the Creative Commons Attribution 4.0 License.
the Creative Commons Attribution 4.0 License.
 | 21 Apr 2026
Glaciogenic seeding-induced hole-punch clouds and their sensitivity to the clouds' background state
Nadja Omanovic
Debora Bötticher
Christopher Fuchs
Ulrike Lohmann
Hole-punch clouds are a visual representation of ice crystal formation and growth as well as their interactions with the liquid phase via the Wegener–Bergeron–Findeisen process. Their appearance is usually associated with an aircraft passing through a liquid cloud layer. However, they can also appear upon glaciogenic seeding of a supercooled low-level stratus cloud, as we showcase in this study. The observations of a hole-punch cloud prompted an investigation into the sensitivity of these clouds to the clouds' background state. We employ high-resolution large-eddy simulations with the weather model ICON and simulate one seeding experiment with different initial liquid water paths. The ensemble of 9 simulations helps us to quantify how the properties of a hole-punch cloud, i.e., strong reductions in the liquid water contents, depends on the cloud liquid water paths. Moreover, we perturb the turbulent mixing length, i.e., the Smagorinsky constant, to evaluate the impact of the intensity of mixing on hole-punch clouds. Generally, larger liquid water paths lead to a delay in the strongest reductions of liquid water content through the Wegener–Bergeron–Findeisen process. Interestingly, the turbulent mixing length does not appear to have a significant impact on the hole-punch cloud properties. These findings improve our understanding of the Wegener–Bergeron–Findeisen process and of the effectiveness of glaciogenic cloud seeding.
- Article
(2150 KB) - Full-text XML
- BibTeX
- EndNote


Hole-punch clouds are typically associated with circular or linear voids after an aircraft penetrates through a supercooled liquid cloud layer (Heymsfield et al., 2010). Prior to the formation of the hole, this cloud is void of any ice because of missing aerosol particles, i.e., ice-nucleating particles (INPs), that help form ice crystals. However, the passage of an aircraft results in an inadvertent seeding effect of the cloud. The expansion of air behind an aircraft can lead to a cooling by 20–30 °C, often enough to kick-start homogeneous ice nucleation, bypassing the need for any INPs (Heymsfield et al., 2011). Upon the formation of ice crystals in a supercooled liquid cloud, the subsequent evolution of a hole-punch cloud depends on the interactions between cloud droplets and ice crystals. One such interaction is the Wegener–Bergeron–Findeisen (WBF) process (Wegener, 1911; Bergeron, 1935; Findeisen, 1938) and it is known to be crucial for the glaciation of a cloud as well as for continental precipitation formation. It takes place because of different saturation water vapor pressures over water (es,w) and ice (es,i). At water-subsaturated conditions cloud droplets will evaporate, while ice crystals continue to grow as long as they experience ice supersaturated conditions (, where e is the ambient water vapor pressure). Moreover, the evaporating cloud droplets serve as a reservoir of water vapor, which can be taken up by the ice crystals. In the case of , both hydrometeors grow while in case of , cloud droplets evaporate and ice crystals sublimate. During the WBF process, ice crystals can grow large enough to start to sediment and form fallstreaks below the cloud. This terminates the extent of the hole, because no more interactions with the cloud droplets are possible. Exactly this process-chain was also observed downstream of industrial areas, which emit anthropogenic aerosols (Toll et al., 2024). They observed a reduction in shortwave reflection as well as in cloud cover and cloud optical thickness.
The importance of the conversion of liquid to ice through the WBF process was early-on recognized in the weather modification community. Schaefer (1946) conducted first experiments of ice crystals in supercooled clouds and Vonnegut (1947) identified the importance of silver iodide acting as an INP to form ice crystals already at −5 °C. At these temperatures, very few natural INPs exist, such that silver iodide is typically used in targeted cloud seeding operations. Across the globe cloud seeding programs emerged with focus on scientific understanding as well as operational usage for precipitation enhancement (Haupt et al., 2018). Within the scientific community, a project called “Seeded and Natural Orographic Wintertime Clouds: The Idaho Experiment” demonstrated the microphysical process-chain upon seeding orographic clouds using remote sensing instruments (French et al., 2018). They also highlighted fundamental knowledge gaps in our understanding of mixed-phase cloud processes. Building on their findings, the CLOUDLAB project aims to address these knowledge gaps by employing the methods of weather modification, i.e., glaciogenic seeding, in a controlled and local manner (Henneberger et al., 2023). Instead of targeting orographic cloud systems, we chose a stable low-level stratus cloud to conduct our seeding experiments. This way, confounding factors, such as orographic forcing, are minimized. The focus was mainly on the quantification of ice growth rates within supercooled clouds in a natural setting (Ramelli et al., 2024; Fuchs et al., 2025). We also created a numerical modeling framework that can be used to reproduce the seeding experiments (Omanovic et al., 2024, 2025c). This framework forms the foundation for this study, such that we can assess the interplay of the liquid and ice phases across a range of cloud states. We aim to answer how the background state, in particular the liquid water content and path, of a supercooled liquid cloud defines the effectiveness of forming a hole-punch cloud by glaciogenic seeding. Additionally, we perturb the turbulent mixing length to assess the effect of enhanced and reduced subgrid-scale mixing within the model simulations. The targeted glaciogenic seeding experiments during CLOUDLAB closely follow the underlying mechanism of hole-punch clouds, as a local perturbation within a liquid cloud triggers the WBF process and changes the cloud characteristics.
2.1 The CLOUDLAB project
Within the CLOUDLAB project, we conducted 78 glaciogenic cloud seeding experiments to infer ice crystal growth rates in supercooled low-level stratus clouds (Henneberger et al., 2023; Miller et al., 2024; Ramelli et al., 2024; Fuchs et al., 2025). This type of cloud occurs frequently in winter in Switzerland. They are often void of any ice crystals because of low INP concentrations (Ohneiser et al., 2026) as well as cloud top temperatures being < −10 °C. Hence, the ice nucleating activity is low making them the ideal candidate for cloud seeding. We employed an uncrewed aerial vehicle (UAV) upstream of the main field site to disperse the seeding material, which consists mostly of silver iodide (Miller et al., 2025). The seeding plumes containing the seeding material and the newly formed ice crystals were advected towards the main field site with the wind and were measured by an array of remote sensing and in situ instruments. This way, a thorough assessment of the cloud's state before, during, and after the seeding was achieved. A central in situ instrument within CLOUDLAB is the in-house developed holographic imager (HOLIMO–HOLographic Imager for Microscopic Objects), which was attached to a tethered balloon system at the main field site. From HOLIMO, we receive information on the cloud droplet and ice crystal concentrations, contents, and size distributions in the size range between 6 µm and 2 mm (Ramelli et al., 2020). All particles with diameters smaller than 25 µm are classified as cloud droplets. For particles larger than 25 µm we distinguish between cloud droplets and ice crystals. The gathered data during the seeding experiments were analyzed with 5 Hz and averaged to 1 s, while the background state (no seeding) was analyzed with 1 Hz. The difference in analysis frequency is due to the rather low ICNC (< 0.5 cm−3) as well as the measurement time of the seeding signal (≈ 6 min) compared to the one of the background. The goal was to achieve a robust data population during the passage of the seeding plume, while during non-seeding conditions, we can average over a longer time period, since the cloud is expected to remain stable and no significant changes are anticipated on that timescale.
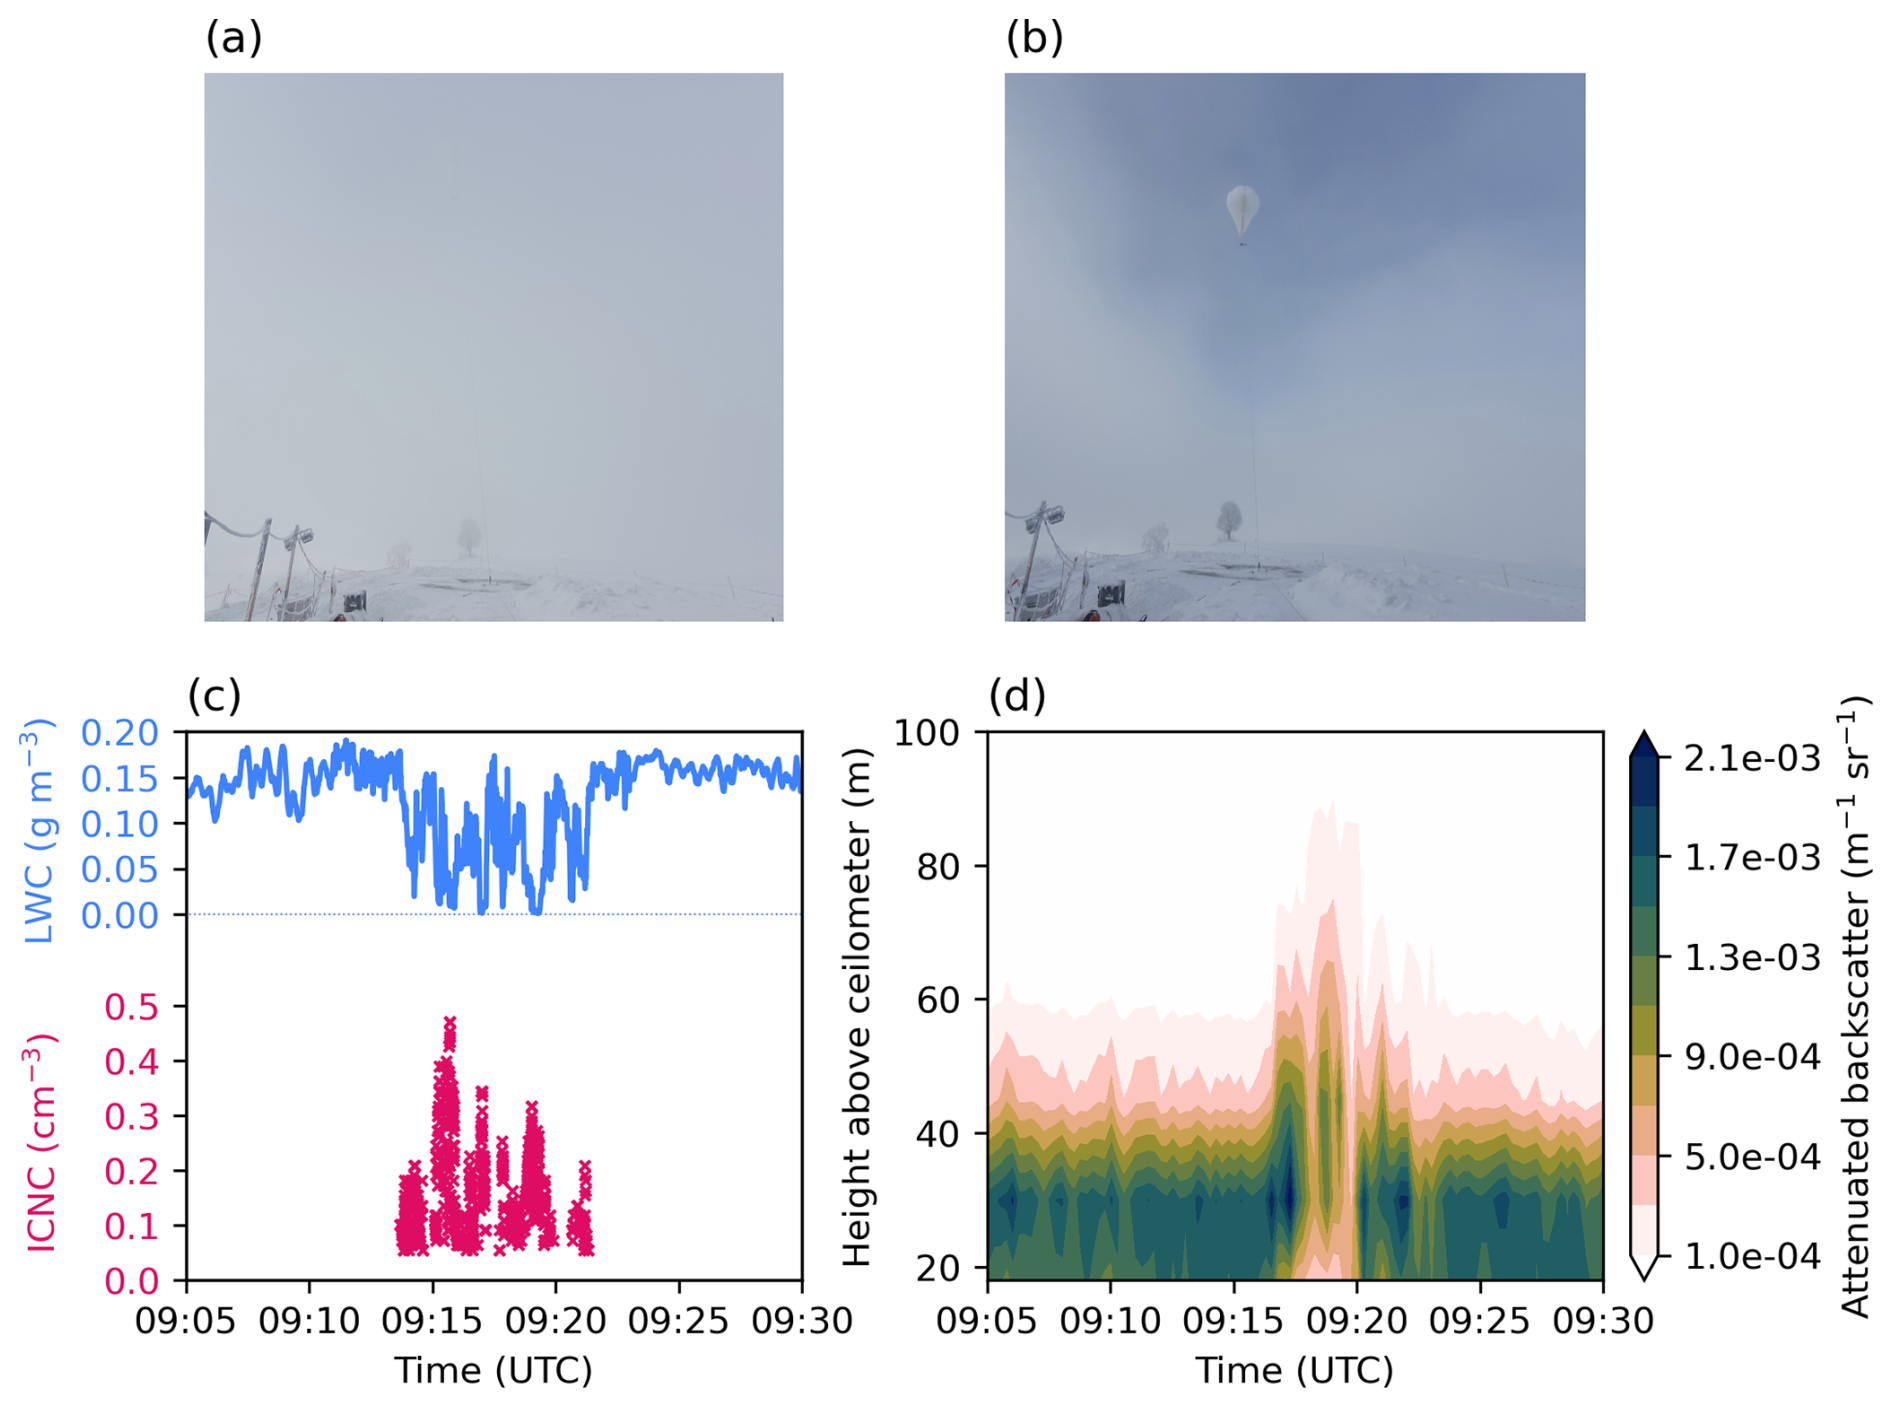
Figure 1Observations of a hole-punch cloud passing over the main field site (at 920 ) at 12 January 2024. (a) and (b) show pictures taken of the cloudy background state and the hole-punch cloud. In (b), the tethered balloon system (at 1000 ) carrying the in situ instrument HOLIMO is clearly identifiable. Note that the pictures were both taken from a similar position, with the tree in the background serving as a reference point. The analyzed measurements from HOLIMO for one seeding experiment are shown in (c) in terms of liquid water content (LWC, g m−3, blue) and ice crystal number concentration (ICNC, cm−3, red). (d) shows the attenuated backscatter during a seeding experiment measured by a ceilometer located at the main field site. The vertical axis indicates the height above the ceilometer, which can be interpreted as the height above ground.
Out of the 78 experiments, 3 experiments, conducted at temperatures around −5.5 °C, were striking because visually a hole could be identified while the seeding plume passed the main field site. All three seeding experiments were conducted on the same day (12 January) in the morning hours (09:00–10:30 UTC). One such example is given in Fig. 1: Fig. 1a shows the cloud (background state) with low visibility and Fig. 1b shows the hole visible during the passage of the seeding plume. The tethered balloon system, which carried HOLIMO, is clearly distinguishable, pointing towards the almost complete evaporation of cloud droplets. The interplay between the ice and liquid phase is further demonstrated in Fig. 1c, which shows the by HOLIMO measured liquid water content (LWC, g m−3) and ice crystal number concentrations (ICNC, cm−3) for one of the three hole-punch cloud seeding experiment. The liquid water path (LWP) of the background state was ≈ 25 g m−2 (based on microwave radiometer observations). It is clearly notable that the reductions in LWC are co-located with the presence of ice crystals. Furthermore, ice crystals were only present in measurements during the seeding signal, further highlighting the absence of any naturally formed ice crystals in the cloud. After the passage of the seeding plume, the cloud reverts to its background state with no ice and LWC ≈ 0.15 g m−3. Moreover, a ceilometer, located at the main field site, also captured the change in cloud base. Before and after the seeding the maximum of attenuated backscatter is close to the ceilometer (see Fig. 1d). During seeding, the attenuated backscatter is decreasing in the levels close to the ceilometer, while we see an increase in the backscatter at heights between 50–70 m above the ceilometer. We cannot conclude if cloud top was lifted as the ceilometer signal could be attenuated before reaching cloud top. The uniqueness of these experiments motivated this study to investigate how the emergence of a hole-punch cloud depends on the background cloud state using numerical simulations.
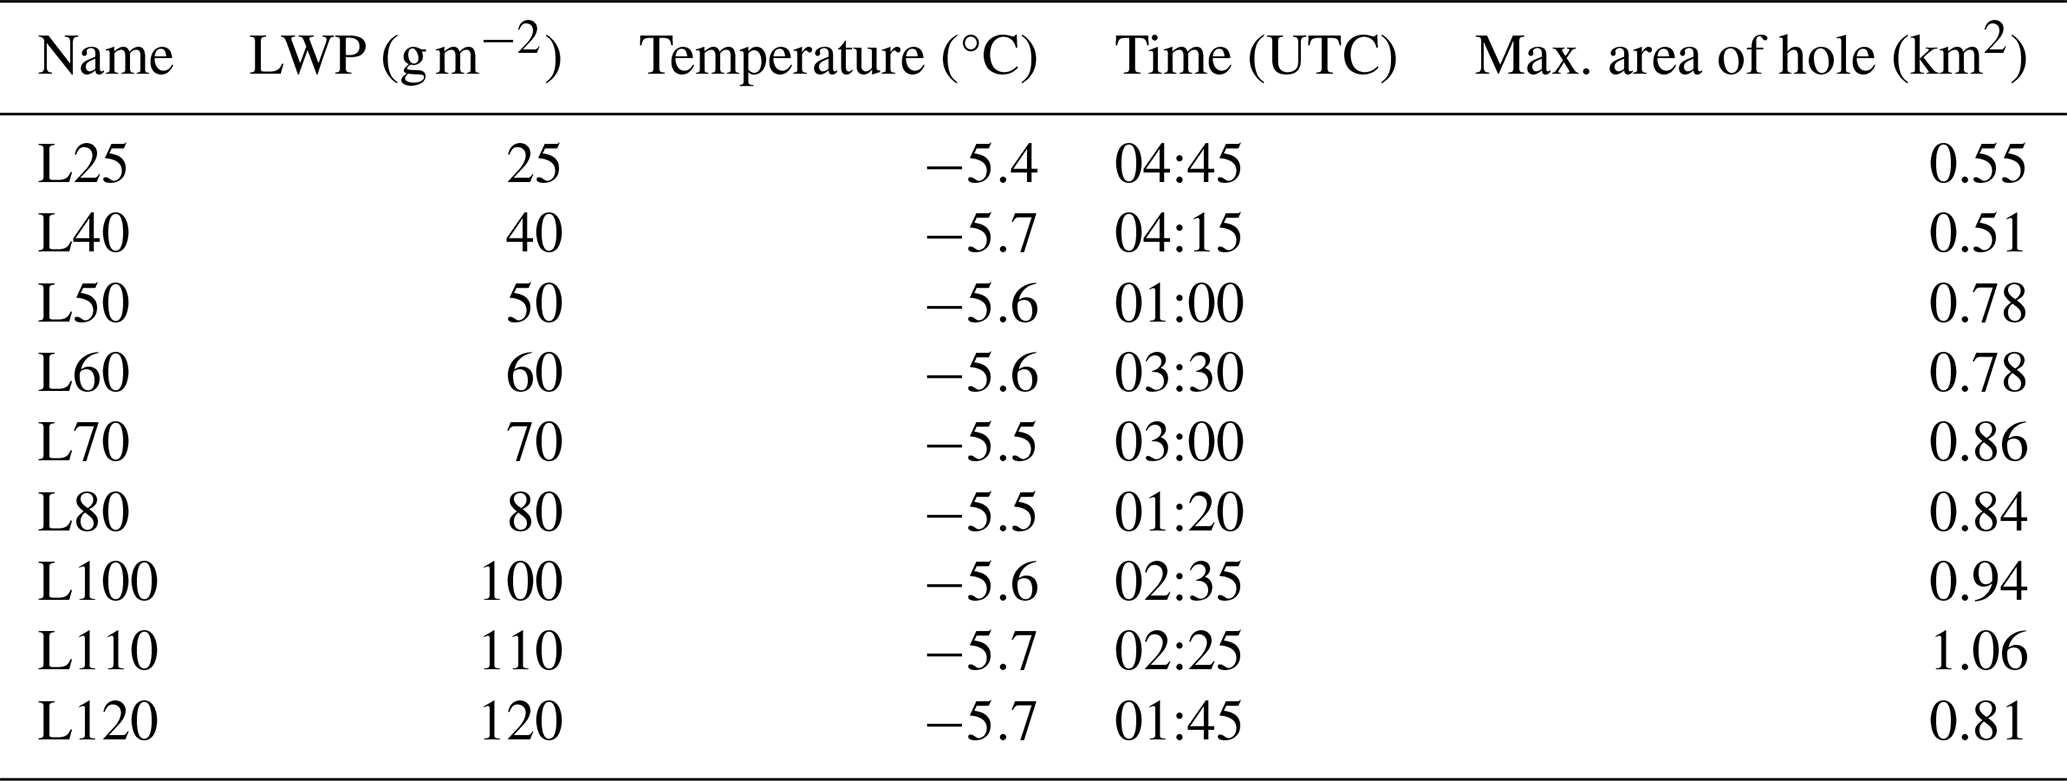
Table 1Overview of the simulations discussed in this study showing the name of the simulation, the liquid water path (LWP) at the seeding location (g m−2, gives the names for the seeding simulation), the seeding temperature (°C), the time when the seeding was performed (UTC), and the maximum area of the hole identified at the strongest reduction in LWC (km2, see Fig. 3a).
2.2 Model Setup and Simulations
In previous studies we demonstrated that the seeding experiments can be successfully reproduced in numerical simulations using the weather prediction model ICON (Zängl et al., 2015) at high horizontal resolution, i.e., in large-eddy mode (Omanovic et al., 2024). We also showed that the simulated ice crystal growth rates need to be increased by a factor 3 to achieve comparable reduction in the liquid phase as observed (Omanovic et al., 2025c). The here presented results are based on ICON simulations at a horizontal resolution of 65 m, model time step of 0.5 s, and a two-moment cloud microphysics scheme (Seifert and Beheng, 2006) with its default configuration (no enhanced ice crystal growth) and its background concentration of cloud condensation nuclei set to 1000 cm−3, such that observed and simulated cloud droplet number concentrations agree well. The cloud microphysics scheme was extended (Omanovic et al., 2024) by an interface for reading in an external file with the location of the seeding emissions, a prognostic seeding particle tracer, and a freezing parameterization assuming immersion freezing of the seeding particles (Marcolli et al., 2016; Miller et al., 2025). The parameterization is based on fitting a sigmoid curve to laboratory measurements. With decreasing temperature the frozen fraction of seeding particles strongly increases. The total number of nucleated ice crystals is limited by the available cloud droplets. The two-moment microphysics scheme itself also has a heterogeneous ice nucleation parameterization for dust particles (Ullrich et al., 2017). However, for the temperature of interest here (−5.5 °C), there is no background ice nucleation activity. We emit 106 seeding particles for 6 min in 7 grid boxes, based on the burning time of the seeding flare attached to the UAV and the latitudinal and longitudinal start and end points of the UAV flight track. The emitted seeding particles freeze upon meeting the right conditions with respect to temperature and availability of cloud droplets. Hence, we have a direct transfer from seeding particles to the ice phase based on the computed frozen fraction following the immersion freezing parameterization. We do not include a budgeting of the seeding particles, i.e., aerosols from melted/sublimated ice crystals are lost and are not available for subsequent ice nucleation. The seeding plume is identified by ICNC, masked to be ≥ 0.001 cm−3.
To evaluate the impact of the cloud's LWP on the emergence, size, and lifetime of the hole-punch cloud, we chose a model simulation day, 24 January 2023, that was one of the field experiment days within CLOUDLAB. During this day, we conducted 9 seeding experiments in the field, none of which showed any signs of hole-punch clouds. This is mostly because the cloud was much thicker (extent of up to 500 m, see Fig. 2a in Ramelli et al., 2024) preventing its complete dissipation after the given observation time. In the model simulations for this day, we have varying LWPs while temperatures agree with the one from the field experiments of a hole-punch cloud (−5.5 ± 0.2 °C). This way, we ensure that the number of nucleated ice crystals and their subsequent growth remains comparable across the different simulations. However, the model simulation day is a different day to when we observed the hole-punch clouds (12 January 2024), but, as in Omanovic et al. (2024) and Omanovic et al. (2025c), we take a surrogate day. The reasoning is that the model simulations for 12 January 2024 produced a too-short lived and too-shallow cloud to adequately reproduce the observations with no possibility to vary the LWC. Table 1 gives an overview of all simulations, which are named after the LWP at the seeding location in the model. Figure A1 shows a height-time profile of LWC for all seeding simulations highlighting that over time LWC and the cloud depth change, both of which impact LWP. The initial LWC at each seeding location may differ across the different simulations, however, we conduct the analysis on the entire seeding plume, which disperses vertically. Hence, we evaluate the efficiency of the WBF process across a range of LWCs. The impact of riming on LWC reductions is deemed negligible as simulations tests without a riming process showed no significant change in the LWC response.
Furthermore, we perturb within the 3D turbulence parameterization (Samgorinsky, 1963; Dipankar et al., 2015) the mixing length, expressed through the Smagorinsky constant Cs. Low values of Cs indicate more turbulent flows, while higher values have a more laminar flow, i.e., less small-scale eddies. Cs also acts to suppress numerical instabilities by damping the waves through enhanced mixing. In numerical weather simulations often higher values of Cs are used because of coarse grid resolutions (Deardorff, 1970; Mason and Brown, 1999). In the case of ICON in large-eddy mode the default value is 0.23. In contrast, in engineering applications often Cs = 0.1 is used. We chose to perform additional simulations with a value of 0.17 and 0.3. The lower value is based on Lilly (1962, 1967), who theorized it to be a minimum for turbulent flows to represent isotropic homogeneous turbulence. We chose the higher value as an upper limit to Cs to ensure a comparable distance from the default as that of the theoretical minimum. The possible impact of subgrid-scale mixing on clouds has been examined for different cloud types. Bryan et al. (2003), for example, found that a high Cs suppresses entrainment into deep convective clouds. Takemi and Rotunno (2003) and Matheou et al. (2011) both identified a delayed/suppressed rain formation upon increasing Cs in cumulus clouds. The enhanced mixing inhibits the effective cloud droplet growth as well as subsequent collision-coalescence processes to form rain. To our knowledge, no study has yet investigated the impact of Cs on liquid-ice-phase interactions. By varying Cs across a widely accepted range of values, the impacts on the WBF efficiency are explored.
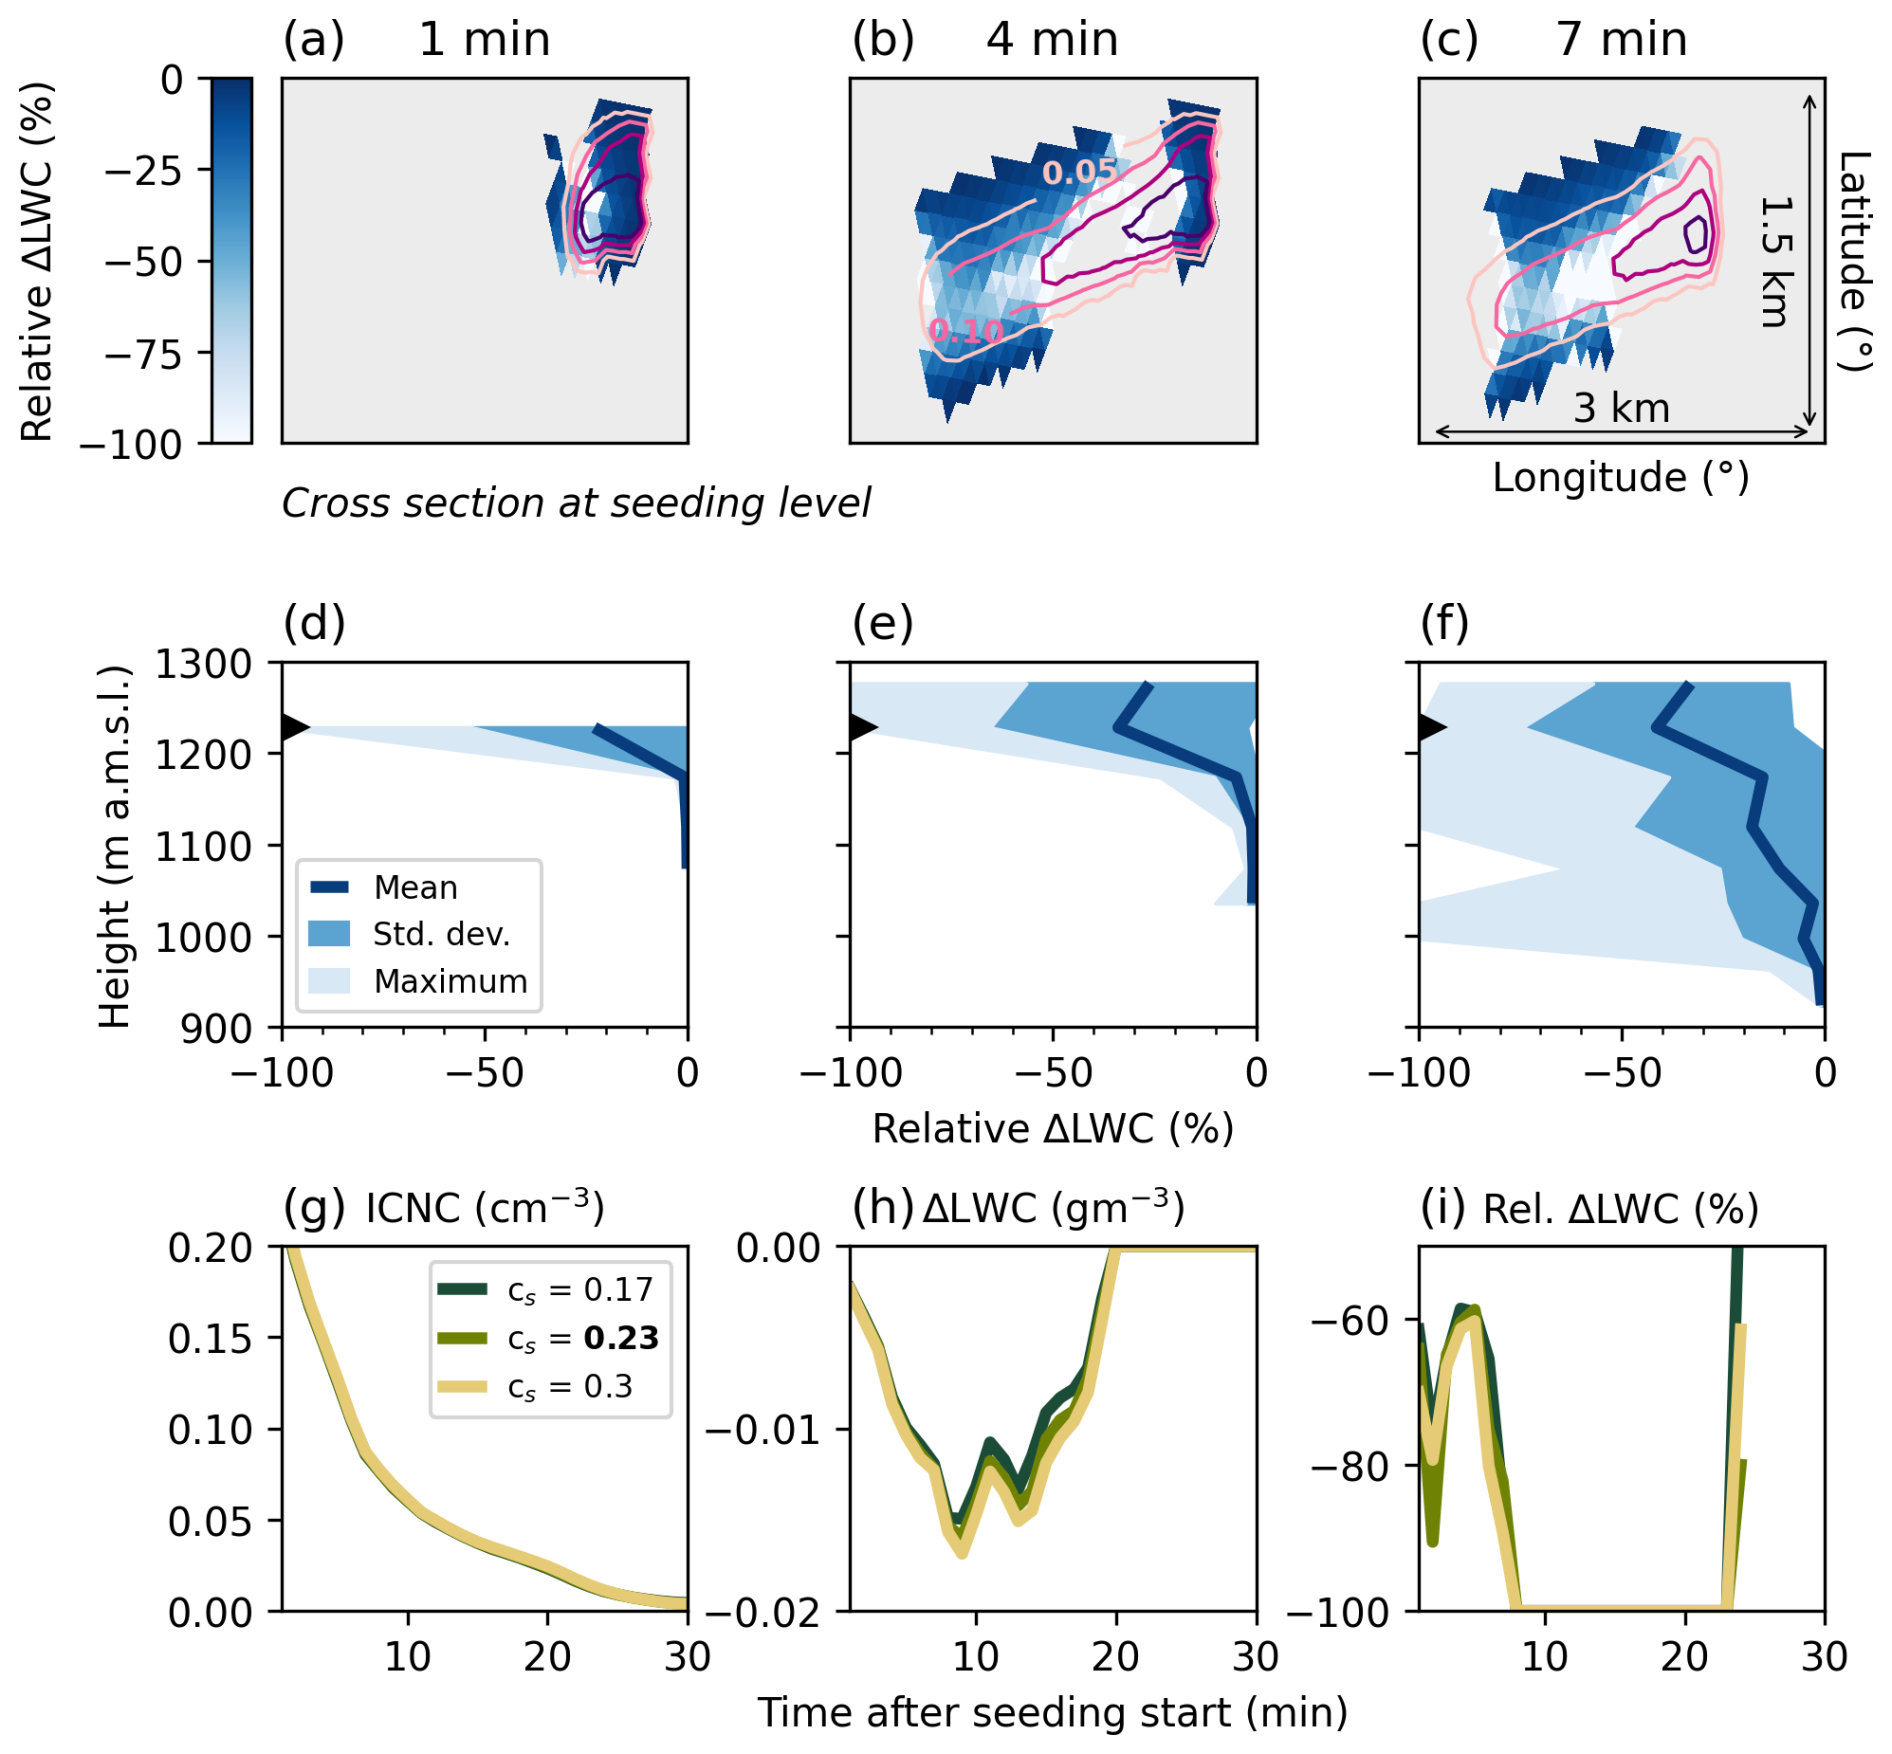
Figure 2Snapshots of seeding simulation L25 with columns indicating the time step after seeding start (1, 4, 7 min). The first row (a–c) shows the relative change in LWC (%) in blue shading and ICNC (cm−3) in pink contours (levels = [0.05, 0.1, 0.15, 0.2]) as a cross section along the seeding level. The domain size is roughly 3 km × 1.5 km. The second row (d–f) shows the relative LWC change vertically resolved and distilled into mean (dark blue line), standard deviation (medium blue shading), and maximum (light blue shading). The abrupt cutoff at height 1300 m is caused by the masking of the seeding plume with ICNC > 0.001 cm−3 (see Sect. 2.2). The black triangle at −100 %/≈ 1200 m denotes the seeding level. The third row (g–i) presents the time evolution of the 95th percentile in ICNC (cm−3), the 5th percentile in absolute changes in LWC (g m−3), and the 5th percentile relative changes in LWC (%). The different colors represent simulations with varying Smagorinsky constants (Cs), where Cs = 0.23 is the default value. All averages are computed for the masked seeding plume (ICNC > 0.001 cm−3) for each model output time step (1 min).
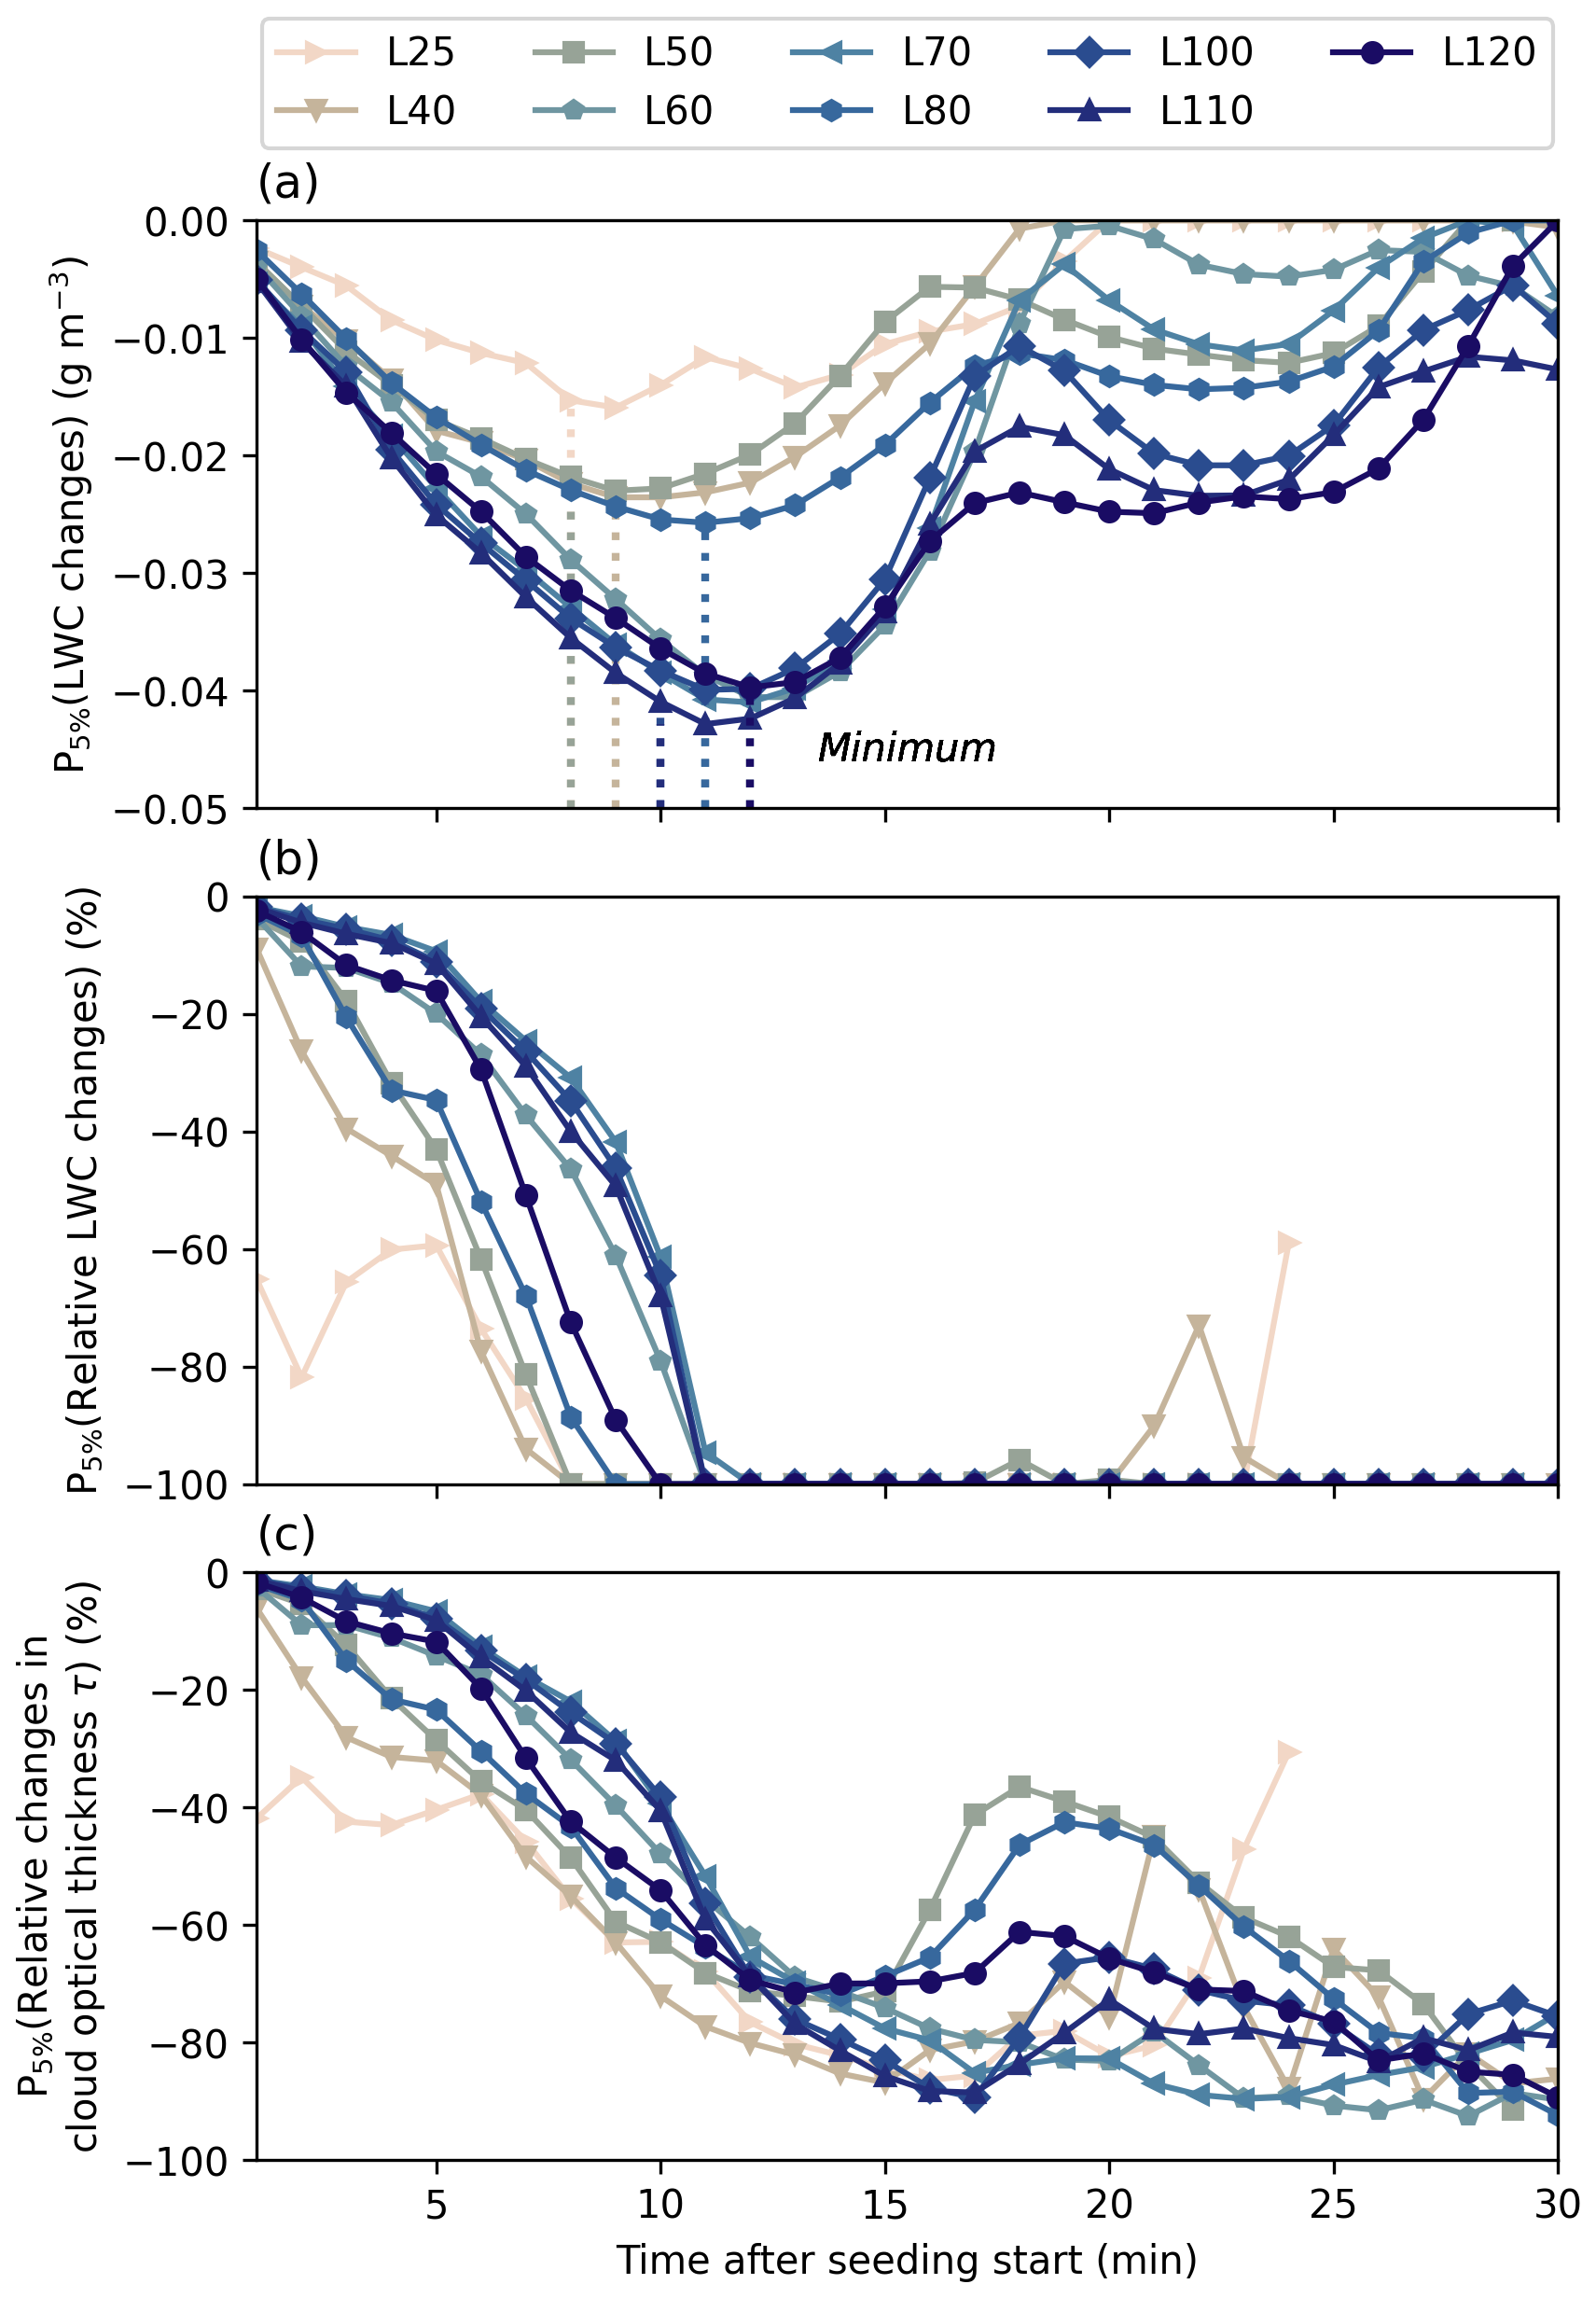
Figure 3For all seeding simulations, differentiated by color and marker, stronger changes indicated by the 5th percentile of absolute (a, g m−3) and relative (b, %) changes in LWC, and changes in cloud optical thickness (c, %) are shown. The values for each seeding simulation shown are averages over the three simulations with different Smagorinsky constants. In (a) the minima for each seeding simulation are marked by vertical dashed lines, which often overlap as in the case of, e.g., L25, L40, and L50. Note that the minimum of the x-axis corresponds to 1 min after seeding start. All averages averages are computed for the masked seeding plume (ICNC > 0.001 cm−3) for each model output time step (1 min).
We first show single time steps during the evolution of the seeding plume in L25 (Fig. 2) to give an overview of the seeding simulations. We chose the time steps 1, 4, and 7 min after the seeding start, such that the first changes in the cloud can be discussed as well as after the seeding concluded (6 min after seeding start). The full evolution of the changes are discussed in the next section. From Fig. 2a–c it is evident that the reductions in LWC are slightly delayed compared to the nucleation of ice crystals. The ice crystals first need to grow to a certain size to be effective in reducing the LWC as we showed in a previous study, where the ice crystal size was underestimated by almost a factor 2 compared to observations (Omanovic et al., 2024). Nonetheless, the reductions highlight the WBF mechanism. After 1 min of the seeding start, a fine line appears downstream of the highest ICNC, along which LWC is reduced up to −100 %, and this signal spreads with time. These stronger reductions can be visible across a few hundred meters, both in latitude and longitude direction. Note that we chose to show the changes along a constant height, but it is evident that the signal also spreads vertically as shown in Fig. 2d–f. The minimum of the mean change at 1 min coincides with the seeding level as here the highest concentration of ICNC is to be expected. These strong changes in LWC are also visible across time as shown in the last row of Fig. 2h–i, which we discuss in the next section. Here, we first want to assess the impact of varying turbulent mixing lengths acting on the subgrid-scale, expressed by the Smagorinsky constant Cs. A value of Cs = 0.17 is identified as a minimum value and indicates more turbulent flows, while a value of 0.3 creates a more homogeneous field by enhancing the mixing. The default value in the model is 0.23 (highlighted in Fig. 2g). The simulated ICNC and absolute and relative changes in LWC are rather insensitive to Cs, i.e., their response over time is unchanged. Hence, the subgrid-scale mixing seems not to be a crucial parameter in changing cloud microphysical processes for this particular cloud type. This is in contrast to other studies (Bryan et al., 2003; Takemi and Rotunno, 2003; Matheou et al., 2011), which found a dependence of Cs, but also employed coarser horizontal grid resolutions. We hypothesize that in our case the explicitly resolved turbulence (grid-scale at 65 m) is dominant enough, such that the sub-grid scale effect plays a minor role. A more thorough analysis of horizontal grid spacing is the subject of a future study building on the work in CLOUDLAB. In the next section, we computed averages across these three simulations for each seeding simulation. Given the low spread between the perturbations, we are only showing the average and no shading. We also want to note here that the absolute changes in LWC are approximately one order of magnitude smaller than what was observed (see Fig. 1c). While we selected the seeding simulations based on the background LWP (= 25 g m−3), we did not achieve an agreement between observed and simulated LWCs. In our simulations, the simulated clouds have a higher vertical extent (see Fig. A1).
Figure 3 summarizes the stronger changes in LWC and cloud optical thickness by computing the 5th percentile for each seeding simulation. The 5th percentile represents the lower tail of the distribution of LWC, i.e., the 5 % of grid points which experience the strongest changes. The cloud optical thickness was calculated as follows: , where h(z) refers to the layer thickness in m, ρl is the density of liquid water in kg m−3, and r is the cloud droplet radius in m. In absolute terms, the reductions are stronger for seeding simulations with higher LWPs, because there is more liquid that can be consumed. This is also the case for the timing of the strongest reductions, which scale in most cases with the initial LWP. We also computed the maximum hole area at these minima by calculating the cell area of the associated grid points. We find a similar pattern: The area of the hole, i.e., strong reductions in LWC, is larger with increasing LWP (see Table 1). At first this seems counterintuitive, however, our hypothesis is that there are two mechanisms defining the hole-punch cloud. (1) Ice crystals form, grow, and lead to the evaporation of cloud droplets through the WBF mechanism creating the hole. (2) As soon as maximum changes of −100 % LWC are achieved, no more liquid water is present to be consumed, such that the extent of the hole is limited. To achieve faster and more wide-spread reductions, a stronger seeding perturbation across a larger area (i.e., longer seeding legs with higher seeding concentrations and/or during a longer seeding time period to achieve higher ICNC) would be required. Hence, ICNC as well as the surrounding LWC matter for the size of a hole-punch cloud. Furthermore, we identify two clusters: For a low background LWP, we see the first −100 % changes after 7–8 min, e.g., for L25, L40, and L50. The other simulations form a cluster with strongest LWC reductions after 11 ± 1 min. Hence, a delay in the appearance of strong LWC reductions is notable. It also notable that for seven out of 9 seeding simulations a second local minimum is achieved (between 20 and 25 min), which is also associated with 100 % LWC reductions. As the seeding plume is advected in space, it encounters background states with first lower and then again higher LWCs, such that a renewed reduction in LWC is possible at later times. The cloud optical thickness evolves in accordance with the LWC reductions, where we see an almost complete dissipation of the cloud.
During the CLOUDLAB field campaigns, we observed the emergence of a hole-punch cloud upon glaciogenic seeding of a low-level stratus cloud. Observations show that strong reductions in LWC coincided with high ICNC, following the WBF mechanism. These findings prompted an investigation into the sensitivity of the seeding-induced hole-punch clouds using numerical simulations. We employed the numerical weather prediction model ICON in large-eddy mode at a horizontal resolution of 65 m and simulated one seeding experiment with different starting LWPs, while the temperature and seeding concentration were kept constant. A total of 9 seeding simulations were performed with LWPs ranging from 25–120 g m−2. For each of the 9 simulations, two additional simulations with different turbulent mixing lengths (Smagorinsky constant) were performed.
The first reductions in LWC were associated with the emission of seeding particles at the seeding level, where the first ice crystals formed. With the dispersion and sedimentation of the ice crystals, reductions in LWC were identified across the entire cloud. Overall, areas of strong LWC reductions were up to 1 km2. Focusing on the strong reductions in LWC (absolute and relative) and cloud optical thickness, we identified a delaying effect with increasing LWP: the strongest reductions appeared later in time, with maximum differences of up to 4 min. This behavior was consequently also reflected in the changes in cloud optical thickness, with stronger changes (< −60 %) appearing only 10 min after the seeding start. We also found that the turbulent mixing length has little to no impact on the changes in LWC. This raises the question if the explicitly resolved turbulence is dominant enough, such that no additional subgrid-scale turbulence is required. Xue et al. (2016) and Chu et al. (2014, 2017) both found a strong dependence on horizontal resolution when simulating glaciogenic cloud seeding. With increasing resolution, the efficiency through the WBF process to form precipitation increased. Hence, if one wants to successfully simulate glaciogenic seeding at coarser horizontal resolutions, the subgrid-scale turbulence may be of higher importance.
This study took on the interesting phenomena of hole-punch clouds, which are known from aircraft flying through a supercooled cloud layer, and investigated them in the context of glaciogenic cloud seeding. Our findings highlighted the interplay of ice crystal growth and the liquid background state of a cloud, i.e., the WBF mechanism. We believe our study provides a foundation for improving our understanding of mixed-phase processes and can inform future cloud seeding strategies.
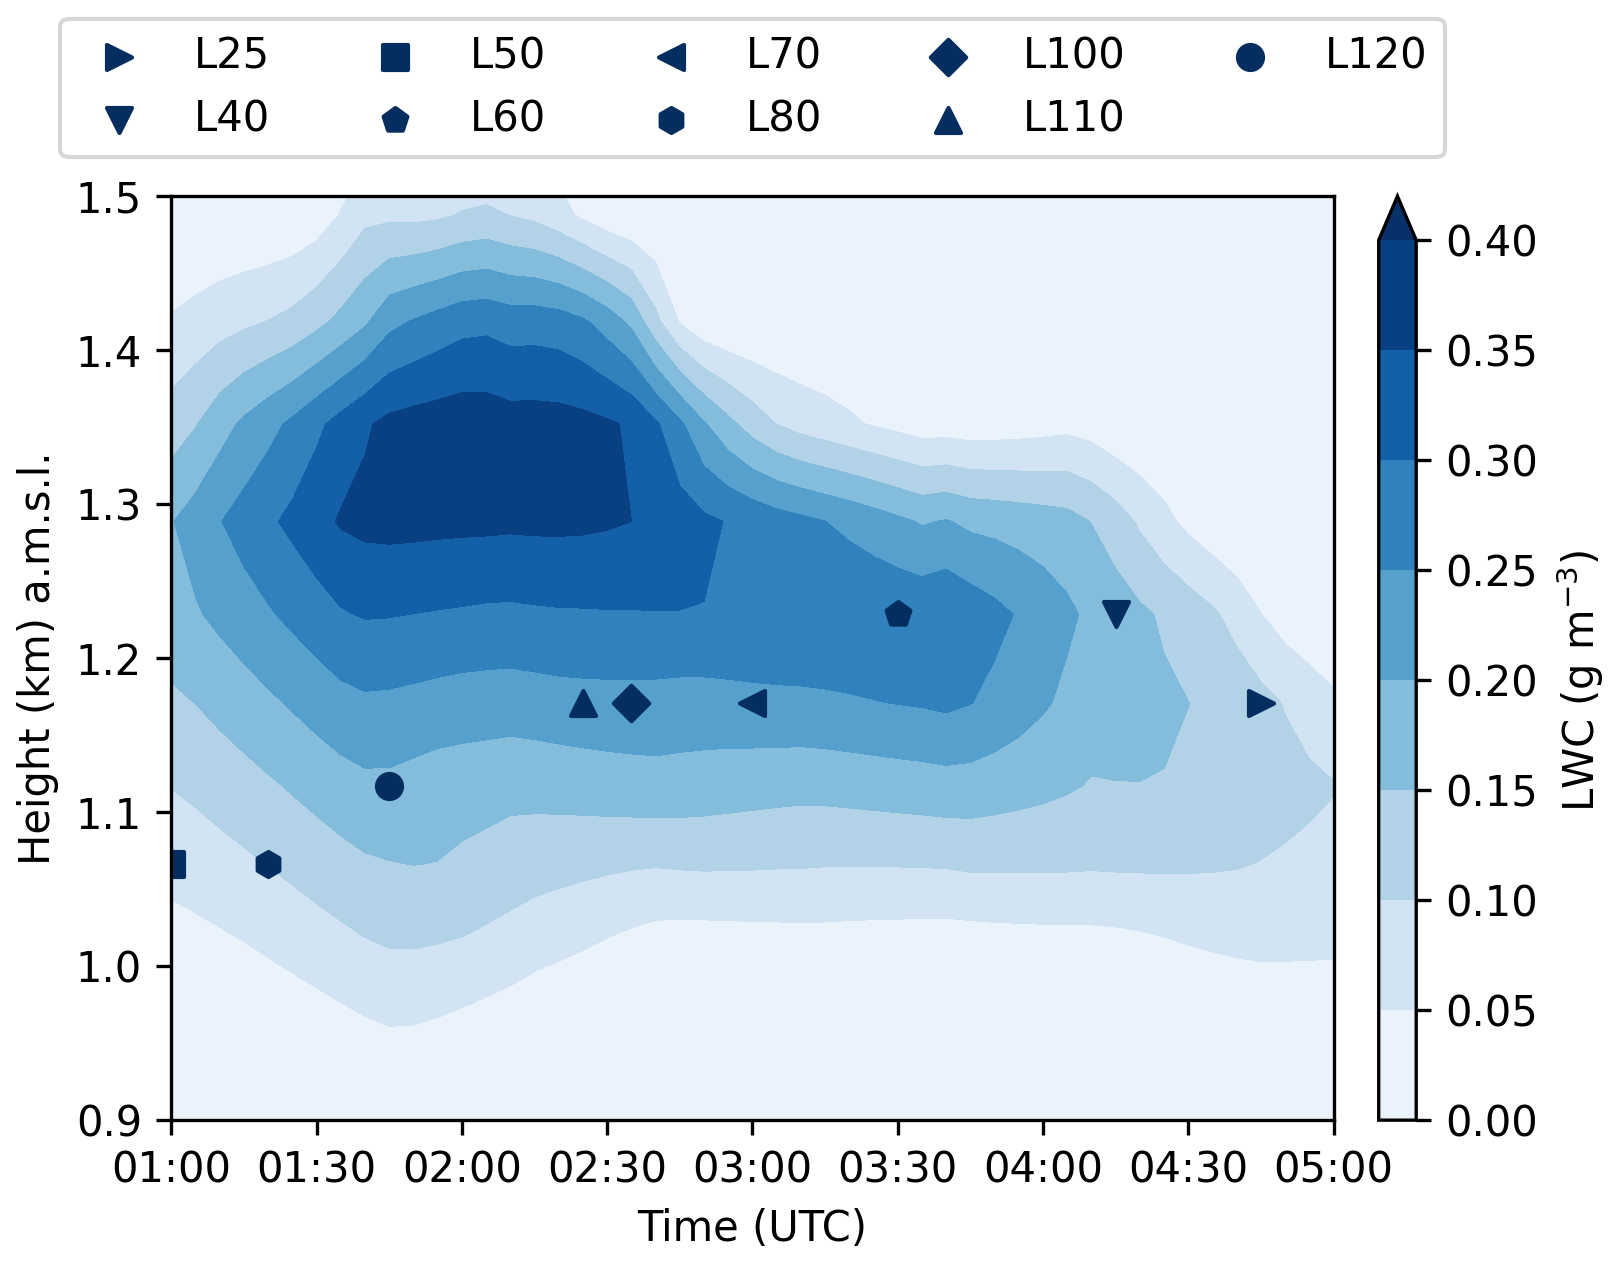
Figure A1Height-time profile of LWC (blue shading, g m−3) of the simulated background state averaged across the seven grid boxes used for the emission of seeding particles. Markers represent the individual seeding simulations showing their seeding height and time.
Model and observational data can be found at https://doi.org/10.5281/zenodo.17482197 (Omanovic et al., 2025a). Analysis and plotting scripts are available at https://doi.org/10.5281/zenodo.17481798 (Omanovic et al., 2025b). We used the ICON model code version 2.6.6 for our simulations. The open-source model code can be obtained at https://icon-model.org/ (last access: 20 April 2025).
UL conceived of the idea for CLOUDLAB and obtainted funding. NO and CF were part of the experimental team to design and conduct in-cloud seeding experiments, with conceptual input from UL. CF conducted the analysis of the HOLIMO data. NO set up the model nesting and performed all simulations. DB conducted the first analysis of the simulations in the course of their bachelor thesis. NO refined the analysis and wrote the manuscript. All authors contributed to editing and reviewing the manuscript.
The contact author has declared that none of the authors has any competing interests.
Publisher's note: Copernicus Publications remains neutral with regard to jurisdictional claims made in the text, published maps, institutional affiliations, or any other geographical representation in this paper. The authors bear the ultimate responsibility for providing appropriate place names. Views expressed in the text are those of the authors and do not necessarily reflect the views of the publisher.
This work has been supported by a grant from the Swiss National Supercomputing Centre (CSCS; under project ID lp88). We would like to further extend gratitude to the following people: Jan Henneberger, Anna J. Miller, Fabiola Ramelli, Robert Spirig, and Huiying Zhang for supporting the field experiments, the TROPOS PolarCAP team including Patric Seifert, Kevin Ohneiser, Johannes Bühl, Tom Gaudek, Hannes Griesche, Willi Schimmel, and Martin Radenz for the remote sensing instrumentation and the scientific discussions and collaborations. The Meteomatics drone team, including Lukas Hammerschmidt, Daniel Schmitz, Philipp Kryenbühl, Remo Steiner, and Dominik Brändle for the support, development, and expertise of our drones. Michael Rösch (ETH) for the technical support of our field setup. Maxime Hervo and MeteoSwiss for the wind profiler supporting our experiments. Frank Kasparek and Aleksei Shilin (Cloud Seeding Technologies) for the expertise on our seeding flares. The Swiss Army, and Stefan Minder for allowing the use and maintenance of our main field site.
This research has been supported by the European Research Council, H2020 European Research Council (grant no. 101021272).
This paper was edited by Blaž Gasparini and reviewed by two anonymous referees.
Bergeron, T.: On the physics of clouds and precipitation, Proc. 5th Assembly UGGI, Lisbon, Portugal, 1935, p. 156–180, 1935. a
Bryan, G. H., Wyngaard, J. C., and Fritsch, J. M.: Resolution Requirements for the Simulation of Deep Moist Convection, Mon. Weather Rev., 131, 2394–2416, https://doi.org/10.1175/1520-0493(2003)131<2394:RRFTSO>2.0.CO;2, 2003. a, b
Chu, X., Xue, L., Geerts, B., Rasmussen, R., and Breed, D.: A Case Study of Radar Observations and WRF LES Simulations of the Impact of Ground-Based Glaciogenic Seeding on Orographic Clouds and Precipitation. Part I: Observations and Model Validations, J. Appl. Meteorol. Clim., 53, 2264–2286, https://doi.org/10.1175/JAMC-D-14-0017.1, 2014. a
Chu, X., Geerts, B., Xue, L., and Pokharel, B.: A Case Study of Cloud Radar Observations and Large-Eddy Simulations of a Shallow Stratiform Orographic Cloud, and the Impact of Glaciogenic Seeding, J. Appl. Meteorol. Clim., 56, 1285–1304, https://doi.org/10.1175/JAMC-D-16-0364.1, 2017. a
Deardorff, J. W.: A Numerical Study of Three-Dimensional Turbulent Channel Flow at Large Reynolds Numbers, J. Fluid Mech., 41, 453–480, https://doi.org/10.1017/S0022112070000691, 1970. a
Dipankar, A., Stevens, B., Heinze, R., Moseley, C., Zängl, G., Giorgetta, M., and Brdar, S.: Large Eddy Simulation Using the General Circulation Model ICON, J. Adv. Model. Earth Sy., 7, 963–986, https://doi.org/10.1002/2015MS000431, 2015. a
Findeisen, W.: Kolloid-meteorologische Vorgänge bei der Niederschlagsbildung, Meteorolo. Z., 55, 121–133, 1938. a
French, J. R., Friedrich, K., Tessendorf, S. A., Rauber, R. M., Geerts, B., Rasmussen, R. M., Xue, L., Kunkel, M. L., and Blestrud, D. R.: Precipitation Formation from Orographic Cloud Seeding, P. Natl. Acad. Sci. USA, 115, 1168–1173, https://doi.org/10.1073/pnas.1716995115, 2018. a
Fuchs, C., Ramelli, F., Miller, A. J., Omanovic, N., Spirig, R., Zhang, H., Seifert, P., Ohneiser, K., Lohmann, U., and Henneberger, J.: Quantifying ice crystal growth rates in natural clouds from glaciogenic cloud seeding experiments, Atmos. Chem. Phys., 25, 12177–12196, https://doi.org/10.5194/acp-25-12177-2025, 2025. a, b
Haupt, S. E., Rauber, R. M., Carmichael, B., Knievel, J. C., and Cogan, J. L.: 100 Years of Progress in Applied Meteorology. Part I: Basic Applications, Meteor. Mon., 59, 22.1–22.33, https://doi.org/10.1175/AMSMONOGRAPHS-D-18-0004.1, 2018. a
Henneberger, J., Ramelli, F., Spirig, R., Omanovic, N., Miller, A. J., Fuchs, C., Zhang, H., Bühl, J., Hervo, M., Kanji, Z. A., Ohneiser, K., Radenz, M., Rösch, M., Seifert, P., and Lohmann, U.: Seeding of Supercooled Low Stratus Clouds with a UAV to Study Microphysical Ice Processes: An Introduction to the CLOUDLAB Project, B. Am. Meteorol. Soc., 104, E1962–E1979, https://doi.org/10.1175/BAMS-D-22-0178.1, 2023. a, b
Heymsfield, A. J., Kennedy, P. C., Massie, S., Schmitt, C., Wang, Z., Haimov, S., and Rangno, A.: Aircraft-Induced Hole Punch and Canal Clouds: Inadvertent Cloud Seeding, B. Am. Meteorol. Soc., 91, 753–766, https://doi.org/10.1175/2009BAMS2905.1, 2010. a
Heymsfield, A. J., Thompson, G., Morrison, H., Bansemer, A., Rasmussen, R. M., Minnis, P., Wang, Z., and Zhang, D.: Formation and Spread of Aircraft-Induced Holes in Clouds, Science, 333, 77–81, https://doi.org/10.1126/science.1202851, 2011. a
Lilly, D. K.: On the Numerical Simulation of Buoyant Convection, Tellus, 14, 148–172, https://doi.org/10.1111/j.2153-3490.1962.tb00128.x, 1962. a
Lilly, D. K.: The representation of small-scale turbulence in numerical simulation experiments, in: Proc. 10th Scientific Computing Symp. on Environmental Sciences, pp. 195–210, https://doi.org/10.5065/D62R3PMM, 1967. a
Marcolli, C., Nagare, B., Welti, A., and Lohmann, U.: Ice nucleation efficiency of AgI: review and new insights, Atmos. Chem. Phys., 16, 8915–8937, https://doi.org/10.5194/acp-16-8915-2016, 2016. a
Mason, P. J. and Brown, A. R.: On Subgrid Models and Filter Operations in Large Eddy Simulations, J. Atmos. Sci., 56, 2101–2114, https://doi.org/10.1175/1520-0469(1999)056<2101:OSMAFO>2.0.CO;2, 1999. a
Matheou, G., Chung, D., Nuijens, L., Stevens, B., and Teixeira, J.: On the Fidelity of Large-Eddy Simulation of Shallow Precipitating Cumulus Convection, Mon. Weather Rev., 139, 2918–2939, https://doi.org/10.1175/2011MWR3599.1, 2011. a, b
Miller, A. J., Ramelli, F., Fuchs, C., Omanovic, N., Spirig, R., Zhang, H., Lohmann, U., Kanji, Z. A., and Henneberger, J.: Two new multirotor uncrewed aerial vehicles (UAVs) for glaciogenic cloud seeding and aerosol measurements within the CLOUDLAB project, Atmos. Meas. Tech., 17, 601–625, https://doi.org/10.5194/amt-17-601-2024, 2024. a
Miller, A. J., Fuchs, C., Ramelli, F., Zhang, H., Omanovic, N., Spirig, R., Marcolli, C., Kanji, Z. A., Lohmann, U., and Henneberger, J.: Quantified ice-nucleating ability of AgI-containing seeding particles in natural clouds, Atmos. Chem. Phys., 25, 5387–5407, https://doi.org/10.5194/acp-25-5387-2025, 2025. a, b
Ohneiser, K., Hartmann, M., Wex, H., Seifert, P., Hardt, A., Miller, A., Baudrexl, K., Thomas, W., Ettrichrätz, V., Maahn, M., Gaudek, T., Schimmel, W., Senf, F., Griesche, H., Radenz, M., and Henneberger, J.: Ice-nucleating particle depletion in the wintertime boundary layer in the pre-Alpine region during stratus cloud conditions, Atmos. Chem. Phys., 26, 3223–3236, https://doi.org/10.5194/acp-26-3223-2026, 2026. a
Omanovic, N., Ferrachat, S., Fuchs, C., Henneberger, J., Miller, A. J., Ohneiser, K., Ramelli, F., Seifert, P., Spirig, R., Zhang, H., and Lohmann, U.: Evaluating the Wegener–Bergeron–Findeisen process in ICON in large-eddy mode with in situ observations from the CLOUDLAB project, Atmos. Chem. Phys., 24, 6825–6844, https://doi.org/10.5194/acp-24-6825-2024, 2024. a, b, c, d, e
Omanovic, N., Bötticher, D., Fuchs, C., and Lohmann, U.: Data input for reproducing the figures presented in the publication “Glaciogenic seeding-induced hole-punch clouds and their sensitivity to the clouds' background state”, Zenodo [data set], https://doi.org/10.5281/zenodo.17482197, 2025a. a
Omanovic, N., Bötticher, D., Fuchs, C., and Lohmann, U.: Scripts for figures in publication “Glaciogenic seeding-induced hole-punch clouds and their sensitivity to the clouds' background state”, Zenodo [code], https://doi.org/10.5281/zenodo.17481798, 2025b. a
Omanovic, N., Ferrachat, S., Fuchs, C., Ramelli, F., Henneberger, J., Miller, A. J., Spirig, R., Zhang, H., and Lohmann, U.: Chasing Ice Crystals: Interlinking Cloud Microphysics and Dynamics in Cloud Seeding Plumes With Lagrangian Trajectories, J. Adv. Model. Earth Sy., 17, e2025MS005016, https://doi.org/10.1029/2025MS005016, 2025c. a, b, c
Ramelli, F., Beck, A., Henneberger, J., and Lohmann, U.: Using a holographic imager on a tethered balloon system for microphysical observations of boundary layer clouds, Atmos. Meas. Tech., 13, 925–939, https://doi.org/10.5194/amt-13-925-2020, 2020. a
Ramelli, F., Henneberger, J., Fuchs, C., Miller, A. J., Omanovic, N., Spirig, R., Zhang, H., David, R. O., Ohneiser, K., Seifert, P., and Lohmann, U.: Repurposing Weather Modification for Cloud Research Showcased by Ice Crystal Growth, PNAS Nexus, 3, pgae402, https://doi.org/10.1093/pnasnexus/pgae402, 2024. a, b, c
Samgorinsky, J.: General circulation experiments with the primitive equations. I. The basic experiment, Mon. Weather Rev., 91, 99–164, 1963. a
Schaefer, V. J.: The Production of Ice Crystals in a Cloud of Supercooled Water Droplets, Science, 104, 457–459, https://doi.org/10.1126/science.104.2707.457, 1946. a
Seifert, A. and Beheng, K. D.: A Two-Moment Cloud Microphysics Parameterization for Mixed-Phase Clouds. Part 1: Model Description, Meteorol. Atmos. Phys., 92, 45–66, https://doi.org/10.1007/s00703-005-0112-4, 2006. a
Takemi, T. and Rotunno, R.: The Effects of Subgrid Model Mixing and Numerical Filtering in Simulations of Mesoscale Cloud Systems, Mon. Weather Rev., 131, 2085–2101, https://doi.org/10.1175/1520-0493(2003)131<2085:TEOSMM>2.0.CO;2, 2003. a, b
Toll, V., Rahu, J., Keernik, H., Trofimov, H., Voormansik, T., Manshausen, P., Hung, E., Michelson, D., Christensen, M. W., Post, P., Junninen, H., Murray, B. J., Lohmann, U., Watson-Parris, D., Stier, P., Donaldson, N., Storelvmo, T., Kulmala, M., and Bellouin, N.: Glaciation of Liquid Clouds, Snowfall, and Reduced Cloud Cover at Industrial Aerosol Hot Spots, Science, 386, 756–762, https://doi.org/10.1126/science.adl0303, 2024. a
Ullrich, R., Hoose, C., Möhler, O., Niemand, M., Wagner, R., Höhler, K., Hiranuma, N., Saathoff, H., and Leisner, T.: A New Ice Nucleation Active Site Parameterization for Desert Dust and Soot, J. Atmos. Sci., 74, 699–717, https://doi.org/10.1175/JAS-D-16-0074.1, 2017. a
Vonnegut, B.: The Nucleation of Ice Formation by Silver Iodide, J. Appl. Phys., 18, 593–595, https://doi.org/10.1063/1.1697813, 1947. a
Wegener, A.: Thermodynamik der Atmosphäre, Barth, 1911. a
Xue, L., Chu, X., Rasmussen, R., Breed, D., and Geerts, B.: A Case Study of Radar Observations and WRF LES Simulations of the Impact of Ground-Based Glaciogenic Seeding on Orographic Clouds and Precipitation. Part II: AgI Dispersion and Seeding Signals Simulated by WRF, J. Appl. Meteorol. Clim., 55, 445–464, https://doi.org/10.1175/JAMC-D-15-0115.1, 2016. a
Zängl, G., Reinert, D., Rípodas, P., and Baldauf, M.: The ICON (ICOsahedral Non-hydrostatic) Modelling Framework of DWD and MPI-M: Description of the Non-Hydrostatic Dynamical Core, Q. J. Roy. Meteor. Soc., 141, 563–579, https://doi.org/10.1002/qj.2378, 2015. a