the Creative Commons Attribution 4.0 License.
the Creative Commons Attribution 4.0 License.
 | 17 Apr 2026
Aerosol–cloud interactions in marine low-clouds in a warmer climate
Prasanth Prabhakaran
Timothy A. Myers
Fabian Hoffmann
Graham Feingold
We explore the impact of aerosol perturbation on the stratocumulus-to-cumulus transition (SCT) in a warmer climate in the North-East Pacific region using a Lagrangian large-eddy simulation model coupled to a two-moment, bin-emulating bulk microphysics scheme. We explore two SCT cases with different free-tropospheric (FT) humidities – moist FT and dry FT. For each case, we consider two Shared Socioeconomic Pathways (SSPs), SSP3-7.0 and SSP1-2.6, from the most recent Coupled Model Intercomparison Project (CMIP6) to determine the extent of warming and changes in aerosol concentration at the end-of-the-century. We find that the cloud radiative effect (CRE) in non-precipitating stratocumulus clouds is more susceptible to climate change than to aerosol. However, after the breakup of the cloud deck, the impact of aerosol tends to dominate. Furthermore, in these low-clouds, aerosol-cloud interactions (Twomey effect and liquid water path adjustments) are to leading order immune to climate change, unless aerosol-induced cloud fraction adjustment is significant. We extend the analysis to marine cloud brightening and show that its efficacy decreases with warming because of the reduction in cloud fraction. We also explore the impact of climate change and aerosol perturbation on SCT. In the moist FT case, climate change advances the onset of cumulus activity and cloud breakup. However, in the dry FT case, climate change does not affect the onset of cumulus activity but delays cloud breakup. In both cases, aerosol injection delays cloud breakup via precipitation suppression but does not affect cumulus onset unless it is coupled to rain formation.
- Article
(4403 KB) - Full-text XML
- BibTeX
- EndNote


Marine low-clouds strongly regulate global mean temperature by reflecting a substantial fraction of incoming short-wave (SW) radiation to outer space (Wood, 2012). The climate feedback associated with these clouds is one of the largest uncertainties in Earth's climate projections (Zelinka et al., 2013). The picture becomes more complex once the uncertainties associated with aerosol-cloud interactions are included (Boucher et al., 2013; Bellouin et al., 2020). The key reason for this is the poor representation of turbulent cloud processes in climate models. In this paper, we explore the impact of climate change on aerosol-cloud interactions in marine low-clouds using Lagrangian (domain moving with mean wind) large-eddy simulations (LESs).
With the advent of high-resolution numerical simulations (LES and cloud-resolving simulations), our understanding of the response of marine low-clouds to climate perturbations has improved substantially (Bretherton et al., 2013; Bretherton and Blossey, 2014). These studies explored the response of marine stratocumulus, cumulus-under-stratocumulus, and shallow cumulus clouds to a warmer climate. They showed that weakening of the subsidence velocity and/or strengthening of the inversion aid in thickening of the stratocumulus deck, a negative feedback with respect to cloud radiative effect (CRE) (Bretherton, 2015). However, weakened radiative cooling and warming result in a strong positive feedback. The net cloud feedback is positive in the stratocumulus and cumulus-under-stratocumulus cases, and weakly positive in the cumulus regime. Their analysis also explored the thermodynamic mechanism behind the thinning and reduction in cloud cover (fc) in marine stratocumulus clouds in a warmer world that results in a positive cloud feedback (entrainment-liquid flux feedback). A similar framework was also used to explore cloud feedback in precipitating and spatially organized marine cumulus clouds (Vogel et al., 2016). Furthermore, several studies have attempted to observationally constrain marine low-cloud feedback. To do so, they quantify the sensitivity of marine low clouds to meteorological perturbations via satellite observations, and then use climate models to estimate meteorological changes with planetary warming. The observation-based findings from these studies are in qualitative agreement with high-resolution models (Cesana and Del Genio, 2021; Ceppi et al., 2024; Myers et al., 2021; Klein et al., 2017, and references therein).
Over the last two decades, several studies have focused on understanding the physical processes associated with aerosol-cloud interactions (ACI) in marine low-clouds. The Twomey effect, an increase in cloud albedo in response to an increase in cloud droplet concentration (Nd) while assuming the LWP is constant, and the life-time effect, where the cloud albedo is increased by suppressing precipitation, have been well explored (Twomey, 1974; Albrecht, 1989). LES studies have highlighted that decrease in sedimentation velocity (sedimentation-entrainment feedback) and the increase in evaporation rate (evaporation-entrainment feedback) at the cloud-top in response to increases in Nd result in an increase in the intensity of turbulence at the cloud-top (Wang et al., 2003; Ackerman et al., 2004; Bretherton et al., 2007). This increases the entrainment rate at cloud-top that eventually results in a reduction in LWP. However, these studies do not account for the effects of the diurnal cycle. Using an ensemble of LES simulations, Zhang et al. (2024) argue that the effects of SW absorption may buffer some of the aforementioned cloud adjustments in response to aerosol perturbations. Moreover, Prabhakaran et al. (2024) showed that weak precipitation suppression causes cloud darkening due to enhanced SW absorption. However, not many studies have focused on how ACI would change in a warmer climate, which is the central question addressed here. Changes in boundary layer turbulence as well as changes in baseline cloud properties due to climate change may alter the cloud response to aerosol. The aerosol perturbation we use in this study is a proxy for intermittent emissions from volcanoes, ship emissions, or a deliberate injection of aerosol to enhance the reflectivity of marine low-clouds (marine cloud brightening, MCB). MCB is a climate intervention approach aimed at mitigating some of the worst effects of anthropogenic radiative forcing (Feingold et al., 2024). The insights from this study should also be useful in assessing the efficacy of MCB in a warmer world.
We use the stratocumulus-to-cumulus transition (SCT) as a framework for exploring ACI in a warmer climate. Consequently, we also explore the impact of climate change on SCT as few studies have explored this topic. The stratocumulus-topped boundary layer transitions into a cumulus-topped boundary layer as the air mass advects towards the equator over a continuously increasing ocean temperature. The associated increase in surface latent heat flux (LHF) and the weakening of subsidence promotes the deepening and decoupling of the cloud-topped boundary layer (Bretherton, 1992; Krueger et al., 1995; Wyant et al., 1997). Eventually, the formation of overshooting cumulus clouds erode the decoupled stratus layer at the top of the boundary layer. We refer to this transition as an entrainment-driven transition. Recent studies have shown that precipitation also likely plays a key role in the breakup of the stratocumulus cloud layer (Yamaguchi et al., 2017; Zhou et al., 2017; Sarkar et al., 2020). We refer to these transitions as the precipitation-mediated transition. In this study, we explore the impact of climate change and aerosol perturbation on both precipitation-mediated and entrainment-driven SCTs.
In the next section, we present our methodology for setting up cases in a warmer world. This is followed by the results from the simulations exploring the impact of climate change and aerosol perturbation on SCT in both precipitation-mediated and entrainment-driven scenarios. We end with a discussion of our results focusing on the impact of climate change on cloud properties, SCT, ACI, and MCB, followed by a summary.
The setup of the LES follows the framework presented in Yamaguchi et al. (2017) and Prabhakaran et al. (2024), and thus will only be briefly discussed.
We use the System for Atmospheric Model (SAM) version 6.10.10 to simulate the dynamics (Khairoutdinov and Randall, 2003) and the effects of radiation are computed using the Rapid Radiative Transfer Model for Global Climate Models (RRTMG) using the two-stream approximation with extended vertical profiles (Mlawer et al., 1997). In addition, we use a two-moment, bin-emulating bulk scheme to represent the microphysical properties of the cloud system (Feingold et al., 1998). Our microphysics model allows local scavenging of aerosol that increases the chance of precipitation and associated feedback, which may play a prominent role in the breakup of stratocumulus clouds (Yamaguchi et al., 2017).
The focus of this study is to assess the impact of aerosol perturbations on the SCT in the North-East Pacific (NEP) region in a warmer climate. We use the well-explored composite reference case from Sandu and Stevens (2011) to represent the present-day (PD) scenario (JJA from 2005–2006). In this case, precipitation plays a prominent role in the onset of cumulus activity and subsequent breakup (Yamaguchi et al., 2017; Zhou et al., 2017; Prabhakaran et al., 2024). However, not all SCTs exhibit a key role for precipitation (e.g., Bretherton et al., 2019). To suppress the precipitation-mediated transition, we created an additional case with reduced humidity in the free troposphere (FT). This results in a case where the transition is driven by entrainment-deepening, which is more representative of the NEP region (Bretherton et al., 2019). The humidity in the FT is lowered to 27 % of the reference value and is referred to as the dry FT case. Note that the dry FT case does not represent a climate perturbation; instead, it represents a different realization of the PD scenario.
In exploring the dynamics associated with stratocumulus-to-cumulus transition (SCT), the choice of the simulation domain size becomes important. Yamaguchi et al. (2017) carried out sensitivity tests for the composite case in Sandu and Stevens (2011) and showed that a horizontal domain size of at least 24 km is required to capture the role of precipitation and associated feedback in SCT. Here, all simulations have a domain size of 48 km in the horizontal directions with a uniform grid size of 100 m. The domain top is 4.25 km with a grid size of 10 m until a height of 2.775 km and then gradually stretched to the top of the domain.
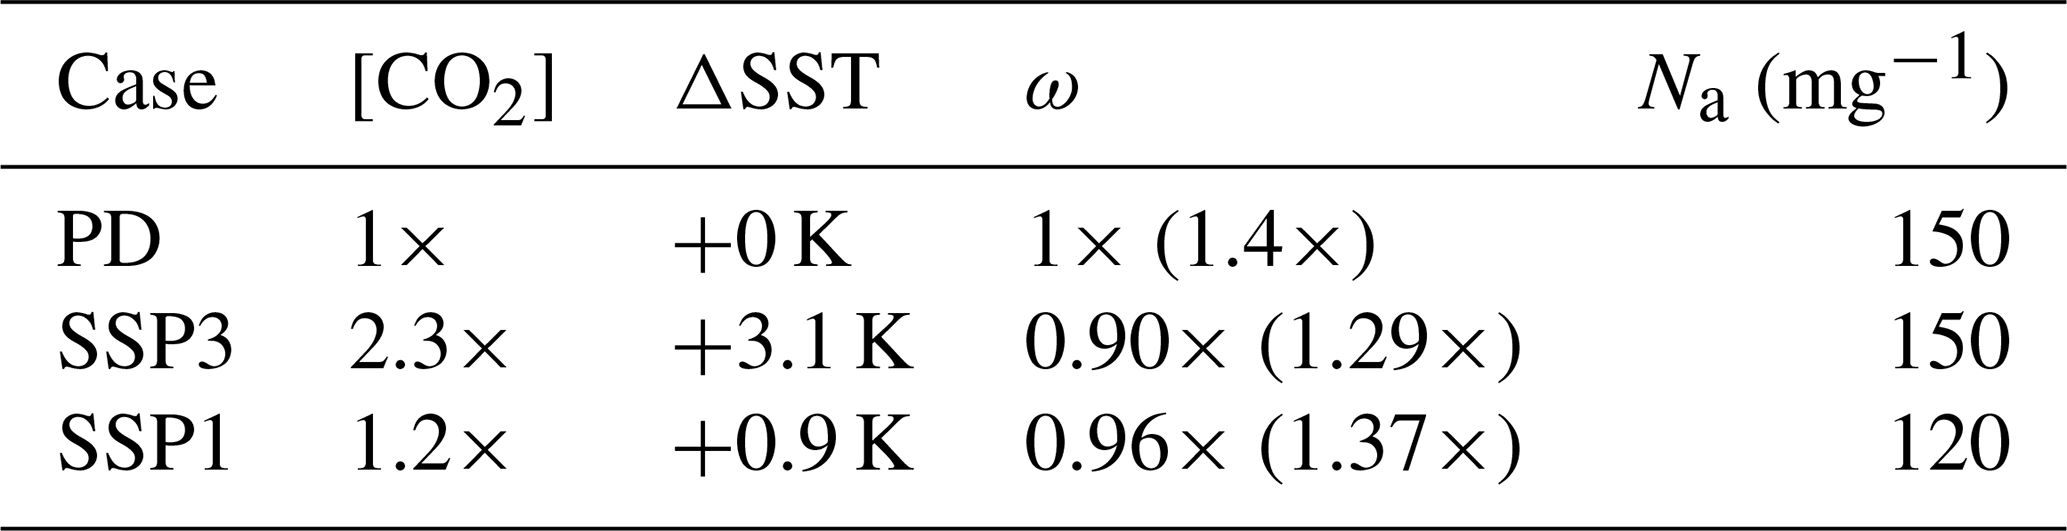
To represent the warmer climate at the end of the century (EoC), we consider two shared socioeconomic pathways (SSPs) with forcings from the Representative Concentration Pathways (RCPs) from the recent coupled model intercomparison project (CMIP6): (i) SSP1-2.6 represents sustainability and is one of the most optimistic warming scenarios, and (ii) SSP3-7.0 represents higher emissions associated with regional rivalry that maintains aerosol forcing (Riahi et al., 2017). The SSP1-2.6, henceforth referred to as SSP1, represents a scenario with cleanup and warming (with respect to preindustrial) restricted to less than 2 °C in global mean temperature. The SSP3-7.0, henceforth referred to as SSP3, is considered the middle-of-the-road scenario. Note that the worst-case-scenario in CMIP6 is SSP5-8.5, however, this scenario is considered highly unlikely (Shiogama et al., 2023). Therefore, we use SSP1 and SSP3 as bounding scenarios to explore the efficacy of MCB in a warmer climate. We use the forcings from these scenarios to develop the equivalent EoC conditions for Sandu and Stevens (2011) using the methodology described in Bretherton and Blossey (2014). A brief overview of the methodology is given below. We also included an additional 12 h spin-up time for the cloud deck to adjust to its surroundings. During this time, the SST and the subsidence velocity remain constant. Aerosol perturbation (uniform surface flux ≈ 2170 particles cm−2 s−1) begins at the end of the spin-up period and is sustained for about 2.67 h (approximate time for a ship to traverse the domain at a speed of 5 m s−1).
To set up simulations under EoC conditions, the variables required from CMIP6 models are changes in SST (ΔSST), CO2 concentration, and changes in subsidence velocity. Note that we are not considering regional variations in temperature due to climate change. We assume that ΔSST is spatially uniform. The ΔSST and CO2 concentrations are obtained from the global average values of the CMIP6 ensemble (Riahi et al., 2017; O'Neill et al., 2016). The challenging part is to determine the sounding profiles for the scalars and the subsidence. The vertical temperature profile in the FT is close to that of a moist pseudoadiabat and is regulated by tropical-deep convective systems (Caldwell and Bretherton, 2009). Under warmer conditions, the temperature in the FT is obtained by following another moist pseudoadiabat with a temperature at sea level that is warmer than the present day value by ΔSST. Similar to earlier studies, we assume that RH in PD and EoC to be identical throughout the domain (Bretherton et al., 2013; Bretherton and Blossey, 2014). The vertical profile of the subsidence velocity (defined as the pressure velocity ω) is determined by ensuring that the average FT temperature drift is minimal. To ensure this, subsidence-induced warming () is balanced by clear-sky radiative cooling in the FT. For more details on determining subsidence profiles, see the appendix in Bretherton and Blossey (2014).
3.1 Precipitation-mediated transition
Figure 1 shows the time evolution of the key cloud-topped boundary layer properties for the original reference case in Sandu and Stevens (2011) (red lines), henceforth referred to as the PD case, and its warmer-world counterpart at the EoC (black (SSP3) and green (SSP1) lines). We start by presenting the impact of warming on the SCT (solid lines) and then discuss the effect of aerosol perturbation (dashed lines). Note that SSP1 has fewer cloud droplets (120 mg−1) compared to the other two cases (150 mg−1) and thus will be discussed separately. Additionally, we use a new metric for determining the onset of cumulus activity. Earlier studies have used various metrics to define the magnitude of this transition. Sandu and Stevens (2011) defined SCT based on reduction in scene albedo (A). In Prabhakaran et al. (2024) and Blossey et al. (2021), the transition is defined on the basis of a sustained reduction (6 to 24 h) in the cloud fraction fc. The latter definition is applicable for the cases in which precipitation plays a prominent role in the transition. Here, we use the spatial variance in the cloud base (zb) as a metric for the onset of cumulus clouds in the boundary layer. For nearly horizontally homogeneous stratocumulus clouds, the variance in zb will be near zero. However, with the onset of cumulus activity, i.e., for cumulus-under-stratocumulus, the variance will increase as the number of cumulus columns increases.
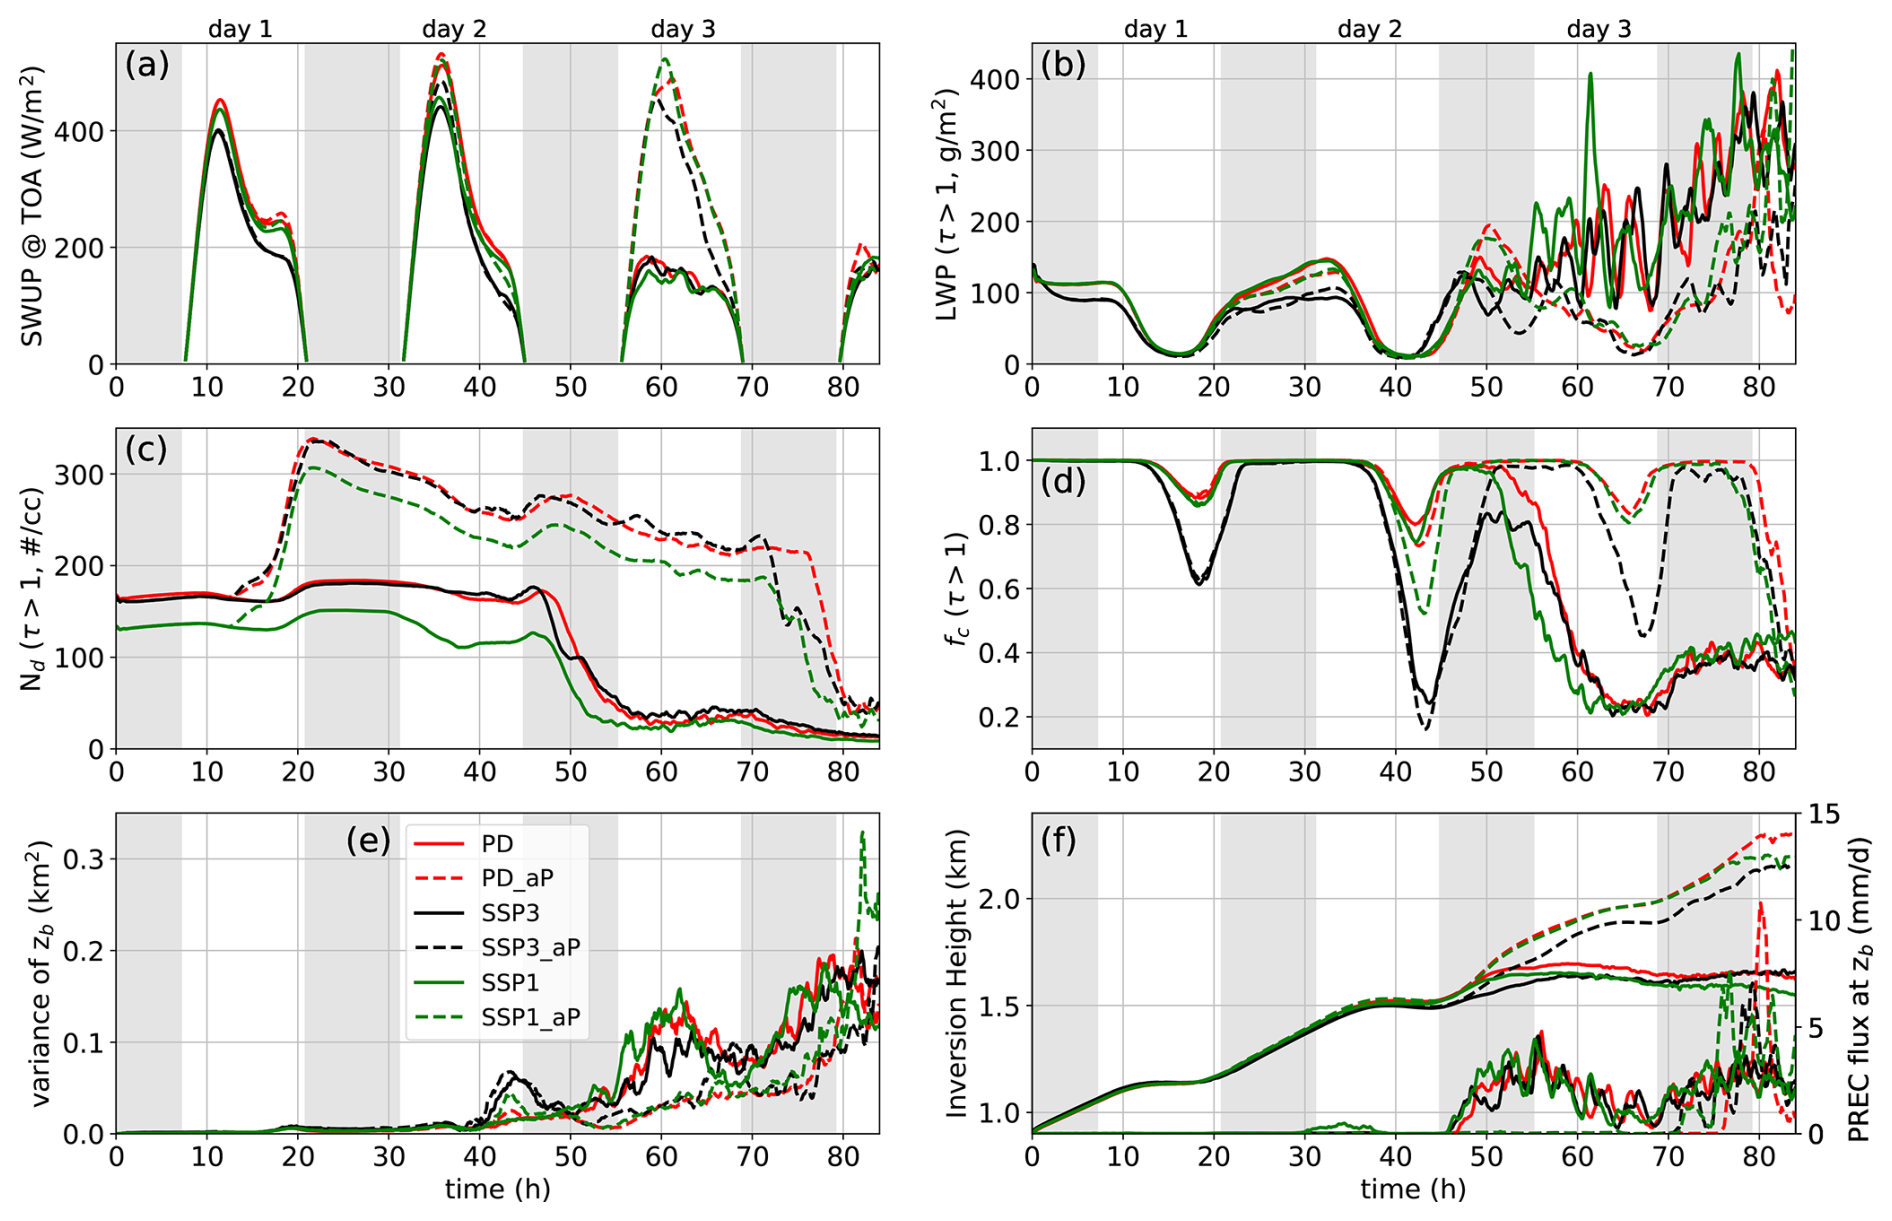
Figure 1Time series of (a) short wave upward (SWUP) flux, (b) liquid water path (LWP), (c) cloud droplet concentration (Nd), (d) cloud fraction (fc), (e) variance of cloud base (zb), (f) domain-averaged precipitation flux (rain rate) at zb and domain-averaged height of the inversion layer (zi) in the high humidity FT cases. τ is the cloud optical thickness used to identify the cloudy regions. The legend is shown in panel (e), and “_aP” in the legend identifies the cases with aerosol perturbation. The time period between sunset and sunrise is shaded in gray.
The evolution of PD (solid red line) is similar to the results in Prabhakaran et al. (2024). The diurnal cycle is clearly evident in the LWP and cloud fraction (fc) time series (Fig. 1b, d). Note that cloud breakup in PD occurs earlier (by approximately 10–12 h) than in Prabhakaran et al. (2024). We attribute this to the additional 12 h spin-up in the current simulations, which causes the boundary layer to deepen by an additional 200 m during this time period. The rapid reduction in fc (around 52 h in Fig. 1d) is triggered by the onset of strong precipitation at the cloud base (Fig. 1f), and is correlated with a rapid reduction in cloud droplet concentration Nd (Fig. 1c). In the strongly warmer-world (SSP3), the LWP is substantially lower than its PD counterpart (Fig. 1b). Note that the entrainment velocity is also lower in SSP3, which is evident from the inversion layer height zi time series (Fig. 1f). This is due to weakening of the boundary layer turbulence due to climate change (Bretherton et al., 2013). zi in the warmer world is lower than in the PD scenario until the onset of precipitation below zb (≈ 55 h). The reduction in LWP, despite the reduction in entrainment velocity, is an outcome of the entrainment-liquid flux (ELF) feedback associated with the increase in humidity jump across the inversion layer due to warming (Bretherton and Blossey, 2014). This increase in the humidity jump across the inversion layer enhances the evaporative cooling rate at the cloud-top, which translates to enhanced buoyancy production at cloud-top, thus increasing the entrainment flux despite a lower entrainment velocity (see Bretherton and Blossey (2014) for a detailed discussion of the ELF feedback mechanism). Additionally, fc undergoes a stronger diurnal cycle in a warmer climate due to the strong reduction in cloud-top radiative cooling as well as the ELF feedback (Bretherton and Blossey, 2014). Interestingly, the onset of cloud breakup in the warmer world (SSP3) around 50 h (Fig. 1d) is also driven by precipitation, and the timing of the onset of precipitation is a bit earlier than in PD. Post cloud breakup (after 64 h), the cloud properties and consequently the short wave upward (SWUP) flux for these two cases converge. The LWP and fc converge within a few hours while the inversion heights take longer. Another variable of interest is the variance of the cloud base height zb (Fig. 1e). We see that cumulus activity is initiated earlier in SSP3 (enhanced value of the variance around 43 h), which is consistent with the earlier onset of precipitation. Note that the boundary layer coupling strengthens after sunset on day 2 and then weakens again after the onset of precipitation. Subsequently, in the remaining days, the magnitude of the zb variance continues to increase. Thus, apart from the onset of precipitation and the reduction in fc, the variance in zb is also a good indicator of cumulus activity in this system.
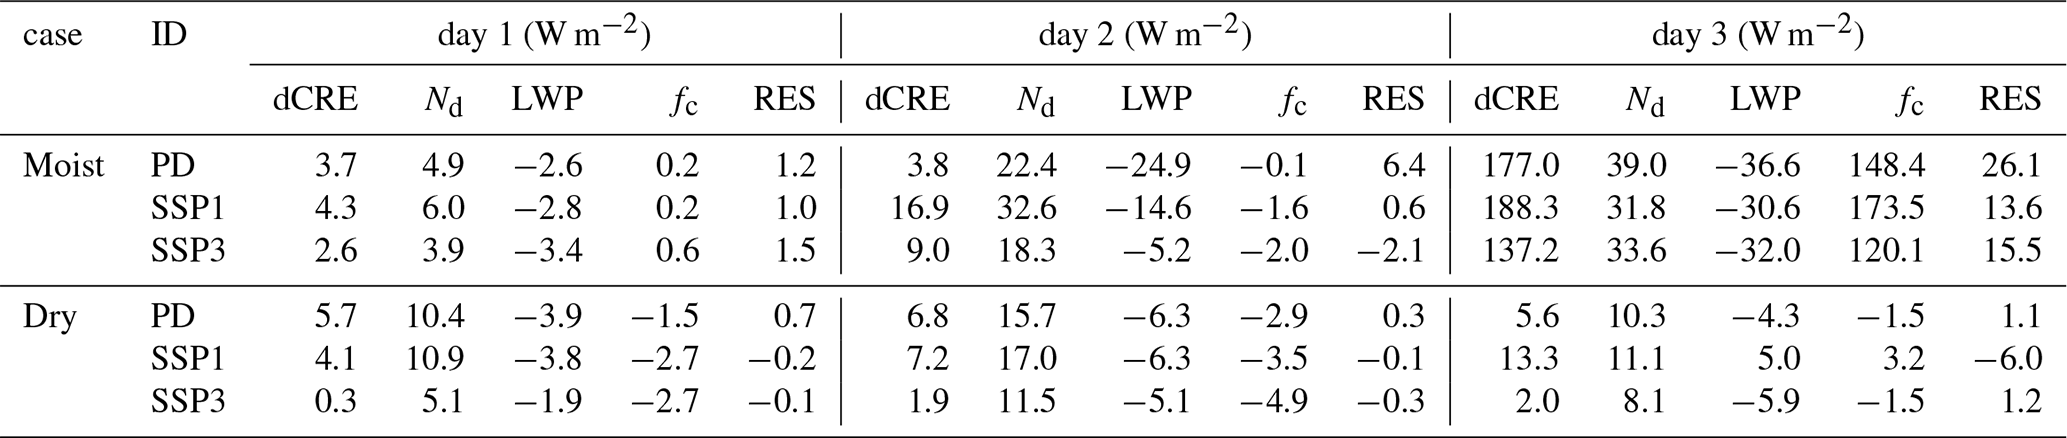
Table 1Large-scale conditions for all the simulations. The changes for each scenario are with respect to the values for the composite reference trajectory in Sandu and Stevens (2011). We report the increase in SST, and the factor by which CO2 concentration ([CO2]) and pressure velocity (ω) changes. The values in the brackets for ω represent the conditions for the equivalent dry FT scenarios. Na shows the aerosol concentration in each scenario.
In the muted warming scenario (SSP1), the effect of warming on cloud properties (solid green line in Fig. 1) is a lot weaker compared to SSP3. This is an obvious outcome of weaker forcing associated with climate change (see Table 1). However, there are additional contributions from the lower aerosol concentration. The LWP and fc are similar to the PD case on days 1 and 2. A possible explanation is that the effects of the ELF feedback associated with warming are offset by the lower aerosol concentration within the marine boundary layer, i.e., the reduction in LWP associated with the effects of climate change (warming and weakened radiative cooling) and the increase in LWP due to the reduction in Nd (weakened sedimentation-entrainment and evaporative-entrainment feedbacks), offset each other. Here too, the lower aerosol concentration results in a slightly earlier onset of precipitation compared to PD. The evolution of cloud properties post-transition is similar to SSP3 but does not show any signs of convergence towards the PD values. fc and SWUP flux are consistently higher in SSP1 after the transition (after ≈ 65 h).
Post aerosol injection (≥ 12 h) and prior to cloud breakup (≲ 50 h), the in-cloud (τ ≥ 1, where τ is cloud optical thickness) LWP is reduced relative to the unperturbed case (dashed lines in Fig. 1). The reduction in LWP is more substantial in PD and SSP1. In SSP3, a combination of weaker boundary layer turbulence (Bretherton et al., 2013) and lower LWP (Chen et al., 2025) reduce the magnitude of sedimentation-entrainment feedback. In PD and SSP3, fc is weakly affected by aerosol perturbation prior to cloud breakup (≈ 50 h). However, in SSP1, suppression of weak precipitation around sunrise on day 2 causes a substantial reduction in fc (between 40–45 h, Fig. 1d, f). This results in a reduction in the scene albedo as is evident from the SWUP flux time series (green dashed line in Fig. 1a). A similar observation was reported in Prabhakaran et al. (2024). This precipitation-suppression induced darkening (albedo reduction) was attributed to the effects of enhanced SW absorption.
Injection of aerosol into the boundary layer delays the onset of cloud breakup through precipitation suppression in all scenarios. Despite the reduction in LWP, the suppression of precipitation maintains overcast conditions for an additional day, leading to substantial cloud brightening on day 3. However, the reduction of fc in the warmer world means that a reduced amount of cloud is available for brightening. This leads to a weaker enhancement of the SWUP flux in SSP3 on day 3 (Fig. 1a).
To quantify the impact of aerosol perturbation on cloud properties, we explore aerosol-induced changes to the SW cloud radiative effect (dCRE ), where positive values indicate cloud brightening. Following Diamond et al. (2020) and Chun et al. (2023), we decompose dCRE into contributions from fc, Nd, and LWP:
where Fin is the incoming solar radiation at top-of-the-atmosphere (TOA), Aclr is the clear-sky albedo, is the cloud albedo contribution from changes in Nd or LWP, fc is cloud fraction, and aP in the subscript indicates aerosol perturbation, respectively. dCRE −Nd or dCRE − LWP represent the change in CRE while LWP or Nd is unperturbed (with respect to aerosol), respectively. Both terms are directly proportional to the unperturbed fc. dCRE −fc is a product of cloud abedo changes and fc changes in response to aerosol perturbation.
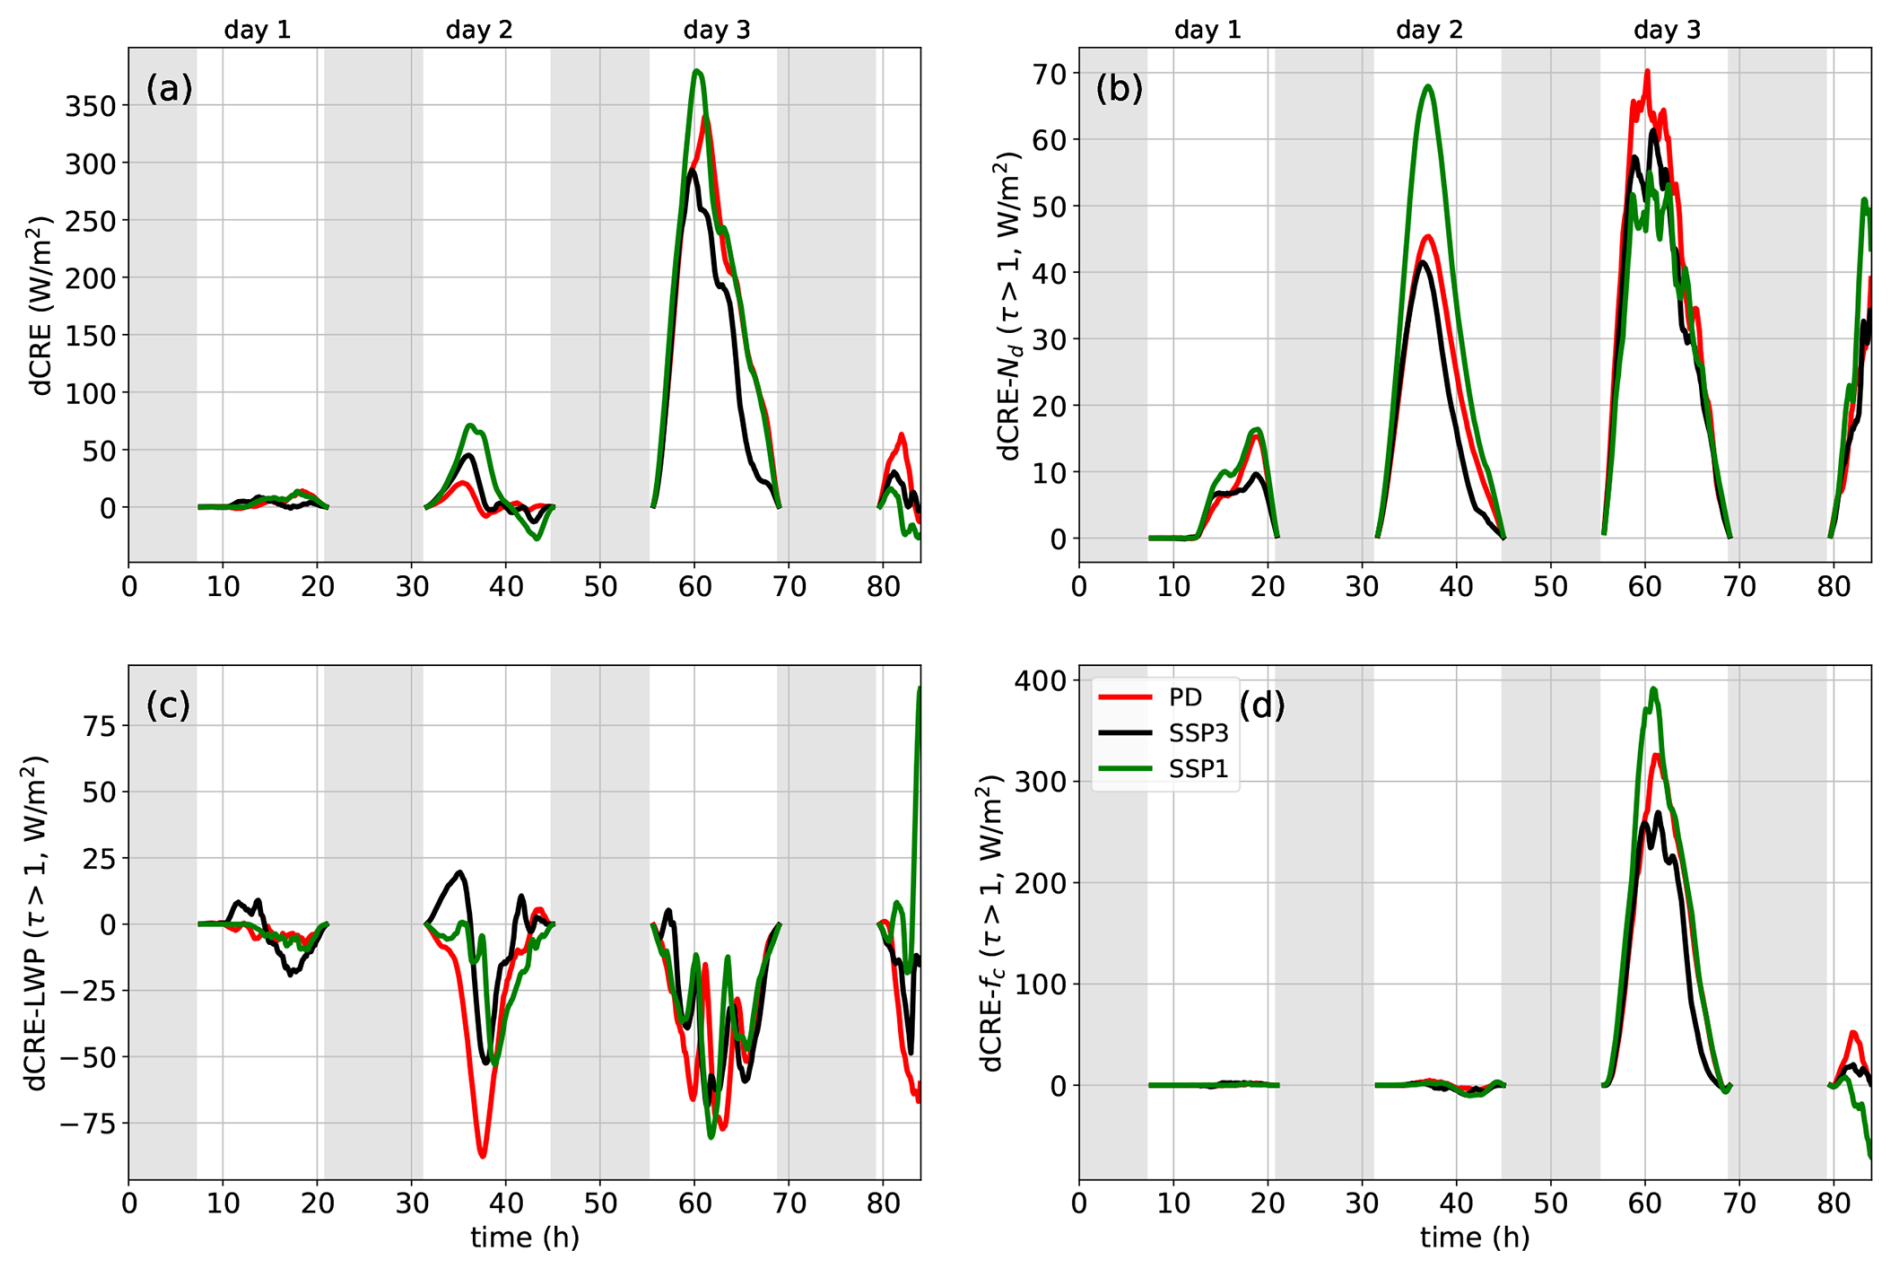
Figure 2Time series of changes in CRE (dCRE = CREunperturbed−CREaerosol perturbed) due to aerosol perturbation in the high FT humidity cases and its contributions from changes to Nd, LWP, and fc. A positive value indicates cloud brightening. (a) dCRE, (b) Nd contribution to dCRE, (c) LWP contribution to dCRE, (d) fc contribution to dCRE. τ is the cloud optical thickness. The legend is shown in panel (d). Note that y axis range is different for each panel.
Figure 2 shows the evolution of dCRE and its components in all scenarios, and Table 2 shows the daytime average for the same quantities. Similar to Prabhakaran et al. (2024), dCRE increases from day 1 to day 3 in all scenarios (Fig. 2a). On day 1, dCRE is highest for SSP1 and PD and lowest for SSP3 (Fig. 2a and Table 2). By day 2, the dCRE is highest for the SSP1 case and lowest for the PD case. On day 3, the highest dCRE is for SSP1 followed by PD and then SSP3. These trends suggest a combined influence of warming and the background aerosol concentrations in determining aerosol-induced CRE changes.
To gain a deeper understanding of these trends on each day, we examine the decomposition of dCRE (Fig. 2b, c, and d). In the first two days, the positive contribution to dCRE is dominated by dCRE −Nd with SSP1 having the highest value. On day 3, dCRE −fc is the dominant contributor to dCRE in all scenarios. This is associated with the suppression of precipitation-induced cloud breakup. As in dCRE −Nd, SSP1 has the highest magnitude, and SSP3 the lowest. The dCRE − LWP component is predominantly negative on all days as a result of the reduction in LWP from increased entrainment flux and SW absorption. This substantially offsets the brightening from the Twomey and lifetime effects. On most days, the highest magnitude is for PD followed by SSP1 and SSP3 (Table 2).
3.2 Entrainment-driven transition
Figure 3, similar to Fig. 1, shows the time series of key boundary layer properties in all scenarios with dry FT humidity (entrainment-driven transition). In this case, precipitation does not play a dominant role in the transition to a cumulus-topped boundary layer. This is evident from Fig. 3f, which shows that the precipitation flux at zb is negligible prior to the onset of cumulus activity (around 66 h) in all unperturbed scenarios. As noted previously, we use the variance in zb as a metric to assess the onset of cumulus activity.
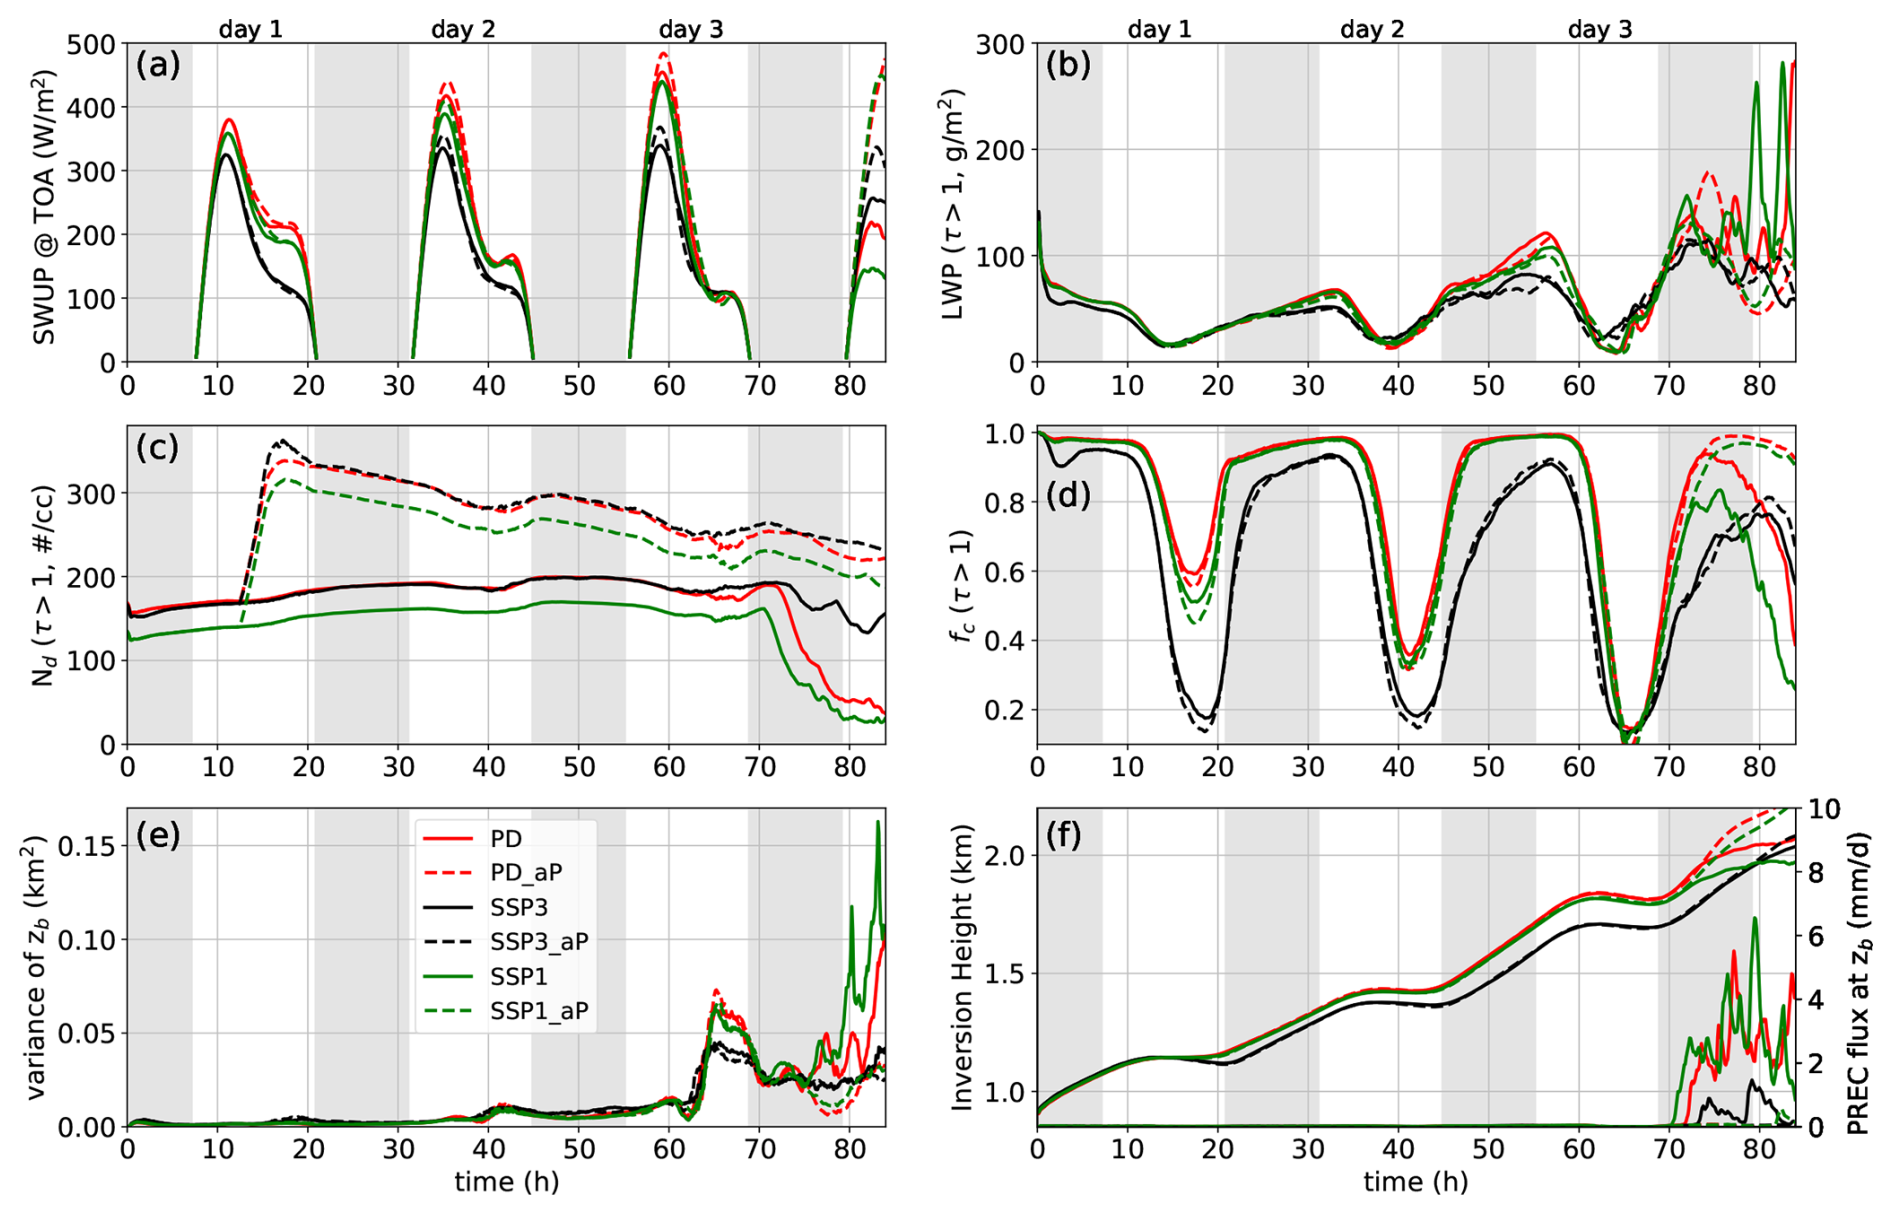
The reduction in FT humidity substantially lowers the cloud LWP (Fig. 3b) compared to the corresponding cases in Fig. 1. Over time, the increase in SST enhances the LWP in the cloud layer in all the unperturbed cases. The LWP is lowest in SSP3 until the onset of precipitation, and similar in the PD and SSP1 cases on day 1 and most of day 2. The relatively low LWP in SSP3 results in weak precipitation below the cloud base until the end of the simulation (Fig. 3f). The fc time series is substantially altered by the degree of climate change (Fig. 3d). The increase in SST due to climate change and the weakening of radiative cooling at cloud-top, enhances the magnitude of changes in fc over the course of a diurnal cycle. Consequently, SSP3 has the lowest fc, followed by SSP1 and the reference case. It is interesting to note that the minimum value in fc is similar on all three days in SSP3, while, in the SSP1 and PD scenarios, the minima in fc decrease from day 1 to day 3. On day 3, the value of the minimum in fc is similar in all three cases around 66 h, marking the onset of cumulus activity. This is evident from the sharp increase in the cloud base variance time series (≈ 66 h in Fig. 3e). The onset of precipitation in the final 12 h of the simulation results in the breakup of the stratocumulus layer, lowers fc and zb, and further increases the variance in zb (Fig. 3d, e, and f). Note that despite the similarity in the onset times of cumulus clouds across scenarios, the cloud breakup timings are quite different. Substantial precipitation occurs first in SSP1 due to a lower Nd, followed by PD, and then SSP3 (Fig. 3f). Substantially lower LWP in SSP3 results in a delayed and weaker precipitation flux (20 %–50 % lower compared to PD). Consequently, cloud breakup is slower in SSP1 (Fig. 3d) and the SWUP flux is highest for SSP1 on day 4 (Fig. 3a). Note that precipitation only plays a secondary role in this entrainment-driven transition case. However, we will see later that the aerosol-induced changes in CRE are dominated by processes associated with precipitation.
The injection of aerosol lowers the LWP in all three scenarios until the onset of precipitation (dashed lines in Fig. 3b). The magnitude of the change in LWP increases with time until the onset of precipitation (Fig. 3b). Additionally, during the daytime, fc also decreases weakly due to the increase in aerosol concentration prior to the onset of precipitation (Fig. 3d). Furthermore, aerosol injection does not influence the onset of cumulus activity (see the variance of zb time series in Fig. 3e). Notable effects related to aerosol perturbation are evident only post precipitation suppression. This enhances fc in PD and SSP1 scenarios. Note that in SSP3, the increase in fc post aerosol injection is weaker compared to SSP1 and PD due to the weaker precipitation flux at zb.
Figure 4 and Table 2 show the dCRE and its components for the entrainment-driven transition cases. Until the onset of precipitation (day 3/day 4), the enhancement in CRE is weaker compared to the high-humidity cases (Fig. 4a). This is an outcome of lower LWP and fc. However, post precipitation onset on the final day, the enhancement in CRE is comparable to the moist FT case. dCRE is comparable in PD and SSP1 on days 1 and 2. On day 3, the dCRE in SSP1 is substantially higher than in PD. For SSP3, the dCRE values are substantially lower than the other two cases on all days. The decomposition of dCRE offers further insights into the evolution of dCRE across scenarios. In SSP3, dCRE −Nd is the lowest on all three days, and the values are similar in SSP1 and PD on each day with slightly higher values for SSP1 due to its lower baseline Nd (Fig. 4b). dCRE − LWP and dCRE −fc are largely negative with similar magnitude in both SSP1 and PD in the first two days (Fig. 4c and d). Additionally, the lowest magnitude for dCRE − LWP on each day is for SSP3. On day 3, there are strong fluctuations in dCRE − LWP and dCRE −fc due to strong cumulus activity (Fig. 4c, d). The substantially higher dCRE on day 3 for SSP1 is the outcome of strong positive LWP and fc contribution due to cumulus activity which is stochastic in nature and thus cannot be directly attributed as a response to aerosol perturbation. A more detailed discussion on ACI after separating the effects of climate change will be presented in Sect. 4.
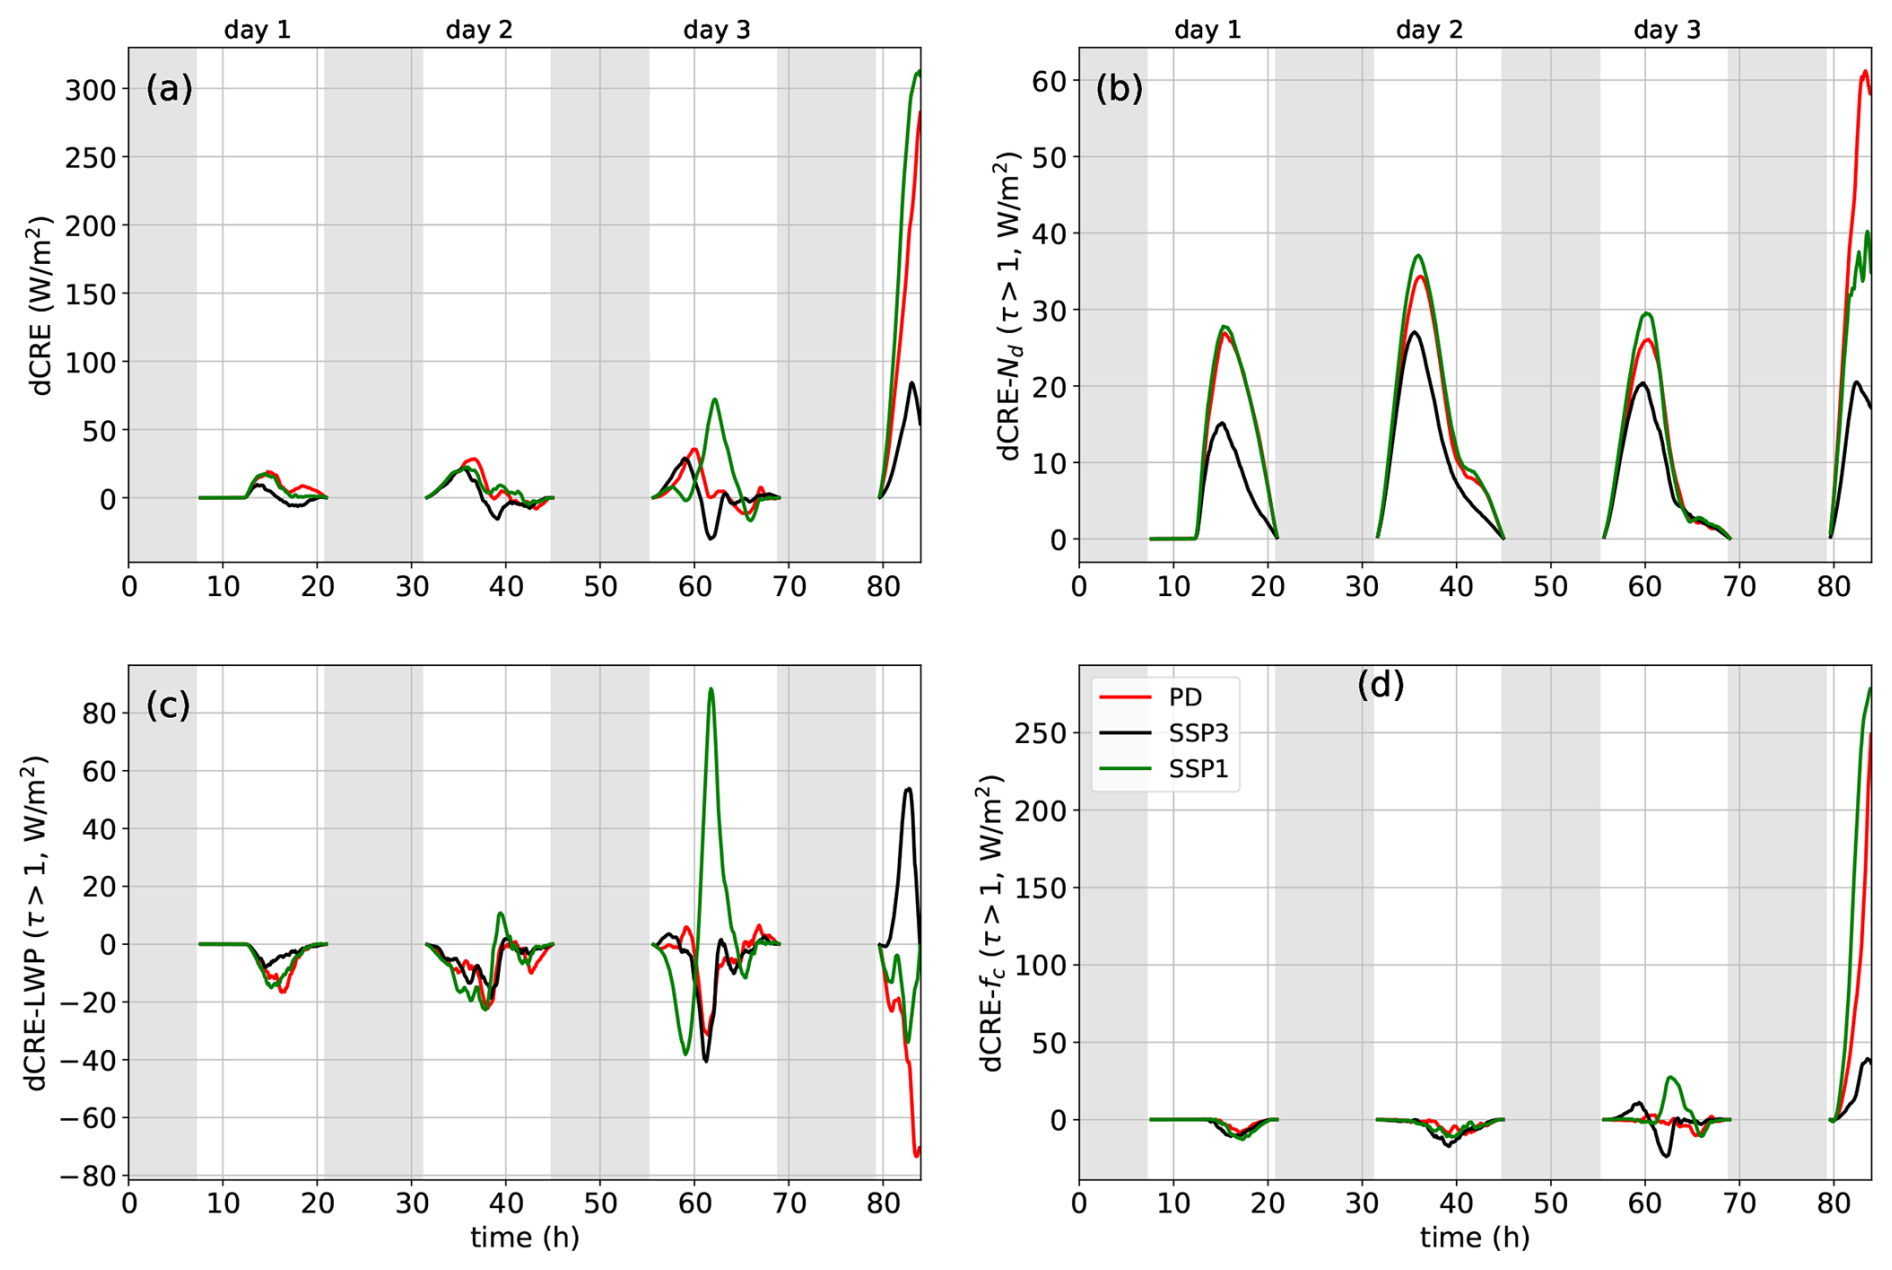
Figure 4Time series of changes in CRE due to aerosol perturbation in the dry FT cases and its contributions from changes to Nd, LWP, and fc. (a) dCRE, (b) Nd contribution to dCRE, (c) LWP contribution to dCRE, (d) fc contribution to dCRE. τ is the cloud optical thickness. The legend is shown in panel (d).
Table 2Cloud radiative effect enhancement (dCRE = CREbaseline−CREaerosol perturbation) and its decomposition at the TOA for all cases. The budgeting is done using cloud properties for a threshold of τ > 1. The quantity for each day is averaged between sunrise and sunset. Column RES is the residual of the dCRE budget. RES = dCRE − sum of dCRE components. A smaller value for RES suggests a uniform cloud field. Note that a positive value for dCRE indicates cloud brightening.
3.3 CRE: Role of climate change
It is tempting to interpret the differences between scenarios in dCRE (Figs. 2 and 4) as an outcome of changes in ACI due to climate change. Instead, these trends are a combination of warming-induced changes and aerosol-induced changes. To better understand this, we quantify the effects of climate change on the unperturbed (with respect to aerosol) state of the cloud. This will aid us in separating the effect of aerosol perturbation from that of climate change.
The impact of climate change on CRE in cases with moist and dry humidities is shown in Fig. 5, which depicts the difference in CRE between PD conditions and EoC conditions (dCREclm). We only consider the cases without aerosol perturbation for calculating dCREclm. A positive value indicates cloud brightening. Note that dCREclm is different from dCRE in Eq. (1). The latter represents the change in CRE due to aerosol perturbation.
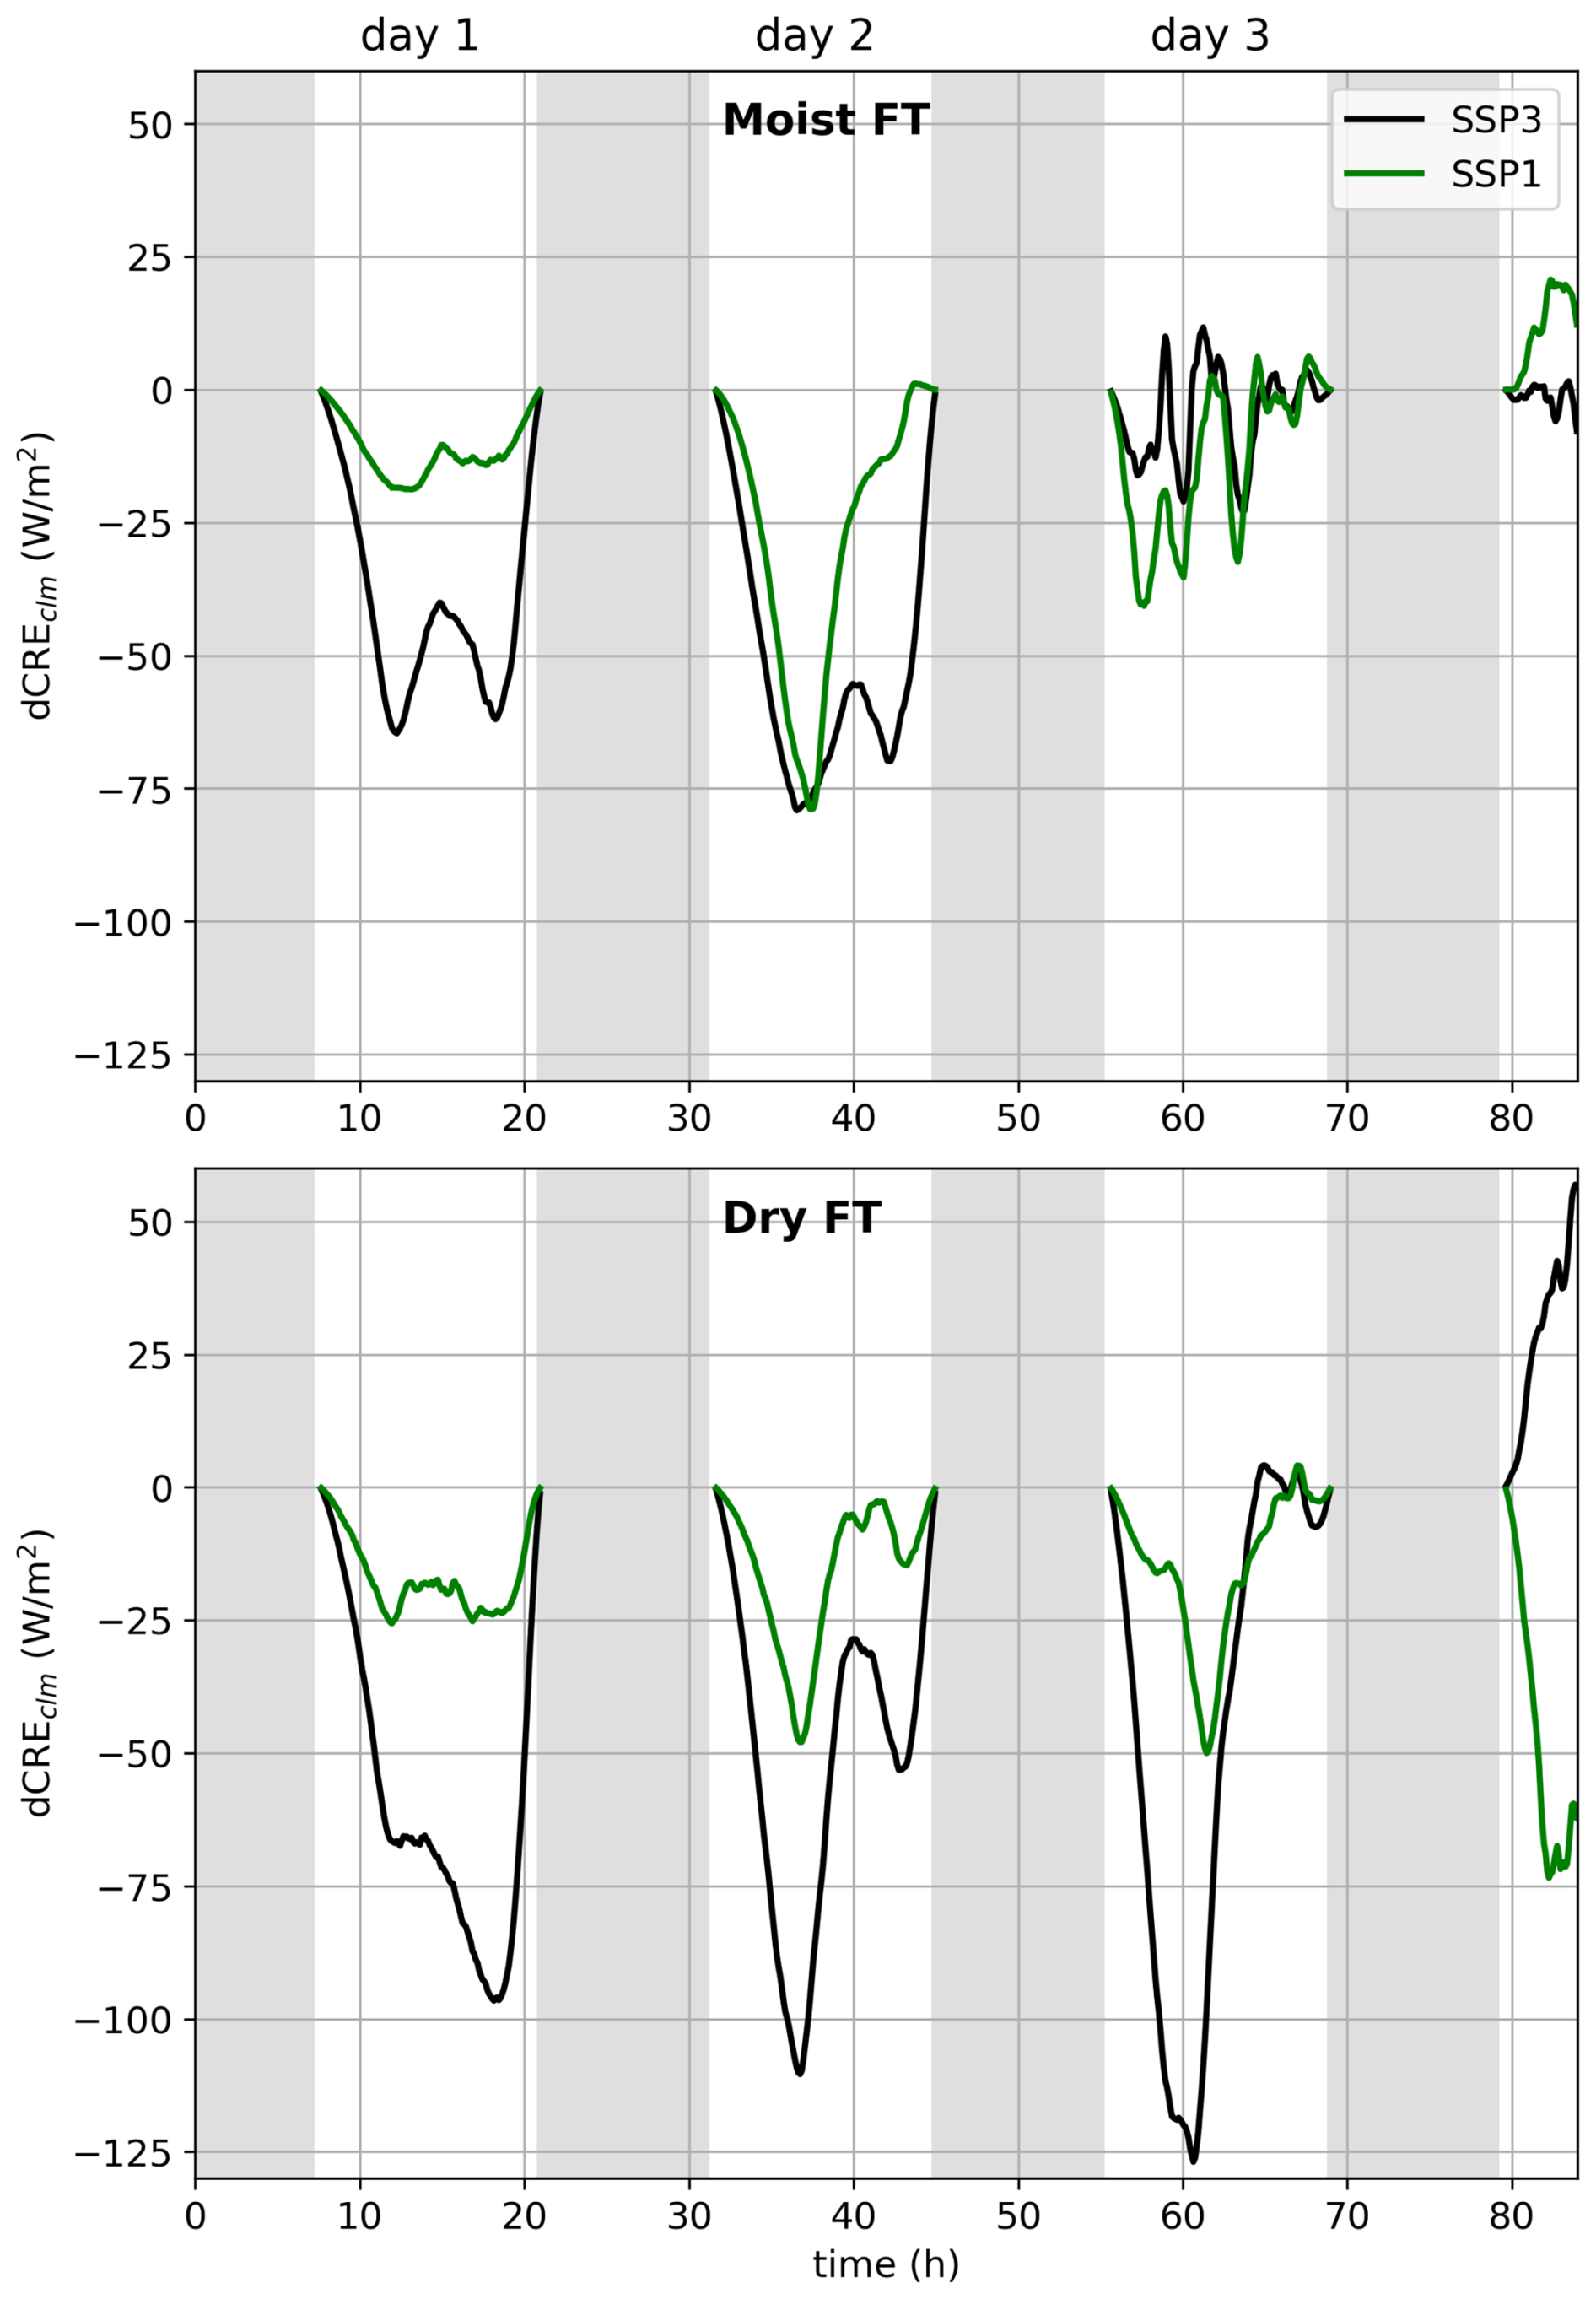
Figure 5Changes in CRE due to climate change. The color code is same as in Figs. 1 and 3. The panel at the top (bottom) represents the moist (dry) FT case. Note that the changes are relative to the PD scenario without aerosol perturbation. A negative value indicates cloud darkening due to climate change.
In the moist FT case, the magnitude of the CRE decreases (cloud darkening) before the onset of strong precipitation in both warming scenarios. This is associated with the reduction in LWP and fc through the effects of warming SST (due to climate change) and the weakening of radiative cooling at cloud-top (Bretherton and Blossey, 2014). The resulting positive low-cloud feedback is consistent with other LES (Bretherton et al., 2013; Bretherton and Blossey, 2014) and observational studies (Myers et al., 2021; Ceppi et al., 2024; Cesana and Del Genio, 2021; Klein et al., 2017). As expected, to leading order, the darkening is stronger for SSP3, though SSP1 shows similar reductions on day 2 due to precipitation losses (Fig. 1f) in LWP and Nd (Fig. 1b and c). On day 3, after the cloud breakup, the magnitude of dCREclm decreases substantially. Note that SSP1 has a slightly higher magnitude on day 3 as precipitation starts earlier. Furthermore, we also see that dCREclm is positive on day 4 in SSP1 due to the higher residual fc.
In the dry FT case, precipitation does not play a prominent role until after sunset on day 3. Until then, SSP3 exhibits the largest darkening. After the onset of cumulus activity (≥ 65 h on day 3), the magnitude of dCREclm reduces to near zero. However, slow cloud breakup in SSP3 due to low LWP results in a positive value for dCREclm (brightening). Overall, the dry FT case exhibits larger (negative) dCREclm compared to the moist FT case and therefore warrants further scrutiny. In particular, we need to understand the impact of climate change on fc and LWP.
Figure 6 depicts the fractional changes in LWP and fc due to climate change. While we show the results for both SSP1 and SSP3, for ease of discussion we focus on SSP3. In moist FT case, the fractional reduction in fc and LWP is substantial. On day 1, the reduction in fc ranges between 5 % and 10 % and increases to 20 %–25 % on day 2. The reduction in LWP is around 20 % on day 1 and less than 5% on day 2. (Note that we are only considering the time period before the onset of precipitation, i.e., before sunset on day 2.) In the dry FT case, the reduction in fc is higher than its moist counterpart (around 30 % to 35 % on days 1 and 2). However, the reduction in LWP is lower compared to the moist case (less than 10 % on day 1). These results indicate that the extent of reduction in fc due to climate change is a function of LWP.
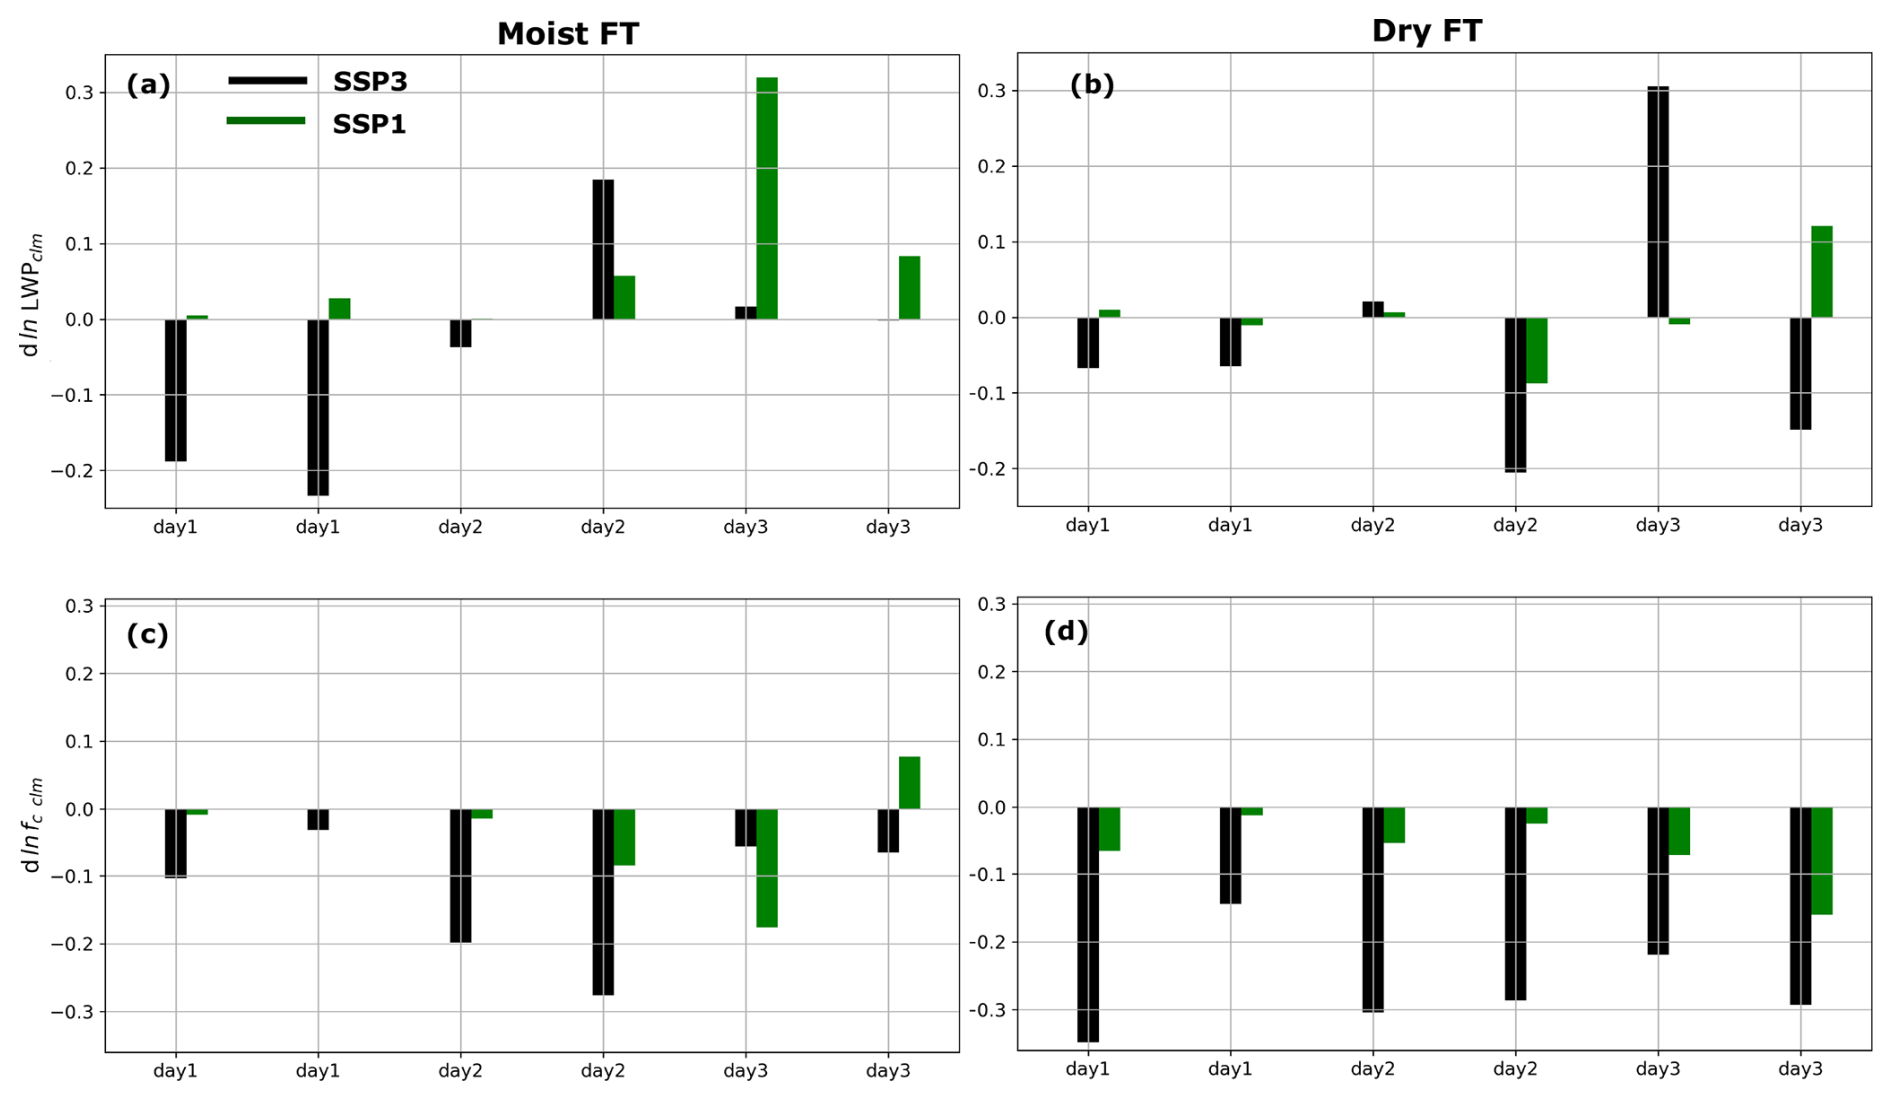
Figure 6Fractional changes in LWP (top) and fc (bottom) due to climate change. The color code is shown in panel (a) and is same as in Figs. 1 and 3. The panels to the left represent the moist FT case and the panels to the right represent the dry FT case. Note that the changes are relative to the equivalent present day scenario. These are average values for each day. Two values per day represent the two averaging periods, between sunrise and sunset (first data point), and sunset to sunrise (second data point).
3.4 Marine cloud brightening
One of the main themes of this study is to evaluate the effect of climate change on the efficacy of marine cloud brightening. To address this, we look at changes to the TOA radiative fluxes. Figure 7 shows time-averaged SWUP flux (panels to the left) and the long-wave upward flux (LWUP) (panels to the right) at the TOA for all cases simulated in this study. There are two data points for each day, each representing the average values between sunrise and sunset and between sunset and sunrise. The top panels represent the moist FT case and the bottom panels represent the dry FT case. In the SSP1 and SSP3 scenarios, the enhancement in SWUP flux due to aerosol perturbation (difference between hatched bars and solid bars) is smaller than the reduction associated with climate change. The effects of positive cloud feedback reduce the brightening prospects of marine low-clouds in the absence of precipitation (see Sect. 3.3).
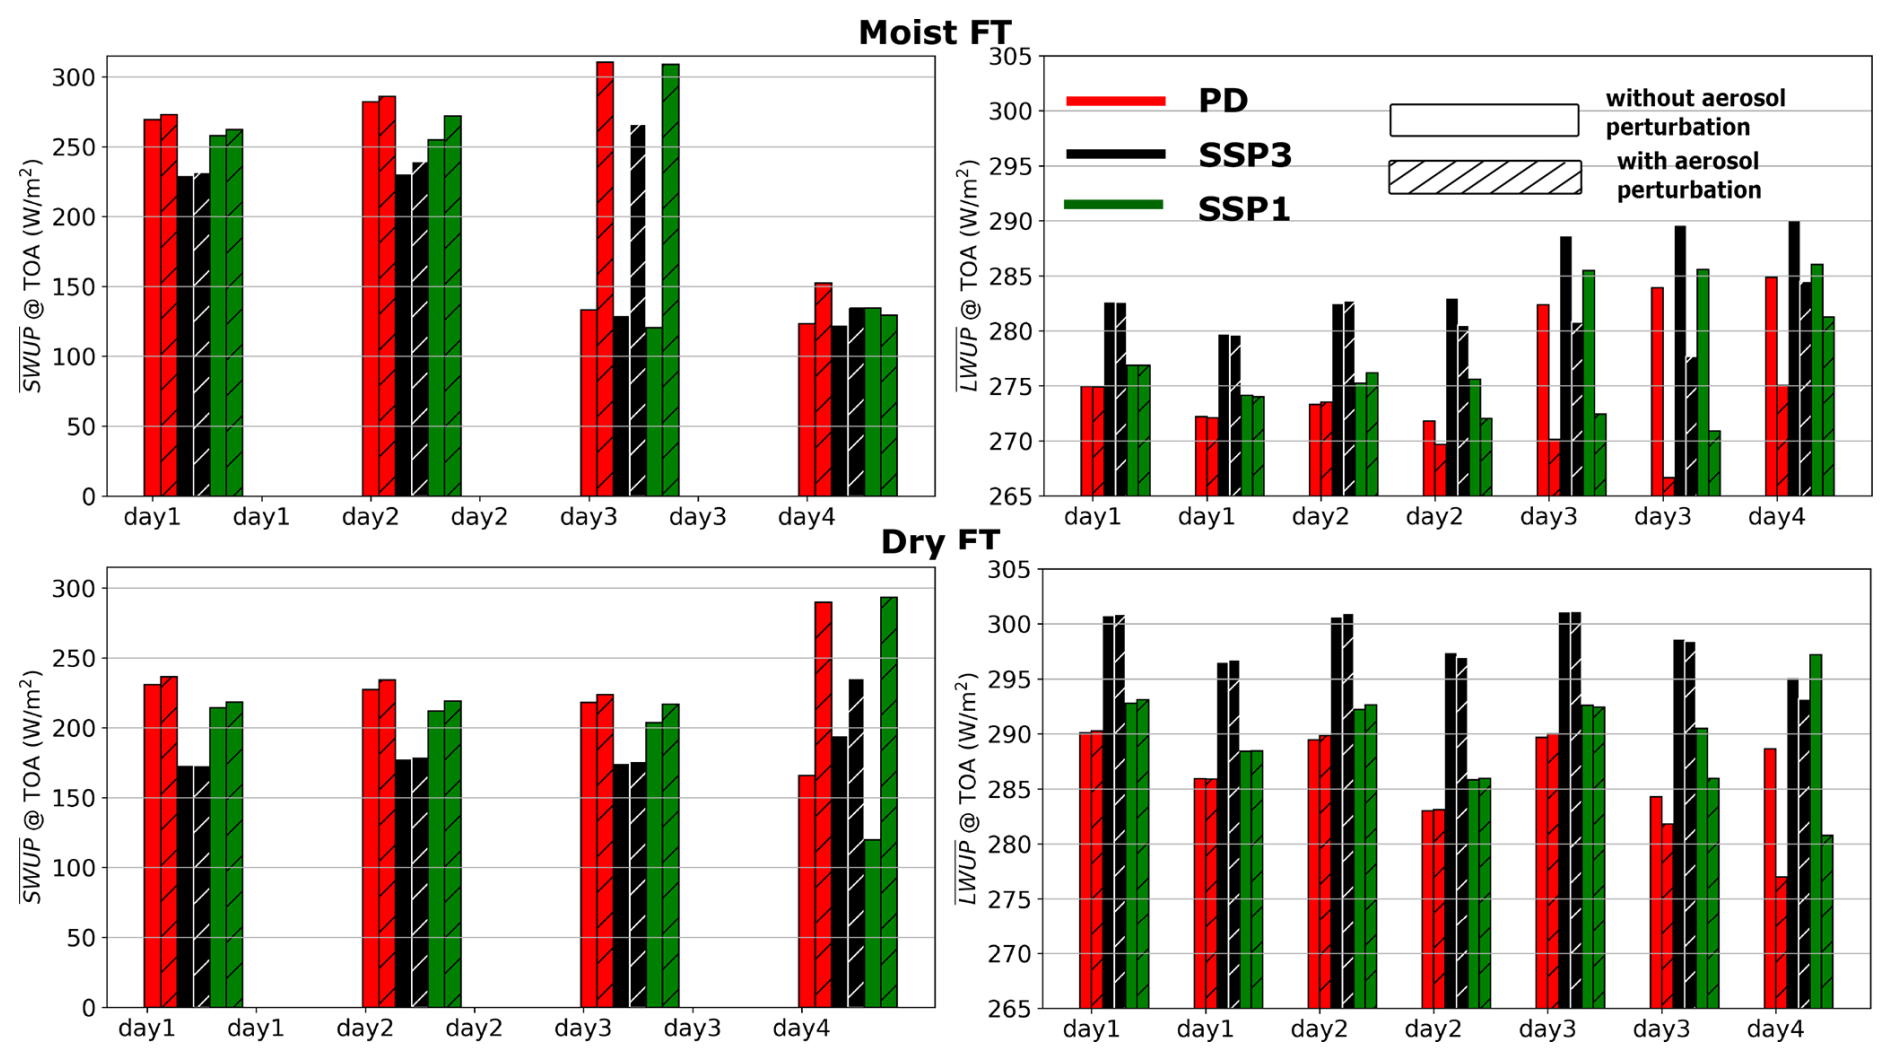
Figure 7Bar plots representing average SWUP (panels to the left) and LWUP (panels to the right) flux at the TOA for each scenario in the moist (top panels) and dry (bottom panels) FT cases. For each day, two average values are reported per scenario. The averaging period for each data point is between sunrise and sunset and between sunset and sunrise. The color code is shown in the top-right panel. The plain and hatched bar plots represent the cases without and with aerosol perturbation, respectively. Note that the vertical axis is different for and .
Suppression of precipitation leads to substantial enhancement in SWUP flux. Some of this enhancement is offset by the reduction in the outgoing LW radiation due to a rise in cloud top height (see the panels to the right in Figs. 7 and 1f). Despite this, in all climate scenarios, suppression of precipitation leads to an enhancement in SWUP flux that is substantially greater than the unperturbed PD scenario, as the effects of cloud feedback are weaker after the cloud breaks up to open-cellular clouds. However, the net enhancement in SWUP flux due to precipitation suppression is not immune to climate change. For instance, in the moist FT case, the highest enhancement in is for the PD and SSP1 scenarios due to the greater fc during daytime on day 3 (Fig. 7a).
In this section, we explore a framework to separate the effects of climate change on the cloud properties from those of aerosol perturbation. Changes in SW CRE due to aerosol injection (dCRE) are shown in Figs. 2 and 4, and the daytime average values are shown in Table 2. The decomposition of dCRE into individual contributions from Nd, LWP, and fc is given by Eq. (1). The Twomey contribution dCRE −Nd and the LWP contribution dCRE − LWP to dCRE are both proportional to unpertured (with respect to aerosol) fc. Furthermore, these components of dCRE are proportional to changes in the cloud albedo due to Nd (or LWP) while LWP (or Nd) is held constant (unperturbed state). The fc contribution, dCRE −fc, is a more complex component of dCRE as it is a function of changes in both fc and total cloud albedo post aerosol perturbation. Under moist FT conditions, the magnitude of dCRE −fc is negligible until the onset of precipitation (see first two days in Fig. 2). Then, to leading order, in the absence of substantial fc changes, dCRE can be expressed as the sum of dCRE −Nd and dCRE − LWP
If we factor out Fin and fc from the above expression, we obtain
The first term on the right side of Eq. (3) is the change in cloud albedo due to the changes in Nd while LWP is kept unchanged and the second term is the change in cloud albedo due to the changes in LWP while Nd is kept unchanged.
The components of albedo changes based on Eq. (3) are shown in Fig. 8 for moist and dry FT cases. There is a remarkable collapse for the Nd contributions across different scenarios in both cases (Fig. 8a and b). We see minor differences between SSP1 and the other two scenarios, which we attribute to the lower aerosol concentration in SSP1 and associated entrainment feedbacks. In the moist FT case, we see a strong deviation in the SSP1 scenario on day 2 due to suppression of weak precipitation. Apart from these minor differences, the collapse in the Nd albedo component extends to clouds with strong precipitation as well (days 3 and 4). In the dry FT case, we see a substantial spread in the Nd albedo component between the scenarios only on day 4. This is related to differences in the timing of the onset and intensity of precipitation across scenarios (Fig. 3f).
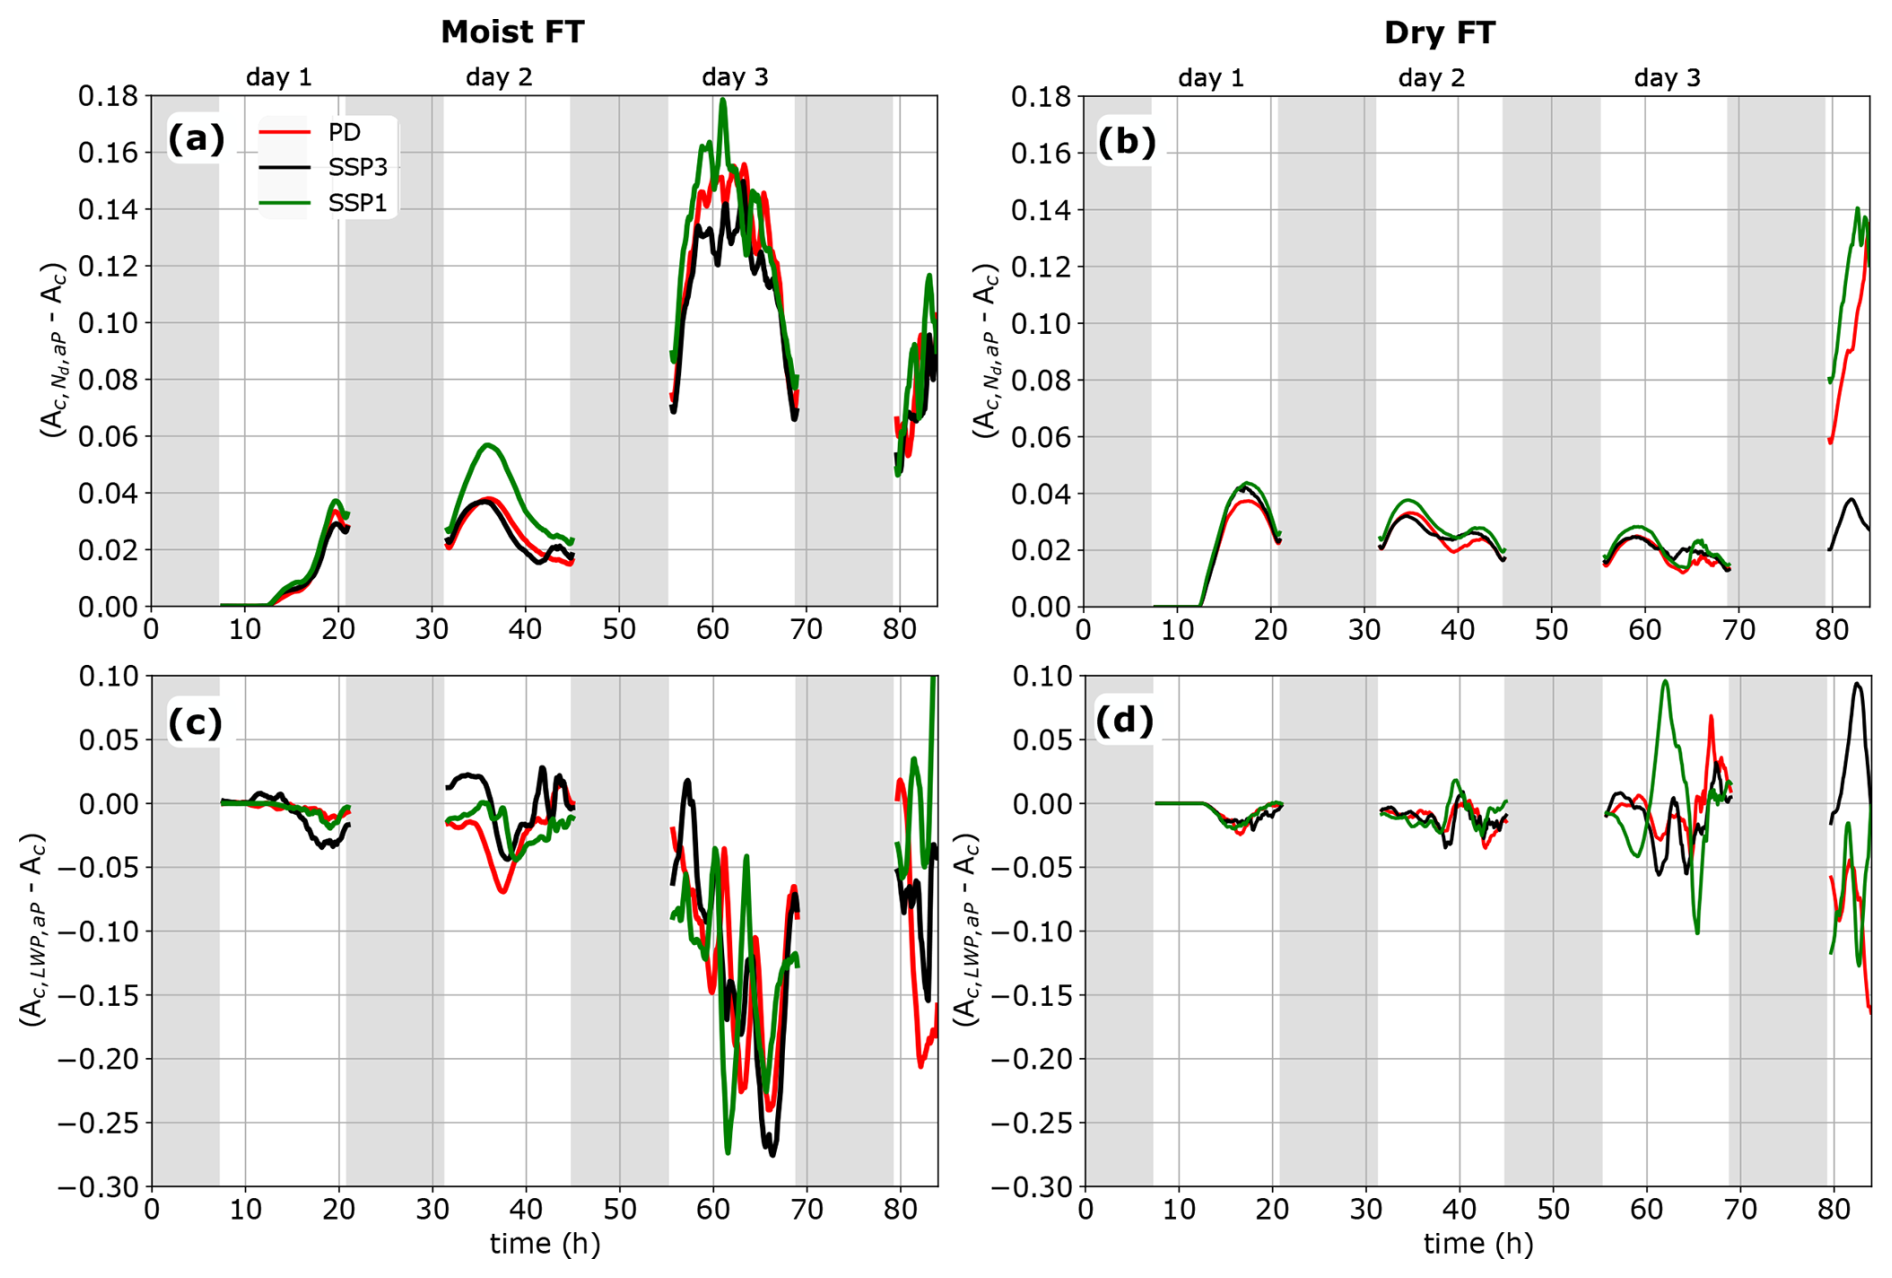
Figure 8Components of cloud albedo changes due to aerosol perturbation in the moist (left column) and dry (right column) cases. The panels at the top (bottom) show the Nd (LWP) component in Eq. (3). The color code is shown in panel (a).
The LWP albedo contribution time series is quite noisy and the collapse across different scenarios is less remarkable compared to the Nd component (Fig. 8c and d). Note that unlike Nd, the LWP adjustment to aerosol perturbation is not instantaneous and could range from a few to several hours (Chen et al., 2025). The critical role of meteorology in determining these time scales is poorly understood. These differences in the LWP adjustment timescale could explain the improved (lower scatter) collapse in the LWP component of the albedo changes in the scenarios with dry FT compared to the equivalent moist FT scenarios in the first two days. Nevertheless, to leading order, there is reasonable collapse across scenarios in both cases on the first two days, and the collapse extends to the third and fourth day in the moist FT scenarios. In the dry FT case, we see a substantial spread across scenarios on days 3 and 4 due to the onset of cumulus activity and precipitation, respectively (Fig. 8d).
In the previous two sections, we explored the effects of climate change on SCT and ACI in the North-East Pacific region. We analyzed two cases of SCT (i) a precipitation-mediated transition, and (ii) an entrainment-driven transition. These cases were created by altering the humidity in the FT, with the high humidity case [the reference case in Sandu and Stevens, 2011] resulting in strong precipitation and the low humidity case resulting in low or negligible precipitation. These cases were subjected to different climate and aerosol perturbations. The results show that until the onset of precipitation the effect of aerosol perturbation is much weaker than the effects of climate change. However, in precipitating cloud systems, the effects of aerosol-induced precipitation suppression dominate over the effects of climate change. In addition, we explore the impact of climate change on the onset of cumulus activity and cloud breakup. The results show that the onset of cumulus activity is not affected by climate change under dry FT conditions and occurs around noon on day 3 (around 66 h). However, the cloud breakup times are different, with the earliest in SSP1, followed by PD and then SSP3. In the moist FT case, SSP3 results in an early onset of cumulus activity (around 42 h) and cloud breakup (around 45 h).
The insights gained from this study would help address the efficacy of MCB as a potential climate intervention strategy to reduce global mean temperature. Our results show that there is a substantial decrease in fc in the warmer world (SSP1 and SSP3 scenarios). This is also supported by the long-term observation trend (Norris et al., 2016). In particular, in our simulations we find that the cases with a drier FT appear to be more susceptible to warming-induced fc reduction. All of this points to a significant reduction in the potential efficacy of MCB as climate change progresses. Thus, from an operational perspective, it would be more effective if MCB were to be deployed sooner rather than later, thus buying additional time for decarbonization technologies to become viable.
5.1 Impact of climate change
Our results in Sect. 3.3 show that in the stratocumulus regime, the dry FT case exhibits a stronger effect of climate change on CRE. We attribute this to the shielding effect of higher LWP in the moist FT case. In all scenarios in Figs. 1 and 3, a substantial reduction in fc does not start until the LWP reaches a sufficiently low value (Prabhakaran et al., 2023). In simpler terms, cloud thinning precedes reduction in fc. Consequently, the higher LWP in the moist FT case shields fc from the effects of weakened radiative cooling and climate-change-induced warming. The lower LWP in the dry FT case results in a stronger reduction in fc. Since CRE, to leading order, is controlled by fc, until the onset of precipitation, dCREclm is higher in the dry FT case.
In the moist FT case, after cloud breakup, the fractional changes in fc and LWP are low, resulting in low dCREclm (Fig. 5). After precipitation-induced breakup, the cloud layer transitions into an open-cellular structure and has the characteristics of a surface driven cloud system (e.g. cumulus clouds) (Wang and Feingold, 2009). Thus, the low value for dCREclm post cloud breakup is consistent with the locally weak low-cloud feedback seen in marine cumulus clouds (Bretherton et al., 2013; Vogel et al., 2016; Dagan et al., 2018; Myers et al., 2021).
5.2 Aerosol–cloud interactions
The similarity in the values for Nd and LWP components of albedo change across climate scenarios in both dry and moist FT cases is, at first sight, puzzling as the impact of climate change on LWP and, by extension, the cloud albedo is clearly evident from the time series plots in Figs. 1b and 3b. It is important to note that the bulk of the reduction in cloud LWP due to climate change is visible post-sunset and before sunrise. Interestingly, after sunrise, the impact of climate change on cloud LWP decreases as clouds with higher LWP are more susceptible to SW absorption (Petters et al., 2012). During this time, the dominant effect of climate change on CRE is evident from the changes in fc (Sect. 3.3). Thus, by factoring out fc in Eq. (2) we are eliminating (to leading order) the effects of climate change on dCRE in non-precipitating marine low-clouds.
The similarity we see here appears to be case-specific as there is no universality among these albedo change time series between the moist and dry FT cases. This local similarity suggests that in stratocumulus clouds, changes in albedo contributions from Nd and LWP are immune to climate change, i.e., the magnitude of Twomey effect and LWP adjustments do not change within the cloudy region. The scenario-specific differences we see in the dCRE components in Table 2 and Figs. 2 and 4 are an outcome of warming-induced changes to the unperturbed state (mainly fc) of the cloud system and not an outcome of the impact of climate change on ACI.
We have established that the Nd and LWP components of are, to leading order, invariant under climate change. If we know the magnitude of the albedo adjustment in the non-precipitating stratocumulus clouds in the present day, then we can estimate the magnitude of CRE adjustment in a warmer climate provided we know fc under warmer conditions. Bretherton et al. (2013) have established that changes in the CRE of stratocumulus clouds due to planetary warming can be approximated as a linear combination of changes in meteorological factors. This linear approximation has also been used in several recent observational studies (Cesana and Del Genio, 2021; Myers et al., 2021; Ceppi et al., 2024; Klein et al., 2017). We extend this to account for Nd and express changes in CRE in non-precipitating clouds under climate change as
where Mi represents ith cloud-controlling meteorological factor and . As discussed earlier, our results suggest that is invariant under climate change. We leave it to future studies to assess the validity of this hypothesis using a larger dataset (observational or simulation).
5.3 Stratocumulus-to-cumulus transition
It is important to note that the low-cloud transitions investigated here are (i) precipitation-mediated (moist FT): from a closed marine startocumulus cloud deck to an open cellular low-cloud layer, and (ii) entrainment-driven (dry FT): the transition from a marine stratocumulus cloud deck to a cumulus-under-stratocumulus cloud deck. Technically, in both cases, the transition to a cumulus-topped boundary layer is not yet complete.
In the precipitation-mediated transition, climate change affects the onset of the transition. The transition is initiated earlier in SSP3 than in PD. Note that both cases have similar aerosol number concentration at the start, and so microphysics is unlikely to explain the difference in initiation time. The boundary layer decoupling is stronger in the SSP3 scenario compared to the PD scenario due to weakened radiative cooling at cloud-top and increased surface latent heat flux (Bretherton and Wyant, 1997). This is also supported by the buoyancy integral ratio (BIR) time series in Fig. 9a. BIR is a ratio between the magnitudes of the negative buoyancy flux in the sub-cloud layer and the positive buoyancy flux in the boundary layer (Turton and Nicholls, 1987; Bretherton and Wyant, 1997). A higher BIR value indicates a stronger decoupling. Note that the level of decoupling is higher in SSP3 especially during the night on day 1. The magnitude of decoupling increases in strength on day 2, which eventually leads to the earlier onset of cumulus activity on day 2. The stronger decoupling in SSP3 is also evident from the jump in the magnitude of the cloud base variance around 43 h (Fig. 1e). The earlier onset of cumulus activity eventually leads to the early onset of precipitation-induced breakup. An earlier transition also occurs in the SSP1 case, but this is driven by both the lower aerosol concentration and the effects of climate change.
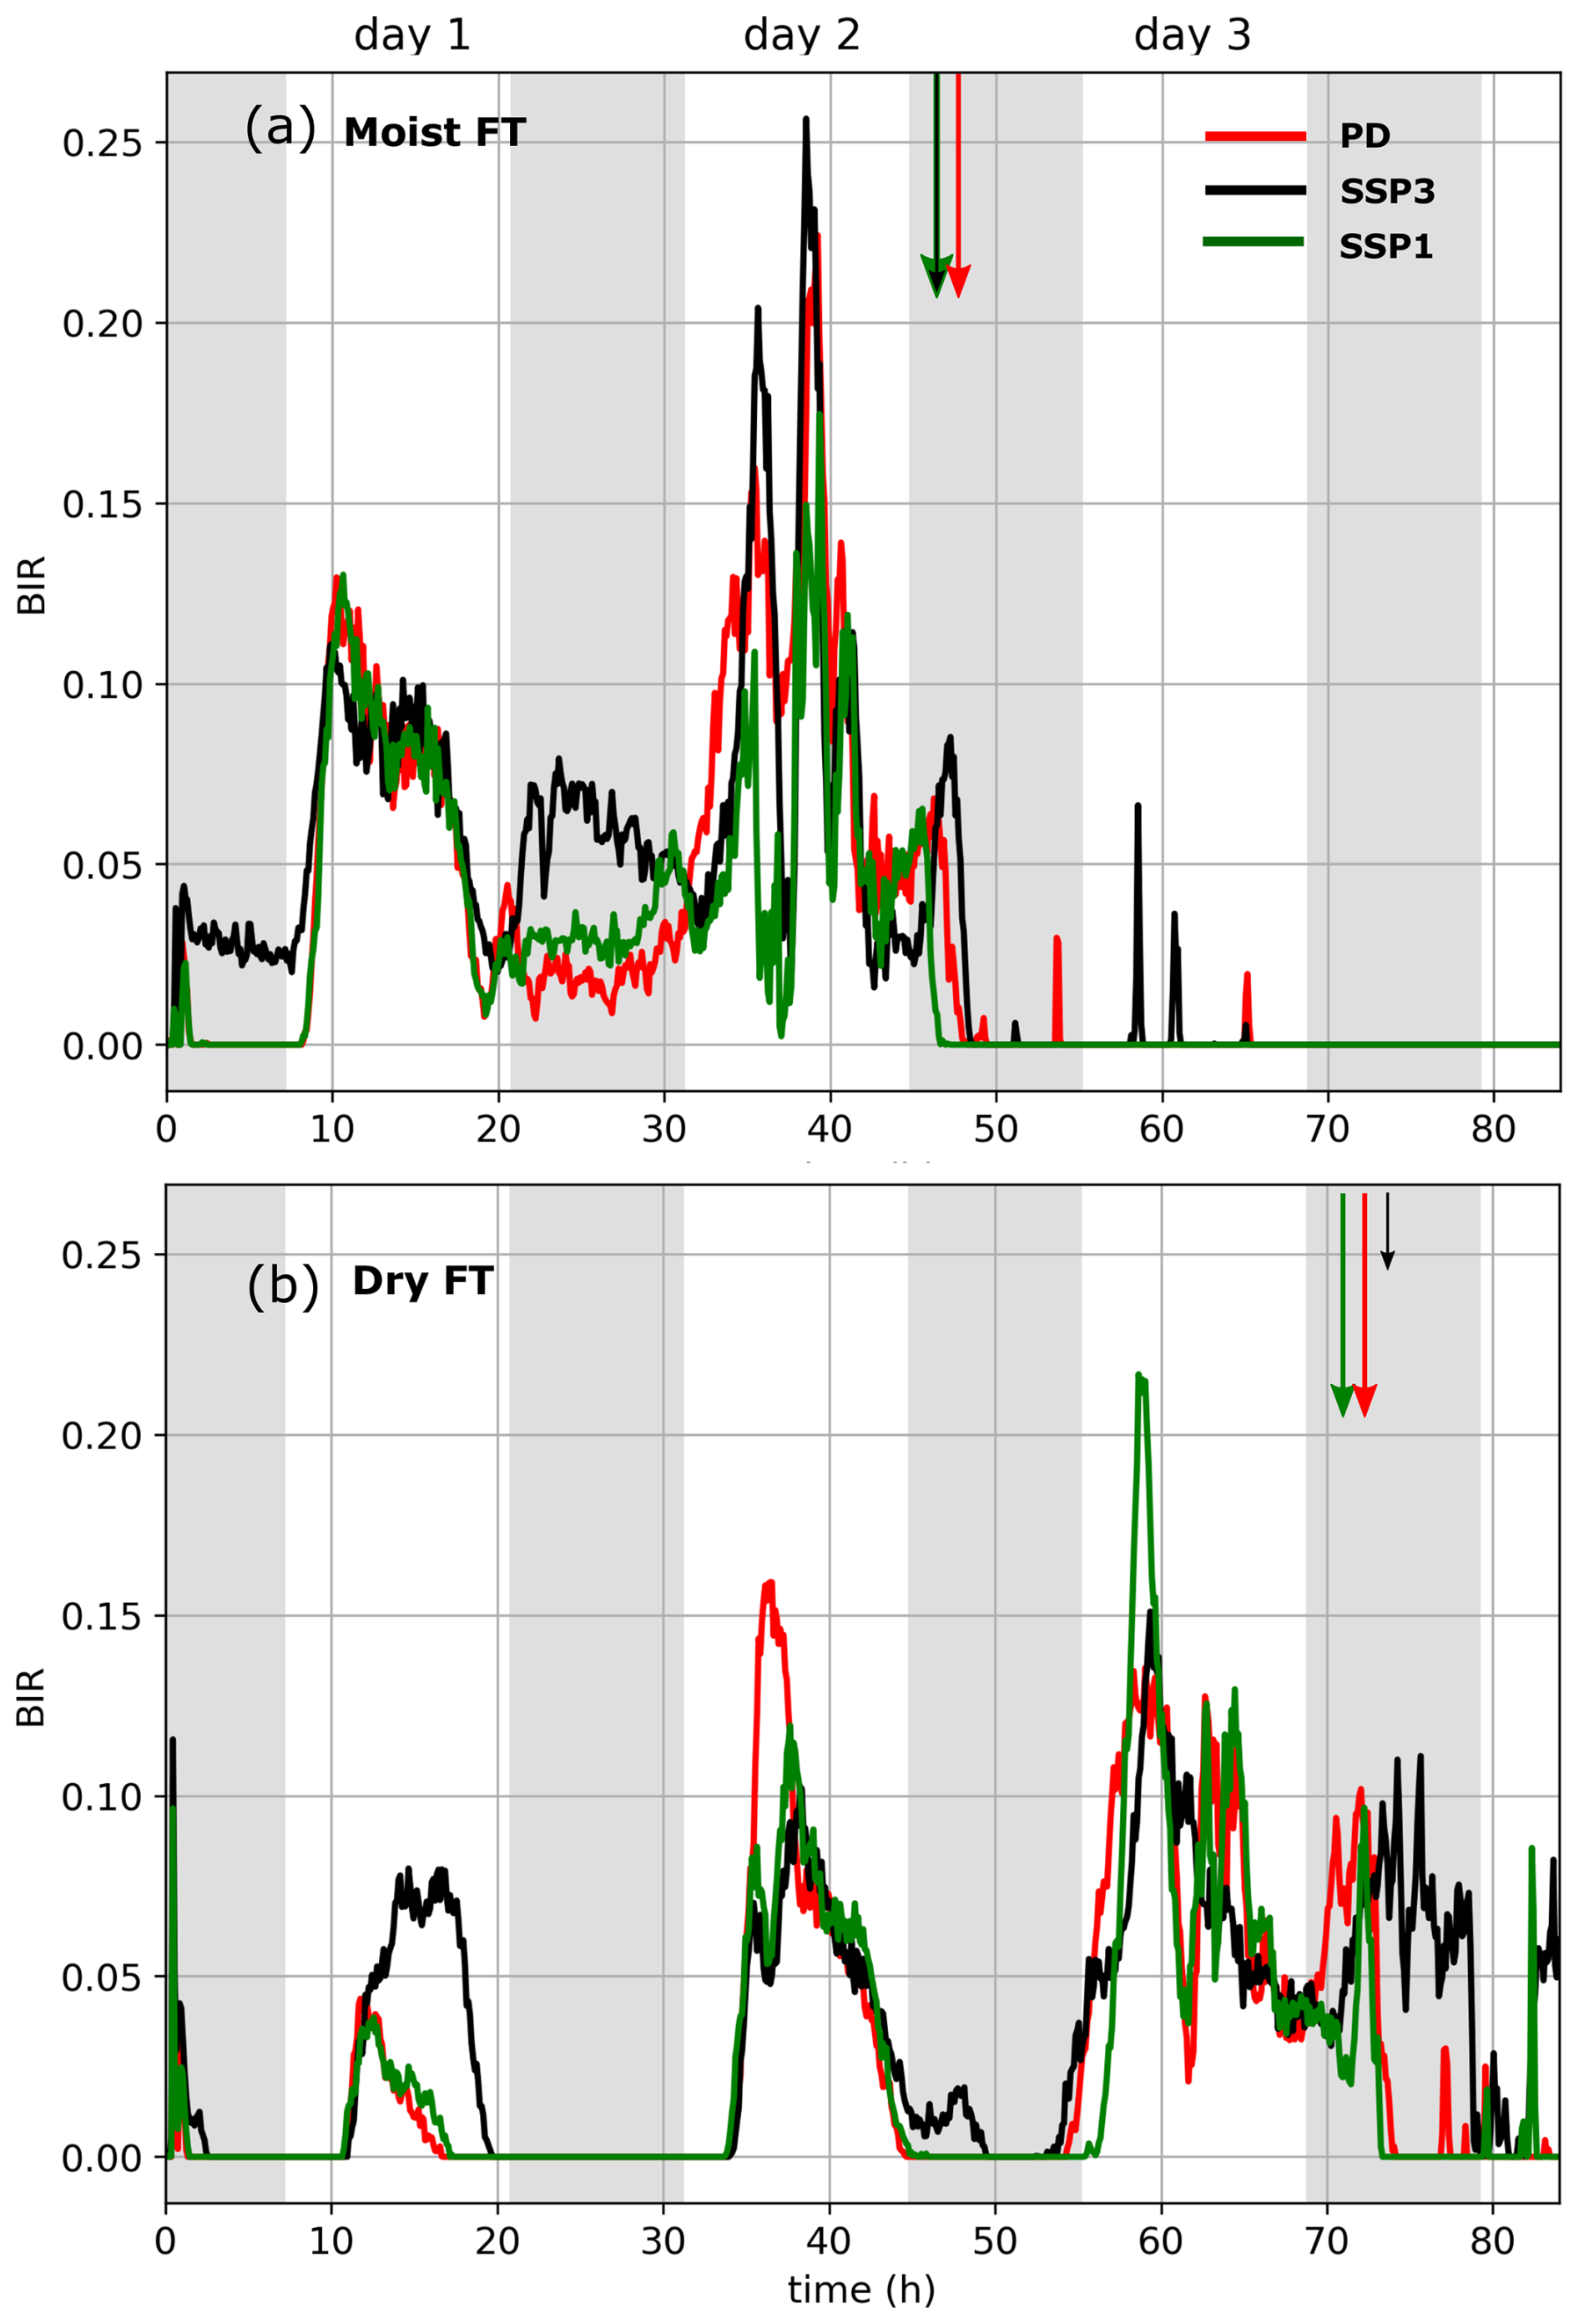
Figure 9Buoyancy integral ratio (BIR) for (a) moist FT scenarios, and (b) dry FT scenarios. The color code is shown in panel (a). The vertical arrows at the top of each panel represent the cloud base precipitation onset time. The length of these arrows is a relative measure of the precipitation intensity.
In the entrainment-driven case, the effects of climate change do not influence the onset of the cumulus clouds. However, the onset of breakup, which is influenced by precipitation, is affected by the effects of warming through changes in LWP. The substantial reduction in LWP in the SSP3 scenario delays the onset and weakens the intensity of precipitation. This results in brighter clouds in the SSP3 case post-transition. This is in contrast to the behavior prior to the transition. It is puzzling that unlike in the scenarios with moist FT, climate change does not affect the onset of cumulus activity in the dry scenarios despite changes in the cloud properties. A possible explanation for this could be that the lower humidity in the FT ensures that radiative cooling at the cloud top is large enough to preserve the structure of the marine boundary layer (MBL) despite the effects of climate change. The BIR time series in Fig. 9b for the dry FT case shows that there is a certain degree of decoupling during the day on the first two days and the extent of decoupling increases from day 1 to day 2. However, after sunset, the boundary layer is recoupled in all scenarios during this time period. On day 3, the decoupling gets a lot stronger in all scenarios, which eventually results in cumulus activity. Note that in the scenarios with moist FT a certain level of decoupling is maintained in the boundary layer even after sunset on all days until the onset of precipitation. Comparison of BIR time series in both cases supports the hypothesis that substantially lower radiative cooling of the boundary layer in the moist FT case (83 W m−2 in moist FT and 113 W m−2 in dry FT) makes the onset of cumulus activity more susceptible to climate change. However, more case studies are required to assess the robustness of this conclusion.
The injection of aerosol delays the breakup of the stratocumulus deck in both moist and dry FT cases by delaying the onset of precipitation in cumulus-cloumns. This leads to substantial brightening of the cloud deck in all climate scenarios. However, the onset of cumulus activity in both cases is largely unaffected by aerosol perturbation (all scenarios in dry FT and SSP3 in moist FT) unless influenced by precipitation formation (PD and SSP1 in moist FT).
In this study, we explored aerosol-cloud interactions (ACI) in a warmer climate in marine low-clouds using Lagrangian (domain advecting with mean wind) large-eddy simulations (LES) coupled to two-moment, bin-emulating bulk microphysics models. We used the well-explored composite reference case from Sandu and Stevens (2011) to set up the stratocumulus-to-cumulus transition (SCT) simulations. In this case, precipitation plays a prominent role in the transition (precipitation-mediated transition) (Yamaguchi et al., 2017). Since not all SCTs are driven by precipitation, we created another case with reduced FT humidity. The humidity was reduced to 27 % of the value in the composite reference case in Sandu and Stevens (2011). This resulted in a case where the onset of cumulus activity was driven by the classical entrainment-deepening of the marine boundary layer (entrainment-driven transition). The equivalent cases for warmer conditions at the end-of-the-century were created following the methodology laid out in Bretherton and Blossey (2014). The large-scale forcings for this setup were obtained from the latest coupled model intercomparison project (CMIP6) data. We considered two shared socioeconomic pathways (SSP) from CMIP6: (i) SSP1-2.6: this is the best-case scenario with a sustainable future with clean up, and (ii) SSP3-7.0: fossil-fueled growth due to regional rivalry.
Our results showed that the effect of climate change on the cloud radiative effect (CRE) dominates over the effect of aerosol perturbation prior to the onset of precipitation in both precipitation-mediated and entrainment-driven cases. In particular, the impact of climate change is much stronger in the entrainment-driven case compared to the precipitation-mediated case. This is because of the higher LWP in the precipitation-mediated case, which shields the cloud fraction (fc) from erosion against the weakened radiative cooling and warming effects associated with climate change. Interestingly, the impact of climate change is muted once the cloud deck is broken up into open-cellular cumulus clouds.
We also explored the impact of climate change on the onset of cumulus activity, as quantified using the variance in cloud base height. In the moist FT case (precipitation-mediated), the effects of climate change resulted in an earlier onset of cumulus activity, which advanced the onset of precipitation-induced cloud breakup in a strongly warmer climate (SSP3). In the dry FT case (entrainment-driven), the onset of cumulus activity appeared immune to the effects of climate change. Our analysis indicated that the weaker radiative cooling associated with higher humidity in the FT makes the boundary layer less coupled in the precipitation-mediated case. Further weakening of radiative cooling associated with climate change enhances the decoupling of the boundary layer, resulting in an earlier onset of cumulus activity. A substantially higher cooling rate at cloud-top in the entrainment-driven case (due to the lower humidity in the FT) maintained a well-mixed boundary layer in all cases until the onset of cumulus activity on day 3. In this case, a similarity in the onset time of cumulus clouds does not translate into a similarity in the onset time of cloud breakup. In a strongly warmer climate (SSP3), the onset of cloud breakup is substantially delayed due to its lower LWP and weaker precipitation intensity. In both moist and dry FT cases, aerosol injection delayed the breakup of the stratocumulus layer through precipitation-suppression, thus substantially enhancing the magnitude of CRE in all scenarios.
The central focus of our study was to assess the impact of climate change on ACI in marine low-clouds. Our analysis showed that the Nd and LWP components of the cloud albedo changes due to aerosol perturbation are similar under the influence of climate change. Thus, in non-precipitating clouds, to leading order, changes in CRE due to aerosol perturbation (dCRE) normalized by fc are constant under the influence of climate change. However, the albedo contributions associated with precipitation-suppression are coupled to changes in both fc and cloud albedo, and are not immune to climate change. Despite this similarity in the ACI in a warmer climate in non-precipitating clouds, the efficacy of marine cloud brightening (MCB) reduces substantially towards the end-of-the-century due to the reduction in cloud fraction associated with the effects of climate change. Moreover, the dCRE in precipitating clouds also decreases due to the effects of climate change. Thus, if considered, a practical implementation of MCB would be more efficient sooner rather than later.
The simulations carried out here are based on an idealized SCT case study built from a 2-year (summer-time) composite trajectory that does not account for all the real-world complexity and variations (e.g., changes in wind speed), and an active coupling between the tropics and the sub-tropics. Chun et al. (2025), employing a weak-temperature gradient framework, report that such coupling could affect the results presented here. However, there is still much uncertainty in how to realistically represent such coupling in a warmer climate in Lagrangian LES of the kind used here. Additionally, the insights from the current study and similar LES studies are only relevant in assessing ACI in the initial phase of MCB. Sustained MCB will result in significant changes in large-scale climatology and background aerosol concentration. Furthermore, evaporation of the sprayed seawater can alter the dynamics of the boundary layer, affecting the efficacy of MCB (Jenkins and Forster, 2013). To overcome these challenges, future studies should focus on an ensemble of trajectories based on realistic conditions in the present and warmer world to assess the impact of climate change on the efficacy of MCB, changes in ACI, and SCT. These studies would aid in assessing the generality of the key hypotheses from the current study – (i) in non-precipitating clouds, changes in CRE due to aerosol perturbation when normalized by fc, are invariant under climate change, and (ii) the efficacy of MCB decreases in a warmer climate due to the reduction in cloud fraction.
The simulations were carried out using SAM (https://wiki.harvard.edu/confluence/display/climatemodeling/SAM, last access: 30 July 2021). The data from the simulations are available from the NOAA Chemical Sciences Laboratory's Clouds, Aerosol, & Climate program webpage at https://csl.noaa.gov/groups/csl9/datasets/data/2026-Prabhakaran-etal/ (last access: 4 February 2026).
PP and GF designed the research with inputs from TM. PP carried out the simulations and analysis. PP, TM, FH, and GF discussed the results. PP wrote the manuscript with input from TM, FH and GF.
At least one of the (co-)authors is a member of the editorial board of Atmospheric Chemistry and Physics. The peer-review process was guided by an independent editor, and the authors also have no other competing interests to declare.
Publisher's note: Copernicus Publications remains neutral with regard to jurisdictional claims made in the text, published maps, institutional affiliations, or any other geographical representation in this paper. The authors bear the ultimate responsibility for providing appropriate place names. Views expressed in the text are those of the authors and do not necessarily reflect the views of the publisher.
Prof. Marat Khairoutdinov graciously provided the SAM model. PP thanks Dr. Jan Kazil and Dr. Isabel McCoy for their inputs in setting up the warmer world simulations.
This research was supported by the U.S. Department of Commerce, Earth's Radiation Budget grant, NOAA CPO Climate and CI no. 03-01-07-001. FH appreciates support from the Emmy Noether program of the German Research Foundation (DFG) under grant HO 6588/1-1.
This paper was edited by Anna Possner and reviewed by two anonymous referees.
Ackerman, A. S., Kirkpatrick, M. P., Stevens, D. E., and Toon, O. B.: The impact of humidity above stratiform clouds on indirect aerosol climate forcing, Nature, 432, 1014–1017, https://doi.org/10.1038/nature03174, 2004. a
Albrecht, B. A.: Aerosols, cloud microphysics, and fractional cloudiness, Science, 245, 1227–1230, https://doi.org/10.1126/science.245.4923.1227, 1989. a
Bellouin, N., Quaas, J., Gryspeerdt, E., Kinne, S., Stier, P., Watson-Parris, D., Boucher, O., Carslaw, K. S., Christensen, M., Daniau, A.-L., Dufresne, J.-L., Feingold, G., Fiedler, S., P. Forster, P., A. Gettelman, A., Haywood, J. M., Lohmann, U., Malavelle, F., Mauritsen, T., McCoy, D. T., Myhre, G., Mülmenstädt, J., Neubauer, D., Possner, A., Rugenstein, M., Sato, Y., Schulz, M., Schwartz, S. E., Sourdeval, O., Storelvmo, T., Toll, V., Winker, D., and Stevens, B.: Bounding global aerosol radiative forcing of climate change, Reviews of Geophysics, 58, e2019RG000660, https://doi.org/10.1029/2019RG000660, 2020. a
Blossey, P. N., Bretherton, C. S., and Mohrmann, J.: Simulating observed cloud transitions in the northeast Pacific during CSET, Monthly Weather Review, https://doi.org/10.1175/mwr-d-20-0328.1, 2021. a
Boucher, O., Randall, D., Artaxo, P., Bretherton, C., Feingold, G., Forster, P., Kerminen, V.-M., Kondo, Y., Liao, H., Lohmann, U., Rasch, P., Satheesh, S., Sherwood, S., Stevens, B., and Zhang, X. Y.: Clouds and aerosols, in: Climate Change 2013: the Physical Science Basis. Contribution of Working Group I to the Fifth Assessment Report of the Intergovernmental Panel on Climate Change, edited by: Stocker, T. F., Qin, D., Plattner, G.-K., Tignor, M., Allen, S., Boschung, J., Nauels, A., Xia, Y., Bex, V., and Midgley, P. M., Cambridge University Press, Cambridge, United Kingdom and New York, NY, USA, 571–657, https://doi.org/10.1017/CBO9781107415324.016, 2013. a
Bretherton, C.: A conceptual model of the stratocumulus-trade-cumulus transition in the subtropical oceans, in: Proc. 11th Int. Conf. on Clouds and Precipitation, vol. 1, 374–377, https://www.iamas.org/iccp/wp-content/uploads/sites/3/2021/01/11th-Internation-Conference-on-Clouds-and-Precipitation-Proceedings-Vol-I.pdf (last access: 5 April 2026), 1992. a
Bretherton, C. S.: Insights into low-latitude cloud feedbacks from high-resolution models, Philosophical Transactions of the Royal Society A: Mathematical, Physical and Engineering Sciences, 373, 20140415, https://doi.org/10.1098/rsta.2014.0415, 2015. a
Bretherton, C. S. and Blossey, P. N.: Low cloud reduction in a greenhouse‐warmed climate: Results from Lagrangian LES of a subtropical marine cloudiness transition, Journal of Advances in Modeling Earth Systems, 6, 91–114, https://doi.org/10.1002/2013MS000250, 2014. a, b, c, d, e, f, g, h, i, j
Bretherton, C. S. and Wyant, M. C.: Moisture transport, lower-tropospheric stability, and decoupling of cloud-topped boundary layers, Journal of the Atmospheric Sciences, 54, 148–167, https://doi.org/10.1175/1520-0469(1997)054<0148:MTLTSA>2.0.CO;2, 1997. a, b
Bretherton, C. S., Blossey, P. N., and Uchida, J.: Cloud droplet sedimentation, entrainment efficiency, and subtropical stratocumulus albedo, Geophysical Research Letters, 34, https://doi.org/10.1029/2006GL027648, 2007. a
Bretherton, C. S., Blossey, P. N., and Jones, C. R.: Mechanisms of marine low cloud sensitivity to idealized climate perturbations: A single-LES exploration extending the CGILS cases, Journal of Advances in Modeling Earth Systems, 5, 316–337, https://doi.org/10.1002/jame.20019, 2013. a, b, c, d, e, f, g
Bretherton, C. S., McCoy, I. L., Mohrmann, J., Wood, R., Ghate, V., Gettelman, A., Bardeen, C. G., Albrecht, B. A., and Zuidema, P.: Cloud, Aerosol, and Boundary Layer Structure across the Northeast Pacific Stratocumulus–Cumulus Transition as Observed during CSET, Monthly Weather Review, 147, 2083–2103, https://doi.org/10.1175/mwr-d-18-0281.1, 2019. a, b
Caldwell, P. and Bretherton, C. S.: Response of a Subtropical Stratocumulus-Capped Mixed Layer to Climate and Aerosol Changes, Journal of Climate, 22, 20–38, https://doi.org/10.1175/2008jcli1967.1, 2009. a
Ceppi, P., Myers, T. A., Nowack, P., Wall, C. J., and Zelinka, M. D.: Implications of a Pervasive Climate Model Bias for Low‐Cloud Feedback, Geophysical Research Letters, 51, https://doi.org/10.1029/2024gl110525, 2024. a, b, c
Cesana, G. V. and Del Genio, A. D.: Observational constraint on cloud feedbacks suggests moderate climate sensitivity, Nature Climate Change, 11, 213–218, https://doi.org/10.1038/s41558-020-00970-y, 2021. a, b, c
Chen, Y.-S., Prabhakaran, P., Hoffmann, F., Kazil, J., Yamaguchi, T., and Feingold, G.: Magnitude and timescale of liquid water path adjustments to cloud droplet number concentration perturbations for nocturnal non-precipitating marine stratocumulus, Atmospheric Chemistry and Physics, 25, 6141–6159, https://doi.org/10.5194/acp-25-6141-2025, 2025. a, b
Chun, J.-Y., Wood, R., Blossey, P., and Doherty, S. J.: Microphysical, macrophysical, and radiative responses of subtropical marine clouds to aerosol injections, Atmospheric Chemistry and Physics, 23, 1345–1368, https://doi.org/10.5194/acp-23-1345-2023, 2023. a
Chun, J.-Y., Wood, R., Blossey, P. N., and Doherty, S. J.: Impact on the stratocumulus-to-cumulus transition of the interaction of cloud microphysics and macrophysics with large-scale circulation, Atmospheric Chemistry and Physics, 25, 5251–5271, https://doi.org/10.5194/acp-25-5251-2025, 2025. a
Dagan, G., Koren, I., Altaratz, O., and Feingold, G.: Feedback mechanisms of shallow convective clouds in a warmer climate as demonstrated by changes in buoyancy, Environmental Research Letters, 13, 054033, https://doi.org/10.1088/1748-9326/aac178, 2018. a
Diamond, M. S., Director, H. M., Eastman, R., Possner, A., and Wood, R.: Substantial Cloud Brightening From Shipping in Subtropical Low Clouds, AGU Advances, 1, https://doi.org/10.1029/2019av000111, 2020. a
Feingold, G., Walko, R. L., Stevens, B., and Cotton, W. R.: Simulations of marine stratocumulus using a new microphysical parameterization scheme, Atmospheric Research, 47–48, 505–528, https://doi.org/10.1016/S0169-8095(98)00058-1, 1998. a
Feingold, G., Ghate, V. P., Russell, L. M., Blossey, P., Cantrell, W., Christensen, M. W., Diamond, M. S., Gettelman, A., Glassmeier, F., Gryspeerdt, E., Haywood, J., Hoffmann, F., Kaul, C. M., Lebsock, M., McComiskey, A. C., McCoy, D. T., Ming, Y., Mülmenstädt, J., Possner, A., Prabhakaran, P., Quinn, P. K., Schmidt, K. S., Shaw, R. A., Singer, C. E., Sorooshian, A., Toll, V., Wan, J. S., Wood, R., Yang, F., Zhang, J., and Zheng, X.: Physical science research needed to evaluate the viability and risks of marine cloud brightening, Science Advances, 10, eadi8594, https://doi.org/10.1126/sciadv.adi8594, 2024. a
Jenkins, A. and Forster, P.: The inclusion of water with the injected aerosol reduces the simulated effectiveness of marine cloud brightening, Atmospheric Science Letters, 14, 164–169, 2013. a
Khairoutdinov, M. F. and Randall, D. A.: Cloud Resolving Modeling of the ARM Summer 1997 IOP: Model Formulation, Results, Uncertainties, and Sensitivities, Journal of the Atmospheric Sciences, 60, 607–625, https://doi.org/10.1175/1520-0469(2003)060<0607:CRMOTA>2.0.CO;2, 2003. a
Klein, S. A., Hall, A., Norris, J. R., and Pincus, R.: Low-Cloud Feedbacks from Cloud-Controlling Factors: A Review, Surveys in Geophysics, 38, 1307–1329, https://doi.org/10.1007/s10712-017-9433-3, 2017. a, b, c
Krueger, S. K., McLean, G. T., and Fu, Q.: Numerical Simulation of the Stratus-to-Cumulus Transition in the Subtropical Marine Boundary Layer. Part II: Boundary-Layer Circulation, Journal of Atmospheric Sciences, 52, 2851–2868, https://doi.org/10.1175/1520-0469(1995)052<2851:NSOTST>2.0.CO;2, 1995. a
Mlawer, E. J., Taubman, S. J., Brown, P. D., Iacono, M. J., and Clough, S. A.: Radiative transfer for inhomogeneous atmospheres: RRTM, a validated correlated-k model for the longwave, Journal of Geophysical Research: Atmospheres, 102, 16663–16682, https://doi.org/10.1029/97JD00237, 1997. a
Myers, T. A., Scott, R. C., Zelinka, M. D., Klein, S. A., Norris, J. R., and Caldwell, P. M.: Observational constraints on low cloud feedback reduce uncertainty of climate sensitivity, Nature Climate Change, 11, 501–507, https://doi.org/10.1038/s41558-021-01039-0, 2021. a, b, c, d
Norris, J. R., Allen, R. J., Evan, A. T., Zelinka, M. D., O’Dell, C. W., and Klein, S. A.: Evidence for climate change in the satellite cloud record, Nature, 536, 72–75, https://doi.org/10.1038/nature18273, 2016. a
O'Neill, B. C., Tebaldi, C., van Vuuren, D. P., Eyring, V., Friedlingstein, P., Hurtt, G., Knutti, R., Kriegler, E., Lamarque, J.-F., Lowe, J., Meehl, G. A., Moss, R., Riahi, K., and Sanderson, B. M.: The Scenario Model Intercomparison Project (ScenarioMIP) for CMIP6, Geoscientific Model Development, 9, 3461–3482, https://doi.org/10.5194/gmd-9-3461-2016, 2016. a
Petters, J. L., Harrington, J. Y., and Clothiaux, E. E.: Radiative–Dynamical Feedbacks in Low Liquid Water Path Stratiform Clouds, Journal of the Atmospheric Sciences, 69, 1498–1512, https://doi.org/10.1175/jas-d-11-0169.1, 2012. a
Prabhakaran, P., Hoffmann, F., and Feingold, G.: Evaluation of pulse aerosol forcing on marine stratocumulus clouds in the context of marine cloud brightening, Journal of the Atmospheric Sciences, 80, 1585–1604, https://doi.org/10.1175/JAS-D-22-0207.1, 2023. a
Prabhakaran, P., Hoffmann, F., and Feingold, G.: Effects of intermittent aerosol forcing on the stratocumulus-to-cumulus transition, Atmospheric Chemistry and Physics, 24, 1919–1937, https://doi.org/10.5194/acp-24-1919-2024, 2024. a, b, c, d, e, f, g, h
Riahi, K., van Vuuren, D. P., Kriegler, E., Edmonds, J., O’Neill, B. C., Fujimori, S., Bauer, N., Calvin, K., Dellink, R., Fricko, O., Lutz, W., Popp, A., Cuaresma, J. C., KC, S., Leimbach, M., Jiang, L., Kram, T., Rao, S., Emmerling, J., Ebi, K., Hasegawa, T., Havlik, P., Humpenöder, F., Da Silva, L. A., Smith, S., Stehfest, E., Bosetti, V., Eom, J., Gernaat, D., Masui, T., Rogelj, J., Strefler, J., Drouet, L., Krey, V., Luderer, G., Harmsen, M., Takahashi, K., Baumstark, L., Doelman, J. C., Kainuma, M., Klimont, Z., Marangoni, G., Lotze-Campen, H., Obersteiner, M., Tabeau, A., and Tavoni, M.: The Shared Socioeconomic Pathways and their energy, land use, and greenhouse gas emissions implications: An overview, Global Environmental Change, 42, 153–168, https://doi.org/10.1016/j.gloenvcha.2016.05.009, 2017. a, b
Sandu, I. and Stevens, B.: On the Factors Modulating the Stratocumulus to Cumulus Transitions, Journal of the Atmospheric Sciences, 68, 1865–1881, https://doi.org/10.1175/2011jas3614.1, 2011. a, b, c, d, e, f, g, h, i
Sarkar, M., Zuidema, P., Albrecht, B., Ghate, V., Jensen, J., Mohrmann, J., and Wood, R.: Observations pertaining to precipitation within the northeast Pacific stratocumulus-to-cumulus transition, Monthly Weather Review, 148, 1251–1273, https://doi.org/10.1175/MWR-D-19-0235.1, 2020. a
Shiogama, H., Fujimori, S., Hasegawa, T., Hayashi, M., Hirabayashi, Y., Ogura, T., Iizumi, T., Takahashi, K., and Takemura, T.: Important distinctiveness of SSP3–7.0 for use in impact assessments, Nature Climate Change, 13, 1276–1278, https://doi.org/10.1038/s41558-023-01883-2, 2023. a
Turton, J. D. and Nicholls, S.: A study of the diurnal variation of stratocumulus using a multiple mixed layer model, Quarterly Journal of the Royal Meteorological Society, 113, 969–1009, https://doi.org/10.1002/qj.49711347712, 1987. a
Twomey, S.: Pollution and the planetary albedo, Atmospheric Environment, 8, 1251–1256, https://doi.org/10.1016/0004-6981(74)90004-3, 1974. a
Vogel, R., Nuijens, L., and Stevens, B.: The role of precipitation and spatial organization in the response of trade‐wind clouds to warming, Journal of Advances in Modeling Earth Systems, 8, 843–862, https://doi.org/10.1002/2015ms000568, 2016. a, b
Wang, H. and Feingold, G.: Modeling mesoscale cellular structures and drizzle in marine stratocumulus. Part II: The microphysics and dynamics of the boundary region between open and closed cells, Journal of the Atmospheric Sciences, 66, 3257–3275, https://doi.org/10.1175/2009JAS3120.1, 2009. a
Wang, S., Wang, Q., and Feingold, G.: Turbulence, condensation, and liquid water transport in numerically simulated nonprecipitating stratocumulus clouds, Journal of the Atmospheric Sciences, 60, 262–278, https://doi.org/10.1175/1520-0469(2003)060<0262:TCALWT>2.0.CO;2, 2003. a
Wood, R.: Stratocumulus clouds, Monthly Weather Review, 140, 2373–2423, https://doi.org/10.1175/MWR-D-11-00121.1, 2012. a
Wyant, M. C., Bretherton, C. S., Rand, H. A., and Stevens, D. E.: Numerical simulations and a conceptual model of the stratocumulus to trade cumulus transition, Journal of the Atmospheric Sciences, 54, 168–192, https://doi.org/10.1175/1520-0469(1997)054<0168:NSAACM>2.0.CO;2, 1997. a
Yamaguchi, T., Feingold, G., and Kazil, J.: Stratocumulus to cumulus transition by drizzle, Journal of Advances in Modeling Earth Systems, 9, 2333–2349, https://doi.org/10.1002/2017MS001104, 2017. a, b, c, d, e, f
Zelinka, M. D., Klein, S. A., Taylor, K. E., Andrews, T., Webb, M. J., Gregory, J. M., and Forster, P. M.: Contributions of Different Cloud Types to Feedbacks and Rapid Adjustments in CMIP5, Journal of Climate, 26, 5007–5027, https://doi.org/10.1175/jcli-d-12-00555.1, 2013. a
Zhang, J., Chen, Y.-S., Yamaguchi, T., and Feingold, G.: Cloud water adjustments to aerosol perturbations are buffered by solar heating in non-precipitating marine stratocumuli, Atmospheric Chemistry and Physics, 24, 10425–10440, https://doi.org/10.5194/acp-24-10425-2024, 2024. a
Zhou, X., Ackerman, A. S., Fridlind, A. M., Wood, R., and Kollias, P.: Impacts of solar-absorbing aerosol layers on the transition of stratocumulus to trade cumulus clouds, Atmospheric Chemistry and Physics, 17, 12725–12742, https://doi.org/10.5194/acp-17-12725-2017, 2017. a, b