the Creative Commons Attribution 4.0 License.
the Creative Commons Attribution 4.0 License.
 | 17 Apr 2026
Revisiting the global budget of atmospheric glyoxal: updates on terrestrial and marine precursor emissions, chemistry, and impacts on atmospheric oxidation capacity
Aoxing Zhang
Enyu Xiong
Wenlu Wu
Wei Tao
Kelley C. Wells
Dylan B. Millet
Min Shao
Christophe Lerot
Thomas Danckaert
Ruixiong Zhang
Kelvin H. Bates
Atmospheric glyoxal (CHOCHO) plays critical yet incompletely understood roles in tropospheric chemistry. Current models substantially underestimate glyoxal abundance over both land and ocean, indicating knowledge gaps in our understanding of its sources and sinks. Here, we present an improved global simulation of atmospheric glyoxal using the GEOS-Chem model, advanced by recent theoretical, experimental, and observational insights on precursor emissions, chemical pathways, and heterogeneous losses. By applying top-down-constrained biogenic isoprene emissions, enhancing biomass burning emissions, and revising glyoxal yields from isoprene, monoterpenes, and glycolaldehyde oxidation, we estimated a global atmospheric glyoxal source of 40 Tg yr−1 and a global burden of 15 Gg, substantially reducing low bias of simulated glyoxal abundance against in situ and TROPOMI satellite observations over land. The improved representation of glyoxal and its precursors increases simulated global mean surface ozone by 4.5 ppb (17 %) and SOA formation by 17.9 Tg yr−1 (13 %), indicating stronger atmospheric oxidation capacity. Further inclusion of a hypothetical secondary marine glyoxal production to match TROPOMI glyoxal observations over the global oceans increased the global source of atmospheric glyoxal to 106 Tg yr−1 and its global burden to 39 Gg, substantially improving agreement with in situ (NMB from −92 % to 12 %) over the ocean. This enhanced marine glyoxal source increased surface HO2 concentrations and OH reactivity over tropical oceans by 6.5 % and 1.9 %. However, this hypothetical marine glyoxal source cannot be accounted for by known marine NMVOC emissions; its existence remains highly uncertain and warrants further investigation. Our work helps reconcile major model-measurement discrepancies for atmospheric glyoxal, enhances its utility as a volatile organic compound (VOC) proxy, and underscores the need to further investigate glyoxal sources and chemistry.
- Article
(6903 KB) - Full-text XML
-
Supplement
(3095 KB) - BibTeX
- EndNote


Glyoxal (CHOCHO), the smallest dicarbonyl, is produced from the photo-oxidation of non-methane volatile organic compounds (NMVOCs), and plays critical and multifaceted roles in tropospheric chemistry (Fu et al., 2008; Myriokefalitakis et al., 2008; Seakins and Blitz, 2011). Glyoxal photolyzes to produce HO2 radicals (Atkinson et al., 2006), thereby propagating atmospheric oxidation and ozone production (Edwards et al., 2014). Glyoxal can also heterogeneously react on surfaces of aqueous aerosols and cloud droplets to become part of secondary organic aerosol (SOA) (Liggio et al., 2005; Fu et al., 2008, 2009, 2012). Once in the aqueous phase, glyoxal may react with ammonium, amines, and amino acids to form light-absorbing organic nitrogenous molecules, which radiatively affect climate (Shapiro et al., 2009; De Haan et al., 2020; Li et al., 2023, 2025). In addition, satellite observations of tropospheric glyoxal VCDs serve as a proxy for NMVOC emissions, offering precursor-differentiating information when analyzed in combination with formaldehyde, another widely used proxy (Stavrakou et al., 2009; DiGangi et al., 2012; Kaiser et al., 2015; Cao et al., 2018).
Despite its importance, the global budget of atmospheric glyoxal remains poorly understood, limiting its utility as a quantitative tracer for NMVOC emissions and hindering assessments of its chemical and climatic impacts. Early model studies by Fu et al. (2008) and Myriokefalitakis et al. (2008) estimated global atmospheric glyoxal sources of 45 to 56 Tg yr−1, with 53 % to 70 % produced from the oxidation of terrestrial biogenic NMVOCs, predominantly isoprene. A more recent work by Müller et al. (2019) estimated a 47 Tg yr−1 global glyoxal source but with smaller contribution from isoprene and larger contributions from monoterpenes and anthropogenic NMVOCs. In contrast, top-down constraints using glyoxal observations from the SCIAMACHY satellite instrument implied a much larger atmospheric glyoxal source of 107 Tg yr−1 from terrestrial NMVOC emissions and photochemical production, with approximately 26 % attributed to unidentified terrestrial biogenic precursors (Stavrakou et al., 2009). More recently, Sfendla et al. (2026) used TROPOMI satellite observations to inversely derive an 110 Tg yr−1 global terrestrial source for atmospheric glyoxal. However, over 40 % of this inferred terrestrial source could not be accounted for by known precursors and chemical mechanisms, highlighting the persistent gap in our understanding of atmospheric glyoxal sources.
Over the past decade, laboratory experiments and theoretical studies have advanced our understanding of the photochemistry of key glyoxal precursors, such as isoprene (Wennberg et al., 2018), aromatics (Xu et al., 2020), and other hydrocarbons (Teng et al., 2015; Kwon et al., 2021). However, discrepancies persist between modeled and observed glyoxal abundances and budgets (Silva et al., 2018; Bates and Jacob, 2019; Ha et al., 2024). For example, the global mean glyoxal yield from isoprene oxidation simulated with a recently developed chemical mechanism was 2 % (Wennberg et al., 2018; Bates and Jacob, 2019), markedly below previous laboratory measurements and mechanistic calculations (Fu et al., 2008; Galloway et al., 2011; Li et al., 2016; Chan Miller et al., 2017; Müller et al., 2019; Ha et al., 2024). These discrepancies highlight critical gaps in our understanding of glyoxal's formation pathways from NMVOC precursors.
Another major uncertainty in the global budget of glyoxal is the undetermined oceanic contribution. A number of observations detected elevated concentrations of glyoxal in sea water samples (1.4 to 4.8 nmol L−1) and in the marine boundary layer (MBL) air (5.6 to 80 ppt) (Zhou and Mopper, 1990a, b; Seaman et al., 2006; Sinreich et al., 2010; Coburn et al., 2014; Mahajan et al., 2014; Lawson et al., 2015; Mungall et al., 2017; Zhu and Kieber, 2019; Kluge et al., 2023), with tentative correlations with the dissolved organic carbon (DOC) or chlorophyll-a contents of sea water (Zhu and Kieber, 2019). These correlations suggested a biogenic source of glyoxal or its precursor in the MBL, although the mechanistic pathways have remained unclear (Chiu et al., 2017). A few glyoxal precursors, such as isoprene, ethylene, and propene have been observed in the remote MBL, but their reported concentrations or fluxes cannot explain the observed glyoxal abundance in the MBL (Plass-Dülmer et al., 1995; Pound, 2021; Zhang et al., 2025; Ferracci et al., 2024; Li et al., 2021; Tripathi et al., 2020). Early satellite retrievals also indicated glyoxal enhancements in the tropical MBL, but there were concerns that those glyoxal retrievals may be confounded by water absorption artifacts (Wittrock et al., 2006; Alvarado et al., 2014). Recent satellite retrieval studies have mitigated water artifacts by incorporating temperature-dependent cross-sections and optimized spectral fitting windows, yet they still found glyoxal hotspots over biologically active tropical oceans (Alvarado et al., 2014; Lerot et al., 2021a). In addition, aircraft observations found the enhanced glyoxal to be vertically well-mixed throughout the MBL (Zhou et al., 2014; Volkamer et al., 2015; Zhu and Kieber, 2019). Collectively, these observations form a line of evidence for substantial glyoxal production in the MBL from yet unidentified marine precursors. The photochemical impact of this potential glyoxal production in the MBL has not been explored.
In this study, we developed an updated global atmospheric glyoxal simulation with the goal of better supporting atmospheric chemistry research, as well as the use of glyoxal for inverting NMVOC emissions and for diagnosing photochemical regime. We incorporated recent experimental, observational, and theoretical knowledge advancements in four aspects: (1) the emissions of glyoxal and its precursors from terrestrial sources, (2) a potential marine photochemical source of glyoxal, (3) updated production pathways and yields of glyoxal from key precursors, and (4) mechanistic representations of heterogeneous uptake on cloud droplets and aqueous aerosols. We evaluated the simulated atmospheric glyoxal abundances against global surface, aircraft, and satellite observations. Finally, we assessed the impacts of the revised atmospheric glyoxal budget on tropospheric oxidation capacity, ozone, and SOA formation globally.
2.1 Global atmospheric glyoxal simulations using the GEOS-Chem model
We developed our new global atmospheric glyoxal simulations using the GEOS-Chem global 3D chemical transport model v14.2.3 (https://geoschem.github.io/, last access: 18 November 2024) (Bey et al., 2001), superseding the obsolete glyoxal simulation in GEOS-Chem v7.3.6 by Fu et al. (2008). The model was driven by NASA's GEOS-FP assimilated meteorology (https://fluid.nccs.nasa.gov/weather, last access: 30 July 2024, native resolution 0.3125° longitude ×0.25° latitude), regridded to 2.5° × 2° for efficient global simulations. GEOS-Chem vertically resolved 72 hybrid sigma pressure levels, with 8 layers in the bottom 1 km to resolve near-surface processes.
We conducted four sensitivity simulations to assess the impacts of precursor emissions and chemistry on the global atmospheric glyoxal budget:
-
GC-CTRL: Control simulation using the standard GEOS-Chem v14.2.3, including its default precursor emissions and gas and aerosol chemistry (Sect. 2.2).
-
GC-TM-E: Simulation incorporating updated terrestrial emissions of glyoxal and its precursors (Sect. 4.1 and 4.2) and a hypothetical secondary glyoxal source over the global oceans (Sect. 4.3), with standard GEOS-Chem chemistry.
-
GC-T-EC: Simulation incorporating updated terrestrial precursor emissions and revised glyoxal chemistry (Sect. 5); no marine glyoxal source.
-
GC-TM-EC: Same as the GC-T-EC simulation but with the addition of the hypothetical marine glyoxal source (Sect. 4.3).
All simulations were from January 2019 to June 2020, with the first six months used as model initialization. Results from July 2019 to June 2020 were analyzed.
2.2 Sources and sinks of glyoxal in the standard GEOS-Chem v14.2.3
In the standard GEOS-Chem v14.2.3, glyoxal was both directly emitted and produced from several primary precursors, including isoprene, acetylene, ethylene, benzene, toluene, lumped xylenes, and glycolaldehyde (HOCH2CHO, also an oxidation product of NMVOCs). GEOS-Chem v14.2.3 also simulated the photochemistry of monoterpenes (Fisher et al., 2016) but did not represent their production of glyoxal. Global emissions of glyoxal and its precursors from anthropogenic, biomass burning, and biogenic sources are summarized in Table 1. Global monthly mean anthropogenic NMVOC emissions were from the Community Emissions Data System (CEDS version 2) (McDuffie et al., 2020) for the year 2019, which included emissions from power generation, industries, transportation, residential activities, agriculture, and biofuel use; however, glyoxal and glycolaldehyde emissions from biofuel use were not included. To better capture regional characteristics, we superseded CEDS data with the following regional emission inventories: the National Emissions Inventory for 2016 (NEI2016) over the continental United States (National Emissions Inventory Collaborative, 2019), the Multi-resolution emission inventory for China (MEIC) for 2019 (Zheng et al., 2018, 2021), and the MIX inventory for the rest of East and South Asia for the year 2010 (Li et al., 2017). Monthly biomass burning emissions of NMVOCs were from the Global Fire Emissions Database version 4 with small fires (GFED4s) (ban der Werf et al., 2017) for the years 2019 and 2020. Biomass burning emissions of glyoxal and glycolaldehyde were estimated using GFED4s burned dry mass and fuel-specific emission factors from Akagi et al. (2011) and Carter et al. (2022). Biogenic emissions of NMVOCs were computed online using the MEGAN v2.1 algorithm (Guenther et al., 2012).
Table 1Global emissions of glyoxal and its precursors in the revised and standard (in parentheses) GEOS-Chem simulationsa.
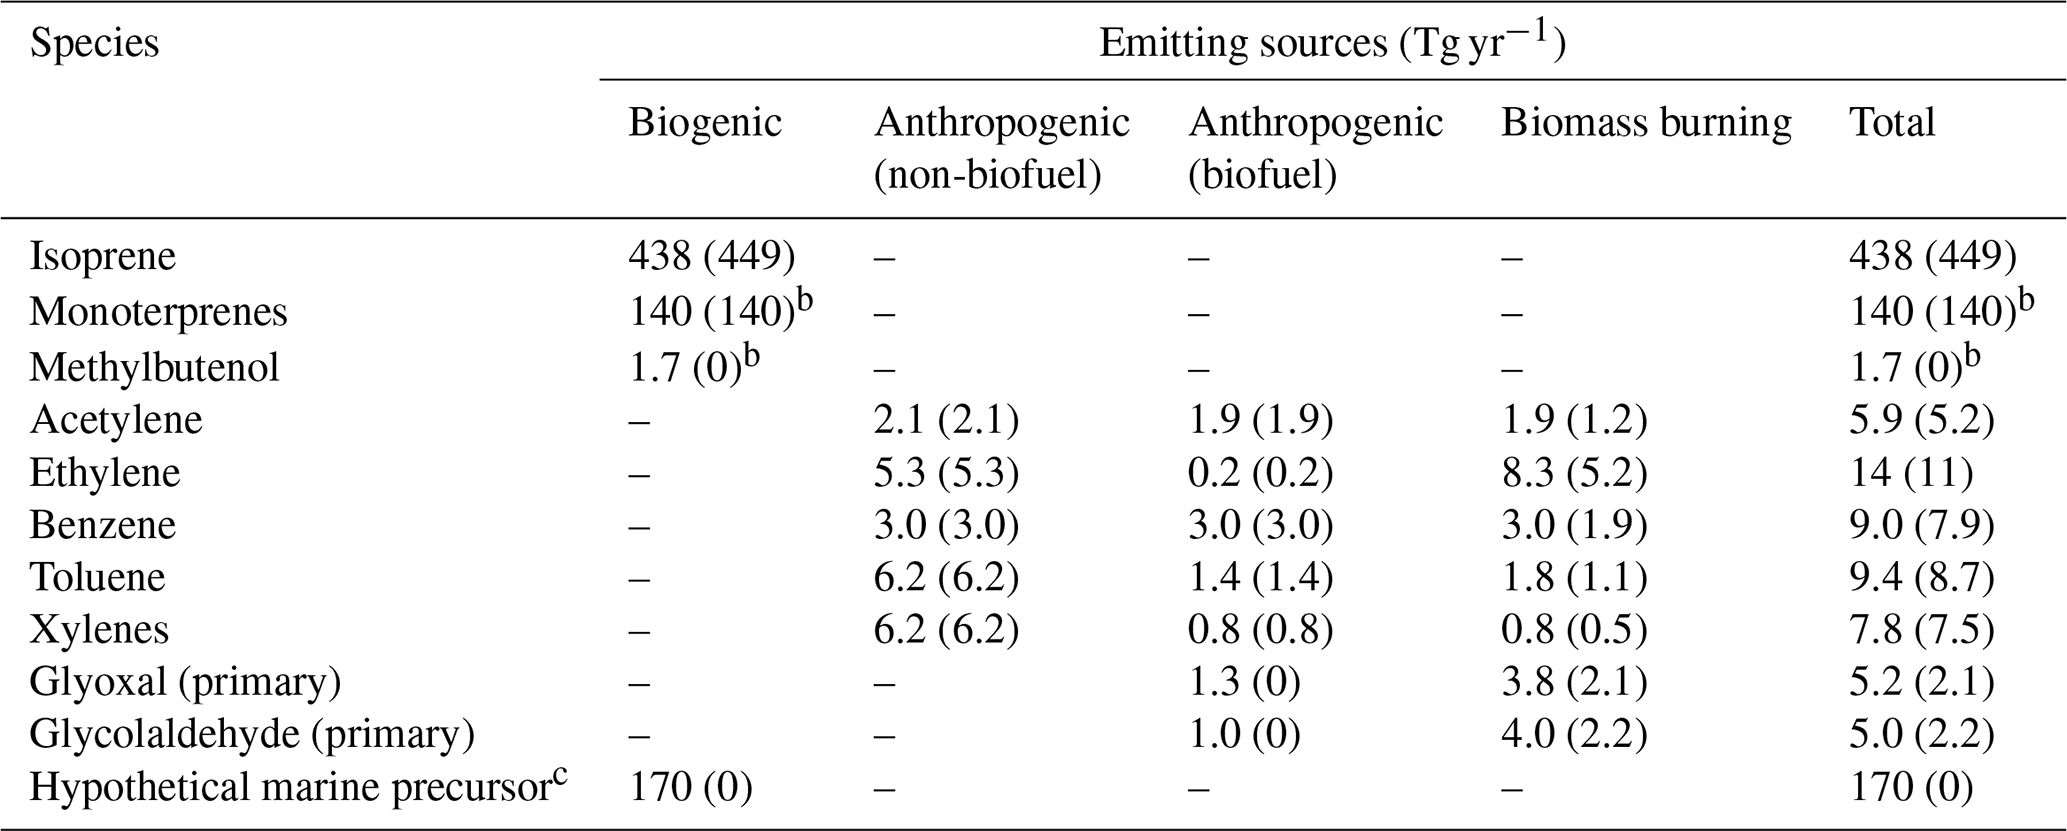
a Numbers in the parentheses were emissions in the standard GEOS-Chem (GC-CTRL) simulation. Numbers outside the parentheses were used in the GC-TM-E, GC-T-EC, and GC-TM-EC simulations. b The standard GEOS-Chem (GC-CTRL) simulation included biogenic emissions of monoterpenes and methylbutenol but did not include their production of glyoxal. c The hypothetical marine precursor was assumed to have a molecular weight of 58, the same as glyoxal. This hypothetical emission was applied only in the GC-TM-E and GC-TM-EC experiments and resulted in a secondary source of glyoxal of 66 Tg yr−1 in the global MBL.
The standard GEOS-Chem v14.2.3 included a HOx–NOx–VOCs–ozone–halogen–aerosol chemical mechanism (Park et al., 2004; Bates and Jacob, 2019). In particular, oxidation of isoprene, the largest known precursor of global glyoxal, was represented by the Reduced Caltech Isoprene Mechanism (RCIM) (Bates and Jacob, 2019). The RCIM is a condensed version of the explicit mechanism developed by Wennberg et al. (2018), which incorporated mechanistic understanding from laboratory and theoretical studies. RCIM described isoprene oxidation by OH, O3, and NO3, along with subsequent formation of major peroxy radicals (RO2), ⩾ C4 carbonyls, and organic nitrates. However, Wennberg et al. (2018) and RCIM did not update the formation of small fragmented products such as glyoxal and glycolaldehyde. Consequently, GEOS-Chem simulated only 2 % global glyoxal yield from isoprene oxidation using RCIM (Bates and Jacob, 2019), lower than previous global model estimations (Fu et al., 2008; Myriokefalitakis et al., 2008; Taraborrelli et al., 2009; Müller et al., 2019) and potentially contributing to the model's underestimation of glyoxal compared to global observations (Sect. 3.1). Bates and Jacob (2019) attributed this low global glyoxal yield partially to loss of isoprene's intermediate oxidation products to aerosol uptake or deposition. Evaluating this glyoxal yield from isoprene was a central objective of our study (Sect. 5.1).
In GEOS-Chem, gaseous glyoxal was chemically removed via oxidation by OH (rate constant kOH = cm3 molecules−1) and by NO3 ( = cm3 molecules−1), photolysis, dry and wet deposition, and heterogeneous uptake. Photolysis rates were calculated using the Fast-JX scheme (Bian and Prather, 2002), which incorporated the latest IUPAC-recommended cross sections and quantum yields (https://iupac.aeris-data.fr, last access: 16 April 2026) (Atkinson et al., 2006; IUPAC Subcommittee for Gas Kinetic Data Evaluation, 2013). Dry and wet depositions of gases and aerosols were as parameterized in Wesely (1989) and Amos et al. (2012). The Henry's law constants for glyoxal (4.19×10⁵ M atm−1) and glycoaldehyde (4.14×10⁴ M atm−1) were from Ip et al. (2009) and Betterton and Hoffmann (1988), respectively. In addition, glyoxal can be heterogeneously and irreversibly uptaken by cloud droplets and wet aerosols (Fu et al., 2008; Curry et al., 2018). The standard GEOS-Chem v14.2.3 used a daytime uptake coefficient γ = and a nighttime uptake coefficient of , both applied only when the ambient relative humidity (RH) was >35 % (Marais et al., 2016).
2.3 DSMACC box model
We used the Dynamically Simple Model of Atmospheric Chemical Complexity (DSMACC) box model (Emmerson and Evans, 2009; Stone et al., 2010) to evaluate glyoxal production from isoprene as represented in three mechanisms: (1) the RCIM as implemented in GEOS-Chem v14.2.3, (2) the Master Chemical Mechanism (MCM) version 3.3.1 (Jenkin et al., 2015), and (3) our updates to the RCIM (Sect. 5.1). Simulations were configured to represent a subtropical site during fall (Zou et al., 2023). All non-isoprene gas-phase reactions and all photolysis were identical to those in the standard GEOS-Chem v14.2.3. Deposition and aerosol uptake processes were disabled. Additional details regarding the DSMACC simulations are given in Sect. S1 in the Supplement.
2.4 Satellite, aircraft, and surface observations of atmospheric glyoxal, isoprene
We used the tropospheric glyoxal vertical column densities (VCDs) observed by the TROPOspheric Monitoring Instrument (TROPOMI) during July 2019 to June 2020 to evaluate our global atmospheric glyoxal simulations and to infer the magnitude of a hypothetical secondary glyoxal source in the MBL (Sect. 4.3). TROPOMI is onboard the Copernicus Sentinel-5 Precursor satellite, which flies in a sun-synchronous orbit over-passing the Equator at 13:30 local time (LT) (Veefkind et al., 2012). Details of the TROPOMI glyoxal retrieval can be found in Alvarado et al. (2020) and Lerot et al. (2021a). Briefly, slant column densities (SCDs) of glyoxal were fitted in the 435 to 460 nm window using the Differential Optical Absorption Spectroscopy (DOAS) approach (Platt and Stutz, 2008), accounting for other absorbers in that wavelength range. In particular, absorption by water vapor and liquid water were quantified using optimized, temperature-dependent cross-sections (Lerot et al., 2021a). The glyoxal SCDs were then converted to tropospheric VCDs using air mass factors (AMFs), accounting for the radiative transfer through the atmosphere (Palmer et al., 2001). Over land, the TROPOMI retrievals used the a priori glyoxal profiles simulated by the Model of Atmospheric composition at Global and Regional scales using Inversion Techniques for Trace gas Emissions (MAGRITTE v1.1, Müller et al., 2019). Over oceans, a fixed parameterized glyoxal profile based on aircraft observations over the tropical Pacific from Volkamer et al. (2015) was used in the retrieval (Lerot et al., 2021a). The total systematic errors of the tropospheric glyoxal VCD retrievals were estimated to be between 1×10¹⁴ and 3×10¹⁴ molecules cm−2, corresponding to 30 % to 70 % of the signals over source regions (Lerot et al., 2021a).
The TROPOMI Level 3 monthly mean glyoxal product averaged the native pixels to 0.05° resolution after excluding pixels with quality assurance values less than 0.5 (Lerot et al., 2021b). This Level 3 product has shown better consistency with ground-based measurements and more reliable seasonal variation and local enhancements over regions of strong biogenic, anthropogenic, and biomass burning emissions, compared to earlier satellite retrievals (Lerot et al., 2021a). We regridded the Level 3 product to 2.5° longitude ×2° latitude for comparison with GEOS-Chem results and for inferring the hypothetical marine source of glyoxal (Sect. 4.3). Model results were sampled at the satellite overpass time. Even after the quality assurance filter, the Level 3 product showed small negative values over remote oceans and deserts where simulated glyoxal VCDs were also very small; these values were retained in the regridding.
We used global monthly mean tropospheric isoprene VCDs (Fu et al., 2019; Wells et al., 2020, 2022) retrieved from the Cross-track Infrared Sounder (CrIS) instrument (Han et al., 2013) to estimate the global terrestrial emission of isoprene (Sect. 4.1) and to evaluate our simulated glyoxal-to-isoprene VCD ratios (Sect. 6). The CrIS instrument, onboard the Suomi-NPP satellite (Equator-overpass at 13:30 LT), detects atmospheric isoprene using its absorption features near 900 cm−1 (Wells et al., 2022). An Artificial Neural Network (ANN) was used to derive the column density of isoprene from CrIS-measured hyperspectral range index. The estimated errors for the isoprene column retrievals were typically <30 % over high-concentration regions (Wells et al., 2020).
We also compared simulated glyoxal concentrations against surface, ship-based, and aircraft measurements of glyoxal over land and ocean. Table S1 compiles the measurements reported in the literature. To compare model results against observations, the monthly mean simulated glyoxal concentrations were sampled at the coordinates of the measurement site and during the month of measurement.
Table 2Global budget of atmospheric glyoxal estimated in this work compared to Fu et al. (2008).
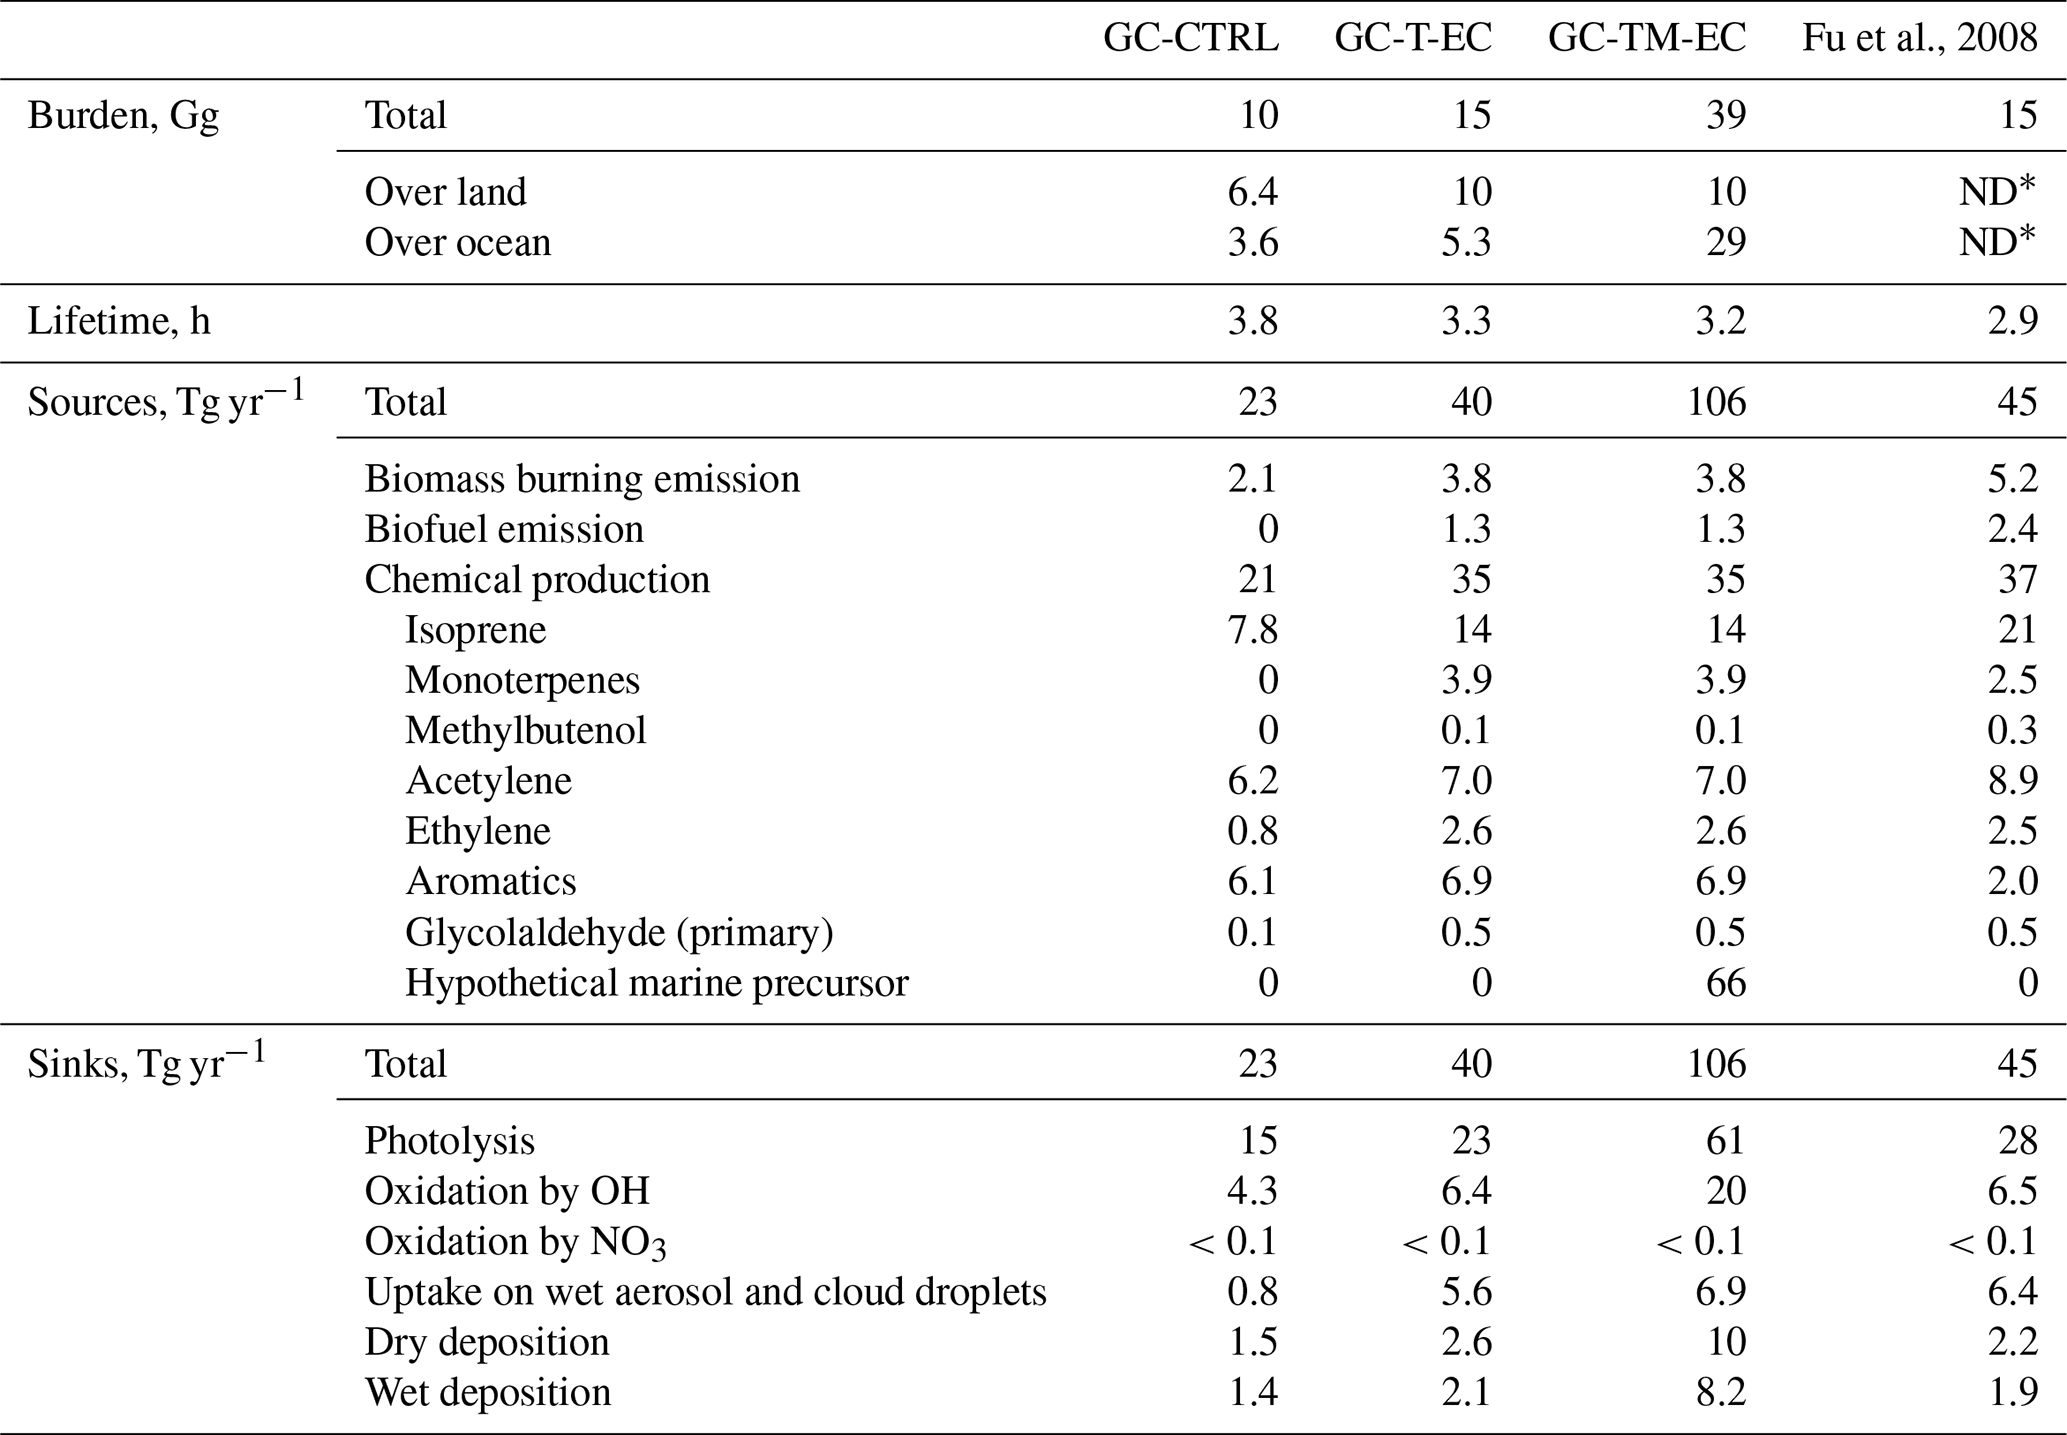
∗ Not documented.
2.5 Observations of other chemical species for model evaluation
We compared model results to additional observational datasets to evaluate the impacts of revised glyoxal simulation on atmospheric chemistry. The one-year (July 2019 to June 2020) mean global surface CO concentrations were averaged from the Measurements of Pollution In The Troposphere (MOPITT) Level 3 monthly gridded CO product (MOP03TM, Version 9) (Ziskin, 2021). The one-year (July 2019 to June 2020) mean global surface daily maximum 8 h average ozone concentrations at 0.1° resolution were from Wang et al. (2025), a machine learning-based fusion of surface observations, chemical transport model simulations, meteorological reanalysis, satellite products, and emission-related information. Simulated organic aerosols (OA) and SOA were also evaluated against measurements over China synthesized by Miao et al. (2021), consisting of campaign-average OA measurements from 68 urban, 18 suburban, and 8 remote sites across China during 2011–2019. Finally, we used aircraft measurements of HOx concentrations from the Airborne Tropospheric Hydrogen Oxides Sensor (Brune et al., 2021) during the Atmospheric Tomography Mission (ATom-2) campaign (Wofsy and Team, 2018) in February 2017 to evaluate the simulated impacts of glyoxal on atmospheric oxidation capacity in the marine atmosphere. Figure S1 shows the aircraft tracks during ATom-2, which transected the remote Pacific and the remote Atlantic.
We first evaluated the atmospheric glyoxal simulation in the standard GEOS-Chem (GC-CTRL simulation) against global observations to identify aspects for model improvements. Figure 1 compares the annual mean (July 2019–June 2020) tropospheric glyoxal VCDs from the GC-CTRL simulation against TROPOMI observations. TROPOMI showed prominent glyoxal enhancements over major biogenic source regions (Southeast U.S., East and South Asia, tropical forests of South America and Africa), seasonal burning areas (boreal forests of North America and Asia, and forests, savannas, and farm and peat lands in South America, Africa and Southeast Asia), and major anthropogenic source regions. These spatial patterns reflected the expected glyoxal production from biogenic isoprene, as well as the emissions of glyoxal and its precursors from biomass burning and anthropogenic emissions (Fu et al., 2008; Myriokefalitakis et al., 2008; Cao et al., 2018).
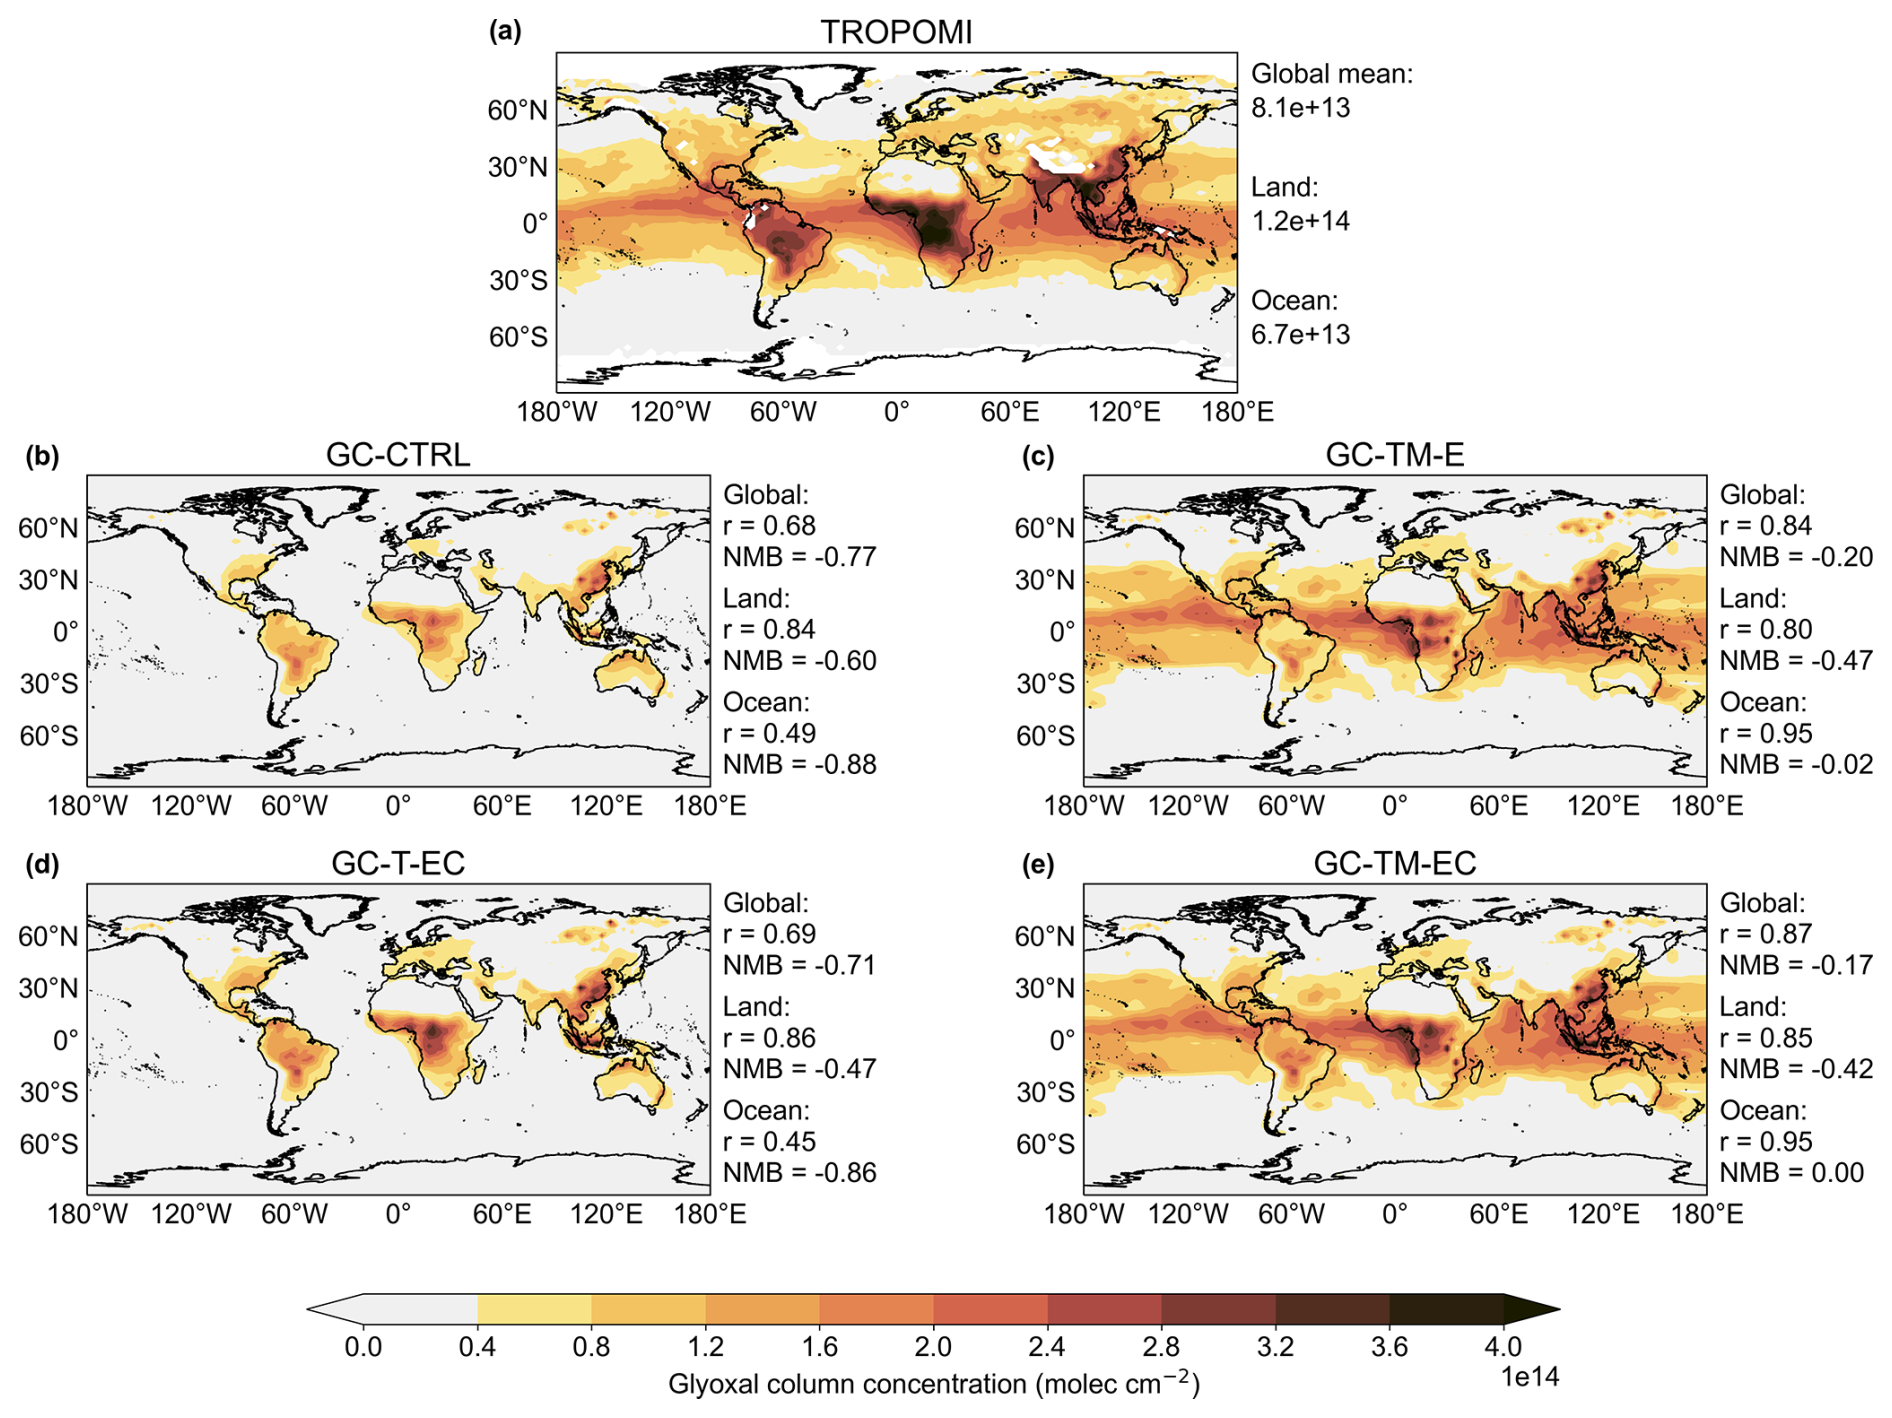
Figure 1Annual mean (July 2019–June 2020) atmospheric glyoxal VCDs as (a) observed by TROPOMI, and as simulated in the (b) GC-CTRL, (c) GC-TM-E, (d) GC-T-EC, and (e) GC-TM-EC experiments. Model statistics against the TROPOMI observations over land, ocean, and globally are shown on the side of panels (b) to (e). The simulated VCDs were sampled at the daily satellite overpass time (13:30 local time) and then averaged to annual means.
The GC-CTRL simulation broadly reproduced the TROPOMI-observed spatial patterns over land (Fig. 1a, b), but the simulated annual mean glyoxal VCDs were systematically lower than TROPOMI observations, with normalized mean biases (NMB) of −77 % globally and −60 % over land (Fig. S2). In particular, the model substantially underestimated glyoxal over the major source regions of biogenic isoprene in the tropics and the mid-latitudes. Figure 2 evaluated the simulated concentrations of glyoxal against individual ground-based and aircraft measurements over land (Table S1). Some measurements were made in urban areas or areas affected by local biomass burning (Table S1) and could not be reproduced by our simulations at coarse resolution. However, even with these outliers excluded, the model still showed substantial underestimations of glyoxal concentrations compared to measurements at the surface and in the boundary layer (NMB = −90 %), suggesting systematic errors in precursor emissions and/or near-surface chemistry.
In addition, TROPOMI observed glyoxal enhancements over the tropical oceans (Fig. 1a) that were spatially correlated with the MODIS Aqua retrieved chlorophyll-a contents (NASA Goddard Space Flight Center, Ocean Ecology Laboratory, Ocean Biology Processing Group, 2014) of surface sea water (Fig. S3, spatial correlation r = 0.5 over the tropical ocean), potentially indicating a marine biogenic source, which was also implied in previous studies (Wittrock et al., 2006; Alvarado et al., 2014; Zhou et al., 2014; Volkamer et al., 2015; Zhu and Kieber, 2019; Lerot et al., 2021a). This feature was completely absent in the GC-CTRL simulation (Fig. 1b) due to the model's lack of marine emissions of glyoxal or its precursors. The NMB of simulated glyoxal concentrations against TROPOMI observations over the global oceans was −88 % (Fig. 1b). Lengthening the simulated glyoxal production timescale from terrestrial precursors would not reproduce the observed marine pattern, indicating that the glyoxal enhancements over the oceans could not be explained by the long-range transport of terrestrial precursors alone (Fu et al., 2008). Figure 2 shows that the GC-CTRL simulation was also unable to reproduce the magnitudes and variations of individual glyoxal measurements in the MBL (Table S1, NMB = −92 %). Figure S4 compares the vertical profiles of simulated glyoxal concentrations against aircraft observations over the Northeast Pacific, North Atlantic, Tropical Atlantic, and the South Atlantic (Volkamer et al., 2015; Kluge et al., 2023). These measurements reported glyoxal concentrations exceeding 10 ppt in the MBL, decreasing gradually with altitude. These observed concentrations of glyoxal in the marine atmosphere were not reproduced in the GC-CTRL simulations.
The evaluation of the GC-CTRL simulation above indicated potential model deficiencies in precursor emissions over land and ocean, as well as in the photochemical production of glyoxal from those precursors. We addressed these issues in the following sections and discussed the uncertainties given the current levels of understanding.
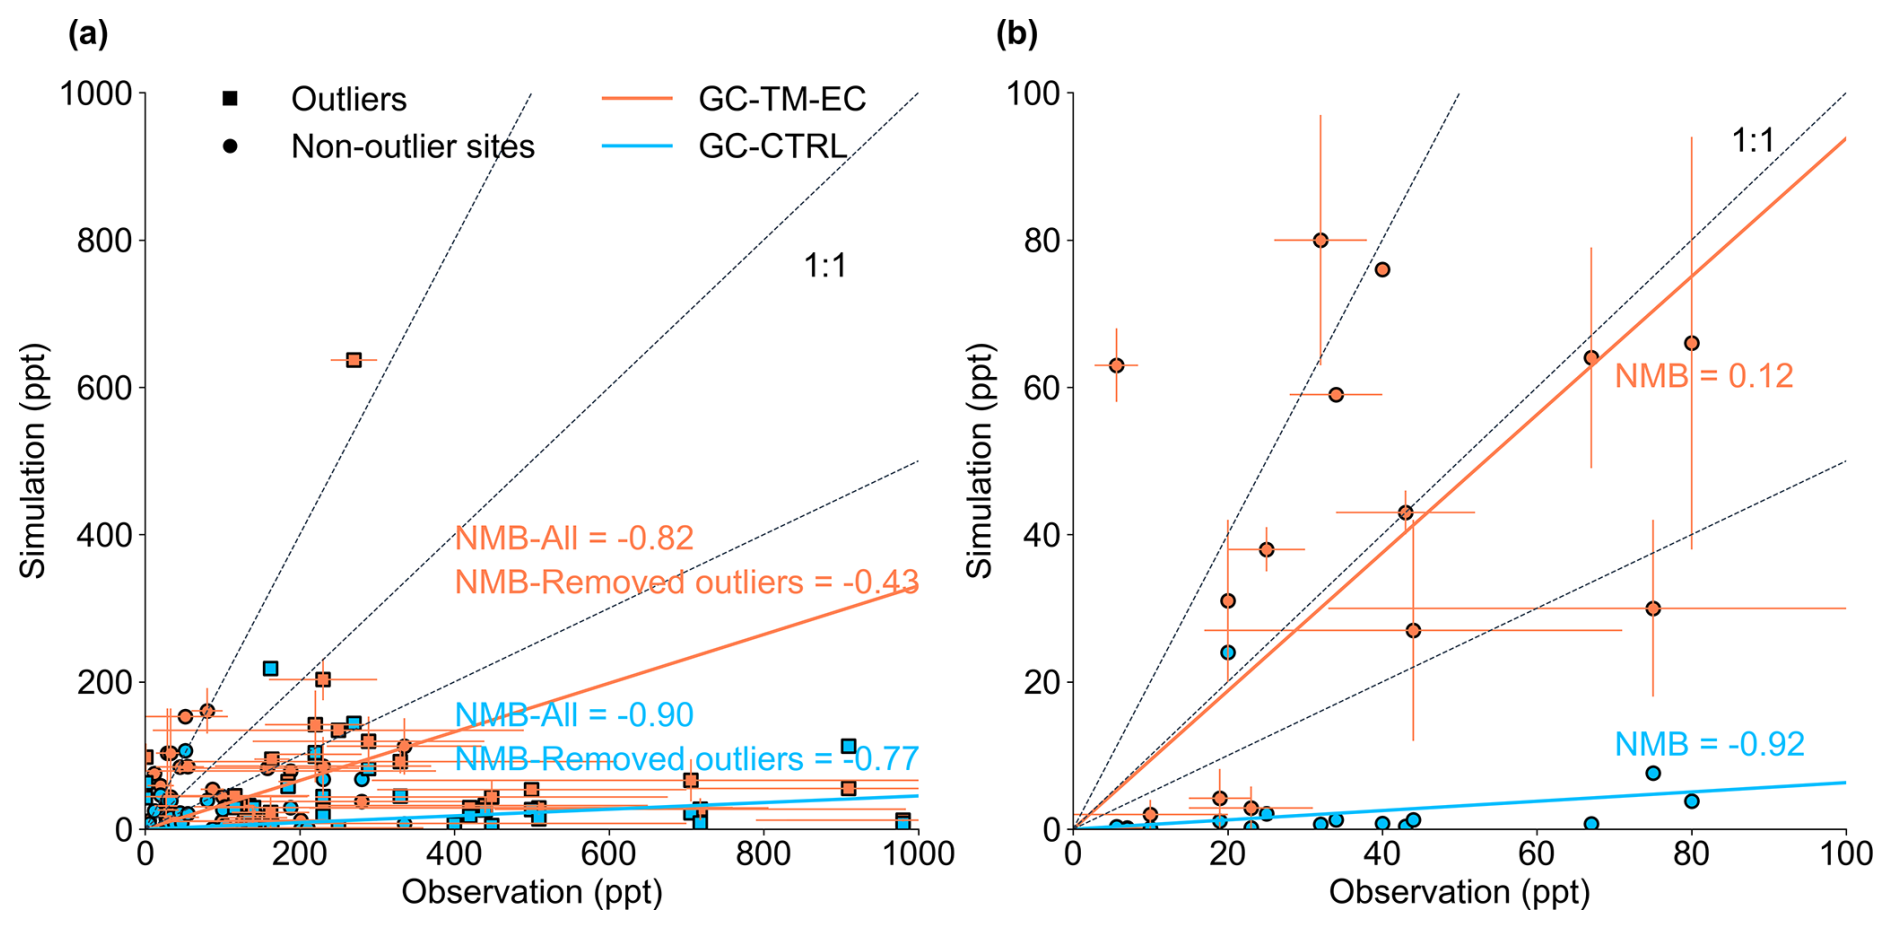
Figure 2Scatter plots of simulated versus observed glyoxal concentrations (unit: ppt) over (a) land and (b) ocean. Blue and red symbols indicate results from the GC-CTRL and GC-TM-EC experiments, respectively. Observations in urban areas or those strongly affected by fire are denoted by squares (noted as “Outliers”). Horizontal and vertical error bars indicate standard deviations of the observations and model results, respectively. Dashed lines indicate the 1:1, 1:2, and 2:1 lines. Solid lines indicate the reduced major-axis regression; regression parameters are shown inset. The references of all corresponding observations are listed in Table S1.
4.1 Top-down constraints on biogenic isoprene emissions over major source regions
Biogenic isoprene is the largest known terrestrial precursor of atmospheric glyoxal (Fu et al., 2008; Myriokefalitakis et al., 2008). Figure 3 compares the annual mean tropospheric isoprene VCDs observed by the CrIS instrument and those in the GC-CTRL simulation. Relative to the CrIS observations, the GC-CTRL simulation underestimated annual isoprene abundances over the mid-latitudes but overestimated isoprene over the Amazon, tropical Africa, and Northern Australia. These discrepancies between CrIS and the GEOS-Chem were similar to those pointed out by Wells et al. (2020) based on comparisons between CrIS and an earlier version of GEOS-Chem (v11-02e). The causes of GEOS-Chem's potential biases in regional isoprene emission are yet unclear due to differences in MEGAN algorithm versions and input data, and insufficient evaluation against in situ isoprene flux measurements over all source regions. Potential biases may also arise from underestimation of land-use-specific isoprene emitters such as oil palm plantations, as well as from chemistry-driven modulation of isoprene columns by co-located soil and biomass-burning NO (Yoon et al., 2026).
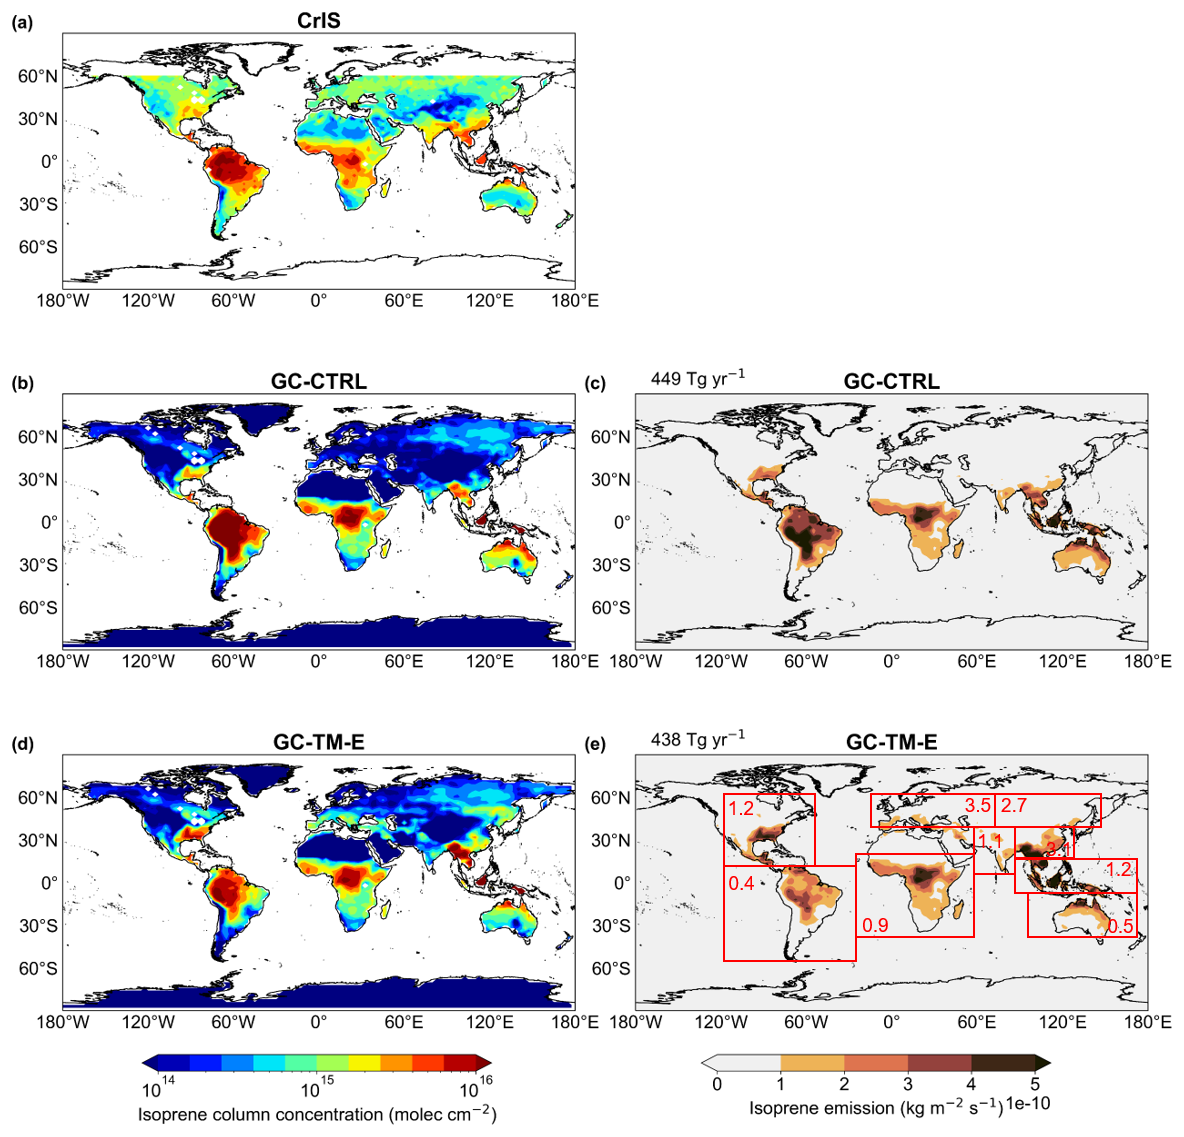
Figure 3Annual mean tropospheric isoprene VCDs (a) as observed by CrIS and as simulated in the (b) GC-CTRL and (d) GC-TM-E experiments, respectively. Also shown are the annual mean isoprene emissions (c) from the GC-CTRL simulation and (e) those scaled and used in the GC-TM-E simulation (also used in GC-T-EC and GC-TM-EC). The areas over water or with no data are shaded white in (a), (b) and (d). The numbers in red boxes indicate the regional mean ratios of isoprene emissions in (e) relative to those in (c).
We addressed the potential biases in GEOS-Chem's isoprene emissions in a “top-down” fashion by scaling the isoprene emissions over nine major source regions (shown in Fig. 3e), such that the simulated annual mean isoprene VCDs () over each region i (=1 to 9) aligned with the CrIS observations ():
where was the annual mean isoprene emission for region i calculated by the default MEGAN algorithm in GEOS-Chem; was the top-down-constrained isoprene emission. In practice, we iterated the scaling process of Eq. (1) twice to account for the photochemical non-linearity associated with OH reactivity.
Figure 3 shows the regional differences in isoprene emissions between our top-down estimates and those of the default GEOS-Chem. The top-down constrained global isoprene emission was 438 Tg yr−1, similar to the default 449 Tg yr−1 in GC-CTRL (Table 1). However, over the Northern mid-latitudes, the regional annual mean isoprene emissions were scaled by factors of 1.2 to 3.5, with maximum increases over the temperate ecosystems of Europe and Asia. Conversely, over the tropical ecosystems of the Amazon, Africa, and Northern Australia, our use of CrIS constraints decreased the regional isoprene emissions by 10 % to 60 %. These CrIS-based constraints on global isoprene emissions were still lower than the global isoprene emission estimates (490 to 514 Tg yr−1) independently derived by Sfendla et al. (2026) using TROPOMI formaldehyde and glyoxal retrievals.
We used the top-down constrained isoprene emissions to drive the GC-TM-E, GC-T-EC, and GC-TM-EC experiments (Sect. 6). Our scaling of regional isoprene emissions generally improves the observed and simulated surface isoprene concentrations in several representative regions, as shown in Fig. S5 (Seco et al., 2011; Link et al., 2015; Garg et al., 2026; Zhang et al., 2020; Sun et al., 2025). Nevertheless, we emphasize that our approach was not a formal inversion of isoprene emissions, which would require more thorough evaluations of the CrIS retrieval and its uncertainty, a more chemically coherent treatment of the OH-nonlinearity, as well as representations of the potential OH-regeneration pathways from isoprene oxidation under low-NOx conditions (Peeters et al., 2014; Yang et al., 2024). Instead, our goal was to broadly constrain the spatial distribution of global isoprene emissions, such that our mechanistic improvements on glyoxal chemistry can be meaningfully evaluated against global observations.
4.2 Additional updates to terrestrial emissions of glyoxal, glycolaldehyde, and their precursors
The default CEDS did not include emissions of glyoxal and glycolaldehyde from biofuel use. We implemented these emissions into GEOS-Chem by scaling biofuel emissions of ethane with emission ratios from Andreae (2019). Where regionally-resolved inventories were available – including Africa (Marais and Wiedinmyer, 2016), the continental U.S. (National Emissions Inventory Collaborative, 2019), and Asia (Li et al., 2017; Zheng et al., 2018, 2021) – we scaled those biofuel emissions of ethane to incorporate local information. The resulting emission estimates for glyoxal and glycolaldehyde from global biofuel use were 1.3 and 1.0 Tg yr−1, respectively (Table 1).
Biogenic methylbutenol (2-methyl-3-buten-2-ol, CH3COH(CH3)CHCH2), emitted almost exclusively by North American pine trees (Guenther et al., 2012), can be oxidized by OH to produce glycolaldehyde. However, methylbutenol was not represented in the standard GEOS-Chem v14.2.3. We added to the model emissions of methylbutenol calculated by the MEGAN v2.1 algorithm (Guenther et al., 2012), resulting in a global emission of 1.7 Tg yr−1 (Table 1).
Several recent studies indicated that the GFED4s inventory underestimated the amount of burned dry mass and the associated pollutant emissions by 30 % to 120 % over various biomass burning areas of the world (Zhong et al., 2022; Castagna et al., 2023; Chen et al., 2023; Qi et al., 2024). We scaled biomass burning emissions of glyoxal, glycolaldehyde, and all other NMVOCs by a factor of 1.8 globally (Table 1), an average of the scale factors from previous regional evaluations (Zhong et al., 2022; Chen et al., 2023; Castagna et al., 2023; Qi et al., 2024). This scale factor was also consistent with the global NMVOC emission estimate (79.3 Tg C yr−1) in the latest GFED5 inventory (Chen et al., 2023), which was 82 % higher than the estimate of GFED4s (43.6 Tg C yr−1). The updated global biomass burning emissions for glyoxal and glycolaldehyde were 3.8 and 4.0 Tg yr−1, respectively (Table 1).
4.3 Estimation of a hypothetical secondary glyoxal source in the global MBL
TROPOMI and other in situ and remote sensing measurements tentatively implied a secondary source of glyoxal over the tropical MBL associated with unknown, potentially biogenic, marine precursors. In this work, we used TROPOMI observations to estimate how large that hypothetical secondary glyoxal source might be, and we evaluated whether the inclusion of that hypothetical glyoxal source is consistent with independent in situ and remote sensing measurements in the global MBL. Previous studies have tentatively linked the glyoxal in the MBL to biologically active waters or to photochemical production from the dissolved organic matter (DOM) content in sea water. However, currently reported concentrations or fluxes of precursors (e.g., isoprene, ethylene, and propene) appear insufficient to explain the magnitude of glyoxal inferred from satellite observations (Broadgate et al., 2004; Zhang et al., 2025; Pound, 2021). In addition, measurements of NMVOCs in the MBL remain too sparse to provide a quantitative global constraint. We therefore interpret the inferred marine glyoxal source as a diagnostic term representing the glyoxal production from potentially missing marine NMVOCs.
We estimated the potential secondary glyoxal source by hypothesizing a short-lived marine precursor, which was emitted at the sea surface, instantaneously mixed throughout the MBL, and oxidized by OH to produce glyoxal at 100 % yield. We started by assuming an a priori daytime emission for this hypothetical precursor, scaled to match the TROPOMI-observed glyoxal VCDs over the global ocean at 2.5° longitude ×2° latitude resolution:
where was the a priori monthly mean emission flux of the unknown precursor on the ith model grid for the mth month; was the TROPOMI-observed glyoxal VCD for that grid and month. We assumed an OH-oxidation rate constant of kOH = cm3 molecules−1, such that the daytime lifetime (τ) of this hypothetical precursor was approximately one hour (at a typical OH concentration in the MBL of 1.8×10⁶ molecules cm−3), consistent with the mean mixing timescale of the global MBL (Maclean et al., 2017). However, we did not allow the precursor to consume OH. We then used the simulated glyoxal VCDs over the oceans to optimize the emission for the hypothetical precursor ():
This optimization was iterated twice until the simulated marine glyoxal VCDs agreed with satellite observations within 20 %, yielding an estimated daytime secondary glyoxal source of 66 Tg yr−1 over the global oceans that spatially correlated with TROPOMI observations (Figs. 4 and S3).
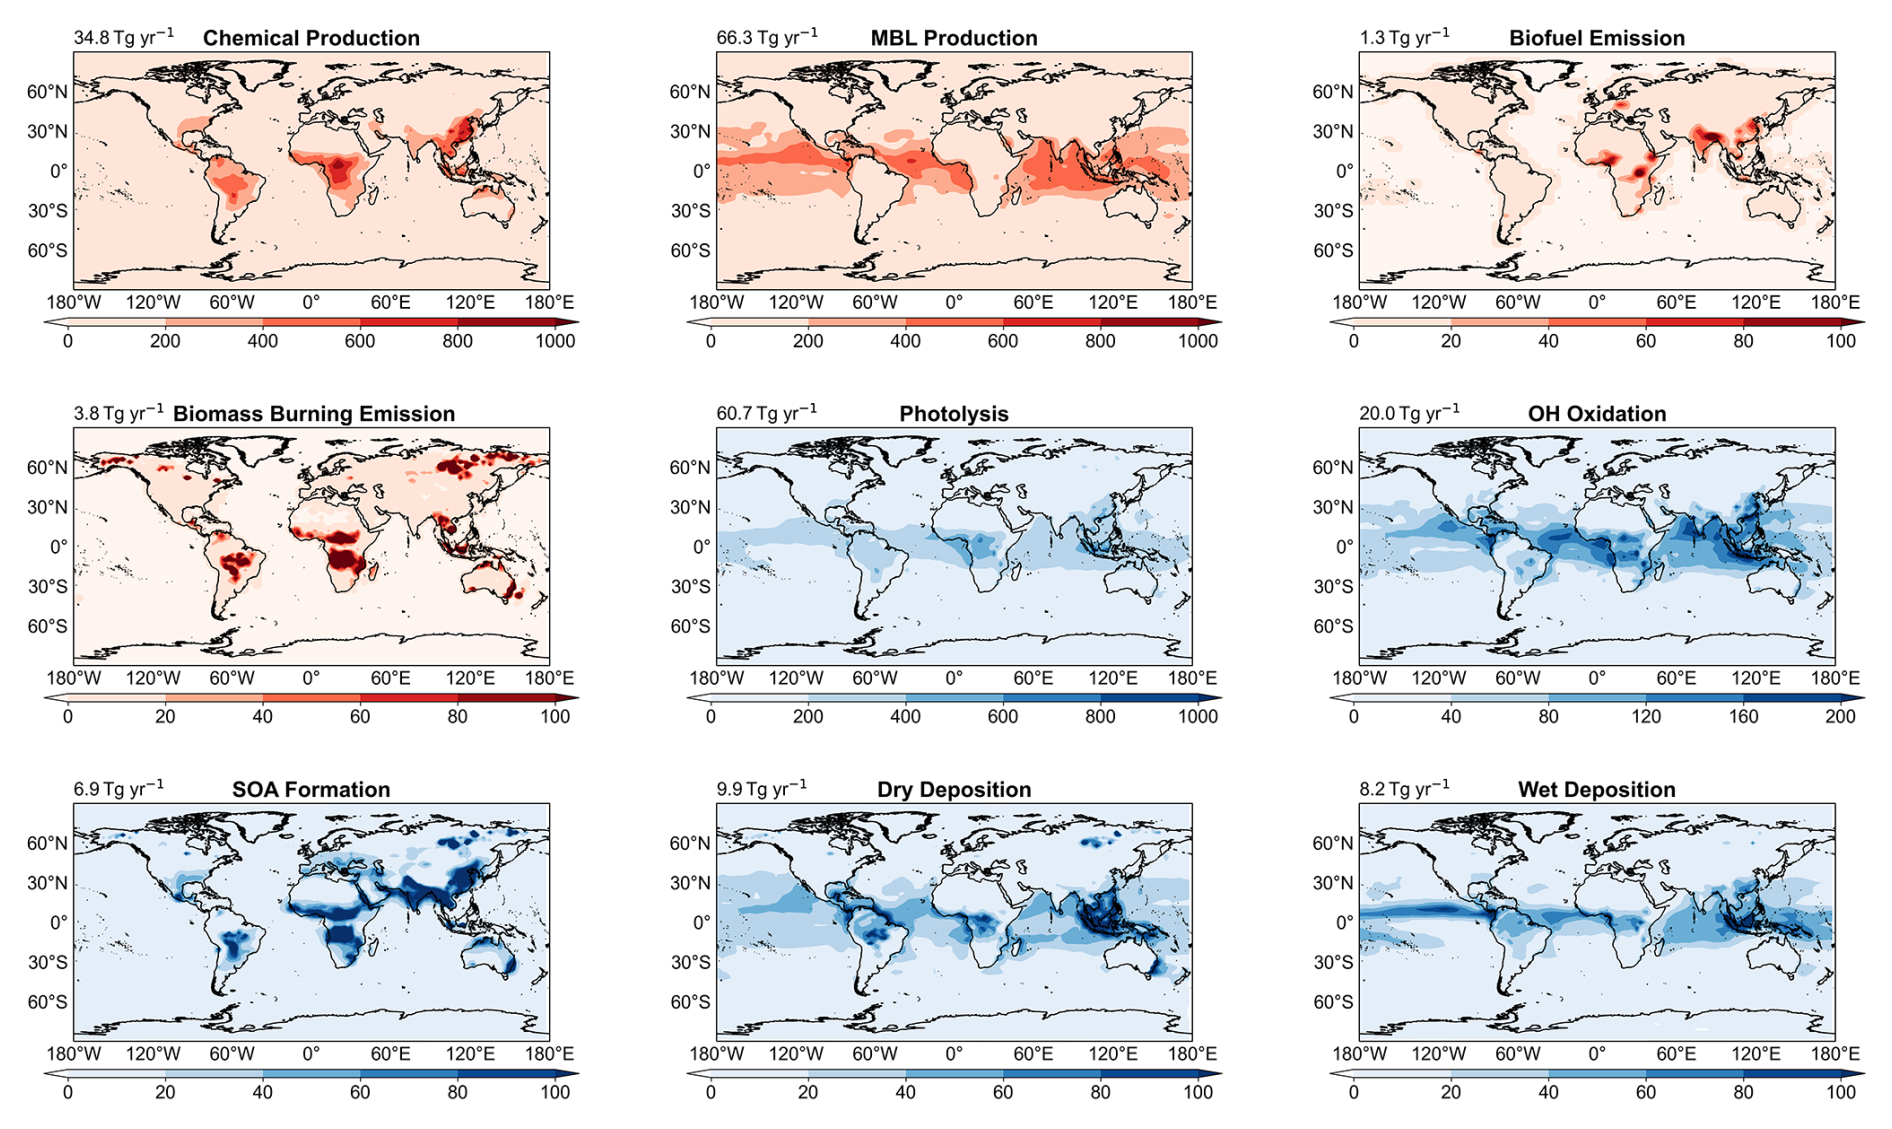
Figure 4Annual mean sources and sinks of simulated atmospheric glyoxal in the GC-TM-EC simulation (unit: kg km−2 yr−1). Global annual sums of individual sources and sinks are shown inset.
5.1 Photochemical production of glyoxal from isoprene
A key objective of this study was to incorporate the latest knowledge to better simulate the glyoxal production from isoprene oxidation. We evaluated Wennberg et al. (2018) and the RCIM against the latest literature and identified two key mechanistic improvements to RCIM (as implemented in the standard GEOS-Chem v14.2.3) to reconcile with experiments. We also highlighted several pathways where the reactions and yields of glyoxal are still uncertain and thus require further study. Figure 5 shows our mechanistic revisions to the RCIM and the simulated glyoxal yields under low- and high-NOx concentrations.
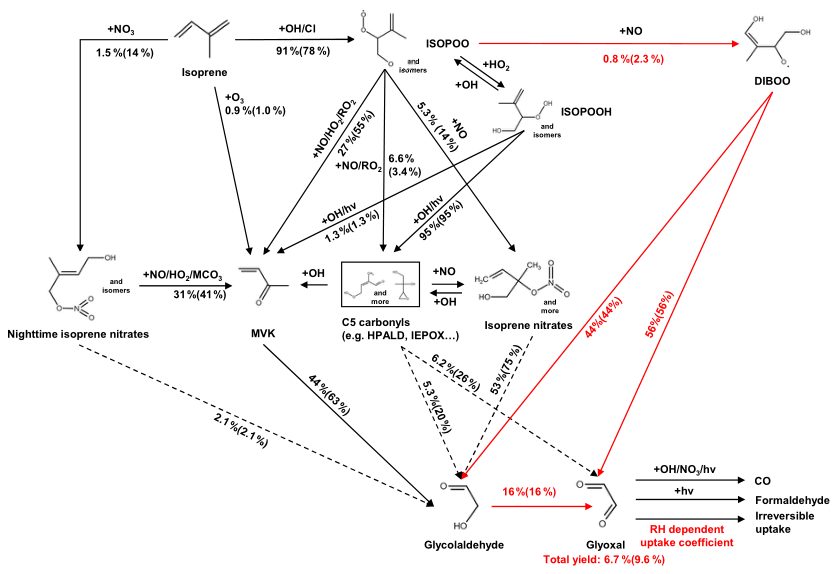
Figure 5Gas-phase production of glyoxal and glycolaldehyde from the oxidation of isoprene as represented in the standard RCIM (black arrows) and as revised in this work (red arrows). Branching ratios outside and inside parentheses were calculated under NO concentrations of 0.1 and 5 ppb, respectively. The solid or dashed arrows denote pathways comprehensively or partially constrained by experiments, respectively. We set [OH] = 1.8×10⁶ molecules cm−3 [O3] = 40 ppb, and RH = 55 %; other environmental conditions were representative of a subtropical site in fall. Pathways with glyoxal yields less than 1 % are not shown in this figure.
5.1.1 First-generation production of glyoxal and glycolaldehyde from the OH-oxidation of isoprene under high-NOx conditions
Chamber experiments by Galloway et al. (2011) demonstrated that, under high-NOx conditions, the production of glyoxal and glycolaldehyde from OH-initiated oxidation of isoprene occurred in two stages. The first stage occurred immediately upon isoprene consumption, with measured molar yields of 2.1±0.6 % and 2.69±0.82 % for glyoxal and glycolaldehyde, respectively. Subsequent photooxidation of C5 and C4 carbonyls led to further production of glyoxal and glycolaldehyde. The first-generation production aligned with the theoretical pathways proposed by Dibble (2004a, b), wherein specific Z-δ-hydroxy-peroxy isoprene radicals (ISOPOO) first react with NO, then rapidly undergo 1,5 H-shifts and O2-additions to yield dihydroxy peroxy radicals. Some of these dihydroxy peroxy radicals further react with NO to produce an alkoxy radical that fragments into pairs of glyoxal and hydroxyacetone or pairs of glycolaldehyde and methylglyoxal. Similar fast production of glyoxal (3.8 % yield inferred) and glycolaldehyde (4.2 % yield) was also noted by Paulot et al. (2009), prompting the inclusion of a Dibble-type pathway in an earlier version of GEOS-Chem (v11-02). The MCM v3.3.1 also incorporated a Dibble-type glyoxal production at 2.2 % molar yield under high-NOx.
The RCIM omitted this first-generation high-NOx pathway. Wennberg et al. (2018) assigned 45 % of the Z-δ-derived dihydroxy peroxy radicals to form C5 hydroxy carbonyls based on experimental constraints (Teng et al., 2017). However, the fate of the remaining 55 % dihydroxy-peroxy radicals was unknown. Wennberg et al. (2018) postulated that the remaining dihydroxy-peroxy radicals undergo rapid enol H-shift, O2-addition, and decomposition; they assumed this pathway to be much faster than the reaction with NO, effectively bypassing the first-generation production of glyoxal and glycolaldehyde.
We revised the RCIM to incorporate the Dibble pathway (Fig. 5), redirecting the 55 % of dihydroxy peroxy radicals of unknown fate (denoted as DIBOO) to react with NO and fragment into glyoxal (GLYX) + hydroxyacetone (HAC) or glycolaldehyde (GLYC) + methylglyoxal (MGLY) pairs. The corresponding RCIM reactions in GEOS-Chem were revised to:
IHOO1 and IHOO4 were the ISOPOOs from OH-addition at carbons 1 and 4 of isoprene; HC5A was a lumped C5 carbonyl. Branches (R1) and (R2) comprised approximately 4.6 % of the total ISOPOO + NO reactions under high-NOx conditions. Yields and rate constants of GLYX (+ HAC) and GLYC (+ MGLY) in Reaction (R3) followed Wennberg et al. (2018). Our revised mechanism resulted in 1.2 % and 1.1 % first-generation molar yields of glyoxal and glycolaldehyde under high-NOx, respectively, still lower than the yields measured experimentally (Paulot et al., 2009; Galloway et al., 2011; Sprengnether et al., 2002).
5.1.2 Post first-generation production of glyoxal from OH-oxidation of isoprene under high- and low-NOx conditions
Beyond the initial OH-oxidation, glyoxal production from isoprene occurs as a second-generation product involving its major intermediate products and as a third-generation product via glycolaldehyde (Wennberg et al., 2018), as depicted in Fig. 5. However, the glyoxal yields from these pathways are still incompletely constrained, especially for low-NOx conditions. In Wennberg et al. (2018), the relevant intermediates include methyl vinyl ketone (MVK), isoprene nitrates, and C5 carbonyls such as isoprene hydroxy hydroperoxides (ISOPOOHs), isoprene dihydroxy epoxides (IEPOXs), and hydroperoxy aldehydes (HPALDs). The yields of these major products from isoprene, the yield of glycolaldehyde from MVK, and the yields of IEPOXs from ISOPOOHs were experimentally constrained under both high- and low-NOx conditions in Wennberg et al. (2018) and represented current-best knowledge. However, the yields of glyoxal and glycolaldehyde from HPALDs were theoretically derived without experimental constraints (Peeters et al., 2014). Also, glycolaldehyde yields from isoprene nitrates were constrained experimentally only for (4-OH,3-ONO2)-isoprene hydroxy nitrate (IHN) (Jacobs et al., 2014; Lee et al., 2014) and generalized across isomers with limited validation. In particular, the production of glyoxal and glycolaldehyde from HPALDs and isoprene nitrates both involved the reactions of C4-dihydroperoxy-carbonyls, whose atmospheric fates were structurally derived (Peeters et al., 2014; Wennberg et al., 2018). Under low-NOx, the yields of glycolaldehyde from IEPOX + OH were subject to uncertainties associated with the radical propagating channels of non-acyl RO2 + HO2 reactions (Bates and Jacob, 2019; Müller et al., 2019). We retained RCIM's standard glyoxal and glycolaldehyde productions from isoprene's intermediate products but highlight the pathways involving HPALDs, isoprene nitrates, and IEPOXs for future experimental investigations.
More critically, the third-generation glyoxal formation from isoprene occurs via the OH-oxidation of glycolaldehyde (Fig. 5). The GEOS-Chem v14.2.3 mechanism assumed an 11 % yield of glyoxal from the glycolaldehyhde + OH reaction based on Paulot et al. (2009), which was markedly lower than the 20 % yield recommended by the IUPAC and JPL and even lower than the 20 %–33 % yields measured by Chan et al. (2009). We updated this glyoxal yield to 20 % in our revised chemical mechanism.
5.1.3 Overall yield of glyoxal from OH-initiated oxidation of isoprene and its sensitivity to NOx
We conducted box simulations to evaluate glyoxal production from the OH-initiated oxidation of isoprene using three chemical mechanisms: the mechanism of GC-CTRL (i.e., the RCIM as implemented in GEOS-Chem v14.2.3), MCM v3.3.1, and our revised mechanism for GC-T-EC. Figure 6 shows the simulated glyoxal yields under varying OH and NOx levels. Oxidation of isoprene initiated by other oxidants, depositions, and aerosol uptake processes were disabled in these box simulations. Under a typical moderate-NOx condition (OH = 1.8×10⁶ molecules cm−3 and NO = 1 ppb), the GC-CTRL mechanism produced glyoxal at only a 4.0 % molar yield, approximately half of the yield simulated by MCM (9.0 %). In comparison, our revised mechanism increased the glyoxal yield to 8.7 %, an enhancement attributed mostly to our added first-generation production and an increased glyoxal yield from glycolaldehyde oxidation.
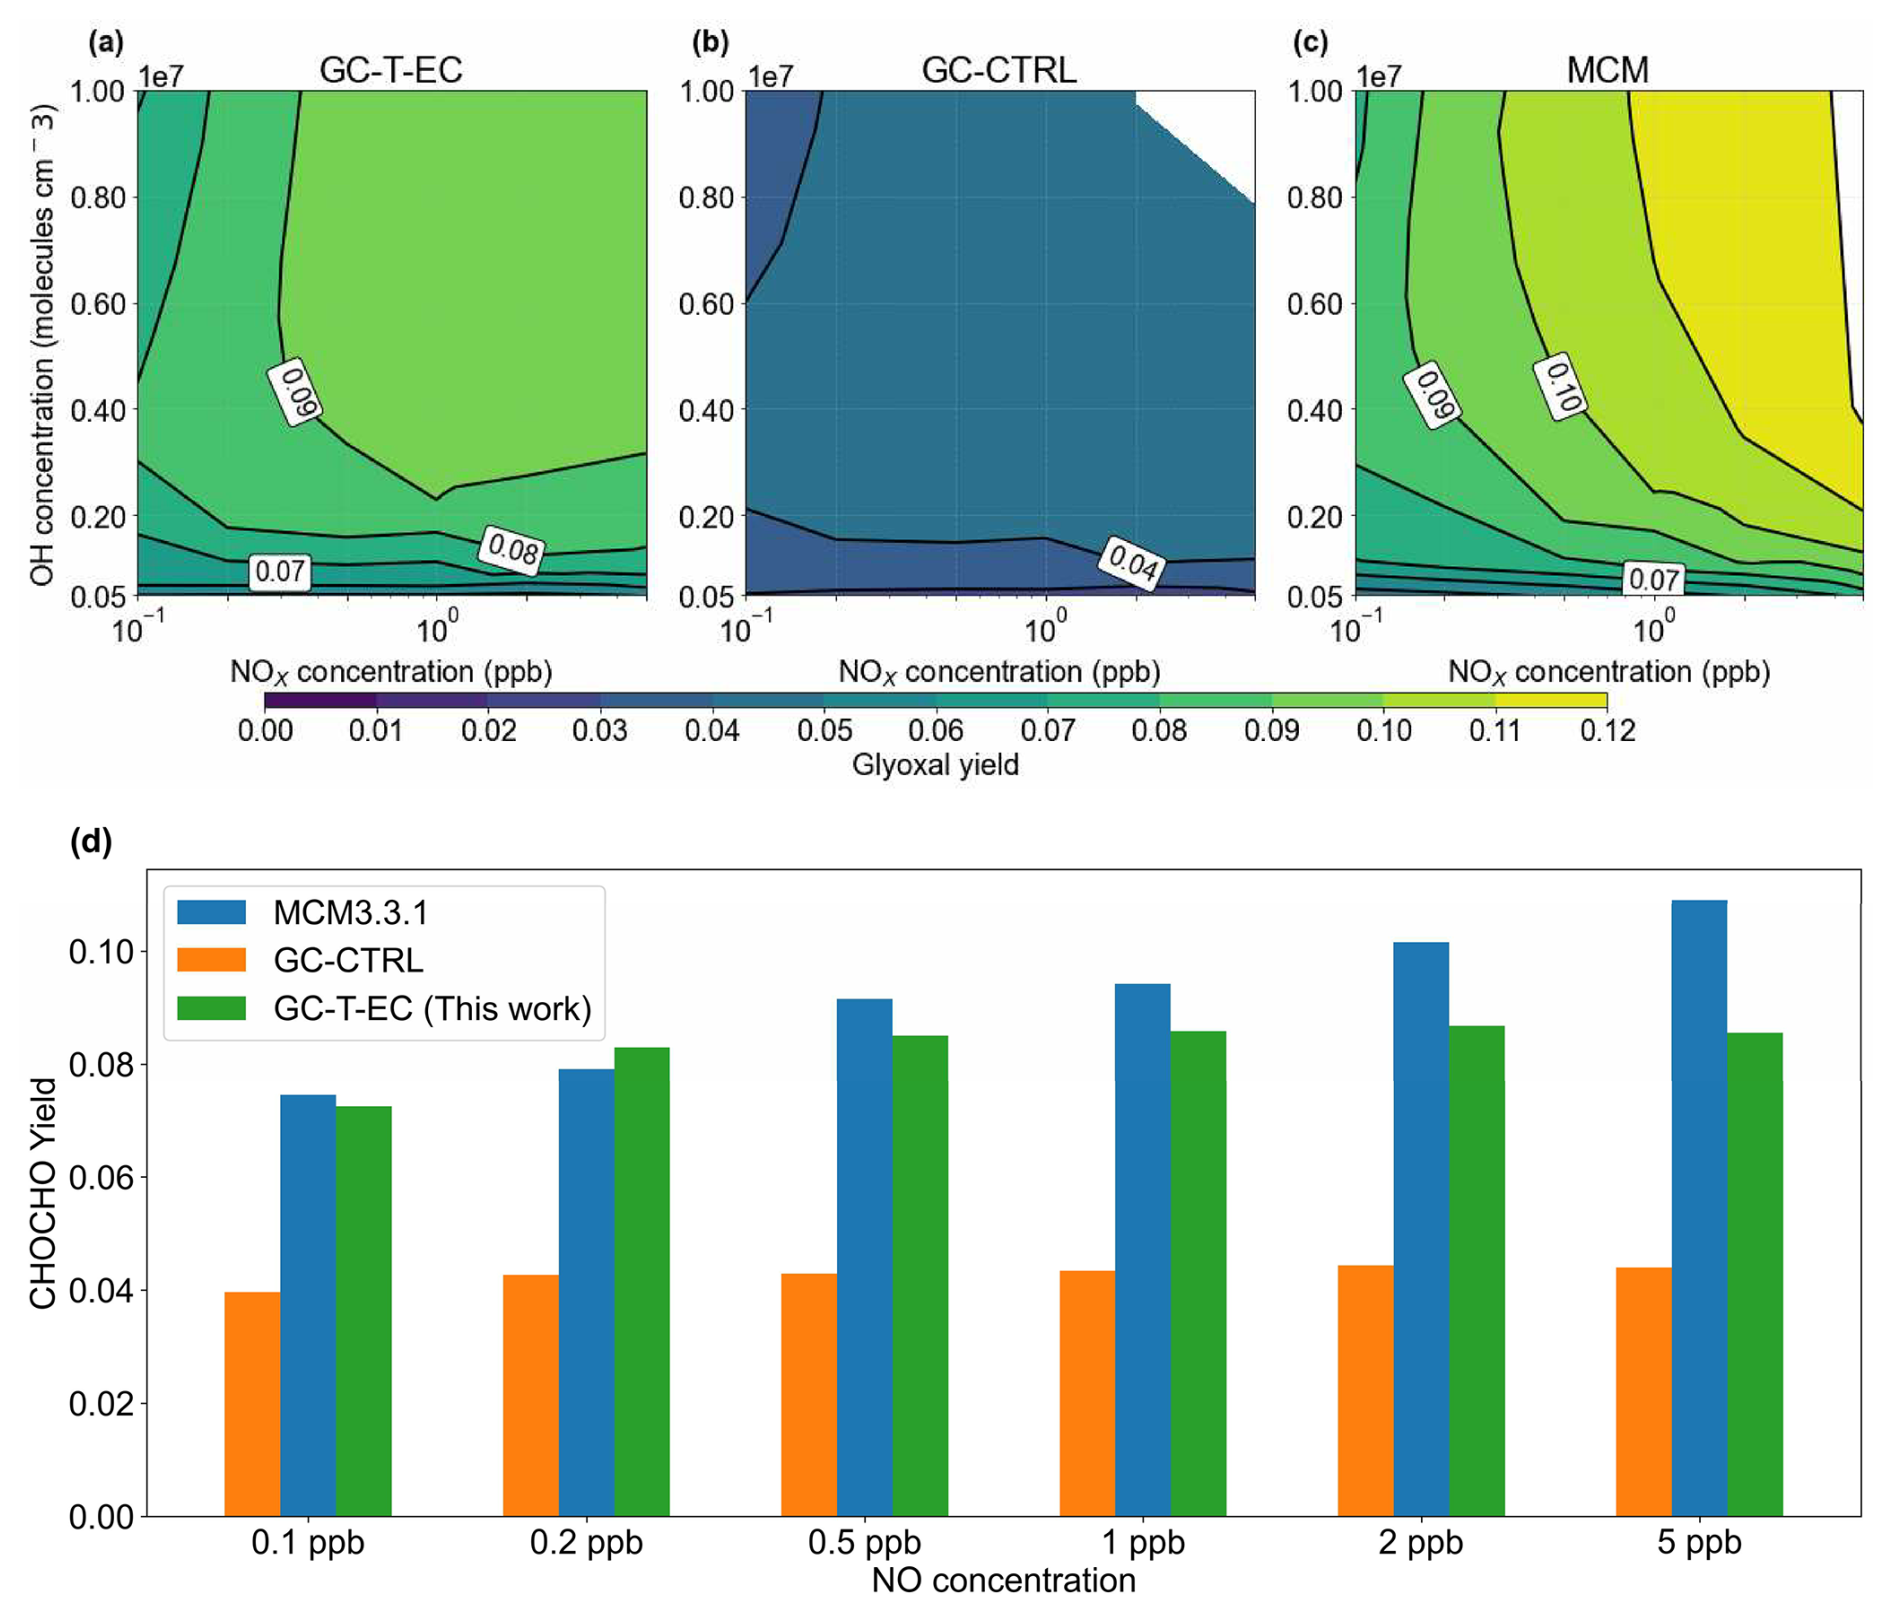
Figure 6Glyoxal yields from isoprene-OH oxidation as a function of NOx and OH concentrations. Molar yields of glyoxal from isoprene + OH oxidation under different daily mean NOx and OH concentrations in (a) our revised chemical mechanism used in GC-T-EC, (b) the RCIM as implemented in the GEOS-Chem v14.2.3 mechanism, and (c) MCM v3.3.1. (d) Comparison of simulated glyoxal molar yields from isoprene + OH oxidation under different NO concentrations at a constant daily mean [OH] = 1.8×10⁶ molecules cm−3.
The NOx-sensitivity of glyoxal yield from isoprene OH-oxidation stems from the competition among reaction pathways and serves as a key diagnostic for evaluating chemical mechanisms. Our box simulations showed disparate NOx-sensitivities among the three chemical mechanisms. In the GC-CTRL mechanism, the glyoxal molar yield from isoprene was almost invariant (3 %–4 %) across a wide range of NO concentrations (0.1 to 10 ppb) (Fig. 6d). In comparison, the MCM exhibited strong enhancements of glyoxal yield with increasing NO levels, rising from 7.5 % at NO = 0.1 ppb to 10.9 % at NO = 5 ppb (Fig. 6d). This positive NOx-sensitivity mainly reflected MCM's explicit representation of glyoxal formation from isoprene nitrates and its assumption of no glyoxal formation from IEPOX-derived peroxy radicals.
Our revised mechanism exhibited a milder yet non-monotonic sensitivity of glyoxal yield to NOx concentration, rising from 7.3 % at NO = 0.1 ppb to a peak of 8.7 % at NO = 2 ppb, then decreased slightly to 8.6 % for OH = 1.8×10⁶ molecules cm−3 (Fig. 6d). Figure 5 compares the branching ratios of glyoxal formation pathways in our revised mechanism at NO concentrations of 0.1 and 5 ppb, respectively. Under high-NO conditions, the DIBOO pathway became effective, and the ISOPOOH reactions shifted moderately toward the production of MVK and isoprene nitrates, whose subsequent yields of glycolaldehyde and glyoxal also increased slightly. At lower NO levels, ISOPOOH and its isomers favored the formation of C5 carbonyls; however, the glycolaldehyde and glyoxal yields from these carbonyls decreased substantially. This complex modulation of competing pathways explained the mild yet non-monotonic NOx-sensitivity in the simulated glyoxal yields of our revised mechanism. Bates and Jacob (2019) showed that the glyoxal yield in the RCIM increased sharply to 10 % at extremely low NO concentration (<10 ppt), driven by the HO2 reaction with IEPOX peroxy radicals and the H-shifts of ISOPOO. This large glyoxal yield at extremely low NO would also be present in our revised mechanism, since our modifications of RCIM were mostly associated with high-NOx pathways. However, an NO level of <10 ppt is unrealistically low for current source areas of isoprene and likely rarely realized in the atmosphere (Hudman et al., 2007; Schulz et al., 2018).
Furthermore, the glyoxal yield from isoprene varied substantially with OH concentrations (Fig. 6a, b, c). At a fixed NOx level of 1 ppb, the glyoxal yield increased from 7 %–8 % at OH = 1×10⁶ molecules cm−3 to 9 %–10 % at OH = 1×10⁷ molecules cm−3 both in our revised mechanism and in MCM, a trend not captured by the GC-CTRL mechanism. This difference reflected the strong influence of OH concentration on the branching between glycolaldehyde's photolysis and OH-oxidation, which was subdued in the GC-CTRL mechanism due to its lower glyoxal yield from glycolaldehyde. In our revised mechanism, a 50 % increase in OH led to a 20 % enhancement in the glyoxal yield from glycolaldehyde. This result highlighted the potential for substantial glyoxal production from isoprene in regions with concurrently high NOx and OH levels.
Experimental constraints on glyoxal yields from OH-initiated isoprene oxidation and their NOx-sensitivity remained limited, though available evidence was generally consistent with our revised mechanism. For high-NOx conditions, Galloway et al. (2011) calculated the total glyoxal yield from OH-initiated isoprene oxidation in an older version of MCM (v3.2), which lacked first-generation production pathways, to be 8 % (with O3 = 320 ppb) to 11 % (without O3). These numbers closely bracketed the high-NOx glyoxal yield (10.9 %) for the current MCM v3.3.1, which did include a 2.2 % first-generation glyoxal production (Fig. 6b). However, Galloway et al. (2011) reported measured total glyoxal yields equivalent to only 64 % of the MCM v3.2 predictions under high-NOx conditions, corresponding to measured yields of 5.1 %–7.0 % for glyoxal. These measured yields aligned more closely with our revised mechanism and suggested that both MCM v3.2 and v3.3.1 overestimated glyoxal production from post-first-generation pathways under high-NOx conditions. Using active differential optical absorption spectroscopy (DOAS), Guo et al. (2021) measured the surface formaldehyde and glyoxal concentrations at an urban site during summer. They observed that in isoprene-dominated air masses, both glyoxal and formaldehyde concentrations, as well as the glyoxal-to-formaldehyde ratio (RGF), were insensitive to NOx levels between 5 and 40 ppb. This result was consistent with the modest NOx-dependence of glyoxal yields in our revised mechanism at high NO concentrations.
Field observations in low-NOx, isoprene-dominated environments indicated that glyoxal production from isoprene is likely substantial. Li et al. (2016) and Chan Miller et al. (2017) analyzed the Southeast Nexus (SENEX) aircraft campaign data over Southeast U.S. during summer 2013. Both studies demonstrated that the observed glyoxal levels and RGF values in this lower-NOx (0.05 to 0.1 ppb between 0 to 5 km altitude) environment could be well simulated using mechanisms where glyoxal yields at low NOx were comparable or even exceeded those at high NOx. Although the two studies proposed different chemical pathways to explain this phenomenon, their results consistently supported a sustained or potentially enhanced glyoxal yield under low-NO conditions, such as that in our revised mechanism and in the RCIM. However, a recent direct measurement reported a glyoxal yield of 0.52±0.06 % from OH-initiated isoprene oxidation under extremely low NOx (<70 ppt) (Warman, 2024), contradicting the inference from field observations and underscoring significant uncertainties in quantifying low-NOx glyoxal yields from isoprene.
5.1.4 Potential uncertainties in glyoxal production from oxidation of isoprene by O3, NO3, and Cl
Ozonolysis accounts for approximately 10 % of the global sink of atmospheric isoprene (Nguyen et al., 2016). In the explicit mechanism of Wennberg et al. (2018), isoprene ozonolysis produces glyoxal predominantly via MVK, whose oxidation would lead to a 2.2 % molar yield of glyoxal under high-NOx conditions but would be at the timescale of several hours. However, in an isoprene ozonolysis chamber experiment with seed particles, Bikkina et al. (2021) observed glyoxal in the particulate phase within half an hour of isoprene consumption, potentially indicating fast glyoxal production followed by aerosol uptake. Recent experiments showed that anti-MVK-oxide, a Criegee intermediate produced by isoprene ozonolysis (Nguyen et al., 2016), may undergo unimolecular decay and O2-addition to produce glyoxal and OH at 3 % ± 1 % yield (Vansco et al., 2020). However, because the current estimate for the yield of anti-MVK-oxide from isoprene ozonolysis was only 6.7 % (Wennberg et al., 2018), the effective glyoxal production from that pathway would be negligible (<0.2 %). We retained the isoprene ozonolysis mechanism in the RCIM but highlighted this glyoxal production pathway for future investigations.
Isoprene oxidation by NO3 at night accounts for approximately 2 % of the global isoprene loss (Bates and Jacob, 2019). In the RCIM, the isoprene + NO3 reaction rapidly formed nitrooxy alkylperoxy radicals (INO2), which reacted with HO2 to yield various isoprene hydroperoxy nitrate isomers (IPN) (Schwantes et al., 2015). Glyoxal was produced mainly through MVK derived from β-1,2-INO2, as constrained by Schwantes et al. (2015). A minor pathway to glyoxal involved the oxidation of 2,1-IPN, though the branching ratios of IPN isomers remained uncertain, and subsequent reaction pathways of IPNs lacked strong experimental validation (Wennberg et al., 2018). Given the complexity of isoprene nitrate speciation and limited experimental constraints, we retained the existing RCIM representation for isoprene + NO3 chemistry.
5.2 Production of glyoxal from other NMVOC precursors
5.2.1 Acetylene
Acetylene (C2H2), with an 18 d global mean lifetime, is an important anthropogenic precursor of glyoxal in the free troposphere (Fu et al., 2008). In the standard GEOS-Chem v14.2.3, OH-initiated oxidation of acetylene produced glyoxal at a fixed molar yield of 63 % following MCM v3.3.1, consistent with experimentally reported yields of 70 % ± 30 % (Bohn and Zetzsch, 1998).
5.2.2 Aromatics
Aromatics in the standard GEOS-Chem v14.2.3 included benzene, toluene, and lumped xylenes (Bates et al., 2021). Laboratory studies indicated that glyoxal produced from OH-initiated aromatic oxidation occurred first through ring-cleavage, followed by oxidation of the cleaved C4 and C5 intermediate products (Volkamer et al., 2007; Bates et al., 2021). Reported first-generation glyoxal yields from ring cleavage varied considerably. In the standard GEOS-Chem v14.2.3, Bates et al. (2021) implemented first-generation glyoxal yields from aromatics by averaging literature-reported values across low- to high-NOx conditions: 18 %, 12 %, 10 % for benzene, toluene, and lumped xylenes, respectively. Glyoxal production pathways and yields from subsequent C4 and C5 intermediate photochemistry were partially constrained by experiments and theoretical studies (Newland et al., 2018; Wang et al., 2020). Given the current level of understanding, we retained the standard GEOS-Chem representation of aromatic chemistry and glyoxal formation pathways.
5.2.3 Ethylene
In the standard GEOS-Chem v14.2.3, atmospheric ethylene (C2H4) was emitted from anthropogenic and biogenic sources over land and underwent oxidation by OH and O3 described by a condensed version of MCM v3.3.1 (Kwon et al., 2021), with the OH-oxidation producing glycolaldehyde at 100 % yield under both high- and low-NOx conditions. We retained the standard ethylene oxidation scheme in GEOS-Chem, but our increased glyoxal yield from glycolaldehyde effectively raised the global molar yield of glyoxal yield from ethylene from 7 % in the GC-CTRL simulation to 19 % in the GC-TM-EC simulation.
5.2.4 Methylbutenol
Atmospheric methylbutenol is oxidized by OH and O3, but these reactions were not represented in the standard GEOS-Chem v14.2.3. Fu et al. (2008) previously assumed a constant 63 % molar yield of glycolaldehyde from methylbutenol OH-oxidation, based on early high-NOx experiments and an early version of MCM (v3.1). However, later experiments by Chan et al. (2009) found that methylbutenol's glycoldehyde yield decrease from 64 %–70 % under high-NOx to 26 %–32 % at low-NOx levels (<2 ppb), indicating competition from an HO2 pathway that bypasses glycolaldehyde formation. We adopted a condensed scheme of the methylbutenol oxidation mechanism from MCM v3.3.1 (Müller et al., 2019), which was experimentally validated for its HO2 turnover rate and formaldehyde production (a product from the high-NOx oxidation of methylbutenol) (Novelli et al., 2018). This scheme predicted glycolaldehyde yields of 63 % under high-NOx and 0 % under low-NOx conditions. Our simulated global glyoxal yield from methylbutenol was 5.8 %.
5.2.5 Monoterpenes
Monoterpenes in the standard GEOS-Chem v14.2.3 were represented by two lumped species: one for monoterpenes with a single double bond (including α-pinene, β-pinene, sabinene, and δ3-carene) and another for those with two double bonds (including limonene, myrcene, and ocimene). Their photochemical oxidation was described by the mechanism of Fisher et al. (2016), which omitted the glyoxal production from ozonolysis – a pathway established in earlier studies (Yu et al., 1998; Fick et al., 2003, 2004).
Reported glyoxal yields from monoterpene ozonolysis were sparse and highly variable, ranging from 4 %–9 % for α-pinene (Fick et al., 2003, 2004) to 6.2 %–24 % for α-phellandrene (a two-double-bond species) (Mackenzie-Rae et al., 2017). Lower yields of 0.5 %–4 % were also reported for two monoterpenoids, geraniol and citral (Nunes et al., 2005). Fu et al. (2008) previously applied in their GEOS-Chem simulation a mid-range 5 % glyoxal yield based on α-pinene experiments. However, this assumption resulted in a simulated glyoxal-to-formaldehyde ratio (RGF) more than three times lower than satellite observations over boreal forests, where monoterpene emissions dominated (Silva et al., 2018). This discrepancy was significantly larger than that over other NMVOC source regions, leading Silva et al. (2018) to conclude that monoterpene-derived glyoxal was substantially underestimated. More recently, Müller et al. (2019) assumed a 20 % glyoxal yield from monoterpene ozonolysis in their chemical mechanism, but the basis for that assumption was unclear. In the latest v14.5 of GEOS-Chem, Travis et al. (2024) implemented a complex monoterpene oxidation mechanism condensed from the MCM v3.3.1. However, that mechanism produced glyoxal from monoterpene ozonolysis exclusively via MVK at relatively low yields.
Given the top-down constraint of Silva et al. (2018) and the higher glyoxal yields reported for α-phellandrene (Mackenzie-Rae et al., 2017), we assumed a fixed 15 % yield to the ozonolysis of all monoterpenes in our revised mechanism. Our simulated global glyoxal yield from monoterpenes was 2.7 %.
5.3 Heterogeneous uptake of glyoxal on aqueous aerosols and cloud droplets
Glyoxal undergoes irreversible uptake by aqueous aerosols and cloud droplets, constituting a substantial pathway for SOA formation in the atmosphere (Fu et al., 2008; Ling et al., 2020). This heterogeneous uptake process was characterized in GEOS-Chem by a reactive uptake coefficient γ (Jacob, 2000; Fu et al., 2008):
where CG was the gas-phase glyoxal concentration, a was the radius of the wet particle or cloud droplet, Dg was the gas-phase diffusivity of glyoxal, v was its mean molecular speed, and A was the particle surface area.
Experiments have shown that glyoxal's irreversible uptake is RH-dependent due to a salting-in effect (Waxman et al., 2015), which was not represented in the standard GEOS-Chem v14.2.3. Curry et al. (2018) parameterized the reactive uptake coefficient (γG) by incorporating thermodynamics, aqueous chemistry, and salting-in effects on mass transfer limitations, resulting in an exponential dependence of γG on RH with a quadratic polynomial exponent. This parameterization yielded γG = at RH = 55 %, decreasing sharply to γG = at RH = 90 %. The RH dependency was consistent with measured gas-particle partitioning effects (Healy et al., 2009), particularly under high-RH conditions (Gen et al., 2018). We adopted this parameterization from Curry et al. (2018) in our revised mechanism.
We evaluated our revised atmospheric glyoxal simulations against global satellite and surface measurements and found that incorporating updated precursor emissions and chemistry improved the overall model–observation consistency. Figure 1 compares the annual mean tropospheric glyoxal VCDs at satellite overpass time (13:30 LT) from sensitivity experiments with TROPOMI observations and the standard GEOS-Chem simulation (GC-CTRL). The GC-TM-E experiment updated the terrestrial precursor emissions and included a hypothetical marine boundary layer glyoxal source. This simulation significantly reduced the global bias against TROPOMI observations (Fig. 1c, NMB %, r=0.84 globally), primarily because oceanic glyoxal VCDs were constrained to TROPOMI-observed values. In addition, the GC-TM-E simulation enhanced glyoxal levels over major forested and biomass burning regions across North America, Europe, Asia, South America, and Africa, and Southeast Asia, improving consistency against TROPOMI glyoxal observations over land (NMB and r=0.80). The GC-T-EC simulation, which refined both terrestrial precursor emissions and chemistry, showed further improved spatial correlation with TROPOMI over land (Fig. 1d), (r= 0.86 and NMB ). However, a global bias remained due to the lack of representation of glyoxal over the oceans.
The GC-TM-EC simulation, which incorporated current-best knowledge on terrestrial precursor emission and chemistry, along with TROPOMI-constrained marine glyoxal source, showed the best overall agreement with global TROPOMI observations (Fig. 1e). The global bias of simulated annual mean glyoxal VCD against TROPOMI observations was −17 %, with a spatial correlation of r = 0.87. Over land, the NMB was −42 %, with a spatial correlation of r = 0.85. The slight improvement in NMB in the GC-TM-EC simulation relative to the GC-T-EC simulaation over land arose from enhanced glyoxal VCDs over the coastal grids due to the added marine glyoxal source. The remaining land bias in the GC-TM-EC simulation reflected persistent uncertainties in precursor emissions from biogenic, anthropogenic (Qiu et al., 2020), and biomass burning sources (Silva et al., 2018), as well as glyoxal yields from these precursors.
Figure 2a compares simulated glyoxal concentrations against surface measurements over land. Excluding measurements from urban and biomass-burning sites, the GC-TM-EC simulation showed substantially better agreement with observations over land (NMB = −43 %) than the GC-CTRL simulation (NMB = −77 %). We found that this improvement over land arose not only from refined isoprene emissions and its glyoxal production, but also from a better quantification of glyoxal and its precursors from biomass burning. Figure 7 compares satellite-observed and simulated VCDs of glyoxal and isoprene, along with the observed and simulated glyoxal-isoprene ratios (RGI) over four high-glyoxal regions. Figure S5 compares the simulated surface isoprene concentrations against measurements in key biogenic source regions. Over North America, the CrIS constraints on isoprene emissions corrected the low bias in GC-CTRL-simulated isoprene VCDs, improving the agreement with observed surface isoprene concentrations, while also improving the agreement between the simulated glyoxal VCDs and the TROPOMI observations. Updates in chemical mechanisms further improved the simulated glyoxal abundances and the RGI, indicating a better representation of glyoxal production from isoprene. In contrast, over South America, Africa, and Southeast Asia, CrIS constraints either reduced or only slightly increased isoprene emissions, which brought the simulated surface isoprene concentrations to better agree with measurements (Fig. S5). However, the enhanced biomass-burning emissions of glyoxal and its precursors substantially raised both the simulated glyoxal abundances and the simulated RGI to become more consistent with observations. Chemical mechanism updates in GC-TM-EC only brought minor adjustments to simulated glyoxal abundance over these regions. These results underscore the large contribution of biomass burning emissions to atmospheric glyoxal, which must be better constrained to enable accurate NMVOC emission inversions using glyoxal VCDs.
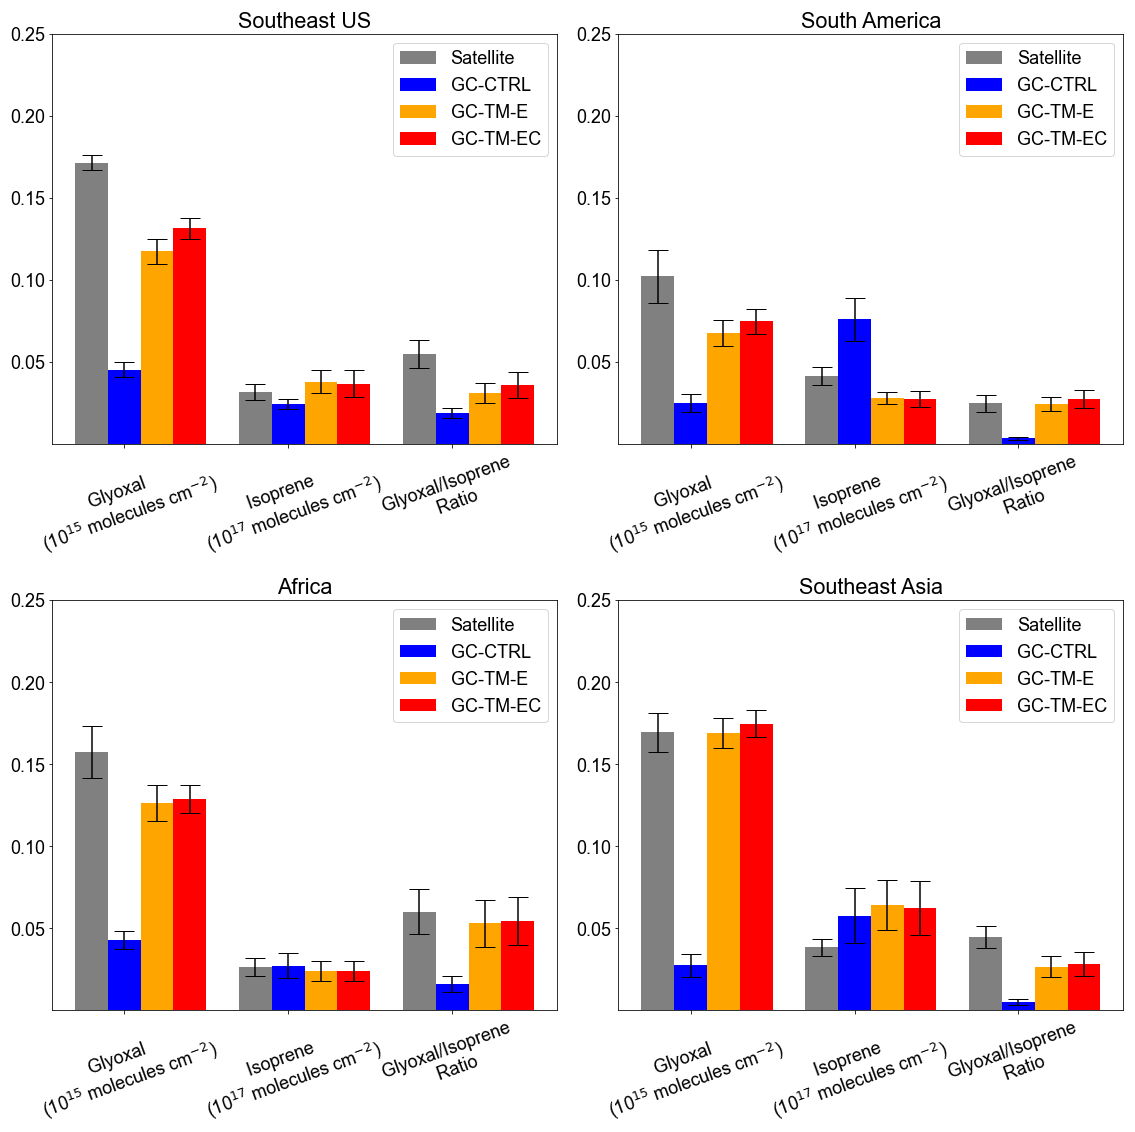
Figure 7Comparison of the satellite-retrieved and simulated VCDs of glyoxal (from TROPOMI) and isoprene (from CrIS-ANN) and their ratios over regions dominated by seasonal biogenic NMVOC emissions: (a) Southeast U.S. (August to October), (b) South America (annual mean), (c) Africa (annual mean), and (d) Southeast Asia (annual mean). Error bars indicate standard deviation of monthly mean VCDs and ratios, respectively.
Over the ocean, inclusion of the hypothetical marine glyoxal source markedly improved the agreement of the GC-TM-EC simulation with independent MBL observations. Compared to the GC-CTRL simulation, the normalized mean bias (NMB) against MBL measurements in the tropical Pacific, Southern Ocean, Caribbean Sea, and North Atlantic was reduced from −92 % to 12 % (Fig. 2b; Table S1). This consistency with observations independent of the TROPOMI retrieval supports the existence of a significant, previously unaccounted–for glyoxal source in the MBL. Figure S4 further compares the simulated glyoxal over the remote ocean with the aircraft observations from Volkamer et al. (2015) and Kluge et al. (2023). With the added marine glyoxal source, GC-TM-EC–simulated glyoxal concentrations aligned better with the limited aircraft data. However, the model overestimated glyoxal in surface air over the Northeast Pacific but underestimated it over the Atlantic. Additionally, the aircraft profiles suggested a more gradual decline in glyoxal concentration with altitude than simulated, which may indicate a longer–lived marine–derived precursor. This inference is inconsistent with the current understanding that marine–emitted VOCs are predominantly short–lived alkenes (e.g., ethylene and propene) and isoprene (Broadgate et al., 2004; Zhang et al., 2025; Pound, 2021).
Table 2 summarizes the simulated global burdens and budgets of atmospheric glyoxal from our sensitivity experiments and compares them with the GC-CTRL simulation and Fu et al. (2008). Figure 4 shows the global patterns of sources and sinks of atmospheric glyoxal in the GC-TM-EC simulation. Assuming that glyoxal and its precursors originated solely from terrestrial sources and using revised chemistry (the GC-T-EC simulation), the estimated global atmospheric glyoxal burden was 15 Gg, 50 % higher than the standard GEOS‐Chem value (10 Gg). This revised burden coincided with the 15 Gg reported by Fu et al. (2008), despite large differences in model emissions and chemical mechanisms. The global atmospheric glyoxal source in the GC-T-EC simulation was 40 Tg yr−1, a 74 % increase over the 23 Tg yr−1 in the GC-CTRL simulation. This enhancement resulted from both elevated primary glyoxal emissions from biomass and biofuel burning, as well asstrengthened secondary chemical productions (67 % enhancement), particularly from isoprene.
Our revised global budget still pointed to isoprene as the most important terrestrial precursor of atmospheric glyoxal, contributing 14 Tg yr−1 (40 %) to the total atmospheric glyoxal source, 79 % stronger than the 7.8 Tg yr−1 in the GC-CTRL simulation. In the GC-T-EC simulation, 86 % of the global glyoxal production from isoprene was through glycolaldehyde, whose global effective yield of glyoxal was 10 %, twice of that in the GC-CTRL simulation. Our revision of the isoprene chemistry increased the global glyoxal yield from isoprene to 3.2 % in the GC-T-EC simulation, compared to the 1.7 % in the GC-CTRL simulation. This yield of glyoxal from isoprene in the global atmosphere was smaller than that predicted by box models, because the key intermediates (such as MVK, IEPOXs, and HPALDs) were removed by deposition or aerosol uptake, limiting their gas-phase reactions (Bates and Jacob, 2019). The total glyoxal production from biogenic precursors was 18 Tg yr−1, 45 % of the total atmospheric glyoxal source. The anthropogenic and biomass burning precursors, including aromatics, acetylene, and ethylene, collectively contributed 41 % of the total glyoxal source.
Atmospheric glyoxal was removed predominantly by photolysis (58 %), followed by OH-oxidation (16 %), irreversible uptake by aqueous particles (14 %), and deposition (14 %) (Fig. 4). In addition, the heterogeneous removal of glyoxal by aqueous particles was 5.6 Tg yr−1, an order of magnitude larger than that in the GC-CTRL simulation. This increase was due to a combination of increased global glyoxal formation and enhanced irreversible uptake coefficient of glyoxal over land. The simulated global lifetime of glyoxal in the GC-T-EC experiment was 3.4 h, shortened compared to the 3.8 h in the standard GEOS-Chem due to accelerated removal by OH and heterogeneous uptake.
The inclusion of a hypothetical marine glyoxal source in the GC-TM-EC simulation substantially altered the global glyoxal budget, elevating the burden to 39 Gg and the total source to 106 Tg yr−1. Approximately 29 Gg of this enhanced burden was over the ocean, representing a 5.5-fold increase compared to the simulated glyoxal burden over the ocean in the GC-T-EC simulation. Sixty percent (66 Tg yr−1) of the total glyoxal source in the GC-TM-EC simulation was produced in the MBL (Table 2, Fig. 4), constituting a large source of OVOCs in the MBL that could influence the oxidative capacity of the marine atmosphere. Terrestrial source contributions remained similar to those in the GC-T-EC simulation.
The relative strengths of glyoxal sinks also shifted significantly in the GC-TM-EC experiment. Photolysis became an even more important sink for global glyoxal due to the high solar radiation and glyoxal concentrations in the tropical MBL. In contrast, glyoxal removal by heterogeneous uptake became relatively less important, as the added glyoxal was concentrated in high-humidity MBL where the reactive uptake coefficient of glyoxal (γG) was suppressed (Curry et al., 2018; Gen et al., 2018). Overall, the simulated lifetime of atmospheric glyoxal in the GC-TM-EC experiment was 3.2 h, similar to that in the GC-T-EC experiment.
Finally, we examined how the revised atmospheric glyoxal simulations affected global atmospheric chemistry. Figure 8 compared the simulated global surface concentrations of OH, HO2, and O3, along with the surface OH reactivity (OHR) associated with NMVOCs, in the model experiments. In the GC-T-EC experiment, regional changes to biogenic and biomass burning emissions and modifications to precursor chemistry strongly affected atmospheric chemistry over land. The increased regional isoprene and biomass burning NMVOC emissions in the GC-T-EC simulation strengthened OH reactivity across North America and Euroasia, while reduced regional isoprene emissions decreased OH reactivity over South America and Australia (Fig. 8h). The simulated surface OH decreased or increased in accordance to these regional changes in OH reactivity, averaging a −4.2 % reduction in global surface OH relative to the GC-CTRL experiment (Fig. 8h). These changes in OH-initiated oxidation of NMVOCs subsequently altered the photochemistry that produced HO2, particularly over relatively high-NOx areas: surface HO2 concentrations increased by more than 10 % over Europe, the Middle East, and East and South Asia, while decreasing slightly over the Amazon and Australia. Globally, the updates of precursor emissions and glyoxal chemistry increased the global surface O3 concentration by 17 %.
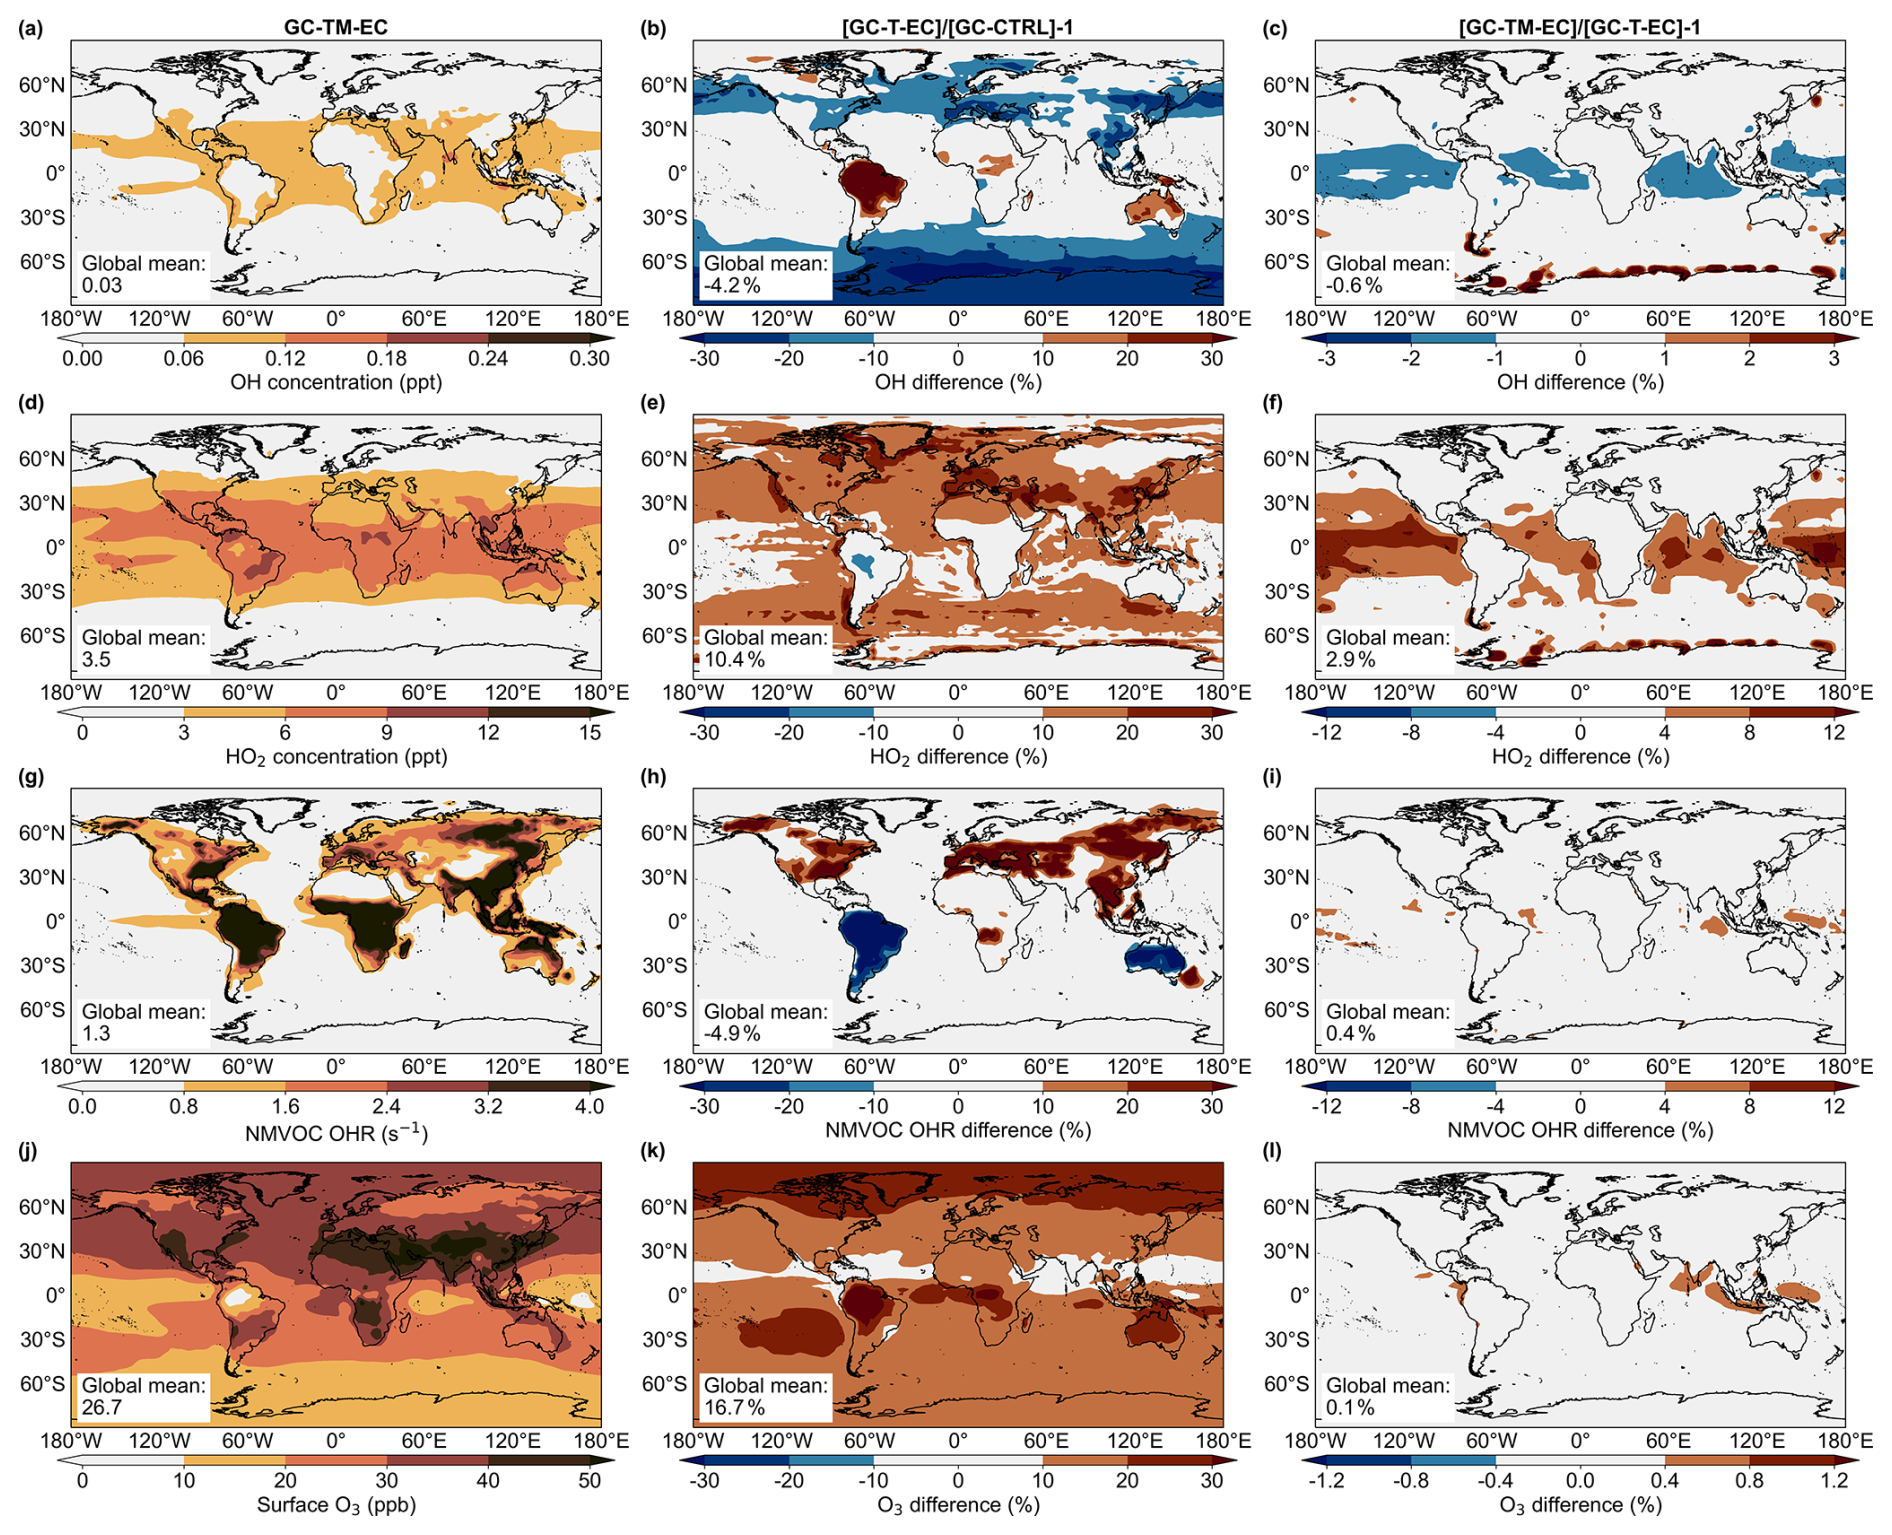
Figure 8Simulated (a) OH (unit: ppt) and (d) HO2 (unit: ppt) concentrations, (g) NMHC OHR (unit: s−1), and O3 (in ppb) among the GC-CTRL, GC-TM-E and GC-TM-EC simulations
The revised precursor emissions and glyoxal chemistry also affected global SOA simulation. Simulated total SOA formation increased from 115 Tg yr−1 in the GC-CTRL experiment to 133 Tg yr−1 in the GC-T-EC experiment and 136 Tg yr−1 in the GC-TM-EC experiment. Glyoxal-derived SOA rose from 0.6 Tg yr−1 in the GC-CTRL experiment to 6.4 Tg yr−1 in the GC-T-EC experiment and 7.6 Tg yr−1 in the GC-TM-EC experiment, respectively. Including the hypothetical marine glyoxal source contributed an extra 1.2 Tg yr−1 of glyoxal SOA. Notably, the relative increase in SOA after inclusion of the hypothetical marine glyoxal source was smaller than the corresponding relative increase in gas-phase glyoxal. This was because glyoxal SOA formation is limited by heterogeneous uptake, which was suppressed in high-RH regions by the salting-in effect, thereby reducing SOA production efficiency over humid marine environments (Waxman et al., 2015).
The hypothetical MBL source of glyoxal also affected the atmospheric oxidative capacity over the ocean, especially in the tropics (Fig. 8c, f, i, l). The additional glyoxal removed OH in the MBL, while its photolysis produced HO2. Relative to the GC-T-EC experiment, the added marine glyoxal source (simulated in GC-TM-EC) had a negative impact on the surface OH concentration globally (−0.6 %), especially over the tropical ocean (−1.0 %). The marine glyoxal increased the surface concentration of HO2 by 6.5 %, the surface NMVOC OH reactivity by 1.9 %, and the surface ozone concentration by 0.3 %, over the tropical ocean.
Figure S6 compares our simulated HOx vertical profile against the observations in the marine boundary layer (below 2500 m) during the ATom-2 mission (Brune et al., 2020). The OH concentrations simulated in the GC-CTRL simulation agreed well with observations, and our improved glyoxal simulation did not significantly change the OH profile over the remote ocean. The HO2 concentration simulated in GC-TM-EC slightly alleviated the underestimation in GC-TM-E by 5 % but still underestimated HO2 compared to the observations, indicating the potential lack or persistent underestimation of HO2 sources (e.g., OVOCs) over the remote MBL.
We also evaluated the broader influence of the revised glyoxal and precursors representations on tropospheric chemistry (Figs. S7, S8, S9). Relative to the GC-CTRL simulation, increased precursor emissions in the GC-TM-EC simulation substantially raised the global mean surface CO concentrations from 99.1 to 113.5 ppb, reducing the model bias against MOPITT observations from −25 % to 13 % (Fig. S7), especially over Eastern United States, East and South Asia, and the tropical South America and Africa. Similarly, enhanced terrestrial precursor emissions moderately increased the simulated global mean surface ozone concentration over land from 22.8 ppb in GC-CTRL to 29.5 ppb in GC-TM-EC, closer to the 34.1 ppb reported in the data–assimilated product of Wang et al. (2025) (Fig. S8). The increased precursor emissions and atmospheric glyoxal abundance in the GC-T-EC experiment also led to a stronger heterogeneous uptake of glyoxal by aqueous particles, thereby enhancing SOA formation (Table 2). Over China, for example, the GC-T-EC experiment simulated significantly higher SOA concentrations than the GC-CTRL experiment, especially at suburban and remote sites (Fig. S9). These increases brought simulations closer to – though still substantially below – observed concentrations, indicating that SOA formation involves complex mechanisms beyond glyoxal chemistry (Miao et al., 2021). The apparent improvements in simulated CO, ozone, and SOA should therefore be interpreted as supporting the chemical plausibility of the revised glyoxal budget and underscoring glyoxal's role as a proxy for atmospheric NMVOC emissions.
We developed an improved global simulation of atmospheric glyoxal using the GEOS-Chem model, advanced by updated emissions and chemical mechanism and consistent with global observations. Assuming glyoxal precursors were entirely terrestrial, we estimated a global atmospheric glyoxal source of 40 Tg yr−1 and a global burden of 15 Gg, effectively improving the consistency between simulated glyoxal VCDs and TROPOMI satellite observations. Isoprene was identified as the dominant terrestrial precursor, while anthropogenic and biomass burning sources – including acetylene, ethylene, and aromatics – collectively contributed 39 % of the global glyoxal source. These results highlighted the importance of non-biogenic precursors to ambient glyoxal in urban and biomass burning areas, with implications for the use of glyoxal for NMVOC emission inversion in such environments.
Even with our improved precursor emission estimates and chemical representation, our simulated glyoxal remained approximately 40 % lower than satellite glyoxal retrievals and surface observations over land. This discrepancy likely stems from both satellite retrieval uncertainties and persistent uncertainties in emissions and chemistry. Anthropogenic emissions of glyoxal precursors, particularly aromatic compounds, are variable and uncertain among different emission inventories and demonstrated a consistent low-bias compared to observations (Yan et al., 2019). In addition, while we scaled isoprene and biomass burning emissions by region on an annual basis, this approach may introduce biases across different land cover types and seasons (Silva et al., 2018; Wang et al., 2024; DiMaria et al., 2025). Uncertainties in simulated OH and NOx concentrations may moderately affect glyoxal production, but they have a potentially large impact on top-down isoprene estimates, particularly over the Amazonian rainforest, where underestimated OH and NOx lead to isoprene overestimation for a given emission rate (Wells et al., 2020). Further uncertainties arise from incomplete representation of key chemical pathways, including glyoxal production from isoprene under low-NOx conditions (Warman, 2024), ozonolysis via Criegee intermediates (Vansco et al., 2020), detailed isoprene nitrate chemistry (Schwantes et al., 2015), and heterogeneous uptake processes of glyoxal (Li et al., 2016; Kim et al., 2022).
Our study highlights the need for improved measurement of VOCs in the MBL and for a deeper exploration of their photochemical transformations. Our exploratory addition of a hypothetical secondary glyoxal source (66 Tg yr−1) raised the global atmospheric glyoxal source to 106 Tg yr−1 and its burden to 39 Gg. While this addition shows tentative consistency with in situ MBL observations, this hypothetical glyoxal source cannot be explained by known marine precursor emissions. Recent work suggests marine biogenic emissions of precursors, such as isoprene, may be larger than previous estimates (Zhang and Gu, 2022). However, our evaluation of model results against limited aircraft measurements points to the possible influence of a more long-live precursor, the nature and impacts of which remain highly uncertain. Resolving this gap in marine photochemistry is essential for quantifying the roles of glyoxal and its precursors in marine and global atmospheric chemistry.
Our revised GEOS-Chem model for global atmospheric glyoxal is permanently archived at https://doi.org/10.57760/sciencedb.27761 (Zhang, 2025). CrIS isoprene observations are available upon request to Dylan Millet. TROPOMI glyoxal observations are available upon request to Thomas Danckaert. Other glyoxal measurements used for model evaluation are summarized in Table S1. ATom observations are downloaded from https://espoarchive.nasa.gov/archive/browse/atom/DC8/BackTraj (last access: 9 September 2025).
The supplement related to this article is available online at https://doi.org/10.5194/acp-26-5123-2026-supplement.
AZ developed the simulations and analyses with help from EX, WW, YL, LZ, WT, and RZ. KCW, DBM, ZW, BY, MS, TD, and CL provided surface and satellite observations. KHB developed the RCIM and implemented it in GEOS-Chem. AZ and TMF wrote the manuscript with inputs from all coauthors. AZ, TMF, and YW conceived the project. TMF supervised and secured funding for the project.
At least one of the (co-)authors is a member of the editorial board of Atmospheric Chemistry and Physics. The peer-review process was guided by an independent editor, and the authors also have no other competing interests to declare.
Publisher's note: Copernicus Publications remains neutral with regard to jurisdictional claims made in the text, published maps, institutional affiliations, or any other geographical representation in this paper. The authors bear the ultimate responsibility for providing appropriate place names. Views expressed in the text are those of the authors and do not necessarily reflect the views of the publisher.
Computational resources were supported by the Center for Computational Science and Engineering of the Southern University of Science and Technology.
This research has been supported by the National Natural Science Foundation of China (grant nos. 42325504, 42305188, and 42461160326), the National Key Research and Development Program of China (grant no. 2023YFC3706205), the Shenzhen Science and Technology Program (grant nos. KQTD20210811090048025 and JCYJ20220818100611024), the High-level Special Funds (G03034K006) and the National Aeronautics and Space Administration (grant no. 80NSSC24M0037).
This paper was edited by Kelley Barsanti and reviewed by two anonymous referees.
Akagi, S. K., Yokelson, R. J., Wiedinmyer, C., Alvarado, M. J., Reid, J. S., Karl, T., Crounse, J. D., and Wennberg, P. O.: Emission factors for open and domestic biomass burning for use in atmospheric models, Atmos. Chem. Phys., 11, 4039–4072, https://doi.org/10.5194/acp-11-4039-2011, 2011. a
Alvarado, L. M. A., Richter, A., Vrekoussis, M., Wittrock, F., Hilboll, A., Schreier, S. F., and Burrows, J. P.: An improved glyoxal retrieval from OMI measurements, Atmos. Meas. Tech., 7, 4133–4150, https://doi.org/10.5194/amt-7-4133-2014, 2014. a, b, c
Alvarado, L. M. A., Richter, A., Vrekoussis, M., Hilboll, A., Kalisz Hedegaard, A. B., Schneising, O., and Burrows, J. P.: Unexpected long-range transport of glyoxal and formaldehyde observed from the Copernicus Sentinel-5 Precursor satellite during the 2018 Canadian wildfires, Atmos. Chem. Phys., 20, 2057–2072, https://doi.org/10.5194/acp-20-2057-2020, 2020. a
Amos, H. M., Jacob, D. J., Holmes, C. D., Fisher, J. A., Wang, Q., Yantosca, R. M., Corbitt, E. S., Galarneau, E., Rutter, A. P., Gustin, M. S., Steffen, A., Schauer, J. J., Graydon, J. A., Louis, V. L. St., Talbot, R. W., Edgerton, E. S., Zhang, Y., and Sunderland, E. M.: Gas-particle partitioning of atmospheric Hg(II) and its effect on global mercury deposition, Atmos. Chem. Phys., 12, 591–603, https://doi.org/10.5194/acp-12-591-2012, 2012. a
Andreae, M. O.: Emission of trace gases and aerosols from biomass burning – an updated assessment, Atmos. Chem. Phys., 19, 8523–8546, https://doi.org/10.5194/acp-19-8523-2019, 2019. a
Atkinson, R., Baulch, D. L., Cox, R. A., Crowley, J. N., Hampson, R. F., Hynes, R. G., Jenkin, M. E., Rossi, M. J., Troe, J., and IUPAC Subcommittee: Evaluated kinetic and photochemical data for atmospheric chemistry: Volume II – gas phase reactions of organic species, Atmos. Chem. Phys., 6, 3625–4055, https://doi.org/10.5194/acp-6-3625-2006, 2006. a, b
Bates, K. H. and Jacob, D. J.: A new model mechanism for atmospheric oxidation of isoprene: global effects on oxidants, nitrogen oxides, organic products, and secondary organic aerosol, Atmos. Chem. Phys., 19, 9613–9640, https://doi.org/10.5194/acp-19-9613-2019, 2019. a, b, c, d, e, f, g, h, i, j
Bates, K. H., Jacob, D. J., Li, K., Ivatt, P. D., Evans, M. J., Yan, Y., and Lin, J.: Development and evaluation of a new compact mechanism for aromatic oxidation in atmospheric models, Atmos. Chem. Phys., 21, 18351–18374, https://doi.org/10.5194/acp-21-18351-2021, 2021. a, b, c
Betterton, E. A. and Hoffmann, M. R.: Henry's law constants of some environmentally important aldehydes, Environ. Sci. Technol., 22, 1415–1418, https://doi.org/10.1021/es00177a004, 1988. a
Bey, I., Jacob, D. J., Yantosca, R. M., Logan, J. A., Field, B. D., Fiore, A. M., Li, Q., Liu, H. Y., Mickley, L. J., and Schultz, M. G.: Global modeling of tropospheric chemistry with assimilated meteorology: Model description and evaluation, J. Geophys. Res.-Atmos., 106, 23073–23095, https://doi.org/10.1029/2001JD000807, 2001. a
Bian, H. and Prather, M. J.: Fast-J2: Accurate simulation of stratospheric photolysis in global chemical models, J. Atmos. Chem., 41, 281–296, https://doi.org/10.1023/A:1014980619462, 2002. a
Bikkina, S., Kawamura, K., Sakamoto, Y., and Hirokawa, J.: Low molecular weight dicarboxylic acids, oxocarboxylic acids and α-dicarbonyls as ozonolysis products of isoprene: Implication for the gaseous-phase formation of secondary organic aerosols, Sci. Total Environ., 769, 144472, https://doi.org/10.1016/j.scitotenv.2020.144472, 2021. a
Bohn, B. and Zetzsch, C.: Formation of HO2 from OH and C2H2 in the presence of O2, J. Chem. Soc., Faraday Trans., 94, 1203–1210, https://doi.org/10.1039/A708536B, 1998. a
Broadgate, W. J., Malin, G., Küpper, F. C., Thompson, A., and Liss, P. S.: Isoprene and other non-methane hydrocarbons from seaweeds: a source of reactive hydrocarbons to the atmosphere, Mar. Chem., 88, 61–73, https://doi.org/10.1016/j.marchem.2004.03.002, 2004. a, b
Brune, W. H., Miller, D. O., Thames, A. B., Allen, H. M., Apel, E. C., Blake, D. R., Bui, T. P., Commane, R., Crounse, J. D., Daube, B. C., Diskin, G. S., DiGangi, J. P., Elkins, J. W., Hall, S. R., Hanisco, T. F., Hannun, R. A., Hintsa, E. J., Hornbrook, R. S., Kim, M. J., McKain, K., Moore, F. L., Neuman, J. A., Nicely, J. M., Peischl, J., Ryerson, T. B., St. Clair, J. M., Sweeney, C., Teng, A. P., Thompson, C., Ullmann, K., Veres, P. R., Wennberg, P. O., and Wolfe, G. M.: Exploring oxidation in the remote free troposphere: insights from atmospheric tomography (ATom), J. Geophys. Res.-Atmos., 125, e2019JD031685, https://doi.org/10.1029/2019JD031685, 2020. a
Brune, W. H., Miller, D. O., and Thames, A. B.: ATom: Measurements from Airborne Tropospheric Hydrogen Oxides Sensor (ATHOS), V2 (Version 2), ORNL Distributed Active Archive Center, ORNL Distributed Active Archive Center, https://doi.org/10.3334/ORNLDAAC/1930, 2021. a
Cao, H., Fu, T.-M., Zhang, L., Henze, D. K., Miller, C. C., Lerot, C., Abad, G. G., De Smedt, I., Zhang, Q., van Roozendael, M., Hendrick, F., Chance, K., Li, J., Zheng, J., and Zhao, Y.: Adjoint inversion of Chinese non-methane volatile organic compound emissions using space-based observations of formaldehyde and glyoxal, Atmos. Chem. Phys., 18, 15017–15046, https://doi.org/10.5194/acp-18-15017-2018, 2018. a, b
Carter, T. S., Heald, C. L., Kroll, J. H., Apel, E. C., Blake, D., Coggon, M., Edtbauer, A., Gkatzelis, G., Hornbrook, R. S., Peischl, J., Pfannerstill, E. Y., Piel, F., Reijrink, N. G., Ringsdorf, A., Warneke, C., Williams, J., Wisthaler, A., and Xu, L.: An improved representation of fire non-methane organic gases (NMOGs) in models: emissions to reactivity, Atmos. Chem. Phys., 22, 12093–12111, https://doi.org/10.5194/acp-22-12093-2022, 2022. a
Castagna, J., Senatore, A., Pellis, G., Vitullo, M., Bencardino, M., and Mendicino, G.: Uncertainty assessment of remote sensing- and ground-based methods to estimate wildfire emissions: a case study in Calabria region (Italy), Air Quality, Atmosphere & Health, 16, 705–717, https://doi.org/10.1007/s11869-022-01300-1, 2023. a, b
Chan, A. W. H., Galloway, M. M., Kwan, A. J., Chhabra, P. S., Keutsch, F. N., Wennberg, P. O., Flagan, R. C., and Seinfeld, J. H.: Photooxidation of 2-Methyl-3-Buten-2-ol (MBO) as a potential source of secondary organic aerosol, Environ. Sci. Technol., 43, 4647–4652, https://doi.org/10.1021/es802560w, 2009. a, b
Chan Miller, C., Jacob, D. J., Marais, E. A., Yu, K., Travis, K. R., Kim, P. S., Fisher, J. A., Zhu, L., Wolfe, G. M., Hanisco, T. F., Keutsch, F. N., Kaiser, J., Min, K.-E., Brown, S. S., Washenfelder, R. A., González Abad, G., and Chance, K.: Glyoxal yield from isoprene oxidation and relation to formaldehyde: chemical mechanism, constraints from SENEX aircraft observations, and interpretation of OMI satellite data, Atmos. Chem. Phys., 17, 8725–8738, https://doi.org/10.5194/acp-17-8725-2017, 2017. a, b
Chen, Y., Hall, J., van Wees, D., Andela, N., Hantson, S., Giglio, L., van der Werf, G. R., Morton, D. C., and Randerson, J. T.: Multi-decadal trends and variability in burned area from the fifth version of the Global Fire Emissions Database (GFED5), Earth Syst. Sci. Data, 15, 5227–5259, https://doi.org/10.5194/essd-15-5227-2023, 2023. a, b, c
Chiu, R., Tinel, L., Gonzalez, L., Ciuraru, R., Bernard, F., George, C., and Volkamer, R.: UV photochemistry of carboxylic acids at the air‐sea boundary: A relevant source of glyoxal and other oxygenated VOC in the marine atmosphere, Geophys. Res. Lett., 44, 1079–1087, https://doi.org/10.1002/2016GL071240, 2017. a
Coburn, S., Ortega, I., Thalman, R., Blomquist, B., Fairall, C. W., and Volkamer, R.: Measurements of diurnal variations and eddy covariance (EC) fluxes of glyoxal in the tropical marine boundary layer: description of the Fast LED-CE-DOAS instrument, Atmos. Meas. Tech., 7, 3579–3595, https://doi.org/10.5194/amt-7-3579-2014, 2014. a
Curry, L. A., Tsui, W. G., and McNeill, V. F.: Technical note: Updated parameterization of the reactive uptake of glyoxal and methylglyoxal by atmospheric aerosols and cloud droplets, Atmos. Chem. Phys., 18, 9823–9830, https://doi.org/10.5194/acp-18-9823-2018, 2018. a, b, c, d
De Haan, D. O., Jansen, K., Rynaski, A. D., Sueme, W. R. P., Torkelson, A. K., Czer, E. T., Kim, A. K., Rafla, M. A., De Haan, A. C., and Tolbert, M. A.: Brown carbon production by aqueous-phase interactions of glyoxal and SO2, Environ. Sci. Technol., 54, 4781–4789, https://doi.org/10.1021/acs.est.9b07852, 2020. a
Dibble, T. S.: Intramolecular hydrogen bonding and double H-atom transfer in peroxy and alkoxy radicals from isoprene, The J. Phys. Chem. A, 108, 2199–2207, https://doi.org/10.1021/jp0306702, 2004a. a
Dibble, T. S.: Prompt chemistry of alkenoxy radical products of the double H-atom transfer of alkoxy radicals from isoprene, J. Phys. Chem. A, 108, 2208–2215, https://doi.org/10.1021/jp0312161, 2004b. a
DiGangi, J. P., Henry, S. B., Kammrath, A., Boyle, E. S., Kaser, L., Schnitzhofer, R., Graus, M., Turnipseed, A., Park, J.-H., Weber, R. J., Hornbrook, R. S., Cantrell, C. A., Maudlin III, R. L., Kim, S., Nakashima, Y., Wolfe, G. M., Kajii, Y., Apel, E. C., Goldstein, A. H., Guenther, A., Karl, T., Hansel, A., and Keutsch, F. N.: Observations of glyoxal and formaldehyde as metrics for the anthropogenic impact on rural photochemistry, Atmos. Chem. Phys., 12, 9529–9543, https://doi.org/10.5194/acp-12-9529-2012, 2012. a
DiMaria, C. A., Jones, D. B. A., Ferracci, V., Bloom, A. A., Worden, H. M., Seco, R., Vettikkat, L., Yáñez‐Serrano, A. M., Guenther, A. B., Araujo, A., Goldstein, A. H., Langford, B., Cash, J., Harris, N. R. P., Brown, L., Rinnan, R., Schobesberger, S., Holst, T., and Mak, J. E.: Optimizing the temperature sensitivity of the isoprene emission model MEGAN in different ecosystems using a Metropolis‐Hastings Markov Chain Monte Carlo method, J. Geophys. Res.-Biogeosci., 130, e2025JG008806, https://doi.org/10.1029/2025JG008806, 2025. a
Edwards, P. M., Brown, S. S., Roberts, J. M., Ahmadov, R., Banta, R. M., deGouw, J. A., Dubé, W. P., Field, R. A., Flynn, J. H., Gilman, J. B., Graus, M., Helmig, D., Koss, A., Langford, A. O., Lefer, B. L., Lerner, B. M., Li, R., Li, S.-M., McKeen, S. A., Murphy, S. M., Parrish, D. D., Senff, C. J., Soltis, J., Stutz, J., Sweeney, C., Thompson, C. R., Trainer, M. K., Tsai, C., Veres, P. R., Washenfelder, R. A., Warneke, C., Wild, R. J., Young, C. J., Yuan, B., and Zamora, R.: High winter ozone pollution from carbonyl photolysis in an oil and gas basin, Nature, 514, 351–354, https://doi.org/10.1038/nature13767, 2014. a
Emmerson, K. M. and Evans, M. J.: Comparison of tropospheric gas-phase chemistry schemes for use within global models, Atmos. Chem. Phys., 9, 1831–1845, https://doi.org/10.5194/acp-9-1831-2009, 2009. a
Ferracci, V., Weber, J., Bolas, C. G., Robinson, A. D., Tummon, F., Rodríguez-Ros, P., Cortés-Greus, P., Baccarini, A., Jones, R. L., Galí, M., Simó, R., Schmale, J., and Harris, N. R. P.: Atmospheric isoprene measurements reveal larger-than-expected Southern Ocean emissions, Nat. Commun., 15, 2571, https://doi.org/10.1038/s41467-024-46744-4, 2024. a
Fick, J., Pommer, L., Nilsson, C., and Andersson, B.: Effect of OH radicals, relative humidity, and time on the composition of the products formed in the ozonolysis of α-pinene, Atmos. Environ., 37, 4087–4096, https://doi.org/10.1016/S1352-2310(03)00522-3, 2003. a, b
Fick, J., Nilsson, C., and Andersson, B.: Formation of oxidation products in a ventilation system, Atmos. Environ., 38, 5895–5899, https://doi.org/10.1016/j.atmosenv.2004.08.020, 2004. a, b
Fisher, J. A., Jacob, D. J., Travis, K. R., Kim, P. S., Marais, E. A., Chan Miller, C., Yu, K., Zhu, L., Yantosca, R. M., Sulprizio, M. P., Mao, J., Wennberg, P. O., Crounse, J. D., Teng, A. P., Nguyen, T. B., St. Clair, J. M., Cohen, R. C., Romer, P., Nault, B. A., Wooldridge, P. J., Jimenez, J. L., Campuzano-Jost, P., Day, D. A., Hu, W., Shepson, P. B., Xiong, F., Blake, D. R., Goldstein, A. H., Misztal, P. K., Hanisco, T. F., Wolfe, G. M., Ryerson, T. B., Wisthaler, A., and Mikoviny, T.: Organic nitrate chemistry and its implications for nitrogen budgets in an isoprene- and monoterpene-rich atmosphere: constraints from aircraft (SEAC4RS) and ground-based (SOAS) observations in the Southeast US, Atmos. Chem. Phys., 16, 5969–5991, https://doi.org/10.5194/acp-16-5969-2016, 2016. a, b
Fu, D., Millet, D. B., Wells, K. C., Payne, V. H., Yu, S., Guenther, A., and Eldering, A.: Direct retrieval of isoprene from satellite-based infrared measurements, Nat. Commun., 10, 3811, https://doi.org/10.1038/s41467-019-11835-0, 2019. a
Fu, T., Jacob, D. J., Wittrock, F., Burrows, J. P., Vrekoussis, M., and Henze, D. K.: Global budgets of atmospheric glyoxal and methylglyoxal, and implications for formation of secondary organic aerosols, J. Geophys. Res.-Atmos., 113, https://doi.org/10.1029/2007JD009505, 2008. a, b, c, d, e, f, g, h, i, j, k, l, m, n, o, p, q
Fu, T.-M., Jacob, D. J., and Heald, C. L.: Aqueous-phase reactive uptake of dicarbonyls as a source of organic aerosol over eastern North America, Atmos. Environ., 43, 1814–1822, https://doi.org/10.1016/j.atmosenv.2008.12.029, 2009. a
Fu, T.-M., Cao, J. J., Zhang, X. Y., Lee, S. C., Zhang, Q., Han, Y. M., Qu, W. J., Han, Z., Zhang, R., Wang, Y. X., Chen, D., and Henze, D. K.: Carbonaceous aerosols in China: top-down constraints on primary sources and estimation of secondary contribution, Atmos. Chem. Phys., 12, 2725–2746, https://doi.org/10.5194/acp-12-2725-2012, 2012. a
Galloway, M. M., Huisman, A. J., Yee, L. D., Chan, A. W. H., Loza, C. L., Seinfeld, J. H., and Keutsch, F. N.: Yields of oxidized volatile organic compounds during the OH radical initiated oxidation of isoprene, methyl vinyl ketone, and methacrolein under high-NOx conditions, Atmos. Chem. Phys., 11, 10779–10790, https://doi.org/10.5194/acp-11-10779-2011, 2011. a, b, c, d, e
Garg, A., Desservettaz, M., Christodoulou, A., Christoudias, T., Kanawade, V. P., Savvides, C., Vrekoussis, M., Naqui, S., Jokinen, T., Byron, J., Williams, J., Mihalopoulos, N., Liakakou, E., Sciare, J., and Bourtsoukidis, E.: Heat and continental transport shape the variability of volatile organic compounds in the Eastern Mediterranean: insights from multi-year observations and regional modeling, Atmos. Chem. Phys., 26, 2597–2622, https://doi.org/10.5194/acp-26-2597-2026, 2026. a
Gen, M., Huang, D. D., and Chan, C. K.: Reactive uptake of glyoxal by ammonium-containing salt particles as a function of relative humidity, Environ. Sci. Technol., 52, 6903–6911, https://doi.org/10.1021/acs.est.8b00606, 2018. a, b
Guenther, A. B., Jiang, X., Heald, C. L., Sakulyanontvittaya, T., Duhl, T., Emmons, L. K., and Wang, X.: The Model of Emissions of Gases and Aerosols from Nature version 2.1 (MEGAN2.1): an extended and updated framework for modeling biogenic emissions, Geosci. Model Dev., 5, 1471–1492, https://doi.org/10.5194/gmd-5-1471-2012, 2012. a, b, c
Guo, Y., Wang, S., Zhu, J., Zhang, R., Gao, S., Saiz-Lopez, A., and Zhou, B.: Atmospheric formaldehyde, glyoxal and their relations to ozone pollution under low- and high-NOx regimes in summertime Shanghai, China, Atmos. Res., 258, 105635, https://doi.org/10.1016/j.atmosres.2021.105635, 2021. a
Ha, E. S., Park, R. J., Kwon, H.-A., Lee, G. T., Lee, S. D., Shin, S., Lee, D.-W., Hong, H., Lerot, C., De Smedt, I., Danckaert, T., Hendrick, F., and Irie, H.: First evaluation of the GEMS glyoxal products against TROPOMI and ground-based measurements, Atmos. Meas. Tech., 17, 6369–6384, https://doi.org/10.5194/amt-17-6369-2024, 2024. a, b
Han, Y., Revercomb, H., Cromp, M., Gu, D., Johnson, D., Mooney, D., Scott, D., Strow, L., Bingham, G., Borg, L., Chen, Y., DeSlover, D., Esplin, M., Hagan, D., Jin, X., Knuteson, R., Motteler, H., Predina, J., Suwinski, L., Taylor, J., Tobin, D., Tremblay, D., Wang, C., Wang, L., Wang, L., and Zavyalov, V.: Suomi NPP CrIS measurements, sensor data record algorithm, calibration and validation activities, and record data quality, J. Geophys. Res.-Atmos., 118, 12734–12748, https://doi.org/10.1002/2013JD020344, 2013. a
Healy, R. M., Temime, B., Kuprovskyte, K., and Wenger, J. C.: Effect of relative humidity on gas/particle partitioning and aerosol mass yield in the photooxidation of p-xylene, Environ. Sci. Technol., 43, 1884–1889, https://doi.org/10.1021/es802404z, 2009. a
Hudman, R. C., Jacob, D. J., Turquety, S., Leibensperger, E. M., Murray, L. T., Wu, S., Gilliland, A. B., Avery, M., Bertram, T. H., Brune, W., Cohen, R. C., Dibb, J. E., Flocke, F. M., Fried, A., Holloway, J., Neuman, J. A., Orville, R., Perring, A., Ren, X., Sachse, G. W., Singh, H. B., Swanson, A., and Wooldridge, P. J.: Surface and lightning sources of nitrogen oxides over the United States: Magnitudes, chemical evolution, and outflow, J. Geophys. Res.-Atmos., 112, https://doi.org/10.1029/2006JD007912, 2007. a
Ip, H. S. S., Huang, X. H. H., and Yu, J. Z.: Effective Henry's law constants of glyoxal, glyoxylic acid, and glycolic acid, Geophys. Res. Lett., 36, https://doi.org/10.1029/2008GL036212, 2009. a
IUPAC Subcommittee for Gas Kinetic Data Evaluation: Gas Kinetic Data Evaluation for Atmospheric Chemistry, http://iupac.pole-ether.fr (last accessed: 15 September 2025), 2013. a
Jacob, D.: Heterogeneous chemistry and tropospheric ozone, Atmos. Environ., 34, 2131–2159, https://doi.org/10.1016/S1352-2310(99)00462-8, 2000. a
Jacobs, M. I., Burke, W. J., and Elrod, M. J.: Kinetics of the reactions of isoprene-derived hydroxynitrates: gas phase epoxide formation and solution phase hydrolysis, Atmos. Chem. Phys., 14, 8933–8946, https://doi.org/10.5194/acp-14-8933-2014, 2014. a
Jenkin, M. E., Young, J. C., and Rickard, A. R.: The MCM v3.3.1 degradation scheme for isoprene, Atmos. Chem. Phys., 15, 11433–11459, https://doi.org/10.5194/acp-15-11433-2015, 2015. a
Kaiser, J., Wolfe, G. M., Min, K. E., Brown, S. S., Miller, C. C., Jacob, D. J., deGouw, J. A., Graus, M., Hanisco, T. F., Holloway, J., Peischl, J., Pollack, I. B., Ryerson, T. B., Warneke, C., Washenfelder, R. A., and Keutsch, F. N.: Reassessing the ratio of glyoxal to formaldehyde as an indicator of hydrocarbon precursor speciation, Atmos. Chem. Phys., 15, 7571–7583, https://doi.org/10.5194/acp-15-7571-2015, 2015. a
Kim, D., Cho, C., Jeong, S., Lee, S., Nault, B. A., Campuzano-Jost, P., Day, D. A., Schroder, J. C., Jimenez, J. L., Volkamer, R., Blake, D. R., Wisthaler, A., Fried, A., DiGangi, J. P., Diskin, G. S., Pusede, S. E., Hall, S. R., Ullmann, K., Huey, L. G., Tanner, D. J., Dibb, J., Knote, C. J., and Min, K.-E.: Field observational constraints on the controllers in glyoxal (CHOCHO) reactive uptake to aerosol, Atmos. Chem. Phys., 22, 805–821, https://doi.org/10.5194/acp-22-805-2022, 2022. a
Kluge, F., Hüneke, T., Lerot, C., Rosanka, S., Rotermund, M. K., Taraborrelli, D., Weyland, B., and Pfeilsticker, K.: Airborne glyoxal measurements in the marine and continental atmosphere: comparison with TROPOMI observations and EMAC simulations, Atmos. Chem. Phys., 23, 1369–1401, https://doi.org/10.5194/acp-23-1369-2023, 2023. a, b, c
Kwon, H.-A., Park, R. J., Oak, Y. J., Nowlan, C. R., Janz, S. J., Kowalewski, M. G., Fried, A., Walega, J., Bates, K. H., Choi, J., Blake, D. R., Wisthaler, A., and Woo, J.-H.: Top-down estimates of anthropogenic VOC emissions in South Korea using formaldehyde vertical column densities from aircraft during the KORUS-AQ campaign, Elementa: Science of the Anthropocene, 9, 00109, https://doi.org/10.1525/elementa.2021.00109, 2021. a, b
Lawson, S. J., Selleck, P. W., Galbally, I. E., Keywood, M. D., Harvey, M. J., Lerot, C., Helmig, D., and Ristovski, Z.: Seasonal in situ observations of glyoxal and methylglyoxal over the temperate oceans of the Southern Hemisphere, Atmos. Chem. Phys., 15, 223–240, https://doi.org/10.5194/acp-15-223-2015, 2015. a
Lee, L., Teng, A. P., Wennberg, P. O., Crounse, J. D., and Cohen, R. C.: On rates and mechanisms of OH and O3 reactions with isoprene-derived hydroxy nitrates, The J. Phys. Chem. A, 118, 1622–1637, https://doi.org/10.1021/jp4107603, 2014. a
Lerot, C., Hendrick, F., Van Roozendael, M., Alvarado, L. M. A., Richter, A., De Smedt, I., Theys, N., Vlietinck, J., Yu, H., Van Gent, J., Stavrakou, T., Müller, J.-F., Valks, P., Loyola, D., Irie, H., Kumar, V., Wagner, T., Schreier, S. F., Sinha, V., Wang, T., Wang, P., and Retscher, C.: Glyoxal tropospheric column retrievals from TROPOMI – multi-satellite intercomparison and ground-based validation, Atmos. Meas. Tech., 14, 7775–7807, https://doi.org/10.5194/amt-14-7775-2021, 2021a. a, b, c, d, e, f, g
Lerot, C., Stavrakou, T., Van Roozendael, M., Alvarado, L. M., and Richter, A.: GLYoxal Retrievals from TROPOMI (GLYRETRO) Product User Manual, Royal Belgian Institute for Space Aeronomy (BIRA-IASB), https://glyretro.aeronomie.be/UploadDir/documents/CHOCHO_PUM_S5PI_BIRA_v1.1.pdf (last access: 15 September 2025), 2021b. a
Li, J., Li, J., Mao, J., Min, K.-E., Washenfelder, R. A., Brown, S. S., Kaiser, J., Keutsch, F. N., Volkamer, R., Wolfe, G. M., Hanisco, T. F., Pollack, I. B., Ryerson, T. B., Ryerson, T. B., Graus, M., Gilman, J. B., Lerner, B. M., Warneke, C., de Gouw, J. A., de Gouw, J. A., Joost A. de Gouw, Joost A. de Gouw, Middlebrook, A. M., Liao, J., Welti, A., Henderson, B. H., McNeill, V. F., Hall, S. R., Ullmann, K., Donner, L. J., Crounse, J. D., Paulot, F., and Horowitz, L. W.: Observational constraints on glyoxal production from isoprene oxidation and its contribution to organic aerosol over the Southeast United States, J. Geophys. Res., 121, 9849–9861, https://doi.org/10.1002/2016jd025331, 2016. a, b, c
Li, J.-L., Zhai, X., Wu, Y.-C., Wang, J., Zhang, H.-H., and Yang, G.-P.: Emissions and potential controls of light alkenes from the marginal seas of China, Sci. Total Environ., 758, 143655, https://doi.org/10.1016/j.scitotenv.2020.143655, 2021. a
Li, M., Zhang, Q., Kurokawa, J.-I., Woo, J.-H., He, K., Lu, Z., Ohara, T., Song, Y., Streets, D. G., Carmichael, G. R., Cheng, Y., Hong, C., Huo, H., Jiang, X., Kang, S., Liu, F., Su, H., and Zheng, B.: MIX: a mosaic Asian anthropogenic emission inventory under the international collaboration framework of the MICS-Asia and HTAP, Atmos. Chem. Phys., 17, 935–963, https://doi.org/10.5194/acp-17-935-2017, 2017. a, b
Li, Y., Fu, T.-M., Yu, J. Z., Yu, X., Chen, Q., Miao, R., Zhou, Y., Zhang, A., Ye, J., Yang, X., Tao, S., Liu, H., and Yao, W.: Dissecting the contributions of organic nitrogen aerosols to global atmospheric nitrogen deposition and implications for ecosystems, Natl. Sci. Rev., 10, nwad244, https://doi.org/10.1093/nsr/nwad244, 2023. a
Li, Y., Fu, T.-M., Yu, J. Z., Zhang, A., Yu, X., Ye, J., Zhu, L., Shen, H., Wang, C., Yang, X., Tao, S., Chen, Q., Li, Y., Li, L., Che, H., and Heald, C. L.: Nitrogen dominates global atmospheric organic aerosol absorption, Science, 387, 989–995, https://doi.org/10.1126/science.adr4473, 2025. a
Liggio, J., Li, S.-M., and McLaren, R.: Reactive uptake of glyoxal by particulate matter, J. Geophys. Res.-Atmos., 110, https://doi.org/10.1029/2004JD005113, 2005. a
Ling, Z., Xie, Q., Shao, M., Wang, Z., Wang, T., Guo, H., and Wang, X.: Formation and sink of glyoxal and methylglyoxal in a polluted subtropical environment: observation-based photochemical analysis and impact evaluation, Atmos. Chem. Phys., 20, 11451–11467, https://doi.org/10.5194/acp-20-11451-2020, 2020. a
Link, M., Zhou, Y., Taubman, B., Sherman, J., Morrow, H., Krintz, I., Robertson, L., Cook, R., Stocks, J., West, M., and Sive, B. C.: A characterization of volatile organic compounds and secondary organic aerosol at a mountain site in the Southeastern United States, J. Atmos. Chem., 72, 81–104, https://doi.org/10.1007/s10874-015-9305-5, 2015. a
Mackenzie-Rae, F. A., Liu, T., Deng, W., Saunders, S. M., Fang, Z., Zhang, Y., and Wang, X.: Ozonolysis of α-phellandrene – Part 1: Gas- and particle-phase characterisation, Atmos. Chem. Phys., 17, 6583–6609, https://doi.org/10.5194/acp-17-6583-2017, 2017. a, b
Maclean, A. M., Butenhoff, C. L., Grayson, J. W., Barsanti, K., Jimenez, J. L., and Bertram, A. K.: Mixing times of organic molecules within secondary organic aerosol particles: a global planetary boundary layer perspective, Atmos. Chem. Phys., 17, 13037–13048, https://doi.org/10.5194/acp-17-13037-2017, 2017. a
Mahajan, A. S., Prados‐Roman, C., Hay, T. D., Lampel, J., Pöhler, D., Groβmann, K., Tschritter, J., Frieß, U., Platt, U., and Johnston, P.: Glyoxal observations in the global marine boundary layer, J. Geophys. Res.-Atmos., 119, 6160–6169, https://doi.org/10.1002/2013JD021388, 2014. a
Marais, E. A. and Wiedinmyer, C.: Air quality impact of diffuse and inefficient combustion emissions in Africa (DICE-Africa), Environ. Sci. Technol., 50, 10739–10745, https://doi.org/10.1021/acs.est.6b02602, 2016. a
Marais, E. A., Jacob, D. J., Jimenez, J. L., Campuzano-Jost, P., Day, D. A., Hu, W., Krechmer, J., Zhu, L., Kim, P. S., Miller, C. C., Fisher, J. A., Travis, K., Yu, K., Hanisco, T. F., Wolfe, G. M., Arkinson, H. L., Pye, H. O. T., Froyd, K. D., Liao, J., and McNeill, V. F.: Aqueous-phase mechanism for secondary organic aerosol formation from isoprene: application to the southeast United States and co-benefit of SO2 emission controls, Atmos. Chem. Phys., 16, 1603–1618, https://doi.org/10.5194/acp-16-1603-2016, 2016. a
McDuffie, E. E., Smith, S. J., O'Rourke, P., Tibrewal, K., Venkataraman, C., Marais, E. A., Zheng, B., Crippa, M., Brauer, M., and Martin, R. V.: A global anthropogenic emission inventory of atmospheric pollutants from sector- and fuel-specific sources (1970–2017): an application of the Community Emissions Data System (CEDS), Earth Syst. Sci. Data, 12, 3413–3442, https://doi.org/10.5194/essd-12-3413-2020, 2020. a
Miao, R., Chen, Q., Shrivastava, M., Chen, Y., Zhang, L., Hu, J., Zheng, Y., and Liao, K.: Process-based and observation-constrained SOA simulations in China: the role of semivolatile and intermediate-volatility organic compounds and OH levels, Atmos. Chem. Phys., 21, 16183–16201, https://doi.org/10.5194/acp-21-16183-2021, 2021. a, b
Mungall, E. L., Abbatt, J. P. D., Wentzell, J. J. B., Lee, A. K. Y., Thomas, J. L., Blais, M., Gosselin, M., Miller, L. A., Papakyriakou, T., Willis, M. D., and Liggio, J.: Microlayer source of oxygenated volatile organic compounds in the summertime marine Arctic boundary layer, P. Natl. Acad. Sci. USA, 114, 6203–6208, https://doi.org/10.1073/pnas.1620571114, 2017. a
Myriokefalitakis, S., Vrekoussis, M., Tsigaridis, K., Wittrock, F., Richter, A., Brühl, C., Volkamer, R., Burrows, J. P., and Kanakidou, M.: The influence of natural and anthropogenic secondary sources on the glyoxal global distribution, Atmos. Chem. Phys., 8, 4965–4981, https://doi.org/10.5194/acp-8-4965-2008, 2008. a, b, c, d, e
Müller, J.-F., Stavrakou, T., and Peeters, J.: Chemistry and deposition in the Model of Atmospheric composition at Global and Regional scales using Inversion Techniques for Trace gas Emissions (MAGRITTE v1.1) – Part 1: Chemical mechanism, Geosci. Model Dev., 12, 2307–2356, https://doi.org/10.5194/gmd-12-2307-2019, 2019. a, b, c, d, e, f, g
NASA Goddard Space Flight Center, Ocean Ecology Laboratory, Ocean Biology Processing Group: MODIS-Terra Ocean Color Data, https://doi.org/10.5067/TERRA/MODIS_OC.2014.0, 2014. a
National Emissions Inventory Collaborative: 2016v1 Emissions Modeling Platform, http://views.cira.colostate.edu/wiki/wiki/10202 (last access: 15 September 2025), 2019. a, b
Newland, M. J., Rea, G. J., Thüner, L. P., Henderson, A. P., Golding, B. T., Rickard, A. R., Barnes, I., and Wenger, J.: Photochemistry of 2-butenedial and 4-oxo-2-pentenal under atmospheric boundary layer conditions, Phys. Chem. Chem. Phys., 21, 1160–1171, https://doi.org/10.1039/C8CP06437G, 2018. a
Nguyen, T. B., Tyndall, G. S., Crounse, J. D., Teng, A. P., Bates, K. H., Schwantes, R. H., Coggon, M. M., Zhang, L., Feiner, P., Milller, D. O., Skog, K. M., Rivera-Rios, J. C., Dorris, M., Olson, K. F., Koss, A., Wild, R. J., Brown, S. S., Goldstein, A. H., de Gouw, J. A., Brune, W. H., Keutsch, F. N., Seinfeld, J. H., and Wennberg, P. O.: Atmospheric fates of Criegee intermediates in the ozonolysis of isoprene, Phys. Chem. Chem. Phys., 18, 10241–10254, https://doi.org/10.1039/C6CP00053C, 2016. a, b
Novelli, A., Kaminski, M., Rolletter, M., Acir, I.-H., Bohn, B., Dorn, H.-P., Li, X., Lutz, A., Nehr, S., Rohrer, F., Tillmann, R., Wegener, R., Holland, F., Hofzumahaus, A., Kiendler-Scharr, A., Wahner, A., and Fuchs, H.: Evaluation of OH and HO2 concentrations and their budgets during photooxidation of 2-methyl-3-butene-2-ol (MBO) in the atmospheric simulation chamber SAPHIR, Atmos. Chem. Phys., 18, 11409–11422, https://doi.org/10.5194/acp-18-11409-2018, 2018. a
Nunes, F., Veloso, M., Deppereira, P., and Deandrade, J.: Gas-phase ozonolysis of the monoterpenoids (S)-(+)-carvone, (R)-(−)-carvone, (−)-carveol, geraniol and citral, Atmos. Environ., 39, 7715–7730, https://doi.org/10.1016/j.atmosenv.2005.04.009, 2005. a
Palmer, P. I., Jacob, D. J., Chance, K., Martin, R. V., Spurr, R. J. D., Kurosu, T. P., Bey, I., Yantosca, R., Fiore, A., and Li, Q.: Air mass factor formulation for spectroscopic measurements from satellites: Application to formaldehyde retrievals from the Global Ozone Monitoring Experiment, J. Geophys. Res.-Atmos., 106, 14539–14550, https://doi.org/10.1029/2000JD900772, 2001. a
Park, R. J., Jacob, D. J., Field, B. D., Yantosca, R. M., and Chin, M.: Natural and transboundary pollution influences on sulfate-nitrate-ammonium aerosols in the United States: Implications for policy, J. Geophys. Res.-Atmos., 109, https://doi.org/10.1029/2003JD004473, 2004. a
Paulot, F., Crounse, J. D., Kjaergaard, H. G., Kroll, J. H., Seinfeld, J. H., and Wennberg, P. O.: Isoprene photooxidation: new insights into the production of acids and organic nitrates, Atmos. Chem. Phys., 9, 1479–1501, https://doi.org/10.5194/acp-9-1479-2009, 2009. a, b, c
Peeters, J., Müller, J.-F., Stavrakou, T., and Nguyen, V. S.: Hydroxyl radical recycling in isoprene oxidation driven by hydrogen bonding and hydrogen tunneling: the upgraded LIM1 mechanism, The J. Phys. Chem. A, 118, 8625–8643, https://doi.org/10.1021/jp5033146, 2014. a, b, c
Plass-Dülmer, C., Koppmann, R., Ratte, M., and Rudolph, J.: Light nonmethane hydrocarbons in seawater, Global Biogeochem. Cy., 9, 79–100, https://doi.org/10.1029/94GB02416, 1995. a
Platt, U. and Stutz, J.: Differential absorption spectroscopy, in: Differential Optical Absorption Spectroscopy: Principles and Applications, pp. 135–174, Springer Berlin Heidelberg, Berlin, Heidelberg, https://link.springer.com/content/pdf/10.1007/978-3-540-75776-4_6.pdf (last access: 15 September 2025), 2008. a
Pound, R. J.: Quantifying the importance of ocean-atmosphere exchange for atmospheric chemistry, phd, University of York, https://etheses.whiterose.ac.uk/id/eprint/29608/ (last access: 16 April 2026), 2021. a, b, c
Qi, B., Zhang, Z., Long, T., He, G., Wang, G., Peng, Y., and Xu, Z.: High resolution (30 m) burned area product improves the ability for carbon emission estimation in Africa, Earth's Future, 12, e2024EF005051, https://doi.org/10.1029/2024EF005051, 2024. a, b
Qiu, X., Wang, S., Ying, Q., Duan, L., Xing, J., Cao, J., Wu, D., Li, X., Chengzhi, X., Yan, X., Liu, C., and Hao, J.: Importance of wintertime anthropogenic glyoxal and methylglyoxal emissions in Beijing and implications for secondary organic aerosol formation in megacities, Environ. Sci. Technol., 54, 11809–11817, https://doi.org/10.1021/acs.est.0c02822, 2020. a
Schulz, C., Schneider, J., Amorim Holanda, B., Appel, O., Costa, A., de Sá, S. S., Dreiling, V., Fütterer, D., Jurkat-Witschas, T., Klimach, T., Knote, C., Krämer, M., Martin, S. T., Mertes, S., Pöhlker, M. L., Sauer, D., Voigt, C., Walser, A., Weinzierl, B., Ziereis, H., Zöger, M., Andreae, M. O., Artaxo, P., Machado, L. A. T., Pöschl, U., Wendisch, M., and Borrmann, S.: Aircraft-based observations of isoprene-epoxydiol-derived secondary organic aerosol (IEPOX-SOA) in the tropical upper troposphere over the Amazon region, Atmos. Chem. Phys., 18, 14979–15001, https://doi.org/10.5194/acp-18-14979-2018, 2018. a
Schwantes, R. H., Teng, A. P., Nguyen, T. B., Coggon, M. M., Crounse, J. D., St. Clair, J. M., Zhang, X., Schilling, K. A., Seinfeld, J. H., and Wennberg, P. O.: Isoprene NO3 oxidation products from the RO2 + HO2 pathway, The J. Phys. Chem. A, 119, 10158–10171, https://doi.org/10.1021/acs.jpca.5b06355, 2015. a, b, c
Seakins, P. W. and Blitz, M. A.: Developments in laboratory studies of gas-phase reactions for atmospheric chemistry with applications to isoprene oxidation and carbonyl chemistry, Ann. Rev. Phys. Chem., 62, 351–373, https://doi.org/10.1146/annurev-physchem-032210-102538, 2011. a
Seaman, V. Y., Charles, M. J., and Cahill, T. M.: A sensitive method for the quantification of acrolein and other volatile carbonyls in ambient air, Anal. Chem., 78, 2405–2412, https://doi.org/10.1021/ac051947s, 2006. a
Seco, R., Peñuelas, J., Filella, I., Llusià, J., Molowny-Horas, R., Schallhart, S., Metzger, A., Müller, M., and Hansel, A.: Contrasting winter and summer VOC mixing ratios at a forest site in the Western Mediterranean Basin: the effect of local biogenic emissions, Atmos. Chem. Phys., 11, 13161–13179, https://doi.org/10.5194/acp-11-13161-2011, 2011. a
Sfendla, Y., Stavrakou, T., Müller, J.-F., Oomen, G.-M., Opacka, B., Danckaert, T., De Smedt, I., and Lerot, C.: Global VOC emissions quantified from inversion of TROPOMI spaceborne formaldehyde and glyoxal data, Atmos. Chem. Phys., 26, 733–767, https://doi.org/10.5194/acp-26-733-2026, 2026. a, b
Shapiro, E. L., Szprengiel, J., Sareen, N., Jen, C. N., Giordano, M. R., and McNeill, V. F.: Light-absorbing secondary organic material formed by glyoxal in aqueous aerosol mimics, Atmos. Chem. Phys., 9, 2289–2300, https://doi.org/10.5194/acp-9-2289-2009, 2009. a
Silva, S. J., Heald, C. L., and Li, M.: Space‐based constraints on terrestrial glyoxal production, J. Geophys. Res.-Atmos., 123, 13583–13594, https://doi.org/10.1029/2018JD029311, 2018. a, b, c, d, e, f
Sinreich, R., Coburn, S., Dix, B., and Volkamer, R.: Ship-based detection of glyoxal over the remote tropical Pacific Ocean, Atmos. Chem. Phys., 10, 11359–11371, https://doi.org/10.5194/acp-10-11359-2010, 2010. a
Sprengnether, M., Demerjian, K. L., Donahue, N. M., and Anderson, J. G.: Product analysis of the OH oxidation of isoprene and 1,3‐butadiene in the presence of NO, J. Geophys. Res.-Atmos., 107, ACH8-1–ACH8-13, https://doi.org/10.1029/2001JD000716, 2002. a
Stavrakou, T., Müller, J.-F., De Smedt, I., Van Roozendael, M., Kanakidou, M., Vrekoussis, M., Wittrock, F., Richter, A., and Burrows, J. P.: The continental source of glyoxal estimated by the synergistic use of spaceborne measurements and inverse modelling, Atmos. Chem. Phys., 9, 8431–8446, https://doi.org/10.5194/acp-9-8431-2009, 2009. a, b
Stone, D., Evans, M. J., Commane, R., Ingham, T., Floquet, C. F. A., McQuaid, J. B., Brookes, D. M., Monks, P. S., Purvis, R., Hamilton, J. F., Hopkins, J., Lee, J., Lewis, A. C., Stewart, D., Murphy, J. G., Mills, G., Oram, D., Reeves, C. E., and Heard, D. E.: HOx observations over West Africa during AMMA: impact of isoprene and NOx, Atmos. Chem. Phys., 10, 9415–9429, https://doi.org/10.5194/acp-10-9415-2010, 2010. a
Sun, S., Palmer, P. I., Siddans, R., Kerridge, B. J., Ventress, L., Edtbauer, A., Ringsdorf, A., Pfannerstill, E. Y., and Williams, J.: Seasonal isoprene emission estimates over tropical South America inferred from satellite observations of isoprene, Atmos. Chem. Phys., 25, 15801–15818, https://doi.org/10.5194/acp-25-15801-2025, 2025. a
Taraborrelli, D., Lawrence, M. G., Butler, T. M., Sander, R., and Lelieveld, J.: Mainz Isoprene Mechanism 2 (MIM2): an isoprene oxidation mechanism for regional and global atmospheric modelling, Atmos. Chem. Phys., 9, 2751–2777, https://doi.org/10.5194/acp-9-2751-2009, 2009. a
Teng, A. P., Crounse, J. D., Lee, L., St. Clair, J. M., Cohen, R. C., and Wennberg, P. O.: Hydroxy nitrate production in the OH-initiated oxidation of alkenes, Atmos. Chem. Phys., 15, 4297–4316, https://doi.org/10.5194/acp-15-4297-2015, 2015. a
Teng, A. P., Crounse, J. D., and Wennberg, P. O.: Isoprene peroxy radical dynamics, J. Am. Chem. Soc., 139, 5367–5377, https://doi.org/10.1021/jacs.6b12838, 2017. a
Travis, K. R., Nault, B. A., Crawford, J. H., Bates, K. H., Blake, D. R., Cohen, R. C., Fried, A., Hall, S. R., Huey, L. G., Lee, Y. R., Meinardi, S., Min, K.-E., Simpson, I. J., and Ullman, K.: Impact of improved representation of volatile organic compound emissions and production of NOx reservoirs on modeled urban ozone production, Atmos. Chem. Phys., 24, 9555–9572, https://doi.org/10.5194/acp-24-9555-2024, 2024. a
Tripathi, N., Sahu, L. K., Singh, A., Yadav, R., Patel, A., Patel, K., and Meenu, P.: Elevated Levels of Biogenic Nonmethane Hydrocarbons in the Marine Boundary Layer of the Arabian Sea During the Intermonsoon, J. Geophys. Res.-Atmos., 125, e2020JD032869, https://doi.org/10.1029/2020JD032869, 2020. a
van der Werf, G. R., Randerson, J. T., Giglio, L., van Leeuwen, T. T., Chen, Y., Rogers, B. M., Mu, M., van Marle, M. J. E., Morton, D. C., Collatz, G. J., Yokelson, R. J., and Kasibhatla, P. S.: Global fire emissions estimates during 1997–2016, Earth Syst. Sci. Data, 9, 697–720, https://doi.org/10.5194/essd-9-697-2017, 2017. a
Vansco, M. F., Caravan, R. L., Zuraski, K., Winiberg, F. A. F., Au, K., Trongsiriwat, N., Walsh, P. J., Osborn, D. L., Percival, C. J., Khan, M. A. H., Shallcross, D. E., Taatjes, C. A., and Lester, M. I.: Experimental evidence of dioxole unimolecular decay pathway for isoprene-derived criegee intermediates, The J. Phys. Chem.A, 124, 3542–3554, https://doi.org/10.1021/acs.jpca.0c02138, 2020. a, b
Veefkind, J., Aben, I., McMullan, K., Förster, H., de Vries, J., Otter, G., Claas, J., Eskes, H., de Haan, J., Kleipool, Q., van Weele, M., Hasekamp, O., Hoogeveen, R., Landgraf, J., Snel, R., Tol, P., Ingmann, P., Voors, R., Kruizinga, B., Vink, R., Visser, H., and Levelt, P.: TROPOMI on the ESA Sentinel-5 Precursor: A GMES mission for global observations of the atmospheric composition for climate, air quality and ozone layer applications, Remote Sens. Environ., 120, 70–83, https://doi.org/10.1016/j.rse.2011.09.027, 2012. a
Volkamer, R., San Martini, F., Molina, L. T., Salcedo, D., Jimenez, J. L., and Molina, M. J.: A missing sink for gas‐phase glyoxal in Mexico City: Formation of secondary organic aerosol, Geophys. Res. Lett., 34, https://doi.org/10.1029/2007GL030752, 2007. a
Volkamer, R., Baidar, S., Campos, T. L., Coburn, S., DiGangi, J. P., Dix, B., Eloranta, E. W., Koenig, T. K., Morley, B., Ortega, I., Pierce, B. R., Reeves, M., Sinreich, R., Wang, S., Zondlo, M. A., and Romashkin, P. A.: Aircraft measurements of BrO, IO, glyoxal, NO2, H2O, O2–O2 and aerosol extinction profiles in the tropics: comparison with aircraft-/ship-based in situ and lidar measurements, Atmos. Meas. Tech., 8, 2121–2148, https://doi.org/10.5194/amt-8-2121-2015, 2015. a, b, c, d, e
Wang, H., Welch, A. M., Nagalingam, S., Leong, C., Czimczik, C. I., Tang, J., Seco, R., Rinnan, R., Vettikkat, L., Schobesberger, S., Holst, T., Brijesh, S., Sheesley, R. J., Barsanti, K. C., and Guenther, A. B.: High temperature sensitivity of Arctic isoprene emissions explained by sedges, Nat. Commun., 15, 6144, https://doi.org/10.1038/s41467-024-49960-0, 2024. a
Wang, R., Shen, H., Zeng, C., Chen, J., Wang, Y., and Li, Y.: A global land daily 10-km-resolution surface ozone dataset from 2013–2022, Sci. Data, 12, 1710, https://doi.org/10.1038/s41597-025-05990-x, 2025. a, b
Wang, S., Newland, M. J., Deng, W., Rickard, A. R., Hamilton, J. F., Muñoz, A., Ródenas, M., Vázquez, M. M., Wang, L., and Wang, X.: Aromatic photo-oxidation, a new source of atmospheric acidity, Environ. Sci. Technol., 54, 7798–7806, https://doi.org/10.1021/acs.est.0c00526, 2020. a
Warman, W. J.: Chamber studies of glyoxal yields from the oxidation of selected biogenic VOCs, PhD thesis, University of Leeds, https://etheses.whiterose.ac.uk/35058/ (last access: 16 April 2026), 2024. a, b
Waxman, E. M., Elm, J., Kurtén, T., Mikkelsen, K. V., Ziemann, P. J., and Volkamer, R.: Glyoxal and methylglyoxal setschenow salting constants in sulfate, nitrate, and chloride solutions: measurements and gibbs energies, Environ. Sci. Technol., 49, 11500–11508, https://doi.org/10.1021/acs.est.5b02782, 2015. a, b
Wells, K. C., Millet, D. B., Payne, V. H., Deventer, M. J., Bates, K. H., de Gouw, J. A., Graus, M., Warneke, C., Wisthaler, A., and Fuentes, J. D.: Satellite isoprene retrievals constrain emissions and atmospheric oxidation, Nature, 585, 225–233, https://doi.org/10.1038/s41586-020-2664-3, 2020. a, b, c, d
Wells, K. C., Millet, D. B., Payne, V. H., Vigouroux, C., Aquino, C. A. B., De Mazière, M., de Gouw, J. A., Graus, M., Kurosu, T., Warneke, C., and Wisthaler, A.: Next‐generation isoprene measurements from space: Detecting daily variability at high resolution, J. Geophys. Res.-Atmos., 127, e2021JD036181, https://doi.org/10.1029/2021JD036181, 2022. a, b
Wennberg, P. O., Bates, K. H., Crounse, J. D., Dodson, L. G., McVay, R. C., Mertens, L. A., Nguyen, T. B., Praske, E., Schwantes, R. H., Smarte, M. D., St Clair, J. M., Teng, A. P., Zhang, X., and Seinfeld, J. H.: Gas-phase reactions of isoprene and its major oxidation products, Chem. Rev., 118, 3337–3390, https://doi.org/10.1021/acs.chemrev.7b00439, 2018. a, b, c, d, e, f, g, h, i, j, k, l, m, n, o
Wesely, M. L.: Parameterization of surface resistances to gaseous dry deposition in regional-scale numerical models, Atmos. Environ., 23, 1293–1304, https://doi.org/10.1016/0004-6981(89)90153-4, 1989. a
Wittrock, F., Richter, A., Oetjen, H., Burrows, J. P., Kanakidou, M., Myriokefalitakis, S., Volkamer, R., Beirle, S., Platt, U., and Wagner, T.: Simultaneous global observations of glyoxal and formaldehyde from space, Geophys. Res. Lett., 33, https://doi.org/10.1029/2006GL026310, 2006. a, b
Wofsy, S. and Team, A. S.: ATom: Aircraft flight track and navigational data, Tech. rep., ORNL Distributed Active Archive Center, Tennessee, USA, https://doi.org/10.3334/ORNLDAAC/1613, 2018. a
Xu, L., Møller, K. H., Crounse, J. D., Kjaergaard, H. G., and Wennberg, P. O.: New insights into the radical chemistry and product distribution in the OH-initiated oxidation of benzene, Environ. Sci. Technol., 54, 13467–13477, https://doi.org/10.1021/acs.est.0c04780, 2020. a
Yan, Y., Cabrera-Perez, D., Lin, J., Pozzer, A., Hu, L., Millet, D. B., Porter, W. C., and Lelieveld, J.: Global tropospheric effects of aromatic chemistry with the SAPRC-11 mechanism implemented in GEOS-Chem version 9-02, Geosci. Model Dev., 12, 111–130, https://doi.org/10.5194/gmd-12-111-2019, 2019. a
Yang, X., Wang, H., Lu, K., Ma, X., Tan, Z., Long, B., Chen, X., Li, C., Zhai, T., Li, Y., Qu, K., Xia, Y., Zhang, Y., Li, X., Chen, S., Dong, H., Zeng, L., and Zhang, Y.: Reactive aldehyde chemistry explains the missing source of hydroxyl radicals, Nat. Commun., 15, 1648, https://doi.org/10.1038/s41467-024-45885-w, 2024. a
Yoon, J. Y. S., Wells, K. C., Millet, D. B., Frankenberg, C., Sanghavi, S., Swann, A. L. S., Thornton, J. A., and Turner, A. J.: Inferring drivers of tropical isoprene: competing effects of emissions and chemistry, Atmos. Chem. Phys., 26, 4509–4529, https://doi.org/10.5194/acp-26-4509-2026, 2026. a
Yu, J., Flagan, R. C., and Seinfeld, J. H.: Identification of Products Containing −COOH, −OH, and −CO in Atmospheric Oxidation of Hydrocarbons, Environ. Sci. Technol., 32, 2357–2370, https://doi.org/10.1021/es980129x, 1998. a
Zhang, A.: GEOS-Chem chemistry with improved glyoxal simulation[DS/OL], V1, Science Data Bank [data set], https://doi.org/10.57760/sciencedb.27761, 2025. a
Zhang, W. and Gu, D.: Geostationary satellite reveals increasing marine isoprene emissions in the center of the equatorial Pacific Ocean, Npj Clim. Atmos. Sci., 5, 83, https://doi.org/10.1038/s41612-022-00311-0, 2022. a
Zhang, W., Weber, J., Archibald, A. T., Abraham, N. L., Booge, D., Yang, M., and Gu, D.: Global Atmospheric Composition Effects from Marine Isoprene Emissions, Environ. Sci. Technol., 59, 2554–2564, https://doi.org/10.1021/acs.est.4c10657, 2025. a, b, c
Zhang, Y., Zhang, R., Yu, J., Zhang, Z., Yang, W., Zhang, H., Lyu, S., Wang, Y., Dai, W., Wang, Y., and Wang, X.: Isoprene Mixing Ratios Measured at Twenty Sites in China During 2012–2014: Comparison With Model Simulation, J. Geophys. Res.-Atmos., 125, e2020JD033523, https://doi.org/10.1029/2020JD033523, 2020. a
Zheng, B., Tong, D., Li, M., Liu, F., Hong, C., Geng, G., Li, H., Li, X., Peng, L., Qi, J., Yan, L., Zhang, Y., Zhao, H., Zheng, Y., He, K., and Zhang, Q.: Trends in China's anthropogenic emissions since 2010 as the consequence of clean air actions, Atmos. Chem. Phys., 18, 14095–14111, https://doi.org/10.5194/acp-18-14095-2018, 2018. a, b
Zheng, B., Zhang, Q., Geng, G., Chen, C., Shi, Q., Cui, M., Lei, Y., and He, K.: Changes in China's anthropogenic emissions and air quality during the COVID-19 pandemic in 2020, Earth Syst. Sci. Data, 13, 2895–2907, https://doi.org/10.5194/essd-13-2895-2021, 2021. a, b
Zhong, Q., Schutgens, N., van der Werf, G. R., van Noije, T., Bauer, S. E., Tsigaridis, K., Mielonen, T., Checa-Garcia, R., Neubauer, D., Kipling, Z., Kirkevåg, A., Olivié, D. J. L., Kokkola, H., Matsui, H., Ginoux, P., Takemura, T., Le Sager, P., Rémy, S., Bian, H., and Chin, M.: Using modelled relationships and satellite observations to attribute modelled aerosol biases over biomass burning regions, Nat. Commun., 13, 5914, https://doi.org/10.1038/s41467-022-33680-4, 2022. a, b
Zhou, S., Gonzalez, L., Leithead, A., Finewax, Z., Thalman, R., Vlasenko, A., Vagle, S., Miller, L. A., Li, S.-M., Bureekul, S., Furutani, H., Uematsu, M., Volkamer, R., and Abbatt, J.: Formation of gas-phase carbonyls from heterogeneous oxidation of polyunsaturated fatty acids at the air–water interface and of the sea surface microlayer, Atmos. Chem. Phys., 14, 1371–1384, https://doi.org/10.5194/acp-14-1371-2014, 2014. a, b
Zhou, X. and Mopper, K.: Apparent partition coefficients of 15 carbonyl compounds between air and seawater and between air and freshwater; implications for air-sea exchange, Environ. Sci. Technol., 24, 1864–1869, https://doi.org/10.1021/es00082a013, 1990a. a
Zhou, X. and Mopper, K.: Measurement of sub-parts-per-billion levels of carbonyl compounds in marine air by a simple cartridge trapping procedure followed by liquid chromatography, Environ. Sci. Technol., 24, 1482–1485, https://doi.org/10.1021/es00080a004, 1990b. a
Zhu, Y. and Kieber, D. J.: Concentrations and Photochemistry of Acetaldehyde, Glyoxal, and Methylglyoxal in the Northwest Atlantic Ocean, Environ. Sci. Technol., https://doi.org/10.1021/acs.est.9b01631, 2019. a, b, c, d
Ziskin, D.: MOPITT CO gridded monthly means (Thermal Infrared Radiances) V009, https://doi.org/10.5067/TERRA/MOPITT/MOP03TM.009, 2021. a
Zou, Z., Chen, Q., Xia, M., Yuan, Q., Chen, Y., Wang, Y., Xiong, E., Wang, Z., and Wang, T.: OH measurements in the coastal atmosphere of South China: possible missing OH sinks in aged air masses, Atmos. Chem. Phys., 23, 7057–7074, https://doi.org/10.5194/acp-23-7057-2023, 2023. a
- Abstract
- Introduction
- Methods
- Evaluation of the standard GEOS-Chem glyoxal simulation as guidance for model improvements
- Updates to terrestrial and marine emissions of glyoxal and its precursors in GEOS-Chem
- Improvements to the chemical processes of glyoxal and its precursors in GEOS-Chem
- Evaluation of simulated glyoxal concentrations against global satellite and surface measurements
- Revised global budgets of atmospheric glyoxal
- Impacts of the revised glyoxal simulation on atmospheric chemistry
- Conclusions
- Code and data availability
- Author contributions
- Competing interests
- Disclaimer
- Acknowledgements
- Financial support
- Review statement
- References
- Supplement