the Creative Commons Attribution 4.0 License.
the Creative Commons Attribution 4.0 License.
 | 10 Apr 2026
Transport of volcanic aerosol from the Raikoke eruption in 2019 through the Northern Hemisphere
Felix Plöger
Zhixuan Bai
Sabine Griessbach
Lars Hoffmann
Frank G. Wienhold
Elizabeth Asher
Alexandre A. Baron
Katie R. Smith
Troy Thornberry
Jianchun Bian
Michaela I. Hegglin
Volcanic injections into the upper troposphere–lower stratosphere (UTLS) affect climate by altering Earth's radiation budget and atmospheric chemistry. However, the pathways by which mid-latitude eruptions spread globally remain poorly understood. We combine nighttime Compact Optical Backscatter Aerosol Detector (COBALD) profiles over Lhasa (China) with ERA5-driven Chemical Lagrangian Model of the Stratosphere (CLaMS) backward trajectories and global three-dimensional sulfur dioxide (SO2)-based tracer simulations. With this integrated framework, we track the plume of the Raikoke eruption (21–22 June 2019) during its transport through the Northern Hemisphere and its interaction with the mature Asian Summer Monsoon Anticyclone (ASMA). Balloon-borne measurements capture the plume's arrival, vertical spreading, and dilution by air in the ASMA interior. Trajectories reveal two principal pathways from distinct Raikoke plumes: (i) an upper-level branch within the summertime stratospheric easterly flow (∼ 460–490 K) carrying the trailing filament of the vorticized volcanic plume (VVP), and (ii) a lower-level branch within the subtropical westerly jet (∼ 390–430 K) carrying the main plume. Although the ASMA can act as a transport barrier at certain potential-temperature levels, it admits mixing into the anticyclone along jet-aligned filaments and redistributes aerosols internally. We show that the transport of the volcanic plume is sensitive to parameterized mixing by varying the mixing strength in CLaMS. Portable Optical Particle Spectrometer (POPS) profiles over Boulder (USA) confirm the plume's timing and altitude, providing an independent evaluation of its transport outside the ASMA region.
- Article
(13628 KB) - Full-text XML
- BibTeX
- EndNote


The impact of volcanic eruptions on climate has been a subject of widespread concern (McCormick et al., 1995; Thompson and Solomon, 2009; Solomon et al., 2011; Bourassa et al., 2012; Masson-Delmotte et al., 2021; Schmidt and Black, 2022). Large eruptions can inject significant amounts of ash and sulfur dioxide (SO2) into the upper troposphere–lower stratosphere (UTLS). While ash typically settles out within weeks, SO2 is oxidized into sulfate aerosols. These aerosols can persist in the stratosphere for months to years and be transported globally by atmospheric circulation, leading to significant climate impacts. Sulfate aerosols efficiently scatter incoming solar radiation back to space, producing a global net cooling in the lower troposphere (Minnis et al., 1993; Tabazadeh et al., 2002; Thompson and Solomon, 2009; Solomon et al., 2011). For instance, the 1991 eruption of Mount Pinatubo caused a global surface temperature decrease of approximately 0.5 °C over the subsequent 2 years (McCormick et al., 1995). Reconstructions based on satellite observations for 1979–2015 indicate that clusters of moderate eruptions since 2004 have imposed a persistent negative radiative forcing of about −0.08 W m−2 (Schmidt et al., 2018). For 2014–2022, stratospheric injections from volcanic eruptions and wildfires produced a global-mean effective radiative forcing of about −0.18 W m−2 (Yu et al., 2023). In addition, enhanced aerosol surface-area density promotes heterogeneous chemistry on polar stratospheric clouds, thereby accelerating ozone depletion (Hofmann and Solomon, 1989; Portmann et al., 1996; Solomon, 1999; Zuev et al., 2015; Solomon et al., 2016).
Several key factors govern the climate impact of volcanic aerosols from an eruption: (1) eruption magnitude; (2) injection height and self-lofting; (3) eruption latitude; and (4) dynamical evolution. (1) Eruption magnitude can be characterized by the amount of SO2 and ash released, which largely controls aerosol formation potential and radiative forcing. Notably, substantial perturbations of stratospheric water vapour and aerosol microphysics have also been reported for the 2022 Hunga Tonga eruption despite modest SO2 injection (Carn et al., 2022; Zhu et al., 2022). (2) Eruption products injected directly into the stratosphere, as well as volcanic plumes in the upper troposphere that self-loft into the lower stratosphere through radiative heating, can persist much longer than plumes confined to the troposphere (Toohey et al., 2025). (3) Aerosols from tropical eruptions are transported most efficiently via the Brewer–Dobson circulation (Brewer, 1949; Dobson, 1956; Butchart, 2014), whereas mid-latitude eruption aerosols can still reach the tropics through Rossby-wave breaking or transport by the Asian Summer Monsoon Anticyclone (ASMA) (Konopka et al., 2009; Kloss et al., 2021; Wu et al., 2023). (4) UTLS jet streams, cyclones, anticyclones, and stratospheric circulation govern dispersion patterns and dilution rates.
In the Northern Hemisphere summer, the ASMA is the dominant circulation system in the UTLS. Deep convection injects pollutants into the UTLS, where the ASMA's strong anticyclonic circulation acts as a dynamical transport barrier, confining these air masses over Asia during ascent into the stratosphere (e.g., Park et al., 2007; Randel et al., 2010; Fadnavis et al., 2014; Santee et al., 2017; Vogel et al., 2019). However, as the ASMA boundary is not a strict transport barrier, air masses can be exported from the monsoon circulation into the extratropical UTLS (Vogel et al., 2016; Yu et al., 2017). This combination of confinement and export is important for interpreting aerosol dispersion during boreal summer, including the dispersion of volcanic aerosol. Previous work on the 2011 Nabro eruption debated whether its plume reached the stratosphere directly or was lofted by monsoon ascent. Bourassa et al. (2012) proposed that the plume remained in the upper troposphere and was subsequently transported into the stratosphere by large-scale ascent in the monsoon, whereas later studies showed evidence of direct stratospheric injection, independent of monsoon-driven lifting (e.g., Fromm et al., 2013; Vernier et al., 2013).
The mid-latitude Raikoke volcano erupted on 21–22 June 2019. Raikoke injected ∼ 1.5 Tg of SO2 into the lower stratosphere (Cai et al., 2022; Vernier et al., 2024). Subsequently, ash-driven radiative heating lofted parts of the volcanic plume, raising the volcanic cloud top above 20 km within 4 d (Muser et al., 2020; Gorkavyi et al., 2021). 3 d after the eruption, compact anticyclonic “vorticized volcanic plumes” (VVPs) detached from the main volcanic cloud, trapping more than half of the SO2 mass (Khaykin et al., 2022). The primary VVP then rose to ∼ 27 km, spanning ∼ 400 km in width but only ∼ 1.5 km in depth. Meanwhile, the residual main plume was diluted at lower altitudes, resulting in two distinct Raikoke plumes (Khaykin et al., 2022). In August 2019, part of the aerosol plume was transported into and through the ASMA during the mature stage of the boreal-summer anticyclone, providing an ideal case to examine how the ASMA modulates volcanic plume transport.
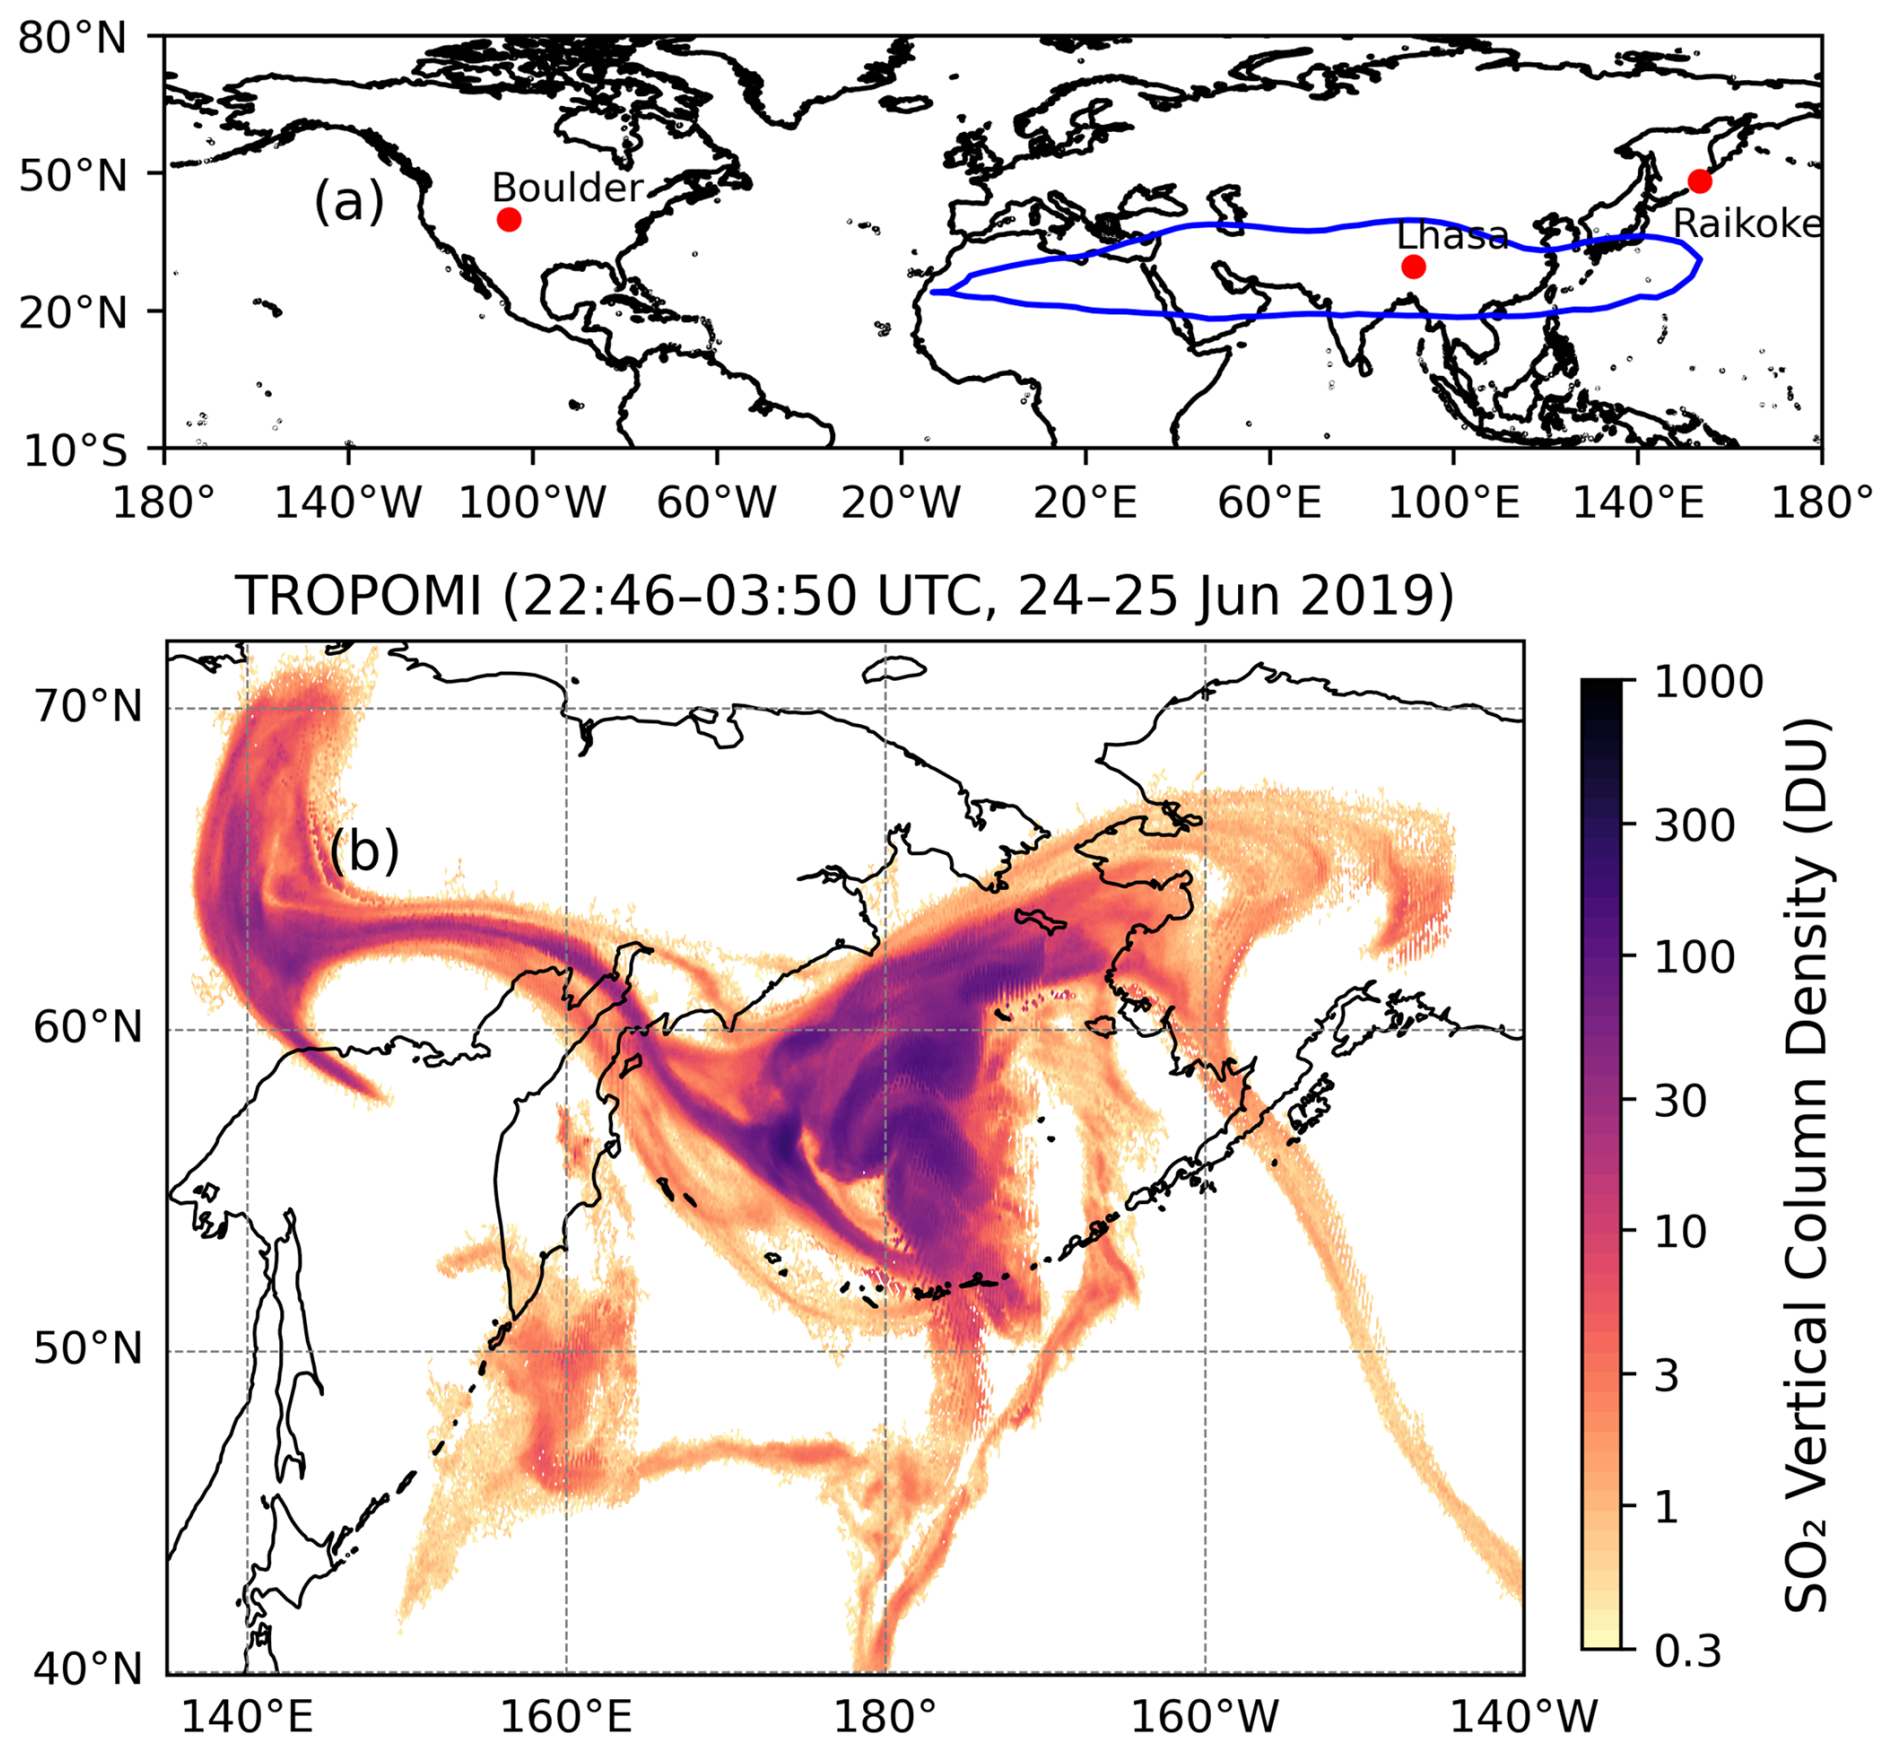
Figure 1(a) Map showing the locations of the balloon measurement sites over Lhasa (29.7° N, 91.1° E) and Boulder (39.9° N, 105.2° W), and the Raikoke volcano (48.3° N, 153.3° E). The blue contour shows the ERA5 geopotential height at 150 hPa averaged over August 2019 at 00:00 UTC. The 14.32 km contour is used here as an indicator of the ASMA at UTLS levels. (b) Spatial distribution of SO2 vertical column density (DU) from TROPOMI, retrieved with an assumed plume height of 15 km, using orbits from 22:46 UTC on 24 June to 03:50 UTC on 25 June 2019.
Beginning in August 2019, frequent balloon-borne measurements were conducted over Lhasa, at UTLS levels located within the ASMA as indicated by the ERA5 150 hPa geopotential height field (Fig. 1a). The profiles captured two pronounced aerosol layers at distinct altitudes that are consistent with the trailing filament of the VVP and the diluted main plume. We combine these observations with ERA5-driven CLaMS backward trajectories and global three-dimensional SO2-based tracer simulations to investigate the source region, transport pathways, and transit times from Raikoke to the Tibetan Plateau. Here, SO2-based refers to passive tracers initialized using the horizontal extent of the Raikoke SO2 cloud derived from the Tropospheric Monitoring Instrument (TROPOMI) aboard Sentinel-5P (Theys et al., 2024). We further use POPS profiles from Lhasa and Boulder to evaluate the simulated plume evolution over the Northern Hemisphere. In particular, Boulder serves as an independent site outside the ASMA region to evaluate plume transport. In situ UTLS observations of volcanic aerosol are rare, particularly for the 2019 Raikoke eruption. Here we combine balloon-borne COBALD and POPS profiles with high-resolution ERA5-driven CLaMS backward trajectories and global three-dimensional SO2-based tracer simulations to identify transport of the Raikoke plume through the Northern Hemisphere and into the ASMA, with particular attention to transport pathways and time scales. Specifically, we address the following research questions: (1) What are the key transport pathways of the Raikoke plume in the vicinity of the ASMA? (2) Which processes dominate plume dilution? In addition, we quantify the sensitivity of the simulations to key model settings (parameterized mixing intensity, injection height, and injection region).
The remainder of the paper is organized as follows: Sect. 2 describes data and methods; Sect. 3 presents balloon observations from Lhasa and Boulder; Sect. 4 reports the backward-trajectory analysis and global CLaMS transport simulations; Sect. 5 discusses modelling sensitivities, including sensitivities to parameterized mixing, injection-region definition, and injection height; Sect. 6 concludes; and Appendix A presents supplementary material.
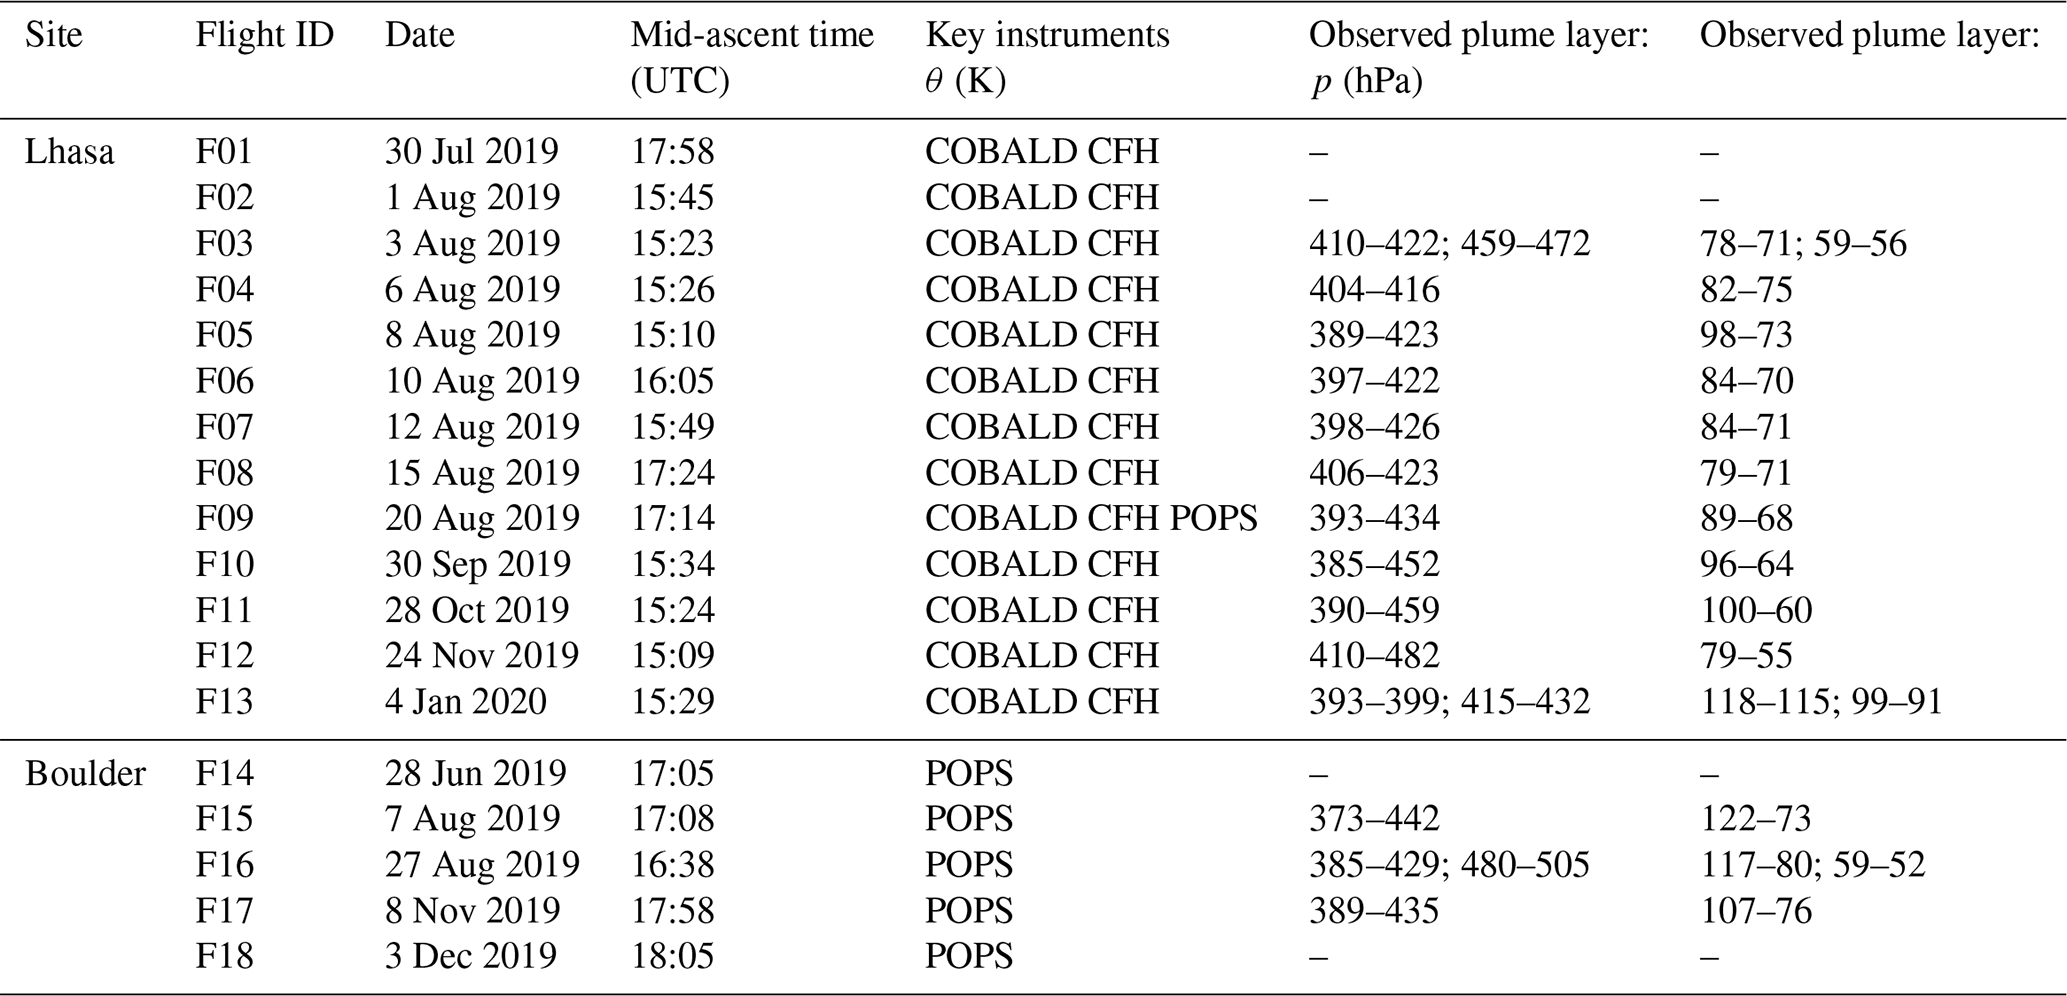
Table 1Summary of analyzed balloon flights at Lhasa and Boulder, including sequential flight ID, date, mid-ascent time (UTC), key instruments used in this study, and the potential temperature (θ) and pressure (p) ranges of the observed volcanic plume layer. The plume layer was identified from COBALD measurements where BSR455 > 1.1 and CI > 6, and from POPS measurements where the particle number concentration exceeded 150 cm−3. Mid-ascent time denotes the midpoint of the ascent period from launch to balloon burst. The “Key instruments” column lists only the instruments analyzed in this work; additional payload components were flown but are not listed here. A dash (–) denotes that no volcanic plume layer was identified for that flight.
2.1 Balloon-borne Instruments
Volcanic aerosol profiles at Lhasa were obtained during the 2019 Asian Summer Monsoon (ASM) season as part of the Sounding Water Vapor, Ozone, and Particles (SWOP) campaign. The SWOP campaign was led by the Institute of Atmospheric Physics, Chinese Academy of Sciences. Balloons were equipped with an electrochemical concentration cell (ECC) ozonesonde, a cryogenic frostpoint hygrometer (CFH), a compact optical backscatter aerosol detector (COBALD), and an International Met Systems (InterMet) iMet-1-RSB radiosonde (GRUAN Lead Centre, 2025). However, ECC ozone measurements are not analyzed in this study. A total of 9 measurements occurred in July–August (1 in July, 8 in August), followed by monthly measurements through January 2020. On 20 August 2019, the payload also included a Portable Optical Particle Spectrometer (POPS). During July–August 2019, Lhasa lay within the interior of the ASMA at UTLS levels (Fig. 1a). The site was chosen to observe the Raikoke plume in the ASMA interior and to document its arrival and vertical evolution. Additional information on SWOP field activities and on campaigns conducted in other years is available in Bian et al. (2012); Li et al. (2017, 2018, 2020); Ma et al. (2022); Yang et al. (2023).
The POPS data over Boulder were provided by the Baseline Balloon Stratospheric Aerosol Profiles (B2SAP) project; we analyze five profiles – 3 influenced by the Raikoke eruption (2 in August 2019 and 1 in November 2019) and 2 background references on 28 June 2019 and 3 December 2019 (Todt et al., 2023).
Figure 1a shows the geographic locations of Raikoke volcano and the balloon-sounding sites at Lhasa and Boulder. An overview of the analyzed balloon flights at Lhasa and Boulder, including the identified plume-layer ranges, is provided in Table 1.
The Compact Optical Backscatter Aerosol Detector (COBALD) was developed by ETH Zurich (Brabec et al., 2012). Its lightweight and portable design makes it suitable for balloon payloads used in the study of cirrus clouds (Brabec et al., 2012; Cirisan et al., 2014; Reinares Martínez et al., 2021; Yang et al., 2023) and aerosols (Vernier et al., 2015; Brunamonti et al., 2018; Hanumanthu et al., 2020). COBALD uses two high-power LEDs emitting at 455 nm (blue) and 940 nm (near‑infrared). It measures backscattered light from air molecules and particles, including aerosols and cloud particles (e.g. ice crystals). The backscatter ratio (BSR) is defined as
where βair is the backscatter coefficient of air molecules and βparticles is the backscatter coefficient of aerosols or cloud particles. The instrument measures only the total backscatter (); βair is calculated in post-processing from Rayleigh scattering using the measured pressure and temperature profiles, and βparticles is obtained as βtotal−βair. Here, BSR455 represents the backscatter ratio at 455 nm. The instrument's field of view is ± 6°, and its detection range spans 0.5–10 m. Because sunlight severely interferes with the measurements, COBALD is only operated at night. COBALD BSR uncertainty is typically characterized by an absolute error interval of about ∼ 5 % for the profile, while the precision is better than ∼ 1 % under UTLS conditions (Vernier et al., 2015; Brunamonti et al., 2021; Reinares Martínez et al., 2021).
The COBALD color index (CI) is defined as
which serves as an empirical proxy for particle size within aerosol layers. Note that when BSR455 and BSR940 are close to 1, CI can become sensitive to small baseline or calibration offsets.
The Cryogenic Frostpoint Hygrometer (CFH) is a high‐precision instrument for measuring water vapor based on the chilled mirror principle. It controls the mirror temperature to maintain a stable frost- or dew-point. Combined with temperature and pressure data from the iMet radiosonde, the relative humidity over ice (RHice) is calculated using the empirical equation from Murphy and Koop (2005):
where eice(T) is the saturation vapour pressure over ice at temperature T (in Kelvin), Tmirror is the measured frost-point temperature, and Tenvironment is the ambient air temperature. CFH uncertainties may be as low as ∼ 2 % in the lower troposphere and ∼ 5 % near the tropical tropopause under good operating conditions (Vömel et al., 2016). For UTLS conditions we use a conservative uncertainty of ± 10 % (Fahey et al., 2014; Poltera et al., 2025).
The Portable Optical Particle Spectrometer (POPS) is a lightweight instrument for measuring aerosol number density and size distribution (Gao et al., 2016). POPS employs a 405 nm laser to detect light scattered by individual particles, with scattering intensity related to particle size. It measures particles from 140 to 2500 nm and reports number concentrations in size bins (Todt et al., 2023). Measurement uncertainties are dominated by particle sizing (including sensitivity to the assumed refractive index) and flow-rate calibration (Gao et al., 2016).
2.2 TROPOMI
TROPOMI, the satellite instrument aboard ESA's sun-synchronous Sentinel-5P platform launched in 2017, is a hyperspectral imaging spectrometer that records back-scattered radiation from the ultraviolet to the shortwave infrared (Veefkind et al., 2012). Total-column SO2 in Dobson units (1 DU = 2.69 × 10¹⁶ ) is retrieved using differential optical absorption spectroscopy (DOAS) applied to three wavelength windows (312–326, 325–335, 360–390 nm) (Theys et al., 2017, 2024). The publicly available Level 2 product provides four vertical columns: the surface–to–top-of-atmosphere column and three columns assuming an SO2 plume centered at 1, 7, or 15 km altitude. Following previous Raikoke studies (Muser et al., 2020; de Leeuw et al., 2021; Cai et al., 2022), we adopt the 15 km retrieval, which most closely matches the eruption's mean injection height; values below the instrument's 0.3 DU detection limit are excluded, following Theys et al. (2024). Four consecutive TROPOMI overpasses of the SO2 vertical column density at 15 km altitude captured the entire Raikoke SO2 cloud between 22:46 UTC on 24 June and 03:50 UTC on 25 June 2019 (Fig. 1b).
2.3 CLaMS
The Chemical Lagrangian Model of the Stratosphere (CLaMS) is a chemistry–transport model that calculates the three-dimensional motion of air parcels, which in turn represent the model grid (McKenna et al., 2002; Pommrich et al., 2014). The CLaMS hybrid vertical coordinate (ζ) follows orography near the surface and transitions smoothly into θ once σ = reaches 0.3 (usually about 300 hPa) (Pommrich et al., 2014). The isentropic coordinate in CLaMS is well suited for representing transport and mixing in the stratosphere. All CLaMS applications in this study – both backward trajectories and three-dimensional simulations with SO2-based tracers – are driven by ERA5 reanalysis: the standard runs use the native hourly fields on the 0.3° × 0.3° (latitude × longitude) grid with 137 vertical levels up to 80 km (Hersbach et al., 2020), whereas the sensitivity experiment in Appendix Fig. A2 repeats the simulation with ERA5 fields at 1° × 1° spatial and 6 h temporal resolution.
Diabatic backward trajectories are initialized every second along the balloon's vertical ascent profile, using the in-situ measurements of temperature (for deriving potential temperature), pressure, time, longitude, and latitude to define the start positions. Vertical velocities were computed from ERA5 wind fields and total diabatic heating rates, including clear-sky and cloud radiation, latent heat release, and turbulent and diffusive transport (Ploeger et al., 2021). This approach captures uplifts by resolved convection as represented in ERA5 (Li et al., 2020; Clemens et al., 2024; Vogel et al., 2024). To identify the volcanic influence, only those backward trajectories that passed through the Raikoke eruption region (Fig. 1b) during 22:46 UTC on 24 June and 03:50 UTC on 25 June 2019 were retained.
Global three-dimensional transport simulations use passive SO2-based tracers initialized from the horizontal extent of the Raikoke SO2 cloud in the TROPOMI 15 km product (Fig. 1b; four overpasses between 22:46 UTC on 24 June and 03:50 UTC on 25 June 2019; values ≥ 0.3 DU) (Theys et al., 2024). At 00:00 UTC on 25 June 2019, parcels inside this mask are initialized to 1 (0 outside) within 3 potential-temperature ranges (380–400, 400–420, and 420–440 K) and then advected and mixed globally, yielding tracer fractions between 0 and 1.
Table 2Summary of tracer simulations using different injection-region definitions (satellite SO2 plume mask and a rectangular domain), including injection layer, mixing interval, and critical Lyapunov exponent (λc).
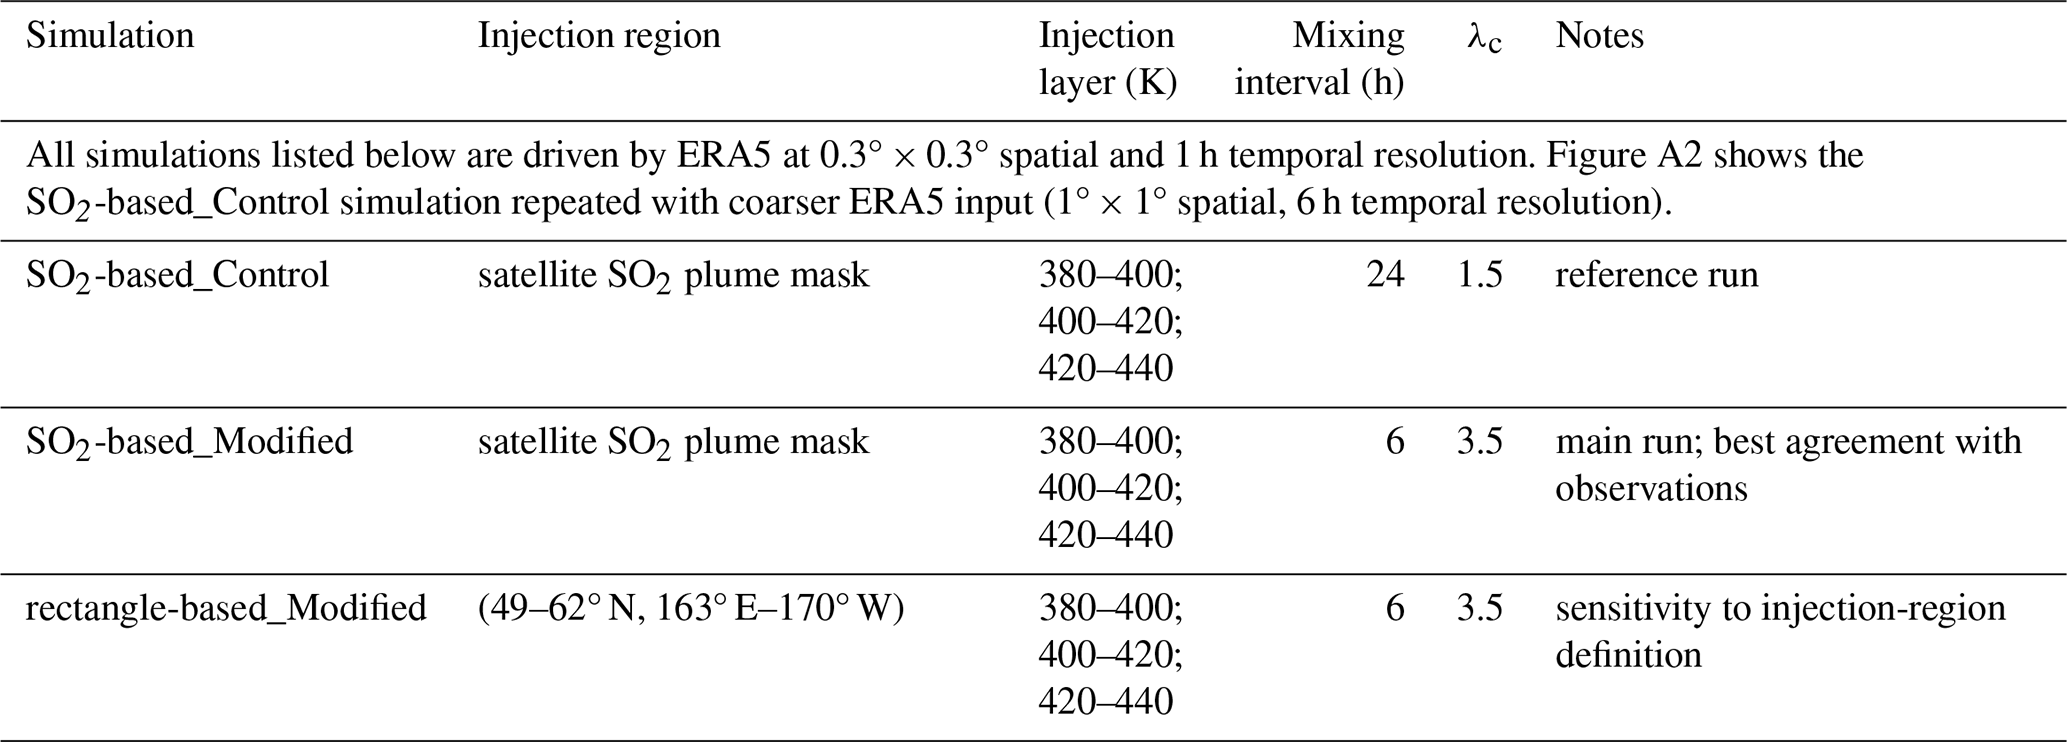
To assess how different mixing intensities influence the reconstruction of volcanic plume transport processes, two simulations were conducted: (i) a control simulation with mixing every 24 h and λc=1.5 (a commonly used set-up for CLaMS simulations driven by high-resolution ERA5 reanalysis data; Vogel et al., 2025); (ii) a modified simulation with mixing every 6 h and λc=3.5. In the CLaMS mixing scheme, parameterized mixing is triggered when the integral deformation between neighboring air parcels exceeds an empirical critical deformation γc=λcΔt, where λc is the critical Lyapunov exponent and Δt is the advective time step (mixing interval). For a given Δt, a larger λc (thus a larger γc) requires stronger deformation to trigger mixing and therefore corresponds to less frequent parameterized mixing (and vice versa) (Konopka et al., 2004, 2007). In our setup, the modified simulation corresponds to enhanced parameterized mixing compared to the control simulation. Throughout most of the paper we show results from the modified simulation, as these agree better with the observations. Sensitivity to parameterized mixing intensity and comparisons with the control simulation are discussed in Sect. 5.1. The mixing configurations and the additional sensitivity runs (rectangular mask and coarser ERA5 input) are summarized in Table 2.
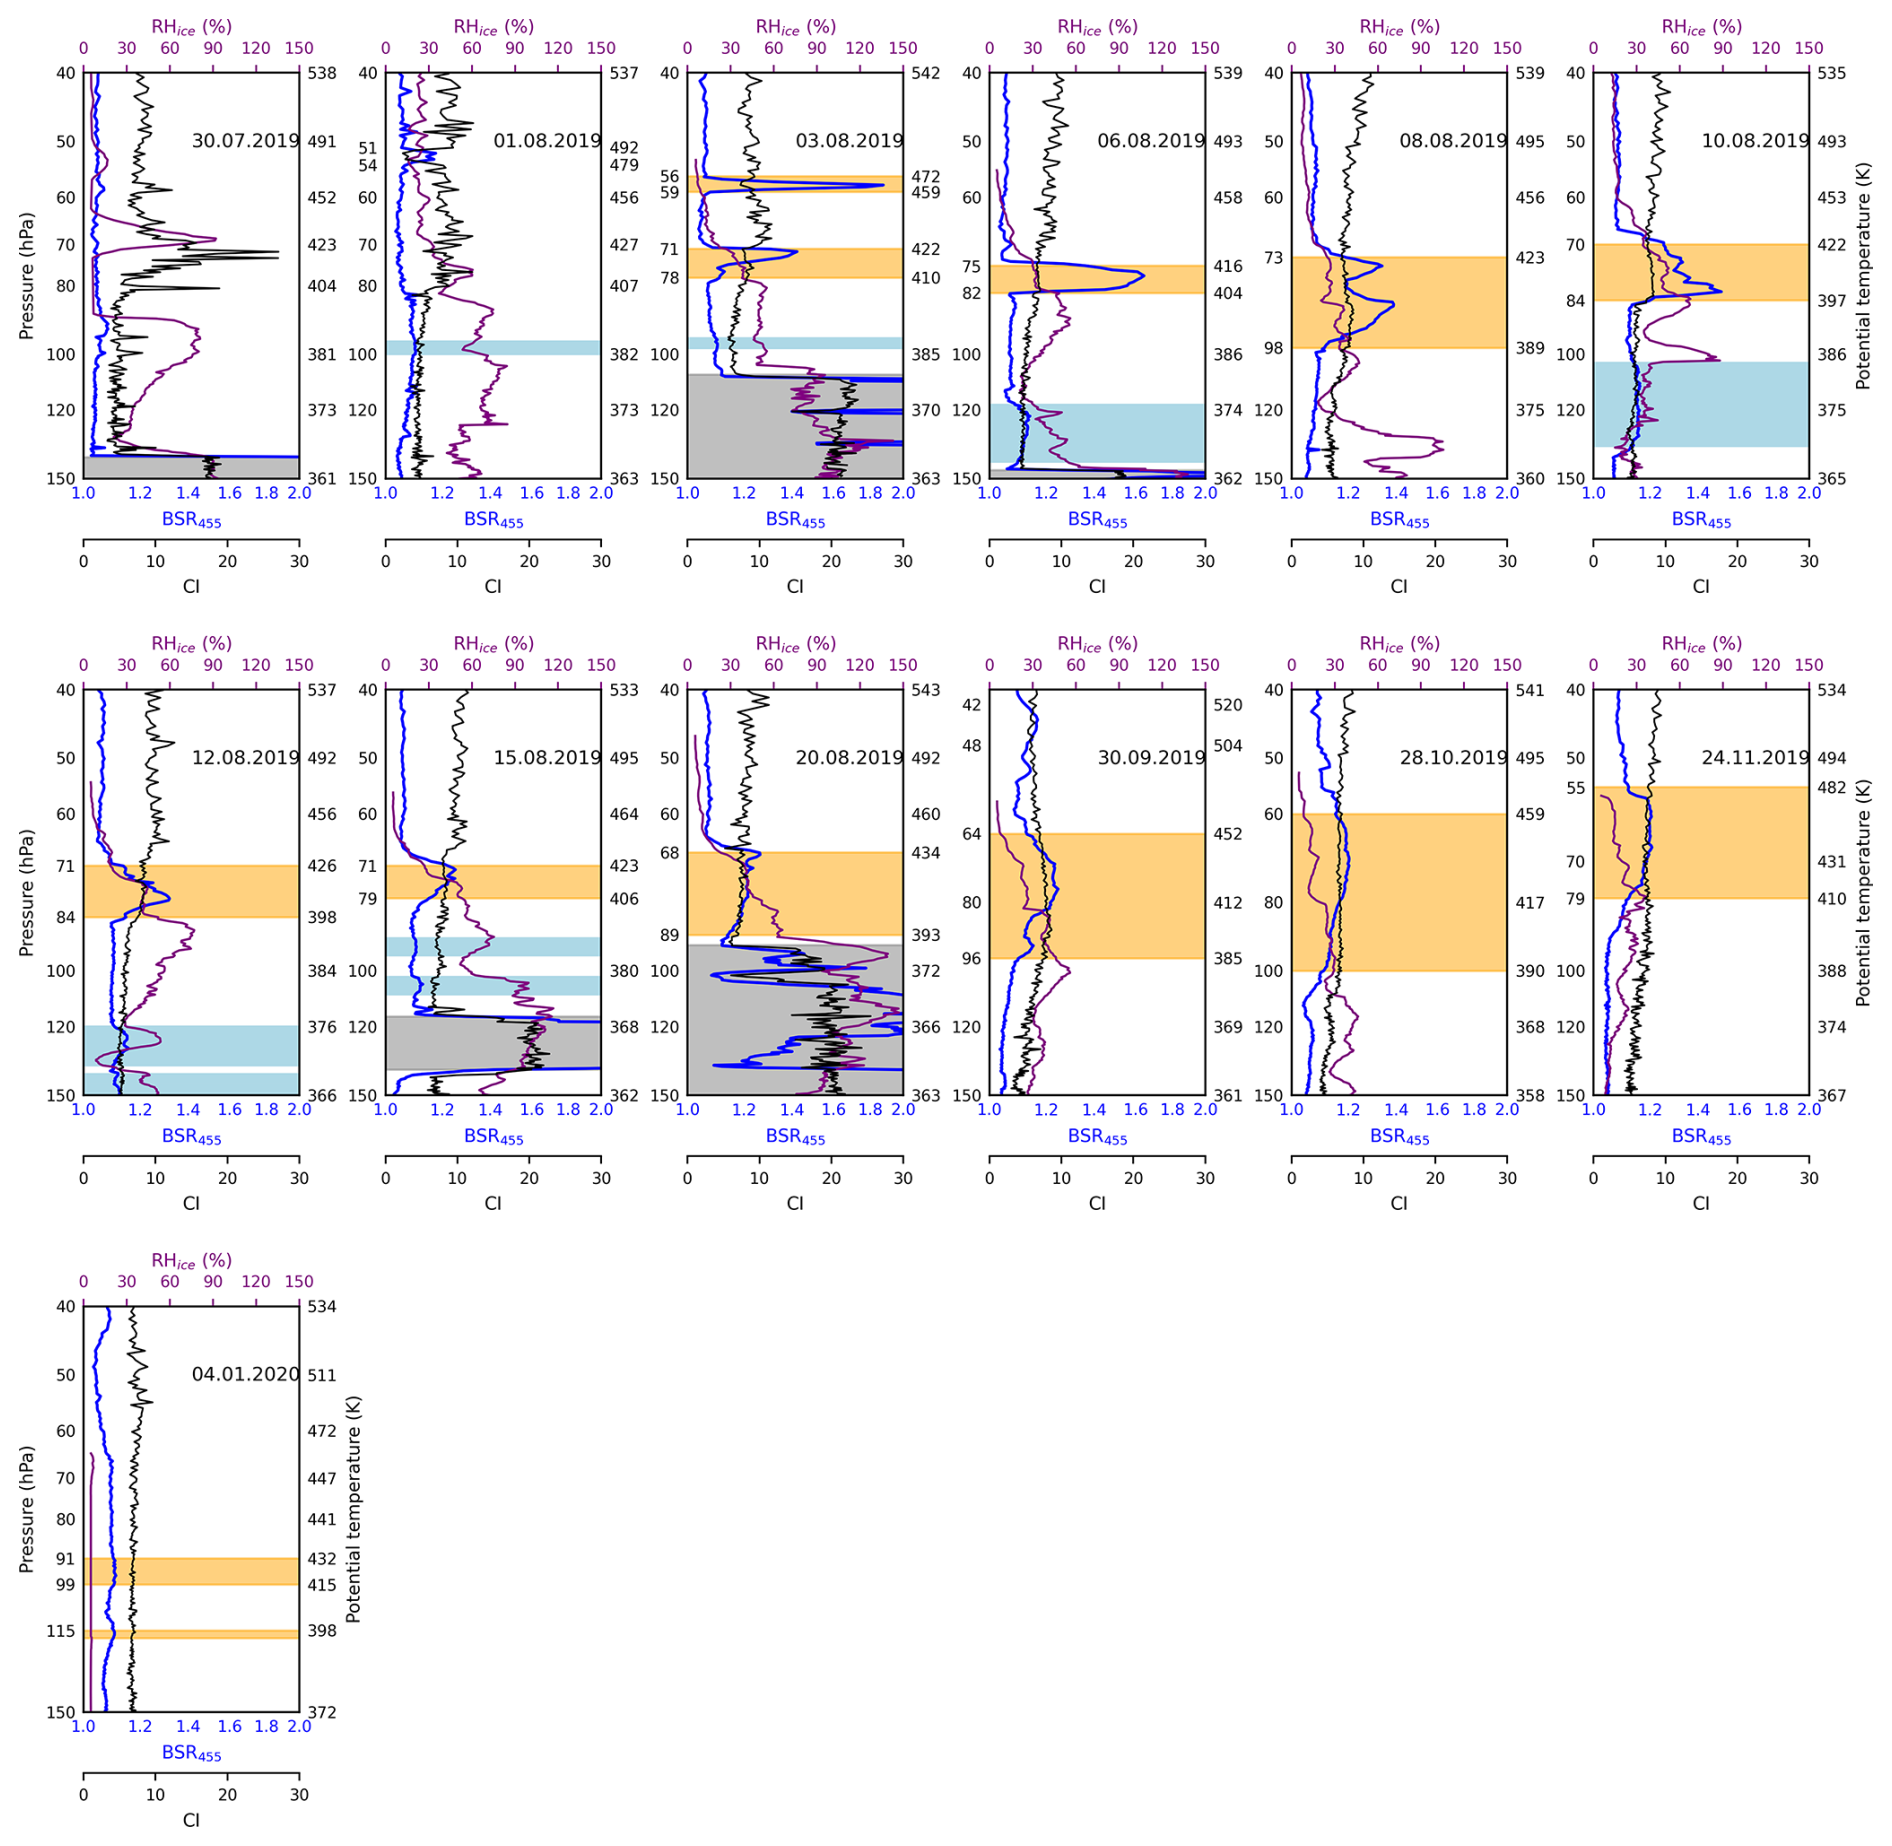
Figure 2COBALD and CFH profiles above Lhasa from 30 July 2019 to 4 January 2020. COBALD backscatter ratio at 455 nm (BSR455, blue) and COBALD color index (CI, black) are shown together with CFH relative humidity over ice (RHice, magenta). Pressure is given on the left axis and the corresponding potential temperature on the right axis. Orange shading marks the Raikoke influenced aerosol layers used to initialize the backward trajectories. Light blue shading indicates lower altitude aerosol enhancements attributed to ATAL that are not used for the plume initialization. Gray shading indicates cirrus conditions.
The COBALD–CFH tandem provides a practical method for identifying cirrus clouds and aerosol layers because collocated backscatter and frost-point humidity measurements allow a straightforward separation of ice-cloud signatures from aerosol enhancements (Brabec et al., 2012; Cirisan et al., 2014; Reinares Martínez et al., 2021; Yang et al., 2023). Cirrus clouds are identified using the criteria BSR455>1.2, RHice > 70 % and CI > 7 (Vernier et al., 2015; Brunamonti et al., 2018; Hanumanthu et al., 2020; Yang et al., 2023). These clouds are shown as gray-shaded regions in Fig. 2. On 30 July 2019, RHice reached ∼ 90 % at 423 K (70 hPa), but no corresponding enhancement in BSR455 was observed; thus, this layer is not classified as cirrus by our joint criterion and likely represents a moist, ice-free layer. When cirrus and aerosols occur within the same profile, aerosol and cloud signals can generally be separated if they are vertically distinct (e.g., using BSR and CI), whereas if a cirrus cloud overlaps the aerosol layer at the same altitude, the aerosol contribution cannot be reliably isolated because cirrus BSR455 typically dominates. Thus, the aerosol cannot be reliably detected or quantified under such conditions. Using these criteria, we exclude cirrus-contaminated layers. Remaining enhancements with BSR455>1.1 are treated as aerosol layers and then classified using a CI threshold of 6: layers attributed to the Raikoke plume (CI > 6) are highlighted in orange in Fig. 2, while layers more consistent with ATAL aerosol (CI < 6) are highlighted in light blue. We note that CI is used here as an additional indicator within aerosol layers and should be interpreted with caution, and that the ATAL identification in our dataset is limited. In very clean air where BSR values at both wavelengths approach 1, CI can become unstable; we therefore apply CI only within aerosol layers with BSR455>1.1 after excluding cirrus. On 3 August 2019, 42 d after the Raikoke eruption, two distinct BSR455 peaks were observed: the upper peak at 459–472 K (59–56 hPa) reached the maximum value recorded in Lhasa (∼ 1.8), and the lower peak at 410–422 K (78–71 hPa) had a somewhat weaker magnitude (∼ 1.4). On 6 August 2019, another sharp peak appeared at 404–416 K (82–75 hPa). After 8 August 2019, the peaks became less sharp and more vertically extended, which persisted until 24 November 2019. By 4 January 2020, the aerosol backscatter enhancement had further weakened, and no distinct peak was observed in the profile.
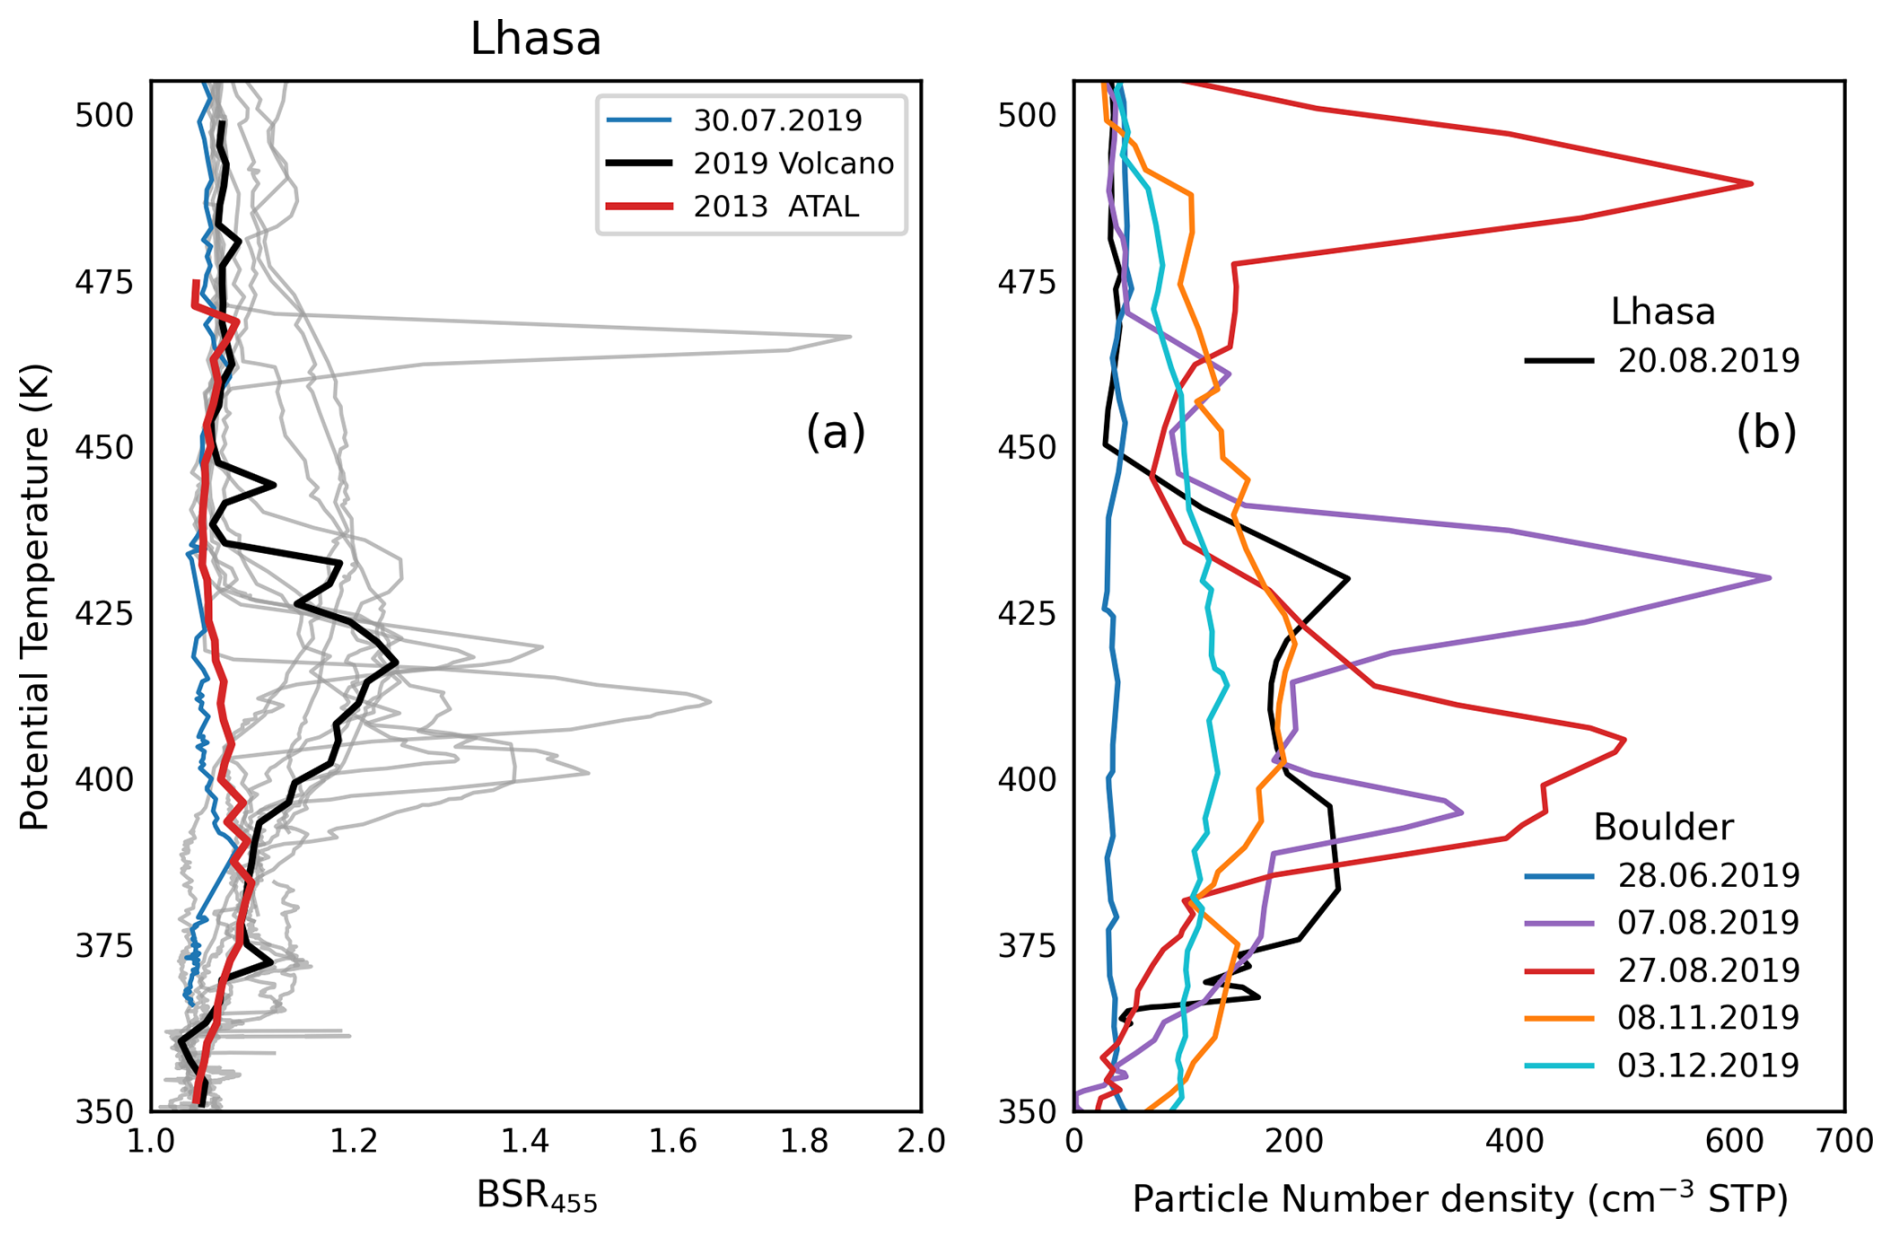
Figure 3(a) COBALD measurements in Lhasa. The black line represents the median BSR455 for the 2019 profiles influenced by the volcanic event, and the gray lines show the corresponding individual profiles. The red line shows the median BSR455 during the ATAL in 2013. The blue line corresponds to the BSR455 on 30 July 2019, which was not affected by the Raikoke eruption. (b) POPS measurements in Boulder and Lhasa.
In general, ATAL-related enhancements in COBALD BSR455 profiles are largely confined to 360–400 K (core near 370–390 K), with occasional extensions up to 420–440 K depending on region and year (Vernier et al., 2015, 2018; Appel et al., 2022). The ATAL profile from 2013 shown in Fig. 3a is taken from the COBALD measurements over Lhasa reported by Vernier et al. (2015). The 2019 median peak occurs near 417 K, about 33 K above the 2013 ATAL peak (384 K), corresponding to roughly 1.7 km in altitude in the UTLS (based on the 30 July 2019 background sounding). The vertical extent of ATAL enhancements varies across regions and years; therefore, we emphasize the peak magnitude as the more robust difference: the 2019 Raikoke-related median BSR455 reaches ∼ 1.25, exceeding the 2013 ATAL peak (∼ 1.10; Fig. 3a).
All POPS particle number densities are converted to standard temperature and pressure (STP; 1013 hPa, 273.15 K) to remove the pressure-driven decline with altitude (Fig. 3b). At Boulder, no clear volcanic aerosol signal was present on 28 June 2019, and by 3 December 2019 the profile shows no obvious volcanic aerosol peak (Fig. 3b). The particle number density at Lhasa on 20 August 2019 was lower than that at Boulder on 7 and 27 August 2019. This is consistent with the global CLaMS tracer simulations (Sect. 4.2; cf. Figs. 7 and 8), which show that the main Raikoke plume is transported along the subtropical westerly jet in the mid-latitude UTLS, while transport into the ASMA interior is more limited due to the anticyclone acting as a partial horizontal barrier. Section 4 presents backward-trajectory calculations and three-dimensional tracer simulations with CLaMS to verify the origin and transport pathways of the plume observed over Lhasa and Boulder.
4.1 Backward-Trajectory Calculations
To verify that the enhanced aerosol layers observed over Lhasa are linked to the Raikoke eruption, we calculated ERA5-driven diabatic backward trajectories with CLaMS (Fig. 4). Trajectories were released every second along each balloon ascent within the selected plume-layer potential-temperature intervals (orange shading in Fig. 2), using the iMet-derived time and location (longitude, latitude, pressure, and temperature) as initial conditions. All trajectories were calculated backward to a single common reference time (21 June 2019, 18:00 UTC), which serves as the trajectory endpoint for all cases.
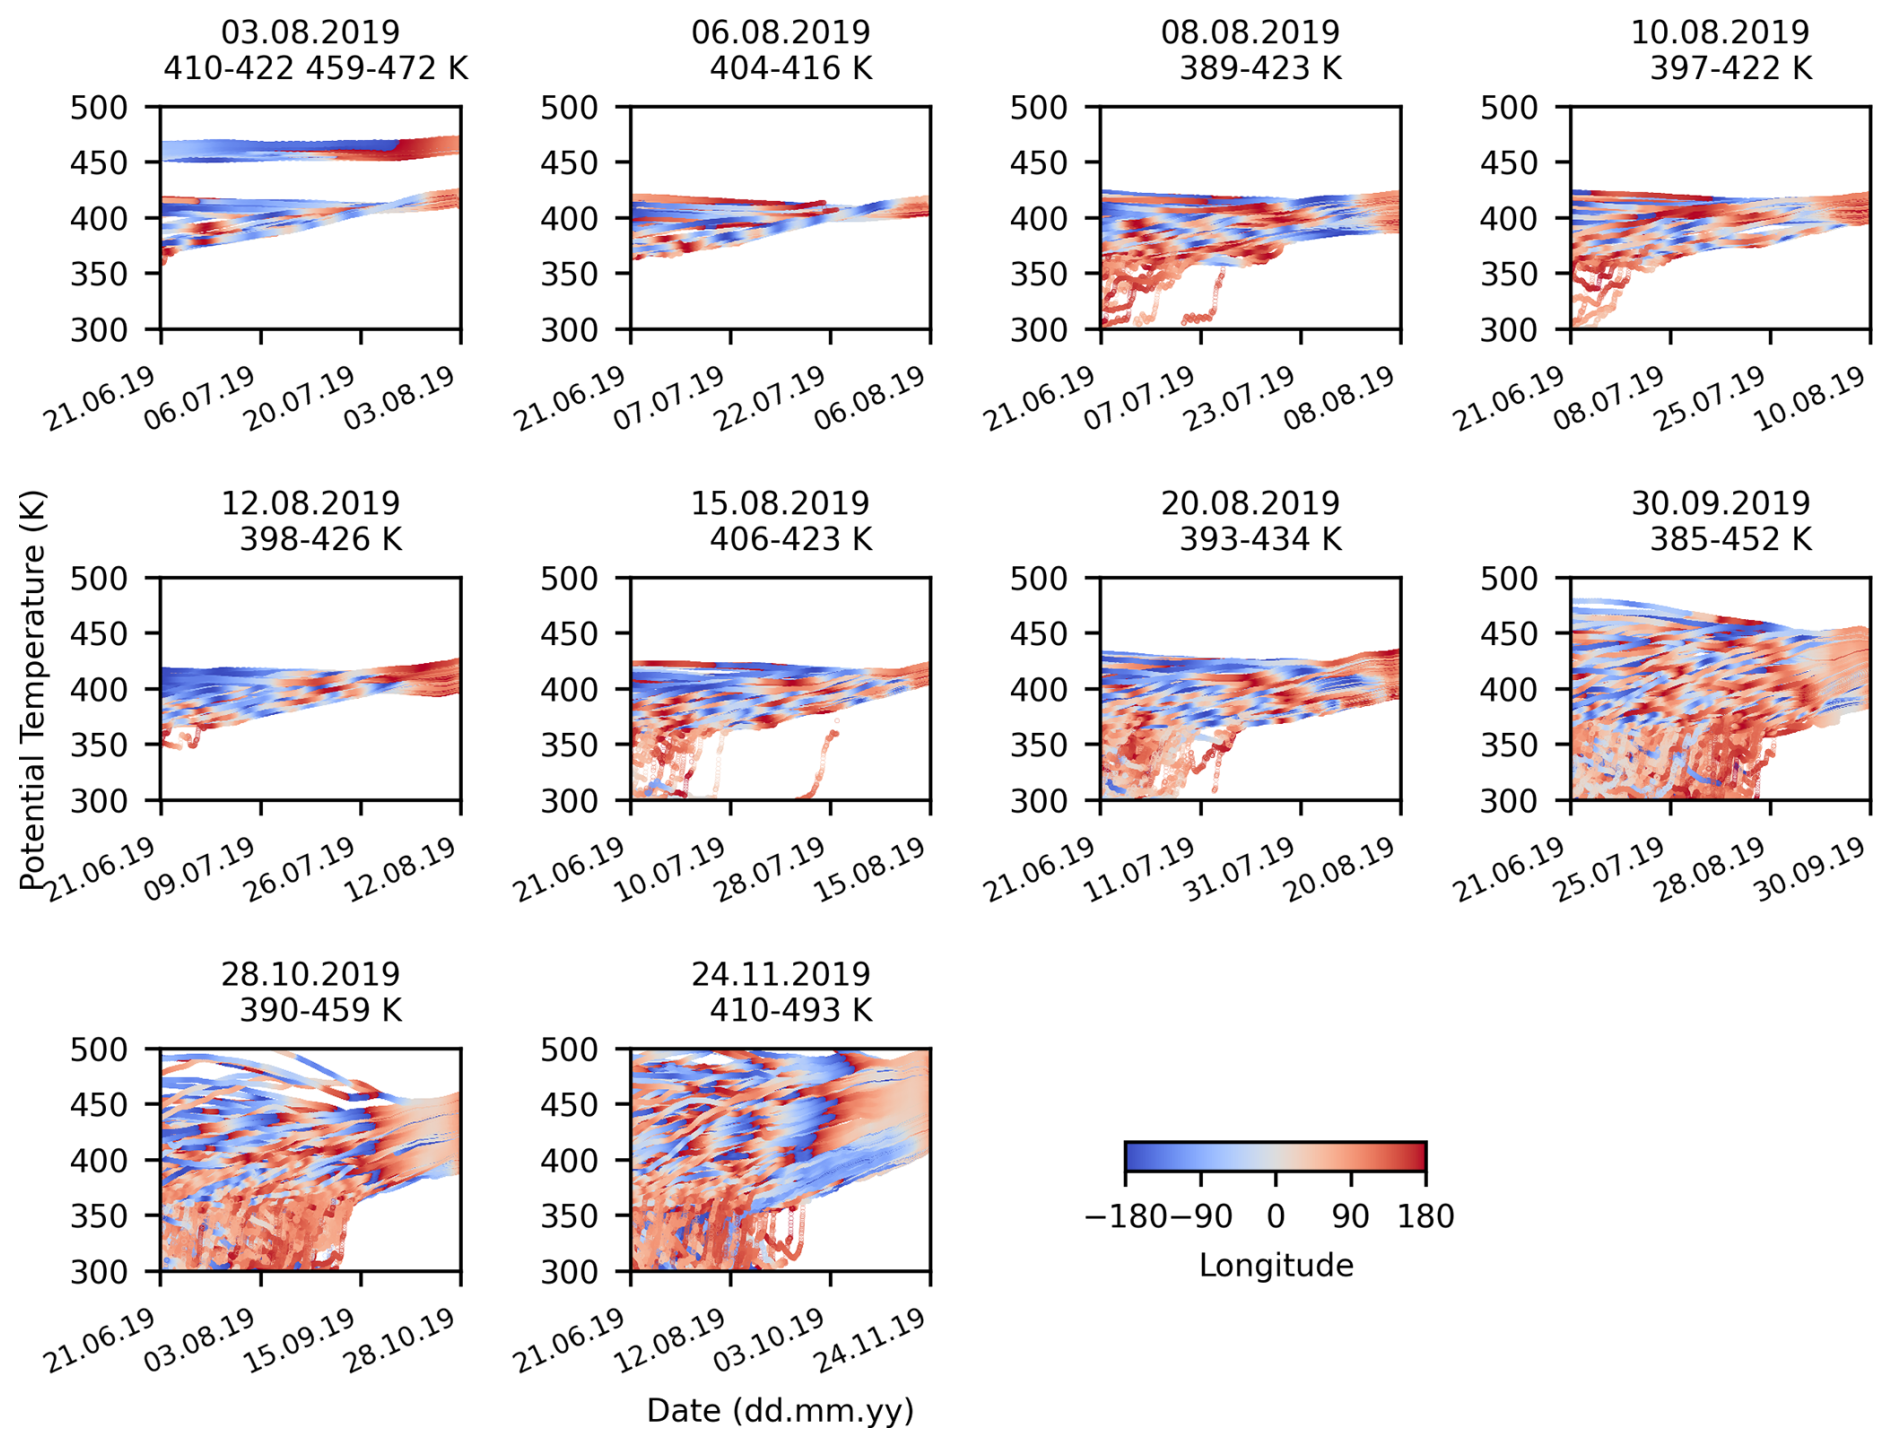
Figure 4Backward trajectories initialized from the Lhasa balloon observations and traced back to the Raikoke eruption reference time (21 June 2019, 18:00 UTC). Only trajectories initialized within the enhanced BSR455 potential-temperature range (orange shading in Fig. 2) are shown. Colors indicate trajectory longitude. The x-axis shows date (dd.mm.yy) along the backward integration (right: balloon initialization time; left: eruption reference time).
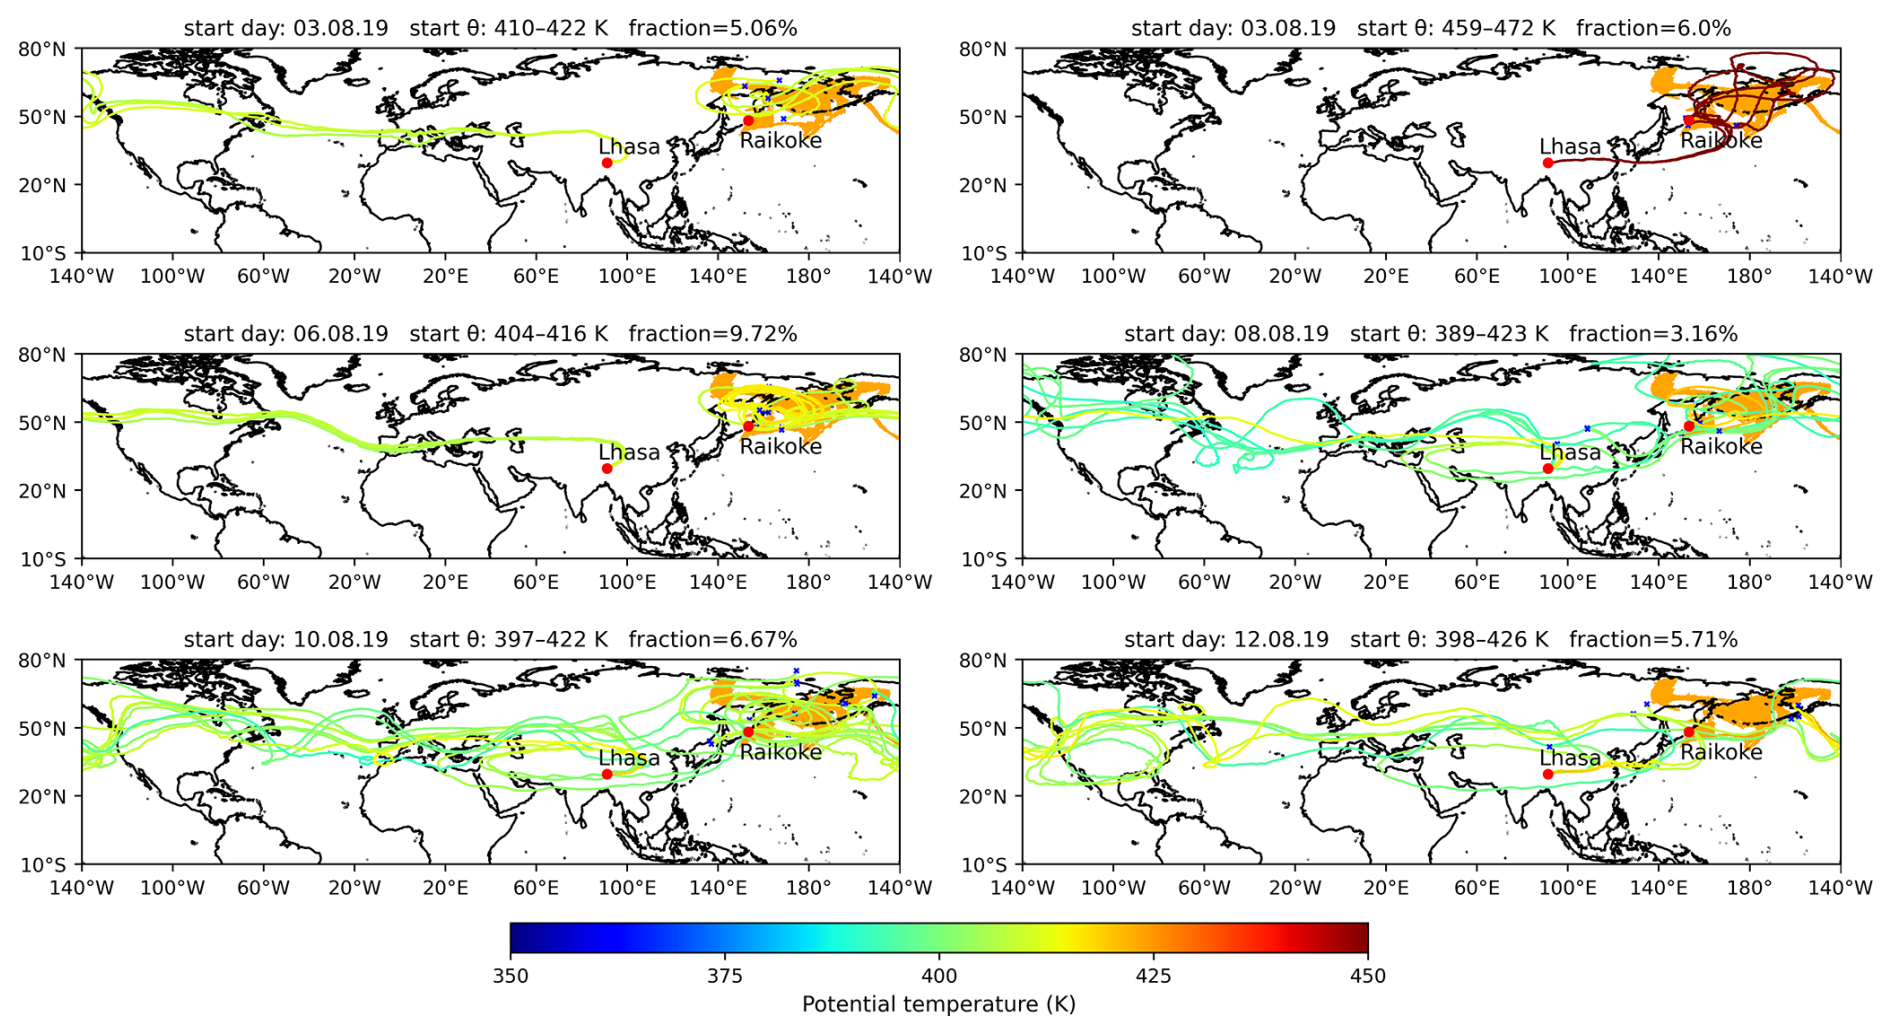
Figure 5Backward trajectories for the Lhasa flights (3, 6, 8, 10, and 12 August 2019). Only trajectories that intersect the TROPOMI SO2 mask between 24 June 2019, 22:46 UTC and 25 June 2019, 03:50 UTC are shown. Trajectories are colored by potential temperature, and the SO2 mask is shaded in orange. Panel titles give the start day, start θ range, and the fraction of trajectories that satisfy the SO2 mask criterion. Locations of Lhasa and Raikoke are marked.
Pronounced BSR455 peaks were observed over Lhasa on 3 and 6 August 2019 (Fig. 2). For the upper layer on 3 August 2019, backward trajectories indicate that the air parcels were transported approximately along isentropic surfaces (Fig. 4). By contrast, the lower layer on 3 August 2019 includes trajectories lofted from ∼ 370 to ∼ 410 K. In the upper layer on 3 August 2019, the transport pathways differed significantly from other layers, as evidenced by changes in longitude (see Fig. 5 for trajectory details). This suggests that the enhanced BSR455 resulted from volcanic aerosols originating from two distinct branches of the volcanic plume at different altitudes, each following a different transport pathway. From 8–20 August 2019, mixing from lower potential-temperature levels began to occur. This coincided with a decrease in BSR455 values in the in-situ measurements, as air with relatively low aerosol concentrations dilutes the enhanced signals. Over the following three months, as the ASMA weakened seasonally, air from lower potential-temperature levels increasingly influenced the Lhasa profiles. During this period, peak BSR455 within the identified plume layer (orange shading in Fig. 2) decreased from values up to 1.88 in early August 2019 (95th percentile up to 1.77) to ≤ 1.25 from 30 September to 24 November 2019 (95th percentile ≤ 1.24), indicating progressive dilution of the volcanic aerosol layer by relatively aerosol-poor air from the lower troposphere.
To illustrate air masses influenced by the Raikoke eruption, we filtered backward trajectories to include only those passing through the eruption region (Fig. 1b) between 22:46 UTC on 24 June 2019 and 03:50 UTC on 25 June 2019. We then examined several representative pathways to show how the volcanic plume entered the ASMA interior (Fig. 5). In Fig. 5, the reported fraction is defined as (number of trajectories that meet the eruption-region criterion)/(total number of backward trajectories initialized for the corresponding flight date and θ layer shown in Fig. 4). For the 6 cases shown in Fig. 5, the total numbers of initialized trajectories are 79 and 50 (3 August 2019, two θ layers), 72 (6 August 2019), 190 (8 August 2019), 165 (10 August 2019), and 105 (12 August 2019). Because this filtering criterion is highly selective, only a small fraction of trajectories remains, and the resulting fractions can be regarded as conservative estimates. A sensitivity test shows that the fraction of backward trajectories reaching the eruption region is ∼ 3 %–10 % when using the original TROPOMI SO2 footprint and satellite-pass time window, but increases to ∼ 12 %–28 % when applying a broader rectangular domain (42–73° N, 137–215° E) and extending the time window to 7 d. The retained trajectories still follow the same main transport pathways shown here, providing confidence in the identified transport patterns.
For the calculation on 3 August 2019, the trajectories are divided into two distinct branches. The trajectories in the lower branch originate from 410–422 K and correspond to the main volcanic aerosol plume carried by the subtropical westerly jet. The upper branch originates from 459–472 K. Satellite observations from TROPOMI on Sentinel-5P indicate that the VVP core was entrained into the summertime easterlies around 20–25 July (Gorkavyi et al., 2021; Khaykin et al., 2022). The backward trajectories initialized in the 3 August 2019 plume layer (459–472 K) in Fig. 5 are consistent with the late-July phase of this satellite-tracked pathway. The potential temperature of the VVP during its transit through the ASMA inferred from satellite detections also closely matches the altitudes of enhanced BSR455 (Gorkavyi et al., 2021; Khaykin et al., 2022). Meanwhile, lidar measurements in Wuhan (central China) on 30 July reveal that the VVP's core backscatter coefficient is much greater than that of the main aerosol plume (Jing et al., 2023; He et al., 2024), implying that our measurements in this branch captured only the trailing filament of the VVP. Although both sets of air parcels belong to the same balloon profile, they trace back to two distinct plume components: the lower-θ main plume in the subtropical westerly jet (∼ 410–422 K) and the higher-θ VVP filament in the summertime easterlies (∼ 459–472 K). This indicates different source altitudes within the Raikoke plume and distinct dynamical transport pathways.
From 6 to 20 August 2019, the overall transport pattern remained similar to that on 6 August 2019 – corresponding to the main volcanic aerosol plume primarily driven by the subtropical westerly jet. After entering the ASMA, some air parcels deviate from the jet pathway and circulate within the anticyclonic region. This increased spreading of trajectories suggests dispersion and lateral mixing with surrounding air, which may contribute to the observed decrease in BSR455.
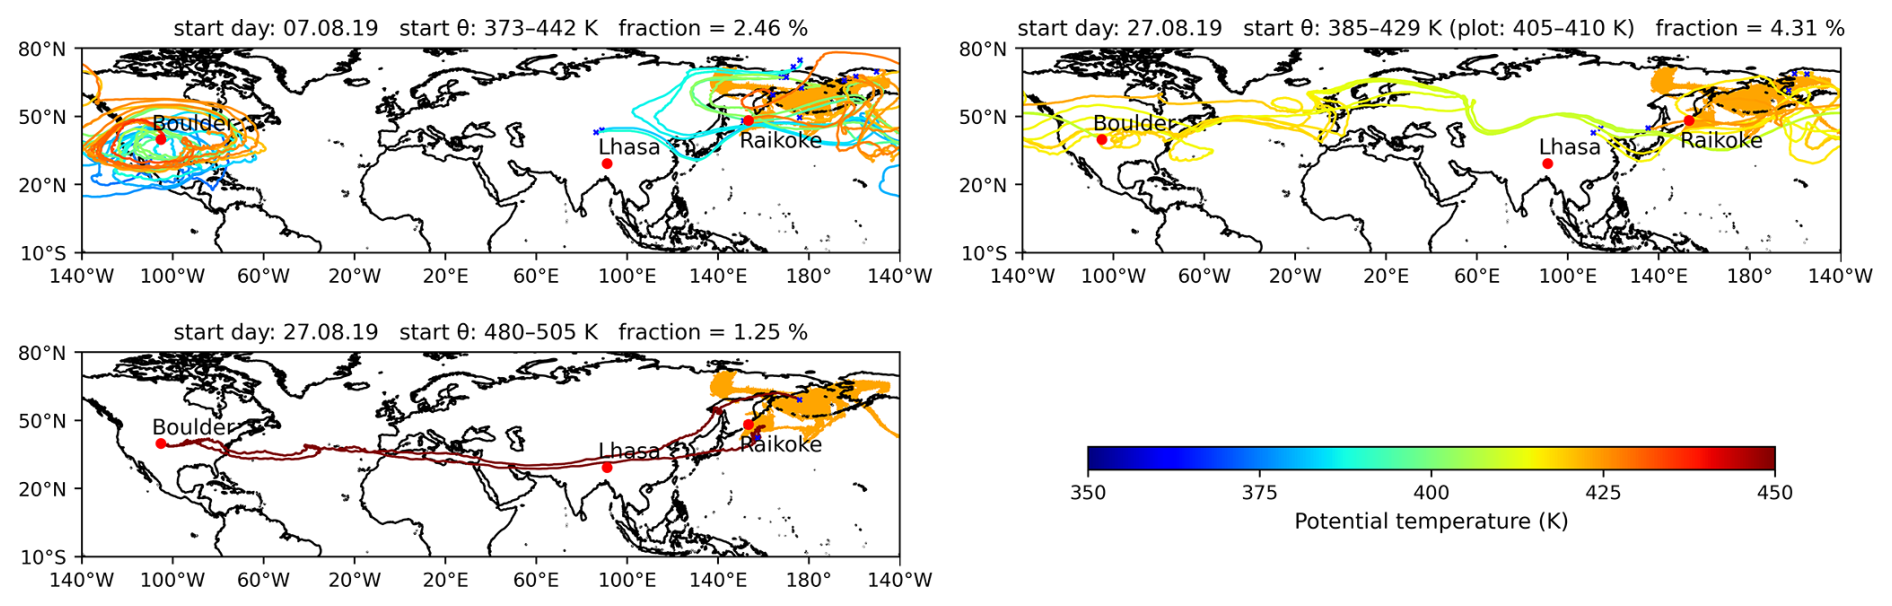
Figure 6Same as Fig. 5, but for the Boulder flights (7 and 27 August 2019). For 27 August 2019, the fraction is computed for 385–429 K, while the plotted trajectories are restricted to 405–410 K to better illustrate the transport pathways. Locations of Boulder, Lhasa, and Raikoke are marked.
Backward trajectories for the Boulder flights on 7 and 27 August 2019 are shown in Fig. 6. On 7 August 2019, an enhanced aerosol layer is observed between 373 and 442 K (particle number concentration > 150 cm−3). The corresponding backward trajectories indicate transport to Boulder primarily along the subtropical westerly jet. On 27 August 2019, two volcanic layers are present. The upper layer (480–505 K) is associated with the VVP filament transported in summertime easterlies. The lower layer occurs at 385–429 K. To better illustrate the transport pathway, we plot only trajectories initialized between 405 and 410 K. These trajectories indicate that the plume had already traveled once around the globe before reaching Boulder.
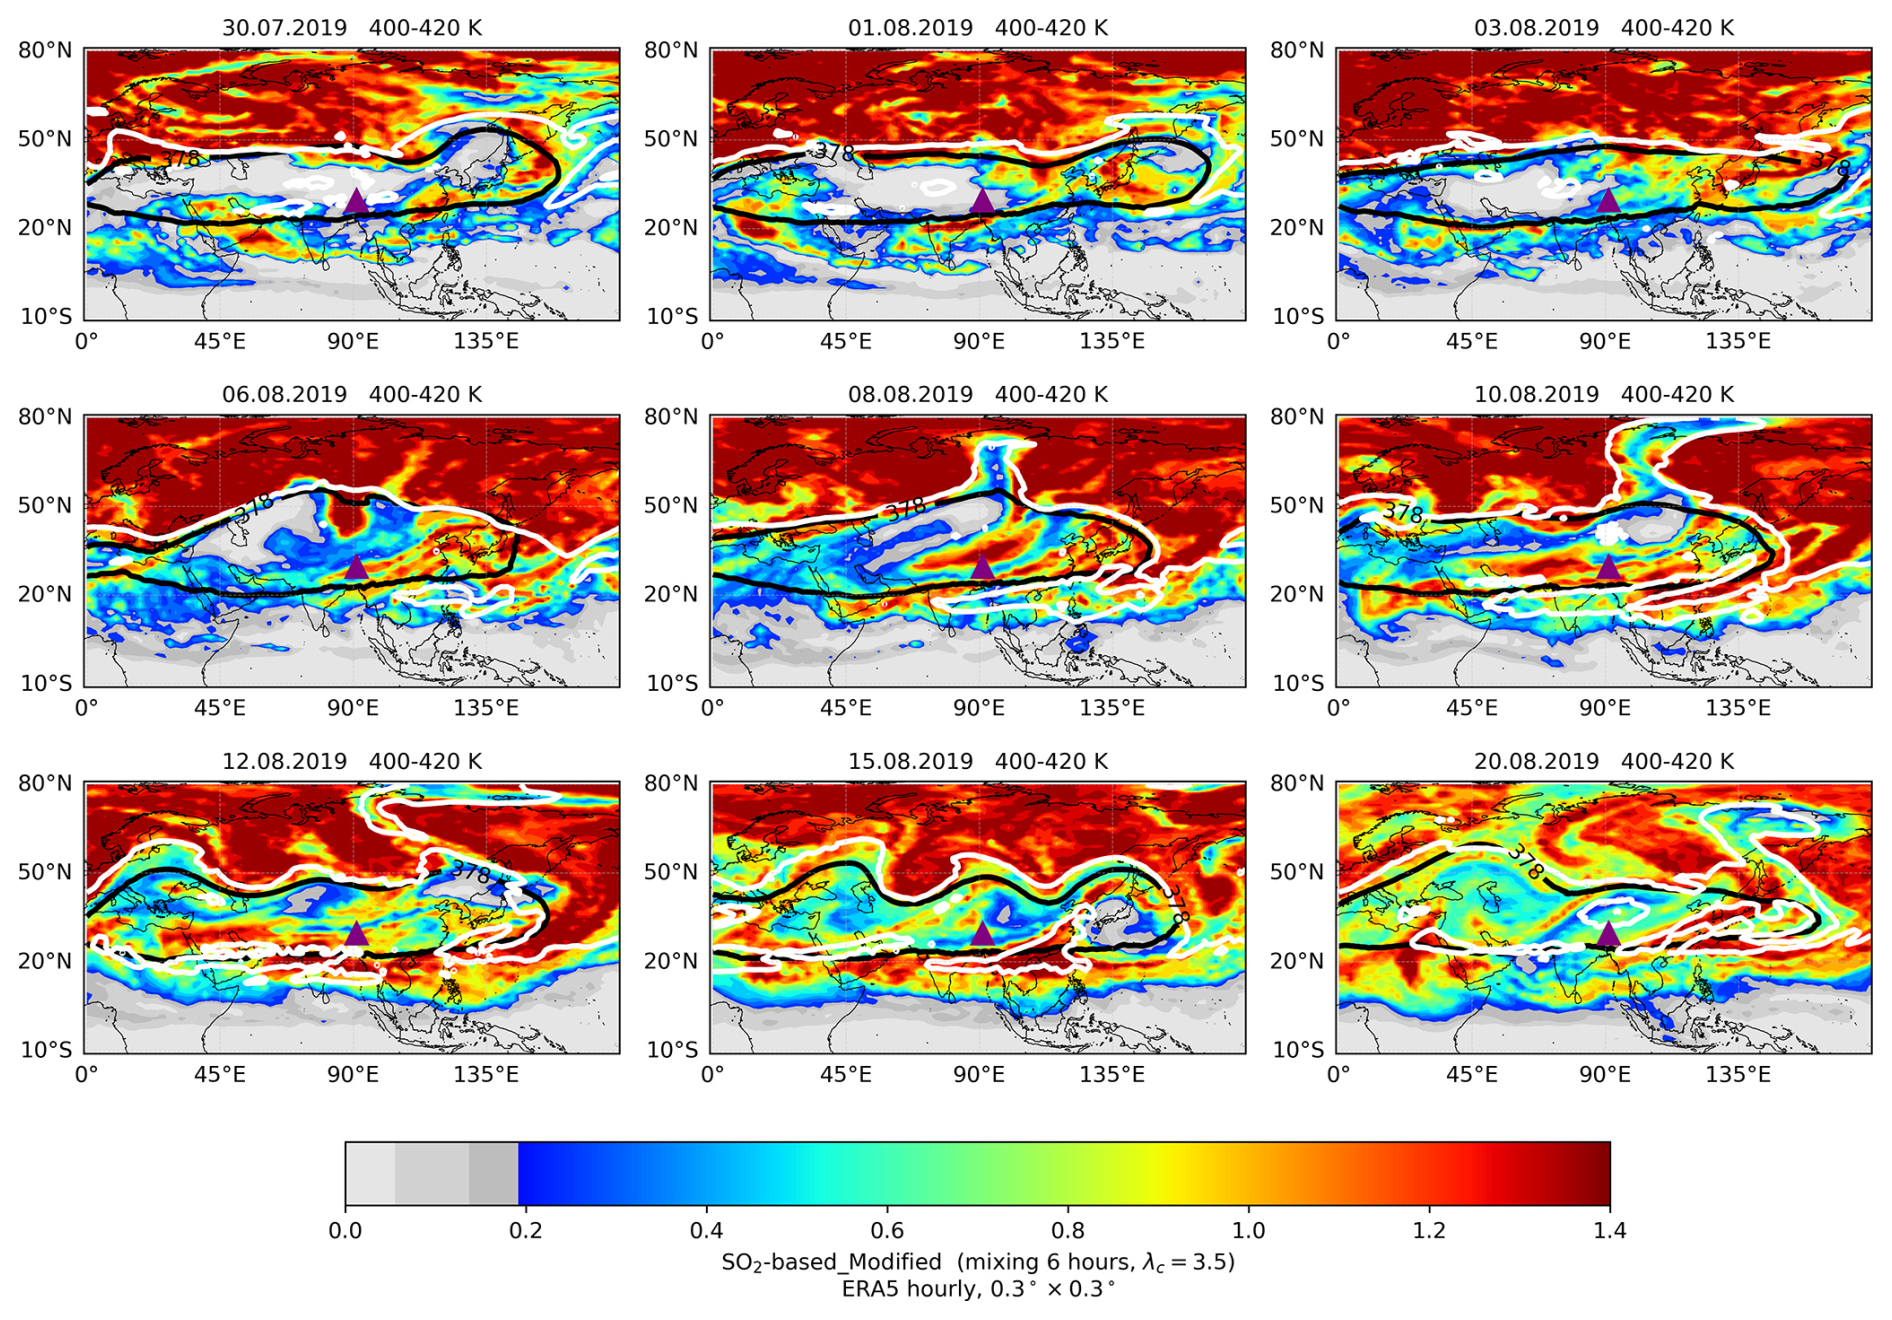
Figure 7SO2-based tracer fractions within the 400–420 K layer from the modified simulation (simulation details in Table 2). The purple triangle indicates Lhasa. The ASMA edge is shown by the black contour at the 378 × 103 m2 s−2 Montgomery streamfunction. The white contour marks the 11 PVU potential vorticity isoline.
4.2 Global three-dimensional CLaMS simulations with SO2-based tracers
In global three-dimensional CLaMS simulations, we use passive tracers initialized from the observed SO2 plume mask (Fig. 1b). We refer to these as SO2-based tracers. At 00:00 UTC on 25 June 2019, the tracer is set to 1 inside the mask (0 outside) within 3 potential-temperature ranges (380–400, 400–420, and 420–440 K) and then advected and mixed throughout the global atmosphere in CLaMS. We present results for the 400–420 K release, while the 380–400 and 420–440 K releases are used as sensitivity tests (Sect. 5.2; Figs. 11–12). Figure 7 shows global maps of fractions of the SO2-based tracer falling within the 400–420 K layer for each measurement day from 30 July to 20 August 2019, using the modified simulation. Here, the tracer fraction (0–1) represents the fractional contribution of air originating from the volcanic plume (identified by the TROPOMI SO2 mask shown in Fig. 1b) after advection and mixing.
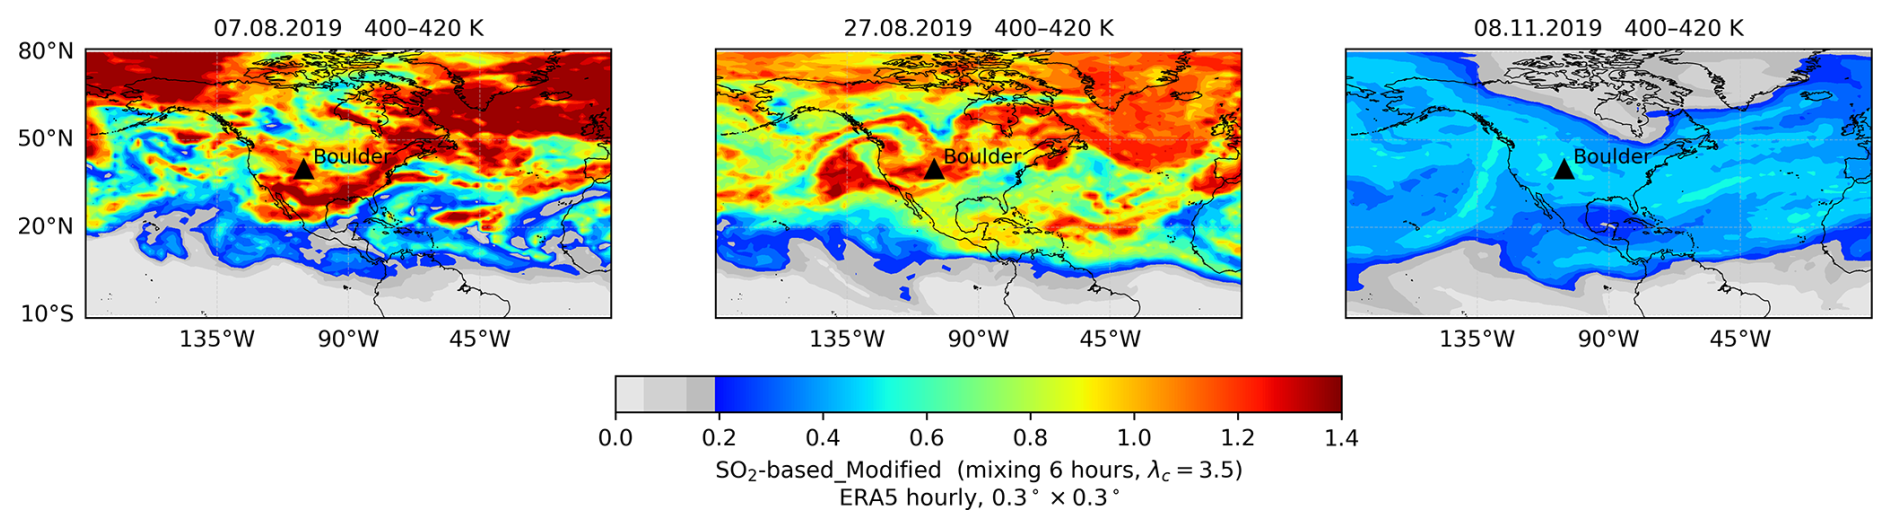
Figure 8Same as Fig. 7, but for SO2-based tracer fractions within the 400–420 K layer over the North American continent. The black triangle indicates the location of Boulder.
The ASMA is indicated by the Montgomery streamfunction (Santee et al., 2017) at the 378 × 103 m2 s−2 contour (layer mean over 400–420 K) as an estimate of its edge. The 11 PVU potential vorticity contour (layer mean over 400–420 K) illustrates the isentropic transport, including ASMA outflow (filaments) and in-mixing of PV-rich air from high latitudes. The strong transport barrier of the ASMA observed within ∼ 370–390 K is much weaker above 400 K (Ploeger et al., 2015). The results shown in Fig. 7 illustrate the overall intrusion of air masses into the ASMA and agree well with the Lhasa COBALD BSR455 observations. From 30 July to 1 August 2019, part of the SO2-based tracer entered the ASMA from its eastern side without reaching Lhasa. This is consistent with the absence of clear aerosol signals in the lower layers of the balloon-borne measurement data. On 3 and 6 August 2019, air masses impacted by the SO2-based tracer arrived above Lhasa. Without a significant effect of upwelling from below at that time, the SO2-based tracer signals remained sharp and concentrated. From 8 to 20 August, most of the ASMA contained mixed air masses. However, SO2-based tracer fractions inside the ASMA remained lower than outside, reflecting the anticyclonic transport barrier. During August, only a minor fraction of the SO2-based tracer is located inside the ASMA, while the majority remains outside. By later months, progressive mixing reduces the contrast between ASMA and surrounding regions in the tracer distribution (not shown here).
The corresponding SO2-based tracer fractions within the 400–420 K layer over the North American continent are shown in Fig. 8. Elevated tracer fractions are simulated over Boulder on both 7 and 27 August 2019. By 8 November 2019, the overall tracer fractions are markedly lower, reflecting progressive dilution by mixing during transport.
5.1 Sensitivity to parameterized mixing and injection-region definition
To assess the sensitivity of plume dispersion to model settings, such as parameterized mixing intensity, tracer release regions, and release altitudes, we performed a series of sensitivity experiments. In previous work with CLaMS driven by 1° × 1° resolution and 6 h temporal resolution reanalysis data (e.g., ERA5, ERA-Interim, as applied in Kloss et al., 2021), the intensity of parameterized small-scale mixing was controlled by choosing a critical Lyapunov exponent λc=1.5 and a mixing interval of 24 h (e.g., Pommrich et al., 2014). Here, we performed simulations with CLaMS driven by high-resolution ERA5 data (0.3° × 0.3° resolution, 1 h) and found best agreement with observations by enhancing mixing intensity in the simulation slightly by choosing λc=3.5 and a mixing interval of 6 h. Taken together, the modified setup corresponds to enhanced parameterized mixing compared to the control setup.
To evaluate the sensitivity of our results with respect to parameterized mixing intensity, Figure A1 in the Appendix shows the SO2-based tracer fractions from the control simulation (λc=1.5; mixing interval Δt = 24 h) and compares them with those from the modified simulation (λc=3.5; Δt = 6 h) in Fig. 7. The control simulation in Figure A1 shows a similar overall intrusion pattern but lacks the distinct fractions over Lhasa on 3 August 2019. The tracer distribution in the control simulation is more fragmented, presenting small, isolated pockets compared to the more homogeneous structures in the modified simulation. In a further sensitivity test, we repeat the control simulation with ERA5 fields at coarser spatial and temporal resolution (details in Table 2). This setup reduces computing time and is often used for global CLaMS simulations that cover multiple years. However, changing the ERA5 resolution has only a minor effect and does not affect our conclusions. This is evident from the comparison of Fig. A1 (0.3° × 0.3°, 1 h) and Fig. A2 (1° × 1°, 6 h).
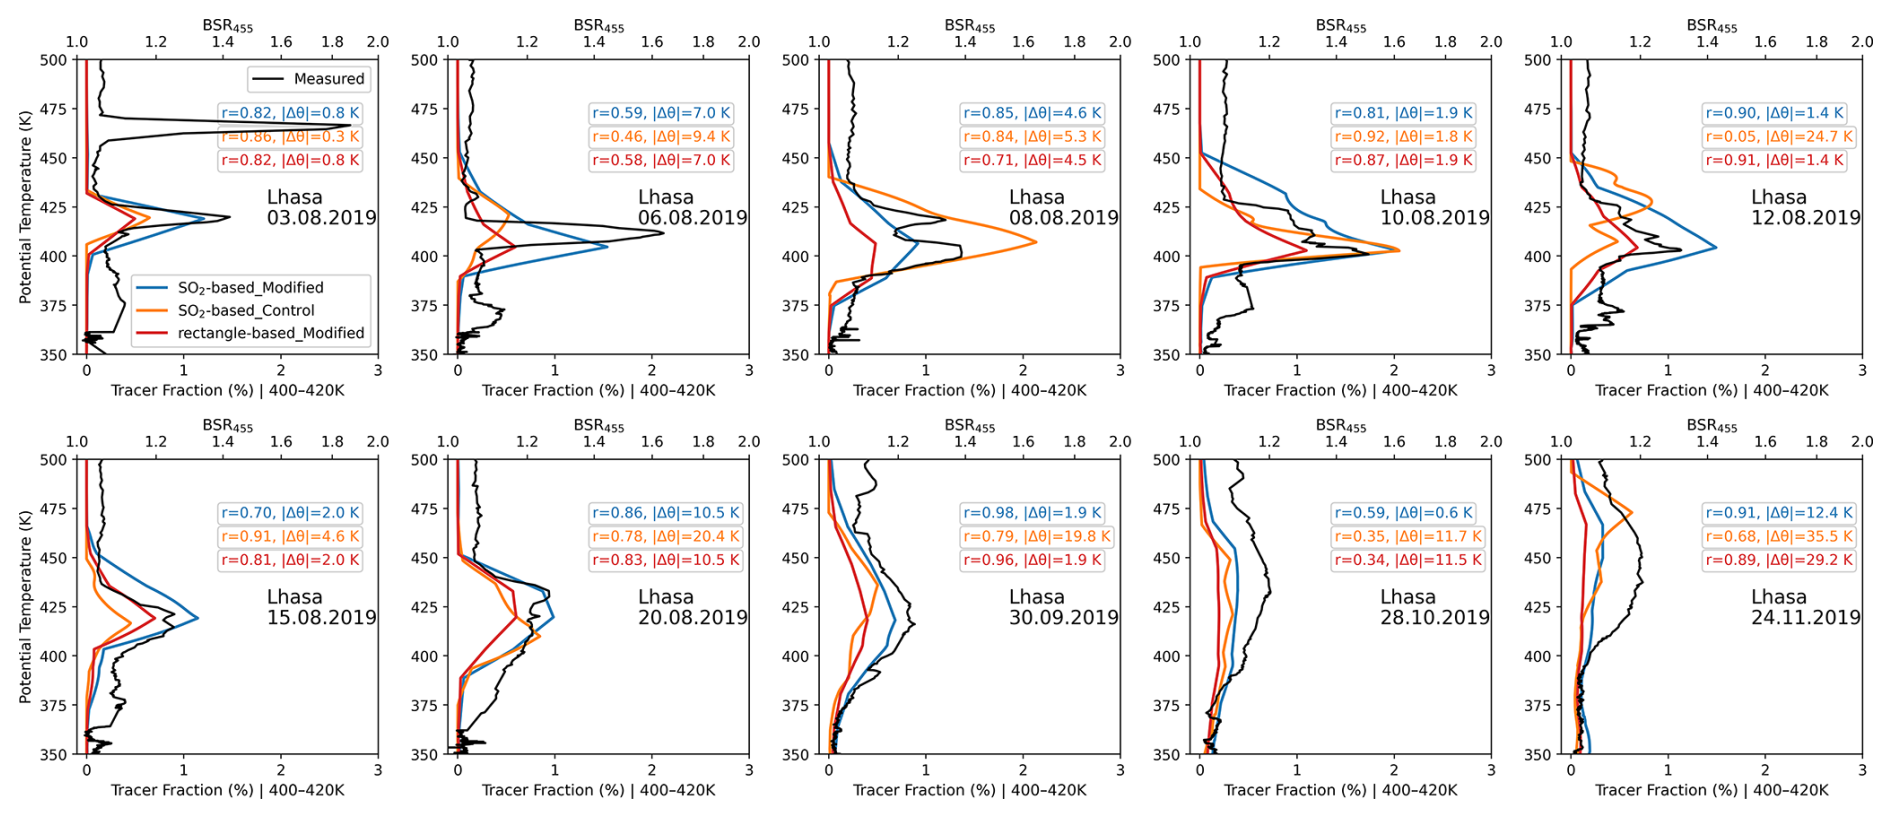
Figure 9Comparison of tracer-fraction profiles with the BSR455 profile over Lhasa. SO2-based tracer fractions from the control simulation (orange) and the modified simulation (blue) are shown together with rectangle-based tracer fractions from the modified simulation (red); see Table 2 for simulation details. Annotation colors match the corresponding simulation profiles. Values give the Pearson correlation r and the absolute peak-height offset |Δθ| (K) between the model tracer-fraction profile and the COBALD BSR455 profile within the analyzed θ range (375–450 K; 375–475 K on 30 September, 28 October, and 24 November 2019).
The different Raikoke tracers from the global three-dimensional CLaMS simulations are interpolated in time and space to the balloon-borne vertical profiles, providing a tracer-fraction profile at each measurement time. By comparing these tracer-fraction profiles from the model simulations with different mixing intensities with the observations (Fig. 9), we assess how the chosen parameterized mixing intensities affect the accuracy of the simulated plume dispersion. To quantify model–measurement agreement for each profile, we compute (i) the Pearson correlation coefficient r between the area-normalized tracer-fraction profile and the COBALD aerosol backscatter ratio at 455 nm (ABSR455), defined as BSR455−1 (e.g., Cirisan et al., 2014; Reinares Martínez et al., 2021), over the main plume layer (375–450 K; 375–475 K on 30 September, 28 October, and 24 November 2019) and (ii) the absolute peak-height difference |Δθ| between the two profiles. Note that r reflects only linear association and should be interpreted as a relative indicator rather than a definitive measure of agreement. The values of r and |Δθ| are annotated in Fig. 9. In Fig. 9, the SO2-based tracers are also released at 400–420 K. This setup primarily samples the diluted main plume rather than the higher-altitude trailing filament of the vorticized volcanic plume (VVP). Accordingly, the higher-altitude peak on 3 August 2019 likely originates from the VVP filament near 460–490 K and is not resolved by the 400–420 K release. A sensitivity simulation targeting the upper-level VVP filament shows enhanced tracer fractions near the observation region (not shown here); however, with the currently used CLaMS resolution, this thin and sharp aerosol peak at a single profile location is difficult to reproduce. Consistent with Figs. 7 and A1, the modified simulation produces tracer peaks (blue lines) that closely match the balloon measurements – except on 6 and 8 August 2019, when the peak altitudes deviate slightly. For most dates, the modified simulation shows consistently higher r and smaller |Δθ|. Although the control simulation (orange lines) occasionally aligns with observed peak altitudes, its overall agreement is weaker and it shows large peak-altitude biases on 12 August 2019 and 24 November 2019 (|Δθpeak| ≈ 25 and ≈ 36 K, respectively; Fig. 9). Overall, the modified simulation captures the vertical structure of the BSR455 profile well, despite minor differences in peak altitude for certain dates.
Furthermore, we assess the sensitivity of the model simulations to the plume initialization by carrying out another simulation using the modified configuration, in which Raikoke plume tracers are initialized within a rectangular latitude–longitude mask (from 49 to 62° N and 163° E to 170° W), following Kloss et al. (2021) (see Table 2 for simulation details). Tracers were released on multiple isentropic levels within this rectangular domain. Here, we show the rectangle-based tracer fractions, released at potential‐temperature levels of 400–420 K (red lines in Fig. 9). The peak heights of the rectangle-based tracer fractions (red lines) and the SO2-based tracer fractions (blue lines) show no significant difference. Because the release domain captures the plume core, even a simple rectangular mask reproduces the observed peak altitude. Hence, for the Raikoke simulations the choice of injection region is less critical than the choice of model mixing intensity.
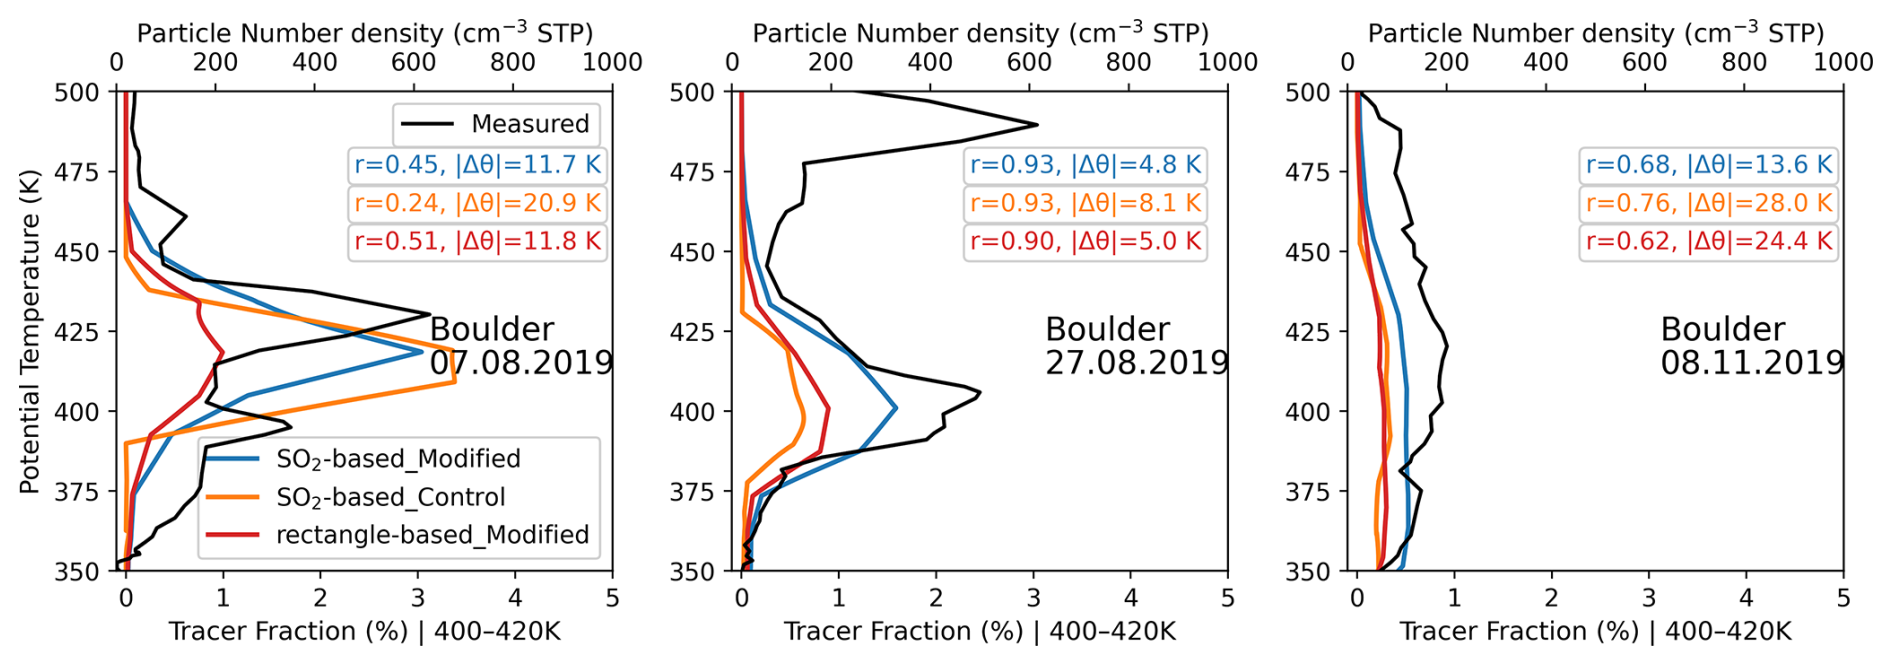
Figure 10Same as Fig. 9 but for Boulder: comparison of tracer-fraction profiles with the POPS aerosol number-concentration profile at STP. Annotations report r and |Δθ| (K) relative to POPS within the analyzed θ range (375–450 K for 7 and 27 August 2019, and 375–475 K for 8 November 2019).
Over Boulder, we likewise compare the tracer-fraction profiles on the measurement dates with the POPS aerosol number concentration profiles at STP (Fig. 10). For the computation of r, we evaluate within 375–450 K for 7 and 27 August 2019, and within 375–475 K for 8 November 2019. Overall, the SO2-based tracers in the modified simulation (blue) reproduce the observed peak structure more closely, with higher r and smaller |Δθ| than the control and rectangle-based simulations.
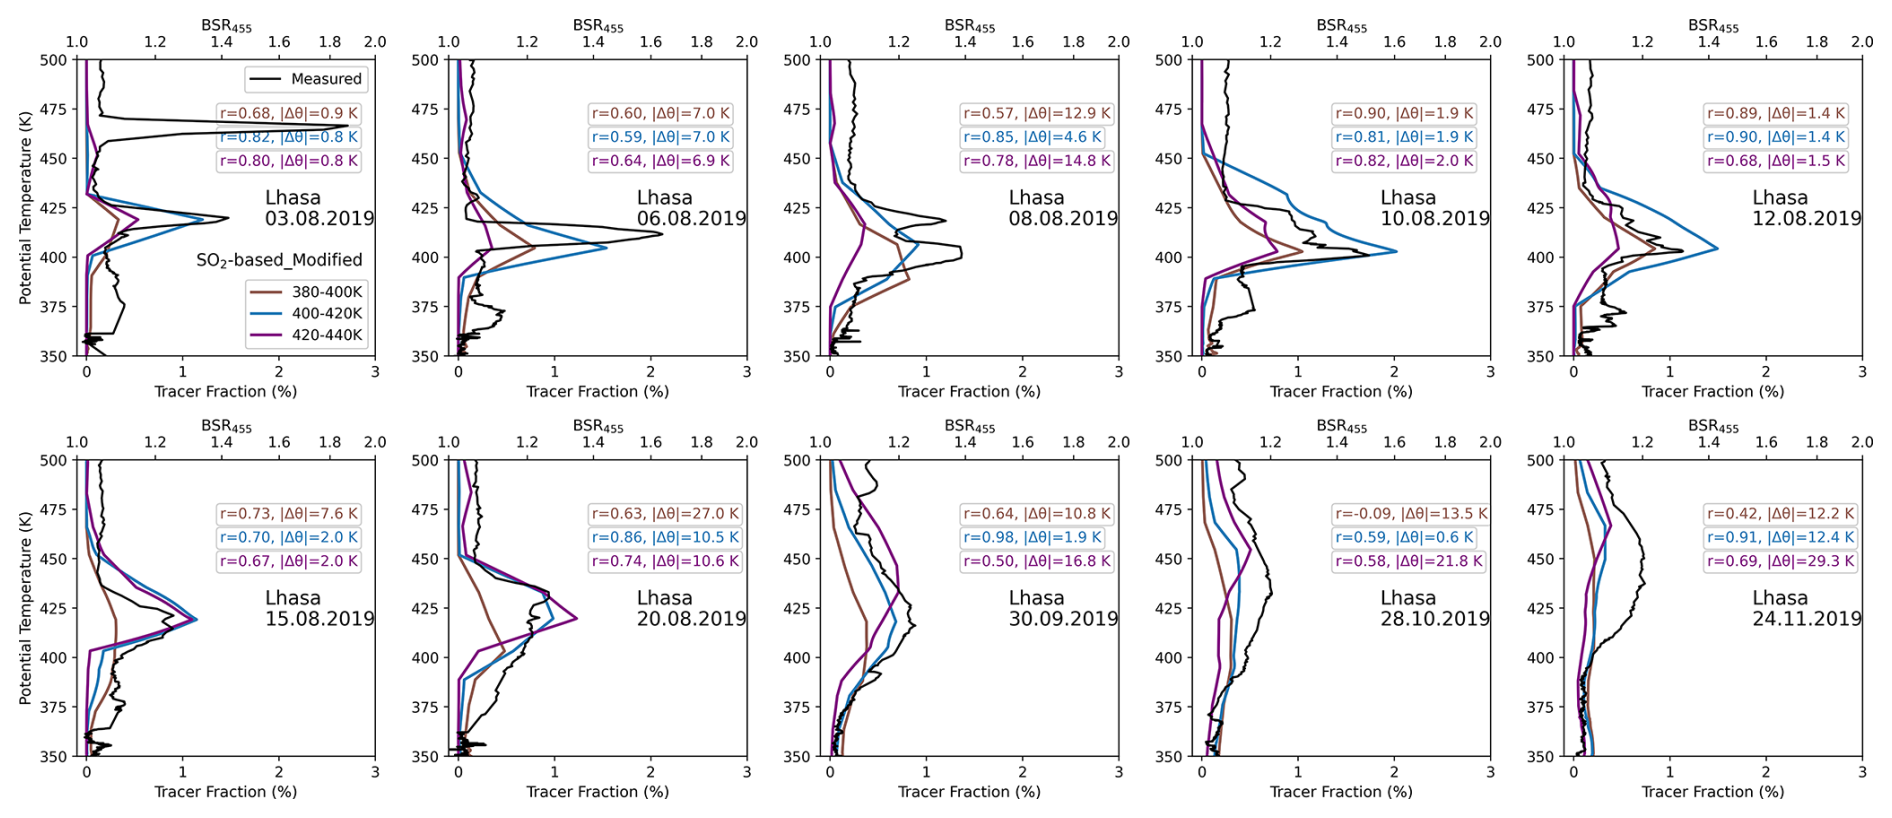
Figure 11SO2-based tracer‐fraction profiles from the modified simulation at different isentropic injection levels (simulation details in Table 2), compared with COBALD BSR455 profiles. Blue lines: injections at 400–420 K; brown lines: 380–400 K; purple lines: 420–440 K. Annotation colors match the corresponding injection-layer curves; values are r and |Δθ| (K) between the model tracer-fraction profile and the COBALD BSR455 profile within the analyzed θ range (375–450 K; 375–475 K on 30 September, 28 October, and 24 November 2019).
5.2 Sensitivity to injection height
The Raikoke plume was injected primarily within 8–16 km (Kloss et al., 2021; Cai et al., 2022; Vernier et al., 2024). The main injection occurred between 18:00 UTC on 21 June and 03:00 UTC on 22 June 2019 (with SO2 release possibly extending to ∼ 06:00 UTC) (Cai et al., 2022; Vernier et al., 2024). Radiative heating of ash and nascent sulfate then lofted parts of the plume, raising volcanic cloud tops above 20 km within 4 d of the eruption (Muser et al., 2020; Gorkavyi et al., 2021). These observations indicate that Raikoke's plume experienced an intense updraft during the eruption stage. Aerosol‑radiative lofting is not included in the CLaMS simulations. However, comparison of the vertical profiles of the SO2-based tracers with in-situ measurements allows estimation of the lofting height. SO2-based tracers were injected at 20 K intervals between 360 and 500 K to cover the entire possible extent of the Raikoke plume. To assess which initialization range best reproduces the observed plume, we compare tracer‑fraction profiles with the BSR455 profiles in Fig. 11.
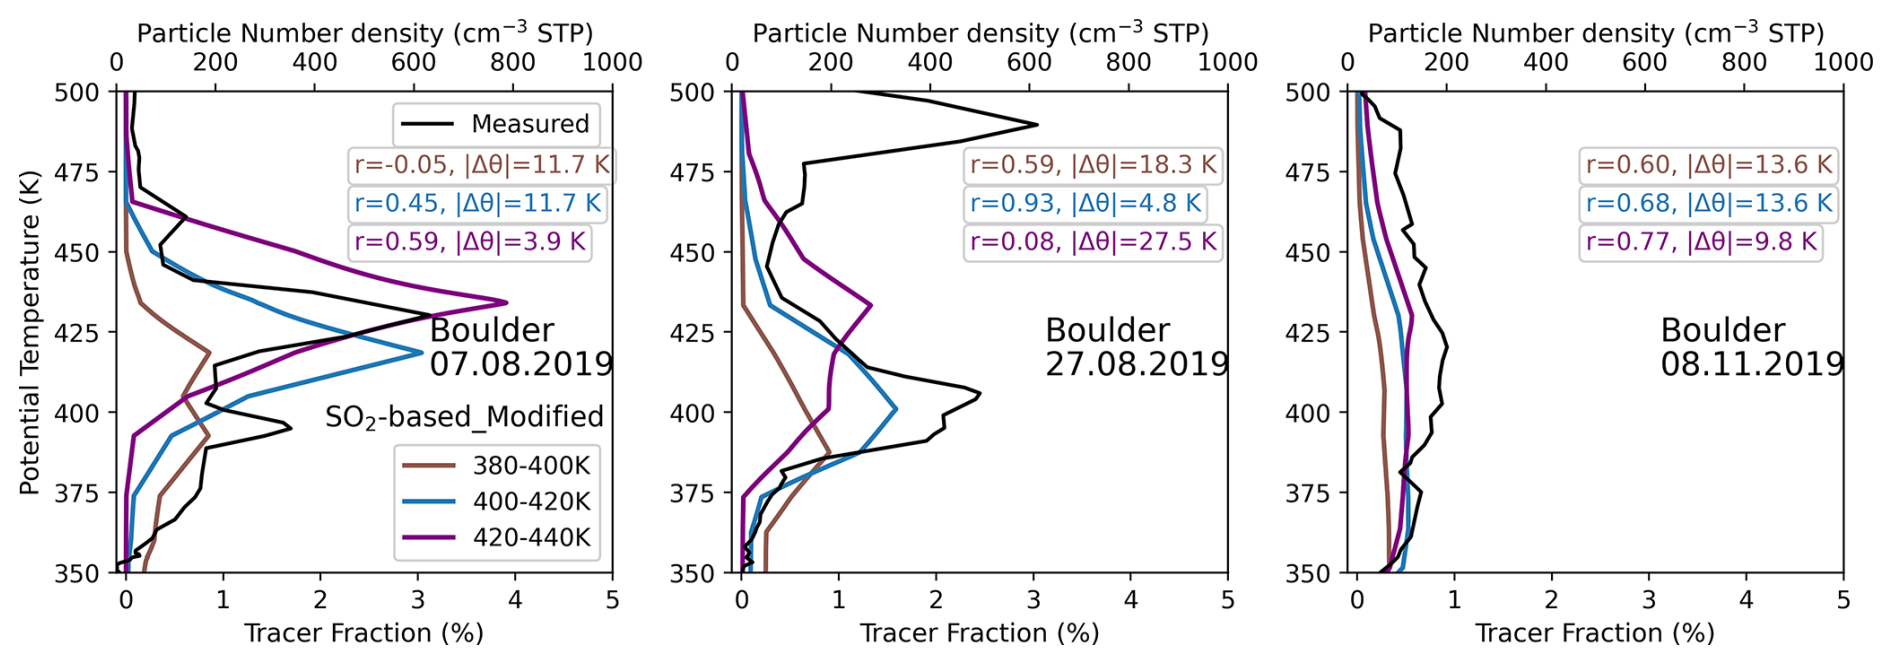
Figure 12Same as Fig. 11 but for Boulder: SO2-based tracer-fraction profiles from the modified simulation at different isentropic injection levels compared with the POPS aerosol number-concentration profile at STP. Blue: 400–420 K; brown: 380–400 K; purple: 420–440 K. Annotations report r and |Δθ| (K) relative to POPS within the analyzed θ range (375–450 K for 7 and 27 August 2019, and 375–475 K for 8 November 2019).
Overall, tracers initialized within 400–420 K (blue lines; ∼ 15–16.5 km at the Raikoke site) best match the enhanced BSR455 profiles, compared with 380–400 K (brown) and 420–440 K (purple). For most dates, the 400–420 K initialization attains the highest r and the smallest |Δθ| among the three layers (see annotations in Fig. 11). For instance, on 3, 6, and 12 August 2019, tracers initialized in the 400–420 K layer contribute most strongly to the peak of the BSR455 profile, while those from the 380–400 and 420–440 K layers also produce peaks at the same altitude but with smaller amplitudes. On 8 August, 30 September, and 28 October 2019, only the 400–420 K tracer reproduces the BSR455 peak at the correct altitude, whereas the peaks from the 380–400 and 420–440 K tracers appear below or above the observed height. For Boulder (Fig. 12), the 400–420 K initialization likewise shows the best agreement with the observations. On 7 August 2019 the 380–400 K layer, and on 27 August 2019 the 420–440 K layer, produce peaks that disagree strongly with the observations (r<0.1).
Cai et al. (2022) estimate a peak injection altitude near 11 km, whereas the tracer level that best matches the observed profiles corresponds to ∼ 15–16.5 km (400–420 K). We hypothesize that this ∼ 4–5 km offset could be consistent with radiative self-heating lofting of the SO2-rich cloud, but it may also reflect uncertainties in injection-height estimates across techniques and model-related discrepancies (e.g., Kloss et al., 2021; Cai et al., 2022; Vernier et al., 2024).
Motivated by the limited availability of in-situ UTLS measurements of volcanic plume and the need to better quantify ASMA-related transport pathways, we combined in-situ balloon observations over Lhasa and Boulder with Lagrangian transport simulations using the CLaMS model, driven by high-resolution ERA5 data, to investigate the transport pathways and mixing processes of the Raikoke plume in the upper troposphere–lower stratosphere (UTLS) during the mature phase of the Asian Summer Monsoon Anticyclone (ASMA). Our main conclusions are:
-
Analysis of backward trajectories. 42 d after the Raikoke eruption, the enhanced BSR455 was first detected over Lhasa. Two separate transport pathways carried the Raikoke plume to the Tibetan Plateau: (i) a high-altitude pathway along summertime easterly winds (∼ 460–490 K) transporting the trailing filament of the vorticized volcanic plume (VVP) and (ii) a lower-level route via the subtropical westerly jet (∼ 390–430 K) transporting the main volcanic plume. These branches converge over Lhasa on 3 August 2019 but at different altitudes, explaining the dual peaks observed in balloon-borne backscatter profiles.
-
Dilution via mixing with relatively aerosol-poor air. During transport through the lower stratosphere, the plume is progressively diluted by background air with low aerosol concentrations. After entering the ASMA, dilution may be driven by upwelling from lower potential temperature levels and by dispersion and lateral mixing with surrounding air. These processes are consistent with the progressively smoothed peaks of enhanced BSR455 signals observed along the balloon profiles.
-
Validation of CLaMS SO2-based tracers. The modified CLaMS simulations using SO2-based tracers successfully capture transport into the ASMA and reconstruct the vertical structure observed over Lhasa, as well as over the North American continent in Boulder. Compared with the control simulation (mixing every 24 h), the modified simulation (mixing every 6 h) produces more coherent tracer distributions that closely match the enhanced BSR455 peaks.
In summary, by combining observations and modelling, we provide further insights into how the mid-latitude Raikoke plume is transported through the Northern Hemisphere UTLS over long distances. We show evidence that the Asian summer monsoon plays a key role in this transport. In particular, parts of the plume are entrained into the monsoon anticyclone and are subsequently diluted by horizontal transport and vertical upwelling within the anticyclone. Our findings improve the understanding of how aerosols from a mid-latitude volcanic injection are transported and dispersed in the lower stratosphere, including in the vicinity of the Asian summer monsoon. This improved understanding of plume transport and dilution is relevant for estimating regional radiative forcing and assessing potential impacts on stratospheric ozone chemistry.
We identified two distinct isentropic transport pathways and assessed plume dilution via mixing with air masses outside the plume. Our simulations show that atmospheric mixing processes, as parameterized in CLaMS in relation to flow deformation, are critical for dispersing the volcanic plume during stratospheric transport. Accordingly, changes in model resolution require adjustment of the mixing parameterization. Our results suggest that a small fraction of the Raikoke plume becomes entrained into the ASMA. Within the ASMA, confinement and summertime diabatic uplift can potentially transport these plume fractions to higher altitudes (e.g., Vogel et al., 2019).
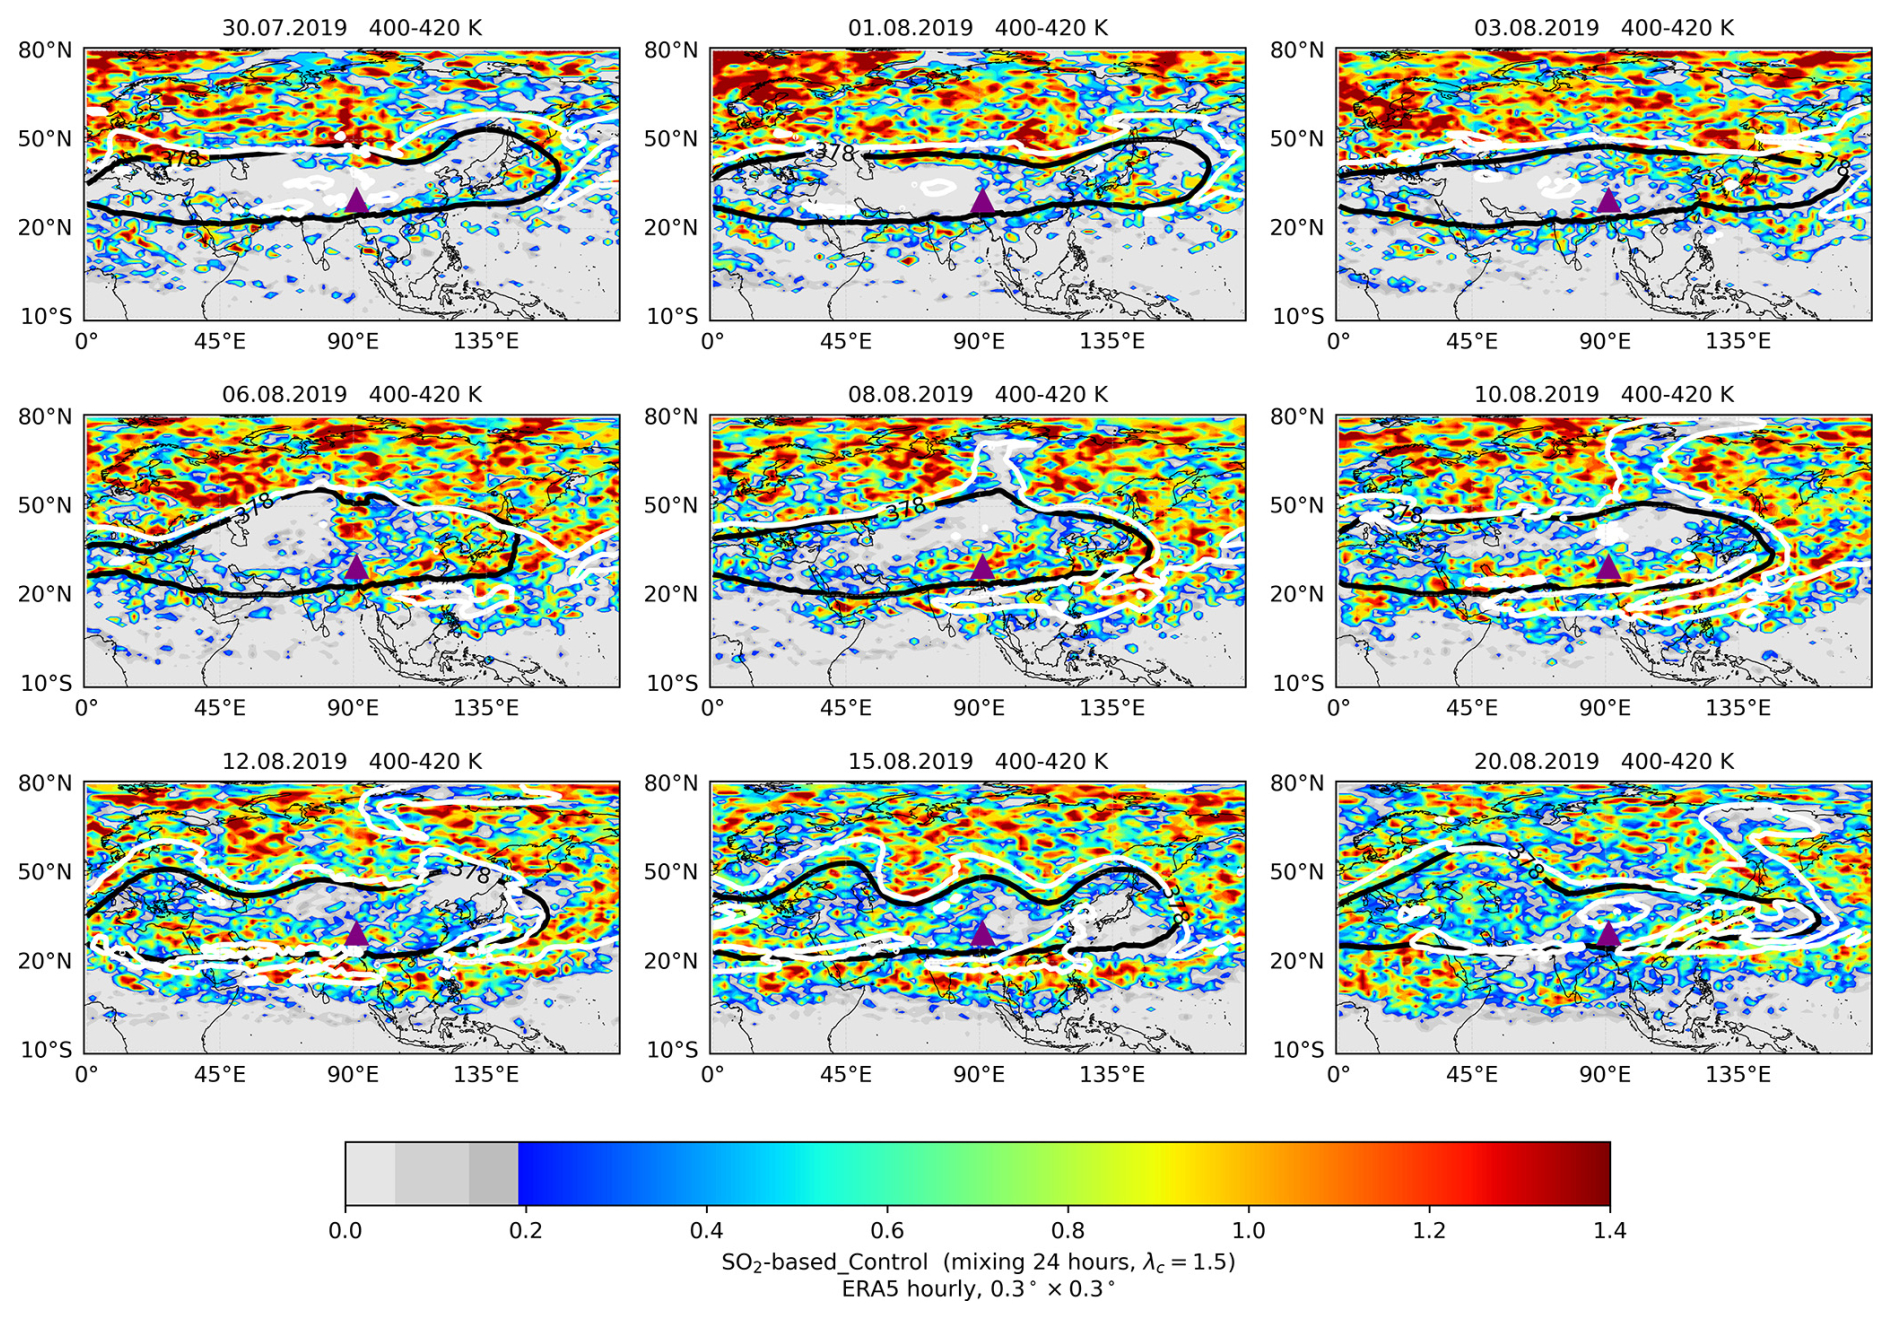
Figure A1Same as Fig. 7, but for SO2-based tracer fractions from the control simulation (simulation details in Table 2), driven by ERA5 at 0.3° × 0.3° spatial and 1 h temporal resolution.
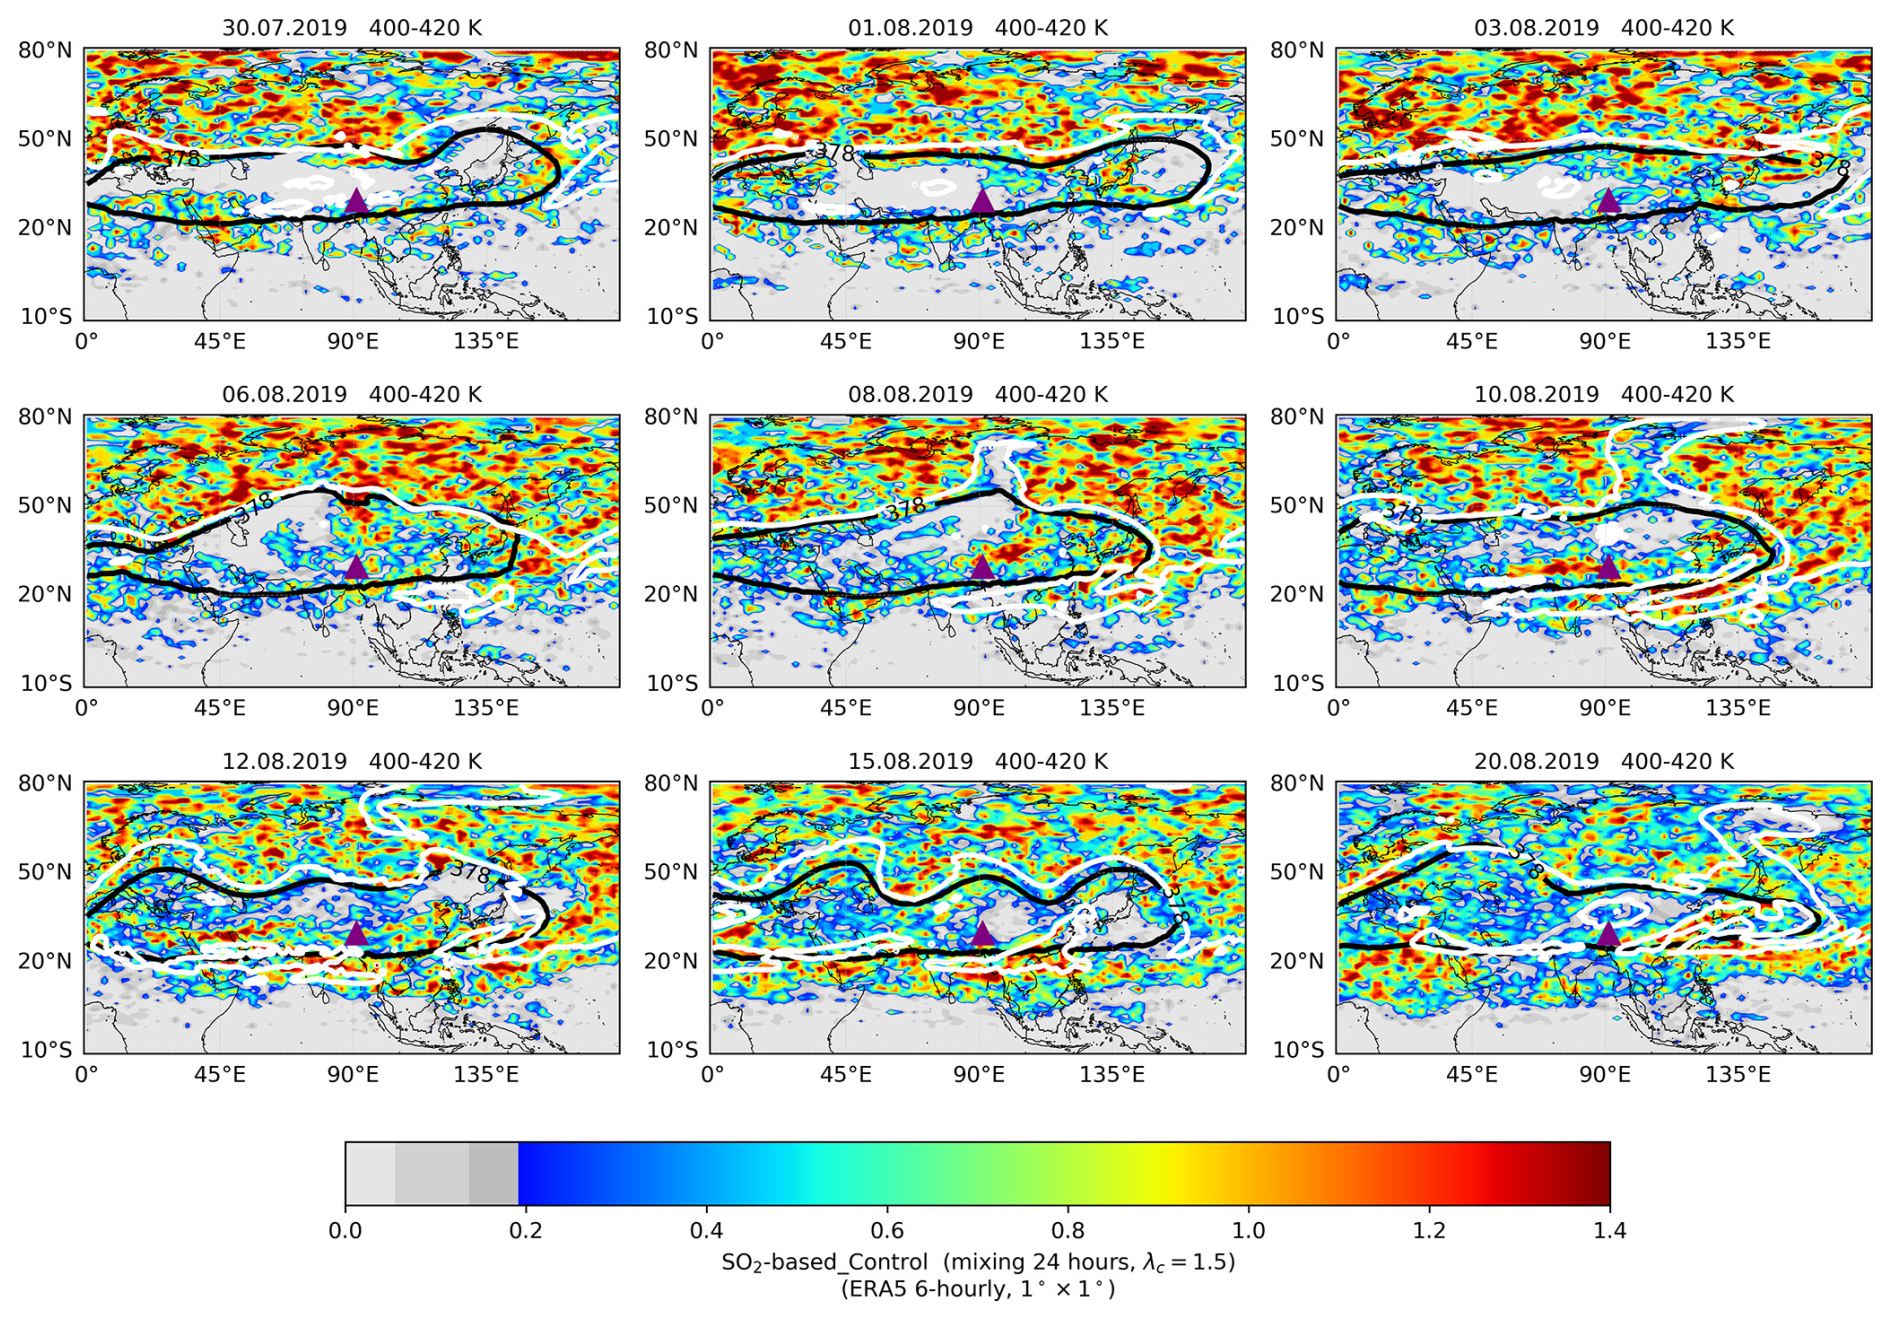
Figure A2Same as Fig. A1, but driven by ERA5 at 1° × 1° spatial and 6 h temporal resolution.
Sentinel-5P TROPOMI SO2 Level-2 OFFL data were obtained from the Copernicus Data Space Ecosystem; the product DOI is https://doi.org/10.5270/S5P-74eidii (Copernicus Sentinel-5P, 2020). ERA5 reanalysis was retrieved from the Copernicus Climate Data Store. We used the “ERA5-complete” dataset on the native grid including model levels (https://doi.org/10.24381/cds.143582cf, Hersbach et al., 2017). POPS (Baseline Balloon Stratospheric Aerosol Profiles, B2SAP) 1 Hz time series were downloaded from NOAA CSL (https://csl.noaa.gov/projects/b2sap/data.html, last access: 3 July 2025). Balloon sounding measurements from the SWOP campaign over Lhasa are available upon request from Jianchun Bian (bjc@mail.iap.ac.cn).
ZY, BV, and FP jointly developed the study concept; BV and FP provided the initial idea and scientific guidance throughout; ZY performed the simulations and analyzed the data and results; BV contributed key components of the CLaMS simulation code; FP contributed the CLaMS code for the global three-dimensional tracer simulations; JCB, ZXB, and DL conducted the balloon-borne measurements at Lhasa; SG and LH provided the TROPOMI data; FGW provided technical support for the COBALD instrument/data; EA, AAB, KRS, and TT provided technical support for the POPS data; MIH contributed to the review and editing of the manuscript; ZY wrote the manuscript with input from all co-authors.
The contact author has declared that none of the authors has any competing interests.
Publisher's note: Copernicus Publications remains neutral with regard to jurisdictional claims made in the text, published maps, institutional affiliations, or any other geographical representation in this paper. The authors bear the ultimate responsibility for providing appropriate place names. Views expressed in the text are those of the authors and do not necessarily reflect the views of the publisher.
We thank the three anonymous reviewers for their thorough and constructive reviews.
This research was supported by the Deutsche Forschungsgemeinschaft (DFG grant no. VO 1276/6-1) and the National Natural Science Foundation of China (NSFC Grant 42061134012) in the frame of a joint NSFC-DFG research project as well as by the NSFC Grant 42394121. We acknowledge the Jülich Supercomputing Centre (JSC; Research Centre Jülich, Germany) for computing time on the supercomputer JUWELS (project CLaMS-ESM) and storage resources on the meteocloud data archive. Further, we thank the European Centre for Medium-Range Weather Forecasts (ECMWF) for providing the ERA5 reanalyses.
Balloon measurements over Boulder are supported by the NOAA cooperative agreement NA22OAR4320151, the Earth Radiation Budget (ERB) project, and the NASA Upper Atmosphere Composition Observations (UACO) program. Katie Smith and Alexandre Baron would like to acknowledge Reflective for supporting this research through their fellowship program.
This research was supported by the Deutsche Forschungsgemeinschaft (grant no. VO 1276/6-1) and the National Natural Science Foundation of China (grant no. 42061134012) in the frame of a joint NSFC-DFG research project, as well as by the National Natural Science Foundation of China (grant no. 42394121).
The article processing charges for this open-access publication were covered by the Forschungszentrum Jülich.
This paper was edited by Stefano Galmarini and reviewed by three anonymous referees.
Appel, O., Köllner, F., Dragoneas, A., Hünig, A., Molleker, S., Schlager, H., Mahnke, C., Weigel, R., Port, M., Schulz, C., Drewnick, F., Vogel, B., Stroh, F., and Borrmann, S.: Chemical analysis of the Asian tropopause aerosol layer (ATAL) with emphasis on secondary aerosol particles using aircraft-based in situ aerosol mass spectrometry, Atmos. Chem. Phys., 22, 13607–13630, https://doi.org/10.5194/acp-22-13607-2022, 2022. a
Bian, J., Pan, L. L., Paulik, L., Vömel, H., and Chen, H.: In situ water vapor and ozone measurements in Lhasa and Kunmin during the Asian summer monsoon, Geophys. Res. Lett., 39, L19808, https://doi.org/10.1029/2012GL052996, 2012. a
Bourassa, A. E., Robock, A., Randel, W. J., Deshler, T., Rieger, L. A., Lloyd, N. D., Llewellyn, E., and Degenstein, D. A.: Large volcanic aerosol load in the stratosphere linked to Asian monsoon transport, Science, 337, 78–81, 2012. a, b
Brabec, M., Wienhold, F. G., Luo, B. P., Vömel, H., Immler, F., Steiner, P., Hausammann, E., Weers, U., and Peter, T.: Particle backscatter and relative humidity measured across cirrus clouds and comparison with microphysical cirrus modelling, Atmos. Chem. Phys., 12, 9135–9148, https://doi.org/10.5194/acp-12-9135-2012, 2012. a, b, c
Brewer, A. W.: Evidence for a world circulation provided by the measurements of helium and water vapour distribution in the stratosphere, Q. J. Roy. Meteor. Soc., 75, 351–363, https://doi.org/10.1002/qj.49707532603, 1949. a
Brunamonti, S., Jorge, T., Oelsner, P., Hanumanthu, S., Singh, B. B., Kumar, K. R., Sonbawne, S., Meier, S., Singh, D., Wienhold, F. G., Luo, B. P., Boettcher, M., Poltera, Y., Jauhiainen, H., Kayastha, R., Karmacharya, J., Dirksen, R., Naja, M., Rex, M., Fadnavis, S., and Peter, T.: Balloon-borne measurements of temperature, water vapor, ozone and aerosol backscatter on the southern slopes of the Himalayas during StratoClim 2016–2017, Atmos. Chem. Phys., 18, 15937–15957, https://doi.org/10.5194/acp-18-15937-2018, 2018. a, b
Brunamonti, S., Martucci, G., Romanens, G., Poltera, Y., Wienhold, F. G., Hervo, M., Haefele, A., and Navas-Guzmán, F.: Validation of aerosol backscatter profiles from Raman lidar and ceilometer using balloon-borne measurements, Atmos. Chem. Phys., 21, 2267–2285, https://doi.org/10.5194/acp-21-2267-2021, 2021. a
Butchart, N.: The Brewer-Dobson circulation, Rev. Geophys., 52, 157–184, https://doi.org/10.1002/2013RG000448, 2014. a
Cai, Z., Griessbach, S., and Hoffmann, L.: Improved estimation of volcanic SO2 injections from satellite retrievals and Lagrangian transport simulations: the 2019 Raikoke eruption, Atmos. Chem. Phys., 22, 6787–6809, https://doi.org/10.5194/acp-22-6787-2022, 2022. a, b, c, d, e, f
Carn, S., Krotkov, N., Fisher, B., and Li, C.: Out of the blue: Volcanic SO2 emissions during the 2021–2022 eruptions of Hunga Tonga–Hunga Ha'apai (Tonga), Front. Earth Sci., 10, 976962, https://doi.org/10.3389/feart.2022.976962, 2022. a
Cirisan, A., Luo, B. P., Engel, I., Wienhold, F. G., Sprenger, M., Krieger, U. K., Weers, U., Romanens, G., Levrat, G., Jeannet, P., Ruffieux, D., Philipona, R., Calpini, B., Spichtinger, P., and Peter, T.: Balloon-borne match measurements of midlatitude cirrus clouds, Atmos. Chem. Phys., 14, 7341–7365, https://doi.org/10.5194/acp-14-7341-2014, 2014. a, b, c
Clemens, J., Vogel, B., Hoffmann, L., Griessbach, S., Thomas, N., Fadnavis, S., Müller, R., Peter, T., and Ploeger, F.: A multi-scenario Lagrangian trajectory analysis to identify source regions of the Asian tropopause aerosol layer on the Indian subcontinent in August 2016, Atmos. Chem. Phys., 24, 763–787, https://doi.org/10.5194/acp-24-763-2024, 2024. a
Copernicus Sentinel-5P (processed by ESA): TROPOMI Level 2 Sulfur Dioxide Total Column products, Version 02, European Space Agency [data set], https://doi.org/10.5270/S5P-74eidii, 2020. a
de Leeuw, J., Schmidt, A., Witham, C. S., Theys, N., Taylor, I. A., Grainger, R. G., Pope, R. J., Haywood, J., Osborne, M., and Kristiansen, N. I.: The 2019 Raikoke volcanic eruption – Part 1: Dispersion model simulations and satellite retrievals of volcanic sulfur dioxide, Atmos. Chem. Phys., 21, 10851–10879, https://doi.org/10.5194/acp-21-10851-2021, 2021. a
Dobson, G. M. B.: Origin and distribution of polyatomic molecules in the atmosphere, Proc. R. Soc. London A, 236, 187–193, 1956. a
Fadnavis, S., Schultz, M. G., Semeniuk, K., Mahajan, A. S., Pozzoli, L., Sonbawne, S., Ghude, S. D., Kiefer, M., and Eckert, E.: Trends in peroxyacetyl nitrate (PAN) in the upper troposphere and lower stratosphere over southern Asia during the summer monsoon season: regional impacts, Atmos. Chem. Phys., 14, 12725–12743, https://doi.org/10.5194/acp-14-12725-2014, 2014. a
Fahey, D. W., Gao, R.-S., Möhler, O., Saathoff, H., Schiller, C., Ebert, V., Krämer, M., Peter, T., Amarouche, N., Avallone, L. M., Bauer, R., Bozóki, Z., Christensen, L. E., Davis, S. M., Durry, G., Dyroff, C., Herman, R. L., Hunsmann, S., Khaykin, S. M., Mackrodt, P., Meyer, J., Smith, J. B., Spelten, N., Troy, R. F., Vömel, H., Wagner, S., and Wienhold, F. G.: The AquaVIT-1 intercomparison of atmospheric water vapor measurement techniques, Atmos. Meas. Tech., 7, 3177–3213, https://doi.org/10.5194/amt-7-3177-2014, 2014. a
Fromm, M., Nedoluha, G., and Charvát, Z.: Comment on “Large Volcanic Aerosol Load in the Stratosphere Linked to Asian Monsoon Transport”, Science, 339, 647, https://doi.org/10.1126/science.1228605, 2013. a
Gao, R. S., Telg, H., McLaughlin, R. J., Ciciora, S. J., Watts, L. A., Richardson, M. S., Schwarz, J. P., Perring, A. E., Thornberry, T. D., Rollins, A. W., Markovic, M. Z., Bates, T. S., Johnson, J. E., and Fahey, D. W.: A light-weight, high-sensitivity particle spectrometer for PM2.5 aerosol measurements, Aerosol Sci. Tech., 50, 88–99, https://doi.org/10.1080/02786826.2015.1131809, 2016. a, b
Gorkavyi, N., Krotkov, N., Li, C., Lait, L., Colarco, P., Carn, S., DeLand, M., Newman, P., Schoeberl, M., Taha, G., Torres, O., Vasilkov, A., and Joiner, J.: Tracking aerosols and SO2 clouds from the Raikoke eruption: 3D view from satellite observations, Atmos. Meas. Tech., 14, 7545–7563, https://doi.org/10.5194/amt-14-7545-2021, 2021. a, b, c, d
GRUAN Lead Centre: InterMet iMet-1 (iMet-1-RSB) – GRUAN instrument information (radiosonde models), https://www.gruan.org/instruments/radiosondes/sonde-models/intermet-imet-1 (last access: 13 January 2026), 2025. a
Hanumanthu, S., Vogel, B., Müller, R., Brunamonti, S., Fadnavis, S., Li, D., Ölsner, P., Naja, M., Singh, B. B., Kumar, K. R., Sonbawne, S., Jauhiainen, H., Vömel, H., Luo, B., Jorge, T., Wienhold, F. G., Dirkson, R., and Peter, T.: Strong day-to-day variability of the Asian Tropopause Aerosol Layer (ATAL) in August 2016 at the Himalayan foothills, Atmos. Chem. Phys., 20, 14273–14302, https://doi.org/10.5194/acp-20-14273-2020, 2020. a, b
He, Y., Jing, D., Yin, Z., Ohneiser, K., and Yi, F.: Long-term (2010–2021) lidar observations of stratospheric aerosols in Wuhan, China, Atmos. Chem. Phys., 24, 11431–11450, https://doi.org/10.5194/acp-24-11431-2024, 2024. a
Hersbach, H., Bell, B., Berrisford, P., Hirahara, S., Horányi, A., Muñoz-Sabater, J., Nicolas, J., Peubey, C., Radu, R., Schepers, D., Simmons, A., Soci, C., Abdalla, S., Abellan, X., Balsamo, G., Bechtold, P., Biavati, G., Bidlot, J., Bonavita, M., De Chiara, G., Dahlgren, P., Dee, D., Diamantakis, M., Dragani, R., Flemming, J., Forbes, R., Fuentes, M., Geer, A., Haimberger, L., Healy, S., Hogan, R.J., Hólm, E., Janisková, M., Keeley, S., Laloyaux, P., Lopez, P., Lupu, C., Radnoti, G., de Rosnay, P., Rozum, I., Vamborg, F., Villaume, S., and Thépaut, J.-N.: Complete ERA5 from 1940: Fifth generation of ECMWF atmospheric reanalyses of the global climate, Copernicus Climate Change Service (C3S) Data Store (CDS) [data set], https://doi.org/10.24381/cds.143582cf, 2017. a
Hersbach, H., Bell, B., Berrisford, P., Hirahara, S., Horànyi, A., Muñoz Sabater, J., Nicolas, J., Peubey, C., Radu, R., Schepers, D., Simmons, A., Soci, C., Abdalla, S., Abellan, X., Balsamo, G., Bechtold, P., Biavati, G., Bidlot, J., Bonavita, M., De Chiara, G., Dahlgren, P., Dee, D., Diamantakis, M., Dragani, R., Flemming, J., Forbes, R., Fuentes, M., Geer, A., Haimberger, L., Healy, S., Hogan, R. J., Hólm, E., Janiskovà, M., Keeley, S., Laloyaux, P., Lopez, P., Lupu, C., Radnoti, G., de Rosnay, P., Rozum, I., Vamborg, F., Villaume, S., and Thépaut, J.-N.: The ERA5 global reanalysis, Q. J. Roy. Meteor. Soc., 146, 1999–2049, https://doi.org/10.1002/qj.3803, 2020. a
Hofmann, D. J. and Solomon, S.: Ozone destruction through heterogeneous chemistry following the eruption of El Chichón, J. Geophys. Res., 94, 5029–5041, 1989. a
Jing, D., He, Y., Yin, Z., Liu, F., Yi, Y., and Yi, F.: Evolution of aerosol plumes from 2019 Raikoke volcanic eruption observed with polarization lidar over central China, Atmos. Environ., 309, 119880, https://doi.org/10.1016/j.atmosenv.2023.119880, 2023. a
Khaykin, S. M., De Laat, A. J., Godin-Beekmann, S., Hauchecorne, A., and Ratynski, M.: Unexpected self-lofting and dynamical confinement of volcanic plumes: the Raikoke 2019 case, Scientific Reports, 12, 22409, https://doi.org/10.1038/s41598-022-27021-0, 2022. a, b, c, d
Kloss, C., Berthet, G., Sellitto, P., Ploeger, F., Taha, G., Tidiga, M., Eremenko, M., Bossolasco, A., Jégou, F., Renard, J.-B., and Legras, B.: Stratospheric aerosol layer perturbation caused by the 2019 Raikoke and Ulawun eruptions and their radiative forcing, Atmos. Chem. Phys., 21, 535–560, https://doi.org/10.5194/acp-21-535-2021, 2021. a, b, c, d, e
Konopka, P., Steinhorst, H.-M., Grooß, J.-U., Günther, G., Müller, R., Elkins, J. W., Jost, H.-J., Richard, E., Schmidt, U., Toon, G., and McKenna, D. S.: Mixing and Ozone Loss in the 1999-2000 Arctic Vortex: Simulations with the 3-dimensional Chemical Lagrangian Model of the Stratosphere (CLaMS), J. Geophys. Res., 109, D02315, https://doi.org/10.1029/2003JD003792, 2004. a
Konopka, P., Günther, G., Müller, R., dos Santos, F. H. S., Schiller, C., Ravegnani, F., Ulanovsky, A., Schlager, H., Volk, C. M., Viciani, S., Pan, L. L., McKenna, D.-S., and Riese, M.: Contribution of mixing to upward transport across the tropical tropopause layer (TTL), Atmos. Chem. Phys., 7, 3285–3308, https://doi.org/10.5194/acp-7-3285-2007, 2007. a
Konopka, P., Grooß, J.-U., Plöger, F., and Müller, R.: Annual cycle of horizontal in-mixing into the lower tropical stratosphere, J. Geophys. Res., 114, D19111, https://doi.org/10.1029/2009JD011955, 2009. a
Li, D., Vogel, B., Bian, J., Müller, R., Pan, L. L., Günther, G., Bai, Z., Li, Q., Zhang, J., Fan, Q., and Vömel, H.: Impact of typhoons on the composition of the upper troposphere within the Asian summer monsoon anticyclone: the SWOP campaign in Lhasa 2013, Atmos. Chem. Phys., 17, 4657–4672, https://doi.org/10.5194/acp-17-4657-2017, 2017. a
Li, D., Vogel, B., Müller, R., Bian, J., Günther, G., Li, Q., Zhang, J., Bai, Z., Vömel, H., and Riese, M.: High tropospheric ozone in Lhasa within the Asian summer monsoon anticyclone in 2013: influence of convective transport and stratospheric intrusions, Atmos. Chem. Phys., 18, 17979–17994, https://doi.org/10.5194/acp-18-17979-2018, 2018. a
Li, D., Vogel, B., Müller, R., Bian, J., Günther, G., Ploeger, F., Li, Q., Zhang, J., Bai, Z., Vömel, H., and Riese, M.: Dehydration and low ozone in the tropopause layer over the Asian monsoon caused by tropical cyclones: Lagrangian transport calculations using ERA-Interim and ERA5 reanalysis data, Atmos. Chem. Phys., 20, 4133–4152, https://doi.org/10.5194/acp-20-4133-2020, 2020. a, b
Ma, D., Bian, J., Li, D., Bai, Z., Li, Q., Zhang, J., Wang, H., Zheng, X., Hurst, D. F., and Vömel, H.: Mixing characteristics within the tropopause transition layer over the Asian summer monsoon region based on ozone and water vapor sounding data, Atmos. Res., 271, 106093, https://doi.org/10.1016/j.atmosres.2022.106093, 2022. a
Masson-Delmotte, V., Zhai, P., Pirani, A., Connors, S. L., Péan, C., Berger, S., Caud, N., Chen, Y., Goldfarb, L., Gomis, M. I., Huang, M., Leitzell, K., Lonnoy, E., Matthews, J. B. R., Maycock, T. K., Waterfield, T., Yelekçi, O., Yu, R., and Zhou, B. (Eds.): Climate Change 2021: The Physical Science Basis, Cambridge University Press, Cambridge, United Kingdom and New York, NY, USA, https://doi.org/10.1017/9781009157896, 2021. a
McCormick, M. P., Thomason, L. W., and Trepte, C. R.: Atmospheric effects of the Mt Pinatubo eruption, Nature, 373, 399–404, 1995. a, b
McKenna, D. S., Konopka, P., Grooß, J.-U., Günther, G., Müller, R., Spang, R., Offermann, D., and Orsolini, Y.: A new Chemical Lagrangian Model of the Stratosphere (CLaMS): 1. Formulation of advection and mixing, J. Geophys. Res., 107, 4309, https://doi.org/10.1029/2000JD000114, 2002. a
Minnis, P., Harrison, E., Stowe, L., Gibson, G., Denn, F., Doelling, D., and Smith Jr, W.: Radiative climate forcing by the Mount Pinatubo eruption, Science, 259, 1411–1415, 1993. a
Murphy, D. M. and Koop, T.: Review of the vapour pressures of ice and supercooled water for atmospheric applications, Q. J. Roy. Meteor.Soc., 131, 1539–1565, 2005. a
Muser, L. O., Hoshyaripour, G. A., Bruckert, J., Horváth, Á., Malinina, E., Wallis, S., Prata, F. J., Rozanov, A., von Savigny, C., Vogel, H., and Vogel, B.: Particle aging and aerosol–radiation interaction affect volcanic plume dispersion: evidence from the Raikoke 2019 eruption, Atmos. Chem. Phys., 20, 15015–15036, https://doi.org/10.5194/acp-20-15015-2020, 2020. a, b, c
Park, M., Randel, W. J., Gettleman, A., Massie, S. T., and Jiang, J. H.: Transport above the Asian summer monsoon anticyclone inferred from Aura Microwave Limb Sounder tracers, J. Geophys. Res., 112, D16309, https://doi.org/10.1029/2006JD008294, 2007. a
Ploeger, F., Gottschling, C., Griessbach, S., Grooß, J.-U., Guenther, G., Konopka, P., Müller, R., Riese, M., Stroh, F., Tao, M., Ungermann, J., Vogel, B., and von Hobe, M.: A potential vorticity-based determination of the transport barrier in the Asian summer monsoon anticyclone, Atmos. Chem. Phys., 15, 13145–13159, https://doi.org/10.5194/acp-15-13145-2015, 2015. a
Ploeger, F., Diallo, M., Charlesworth, E., Konopka, P., Legras, B., Laube, J. C., Grooß, J.-U., Günther, G., Engel, A., and Riese, M.: The stratospheric Brewer–Dobson circulation inferred from age of air in the ERA5 reanalysis, Atmos. Chem. Phys., 21, 8393–8412, https://doi.org/10.5194/acp-21-8393-2021, 2021. a
Poltera, Y., Luo, B., Wienhold, F. G., and Peter, T.: The “Golden Points” and nonequilibrium correction of high-accuracy frost point hygrometers, EGUsphere [preprint], https://doi.org/10.5194/egusphere-2025-2003, 2025. a
Pommrich, R., Müller, R., Grooß, J.-U., Konopka, P., Ploeger, F., Vogel, B., Tao, M., Hoppe, C. M., Günther, G., Spelten, N., Hoffmann, L., Pumphrey, H.-C., Viciani, S., D'Amato, F., Volk, C. M., Hoor, P., Schlager, H., and Riese, M.: Tropical troposphere to stratosphere transport of carbon monoxide and long-lived trace species in the Chemical Lagrangian Model of the Stratosphere (CLaMS), Geosci. Model Dev., 7, 2895–2916, https://doi.org/10.5194/gmd-7-2895-2014, 2014. a, b, c
Portmann, R. W., Solomon, S., Garcia, R. R., Thomason, L. W., Poole, L. R., and McCormick, M. P.: Role of aerosol variations in anthropogenic ozone depletion in the polar regions, J. Geophys. Res., 101, 22991–23006, 1996. a
Randel, W. J., Park, M., Emmons, L., Kinnison, D., Bernath, P., Walker, K. A., Boone, C., and Pumphrey, H.: Asian Monsoon Transport of Pollution to the Stratosphere, Science, 328, 611–613, https://doi.org/10.1126/science.1182274, 2010. a
Reinares Martínez, I., Evan, S., Wienhold, F. G., Brioude, J., Jensen, E. J., Thornberry, T. D., Héron, D., Verreyken, B., Körner, S., Vömel, H., Metzger, J.-M., and Posny, F.: Unprecedented observations of a nascent in situ cirrus in the tropical tropopause layer, Geophys. Res. Lett., 48, e2020GL090936, https://doi.org/10.1029/2020GL090936, 2021. a, b, c, d
Santee, M. L., Manney, G. L., Livesey, N. J., Schwartz, M. J., Neu, J. L., and Read, W. G.: A comprehensive overview of the climatological composition of the Asian summer monsoon anticyclone based on 10 years of Aura Microwave Limb Sounder measurements, J. Geophys. Res., 122, 5491–5514, https://doi.org/10.1002/2016JD026408, 2017. a, b
Schmidt, A. and Black, B. A.: Reckoning with the rocky relationship between eruption size and climate response: toward a volcano-climate index, Annu. Rev. Earth Pl. Sc., 50, 627–661, 2022. a
Schmidt, A., Mills, M. J., Ghan, S., Gregory, J. M., Allan, R. P., Andrews, T., Bardeen, C. G., Conley, A., Forster, P. M., Gettelman, A., Portmann, R. W., Solomon, S., and Toon, O. B.: Volcanic radiative forcing from 1979 to 2015, J. Geophys. Res.-Atmos., 123, 12491–12508, 2018. a
Solomon, S.: Stratospheric ozone depletion: A review of concepts and history, Rev. Geophys., 37, 275–316, https://doi.org/10.1029/1999RG900008, 1999. a
Solomon, S., Daniel, J. S., Neely, R. R., Vernier, J.-P., Dutton, E. G., and Thomason, L. W.: The Persistently Variable “Background” Stratospheric Aerosol Layer and Global Climate Change, Science, 333, 866–870, https://doi.org/10.1126/science.1206027, 2011. a, b
Solomon, S., Ivy, D. J., Kinnison, D., Mills, M. J., Neely, R. R., and Schmidt, A.: Emergence of healing in the Antarctic ozone layer, Science, 353, 269–274, https://doi.org/10.1126/science.aae0061, 2016. a
Tabazadeh, A., Drdla, K., Schoeberl, M. R., Hamill, P., and Toon, O. B.: Arctic “ozone hole” in a cold volcanic stratosphere, P. Natl. Acad. Sci. USA, 99, 2609–2612, 2002. a
Theys, N., De Smedt, I., Yu, H., Danckaert, T., van Gent, J., Hörmann, C., Wagner, T., Hedelt, P., Bauer, H., Romahn, F., Pedergnana, M., Loyola, D., and Van Roozendael, M.: Sulfur dioxide retrievals from TROPOMI onboard Sentinel-5 Precursor: algorithm theoretical basis, Atmos. Meas. Tech., 10, 119–153, https://doi.org/10.5194/amt-10-119-2017, 2017. a
Theys, N., Smedt, I. D., Lerot, C., Vlietinck, J., Yu, H., Roozendael, M. V., Hedelt, P., and Romahn, F.: Sentinel-5P/TROPOMI SO2 Level-2 Algorithm Theoretical Basis Document, 87 pp., https://sentinels.copernicus.eu/documents/247904/2476257/Sentinel-5P-ATBD-SO2-TROPOMI.pdf (last access: 25 March 2026), 2024. a, b, c, d
Thompson, D. W. J. and Solomon, S.: Understanding Recent Stratospheric Climate Change, J. Climate, 22, 1934–1943, https://doi.org/10.1175/2008JCLI2482.1, 2009. a, b
Todt, M. A., Asher, E., Hall, E., Cullis, P., Jordan, A., Xiong, K., Hurst, D. F., and Thornberry, T.: Baseline Balloon Stratospheric Aerosol Profiles (B2SAP)–Systematic Measurements of Aerosol Number Density and Size, J. Geophys. Res.-Atmos., 128, e2022JD038041, https://doi.org/10.1029/2022JD038041, 2023. a, b
Toohey, M., Jia, Y., Khanal, S., and Tegtmeier, S.: Stratospheric residence time and the lifetime of volcanic stratospheric aerosols, Atmos. Chem. Phys., 25, 3821–3839, https://doi.org/10.5194/acp-25-3821-2025, 2025. a
Veefkind, J. P., Aben, I., McMullan, K., Förster, H., de Vries, J., Otter, G., Claas, J., Eskes, H. J., de Haan, J. F., Kleipool, Q., van Weele, M., Hasekamp, O., Hoogeveen, R., Landgraf, J., Snel, R., Tol, P., Ingmann, P., Voors, R., Kruizinga, B., Vink, R., Visser, H., and Levelt, P. F.: TROPOMI on the ESA Sentinel-5 Precursor: A GMES mission for global observations of the atmospheric composition for climate, air quality and ozone layer applications, Remote Sens. Environ., 120, 70–83, 2012. a
Vernier, J., Thomason, L. W., Fairlie, T. D., Minnis, P., Bedka, K. M., and Palikonda, R.: Comment on “Large Volcanic Aerosol Load in the Stratosphere Linked to Asian Monsoon Transport”, Science, 339, 647, https://doi.org/10.1126/science.1227817, 2013. a
Vernier, J. P., Fairlie, T. D., Natarajan, M., Wienhold, F. G., Bian, J., Martinsson, B. G., Crumeyrolle, S., Thomason, L. W., and Bedka, K. M.: Increase in upper tropospheric and lower stratospheric aerosol levels and its potential connection with Asian pollution, J. Geophys. Res., 120, 1608–1619, https://doi.org/10.1002/2014JD022372, 2015. a, b, c, d, e
Vernier, J.-P., Fairlie, T. D., Deshler, T., Ratnam, M. V., Gadhavi, H., Kumar, B. S., Natarajan, M., Pandit, A. K., Raj, S. T. A., Kumar, A. H., Jayaraman, A., Singh, A. K., Rastogi, N., Sinha, P. R., Kumar, S., Tiwari, S., Wegner, T., Baker, N., Vignelles, D., Stenchikov, G., Shevchenko, I., Smith, J., Bedka, K., Kesarkar, A., Singh, V., Bhate, J., Ravikiran, V., Rao, M. D., Ravindrababu, S., Patel, A., Vernier, H., Wienhold, F. G., Liu, H., Knepp, T. N., Thomason, L., Crawford, J., Ziemba, L., Moore, J., Crumeyrolle, S., Williamson, M., Berthet, G., Jégou, F., and Renard, J.-B.: BATAL: The Balloon Measurement Campaigns of the Asian Tropopause Aerosol Layer, B. Am. Meteorol. Soc., 99, 955–973, https://doi.org/10.1175/BAMS-D-17-0014.1, 2018. a
Vernier, J.-P., Aubry, T. J., Timmreck, C., Schmidt, A., Clarisse, L., Prata, F., Theys, N., Prata, A. T., Mann, G., Choi, H., Carn, S., Rigby, R., Loughlin, S. C., and Stevenson, J. A.: The 2019 Raikoke eruption as a testbed used by the Volcano Response group for rapid assessment of volcanic atmospheric impacts, Atmos. Chem. Phys., 24, 5765–5782, https://doi.org/10.5194/acp-24-5765-2024, 2024. a, b, c, d
Vogel, B., Günther, G., Müller, R., Grooß, J.-U., Afchine, A., Bozem, H., Hoor, P., Krämer, M., Müller, S., Riese, M., Rolf, C., Spelten, N., Stiller, G. P., Ungermann, J., and Zahn, A.: Long-range transport pathways of tropospheric source gases originating in Asia into the northern lower stratosphere during the Asian monsoon season 2012, Atmos. Chem. Phys., 16, 15301–15325, https://doi.org/10.5194/acp-16-15301-2016, 2016. a
Vogel, B., Müller, R., Günther, G., Spang, R., Hanumanthu, S., Li, D., Riese, M., and Stiller, G. P.: Lagrangian simulations of the transport of young air masses to the top of the Asian monsoon anticyclone and into the tropical pipe, Atmos. Chem. Phys., 19, 6007–6034, https://doi.org/10.5194/acp-19-6007-2019, 2019. a, b
Vogel, B., Volk, C. M., Wintel, J., Lauther, V., Clemens, J., Grooß, J.-U., Günther, G., Hoffmann, L., Laube, J. C., Müller, R., Ploeger, F., and Stroh, F.: Evaluation of vertical transport in ERA5 and ERA-Interim reanalysis using high-altitude aircraft measurements in the Asian summer monsoon 2017, Atmos. Chem. Phys., 24, 317–343, https://doi.org/10.5194/acp-24-317-2024, 2024. a
Vogel, B., Lauther, V., Köllner, F., Ekinci, F., Rolf, C., Strobel, J., van Luijt, R., Volk, M. C., Borrmann, S., Dragoneas, A., Eppers, O., Molleker, S., Hoor, P., Ort, L., Weyland, F., Zahn, A., Clemens, J., Günther, G., Kachula, O., Müller, R., Ploeger, F., and Riese, M.: Continental and marine source regions contributing to the outflow of the Asian summer monsoon anticyclone during the PHILEAS campaign in summer 2023, EGUsphere [preprint], https://doi.org/10.5194/egusphere-2025-5609, 2025. a
Vömel, H., Naebert, T., Dirksen, R., and Sommer, M.: An update on the uncertainties of water vapor measurements using cryogenic frost point hygrometers, Atmos. Meas. Tech., 9, 3755–3768, https://doi.org/10.5194/amt-9-3755-2016, 2016. a
Wu, X., Qiao, Q., Chen, B., Wang, X., Hoffmann, L., Griessbach, S., Tian, Y., and Wang, Y.: The influence of the Asian summer monsoon on volcanic aerosol transport in the UTLS region, npj Clim. Atmos. Sci., 6, 11, 2023. a
Yang, Z., Li, D., Luo, J., Tian, W., Bai, Z., Li, Q., Zhang, J., Wang, H., Zheng, X., Vömel, H., Wienhold, F. G., Peter, T., Hurst, D., and Bian, J.: Determination of cirrus occurrence and distribution characteristics over the Tibetan Plateau based on the SWOP campaign, J. Geophys. Res.-Atmos., 128, e2022JD037682, https://doi.org/10.1029/2022JD037682, 2023. a, b, c, d
Yu, P., Rosenlof, K. H., Liu, S., Telg, H., Thornberry, T. D., Rollins, A. W., Portmann, R. W., Bai, Z., Ray, E. A., Duan, Y., Pan, L. L., Toon, O. B., Bian, J., and Gao, R.-S.: Efficient transport of tropospheric aerosol into the stratosphere via the Asian summer monsoon anticyclone, P. Natl. Acad. Sci. USA, 114, 6972–6977, https://doi.org/10.1073/pnas.1701170114, 2017. a
Yu, P., Portmann, R. W., Peng, Y., Liu, C.-C., Zhu, Y., Asher, E., Bai, Z., Lu, Y., Bian, J., Mills, M. J., Schmidt, A., Rosenlof, K. H., and Toon, O. B.: Radiative forcing from the 2014–2022 volcanic and wildfire injections, Geophys. Res. Lett., 50, e2023GL103791, 2023. a
Zhu, Y., Bardeen, C. G., Tilmes, S., Mills, M. J., Wang, X., Harvey, V. L., Taha, G., Kinnison, D., Portmann, R. W., Yu, P., Rosenlof, K. H., Avery, M., Kloss, C., Li, C., Glanville, A. S., Millán, L., Deshler, T., Krotkov, N., and Toon, O. B.: Perturbations in stratospheric aerosol evolution due to the water-rich plume of the 2022 Hunga-Tonga eruption, Communications Earth & Environment, 3, 248, https://doi.org/10.1038/s43247-022-00580-w, 2022. a
Zuev, V., Zueva, N., Savelieva, E., and Gerasimov, V.: The Antarctic ozone depletion caused by Erebus volcano gas emissions, Atmos. Environ., 122, 393–399, https://doi.org/10.1016/j.atmosenv.2015.10.005, 2015. a