the Creative Commons Attribution 4.0 License.
the Creative Commons Attribution 4.0 License.
 | 09 Apr 2026
Microphysical properties of various precipitation systems worldwide classified via objective methods based on dual-frequency precipitation radar observations
Yujia Zhang
Xiaodong Zhang
Microphysical properties play crucial roles in physical processes related to the development of precipitation. In this study, Global Precipitation Measurement (GPM) dual-frequency precipitation radar (DPR) data were processed to demonstrate the microphysical properties of different precipitation systems (PS) that are objectively classified with the k-means clustering algorithm. Four types of regular/non-extreme PS (high-latitude shallow PS, subtropical shallow PS, moderate PS, deep PS) and four types of extreme PS (extreme deep PS, strong PS, extreme strong PS, and marine extreme PS) were recognized. These eight types of PS exhibit differences in spatial-temporal features and convection characteristics, such as storm height, rain intensity, and vertical structures. For example, the extreme strong PS, with the highest radar echo top and largest mean mass-weighted mean diameter are mainly located over tropical continents, whereas high-latitude shallow PS have the least precipitation rate and mean normalized intercept parameter values. The relationships between convection features and microphysical properties also vary among the eight types of PS. For extreme PS, maximum precipitation rate near the surface generally exceeds 100 mm h−1 and balanced breakup and coalescence processes play a dominant role compared with non-extreme PS. In contrast, the coalescence processes dominate near the surface in two types of shallow PS. These results highlight the diversity of global precipitation microphysics and emphasize the necessity of global studies to increase the understanding of precipitation processes.
Please read the corrigendum first before continuing.
-
Notice on corrigendum
The requested paper has a corresponding corrigendum published. Please read the corrigendum first before downloading the article.
-
Article
(11047 KB)
- Corrigendum
-
Supplement
(779 KB)
-
The requested paper has a corresponding corrigendum published. Please read the corrigendum first before downloading the article.
- Article
(11047 KB) - Full-text XML
- Corrigendum
-
Supplement
(779 KB) - BibTeX
- EndNote


The microphysical characteristics of precipitation provide crucial information for describing precipitation. The deficiency of precipitation microphysical parameterization schemes is a significant factor contributing to precipitation errors in weather and climate models (Snook and Xue, 2008). Accurately obtaining spatiotemporal variations in precipitation microphysical parameters is essential for understanding the physical processes of precipitation, increasing the accuracy of quantitative precipitation estimation, and evaluating microphysical parameterizations in models (Chen et al., 2011; Zhang et al., 2023). Currently, observations and characteristics of precipitation microphysics at the global scale remain lacking because of the limited number of observation approaches.
The drop size distribution (DSD) is a typical metric for depicting precipitation microphysics. DSD features can be derived from observations obtained via disdrometers, ground-based radar instruments, and space-based radar instruments. In radar instruments, the interaction of electromagnetic waves with hydrometeors is used to retrieve DSD parameters (Marzuki et al., 2023), whereas disdrometers measure raindrop counts to directly obtain DSDs at the surface. Disdrometers provide only point measurements at specific levels and cannot measure the vertical structure of DSDs. Moreover, disdrometer observations are relatively sparse, especially over the ocean. Although ground-based radar instruments can measure the three-dimensional structure of precipitation, they can only be used in limited areas, and their observation accuracy is significantly affected by the terrain conditions within the observation area (Dai et al., 2020). In contrast, space-based radar instruments can provide the vertical structures of DSD parameters worldwide. This study focuses on the microphysical characteristics of various precipitation systems (PS) worldwide. Compared with other instruments, space-based radar instruments are the most suitable for researching global precipitation microphysics.
In 1997, the Tropical Rainfall Measuring Mission (TRMM) satellite was launched by the National Aeronautics and Space Administration (NASA) and the Japan Aerospace Exploration Agency (JAXA). The precipitation radar (PR), which operates in the Ku-band (13.8 GHz), was carried by the TRMM (Iguchi et al., 2000). This marked the beginning of the observation of precipitation microphysics via space-based radar instruments. In 2014, NASA and JAXA successfully launched the Global Precipitation Measurement (GPM) Core Observatory (GPM-CO). The GPM-CO carried the first spaceborne dual-frequency precipitation radar (DPR) system, operating in the Ku and Ka bands (13.6 and 35.5 GHz, respectively) (Skofronick-Jackson et al., 2017). Via the use of this characteristic, mean mass-weighted mean diameter (Dm) and mean normalized intercept parameter (Nw) can be retrieved. The retrieved DSD parameters have been verified with ground-based observations and exhibit closer agreement with in situ measurements than those derived from the TRMM PR algorithm (Sun et al., 2020). In addition, validation studies have confirmed the feasibility of using DPR observations for DSD parameter analysis (D'Adderio et al., 2018; Peinó et al., 2024). Peinó et al. (2024) used observational data from seven Parsivel disdrometers across different topographic zones in the western Mediterranean to validate GPM DSD products. They reported that the GPM DPR products effectively captured the variations in DSDs observed under different rainfall intensities. Therefore, GPM DSD products have been widely employed to investigate the microphysical characteristics of precipitation in the literature (Wen et al., 2023, 2024).
However, previous studies involving GPM DSD products have focused mainly on specific locations or weather systems. For example, Li et al. (2024) studied the vertical structure and DSD characteristics of different precipitation types during the rainy season over South China and reported that the precipitation type and intensity affect the DSD parameters. In their study, under the same precipitation intensity, shallow convective precipitation exhibited the smallest Dm and largest Nw values, whereas deep convective precipitation exhibited the opposite phenomenon. Additionally, regarding stratiform precipitation, for precipitation rate > 3.5 mm h−1, Dm slightly increased, and in regard to shallow convective precipitation, Dm remained at approximately 1.3 mm for Precipitation Rate > 2 mm h−1. Similarly, Wen et al. (2023) analyzed the seasonal variations in the vertical structure of precipitation microphysics in East China. They reported that the spatial distributions of Dm and Nw demonstrated obvious seasonal variations and that there are more small raindrops in convective precipitation in autumn and winter than during the other seasons. Additionally, regarding weather conditions, regional variations in the precipitation characteristics of tropical cyclones have been investigated over the North Indian Ocean (Kumar et al., 2023). Research has revealed that the nature of microphysical processes largely influences the growth of droplets in convective and stratiform rain. Wu et al. (2022) investigated the DSD characteristics of record-breaking Typhoon In-Fa. Their findings revealed significant internal and regional differences in the microphysical characteristics of typhoon precipitation. When different precipitation types during Typhoon In-Fa were compared, convective precipitation (Nw values ranging from 3.80 to 3.96 m−3 mm−1) exhibited higher raindrop concentrations than did stratiform precipitation (Nw values ranging from 3.40 to 3.50 m−3 mm−1). Additionally, convective precipitation during Typhoon In-Fa indicated a greater (lower) raindrop concentration than that during Typhoon Taiwan (Hainan), while the raindrop diameter was smaller than those during both Typhoons Taiwan and Hainan. These studies primarily focused on the microphysical process and structure of various weather conditions, which provided insight into the formation process of precipitation.
At present, there are few studies on the microphysical characteristics of large-scale and global PS. On the one hand, as mentioned above, the DSD is influenced by numerous factors, such as precipitation type and season. There may be multiple precipitation types and DSDs in one area. On the other hand, few DSD datasets covering the whole world are available. Dolan et al. (2018) used twelve disdrometer datasets across three latitudinal zones – high-latitude, midlatitude, and low-latitude zones – to analyze DSD spatial variability. They reported that the DSD varies with latitude. At low latitudes, moderate Dm values (1.5–2 mm) and large log10(Nw) values (> 4 m−3 mm−1) dominated. At midlatitudes, high Dm values and small Nw values dominated. At high latitudes, low Dm and large Nw values prevailed. The twelve disdrometers mainly located in the United States, Darwin, Finland, and central Indian ocean, and hence it failed to capture precipitation microphysical characteristics over all climatic regimes. Hence, in this study, GPM DSD products were employed to investigate the microphysical characteristics of PS at global scales.
This study aims to objectively classify PS based on DPR observations using a machine learning approach and to systematically analyze the microphysical characteristics of the resulting PS types. By constructing a unified, data-driven classification framework, the results help clarify regional variability in drop size distributions (DSDs) and provide new insight into the microphysical processes governing different precipitation regimes. This study is organized in four sections. Section 2 provides detailed descriptions of the GPM data and machine learning models applied in this study. The main results are presented in Sect. 3, and finally, a summary is given in Sect. 4.
2.1 Data
GPM observations cover the range from 65° S to 65° N (Hou et al., 2014; Tapiador et al., 2012). The GPM DPR operates in the Ka and Ku bands, with a spatial resolution of approximately 5 × 5 km2. The scanning of DPR is cross-track and has three scan patterns: normal scan, matching scan, and high sensitivity scan (Das et al., 2022). Since the scanning pattern of the Ka-band was changed in 2018 (Awaka et al., 2021), the GPM 2A DPR (version 7) products considered the changes in the Ka-band scan pattern with a more accurate precipitation estimation algorithm. The product formats in version 7 have been changed from the original three types to two types: Full scan and High Sensitivity scan. The Full scan product exhibits a new format and is defined as a full-scan dual-frequency product with a 125 m vertical range resolution. Compared with previous algorithms, the FS mode makes it possible for the first time to process a full-scan band of approximately 245 km in dual-band mode (Awaka et al., 2021). Therefore, the observations from the Full scan were adopted in this study.
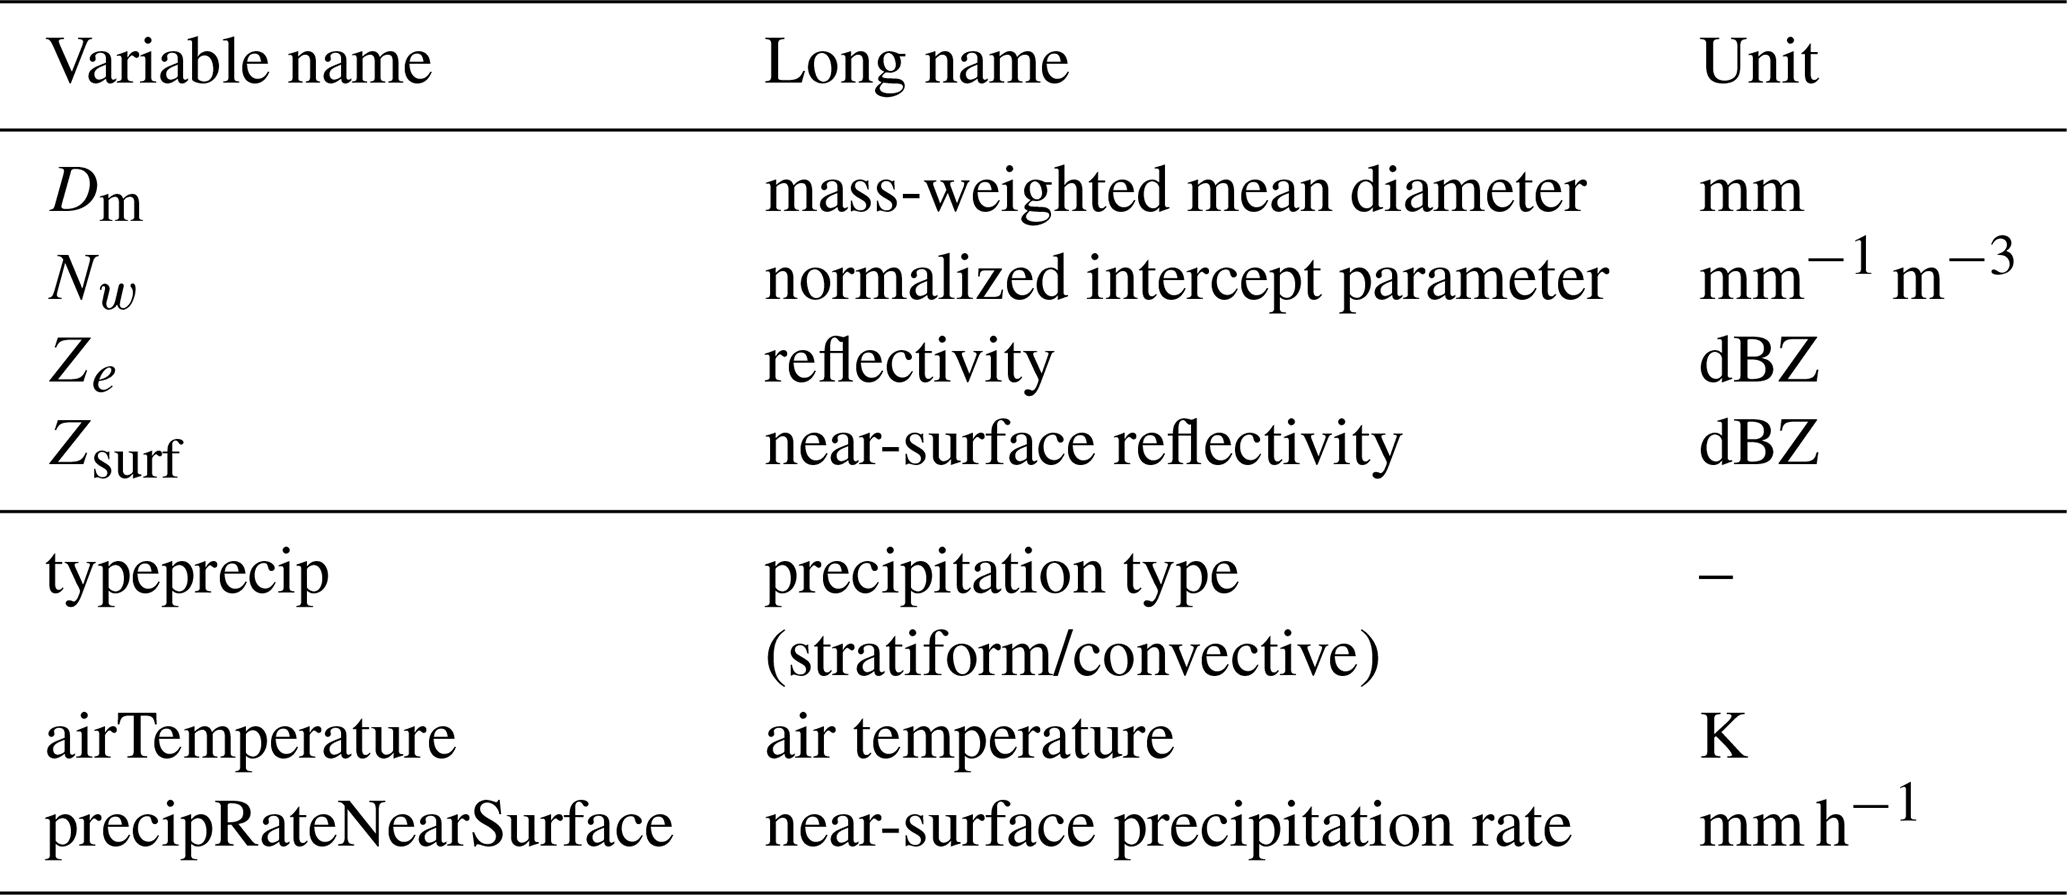
In this study, five years (2018–2022) of 2A DPR products (version 7) were employed. The parameters used in this machine learning model are showed in Table 1. Detailed descriptions of the generation and retrieval of these parameters can be found in Iguchi et al. (2021). The microphysical variables analyzed here are directly taken from the standard GPM DPR products. Previous studies have extensively evaluated the GPM DPR products on a global scale (Chase et al., 2020; Gatlin et al., 2020; Huang et al., 2022; Peinó et al., 2024; Seela et al., 2023), supporting their suitability for scientific analyses. The precipitation type helps distinguish between stratiform and convective precipitation pixels, while air temperature is used to separate snow from rain. Although the DPR product provides a precipitation phase flag, its determination mainly depends on bright-band detection and the 0°C level, which may misclassify surface precipitation under near-freezing conditions. To more strictly exclude potential solid or mixed-phase cases at the surface, this study additionally applies a surface air temperature threshold (> 10 °C) when identifying rain-dominated precipitation systems.
Table 1Summary of the input variables used in the machine learning model, including the original DPR variable names, descriptions, and units.
2.2 Precipitation system (PS)
This paper presents a method based on the connected domain principle for identifying PS, similar to those contained in the widely used TRMM/GPM Precipitation Feature dataset (Liu et al., 2008, 2020). First, pixels with precipitation no less than 0.1 mm h−1 are derived from DPR orbit data. Then, neighboring precipitation pixels, including diagonally adjacent precipitation pixels, are grouped together as a PS. Each PS is required to have a minimum of four precipitation pixels.
The DPR provides three-dimensional structure of precipitation and DPR products include radar reflectivity parameters and retrieved DSD parameters from 0 to 22 km with a range resolution of 125 m. Consequently, for each PS type, DSD and radar reflectivity parameters such as the maximum and average values of each layer were calculated. The average Dm and Nw profiles were used for each PS, and when referring to the maximum Dm and Nw values in each layer, MAX-Dm and MAX-Nw were used, respectively. Given the potential relationships of the convective intensity with microphysical parameters, Ze in the product was employed to calculate several convection indicators. These include the maximum 20/30/40 dBZ echo top height (MAXHT20/30/40) for each type of PS (Liu, 2011; Liu et al., 2020; Ni et al., 2019; Roy et al., 2020), the echo top height of the PS (Htop) (Arulraj and Barros, 2021), and other convective parameters. To describe PS conditions, several additional features were calculated, including the maximum precipitation rate near the surface (maximum precipitation rate of the precipitation pixels included in the PS) and precipitation area (the number of precipitation pixels contained in the PS). For the stratiform, convective, land, and oceanic percentages, the corresponding pixel fractions among each individual PS were first calculated. These fractions were then averaged across all PS within a given cluster to represent the cluster-level characteristics. Considering that the GPM satellite exhibits a higher observation frequency in high-latitude regions (approximately 2–3 times that at the equator), the original dataset is prone to oversampling in these areas, which can introduce bias. To construct a balanced dataset suitable for clustering analysis, this study implemented a homogenization for the sampling. Specifically, the satellite's observation frequency was calculated as a function of latitude, and sample size for each latitude was adjusted using the ratio of its frequency to that at the equator. Subsequently, precipitation systems were randomly selected from each latitude to ensure a consistent scaled sample size, thereby effectively addressing the issue of uneven sampling. Finally, a total of 8 924 307 PS were obtained for subsequent analysis.
2.3 Methods
In this study, two distinct machine learning models, namely k-means clustering and principal component analysis (PCA) were used. Both models were trained and evaluated via the Python scikit-learn package. These models are briefly described below. The k-means algorithm is a widely used unsupervised clustering method in machine learning because of its simplicity and computational efficiency (Jain, 2010). The algorithm follows a three-step process. Initially, it aims to select initial cluster centers by randomly obtaining sample coordinates from the dataset and assigning each sample to its nearest cluster center. Next, it computes the mean of all sample points assigned to each previous cluster center to establish new cluster centers. Finally, the algorithm aims to evaluate the differences between the new and old cluster centers. If differences are present, the last two steps are repeated until the cluster centers stabilize and no longer shift (Jain, 2010).
PCA is a classical dimensionality reduction tool in machine learning (Gang and Bajwa, 2022). PCA is based on the linear combination of target features to construct the principal subspace, and the variance is then employed to measure the information content with the aim of identifying the linear subspace with the maximum variance (Marukatat, 2023). In summary, PCA aims to transform numerous irrelevant features into a comparatively limited number of pertinent ones, thereby retaining as much of the informational content of the original data as possible (Gang and Bajwa, 2022). In our case, we used PCA to reduce the v dimension, compressing the original 176 height levels into a single representative component for each variable (Ze, Dm, or Nw). Vertically integrated variables (e.g., total water path) are not used here, because while they have clear physical meaning, they aggregate information across the vertical column and may obscure important vertical contrasts relevant to precipitation processes. Only one principal component per variable was retained for each profile, as this sufficiently captures the dominant variance of the vertical structure and served as a compact descriptor for clustering (Festa et al., 2023; Jolliffe and Cadima, 2016). The PCA was applied once, independently, for each parameter. Time was not treated as an input dimension; only the vertical (height) dimension was reduced.
In this study, all the ∼ 9 million PS derived in Sect. 2.2 are used. Input parameters of each PS for k-means clustering include the maximum precipitation rate near the surface, the echo top height of the PS, the precipitation area, the proportion of stratiform precipitation, the proportion of convective precipitation, the DSD parameters (Dm and Nw), the maximum Ze, and the first principal component score of the vertical profiles of Ze, Dm, and Nw. These parameters were selected based on their critical role in comprehensively characterizing the features, structure, and microphysical processes of precipitation systems. Among them, the maximum surface precipitation rate and Ze reflect the intensity of the precipitation process and its echo characteristics, while the precipitation area directly characterizes the spatial differences in the horizontal distributions of the system. The Htop not only reveals the vertical distribution but also captures the top-level information of the precipitation cloud through the maximum reflectivity height. Introducing the proportions of stratiform and convective precipitation facilitates the differentiation of precipitation types generated by distinct mechanisms, thereby elucidating their evolution patterns and dynamic characteristics. Furthermore, the DSD parameters (Dm and Nw) effectively describe the size distribution of precipitation particles and their intrinsic physical processes, providing an essential basis for an in-depth understanding of precipitation microphysics.
The quality of clustering was evaluated by analyzing different clustering structures derived from the same dataset. Common clustering performance metrics include the sum of squared errors (SSE), Davis Bouldin (DB) index, Calinski-Harabasz (CH) Score (El Khattabi et al., 2024) and silhouette index, which are widely used to evaluate clustering effectiveness and quality (Ay et al., 2023). In this case, the DB index was calculated by computing the average sum of the intraclass distances between any two clusters divided by the distance between the centers of those two clusters and obtaining the maximum value. The DB index can manage clusters of different sizes and densities with a high degree of robustness to noise and outliers. A lower DB index indicates better clustering performance (Sowan et al., 2023). Additionally, the CH score, which assesses clustering compactness and separation, was also considered. Higher CH scores indicates better-defined clusters. Algorithms with clustering numbers ranging from 3 to 20 were executed, and the resulting change in the DB index and CH score was plotted (refer to Fig. S1 in the Supplement). As shown in Fig. S1, when K = 8, the DB index reaches its minimum while the CH index remains at a relatively high level. This indicates that the clustering at K = 8 achieves a favorable balance between intra-cluster compactness and inter-cluster separation, supporting the selection of eight clusters as an appropriate classification. Although the CH index reaches its maximum at K = 11, the improvement compared with K = 8 is marginal. A comprehensive comparison suggests that using 11 clusters would likely introduce unnecessary redundancy without substantially improving clustering performance. Therefore, based on the combined evaluation of multiple clustering validity metrics, this study ultimately classifies the precipitation systems into eight categories.
3.1 Global distributions
After clustering, each cluster was characterized by its unique precipitation and spatial distribution characteristics, including Dm, MAXHT20/30/40, and convective/stratiform fractions. Table 2 summarizes the statistics of various parameters for the eight types of PS, while Fig. 1 illustrates their spatial distributions. For clarity in the subsequent discussion, Clusters 1–8 were grouped and named based on their spatial distributions (Fig. 1) and key precipitation characteristics (Table 2). Four non-extreme precipitation systems were identified (high-latitude shallow, subtropical shallow, moderate, and deep PS), along with four extreme precipitation systems (extreme deep, strong, extreme strong, and marine extreme PS). Overall, extreme precipitation systems account for a smaller proportion and exhibit higher MAXHT20/30/40, larger Dm, and stronger precipitation rates compared with non-extreme precipitation systems. Geographically, high-latitude shallow PS are predominantly found poleward of 40° N and 35° S, whereas subtropical shallow PS mainly occur within approximately 20° of the equator. The marine extreme convection type is primarily distributed over oceanic regions.
Table 2Precipitation parameters for the different types of PS. (* indicate that in high-latitude shallow PS and subtropical shallow PS, approximately 80 % of the samples do not reach 40 dBZ. Therefore, the mean MAXHT40 for these samples is recorded as 0.).
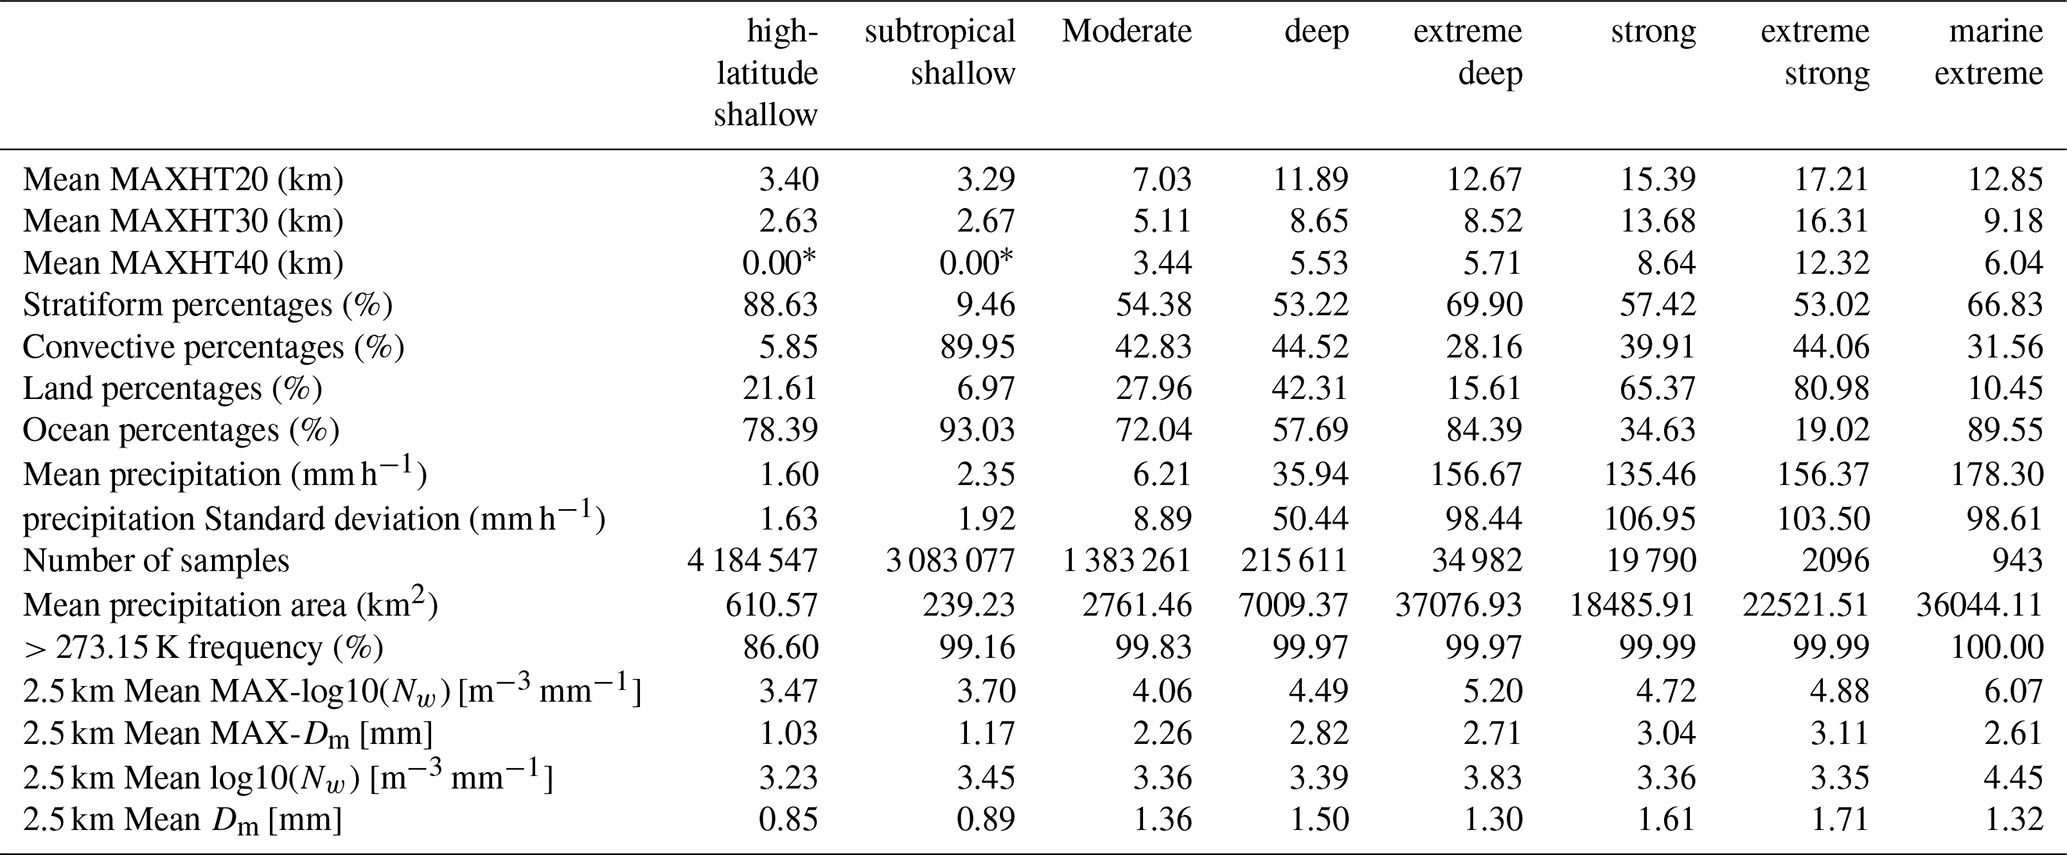
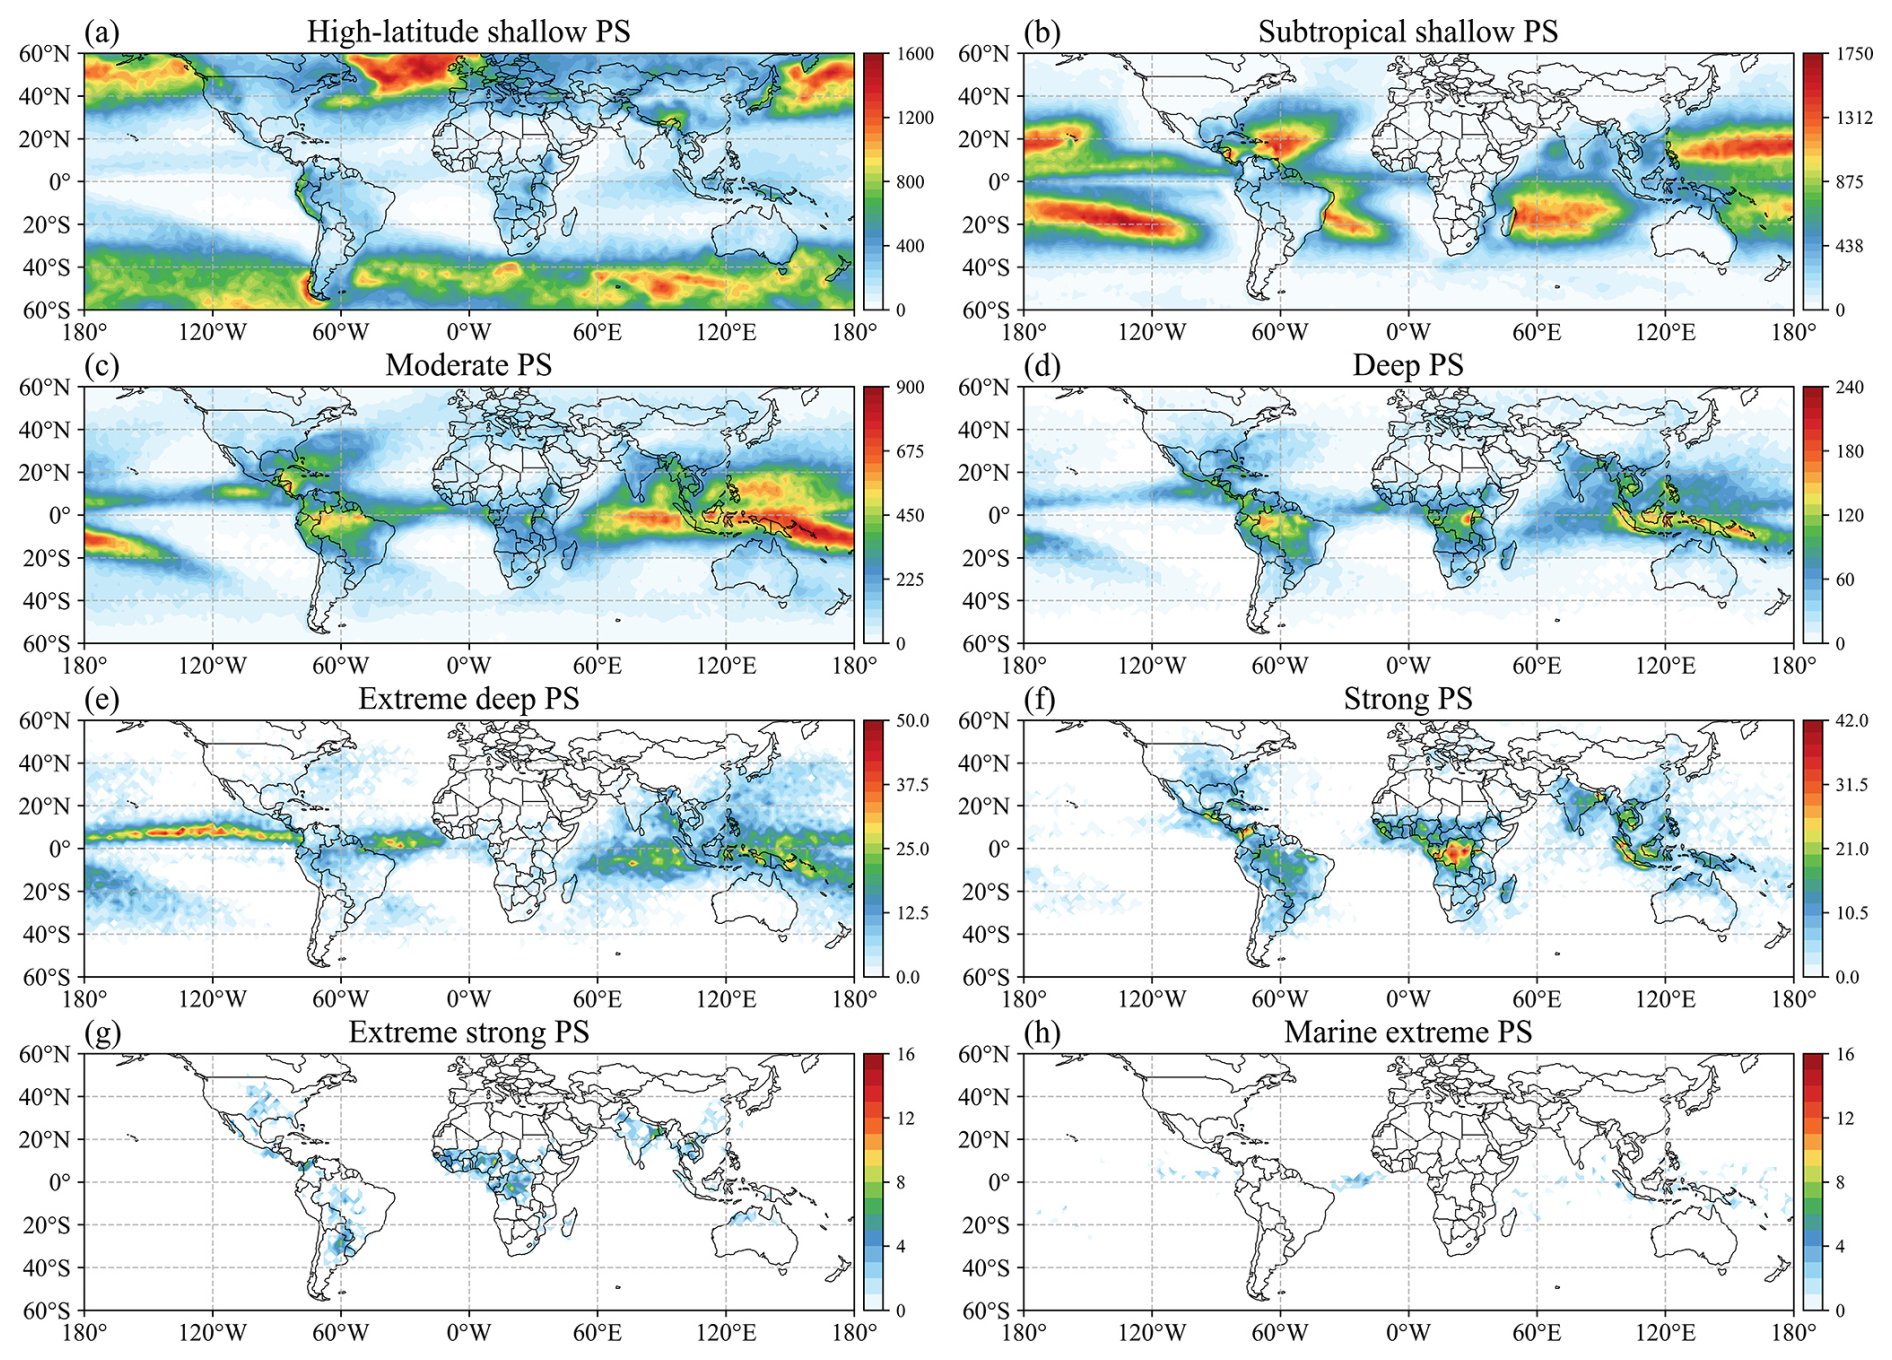
Figure 1Spatial distributions (2°×2°) of the PS counts from 2018 to 2022.
The numbers in Table 2 include abundant information and verify the rationality of the objectively clustering algorithm. First, the numbers of the various types of PS differed significantly. The two types of shallow PS (high-latitude shallow PS and subtropical shallow PS) accounted for 81.44 % of the total PS count. The proportions of deep and moderate PS were 2.41 % and 15.50 %, respectively. The other four types of PS are regarded as extreme PS (extreme deep PS, strong PS, extreme strong PS, and marine extreme PS) because they exhibit markedly stronger precipitation intensity (as shown in Figs. 4–6) and vertical development than the other categories and occur very infrequently in the global sample, accounting for only 0.39 %, 0.22 %, 0.02 %, and 0.01 % of the total PS, respectively. In the non-extreme PS, MAXHT20 is generally positively related to the precipitation rate (Table 2). However, in the extreme PS, the correlation between the extreme precipitation rate and MAXHT20 is not clear. For example, that the mean value of the maximum precipitation rate in marine extreme PS was the highest among the eight types of PS, although its MAXHT20 was less than that in extreme strong PS and close to that in extreme deep PS. This result is consistent with other studies noting a weak link between the heaviest rainfall and the highest storm top (Hamada et al., 2015). Although the convective intensity of extreme deep PS is not significantly higher than that of deep PS, it exhibits a substantially larger precipitation area and maximum precipitation rate.
High-latitude shallow PS was most prevalent at midlatitudes and high latitudes, where snowfall and sleeting are more frequent than at low latitudes. Notably, high-latitude shallow PS were dominated by stratiform precipitation, with stratiform pixels accounting for 88.63 %. Meanwhile, approximately 86.60 % of the PS exhibited surface temperatures higher than 0 °C. A study confirmed that at high latitudes and in polar regions, more than 25 % of precipitation falls as snow (von Lerber et al., 2018). This is consistent with the observations from high-latitude shallow PS. Additionally, an analysis of high-latitude shallow PS by latitude revealed that with increasing latitude, the number of samples generally increased. Moreover, the number of PS with echo top heights less than 2.5 km increased with latitude. During the winter season at 65° S, PS with echo top heights below 2.5 km accounted for approximately 50 % of the total PS there. This is likely due to the influence of the low surface temperature and weak convection (refer to Fig. S2 in the Supplement).
Subtropical shallow PS primarily occurred over the ocean dominated by the subtropical high, with a relatively limited degree of overlap with moderate PS and deep PS (Fig. 1). The mean MAXHT20 value in subtropical shallow PS was only 3.29 km, and the proportion of convective precipitation was the highest among all the types of PS, exceeding 90 %. Compared with those of the other PS, subtropical shallow PS exhibited the smallest precipitation area. Moreover, it was rarely found over land. These results support the conclusion that subtropical shallow PS is associated with isolated shallow convection over the ocean, which has been the topic of interest in previous studies (Chen and Liu, 2016; Chudler et al., 2022; Houze et al., 2015).
The geographic distribution patterns of deep PS and moderate PS were approximately the same (Fig. 1). The number of occurrences in the maritime continent (MC), Indian Ocean, Atlantic Ocean, Amazon rainforests and Pacific Ocean were relatively high. These regions are generally influenced by the Intertropical Convergence Zone (ITCZ). Nevertheless, the deep PS has higher land percentage. The mean values of the maximum precipitation rates in moderate PS and deep PS were 6.21 and 35.94 mm h−1, respectively, whereas those of MAXHT20 were 7.03 and 11.89 km, respectively. As a result, the spatial distribution of deep PS is very similar to that of the deep convection core (Ni et al., 2019), which is defined as MAXHT20 larger than 10 km.
Strong PS, extreme deep PS, extreme strong PS, and marine extreme PS demonstrated low sample sizes. However, their precipitation areas are significantly larger than non-extreme PS (Table 2). The location of extreme deep PS is similar with moderate and deep PS, with larger values for most parameters. In the extreme strong PS, the proportion of land pixels reaches 81 %, with significant concentrations in near-equatorial Africa, America, India, the southeastern US, and South America. The average maximum precipitation rate in extreme strong PS was 156.37 mm h−1, and MAXHT40 reached 12.32 km, which is the highest among all the types of PS. The high MAXHT40 value indicates strong updraft in the middle troposphere, which is a hallmark of intense convection and favors hail formation (Kumar et al., 2023; Zipser et al., 2006). Therefore, the spatial distributions of hailstorms in extreme strong PS were very similar to those of the global hail map derived from spaceborne precipitation radar (Ni et al., 2017) and passive microwave sensor (Bang and Cecil, 2021). Marine extreme PS were primarily situated in the near-equatorial marine region, with only 943 PS, of which 90 % were over the ocean. The mean maximum precipitation rate in marine extreme PS was 178.30 mm h−1, ranking first among the eight types of PS. Although the MAXHT20 value in marine extreme PS reached 12.81 km, the MAXHT40 value in marine extreme PS was approximately half of that in extreme strong PS, indicating low convection activity in the middle and upper levels. This is consistent with the findings of Liu et al. (2007), who observed that the difference between cloud-top height and MAXHT20 over land is smaller than that over the ocean, indicating that convective intensity is stronger over land than over the ocean.
Oceanic extreme PS (extreme deep PS with a high fraction of ocean pixels and marine extreme PS) have mean precipitation coverage areas exceeding 36 000 km2, significantly larger than continental extreme PS (strong PS and extreme strong PS). This spatial distribution aligns with previous findings that the most extensive precipitation systems are predominantly located in oceanic regions according to the study of Zhang and Wang (2021). Furthermore, continental extreme PS display markedly stronger convective intensity. This disparity is largely attributable to the observation that the heaviest PS generally occur over tropical land, the Western Pacific warm pool, the North American Great Plains, and Argentina, whereas the most intense convective storms are predominantly observed over continental areas (Liu and Zipser, 2015).
3.2 Global distributions of microphysical features
Figures 2 and 3 show the global distributions of the microphysical parameters for the eight types of PS. To avoid the influence of ground clutter, in each PS, the mean Dm and Nw values at 2.5 km above the ground surface were analyzed. Notably, there was a significant degree of spatial heterogeneity in each panel. The general conclusion is that continental PS exhibit a higher Dm than do oceanic PS. Usually, continental rainfall is associated with high convective activity in which clouds produce large raindrops. In contrast, oceanic rainfall is accompanied by the formation of weak updrafts and the development of a low melting layer, which impedes the formation of large raindrops and results in a high concentration of small raindrops (Saha et al., 2022; Seela et al., 2018). Moreover, Dm decreases with increasing latitude, a trend that is especially notable in high-latitude marine regions (refer to Fig. S2c in the Supplement). Cha and Yum (2021) noted that snow primarily comprises small particles (diameter < 1 mm). In high-latitude shallow PS, snowfall may become more frequent from the middle to high latitudes, which can result in a decrease in Dm. Notably, the height and thickness of the melting layer may influence raindrop growth (Hu et al., 2024). With increasing latitude, the melting layer becomes thinner, thus reducing the conditions necessary for raindrop growth, which may lead to the formation of a larger number of small raindrops. In the oceanic regions within subtropical shallow PS, the higher sea surface temperature in the tropics is more conducive to convection formation and development. Moreover, Dm varies among the eight clusters in a specific region. For example, in the Amazon region, moderate PS exhibits a lower Dm than deep PS does.
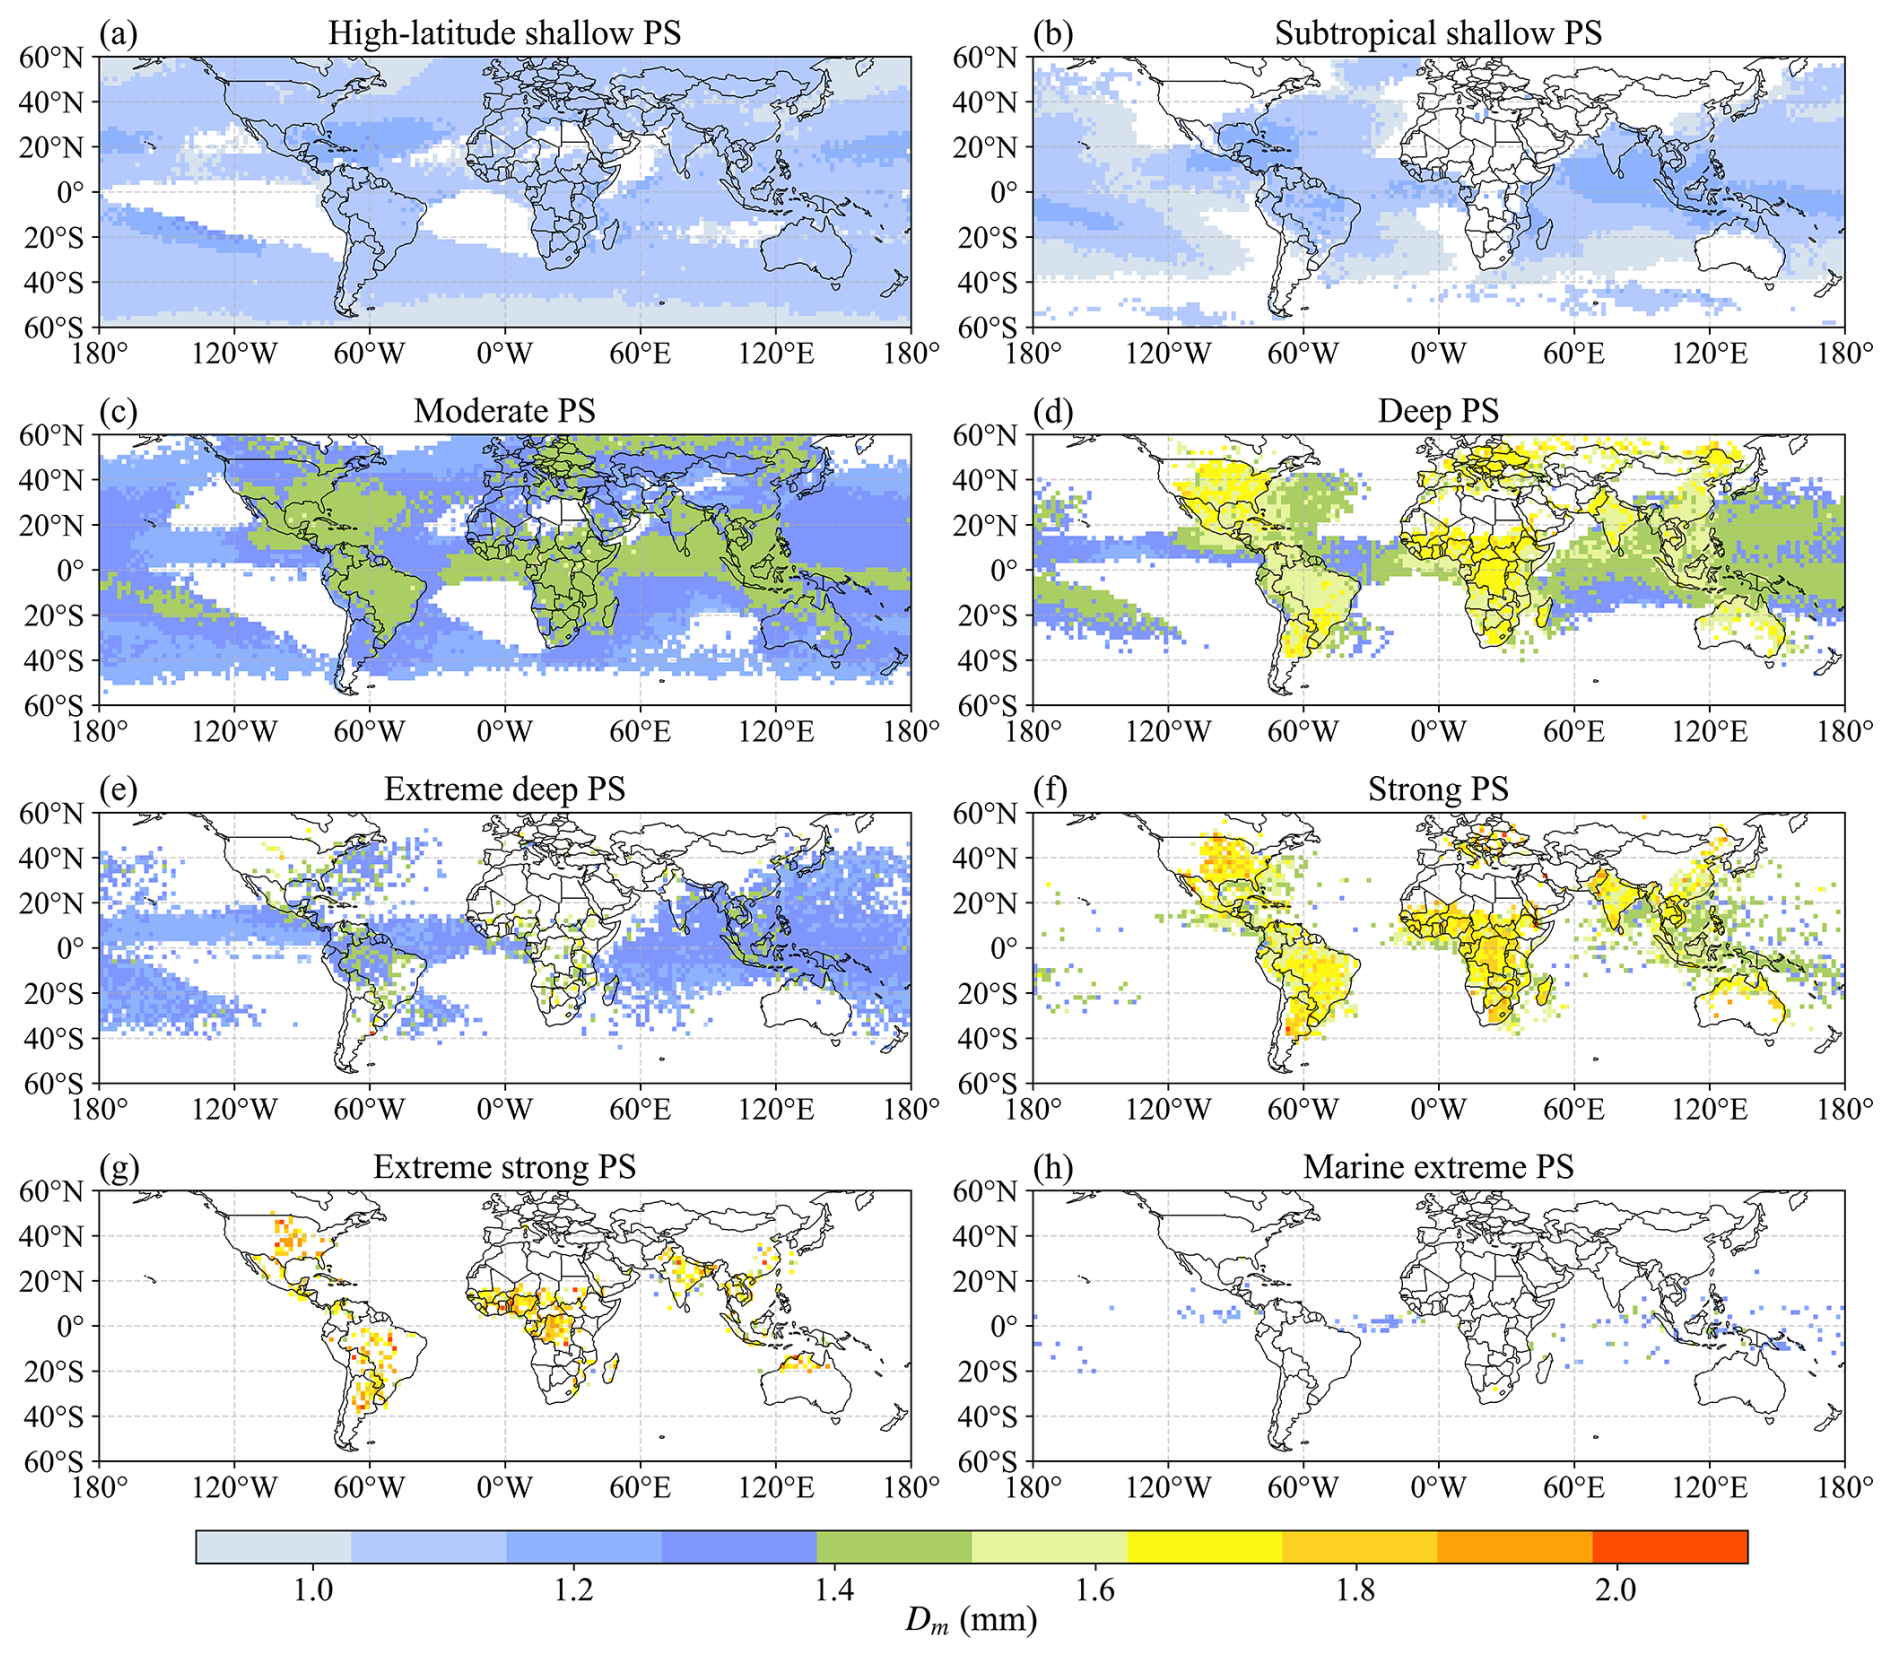
Figure 2Spatial distributions of the mass-weighted mean diameter (Dm) for the eight PS clusters at a height of 2.5 km.
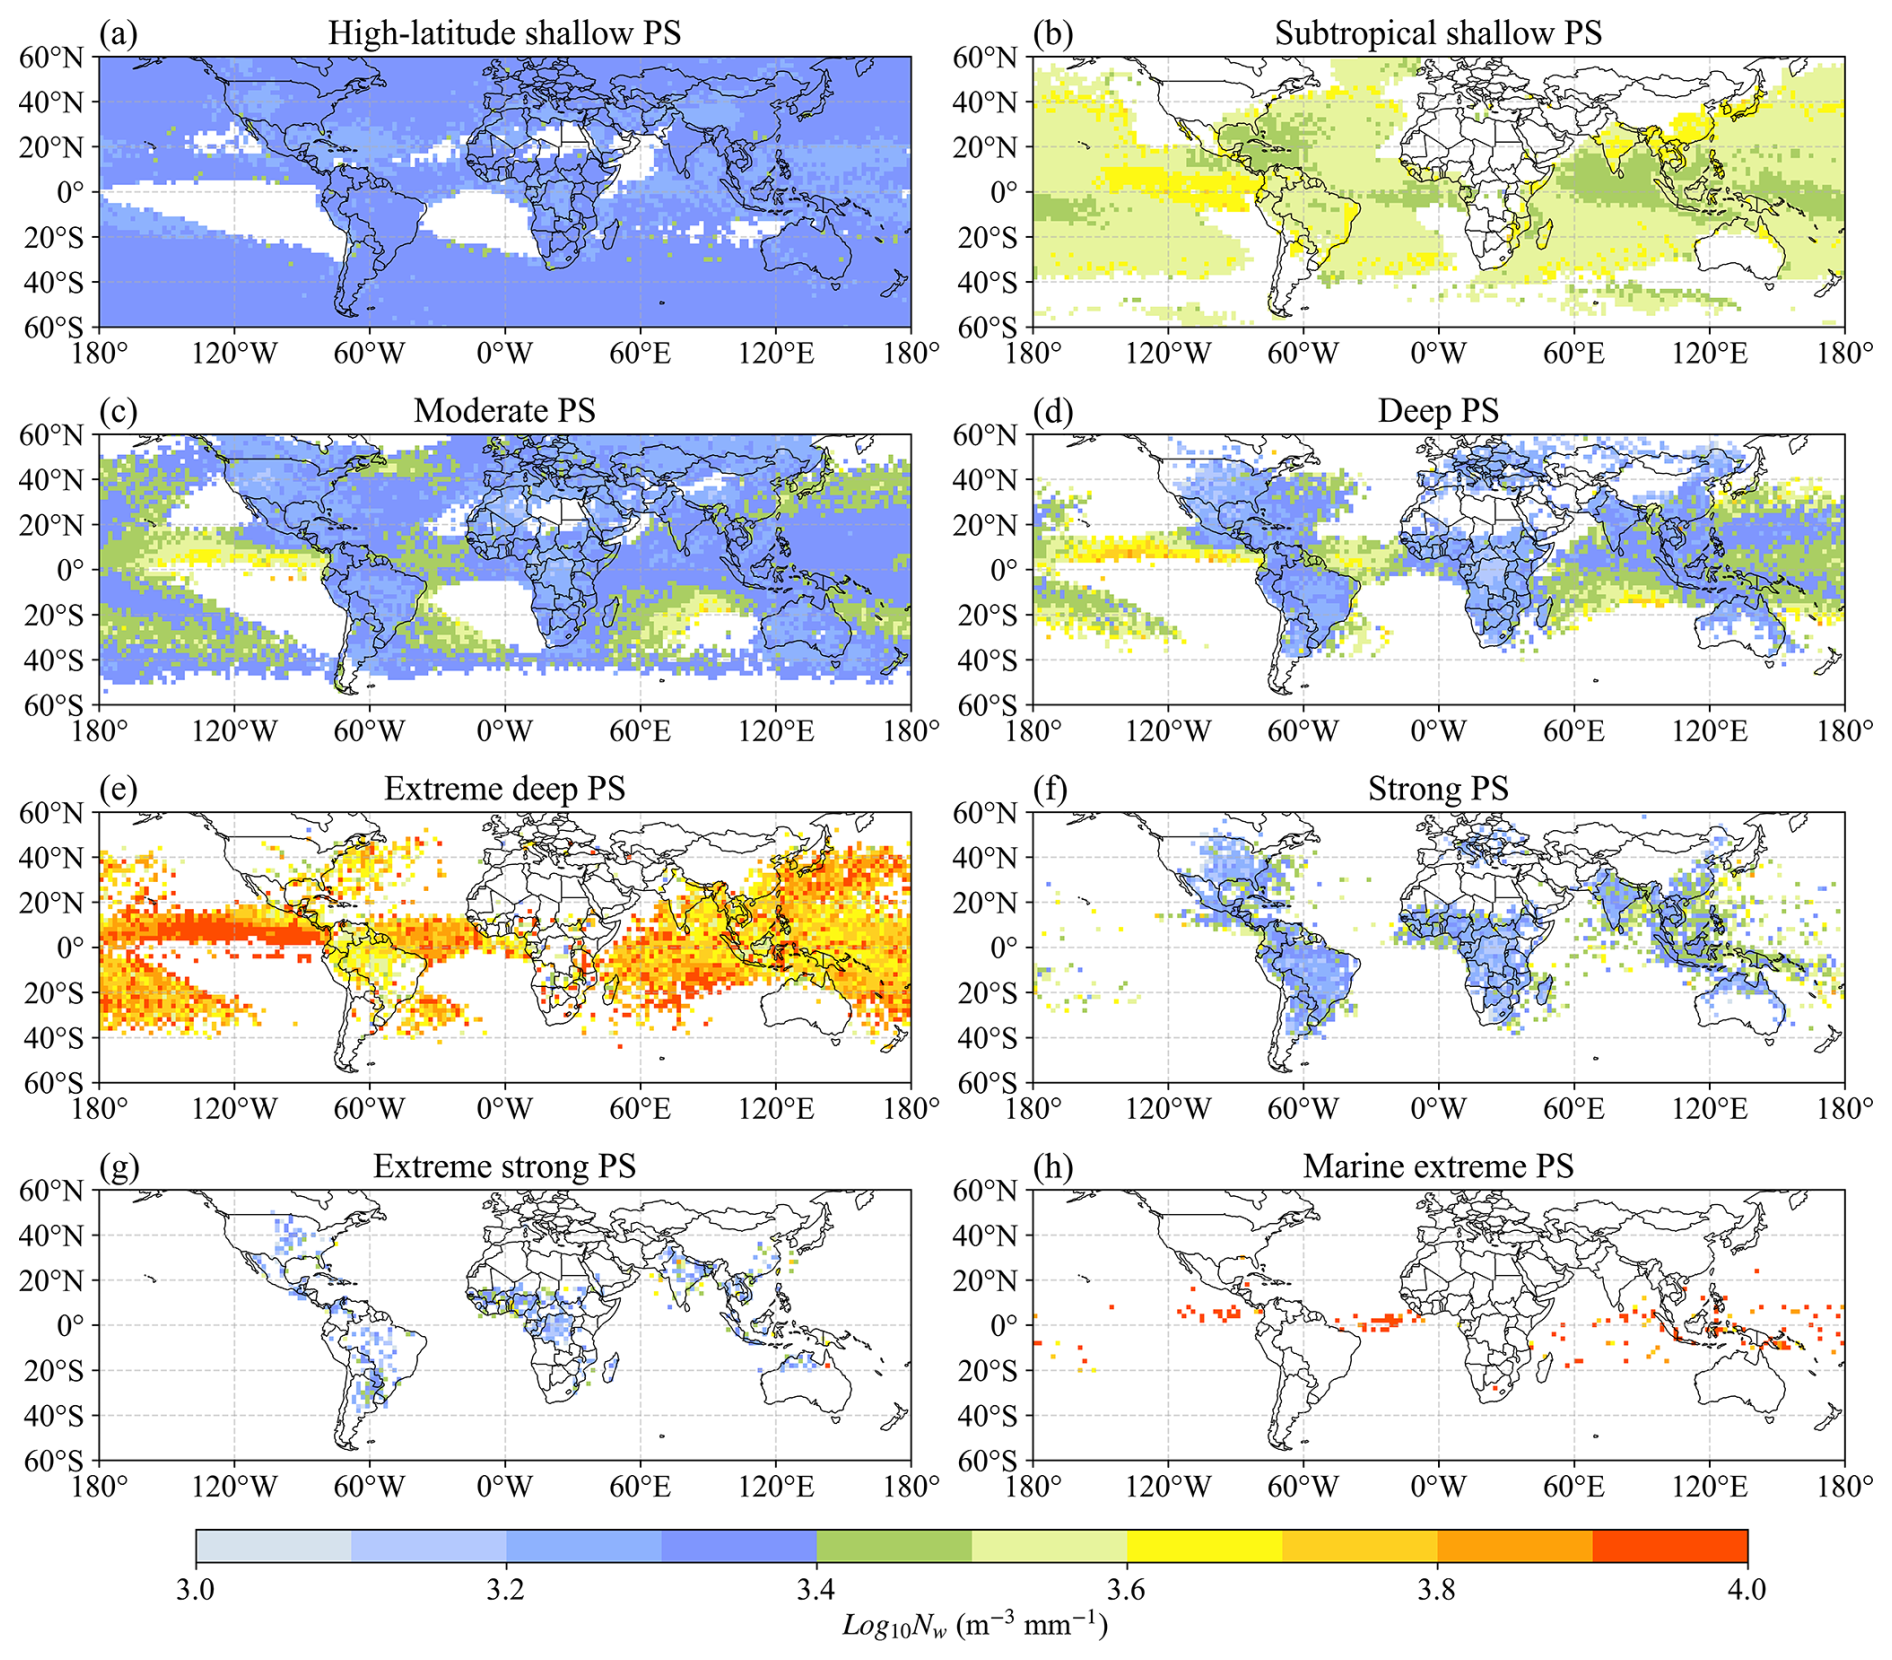
Figure 3Similar to Fig. 2 but for log10(Nw).
Similar to Dm, there is a distinct contrast in Nw between continents and oceans (Das and Chatterjee, 2018). Continental rainfall is usually associated with the cold rain mechanism, whereby raindrops grow as ice particles (Gupta et al., 2023). In contrast, oceanic rainfall is associated with a warm rain regime, in which raindrops grow via a collision-agglomeration mechanism. Consequently, Nw over land is less than that over oceans (Suh et al., 2016). For the same PS, Nw is high in areas with small Dm values and conversely low in areas with large Dm values. For example, in extreme deep PS, the Dm value over the eastern near-equatorial Pacific Ocean, which reaches approximately 1.18 mm, is smaller than that of the other oceanic regions. However, Nw is significantly greater than those in the other regions. In strong PS, the Dm values in near-equatorial Africa and the eastern United States are greater than those in other regions, but the Nw values are lower than those in other regions. It is possible that Dm and Nw may be negatively correlated for the same PS.
3.3 Vertical structure of the different PS types
The contoured frequency by altitude diagrams (CFADs) of Dm, Nw, and the maximum radar reflectivity for the eight clusters are shown in Figs. 4–6. Figure 4 shows the CFAD of the maximum radar reflectivity profiles. The results revealed high echo tops for deep PS, extreme deep PS, strong PS, and extreme strong PS, and low echo tops for high-latitude shallow PS and subtropical shallow PS. Extreme strong PS attained an echo top height greater than 18 km, and it also exhibited the strongest convection at the middle level. Its geographic distribution was exclusively terrestrial, which is consistent with other studies concluding that deep convective cores occur mostly over land (Houze et al., 2015). Extreme deep PS and marine extreme PS exhibited sharper decreasing trends from 6–12 km than extreme strong PS, indicating weaker convective updrafts. In contrast, extreme strong PS had stronger updrafts, producing more supercooled liquid droplets and large ice–water vapor condensates (Jiang, 2012). In contrast, extreme deep PS and marine extreme PS showed lower 40 dBZ echo tops and a more rapid decrease in reflectivity above the freezing level. This suggests relatively weaker mid- and upper-level updrafts, which limit the vertical transport of ice particles and reduce the abundance of supercooled liquid and large condensate.
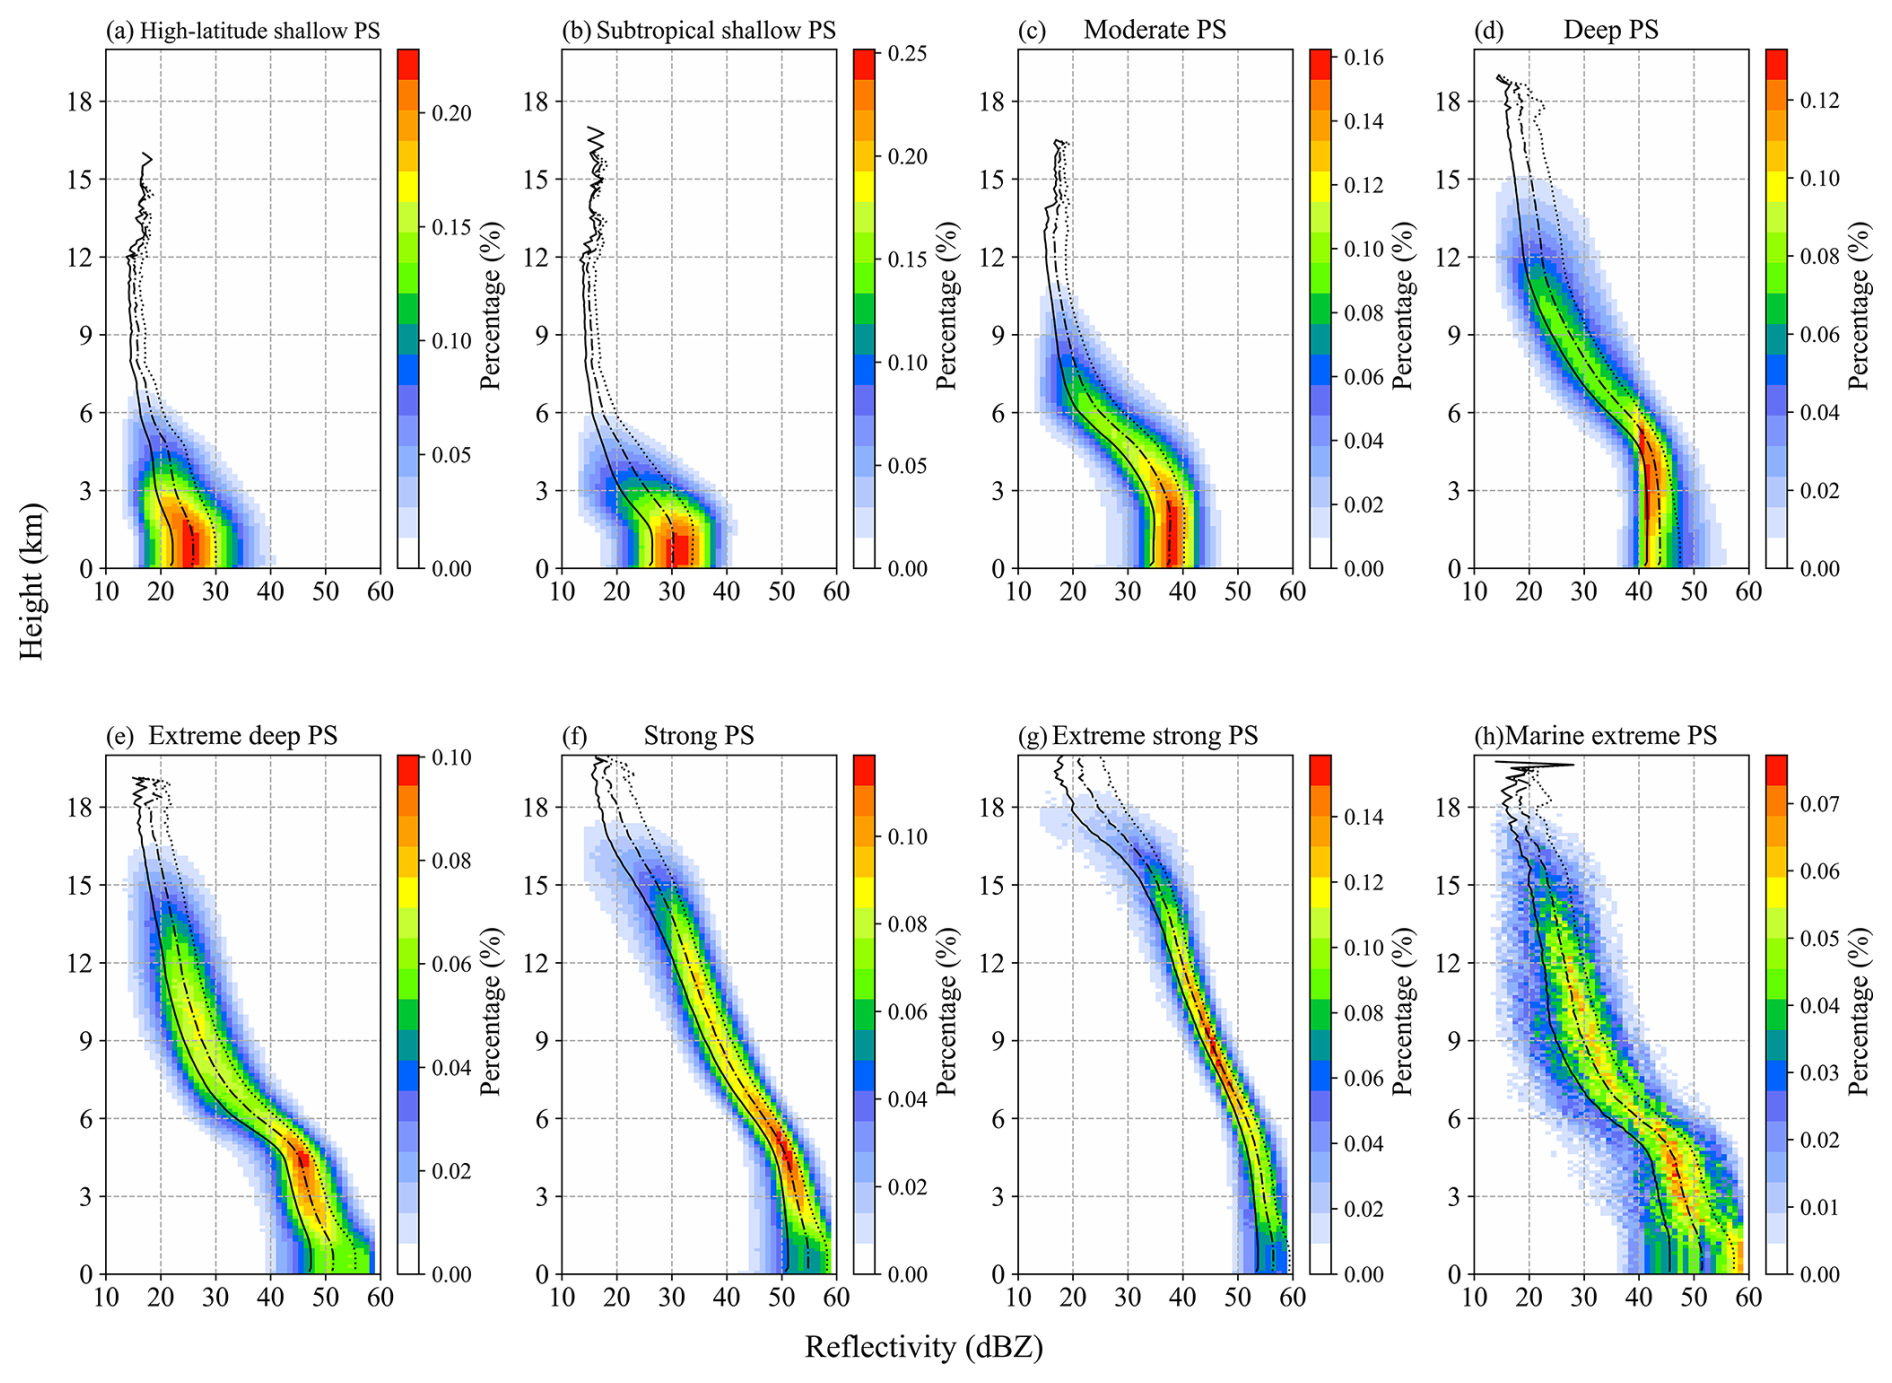
Figure 4Contoured frequency by altitude diagrams (CFADs) of the maximum radar reflectivity for the eight distinct PS clusters. The solid lines indicate the 25th percentiles; the dashed-dotted lines indicate the 50th percentiles; the dotted lines indicate the 75th percentiles.
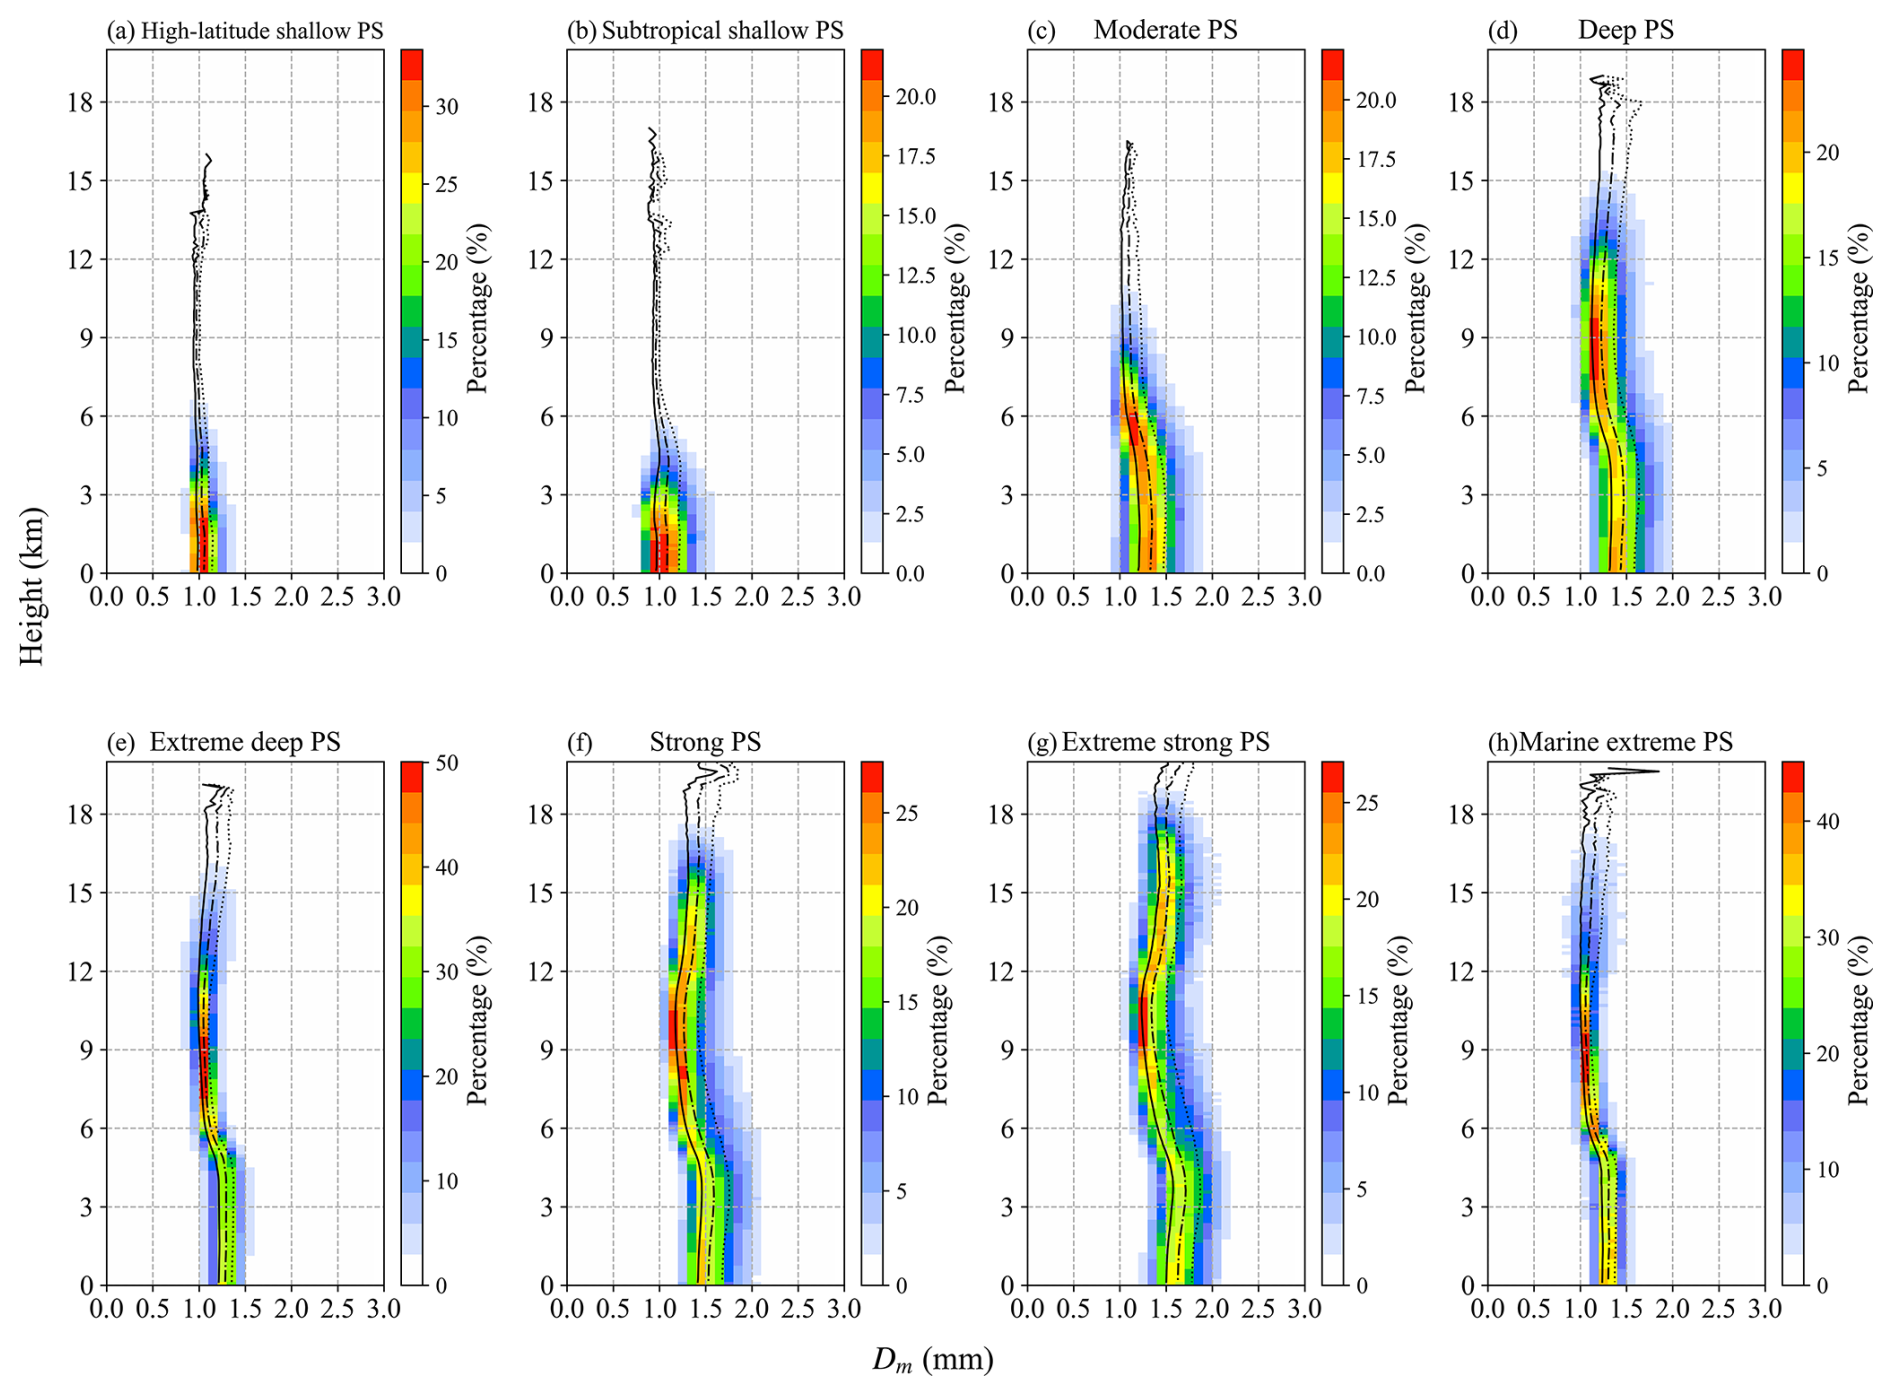
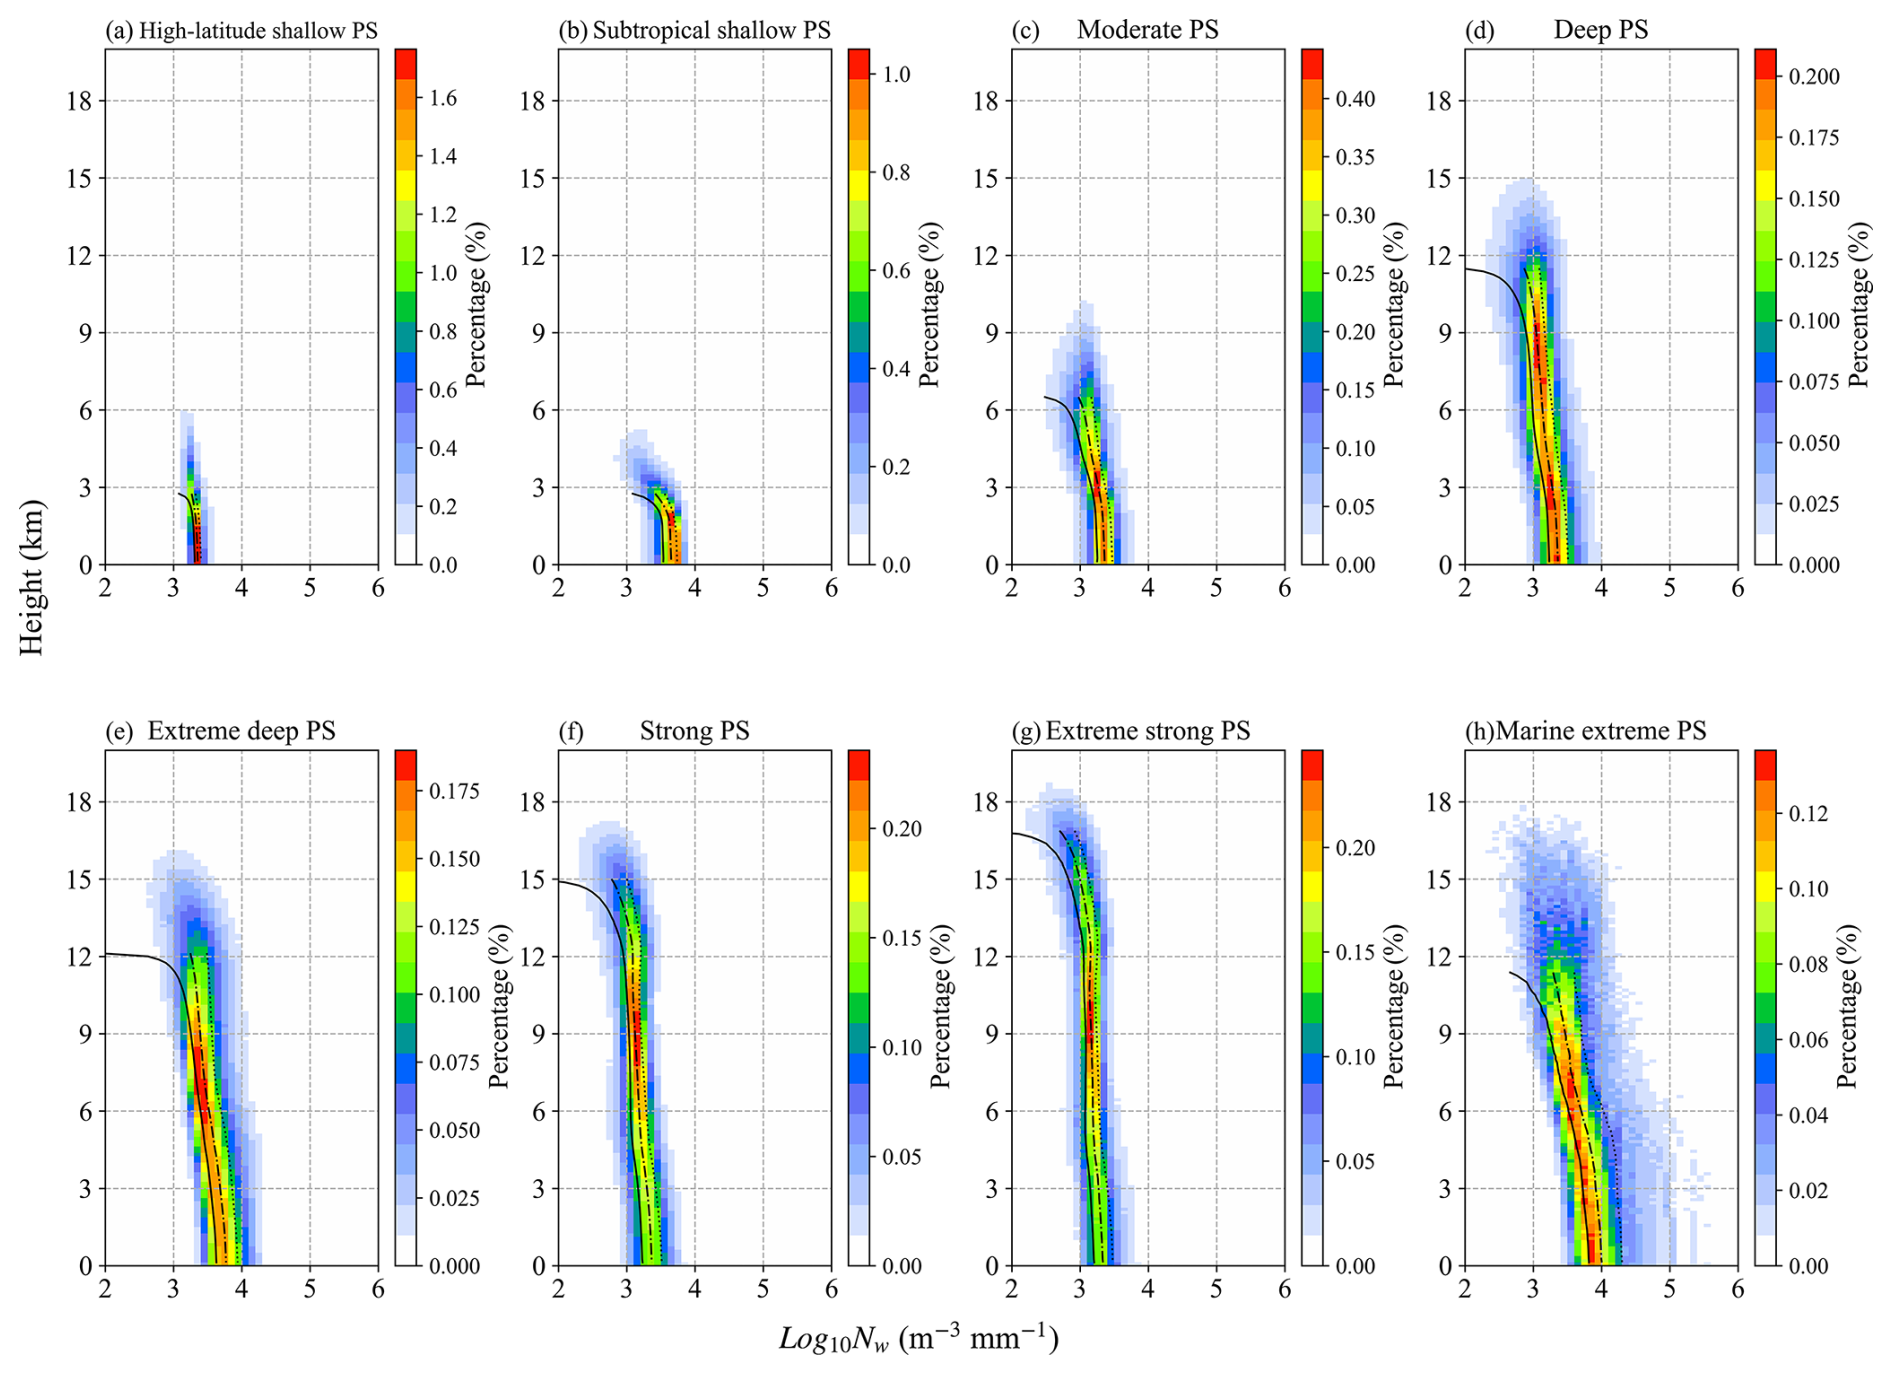
Table 2 indicates that the land proportion of extreme strong PS was much greater than that of extreme deep PS and marine extreme PS. Additionally, compared with oceanic environments, land land regions are generally characterized by relatively drier conditions and lapse rates closer to the dry adiabatic profile, which enhance buoyancy and allow stronger updrafts to loft ice crystals to higher altitudes. As a result, the maximum radar reflectivity in the middle levels at high altitudes decreased more slowly in extreme strong PS. High-latitude shallow PS and subtropical shallow PS yielded low echo tops of less than 6 km, indicating low convective intensity. Therefore, subtropical shallow PS could be identified as being associated with isolated shallow convection over the ocean, especially the region dominated by the subtropical high.
Figure 5 shows the CFAD of Dm for the eight types of PS. Generally, deep convections (deep PS, extreme deep PS, strong PS, extreme strong PS, and marine extreme PS) produce different Dm values in the regions above and below approximately 5 km. Moreover, strong PS and extreme strong PS exhibited wider distributions than those of extreme deep PS and marine extreme PS. For deep PS, strong PS, and extreme strong PS, Dm below 4.8 km did not change much or slightly increased along with height, but the value decreased between 4.8 and 6.9 km. In extreme strong PS, the vertical structure of Dm was more complex. Extreme strong PS exhibited three regimes according to the variations in Dm. The first regime was observed between 0 and 4.1 km, where Dm increases with altitude. This is consistent with other papers involving the use of ground-based radar observations and reporting that Dm of deep convective precipitation decreases with decreasing height near the surface (Marzuki et al., 2023). The observed decrease in Dm may be related to the continued breakdown of large isolated raindrops in the atmosphere. The second regime was observed above the freezing level, from 4.1 to 10 km, where Dm decreases with altitude. In this regime, the updraft in deep convection was decreased (Uma and Rao, 2009). The decline in updraft decreased the size of the particles that can be retained in the cloud. The rapid changes of Dm between the two regimes might be due to the changes of precipitation phase across the melting layer. As revealed by Mroz et al. (2024), the routine retrieval algorithm results in rapid changes of Dm and mass flux around the melting level, because the DPR observations cannot quantify ice water content and ice crystal size above the stratiform rain regions. Finally, the third regime was observed between 10 and 18 km, where Dm increases with altitude and where strengthened updrafts are often observed (Becker and Hohenegger, 2021). Although both high-latitude shallow PS and subtropical shallow PS were shallow PS, subtropical shallow PS had a wider distribution of Dm than high-latitude shallow PS. One possible reason is that in shallow oceanic convection, the breaking of large raindrops broadens the DSD.
Figure 6 shows the CFAD of log10(Nw) for the different types of PS. In general, Nw decreases with increasing altitude. The distribution range of Nw for shallow PS was relatively small. Moreover, the Nw distribution range of subtropical shallow PS was larger than that of high-latitude shallow PS. Among PS with intense convection, PS with a greater proportion of land coverage exhibited a narrower distribution of Nw, whereas PS with a greater proportion of ocean coverage exhibited higher Nw values. For example, the Nw values of strong PS and extreme strong PS were smaller and narrower than those of ocean-dominated deep PS, extreme deep PS and marine extreme PS. This finding is consistent with the conclusions of other studies (Kumar et al., 2024). One possible explanation is that the slower updrafts over ocean regions result in higher concentrations of smaller condensates at lower altitudes. Moreover, for both Dm and Nw, the four non-extreme PS exhibit little vertical variation below the melting layer, which may be attributed to a balance between coalescence and breakup processes.
3.4 DSD characteristics at a height of 2.5 km
Figure 7a–h show the frequency distributions of the mean Dm and log10(Nw) values observed at 2.5 km above ground level. The mean Dm values and the corresponding log10(Nw) values for the eight types of PS are detailed in Table 2. Generally, all the distributions shown in Fig. 7a–h greatly deviate from the parameters of continental convection and maritime convection defined by Bringi et al. (2003). One reason is that the mean values of Dm and Nw for one PS were considered here, whereas Bringi et al. (2003) separated the observation samples into stratiform and convective samples. Moreover, the DSDs observed by disdrometers are generally cumulative observations of a single storm at one fixed location and differ from the results for each PS in this study, which represent the instantaneous occurrence of a storm. With the most intense convection at the middle level, extreme strong PS was the closest to continental convection (Fig. 7d), whereas marine extreme PS was the closest to maritime convection (Fig. 7e). For most PS, Dm and Nw were negatively correlated, with greater dispersion of Dm than that of Nw. However, it should be noted that the observed correlations between Dm and Nw may partly be due to the retrieval assumptions in the GPM algorithm, which enforces a correlation between Dm and precipitation rate (Chase et al., 2020), rather than purely physical relationships. Moreover, the shallow PS exhibited lower Dm and Nw values and narrower distributions than those of the deep PS.
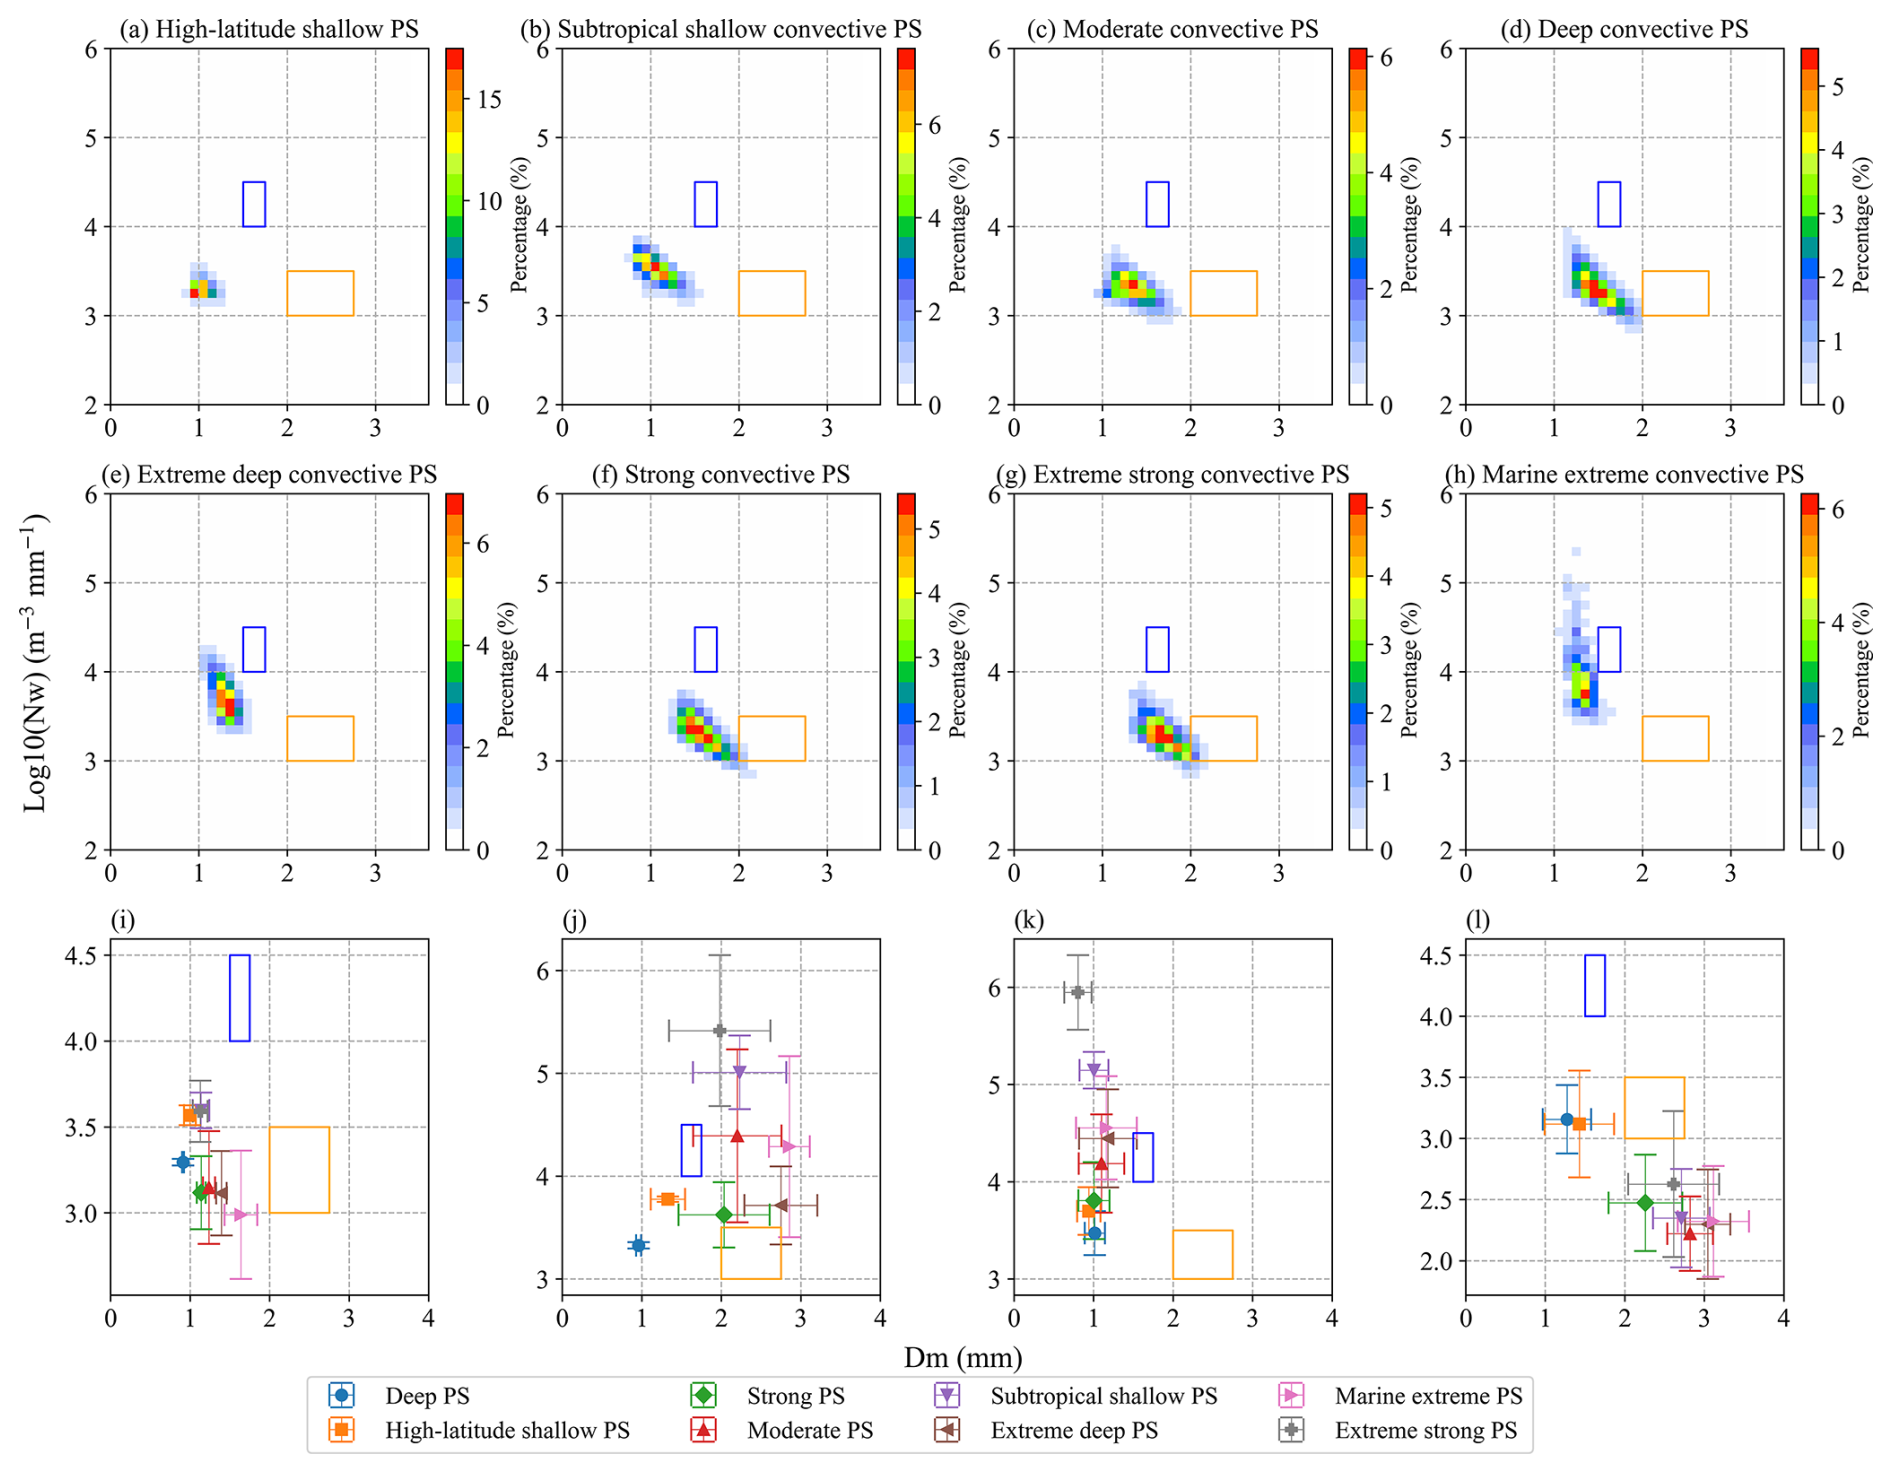
Figure 7(a–h) Two-dimensional frequency distributions of Dm and log10(Nw) at a height of 2.5 km, and (i–l) statistical values of log10(Nw) and Dm for each PS (the bar indicates one standard deviation). (i) Mean values of Dm and log10(Nw), (j) MAX-Dm and MAX-log10(Nw), (k) MAX-log10(Nw) and Dm at its corresponding position, and (l) MAX-Dm and log10(Nw) at its corresponding position for each PS. The blue and orange rectangles denote the maritime and continental convective clusters, respectively, in Dm and log10(Nw) space from Bringi et al. (2003).
To further compare the mean Dm and Nw values of the different clusters, Fig. 7i shows a summary of the mean Dm and Nw values, with the standard deviation for each type of PS. Marine extreme PS showed a significant abnormal low value of Nw, whereas the Nw value of extreme deep PS slightly deviated from those of the other PS. If only the three extreme deep PS with the highest echo tops (strong, extreme strong, and marine extreme PS) are considered, Dm and Nw show an inverse relationship. These results might suggest that in deep convection, the DSD parameters at the near-surface level are related to convection intensity parameters. Ni et al. (2019) revealed that the dual-frequency ratio between the Ku and Ka bands at 12 km was positively correlated with intensity parameters such as MAXHT20/30, partly because stronger updrafts could hold larger ice particles in clouds.
Note that the mean Dm and Nw values do not capture the variety of DSDs in each PS. For example, the DSD might differ between convective and stratiform regions, where the Nw–Dm relationships might vary. To comprehensively demonstrate the microphysical features of PS, Fig. 7j shows the mean MAX-Dm and MAX-Nw values of each PS at 2.5 km. For extreme PS, MAX-Dm and MAX-Nw were negatively correlated, while a positive correlation was observed for non-extreme PS. A similar relationship is also shown in Fig. 7k, which suggests a relationship between MAX-Nw and the corresponding Dm value in the MAX-Nw pixels of each PS. Nevertheless, as shown in Fig. 7k, the Dm values of all eight types of PS were very close. Nevertheless, it could be also found that in the non-extreme PS the Dm increases with MAX-Nw, while in the extreme PS, the Dm decreases with MAX-Nw. Figure 7l shows the relationship between MAX-Dm and the corresponding Nw value in the MAX-Dm pixels of each PS. Interestingly, for all eight types of PS, MAX-Dm and Nw showed significantly negative correlations. Note that MAX-Dm and MAX-Nw in Fig. 7j are the maximum values for one PS and usually do not occur in the same pixel. Figure 7k–l show the Nw–Dm relationship observed at the same location. Overall, the conclusions generally indicated that deep PS yield larger MAX-Nw or MAX-Dm values than shallow convection PS do. Overall, extreme PS exhibited negative correlations between Nw and Dm, whereas non-extreme PS demonstrated positive correlations.
In this study, we saw a positive relationship between the increase in Dm and MAXHT20 in extreme PS. However, extreme strong PS attained the highest MAXHT20 value, but its precipitation rate was lower than that of extreme deep PS and marine extreme PS. These results suggest a complex relationship between the microphysical parameters and convection features, especially in deep and intense convection systems. Notably, in extreme convection, intense precipitation at lower storm levels can cause significant rain-induced attenuation of the radar signal, which may in turn influence the retrieval accuracy of microphysical parameters. To assess the impact of attenuation on the Dm–Nw relationship, ground-based observations of microphysical properties from disdrometers are needed. Finally, we considered the PS as a whole. The microphysical characteristics varied among different pixels. The mean or maximum values of Dm and Nw only reflect part of the total process. Therefore, analyses on the basis of pixel-level observations would improve this work.
To gain further insight into the primary microphysical processes associated with the various PS, we employed an investigative approach analogous to that utilized by Kumjian and Prat (2014). To prevent the influence of ground-based clutter, ΔZe and ΔDm values were calculated as the difference between Ze and Dm at 2 and 3 km above the ground. Specifically, and are calculated. Figure 8 shows the frequency pattern of ΔZe versus ΔDm for the eight types of PS. An increase (decrease) in Ze and Dm indicates that coalescence (breakup) processes dominate. Balanced breakup and coalescence processes result in an increase in Ze but a decrease in Dm. In contrast, a decrease in Ze and an increase in Dm are due to predominantly evaporation or size sorting processes (Wen et al., 2023).
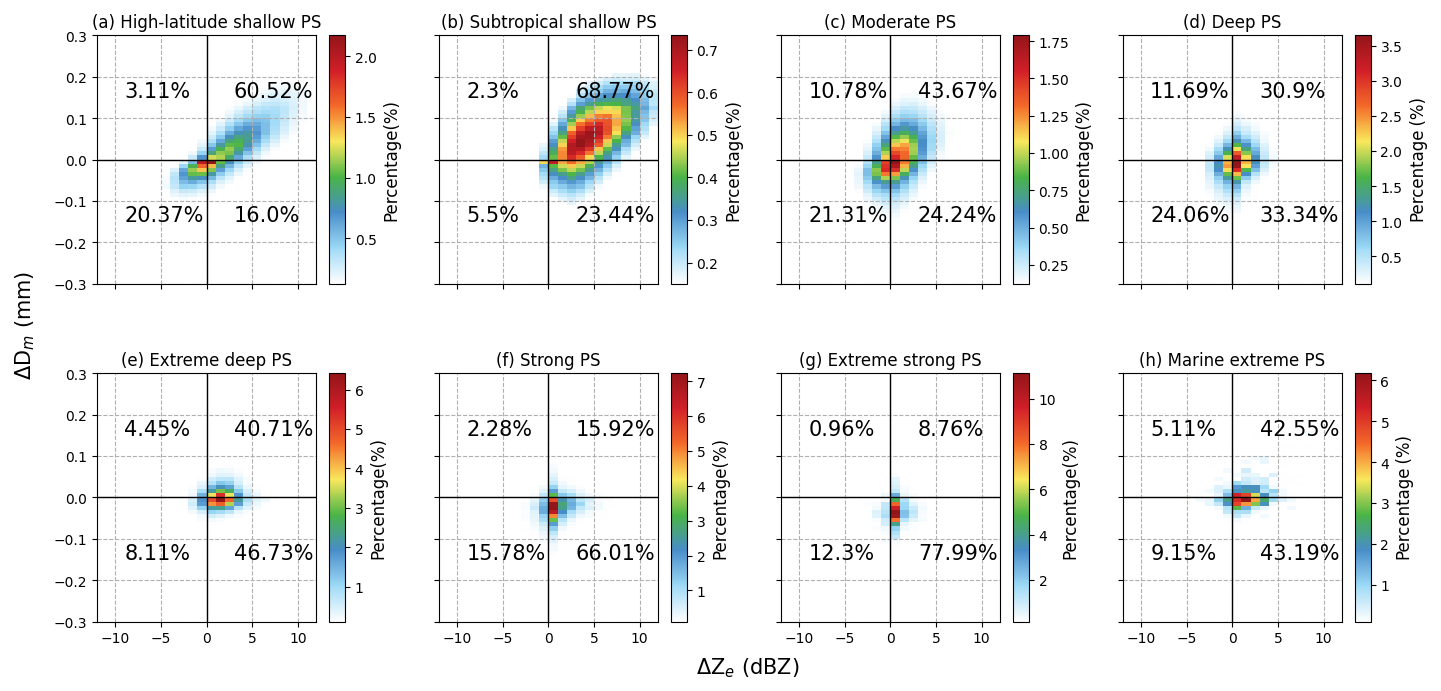
The microphysical processes of the different types of PS exhibited clear differences. Notably, the microphysical processes were dominated by coalescence in the two types of shallow PS (Fig. 8a, b). Previous studies have demonstrated that high-latitude shallow PS are more likely to experience the condensation of rain droplets into snow due to the low temperatures in these regions (Thompson et al., 2015). Meanwhile, the coalescence process plays an important role in tropical oceanic shallow convective precipitation (subtropical shallow PS) as demonstrated by Li et al. (2024). Balanced breakup and coalescence processes in extreme PS accounted for more than 40 % of the total microphysical processes, significantly exceeding the other three types of microphysical processes. The microphysical processes may reach an equilibrium state under high rainfall rates, in which the coalescence and breakup of raindrops are nearly balanced. These results are consistent with Shi et al. (2025), who found that extreme rainfall is primarily driven by vigorous mixed-phase processes and a balance between coalescence and breakup in liquid-phase processes. Extreme deep PS and marine extreme PS encompassed a higher percentage of coalescence processes than strong PS and extreme strong PS did, whereas strong PS and extreme strong PS encompassed a higher percentage of breakup processes.
3.5 Seasonal and diurnal cycles
In this study, seasons were categorized by fixed calendar months. The Northern Hemisphere seasons were defined as spring (March–May), summer (June–August), autumn (September–November), and winter (December–February). Conversely, the Southern Hemisphere seasons followed the opposite pattern: spring (September–November), summer (December–February), autumn (March–May), and winter (June–August). Based on this classification, the subsequent analysis examines seasonal and diurnal variations in PS frequency and microphysical parameters. Figure 9 shows the cycles of PS occurrence. Overall, the seasonal and diurnal cycles differed among the eight types of PS. Moderate PS, deep PS, strong PS, and extreme strong PS exhibited cycles like those of continental convection systems, with peaks in the afternoon and in summer. Dominated by tropical shallow convection over the ocean (Fig. 1), subtropical shallow PS occurred mostly between 00:00 and 05:00 local time. and was more frequent during the autumn season than during the other seasons, with the lowest occurrence during the spring season. The other types of PS (high-latitude shallow PS, extreme deep PS, and marine extreme PS) did not show obvious diurnal cycles, except that high-latitude shallow PS indicated a low peak at approximately 06:00 a.m. in winter and a valley before noon in summer. High-latitude shallow PS occurred infrequently in winter. Extreme deep PS occurred more frequently in summer and autumn, with fewer occurrences in winter. Note that marine extreme PS did not demonstrate obvious seasonal discrepancies, but showed a peak at night in the summer. Specifically, strong PS and extreme strong PS with a higher proportion over land exhibit a peak occurrence around 03:00 p.m. in the afternoon. In contrast, extreme deep PS and marine extreme PS mostly show no distinct peak, with frequencies distributed evenly throughout the day. This difference reflects the land-ocean contrast in extreme PS, which is consistent with findings from other related studies (Wang and Tang, 2020).
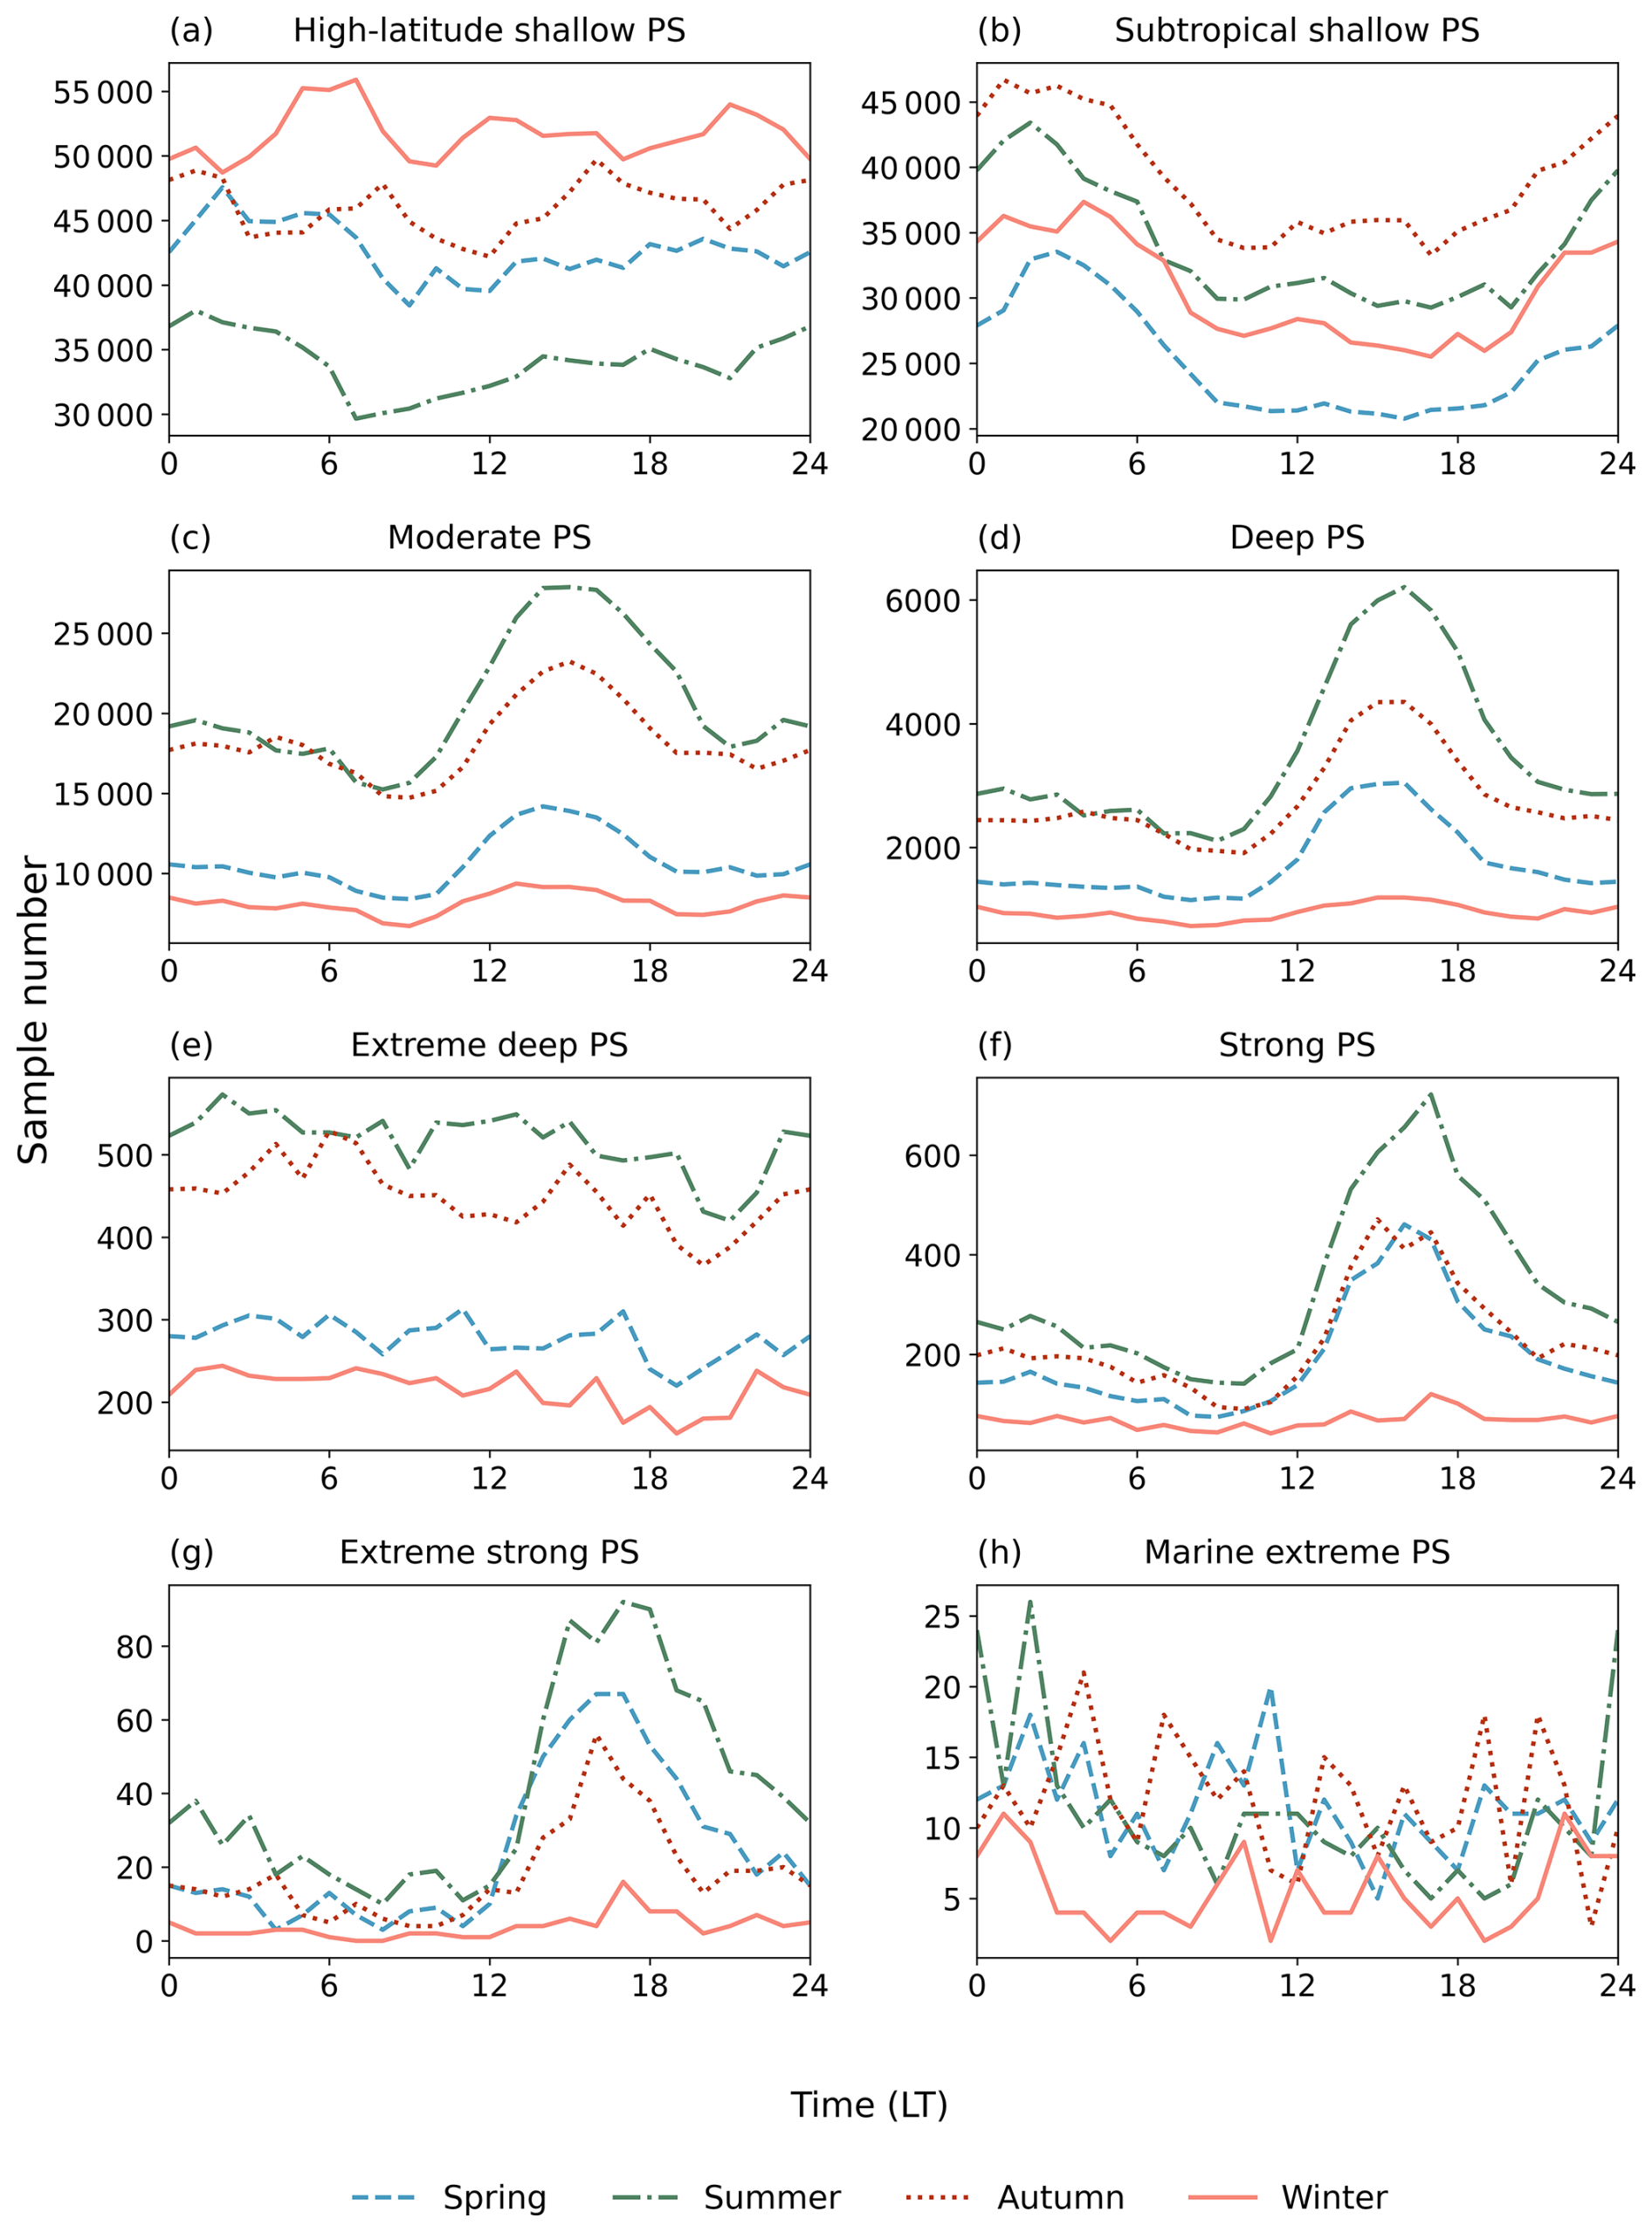
Figure 9Diurnal variations in the sample sizes of the eight distinct PS clusters across the four seasons.
Figures 10 and 11 show the seasonal and diurnal cycles of Dm and Nw, respectively. The diurnal cycles of Dm were similar with those of PS occurrence to some extent. For example, in moderate PS, deep PS and strong PS, both the occurrence and Dm have peaks around 15:00 p.m. One connection between these two parameters is that environments that favor storm occurrence could also facilitate the development of stronger updrafts, which could promote the formation of large particles in clouds. Nevertheless, discrepancies are obvious between the cycles of occurrence and Dm. For example, the Dm in the extreme strong PS did not show obvious diurnal variations. The high-latitude shallow PS shows a peak in the summer (Fig. 10a), which is not found in the diurnal cycle of occurrence (Fig. 9a). In subtropical shallow PS, the diurnal cycle of Dm (Fig. 10b) was the opposite to that of PS occurrence (Fig. 9b). The diurnal variation of Nw differed substantially from that of Dm and occurrence frequency. In subtropical shallow PS, moderate PS, deep PS, and strong PS, the Nw peaked in the morning. Nevertheless, the diurnal cycles of subtropical shallow PS, moderate PS, and deep PS also differed. For example, Nw of subtropical shallow PS at night was low, whereas Nw of shallow convective PS and moderate PS at night was very close to its peak. Extreme deep PS and marine extreme PS did not exhibit obvious diurnal cycles of Nw. The extreme strong PS showed low values of Nw in the afternoon and little variation at night. For high-latitude shallow PS, diurnal variation is not clear except in the summer when the Nw in the afternoon is the lowest.
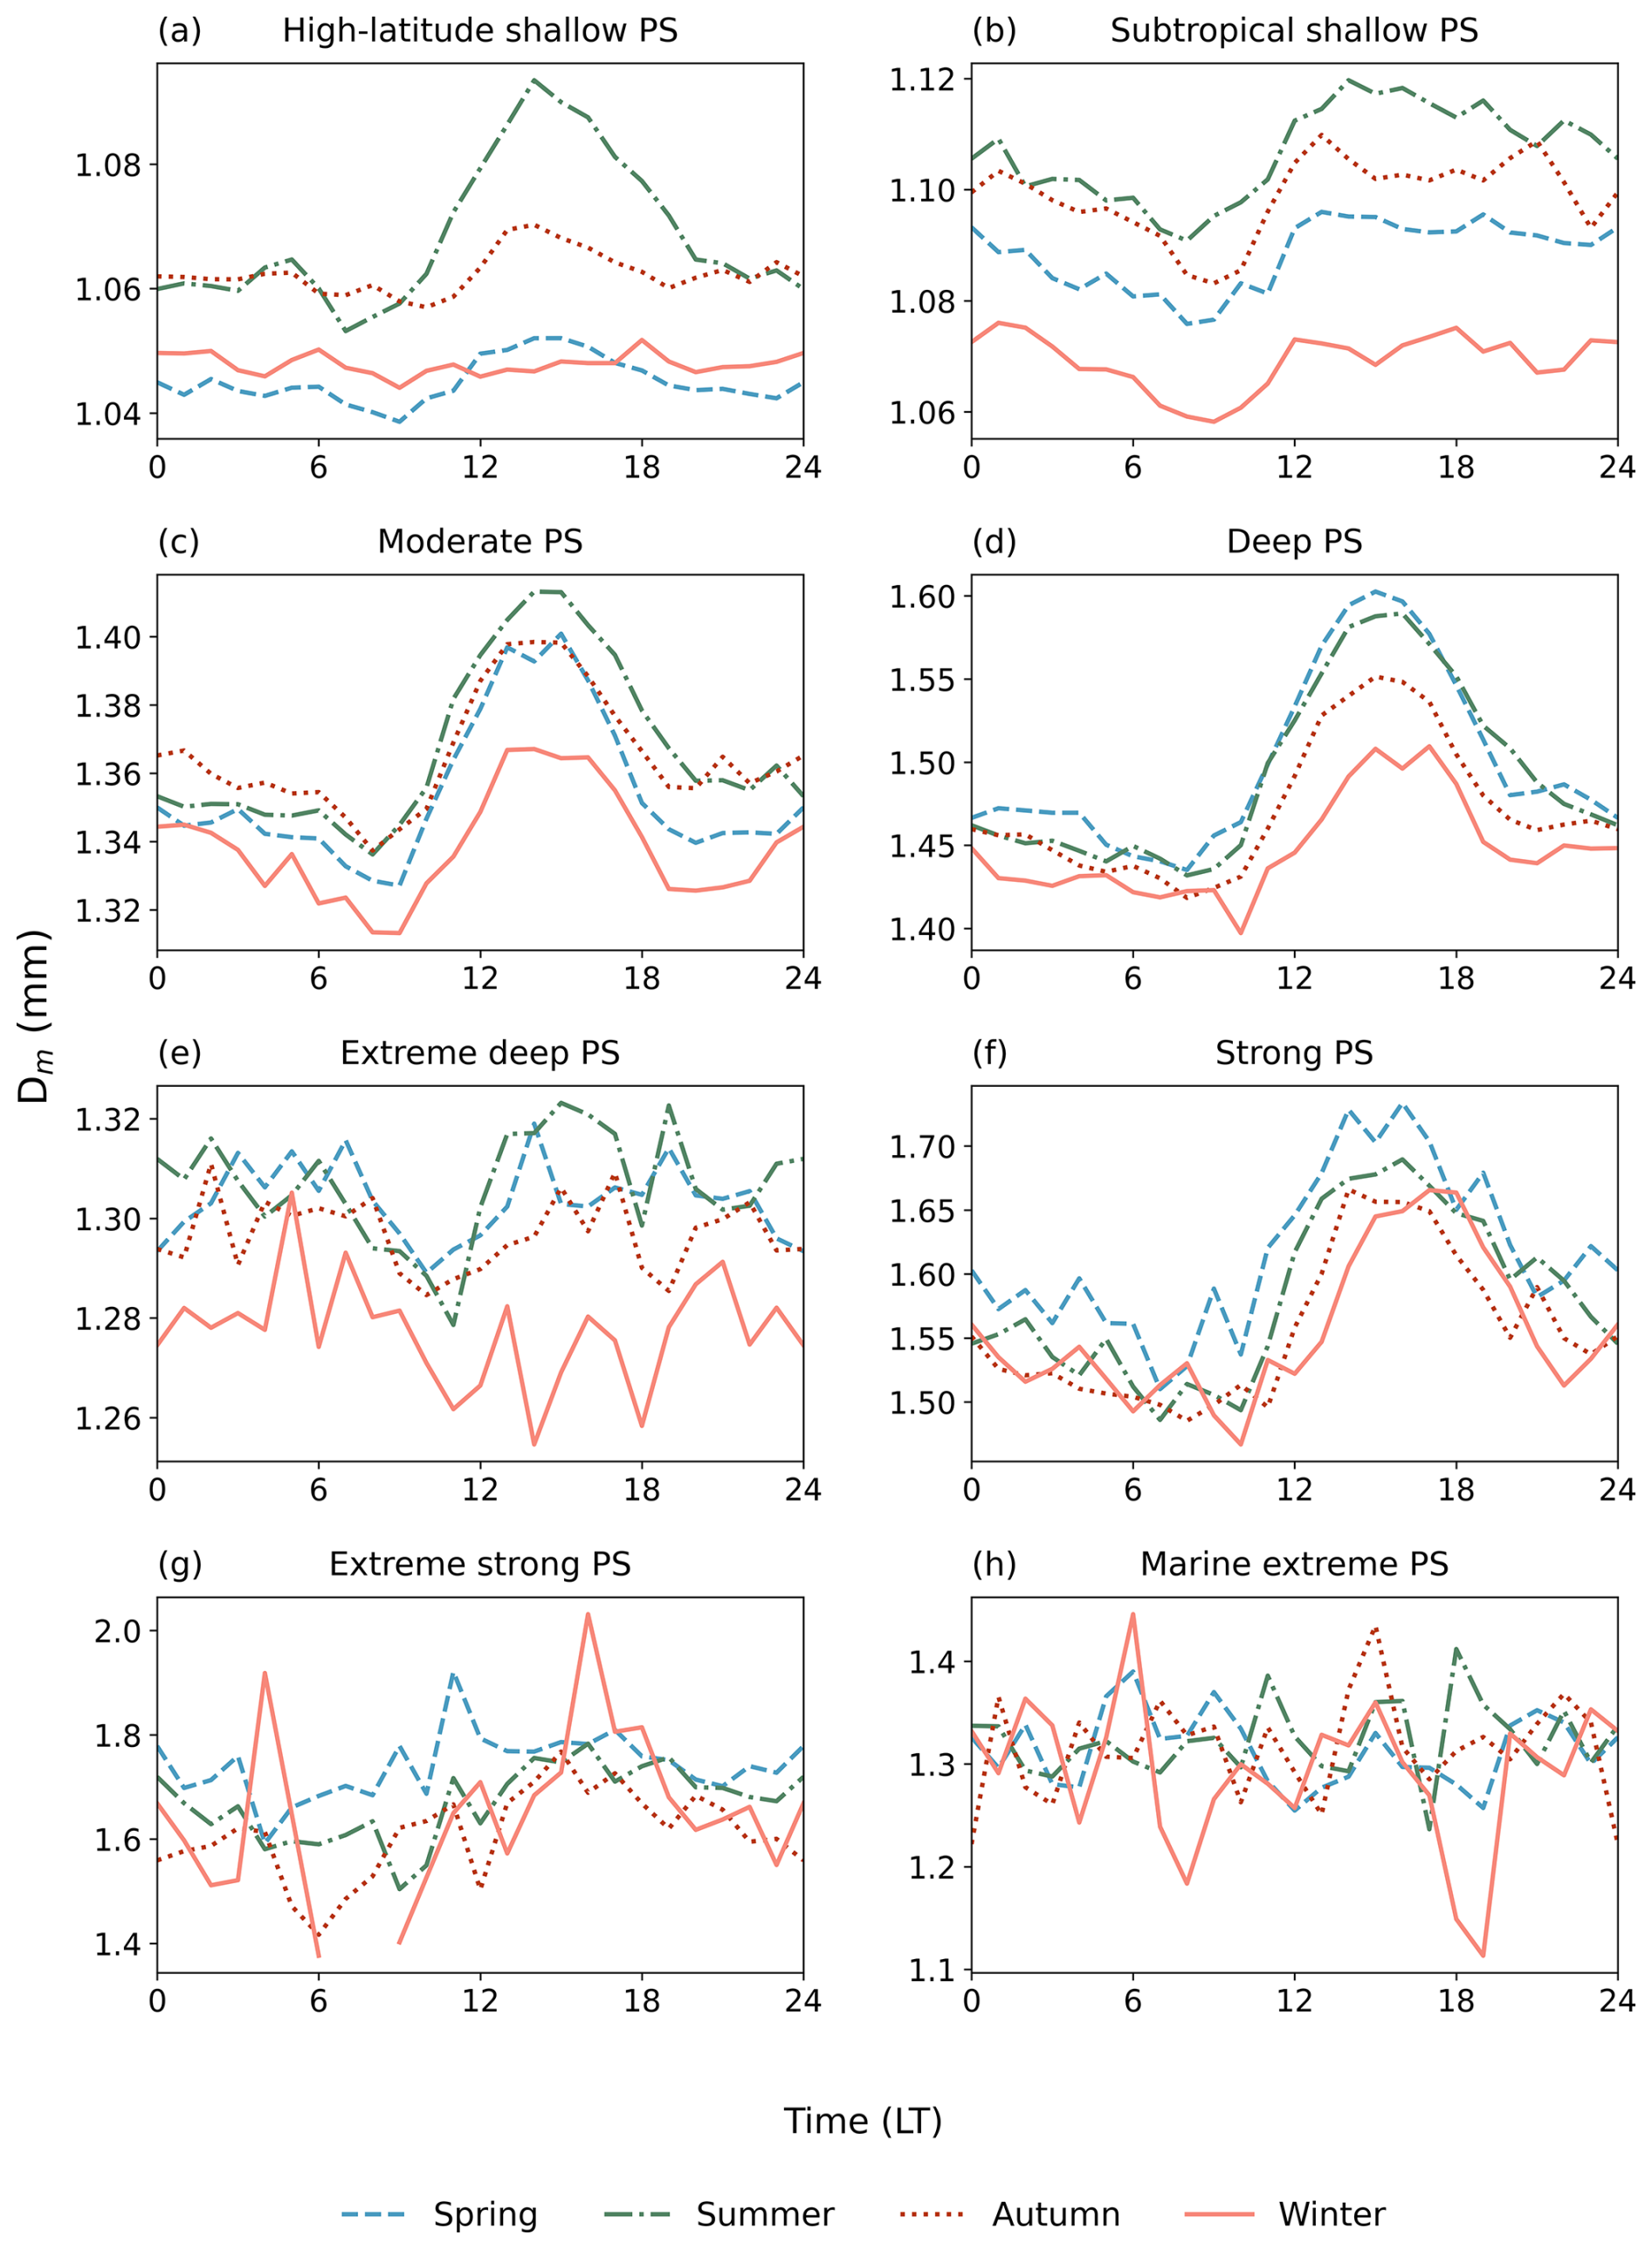
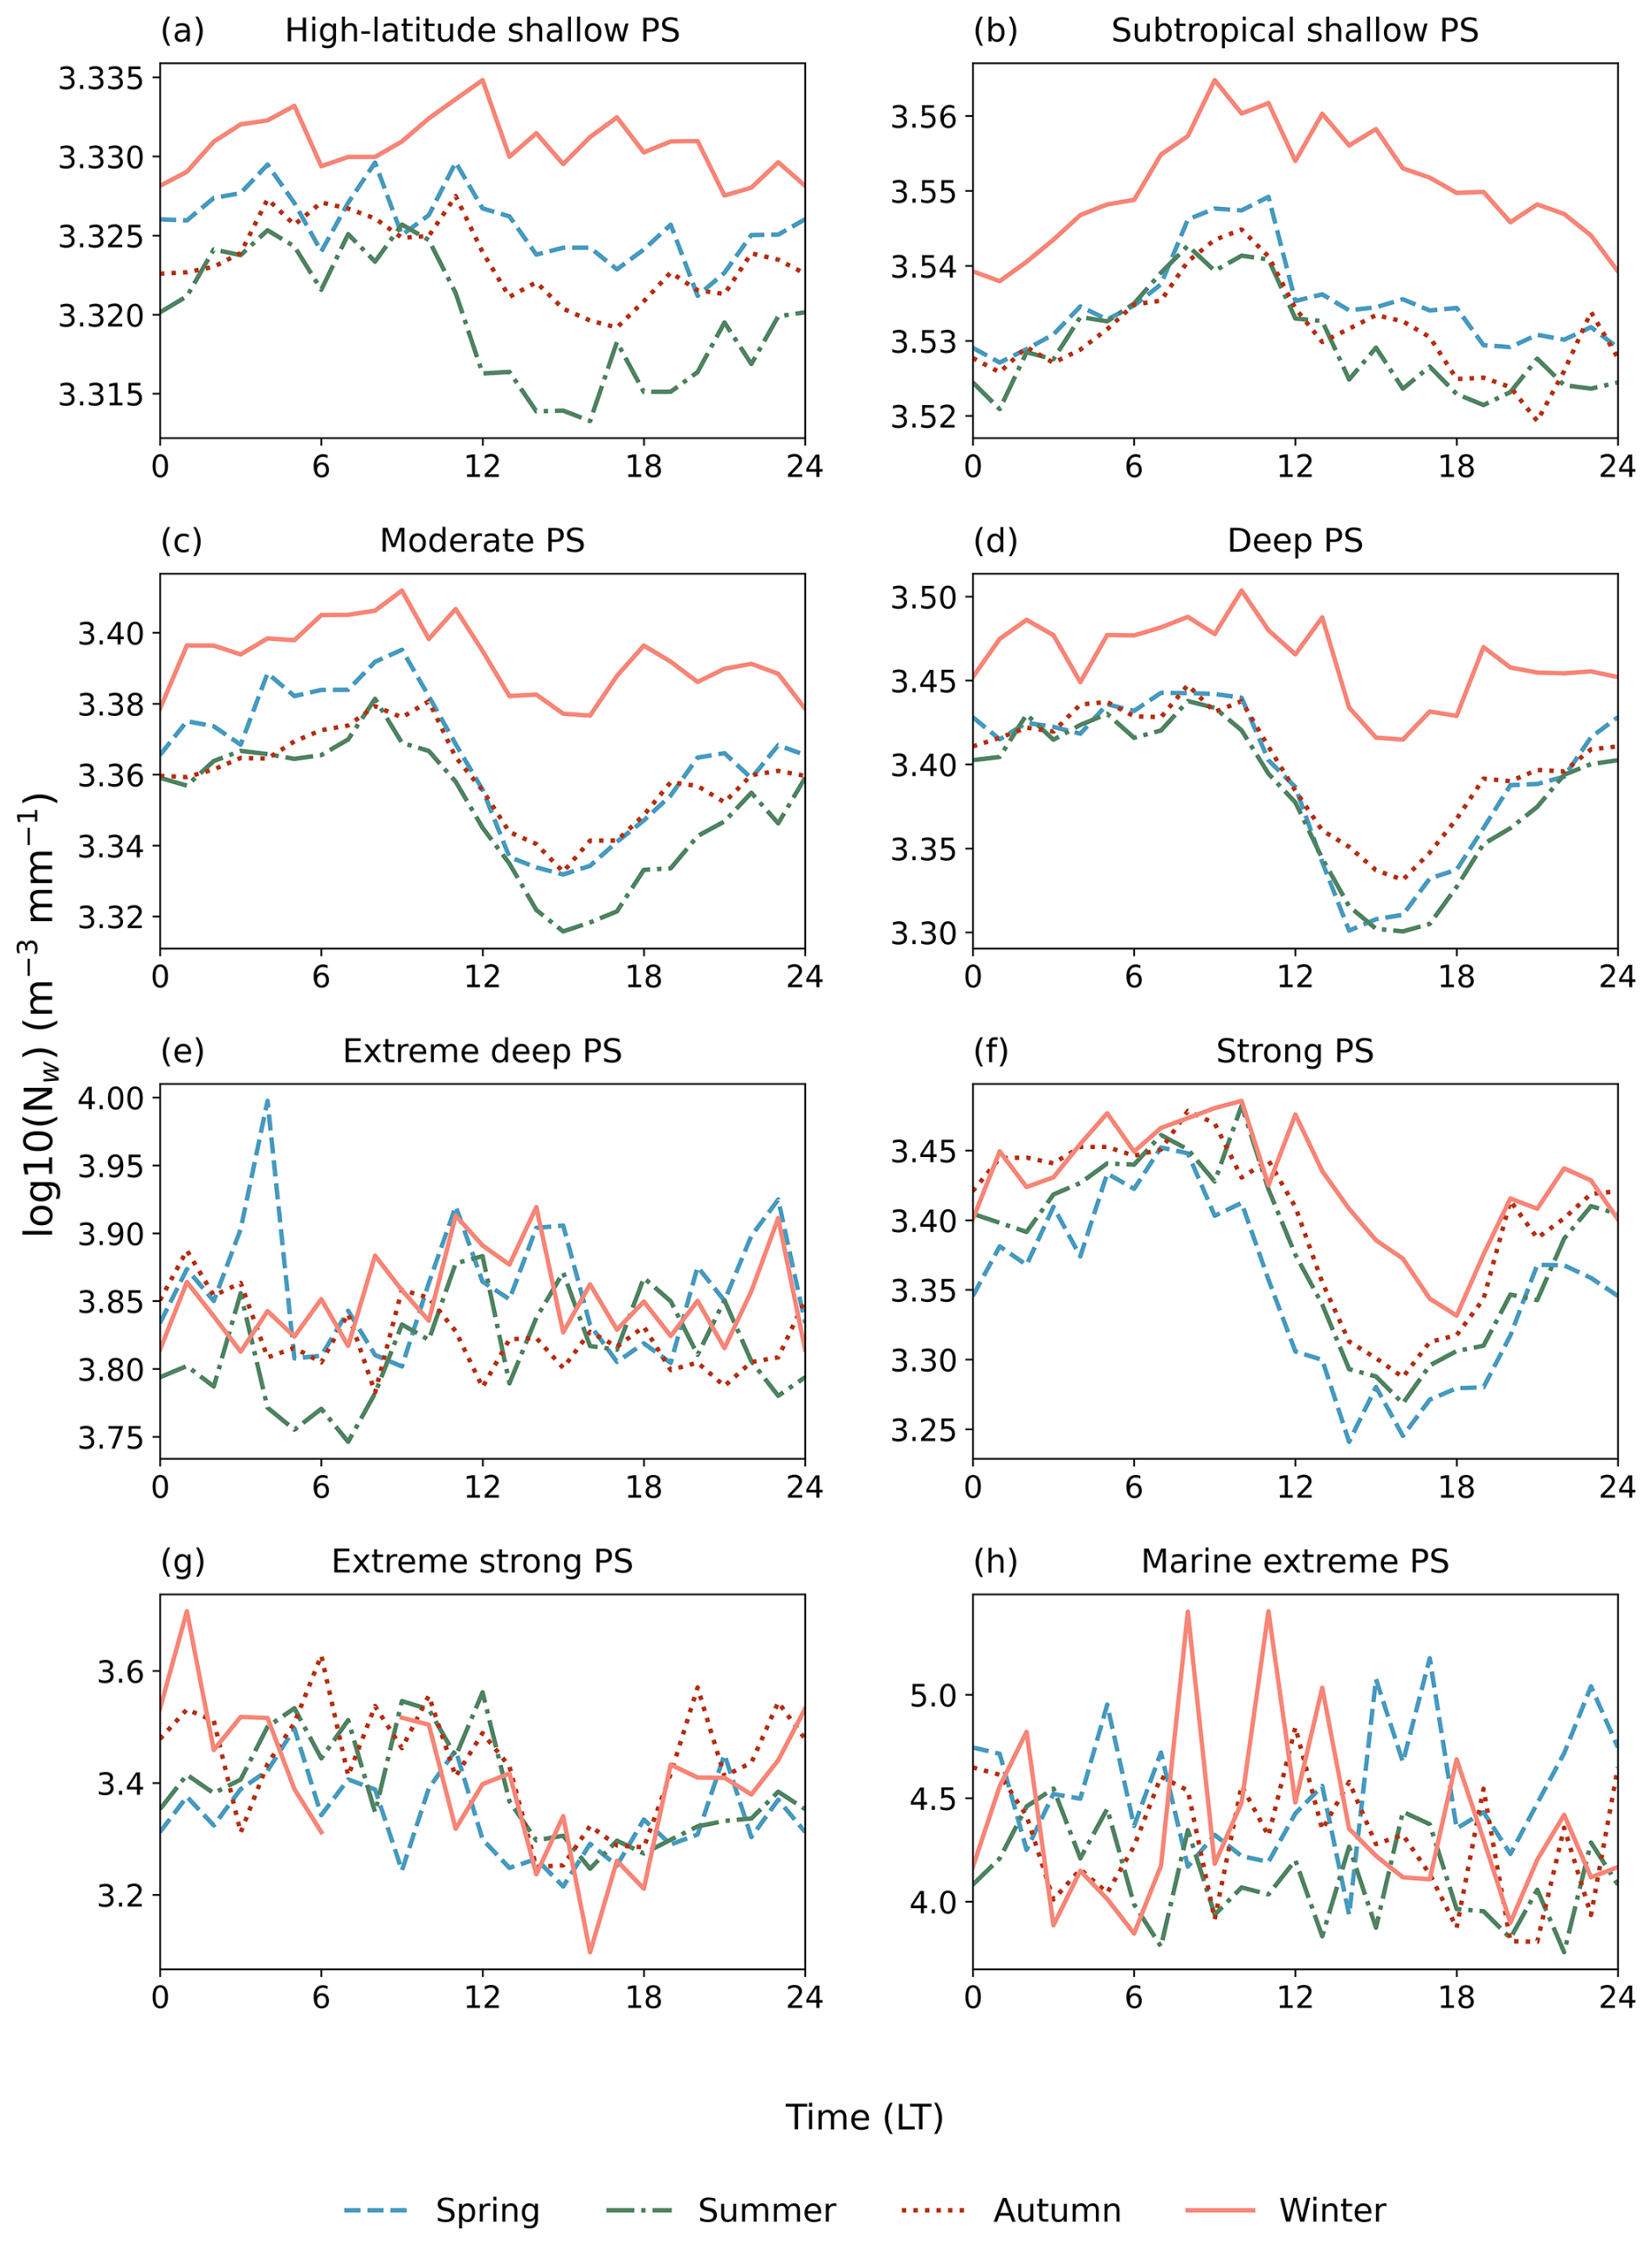
Similar to the diurnal cycles, the annual cycles of Dm and Nw were opposite in subtropical shallow PS, moderate PS, and deep PS, of which Dm was the lowest and Nw was the largest in winter. Nevertheless, there were also differences in the annual cycles of the three types of PS. For example, in subtropical shallow PS, Dm was the largest in summer, followed by autumn and spring, whereas the Nw values during the three seasons were very close. Among the extreme PS, Nw and Dm did not exhibit obvious annual cycles. For high-latitude shallow PS, the highest Dm value occurs in summer and the Dm in winter and spring were comparable. However, the annual cycle of Nw attained the largest value in winter and the lowest value in summer.
In this study, GPM DPR data were used to objectively classify global PS and analyze the microphysical characteristics of the different types of PS. The main conclusions are as follows:
- 1.
By conducting an objective classification of global PS via key parameters such as the convective intensity, radar reflectivity, and DSD parameters, eight distinct types of PS were identified. These systems were classified on the basis of their unique microphysical and convective properties, providing a detailed understanding of the different precipitation processes worldwide. The eight types of PS identified are as four types of regular/non-extreme PS (high-latitude shallow PS, subtropical shallow PS, moderate PS, deep PS) and four types of extreme PS (extreme deep PS, strong PS, extreme strong PS, marine extreme PS).
- 2.
MAXHT20 is generally correlated with the precipitation rate, but this relationship is not clear for extreme PS. The relationship between MAXHT20 and Dm does not follow a simple linear pattern. For extreme PS, MAXHT20 is positively related to Dm at 2.5 km above the ground surface. This may reflect the relationship between higher cloud tops and greater liquid water contents in strongly convective PS. However, for non-extreme PS, the relationship between MAXHT20 and Dm is more complex and may be influenced by variations in the physical processes of the different PS.
- 3.
For the same type of PS, Dm over land is greater than that over the ocean. Additionally, Dm exhibits latitudinal variability, particularly in high-latitude shallow PS, where Dm decreases with increasing latitude. Additionally, continental rainfall is often associated with lower Nw values due to the dominance of the cold-rain (ice-phase) process, in which precipitation particles grow through riming and aggregation above the freezing level, typically producing larger but fewer drops after melting. In contrast, oceanic rainfall is more frequently governed by the warm-rain process dominated by collision–coalescence below the freezing level, which tends to generate more numerous but smaller raindrops and thus higher Nw values. Shallow PS generally exhibit narrow distributions of both Dm and Nw, particularly in high-latitude shallow PS. Among the strong PS, those with a higher land proportion exhibit a narrower distribution of Nw values, whereas those with a greater ocean proportion exhibit larger Nw values. However, the behavior of Dm is opposite: PS with a higher ocean proportion show a narrower distribution of Dm values than land-dominated PS.
- 4.
The different PS exhibit distinct microphysical processes. In shallow convective PS, such as subtropical shallow PS and high-latitude shallow PS, coalescence processes largely shape the microphysical characteristics, indicating the aggregation of small raindrops in these PS. In contrast, extreme PS are characterized by balanced breakup and coalescence processes, highlighting a more complex interaction between raindrop formation and breakup. These results emphasize the varying mechanisms that govern microphysical behavior across the different types of PS. PS types with high precipitation rates are dominated primarily by balanced breakup and coalescence processes, whereas shallow PS are characterized mainly by coalescence.
- 5.
The seasonal and diurnal cycles of PS and their microphysical parameters vary across clusters. Continental convection clusters peak in the afternoon and summer, whereas tropical and high-latitude systems exhibit unique seasonal and diurnal cycles, often with opposite trends between Dm and Nw.
Classifying PS is essential for increasing the understanding of the microphysical processes that govern cloud development and precipitation formation across various climatic regimes. This classification enables the identification of key mechanisms that shape precipitation particle formation, growth, and distribution, thereby providing a more physically grounded view of precipitation system diversity. This study revealed the global distribution characteristics of different types of PS and elucidated the variations in microphysical properties across regions with distinct climatic and geographic conditions. Among the findings, the identified PS types are closely linked to consistent variations in key microphysical parameters, suggesting that this objective classification framework can effectively distinguish precipitation regimes with different underlying physical mechanisms. These results provide new observational evidence for global precipitation variability and establish a physically consistent framework for process-oriented comparisons, cross-regional analyses, and the evaluation of satellite precipitation products and numerical model representations of precipitation systems.
The codes used for analysis method are available upon request.
The GPM-DPR (version 07A) data from the NASA/Goddard Space Flight Center are available at https://gpm.nasa.gov/data/directory/2a-dpr-ges-disc (last access: 24 March 2026) (https://doi.org/10.5067/GPM/DPR/GPM/2A/07, Iguchi and Meneghini, 2021). All statistics and visualization are operated with Anaconda Individual Edition Python version 3.8.3 (Free Download, Anaconda, accessed on 10 April 2022).
The supplement related to this article is available online at https://doi.org/10.5194/acp-26-4727-2026-supplement.
XZ and XN conceptualised and planned the research study. XZ conducted the satellite data analysis with support from XN and drafted the initial manuscript. XN and JZ reviewed and revised the manuscript to refine its content.
The contact author has declared that none of the authors has any competing interests.
Publisher's note: Copernicus Publications remains neutral with regard to jurisdictional claims made in the text, published maps, institutional affiliations, or any other geographical representation in this paper. The authors bear the ultimate responsibility for providing appropriate place names. Views expressed in the text are those of the authors and do not necessarily reflect the views of the publisher.
We thank the editor, Radovan Krejci, and referees for their careful review and constructive comments in the review process, which have significantly improved the manuscript.
This research has been supported by the National Natural Science Foundation of China (grant no. 42105005) and the Fundamental Research Funds for the Central Universities (grant no. SWU-KT22007).
This paper was edited by Radovan Krejci and reviewed by three anonymous referees.
Arulraj, M. and Barros, A. P.: Automatic detection and classification of low-level orographic precipitation processes from space-borne radars using machine learning, Remote Sens. Environ., 257, 112355, https://doi.org/10.1016/j.rse.2021.112355, 2021.
Awaka, J., Le, M., Brodzik, S., Kubota, T., Masaki, T., Chandrasekar, V., and Iguchi, T.: Development of precipitation type classification algorithms for a full scan mode of GPM dual-frequency precipitation radar, J. Meteorol. Soc. Jpn. Ser. II, 99, 1253–1270, https://doi.org/10.2151/jmsj.2021-061, 2021.
Ay, M., Özbakır, L., Kulluk, S., Gülmez, B., Öztürk, G., and Özer, S.: FC-Kmeans: Fixed-centered K-means algorithm, Expert Syst. Appl., 211, 118656, https://doi.org/10.1016/j.eswa.2022.118656, 2023.
Bang, S. D. and Cecil, D. J.: Testing Passive Microwave-Based Hail Retrievals Using GPM DPR Ku-Band Radar, J. Appl. Meterol. Climatol., 60, 255–271, https://doi.org/10.1175/JAMC-D-20-0129.1, 2021.
Becker, T. and Hohenegger, C.: Entrainment and its dependency on environmental conditions and convective organization in convection-permitting simulations, Mon. Weather Rev., 149, 537–550, https://doi.org/10.1175/MWR-D-20-0229.1, 2021.
Bringi, V. N., Chandrasekar, V., Hubbert, J., Gorgucci, E., Randeu, W. L., and Schoenhuber, M.: Raindrop size distribution in different climatic regimes from disdrometer and dual-polarized radar analysis, J. Atmos. Sci., 60, 354–365, https://doi.org/10.1175/1520-0469(2003)060<0354:RSDIDC>2.0.CO;2, 2003.
Cha, J. W. and Yum, S. S.: Characteristics of Precipitation Particles Measured by PARSIVEL Disdrometer at a Mountain and a Coastal Site in Korea, Asia-Pac. J. Atmospheric Sci., 57, 261–276, https://doi.org/10.1007/s13143-020-00190-6, 2021.
Chase, R. J., Nesbitt, S. W., and McFarquhar, G. M.: Evaluation of the Microphysical Assumptions within GPM-DPR Using Ground-Based Observations of Rain and Snow, Atmosphere, 11, 619, https://doi.org/10.3390/atmos11060619, 2020.
Chen, B. and Liu, C.: Warm organized rain systems over the tropical eastern Pacific, J. Clim., 29, 3403–3422, https://doi.org/10.1175/JCLI-D-15-0177.1, 2016.
Chen, B., Hu, W., and Pu, J.: Characteristics of the raindrop size distribution for freezing precipitation observed in southern China, J. Geophys. Res.-Atmos., 116, https://doi.org/10.1029/2010JD015305, 2011.
Chudler, K., Rutledge, S. A., and Dolan, B.: Unique radar observations of large raindrops in tropical warm rain during PISTON, Mon. Weather Rev., 150, 2719–2736, https://doi.org/10.1175/MWR-D-21-0298.1, 2022.
D'Adderio, L. P., Vulpiani, G., Porcù, F., Tokay, A., and Meneghini, R.: Comparison of GPM Core Observatory and Ground-Based Radar Retrieval of Mass-Weighted Mean Raindrop Diameter at Midlatitude, J. Hydrometeorol., 19, 1583–1598, https://doi.org/10.1175/JHM-D-18-0002.1, 2018.
Dai, Q., Zhu, J., Zhang, S., Zhu, S., Han, D., and Lv, G.: Estimation of rainfall erosivity based on WRF-derived raindrop size distributions, Hydrol. Earth Syst. Sci., 24, 5407–5422, https://doi.org/10.5194/hess-24-5407-2020, 2020.
Das, S. and Chatterjee, C.: Rain characterization based on maritime and continental origin at a tropical location, J. Atmos. Sol.-Terr. Phys., 173, 109–118, https://doi.org/10.1016/j.jastp.2018.02.011, 2018.
Das, S., Wang, Y., Gong, J., Ding, L., Munchak, S. J., Wang, C., Wu, D. L., Liao, L., Olson, W. S., and Barahona, D. O.: A comprehensive machine learning study to classify precipitation type over land from Global Precipitation Measurement Microwave Imager (GPM-GMI) measurements, Remote Sens., 14, 3631, https://doi.org/10.3390/rs14153631, 2022.
Dolan, B., Fuchs, B., Rutledge, S. A., Barnes, E. A., and Thompson, E. J.: Primary modes of global drop size distributions, J. Atmos. Sci., 75, 1453–1476, https://doi.org/10.1175/JAS-D-17-0242.1, 2018.
El Khattabi, M.-Z., El Jai, M., Lahmadi, Y., Oughdir, L., and Rahhali, M.: Understanding the Interplay Between Metrics, Normalization Forms, and Data distribution in K-Means Clustering: A Comparative Simulation Study, Arab. J. Sci. Eng., 49, 2987–3007, https://doi.org/10.1007/s13369-023-07741-9, 2024.
Festa, D., Novellino, A., Hussain, E., Bateson, L., Casagli, N., Confuorto, P., Del Soldato, M., and Raspini, F.: Unsupervised detection of InSAR time series patterns based on PCA and K-means clustering, Int. J. Appl. Earth Obs. Geoinf., 118, 103276, https://doi.org/10.1016/j.jag.2023.103276, 2023.
Gang, A. and Bajwa, W. U.: FAST-PCA: A Fast and Exact Algorithm for Distributed Principal Component Analysis, IEEE Trans. Signal Process., 70, 6080–6095, https://doi.org/10.1109/TSP.2022.3229635, 2022.
Gatlin, P. N., Petersen, W. A., Pippitt, J. L., Berendes, T. A., Wolff, D. B., and Tokay, A.: The GPM Validation Network and Evaluation of Satellite-Based Retrievals of the Rain Drop Size Distribution, Atmosphere, 11, https://doi.org/10.3390/atmos11091010, 2020.
Gupta, A. K., Deshmukh, A., Waman, D., Patade, S., Jadav, A., Phillips, V. T. J., Bansemer, A., Martins, J. A., and Gonçalves, F. L. T.: The microphysics of the warm-rain and ice crystal processes of precipitation in simulated continental convective storms, Commun. Earth Environ., 4, 226, https://doi.org/10.1038/s43247-023-00884-5, 2023.
Hamada, A., Takayabu, Y. N., Liu, C., and Zipser, E. J.: Weak linkage between the heaviest rainfall and tallest storms, Nat. Commun., 6, 6213, https://doi.org/10.1038/ncomms7213, 2015.
Hou, A. Y., Kakar, R. K., Neeck, S., Azarbarzin, A. A., Kummerow, C. D., Kojima, M., Oki, R., Nakamura, K., and Iguchi, T.: The global precipitation measurement mission, Bull. Am. Meterol. Soc., 95, 701–722, https://doi.org/10.1175/BAMS-D-13-00164.1, 2014.
Houze Jr., R. A., Rasmussen, K. L., Zuluaga, M. D., and Brodzik, S. R.: The variable nature of convection in the tropics and subtropics: A legacy of 16 years of the Tropical Rainfall Measuring Mission satellite, Rev. Geophys., 53, 994–1021, https://doi.org/10.1002/2015RG000488, 2015.
Hu, X., Ai, W., Qiao, J., and Yan, W.: Insight into global climatology of melting layer: latitudinal dependence and orographic relief, Theor. Appl. Climatol., 155, 4863–4873, https://doi.org/10.1007/s00704-024-04926-6, 2024.
Huang, H., Zhao, K., Fu, P., Chen, H., Chen, G., and Zhang, Y.: Validation of Precipitation Measurements From the Dual-Frequency Precipitation Radar Onboard the GPM Core Observatory Using a Polarimetric Radar in South China, IEEE Trans. Geosci. Remote Sens., 60, 1–16, https://doi.org/10.1109/TGRS.2021.3118601, 2022.
Iguchi, T. and Meneghini, R.: GPM DPR Precipitation Profile L2A 1.5 hours 5 km V07, Greenbelt, MD, Goddard Earth Sciences Data and Information Services Center (GES DISC) [data set], https://doi.org/10.5067/GPM/DPR/GPM/2A/07, 2021.
Iguchi, T., Kozu, T., Meneghini, R., Awaka, J., and Okamoto, K.: Rain-Profiling algorithm for the TRMM precipitation radar, J. Appl. Meterol. Clim., 39, 2038–2052, https://doi.org/10.1175/1520-0450(2001)040>2038:RPAFTT<2.0.CO;2, 2000.
Iguchi, T., Seto, S., Meneghini, R., Yoshida, N., Awaka, J., Le, M., Chandrasekar, V., Brodzik, S., Tanelli, S., Kanemaru, K., Masaki, T., Kubota, T., and Takahashi, N.: GPM/DPR Level-2 Algorithm Theoretical Basis Document, 2021.
Jain, A. K.: Data clustering: 50 years beyond K-means, Pattern Recognit. Lett., 31, 651–666, https://doi.org/10.1016/j.patrec.2009.09.011, 2010.
Jiang, H.: The relationship between tropical cyclone intensity change and the strength of inner-core convection, Mon. Weather Rev., 140, 1164–1176, https://doi.org/10.1175/MWR-D-11-00134.1, 2012.
Jolliffe, I. T. and Cadima, J.: Principal component analysis: a review and recent developments, Phil. Trans. R. Soc. Lond. A, 374, 20150202, https://doi.org/10.1098/rsta.2015.0202, 2016.
Kumar, K. S., Das, S. K., Deshpande, S. M., Deshpande, M., and Pandithurai, G.: Regional variability of precipitation characteristics in tropical cyclones over the North Indian Ocean from GPM-DPR measurements, Atmos. Res., 283, 106568, https://doi.org/10.1016/j.atmosres.2022.106568, 2023.
Kumar, S., Flores-Rojas, J. L., Moya-Álvarez, A. S., Martínez-Castro, D., and Silva, Y.: Hydrometeors distribution in intense precipitating cloud cells over the earth's during two rainfall seasons, J. Indian Soc. Remote Sens., 52, 95–111, https://doi.org/10.1007/s12524-023-01805-x, 2024.
Kumjian, M. R. and Prat, O. P.: The impact of raindrop collisional processes on the polarimetric radar variables, J. Atmos. Sci., 71, 3052–3067, https://doi.org/10.1175/JAS-D-13-0357.1, 2014.
von Lerber, A., Moisseev, D., Marks, D. A., Petersen, W., Harri, A.-M., and Chandrasekar, V.: Validation of GMI Snowfall Observations by Using a Combination of Weather Radar and Surface Measurements, J. Appl. Meterol. Climatol., 57, 797–820, https://doi.org/10.1175/JAMC-D-17-0176.1, 2018.
Li, D., Qi, Y., and Li, H.: Statistical characteristics of convective and stratiform precipitation during the rainy season over South China based on GPM-DPR observations, Atmos. Res., 301, 107267, https://doi.org/10.1016/j.atmosres.2024.107267, 2024.
Liu, C.: Rainfall Contributions from Precipitation Systems with Different Sizes, Convective Intensities, and Durations over the Tropics and Subtropics, J. Hydrometeorol., 12, 394–412, https://doi.org/10.1175/2010JHM1320.1, 2011.
Liu, C. and Zipser, E. J.: The global distribution of largest, deepest, and most intense precipitation systems, Geophys. Res. Lett., 42, 3591–3595, https://doi.org/10.1002/2015GL063776, 2015.
Liu, C., Zipser, E. J., and Nesbitt, S. W.: Global Distribution of Tropical Deep Convection: Different Perspectives from TRMM Infrared and Radar Data, J. Climate, 191, 489–503, https://doi.org/10.1175/JCLI4023.1, 2007.
Liu, C., Zipser, E. J., Cecil, D. J., Nesbitt, S. W., and Sherwood, S.: A cloud and precipitation feature database from nine years of TRMM observations, J. Appl. Meterol. Climatol., 47, 2712–2728, https://doi.org/10.1175/2008JAMC1890.1, 2008.
Liu, N., Liu, C., and Hayden, L.: Climatology and detection of overshooting convection from 4 years of GPM precipitation radar and passive microwave observations, J. Geophys. Res.-Atmos., 125, e2019JD032003, https://doi.org/10.1029/2019JD032003, 2020.
Marukatat, S.: Tutorial on PCA and approximate PCA and approximate kernel PCA, Artif. Intell. Rev., 56, 5445–5477, https://doi.org/10.1007/s10462-022-10297-z, 2023.
Marzuki, M., Ramadhan, R., Yusnaini, H., Renggono, F., Vonnisa, M., and Hashiguchi, H.: Comparison of vertical profile of raindrop size distribution from micro rain radar with global precipitation measurement over Western Java Island, Remote Sens. Appl.-Soc. Environ., 29, 100885, https://doi.org/10.1016/j.rsase.2022.100885, 2023.
Mroz, K., Battaglia, A., and Fridlind, A. M.: Enhancing consistency of microphysical properties of precipitation across the melting layer in dual-frequency precipitation radar data, Atmos. Meas. Tech., 17, 1577–1597, https://doi.org/10.5194/amt-17-1577-2024, 2024.
Ni, X., Liu, C., Cecil, D. J., and Zhang, Q.: On the detection of hail using satellite passive microwave radiometers and precipitation radar, J. Appl. Meterol. Climatol., 56, 2693–2709, https://doi.org/10.1175/JAMC-D-17-0065.1, 2017.
Ni, X., Liu, C., and Zipser, E.: Ice microphysical properties near the tops of deep convective cores implied by the GPM Dual-Frequency Radar observations, J. Atmos. Sci., 76, 2899–2917, https://doi.org/10.1175/JAS-D-18-0243.1, 2019.
Peinó, E., Bech, J., Polls, F., Udina, M., Petracca, M., Adirosi, E., Gonzalez, S., and Boudevillain, B.: Validation of GPM DPR Rainfall and Drop Size Distributions Using Disdrometer Observations in the Western Mediterranean, Remote Sens., 16, 2594, https://doi.org/10.3390/rs16142594, 2024.
Roy, P., Biswasharma, R., Deshamukhya, A., and Sharma, S.: Spatial and seasonal variation of rainfall contribution by the height spectrum of precipitation systems and associated cloud bulk properties over the South Asia, Int. J. Climatol., 40, 3771–3791, https://doi.org/10.1002/joc.6427, 2020.
Saha, P., Majumder, S., and Maitra, A.: Rain drop size distribution analysis at a tropical location near land-sea boundary, Theor. Appl. Climatol., 147, 487–498, https://doi.org/10.1007/s00704-021-03809-4, 2022.
Seela, B. K., Janapati, J., Lin, P.-L., Wang, P. K., and Lee, M.-T.: Raindrop size distribution characteristics of summer and winter season rainfall over North Taiwan, J. Geophys. Res.-Atmos., 123, 11602–11624, https://doi.org/10.1029/2018JD028307, 2018.
Seela, B. K., Janapati, J., Lin, P.-L., Lan, C.-H., and Huang, M.-Q.: Evaluation of GPM DPR Rain Parameters with North Taiwan Disdrometers, J. Hydrometeorol., 10, 47–64, https://doi.org/10.1175/JHM-D-23-0027.1, 2023.
Shi, R., Lu, C., Xu, W., and Luo, Y.: A global view on microphysical discriminations between heavier and lighter convective rainfall, Commun. Earth Environ., 6, 511, https://doi.org/10.1038/s43247-025-02473-0, 2025.
Skofronick-Jackson, G., Petersen, W. A., Berg, W., Kidd, C., Stocker, E. F., Kirschbaum, D. B., Kakar, R., Braun, S. A., Huffman, G. J., Iguchi, T., Kirstetter, P. E., Kummerow, C., Meneghini, R., Oki, R., Olson, W. S., Takayabu, Y. N., Furukawa, K., and Wilheit, T.: The global precipitation measurement (GPM) mission for science and society, Bull. Am. Meterol. Soc., 98, 1679–1695, https://doi.org/10.1175/BAMS-D-15-00306.1, 2017.
Snook, N. and Xue, M.: Effects of microphysical drop size distribution on tornadogenesis in supercell thunderstorms, Geophys. Res. Lett., 35, https://doi.org/10.1029/2008GL035866, 2008.
Sowan, B., Hong, T.-P., Al-Qerem, A., Alauthman, M., and Matar, N.: Ensembling validation indices to estimate the optimal number of clusters, Appl. Intell., 53, 9933–9957, https://doi.org/10.1007/s10489-022-03939-w, 2023.
Suh, S.-H., You, C.-H., and Lee, D.-I.: Climatological characteristics of raindrop size distributions in Busan, Republic of Korea, Hydrol. Earth Syst. Sci., 20, 193–207, https://doi.org/10.5194/hess-20-193-2016, 2016.
Sun, Y., Dong, X., Cui, W., Zhou, Z., Fu, Z., Zhou, L., Deng, Y., and Cui, C.: Vertical Structures of Typical Meiyu Precipitation Events Retrieved From GPM-DPR, J. Geophys. Res.-Atmos., 125, e2019JD031466, https://doi.org/10.1029/2019JD031466, 2020.
Tapiador, F. J., Turk, F. J., Petersen, W., Hou, A. Y., García-Ortega, E., Machado, L. A. T., Angelis, C. F., Salio, P., Kidd, C., Huffman, G. J., and de Castro, M.: Global precipitation measurement: Methods, datasets and applications, Atmos. Res., 104–105, 70–97, https://doi.org/10.1016/j.atmosres.2011.10.021, 2012.
Thompson, E. J., Rutledge, S. A., Dolan, B., and Thurai, M.: Drop size distributions and radar observations of convective and stratiform rain over the equatorial Indian and west Pacific Oceans, J. Atmos. Sci., 72, 4091–4125, https://doi.org/10.1175/JAS-D-14-0206.1, 2015.
Uma, K. N. and Rao, T. N.: Characteristics of vertical velocity cores in different convective systems observed over Gadanki, India, Mon. Weather Rev., 137, 954–975, https://doi.org/10.1175/2008MWR2677.1, 2009.
Wang, T. and Tang, G.: Spatial Variability and Linkage Between Extreme Convections and Extreme Precipitation Revealed by 22-Year Space-Borne Precipitation Radar Data, Geophys. Res. Lett., 47, e2020GL088437, https://doi.org/10.1029/2020GL088437, 2020.
Wen, J., Wang, G., Zhou, R., Li, R., Zhaxi, S., and Bai, M.: Seasonal Variation in Vertical Structure for Stratiform Rain at Mêdog Site in Southeastern Tibetan Plateau, Remote Sens., 16, 1230, https://doi.org/10.3390/rs16071230, 2024.
Wen, L., Chen, G., Yang, C., Zhang, H., and Fu, Z.: Seasonal variations in precipitation microphysics over East China based on GPM DPR observations, Atmos. Res., 293, 106933, https://doi.org/10.1016/j.atmosres.2023.106933, 2023.
Wu, Z., Zhang, Y., Zhang, L., Zheng, H., and Huang, X.: A comparison of convective and stratiform precipitation microphysics of the record-breaking typhoon In-Fa (2021), Remote Sens., 14, 344, https://doi.org/10.3390/rs14020344, 2022.
Zhang, Y. and Wang, K.: Global precipitation system size, Environ. Res. Lett., 16, 054005, https://doi.org/10.1088/1748-9326/abf394, 2021.
Zhang, Z., Li, H., Li, D., and Qi, Y.: Spatial variability of raindrop size distribution at Beijing city scale and its implications for polarimetric radar QPE, Remote Sens., 15, 3964, https://doi.org/10.3390/rs15163964, 2023.
Zipser, E. J., Cecil, D. J., Liu, C., Nesbitt, S. W., and Yorty, D. P.: Where are the most intense thunderstorms on earth?, Bull. Amer. Meteor. Soc., 87, 1057–1072, https://doi.org/10.1175/BAMS-87-8-1057, 2006.
The requested paper has a corresponding corrigendum published. Please read the corrigendum first before downloading the article.
- Article
(11047 KB) - Full-text XML
- Corrigendum
-
Supplement
(779 KB) - BibTeX
- EndNote