the Creative Commons Attribution 4.0 License.
the Creative Commons Attribution 4.0 License.
 | 08 Apr 2026
EarthCARE Cloud Profiling Radar observations of the vertical structure of marine stratocumulus clouds
Pavlos Kollias
Susmitha Sasikumar
Alessandro Battaglia
Bernat Puigdomènech Treserras
Matthew L. Walker McLinden
Launched in May 2024, the EarthCARE Cloud Profiling Radar (EC-CPR) provides enhanced sensitivity, finer horizontal resolution, finer vertical sampling and greatly reduced surface clutter contamination compared to its predecessor, the CloudSat's CPR (CS-CPR). These improvements enable more accurate detection and characterization of the vertical structure of marine low-level clouds. This study presents the first year of EC-CPR observations of stratocumulus (Sc) clouds over the Southeast Pacific and Southeast Atlantic Oceans.
The analysis of EC-CPR clear-sky profiles and comparisons with airborne radar data confirm that surface clutter is effectively suppressed above 0.5 km. Comparisons with CS-CPR data from 2007–2008 show that EC-CPR detects nearly double the Sc amount relative to CS-CPR in the regions of study. When a columnar maximum reflectivity (ZMAX) threshold of −15 dBZ is used to flag raining profiles, CS-CPR is found to underestimate rainfall occurrence by ∼ 20 % for ZMAX located between 500 and 750 m above the surface.
Using a steady-state one-dimensional drizzle model, the impact of the point target response (PTR) on EC-CPR reflectivity profiles in Sc clouds is examined. PTR causes vertical stretching of radar-detected cloud boundaries, resulting in an overestimation of cloud thickness by approximately 0.4–0.5 km in drizzling clouds. Additionally, PTR induces parabolic shaping of reflectivity profiles regardless of drizzle presence, complicating the distinction between drizzle-free and drizzle-containing clouds. These findings underscore the need for cautious interpretation of radar reflectivity profiles and suggest the incorporation of additional constraints, such as Doppler velocity and path-integrated attenuation to improve future drizzle detection strategies.
- Article
(4463 KB) - Full-text XML
-
Supplement
(634 KB) - BibTeX
- EndNote


Stratocumulus (Sc) clouds cover extensive areas of the subtropical oceans especially near the eastern continental boundaries (Hartmann et al., 1992; Wood, 2012). These extensive low-level clouds exert a strong net cooling radiative effect by strongly reflecting the incoming shortwave radiation, while having a relatively small impact on outgoing longwave emission due to their low altitude. Several processes including turbulent mixing, drizzle formation, mesoscale organization active at different scales contribute to their radiative and microphysical properties.
Drizzle that may or may not reach the Earth's surface is ubiquitous in the marine Sc (Glienke et al., 2017; Wu et al., 2017, Yang et al., 2018, Zhu et al., 2022). In spite of the low intensity on average (0.5 to 2 mm d−1 considered as moderate drizzle, Wood, 2012), the evolution of drizzle has a critical role in shaping the interaction of aerosol, macrophysics, microphysics and dynamics of Sc clouds (e.g., L'Ecuyer et al., 2009; Wood et al., 2012; Yamaguchi et al., 2017; Eastman et al., 2021), which subsequently modulate the overall cloud albedo, lifetime and the effectiveness of associated climate cooling (Mülmenstädt et al., 2021).
The National Aeronautics and Space Administration (NASA) CloudSat Cloud Profiling Radar (CS-CPR) lead the pioneering efforts of observing low level stratiform marine clouds and associated light precipitation globally (Stephens et al., 2002). The CS-CPR is the first 94 GHz radar in space with initial sensitivity at around −30 dBZ (Tanelli et al., 2008). The reflectivity was sampled at a vertical resolution of 480 m with 240 m oversampling averaged over a 1.4 km by 1.7 km footprint (cross and along track). The reflectivity profiles in Sc provided information on cloud structure and drizzle particle size (Kollias et al., 2011a, b). Since the launch in 2006, CS-CPR in synergy with other active and passive sensors in the NASA A-train constellation served as a key benchmark for climate models (e.g., Stephens et al., 2010), but also advanced a diversity of scientific understanding from aerosol-cloud interactions to warm rain formations (Leon et al., 2008; Takahashi et al., 2017; Suzuki et al., 2010; among many others). Despite the achievements and efforts, stratocumulus clouds are inherently challenging for spaceborne CPRs, given they are typically capped by a strong inversion with cloud thickness <500 m (e.g., Yang et al., 2018) and 50 % of the sub-cloud rain echoes can be below 0.75 km (Lamer et al., 2020). For instance, 30 %–70 % of cloudy columns in marine boundary layer clouds can be missed by CS-CPR due to the ground clutter (0.75–1 km), limited sensitivity, and coarse sampling range (Rapp et al., 2013; Christensen et al., 2013; Liu et al., 2018; Lamer et al., 2020).
With the decommissioning of NASA's CloudSat and CALIPSO satellites in 2023, the launch of EarthCARE satellite could therefore not come at a more opportune time. The Earth Clouds, Aerosol and Radiation Explorer (EarthCARE, Wehr et al., 2023) is a joint European/Japanese mission that was successfully launched in May 2024. The payload is composed of a 94 GHz Doppler Cloud Profiling Radar (EC-CPR hereafter), a high-spectral-resolution ATmospheric LIDar (ATLID), a multi-spectral imager (MSI) and a broadband radiometer (BBR). The composition resembles A-train in a way permitting synergistic approaches that integrate profiling capabilities of radar and lidar with the passive imagers providing broad cloud context.
EC-CPR is the first spaceborne cloud radar with Doppler capabilities, which open the opportunities of estimating vertical air motions and sedimentation rates on a global scale (Kollias et al., 2014). In addition, EC-CPR has improvements in several aspects regarding reflectivity measurements, compared to its predecessor CS-CPR. EC-CPR possesses a larger antenna (2.5 vs. 1.8 m diameter) and flies at lower altitude (∼ 393 km vs. 705–732 km of CS-CPR), which allows an enhancement of sensitivity and a reduction of footprint size. The minimum detectable signal (MDS) of EC-CPR is around −35 dBZ, whereas CloudSat's MDS varied over the course of the mission being close to −30 dBZ in 2007 and ending near −25 dBZ in 2020 (personal communication, Roger Marchand). EC-CPR's instantaneous footprint at the surface level is 750 m (Wehr et al., 2023), approximately a factor of 2.3 (along track) and 4 (field-of-view area) smaller than the CS-CPR footprint. As such, the non-uniform beam filling (NUBF) effect is expected to be largely mitigated (Battaglia et al., 2020; Xu et al., 2026). In terms of vertical sampling, EC-CPR provides a finer range sampling at 100 m relative to CS-CPR at 240 m. Horizontally, along-track integration length is reduced to 500 m (Kollias et al., 2023) from 1.1 km of CS-CPR.
Drizzle detection with radar observations is an ongoing topic of interest. A threshold of radar reflectivity, typically ranging from −20 to −15 dBZ, is used to distinguish drizzling and non-drizzling clouds in many studies (Chin et al., 2000; Mace and Sassen, 2000; Kato et al., 2001; Wang and Geerts, 2003; Kogan et al., 2005; Leon et al., 2008; Lebsock et al., 2008; among others). In the CloudSat 2C-PRECIP-COLUMN product (Haynes et al., 2009), rain is flagged possible when near-surface reflectivity exceeds −15 dBZ with rain occurrence more certain with enhanced reflectivity. This threshold reflectivity can vary with cloud droplet number concentration and effective radius as well as liquid water path (LWP, Liu et al., 2008; Leon et al., 2008). Fewer studies explored the slope of CS-CPR reflectivity profiles in order to determine the onset of warm rain (Wang et al., 2017), which is based on where the maximum columnar reflectivity (ZMAX) is located in the vertical profile. The different locations of ZMAX (HMAX) signal the different predominant microphysical processes. Reflectivity increases with height (ZMAX closer to cloud top) within the non-raining clouds due to condensational growth. As the collision and coalescence processes becoming more efficient with drizzle development, ZMAX is expected to move towards cloud base.
The primary objectives of this study are as follows:
-
Evaluate the overall performance of the first-year EC-CPR observations regarding the detection of cloud and precipitation within Sc over the Southeast Pacific (SEP) and Southeast Atlantic (SEA) Ocean.
-
Compare the existing EC-CPR observations of subtropical Sc with the climatology based on CS-CPR to understand the novel insights EC-CPR can introduce with its enhanced capabilities. A continuous long-term observational record of marine low clouds can be possible with consistency established and discrepancies well understood.
-
Combining observations with a drizzle model, we investigate how the key information contained in reflectivity profiles regarding drizzle occurrence can be distorted by the radar point target response (PTR) and surface clutter.
2.1 EarthCARE and CloudSat observations
The EC-CPR observations cover the period from June 2024 to 19 May 2025 and include the radar reflectivity corrected for gaseous attenuation and the feature mask that identifies significant detections from hydrometeors and removes noise, ground-clutter and other artifacts (Kollias et al., 2023). Two years (2007 and 2008) of CS-CPR observations are used for comparison. The CS-CPR radar reflectivity and cloud mask are from the 2B-GEOPROF R05 (Marchand et al., 2008). The data analysis focuses on two 20×20° geographical regions that are well known for their strong climatology of low-level stratiform clouds. The first is in the Southeast Pacific (SEP), centered at 80° W and 20° S off the coast of Chile. The other is in the Southeast Atlantic (SEA), centered around 0 and 15° S off the coast of Angola and Namibia.
A number of criteria are applied to select single-layer marine low cloud profiles from the EC dataset: (1) “significant_detection_classification” is between 1 and 3, so as to exclude range bins that are identified to be contaminated by ground clutter with high confidence or other artifacts such as mirror images and multiple scattering tails. (2) continuous radar echo with reflectivity greater than −35 dBZ extend from below 1 up to 3.5 km. An upper threshold from 3 to 4 km is often taken for Sc cloud regime as the majority of maritime Sc has cloud top below 3 km (Leon et al., 2008; Muhlbauer et al., 2014). (3) There are no measured reflectivities that exceed −35 dBZ within 1 km above the identified low-level clouds, so the identified layer clearly separated from higher clouds. (4)“land_flag” is used to determine observations taken over the ocean surface. (5) At least two continuous cloudy range bins vertically are required.
Given the differences of radar system and data products, the criteria used for CloudSat are adjusted accordingly. (1) Consistent with previous studies (e.g., Muhlbauer et al., 2014), Cloud_mask is ≧20 to remove clutter and very weak echoes with high uncertainty. (2) and 3) are the same as applied the in the EC data but use the minimum detectable signal of −30 dBZ as the threshold. (4) “Surface_type” from 2C-Precip-COLUMN R05 (Haynes et al., 2009) is used to identify profiles over open ocean without sea ice. (5) applied to the EC dataset is not required for CloudSat, provided the different vertical resolution (240 vs. 100 m) and the shallow nature of Sc.
Figure1 exhibits the spatial maps of mean cloud fraction for the studied regions, which are calculated by dividing the total number of identified Sc profiles by the total number of all observed profiles within 1×1° bins. Cloud fraction estimated using EC-CPR (Fig. 1a) is on average 19 % higher than the estimates based on CS-CPR (Fig. 1b). Despite the weak La Niña forcing together with the abnormally warm SSTs in 2024–2025 are inclined to cause modest decrease of Sc cloud fraction in the more offshore regions, EC-CPR detects overall higher cloud fraction due to its enhanced capability. The spatial characteristics of EC-CPR cloud fraction show good consistency with the climatology built upon 5 years of CS-CPR (Marchand et al., 2008) and CALIPSO (Mace et al., 2009) data (Fig. 2 in Muhlbauer et al., 2014), though about 20 % more Sc clouds can only be detected with radar and lidar together. Moving westward and further offshore, cloud fraction is lower consistent with well-known tendency of the extensive Sc cloud decks in this region gradually breaking with cumulus developing under Sc, as boundary layer deepens, and stability reduces. The change of cloud features and mesoscale organizations is also reflected by the increased cloud top height (CTH) variability moving away from the coasts (Fig. S1b and d in the Supplement). Near the coast Sc deck is capped by the strong inversion and frequently non- or lightly drizzling with low CTH, which is particularly challenging for spaceborne radars. EC-CPR shows an improvement as significant as ∼ 30 % in the detection of coastal Sc (Fig. 1c). In terms of radar-detected CTH, EC-CPR and CS-CPR diverge most near the coast (Fig. S1a and c). CTH is reported to be about 1–1.2 km just offshore of Chile/Peru and increase to 1.5–2 km by 85° W during the VOCALS Regional Experiment (Bretherton et al., 2010), which is quite consistent with the EC-CPR observations shown in Fig. S1a.
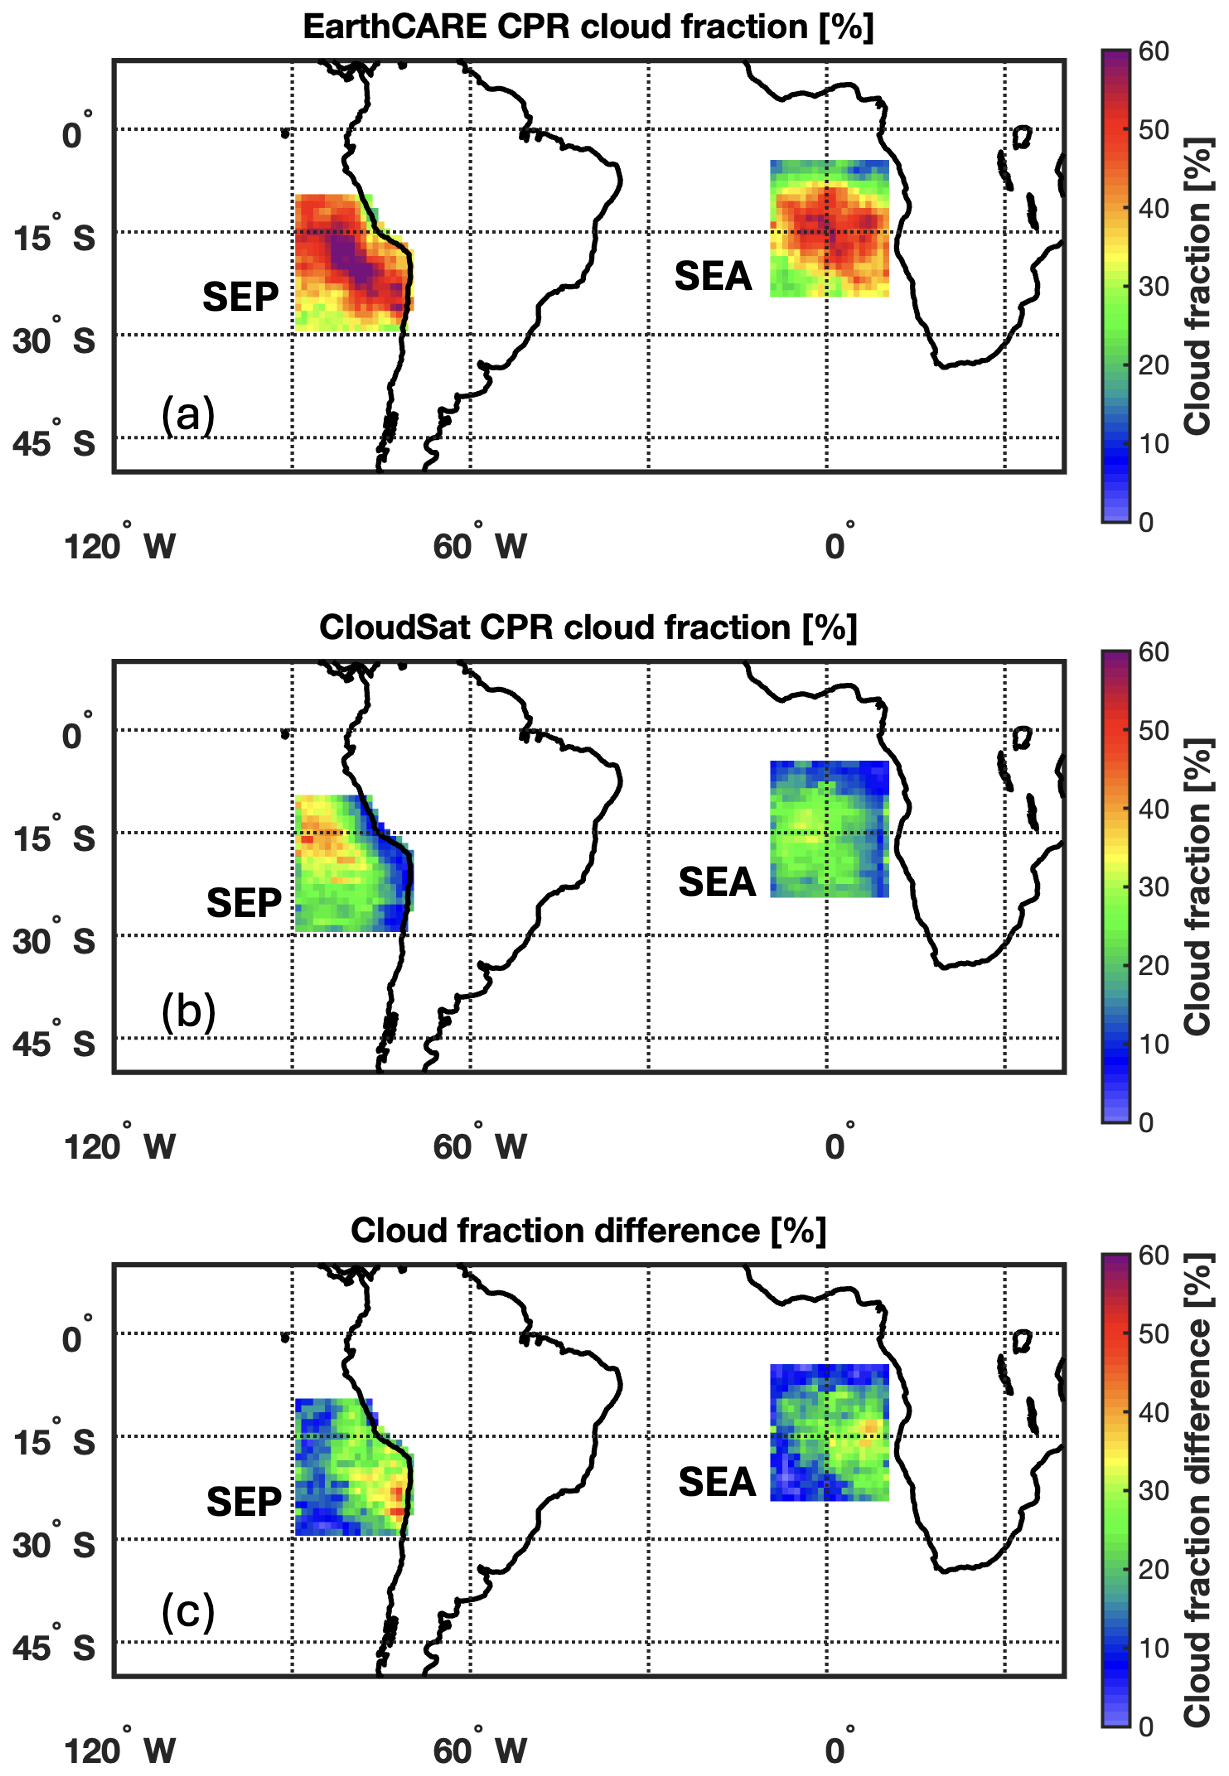
Figure 1(a) Spatial maps of cloud fraction from the first year of the EarthCARE CPR data for the studied regions over Southeast Atlantic (SEA) and Southeast Pacific (SEP) Ocean. (b) Same as in (a), but for the 2-year CloudSat CPR data from 2007 to 2008. Means of 1×1° bins are shown. (c) The difference of cloud fraction between EarthCARE and CloudSat CPR. A 2D box smoothing is applied to reduce the noise in the spatial map, which does not affect the analysis in the remainder of the manuscript.
2.2 Drizzle model
A one-dimensional (1D) steady-state drizzle model is employed (Kollias et al., 2011b) to help with the interpretation of the vertical structure of stratocumulus as documented by the EC-CPR. The model was developed to study the evolution of the drizzle DSDs within and below warm stratiform clouds, allowing for various assumptions for key parameters and processes, such as cloud number concentration (Nd), LWP amount, autoconversion schemes, initial drizzle DSDs, and the vertical distribution of the cloud liquid water content (LWC) and the degree of adiabaticity. The vertical resolution of the model is 10 m.
Cloud LWC increases with height above cloud base, the rate of which is determined by Γad and fad. Γad indicates the theoretically predicted growth rate in an adiabatic rising parcel. A constant value of kg m−4 is used here. fad is the adiabaticity factor that represents the degree of departure from the adiabatic assumption due to mixing. fad is set to be either 1 (adiabatic) or follow the parameterization in Wood et al. (2009) where fad scales with height in the cloud layer. Cloud DSD is assumed to be lognormal. Nd is constant in the cloud layer, with the value specified to be 50, 100, 200, 400, 750, or 1000 cm−3, representing a range of environments from pristine to very polluted. Cloud LWP is varied from about 50 to 250 gm−2, which is consistent with the climatology of observed Sc clouds. Five autoconversion schemes are considered. Three of them parameterizes autoconversion solely as a function of cloud mass content and number concentration (Tripoli and Cotton, 1980; Khairoutdinov and Kogan, 2000; Wood, 2005), whereas Liu and Daum (2004) uses cloud droplet larger order moments and Seifert and Beheng (2001) uses drizzle water mixing ratio.
The initial size distribution of injected drizzle via autoconversion is assumed to be a two-shape parameter generalized gamma distribution. The explicit calculation of the further stochastic growth of each drizzle size via the cloud droplet accretion is done using collision efficiency from Vohl et al. (2007). Observational study suggests that the choice of accretion rate formulation results in less diversity in comparison to the choice of autoconversion scheme (Wood, 2005). As such, we use 5 different autoconversion parameterizations with the accretion formulation unchanged. The diameter of embryo drizzle drops is set to be either 60 or 80 µm. Below clouds in the sub-saturated environment drizzle drops are subject to evaporation process. A linear decrease at 0.36 km−1 is imposed for relative humidity below cloud base based on EPIC observations (Comstock et al., 2004).
A total of over 1500 reflectivity profiles are generated by combining 5 different Nd, varying LWP, 2 assumptions of cloud LWC profile (fad=1 or scales with height in the cloud layer), 5 autoconversion schemes, and 2 options regarding embryo drizzle size (60 or 80 µm). Other assumptions in the 1D drizzle model are fixed for this study.
2.3 EC-CPR Point Target Response
The radar point target response (PTR) describes how a radar system responds to an idealized “point target” (a target so small compared to the radar backscattering volume that it can be treated as a single scattering point in space). The EC-CPR PRT depends on the pulse length and on the receiver specifics. Understanding the PTR is very important for the interpretation of radar reflectivity profiles from shallow cloud systems such as low-level stratiform marine clouds. The PTR can smooth the reflectivity profiles, causing a reduction of peak reflectivity and an extension of cloud boundaries determined by radar echoes (Burns et al., 2016; Lamer et al., 2020).
Considering the Earth's surface as a point target, the clear-sky reflectivity profiles measured in proximity to the surface can be used to estimate the PTR. A CFAD composed of over 8 million EC-CPR reflectivity collected under clear-sky conditions with wind speeds between 7.5 and 8.5 m s−1 (thus σo about 10 dB, Sasikumar et al., 2025) is shown in Fig. 2. The red line indicates the derived median. Reflectivity peaks around 35 dBZ at the surface and rapidly decreases to −35 dBZ at the altitude of 0.5 km. The variability of surface echoes is subject to gaseous attenuation, the movement of satellite altitude and surface conditions (Burns et al., 2016). The strength of surface return varies within a few dB under the selected wind condition.
The EC-CPR PTR was designed to be asymmetric. The ground clutter is fully suppressed (below the EC-CPR MDS) 500 m above the sea surface while it has a gentler roll-off at negative heights (tail of the PTR). Therefore, it is different from the CS-CPR PTR that is largely symmetric (Lamer et al., 2020).
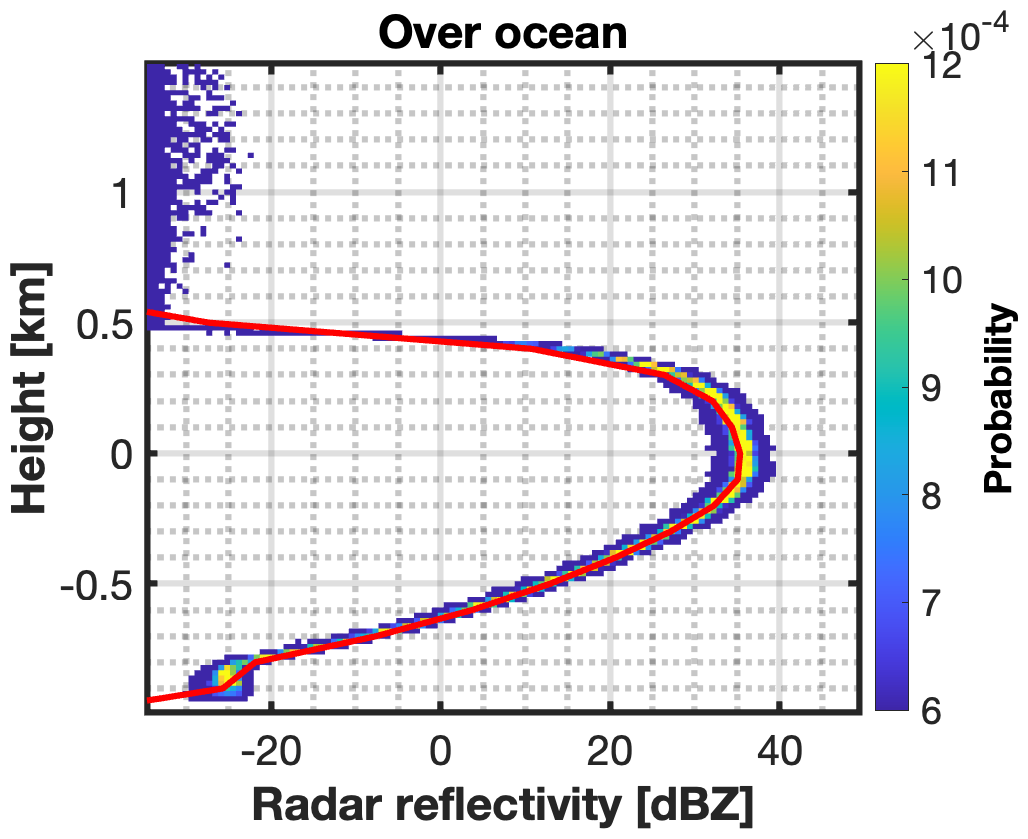
Figure 2Contour of Frequency by Altitude Diagram (CFAD) of over 8 million clear-sky reflectivity profiles observed by EC-CPR over ice-free ocean where wind speeds are within 8±0.5 m s−1. The solid red line represents the derived median as the PTR function.
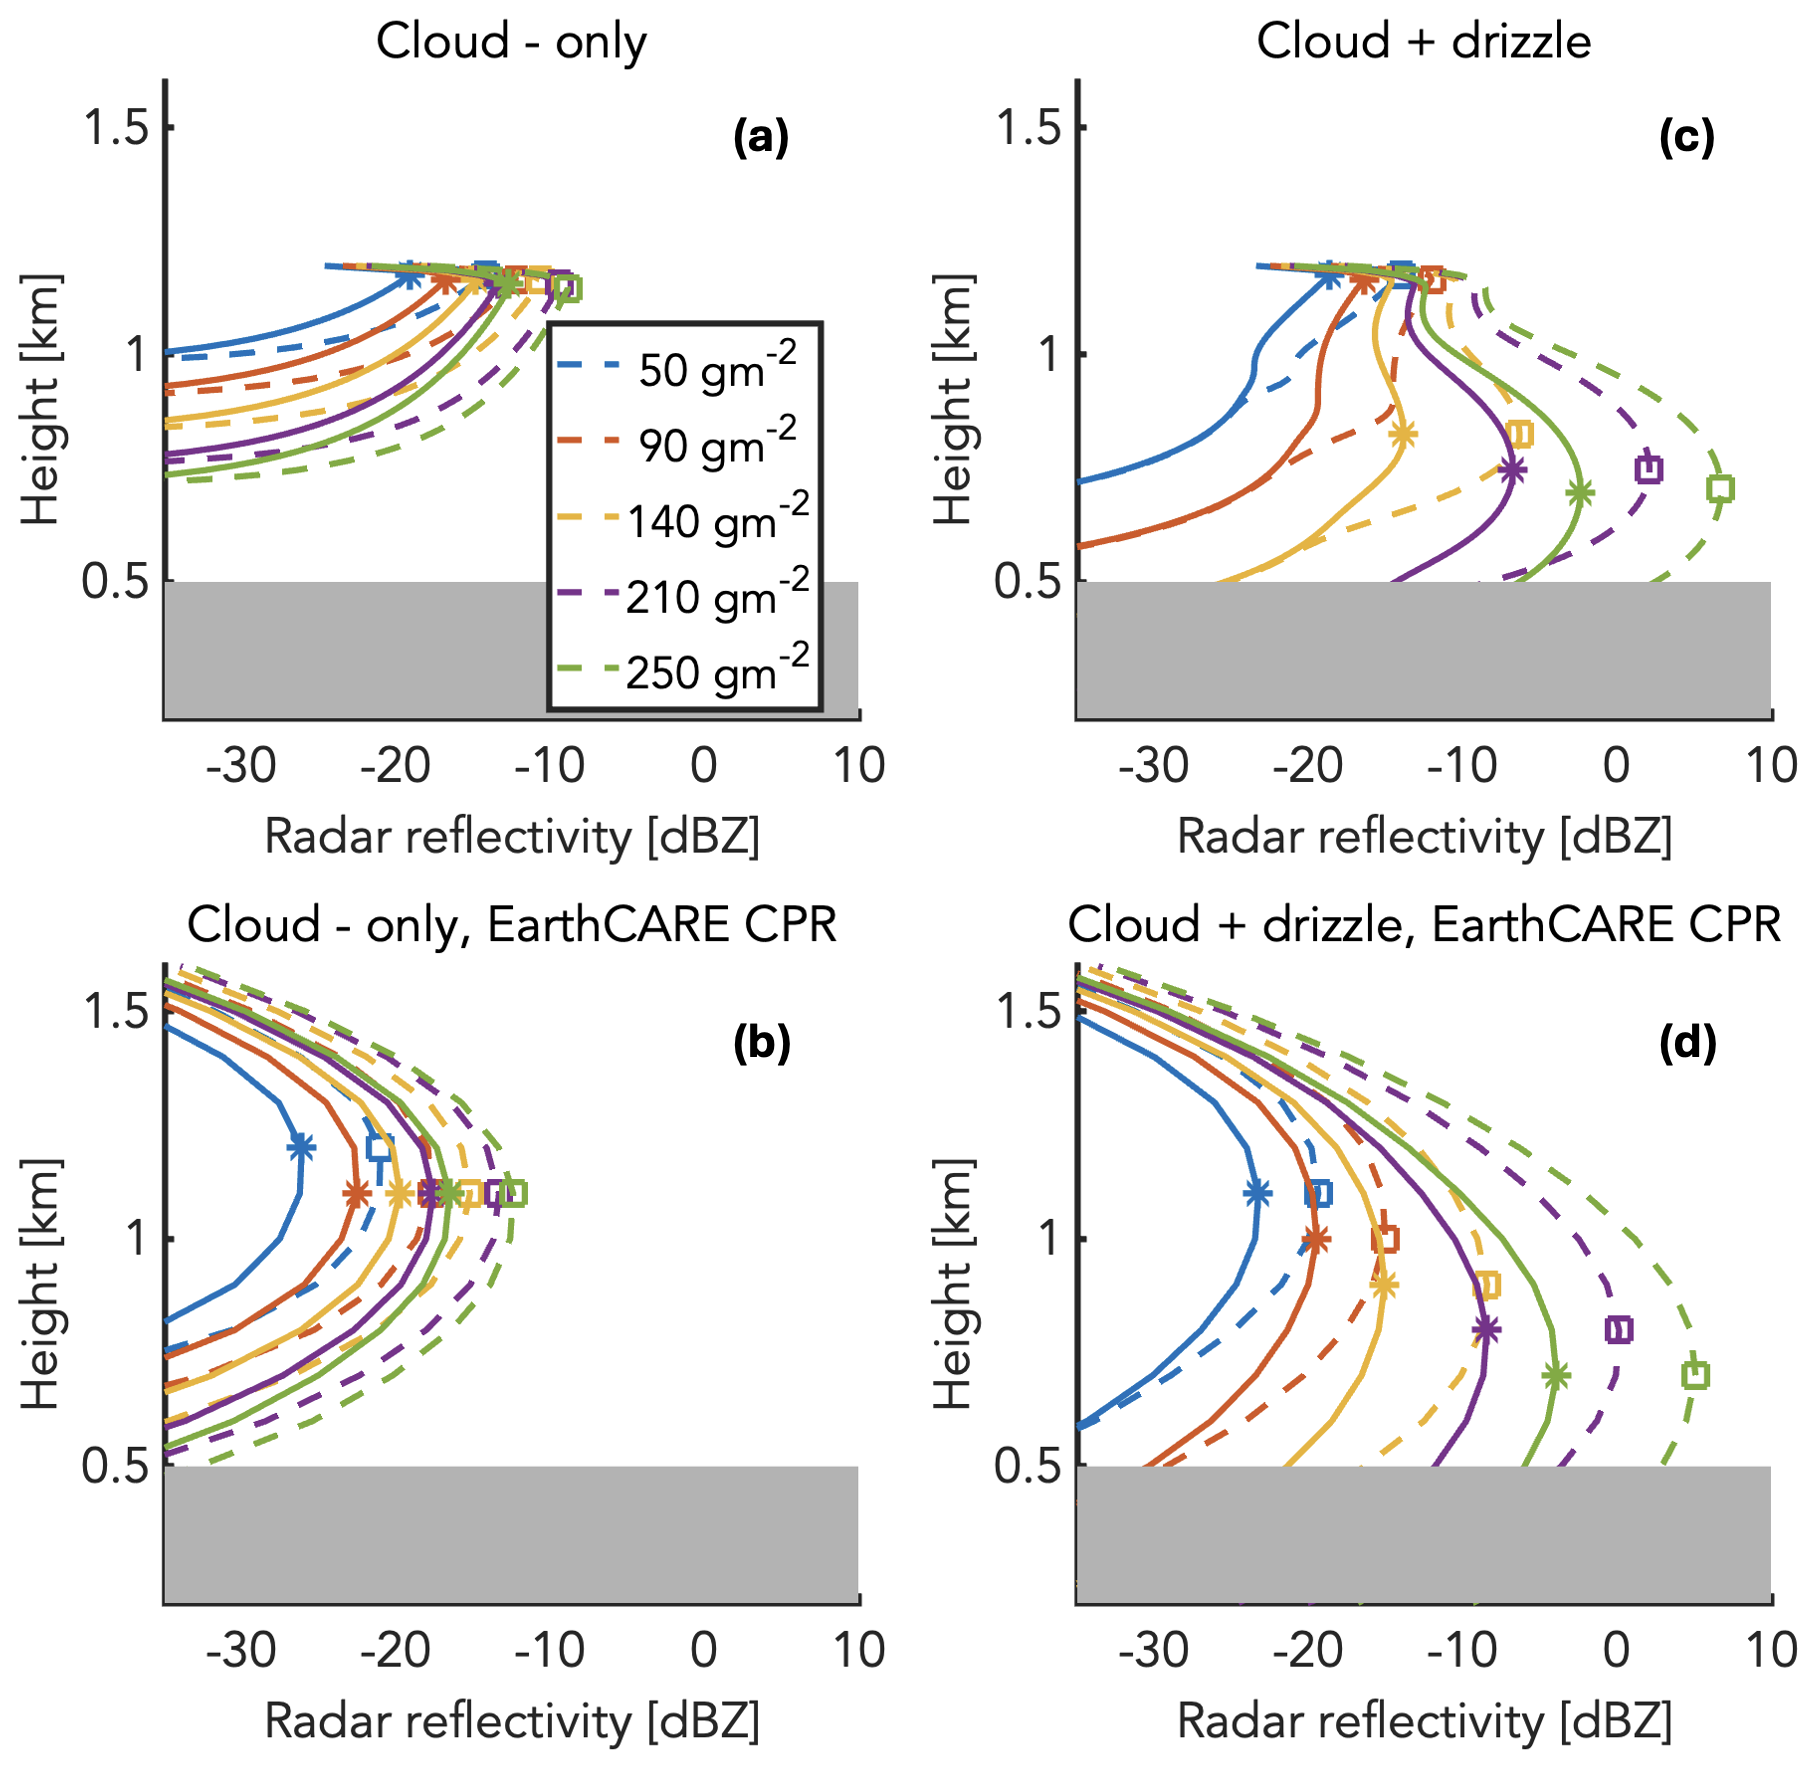
Figure 3(a) Reflectivity profiles forward calculated from the 1D microphysical model output using the cloud only hydrometeors; (b) same as (a), but with the PTR applied. (c) Reflectivity profiles forward calculated from the 1D microphysical model output using both the cloud and drizzle hydrometeors (which correspond to the actual radar signal); (d) same as in (c), but with PTR applied. Solid and dash lines indicate that total number of cloud droplets per unit of volume (200 and 50 m−3, respectively). Colors indicate different cloud LWP in gm−2 as shown in legend. Asterisks and squares respectively represent the height of the ZMAX. The gray zone indicates the region contaminated by the surface clutter.
2.4 EC-CPR simulations
The 1D model “cloud only” and “cloud + drizzle” microphysical profiles are used as input to estimate the radar reflectivity at the model resolution (10 m) using T-matrix scattering. Figure 3a and c show ten radar reflectivity profiles for two different Nd values (50 and 200 cm−3) and five LWP values between 51 to 252 gm−2. The top-row panels show the vertical profiles at model resolution and the bottom-row panels display what the EC-CPR would observe correspondingly. Prior to the application of the PTR, reflectivity tends to increase with height when there exist only cloud particles due to the condensational growth of the cloud droplets (Fig. 3a). The location of the maximum radar reflectivity (ZMAX) is indicated by squares and asterisks. In the cloud-only profiles, ZMAX is close to the cloud top with values between −25 and −10 dBZ. In general, larger LWP leads to larger cloud reflectivity given the same Nd, and likewise smaller Nd results in larger cloud reflectivity provided the same LWP. For Nd this is due to the bigger droplets formed in the more pristine environment for the same LWP.
When drizzle particles are added to the cloud-only profiles, the processes of autoconversion and accretion that transfer water mass from the cloud to the drizzle category also contribute to the determination of the radar reflectivity profile. In this case (Fig. 3c), the height of ZMAX (HMAX) tends to be lowered and within closer proximity to cloud base, the specific location of which varies with microphysics (Fig. 3c). This is consistent with surface-based observations (Frisch et al., 1995; Kollias et al., 2004; Serpetzoglou et al., 2008). The reflectivity starts to decrease as drizzle drops fall below cloud base under the effect of evaporation process (Yang et al., 2018; Ghate and Cadeddu, 2019). The values of ZMAX are also significantly increased due to the presence of larger drizzle drops with range between −20 to +5 dBZ. It is worth noting that ZMAX is often located below cloud base with the existence of drizzle (e.g., Comstock et al., 2004) and therefore HMAX cannot be simply interpreted as an equivalent to cloud base height. In addition, HMAX is not necessarily where rain rates (∼ D4) or total water mass (∼ D3) reaches the maximum due to the fact that reflectivity (∼ D6) is disproportionately sensitive to the larger drops in the volume. There is considerable overlap in the range of ZMAX values in “cloud only” and “cloud + drizzle” profiles. Nevertheless, location of the ZMAX (HMAX) and the morphology of the radar reflectivity profile could add critical information for the detection of drizzle particles in the radar reflectivity profiles of low-level stratiform clouds (Fig. 3a vs. c).
The forward simulated profiles of radar reflectivity for the cloud-only and cloud and drizzle profiles are convoluted in range with the EC-CPR PTR to simulate the vertical stretch effects of the 500 m pulse length using the methodology described in Lamer et al., 2020 (Fig. 3b, d). The EC-CPR PTR complicates the interpretation of the radar reflectivity profile. After applying the PTR, the shape of cloud-only reflectivity profiles (Fig. 3b) changes significantly and the initially asymmetrical profile becomes parabolic. The HMAX shift lower, closer to the center of the CPR echo profile (Fig. 3b) instead of near the cloud top as shown in Fig. 3a. Also notable is the vertical stretching of cloud layers, with the top and bottom of the radar echo stretched upwards and downwards, respectively (Lamer et al., 2020). Thus, biases are introduced in terms of cloud boundaries based on radar signal returns (Burns et al., 2016). As for the drizzling scenario, the convolution with PTR smooths out the vertical change associated with microphysical processes and thickens the hydrometeor layer as well (Fig. 3d). More importantly, the PTR blurs the distinction between “cloud-only” and “cloud + drizzle” profiles that could have been made with the radar observations with high vertical resolution (short pulse) based on the relative position of ZMAX in the vertical column.
The impact of the EC-CPR PTR on the observed thickness of low-level marine stratiform clouds is further demonstrated in Fig. 4. Using all the simulated EC-CPR reflectivity profiles of the 1D model output, the hydrometeor layer thickness (ΔH) with or without the PTR range convolutions applied and using the same minimum detectable signal as the EC-CPR is estimated. As expected, the application of the PTR shifts the relationship away from the 1:1 line. The ΔH varies from 0.2 to 0.5 km in the cloud-only cases from the 1D model. After the convolution with PTR, most cloud-only ΔH is between 0.4 and 1 km (triangles). The similar inflation of ΔH is also observed in the “cloud + drizzle” cases with an average increase about 0.4–0.5 km (circles). As expected, ΔH is overall thicker with the presence of drizzle. In addition, there appears to be a more significant change in ΔH due to PTR for profiles with higher ZMAX.
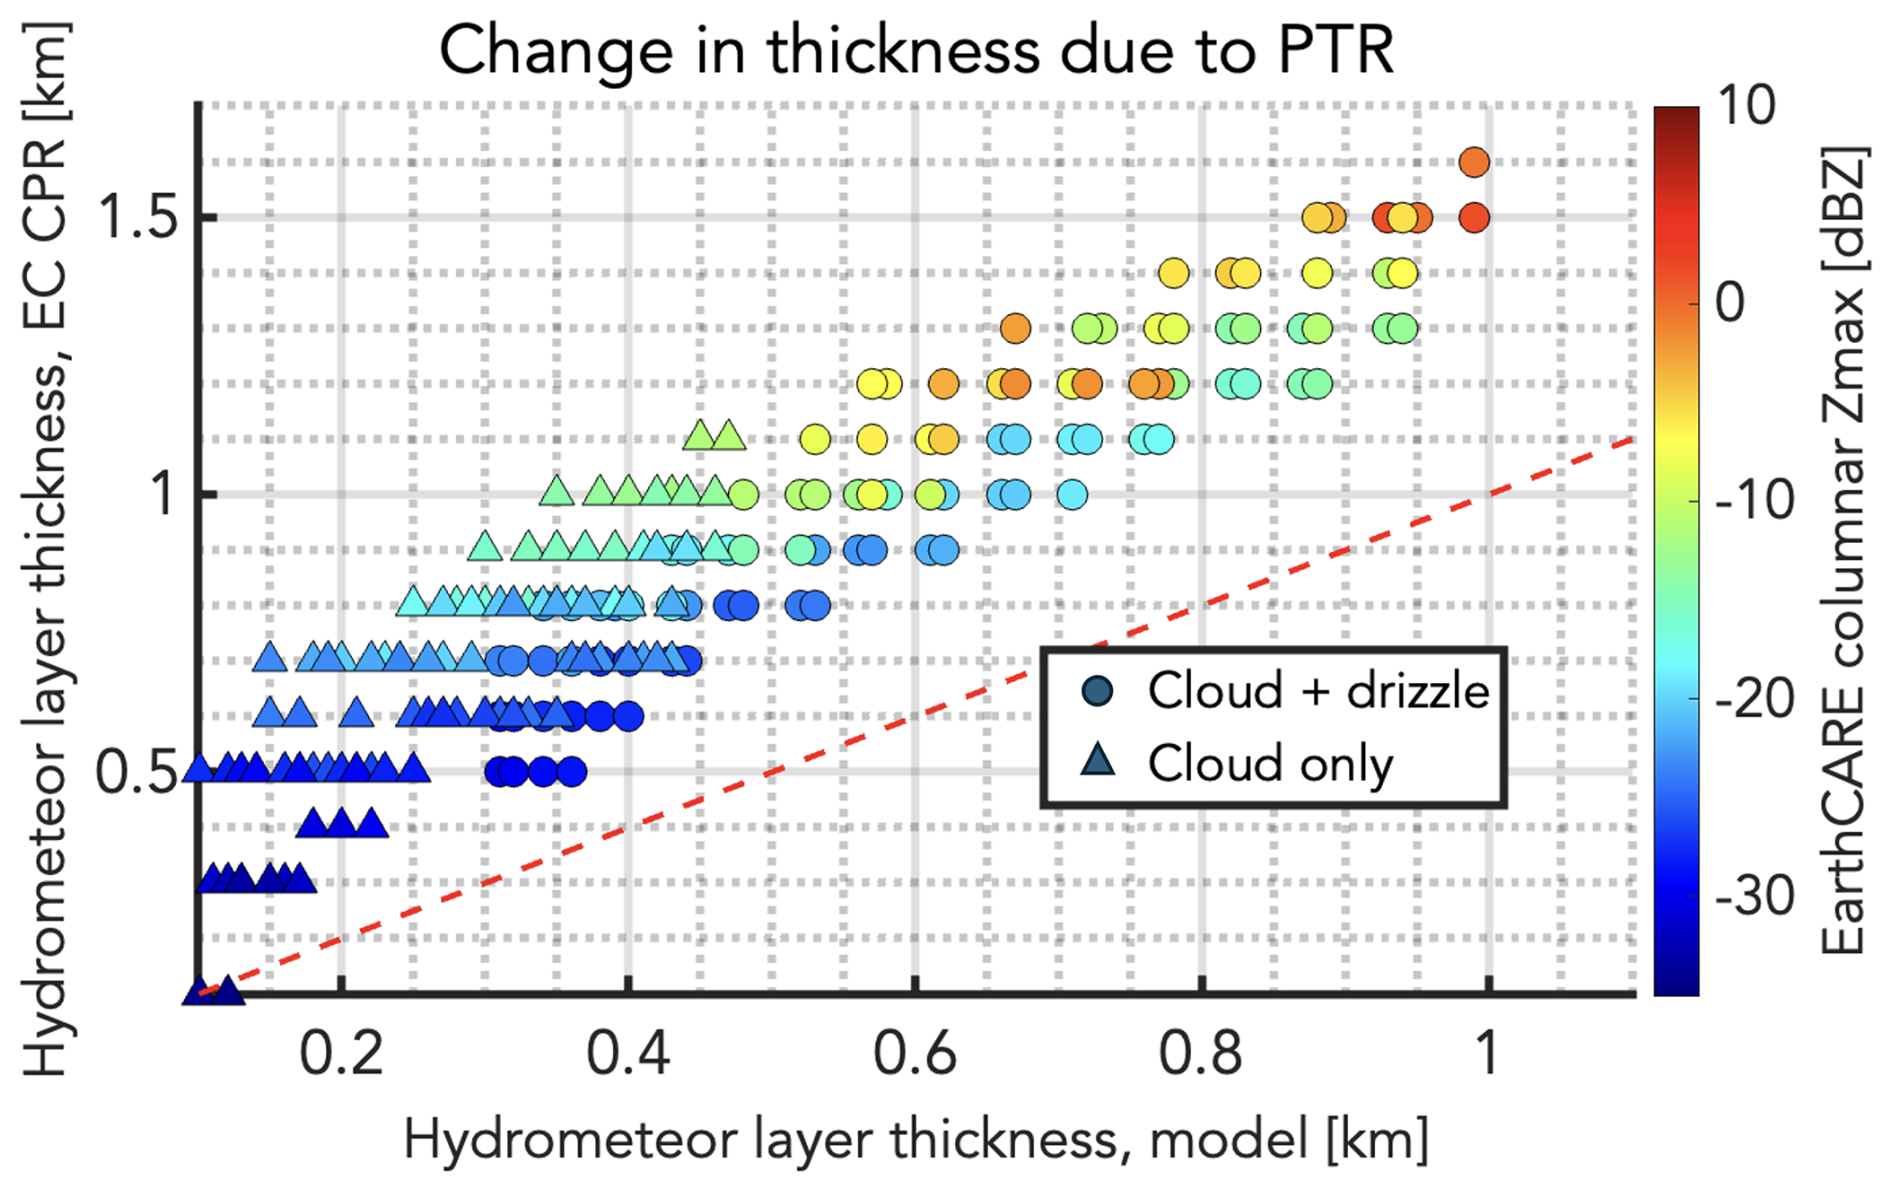
Figure 4Model hydrometeor layer thickness with EC-CPR PTR convolved vs. model hydrometeor layer thickness without the PTR applied. Colors indicate the ZMAX in the column. Circles represent “cloud + drizzle” profiles and triangles represent “cloud-only” profiles.
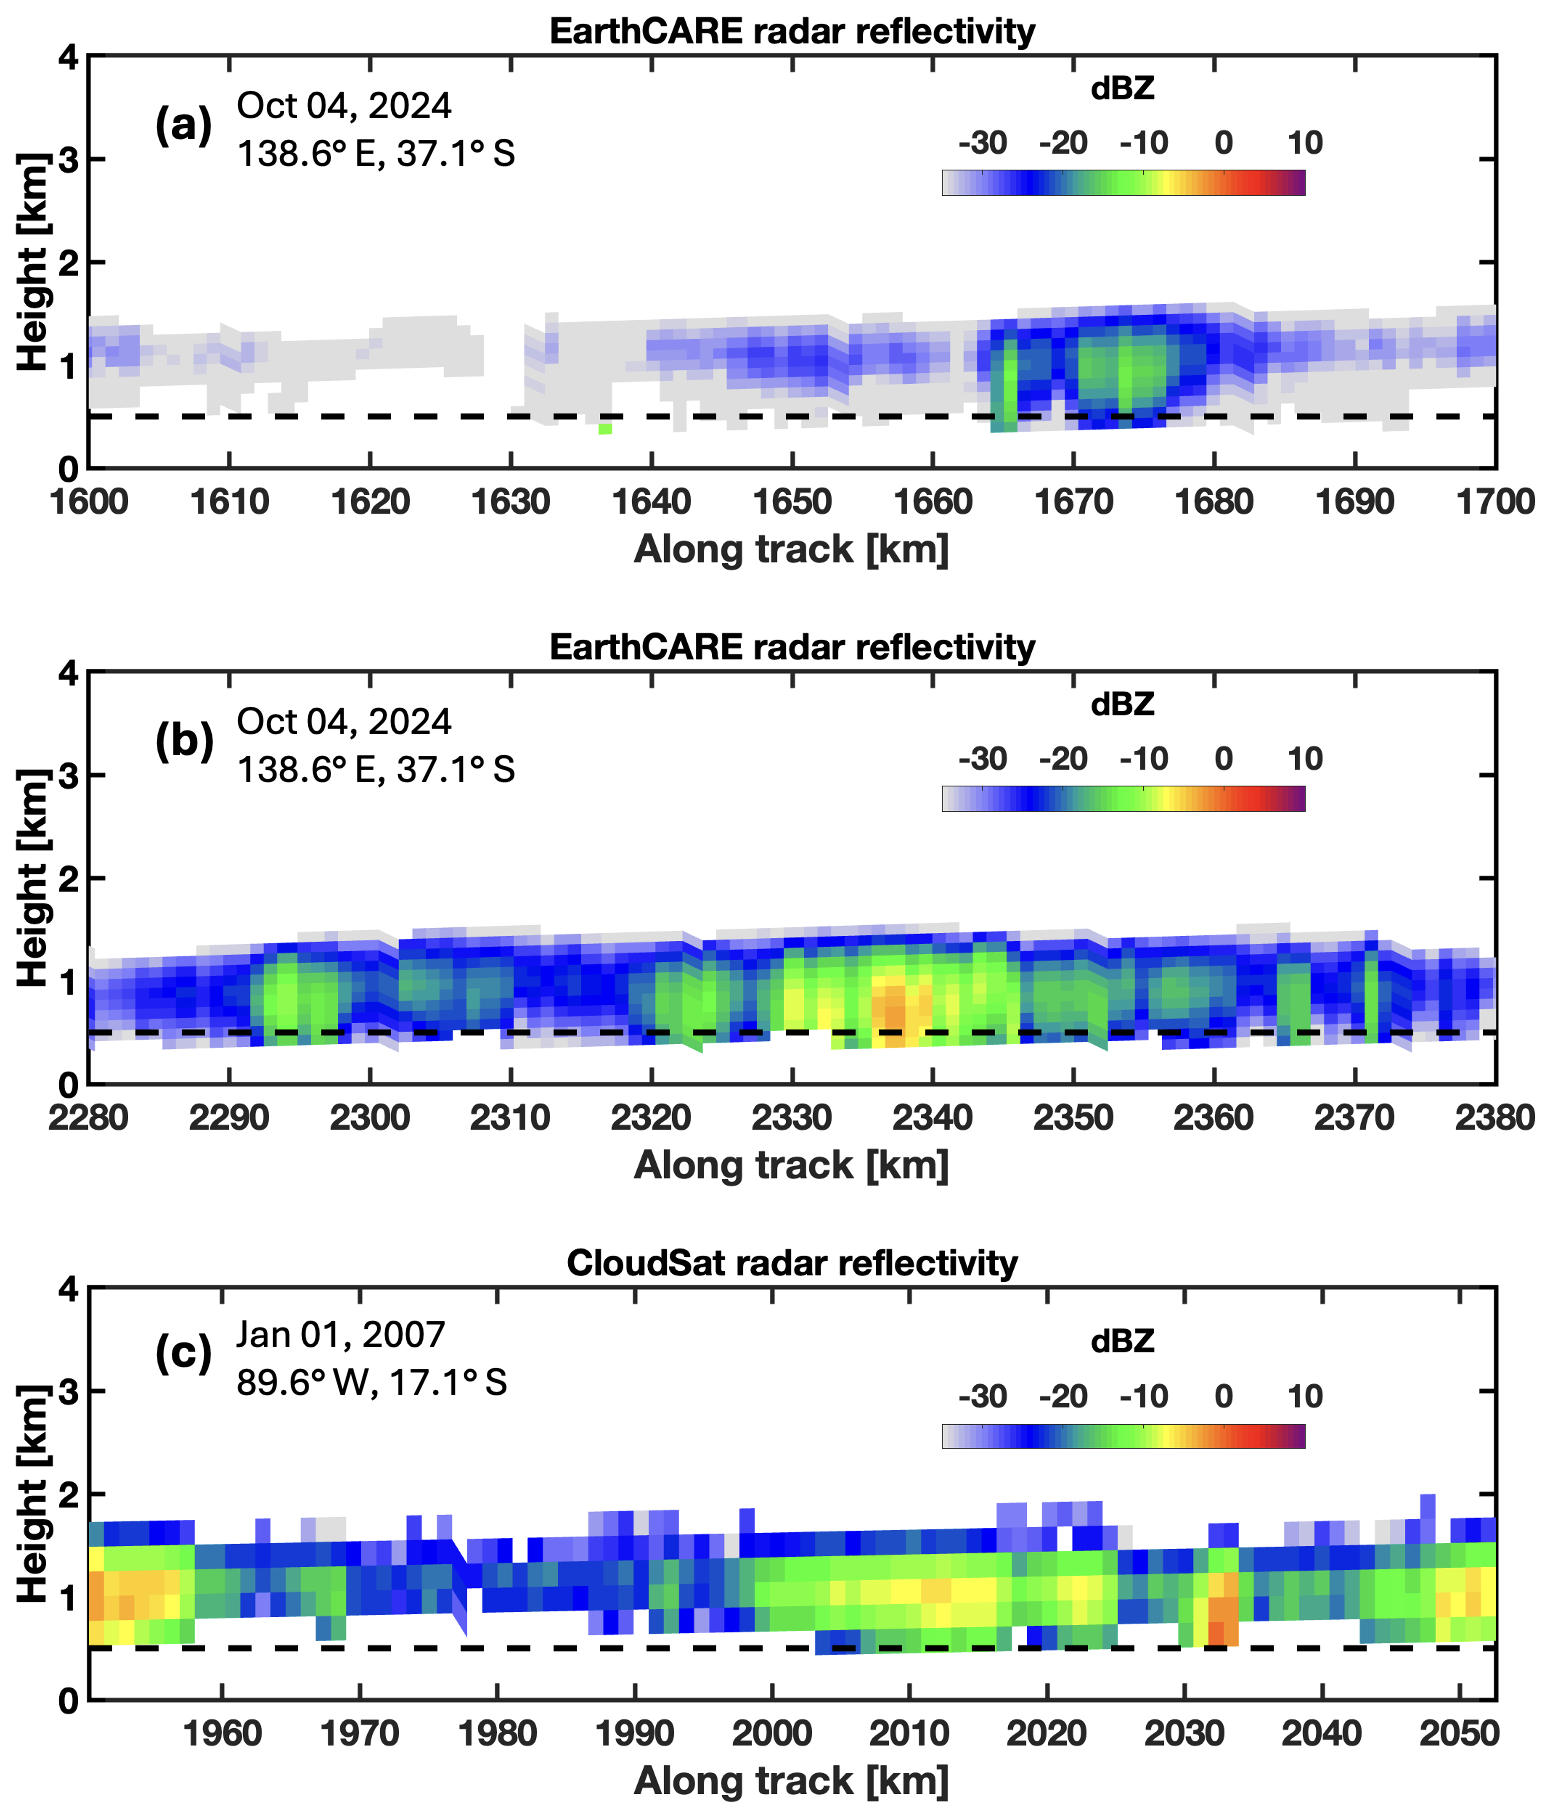
Figure 5(a, b) Two segments of marine low clouds observed by the EC-CPR on 4 October 2024, near 138.6° E and 37.1° S. Ground clutter is removed. (c) Observations of CloudSat CPR (cloud mask ≧20) at 89.6° W and 17.1° S on 1 January 2007. Black dash lines indicate the height of 0.5 km.
3.1 Comparison with CloudSat and airborne radar observations
The EarthCARE satellite was launched after the decommission of the CloudSat satellite, therefore no coincident measurements are available. Three 100 km along track observations of Sc from the EC-CPR (Fig. 5a and b) and CS-CPR (Fig. 5c) are presented to provide a quick overview of the qualitative differences between the two CPRs. Figure 5a shows a tenuous thin Sc with ZMAX often less than −28 dBZ. As a result, a large portion of the EC-CPR hydrometeor detection are expected to be missed by the CS-CPR due to their very weak radar echoes and their location below 1 km. This suggests that the representativeness of cloud-only and lightly drizzling profiles is enhanced with the EC-CPR observations. Two additional EC-CPR and CS-CPR examples of thin non-precipitating low clouds with cloud top below 1 km are given in Fig. S2. CS-CPR more likely underdetects a larger part of a continuous cloud layer that is shallow and weakly reflective due to its limitations on sensitivity and surface clutter.
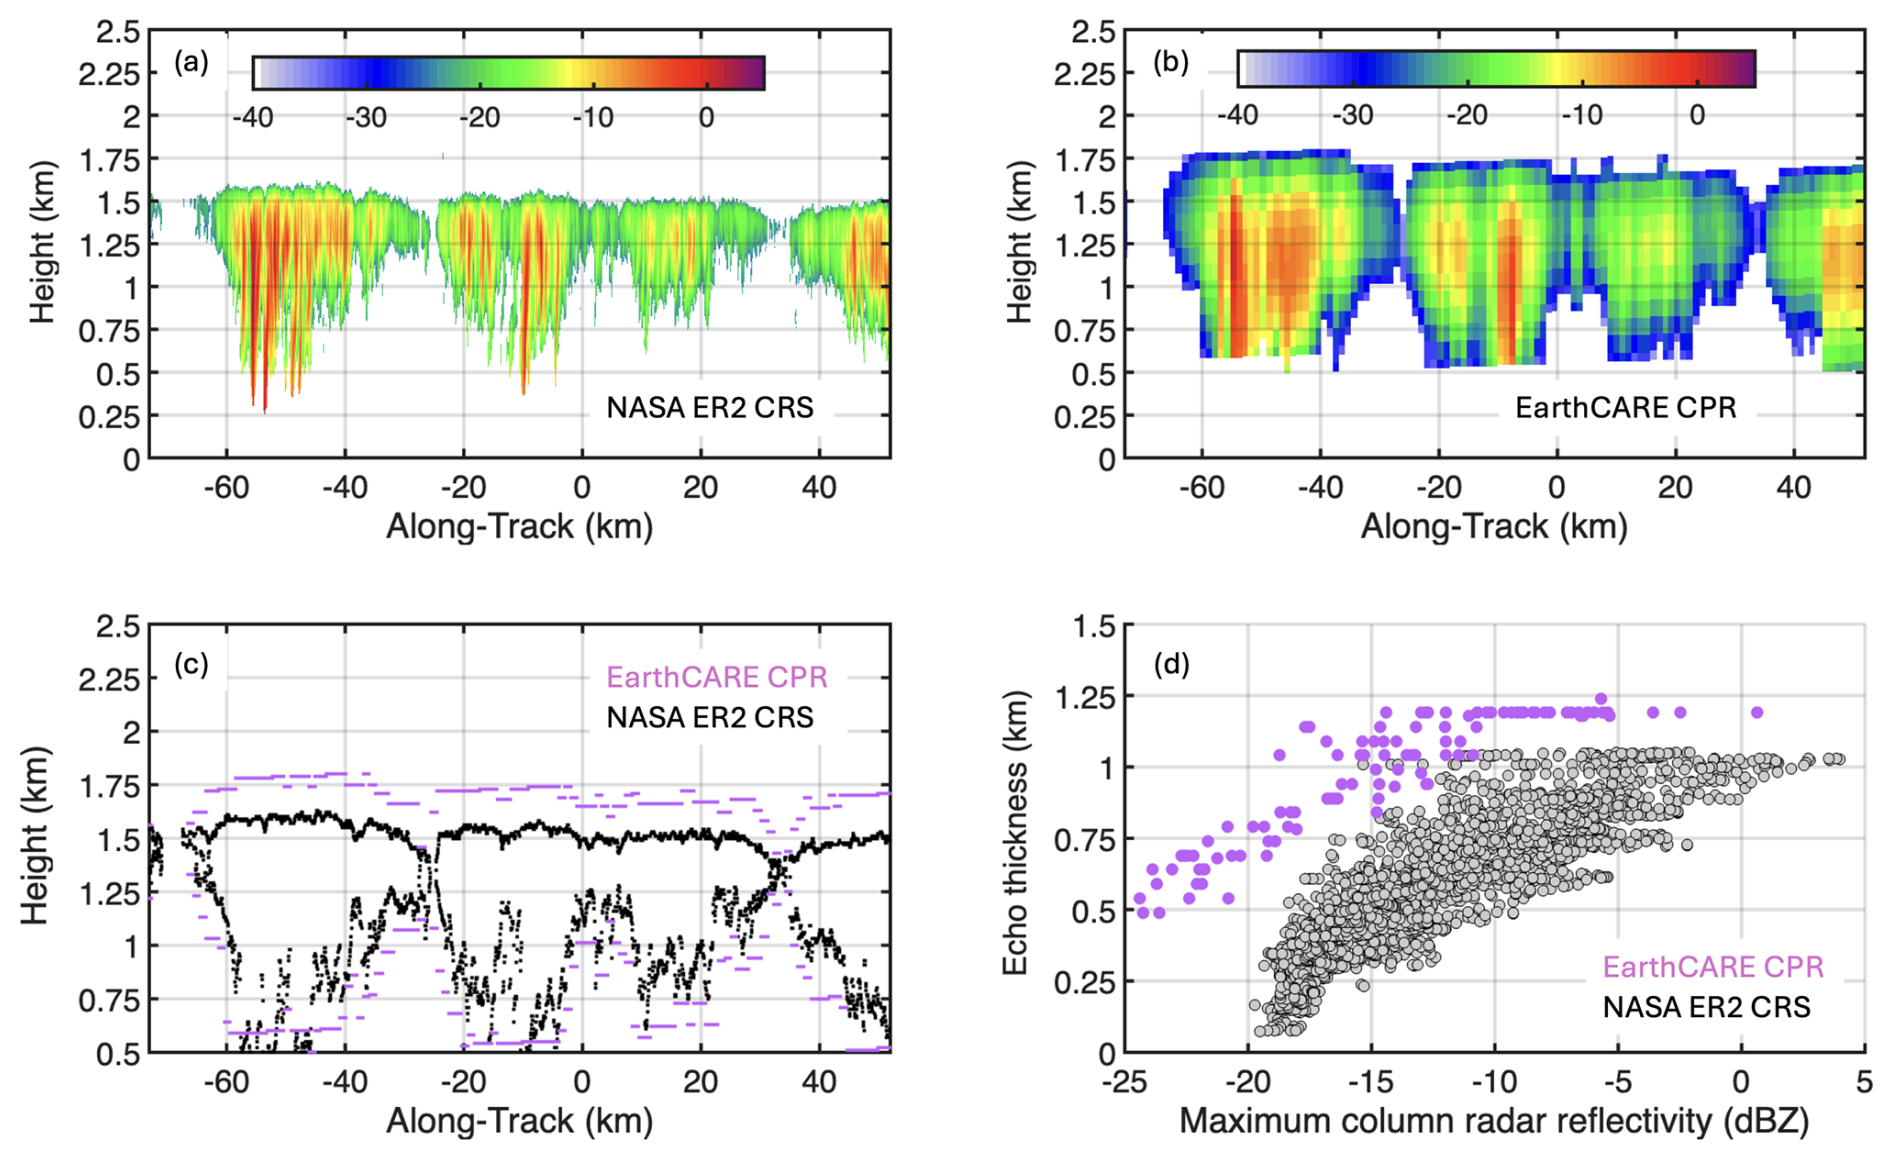
Figure 6EarthCARE CPR and collocated NASA ER-2 CRS observations of marine stratus collected on 30 October 2024, near 121.7° W and 26.6° N. (a) radar reflectivity [dBZ] measured by ER-2 CRS and (b) EarthCARE CPR, respectively. (c) cloud top and base height determined with radar reflectivity from the EarthCARE CPR (purple) and ER2 CRS (black). (d) Hydrometeor layer thickness based on radar echoes vs. the maximum columnar radar reflectivity.
The other two panels present similar drizzling scenarios that are detectable by both EC-CPR and CS-CPR. The cloud top of the EarthCARE case (Fig. 5b) appears lower and more flattened relative to the CloudSat case (Fig. 5c), which may be attributed to both the differences in PTR and the location and time of observations. In addition, a more complete profile can now be obtained with EC-CPR for clouds with reflectivity between about −25 and −15 dBZ that are subject to larger uncertainties regarding drizzle occurrences. If we compare 2300–2320 m along track in Fig. 5b against 1970–1990 m along track in Fig. 4c, the capability of EC-CPR to extend the detection to ∼ 500 m in such clouds could improve our ability to determine if the stratiform layer precipitates.
The Westcoast & Heartland Hyperspectral Microwave Sensor Intensive Experiment (WHyMSIE) took place in October and November 2024, which included coordinated underflights of EarthCARE for validation purposes. On 30 October 2024, a marine stratiform cloud layer was observed off the coast of California by the EC-CPR and the Cloud Radar System (CRS, McLinden et al., 2021) on-board the NASA ER-2 high-altitude aircraft (Fig. 6). The RMS of ground track match was 429 meters, and the relative time was −7 to 5 min. The CRS is a 94 GHz cloud radar with a sensitivity of −30 dBZ at 10 km range and 0.5 s integration. Considering the ER-2 flying altitude (approximately 20 km) the effective sensitivity of the CRS is −25 dBZ at the altitude of the marine stratocumulus clouds. The vertical resolution is 115 m, which is approximately 5 times higher than that of the EC-CPR. The CRS along track resolution is 125 m which is 8 times finer than that of the EC-CPR.
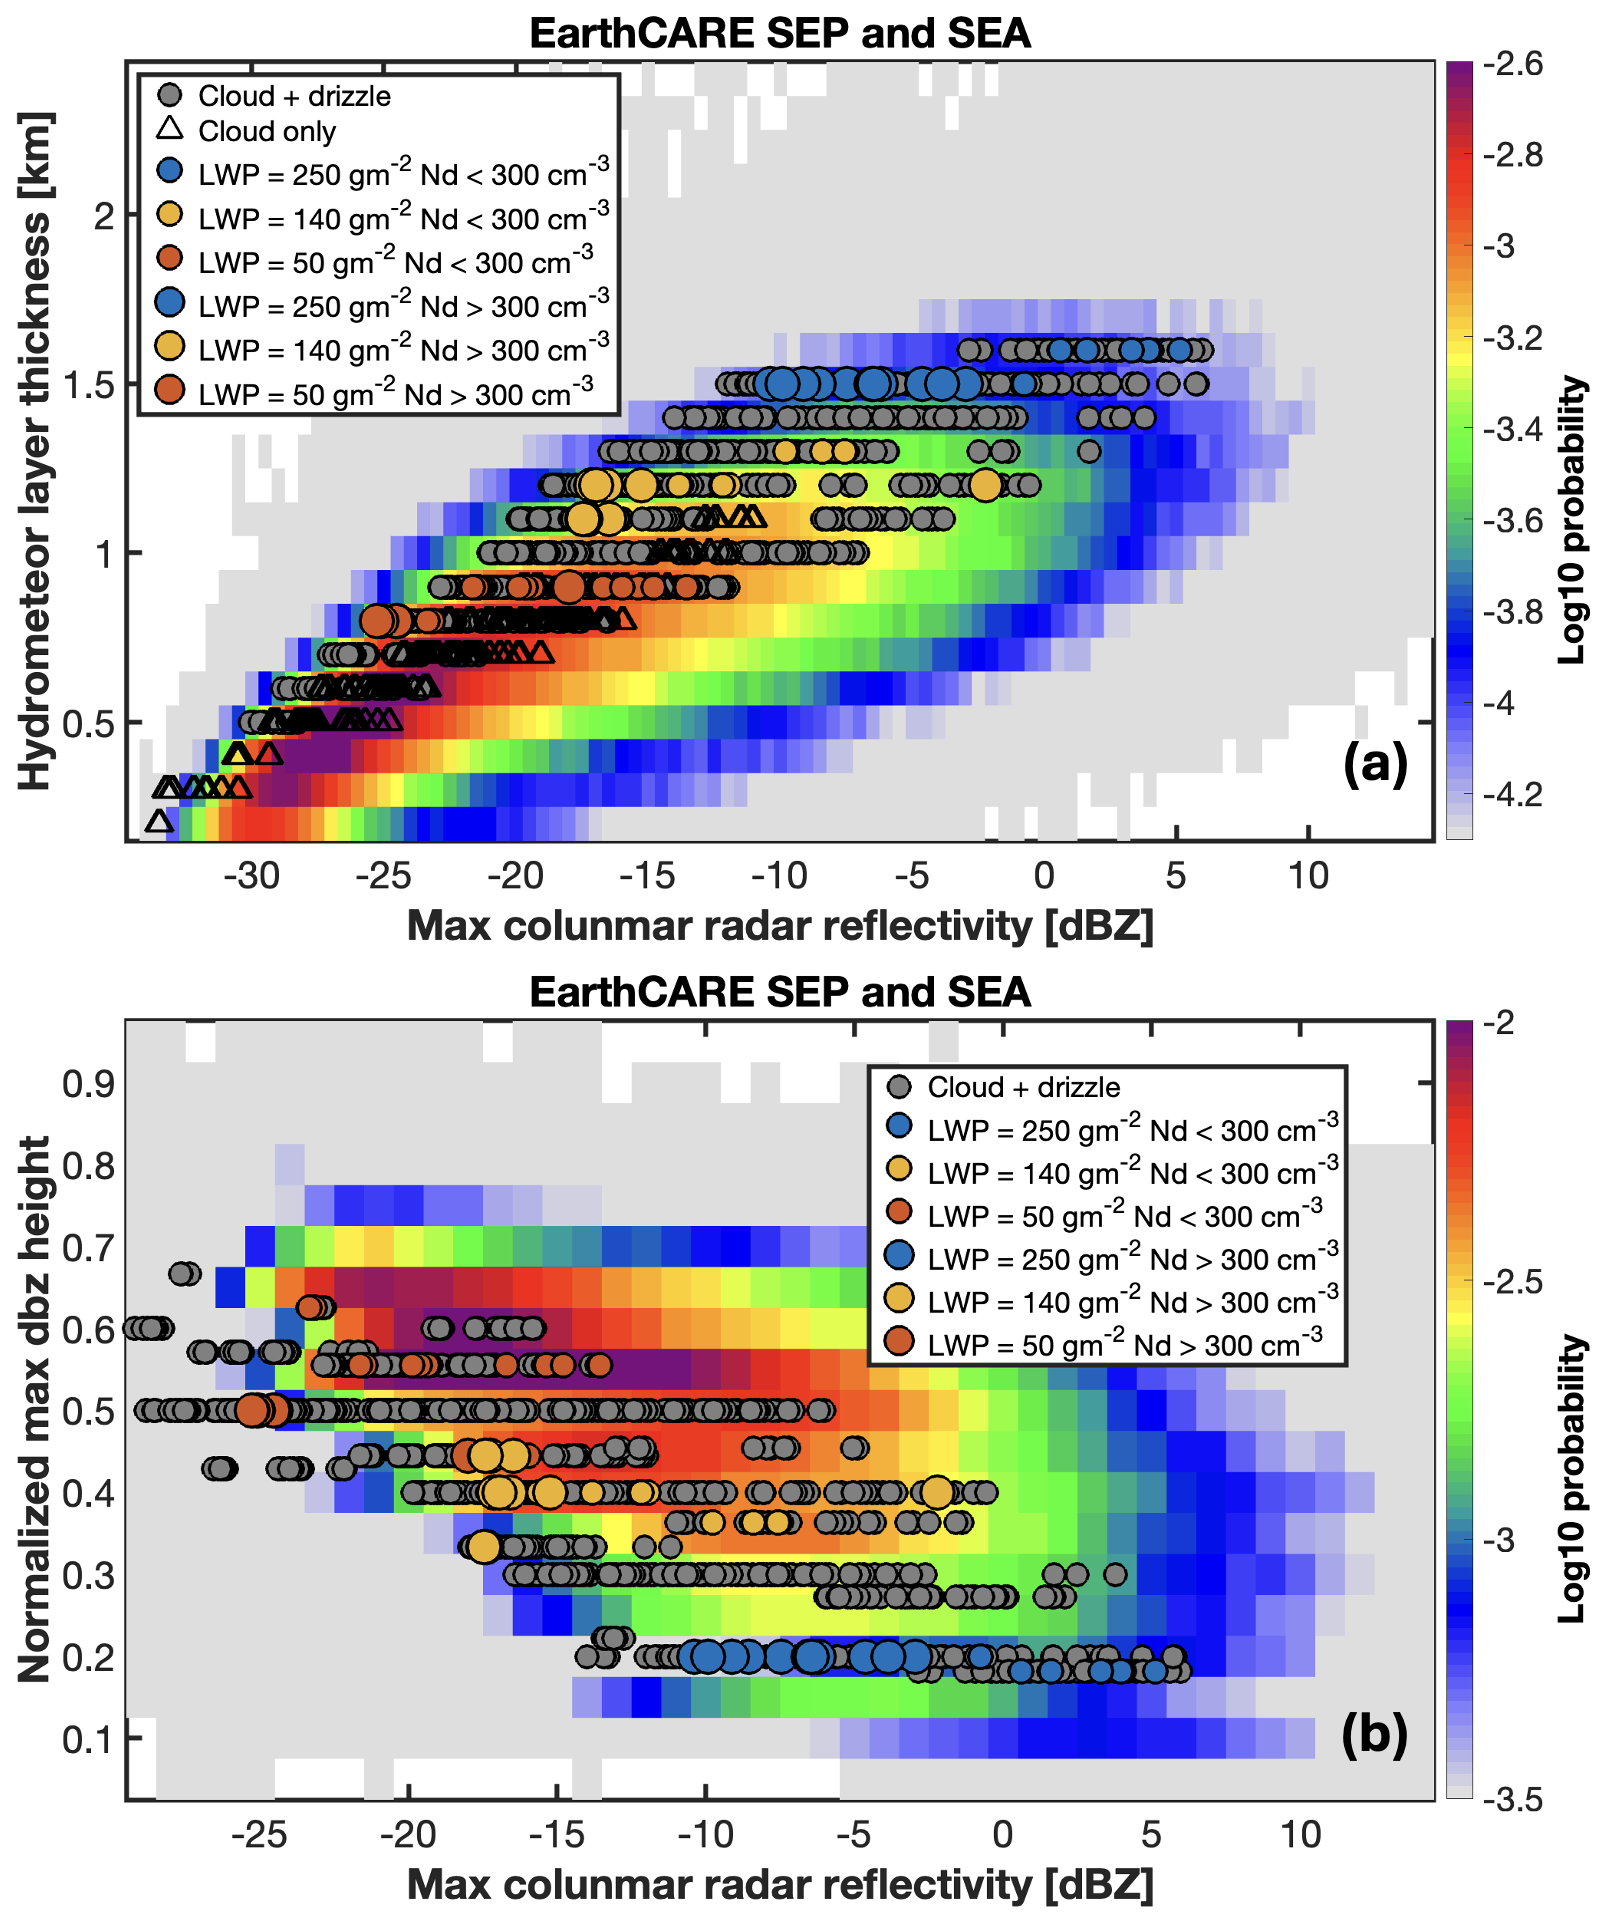
Figure 7(a) Probability distributions of Sc cloud thickness vs. the maximum radar reflectivity in the column observed by EC-CPR from June 2024 to May 2025 in SEP and SEA. Triangles indicate “cloud-only” model runs convolved with EC PTR. Purple circles indicate all the “cloud + drizzle” model runs convolved with EC PTR. Circles with filled colors in different size highlight subsets of model runs with different LWP and Nd as indicated in the legend. (b) Probability distributions of Sc normalized height of ZMAX vs. the maximum radar reflectivity in the column observed by EC-CPR. Profiles with hydrometeor layer thickness smaller than 0.7 km are excluded so as to mainly focus on the “cloud + drizzle” scenario. Profiles with ZMAX just above the ground clutter are not included. Overlaid circles are the same as in (a).
The agreement between the EC-CPR and CRS observations is very encouraging (Fig. 6). The EC-CPR captures most of the cloud and precipitation features despite the horizontal and vertical smoothing and stretching induced by the PTR and the CPR footprint (∼ 800 m). The cloud top determined by the EC-CPR is about 150–200 m taller than that of the CRS (Fig. 6a, b and c). This is consistent with the analysis of the modelled radar reflectivity profiles. The ground clutter is within close proximity to 500 m as predicted by the PTR. Also noticeable is the thickening of the clouds due to the EC-CPR PTR that stretches clouds both upwards and downwards (Fig. 6c). Evident in both ER2 and EarthCARE observations, there is a similar positive correlation between ZMAX and the hydrometeor layer thickness determined by radar (Fig. 6d).
Ambiguities exist when it comes to partition cloud and drizzle with single-frequency radar reflectivities (e.g., Xu et al., 2019). The variability associated with microphysics, dynamics and the fact that reflectivity is dominated by the large drops in the radar volume all contribute. Therefore, using a threshold of ZMAX for drizzle detection is subject to uncertainties. Combining the model outputs and the EC-CPR reflectivity profiles allows for some exploration of the possibility to identify a multi-variable relationship beyond a simple threshold of reflectivity. For that purpose, the joint probability distribution between observed hydrometeor layer thickness (ΔH) and ZMAX in low-level marine stratiform clouds in the EC-CPR observation is examined next (Fig. 7a). As expected, the maximum EC-CPR reflectivity in the column (ZMAX) increases as ΔH increases. The overlayed model data are after the convolution with the PTR and with the existence of ground clutter (∼ 0.5 km) considered. Within the full spectrum of ΔH, it is almost certain drizzle-free (black triangles) at the lower end and drizzle-present (circles) at the higher end. The differentiation of “cloud-only” and “cloud + drizzle” with radar alone seems most challenging in the domain where ΔH is 0.7–1 km and ZMAX ranges from −25 to −15 dBZ. The positive correlations between ΔH and ZMAX shown in Fig. 7a is evident in both the EC-CPR observations and the forward simulated model output. Nature carries more variability, and the employed 1D steady model can only capture the frequently observed events. Thicker clouds and larger ZMAX imply an enhanced amount of LWP (indicated by filled circles). The constraints of these observables on cloud Nd are more complicated with a tendency of Nd negatively correlated with ZMAX. The nonlinear relationships are also present in the covariance of ZMAX with LWP and cloud effective radius that are investigated by Leon et al. (2008).
Finally, we examine the relationship between the normalized height of ZMAX (NHMAX) and ZMAX (Fig. 7b). NHMAX is defined as , where HMAX is the height of the ZMAX, HCB is the observed hydrometeor base height and ΔH is the observed hydrometeor layer thickness. Here cloud base and thickness are determined with radar echoes above MDS. Also, the EC-CPR profiles with ZMAX found at the range bin just above the surface clutter are excluded, since the true ZMAX might be within the clutter. The observed NHMAX of cloud-only and light drizzling profiles is close to 0.5. We know from ground-based and airborne radar observations (Kollias et al., 2011b; Rémillard et al., 2013; Yang et al., 2018) that the NHMAX of cloud-only and light drizzling profiles is usually near the cloud top. Thus, the PTR limits our ability to diagnose the absence of drizzle particles using the NHMAX value. As the size and number concentration of drizzle particles in the profile increases, ZMAX increases and NHMAX decreases but the PRT has reduced the dynamic range of the NHMAX compared to those from the model simulations without the PRT (Fig. 3). Further effort would be devoted to combining other observations that could afford additional constraints on drizzle detection such as Doppler velocity and path integrated attenuation (PIA).
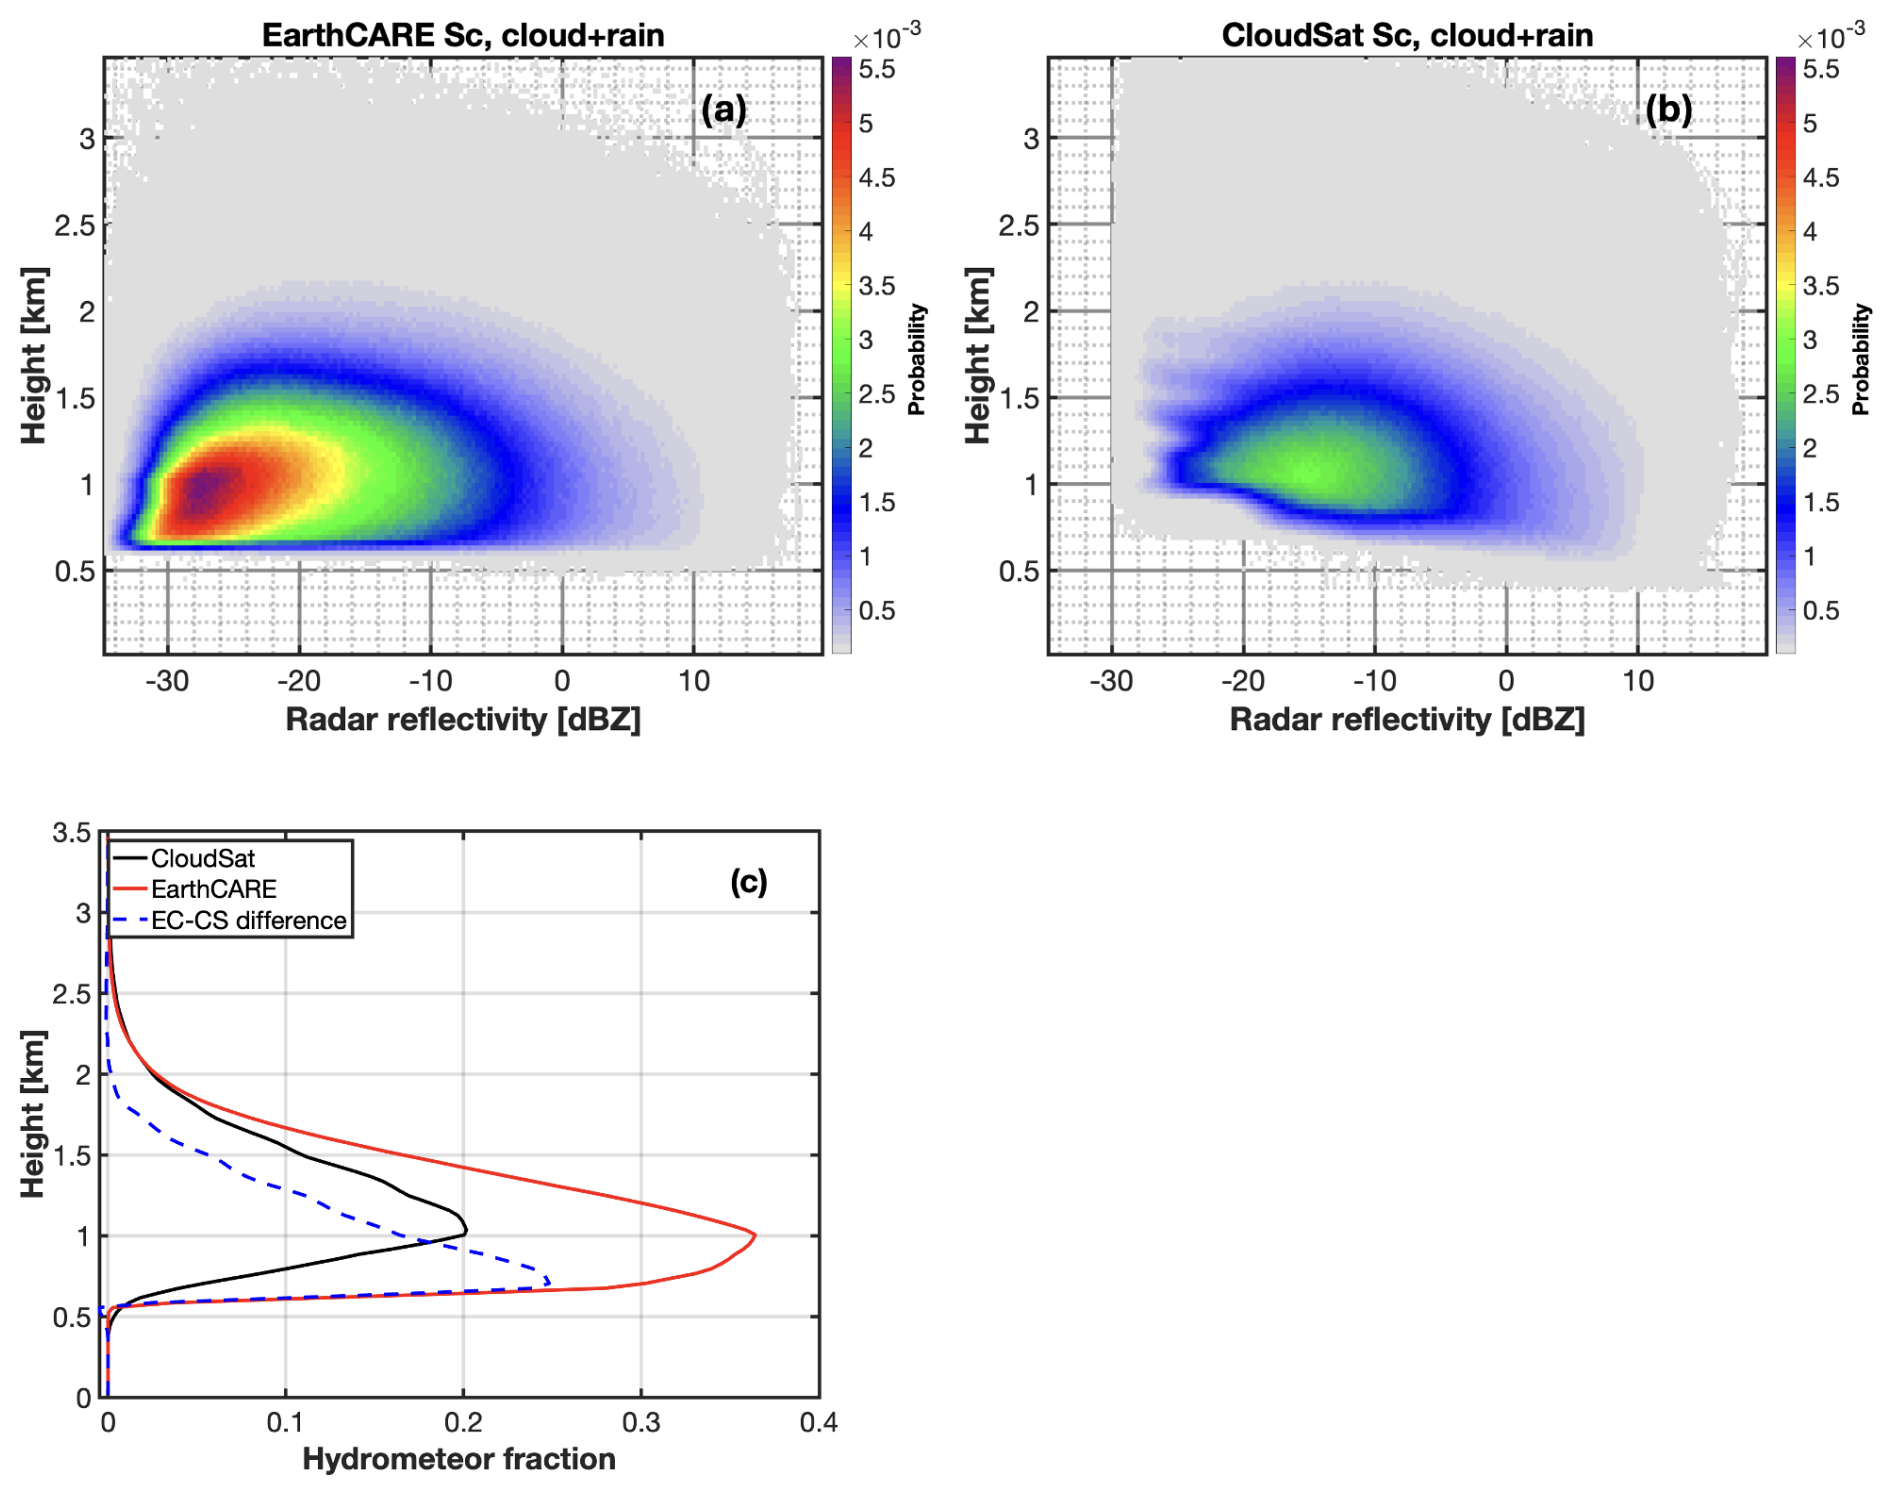
Figure 8(a) Reflectivity-height histogram of stratocumulus observed by the EarthCARE CPR from June 2024 to 19 May 2025, off South America and Africa coasts; (b) same as in (a), but for CloudSat CPR observations from 2007 to 2008. The vertical bin spacing is 30 m. The same interpolation to the 30 m bins is applied to both datasets. (c) Vertical profile of the hydrometeor detection fraction from each sensor and the difference (blue dash line) between EarthCARE and CloudSat.
3.2 Statistical comparison EC- and CS-CPR observations in marine stratus clouds
One way to evaluate the overall performance of EC-CPR against that of the CS-CPR in the detection of low-level stratiform marine clouds is to rely on statistics collected over a large spatial domain (the two marine stratocumulus basins (SEP and SEA) shown in Fig. 1) and over a large temporal window (1 year for EC, 2 years for CloudSat). The reflectivity-height histogram of CPR echoes from the EC and CS are shown in Fig. 8a and b, respectively. Sc clouds are selected based upon the criteria as introduced in Sect. 2. The impact of the higher sensitivity and improved suppression of the surface echo are clearly visible. The two spaceborne CPR have radar echoes concentrated below 1.5 km and similar detections when reflectivity is dBZ. CS-CPR appears to have a better signal to clutter ratio at low altitudes at high reflectivity and therefore more capable in terms of observing heavy snowfall (Coppola et al., 2025). Nevertheless, the EC-CPR detect significantly more echoes in the lowest km below −20 dBZ, due to its higher sensitivity and improved surface clutter suppression. It is evident that the EC-CPR has enhanced capabilities to observe Sc clouds with weak echoes and possibly virga. The Sc cloud fraction (fraction of columns with a detection) as observed by EC-CPR and CS-CPR is approximately 40 % (44.8 % in SEP and 36.7 % in SEA) and 20 % (23.6 % in SEP and 19.2 % in SEA), respectively.
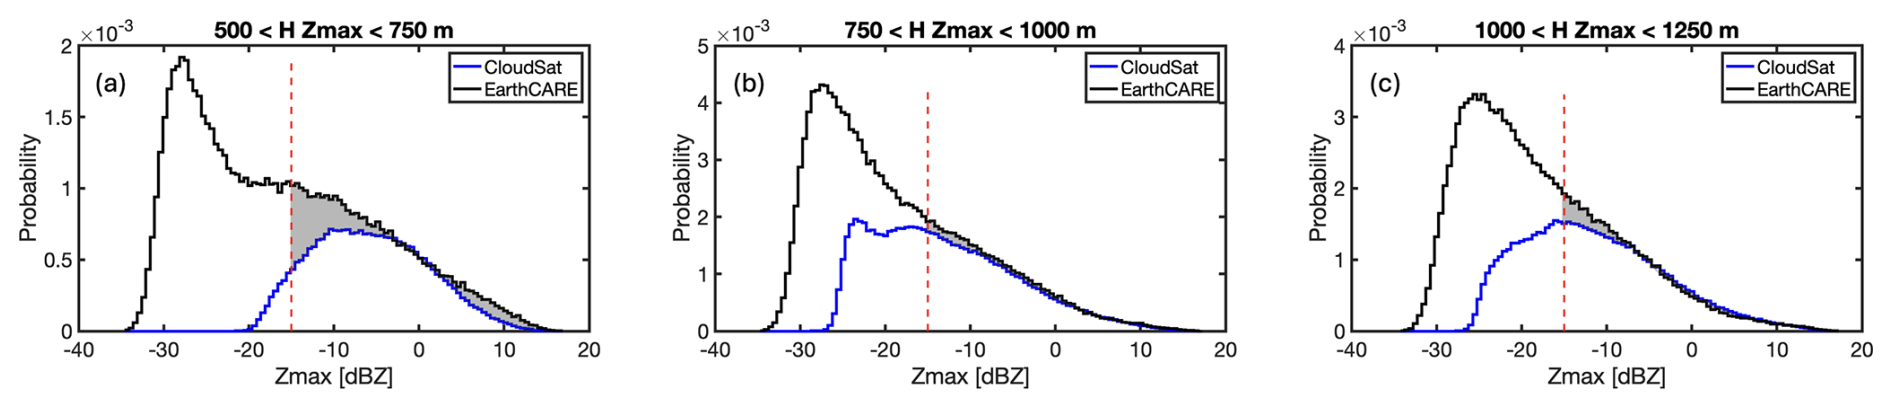
Figure 9The probability distribution ZMAX values at different height ranges above the ocean surface: (a) between 500 and 750 m; (b) between 750 and 1000 m; and (c) between 1000 and 1250 m. Black and blue lines respectively indicate the EC-CPR and CS-CPR observations collected in SEA and SEP. The three categories are responsible for a Sc cloud fraction of 7.5 %, 14.7 %, 12.4 % for EC and 2.7 %, 7.9 %, 6.4 % for CloudSat, respectively. The red dash lines mark where ZMAX is −15 dBZ; precipitating Sc are identified to correspond to the region located to the right of such lines. The three categories are responsible for a precipitating Sc cloud fraction of 3 %, 4.4 %, 4 % for EC and 2.4 %, 4 %, 3.8 % for CloudSat, respectively. The areas shaded in gray highlight the difference where ZMAX is greater than −15 dBZ.
The maximum radar reflectivity in the column (ZMAX) is frequently used to determine the presence of drizzle in low-level stratiform clouds (Frisch et al., 1995; Liu et al., 2008; Kollias et al., 2011a). In CloudSat, if the ZMAX is higher than −15 dBZ, the profile was considered as containing drizzle (Lebsock et al., 2008). Here, the same definition for the detection of drizzle in the profile will be used in the EC-CPR observations. We will focus on the impact of the improved features of the EC-CPR in the determination of the fraction of drizzling profiles. In particular, since the EC-CPR extends the detection capability down to 0.5 km above the ground, we will use the EC-CPR observations as a benchmark to quantify the misdetections by the CS-CPR due to its higher blind zone.
The probability distributions of ZMAX from nearly one year of EarthCARE and two years of CloudSat observations in the two marine stratocumulus basins (SEP and SEA) are shown in Fig. 9. The ZMAX dataset is conditionally sampled based on the height where the ZMAX is observed. The probability is calculated by scaling the counts of each bin on the x axis by the total number of cloudy and clear-sky profiles of CloudSat and EarthCARE datasets, respectively.
The distribution of ZMAX observed by EC-CPR is clearly more skewed to lower reflectivity in comparison with CS-CPR. The enhanced MDS significantly improves the detection of cloud-only and weakly drizzling components. The bimodality of CS-CPR ZMAX reported but unexpected by Leon et al. (2008) is also noticeable here for the subset with HMAX ranging from 750 and 1000 m (blue line in Fig. 9b), though a single mode of ZMAX exists in the other subsets. We found that the mode with CS-CPR reflectivity smaller than −20 dBZ in Fig. 9b is mainly composed of profiles that have only one radar range bin above MDS. The bimodality could be due to the coarse vertical sampling of CS-CPR or an enhancement of reflectivity due to noise. The fraction of precipitating Sc observed by EC-CPR and CS-CPR is respectively 11.4 % and 10.2 %, summing the three height categories in Fig. 9. Overall CS-CPR misses the precipitation detection in Sc clouds by about 10.5 %. As the height window of ZMAX decreases, ZMAX needs to be higher to be accurately detected by the CS-CPR. Considering −15 dBZ as the threshold to determine rain occurrence, CS-CPR misses increasing amount of raining profiles as HMAX reduces. The missed detections are the largest if HMAX is lower than 750 m (Fig. 9a), with about 20 % of the raining profiles that are captured by EC-CPR are not detected by CS-CPR.
When HMAX is >750 m, one would expect that two sensors have the same level of skills in terms of detecting drizzle, while EC-CPR observed slightly more drizzle (Fig. 9b and c). A factor that contributes these differences is that the sampling periods are different in this comparison, since CS-CPR and EC-CPR do not have coincident observations. The slightly weaker inversions and warmer than average SSTs in 2024–20255 tend to favor deeper boundary layer and more mixed stratocumulus-cumulus clouds that carry larger liquid water path with higher chance to rain, whereas the colder SSTs combined with strong inversions in 2007–2008 favor overcast Sc with overall less precipitation.
The Cloud Profiling Radar (CPR) onboard the EarthCARE satellite mission provides enhanced measurement capabilities relative to its predecessor, the CloudSat CPR. Operating at the similar frequency and pulse length, the EarthCARE CPR (EC-CPR) offers finer spatial sampling, an approximately +7 dBZ improvement in sensitivity, and substantially reduced surface clutter contamination. These advancements are particularly beneficial for the detection and characterization of marine stratocumulus (Sc) clouds.
In this study, we assess the overall performance of EC-CPR using the first-year (2024–2025) observations collected over two 20°×20° domains in the Southeast Pacific and Southeast Atlantic Oceans, regions known for persistent stratocumulus clouds. EC-CPR data are evaluated against coincident and collocated aircraft radar measurements and compared with CloudSat-based climatology from 2007–2008 when the sensitivity of CS-CPR at its best, since EarthCARE was launched after the decommission of CloudSat. In addition, we investigate how the point target response (PTR) influences EC-CPR reflectivity profiles and drizzle identification. Using a drizzle microphysics model that generates “cloud-only” and “cloud + drizzle” profiles, combined with a radar simulator that forward calculates radar observables, we quantify how PTR-induced distortions affect reflectivity profiles and the interpretation of drizzle in stratocumulus systems.
The EC-CPR observations confirm that surface clutter contamination is effectively suppressed below 0.5 km due to the asymmetric shape of the PTR. As a result, hydrometeor detection is possible approximately 0.25–0.5 km closer to the surface compared to the CS-CPR.
For the marine stratocumulus (Sc) regions analysed in this study, CS-CPR estimates an average cloud fraction of about 20 % (Fig. 1), whereas EC-CPR yields an average of approximately 40 %, nearly double, despite the weak La Niña forcing together with the warmer than average SSTs in 2024–2025 tend to cause modest decrease of Sc cloud fraction in the more offshore regions. This value, however, remains about 20 % lower than the estimate obtained using a synergistic combination of CS-CPR and CALIPSO (Fig. 2 in Muhlbauer et al., 2014). The geographical distribution of cloud fraction derived from EC-CPR alone agrees well with previous results based on CS-CPR and CALIPSO, successfully capturing the observed transition from overcast stratocumulus to broken cumulus regimes moving westward and offshore. In addition, EC-CPR shows significant improvement in detecting coastal Sc decks that are weakly reflective with low cloud top height.
Compared with CS-CPR, EC-CPR demonstrates a clear advantage in detecting non-drizzling and weakly drizzling stratocumulus. The fraction of cloudy profiles below 1 km with reflectivities weaker than −20 dBZ is substantially underestimated by CS-CPR. When a column-maximum reflectivity threshold of dBZ is used to identify raining profiles, CS-CPR underestimates rainfall occurrence by up to 20 % when ZMAX occurs between 500 and 750 m. This underestimation diminishes when ZMAX is either larger or located higher in the cloud column. Overall CS-CPR misses the precipitation detection in Sc clouds by about 10.5 % for ZMAX located between 500 and 1250 m.
EC-CPR reflectivity measurements closely replicate coincident airborne radar observations, though, as expected, cloud layers appear thicker at the coarser EC-CPR resolution. The influence of the PTR stretches clouds both upward and downward, resulting in an average overestimation of cloud thickness by 0.4–0.5 km in drizzling conditions. This degree of vertical stretching correlates positively with ZMAX and the true cloud depth (Fig. 6).
The PTR also induces a parabolic shaping of reflectivity profiles relative to the modeled truth, affecting both non-drizzling and drizzling clouds. Consequently, the distinct contrast between the top-heavy profiles typical of non-drizzling clouds and the bottom-heavy profiles characteristic of drizzling clouds is reduced. Given the magnitude of this effect and the ZMAX does not necessarily maximize where the precipitation is most abundant, additional observational constraints – beyond ZMAX and HMAX should be explored, such as Doppler velocity and path-integrated attenuation (PIA).
Finally, ZMAX tends to scale with cloud thickness, a relationship evident in both EC-CPR observations and the drizzle model simulations. The model also reveals an overall increase in liquid water path (LWP) with ZMAX and cloud thickness, although the relationship between droplet number concentration (Nd) and reflectivity is more complex and requires further investigation.
EarthCARE data are publicly available from the ESA portal, https://earth.esa.int/eogateway/missions/earthcare/data (last access: 23 March 2026). CloudSat 2B-GEOPROF(R05) is available at https://www.cloudsat.cira.colostate.edu/data-products/2b-geoprof (last access: 23 March 2026). The EarthCARE CPR point target response function is available in the Supplement. Code and the 1D model data are available upon request.
The supplement related to this article is available online at https://doi.org/10.5194/acp-26-4619-2026-supplement.
ZX performed the analysis, generated the figures, and drafted the manuscript. PK provided the supervision and reviewed the manuscript. SS conducted the analysis of the CloudSat CPR data. AB provided the feedback on the results and the manuscript. BPT and MWM provided the EarthCARE CPR and ER-2 CRS data, respectively.
The contact author has declared that none of the authors has any competing interests.
Publisher's note: Copernicus Publications remains neutral with regard to jurisdictional claims made in the text, published maps, institutional affiliations, or any other geographical representation in this paper. The authors bear the ultimate responsibility for providing appropriate place names. Views expressed in the text are those of the authors and do not necessarily reflect the views of the publisher.
This article is part of the special issue “Early results from EarthCARE (AMT/ACP/GMD inter-journal SI)”. It is not associated with a conference.
PK was supported by the European Space Agency (ESA) under the EarthCARE Data Innovation and Science Cluster (DISC) project (AO/1-12009/24/I-NS). PK and ZX were also supported by the National Aeronautics and Space Administration (NASA) under the Atmospheric Observing System (AOS) project (Contract number: 80NSSC23M0113).
This research has been supported by the European Space Agency (grant no. AO/1-12009/24/I-NS) and the Goddard Space Flight Center (Atmospheric Observing System (AOS) project (contract no. 80NSSC23M0113)).
This paper was edited by Matthew Christensen and reviewed by Matthew Lebsock, Roger Marchand, and one anonymous referee.
Battaglia, A., Kollias, P., Dhillon, R., Lamer, K., Khairoutdinov, M., and Watters, D.: Mind the gap – Part 2: Improving quantitative estimates of cloud and rain water path in oceanic warm rain using spaceborne radars, Atmos. Meas. Tech., 13, 4865–4883, https://doi.org/10.5194/amt-13-4865-2020, 2020.
Bretherton, C. S., Wood, R., George, R. C., Leon, D., Allen, G., and Zheng, X.: Southeast Pacific stratocumulus clouds, precipitation and boundary layer structure sampled along 20° S during VOCALS-REx, Atmos. Chem. Phys., 10, 10639–10654, https://doi.org/10.5194/acp-10-10639-2010, 2010.
Burns, D., Kollias, P., Tatarevic, A., Battaglia, A., and Tanelli S.: The performance of the EarthCARE Cloud Profling Radar in marine stratiform clouds, J. Geophys. Res.-Atmos., 121, 525–14,537, https://doi.org/10.1002/2016JD025090, 2016.
Chin, H.-N. S., Rodriguez, D. J., Cederwall, R. T., Chuang, C. C., Grossman, A. S., Yio, J. J., Fu, Q., and Miller, M. A.: A microphysical retrieval scheme for continental low-level stratiform clouds: Impacts of the subadiabatic character on microphysical properties and radiation budgets, Mon. Weather Rev., 128, 2511–2527, 2000.
Christensen, M. W., Stephens, G. L., and Lebsock, M. D.: Exposing biases in retrieved low cloud properties from CloudSat: A guide for evaluating observations and climate data, J. Geophys. Res.-Atmos., 118, 12120–12131, https://doi.org/10.1002/2013JD020224, 2013.
Comstock, K. K., Wood, R., Yuter, S. E., and Bretherton, C. S.: Reflectivity and rain rate in and below drizzling stratocumulus, Q. J. Roy. Meteor. Soc., 130, 2891–2918, 2004.
Coppola, M., Battaglia, A., Tridon, F., and Kollias, P.: Improved hydrometeor detection near the Earth's surface by a conically scanning spaceborne W-band radar, Atmos. Meas. Tech., 18, 5071–5085, https://doi.org/10.5194/amt-18-5071-2025, 2025.
Eastman, R. I., McCoy, L., and Wood, R.: Environmental and internal controls on Lagrangian transitions from closed cell mesoscale cellular convection over subtropical oceans, J. Atmos. Sci., 78, 2367–2383, https://doi.org/10.1175/JAS-D-20-0277.1, 2021.
Frisch, A. S., Fairall, C. W., and Snider, J. B.: Measurement of Stratus Cloud and Drizzle Parameters in ASTEX with a Kα-Band Doppler Radar and a Microwave Radiometer, J. Atmos. Sci., 52, 2788–2799, https://doi.org/10.1175/1520-0469(1995)052<2788:MOSCAD>2.0.CO;2, 1995.
Ghate, V. P. and Cadeddu, M. P.: Drizzle and turbulence below closed cellular marine stratocumulus clouds, J. Geophys. Res.-Atmos., 124, 5724–5737, https://doi.org/10.1029/2018JD030141, 2019.
Glienke, S., Kostinski, A., Fugal, J., Shaw, R., Borrmann, S., and Stith, J.: Cloud droplets to drizzle: Contribution of transition drops to microphysical and optical properties of marine stratocumulus clouds, Geophys. Res. Lett., 44, 8002–8010, https://doi.org/10.1002/2017GL074430, 2017.
Hartmann, D. L., Ockert-Bell, M. E., and Michelsen, M. L.: The Effect of Cloud Type on Earth's Energy Balance: Global Analysis, J. Climate, 5, 1281–1304, https://doi.org/10.1175/1520-0442(1992)005<1281:TEOCTO>2.0.CO;2, 1992.
Haynes, J. M., L'Ecuyer, T. S., Stephens, G. L., Miller, S. D., Mitrescu, C., Wood, N. B., and Tanelli, S.: Rainfall retrieval over the ocean with spaceborne W-band radar, J. Geophys. Res., 114, D00A22, https://doi.org/10.1029/2008JD009973, 2009.
Kato, S., Mace, G. G., Clothiaux, E. E., Liljegren, J. C., and Austin, R. T.: Doppler cloud radar derived drop size distributions in liquid water stratus clouds, J. Atmos. Sci., 58, 2895–2911, 2001.
Khairoutdinov, M. and Kogan, Y.: A new cloud physics parameterization in a large-eddy simulation model of marine stratocumulus, Mon. Weather Rev., 128, 229–243, 2000.
Kogan, Z. N., Mechem, D. B., and Kogan, Y. L.: Assessment of variability in continental low stratiform clouds based on observations of radar reflectivity, J. Geophys. Res., 110, D18205, https://doi.org/10.1029/2005JD006158, 2005.
Kollias, P., Fairall, C. W., Zuidema, P., Tomlinson, J., and Wick, G. A.: Observations of marine stratocumulus in SE Pacific during the PACS 2003 cruise, Geophys. Res. Lett., 31, L22110, https://doi.org/10.1029/2004GL020751, 2004.
Kollias, P., Rémillard, J., Luke, E., and Szyrmer, W.: Cloud radar Doppler spectra in drizzling stratiform clouds: 1. Forward modeling and remote sensing applications, J. Geophys. Res., 116, D13201, https://doi.org/10.1029/2010JD015237, 2011a.
Kollias, P., Szyrmer, W., Rémillard, J., and Luke, E.: Cloud radar Doppler spectra in drizzling stratiform clouds: 2. Observations and microphysical modeling of drizzle evolution, J. Geophys. Res., 116, D13203, https://doi.org/10.1029/2010JD015238, 2011b.
Kollias, P., Tanelli, S., Battaglia, A., and Tatarevic, A.: Evaluation of EarthCARE Cloud Profiling Radar Doppler velocity measurements in particle sedimentation regimes, J. Atmos. Ocean. Tech., 31, 366–386, https://doi.org/10.1175/JTECH-D-11-00202.1, 2014.
Kollias, P., Puidgomènech Treserras, B., Battaglia, A., Borque, P. C., and Tatarevic, A.: Processing reflectivity and Doppler velocity from EarthCARE's cloud-profiling radar: the C-FMR, C-CD and C-APC products, Atmos. Meas. Tech., 16, 1901–1914, https://doi.org/10.5194/amt-16-1901-2023, 2023.
Lamer, K., Kollias, P., Battaglia, A., and Preval, S.: Mind the gap – Part 1: Accurately locating warm marine boundary layer clouds and precipitation using spaceborne radars, Atmos. Meas. Tech., 13, 2363–2379, https://doi.org/10.5194/amt-13-2363-2020, 2020.
Lebsock, M. D., Stephens, G. L., and Kummerow C.: Multisensor satellite observations of aerosol effects on warm clouds, J. Geophys. Res., 113, D15205, https://doi.org/10.1029/2008JD009876, 2008.
L'Ecuyer, T. S., Berg, W., Haynes, J., Lebsock, M., and Takemura, T.: Global observations of aerosol impacts on precipitation occurrence in warm maritime clouds, J. Geophys. Res., 114, D09211, https://doi.org/10.1029/2008JD011273, 2009.
Leon, D. C., Wang, Z., and Liu, D.: Climatology of drizzle in marine boundary layer clouds based on 1 year of data from CloudSat and Cloud-Aerosol Lidar and Infrared Pathfinder Satellite Observations (CALIPSO), J. Geophys. Res., 113, D00A14, https://doi.org/10.1029/2008JD009835, 2008.
Liu, Y. and Daum, P. H.: Parameterization of the autoconversion process, Part I: Analytical formulation of the Kessler-type parameterizations, J. Atmos. Sci., 61, 1539–1548, 2004.
Liu, Y., Geerts, B., Miller, M., Daum, P., and McGraw R.: Threshold radar reflectivity for drizzling clouds, Geophys. Res. Lett., 35, L03807, https://doi.org/10.1029/2007GL031201, 2008.
Liu, D., Liu, Q., Liu, G., Wei, J., Deng, S., and Fu, Y.: Multiple Factors Explaining the Deficiency of Cloud Profiling Radar on Detecting Oceanic Warm Clouds, J. Geophys. Res.-Atmos., 123, 8135–8158, 2018.
Mace, G. G. and Sassen, K.: A constrained algorithm for retrieval of stratocumulus cloud properties using solar radiation, microwave radiometer, and millimeter cloud radar data, J. Geophys. Res., 105, 29099–29108, 2000.
Mace, G. G., Zhang, Q., Vaughan, M., Marchand, R., Stephens, G., Trepte, C., and Winker, D.: A description of hydrometeor layer occurrence statistics derived from the first year of merged Cloudsat and CALIPSO data, J. Geophys. Res., 114, D00A26, https://doi.org/10.1029/2007JD009755, 2009.
Marchand, R. T., Mace, G. G., and Ackerman, T. P.: Hydrometeor detection using CloudSat: An Earth orbiting 94 GHz cloud radar, J. Atmos. Ocean. Tech., 25, 519–533, 2008.
McLinden, M. L. W., Li, L., Heymsfield, G. M., Coon, M., and Emory, A.: The NASA GSFC 94-GHz Airborne Solid-State Cloud Radar System (CRS), J. Atmos. Ocean. Tech., 38, 1001–1017, https://doi.org/10.1175/JTECH-D-20-0127.1, 2021.
Muhlbauer, A., McCoy, I. L., and Wood, R.: Climatology of stratocumulus cloud morphologies: microphysical properties and radiative effects, Atmos. Chem. Phys., 14, 6695–6716, https://doi.org/10.5194/acp-14-6695-2014, 2014.
Mülmenstädt, J., Salzmann, M., Kay, J. E., Zelinka, M. D., Ma, P., Nam, C., Kretzschmar, J., Hörnig, S., and Quaas J.: An underestimated negative cloud feedback from cloud lifetime changes, Nat. Clim. Change, 11, 508–513, https://doi.org/10.1038/s41558-021-01038-1, 2021.
Rapp, A. D., Lebsock, M., and L'Ecuyer, T.: Low cloud precipitation climatology in the southeastern Pacific marine stratocumulus region using CloudSat, Environ. Res. Lett., 8, 014027, https://doi.org/10.1088/1748-9326/8/1/014027, 2013.
Rémillard, J., Kollias, P., and Szyrmer, W.: Radar-radiometer retrievals of cloud number concentration and dispersion parameter in nondrizzling marine stratocumulus, Atmos. Meas. Tech., 6, 1817–1828, https://doi.org/10.5194/amt-6-1817-2013, 2013.
Sasikumar, S., Battaglia, A., Puigdomènech Treserras, B., and Kollias, P.: The Estimation of Path Integrated Attenuation for the EarthCARE Cloud Profiling Radar, EGUsphere [preprint], https://doi.org/10.5194/egusphere-2025-3573, 2025.
Seifert, A. and Beheng, K. D.: A double-moment parameterization for simulating autoconversion, accretion and selfcollection, Atmos. Res., 59–60, 265–281, 2001.
Serpetzoglou, E., Albrecht, B. A., Kollias, P., and Fairall, C. W.: Boundary Layer, Cloud, and Drizzle Variability in the Southeast Pacific Stratocumulus Regime, J. Climate, 21, 6191–6214, https://doi.org/10.1175/2008JCLI2186.1, 2008.
Stephens, G. L., Vane, D. G., Boain, R. J., Mace, G. G., Sassen, K., Wang, Z., Illingworth, A. J., O'connor, E. J., Rossow, W. B., Durden, S. L., Miller, S. D., Austin, R. T., Benedetti, A., and Mitrescu, C.: The cloudsat mission and the a-train, B. Am. Meteor. Soc., 83, 1771–1790, https://doi.org/10.1175/BAMS-83-12-1771, 2002.
Stephens, G. L., L'Ecuyer, T., Forbes, R., Gettlemen, A., Golaz, J.-C., Bodas-Salcedo, A., Suzuki, K., Gabriel, P., and Haynes J.: Dreary state of precipitation in global models, J. Geophys. Res., 115, D24211, https://doi.org/10.1029/2010JD014532, 2010.
Suzuki, K., Nakajima, T. Y., and Stephens, G. L.: Particle growth and drop collection efficiency of warm clouds as inferred from joint CloudSat and MODIS observations, J. Atmos. Sci., 67, 3019–3032, https://doi.org/10.1175/2010JAS3463.1, 2010.
Takahashi, H., Suzuki, K., and Stephens, G. L.: Land–ocean differences in the warm rain formation process in satellite observations, ground-based observations, and model simulations, Q. J. Roy. Meteor. Soc., 143, 1804–1815, https://doi.org/10.1002/qj.3042, 2017.
Tanelli, S., Durden, S. L., Im, E., Pak, K. S., Reinke, D. G., Partain, P., Haynes, J. M., and Marchand, R. T.: CloudSat's Cloud Profiling Radar after two years in orbit: Performance, calibration, and processing, IEEE T. Geosci. Remote, 46, 3560–3573, https://doi.org/10.1109/TGRS.2008.2002030, 2008.
Tripoli, G. J. and Cotton, W. R.: A numerical investigation of several factors contributing to the observed variable density of deep convection over south Florida, J. Appl. Meteor., 1037–1063, 1980.
Vohl, O., Mitra, S. K., Wurzler, S., Diehl, K., and Pruppacher, H. R.: Collision efficiencies empirically determined from laboratory investigations of collisional growth of small raindrops in a laminar flow field, Atmos. Res., 85, 120–125, 2007.
Wang, Y., Chen, Y., Fu, Y., and Liu, G.: Identification of precipitation onset based on Cloudsat observations, J. Quant. Spectrosc. Ra., 188, 142–147, https://doi.org/10.1016/j.jqsrt.2016.06.028, 2017.
Wang, J. and Geerts, B.: Identifying drizzle within marine stratus with W-band radar reflectivity, Atmos. Res., 69, 1–27, 2003.
Wehr, T., Kubota, T., Tzeremes, G., Wallace, K., Nakatsuka, H., Ohno, Y., Koopman, R., Rusli, S., Kikuchi, M., Eisinger, M., Tanaka, T., Taga, M., Deghaye, P., Tomita, E., and Bernaerts, D.: The EarthCARE mission – science and system overview, Atmos. Meas. Tech., 16, 3581–3608, https://doi.org/10.5194/amt-16-3581-2023, 2023.
Wood, R.: Drizzle in stratiform boundary layer clouds. Part II: Microphysical aspects, J. Atmos. Sci., 62, 3034–3050, 2005.
Wood, R.: Stratocumulus clouds, Mon. Weather Rev., 140, 2373–2423, https://doi.org/10.1175/MWR-D-11-00121.1, 2012.
Wood, R., Kubar, T. L., and Hartmann, D. L.: Understanding the Importance of Microphysics and Macrophysics for Warm Rain in Marine Low Clouds. Part II: Heuristic Models of Rain Formation, J. Atmos. Sci., 66, 2973–2990, https://doi.org/10.1175/2009JAS3072.1, 2009.
Wood, R., Leon, D., Lebsock, M., Snider, J., and Clarke, A. D.: Precipitation driving of droplet concentration variability in marine low clouds, J. Geophys. Res., 117, D19210, https://doi.org/10.1029/2012JD018305, 2012.
Wu, P., Dong, X., Xi, B., Liu, Y., Thieman, M., and Minnis, P.: Effects of environment forcing on marine boundary layer cloud-drizzle processes, J. Geophys. Res.-Atmos., 122, 4463–4478, https://doi.org/10.1002/2016JD026326, 2017.
Xu, Z., Mace, G. G., and Posselt, D. J.: A method for assessing relative skill in retrieving cloud and precipitation properties in next generation cloud radar and radiometer orbiting observatories, J. Atmos. Ocean. Tech., 36, 2283–2306, https://doi.org/10.1175/JTECH-D-18-0204.1, 2019.
Xu, Z., Kollias, P., Lebsock, M., Battaglia A., and Sasikumar S.: Assessing Uncertainty and Biases in Total Liquid Water Path Retrieved from W-, Ka- and G-band Radar/Radiometer Observations from Space, J. Atmos. Ocean. Tech., https://doi.org/10.1175/JTECH-D-25-0044.1, 2026.
Yamaguchi, T., Feingold, G., and Kazil, J.: Stratocumulus to cumulus transition by drizzle, J. Adv. Model. Earth Sy., 9, 2333–2349, https://doi.org/10.1002/2017MS001104, 2017.
Yang, F., Luke, E. P., Kollias, P., Kostinski, A. B., and Vogelmann, A. M.: Scaling of drizzle virga depth with cloud thickness for marine stratocumulus clouds, Geophys. Res. Lett., 45, 3746–3753, https://doi.org/10.1029/2018GL077145, 2018.
Zhu, Z., Kollias, P., Luke, E., and Yang, F.: New insights on the prevalence of drizzle in marine stratocumulus clouds based on a machine learning algorithm applied to radar Doppler spectra, Atmos. Chem. Phys., 22, 7405–7416, https://doi.org/10.5194/acp-22-7405-2022, 2022.