the Creative Commons Attribution 4.0 License.
the Creative Commons Attribution 4.0 License.
 | 07 Apr 2026
QBO modulation of global monsoon systems with application to northern winter and summer for neutral to moderate ENSO conditions
Shigeo Yoden
Matthew H. Hitchman
Tetsuya Takemi
Kosuke Ito
The influence of the stratospheric Quasi-biennial oscillation (QBO) on global monsoon systems and their extratropical teleconnections is investigated using 42 years (1979–2020) of monthly mean ERA-5 reanalyses data, excluding the ∼ 22 % of months with Niño 3.4 index above ±1.0 K. This study provides a unified perspective on how the QBO modulates the global monsoon system for neutral to moderate ENSO conditions, with applications to northern summer and winter. During JJA, QBO westerly (W) at 50 hPa coincides with enhanced rainfall over the Maritime Continent and less over the Western Pacific. For the same JJA and QBO W, the zonal mean cold anomaly in the subtropical UTLS associated with the QBO mean meridional circulation (MMC) acts to reduce static stability in the Northwest Pacific. This coincides with a weaker anticyclonic lower tropospheric circulation and eastward shift in convective rainfall from south of Japan. During DJF, QBO modulation of tropical deep convection alters the planetary wave train pattern emanating from the tropics along the UTLS. QBO W at 50 hPa promotes a positive North Atlantic Oscillation (NAO) phase, with an enhanced Azores High, stronger North Atlantic jet stream, and westward shift in precipitation toward North America. QBO W at 70 hPa promotes a positive Pacific North America (PNA) phase, with anomalous northeastward flow into Alaska and above average precipitation, accompanied by reduced precipitation along the west coast of the United States. In each case, the opposite effect is observed during QBO easterly (E).
- Article
(22771 KB) - Full-text XML
-
Supplement
(2317 KB) - BibTeX
- EndNote


The global monsoon (GM) is a large-scale circulation system which helps to control the distribution of precipitation in low- and mid-latitudes. It responds to the annual cycle of solar forcing and energy budgets (Bordoni and Schneider, 2008; Biasutti et al., 2018; Geen et al., 2020), and is influenced by continental-scale thermal contrast between land and ocean (e.g., Chang et al., 2005; Krishnamurti et al., 2013). In the GM system, specific features of the underlying surface, including the land-ocean distribution, topography, and oceanic circulation play key roles in contributing to regional differences observed among monsoon systems (Wang and Ding, 2008; Wang et al., 2017). Based on the timing of the wet season, the summer GM can be classified into two main modes: the boreal summer monsoon (June, July, and August, hereinafter JJA) in the Northern Hemisphere (NH) subtropics, and the austral summer monsoon (December, January, and February, hereinafter DJF) in the Southern Hemisphere (SH) subtropics (An et al., 2015). During JJA the three primary regional monsoon systems are North African, Asian, and North American, while during DJF they are South African, Australian, and South American. These regional monsoons are not independent but have a dynamical linkage among them via prevailing wind patterns (Meehl, 1987). In the past few decades there has been a series of research publications and review articles which describe the complexity of the GM system (e.g., Chang et al., 2005, 2011, 2017, 2021; Yoden et al., 2023). Its variability across different time scales has a profound societal and economic impact on nearly two-thirds of the world's population. Thus, studying variations in the GM system across subseasonal, seasonal, interannual, and decadal timescales is essential for improving knowledge and forecasting skill. Forecasting variations in GM dynamics across different time scales remains challenging. Understanding interannual variability of the GM system presents a significant challenge to the scientific community. An improvement in understanding would directly benefit society through an improved ability to forecast regional and seasonal climate anomalies.
On interannual time scales, the GM system is also influenced by the tropospheric El Niño Southern Oscillation (ENSO). The ENSO is a major tropospheric driver of global teleconnections (Horel and Wallace, 1981; Shen and Lau, 1995; Krishnamurthy and Goswami, 2000; Yu et al., 2021; Park et al., 2023). It influences the GM by modulating the distribution of sea surface temperature (SST) and tropospheric circulations. Over the Northwest Pacific, ENSO significantly modulates regional atmospheric circulation and associated precipitation patterns (Wang et al., 2000; Wu et al., 2003; Park and Son, 2024). Through modulation of tropical convective centers, ENSO can modulate the Rossby source term (chap. 8, James, 1994; Kim and Kim, 2002), and therefore modify climatological structures associated with stationary Rossby wave trains, including the North Atlantic Oscillation (NAO) and Pacific-North America pattern (PNA). As a remote teleconnection with the North Atlantic, ENSO induces variability in the NAO, leading to shifts in the jet stream location and strength, modulating weather conditions across Northern Europe and the Eastern United States (Hurrell et al., 2003). In the North Pacific, ENSO anomalies modulate the PNA pattern, where La Nina favors more precipitation in Alaska (Wendler et al., 2017), and El Nino favors more precipitation in California (Jong et al., 2016). Recently, Yu et al. (2021) demonstrated that, at interannual time scales, the Indian summer monsoon exhibits a significant relationship with ENSO. Despite extensive studies on the teleconnection between GM dynamics and surface atmospheric circulations, interannual variability of the GM is still unclear, and further research is needed to improve understanding.
The Quasi-biennial oscillation (QBO) is a regular dynamical feature of the equatorial stratosphere in which alternating layers of easterly (E) and westerly (W) winds descend in time, with a range in periodicity of 24–32 months (Baldwin et al., 2001). The influence of the QBO is not confined to the equatorial stratosphere, but can extend down to the surface across the entire globe through two primary pathways, along the upper troposphere and lower stratosphere (UTLS) or via the stratosphere (Hitchman et al., 2021). In both pathways, the QBO mean meridional circulation (MMC) modulates the temperature structure of the tropics and subtropics in an antiphased sense, where descending QBO W is associated with a warm anomaly in the tropics and simultaneous cold anomalies in the subtropics of both hemispheres. Moreover, QBO temperature anomalies in the UTLS can modulate tropical deep convection and therefore alter the planetary wave pattern radiating along the UTLS into the extratropics. Modulation of the subtropical westerly jets (STJs) via QBO MMC anomalies can be complex since it involves feedback with extratropical synoptic and planetary waves (Garfinkel and Hartmann, 2011). Here we refer to the “UTLS pathway” of QBO influence as involving simultaneous, anti-phased modulation of tropical and subtropical UTLS temperature anomalies by the descending pattern of QBO MMC cells, modulating deep convective centers, emanation of planetary wave activity along the UTLS into the extratropics. Via the UTLS pathway, the QBO can thereby alter planetary wave patterns and jets (Kumar et al., 2022, 2024) and therefore regional GM circulations.
The “stratospheric pathway”, or polar route, connects to the extratropical surface via the winter stratosphere. The polar route involves QBO modulation of planetary Rossby wave propagation by changing the stratospheric QBO MMC and position of the zero-wind line at mid-stratospheric levels. This pathway gives rise to “Holton-Tan (H-T) effect” (Holton and Tan, 1980, 1982), which operates during boreal winter when westerlies exist in the polar stratosphere. QBO E at 30 hPa favors a disrupted polar vortex, and therefore a low NAM index and increased midlatitude surface cold air outbreaks (Thompson and Wallace, 2001; Kumar et al., 2024).
In the ULTS pathway, when a QBO MMC pattern arrives at the tropopause, the resulting temperature anomalies alter the meridional temperature gradient, and are therefore associated with zonal wind anomalies by the thermal wind law. The resulting changes in static stability and wind shear in the UTLS can affect deep convection (Giorgetta et al., 1999a; Collimore et al., 2003; Nie and Sobel, 2015). The resulting QBO zonal wind anomalies can influence the STJs, which can, in turn, interact with synoptic and planetary-scale waves that originate in the extratropics and dissipate in the subtropics (Garfinkel and Hartmann, 2011; Inoue and Takahashi, 2013; Haynes et al., 2021). During JJA, the subtropical jet is displaced poleward by the South Asian High, creating a unique regime to be investigated. Gray et al. (2018) observed increased precipitation in the tropical Western Pacific when there is QBO W at 70 hPa, particularly during boreal summer. They also noted that the band of precipitation across the Pacific, associated with the intertropical convergence zone (ITCZ), shifts southward. Park et al. (2022) found that when QBO E occurs at 70 hPa, the East Asian STJ weakens and shifts poleward.
Modulation of the tropical UTLS by the QBO MMC can be linked to the surface through modulation of deep convection and its organization (Gray et al., 1992a, b; Collimore et al., 1998, 2003; Kumar et al., 2014; Lee et al., 2019; Hitchman et al., 2021; Haynes et al., 2021; Gao et al., 2023). QBO modulation of deep convective centers can modulate the planetary wave trains which emanate from them, with poleward energy dispersion along the UTLS (Peña-Ortiz et al., 2019; Yamazaki et al., 2020). This can, in turn, modulate regional circulation features in the extratropics, including the NAO and PNA patterns. This principle provides the impetus for highlighting two other regions: QBO modulation of the PNA and NAO patterns during DJF.The effects of the QBO on rainfall in different parts of the globe, particularly within the tropical and subtropical regions, have been examined in previous observational studies (Seo et al., 2013; Gray et al., 2018). In addition, several numerical modeling studies have been conducted to explore modulation of rainfall patterns by the QBO (Goswami, 1998; Giorgetta et al., 1999b; Brönnimann et al., 2016). However, some contradictions have been observed among the numerical model studies. In a general circulation model (GCM) experiment, Giorgetta et al. (1999b) found that the boreal summer monsoon is significantly influenced by the QBO, with less precipitation over the Western Pacific during QBO W but more over the Indian Ocean. On the other hand, Brönnimann et al. (2016) did not find significant QBO effects on the Indian monsoon in either observations or coupled ocean–atmosphere–chemistry climate model simulations.
Recently Yoden et al. (2023) reported on new observational aspects of QBO modulation in the GM system, highlighting modulation of low-pressure cyclonic perturbations over the NH Western Pacific during JJA and Eastern Pacific during DJF. However, this study did not provide an in-depth view of the QBO association with the GM system from both a phenomenological and mechanical perspective. In a very recent study, Kumar et al. (2024) demonstrated teleconnections between the QBO and regional surface climate in Eurasia and North America during boreal winter. They proposed a teleconnection pathway via the UTLS region to the high-latitude surface by diagnosing changes in planetary wave activity, independent of the H-T mechanism. Both studies suggest that the role of the QBO in modulating surface weather regimes from the equatorial regions to the polar regions cannot be ignored. Therefore, further systematic work is needed to diagnose the QBO teleconnection pathways, which vary on a seasonal and regional basis and by phase of the QBO.
QBO teleconnections with the tropospheric surface via the different routes discussed above display pronounced zonally asymmetric feature and sensitivity to its vertical phase (Collimore et al., 1998, 2003; Gray et al., 2018; García-Franco et al., 2023; Kumar et al., 2024). Collimore et al. (1998, 2003) observed that the QBO primarily modulates convective activity over tropical deep convection, using the 50–70 hPa zonal-mean wind shear as an index. Gray et al. (2018) noted that, during JJA, precipitation over the tropical Western Pacific exhibits maximum sensitivity to QBO winds at 70 hPa. On the other hand, Zhou et al. (2024) observed that precipitation over the Yangtze–Huaihe River Basin (YHRB) during JJA is sensitive to QBO winds at 50 hPa. During DJF, the 50 hPa QBO index has been extensively used to assess changes in the NAM via H-T mechanics, in order to evaluate its modulation of mid-latitude surface dynamics. Recently Kumar et al. (2024) used the 70 hPa QBO index and described a teleconnection pathway via the UTLS to the Eurasian and North American surface. The present study uses 50 and 70 hPa QBO indices, since these levels exhibit the most consistent phase relationship with QBO phase in the UTLS, and are compatible with most previous studies. The QBO signal in tropical precipitation exhibits significant zonal asymmetries at a regional scale (Gray et al., 2018; García-Franco et al., 2023; Yoden et al., 2023). García-Franco et al. (2023) found much larger QBO differences in precipitation over the oceans. The present study is intended to provide a first-step global perspective by identifying regions where the QBO signal is most evident in the zonally-asymmetric GM circulation systems.
The phase of ENSO can enhance or diminish the influence the QBO (Kumar et al., 2022). The new teleconnection pathway observed by Kumar et al. (2024) was found to exist only during the neutral phase of ENSO (neither El Niño nor La Niña). Yoden et al. (2023) excluded extreme El Niño and La Niña events to avoid contamination by them. Information about QBO phase can be used to improve ENSO prediction (Rodrigo et al., 2025). Here our strategy is to study QBO anomalies, including all months in which ENSO is neutral-to-moderate. This approach excludes only strong El Nino and La Nina months and is therefore complementary to other approaches in trying to distinguish the mutual effects of ENSO and the QBO. In this study, we highlight QBO effects on GM system, regional circulation, and precipitation patterns from tropical to extratropical latitudes (60° S–60° N). Potential routes by which the QBO connects with the GM system will be investigated, focussing on changes associated with specific QBO phase pairs. Separate analyses are presented for the JJA and DJF seasons.
2.1 Data
Monthly mean ERA-5 reanalysis data for the 42-year period 1979–2020 (satellite era) are used to analyze zonal and meridional wind (U, V), vertical wind (W), divergence of horizontal wind, specific humidity (q), mean sea level pressure (MSLP), and geopotential height (GPH). ERA-5 offers several improvements over ERA-Interim, having benefitted from a decade of development in core dynamics and model physics (Hersbach et al., 2020). Assimilation of a much larger number of reprocessed datasets has improved ERA-5 reanalysis products. In this study, a double prime superscript for a given meteorological variable, X′′, represents de-seasonalized anomalies, or deviation from the climatological seasonal mean in the 42-year data set. Vertical wind shear of the zonal mean zonal wind () is calculated using centered finite differencing.
Monthly mean values of outgoing longwave radiation (OLR) are obtained from the National Oceanic and Atmospheric Administration (NOAA) (Gruber and Krueger, 1984). To study the monsoon patterns, precipitation (P) data are obtained from the Global Precipitation Climatology Project (GPCP) version 2.3, which incorporates precipitation estimates from surface rain gauge stations, low-orbit satellite microwave data, and geostationary satellite infrared data, on a 2.5° × 2.5° (latitude × longitude) global grid (Adler et al., 2003, 2018). This dataset provides an overview of global monsoon rainfall patterns over both land and ocean.
SST data are obtained from the Hadley Centre Global Sea Ice and Sea Surface Temperature (HadISST) v1.1 (Rayner et al., 2003) and are used to calculate the monthly Niño 3.4 index for identifying extreme ENSO events. These events are defined using de-seasonalized data over a 42-year period in the Niño 3.4 region (5° N–5° S, 120–170° W). Any month is considered to be an extreme El Niño or La Niña period whenever the Niño 3.4 index exceeds the threshold values ±1.0 K (+: El Niño; −: La Niña). We obtained 395 neutral, 57 El Niño, and 52 La Niña months. This study focuses on the 395 neutral-to-moderate months only, and all the analysis is conducted at 2.5° × 2.5° resolution, spanning 60° S to 60° N.
2.2 Methodology
A QBO state is defined in a two-dimensional phase space using the first two principal components (PC1 and PC2) of the de-seasonalized zonal mean zonal wind variations in the equatorial lower stratosphere between 10 to 70 hPa (Wallace et al., 1993). Figure S1 in the Supplement shows the vertical structure of the first two leading EOFs, along with scatter plots in the PC1 and PC2 phase space for all four seasons: DJF, March, April, and May (MAM), JJA, and September, October, and November (SON). The QBO state is represented by the phase angle , where PC1′ and PC2′ are the principal components with respect to the centroid of all data points (black + marker in Fig. S1). See Kumar et al. (2022, 2024) and Yoden et al. (2023) for a detailed description of the methodology used in employing EOF analysis to define QBO phase. In this study we divide QBO phase into the following eight 45° angular bins: phase 1 (0–45°), phase 2 (45–90°), phase 3 (90–135°), phase 4 (135–180°), phase 5 (180–225°), phase 6 (225–270°), phase 7 (270–315°), and phase 8 (315–360°), hereinafter designated P1 to P8 (Hitchman et al., 2021; Yoden et al., 2023).
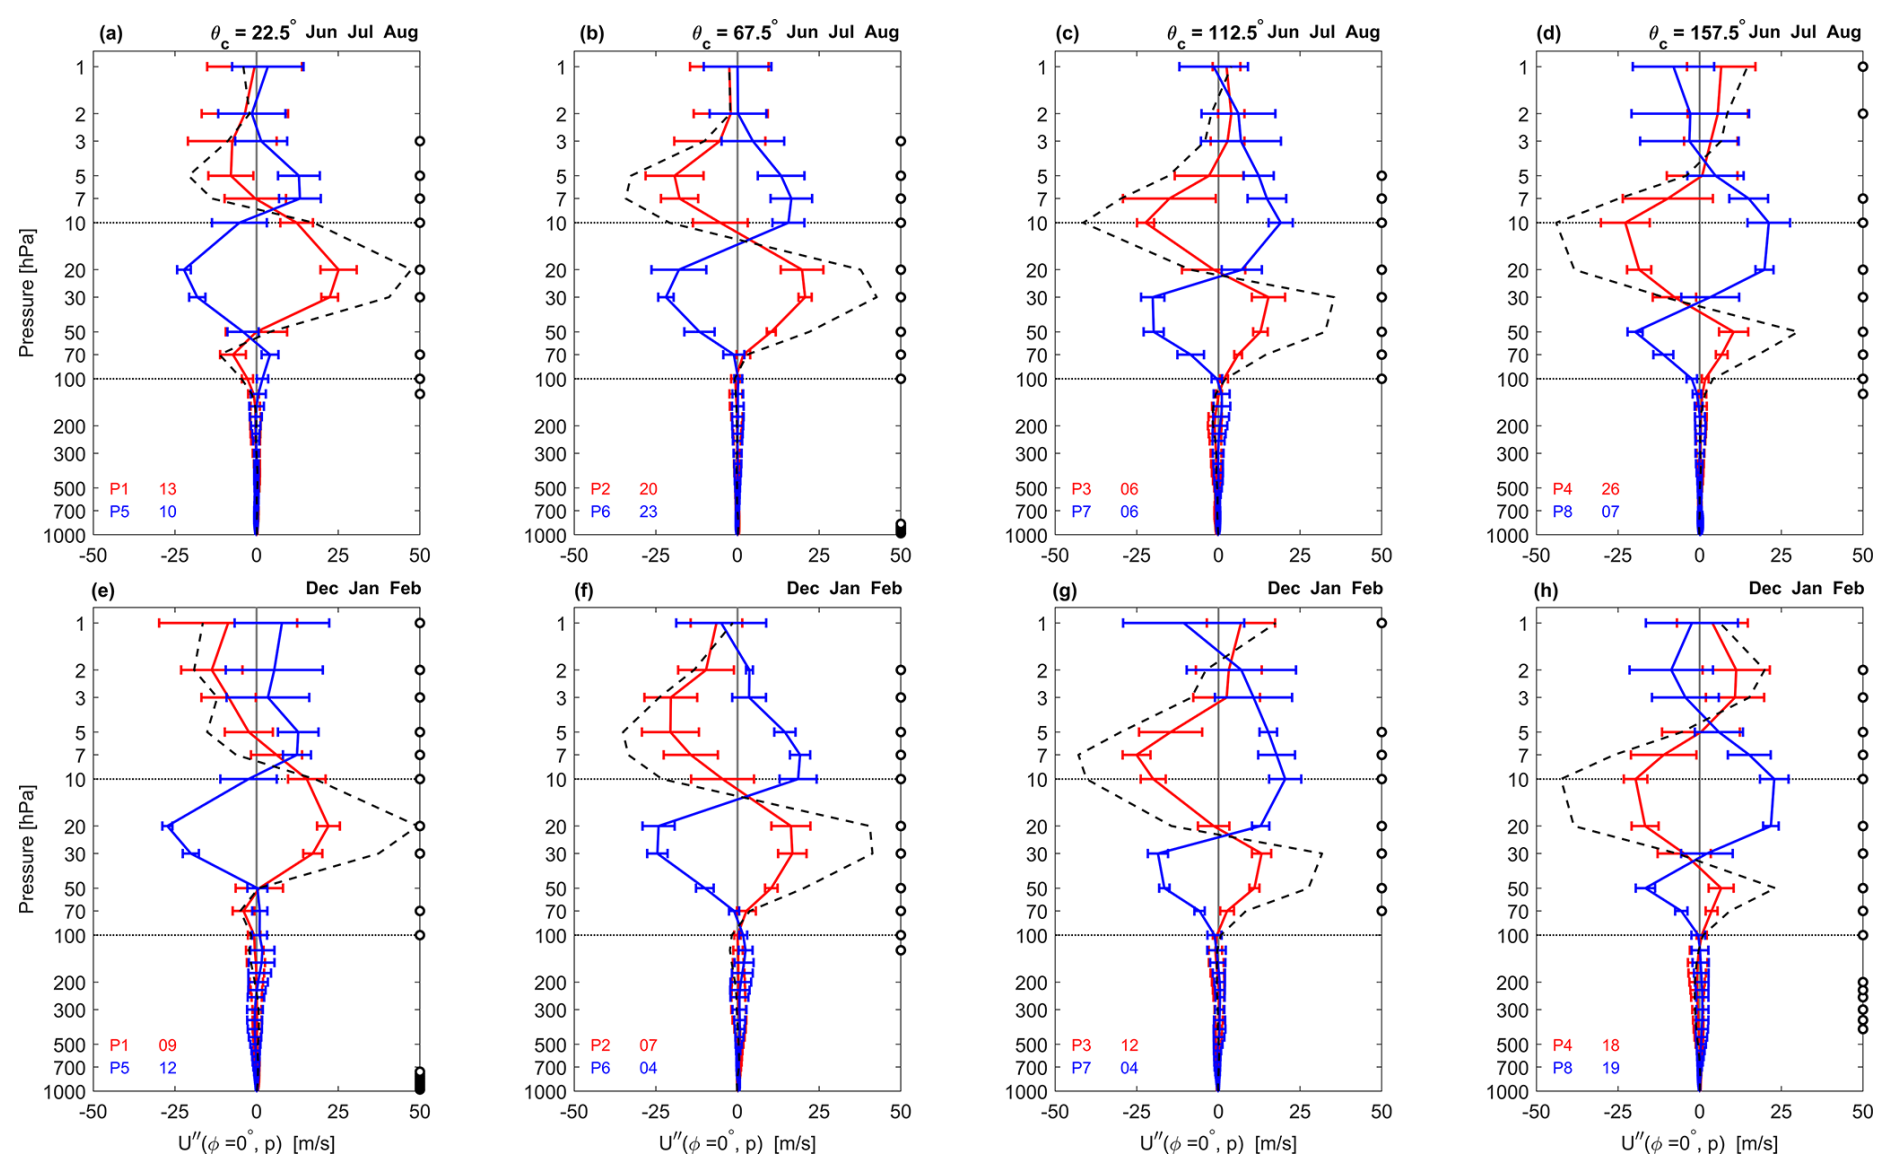
Figure 1Average vertical profiles of zonal mean zonal wind U′′ anomalies for each of the eight phases P1 to P4 (red) and P5 to P8 (blue), along with composite differences between these QBO opposite phases (black dashed line) for JJA (a–d) and DJF (e–h). The whiskers denote ±1 standard deviation for each composite phase, and an open circle is plotted on the right y-axis if the composite difference at that level exceeds 90 % statistical significance. The total number of samples for each phase is written at the bottom left corner in each panel.
Figure 1 shows vertical profiles of the composite means of de-seasonalized zonal mean zonal wind at the equator, for each of the eight phases separately, during JJA (Fig. 1a–d) and DJF (Fig. 1e–h). Each subplot contains two profiles corresponding to opposite QBO phases at the central angle θc (i.e., θc, and θc+180°), shown in red for P1 to P4 and blue for P5 to P8. The composite difference between the opposite phases is shown as a black dashed line (Fig. 1). An open circle on the right y-axis indicates that the composite difference for a given level is statistically significant (90 %), using a two-sided Student's t-test with two independent samples in each phase. Successive downward phase propagation of QBO W (E) phase can be seen from P1 to P4 (P5 to P8) between 20 and 70 hPa. Most of the major features of QBO propagation are similar in the two seasons for each phase pair (Fig. 1).
However, when QBO winds maximize at 70 hPa with the opposite phase at 20 hPa, the profile of P1 − P5 is different above 3 hPa for JJA (Fig. 1a) and DJF (Fig. 1e). Further, it is also noteworthy that the magnitude of P1 − P5 in the lowest stratosphere is diminished during DJF. At 70 hPa, the whiskers are clearly separated in the JJA profile (Fig. 1a), but overlap in the DJF profile (Fig. 1e). Kumar et al. (2013) showed that the tropopause height is at a higher altitude (∼ 90 hPa) during DJF compared to JJA (∼ 110 hPa) (see also Reid and Gage, 1985). Note that DJF is a dynamically active season in the NH (and during SON in the SH), with QBO W winds permitting more upward propagation of planetary waves into the stratosphere and the possibility of the H-T mechanism. Also, deep convection penetrates higher over Indonesia during DJF, so that cloud tops would extend higher into QBO thermal anomalies associated with the MMC, which can modulate static stability. Furthermore, the pattern of convection is more symmetric about the equator during DJF, subject to the tropical QBO UTLS anomaly. From these considerations, one might expect significant QBO effects during DJF in the tropics. During JJA convection shifts northeastward to Southeast Asia from the Maritime Continent and northeastward from Brazil to the Gulf of Panama, both in the subtropics. Thus, during JJA convection in the subtropics is subject to the opposite sign of QBO UTLS thermal anomaly compared to the tropics. Keeping this antiphased zonal mean pattern in mind will be helpful in diagnosing QBO influences during JJA compared to DJF.
Based on our previous survey of modulations of the GM system by QBO phase (Yoden et al., 2023), this study will focus on the phases when QBO anomalies arrive in the UTLS regions, separately for JJA and DJF. Results are presented for the composite differences P4 − P8 (QBO W − E at 50 hPa) and P5 − P1 (QBO W − E at 70 hPa). For an easy understanding of the QBO signature in the GM system, it is essential to grasp the fundamental dynamics of the GM system; therefore, we will first discuss its climatology briefly in the next section.
Figure 2 provides an overview of the 42-year zonal mean and non-zonal climatology of the GM system in precipitation and winds at 950 hPa, showing the annual mean, JJA mean, DJF mean, and JJA − DJF mean patterns separately, using only neutral ENSO months. The composite difference panel provides a concise overview of seasonal variations in global monsoon precipitation, a phenomenon extensively examined in numerous previous studies (Wang and Ding, 2008; Bordoni and Schneider, 2008; Biasutti et al., 2018; Geen et al., 2020). This figure is an updated version of Fig. 3 of Yoden et al. (2023), showing a wider latitudinal domain, from 60° S to 60° N, and including wind patterns in the boundary layer at 950 hPa.
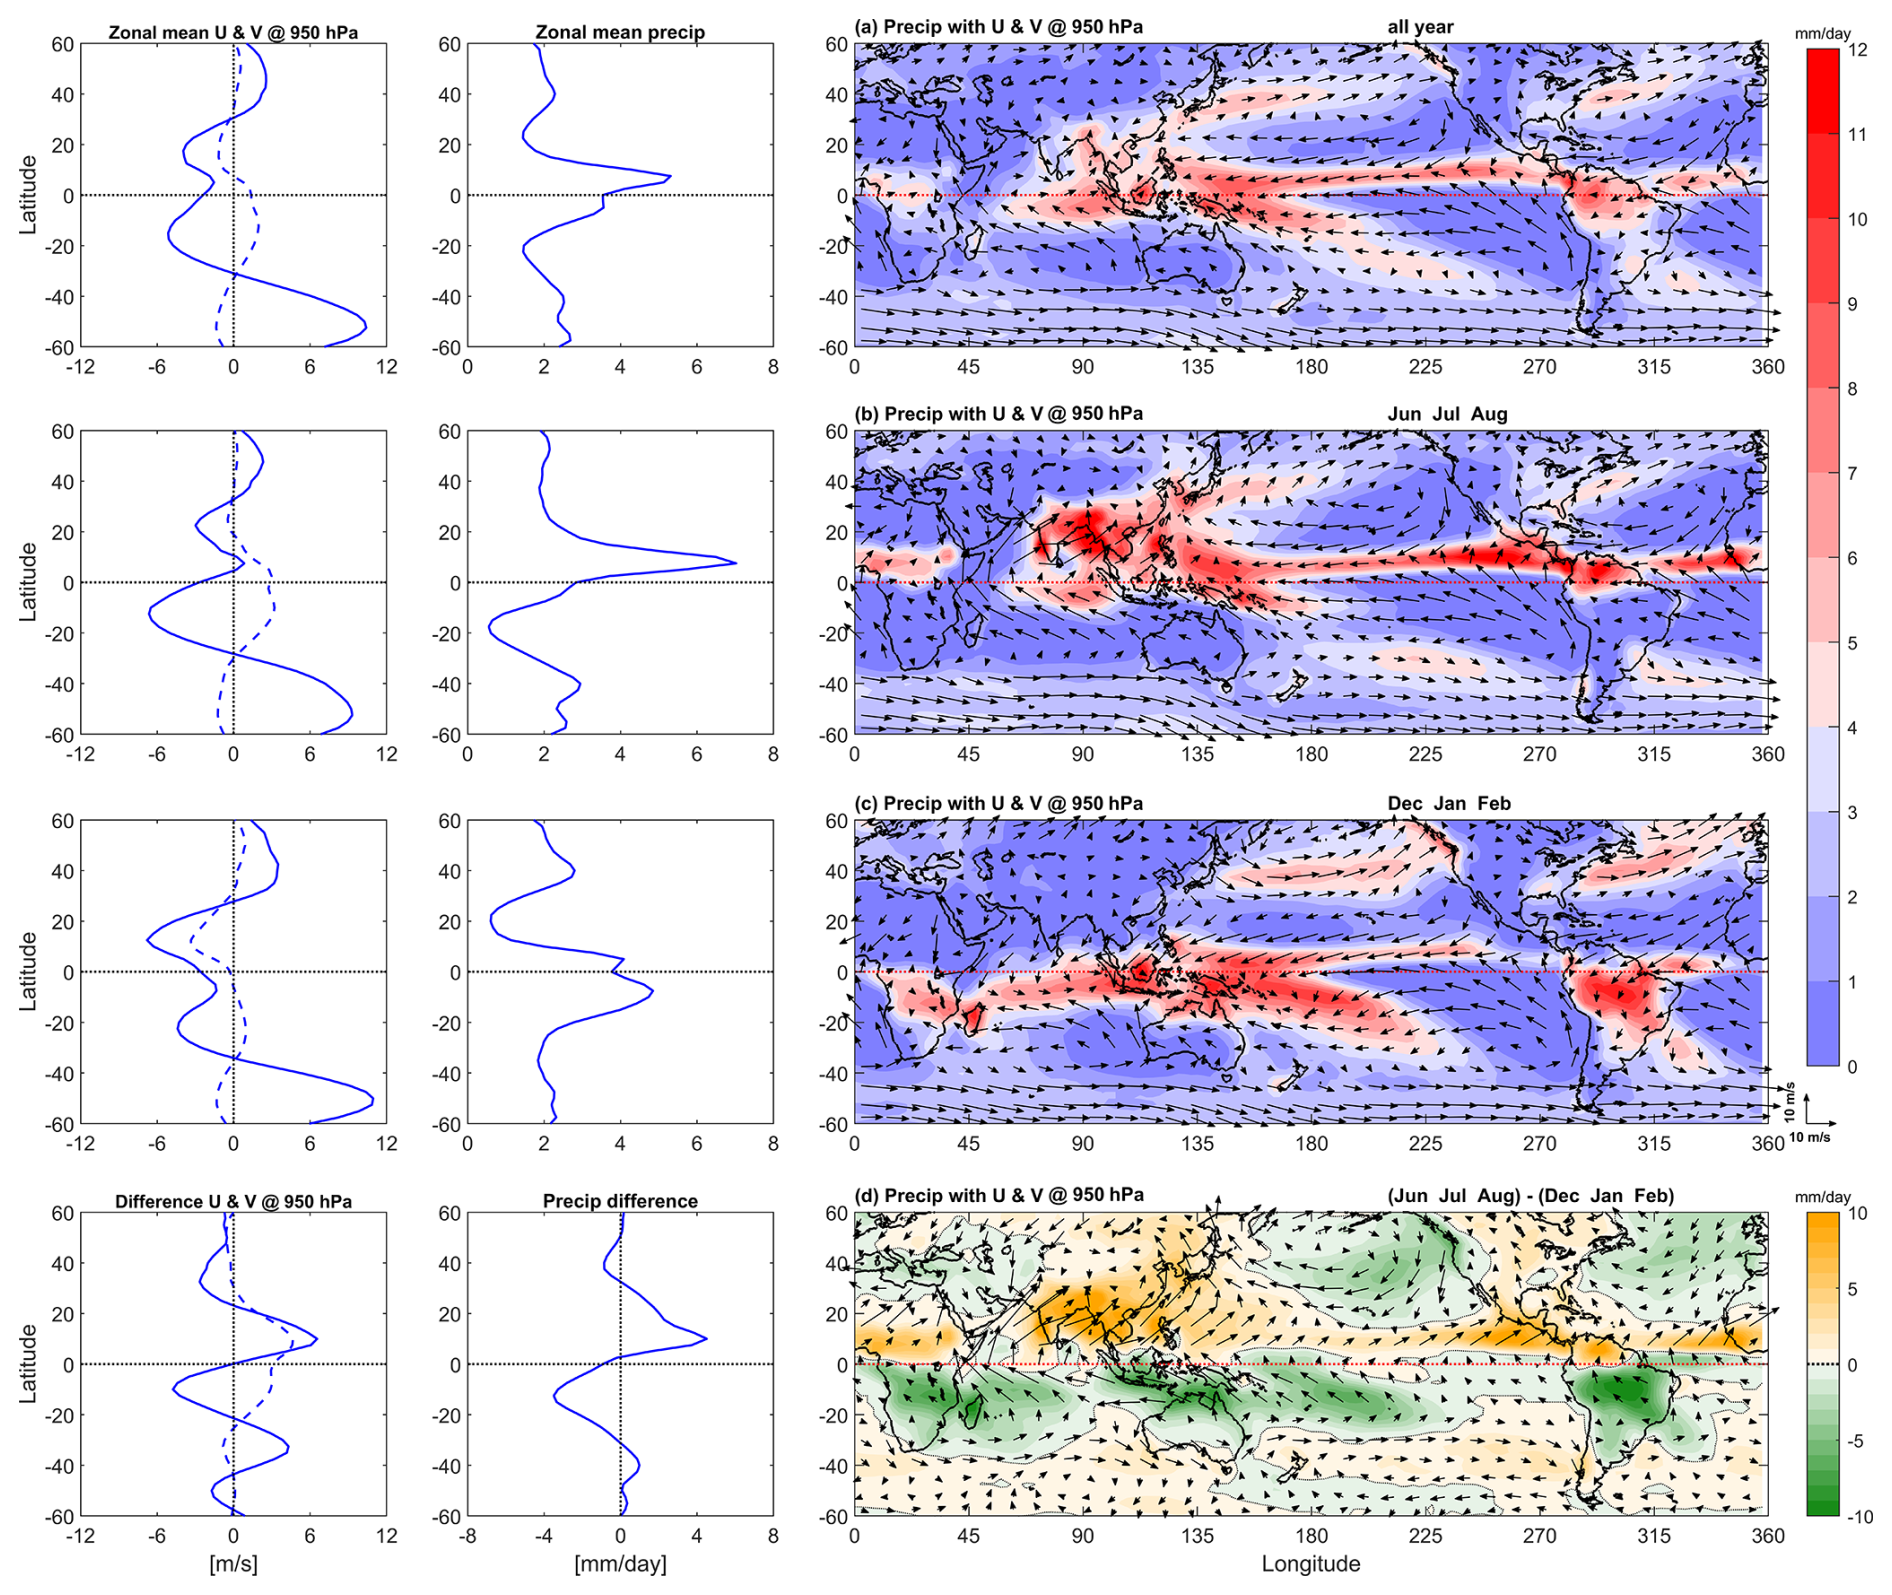
Figure 2ERA-5 climatology (1979–2020) of precipitation (P) and horizontal winds (U, V) at 950 hPa, using only neutral ENSO months. The 1st and 2nd columns show latitudinal profiles of zonal mean zonal [U] (solid line) and meridional [V] (dashed line) winds, and zonal mean precipitation [P], respectively. The 3rd column shows charts of precipitation P (color bar) along 950 hPa wind vectors. From top to bottom, rows show results for the climatological (a) annual mean, (b) boreal summer monsoon (JJA), (c) austral summer monsoon (DJF), and (d) the composite difference JJA − DJF, respectively. In panel (d), a positive value (golden color) denotes enhanced precipitation during JJA relative to DJF, and a negative value (green color) denotes enhanced precipitation during DJF relative to JJA.
Seasonal variations between JJA and DJF can be clearly seen in the zonal mean and geographically-varying structure of precipitation and horizontal wind vectors. Note there is very little shift in the ITCZ in the Pacific, but the latitude of the zonal mean maximum shifts from ∼ 7° N in JJA to ∼ 10° S in DJF (Fig. 2, 2nd column). Vigorous convection over Brazil and the South Pacific Convergence Zone (SPCZ) contribute strongly to the zonal mean in DJF. In the composite difference JJA − DJF panel, [U] and [P] show roughly anti-symmetric profiles with respect to the equator, whereas [V] is roughly symmetric, describing the annual cycle responses with a half-year time difference between the two hemispheres and the asymmetry of the Hadley circulation at the solstices.
The composite difference chart of precipitation and 950 hPa winds (Fig. 2d) highlights the prominent regional monsoon systems over the globe. During boreal summer monsoon JJA in the NH, heavy precipitation is associated with the North African, Asian, and North American monsoons (Fig. 2b, golden shading in Fig. 2d). These monsoon precipitation patterns are associated with dominant large-scale wind circulations. The northward flow in the boundary layer associated with the Hadley cell occurs in preferred longitude bands, including prominent cross-equatorial winds over Indonesia, over the western Indian Ocean (which feeds the Somali Jet), over the Eastern Pacific, and Eastern Atlantic Oceans, each of which brings moisture toward heavy precipitation regions along the ITCZ (Fig. 2b, d). The North Atlantic and North Pacific are dominated by large surface anticyclones, which generate less precipitation but transport moisture clockwise from the subtropics, creating a band of higher precipitation to the northwest of the anticyclones (Fig. 2b).
The monsoon circulation during DJF also exhibits a longitudinal preference for cross-equatorial flow in the boundary layer toward the summer hemisphere, notably in the Western Pacific and Western Atlantic, which feed into regional precipitation maxima over South Africa, the Amazon, and a band stretching from the SPCZ in the Southwest Pacific across the Indian Ocean (Fig. 2c). These regional precipitation maxima are highlighted by green shading in the JJA − DJF difference plot (Fig. 2d). As in the NH during JJA, large anticyclones are prominent over the mid-latitude Indian, Pacific, and Atlantic Oceans of the SH during DJF, which help feed moisture poleward on their west edges, creating thin midlatitude precipitation maxima poleward of the anticyclones. Seasonal characteristics of other meteorological variables are shown in Fig. S2 as JJA − DJF differences for OLR, 300 hPa specific humidity, SST, MSLP and 950 hPa winds, 950 hPa divergence, and 500 hPa vertical velocity. Deep convective features appear as opposite-sign peaks of OLR difference across all six regional monsoon systems (Fig. S2b). A more detailed description on the climatology and seasonality of all these meteorological variables can be found in Yoden et al. (2023).
Deseaonalized anomalies of zonal mean zonal wind U′′ and temperature T′′ between 60° S to 60° N, binned using QBO W − E paired phase indices at 50 hPa (P4 − P8), are used to investigate the seasonal dependency of QBO dynamical teleconnections separately for the boreal and austral monsoon summer seasons (Fig. 3). The antiphased pattern of vertical motion between the tropics and subtropics associated with the MMC is manifested in the UTLS temperature anomalies, such that QBO W causes a tropical warm anomaly and subtropical cold anomalies (Fig. 3c, d). This is more evident during JJA in the subtropics (Fig. 3c), but more evident during DJF in the tropical troposphere (Fig. 3d). From the thermal wind law, integrating upward through the meridional temperature gradients associated with these anomalies yields horseshoe-shaped structures in the QBO W − E zonal wind anomalies (Fig. 3a, b).
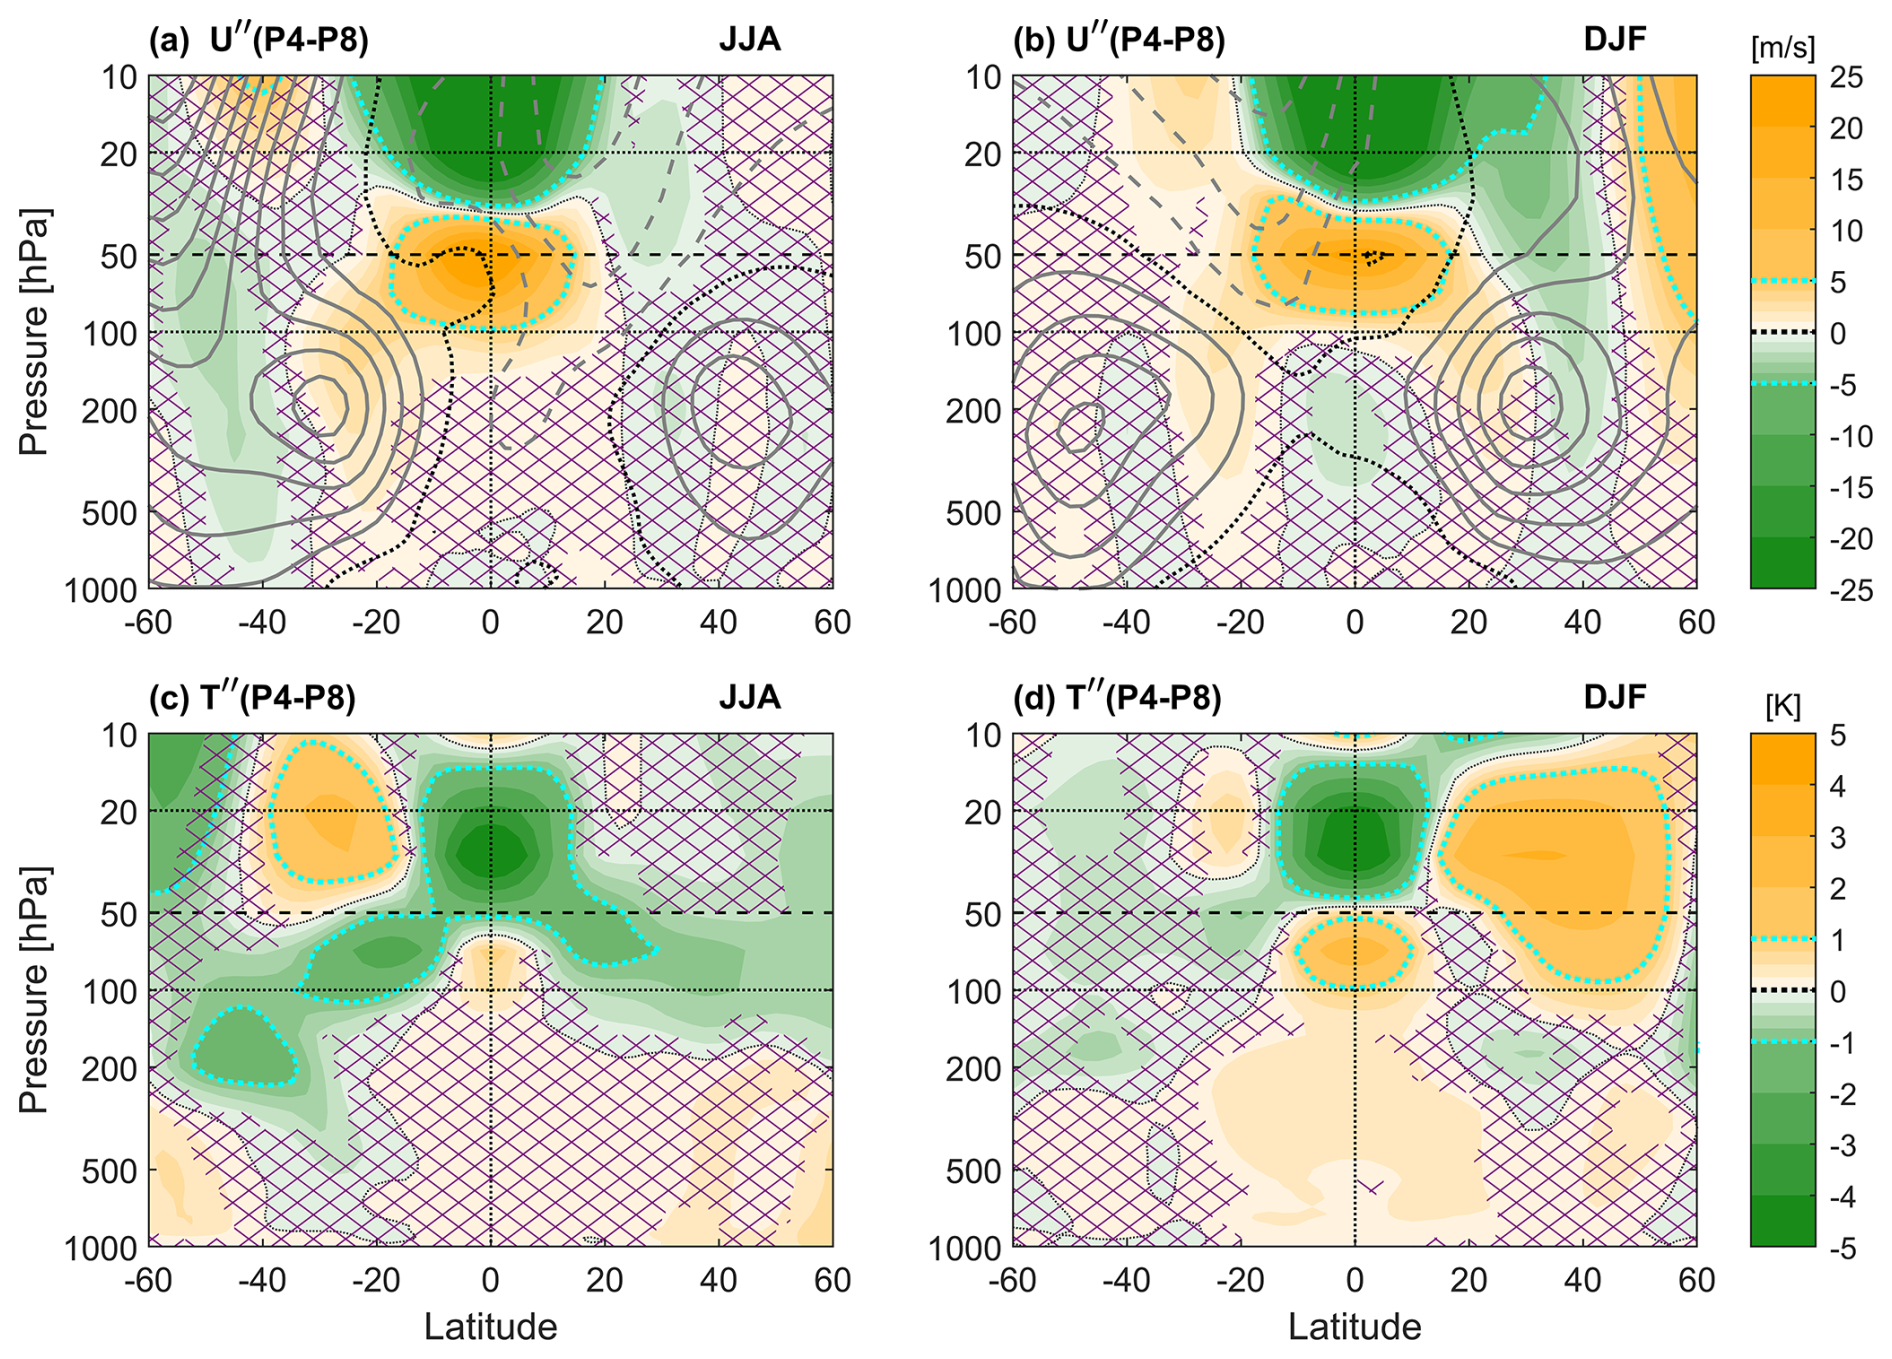
Figure 3Meridional sections of the composite difference in U′′ and T′′ anomalies for opposing QBO phase pairs, QBO W − E at 50 hPa (P4 − P8), during DJF and JJA. (a–b) U′′ wind anomalies. (c–d) T′′ anomalies. From left to right, columns represent JJA, and DJF. The violet cross hatching indicates regions of statistical significance less than 90 %. The cyan dotted line separate regions of fine and coarse contour. Horizontal lines indicate the 20 hPa (dotted), 50 hPa (dashed), and 100 hPa (dotted) levels. The climatological cycle of the U-wind for the period 1970–2020 is also shown as gray contour lines over the U′′ wind anomaly panels for the respective seasons. The solid (dashed) contour lines represent the positive (negative) value, and the black dotted line is the position of the zero-wind line.
During JJA this arch-like structure is absent in the NH subtropics (Fig. 3a). This is the location of the strong upper tropospheric easterlies associated with the equatorward side of the Southeast Asian monsoon during JJA (Krishnamurti, 1971). This shows that the Tibetan High and its associated easterly jet may not significantly be affected by the QBO. However, note the cold anomaly in the UTLS near 20° N, which can act to reduce static stability above deep convective center located over Southeast Asia (Fig. 2b) during QBO W at 50 hPa. Note that the corresponding cold anomaly in the SH, acts to shift the winter subtropical jet poleward (Fig. 3a). The MMC near 30 hPa is showing asymmetrical extension into the winter hemisphere.
During DJF there is a warm anomaly in the tropical troposphere for QBO W at 50 hPa (Fig. 3d). From the thermal wind law, this implies enhanced, equatorward-displaced subtropical jets near 20°, as are seen in both hemispheres (Fig. 3b). The MMC near 30 hPa is greatly amplified, extending well into the winter hemisphere, causing a large warm anomaly near 40° N (Fig. 3d). Previous studies have shown a stronger extension of QBO MMC into the winter hemisphere (Randel et al., 1999; Kinnersley and Tung, 1999; Peña-Ortiz et al., 2008; Hitchman et al., 2021; Kumar et al., 2022). This implies a weakening of stratospheric westerlies near 30° N during QBO W, as seen in Fig. 3b. The warm anomaly near 40° N is the downwelling companion to the upwelling over the equator which underlies QBO E, also implies a strengthening of the polar night jet near 60° N during QBO W, as seen in Fig. 3b. This is a visual representation of the H-T effect, where QBO W is correlated with a stronger polar night jet.
QBO W at 50 hPa implies a warm anomaly near the tropical tropopause, which lowers the tropopause and stabilizes the upper troposphere, thereby reducing deep convection over Indonesia during NH winter (Collimore et al., 2003), weakening the Walker Circulation (WC) (Yasunari, 1990; Huang et al., 2012; Hu et al., 2012; García-Franco et al., 2022), and causing a warm anomaly throughout the troposphere over Indonesia (Muhsin et al., 2018). The opposite effect for QBO E, with a cold anomaly in the tropical UTLS, warm anomalies in the subtropical UTLS in both the NH and SH, and enhanced convection over Indonesia during DJF. There is also significant modulation of the STJs and polar night jet by QBO MMC. These results suggest that both the stratospheric and UTLS routes for QBO teleconnections operate simultaneously, in addition to the H-T mechanism during DJF.
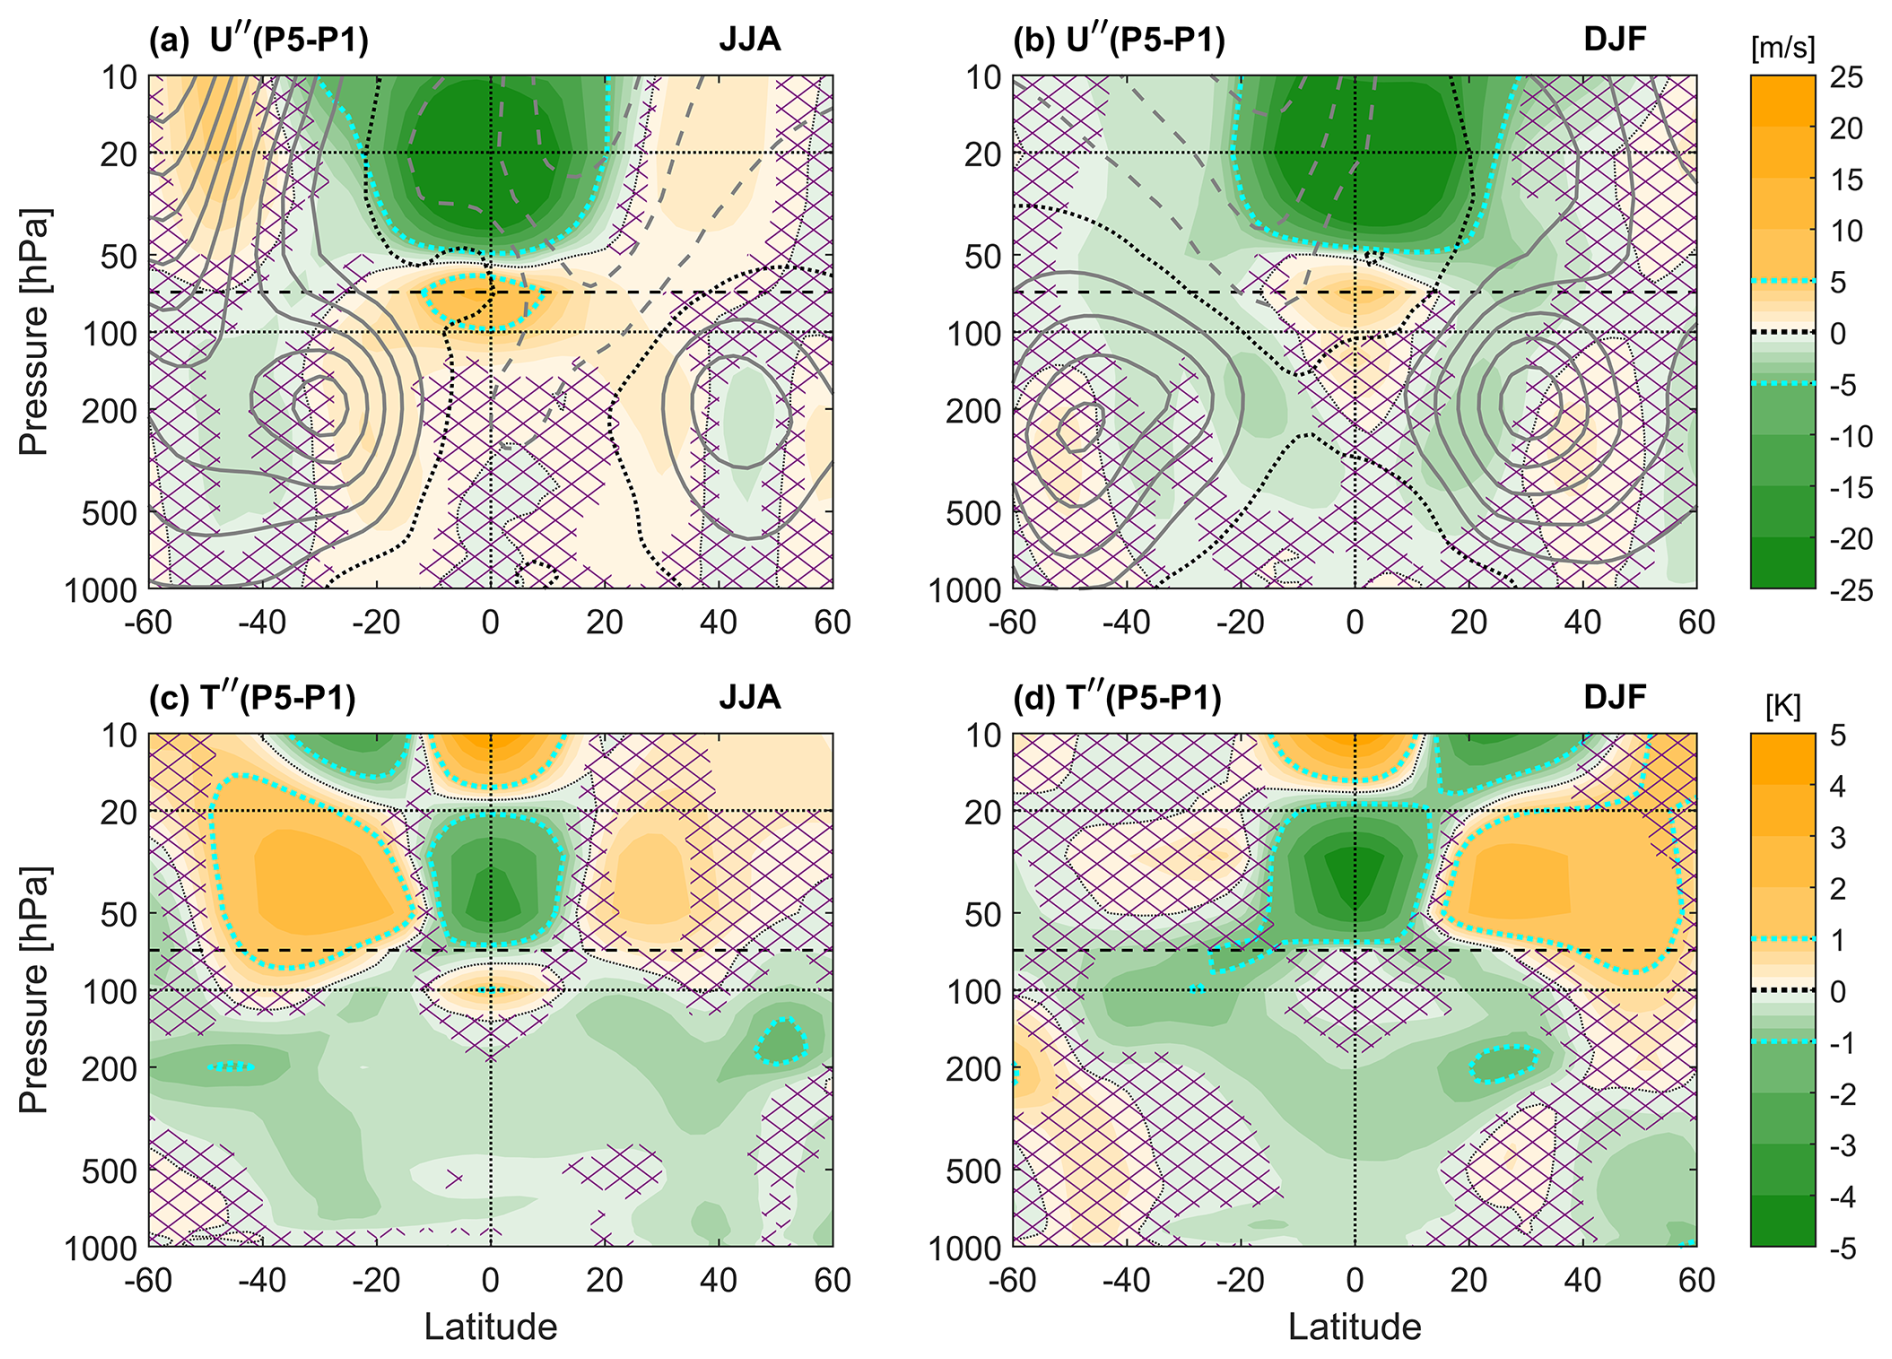
Figure 4Same as Fig. 3, but for QBO W − E at 70 hPa (P5 − P1) and horizontal dashed is plotted for 70 hPa level.
Figure 4 shows the same seasonal meridional structure of U′′ and T′′ composite differences as in Fig. 3 but for QBO W − E at 70 hPa (P5 − P1). During both JJA and DJF one may see a fundamental tri-pole pattern in temperature anomalies along the subtropical UTLS, with the subtropics antiphased with the tropics (Fig. 4c, d). The anomalies can extend deep into the troposphere, with considerable differences between the two seasons. During JJA this somewhat complex temperature anomaly pattern is associated with an equatorward shift in the subtropical jet in both hemispheres (Fig. 4a), while during DJF it is associated with a poleward shift in both hemispheres (Fig. 4b). Note that moderate QBO anomalies in temperature and zonal wind are found throughout the troposphere, which can affect surface weather.
The subtropical and extratropical tropospheric responses depend on season and phase of the QBO, with interesting differences seen even between using 50 and 70 hPa as index levels (compare Figs. 3 and 4). For example, during DJF and QBO W at 70 hPa, a significant cooling anomaly is also evident in the lower troposphere poleward of 40° N (Fig. 4d). This confirms the recent finding of Kumar et al. (2024) regarding a QBO teleconnection pathway for these cooling patterns via the UTLS region to the high-latitude surface. Based on this zonal mean analysis, QBO dynamical teleconnections with tropical, subtropical, and polar regions vary with the seasons and downward propagation of the QBO anomalies. Additionally, the characteristics of QBO anomaly patterns in any latitudinal zone may differ with geographical location. Since the monsoon system is linked to the distribution of land and sea, and since the climatological patterns associated with emanation of planetary wave trains are fundamentally zonally asymmetric, such as the PNA and NAO patterns, we now focus on the geographical variation of QBO teleconnections in the extratropics.
5.1 Composite differences of seasonal precipitation and surface wind for opposite QBO phases
In order to visualize regional effects of QBO dynamical teleconnections in the GM system, we investigated the horizontal distribution of the QBO signal in precipitation and surface wind during JJA and DJF (Fig. 5). The index pairs QBO W − E at 50 hPa index (P4 − P8) and 70 hPa index (P5 − P1) are of interest since they are associated with significant QBO anomalies arriving in the tropical and subtropical UTLS. Significant patterns in the composite differences exist at continental scale in the equatorial, tropical, and extratropical regions which are related to modulation of regional atmospheric circulations for both seasons. As in the seasonal mean fields (Fig. 2b, c), one may observe a systematic association between precipitation maxima and convergence in anomalous surface wind patterns. The differences among the four panels in Fig. 5 illustrate that the regional monsoon system response to the QBO is sensitive to both season and QBO phase.
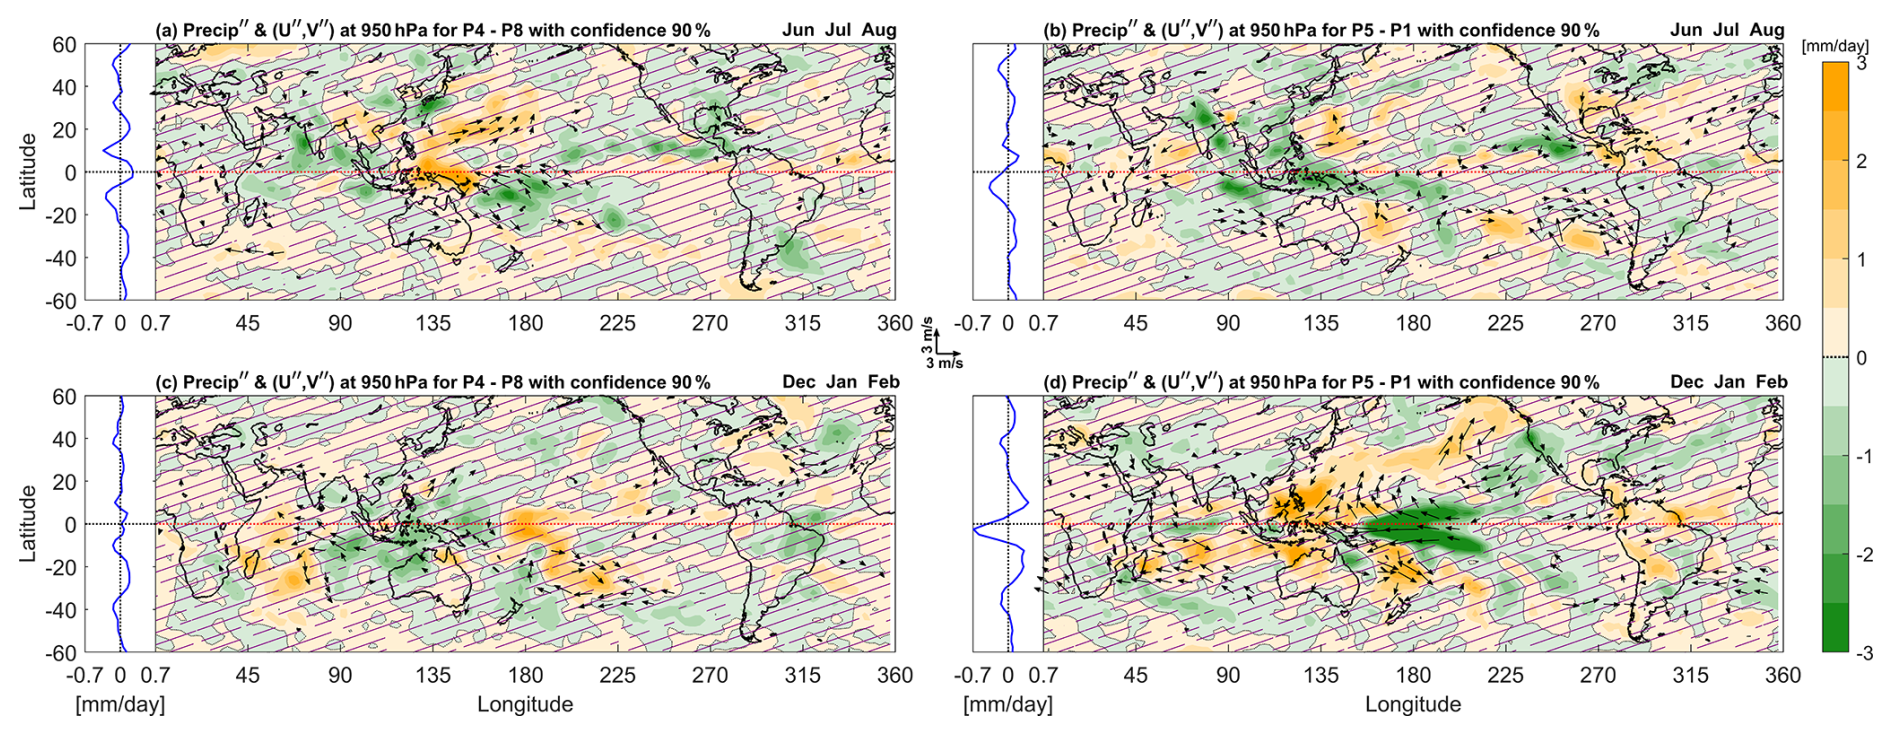
Figure 5Longitude-latitude sections of QBO composite differences in precipitation (color bar) and 950 hPa horizontal winds (vector length shown in center inset) anomalies for QBO opposite phase pairs, for (a–b) JJA and (c–d) DJF. The left column represents QBO W − E at 50 hPa (P4 − P8), while the right column represents QBO W − E at 70 hPa (P5 − P1). The latitudinal profile of zonal mean precipitation anomaly is shown to the left of each panel. Wind anomalies (U′′, V′′) are plotted if either component's statistical significance exceeds 90 %. Violet cross-hatching indicates regions of statistical significance less than 90 %.
During JJA, deep convection shifts toward Southeast Asia, away from the Maritime Continent (Fig. 2b, d) and the South Asian High dominates the circulation in the UTLS. Applying the 50 hPa index for JJA, one may see enhanced precipitation near 20° N in the longitude band ∼ 90–180° E during QBO W (Fig. 5a). This is compatible with the UTLS cold anomaly in the rising branch of the QBO MMC seen near 20° N in Fig. 3c. At the equator there is enhanced precipitation near 135° E and reduced precipitation near 80 and 170° E (Fig. 5a). The east-west dipole pattern modulates deep convection in the tropical west Pacific, which in turn affects the Pacific cell of the WC. One may interpret the pattern in Fig. 5a over the subtropical Northwest Pacific as an arc-shaped maximum during QBO W which occurs on the edge of the lower tropospheric anticyclone known as the Bonin High (Fig. 2b). This represents an equatorward shift in precipitation, with a negative anomaly over China and Southern Japan. Which is consistent with the results of Zhou et al. (2024), who showed that low precipitation preferentially occurs in the YHRB during QBO W at 50 hPa. We will provide a detailed analysis of this point in a subsequent section. The composite difference QBO W − E at 70 hPa (P5 − P1) for JJA does not show any significant anomalies in precipitation or wind vectors (Fig. 5b). However, reduced rainfall occurs over Indonesia during QBO W at 70 hPa, which is compatible with the QBO UTLS warm anomaly over the equator seen in Fig. 4c.
During DJF, convection over the Maritime Continent is more intense than during JJA and more symmetric about the equator (Fig. 2c). The SPCZ at the southeast of Indonesia is a significant zonally asymmetric region of off-equatorial heating during austral summer. The QBO W warm anomaly in the UTLS over the equator, obtained using the 50 hPa index (P4 − P8), is more robust during DJF than during JJA (compare Fig. 3d and c). This is accompanied by reduced precipitation over Indonesia (∼ 90–160° E) and in the SPCZ, with enhanced precipitation near the tropical date line (Fig. 5c). This is in agreement with previous results (Collimore et al., 2003; Tegtmeier et al., 2020; Hitchman et al., 2021). QBO W at 50 hPa implies increased static stability in the tropical UTLS when there is a QBO warm anomaly near the tropopause (Gray et al., 1992b; Giorgetta et al., 1999a). Consistent with this, Liess and Geller (2012) report a diminution of rainfall over Indonesia in DJF during QBO W. The reduced precipitation over Indonesia (Fig. 5c) is consistent with our zonal seasonal mean structure (Fig. 3d). As shown by Collimore et al. (2003), and discussed further below, there is local enhancement of the warm anomaly in the UTLS over Indonesia during DJF, compatible with the concept that convective positive feedbacks can amplify the response to QBO UTLS temperature anomalies.
During DJF, when the 70 hPa index (P5 − P1) is used, the equatorial UTLS zonal mean warm anomaly in the troposphere seen in the 50 hPa index (Fig. 3d) becomes a cold anomaly in the upper troposphere (Fig. 4d). With the pattern of QBO MMC penetrating downward into the troposphere somewhat farther, in this phase precipitation is enhanced over Indonesia and suppressed near the date line (Fig. 5d). The response of convection in the tropical West Pacific during DJF is sensitive to QBO phases. In the extratropics, there is an enhanced anticyclonic circulation over the North Atlantic for the 50 hPa index and over the Northeast Pacific for the 70 hPa index, with enhanced precipitation centered on the associated northward flow anomaly (Fig. 5c, d). The lower tropospheric regional circulations which are modulated by the QBO correspond to the NAO and PNA patterns, respectively. This highlights that QBO dynamical teleconnections occur in regions where localized atmospheric circulations are present.
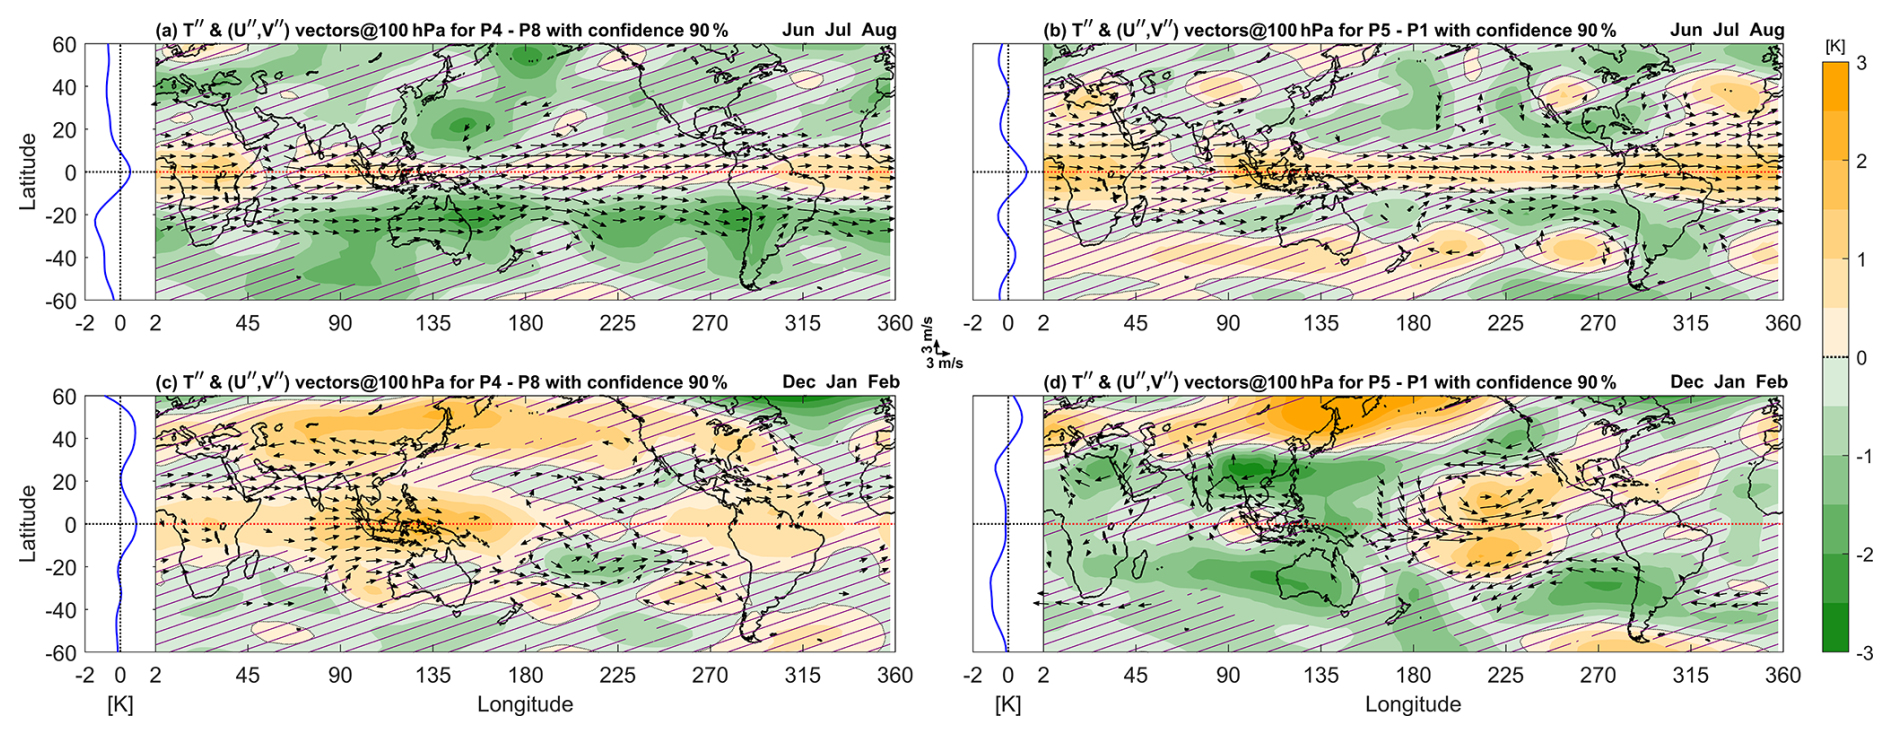
Figure 6As in Fig. 5, but for temperature T′′ (color bar) and wind vectors (U′′, V′′) at 100 hPa. The zonal mean profile of QBO temperature anomaly is shown to the left of each panel.
To explore the zonal structure of UTLS QBO anomalies, composite differences for temperature and horizontal winds at 100 hPa are shown in Fig. 6 for QBO opposite phase pairs. During JJA, anomalous QBO W winds (range ∼ 2–3 m s−1) and a warm anomaly (range ∼ 1–3 K) are found near the tropopause in a zonally-symmetric pattern along the equator. Using the 50 hPa index (P4 − P8), the QBO W zonal wind anomaly at 100 hPa is larger than it is when using the 70 hPa index (P5 − P1) (compare Fig. 6a and b). This is compatible with the downward progression and diminution of QBO W from Figs. 3a to 4a. The QBO temperature anomaly descends with time, being stronger at 100 hPa using the 70 hPa index than using the 50 hPa index (compare Figs. 3c and 4c). This is seen at 100 hPa as a narrowing of the westerlies and broadening of the temperature anomaly at the equator as the QBO MMC descend from the 50 hPa level to the 70 hPa level (compare Fig. 6a and b). This progression is also compatible with reduced equatorial precipitation as the warm anomaly enters the upper troposphere (compare Fig. 5a and b).
Note the prominent QBO cold anomaly near 20° S during JJA, as shown by Hitchman et al. (2021). It is associated with the same MMC which caused the warm anomaly over the equator (Fig. 6a, b). The subtropical winter cooling effect along the UTLS generated by the QBO MMC is stronger and more significant for the 50 hPa index (Fig. 6a). In agreement with the zonal mean structure during JJA, significant QBO negative temperature anomalies in the subtropics associated with the QBO MMC have zonally symmetric features in the winter hemisphere (Fig. 6a, b).
During JJA and using the 50 hPa QBO index, one may observe a distinct cool anomaly over the subtropical Northwest Pacific Ocean near 140° E (Fig. 6a) which extends into the Bering Sea and coincides with the region where a significant pattern was found in precipitation and wind vectors at the surface (Fig. 5a). Enhanced precipitation at the western edge of a weakened Bonin High may imply that more convective updrafts overshoot and cool the 100 hPa level in this region during QBO W. The composite difference for the 70 hPa index also shows a region of cooling in the subtropical lower stratosphere over the Central Pacific midlatitudes (Fig. 6b), although less robust than for the 50 hPa index. These results indicate that there are preferred longitude bands where the QBO can influence the extratropics along the subtropical UTLS, with subsequent modulation of extratropical surface weather.
During DJF, the tropopause in convective regions usually lies above the 100 hPa level, making it harder for QBO wind regimes to affect the 100 hPa level. QBO Wwind and warm temperature anomalies appear in the tropics at specific longitude bands (Fig. 6c, d). For the 50 hPa index, a significant QBO warm anomaly occurs over Indonesia, extending from Central Africa to the Date Line, with another warm anomaly over Amazonia (Fig. 6c). The range reaches 3 K over Indonesia where significant westerly wind vectors reside. These warm anomalies coincide with the climatological locations of deep convection, characterized by cloud top temperatures less than 192 K and low OLR emission (Collimore et al., 1998) and an easterly flow anomaly at 150 hPa, just below the tropical tropopause, consistent with a reduced WC during QBO W (cf. Figs. 18e, 19e of Hitchman et al., 2021). Similar temperature anomaly patterns were observed in cold point tropopause temperature (CPT) for the same QBO W − E phases by Hitchman et al. (2021, see their Fig. 17b). Tropical UTLS thermal anomalies are stronger during DJF, with greater geographical variation in the strength of deep convection and tropopause height. This creates a greater opportunity for QBO anomalies to preferentially affect regions with characteristically deep convection during DJF compared to JJA.
For the 50 hPa index, significant QBO W wind anomalies can be seen in the NH and SH subtropical Eastern Pacific and in the North Atlantic (Fig. 6c), which was noted as downward-extending subtropical anomalies in the zonal mean structure (Fig. 3b). Extratropical QBO warm anomalies appear near 50° N and 30° S, being stronger in the winter hemisphere, and in the eastern hemisphere (Fig. 6c). A cold anomaly can be seen at 100 hPa centered near the tip of Greenland, consistent with an amplified wave-one pattern during QBO W (Kumar et al., 2024). This North Atlantic 100 hPa temperature anomaly is related to the westward shift in the precipitation maximum (Fig. 5c). This geographical fingerprint provides useful information for evaluating whether this teleconnection operates through the stratosphere pathway in the H-T mechanism or along the subtropical UTLS. For 70 hPa index, the temperature anomaly shows a dipole pattern in the tropical Pacific and PNA regions, as was observed for the surface precipitation (Fig. 5d). The Indonesia warm anomaly changes to a cool anomaly. A wavenumber-one pattern in temperature anomaly is also evident near 60° N (Fig. 6d), similar to that observed at 50 hPa (Fig. 6c). There are also significant easterly anomalies in the STJs of both hemispheres in the Eastern Pacific when the 70 hPa level is used, resulting in a cyclonic circulation anomaly off of the west coast of North America (upper level trough), which accompanies the anticyclonic surface wind vector anomaly in Fig. 5d.
These composite differences maps illustrate the systematic, significant association between the GM system and QBO anomalies in the UTLS throughout the tropics and extratropics. The characteristic of this dynamical teleconnection is regional and is manifested where prominent localized atmospheric circulations prevail. Results are sensitive to QBO phase. In the tropics a QBO signal in precipitation is observed, which occurs in the centers of deep convection. The strongest signals are associated with modulation of the convection over the Maritime Continent and Southeast Asia and exhibit significant dependence on season and on QBO phase. The zonal mean QBO MMC causes simultaneous antiphased cold and warm anomalies in the tropical and subtropical UTLS. In the tropics, the QBO modulates regions of deep convection and therefore creates a regionally-varying signal which can also propagate into the extratropics along the UTLS. The manner in which the teleconnection signal propagates from the tropics into the midlatitudes is not fully understood but involves modulation of planetary Rossby wave radiation from tropical convective centers. Locally this can lead to changes in seasonal mean cyclonic and anticyclonic circulations in the extratropics. During NH summer the stratospheric route is disabled. Therefore, during summer the QBO can only influence the extratropics via the subtropical UTLS pathway. However, during winter a QBO teleconnection can reach the extratropical surface via either the stratospheric pathway and annular modes or via the subtropical UTLS. The rest of this study will present further information about these potential routes with their regional characteristics.
5.2 QBO dynamical teleconnection with the Northwest Pacific during JJA
In order to investigate dynamical teleconnections operating along the subtropical route during boreal summer JJA, we analyze composite climatologies of precipitation and other meteorological parameters, for QBO W and E phases at 50 hPa (P4 and P8), along with composite differences. The Northwest Pacific region (10–50° N, 120–190° E) is shown in Fig. 7. From top to bottom, rows show precipitation, 500 hPa W-wind, MLSP together with 950 hPa horizontal winds, and temperature together with horizontal winds at 100 hPa. The presence of the QBO signal is clearly visible even in the composite climatologies for QBO W and E phases (P4 and P8). During QBO E at 50 hPa, the band of precipitation which arches anticyclonically toward Alaska is enhanced south of Japan (Fig. 7b), with associated increase in mid-tropospheric upward motion (Fig. 7e). During QBO W at 50 hPa there is less precipitation along this summertime synoptic-scale storm track, more precipitation throughout the rest of the Northwest Pacific (Fig. 7a), and reduced upward motion near the southern tip of Japan (Fig. 7d). These features are more easily seen in the difference plots (Fig. 7c, f).
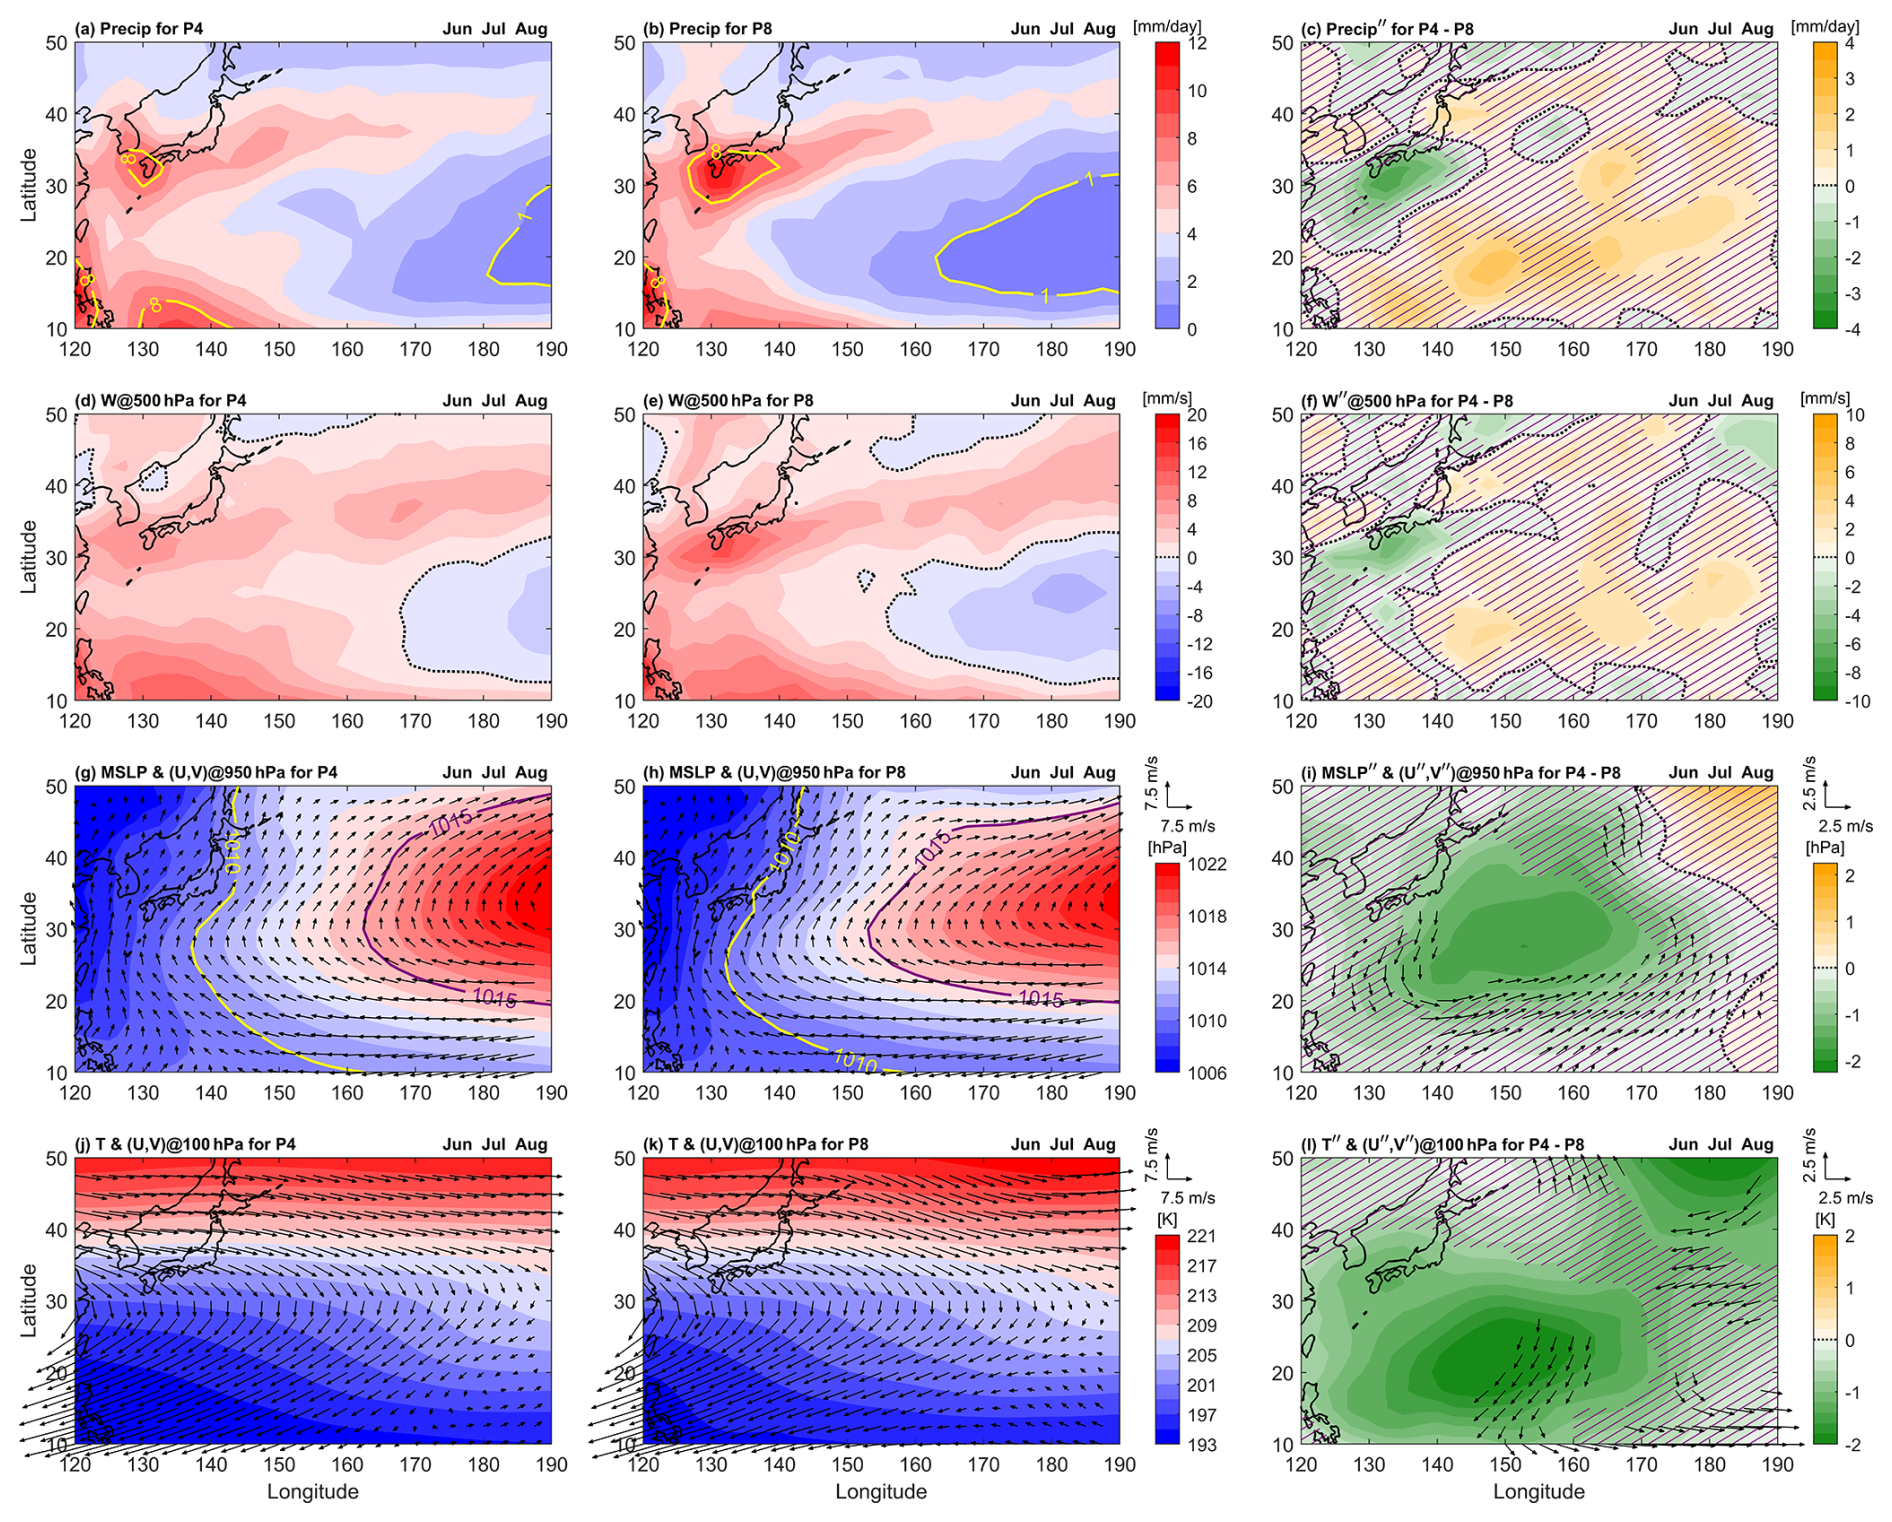
Figure 7QBO regional teleconnection manifestation in the Northwest Pacific (10–50° N, 120–190° E) during boreal summer (JJA), showing composite climatolgies of (left) QBO W at 50 hPa (P4), (middle) QBO E at 50 hPa (P8), and (right) QBO W − E at 50 hPa (P4 − P8), for (a–c) precipitation, (d–f) mid tropospheric W-wind at 500 hPa, (g–i) MLSP with (U, V) wind at 950 hPa, and (j–l) 100 hPa temperature with (U, V) wind. The violet cross hatching on the composite difference plots indicates regions of statistical significance less than 90 %. Wind anomalies (U′′, V′′) are plotted only if either component's statistical significance exceeds 90 %.
This variation in precipitation is associated with modulation of the regional circulation (Fig. 7g–l). During QBO W at 50 hPa, the lower tropospheric anticyclonic which dominates the Northwest Pacific basin is diminished (Fig. 7g), while it is enhanced during QBO E at 50 hPa (Fig. 7h), such that a negative anomaly in MSLP and cyclonic anomalous circulation are seen in the difference composite QBO W − E (Fig. 7i). During the QBO W phase the high-pressure region contracts, with isobars shifting slightly eastward (as indicated by the position of the yellow line in Fig. 7g). This shrinking of the western edge of the surface anticyclone allows for the eastward expansion of convective precipitation from south of Japan into the Northwest Pacific during QBO W. Diminution of the anticyclone is accompanied by anomalous upward motion at 500 hPa in the Northwest Pacific and decreased upward motion south of Japan during QBO W (Fig. 7f). There is a strong anticyclonic curvature of the flow near 30° N, 150° E around UTLS and this region is influenced by the northeast portion of the South Asian High (Fig. 7j–l). During QBO W at 50 hPa this circulation is stronger, with an associated cold anomaly at 100 hPa (Fig. 7j), while during QBO E this circulation is weaker and 100 hPa temperatures are not as cold (Fig. 7k). During QBO W this results in enhanced southward flow in the central North Pacific on the eastern edge of the South Asian High (Fig. 7l).
During JJA a significant QBO cold anomaly was found at 100 hPa over the Northwest Pacific during QBO W at 50 hPa, with a reduced anticyclone in MSLP and 950 hPa winds. Postel and Hitchman (1999, 2001) showed that there is a maximum in Rossby wave breaking in the UTLS (150 hPa) during JJA for this region associated with the episodic detrainment of low potential vorticity from the Tibetan High to northeastward over the Pacific. These events occur when transient synoptic waves travel along the poleward edge of the South Asian High. This regional maximum in Rossby wave breaking (RWB) was confirmed by Hitchman and Huesmann (2007) for the 350 K surface. The South Asian High appears to be more robust in its northeast quadrant during QBO W at 50 hPa. This analysis suggests that, in the UTLS pathway, the QBO can connect to surface dynamics at a regional scale via modulation of localized atmospheric circulations.
5.3 QBO teleconnections with the North Atlantic during DJF for 50 hPa index
Figure 8 is in the same format as Fig. 7, but focuses on the North Atlantic region (20–60° N, 280–350° E) for boreal winter DJF. During this season, teleconnection routes are possible via either the stratosphere, or along the UTLS, or both. For QBO W at 50 hPa (Fig. 8a), precipitation is enhanced in the western North Atlantic and diminished in the eastern North Atlantic relative to QBO E (Fig. 8b). This feature is distinctly recognizable as a significant east-west dipole in the composite difference QBO W − E (Fig. 8c). A similar east–west dipole pattern is also evident in anomalous vertical motion at 500 hPa. This reflecting a westward shift in the both precipitation and upward motion during QBO W (Fig. 8f). The variation in precipitation is closely linked to changes in the GM system circulation patterns (Fig. 8g–l). During QBO W, the dominant Azores High surface anticyclone is strengthened (Fig. 8g), with a westward shift in poleward advection of moist tropical air. This signal is quasi-barotropic, extending from the surface to the lowest stratosphere at 200 hPa (Fig. 8l). It represents a strengthening of anticyclonic flow in the North Atlantic during QBO W at 50 hPa. A stronger Azores High implies a higher index NAO and stronger flow into northern Europe (e.g., Thompson and Wallace, 2000).
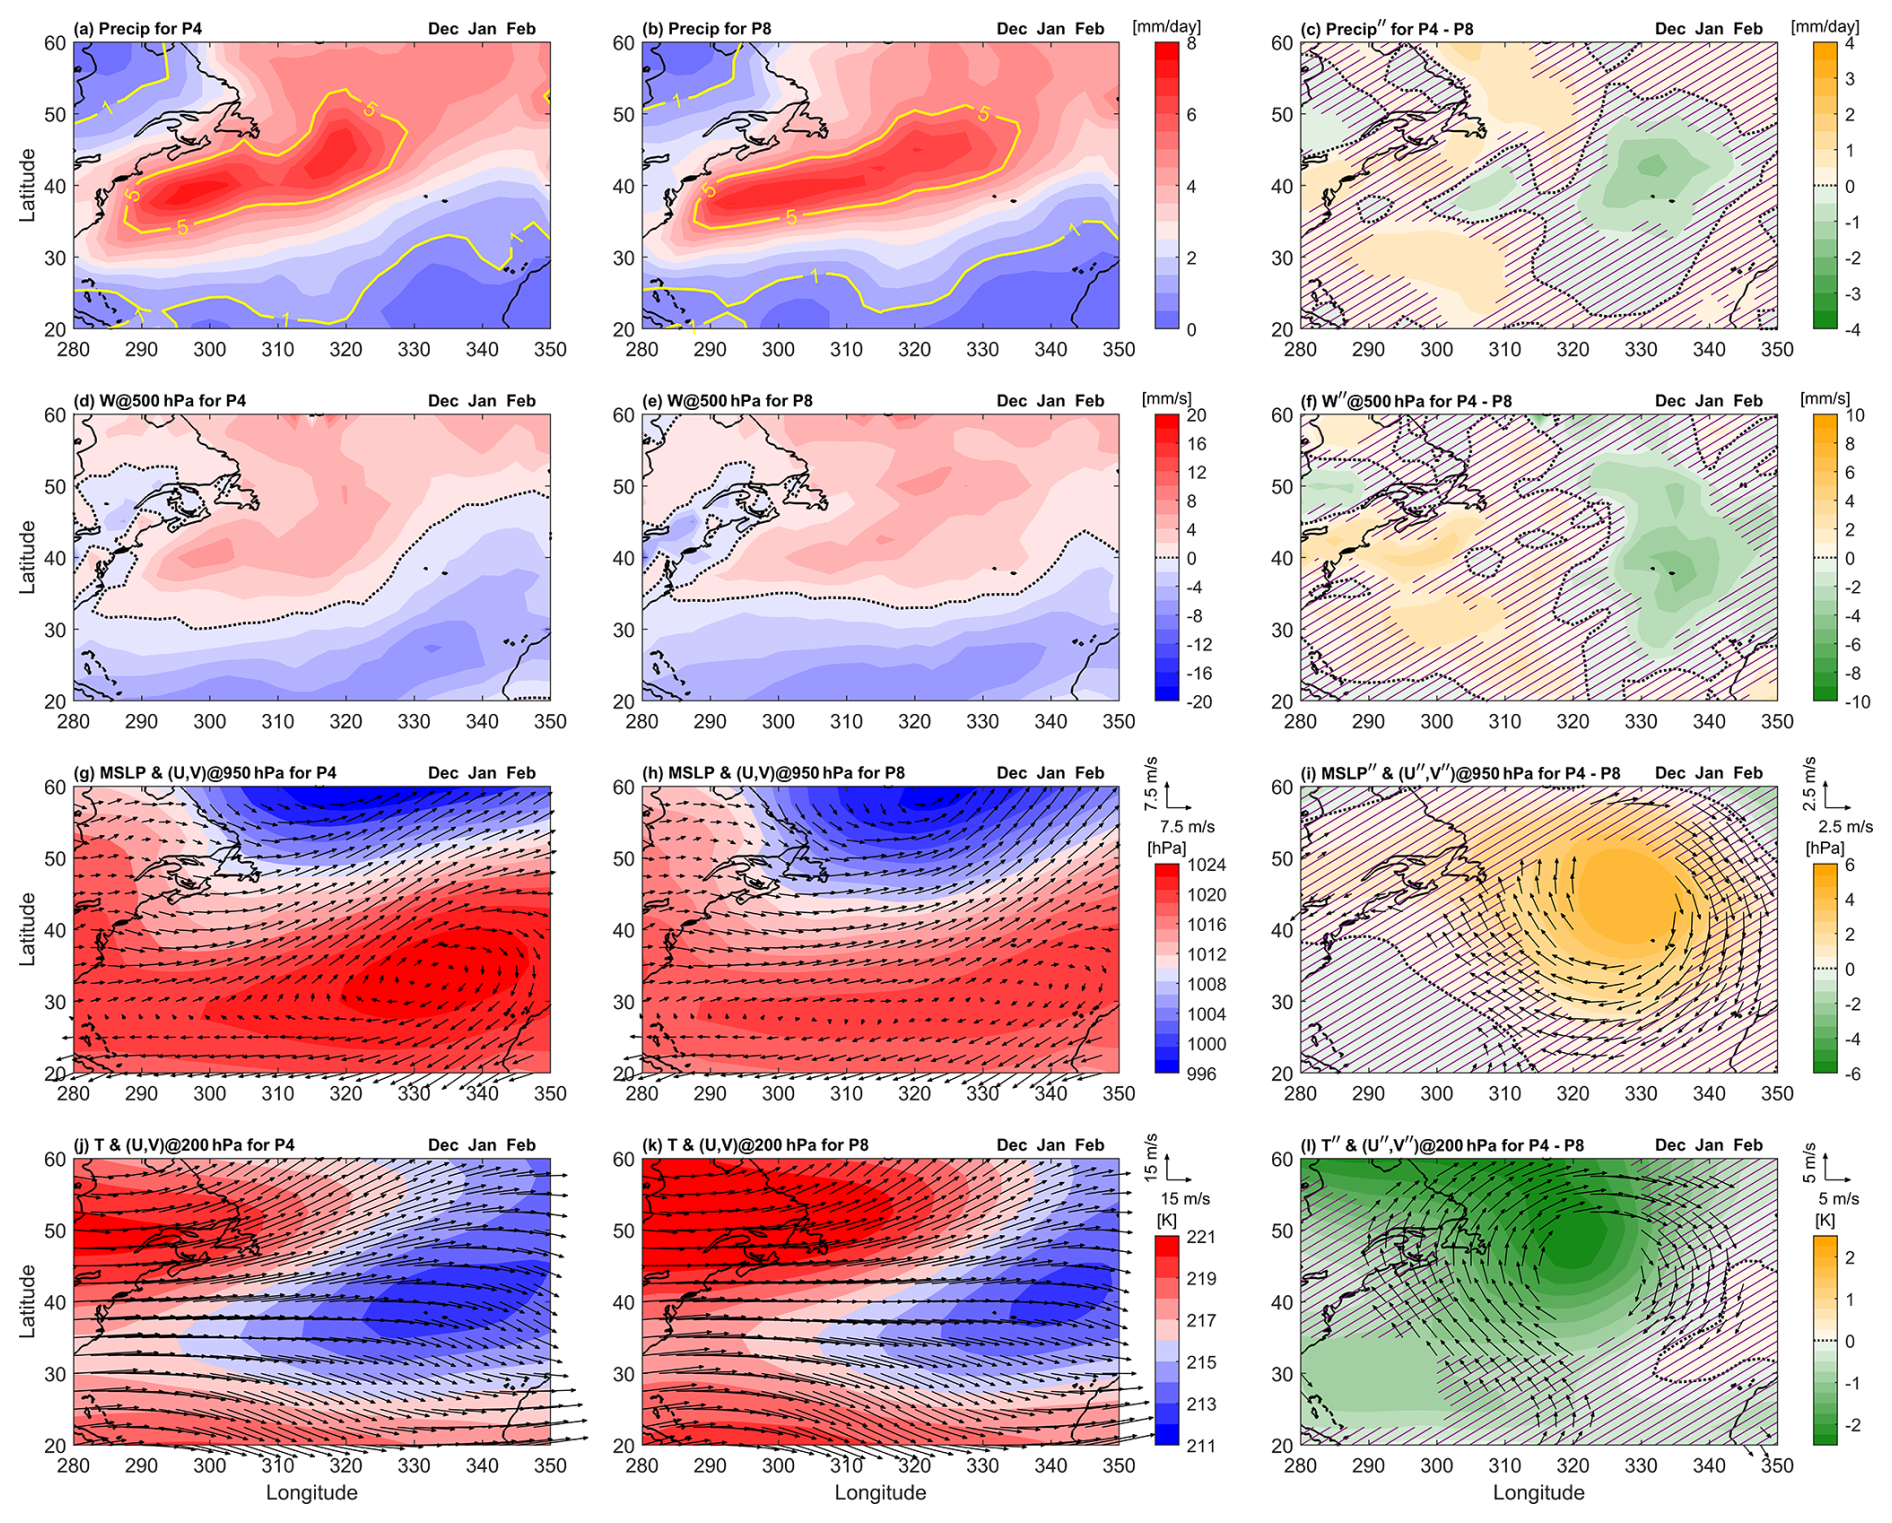
Figure 8As in Fig. 7, but for DJF and focused over the North Atlantic Ocean (20–60° N, 280–350° E).
The increased pressure in the Azores High enhances the anticyclonic circulation near the Azores, resulting in a more intense North Atlantic (NA) jet stream. This change in anticyclone creates optimal conditions for heavy precipitation in the western NA including the eastern coast of North America and lighter precipitation around the Azores High (Fig. 8a). The opposite effect is found for QBO E at 50 hPa (Fig. 8b). The composite difference QBO W − E clearly highlights this feature, showing significant anticyclonic motion in wind anomalies centered around the high pressure zone (Fig. 8i). Similar to JJA, stronger upward motion can be observed at 500 hPa over regions of enhanced precipitation (Fig. 8d–f).
In the extratropical lower stratosphere (200 hPa), temperature anomalies display significant patterns akin to those of MSLP (Fig. 8i, l). This is contrast to the situation in the Northwest Pacific during JJA, where a large surface anticyclone is centered over the Pacific and a larger anticyclone is centered over Tibet in the UTLS (Fig. 7i, l). In the North Atlantic during DJF, the structure is equivalent barotropic with a strengthened anticyclone extending upward, causing cooling of the lower stratosphere in the eastern North Atlantic during QBO W at 50 hPa (Fig. 8i, l). As discussed earlier in the seasonal DJF zonal mean structure for the 50 hPa index, these anomaly patterns may be linked to either the H-T mechanism associated with the stratospheric QBO teleconnection route, or to the route along the subtropical UTLS, or to a combination of both. The influence of the QBO is manifested where regional atmospheric circulations exist. In this case, the QBO is regionally interacting with the NAO.
5.4 QBO teleconnections with the Northeast Pacific during DJF for 70 hPa index
Figure 9 shows the same variables as in Fig. 8, but for the northeast Pacific region (20–60° N, 190–260° E) and using the 70 hPa index. During QBO W, rainfall and 500 hPa vertical motion are both enhanced from northwest of Hawaii to the Gulf of Alaska, while these are diminished along the west coast of the United States (Fig. 9c, f). Consistent with results from Sect. 5.2 and 5.3, these patterns are systematically linked with variations in the localized atmospheric circulations. Further, the spatial structure of the 500 hPa GPH anomaly composite difference patterns (Fig. S3) resemble with that of the MSLP (Fig. 8i). This supports that QBO W at 70 hPa modulates the tropospheric planetary wave pattern in this region such that a positive PNA pattern is excited, with an enhanced surface low in the Gulf of Alaska and enhanced anticyclonic flow off the west coast of California (Fig. 9i). A stronger tropospheric low in the Gulf of Alaska implies a lower tropopause, hence a warm anomaly in the lower stratosphere near 200 hPa (Fig. 9l). The effect of the QBO on the PNA is similar to that of ENSO, where QBO W at 70 hPa (or La Nina) favors more precipitation in Alaska, while QBO E at 70 hPa (or El Nino) favors more precipitation in California during DJF. Note that our analysis includes only the neutral ENSO phase. We obtain very similar patterns using the lower threshold values of ±0.4 K of the ENSO index (Fig. S4).
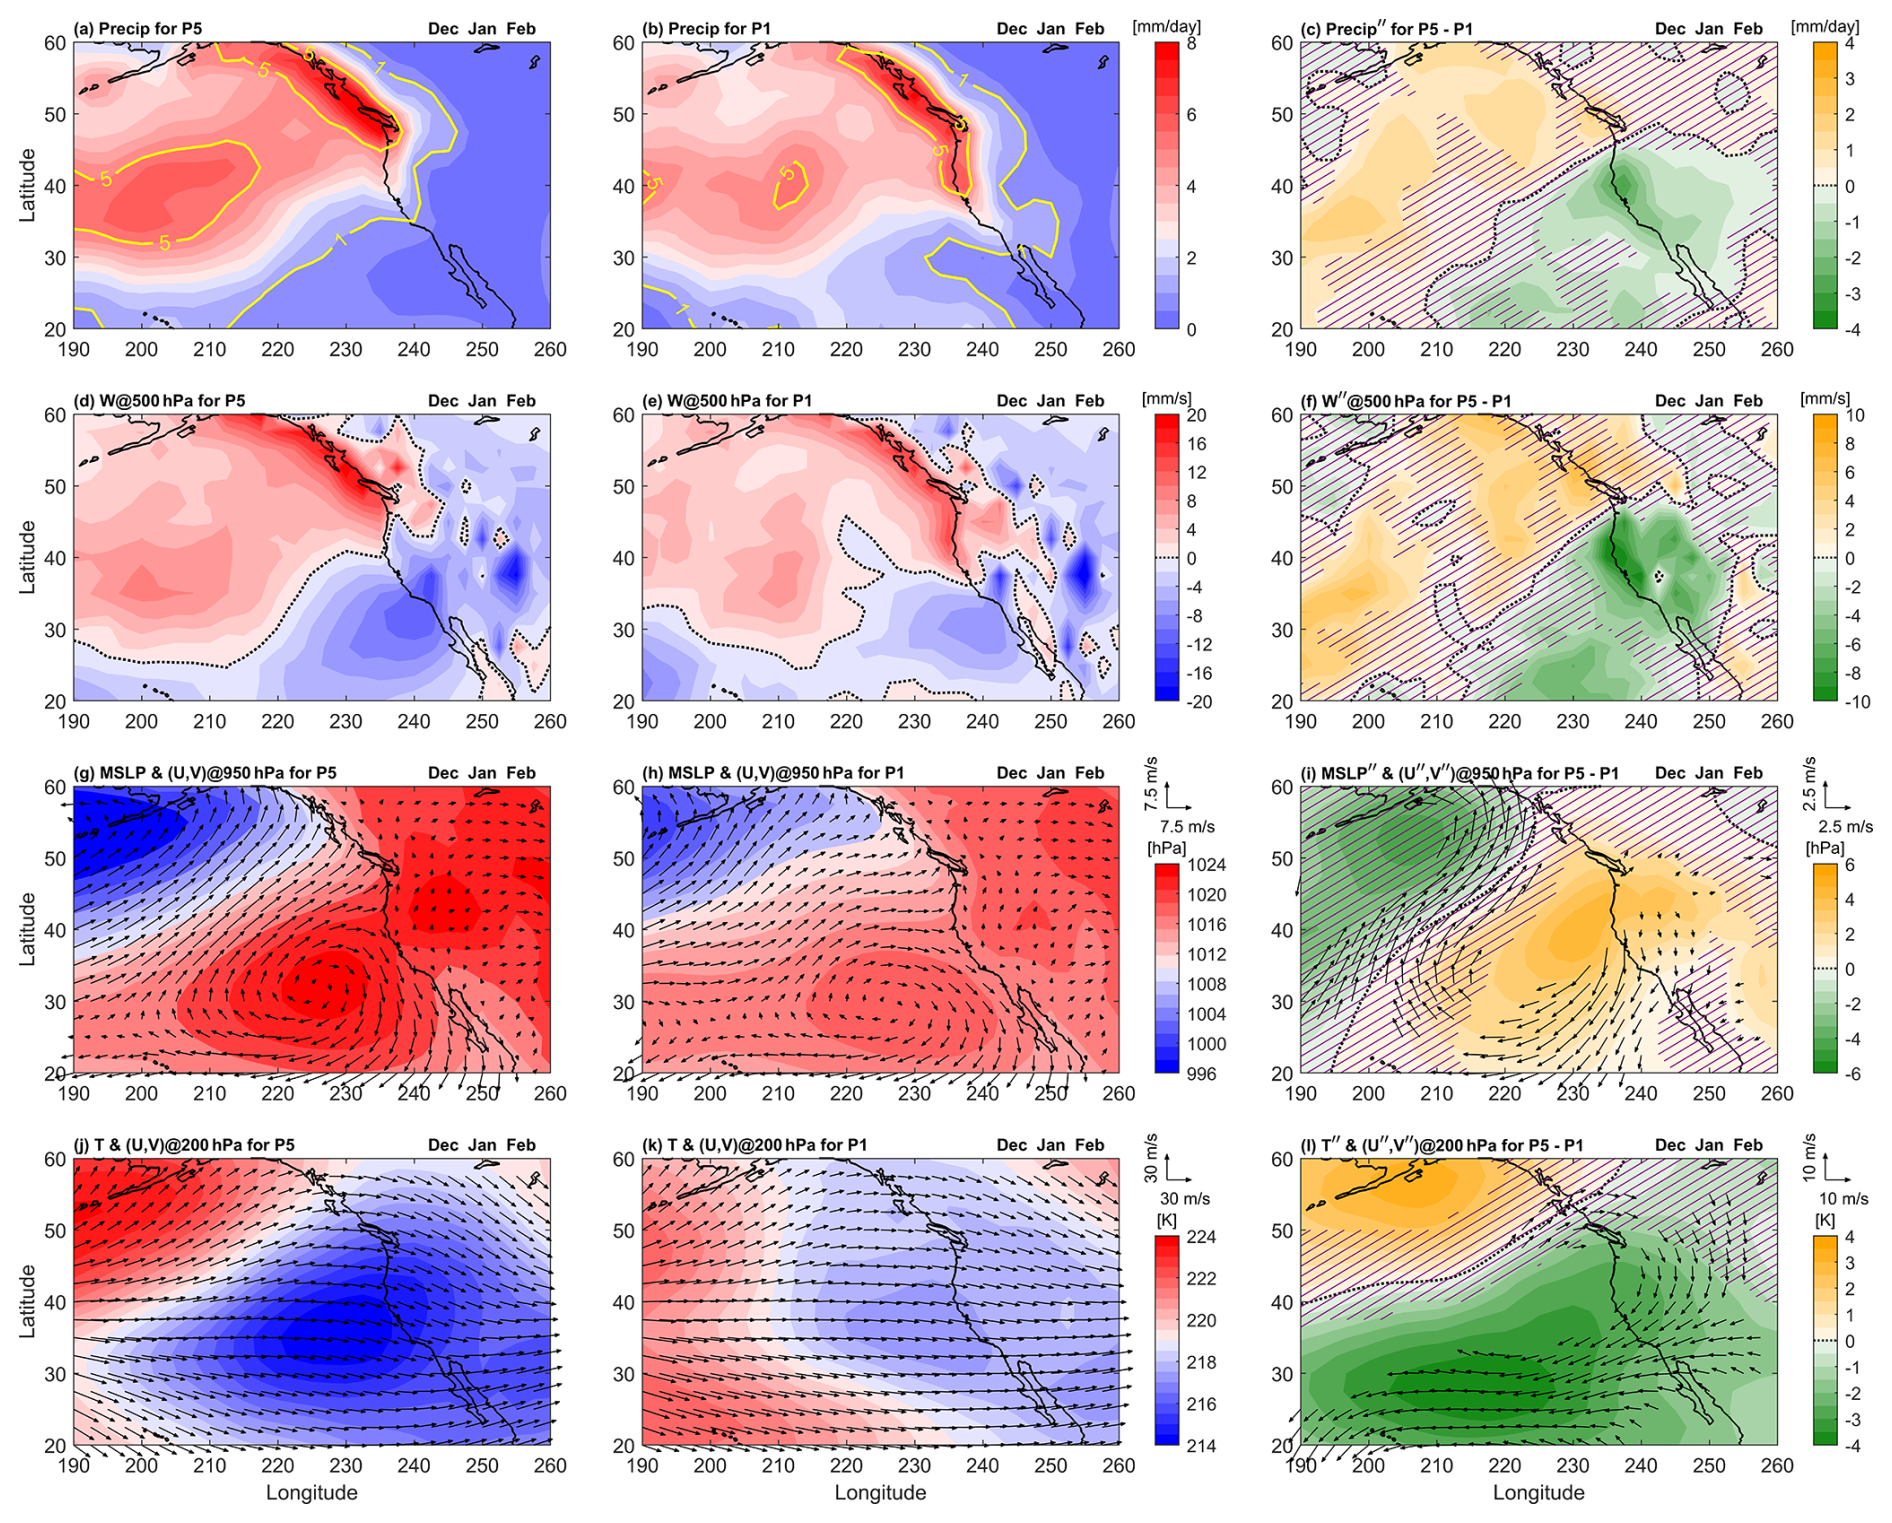
Figure 9As in Fig. 7, but focused over the Northeast Pacific region (20–60° N, 190–260° E) during DJF, for QBO W and E at 70 hPa (P5 and P1).
The above analysis suggests that the QBO has dynamical teleconnections with different parts of the GM system via modulation of regional atmospheric circulations. The anomalies in MSLP, surface winds, and precipitation patterns were found to be associated with QBO anomalies in the UTLS. To better understand the vertical structure of perturbations associated with the QBO, we analyze longitude-altitude sections of anomalies in GPH, vertical shear of zonal wind, temperature, static stability, meridional wind, and vertical wind. These analyses are averaged over selected latitude bands for the paired QBO phases at which significant composite difference patterns were observed for three regions: the Northwest Pacific during JJA, the North Atlantic Ocean during DJF, and the Northeast Pacific during DJF (Fig. 10).
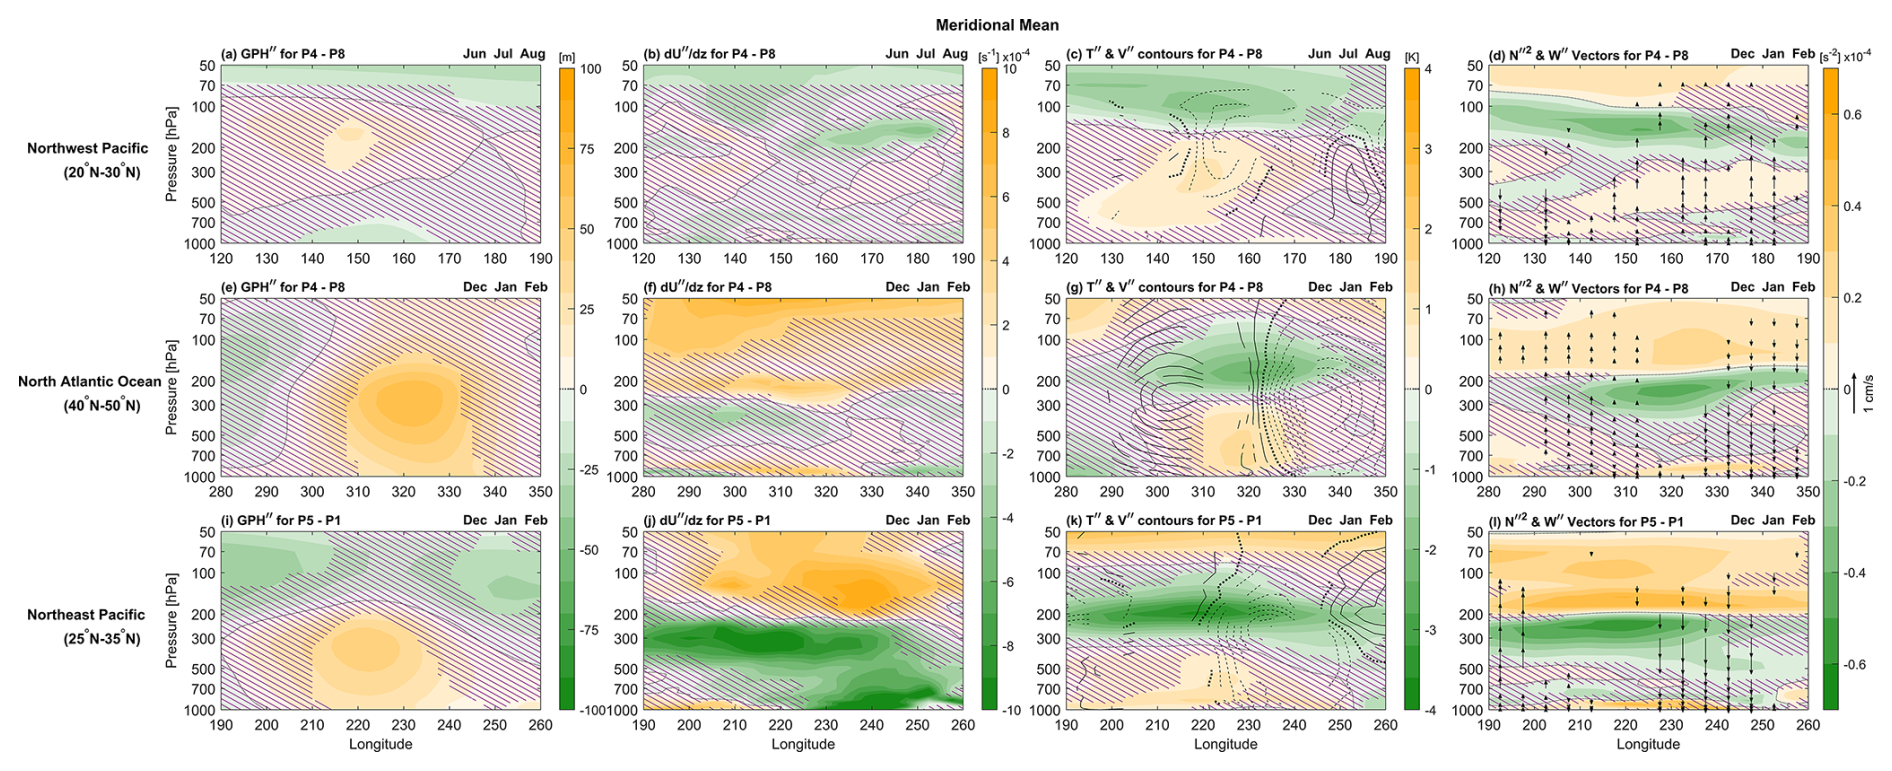
Figure 10Longitude-pressure sections of composite differences between opposite QBO phases for selected latitudinal means shown in Figs. 7, 8, and 9. The top row shows the latitudinal mean between 20 and 30° N over the Northwest Pacific (120–190° E) during JJA, the middle row shows the mean between 40 and 50° N over the North Atlantic Ocean (280–350° E) during DJF, and bottom row shows the mean between 25 and 35° N over Northeast Pacific (190 and 260° E) during DJF. The first, second, third, and fourth column of each row represent the composite difference of GPH”, vertical shear of zonal wind (), T′′ (color bar) with V′′ wind (contour lines at 0.5 m s−1), and with W′′ wind vectors, respectively. The top two rows use QBO W − E at 50 hPa (P4 − P8), and the third uses 70 hPa indices (P5 − P1). Violet cross-hatching indicates regions of statistical significance less than 90 %. The V′′ contours on the 3rd column and W′′ wind arrows on the 4th column are plotted only if either component's statistical significance exceeds the 90 %.
In the Northwest Pacific during JJA, the composite difference in GPH anomaly shows low values over the region 135–170° E (Fig. 10a), where diminution of the lower tropospheric anticyclone and strengthening of the upper tropospheric anticyclonic flow is observed during QBO W. This upper tropospheric ridging is compatible with more convection in the Northwest Pacific. Above 150 hPa, one may see the subtropical UTLS cold anomaly anomaly, which may help promote deep convection in this region during QBO W (Fig. 10c). Indeed, static stability is reduced in the layer 150–70 hPa and there is enhanced upward motion throughout the troposphere during QBO W in this region (Fig. 10d). The QBO anomaly in meridional wind shows anomalous poleward flow to the west and equatorward flow to the east of this enhanced anticyclonic flow in the UTLS during QBO W (Fig. 10c). This represents an amplification of the time mean flow in the RWB surf zone to the northeast of the South Asian High (Postel and Hitchman, 1999).
Zhou et al. (2024) analysed the QBO meridional structure averaged over 120–160° E for JJA and showed that during QBO W at 50 hPa there are regional zonal wind anomalies in the troposphere in the band 30–40° N. This corresponds to an equatorward shift in the STJs during QBO W, which coincides with reduced moisture transport and convergence, leading to lower rainfall extremes in the YHRB. Gao et al. (2023) described these results in terms of a regional QBO MMC anomaly. Our results confirm low precipitation over this region for QBO W at 50 hPa, but these features are not limited to the YHRB, having broader spatial domains spanning the Northwest Pacific. But during the boreal summer, the planetary waves are relatively weak and there is large region of convection over Southeast Asia. Also, the STJ is displaced northward in that longitude band and there is a huge anticyclone in the upper troposphere in this region. Here we interpret the regional response as a direct influence of the QBO zonal mean UTLS cold anomaly in the subtropical NH on promoting deep convection. In our analysis, we found a regional cool anomaly in the upper troposphere over the Northwest Pacific during QBO W at 50 hPa. This is related to enhanced deep convection in the Southeast Asian monsoon, the northeastward expansion of the South Asian High in the upper troposphere, and diminution of the surface anticyclone over the Northwest Pacific. These changes result in reduced upward motion and precipitation over the southern tip of Japan and enhanced upward motion and precipitation over the Northwest Pacific. It is possible to call this a local MMC anomaly, where the polarity is rising over the Northwestern Pacific and sinking over Japan during QBO W at 50 hPa, but the underlying cause for this apparent local circulation is more complex.
Considering the zonal mean temperature anomalies in Fig. 3c and non-zonal in Fig. 6a for the QBO MMC, one may see a QBO cold anomaly all along the subtropical UTLS during QBO W at 50 hPa, which accompanies the warm anomaly over the equator. This subtropical cold anomaly might be expected to enhance precipitation in a zonally-symmetric pattern, since there is a decrease in static stability in the subtropical UTLS across Asia and the Northwest Pacific, from 120 to 180° E (Fig. 10c). This would encourage more deep convection over the Northwest Pacific relative to over land along the east coast of Asia during QBO W. Another aspect of this system which may be important in this context is that deep tropical convection is suppressed over Indonesia during QBO W, which implies reduced subtropical downwelling. The lower tropospheric anticyclone which dominates the circulation east of Japan during summer (the Bonin High; Enomoto et al., 2003) is one region of subsidence. With reduced convection in the adjacent tropics, one might expect a reduction in subsidence and strength of the Bonin High. In our analysis, the reduced subtropical downwelling is evident as a significant upward W-wind anomaly accompanied by notable meridional wind contours, suggesting a weakening of the region of subsidence over east of Japan (Fig. 10c, d). This phenomenological perspective supports the mechanism that UTLS static stability plays a key role in regulating deep convection over the Northwest Pacific region. Hu et al. (2024) also concluded that temperature anomalies near the tropopause and upper tropospheric static stability make major contributions to deep convection over the northern South China Sea.
To see other possible routes for QBO dynamical teleconnection, potentially through the polar or extratropical region, orthographic NH polar projections (0–90° N) of GPH′′ at 50 hPa, along with 200 hPa tropospheric temperature, MSLP, and precipitation, are shown in Fig. S5 for JJA. None of the panels exhibit any other possible routes for QBO teleconnections at the 50 hPa level (2nd column, Fig. S5) or even at 70 hPa (3rd column, Fig. S5), because quasi-stationary planetary wave activity between the equator and polar regions remains very low during the summer monsoon season when stratospheric winds are easterly (Chen et al., 2005). The orthographic polar projections also highlight the localized characteristics of the QBO MMC subtropical UTLS route over the Northwest Pacific, as previously discussed.
During DJF, the nature of dynamical teleconnection remains intact across QBO phases (50 to 70 hPa), but the geographical location for surface linkage changes. For both the North Atlantic and Northeast Pacific, significant positive GPH anomalies prevail in the troposphere, but the Atlantic anticyclonic anomaly extends upward above 300 hPa (Fig. 10e, i). The locations of these anomalies coincide with the locations of the anticyclonic MSLP anomalies in Figs. 8i and 9i. In both regions there is a negative wind shear anomaly in the troposphere and a positive shear anomaly in the lower stratosphere (Fig. 10f, j), but with significantly larger magnitudes over the Northeast Pacific. During DJF, we found a regional cool anomaly in the upper troposphere off the coast of California, with a warm anomaly in the Gulf of Alaska during QBO W at 50 hPa (Fig. 9l). The cold anomaly at 25–35° N may be seen in Fig. 10k. The vertical structure of QBO temperature anomalies is similar in both the Atlantic region and off the coast of California, with a cold anomaly in the lower stratosphere (above 300 hPa) and warm anomaly throughout the troposphere (Fig. 10g, k). This implies changes in static stability, with a decrease below 200 hPa and an increase above (Fig. 10h, l). For the Atlantic, these anomalies during QBO W are accompanied by anomalous rising poleward motion at western sector and equatorward sinking motion at eastern sector with upward and downward motion, respectively (Fig. 10g, h, k, l). During DJF, between 40 and 50° N in the North Atlantic, the climatological vertical motion field exhibits marginal ascent over the oceanic eastern sector and marginal subsidence over the continental western sector (see Fig. 2a of Schwendike et al., 2014). Therefore, QBO W at 50 hPa reduces the contrast between these ascending and descending branches. The static stability patterns over both the North Atlantic and Northeast Pacific do not show any consistent relationship with the vertical wind field across all longitudes, as observed over the Northwest Pacific region, but during a different season (JJA). It is also noted that both the temperature and stability patterns occur at lower levels compared to the Northwest Pacific. A straightforward interpretation of changes in static stability and vertical motion is that they are consistent with QBO modulation of the long-wave pattern, rather than invoking a primary feedback role for static instability, such as during JJA over East Asia. This suggests that the role of static stability in modulating vertical motions and convection depends on regional dynamics that vary across seasons.
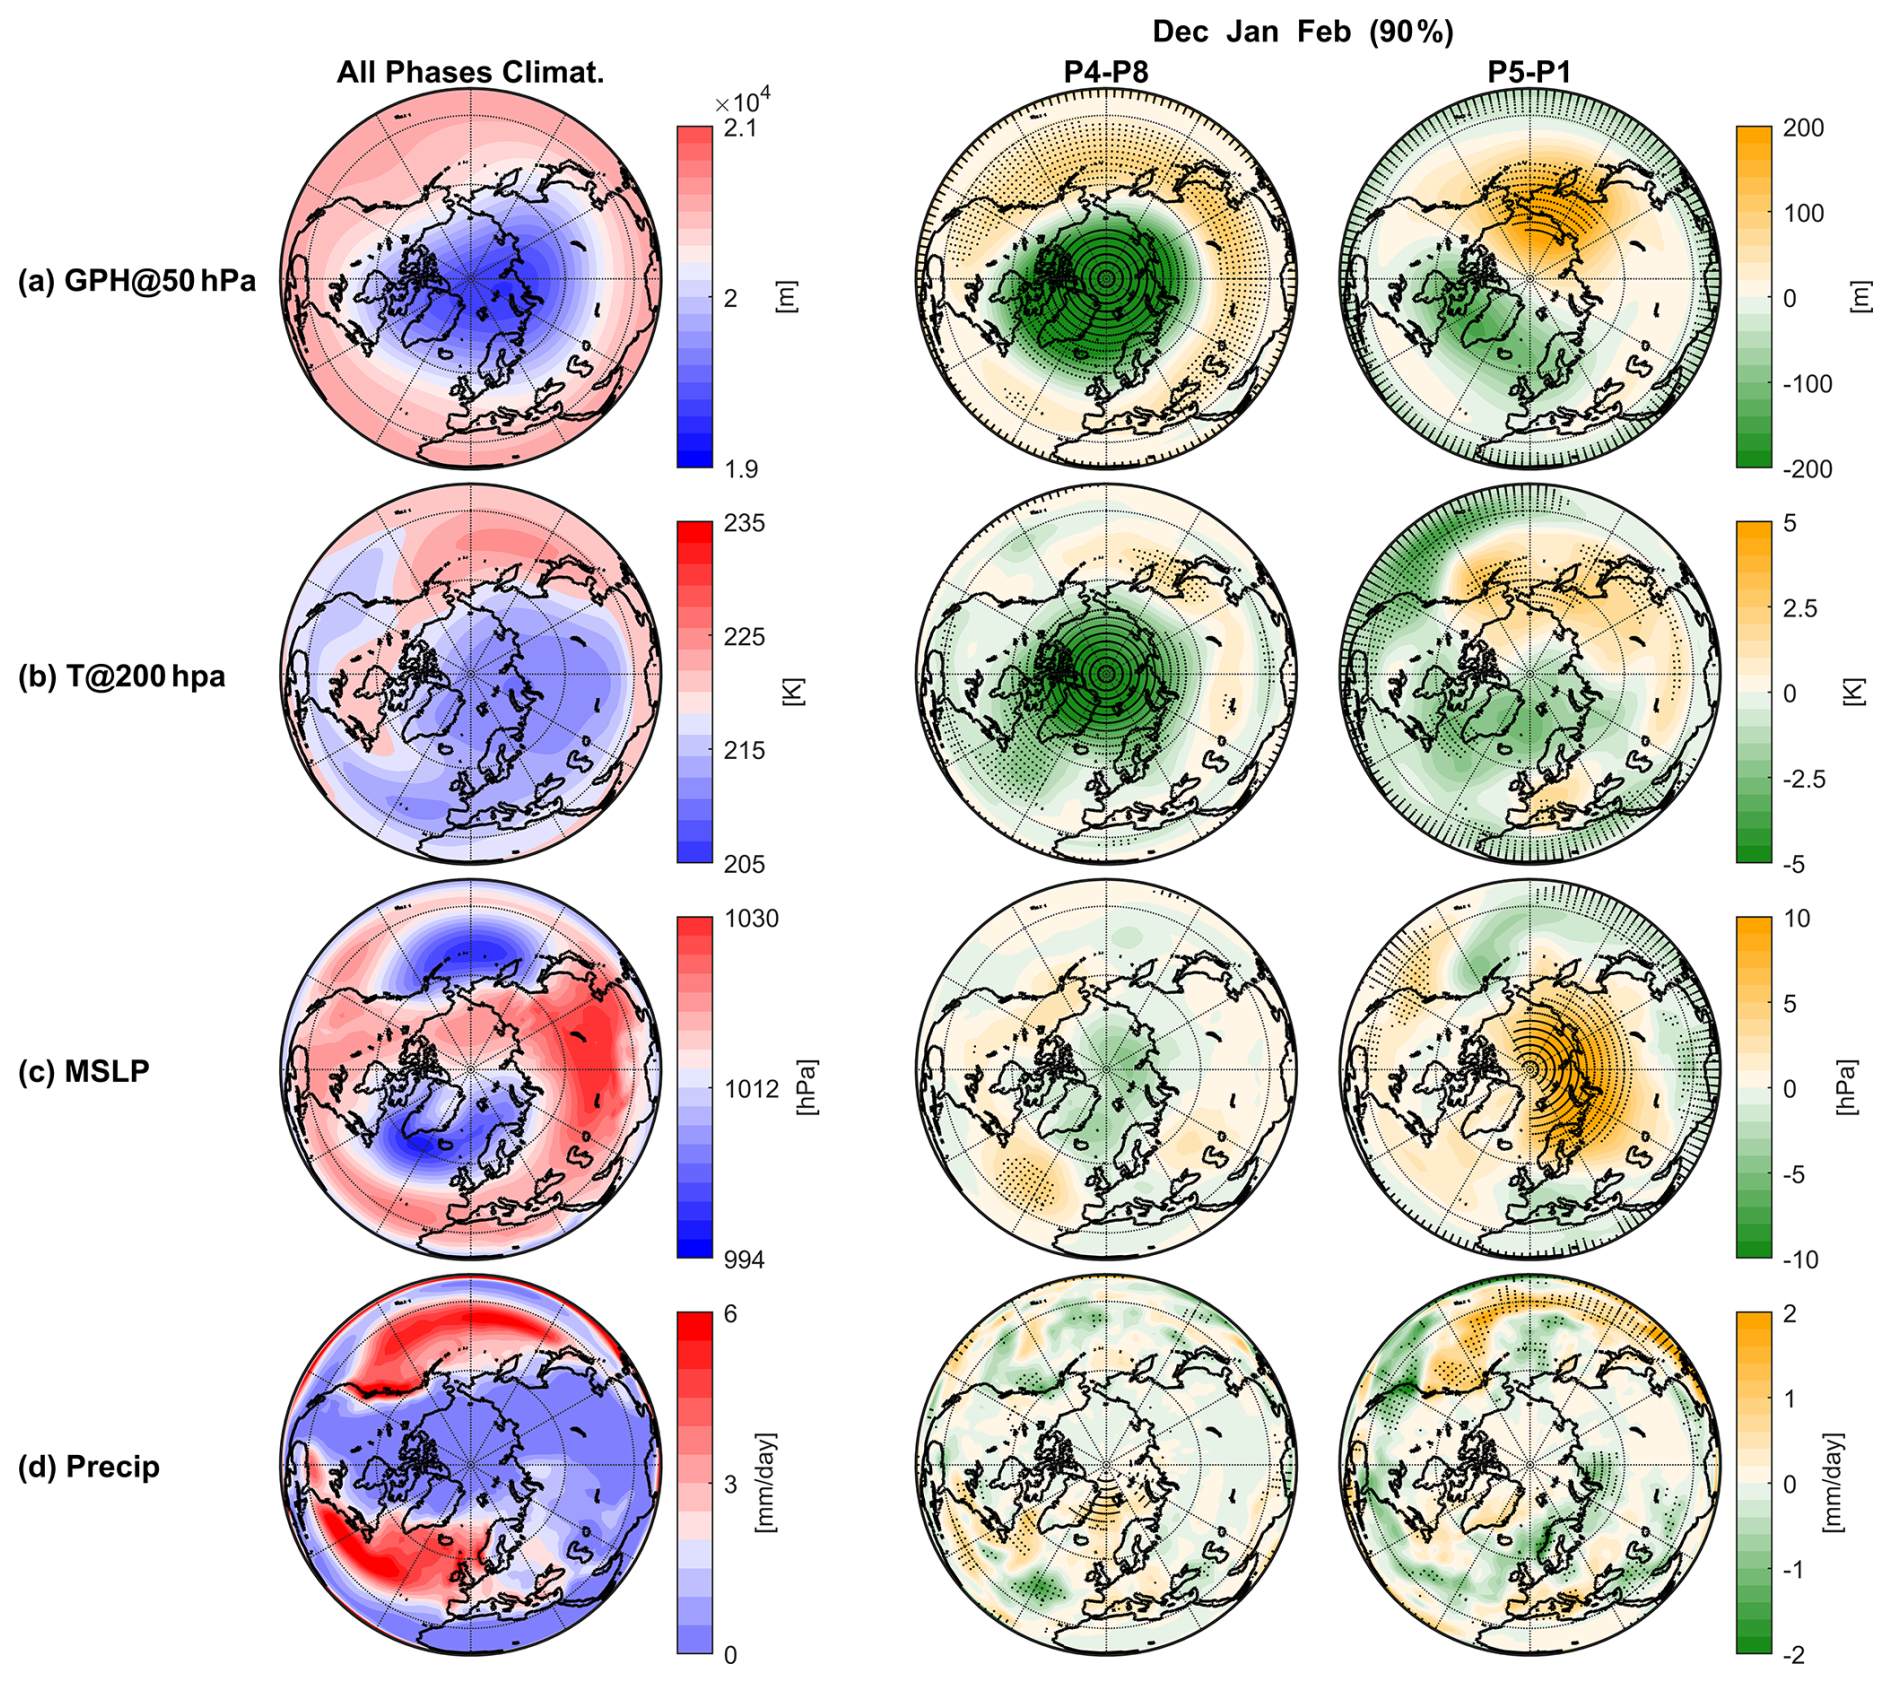
Figure 11NH orthographic polar projections (10–90° N) of (a) 50 hPa GPH, (b) T at 200 hPa, (c) MSLP, and (d) precipitation, showing the climatology and anomalies of composite differences between QBO opposite phases during DJF and neutral ENSO. The first, second, and third, columns of each row represent the climatological mean, QBO W − E at 50 hPa (P4 − P8), and QBO W − E at 70 hPa (P5 − P1), respectively. Black dots on the both composite difference plots highlight regions where statistical significance exceeds 90 %.
To better understand QBO teleconnections during DJF, we also examined orthographic NH polar projections (0–90° N) of GPH′′ at 50 hPa, along with 200 hPa temperature, MSLP, and precipitation (Fig. 11. Over the Arctic Circle (> 60° N), significant composite differences, QBO W − E (P4 − P8), are seen in GPH′′ at 50 hPa, indicative of a deeper polar vortex during QBO W than QBO E (2nd column Fig. 11a). This annular mode structure is part of the teleconnection pathway originally known as the QBO stratospheric route, or H-T Mechanism. The lower stratospheric T′′ anomalies at 200 hPa are somewhat similar to those at 50 hPa GPH′′ (2nd column Fig. 11b), consistent with a deeper and cooler polar vortex during QBO W. MSLP′′ also shows a low anomaly over the pole, but it is not significant (Fig. 11c). However, the amplification of the Azores High and reduction in rainfall over the North Atlantic during QBO W are significant (Fig. 11c, d). The NAO and polar vortex are linked by annular mode structures (Kodera et al., 1999; Kumar et al., 2022). The QBO-NAO teleconnection may result from tropospheric eddies interacting with barotropic annular anomalies (Kushner, 2010). This can result in latitudinal displacement of the STJs (Fig. 3b). Factors which can affect the response include nonlinear interaction between the STJ and polar night jet (PNJ) (Kushner and Polvani, 2004) and the presence or absence of strong zonal asymmetries (Gerber and Polvani, 2009). The relationship between zonal mean QBO anomalies associated with the QBO MMC and regional circulations is complex, with distinctly different responses of the local STJs over the Pacific and Atlantic during DJF (Kumar et al., 2022). However, a detailed mechanism for the NAO- QBO dynamical teleconnection is still unclear and needs to be explored in the future.
For the 70 hPa index pair P5 − P1 statistically significant QBO modulation is found in the Northeast Pacific (Fig. 11, right-hand column). The composite difference QBO W − E for GPH′′ does not reflect any annular mode structure. This may argue against the H-T mechanism but it is possible for annular modes to interact with the flow to yield a large ridge over the North Pacific. It is also highly possible that the PNA pattern is altered via the UTLS pathway, which leads to a stronger Aleutian High. Climatologically, during DJF the Aleutian High tilts westward with height from the troposphere into the upper stratosphere and mesosphere (Harvey and Hitchman, 1996). This wavenumber-one pattern (3rd column in Fig. 11a), consists of an amplified Aleutian High over the Pacific and trough over the North Atlantic. Although the trough anomaly is not highly significant, the Aleutian High anomaly is. The lower stratospheric temperature patterns at 200 hPa are consistent with GPH′′, where a warm anomaly underlies the Aleutian High amplification over the North Pacific and a cold anomaly underlies the trough over the North Atlantic. When the 70 hPa index is used during DJF one may also see a strongly amplified Siberian High in the high latitude sector 0–180° E and reduced precipitation in Northern Eurasia (Fig. 11c, d, 3rd column).
One of the possible mechanisms for the QBO–PNA teleconnection is modulation of the planetary wave train emanating from tropical convection centers along the UTLS pathway (Kumar et al., 2024). They showed that enhanced EP flux convergence in the high latitudes during QBO W at 70 hPa. Increased extratropical stratospheric EP flux convergence favours a low index annual mode for both the SH and NH (Polvani et al., 2010; and Fig. 6 of Kumar et al., 2024). Our results also support the idea that the UTLS pathways involves modulation of the annular mode, whose primary response is a north -south displacement of the midlatitude jet in a dipole pattern (cf. Plate 4 in Kushner et al., 2001; and Fig. 4 of Kumar et al., 2024).
This study presented a brief overview of the GM system using global monthly mean ERA-5 reanalysis data from 1979 to 2020. We focussed on possible teleconnections between the stratospheric QBO and different monsoon systems at the global scale for neutral to moderate ENSO conditions, in the absence of extreme El Niño and La Niña events. We explored modulation of regional circulations during two different seasons – boreal summer JJA, and austral summer DJF. Teleconnections were found to vary with season, and to be sensitive to QBO phase. In boreal summer, the subtropical UTLS cold anomaly associated with the MMC during QBO W enhances precipitation associated with the Asian monsoon, spreading eastward over the Northwest Pacific. We also found significant modulations of precipitation patterns in the North Atlantic and Northeast Pacific during DJF.
In the tropics during JJA, the QBO influences deep convection and modulates the WC. QBO W at 50 hPa is accompanied by enhanced precipitation near 135° E at the equator, which is connected to the region of enhanced precipitation over the subtropical Northwest Pacific. When the QBO W anomaly penetrates deeper in the UTLS (70 hPa index), precipitation is suppressed near 135° E at the equator. This is to be expected in the presence of a large warm anomaly at the tropopause over the Maritime Continent. A route along the subtropical UTLS was observed as modulation of circulations over the Northwest Pacific by QBO MMC temperature anomalies, which impacted precipitation in a large region extending from China to the Western Pacific. It is confirmed that QBO W at 50 hPa brings reduced precipitation over the YHRB region (Zhou at el., 2024). These features were not confined to this region alone, rather, they extended across broader spatial domains, from Japan to the northwestern Pacific Ocean. QBO W at 50 hPa favors a shift in rainfall from the tip of Japan eastward toward a diminished Bonin high. The opposite effects were observed during the QBO E phase. These patterns can be understood in terms of a regional response to zonally symmetric temperature anomalies associated with the QBO MMC in the subtropical region that prevailed from Northeast Asia to North Pacific region, together with diminution of the Lagrangian overturning circulation between reduced deep convection over the Maritime Continent and a reduced equivalent-barotropic Bonin High. From our analysis we infer that, during JJA over East Asia, QBO MMC temperature anomalies around the tropopause in the subtropical region affect UTLS static stability and modulate deep convection, rather than modulating synoptic wave interaction with the STJs.
During DJF, QBO influence on convection in the tropical West Pacific is sensitive to QBO phase in the UTLS. For QBO W at 50 hPa, consistent with negative feedback on deep convection, a warm anomaly near the tropopause over Indonesia is accompanied by reduced precipitation over Indonesia (∼ 90–160° E) and in the SPCZ, with enhanced precipitation near the tropical date line. On the contrary, for QBO W at 70 hPa, when the QBO anomaly penetrates downward into the troposphere somewhat farther, the warm anomaly near the tropopause over Indonesia changes into a cool anomaly that is compatible with amplifying the convective positive feedbacks. This leads to a “reversed” precipitation pattern, with enhanced values over Indonesia and suppressed values near the date line.
During DJF, the presence of QBO teleconnection routes along the subtropical UTLS and stratospheric-polar routes were evident through the modulation of precipitation in the extratropics. QBO modulation of tropical deep convection alters the planetary wave train pattern emanating from the tropics to extratropic along the UTLS, rather than invoking a primary feedback role for static instability, such as during JJA over East Asia. In the North Atlantic region, QBO W at 50 hPa favors a positive NAO index. This, in turn, enhances the anticyclonic circulation associated with the Azores High, resulting in a more intense NA jet stream and shifts the precipitation maximum westward toward the east coast of North America away from around the Azores High. QBO W at 70 hPa promotes a positive PNA phase, which intensifies the mid-latitude northeastward flow over the Pacific Ocean. This brings above average precipitation to southern Alaska and below average precipitation on the west coast of the United States. The opposite effects occur for QBO E. On the basis of the current analysis, it is difficult to discern the exact mechanism for these linkages, as most analysis focused on phenomenological descriptions. However, the QBO-NAO linkage may be understood in term of the H-T mechanism associated with the QBO polar route. The NAO and polar vortex have a stronger dynamical connection (Kodera et al., 1999; Kumar et al., 2022). A deeper polar vortex was observed for QBO W than QBO E, affecting the annular mode structure. Another possible mechanism for this linkage may be QBO displacement of the STJs. The QBO-PNA linkage may be due to changes in the pattern of planetary wave radiation along great circle routes from seasonal monsoon system convective centers via the UTLS pathway, with enhanced EP flux convergence in the high latitudes (Kumar et al., 2024). Further detailed investigations are necessary to understand the precise mechanisms operating in the QBO-NAO and QBO-PNA teleconnections.
All data used in this study are openly accessible for the public. The ERA-5 data set is available online at https://cds.climate.copernicus.eu/datasets (last access: June 2025). The OLR data is available online at https://psl.noaa.gov/data/gridded/data.olrcdr.interp.html (last access: December 2023). The GPCC data is available online at https://psl.noaa.gov/data/gridded/data.gpcc.html (last access: August 2025). The HadISST data set is available online at https://www.metoffice.gov.uk/hadobs/hadisst/data/download.html (last access: June 2025).
The supplement related to this article is available online at https://doi.org/10.5194/acp-26-4547-2026-supplement.
VK and SY jointly worked on the research design and methodology. VK analyzed the all data and wrote the first draft of the paper. MHH, SY, TT, and KI contributed to the conceptualization, review, and edited the draft. MHH also contributed significantly to the discussion section.
The contact author has declared that none of the authors has any competing interests.
Publisher's note: Copernicus Publications remains neutral with regard to jurisdictional claims made in the text, published maps, institutional affiliations, or any other geographical representation in this paper. The authors bear the ultimate responsibility for providing appropriate place names. Views expressed in the text are those of the authors and do not necessarily reflect the views of the publisher.
The authors would like to thank all members of the ERA5 reanalysis, HadISST, GPCC, and NOAA teams for their efforts in making these datasets available online.
This paper is based on achievements of the collaborative research project (2025IG-04) of the Disaster Prevention Research Institute of Kyoto University.
This research has been supported by the Disaster Prevention Research Institute, Kyoto University (grant no. 2025IG-04).
This paper was edited by Michael Byrne and reviewed by two anonymous referees.
Adler, R. F., Huffman, G. J., Chang, A., Ferraro, R., Xie, P., Janowiak, J., Rudolf, B., Schneider, U., Curtis, S., Bolvin, D., Gruber, A., Susskind, J., and Arkin, P.: The Version 2 Global Precipitation Climatology Project (GPCP) Monthly Precipitation Analysis (1979–Present), J. Hydrometeor., 4, 1147–1167, 2003.
Adler, R. F., Sapiano, M. R. P., Huffman, G. J., Wang, J.-J., Gu, G., Bolvin, D., Chiu, L., Schneider, U., Becker, A., Nelkin, E., Xie, P., Ferraro, R., and Shin, D.-B.: The Global Precipitation Climatology Project (GPCP) Monthly Analysis (New Version 2.3) and a Review of 2017 Global Precipitation, Atmosphere, 9, 138, https://doi.org/10.3390/atmos9040138, 2018.
An, Z., Wu, G., Li, J., Sun, Y., Liu, Y., Zhou, W., Cai, Y., Duan, A., Li, L., Mao, J., Cheng, H., Shi, Z., Tan, L., Yan, H., Ao, H., Chang, H., and Feng, J.: Global Monsoon Dynamics and Climate Change, Annu. Rev. Earth Planet. Sci., 43, 29–77, https://doi.org/10.1146/annurev-earth-060313-054623, 2015.
Baldwin, M. P., Gray, L. J., Dunkerton, T. J., Hamilton, K., Haynes, P. H., Randel, W. J., Holton, J. R., Alexander, M. J., Hirota, I., Horinouchi, T., Jones, D. B. A., Kinnersley, J. S., Marquardt, C., Sato, K., and Takahashi, M.: The quasi-biennial oscillation, Reviews of Geophysics, 39, 179–229, https://doi.org/10.1029/1999RG000073, 2001.
Biasutti, M., Voigt, A., Boos, W. R., Braconnot, P., Hargreaves, J. C., Harrison, S. P., Kang, S. M., Mapes, B. E., Scheff, J., Schumacher, C., Sobel, A. H., and Xie, S.-P.: Global energetics and local physics as drivers of past, present and future monsoons, Nature Geoscience, 11, 392–400, https://doi.org/10.1038/s41561-018-0137-1, 2018.
Bordoni, S. and Schneider, T.: Monsoons as eddy-mediated regime transitions of the tropical overturning circulation, Nature Geoscience, 1, 515–519, https://doi.org/10.1038/ngeo248, 2008.
Brönnimann, S., Malik, A., Stickler, A., Wegmann, M., Raible, C. C., Muthers, S., Anet, J., Rozanov, E., and Schmutz, W.: Multidecadal variations of the effects of the Quasi-Biennial Oscillation on the climate system, Atmos. Chem. Phys., 16, 15529–15543, https://doi.org/10.5194/acp-16-15529-2016, 2016.
Chang, C. P., Wang, B., and Lau, N. C. G. (Eds.): The Global Monsoon System: Research and Forecast, WMO/TD, No. 1266, 542 pp., TMRP Rep. 70, 2005.
Chang, C. P., Ding, Y., Lau, N. C., Johnson, R. H., Wang, B., and Yasunari, T. (Eds.): The Global Monsoon System: Research and Forecast (2nd Edition), World Scientific Series on Asia-Pacific Weather and Climate, 5, 594 pp., https://doi.org/10.1142/8109, 2011.
Chang, C. P., Kuo, H. C., Lau, N. C., Johnson, R. H., Wang, B., and Wheeler, M. C. (Eds.): The Global Monsoon System: Research and Forecast (3rd Edition), World Scientific Series on Asia-Pacific Weather and Climate, 9, 385 pp., https://doi.org/10.1142/10305, 2017.
Chang, C. P., Ha, K. J., Johnson, R. H., Kim, D., Lau, G. N. C., and Wang, B. (Eds.): The Multiscale Global Monsoon System, World Scientific Series on Asia-Pacific Weather and Climate, 11, 406 pp., https://doi.org/10.1142/11723, 2021.
Chen, W., Yang, S., and Huang, R. H.: Relationship between stationary planetary wave activity and the East Asian winter monsoon, J. Geophys. Res., 110, D14110, https://doi.org/10.1029/2004JD005669, 2005.
Collimore, C. C., Hitchman, M. H., and Martin, D. W.: Is there a quasi-biennial oscillation in tropical deep convection?, Geophysical Research Letters, 25, 333–336, https://doi.org/10.1029/97GL03722, 1998.
Collimore, C. C., Martin, D. W., Hitchman, M. H., Huesmann, A., and Waliser, D. E.: On The Relationship between the QBO and Tropical Deep Convection, J. Climate, 16, 2552–2568, https://doi.org/10.1175/1520-0442(2003)016<2552:OTRBTQ>2.0.CO;2, 2003.
Enomoto, T., Hoskins, B. J., and Matsuda, Y.: The Formation Mechanism of the Bonin High in August, Quarterly Journal of the Royal Meteorological Society, 129, 157–158, https://doi.org/10.1256/qj.01.211, 2003.
Gao, X., Hu, J., Ren, R., and Shen, Y.: Impacts of the stratospheric quasi-biennial oscillation on the tropospheric circulation and climate in the Northeast Asia–North Pacific region in early summer, Atmospheric and Oceanic Science Letters, 16, 3, https://doi.org/10.1016/j.aosl.2022.100319, 2023.
García-Franco, J. L., Gray, L. J., Osprey, S., Chadwick, R., and Martin, Z.: The tropical route of quasi-biennial oscillation (QBO) teleconnections in a climate model, Weather Clim. Dynam., 3, 825–844, https://doi.org/10.5194/wcd-3-825-2022, 2022.
García-Franco, J. L., Gray, L. J., Osprey, S., Jaison, A. M., Chadwick, R., and Lin, J.: Understanding the Mechanisms for Tropical Surface Impacts of the Quasi-Biennial Oscillation (QBO), Journal of Geophysical Research: Atmospheres, 128, e2023JD038474, https://doi.org/10.1029/2023JD038474, 2023.
Garfinkel, C. I. and Hartmann, D. L.: The Influence of the Quasi-Biennial Oscillation on the Troposphere in Winter in a Hierarchy of Models. Part I: Simplified Dry GCMs, J. Atmos. Sci., 68, 1273–1289, https://doi.org/10.1175/2011JAS3665.1, 2011.
Geen, R., Bordoni, S., Battisti, D. S., and Hui, K.: Monsoons, ITCZs, and the Concept of the Global Monsoon, Reviews of Geophysics, 58, e2020RG000700, https://doi.org/10.1029/2020RG000700, 2020.
Gerber, E. P. and Polvani, L.: Stratosphere-troposphere coupling in a relatively simple AGCM: the importance of stratospheric variability, J. Clim., 22, 1920–1933, https://doi.org/10.1175/2008JCLI2548.1, 2009.
Giorgetta, M. A., Bengtsson, L., and Arpe K.: Potential role of the quasi-biennial oscillation in the stratosphere-troposphere exchange as found in water vapor in general circulation model experiments, J. Geophys. Res., 104, 6003–6019, https://doi.org/10.1029/1998jd200112, 1999a.
Giorgetta, M. A., Bengtsson L., and Arpe, K.: An investigation of QBO signals in the east Asian and Indian monsoon in GCM experiments, Climate Dyn., 15, 435–450, https://doi.org/10.1007/s003820050292, 1999b.
Goswami, B.: Interannual variations of Indian summer monsoon in a GCM: External conditions versus internal feedbacks, J. Clim., 11, 501–522, https://doi.org/10.1175/1520-0442(1998)011<0501:IVOISM>2.0.CO;2, 1998.
Gray, L. J., Anstey, J. A., Kawatani, Y., Lu, H., Osprey, S., and Schenzinger, V.: Surface impacts of the Quasi Biennial Oscillation, Atmos. Chem. Phys., 18, 8227–8247, https://doi.org/10.5194/acp-18-8227-2018, 2018.
Gray, W. M., Scheaffer, J. D., and Knaff, J. A.: Influence of the stratospheric QBO on ENSO variability, J. Meteorol. Soc. Jpn., 70, 975–995, https://doi.org/10.2151/jmsj1965.70.5_975, 1992a.
Gray, W. M., Sheaffer, J. D., and Knaff, J. A.: Hypothesized mechanism for stratospheric QBO influence on ENSO variability, Geophys. Res. Lett., 19, 107–110, https://doi.org/10.1029/91GL02950, 1992b.
Gruber, A. and Krueger, A. F.: The status of NOAA outgoing longwave radiation data set, B. Am. Meteor. Soc., 65, 958–962, 1984.
Harvey, V. L. and Hitchman, M. H.: A climatology of the Aleutian high, J. Atmos. Sci., 53, 2088–2101, 1996.
Haynes, P., Hitchcock, P., Hitchman, M., Yoden, S., Hendon, H., Kiladis, G., Kodera, K., and Simpson, I.: The influence of the stratosphere on the tropical troposphere, J. Meteorol. Soc. Jpn., 99, 803–845, https://doi.org/10.2151/jmsj.2021-040, 2021.
Hersbach, H., Bell, B., Berrisford, P., Hirahara, S., Horányi, A., Mu noz-Sabater, J., Nicolas, J., Peubey, C., Radu, R., Schepers, D., Simmons, A., Soci, C., Abdalla, S., Abellan, X., Balsamo, G., Bechtold, P., Biavati, G., Bidlot, J., Bonavita, M., De Chiara, G., Dahlgren, P., Dee, D., Diamantakis, M., Dragani, R., Flemming, J., Forbes, R., Fuentes, M., Geer, A., Haimberger, L., Healy, S., Hogan, R. J., Hólm, E., Janisková, M., Keeley, S., Laloyaux, P., Lopez, P., Lupu, C., Radnoti, G., de Rosnay, P., Rozum, I., Vamborg, F., Villaume, S., and Thépaut, J.-N.: The ERA5 global reanalysis, Q. J. Roy. Meteorol. Soc., 146, 1999–2049, https://doi.org/10.1002/qj.3803, 2020.
Hitchman, M. H. and Huesmann, A. S.: A seasonal climatology of Rossby wave breaking in the layer 330–2000 K, J. Atmos. Sci., 64, 1922–1940, https://doi.org/10.1175/JAS3927.1, 2007.
Hitchman, M. H., Yoden, S., Haynes, P. H., Kumar, V., and Tegtmeier, S.: An observational history of the direct influence of the stratospheric quasi-biennial oscillation on the tropical and subtropical upper troposphere and lower stratosphere, J. Meteorol. Soc. Jpn., 99, 239–267, https://doi.org/10.2151/jmsj.2021-012, 2021.
Holton, J. R. and Tan, H.-C.: The influence of the equatorial quasi-biennial oscillation on the global circulation at 50 mb, Journal of the Atmospheric Sciences, 37, 2200–2208, https://doi.org/10.1175/1520-0469(1980)037<2200:TIOTEQ>2.0.CO;2, 1980.
Holton, J. R. and Tan, H.-C.: The quasi-biennial oscillation in the Northern Hemisphere lower stratosphere, Journal of the Meteorological Society of Japan, 60, 140–147, https://doi.org/10.2151/jmsj1965.60.1_140, 1982.
Horel, J. D. and Wallace, J. M.: Planetary-scale atmospheric phenomena associated with the Southern Oscillation, Mon. Weather Rev., 109, 813–829, https://doi.org/10.1175/1520-0493(1981)109<0813:PSAPAW>2.0.CO;2, 1981.
Hu, Y., Jian, M., and Gao, S.: Effect of quasi-biennial oscillation on the intensity of the South China Sea summer monsoon, Int. J. Climatol., 44, 448–469, https://doi.org/10.1002/joc.8336, 2024.
Hu, Z.-Z., Huang, B., Kinter III, J. L., Wu, Z., and Kumar, A.: Connection of the stratospheric QBO with global atmospheric general circulation and tropical SST. Part II: interdecadal variations, Climate Dynamics, 38, 25–43, https://doi.org/10.1007/s00382-011-1073-6, 2012.
Huang, B., Hu, Z.-Z., KinterIII, J. L., Wu, Z., and Kumar, A.: Connection of stratospheric QBO with global atmospheric general circulation and tropical SST. Part I: methodology and composite life cycle, Climate Dynamics, 38, 1–23, https://doi.org/10.1007/s00382-011-1250-7, 2012.
Hurrell, J. W., Kushnir, Y., Ottersen, G., and Visbeck, M.: An overview of the North Atlantic Oscillation, in: Geophysical Monograph American Geophysical Union, Geophysical Monograph Series, 134, 1–35, https://doi.org/10.1029/134GM01, 2003.
Inoue, M. and Takahashi, M.: Connections between the stratospheric quasi-biennial oscillation and tropospheric circulation over Asia in northern autumn: QBO-troposphere relationship over Asia, J. Geophys. Res.: Atmos., 118, 10740–10753, https://doi.org/10.1002/jgrd.50827, 2013.
James, I. N.: Introduction to Circulating Atmospheres, Cambridge University Press, 422, https://doi.org/10.1017/CBO9780511622977, 1994.
Jong, B.-T., Ting, M., and Seager, R.: El Ni no's impact on California precipitation: Seasonality, regionality, and El Ni no's intensity, Environmental Research Letters, 11, 054021, https://doi.org/10.1088/1748-9326/11/5/054021, 2016.
Kim, K. Y. and Kim, Y. Y.: Mechanism of Kelvin and Rossby waves during ENSO events, Meteorol. Atmos. Phys., 81, 169–189, https://doi.org/10.1007/s00703-002-0547-9, 2002.
Kinnersley, J. S. and Tung, K.: Mechanisms for the Extratropical QBO in Circulation and Ozone, J. Atmos. Sci., 56, 1942–1962, https://doi.org/10.1175/1520-0469(1999)056<1942:MFTEQI>2.0.CO;2, 1999.
Kodera, K., Koide, H., and Yoshimura, H.: Northern Hemisphere winter circulation associated with the North Atlantic oscillation and stratospheric polar-night jet, Geophys. Res. Lett., 26, 443–446, https://doi.org/10.1029/1999GL900016, 1999.
Krishnamurti, T. N.: Tropical east west circulations during northern summer, J. Atmos. Sci., 28, 1342–1347, https://doi.org/10.1175/1520-0469(1971)028<1342:TEWCDT>2.0.CO;2, 1971.
Krishnamurti, T. N., Stefanova, L., and Misra, V.: Chapter 5 Monsoons, in “Tropical Meteorology”, Springer Atmospheric Sciences, Springer, 75–119, https://doi.org/10.1007/978-1-4614-7409-8_5, 2013.
Krishnamurthy, V. and Goswami, B. N.: Indian Monsoon-ENSO Relationship on Interdecadal Timescale, Journal of Climate, 13, 579–595, https://doi.org/10.1175/1520-0442(2000)013<0579:IMEROI>2.0.CO;2, 2000.
Kumar, V., Dhaka, S. K., Jain, A., Chaudhary, A., Bhatnagar, R., Gupta, A., Panwar, V., Singh, N., and Reddy, K. K.: COSMIC satellite observations on seasonal variation of pressure at cold point tropopause (P-CPT) and its relation with Tropical Easterly Jet (TEJ) over tropical region, Indian J. Radio Space Phys. 42, 292–297, 2013.
Kumar, V., Dhaka, S., Reddy, K., Gupta, A., Prasad, S. S., Panwar, V., Singh, N., Ho, S.-P., and Takahashi, M.: Impact of quasi-biennial oscillation on the inter-annual variability of the tropopause height and temperature in the tropics: A study using COSMIC/FORMOSAT-3 observations, Atmos. Res., 139, 62–70, https://doi.org/10.1016/j.atmosres.2013.12.014, 2014.
Kumar, V., Yoden, S., and Hitchman, M. H.: QBO and ENSO effects on the mean meridional circulation, polar vortex, subtropical westerly jets, and wave patterns during boreal winter, J. Geophys. Res.: Atmos., 127, e2022JD036691, https://doi.org/10.1029/2022JD036691, 2022.
Kumar, V., Hitchman, M. H., Du, W. Dhaka, S. K., and Yoden, S.: Teleconnection of the Quasi-biennial oscillation with boreal winter surface climate in Eurasia and North America, Commun. Earth Environ., 5, 251, https://doi.org/10.1038/s43247-024-01422-7, 2024.
Kushner, P. J.: Annular modes of the troposphere and stratosphere, in the stratosphere: dynamics, transport, and chemistry, in: Geophysical Monograph Series, edited by: Polvani, L. M., Sobel, A. H., and Waugh, D. W., American Geophysical Union, 190, 59–92, https://doi.org/10.1029/GM190, 2010.
Kushner, P. J. and Polvani, L.: Stratosphere-troposphere coupling in a relatively simple AGCM: the role of eddies, J. Clim., 17, 629–639, https://doi.org/10.1175/1520-0442(2004)017<0629:SCIARS>2.0.CO;2, 2004.
Kushner, P. J., Held, I., and Delworth, T. W.: Southern Hemisphere atmospheric circulation response to global warming, J. Climate, 14, 2238–2249, https://doi.org/10.1175/1520-0442(2001)014<0001:SHACRT>2.0.CO;2, 2001.
Lee, J.-H., Kang, M.-J., and Chun, H.-Y.: Differences in the Tropical Convective Activities at the Opposite Phases of the Quasi-Biennial Oscillation, Asia-Pacific J. Atmos Sci., 55, 317–336, https://doi.org/10.1007/s13143-018-0096-x, 2019.
Liess, S. and Geller, M. A.: On the relationship between QBO and distribution of tropical deep convection, J. Geophys. Res., 117, 2011JD016317, https://doi.org/10.1029/2011JD016317, 2012.
Meehl, G. A.: The annual cycle and interannual variability in the tropical Pacific and Indian Ocean regions, Mon. Weather Rev., 115, 27–50, https://doi.org/10.1175/1520-0493(1987)115<0027:TACAIV>2.0.CO;2, 1987.
Muhsin, M., Sunilkumar, S. V., Venkat Ratnam, M., Parameswaran, K., Krishna Murthy, B., and Emmanuel, M.: Effect of convection on the thermal structure of the troposphere and lower stratosphere including the tropical tropopause layer in the South Asian monsoon region, J. Atmos. Sol.-Terr. Phys., 169, 52–65, https://doi.org/10.1016/j.jastp.2018.01.016, 2018.
Nie, J. and Sobel, A. H.: Responses of Tropical Deep Convection to the QBO: Cloud-Resolving Simulations, Journal of the Atmospheric Sciences, 72, 3625–3638, https://doi.org/10.1175/JAS-D-15-0035.1, 2015.
Park, C. H. and Son, S. W.: Subseasonal variability of ENSO–East Asia teleconnections driven by tropical convection over the Indian ocean and Maritime Continent, Geophysical Research Letters, 51, e2023GL108062, https://doi.org/10.1029/2023GL108062, 2024.
Park, C. H., Son, S. W., Lim, Y., and Choi, J.: Quasi-biennial oscillation-related surface air temperature change over the western North Pacific in late winter, Int. J. Clim., 42, 4351–4359, https://doi.org/10.1002/joc.7470, 2022.
Park, C. H., Choi, J., Son, S. W., Kim, D., Yeh, S. W., and Kug, J. S.: Sub-seasonal variability of ENSO teleconnections in Western North America and its prediction skill, Journal of Geophysical Research: Atmospheres, 128, e2022JD037985, https://doi.org/10.1029/2022JD037985, 2023.
Peña-Ortiz, C., Ribera, P., García-Herrera, R., Giorgetta, M. A., and García, R. R.: Forcing mechanism of the seasonally asymmetric quasi-biennial oscillation secondary circulation in ERA-40 and MAECHAM5, J. Geophys. Res., 113, D16103, https://doi.org/10.1029/2007JD009288, 2008.
Peña-Ortiz, C., Manzini, E., and Giorgetta, M.: Tropical deep convection impact on southern winter stationary waves and its modulation by the Quasi-Biennial Oscillation, J. Climate, 32, 7453–7467, https://doi.org/10.1175/JCLI-D-18-0763.1, 2019.
Polvani, L. M., Sobel, A. H., and Waugh D. W.: The Stratosphere: Dynamics, Transport, and Chemistry, Geophys. Monogr. Ser., AGU, 190, https://doi.org/10.1029/GM190, 2010.
Postel, G. A. and Hitchman, M. H.: Climatology of Rossby wave breaking along the subtropical tropopause, J. Atmos. Sci., 56, 359–373, https://doi.org/10.1175/1520-0469(1999)056<0359:ACORWB>2.0.CO;2, 1999.
Postel, G. A. and Hitchman, M. H.: Observational diagnosis of a Rossby wave breaking event along the subtropical tropopause, Mon. Wea. Rev., 129, 2555–2569, https://doi.org/10.1175/1520-0493(2001)129<2555:ACSORW>2.0.CO;2, 2001.
Randel, W. J., Wu, F., Swinbank, R., Nash, J., and O'Neill, A.: Global QBO circulation derived from UKMO stratospheric analyses, J. Atmos. Sci., 56, 457–474, https://doi.org/10.1175/1520-0469(1999)056<0457:GQCDFU>2.0.CO;2, 1999.
Rayner, N. A., Parker, D. E., Horton, E. B., Folland, C. K., Alexander, L., Rowell, D. P., Kent, E. C., and Kaplan, A.: Global analyses of sea surface temperature, sea ice, and night marine air temperature since the late nineteenth century, Journal of Geophysical Research, 108, 4407, https://doi.org/10.1029/2002JD002670, 2003.
Reid, G. C. and Gage, K. S.: Interannual variations in the height of the tropical tropopause, J. Geophys. Res.-Atmos., 90, 5629–5635, https://doi.org/10.1029/JD090iD03p05629, 1985.
Rodrigo, M., García-Serrano, J., and Bladé, I.: Quasi-biennial oscillation influence on tropical convection and El Ni no variability, Geophysical Research Letters, 52, e2024GL112854, https://doi.org/10.1029/2024GL112854, 2025.
Schwendike, J., Govekar, P., Reeder, M. J., Wardle, R., Berry, G. J., and Jakob, C.: Local partitioning of the overturning circulation in the tropics and the connection to the Hadley and Walker circulations, J. Geophys. Res.-Atmos., 119, 1322–1339, 2014.
Seo, J., Choi, W., Youn, D., Park, D.-S. R., and Kim, J. Y.: Relationship between the stratospheric quasi-biennial oscillation and the spring rainfall in the western North Pacific, Geophys. Res. Lett., 40, 5949–5953, https://doi.org/10.1002/2013GL058266, 2013.
Shen, S. and Lau, K. M.: Biennial oscillation associated with the East Asian summer monsoon and tropical sea surface temperatures, J. Meteor. Soc. Japan, 73, 105–124, https://doi.org/10.2151/jmsj1965.73.1_105, 1995.
Tegtmeier, S., Anstey, J., Davis, S., Ivanciu, I., Jia, Y., McPhee, D., and Pilch Kedzierski, R.: Zonal Asymmetry of the QBO Temperature Signal in the Tropical Tropopause Region, Geophys. Res. Lett., 47, e2020GL089533, https://doi.org/10.1029/2020GL089533, 2020.
Thompson, D. W. and Wallace, J. M.: Regional climate impacts of the Northern Hemisphere annular mode, Science, 293, 85–89, https://doi.org/10.1126/science.1058958, 2001.
Thompson, D. W. J. and Wallace, J. M.: Annular modes in the extratropical circulation. Part I: Month-to-month variability, J. Climate, 13, 1000–1016, https://doi.org/10.1175/1520-0442(2000)013<1000:AMITEC>2.0.CO;2, 2000.
Wallace, J. M., Panetta, R. L., and Estberg, J.: Representation of the equatorial stratospheric Quasi-Biennial Oscillation in EOF phase space, J. Atm. Sci., 50, 1751–1762, https://doi.org/10.1175/1520-0469(1993)050<1751:ROTESQ>2.0.CO;2, 1993.
Wang, B. and Ding, Q.: Global monsoon: Dominant mode of annual variation in the tropics, Dyn. Atmos. Oceans, 44, 165–183, https://doi.org/10.1016/j.dynatmoce.2007.05.002, 2008.
Wang, B., Wu, R., and Fu, X.: Pacific-East Asia teleconnection: How does ENSO affect East Asian climate?, Journal of Climate, 13, 1517–1536, https://doi.org/10.1175/1520-0442(2000)013<1517:PEATHD>2.0.CO;2, 2000.
Wang, P. X., Wang, B., Cheng, H., Fasullo, J., Guo, Z. T., Kiefer, T., and Liu, Z. Y.: The global monsoon across time scales: Mechanisms and outstanding issues, Earth-Sci. Rev., 174, 84–121, https://doi.org/10.1016/j.earscirev.2017.07.006, 2017.
Wendler, G., Gordon, T., and Stuefer, M.: On the Precipitation and Precipitation Change in Alaska, Atmosphere, 8, 253, https://doi.org/10.3390/atmos8120253, 2017.
Wu, R., Hu, Z. Z., and Kirtman, B. P.: Evolution of ENSO-related rainfall anomalies in East Asia, Journal of Climate, 16, 3742–3758, https://doi.org/10.1175/1520-0442(2003)016<3742:EOERAI>2.0.CO;2, 2003.
Yamazaki, K., Nakamura, T., Ukita, J., and Hoshi, K.: A tropospheric pathway of the stratospheric quasi-biennial oscillation (QBO) impact on the boreal winter polar vortex, Atmos. Chem. Phys., 20, 5111–5127, https://doi.org/10.5194/acp-20-5111-2020, 2020.
Yasunari, T.: Impact of Indian monsoon on the coupled atmosphere/ocean systems in the tropical Pacific, Meteor. Atmos. Phys., 44, 29–41, https://doi.org/10.1007/BF01026809, 1990.
Yoden, S., Kumar, V., Dhaka, S. K., and Hitchman, M. H.: Global monsoon systems and their modulation by the equatorial Quasi-Biennial Oscillation, MAUSAM, 74-2, 239–252, https://doi.org/10.54302/mausam.v74i2.5948, 2023.
Yu, S. Y., Fan, L., Zhang, Y., Zheng, X. T., and Li, Z.: Re-examining the Indian summer monsoon rainfall–ENSO relationship from its recovery in the 21st century: Role of the Indian Ocean SST anomaly associated with types of ENSO evolution, Geo. Res. Lett., 48, e2021GL092873, https://doi.org/10.1029/2021GL092873, 2021.
Zhou, F., Wu, Y., Han, T., and Yin, Z.: Stratospheric quasi-biennial oscillation modulates the impact of boreal summer intraseasonal oscillation on rainfall extremes in the Yangtze–Huaihe River Basin, Geophysical Res. Lett., 51, e2024GL110922, https://doi.org/10.1029/2024GL110922, 2024.
- Abstract
- Introduction
- Data and methodology
- Climatological cycle of the GM
- Zonal mean seasonal structure of QBO
- QBO teleconnections with the GM system
- Longitude-altitude structure of regional QBO anomalies
- Conclusions
- Data availability
- Author contributions
- Competing interests
- Disclaimer
- Acknowledgements
- Financial support
- Review statement
- References
- Supplement