the Creative Commons Attribution 4.0 License.
the Creative Commons Attribution 4.0 License.
 | 27 Mar 2026
The lapse rate and the cold point tropopause in the Asian Summer Monsoon anticyclone
Bärbel Vogel
Martina Krämer
Christian Rolf
Nicole Spelten
Fabrizio Ravegnani
Tropospheric and stratospheric airmasses are separated by the tropopause. Here we investigate the lapse rate tropopause and the cold point tropopause in the Asian summer monsoon anticyclone (ASMA) based on high-altitude airborne measurements in summer 2017. We find that the lapse rate tropopause, and not the cold point, constitutes a good estimate of the upper boundary of the well mixed tropospheric air for many species. There is slow, diabatic, upward transport in the vicinity of the lapse rate tropopause and above. The cold point is located on average about 1 km above the lapse rate tropopause and is about 3 K colder (pressure lower by about 12 hPa). The cold point is in particular important for water vapour. Above the cold point in the ASMA molar water vapour mixing ratios (including hydration patches) range between ∼3 and 10 ppm. In the observations, no indication of substantial dehydration above the cold point was found. Ozone mixing ratios increase substantially with altitude; between the lapse rate and the cold point tropopause molar ozone mixing ratios are in the range of 50–200 ppb. For strong convection (flight on 10 August 2017) there is substantial dehydration at the cold point tropopause (indicated by high values of total water, ice particle occurrence, and strong supersaturation). Above the cold point, under such conditions, neither ice particle occurrence, nor enhanced molar mixing ratios of water vapour (above about 6 ppm) are observed.
- Article
(3572 KB) - Full-text XML
-
Supplement
(797 KB) - BibTeX
- EndNote


In the tropics, atmospheric composition in general and the temperature profile in particular are rather different above and below the tropopause (e.g., Hoskins and Rodwell, 1995; Richard et al., 2006; Park et al., 2007; Bian et al., 2012; Pan et al., 2014, 2018; Krämer et al., 2020). Below the tropical tropopause the atmosphere is of tropospheric nature and is vertically strongly mixed, above the tropopause the air is more of stratospheric nature; in particular the air shows lower mixing ratios of water vapour and higher mixing ratios of ozone (e.g., Jeffery et al., 2022).
The tropopause is classically defined by the atmospheric lapse rate (WMO, 1957) (i.e., the location of a significant change in the atmospheric temperature lapse rate); the lapse rate tropopause is also referred to as the thermal tropopause. Overshoots of convection across the lapse rate tropopause occur (e.g., Khaykin et al., 2022; Clapp et al., 2023), in particular in the monsoon regions. This leads to transport of water vapour across the tropopause into the lowermost stratosphere. The transport of water vapour into the lowermost stratosphere and the abundance of water vapour in the lower stratosphere are important for tropospheric climate and dynamics; processes in this regard are often not well simulated in models (Solomon et al., 2010; Charlesworth et al., 2023; Ploeger et al., 2024). Lower stratospheric water vapour is a key radiative agent in the Earth's climate system; in particular, the regional Pacific moist bias in stratospheric models can be reduced through a Lagrangian transport scheme, which could be important for improving the simulation of regional circulation systems in the Asian monsoon region (Ploeger et al., 2024).
The tropopause as the separation between the troposphere and the stratosphere is a notion that has long been established (e.g., Allam and Tuck, 1984a, b; Bethan et al., 1996; Hoinka, 1997). However, the tropopause is still a topic of current research (e.g., Kunz et al., 2011; Pan et al., 2014, 2018; Maddox and Mullendore, 2018; Hoffmann and Spang, 2022; Tinney et al., 2022; Zou et al., 2023; Zhang et al., 2024; Turhal et al., 2024; Reutter and Spichtinger, 2025; Bauchinger et al., 2025; Riese et al., 2026). There are different ways to determine the location of the tropopause (e.g., Bethan et al., 1996; Vaughan and Timmis, 1998; Hoinka, 1997; Kunz et al., 2011; Maddox and Mullendore, 2018; Pan et al., 2018; Turhal et al., 2024; Reutter and Spichtinger, 2025; Bauchinger et al., 2025). There are also variations over long time scales (decades) of tropopause height and temperature (e.g., Zou et al., 2023).
The role of the ASMA in transport across the tropopause has been discussed since many years and relevant things have been discovered. Already early model studies predicted the role of the ASMA in the entry of water vapour into the stratosphere (Allam and Tuck, 1984a, b). Rosenlof et al. (1997) and Dethof et al. (1999) showed early evidence for the large-scale transport of moist air across the subtropical jet stream in association with upper level monsoon anticyclones. And exchange between the upper tropical troposphere and the lower stratosphere (and vice versa) was investigated in aircraft observations of water, ozone, wind, and temperature in the potential temperature range of ∼360 to 420 K potential temperature (Tuck et al., 2003, 2004).
The tropical tropopause is observed (Tuck et al., 2003, see also Table 1) at potential temperature values greater than the maximum moist static surface energies (about 355 K, Tuck et al., 2003) indicating that adiabatic transport of potentially warm air from the midlatitude stratosphere to the tropics occurs (Tuck et al., 2003). Here potential temperature θ is defined as
with , R is the gas constant for dry air, cp is the specific heat capacity at constant pressure, and p0 is a reference pressure (1000 hPa for the calculations reported here).
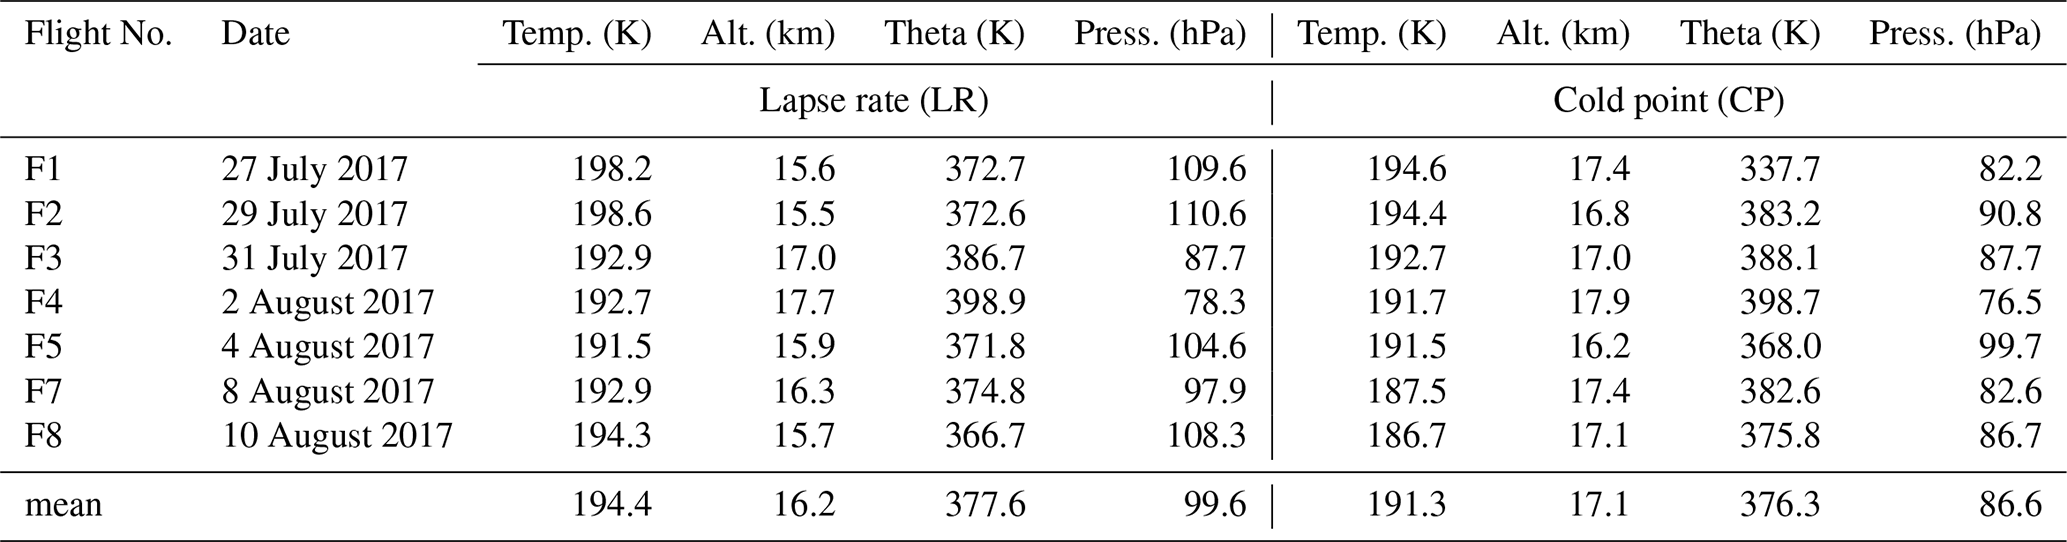
Table 1Overview of the StratoClim science flights 2017 from Kathmandu. Shown is information on the lapse rate (LR) and the cold point (CP) tropopause for selected parts of the flight (i.e. the first three hours of the flight; except F1, 1.9–3 h of the flight and F7, 1–2.5 h of the flight – in other words vertical profiles crossing the tropopause on ascent). (Note that F6 did not substantially cross the tropopause and is therefore not listed.)
Often, the location of the tropopause is considered as a cold point (the point in the profile showing the lowest temperature) or as the lapse rate tropopause (WMO, 1957). These two different ways of locating the tropopause lead to different conclusions on the properties of air masses in the vicinity of the tropopause (Munchak and Pan, 2014; Pan et al., 2018). Observations in the vicinity of the tropopause were also made earlier in flights between the surface and 18 km in late January 2004 from Costa Rica (10° N, Richard et al., 2006). The cold point and the lapse rate tropopause are sometimes collocated, but often the tropical cold point is located substantially above the lapse rate tropopause (Munchak and Pan, 2014; Pan et al., 2018). Both the cold point and the lapse rate tropopause were analysed based on aircraft measurements in January–March 2014 in the western Pacific (Pan et al., 2018); finding that the air is drier on average at the cold point than at the lapse rate tropopause. Further, Pan et al. (2018) found a significant air mass discontinuity at the lapse rate tropopause. They conclude that there is no local barrier for transport across the lapse rate tropopause, but rather that this boundary reflects the with altitude diminishing role of convectively driven transport and mixing. This is important as the tropical west Pacific in winter is a key entry region for tropospheric air into the stratosphere. (e.g., Sun et al., 2025).
Likewise, the ASMA is an important entry region to the stratosphere, which will be the focus here. We use measurements on board of a high flying research aircraft (Geophysica) in July and August 2017 (that is during the Asian summer monsoon peak season), during the StratoClim campaign based in Kathmandu/Nepal (e.g., Legras and Bucci, 2020; Krämer et al., 2020; Singer et al., 2022). There were eight science flights out of Kathmandu during this period and the flights covered the altitude range from the ground to about 475 K. Trace gas, water vapour, and particle measurements during this campaign have been analysed before (e.g., Höpfner et al., 2019; Krämer et al., 2020; Legras and Bucci, 2020; von Hobe et al., 2021; Appel et al., 2022; Singer et al., 2022; Konopka et al., 2023; Vogel et al., 2023). Also, the moistening of the lower stratosphere in the ASMA observed in a specific flight (8 August 2017) during the StratoClim campaign was investigated (Lee et al., 2019; Khaykin et al., 2022). Here we focus on tropopause characteristics in the ASMA region during the StratoClim campaign in Kathmandu in summer 2017.
The ASMA exists in Northern hemisphere summer in the upper troposphere and lower stratosphere (e.g., Park et al., 2007; Gottschaldt et al., 2018; Fadnavis et al., 2023). The ASMA stretches over a large area, between the Eastern Mediterranean and Northern India and the Tibetan plateau (e.g., Park et al., 2007; Vogel et al., 2016; Manney et al., 2021; Becker et al., 2025; Kachula et al., 2025). In the Asian monsoon region and season, the lapse rate tropopause is typically located at greater altitudes (i.e. at lower pressures) than the tropopause outside the monsoon region (by about 0.5 to 1 km or 20 K in potential temperature; Highwood and Hoskins, 1998; Bian et al., 2012; Ploeger et al., 2015; Vogel et al., 2015). Further, there is a strong year-to-year variability in the altitude and the temperature of the lapse rate tropopause in the Asian monsoon region (Hoffmann and Spang, 2022; Zou et al., 2023).
Upward transport in the Asian summer monsoon is dominated by convective activity. The fact that thunderstorms may inject substantial amounts of water vapour into the lowermost stratosphere was already found in early airborne measurements (aircraft flights around a thunderstorm top near Amarillo, Texas, in 1972, Shlanta and Kuhn, 1973). There are sources of tropospheric perturbations at lower altitudes (e.g., ozone, ozone depleting substances, water vapour, CO, and CO2) which are detectable in the ASMA at greater altitudes, above about 370 K potential temperature (Park et al., 2007; Ploeger et al., 2013; Santee et al., 2017; Muhsin et al., 2018; Ueyama et al., 2018; Legras and Bucci, 2020; Krämer et al., 2020; von Hobe et al., 2021; Adcock et al., 2021; Singer et al., 2022; Vogel et al., 2023, 2024; Clemens et al., 2024; Becker et al., 2025). When investigating the impact of convection on the stratospheric composition in the ASMA it is important to consider the influence of transport across the lapse rate tropopause (Khaykin et al., 2022; Clapp et al., 2023).
The impact of convective activity in the North American and Asian Monsoon regions on stratospheric humidity has been investigated based on satellite observations (Randel et al., 2015; Wang et al., 2025); it is concluded that stronger convection leads to a drier stratosphere, whereas weaker convection leads to a more humid stratosphere (Randel et al., 2015). Dehydration in the upper troposphere and lower stratosphere over the Asian summer monsoon caused by tropical cyclones has also been observed (Li et al., 2020, 2023). Further, moistening of the global lower stratosphere through sublimating ice particles (a process showing a substantial regional variability) can be detected as an isotopic enhancement of the ratio (Randel et al., 2012; Singer et al., 2022; Khaykin et al., 2022).
Moreover, the altitude of the tropopause and its characteristics are very different in the extra-tropics and in the tropics; in the tropics the transition from the troposphere to the stratosphere occurs in a layer, rather than at a sharply defined point referred to as “tropopause”. This fact has led to the concept of a tropical tropopause layer (TTL, Fueglistaler et al., 2009); with a bottom at ∼150 hPa, 355 K, 14 km (pressure, potential temperature, and altitude) and a top at ∼70 hPa, 425 K, 18.5 km (Fueglistaler et al., 2009). The existence of a TTL (but not using this term) was discussed earlier based on observations (Tuck et al., 1997; Richard et al., 2006). There is further a longitudinal variation of the tropopause altitude, in particular associated with the ASMA and with El Niño-southern oscillation events (Gage and Reid, 1987; Highwood and Hoskins, 1998; Bian et al., 2012; Turhal et al., 2024).
In the upper troposphere and lower stratosphere, temperature (T) altitude (z), pressure (p) and potential temperature (θ) are related (e.g., Krämer et al., 2020). Pressure decreases with altitude and potential temperature increases with altitude (Krämer et al., 2020, see also Appendix A). The relation in detail can be different above and below the tropical tropopause, where the tropical tropopause temperature is close to the minimum in temperature (e.g., Pan et al., 2018; Hoffmann and Spang, 2022; Singer et al., 2022). In any case, in discussions of Asian monsoon issues, altitude, pressure and potential temperature are all used frequently; therefore we provide here relations between these quantities based on in-situ measurements in the ASMA in 2017 (see Appendix A).
We focus here on airborne observations of water vapour, ozone, temperature, other meteorological parameters, and cloud occurrence (total water); all these quantities are accessible also through balloon-borne observations. Obviously, the measurements during StratoClim in 2017 provide a wealth of further information, which will be valuable for an extension of the present work.
Here we find that the lapse rate tropopause in the Asian summer monsoon anticyclone constitutes a good estimate for the upper boundary of the well mixed tropospheric air mass and that the lapse rate tropopause and the cold point tropopause are often not co-located; these two “tropopauses” are different. The cold point tropopause is in particular important for water vapour; in the ASMA, above the cold point tropopause, mixing ratios of water vapour are ≲10 ppm. For strong convection there is substantial dehydration at the cold point tropopause and no indication of particle occurrence or enhanced mixing ratios of water vapour (≳6 ppm) above the altitude of the cold point tropopause.
2.1 Temperature, Altitude and Pressure
We use measurements of temperature on board the research aircraft Geophysica in 2017 by the scientific Rosemount probe (TDC, Shur et al., 2006). We use the Mach number corrected version of the TDC temperature measurements (Singer et al., 2022). Temperature accuracy and precision are 0.5 and 0.1 K, respectively (Singer et al., 2022). The altitude of the aircraft is deduced from the aircraft system (UCSE, Stefanutti et al., 1999); likewise pressure measurements are taken from UCSE, but there is no significant difference in the pressure measurements of the UCSE and TDC systems. The UCSE altitude is consistently used for all analyses throughout the paper.
2.2 Gas-phase water vapour, total water vapour and ozone
Gas-phase water vapour aboard the Geophysica was measured by the FLASH instrument (Sitnikov et al., 2007; Khaykin et al., 2022), a Lyman-α photofragment fluorescence instrument with 1 s time resolution, a precision of 0.2 ppm, and a measurement range of 1–1000 ppm. Total water vapour on board the aircraft is measured by the FISH instrument, which is also a Lyman-α photofragment fluorescence instrument using a forward facing inlet (Zöger et al., 1999; Meyer et al., 2015; Schiller, 2015). Overall, in the range from 4 to 1000 ppm, the total accuracy of FISH is 6 %–8 %; for lower mixing ratios down to 1 ppm, the uncertainty reaches a lower limit of 0.3 ppm (Meyer et al., 2015). Considering the enhanced sampling of cloud particles caused by the forward facing inlet of the FISH instrument, an estimate of the cloud ice water content in the atmosphere is possible (Schiller et al., 2008, 2009; Schiller, 2015; Afchine et al., 2018).
Gas-phase water vapour in clouds is taken from the FLASH measurements; because of the design of the inlet, FLASH only measures gas-phase water vapour in the atmosphere. If FLASH measurements are not available, gas-phase water vapour in ice clouds is approximated as saturation over ice (see also the discussion in Richard et al., 2006). Outside of clouds FISH also reports gas-phase water vapour. A detailed comparison of gas-phase water vapour measurements of the FISH and FLASH instruments during the campaign in 2017 is reported elsewhere (Singer et al., 2022). Overall, gas-phase measurements (outside clouds) of the FISH instrument have shown good agreement with a number of independent aircraft hygrometers (Rollins et al., 2014; Singer et al., 2022).
We further use the relative humidity over ice based on the aircraft measurements. First, the water vapour saturation mixing ratio over ice is calculated from pressure and temperature aboard the aircraft. Second, the measured gas-phase mixing ratio (here from the FLASH measurements) is used to calculate the ratio of gas-phase water vapour mixing ratio to the water vapour saturation mixing ratio over ice, in other words the relative humidity over ice.
Ozone on board the aircraft is measured by FOZAN-II, a dual-channel automatic fast-response (1 s) chemiluminescent ozone analyser (Ulanovsky et al., 2001). The measured ozone concentration range is 10–500 µg m−3, the relative error is less than 10 % and the measurement range is from the ground to 22 km altitude (Ulanovsky et al., 2001). At 30 hPa (and 200 K) a range of 10–500 µg m−3 corresponds to a range in molar mixing ratio of ozone of 116 to 5776 ppb. The lower limit of the ozone concentration measured by FOZAN-II (10 µg m−3) means that the instrument can measure increasingly lower values of the molar mixing ratio of ozone with increasing pressure; for example, at 1000 hPa a value of 10 µg m−3 corresponds to 3.5 ppb.
2.3 Water vapour isotopologues
In the StratoClim campaign, an indication of water vapour enhancements through sublimating ice particles is provided by measurements of the ratio, which is provided by the Chicago Water Isotope Spectrometer (ChiWIS, Singer et al., 2022). An isotopic enhancement of the ratio (i.e., heavy water vapour) indicates gas-phase water resulting from the sublimation of ice particles (Hanisco et al., 2007). The ChiWIS measurements are not directly used here, but conclusions in the literature on water vapour originating from sublimating ice particles (Khaykin et al., 2022) are used. Values of the δD of about −450 in ‰ are indicative of sublimating ice particles, where the ratio of is given in the δ notation (Hanisco et al., 2007): (RVSMOW is the ratio of in Vienna standard mean ocean water).
Here we focus on three specific flights during the StratoClim campaign in 2017 based in Kathmandu, Nepal (e.g., Legras and Bucci, 2020; Krämer et al., 2020; Singer et al., 2022). We focus on measurements of temperature, ozone mixing ratios, gas-phase water vapour mixing ratios and water vapour in the particle phase. Flight F2 on 29 July 2017 was designed as an ATAL flight, no particles were observed. Flight F7 on 8 August, designed as an ASMA survey, showed few particles and some enhancement of gas-phase water vapour at greater altitudes. Flight F8, on 10 August 2017, was probing fresh convection.
3.1 Deducing the location of the tropopause
There is a variety of methods to determine the location of the tropopause (Hoinka, 1997); here we focus on two specific methods: the lapse rate tropopause and the cold point tropopause. Both methods require only a measurement of the atmospheric temperature profile.
The lapse rate tropopause, is defined as the lowest level at which the temperature lapse rate decreases to 2 K km−1 or less, provided that the average lapse rate between that level and all higher levels within 2 km does not exceed 2 K km−1 (WMO, 1957). That is, a layer of 2 km above a candidate tropopause is required by this definition; so that the lapse rate tropopause is designed for a vertical profile measurement. Thus, to determine the lapse rate tropopause, we select a part of the flight, here the first three hours of the flight (i.e., the ascent of the aircraft, see Table 1 for details). For the same part of the flight, to facilitate a comparison, we report values for the cold point tropopause (the point in the profile showing the lowest temperature; Table 1). Values for the last part of the flight (descent into Kathmandu crossing the tropopause region) and the cold point tropopause considering the entire flight are reported elsewhere (Müller, 2026, see also Supplement).
Examples of observed temperature profiles in the Asian monsoon region versus altitude and versus potential temperature on 29 July 2017 (as well as the location of the cold point and lapse rate tropopause) are shown in Fig. 1 (top and bottom). Temperature decreases almost linearly with altitude (Fig. 1, top) up to the lapse rate tropopause and thus constitutes an example of a polytropic temperature profile (a temperature profile with a constant lapse rate; Ertel, 1938). The lapse rate tropopause is also noticeable as a discontinuity in the vertical gradient of potential temperature (Fig. 1, bottom), consistent with Kohma and Sato (2019), who defined the lapse rate tropopause by this property of potential temperature.
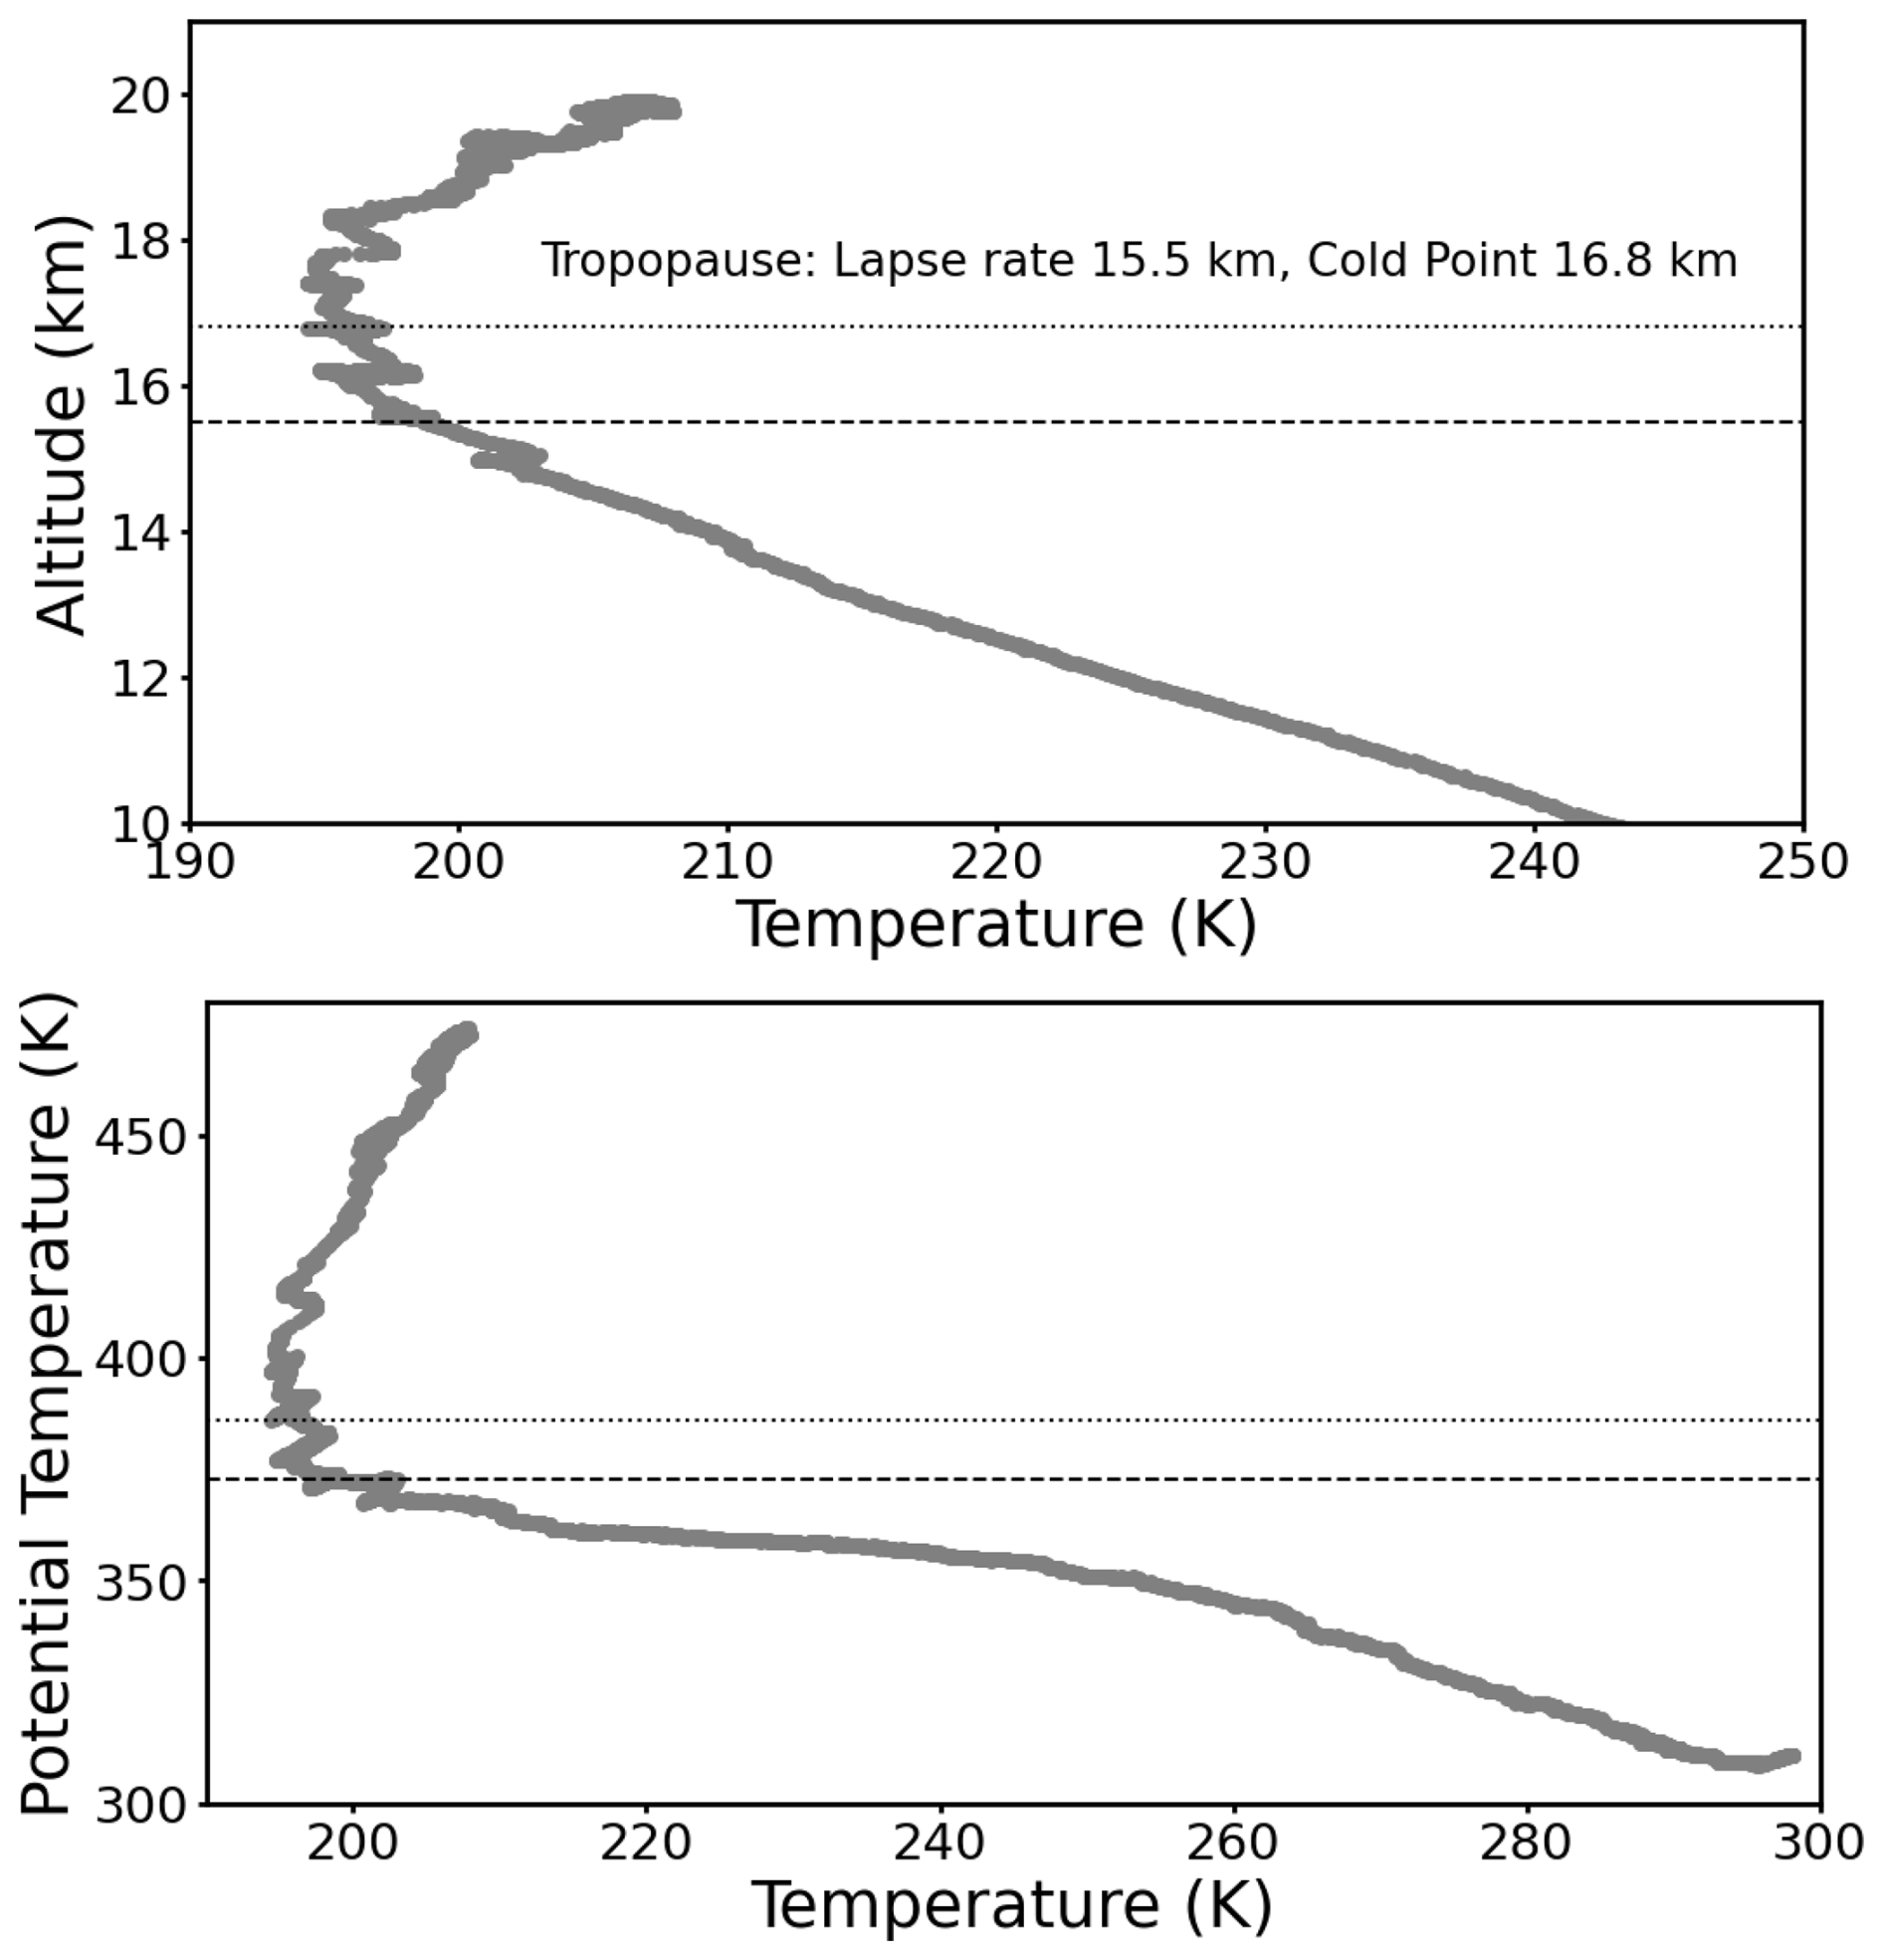
Figure 1The temperature profile versus altitude (top) and potential temperature (bottom) in the vicinity of the tropopause for the scientific flight on 29 July 2017. The dashed line shows the altitude of the lapse rate tropopause (15.5 km and 372.6 K, respectively) and the dotted line the altitude of the cold point tropopause (16.8 km and 383.2 K, respectively). Tropopause and temperature information is for the first three hours of the flight (see Table 1).
Note that locating the tropopause always constitutes an approximation because air parcels do not ascend vertically (as a balloon ascent does) and aircraft measurements always cover a certain horizontal area. Tropopause information at a particular point can be interpolated from gridded data, e.g. using meteorological reanalyses, but are subject to interpolation uncertainties. It would be better, considering the evolution of an air parcel in a Lagrangian sampling, when interpreting measurements at a particular point in the lower stratosphere (e.g. Schiller et al., 2009; Wright et al., 2011; Rolf et al., 2015; Ueyama et al., 2018; Legras and Bucci, 2020; Khaykin et al., 2022; Konopka et al., 2023; Wang et al., 2025); however this view is only accessible in model simulations (see also Sect. 3.3).
3.2 Cold point and lapse rate tropopause
For the first part of each StratoClim flight (the first three hours), Table 1 lists the location of the lapse rate tropopause. The mean lapse rate tropopause is located at 16.2 km (or 377.6 K, pressure 99.6 hPa); the mean temperature at the lapse rate tropopause is 194.4 K. Also, the cold point tropopause for the same flight segment (i.e., the first three hours) measured by the aircraft is listed in Table 1, as well as the altitude, the potential temperature and the pressure at the cold point. The cold point measured by the aircraft instruments for the entire flight is reported elsewhere (Müller, 2026). The range of the potential temperature for the ascent flight segments at the cold point is 337.7 to 398.7 K (approximately consistent with Khaykin et al., 2022). The mean cold point temperature for these parts of the flights is 191.3 K, the mean altitude of the cold point is 17.1 km and 376.3 K and 86.6 hPa for potential temperature and pressure, respectively. The example of the temperature profile measured during StratoClim in the scientific flight on 29 July 2017 is shown in Fig. 1.
The observations shown here indicate that, for the Asian summer monsoon, the cold point is frequently located above the lapse rate tropopause (Table 1) although occasionally the lapse rate tropopause and the cold point may be located very closely in altitude and pressure (e.g., F5, 4 August 2017). On average the cold point is located 0.9 km above the lapse rate tropopause and the cold point tropopause is about 3.1 K colder than the lapse rate tropopause (Table 1).
Up to the lapse rate tropopause, temperature is decreasing rapidly with potential temperature (Fig. 1. bottom) or with altitude (Fig. 1, top). Above the lapse rate tropopause, the temperature varies little up to the cold point. Above the cold point, with increasing altitude and potential temperature, temperature increases again (Fig. 1).
However, vertical ascent through layers of constant potential temperature occurs according to the heating rate per unit mass Q where the isentropic vertical velocity is given by the first law of thermodynamics
(here has units of K d−1). Thus, the slow vertical ascent on time scales of several days is not affected by any local transport barriers. Therefore, there cannot be a local control of the slow upward transport in the vicinity of the tropopause.
3.3 Ozone and Water Vapour in the vicinity of the tropopause
The chemical composition of air masses in the vicinity of the tropopause in the ASMA is investigated here using in-situ air-borne measurements of ozone and water vapour in the Asian monsoon anticyclone in 2017 in the frame of the StratoClim campaign (e.g., Legras and Bucci, 2020; Krämer et al., 2020; Singer et al., 2022). Flights were selected for which both water vapour and ozone measurements are available. Throughout this work, ozone and water vapour are expressed in molar mixing ratios reported as ppb and ppm. (Note that for an ideal gas molar mixing ratios are identical to volume mixing ratios.)
The aircraft measurements discussed here cannot measure a profile in the Lagrangian sense (the Lagrangian point of view can be reached in model simulations), in other words the sampled air masses will be from downwind, i.e. from regions having in general other properties than the air masses during the ascent or descent of the aircraft (i.e., Ueyama et al., 2018; Khaykin et al., 2022; Konopka et al., 2023; Wang et al., 2025).
For the water vapour and ozone measurements considered here, it is important that the tropopause is a different entity for different species. In contrast to practically all other species of tropospheric origin, gas-phase water vapour may freeze out (cirrus particle formation) at low atmospheric temperatures. Thus, for gas-phase water vapour, the cold point is most important, as temperature is relevant here and not transport.
3.3.1 Hydration and dehydration of the stratosphere through sublimating and sedimenting ice particles
The presence of ice particles in an air mass in the vicinity of the tropopause can be indicative of either hydration or dehydration. Ice particles present in subsaturated air are indicative of sublimation of ice leading to hydration of the air mass, whereas ice particles in supersaturated air will to grow and tend to sediment, thus leading to dehydration of the air mass (Jensen et al., 2020; Khaykin et al., 2022).
The sedimentation velocity of particles of moderate size in the stratosphere is small; a particle with a radius r=10 µm at 30 km falls about 108 m h−1 and at 20 km about 90 m h−1 (Müller and Peter, 1992). The fall speed is ∝r2 so that a smaller particle will fall substantially slower, whereas a particle with a radius r of 100 µm will fall about 7 km h−1 at 30 km or 3 km h−1 at 20 km (Müller and Peter, 1992).
However, small and large ice particles in the same air mass do not develop independently. It was suggested (Knollenberg et al., 1993; Richard et al., 2006) that the ablation of small ice particles by solar near-infrared radiation plays a role in the production of the lowest, unsaturated water vapour values; the vapour molecules from the ablated small particles distil over to the larger particles that have significant fall speeds (Müller and Peter, 1992).
3.3.2 The scientific flight on 29 July 2017
The air masses sampled during the scientific flight on 29 July 2017 were influenced by convection several days before the measurement (Khaykin et al., 2022; Konopka et al., 2023). But during this flight, no occurrence of particles was observed above 13 km and in particular above the lapse rate tropopause (Fig. 2, top right). There are two layers of enhanced water vapour of about 10 ppm between 16.5 and 17.5 km, at and above the cold point tropopause (Fig. 2, top right). The convective origin of these layers of enhanced water vapour at about 16.5 and 17.5 km is confirmed by a strong enhancement in the ratio (see also Sect. 2.3) indicating that the water vapour enhancement was produced by sublimation of ice (Khaykin et al., 2022). On this day, water vapour measurements above the cold point tropopause show a decline of H2O with altitude, with no indication of dehydration above the cold point (Fig. 2, top right).
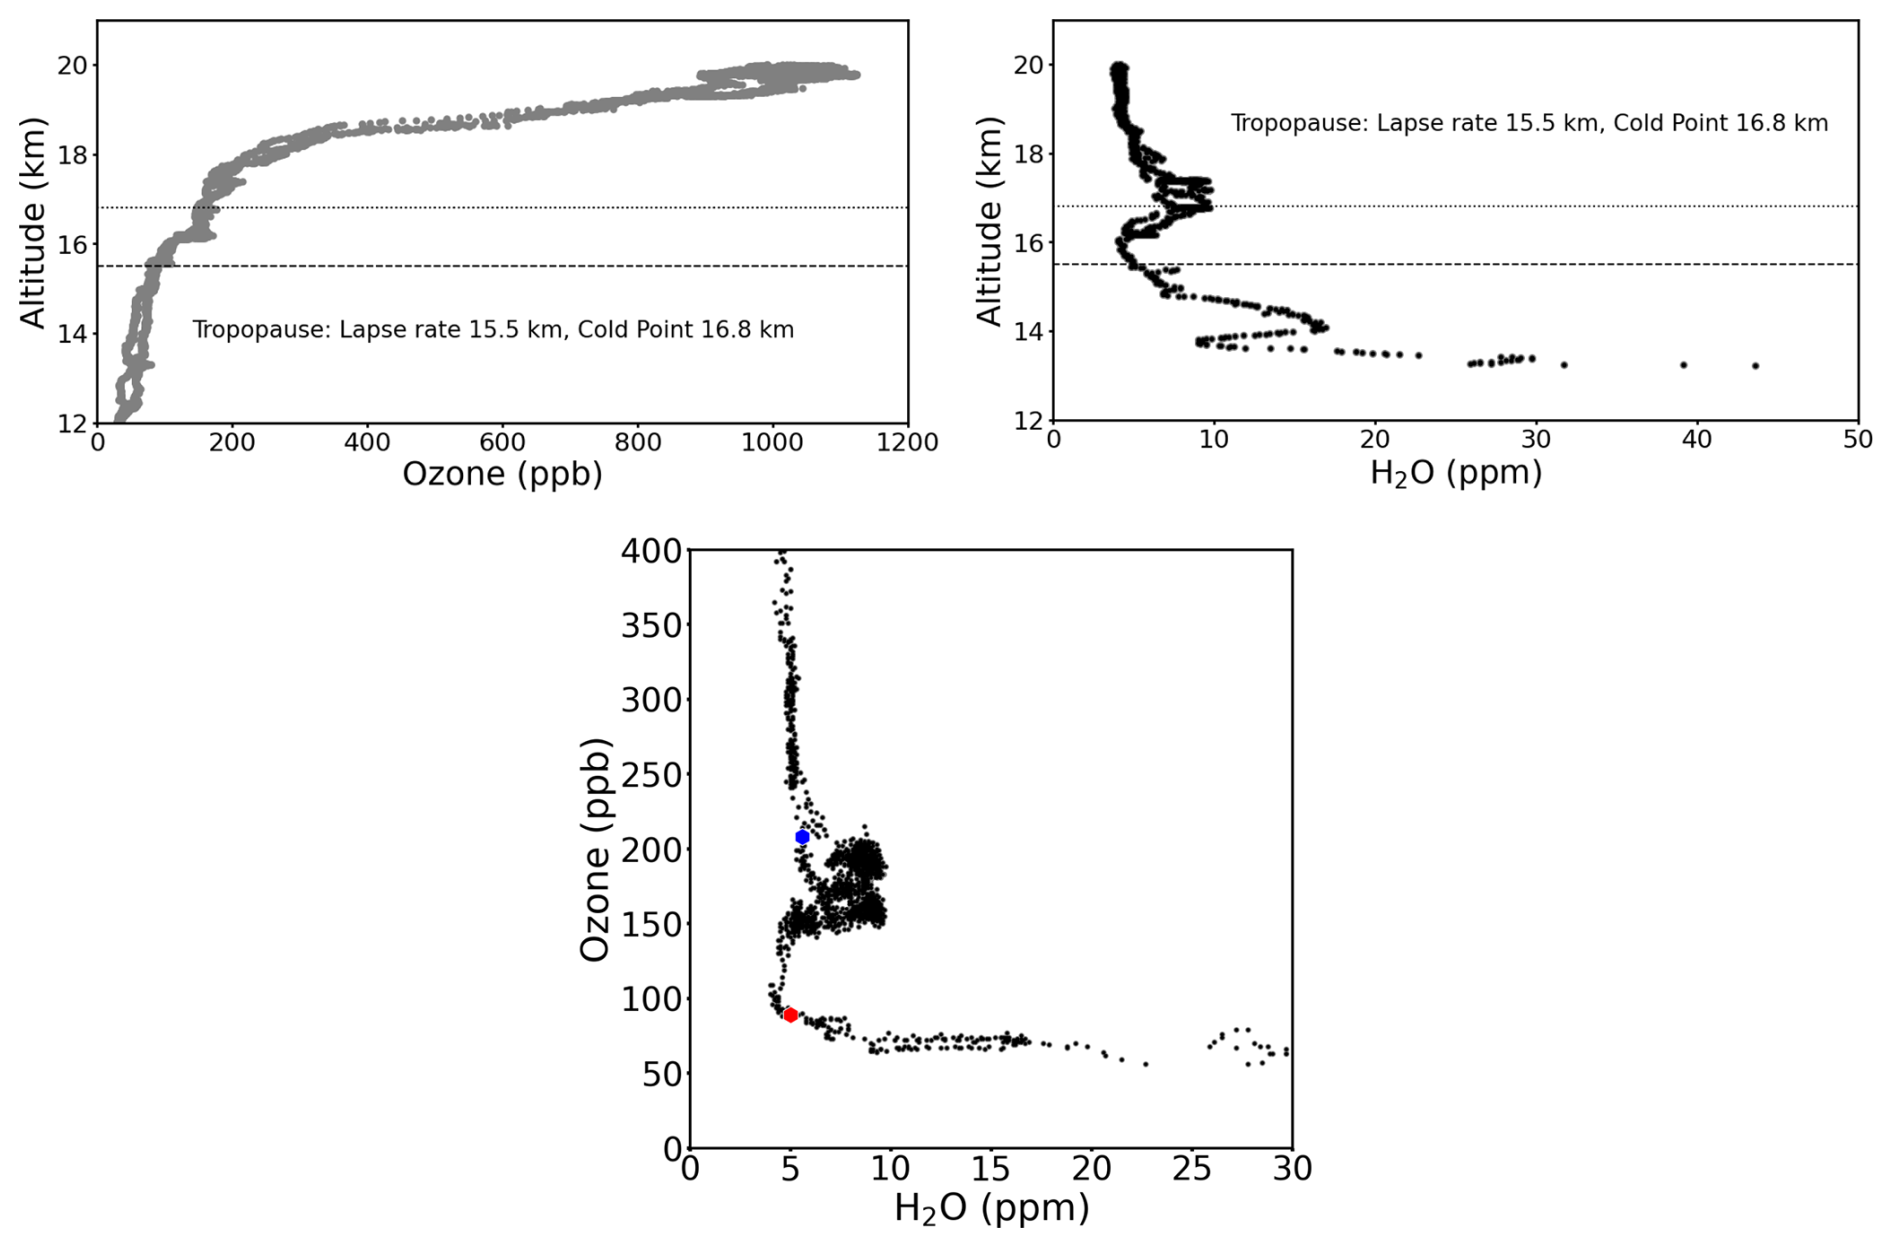
Figure 2Measurements of molar mixing ratios of ozone (top left) and water vapour (top right) versus altitude in the vicinity of the tropopause for the scientific flight on 29 July 2017. The dashed line shows the altitude of the lapse rate tropopause and the dotted line the altitude of the cold point tropopause. Bottom panel shows a scatter plot of the aircraft measurements of ozone and water vapour on 29 July 2017. The red symbol indicates the location of the lapse rate tropopause; the blue symbol the location of the cold point tropopause. Tropopause information is for the first three hours of the flight (see Table 1), ozone and water vapour measurements are for the entire flight. In the top right and bottom panel, grey symbols indicate the FISH total water vapour measurements and black points show the FLASH gas-phase water vapour measurements. Note that for this flight the FISH and FLASH water vapour measurements are very similar (top right and bottom panel), in other words no cloud particles were observed.
Ozone mixing ratios stay approximately constant with altitude up to about 12 km, with a moderate increase above. A substantial ozone increase starts above the lapse rate tropopause, increasing substantially with altitude, especially above the cold point (Fig. 2, top left).
These findings are corroborated by investigating the ozone-H2O scatter plot (Fig. 2, bottom); which shows the well known “L-shape” (Pan et al., 2018) and, further, the water vapour enhancements of about 10 ppm for ozone mixing ratios between ∼150 to 200 ppb. Measurements below the lapse rate tropopause are of tropospheric character (poor in ozone and enhanced in water vapour).
3.3.3 The scientific flight on 8 August 2017
In contrast to flight F2 (on 29 July), which stayed in the airspace of Nepal, F7 (on 8 August) reached deep into Indian airspace and almost reached the Bay of Bengal (Singer et al., 2022). During F7, air masses were sampled that show an approximately constant ozone mixing ratio with altitude up to 14 km; the ozone mixing ratio increases somewhat above. Ozone mixing ratios increase substantially above the lapse rate tropopause (Fig. 3, top left).
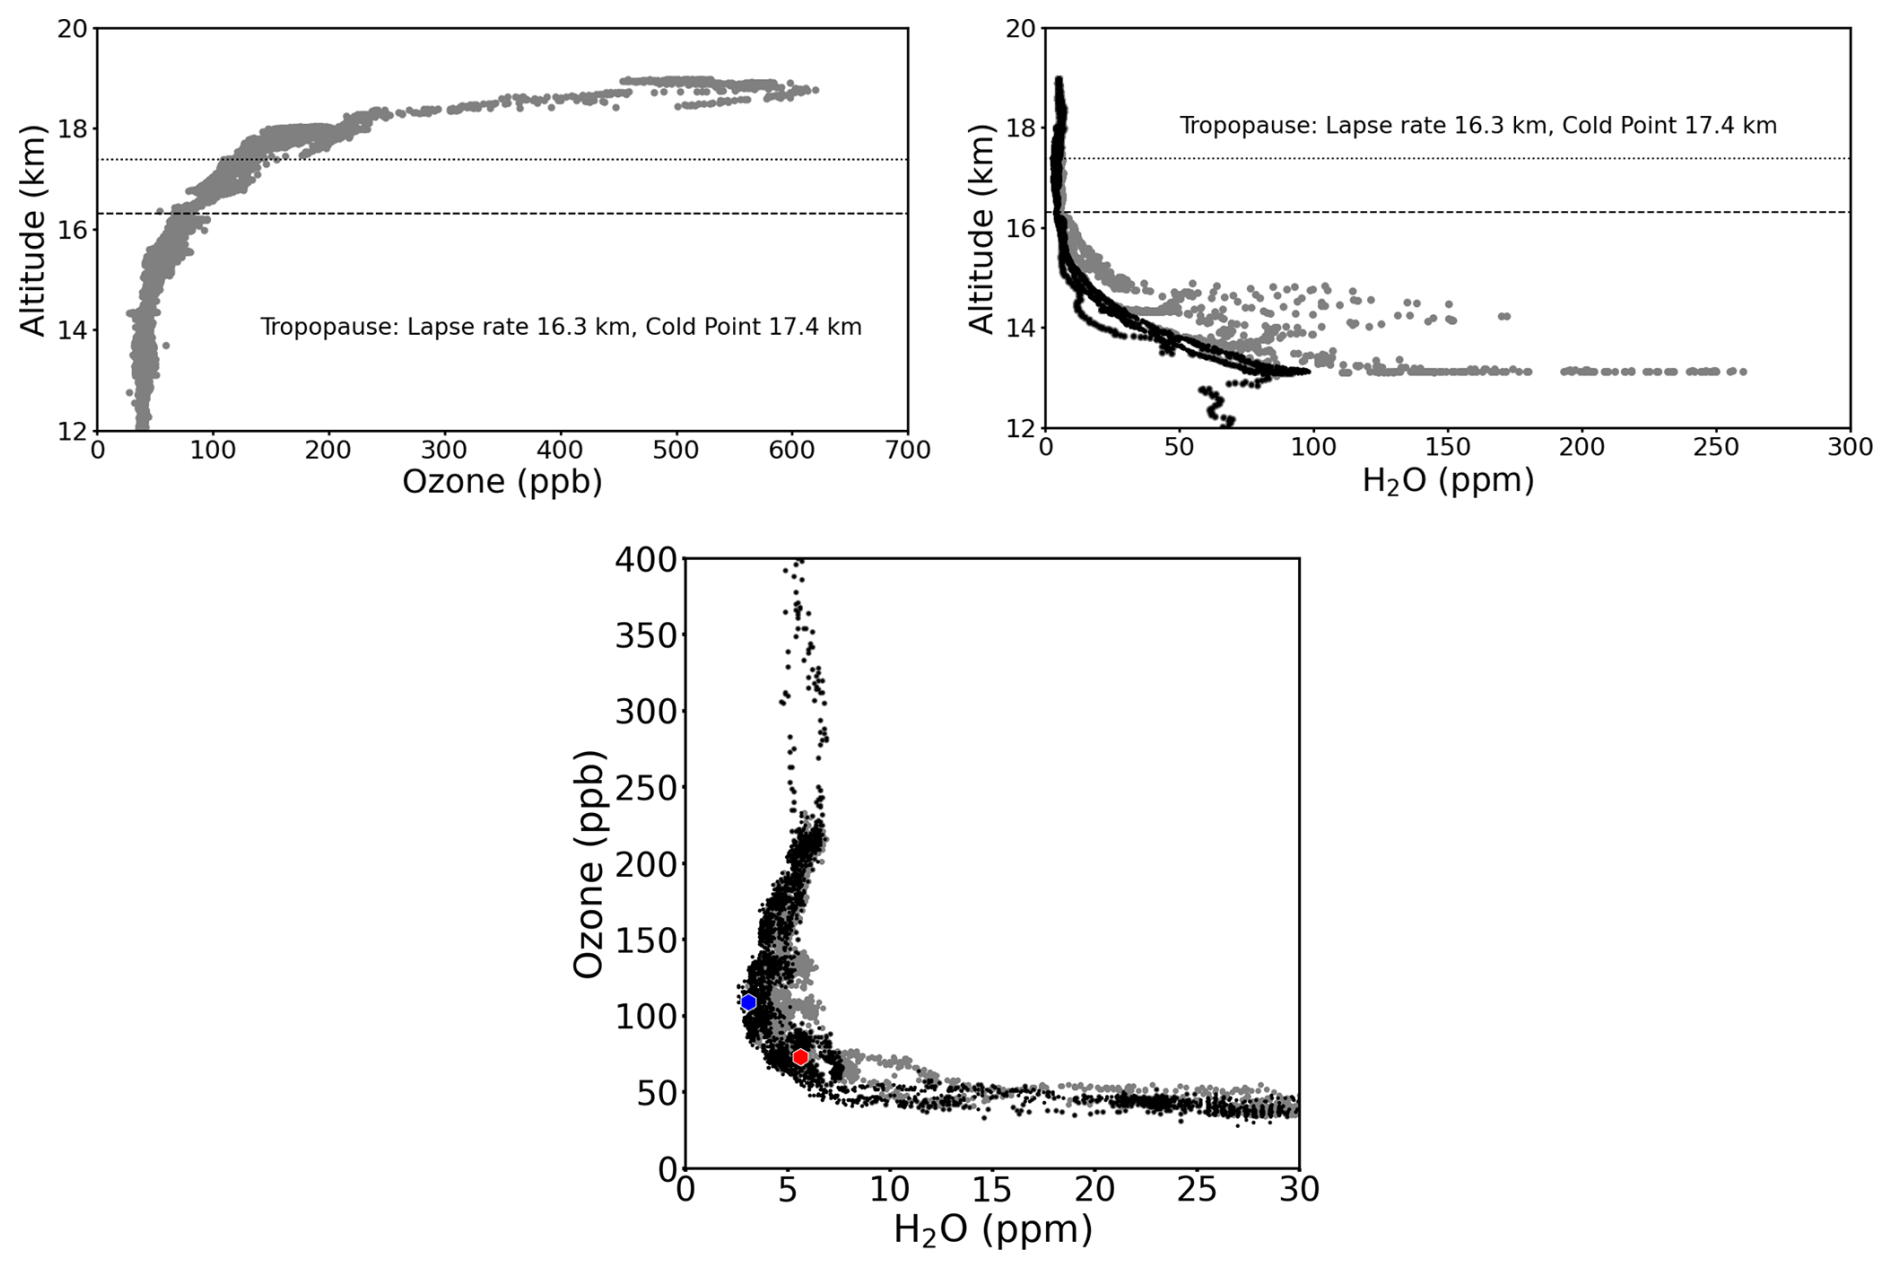
Figure 3Measurements of ozone (top left) and water vapour (top right) versus altitude in the vicinity of the tropopause for the scientific flight on 8 August 2017. The dashed line shows the altitude of the lapse rate tropopause and the dotted line the altitude of the cold point tropopause. Tropopause information is for the first three hours of the flight (see Table 1), ozone and water vapour measurements are for the entire flight. In top right panel and in the scatter plot in the bottom panel, grey symbols indicate the FISH total water vapour measurements and black points show the gas-phase water vapour measurements by the FLASH instrument. The red symbol in the bottom panel indicates the location of the lapse rate tropopause; the blue symbol the location of the cold point tropopause.
Below the lapse rate tropopause, on 8 August 2017, ice particles occur (Fig. 3, top right, Fig. 4). This is obvious as the grey symbols (total water) clearly show – at the same altitude or potential temperature – higher values than the black symbols (gas-phase water vapour). The same is true (but with lower values of total water) for the vertical range between the lapse rate tropopause and the cold point tropopause (Fig. 4). Slightly above the cold point tropopause, at about 390 K (17 km), ice particles are observed (Fig. 4), but no clear indication of particle occurrence is found above 390 K. The measurements show enhancement of water vapour to mixing ratios up to ∼7 ppm (Fig. 4) above the cold point tropopause between 400 and 410 K.
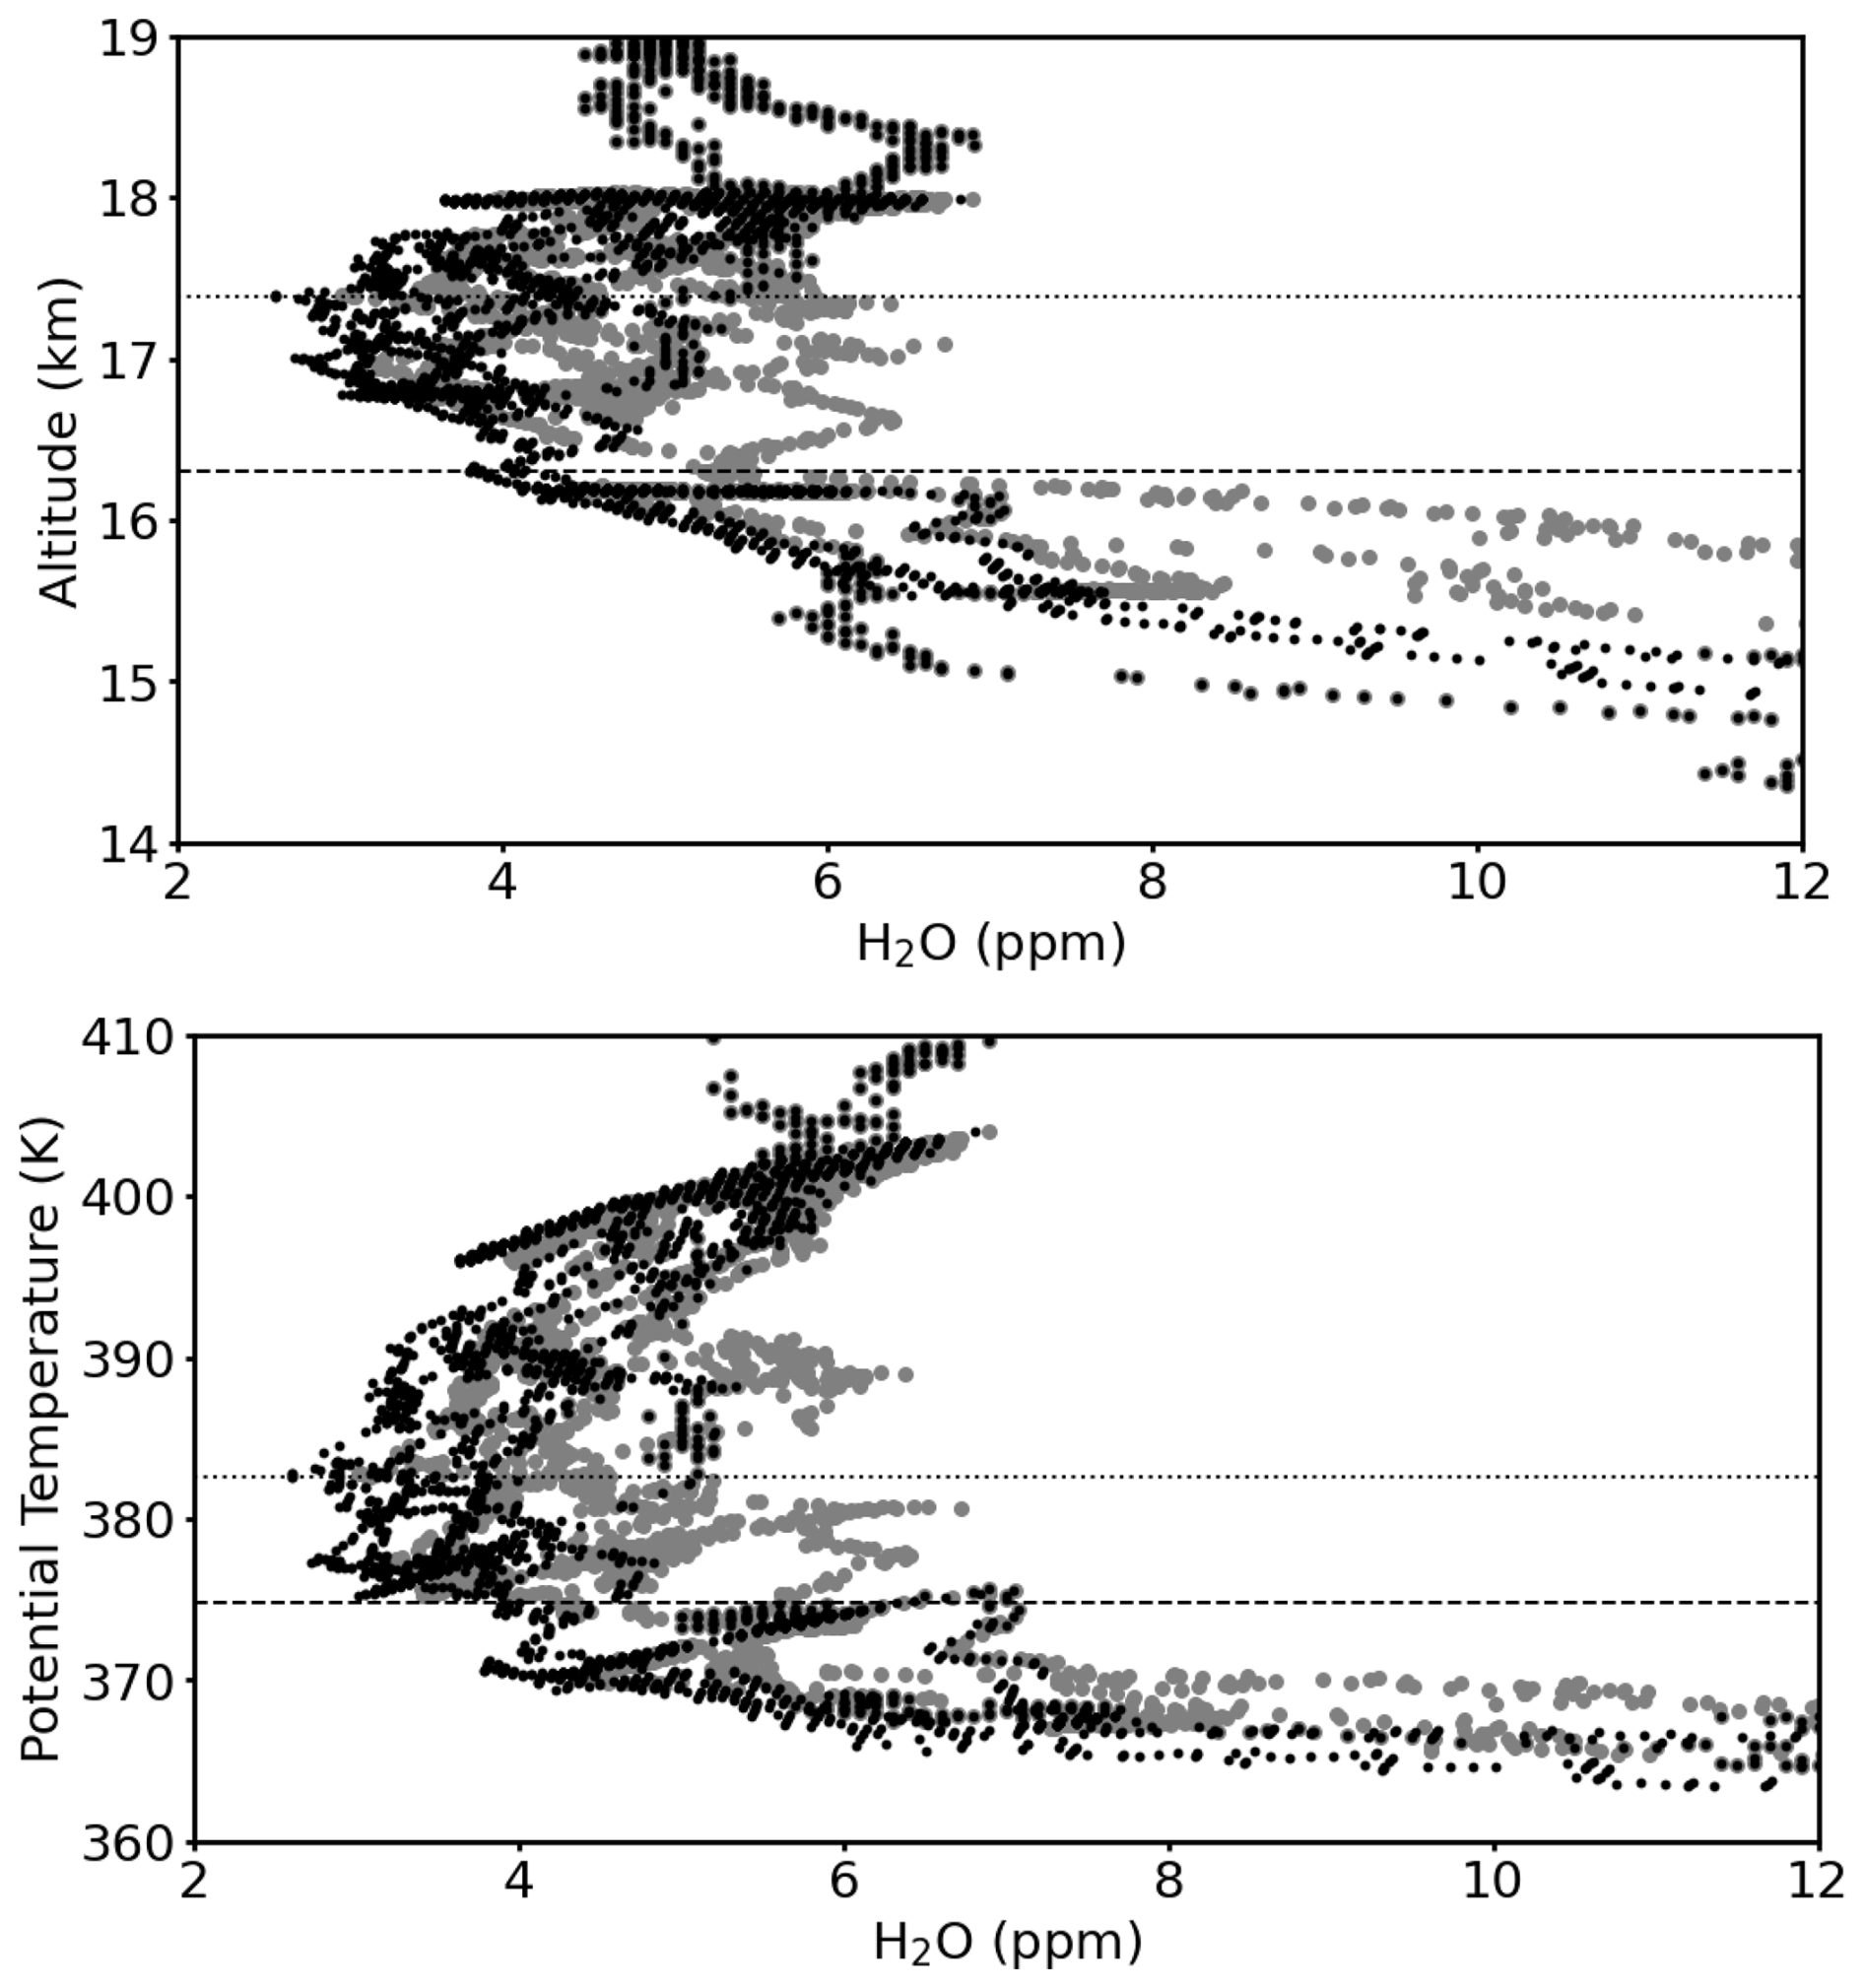
Figure 4Water vapour versus altitude (top) and versus potential temperature (bottom) in the vicinity of the tropopause for the scientific flight on 8 August 2017 (similar as in Fig. 3, top right), but for a reduced range of observed water vapour values. The dotted line shows the cold point for this flight (17.4 km, top, and 382.6 K, bottom) and the dashed line the lapse rate tropopause (16.3 km, top, and 374.8 K, bottom). Grey symbols indicate the FISH total water vapour measurements and black points show the gas-phase water vapour measurements by the FLASH instrument. The aircraft measurements extend to about 440 K.
The ozone-H2O scatterplot for 8 August (Fig. 3, bottom) corroborates the findings deduced from the observed profiles. The air below the lapse rate tropopause is of tropospheric character. Particles occur for ozone mixing ratios of 100–150 ppb and the H2O enhancement with mixing ratios below about 7 ppm is noticeable for ozone mixing ratios of 200–350 ppb.
3.3.4 The scientific flight on 10 August 2017
The scientific flight on 10 August 2017 was conducted under conditions of strong convection (Konopka et al., 2023) for about the first two hours of the flight. The entire flight duration was 3.7 h.
Clearly noticeable in the water vapour measurements on 10 August (Fig. 5, top right) is the very strong total water enhancement, which indicates the occurrence of ice particles (enhanced FISH water vapour measurements reaching up to ∼250 ppm). These ice particles are closely collocated with the altitude of the cold point tropopause (Fig. 5, top right, and Fig. 6, top). There is also occurrence of particles below the cold point as well as at and below the lapse rate tropopause (Fig. 5, top right). Further, cloud particles (i.e., high total water values) occur below the lapse rate tropopause in the troposphere. Ice particles are observed during the first two hours of the flight. No ice particles were detected by FISH for the flight section between about 17.1 km (375 K) and the top altitude of the flight (∼18.5 km, 420 K). Thus, the flight section between ∼17.1 km and the top altitude of the flight was conducted in cloud free air (Fig. 6).
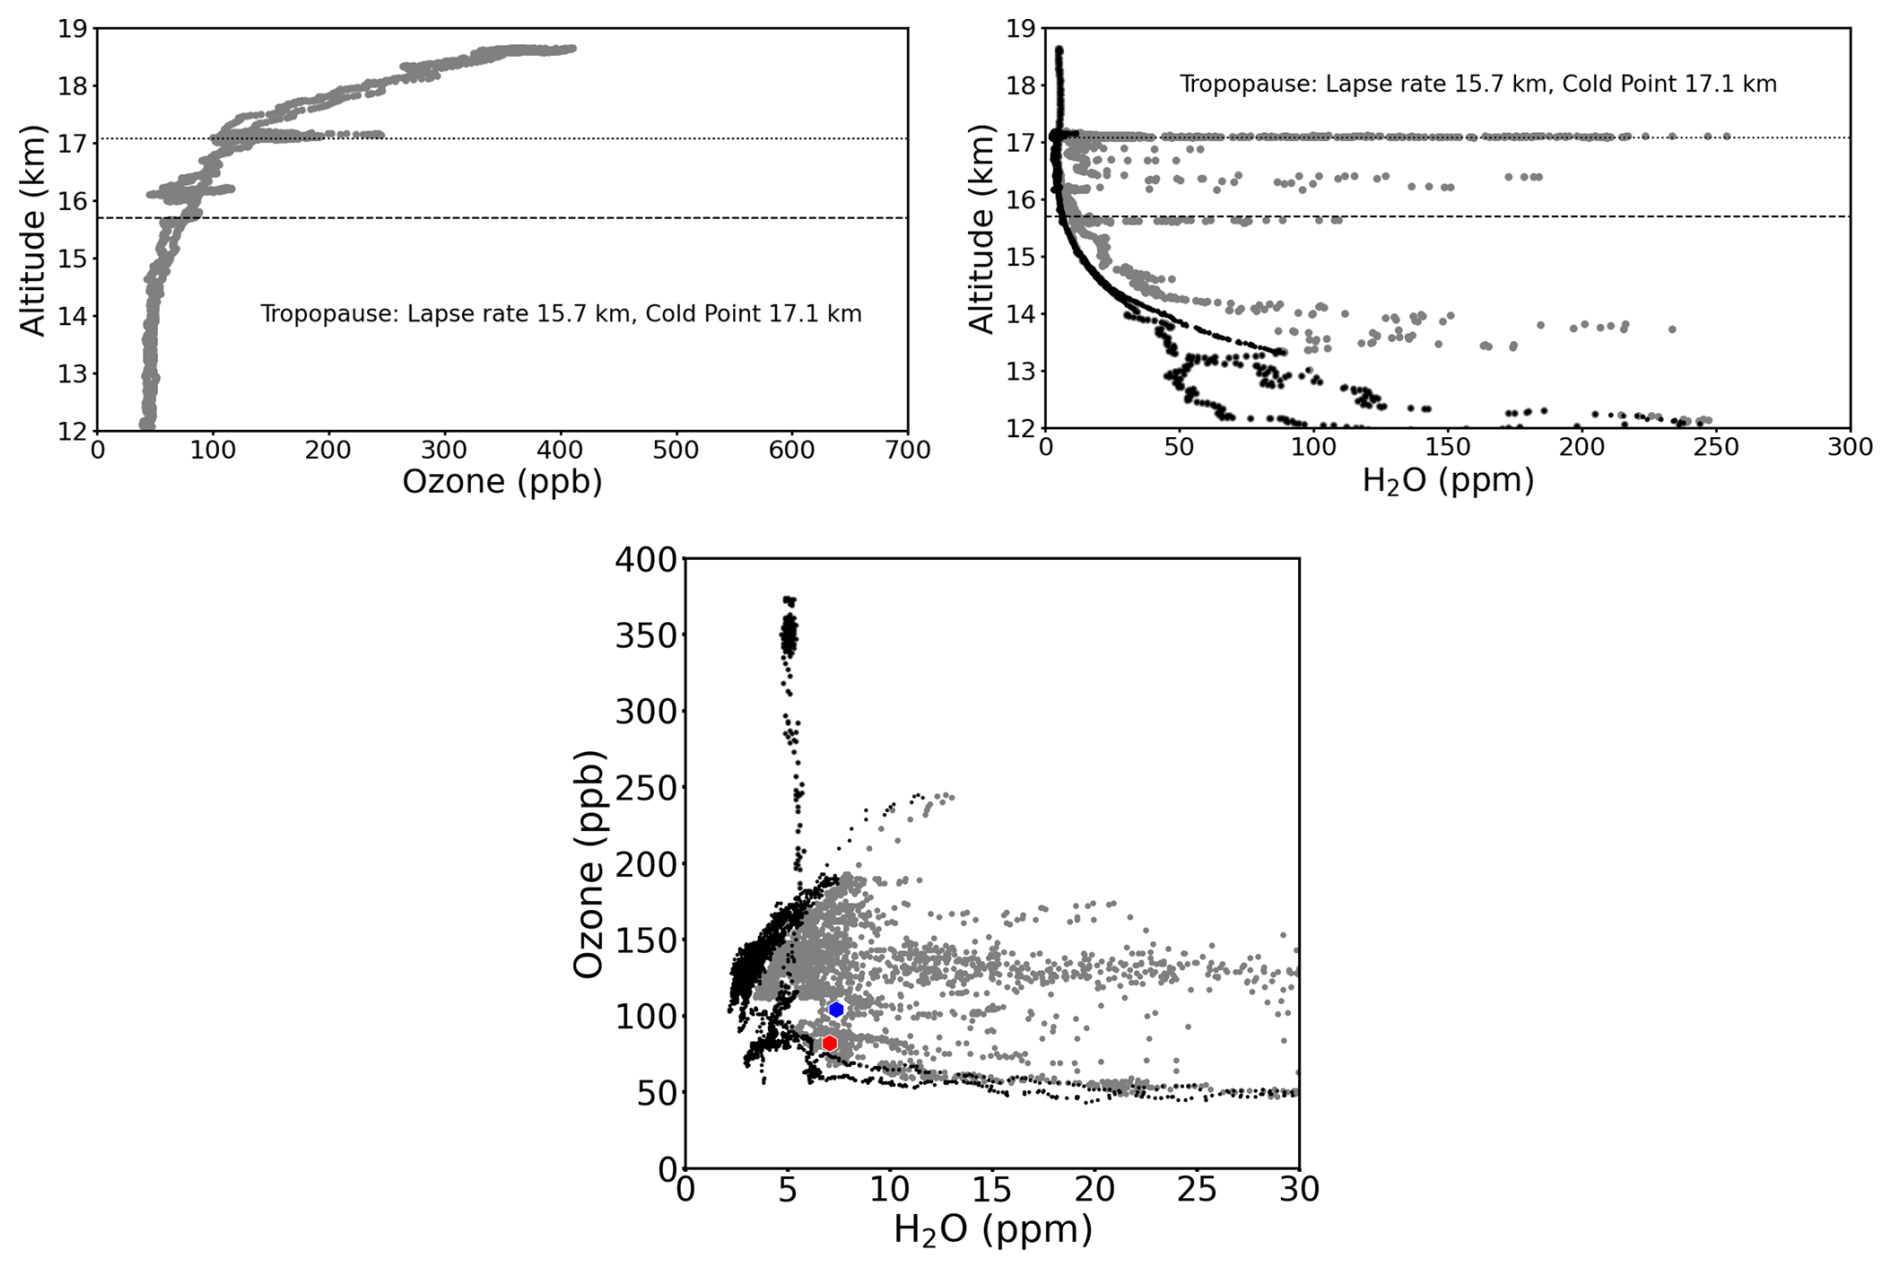
Figure 5Measurements of ozone (top left) and water vapour (top right) versus altitude in the vicinity of the tropopause for the scientific flight on 10 August 2017. The dashed line shows the altitude of the lapse rate tropopause and the dotted line the altitude of the cold point tropopause. Tropopause information is for the first three hours of the flight (see Table 1), ozone and water vapour measurements are for the entire flight. In top right panel and in the scatter plot in the bottom panel, grey symbols indicate the FISH total water vapour measurements and black points show the gas-phase water vapour measurements by the FLASH instrument. The red symbol in the bottom panel indicates the location of the lapse rate tropopause; the blue symbol the location of the cold point tropopause.
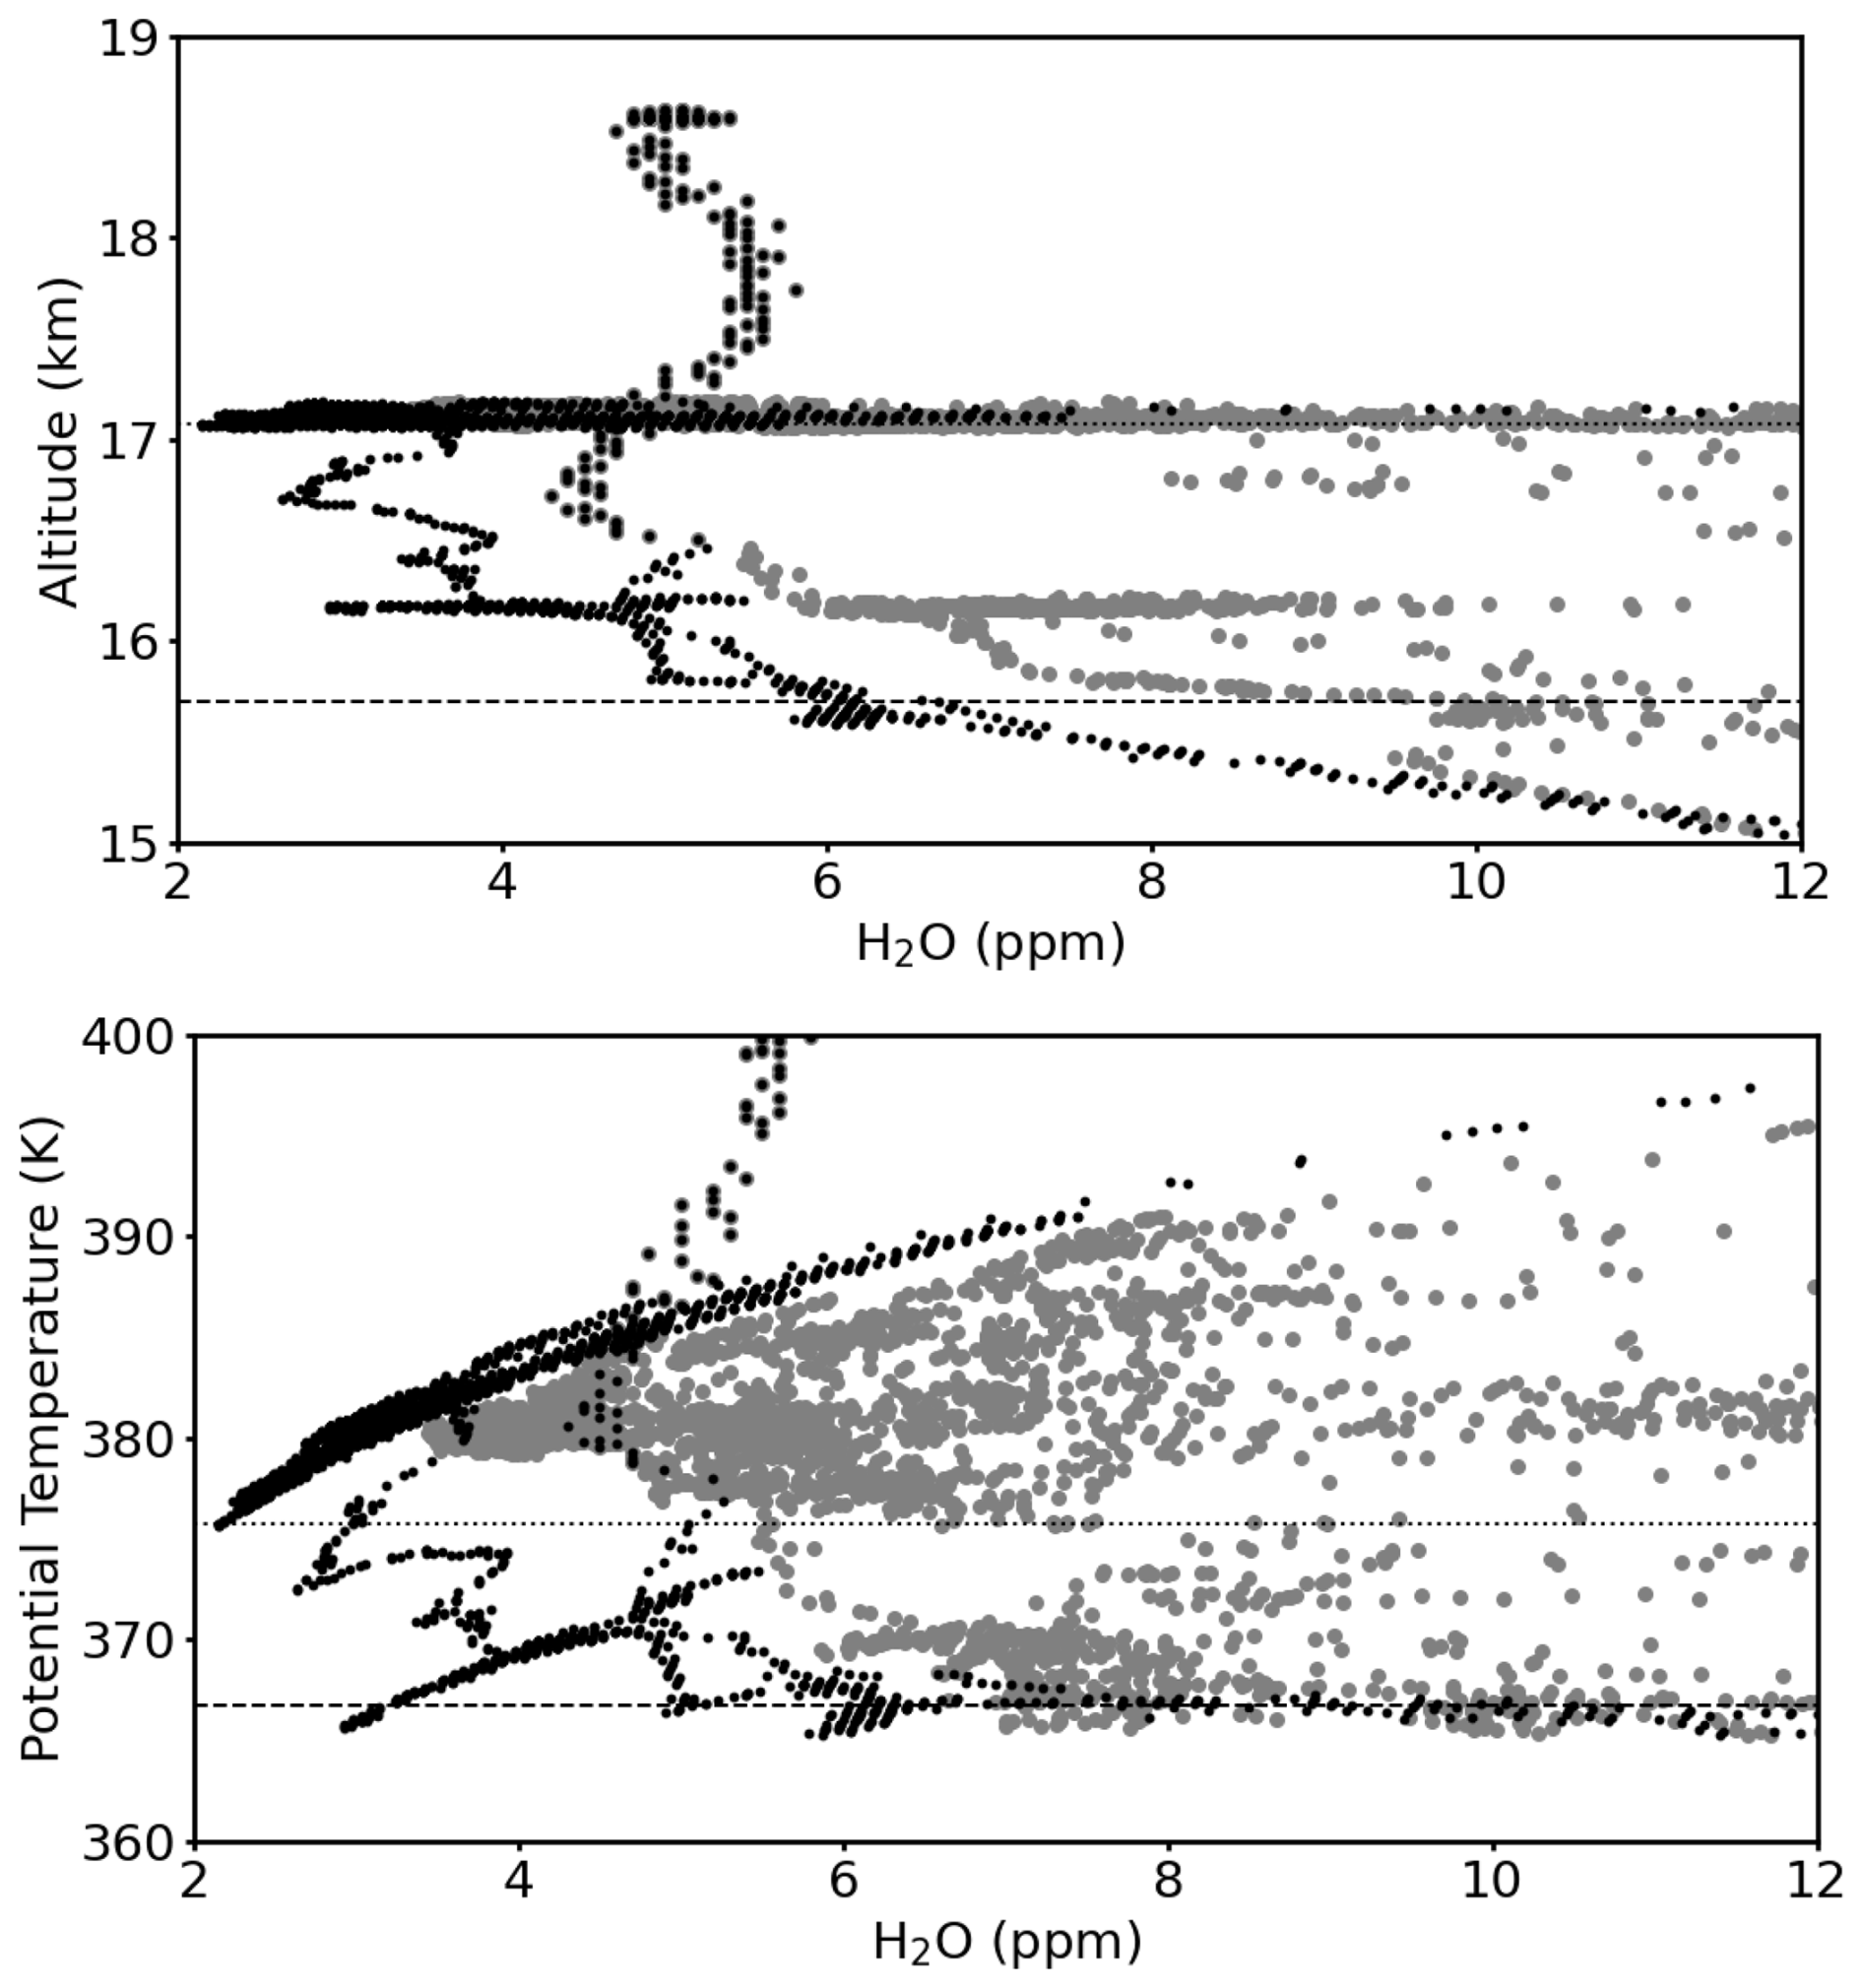
Figure 6Water vapour versus altitude (top) and versus potential temperature (bottom) in the vicinity of the cold point and the lapse rate tropopause for the scientific flight on 10 August 2017 (similar as in Fig. 5, top right, but for a reduced range of observed water vapour values). The dotted line shows the cold point for this flight (17.1 km, top, and 375.8 K, bottom) and the dashed line the lapse rate tropopause (15.7 km, top, and 366.7 K, bottom). Grey symbols indicate the FISH total water vapour measurements and black points show the gas-phase water vapour measurements by the FLASH instrument. The aircraft measurements extend to about 420 K.
The part of the flight on 10 August 2017 between 09:45 and 11:10 local time (local time is used throughout the paper) was conducted close to the pressure level of the cold point tropopause (not shown). Thus, the particle occurrence (i.e., the enhanced water vapour measured by FISH) close to the cold point tropopause (Fig. 5, top right) consists of a series of peaks of enhanced water vapour sampled between 09:45 and 11:10.
Ozone mixing ratios on 10 August 2017 are low and not very variable between 12 and 14 km; they increase slightly between 14 km and the lapse rate tropopause (Fig. 5, top left panel). Ozone mixing ratios increase above the lapse rate tropopause and are much more variable than below. Ozone increases further above the cold point tropopause and there is a large variability of ozone at the cold point tropopause, with mixing ratios ranging between ∼100 and 350 ppb.
The ozone-H2O scatterplot for 10 August 2017 (see Fig. 5, bottom) corroborates the findings deduced from the observed profiles (Fig. 5, top); the scatterplot shows in general an “L-shape” with an enhancement of gas-phase water vapour at about 60–170 ppb ozone. Very low water vapour mixing ratios (below about 3 ppm) are observed during this flight (for ozone mixing ratios of about 100–150 ppb).
These water vapour observations indicate that (under the conditions of strong convection) dehydration occurs at altitudes close to the cold point tropopause (Figs. 5, top right, and 6), where there is supersaturation (Fig. 7). However, using potential temperature as the vertical coordinate (Fig. 6, bottom) indicates that particle occurrence under conditions of strong convection extends to about 390 K.
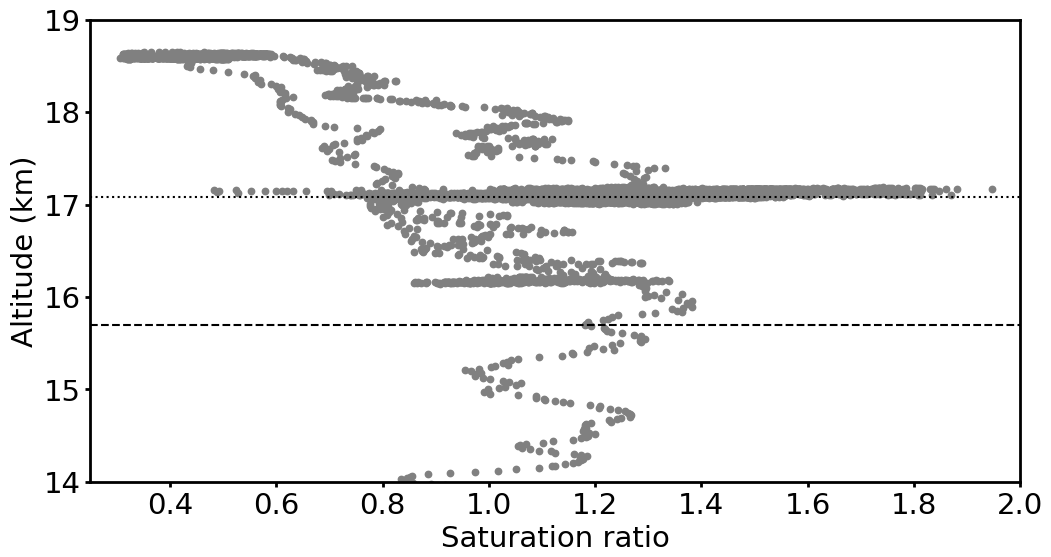
Figure 7Saturation ratio of H2O over ice versus altitude for the scientific flight on 10 August 2017 in the vicinity of the cold point and the lapse rate tropopause. Gas-phase H2O measurements are from the FLASH instrument; these measurements are used to calculate the water vapour saturation ratio. The dotted line shows the cold point for this flight (17.1 km) and the dashed line the lapse rate tropopause (15.7 km). The top altitude for which FISH observed ice particles is 17.1 km. (See Supplement for a figure showing potential temperature as the vertical axis.)
Importantly, the particles for conditions of strong convection (the first two hours of the flight) occur in strongly supersaturated air (Fig. 7). Thus these particles will grow and therefore likely sediment. Sedimenting ice particles will dehydrate the air mass they occur in; thus for the flight on 10 August, supersaturated air in the vicinity of the cold point should lead to dehydrating the air mass at the cold point tropopause.
However, particles and supersaturated air masses occur between the cold point and the lapse rate tropopause, indicating further dehydration occurring at these altitudes. Particles also occur in the troposphere, below the lapse rate tropopause (Fig. 5, top right).
3.3.5 General properties of the cold point and the lapse rate tropopause in the Asian summer monsoon anticyclone
Up to the lapse rate tropopause, ozone mixing ratios are relatively low, the air is humid and frequent occurrence of cloud particles is observed. Water vapour mixing ratios decrease with increasing altitude and with slightly increasing ozone mixing ratios. Thus we conclude that the lapse rate tropopause in the Asian summer monsoon anticyclone constitutes a good estimate for the upper boundary of the well mixed tropospheric air mass.
Between the lapse rate tropopause and the cold point, the air masses show no longer a tropospheric character, ozone mixing ratios increase with altitude. Further, convection may penetrate the lapse rate tropopause and humidify the region above the lapse rate tropopause. Water vapour mixing ratios in the ASMA in 2017 above the cold point tropopause (i.e., also above the lapse rate tropopause) range up to ∼5–6 ppm. Moister patches with enhancements in water vapour mixing ratios up to ∼10 ppm are occasionally observed. However, for strong convection, severe dehydration is indicated by the occurrence of ice particles in supersaturated air very close to the cold point tropopause.
Here, with a focus on the Asian Monsoon; we confirm earlier reports for the tropical west Pacific in winter (Pan et al., 2018) that the lapse rate tropopause identifies the transition from tropospheric air masses to stratospheric air masses. We also find that in the Asian monsoon the air is generally drier at and above the cold point tropopause than below; again consistent with earlier reports for winter in the west Pacific (Pan et al., 2018) and near tropical central America at 10° N (Richard et al., 2006). It should be noted that an early stratosphere-troposphere model already predicted the role of monsoonal circulation in air entry to the stratosphere (Allam and Tuck, 1984a, b). However, the air above the cold point tropopause in the Asian summer monsoon is more humid (mixing ratios of ∼3–10 ppm) than in the west Pacific in winter (∼3 ppm, Pan et al., 2018).
Ozone mixing ratios in the ASMA, increase moderately with altitude in the upper troposphere (below the lapse rate tropopause) and increase substantially above the lapse rate tropopause (e.g., Pan et al., 2018; Brunamonti et al., 2018; Fadnavis et al., 2023). Ozone mixing ratios between the cold point tropopause and the lapse rate tropopause range between 50 and 200 ppb, consistent with measurements in the west Pacific in winter (Pan et al., 2018).
In the Asian monsoon region, penetration of deep convective systems to above the lapse rate tropopause (Clapp et al., 2023) and also (but to a lesser extent) above the cold point tropopause occurs. If ice particles reach the lowermost stratosphere and sublimate there (before the particles sediment) this process may cause local hydration. Indeed, layers of enhanced gas-phase water vapour (below ≈10 ppm) above the lapse rate and the cold point tropopause were observed on 29 July and 8 August 2017 (Lee et al., 2019; Khaykin et al., 2022, see also Figs. 2, 3, and 6). There are also observations of enhanced water vapour mixing ratios of ≈10 ppm in the lowermost stratosphere over North America during and before the American monsoon (Robrecht et al., 2019). However, such conditions of enhanced water vapour are not observed frequently.
On the flight on 8 August 2017 (Fig. 4), the occurrence of ice particles was observed at ∼390 K (17 km) and an enhancement in gas-phase water vapour at ∼400–410 K (18–19 km) above the cold point tropopause in agreement with earlier reports (Lee et al., 2019; Khaykin et al., 2022). In moist, supersaturated air parcels, prevailing above the cold point tropopause, formation of ice particles is possible. However, it is not obvious that these ice clouds cause substantial dehydration because of a limited spatial and temporal extent of such air parcels and because of a limited size (causing a low sedimentation velocity) of the ice particles (Khaykin et al., 2022).
Overall, we observe a certain variability of gas-phase water vapour in the Asian summer monsoon region as both dehydration of air caused by freeze drying (water vapour mixing ratios below about 3 ppm) and hydration caused by convective overshoots (water vapour mixing ratios ≲10 ppm) of the cold point tropopause occurs (consistent with the findings of Emmanuel et al., 2021).
The scientific flight on 10 August 2017 allowed the tropopause conditions of strong convection to be investigated. Kuang and Bretherton (2004) report that the cold point tropopause under such conditions is strongly tied to the convective cooling maximum. This is consistent with substantial ice particle occurrence around the cold point tropopause as observed during the flight on 10 August 2017 (Figs. 5 and 6). The ice particles at the cold point exist in strongly supersaturated air (Fig. 7) and will thus likely sediment. This would lead to dehydration at the cold point tropopause until a saturation of one is reached, again consistent with the conclusions of Kuang and Bretherton (2004). The findings by Kuang and Bretherton (2004) that the cold point tropopause is strongly tied to convection suggests that dehydration processes at the cold point can be assumed as abrupt.
Our analysis for the flight on 10 August indicates that stratospheric water vapour mixing ratios in the Asian summer monsoon region are regulated by cold point temperatures, and that deep convection overshooting the lapse rate tropopause plays a relatively minor role in moistening the stratosphere (supporting conclusions in earlier work based on remote sensing observations, Randel et al., 2015). Further, the conclusion of very rapid transport from the ground up to the cold point on 10 August 2017 is also supported by the CO2 measurements during this flight: CO2 mixing ratios in the vicinity of the cold point (about 375 K, Fig. 6) are of lower tropospheric character (mixing ratios below about 400 ppm, Vogel et al., 2024, their Fig. A3).
The lapse rate tropopause, in the ASMA, marks the top boundary of tropospheric air. Tropospheric air is vertically mixed, humid and relatively low in ozone; insofar, the lapse rate tropopause in the Asian summer monsoon constitutes an air mass boundary. Further, the lapse rate tropopause (in contrast to the cold point tropopause) constitutes a clear discontinuity in the profile of temperature against potential temperature (Fig. 1, bottom, and electronic supplement). Nonetheless, the demarcation between the troposphere and the stratosphere is different for different trace species, for example there is freeze out of water vapour at the lowest temperatures, chemical production of ozone in the stratosphere and limited inmixing of aged lower stratospheric air into tropospheric air ascending into the lowermost stratosphere. Vertical ascent () in the ASMA through layers of constant potential temperature θ occurs according to the atmospheric heating rate (Eq. 2) with no local (long-term) obstacle for vertical transport. The location of the lapse rate tropopause in the Asian summer monsoon is thus not determined by local processes.
Thus, the air masses below and above the lapse rate tropopause are very different. In other words, the lapse rate tropopause and the cold point tropopause are two different things (in spite of both being referred to as “tropopause”); they constitute boundaries of different air masses. Commonly, the cold point is located substantially (about 1 km) above the lapse rate tropopause. Above the cold point tropopause in the Asian Monsoon, the air is largely stratospheric; i.e., the air is dry and ozone mixing ratios increase with altitude.
Therefore, it is necessary to specify, whether convective systems are overshooting the lapse rate or the cold point tropopause. On some occasions, deep convective systems may penetrate the cold point tropopause. Under such conditions, sublimating cloud particles can humidify the air above the cold point tropopause. Such conditions were observed during the flight on 8 August 2017 (Fig. 4) with total water mixing ratios of ≲7 ppm ∼1 km (∼25 K) above the cold point tropopause.
Moist plumes caused by convection above the cold point tropopause may reach a layer characterised by radiatively driven upward motion of ≈1 K d−1 (Legras and Bucci, 2020). Thus, such moist air parcels – as long as they remain unmixed – will rise to greater potential temperatures (altitudes). This type of air parcels was also detected in balloon measurements in the ASMA above the cold point tropopause in 2016 and 2017 (Brunamonti et al., 2018). However, a hydration of the lowermost stratosphere is not regularly observed. Further, in such moist air parcels, new ice cloud formation is possible (Khaykin et al., 2022).
When convection is strong (flight on 10 August 2017), particle occurrence and oversaturation is observed in close proximity of the cold point tropopause (Figs. 5, top right, 6, and 7). A very strong enhancement of total water (i.e., ice particle occurrence) is noticeable close to the cold point tropopause at about 17.1 km (about ±100 m around the cold point, Fig. 6). The coincidence of the cold point tropopause and the ice particle occurrence at an altitude of ∼17.1 km leads to the hypothesis that the same processes are responsible for the formation of the cold point and for the formation of cloud particles. Thus strong convection should lead to dehydration at the cold point tropopause and not to a moistening of the stratosphere.
Further, a clear enhancement of ozone mixing ratios (up to about 250 ppb) is visible at the location of the cold point tropopause (Fig. 5, top left). There is no indication in the Geophysica measurements in the Asian summer monsoon in 2017 of humidification of stratospheric air exceeding mixing ratios of ∼10 ppm of water vapour above the cold point tropopause. Overall, the air in the lower stratosphere above the Asian monsoon anticyclone is moister (water vapour mixing ratios of ∼3–10 ppm) than in winter over the west Pacific (water vapour mixing ratios of ∼3 ppm).
Here we investigate solely measurements in the Asian monsoon anticyclone in 2017. However there is a substantial interannual variability of the monsoon (e.g., Kachula et al., 2025). To address this variability, the analysis of measurements in other years is required. Moreover, it will be possible to further exploit the aircraft measurements in 2017 by extending the analysis to other measurements on the plane.
Measurements of the species and quantities considered here (namely ozone, water vapour, temperature and cloud occurrence) are in principle also accessible through balloon-borne measurements (e.g., Bian et al., 2012; Renard et al., 2016; Gao et al., 2016; Brunamonti et al., 2018; Bian et al., 2020; Hanumanthu et al., 2020; Fadnavis et al., 2023; Clemens et al., 2024). Measurements of cloud occurrence are not straightforward as it is difficult to cover the entire size range of cloud particles occurring in the atmosphere in measurements. In the future, when fewer satellite observations will be available (Salawitch et al., 2025) networks of balloon-borne observations might become increasingly important (Müller et al., 2016; Bian et al., 2020; Fadnavis et al., 2023). Therefore, in future work, an extension of the present analysis for the Asian monsoon will be possible (based on balloon-borne measurements), which will feature more profiles (and thus a better statistics) and will allow inter-annual as well as intra-seasonal variability to be addressed.
Frequently, there is the question regarding the relation between altitude, potential temperature and pressure in the upper troposphere and lower stratosphere (Krämer et al., 2020, Fig. 2) and in particular in the ASMA. Therefore, empirical fits (based on the aircraft measurements, Stefanutti et al., 1999; Shur et al., 2006, in the Asian summer monsoon in 2017) for the relations in question are provided here. The empirical (polynominal) fits are given below, the coefficients used for the fits are listed in Table A1. For altitude and potential temperature one may use the ansatz:
and likewise for pressure and potential temperature
where x is potential temperature for values greater than 350 K (see also Figs. A1 and A2).
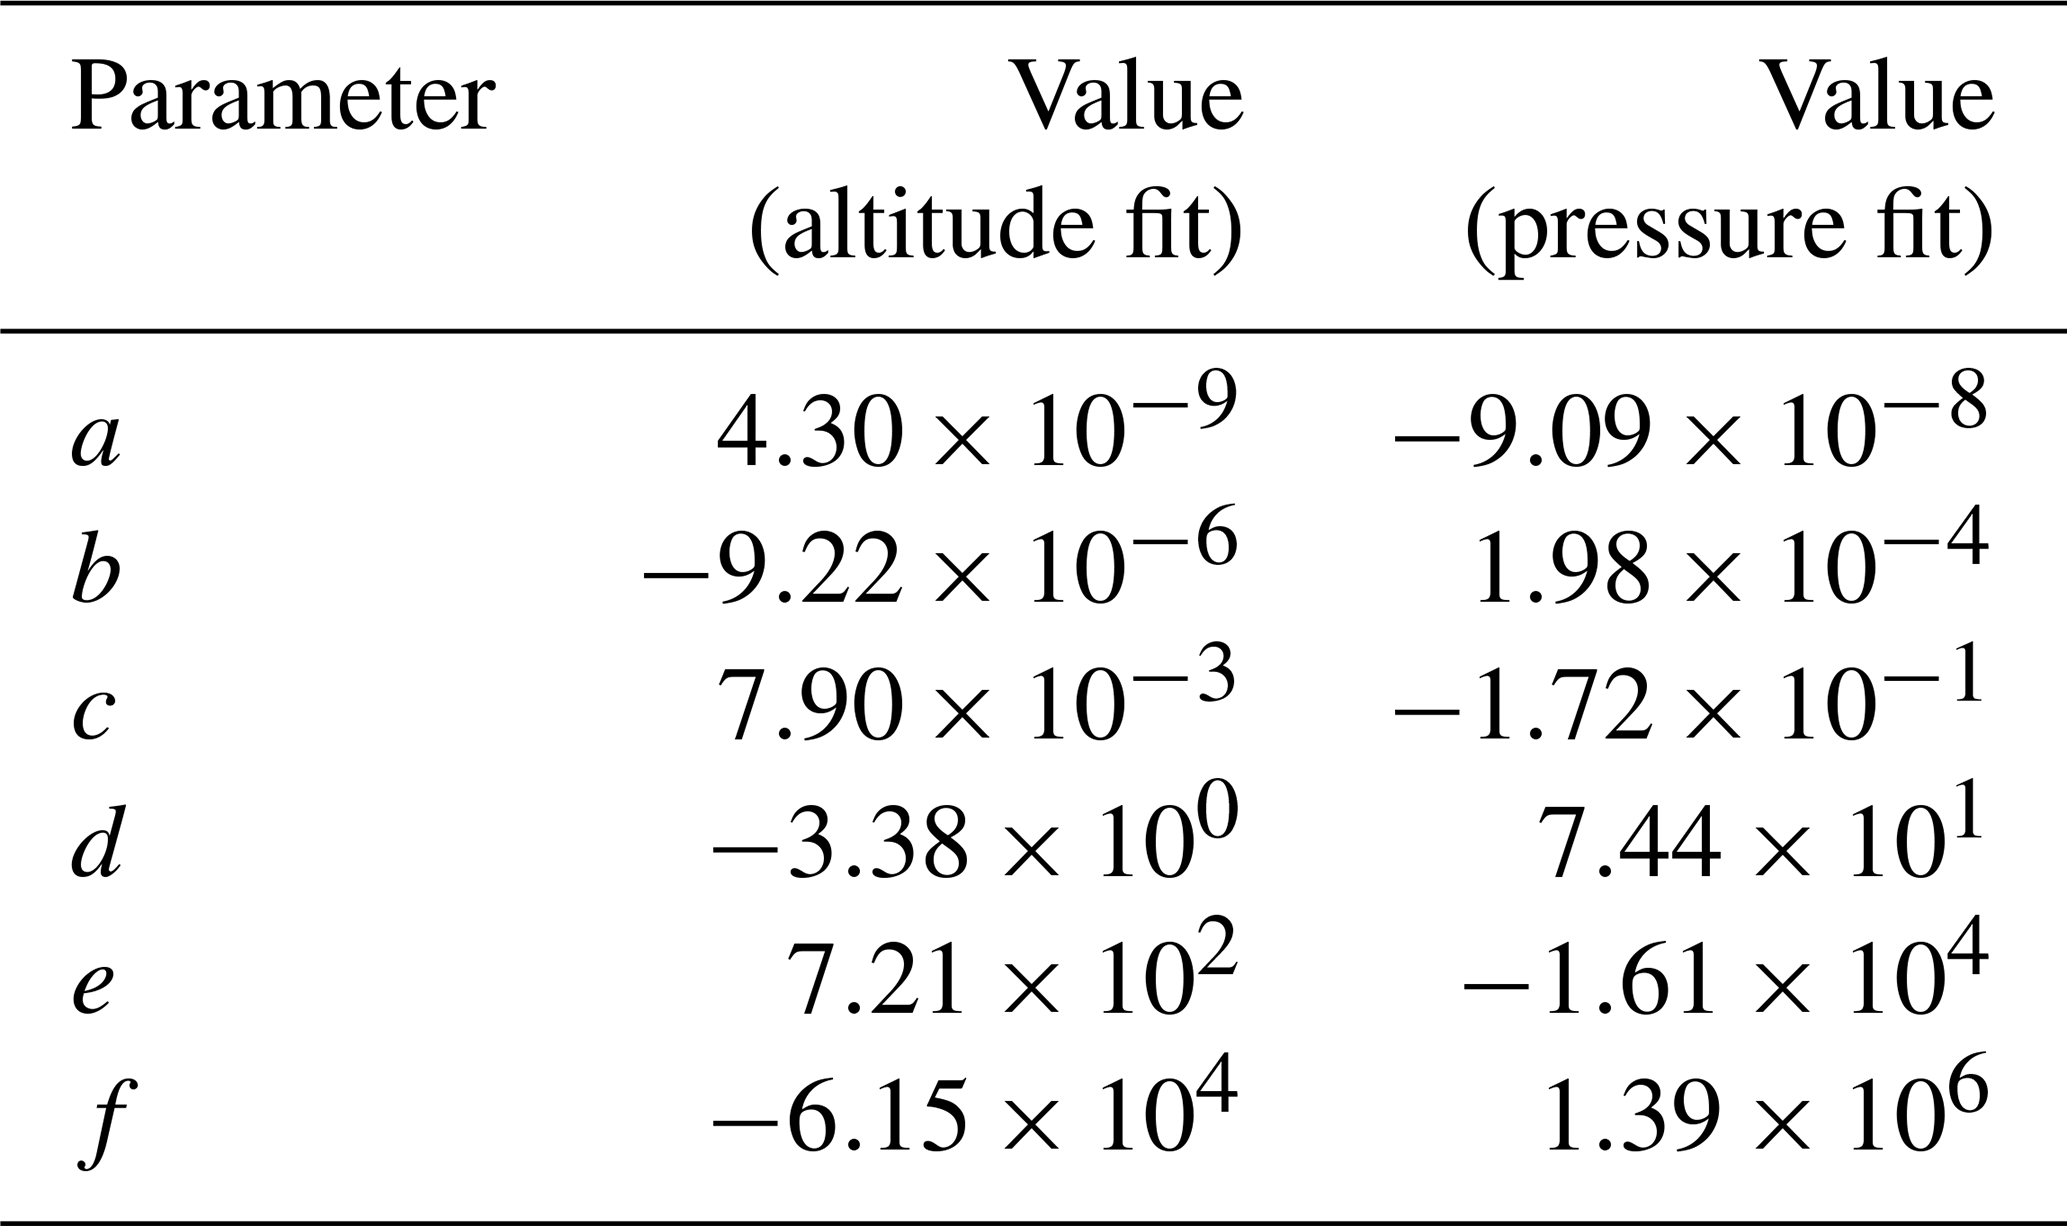
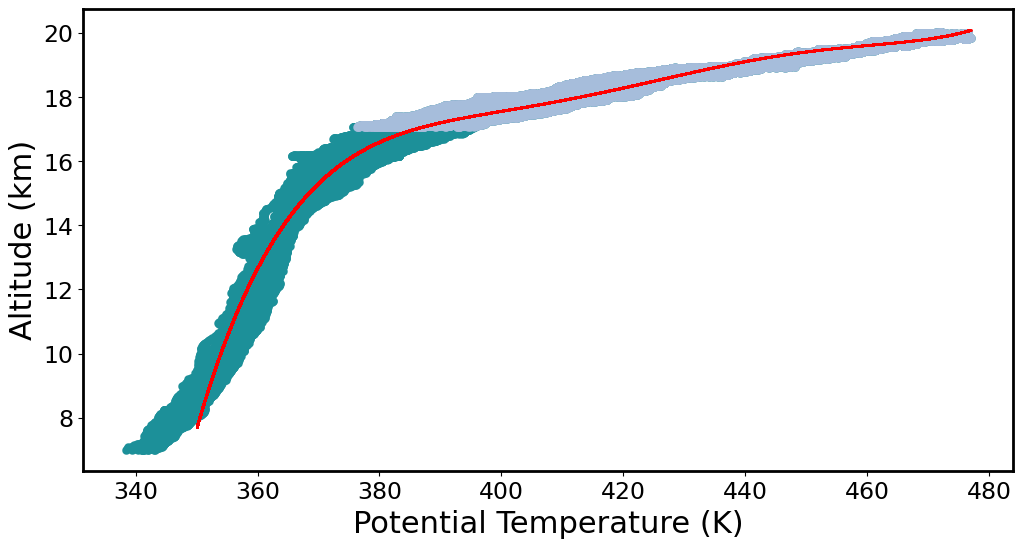
Figure A1The relation between altitude and potential temperature for all science flights from Kathmandu (dark). Measurements above the (mean) cold point tropopause are shown in light blue. Red line shows an empirical fit to the data for potential temperature greater than 350 K.
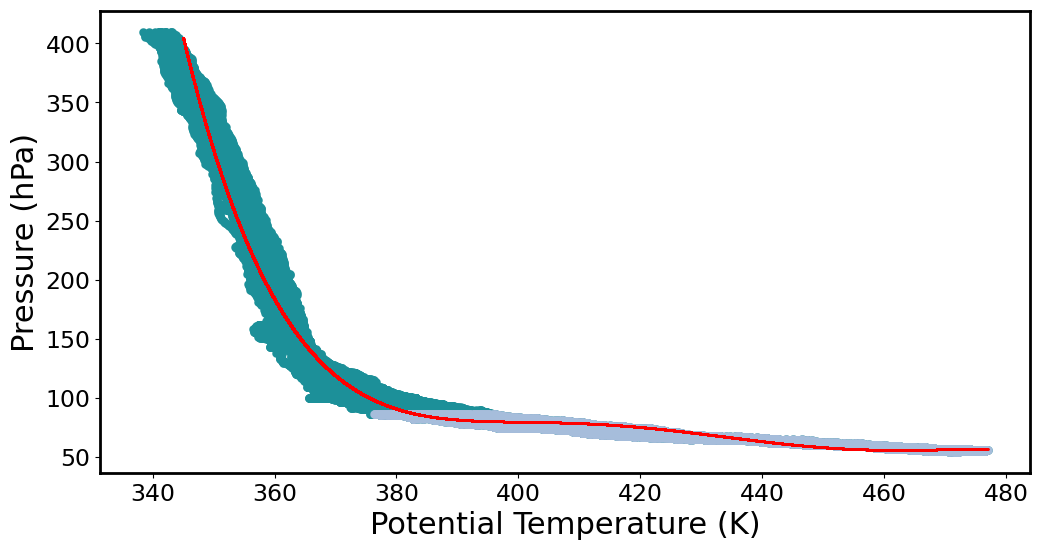
Figure A2The relation between pressure and potential temperature for all science flights from Kathmandu (dark). Measurements above the (mean) cold point tropopause are shown in light blue. Red line shows an empirical fit to the data for potential temperature greater than 350 K.
The relation between pressure p and altitude z (for an altitude range 8–20 km) is described well by an exponential dependence (not shown)
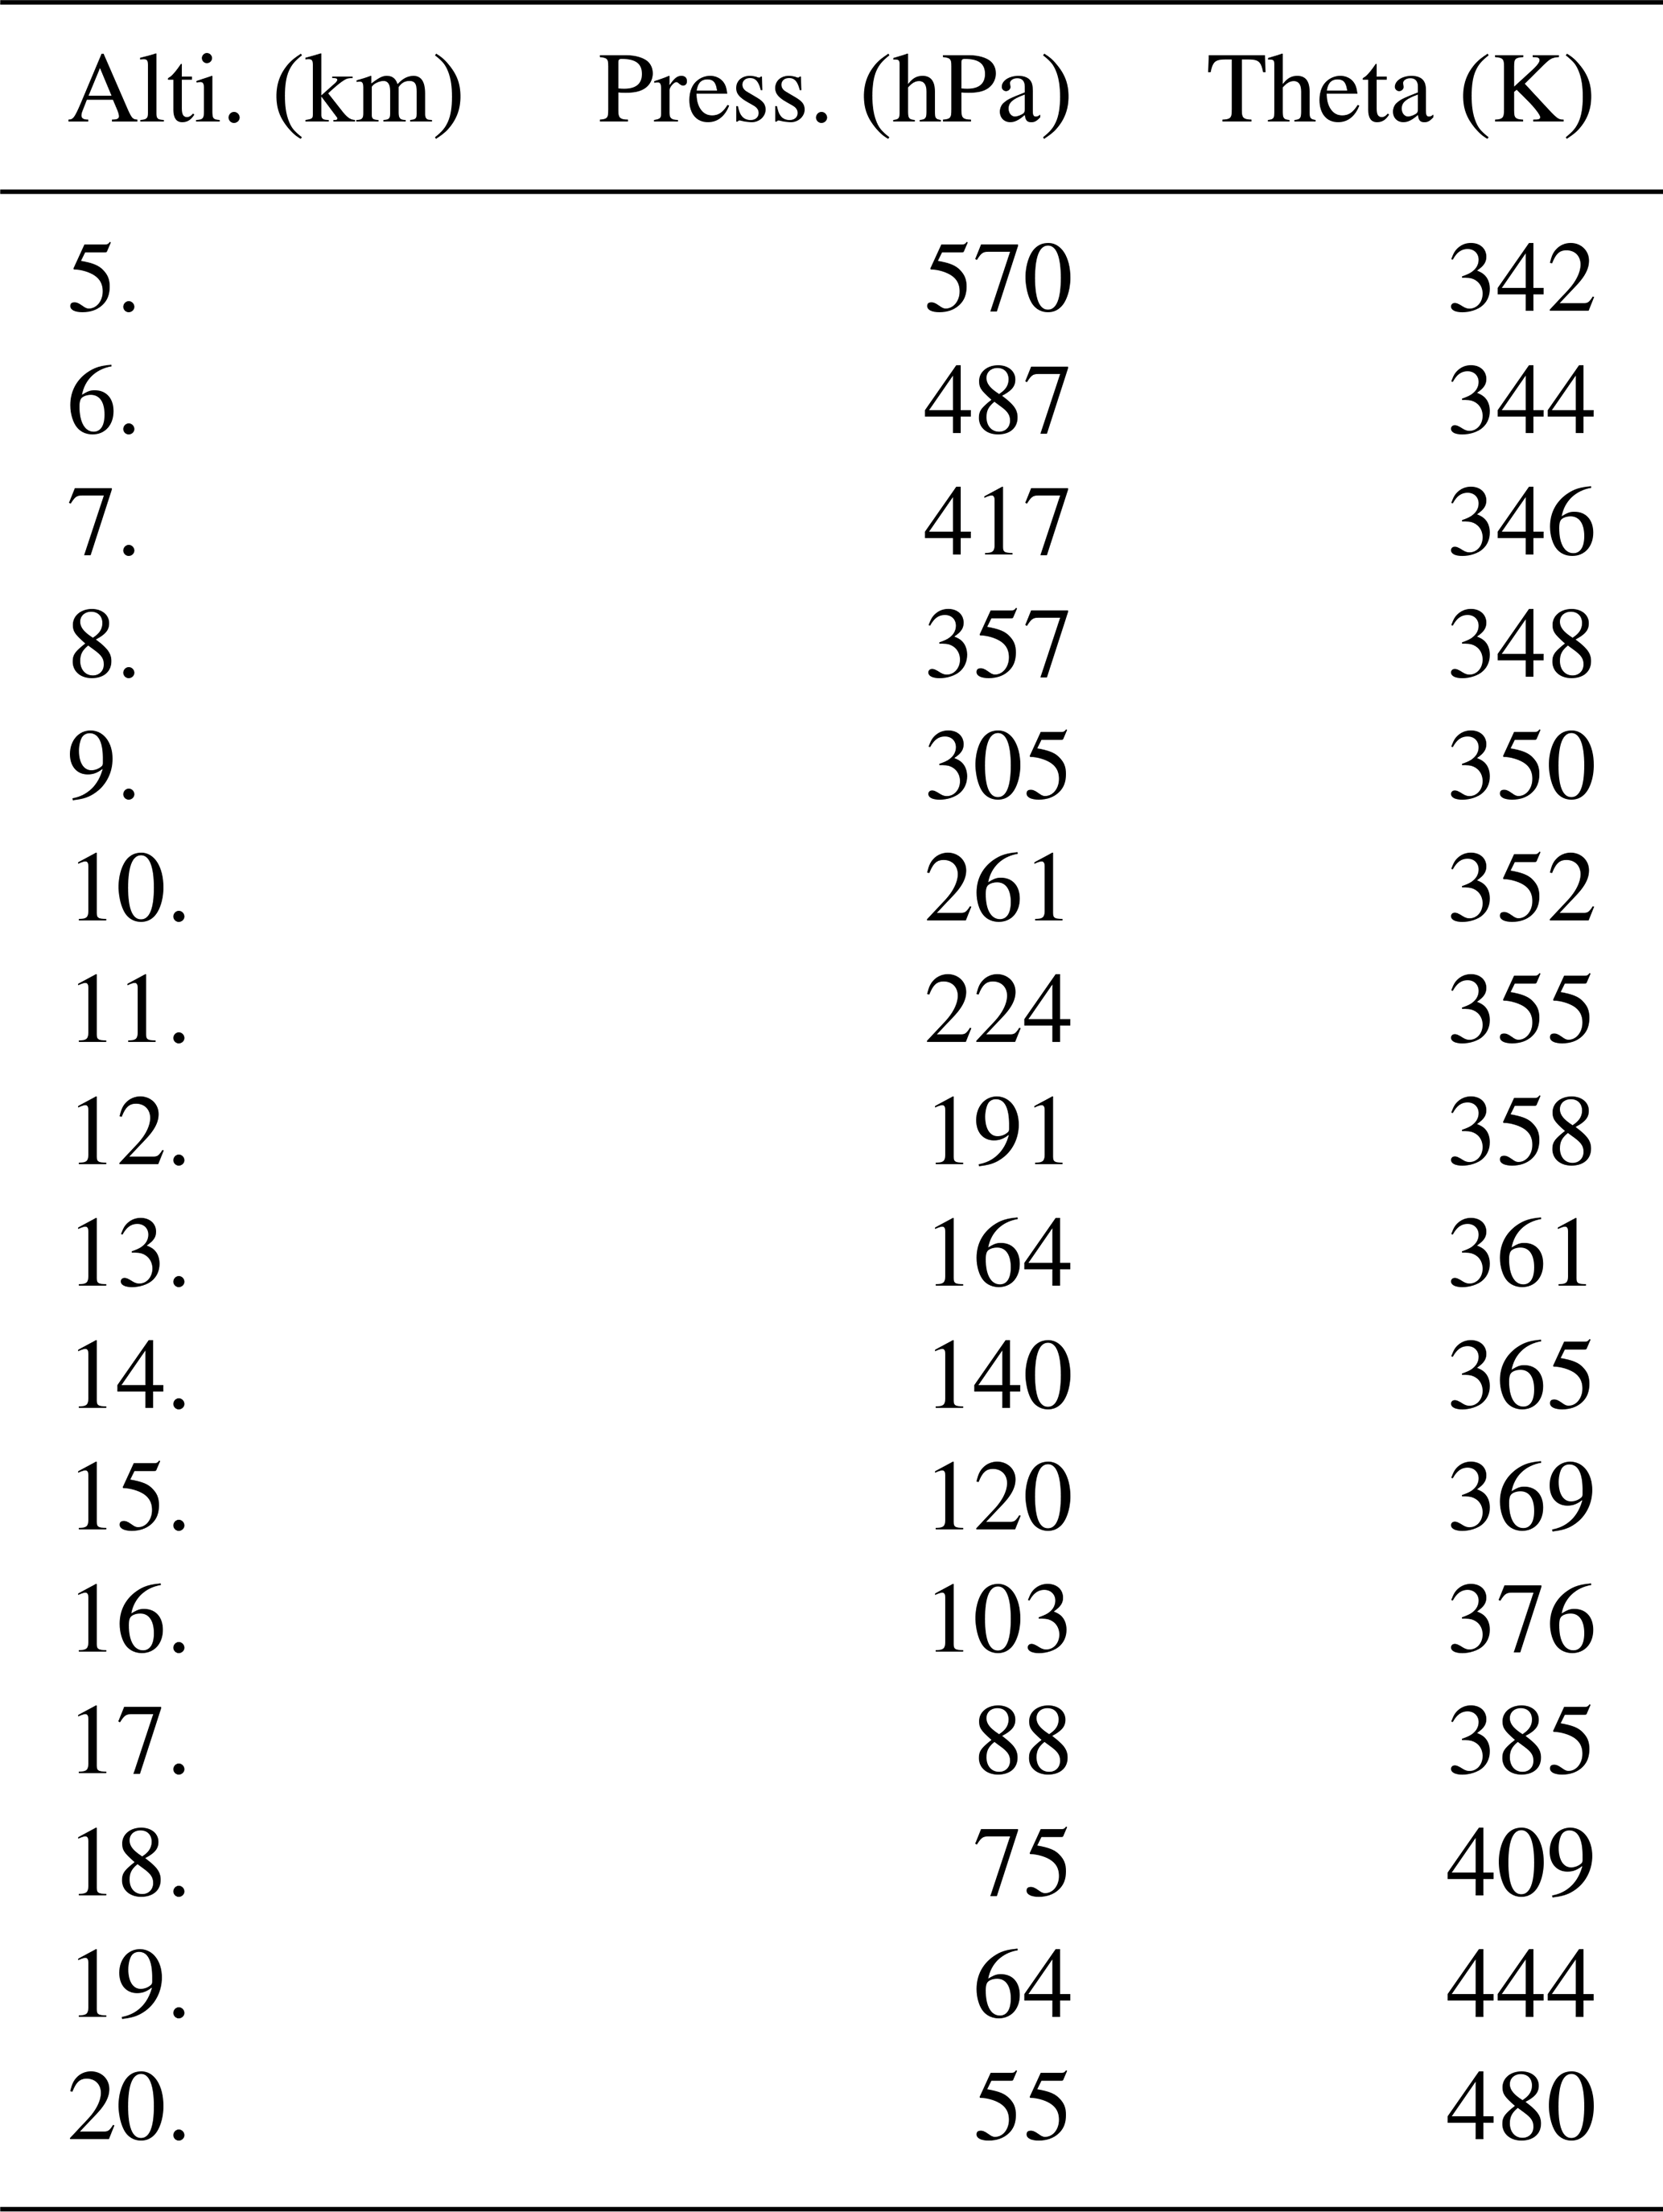
with pfit=1242 hPa and Hfit=6.42 km and where there is little variation of the relation above and below the tropopause (note that the values pfit and Hfit are only fitting parameters, the relation is valid for 8–20 km). The approximate values derived from Eq. (A3) are shown in Table A2.
The code to calculate the location of the lapse rate tropopause is available at https://gitlab.physik.uni-muenchen.de/LDAP_ag-birner/tropopause/-/blob/master/tropopause.py (last access: 24 March 2026).
The measurements used here were obtained during the scientific flights of the StratoClim aircraft campaign in summer 2017; the data are available on the HALO database at https://halo-db.pa.op.dlr.de/mission/101 (last access: 24 March 2026) (DLR, 2026).
The supplement related to this article is available online at https://doi.org/10.5194/acp-26-4359-2026-supplement.
MK, CR and NS provided the FISH measurements used here; FR provided the ozone measurements used here. All co-authors discussed the results of the study and helped formulating the manuscript.
At least one of the (co-)authors is a member of the editorial board of Atmospheric Chemistry and Physics. The peer-review process was guided by an independent editor, and the authors also have no other competing interests to declare.
Publisher's note: Copernicus Publications remains neutral with regard to jurisdictional claims made in the text, published maps, institutional affiliations, or any other geographical representation in this paper. The authors bear the ultimate responsibility for providing appropriate place names. Views expressed in the text are those of the authors and do not necessarily reflect the views of the publisher.
We thank Fred Stroh very much for help with data processing and for comments on the quality of the measurements used here. We further gratefully acknowledge Matthias Riße and Gebhard Günther for help with the python code used for this study. We thank the TDC and the UCSE team very much for producing thermodynamic measurements, A. Lykov, V. Yushkov and the FLASH team for the gas-phase water vapour measurements, A. Ulanovsky, V. Yushkov and the FOZAN team for measurements of ozone on the high-flying laboratory Geophysica. Not being included as coauthors of the present work does not reflect any limitation in the scientific contribution of the TDC, UCSE, FLASH, and FOZAN teams. Two anonymous reviewers provided comments on the original manuscript, which helped improving the paper. We thank A. Tuck and P. Konopka for helpful comments and discussions.
The article processing charges for this open-access publication were covered by the Forschungszentrum Jülich.
This paper was edited by Jayanarayanan Kuttippurath and reviewed by two anonymous referees.
Adcock, K. E., Fraser, P. J., Hall, B. D., Langenfelds, R. L., Lee, G., Montzka, S. A., Oram, D. E., Röckmann, T., Stroh, F., Sturges, W. T., Vogel, B., and Laube, J. C.: Aircraft-based observations of ozone-depleting substances in the upper troposphere and lower stratosphere in and above the Asian summer monsoon, J. Geophys. Res., 126, e2020JD033137, https://doi.org/10.1029/2020JD033137, 2021. a
Afchine, A., Rolf, C., Costa, A., Spelten, N., Riese, M., Buchholz, B., Ebert, V., Heller, R., Kaufmann, S., Minikin, A., Voigt, C., Zöger, M., Smith, J., Lawson, P., Lykov, A., Khaykin, S., and Krämer, M.: Ice particle sampling from aircraft – influence of the probing position on the ice water content, Atmos. Meas. Tech., 11, 4015–4031, https://doi.org/10.5194/amt-11-4015-2018, 2018. a
Allam, R. J. and Tuck, A. F.: Transport of water vapour in a stratosphere-troposphere general circulation model I. Fluxes, Q. J. Roy. Meteor. Soc., 110, 321–356, 1984a. a, b, c
Allam, R. J. and Tuck, A. F.: Transport of water vapour in a stratosphere-troposphere general circulation model II. Trajectories, Q. J. Roy. Meteor. Soc., 110, 357–392, 1984b. a, b, c
Appel, O., Köllner, F., Dragoneas, A., Hünig, A., Molleker, S., Schlager, H., Mahnke, C., Weigel, R., Port, M., Schulz, C., Drewnick, F., Vogel, B., Stroh, F., and Borrmann, S.: Chemical analysis of the Asian tropopause aerosol layer (ATAL) with emphasis on secondary aerosol particles using aircraft-based in situ aerosol mass spectrometry, Atmos. Chem. Phys., 22, 13607–13630, https://doi.org/10.5194/acp-22-13607-2022, 2022. a
Bauchinger, S., Engel, A., Jesswein, M., Keber, T., Bönisch, H., Obersteiner, F., Zahn, A., Emig, N., Hoor, P., Lachnitt, H.-C., Weyland, F., Ort, L., and Schuck, T. J.: The extratropical tropopause – trace gas perspective on tropopause definition choice, Atmos. Chem. Phys., 25, 14167–14186, https://doi.org/10.5194/acp-25-14167-2025, 2025. a, b
Becker, F., Vogel, B., Günther, G., Ploeger, F., Riese, M., Rosanka, S., Taraborrelli, D., Nützel, M., Jöckel, P., Brinkop, S., and Müller, R.: Upward transport of boundary layer air to altitudes of the Asian summer monsoon anticyclone in Eulerian and Lagrangian model simulations, Meteorol. Z., 34, 195–211, https://doi.org/10.1127/metz/1266, 2025. a, b
Bethan, S., Vaughan, G., and Reid, S. J.: A comparison of ozone and thermal tropopause heights and the impact of tropopause definition on quantifying the ozone content of the troposphere, Q. J. Roy. Meteor. Soc., 122, 929–944, 1996. a, b
Bian, J., Pan, L. L., Paulik, L., Vömel, H., and Chen, H.: In situ water vapor and ozone measurements in Lhasa and Kunmin during the Asian summer monsoon, Geophys. Res. Lett., 39, L19808, https://doi.org/10.1029/2012GL052996, 2012. a, b, c, d
Bian, J., Li, D., Bai, Z., Li, Q., Lyu, D., and Zhou, X.: Transport of Asian surface pollutants to the global stratosphere from the Tibetan Plateau region during the Asian summer monsoon, Natl. Sci. Rev., 7, 516–533, https://doi.org/10.1093/nsr/nwaa005, 2020. a, b
Brunamonti, S., Jorge, T., Oelsner, P., Hanumanthu, S., Singh, B. B., Kumar, K. R., Sonbawne, S., Meier, S., Singh, D., Wienhold, F. G., Luo, B. P., Boettcher, M., Poltera, Y., Jauhiainen, H., Kayastha, R., Karmacharya, J., Dirksen, R., Naja, M., Rex, M., Fadnavis, S., and Peter, T.: Balloon-borne measurements of temperature, water vapor, ozone and aerosol backscatter on the southern slopes of the Himalayas during StratoClim 2016–2017, Atmos. Chem. Phys., 18, 15937–15957, https://doi.org/10.5194/acp-18-15937-2018, 2018. a, b, c
Charlesworth, E., Ploeger, F., Birner, T., Baikhadzhaev, R., Abalos, M., Abraham, L., Akiyoshi, H., Bekki, S., Dennison, F., Jöckel, P., Keeble, J., Kinnison, D., Morgenstern, O., Plummer, D., Rozanov, E., Strode, S., Zeng, G., and Riese, M.: Stratospheric water vapor affecting atmospheric circulation, Nat. Commun., 14, 3925, https://doi.org/10.1038/s41467-023-39559-2, 2023. a
Clapp, C. E., Smith, J. B., Bedka, K. M., and Anderson, J. G.: Distribution of cross-tropopause convection within the Asian monsoon region from May through October 2017, Atmos. Chem. Phys., 23, 3279–3298, https://doi.org/10.5194/acp-23-3279-2023, 2023. a, b, c
Clemens, J., Vogel, B., Hoffmann, L., Griessbach, S., Thomas, N., Fadnavis, S., Müller, R., Peter, T., and Ploeger, F.: A multi-scenario Lagrangian trajectory analysis to identify source regions of the Asian tropopause aerosol layer on the Indian subcontinent in August 2016, Atmos. Chem. Phys., 24, 763–787, https://doi.org/10.5194/acp-24-763-2024, 2024. a, b
Dethof, A., O'Neill, A., Slingo, J. M., and Smit, H. G. J.: A mechanism for moistening the lower stratosphere involving the Asian summer monsoon, Q. J. Roy. Meteor. Soc., 556, 1079–1106, 1999. a
DLR: DLR Mission: STRATOCLIM, HALO database, https://halo-db.pa.op.dlr.de/mission/101, last access: 2 March 2026. a
Emmanuel, M., Sunilkumar, S., Muhsin, M., Satheesh Chandran, P., Parameswaran, K., Kumar, B. S., Maitra, A., Satyanarayana, A., and Nagendra, N.: Effect of monsoon dynamics and deep convection on the upper troposphere lower stratosphere water vapour over Indian monsoon region, Atmos. Res., 249, 105336, https://doi.org/10.1016/j.atmosres.2020.105336, 2021. a
Ertel, H.: Methoden und Probleme der Dynamischen Meteorologie, vol. 5 of Ergebnisse der Mathematik und ihrer Grenzgebiete, Verlag von Julius Springer, Berlin, reprint, https://doi.org/10.1007/978-3-642-65431-2, 1938. a
Fadnavis, S., Sagalgile, A., Sonbawne, S., Vogel, B., Peter, T., Wienhold, F. G., Dirksen, R., Oelsner, P., and Müller, R.: Comparison of ozone sonde measurements in the upper troposphere and lower Stratosphere in Northern India with reanalysis and chemistry-climate-model data, Sci. Rep.-UK, 13, 7133, https://doi.org/10.1038/s41598-023-34330-5, 2023. a, b, c, d
Fueglistaler, S., Dessler, A. E., Dunkerton, T. J., Folkins, I., Fu, Q., and Mote, P. W.: Tropical tropopause layer, Rev. Geophys., 47, RG1004, https://doi.org/10.1029/2008RG000267, 2009. a, b
Gage, K. S. and Reid, G. C.: Longitudinal variations in tropical tropopause properties in relation to tropical convection and El Niño-southern oscillation events, J. Geophys. Res., 92, 14197–14203, 1987. a
Gao, R. S., Telg, H., McLaughlin, R. J., Ciciora, S. J., Watts, L. A., Richardson, M. S., Schwarz, J. P., Perring, A. E., Thornberry, T. D., Rollins, A. W., Markovic, M. Z., Bates, T. S., Johnson, J. E., and Fahey, D. W.: A light-weight, high-sensitivity particle spectrometer for PM2.5 aerosol measurements, Aerosol Sci. Tech., 50, 88–99, https://doi.org/10.1080/02786826.2015.1131809, 2016. a
Gottschaldt, K.-D., Schlager, H., Baumann, R., Cai, D. S., Eyring, V., Graf, P., Grewe, V., Jöckel, P., Jurkat-Witschas, T., Voigt, C., Zahn, A., and Ziereis, H.: Dynamics and composition of the Asian summer monsoon anticyclone, Atmos. Chem. Phys., 18, 5655–5675, https://doi.org/10.5194/acp-18-5655-2018, 2018. a
Hanisco, T. F., Moyer, E. J., Weinstock, E. M., Clair, J. M. S., Sayres, D. S., Smith, J. B., Lockwood, R., Anderson, J. G., Dessler, A. E., Keutsch, F. N., Spackman, J. R., Read, W. G., and Bui, T. P.: Observations of deep convective influence on stratospheric water vapor and its isotopic composition, Geophys. Res. Lett., 34, L04814, https://doi.org/10.1029/2006GL027899 2007. a, b
Hanumanthu, S., Vogel, B., Müller, R., Brunamonti, S., Fadnavis, S., Li, D., Ölsner, P., Naja, M., Singh, B. B., Kumar, K. R., Sonbawne, S., Jauhiainen, H., Vömel, H., Luo, B., Jorge, T., Wienhold, F. G., Dirkson, R., and Peter, T.: Strong day-to-day variability of the Asian Tropopause Aerosol Layer (ATAL) in August 2016 at the Himalayan foothills, Atmos. Chem. Phys., 20, 14273–14302, https://doi.org/10.5194/acp-20-14273-2020, 2020. a
Highwood, E. J. and Hoskins, B. J.: The tropical tropopause, Q. J. Roy. Meteor. Soc., 124, 1579–1604, 1998. a, b
Hoffmann, L. and Spang, R.: An assessment of tropopause characteristics of the ERA5 and ERA-Interim meteorological reanalyses, Atmos. Chem. Phys., 22, 4019–4046, https://doi.org/10.5194/acp-22-4019-2022, 2022. a, b, c
Hoinka, K. P.: The tropopause: discovery, definition and demarcation, Meteorol. Z., 6, 281–303, 1997. a, b, c
Höpfner, M., Ungermann, J., Borrmann, S., Wagner, R., Spang, R., Riese, M., Stiller, G., Appel, O., Batenburg, A. M., Bucci, S., Cairo, F., Dragoneas, A., Friedl-Vallon, F., Hünig, A., Johansson, S., Krasauskas, L., Legras, B., Leisner, T., Mahnke, C., Möhler, O., Molleker, S., Müller, R., Neubert, T., Orphal, J., Preusse, P., Rex, M., Saathoff, H., Stroh, F., Weigel, R., and Wohltmann, I.: Ammonium nitrate particles formed in upper troposphere from ground ammonia sources during Asian monsoons, Nat. Geosci., 12, 608–612, https://doi.org/10.1038/s41561-019-0385-8, 2019. a
Hoskins, B. J. and Rodwell, M. J.: A model of the Asian summer monsoon, I, The global scale, J. Atmos. Sci., 52, 1329–1340, 1995. a
Jeffery, P. S., Walker, K. A., Sioris, C. E., Boone, C. D., Degenstein, D., Manney, G. L., McElroy, C. T., Millán, L., Plummer, D. A., Ryan, N. J., Sheese, P. E., and Zou, J.: Water vapour and ozone in the upper troposphere–lower stratosphere: global climatologies from three Canadian limb-viewing instruments, Atmos. Chem. Phys., 22, 14709–14734, https://doi.org/10.5194/acp-22-14709-2022, 2022. a
Jensen, E. J., Pan, L. L., Honomichl, S., Diskin, G. S., Krämer, M., Spelten, N., Günther, G., Hurst, D. F., Fujiwara, M., Vömel, H., Selkirk, H. B., Suzuki, J., Schwartz, M. J., and Smith, J. B.: Assessment of observational evidence for direct convective hydration of the lower stratosphere, J. Geophys. Res., 125, e2020JD032793, https://doi.org/10.1029/2020JD032793, 2020. a
Kachula, O., Vogel, B., Günther, G., and Müller, R.: An optimization-based approach to track the Asian summer monsoon anticyclone across daily and interannual variability, Atmos. Chem. Phys., 25, 15171–15195, https://doi.org/10.5194/acp-25-15171-2025, 2025. a, b
Khaykin, S. M., Moyer, E., Krämer, M., Clouser, B., Bucci, S., Legras, B., Lykov, A., Afchine, A., Cairo, F., Formanyuk, I., Mitev, V., Matthey, R., Rolf, C., Singer, C. E., Spelten, N., Volkov, V., Yushkov, V., and Stroh, F.: Persistence of moist plumes from overshooting convection in the Asian monsoon anticyclone, Atmos. Chem. Phys., 22, 3169–3189, https://doi.org/10.5194/acp-22-3169-2022, 2022. a, b, c, d, e, f, g, h, i, j, k, l, m, n, o, p
Knollenberg, R. G., Kelly, K. K., and Wilson, J. C.: Measurements of high number densities of ice crystals in the tops of tropical cumulonimbus, J. Geophys. Res., 98, 8639–8664, 1993. a
Kohma, M. and Sato, K.: A diagnostic equation for tendency of lapse-rate-tropopause heights and its application, J. Atmos. Sci., 76, 3337–3350, https://doi.org/10.1175/JAS-D-19-0054.1, 2019. a
Konopka, P., Rolf, C., von Hobe, M., Khaykin, S. M., Clouser, B., Moyer, E., Ravegnani, F., D'Amato, F., Viciani, S., Spelten, N., Afchine, A., Krämer, M., Stroh, F., and Ploeger, F.: The dehydration carousel of stratospheric water vapor in the Asian summer monsoon anticyclone, Atmos. Chem. Phys., 23, 12935–12947, https://doi.org/10.5194/acp-23-12935-2023, 2023. a, b, c, d, e
Krämer, M., Rolf, C., Spelten, N., Afchine, A., Fahey, D., Jensen, E., Khaykin, S., Kuhn, T., Lawson, P., Lykov, A., Pan, L. L., Riese, M., Rollins, A., Stroh, F., Thornberry, T., Wolf, V., Woods, S., Spichtinger, P., Quaas, J., and Sourdeval, O.: A microphysics guide to cirrus – Part 2: Climatologies of clouds and humidity from observations, Atmos. Chem. Phys., 20, 12569–12608, https://doi.org/10.5194/acp-20-12569-2020, 2020. a, b, c, d, e, f, g, h, i
Kuang, Z. and Bretherton, C. S.: Convective influence on the heat balance of the Tropical Tropopause Layer: A cloud-resolving model study, J. Atmos. Sci., 61, 2919–2927, https://doi.org/10.1175/JAS-3306.1, 2004. a, b, c
Kunz, A., Konopka, P., Müller, R., and Pan, L. L.: Dynamical tropopause based on isentropic potential vorticity gradients, J. Geophys. Res., 116, D01110, https://doi.org/10.1029/2010JD014343, 2011. a, b
Lee, K.-O., Dauhut, T., Chaboureau, J.-P., Khaykin, S., Krämer, M., and Rolf, C.: Convective hydration in the tropical tropopause layer during the StratoClim aircraft campaign: pathway of an observed hydration patch, Atmos. Chem. Phys., 19, 11803–11820, https://doi.org/10.5194/acp-19-11803-2019, 2019. a, b, c
Legras, B. and Bucci, S.: Confinement of air in the Asian monsoon anticyclone and pathways of convective air to the stratosphere during the summer season, Atmos. Chem. Phys., 20, 11045–11064, https://doi.org/10.5194/acp-20-11045-2020, 2020. a, b, c, d, e, f, g
Li, D., Vogel, B., Müller, R., Bian, J., Günther, G., Ploeger, F., Li, Q., Zhang, J., Bai, Z., Vömel, H., and Riese, M.: Dehydration and low ozone in the tropopause layer over the Asian monsoon caused by tropical cyclones: Lagrangian transport calculations using ERA-Interim and ERA5 reanalysis data, Atmos. Chem. Phys., 20, 4133–4152, https://doi.org/10.5194/acp-20-4133-2020, 2020. a
Li, D., Bian, J., Zhang, X., Vogel, B., Müller, R., and Günther, G.: Impact of typhoon Soudelor on ozone and water vapor in the Asian monsoon anticyclone western Pacific mode, Atmos. Sci. Lett., 24, e1147, https://doi.org/10.1002/asl.1147, 2023. a
Maddox, E. M. and Mullendore, G. L.: Determination of best tropopause definition for convective transport studies, J. Atmos. Sci., 75, 3433–3446, https://doi.org/10.1175/JAS-D-18-0032.1, 2018. a, b
Manney, G. L., Santee, M. L., Lawrence, Z. D., Wargan, K., and Schwartz, M. J.: A moments view of climatology and variability of the Asian summer monsoon anticyclone, J. Climate, 34, 7821–7841, https://doi.org/10.1175/JCLI-D-20-0729.1, 2021. a
Meyer, J., Rolf, C., Schiller, C., Rohs, S., Spelten, N., Afchine, A., Zöger, M., Sitnikov, N., Thornberry, T. D., Rollins, A. W., Bozóki, Z., Tátrai, D., Ebert, V., Kühnreich, B., Mackrodt, P., Möhler, O., Saathoff, H., Rosenlof, K. H., and Krämer, M.: Two decades of water vapor measurements with the FISH fluorescence hygrometer: a review, Atmos. Chem. Phys., 15, 8521–8538, https://doi.org/10.5194/acp-15-8521-2015, 2015. a, b
Muhsin, M., Sunilkumar, S., Venkat Ratnam, M., Parameswaran, K., Krishna Murthy, B., and Emmanuel, M.: Effect of convection on the thermal structure of the troposphere and lower stratosphere including the tropical tropopause layer in the South Asian monsoon region, J. Atmos. Sol.-Terr. Phy., 169, 52–65, https://doi.org/10.1016/j.jastp.2018.01.016, 2018. a
Müller, R.: Scaling the vertical variability of the Montgomery potential in the Asian Monsoon anticyclone, Meteorol. Z., in review, 2026. a, b
Müller, R. and Peter, T.: The numerical modelling of the sedimentation of polar stratospheric cloud particles, Ber. Bunsen. Phys. Chem., 96, 353–361, 1992. a, b, c
Müller, R., Kunz, A., Hurst, D. F., Rolf, C., Krämer, M., and Riese, M.: The need for accurate long-term water vapor measurements in the upper troposphere and lower stratosphere with global coverage, Earth's Future, 4, 25–32, https://doi.org/10.1002/2015EF000321, 2016. a
Munchak, L. A. and Pan, L. L.: Separation of the lapse rate and the cold point tropopauses in the tropics and the resulting impact on cloud top-tropopause relationships, J. Geophys. Res., 119, 7963–7978, https://doi.org/10.1002/2013JD021189, 2014. a, b
Pan, L. L., Paulik, L. C., Honomichl, S. B., Munchak, L. A., Bian, J., Selkirk, H. B., and Vömel, H.: Identification of the tropical tropopause transition layer using the ozone-water vapor relationship, J. Geophys. Res., 119, 3586–3599, https://doi.org/10.1002/2013JD020558, 2014. a, b
Pan, L. L., Honomichl, S. B., Bui, T. V., Thornberry, T., Rollins, A., Hintsa, E., and Jensen, E. J.: Lapse rate or cold point: the tropical tropopause identified by in situ trace gas measurements, Geophys. Res. Lett., 45, 10756–10763, https://doi.org/10.1029/2018GL079573, 2018. a, b, c, d, e, f, g, h, i, j, k, l, m, n
Park, M., Randel, W. J., Gettleman, A., Massie, S. T., and Jiang, J. H.: Transport above the Asian summer monsoon anticyclone inferred from Aura Microwave Limb Sounder tracers, J. Geophys. Res., 112, D16309, https://doi.org/10.1029/2006JD008294, 2007. a, b, c, d
Ploeger, F., Günther, G., Konopka, P., Fueglistaler, S., Müller, R., Hoppe, C., Kunz, A., Spang, R., Grooß, J.-U., and Riese, M.: Horizontal water vapor transport in the lower stratosphere from subtropics to high latitudes during boreal summer, J. Geophys. Res., 118, 8111–8127, https://doi.org/10.1002/jgrd.50636, 2013. a
Ploeger, F., Gottschling, C., Griessbach, S., Grooß, J.-U., Guenther, G., Konopka, P., Müller, R., Riese, M., Stroh, F., Tao, M., Ungermann, J., Vogel, B., and von Hobe, M.: A potential vorticity-based determination of the transport barrier in the Asian summer monsoon anticyclone, Atmos. Chem. Phys., 15, 13145–13159, https://doi.org/10.5194/acp-15-13145-2015, 2015. a
Ploeger, F., Birner, T., Charlesworth, E., Konopka, P., and Müller, R.: Moist bias in the Pacific upper troposphere and lower stratosphere (UTLS) in climate models affects regional circulation patterns, Atmos. Chem. Phys., 24, 2033–2043, https://doi.org/10.5194/acp-24-2033-2024, 2024. a, b
Randel, W. J., Moyer, E., Park, M., Jensen, E., Bernath, P., Walker, K., and Boone, C.: Global variations of HDO and ratios in the upper troposphere and lower stratosphere derived from ACE–FTS satellite measurements, J. Geophys. Res., 117, D06303, https://doi.org/10.1029/2011JD016632, 2012. a
Randel, W. J., Zhang, K., and Fu, R.: What controls stratospheric water vapor in the NH summer monsoon regions?, J. Geophys. Res., 120, 7988–8001, https://doi.org/10.1002/2015JD023622, 2015. a, b, c
Renard, J.-B., Dulac, F., Berthet, G., Lurton, T., Vignelles, D., Jégou, F., Tonnelier, T., Jeannot, M., Couté, B., Akiki, R., Verdier, N., Mallet, M., Gensdarmes, F., Charpentier, P., Mesmin, S., Duverger, V., Dupont, J.-C., Elias, T., Crenn, V., Sciare, J., Zieger, P., Salter, M., Roberts, T., Giacomoni, J., Gobbi, M., Hamonou, E., Olafsson, H., Dagsson-Waldhauserova, P., Camy-Peyret, C., Mazel, C., Décamps, T., Piringer, M., Surcin, J., and Daugeron, D.: LOAC: a small aerosol optical counter/sizer for ground-based and balloon measurements of the size distribution and nature of atmospheric particles – Part 2: First results from balloon and unmanned aerial vehicle flights, Atmos. Meas. Tech., 9, 3673–3686, https://doi.org/10.5194/amt-9-3673-2016, 2016. a
Reutter, P. and Spichtinger, P.: The frosty frontier: redefining the mid-latitude tropopause using the relative humidity over ice, Atmos. Chem. Phys., 25, 16303–16314, https://doi.org/10.5194/acp-25-16303-2025, 2025. a, b
Richard, E. C., Tuck, A. F., Aikin, K. C., Kelly, K. K., Herman, R. L., Troy, R. F., Hovde, S. J., Rosenlof, K. H., Thompson, T. L., and Ray, E. A.: High-resolution airborne profiles of CH4, O3, and water vapor near tropical Central America in late January to early February 2004, J. Geophys. Res., 111, D13304, https://doi.org/10.1029/2005JD006513, 2006. a, b, c, d, e, f
Riese, M., Hoor, P., Rolf, C., Kunkel, D., Vogel, B., Köllner, F., Pöhlker, M., Ploeger, F., Ungermann, J., Woiwode, W., Johansson, S., Bauer, R., Barmpounis, K., Borrmann, S., Brauner, P., Clemens, J., Dragoneas, A., Ekinci, F., Emig, N., Engel, A., Eppers, O., Fadnavis, S., Friedl-Vallon, F., Geldenhuys, M., Günther, G., Grooß, J.-U., Hegglin, M., Höpfner, M., Jesswein, M., Joppe, P., Kaumanns, J., Kachula, O., Keber, T., Kretschmer, E., Lachnitt, H. C., Lauther, V., Lloyd, P., Molleker, S., Müller, R., Neubert, T., Ort, L., Pöschl, U., Pöhlker, C., Rapp, M., Retzlaff, M., Rhode, S., Schneider, J., Schuck, T., Sinnhuber, B.-M., Spelten, N., Strobel, J., Tomsche, L., Turhal, K., van Luijt, R., Versick, S., Voigt, C., Volk, M. C., von Hobe, M., Zahn, A., Ziereis, H., and Zlotos, L.: Long-range transport of polluted Asian summer monsoon air to high latitudes during the PHILEAS campaign in the boreal summer 2023, B. Am. Meteorol. Soc., https://doi.org/10.1175/BAMS-D-24-0232.1, accepted, 2026. a
Robrecht, S., Vogel, B., Grooß, J.-U., Rosenlof, K., Thornberry, T., Rollins, A., Krämer, M., Christensen, L., and Müller, R.: Mechanism of ozone loss under enhanced water vapour conditions in the mid-latitude lower stratosphere in summer, Atmos. Chem. Phys., 19, 5805–5833, https://doi.org/10.5194/acp-19-5805-2019, 2019. a
Rolf, C., Afchine, A., Bozem, H., Buchholz, B., Ebert, V., Guggenmoser, T., Hoor, P., Konopka, P., Kretschmer, E., Müller, S., Schlager, H., Spelten, N., Sumińska-Ebersoldt, O., Ungermann, J., Zahn, A., and Krämer, M.: Transport of Antarctic stratospheric strongly dehydrated air into the troposphere observed during the HALO-ESMVal campaign 2012, Atmos. Chem. Phys., 15, 9143–9158, https://doi.org/10.5194/acp-15-9143-2015, 2015. a
Rollins, A. W., Thornberry, T. D., Gao, R. S., Smith, J. B., Sayres, D. S., Sargent, M. R., Schiller, C., Krämer, M., Spelten, N., Hurst, D. F., Jordan, A. F., Hall, E. G., Vömel, H., Diskin, G. S., Podolske, J. R., Christensen, L. E., Rosenlof, K. H., and Fahey, D. W.: Evaluation of UT/LS hygrometer accuracy by intercomparison during the NASA MACPEX mission, J. Geophys. Res., 119, 1915–1935, https://doi.org/10.1002/2013JD020817, 2014. a
Rosenlof, K. H., Tuck, A. F., Kelly, K. K., Russell III, J. M., and McCormick, M. P.: Hemispheric asymmetries in the water vapor and inferences about transport in the lower stratosphere, J. Geophys. Res., 102, 13213–13234, https://doi.org/10.1029/97JD00873, 1997. a
Salawitch, R. J., Smith, J. B., Selkirk, H., Wargan, K., Chipperfield, M. P., Hossaini, R., Levelt, P. F., Livesey, N. J., McBride, L. A., Millán, L. F., Moyer, E., Santee, M. L., Schoeberl, M. R., Solomon, S., Stone, K., and Worden, H. M.: The imminent data desert: The future of stratospheric monitoring in a rapidly changing world, B. Am. Meteorol. Soc., 106, E540–E563, https://doi.org/10.1175/BAMS-D-23-0281.1, 2025. a
Santee, M. L., Manney, G. L., Livesey, N. J., Schwartz, M. J., Neu, J. L., and Read, W. G.: A comprehensive overview of the climatological composition of the Asian summer monsoon anticyclone based on 10 years of Aura Microwave Limb Sounder measurements, J. Geophys. Res., 122, 5491–5514, https://doi.org/10.1002/2016JD026408, 2017. a
Schiller, C.: Hydration and dehydration at the tropical tropopause, vol. 295 of Energy & Environment, Forschungszentrum Jülich, Habil. Schr. University of Wuppertal, ISBN: 978-3-95806-101-9, 2015. a, b
Schiller, C., Krämer, M., Afchine, A., Spelten, N., and Sitnikov, N.: The ice water content of Arctic, mid latitude and tropical cirrus, J. Geophys. Res., 113, D24208, https://doi.org/10.1029/2008JD010342, 2008. a
Schiller, C., Grooß, J.-U., Konopka, P., Plöger, F., Silva dos Santos, F. H., and Spelten, N.: Hydration and dehydration at the tropical tropopause, Atmos. Chem. Phys., 9, 9647–9660, https://doi.org/10.5194/acp-9-9647-2009, 2009. a, b
Shlanta, A. and Kuhn, P. M.: Ozone and water vapor injected into the stratosphere from two isolated thunderstorms, J. Appl. Meteorol. Clim., 12, 1375–1378, https://doi.org/10.1175/1520-0450(1973)012<1375:OAWVII>2.0.CO;2, 1973. a
Shur, G. N., Yushkov, V. A., Drynkov, A. V., Fadeeva, G. V., and Potertikova, G. A.: Study of thermodynamics of the stratosphere at high latitudes of the Northern hemisphere on the M-55 Geofizika flying laboratory, Russ. Meteorol. Hydro+., 8, 43–53, 2006. a, b
Singer, C. E., Clouser, B. W., Khaykin, S. M., Krämer, M., Cairo, F., Peter, T., Lykov, A., Rolf, C., Spelten, N., Afchine, A., Brunamonti, S., and Moyer, E. J.: Intercomparison of upper tropospheric and lower stratospheric water vapor measurements over the Asian Summer Monsoon during the StratoClim campaign, Atmos. Meas. Tech., 15, 4767–4783, https://doi.org/10.5194/amt-15-4767-2022, 2022. a, b, c, d, e, f, g, h, i, j, k, l, m
Sitnikov, N., Yushkov, V., Afchine, A., Korshunov, L., Astakhov, V., Ulanovskii, A., Kraemer, M., Mangold, A., Schiller, C., and Ravegnani, F.: The FLASH instrument for water vapor measurements on board the high-altitude airplane, Instrum. Exp. Tech+., 50, 113–121, https://doi.org/10.1134/S0020441207010174, 2007. a
Solomon, S., Rosenlof, K., Portmann, R., Daniel, J., Davis, S., Sanford, T., and Plattner, G.-K.: Contributions of stratospheric water vapor to decadal changes in the rate of global warming, Science, 327, 1219–1223, https://doi.org/10.1126/science.1182488, 2010. a
Stefanutti, L., Sokolov, L., Balestri, S., MacKenzie, A. R., and Khattatov, V.: The M-55 Geophysica as a platform for the Airborne Polar Experiment, J. Atmos. Ocean. Tech., 16, 1303–1312, https://doi.org/10.1175/1520-0426(1999)016<1303:TMGAAP>2.0.CO;2, 1999. a, b
Sun, X., Müller, K., Palm, M., Ritter, C., Ji, D., Röpke, T. B., and Notholt, J.: Evidence of tropospheric uplift into the stratosphere via the tropical western Pacific cold trap, Atmos. Chem. Phys., 25, 6881–6902, https://doi.org/10.5194/acp-25-6881-2025, 2025. a
Tinney, E. N., Homeyer, C. R., Elizalde, L., Hurst, D. F., Thompson, A. M., Stauffer, R. M., Vömel, H., and Selkirk, H. B.: A modern approach to a stability-based definition of the tropopause, Mon. Weather Rev., 150, 3151–3174, https://doi.org/10.1175/MWR-D-22-0174.1, 2022. a
Tuck, A. F., Baumgardner, D., Chan, K. R., Dye, J. E., Elkins, J. W., Hovde, S. J., Kelly, K. K., Loewenstein, M., Margitan, J. J., May, R. D., Podolske, J. R., Proffitt, M. H., Rosenlof, K. H., Smith, W. L., Webster, C. R., and Wilson, J. C.: The Brewer-Dobson circulation in the light of high altitude in situ aircraft observation, Q. J. Roy. Meteor. Soc., 123, 1–69, 1997. a
Tuck, A. F., Hovde, S. J., Kelly, K. K., Mahoney, M. J., Proffitt, M. H., Richard, E. C., and Thompson, T. L.: Exchange between the upper tropical troposphere and the lower stratosphere studied with aircraft observations, J. Geophys. Res., 108, 4734, https://doi.org/10.1029/2003JD003399, 2003. a, b, c, d
Tuck, A. F., Hovde, S. J., Kelly, K. K., Reid, S. J., Richard, E. C., Atlas, E. L., Donnelly, S. G., Stroud, V. R., Cziczo, D. J., Murphy, D. M., Thomson, D. S., Elkins, J. W., Moore, F. L., Ray, E. A., Mahoney, M. J., and Friedl, R. R.: Horizontal variability 1–2 km below the tropical tropopause, J. Geophys. Res., 109, https://doi.org/10.1029/2003JD003942, 2004. a
Turhal, K., Plöger, F., Clemens, J., Birner, T., Weyland, F., Konopka, P., and Hoor, P.: Variability and trends in the potential vorticity (PV)-gradient dynamical tropopause, Atmos. Chem. Phys., 24, 13653–13679, https://doi.org/10.5194/acp-24-13653-2024, 2024. a, b, c
Ueyama, R., Jensen, E. J., and Pfister, L.: Convective influence on the humidity and clouds in the tropical tropopause layer during boreal Summer, J. Geophys. Res., 123, 7576–7593, https://doi.org/10.1029/2018JD028674, 2018. a, b, c
Ulanovsky, A. E., Yushkov, V. A., Sitnikov, N. M., and Ravegnani, F.: The FOZAN-II fast-response chemiluminescent airborne ozone analyzer, Instrum. Exp. Tech+., 44, 249–256, 2001. a, b
Vaughan, G. and Timmis, C.: Transport of near-tropopause air into the lower midlatitude stratosphere, Q. J. Roy. Meteor. Soc., 124, 1559–1578, 1998. a
Vogel, B., Günther, G., Müller, R., Grooß, J.-U., and Riese, M.: Impact of different Asian source regions on the composition of the Asian monsoon anticyclone and of the extratropical lowermost stratosphere, Atmos. Chem. Phys., 15, 13699–13716, https://doi.org/10.5194/acp-15-13699-2015, 2015. a
Vogel, B., Günther, G., Müller, R., Grooß, J.-U., Afchine, A., Bozem, H., Hoor, P., Krämer, M., Müller, S., Riese, M., Rolf, C., Spelten, N., Stiller, G. P., Ungermann, J., and Zahn, A.: Long-range transport pathways of tropospheric source gases originating in Asia into the northern lower stratosphere during the Asian monsoon season 2012, Atmos. Chem. Phys., 16, 15301–15325, https://doi.org/10.5194/acp-16-15301-2016, 2016. a
Vogel, B., Volk, C. M., Wintel, J., Lauther, V., Müller, R., Patra, P. K., Riese, M., Terao, Y., and Stroh, F.: Reconstructing high-resolution in-situ vertical carbon dioxide profiles in the sparsely monitored Asian monsoon region, Commun. Earth Environ., 4, 72, https://doi.org/10.1038/s43247-023-00725-5, 2023. a, b
Vogel, B., Volk, C. M., Wintel, J., Lauther, V., Clemens, J., Grooß, J.-U., Günther, G., Hoffmann, L., Laube, J. C., Müller, R., Ploeger, F., and Stroh, F.: Evaluation of vertical transport in ERA5 and ERA-Interim reanalysis using high-altitude aircraft measurements in the Asian summer monsoon 2017, Atmos. Chem. Phys., 24, 317–343, https://doi.org/10.5194/acp-24-317-2024, 2024. a, b
von Hobe, M., Ploeger, F., Konopka, P., Kloss, C., Ulanowski, A., Yushkov, V., Ravegnani, F., Volk, C. M., Pan, L. L., Honomichl, S. B., Tilmes, S., Kinnison, D. E., Garcia, R. R., and Wright, J. S.: Upward transport into and within the Asian monsoon anticyclone as inferred from StratoClim trace gas observations, Atmos. Chem. Phys., 21, 1267–1285, https://doi.org/10.5194/acp-21-1267-2021, 2021. a, b
Wang, H., Park, M., Tao, M., Peña-Ortiz, C., Plaza-Martin, N. P., Ploeger, F., and Konopka, P.: Understanding boreal summer UTLS water vapor variations in monsoon regions: a Lagrangian perspective, Atmos. Chem. Phys., 25, 14703–14718, https://doi.org/10.5194/acp-25-14703-2025, 2025. a, b, c
WMO: Meteorology – A three-dimensional science, WMO Bull., 134–138, https://de.scribd.com/document/601621440/1957-WMO-bulletin-vi-4 (last access: 24 March 2026), 1957. a, b, c
Wright, J. S., Fu, R., Fueglistaler, S., Liu, Y. S., and Zhang, Y.: The influence of summertime convection over Southeast Asia on water vapor in the tropical stratosphere, J. Geophys. Res., 116, D12302, https://doi.org/10.1029/2010JD015416, 2011. a
Zhang, K., Luo, T., Li, X., Cui, S., Weng, N., Huang, Y., and Wang, Y.: A novel method for detecting tropopause structures based on the bi-Gaussian function, Atmos. Chem. Phys., 24, 11157–11173, https://doi.org/10.5194/acp-24-11157-2024, 2024. a
Zöger, M., Schiller, C., and Eicke, N.: Fast in situ hygrometers: A new family of balloonborne and airborne Lyman-α photofragment fluorescence hygrometers, J. Geophys. Res., 104, 1807–1816, 1999. a
Zou, L., Hoffmann, L., Müller, R., and Spang, R.: Variability and trends of the tropical tropopause derived from a 1980–2021 multi-reanalysis assessment, Front. Earth Sci., 11, 1177502, https://doi.org/10.3389/feart.2023.1177502, 2023. a, b, c
- Abstract
- Introduction
- Measurements during the StratoClim campaign in the Asian Summer Monsoon from Kathmandu in 2017
- Results
- Discussion
- Conclusions
- Appendix A: The relation between altitude, potential temperature and pressure in the Asian summer monsoon
- Code availability
- Data availability
- Author contributions
- Competing interests
- Disclaimer
- Acknowledgements
- Financial support
- Review statement
- References
- Supplement