the Creative Commons Attribution 4.0 License.
the Creative Commons Attribution 4.0 License.
 | 27 Mar 2026
Meteorological drivers of the low-cloud radiative feedback pattern effect and its uncertainty
Timothy A. Myers
Mark D. Zelinka
Cristian Proistosescu
Yuan-Jen Lin
Kate Marvel
The radiative feedback pattern effect remains a large source of uncertainty for both projections of future trends and interpretations of past trends in global temperature. The pattern effect is defined as the difference in feedbacks between transient and long-term simulations, and past work shows that is primarily attributed to changes in the marine low-cloud radiative feedback. Here we use low cloud meteorological kernels to map out both the primary cloud controlling factors through which changing surface temperature patterns drive changes in low-cloud feedback, as well as the sources of model spread. We find that the pattern effect is almost entirely driven by changes in estimated inversion strength (EIS) in the Southern Hemisphere, particularly in the South East Pacific and Southern Ocean. In both past and future simulations, inter-model spread is primarily caused by model differences in the sensitivity of low clouds to the environmental conditions, rather than differences in the simulated evolution of environmental conditions.
- Article
(18543 KB) - Full-text XML
- BibTeX
- EndNote


The time-evolution of the net radiative feedback was first identified within general circulation model (GCM) simulations, where the feedback becomes less negative over time after a forcing, such as a quadrupling of carbon dioxide concentration, is imposed, leading to an increase in climate sensitivity (e.g. Senior and Mitchell, 2000; Held et al., 2010; Andrews et al., 2012; Li et al., 2013; Andrews and Ringer, 2014; Knutti and Rugenstein, 2015; Andrews et al., 2015; Armour, 2017; Proistosescu and Huybers, 2017; Rugenstein et al., 2016, 2019, 2020). GCM experiments forced by abruptly quadrupling CO2 show that warming is initially delayed in certain regions, most notably the eastern tropical Pacific and the Southern Ocean (e.g. Andrews et al., 2015; Heede and Fedorov, 2021). On long time scales however, these regions exhibit amplified warming. As these regions eventually warm, they actuate more positive radiative feedbacks. This evolution of the net radiative feedback as the pattern of surface warming evolves is termed the “pattern effect” (Armour et al., 2013; Andrews et al., 2015; Zhou et al., 2016, 2017; Dong et al., 2019).
Estimates of Equilibrium Climate Sensitivity (ECS) need to account for the pattern effect when translating the transient net feedback calculated from present day observations into an expected equilibrium feedback (Sherwood et al., 2020). ECS can be estimated given knowledge of the forcing and feedback as:
where F2× is the radiative forcing associated with a doubling of CO2, λeq is the net radiative feedback at equilibrium, λhist is the radiative feedback over the historical period, and Δλ is the pattern effect-driven difference between equilibrium and historical feedbacks. The magnitude of the pattern effect, Δλ is thus usually quantified as the difference between an estimate of the equilibrium feedback drawn from an abrupt4xCO2 simulation, and a historical feedback estimated from either coupled historical simulations or historical simulations with prescribed sea surface temperatures, i.e., AMIP simulations (Andrews et al., 2022). Within models, Δλ is also often quantified as the difference between the early and late part of an abrupt4xCO2 simulation (Andrews et al., 2015). Observational estimates of ECS then rely on adding a model-derived estimate of Δλ on top of an observationally-derived estimate of λhist (Sherwood et al., 2020).
Climate models exhibit large uncertainty in the magnitude of the pattern effect – an uncertainty so large that it precludes observational estimates on the upper bound of future warming (Sherwood et al., 2020; Armour et al., 2024). Instead, this upper bound is largely constrained by paleoclimate information. However, translating past warming into future warming requires the use of models and is itself sensitive to model-estimates of the pattern effect (Cooper et al., 2024). Thus, understanding the sources of model spread in the pattern effect, and ultimately reducing that spread, is a major roadblock in improving projections of future warming.
The change in the net feedback is primarily caused by changes in the shortwave cloud radiative feedback associated with marine low clouds (Andrews et al., 2015; Zhou et al., 2016). The primary atmospheric mechanism posited is that surface warming in regions of deep convection like the Indo-Pacific Warm Pool warms the troposphere and thus increases outgoing radiation through both the lapse rate feedback, and through increases in low-cloud cover mediated by changes in tropospheric stability. In contrast, warming in regions of descent, like the eastern tropical Pacific, and other locations like the Southern Ocean, generally has a more local effect on top-of-atmosphere (TOA) radiation, and contributes to a less-negative global feedback through both lapse rate and cloud feedbacks (Dong et al., 2019; Zhou et al., 2016, 2017; Ceppi and Gregory, 2017, 2019; Hedemann et al., 2022).
Here we evaluate the sources of model spread in the pattern effect by mapping out the primary cloud controlling factors (CCFs) that drive low-cloud feedbacks under changing surface temperature patterns. Using this framework, we build on the work of Scott et al. (2020), Myers et al. (2021) (hereafter S20 and M21, respectively), and Myers et al. (2023) to examine (1) the contributions of different CCFs to the cloud feedback pattern effect under various past and future climate change scenarios, (2) the major sources of feedback uncertainty, and (3) how coupled model biases in the evolution of historical SSTs lead to biases in the feedbacks as discussed in Andrews et al. (2022).
Section 2 details the methodology, with subsections detailing the GCM simulations used, CCF framework and choice of CCFs, sensitivities of low-cloud radiative anomalies or radiative effects to local meteorology – known as meteorological cloud radiative kernels, and the inter-model variance analysis. Section 3 explains global feedback and the spatial pattern quantified by meteorological kernels and the CCFs. We summarize the results in Sect. 4.
2.1 GCM Simulations
We use global climate model simulations from the Coupled Model Intercomparison Project CMIP Phase 5 (Taylor et al., 2012) and 6 (Eyring et al., 2016), totaling to 16 GCMs (Table E1). We analyze atmosphere-only historical simulations (AMIP), coupled historical simulations (historical), and coupled simulations with abrupt-quadrupling of atmospheric CO2 (abrupt-4xCO2).
The AMIP and historical experiments are both analyzed over the 1982–2008 interval. While they both have forcing constituents consistent with the historical record, they differ in their boundary conditions and active components: AMIP is an atmosphere-only simulation with prescribed sea surface temperature and sea ice concentration variations, and the historical experiment has both ocean and atmosphere components active. While globally-averaged SST trends in coupled models are broadly consistent with observations, they struggle to precisely reproduce trends in historical SST patterns (Dong et al., 2021; Wills et al., 2022). Whether or not the observed patterns are consistent with the magnitude and patterns of natural variability in coupled models depends on the precise metric, interval, and region of focus. Some studies find the observed pattern consistent with modeled variability (Olonscheck et al., 2020; Watanabe et al., 2021), while others find it inconsistent (Wills et al., 2022; Rugenstein et al., 2023a). It is also possible that the discrepancy between AMIP and coupled historical simulations arises from the failure of coupled models to adequately simulate the forced response (e.g. Wills et al., 2022). A number of mechanisms have been proposed as explaining the observed cooling in the Pacific and the failure of models to do so, such as the dynamical thermostat (Clement et al., 1996), cold tongue biases (Seager et al., 2019), aerosols (Heede and Fedorov, 2021), or teleconnections from the Southern Ocean (Dong et al., 2022; Kang et al., 2023). Yet another possibility is that of errors in the SST reconstruction used in AMIP simulations (Modak and Mauritsen, 2023). The reason for this discrepancy is still an active area of research (e.g. reviews by Rugenstein et al., 2023b; Watanabe et al., 2024).
In this study we focus on the differences in atmospheric response between different simulations, and are therefore agnostic to the root causes of the SST patterns and their discrepancy. Observational estimate of the historical radiative feedback λhist will also contain both forced and unforced components, and thus differences between AMIP simulations and long term feedbacks λeq provide the best model analog for the expected magnitude of the pattern effect (Sherwood et al., 2020; Andrews et al., 2022).
We also use the idealized abrupt-4xCO2 experiment to evaluate how future feedbacks will evolve as warming patterns change over time. Abrupt-4xCO2 is a coupled ocean-atmosphere simulation wherein atmospheric CO2 concentration is abruptly quadrupled at the initiation of the run and then kept constant for the entire duration of the run, which is typically 150 years long. All other forcings are kept at pre-industrial levels. We separate the first 20 and latter 130 years as an analog to the fast and slow climate response as following, e.g., Andrews et al. (2015) and Dong et al. (2020), and refer to these two intervals as 4xCO2-fast and 4xCO2-slow.
2.2 Cloud Controlling Factors
Inter-model spread in the total feedback estimates can be largely explained by the spread in marine low cloud feedbacks (Bony and Dufresne, 2005; Zelinka et al., 2020). To understand the drivers of marine low cloud feedbacks and attendant sources of uncertainty, we use the Cloud Controlling Factor (CCF) framework (e.g. review by Klein et al., 2017). The CCF framework partitions the low-cloud feedback into the product of the sensitivities of low-cloud radiative fluxes to a number of local CCFs indicative of local meteorology, and the changes in these local CCFs with global temperature change. The marine low cloud feedback can thus be written as:
where Rlow represents local anomalies in the low-cloud radiative effect as will be discussed below, Tg represents global-mean temperature, and thus represents local low-cloud feedbacks. represent the radiative sensitivities of low-clouds to each CCF, i, and are known as the meteorological cloud radiative kernels (Scott et al., 2020; Myers et al., 2021). Finally, are the magnitude of CCFs to global surface temperature change. All terms in Eq. (2) are a function of latitude and longitude, except Tg. The global-mean low-cloud feedback can be estimated by summing all local responses. Since the meteorological kernels are local, they are invariant to changes in the pattern of surface warming. The impact of warming patterns shows up in the local changes of CCFs to global warming, with different warming patterns yielding different values for .
Changes in CCFs with temperature, , are calculated by computing a linear trend in the CCF and a linear trend in temperature, and then dividing the two. We choose this approach over the standard approach of regressing CCFs directly against temperature due to recent work showing that the standard approach strongly aliases natural variability into feedback estimates (Lin et al., 2025). While pattern effects associated with natural variability are interesting in their own right (Proistosescu et al., 2018), our focus here is on feedback differences between transient and long-term warming induced by external forcing.
The 6 CCFs chosen in this study follow Scott et al. (2020) and Myers et al. (2021, 2023) and include sea surface temperature (SST), estimated inversion strength (EIS) – a measure of lower tropospheric stability, horizontal surface temperature advection (Tadv), relative humidity at 700 hPa (RH), vertical velocity at 700 hPa (ω), and near-surface wind speed (WS). Prior work has documented in-depth how CCFs impact marine boundary layer cloudiness, covering all 6 CCFs using theory, models, and observations (Myers and Norris, 2015; Scott et al., 2020; Cesana and Del Genio, 2021; Bretherton, 2015), or focusing on specific CCFs (Lilly, 1968; Cesana and Del Genio, 2021).
2.3 Meteorological Cloud Radiative Kernels
Low-cloud meteorological cloud radiative kernels are the sensitivities of low cloud radiative effects to local perturbations from the large-scale environment, and have been used to provide observationally constrained estimates of the net low-cloud feedback and of the low-cloud feedback pattern effect (Myers et al., 2023). Since marine boundary layer clouds respond to large-scale environmental changes on the timescale of hours to days, there is sufficient data in the satellite record to derive these kernels from observations (Lewis et al., 2023; Mauger and Norris, 2010; Pincus et al., 1997; Scott et al., 2020).
Low-cloud fraction perturbations from either observational product (S20) or climate models (M21) are first convolved with the radiative flux sensitivities to cloud fraction perturbations, known as cloud radiative kernels (Zelinka et al., 2012; Zhou et al., 2013), to obtain time series of monthly low-cloud radiative anomalies (Rlow). Meteorological cloud radiative kernels, (), are then calculated through multi-linear regression of the Rlow anomalies onto the CCFs.
The GCM-based kernels used in this study are derived by M21 using the same 7 CMIP5 models and 9 CMIP6 models detailed in Table E1, primarily determined by the availability of cloud fraction histograms produced by the International Satellite Cloud Climatology Project (ISCCP) simulator (Bodas-Salcedo et al., 2011). Observational kernels derived by S20 used cloud properties and radiation data from NASA Clouds and the Earth’s Radiant Energy System Flux by Cloud Type dataset (CERES-FBCT) (Doelling, 2020), the Collection 6.1 of the MODIS cloud products (MODIS) (Platnick and Yang, 2015), International Satellite Cloud Climatology Project (ISCCP) (Rossow et al., 2017), and the Advanced Very High-Resolution Radiometer Pathfinder Atmospheres Extended (PATMOS-x) (Heidinger et al., 2014). Variations in meteorological fields are derived from the European Center for Medium-Range Weather Forecasts (ECMWF) Reanalysis v5 (ERA5) (Hersbach et al., 2019a, b). The National Oceanic and Atmospheric Administration (NOAA) Optimum Interpolation (OI) product is used for the monthly SST fields (Huang et al., 2021). These radiative sensitivities to the large-scale environment cover the oceans over 60° N to 60° S at a 5°-by-5° scale. Further details of derivation and physical interpretation of these kernels are described in detail in S20 and M21, respectively.
2.4 Inter-model Variance Partition
To understand the sources of inter-model spread in the total low-cloud feedback, we decompose Eq. (2) in terms of the model ensemble mean and deviations from the ensemble mean:
where the notation represents the model ensemble mean, and the x′ represents model-specific anomalies from the ensemble mean. We can estimate the low-cloud feedback inter-model variance as below:
Equation (4) quantifies how much of the total low-cloud feedback spread comes from, respectively, the model spread in the cloud radiative sensitivity to changes in CCFs, and the model spread in how GCMs simulate changes in CCFs in response to warming. ϵ is a residual term due to potential covariance between the radiative flux sensitivity to meteorology and the meteorology, or between the sensitivities of different CCFs. An observationally-based set of meteorological kernels can also be used in place of the model ensemble mean kernels.
3.1 Global Feedback
Figure 1 presents the kernel estimate of the total marine low-cloud feedback and the contributions from each CCF. From the top to bottom, panels show the feedback calculated with (a) both kernels () and changes in meteorological fields () derived from models, showing the total model-spread in low-cloud feedbacks; (b) observationally constrained kernels with model-specific changes in meteorology, showing the contribution to model spread from uncertainty in the meteorology and (c) model-specific kernels and multi-model mean changes in meteorology, showing the contribution to model spread from uncertainty in kernels. A near-global marine low cloud feedback is computed using spatially-weighted averages of Eq. (2) across the oceans between 60° N–60° S, following S20 and M21. The color of the markers represents the different experiments, the red diamond indicates the multi-model mean, and the black line shows the ensemble standard deviation (1σ). The inter-experiment total low-cloud feedback mean values and standard deviation are included in Table F1.
3.1.1 Ensemble Mean Results: Drivers of Low-cloud Feedback
We find the model ensemble mean results (red markers in Fig. 1a) have a negative (stabilizing) marine low-cloud feedback in the AMIP experiments; historical have a near-zero feedback, 4xCO2-fast have a weakly positive feedback, while 4xCO2-slow have a slightly more positive feedback. These feedback estimates come with a large model spread that often crosses zero. However, individual models show similar differences between experiments as the ensemble mean, suggesting a consistent sign of the pattern effect across models.
Across the three experiments indicative of transient warming (AMIP, historical, 4xCO2-fast) the total marine low-cloud feedback is determined by a compensation between a negative contribution from EIS and positive contributions from SST and RH. On long time scales (4xCO2-slow) both the EIS and RH components are nearly zero, with the total feedback thus being determined almost entirely by the SST component. The other three CCFs, Tadv, ω, and WS have near zero contributions in the global-mean.
The SST component is roughly constant across experiments. The EIS component is very strongly negative in AMIP simulations, with its value becoming progressively less negative in the coupled historical and 4xCO2-fast experiments. The contribution of RH is small but not insignificant in the AMIP and historical experiments and is nearly zero in both 4xCO2 experiments. The ensemble mean total low-cloud feedback is slightly negative in the historical experiment, but is slightly positive in the fast-response of the 4xCO2 experiment.
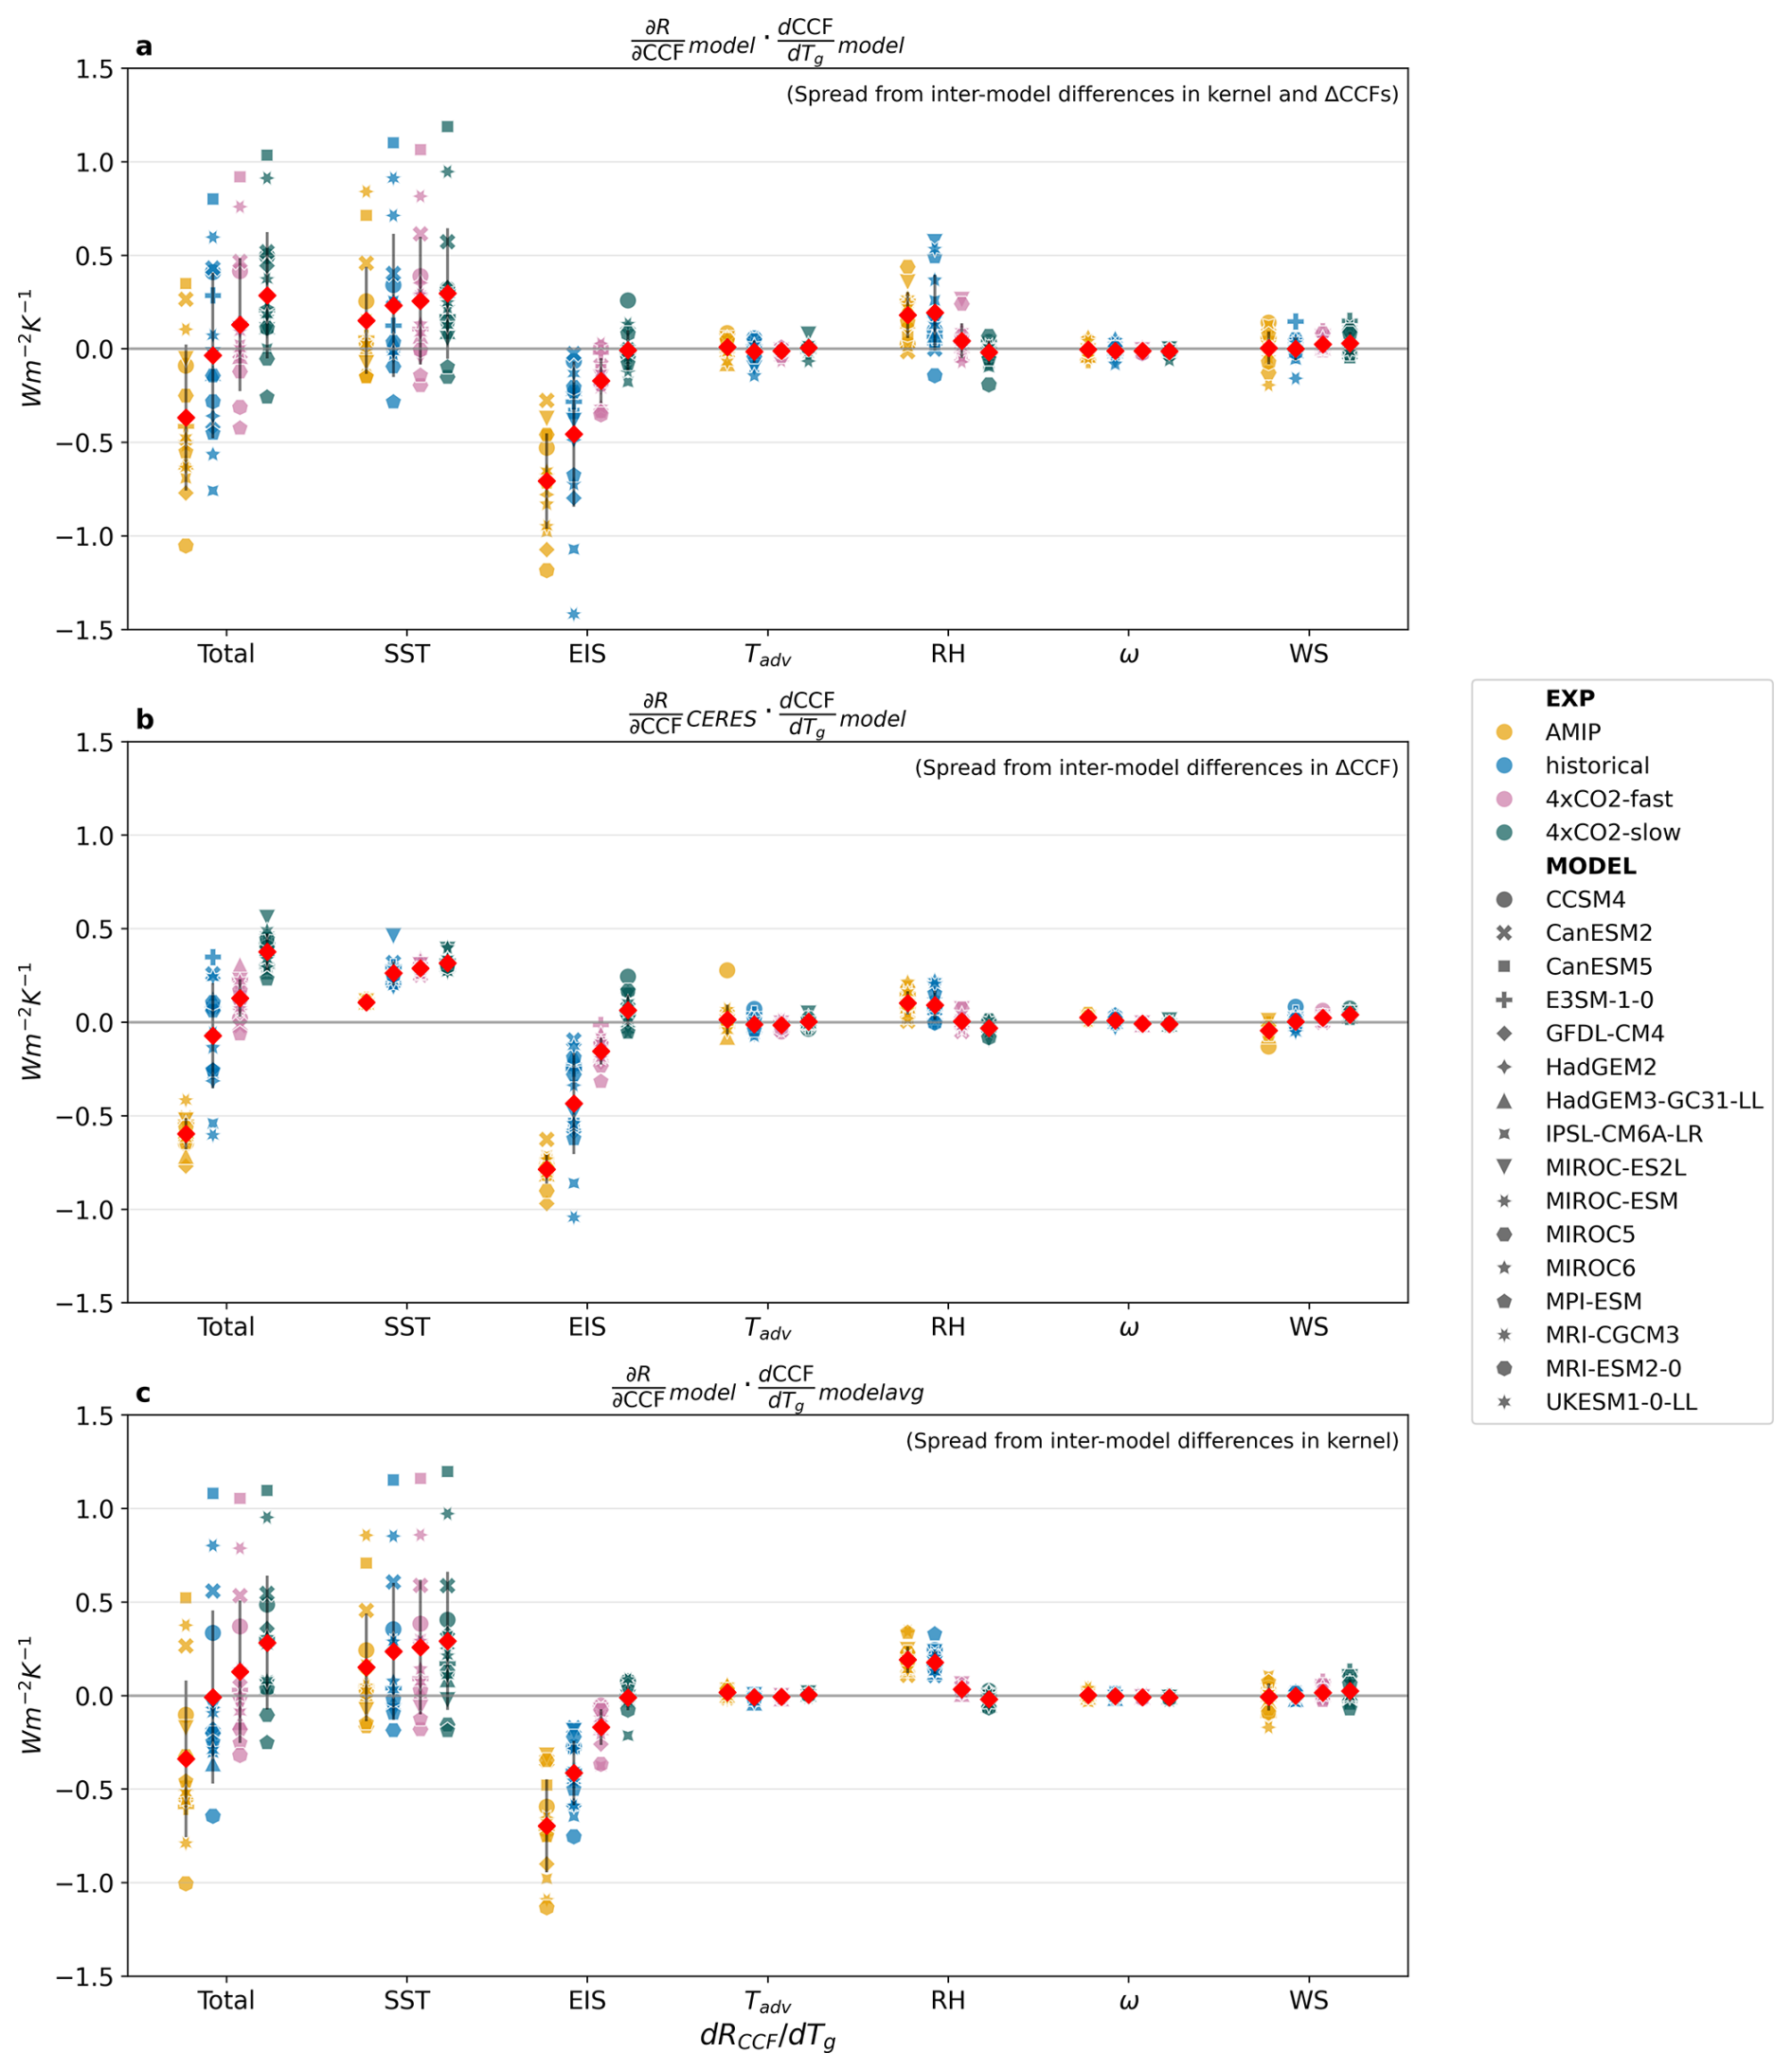
Figure 1Marine-only, spatially-weighted averages of 60° N–60° S low-cloud feedback estimates and its sub-components using (a) model-specific radiative flux sensitivities to meteorological changes () and model-specific meteorological changes to warming (), (b) radiative flux sensitivities to meteorology observationally constrained with the CERES-FBCT product and model-specific meteorological changes, and (c) model-specific radiative flux sensitivities to meteorology and ensemble-averaged meteorological changes. Each marker represents one model estimate, where the model-ensemble average and ensemble standard deviation (1σ) are illustrated by the red diamond and the black line respectively.
3.1.2 Ensemble Mean Results: The Pattern Effect
The pattern effect contribution to the marine low cloud contribution can be computed as the difference in the feedback estimate between 4xCO2-slow and the other three experiments that represents the transient feedback.
All panels in Fig. 1 show that the marine low-cloud feedback becomes less negative going from transient AMIP, historical, and 4xCO2-fast simulations to the 4xCO2-slow simulation representative of the long-term response. Our kernel-derived estimates are thus consistent with past literature on the pattern effect, suggesting the low-cloud feedback evolves to be less negative over time (Andrews et al., 2015, 2018, 2022; Myers et al., 2023), and changes in EIS are an important component to this evolution (Ceppi and Gregory, 2019). The kernel approach allows us to quantify which cloud controlling factor drives the pattern effect. We find that the pattern effect is driven almost entirely by changes in the EIS component of the feedback. Both ensemble means and most individual models agree that EIS components are strongly negative in AMIP and historical experiments, and weakly negative in 4xCO2-fast, eventually becoming near zero on long time scales in 4xCO2-slow. The SST-component is similar in magnitude across all experiments, which means it has a minimal contribution to the pattern effect. The RH-component becomes less positive in the 4xCO2-slow compared to the transient simulations, leading to a small compensation of the much larger EIS-induced pattern effect.
It is worth noting the difference in feedbacks between AMIP and the coupled simulations. Observed transient SST patterns drive both a slightly less positive SST-induced feedback and a more negative EIS-induced feedback (AMIP, indicated by yellow markers) than their coupled-model counterparts (historical and 4xCO2-fast, indicated by blue and magenta markers) in Fig. 1. This is consistent with the hypothesis that coupled models have large systematic biases in equatorial Pacific SST patterns, where they are unable to reproduce the strengthening of the equatorial Pacific SST gradient and Walker Circulation as in observations (Wills et al., 2022). The weaker SST gradient in coupled-models generates a much weaker EIS signal (Dong et al., 2019).
Cloud feedback components attributable to other CCFs (Tadv, ω, WS) have much smaller magnitudes or are near zero across experiments, contributing very little to the total low-cloud feedback in each experiment and the pattern effect.
3.1.3 Ensemble Mean Results: Observationally Constrained Low-cloud Feedback and Pattern Effect Estimates
We also show estimates of observationally constrained marine-low cloud feedbacks using CERES-FBCT kernels in Fig. 1b, and MODIS, ISCCP and PATMOS-x products in Fig. A1, and their magnitudes in Table F1. The overall behavior of the total feedback and its components using observational kernels is similar to that using model-specific kernels.
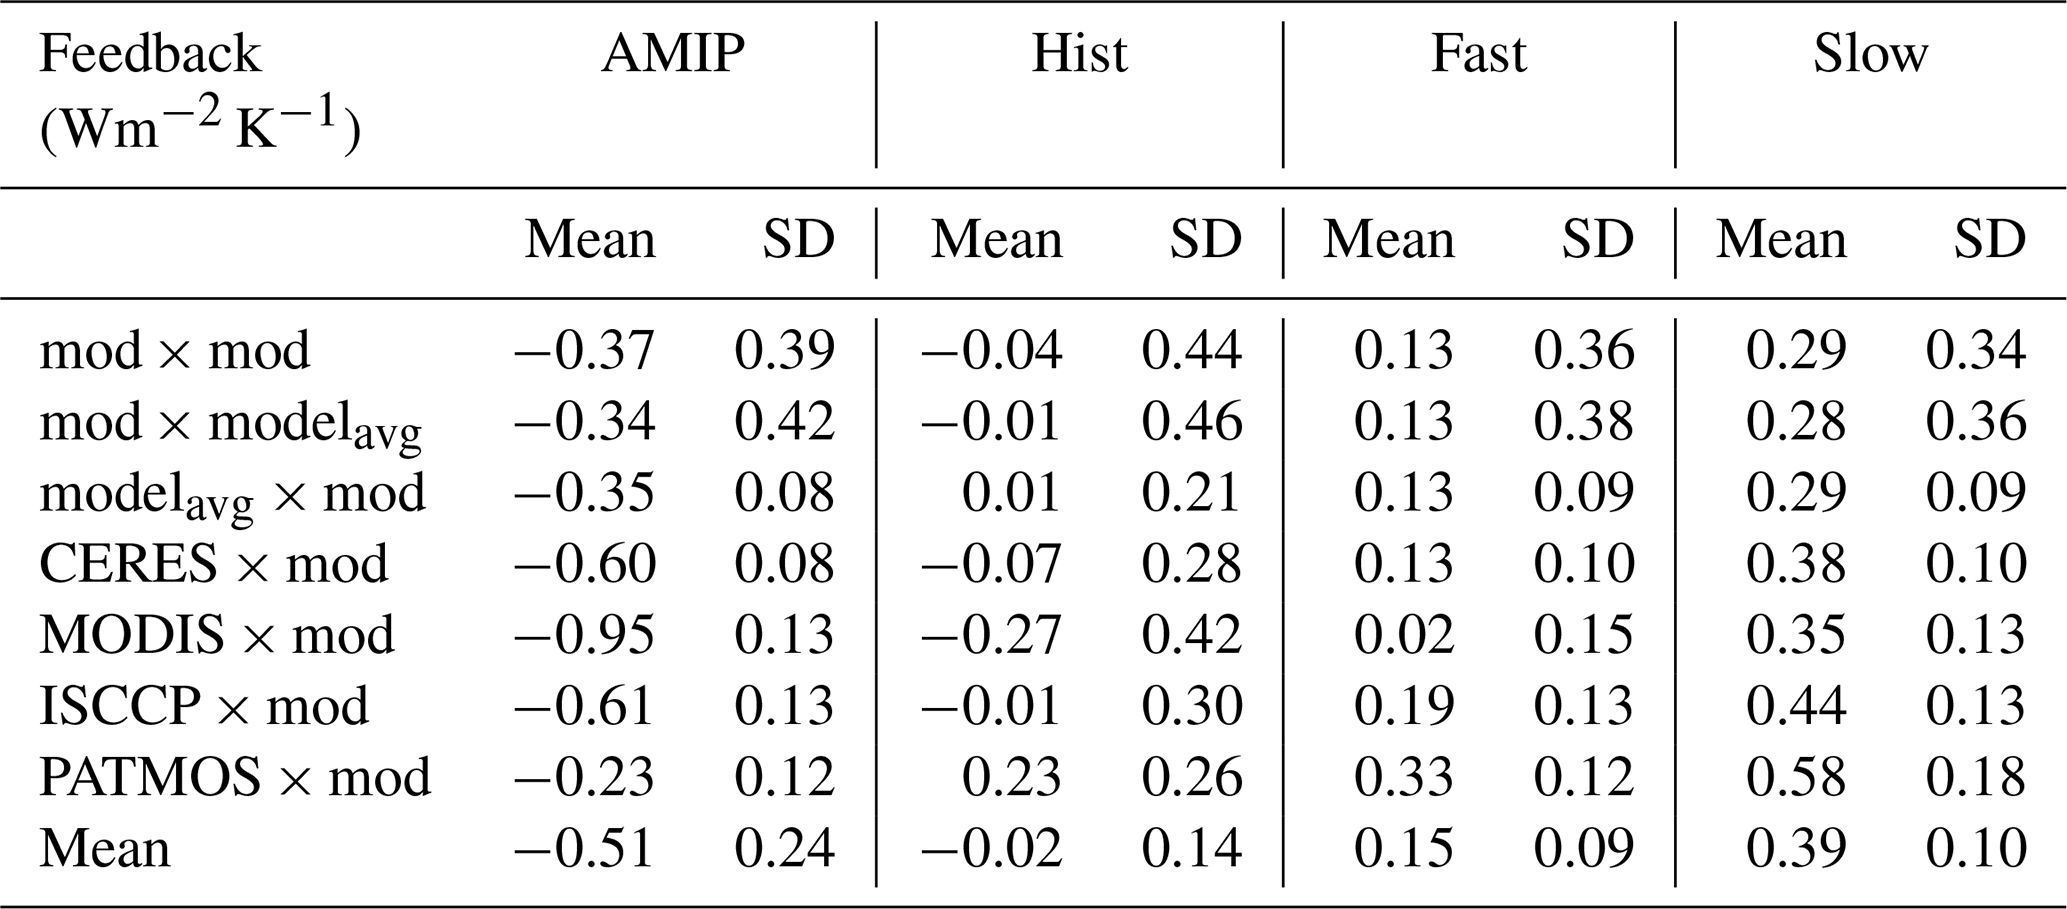
All results using observationally-derived kernels suggest a weak negative total low-cloud feedback in the historical experiment, except results calculated with the PATMOS-x kernels (Fig. A1c). 4xCO2-fast and 4xCO2-slow total-low cloud feedback estimates are consistent across kernel choices, are near-zero and positive respectively. While the overall behavior stays the same, the magnitudes of observationally-constrained feedback are sensitive to the choice of kernels, particularly in the AMIP simulations. For example, the ensemble-mean transient total low-cloud feedback in AMIP ranges from Wm−2 K−1 using MODIS-kernels to Wm−2 K−1 using PATMOS-x kernels (Fig. A1a, c and Table F1).
The magnitude of the pattern effect is also sensitive to the choice of observational kernels. For instance, EIS-driven pattern effect estimates from models (0.69, 0.45, 0.16 Wm−2 K−1 for AMIP, historical and 4xCO2-fast) are close to those derived with PATMOS-x kernels (0.49, 0.42, 0.18 Wm−2 K−1). However, the full range of observational estimates of EIS-driven pattern effect ranges from 0.69–1.13, 0.42–0.71, and 0.18–0.31 Wm−2 K−1, where PATMOS-x kernel results are on the lower end across the observationally constrained estimates. This difference in radiative flux sensitivities to meteorology can be attributable to the choice of the observational dataset, which is elaborated in Sect. 4. Our results do not suggest a single best choice of kernel but instead calls for future work to improve the agreement on the meteorological kernels between observations, which is critical for constraining the low-cloud feedback pattern effect.
3.1.4 Inter-model Spread
We can qualitatively attribute the inter-model spread in the marine low-cloud feedback and its subcomponents to either the radiative flux sensitivities to meteorology (kernels) or the meteorological changes under warming. Figure 1b shows feedback estimates with model-specific changes in meteorology (), but replacing model-specific kernels () with CERES-FBCT observational kernels. Figure 1c shows feedback estimates with model-specific kernels, but replacing model-specific changes in meteorology with the ensemble-mean. The comparison of the spread of markers in the two calculations with Fig. 1a is indicative of the inter-model spread in the environmental response per unit warming only (Fig. 1b), or the model spread in the sensitivities of low cloud radiative fluxes to their local environment (Fig. 1c).
Overall, models have less disagreement on CCF responses to warming than the radiative flux sensitivities to CCF changes. The CCF decomposition shows that the vast majority of the uncertainty in both the net marine low cloud feedback and the pattern effect comes from uncertainty in how marine low clouds respond to their local environment (i.e. model spread in kernels, Fig. 1c). By comparison, the model uncertainty in how meteorology changes with warming is much smaller (i.e model spread in CCF changes, Fig. 1b), with the notable exception of the historical experiment. These results hold if the CERES-FBCT observational kernels are replaced with either the ensemble mean kernels or other observational kernels (Fig. A1). In terms of specific CCFs, the largest sources of uncertainty are the sensitivities of clouds to SST and EIS, with smaller contributions from RH and WS, and negligible contributions from Tadv and ω. The fact that models have less uncertainty in the response of CCF to warming has been an underlying assumption of the approach since it's inception (Klein et al., 2017; Brient and Schneider, 2016; Qu et al., 2015; Myers and Norris, 2016). However, this is, to our knowledge, the first time the relative uncertainties have been quantified.
The positive extremes (upper limit) of total low-cloud feedback estimates can be attributed to models having higher radiative flux sensitivities to SSTs, such as MIROC-ESM (CMIP5) and CanESM5 (CMIP6). This suggests that constraining the sensitivity of marine low-clouds to SSTs is key to estimating the upper limit of the total low-cloud feedback.
In contrast, the negative extremes (lower limit) of the transient total low-cloud feedback inter-model spread in Fig. 1a is attributable to EIS-induced feedback across all experiments representative of the rapid response (AMIP, historical and 4xCO2-fast), portrayed by the yellow, blue and magenta markers in the EIS columns. Estimates of low-cloud feedback for AMIP, historical and 4xCO2-fast in the EIS column are negative across choice of meteorological kernels and meteorology (Figs. 1 and A1), implying that all models agree EIS will induce a stabilizing transient feedback, but the magnitude range of the negative feedback, and thus of the pattern effect, remains large.
The only experiment where uncertainty in meteorology is comparable with uncertainty in radiative sensitivity is the coupled historical experiment. In particular, there is a large model spread in the term in historical experiments (Fig. 1b, EIS column). The same spread is not observed in the AMIP experiments that are all run with the identical SST patterns. These results suggest differences in across the coupled experiments likely come from differences in how the different SST patterns drive different patterns of atmospheric circulation. It is worth noting that differences in SST patterns across coupled models do not drive big differences in the direct SST response (Fig. 1b, SST column).
Finally, we note that while inter-model variance becomes much smaller when using observational kernels, the estimate of the marine low-cloud feedback estimates is very sensitive to the choice of observational kernels (Fig. A1). It is also possible that the inter-model spread in CCF-response in coupled models may be higher in the entire CMIP5 and CMIP6 ensemble, compared to the subset of 16 models with ISCCP simulator output that were used here.
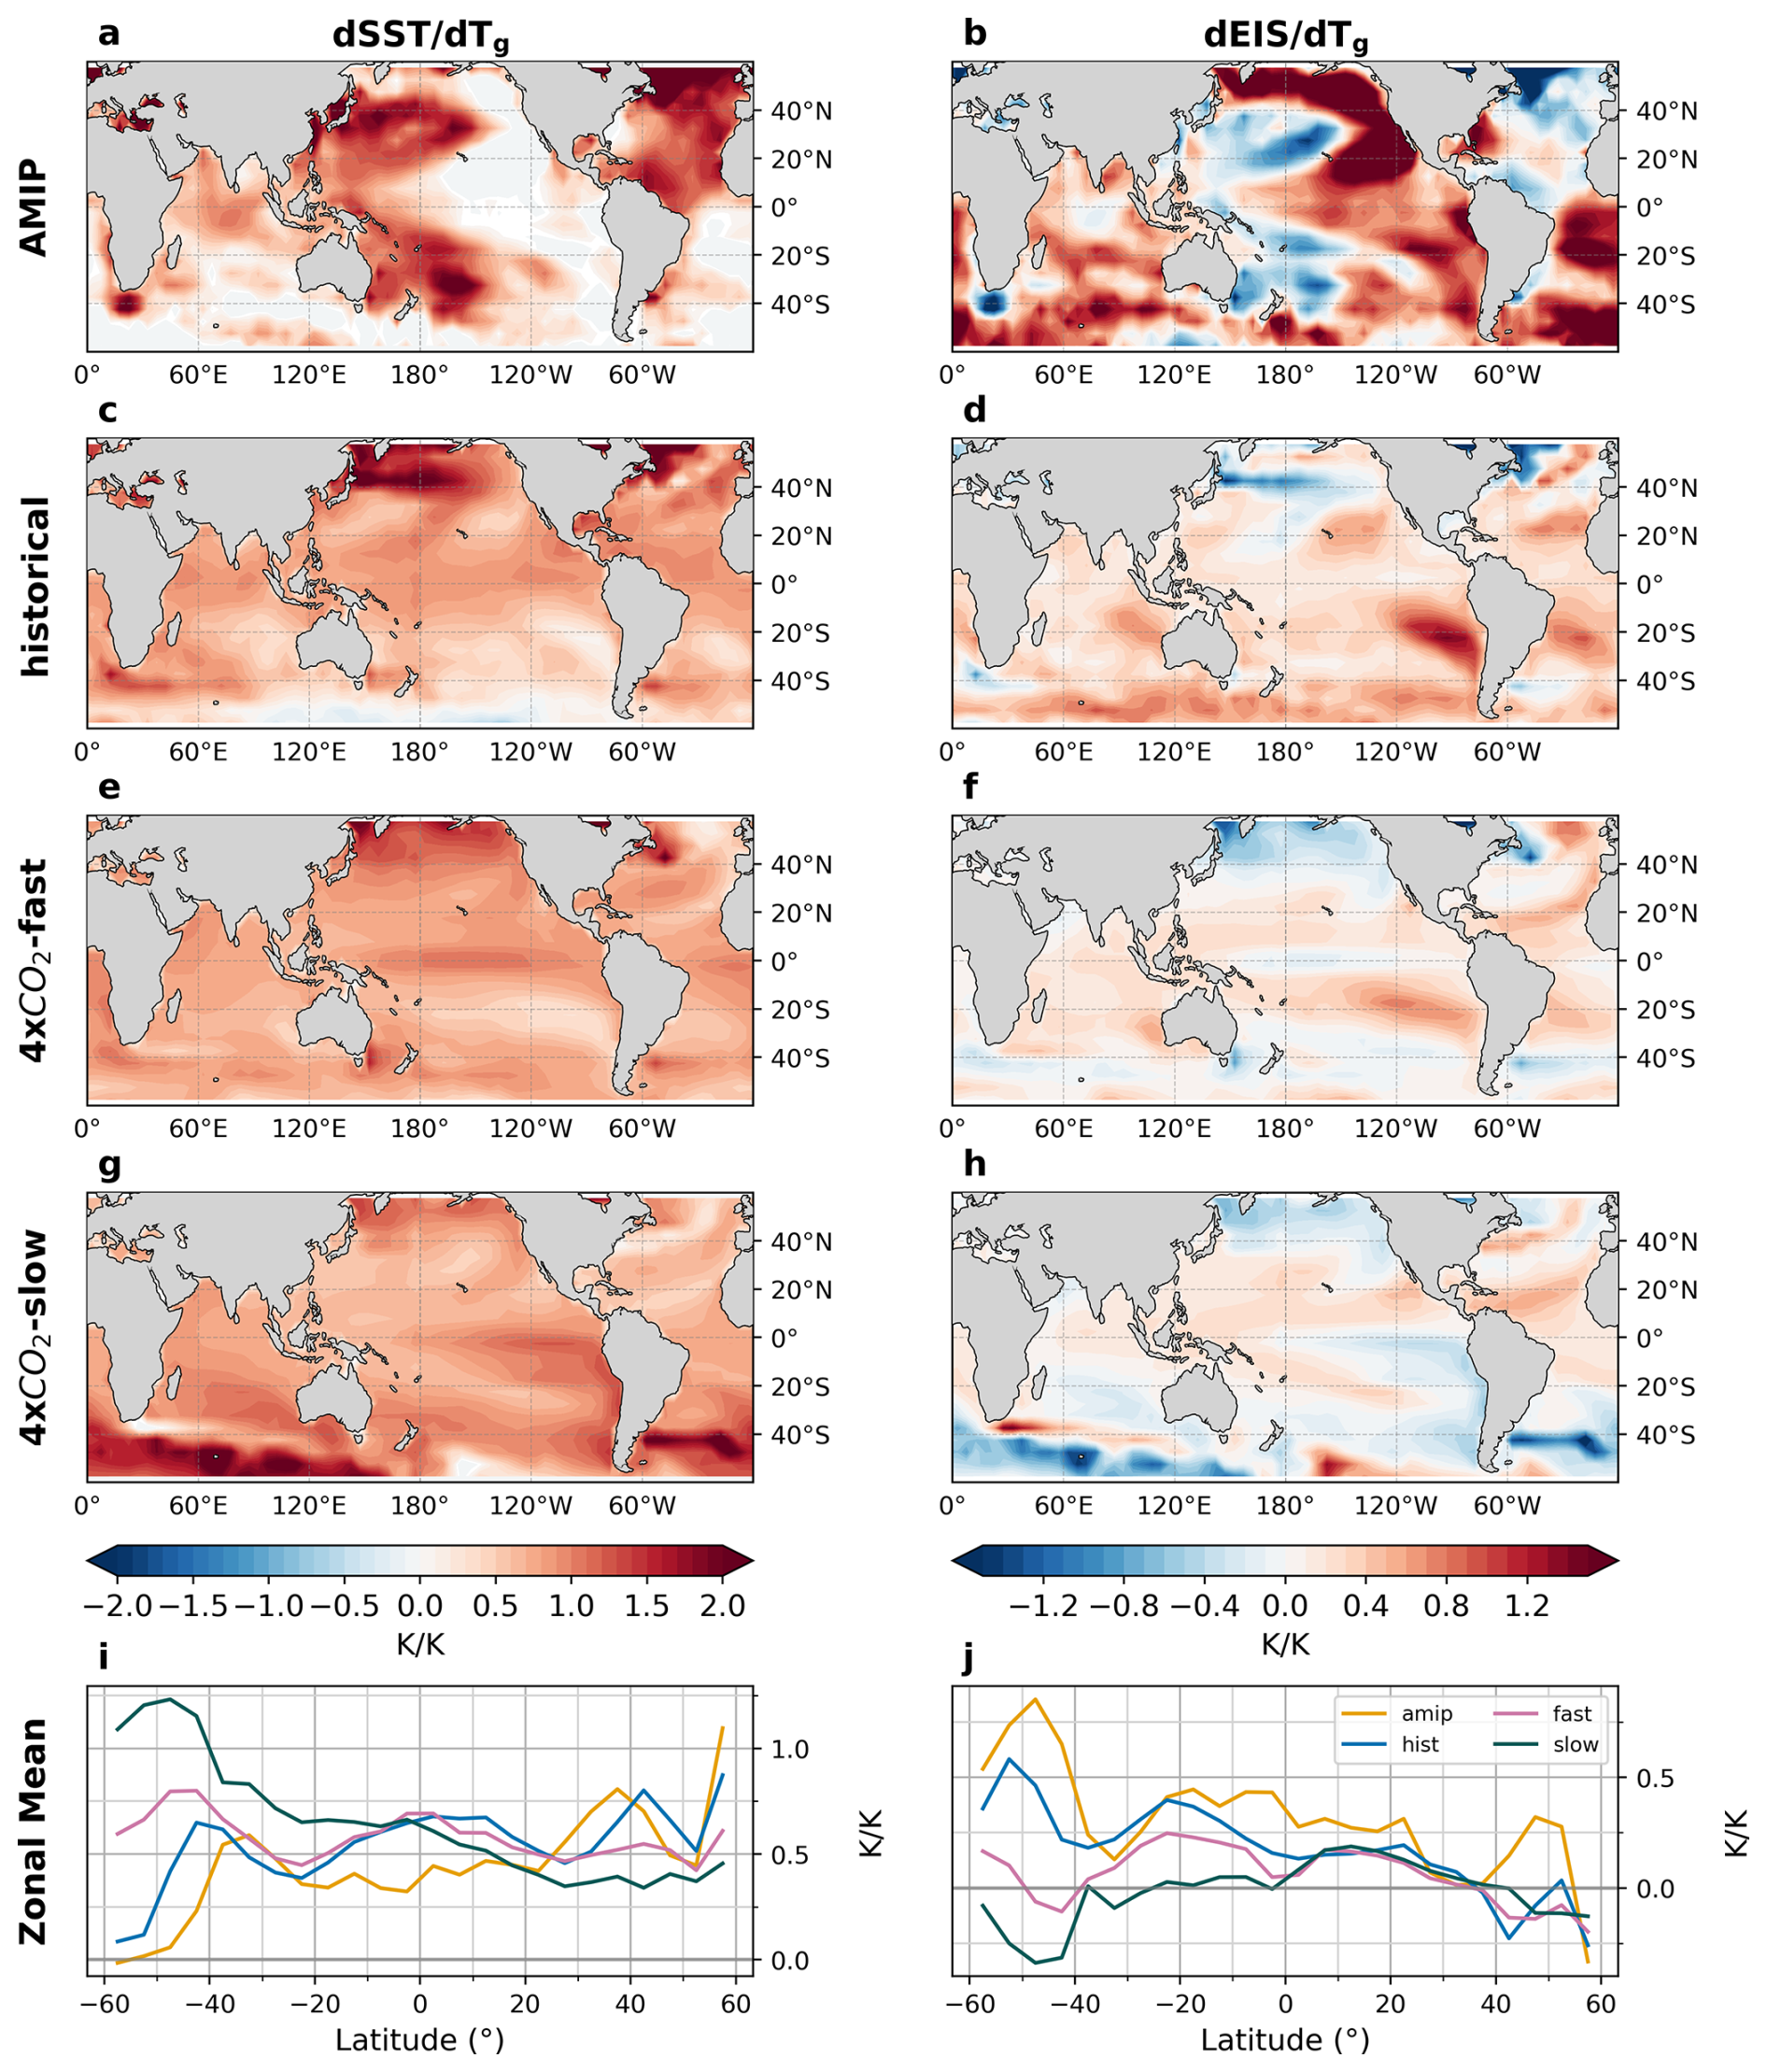
Figure 2Spatial distribution and zonal averages of (a–e) SST and (f–j) EIS changes per degree warming in AMIP, historical, abrupt-4xCO2-fast, and abrupt-4xCO2-slow experiments. Maps of Tadv, RH, ω, and WS are shown in. Figure B1 in the Appendix.
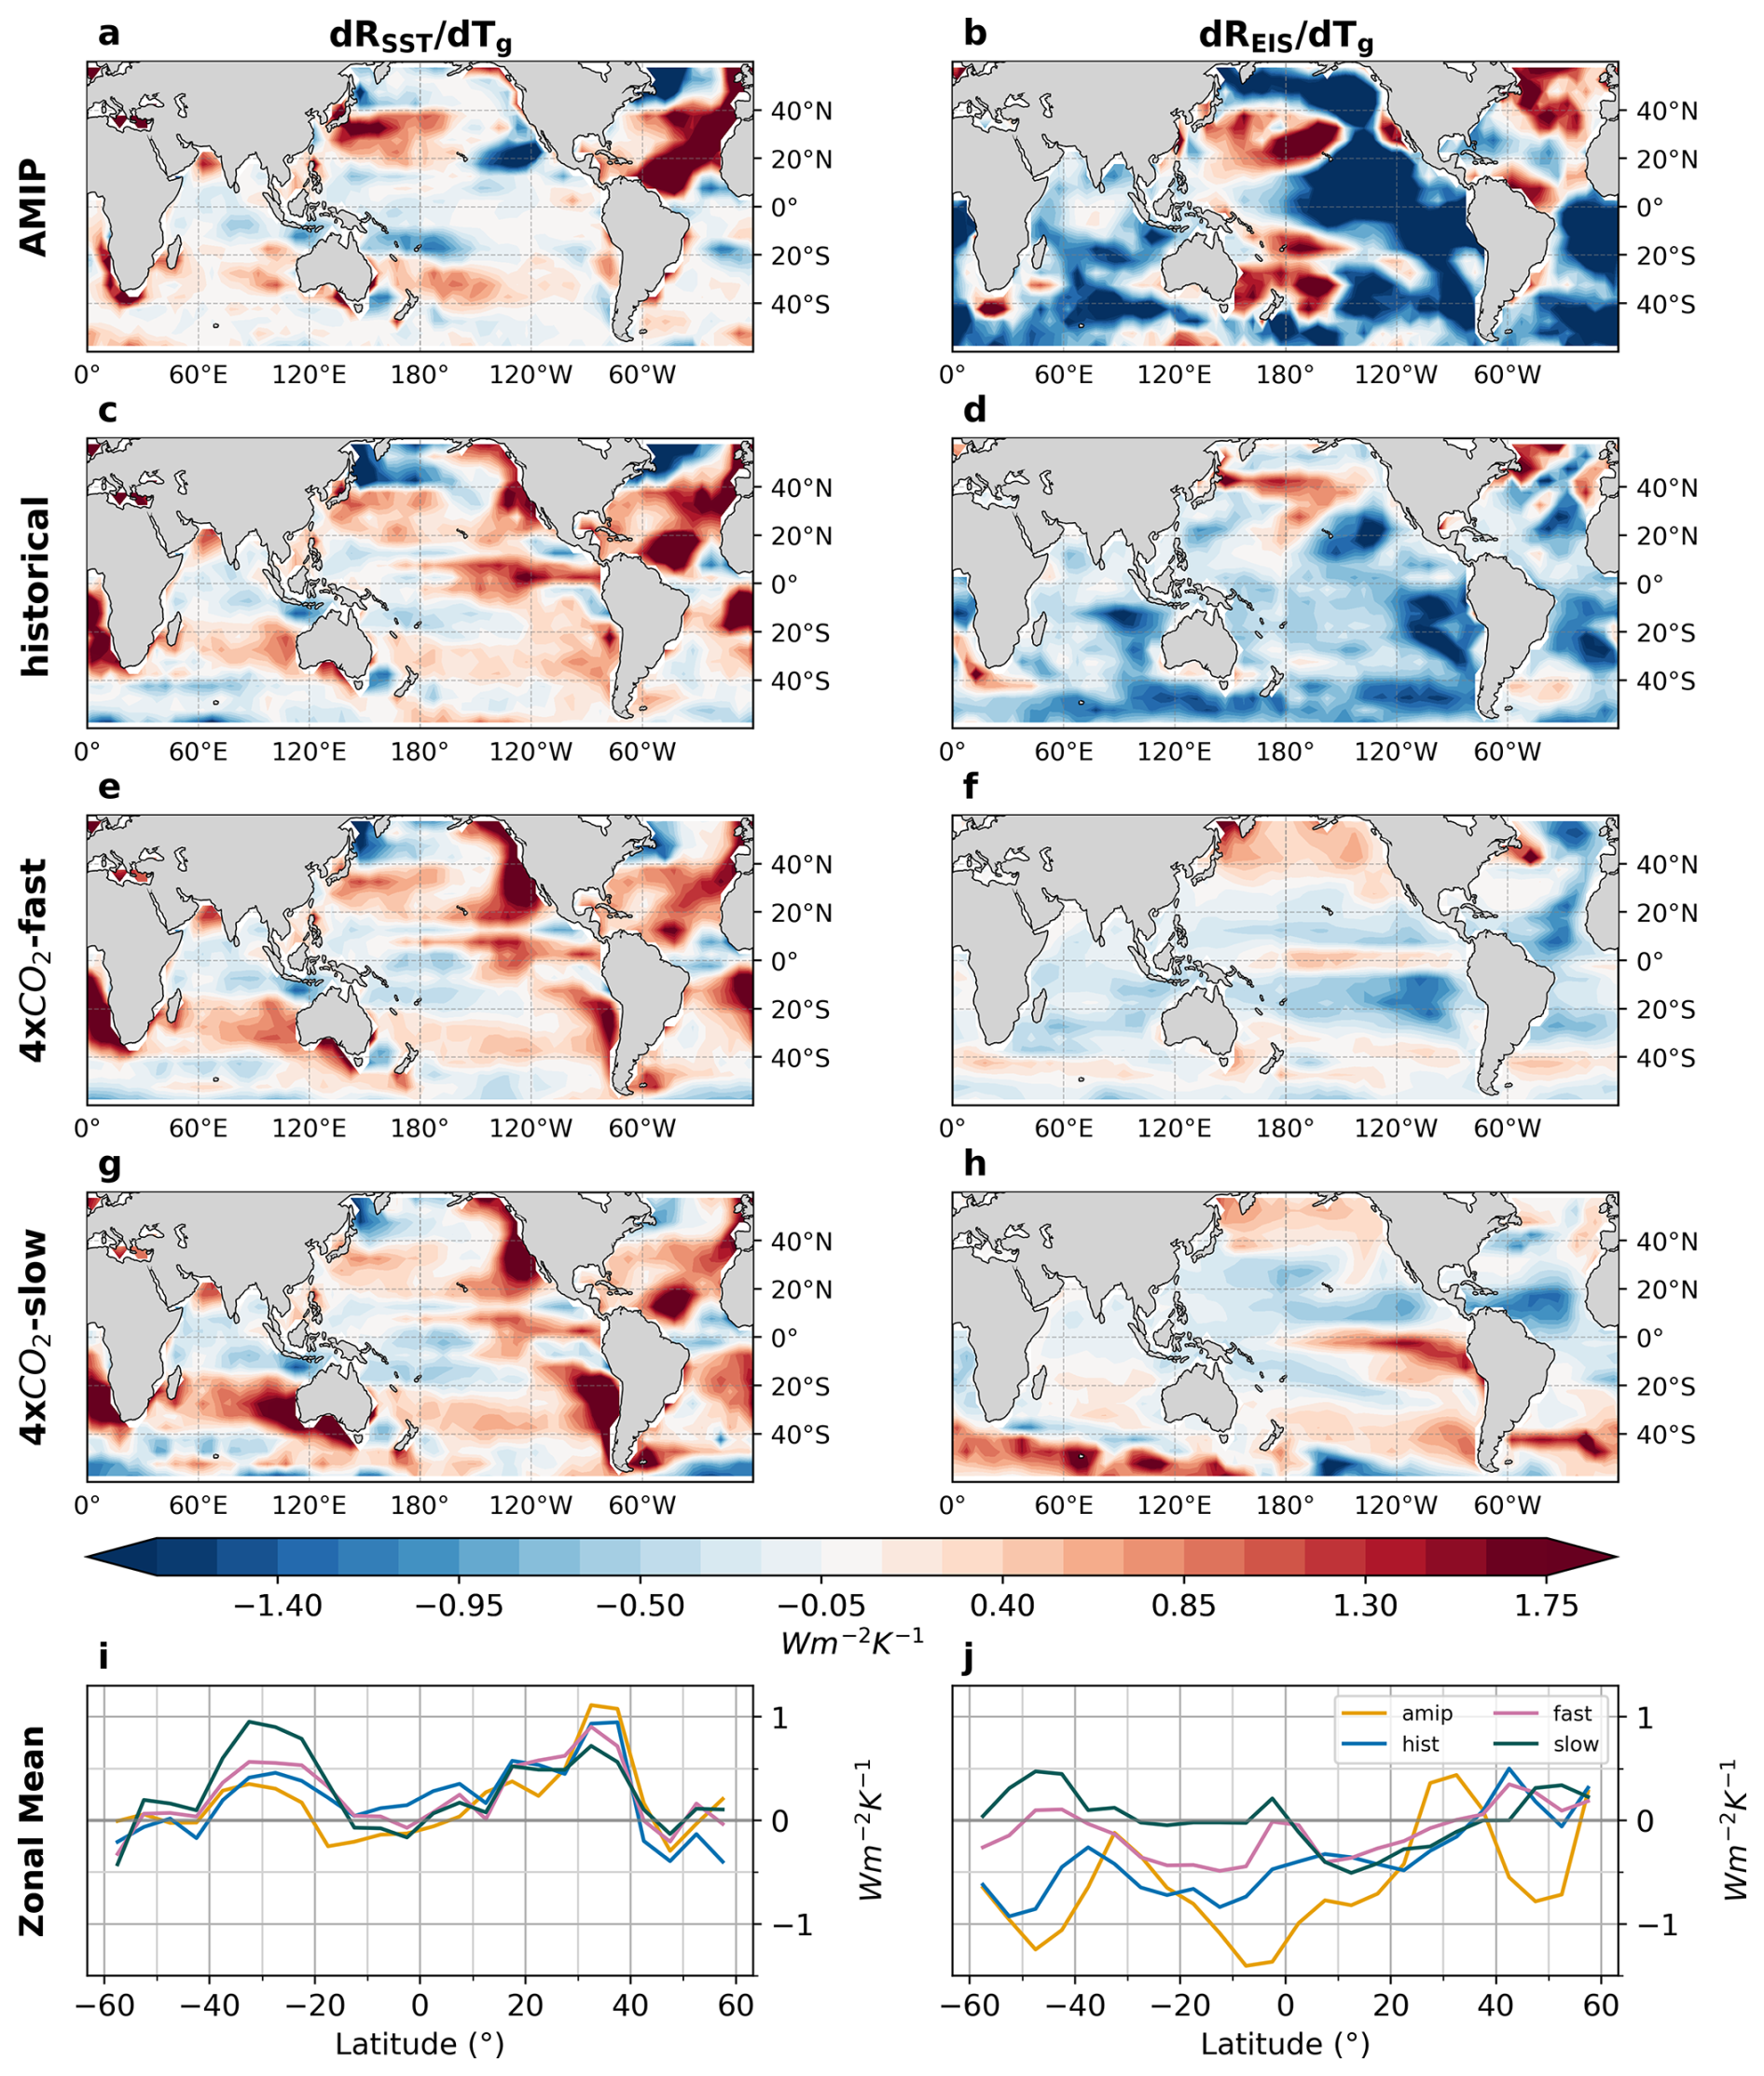
Figure 3Spatial distribution and their zonal averages of ensemble mean (a–e) SST- and (f–j) EIS-induced feedback in AMIP, historical, abrupt-4xCO2-fast, and abrupt-4xCO2-slow experiments. Low-cloud feedback estimates are calculated using model-specific radiative flux sensitivities to CCFs and model-specific CCFs. Maps of Tadv, RH, ω, and WS are shown in Fig. C1 in the Appendix.
3.2 Regional Patterns
In this section, we analyze the spatial distribution of CCF-specific changes under warming and their induced low-cloud feedback. Figure 2 shows the ensemble mean changes of cloud-controlling factors per unit warming, , and Fig. 3 shows the low-cloud feedback induced by individual cloud-controlling factors across experiments. We only show the feedback attributed to SST and EIS in the main figures for their larger role in driving the total low-cloud feedback and the low-cloud feedback pattern effect. The results for Tadv, RH, ω, and WS are shown in Figs. B1 and C1.
The three transient simulations show more warming in the West Pacific and either cooling (in AMIP) or less warming (in historical and 4xCO-fast) in the Southeast Pacific and Southern Ocean, which eventually transitions to more warming in the East Pacific and Southern Ocean on long-time scales (4xCO2-slow). Despite these regional differences in SST, the direct contributions of SSTs to the low cloud feedback, dRSST, are quite similar across coupled experiments (Fig. 3). The AMIP simulation does show some significant regional differences for dRSST especially in the North and Equatorial Pacific, but these cancel each other out when looking at zonal-mean (Fig. 3i) and global values (Fig. 1).
The different regional SST changes do, however, drive significant differences in marine low-cloud feedback through their impact on EIS patterns (Fig. 2 b, d, f, h, j). EIS patterns go from exhibiting a strengthening of the inversion with global warming in the South East Pacific and the Southern Ocean in transient and historical simulations (AMIP, historical, 4xCO2-fast) to a weakening of the inversion with global warming in long term 4xCO2-slow.
Overall, the changes in dREIS that dominate the pattern effect are primarily driven by the progressive weakening of the inversion in the low latitudes and in the South East Pacific between transient and long-term simulations (Fig. 3b, d, f, h, j). While the Northern Hemisphere exhibits strong regional changes in EIS and dREIS, these mostly cancel each other out in the zonal means (Fig. 3j).
Note that while the AMIP and coupled historical simulations share qualitative patterns of meteorology (e.g. Fig. 2a, c and b, d) and CRE changes (e.g. Fig. 3a, c, and b, d), it is clear that coupled simulations struggle to replicate observed warming pattern and subsequent changes in meteorology and feedbacks. Large regional differences compensate each other in the SST component, such that zonal-mean and global-mean differences are negligible for dRSST. However, these biases in SST patterns drive large biases in regional EIS, which in turn drive large biases in dREIS, that persist into the zonal- and global-means. Due to these biases in dREIS, the transient low-cloud feedback in the coupled historical simulations is therefore biased towards more positive values compared to the low-feedback obtained when prescribing observed SST patterns (AMIP) simulations. Holding the assumption that the 4xCO2-slow response is representative of the future low-cloud response, using the coupled historical simulation would under-estimate the magnitude of the pattern effect, Δλ.
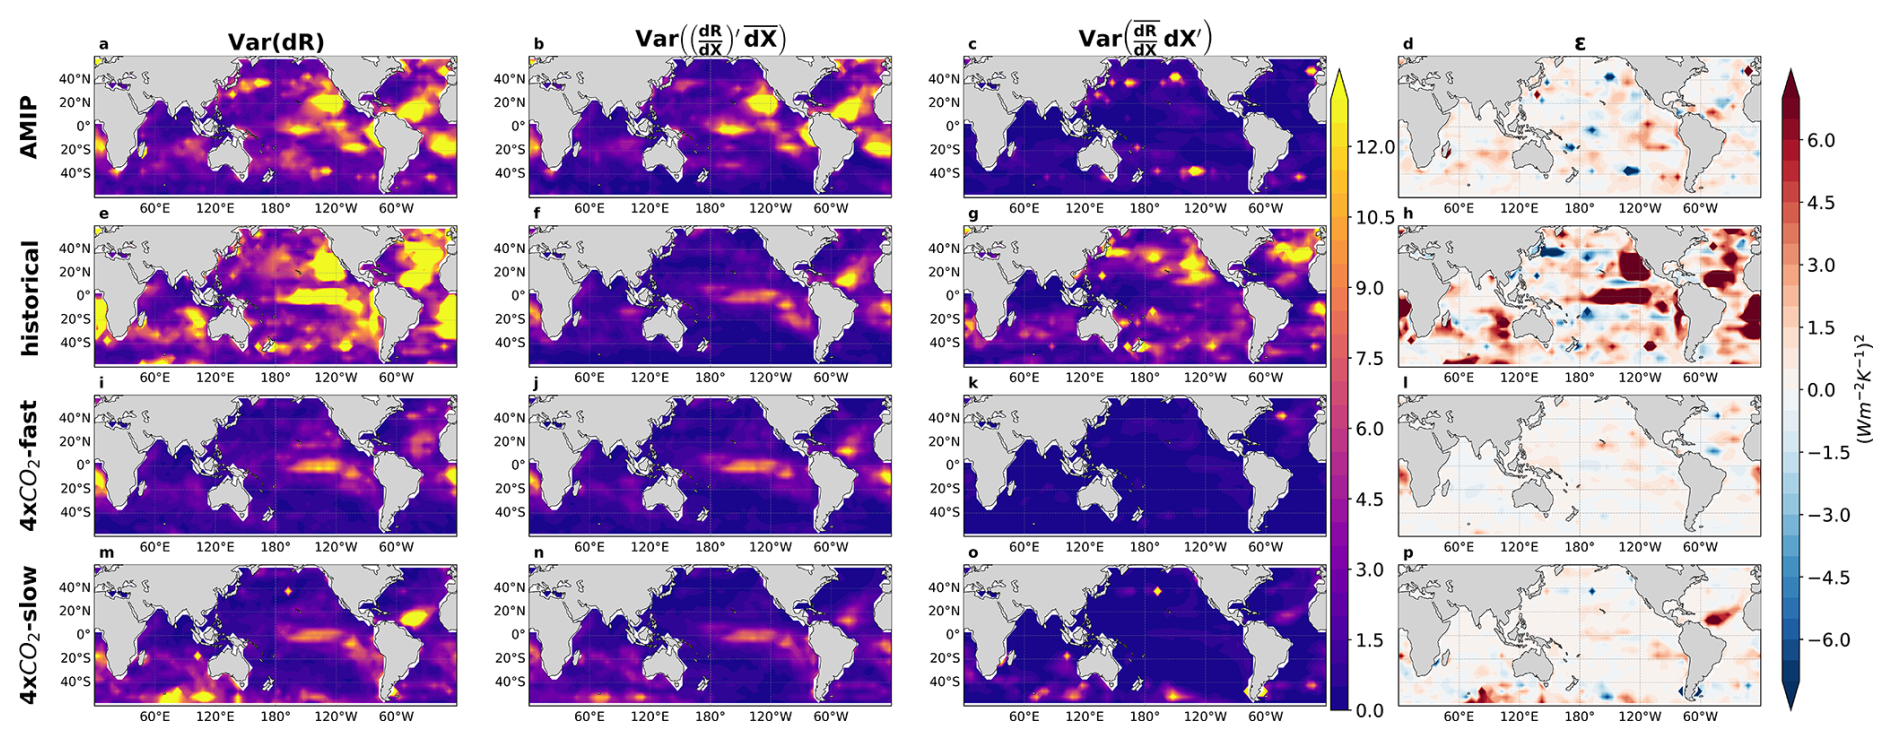
Figure 4Spatial distribution of (from left column to right) the total low-cloud feedback inter-model spread, and the breakdown of each term on the right-hand-side of Eq. (4): variance determined by the radiative flux sensitivities to CCF alone, variance determined by CCF changes from warming alone, and the covariance (ϵ) between the low-cloud meteorological kernels and the meteorology for each experiment, which is the difference between the first column and the sum of the second and third column from left to right. From top to bottom row shows the experiments: (a–d) AMIP, (e–h) historical, (i–l) abrupt-4xCO2-fast and (m–p) abrupt-4xCO2-slow. Spatial distribution for the inter-model spread for each CCF-induced feedback are shown in Figs. D1–D6 in the Appendix.
Following Eq. (4), Fig. 4 shows inter-model spread in regional feedback estimates. Var(dR) depicts the model spread of the total marine low-cloud feedback, depicts the spread of model kernels, and depicts the spread of meteorological condition changes, and the last column illustrates the residual term in the decomposition due to covariances between the first two terms.
As expected from the global analysis, there is high model agreement that most regional variance in the total feedbacks comes from the meteorological kernels (Fig. 4b, f, j, n), with the variance pattern in the model kernels largely mirroring the pattern in the total feedback variance (Fig. 4a, e, i, m). Results from Historical also have a high inter-model variance in the CCF changes per unit warming and covariance between the two terms, caused by the EIS-component as seen in Sect. 3.1 and Fig. D2 in the Appendix. The regions with the largest spread in Var(dR) are those with abundant marine low clouds. The central and eastern Pacific and tropical North Atlantic Ocean have low model agreement, with inter-model variance being dominated by the SST and EIS kernels (Figs. D1–D6).
In this paper we identified changes in EIS (Fig. 1a) in the Southeast Pacific and Southern Ocean (Fig. 3j) as the largest contribution to the marine low-cloud pattern effect, where the pattern effect is defined as the difference in feedback between transient and long-term warming. Surprisingly, we find that large regional changes in the direct impact of SSTs on low clouds, dRSST cancel each other out in the global mean. Thus, the time-evolving SST patterns impact the radiative feedback indirectly, by altering atmospheric circulation and EIS.
Transient warming patterns are characterized by a strengthening of the inversion in the Southeast Pacific and Southern Ocean, which leads to a strong negative EIS-induced feedback. As the warming pattern evolves, EIS changes in these regions go from positive to negative, indicating an eventual weakening of the inversion, and a subsequent switch to a positive feedback in these regions.
Of the other CCFs, SST has a large contribution to the total marine low-cloud feedback, but that contribution is constant across experiments, leading to a negligible contribution to the pattern effect. RH changes between historical and long-term experiments suggest a small compensation of the EIS-induced pattern effect, while Tadv, ω, and WS have negligible contribution to both the net feedback and the pattern effect.
Additionally, we show that the majority of the uncertainty in the simulated low-cloud CRE lies in the model sensitivity of marine low clouds to environmental conditions, i.e. the meteorological kernels. However, a non-trivial amount of uncertainty does come from inter-model spread in how coupled models simulate historical changes in EIS. Since the spread in EIS is smaller for AMIP simulations with prescribed SSTs, the spread in EIS response in the coupled models must ultimately come from how coupled models simulate SST patterns, rather than the direct response of EIS to historical forcing. The impact of these differences in SST patterns on feedbacks is indirect, and shows up in the EIS-driven component, not in the SST-driven component.
Our results suggest that while model estimates are broadly consistent with observations, model-based kernels tend to underestimate the strength of the pattern effect relative to satellite-derived kernels. Considerable spread remains across estimates derived with observational meteorological kernels (Fig. A2), due to the differences in instrument capabilities, cloud detection algorithms and selection of cloud retrievals in each observational dataset (e.g. Stubenrauch et al., 2013; Minnis et al., 2011). For example, ISCCP uses IR-VIS methods to provide cloud properties that correspond to the radiative mean from both high and low clouds and tend to misidentify high clouds that overlay low clouds and return biased-high mid-level cloud amounts. MODIS, CERES-FBCT and PATMOS-x products retrieve high cloud properties using IR methods, but distinct biases remain. Using all four observational kernels therefore provides a comprehensive range of low cloud amounts and the resulting feedback and pattern effect estimates. However, additional observations will remain pivotal in narrowing the range of radiative sensitivities to meteorology. Regardless, the inter-model spread in the magnitude of the pattern effect is much less than the spread in the net feedbacks (see comparison between (Figs. 3a, b and D1a, b, and c).
This work helps pinpoint the two main areas of future work needed to improve estimates of both the net marine low-cloud feedback and the pattern effect: a better constraint on the low-cloud response to inversion strength, and improved ability of coupled models to simulate historical SST patterns.
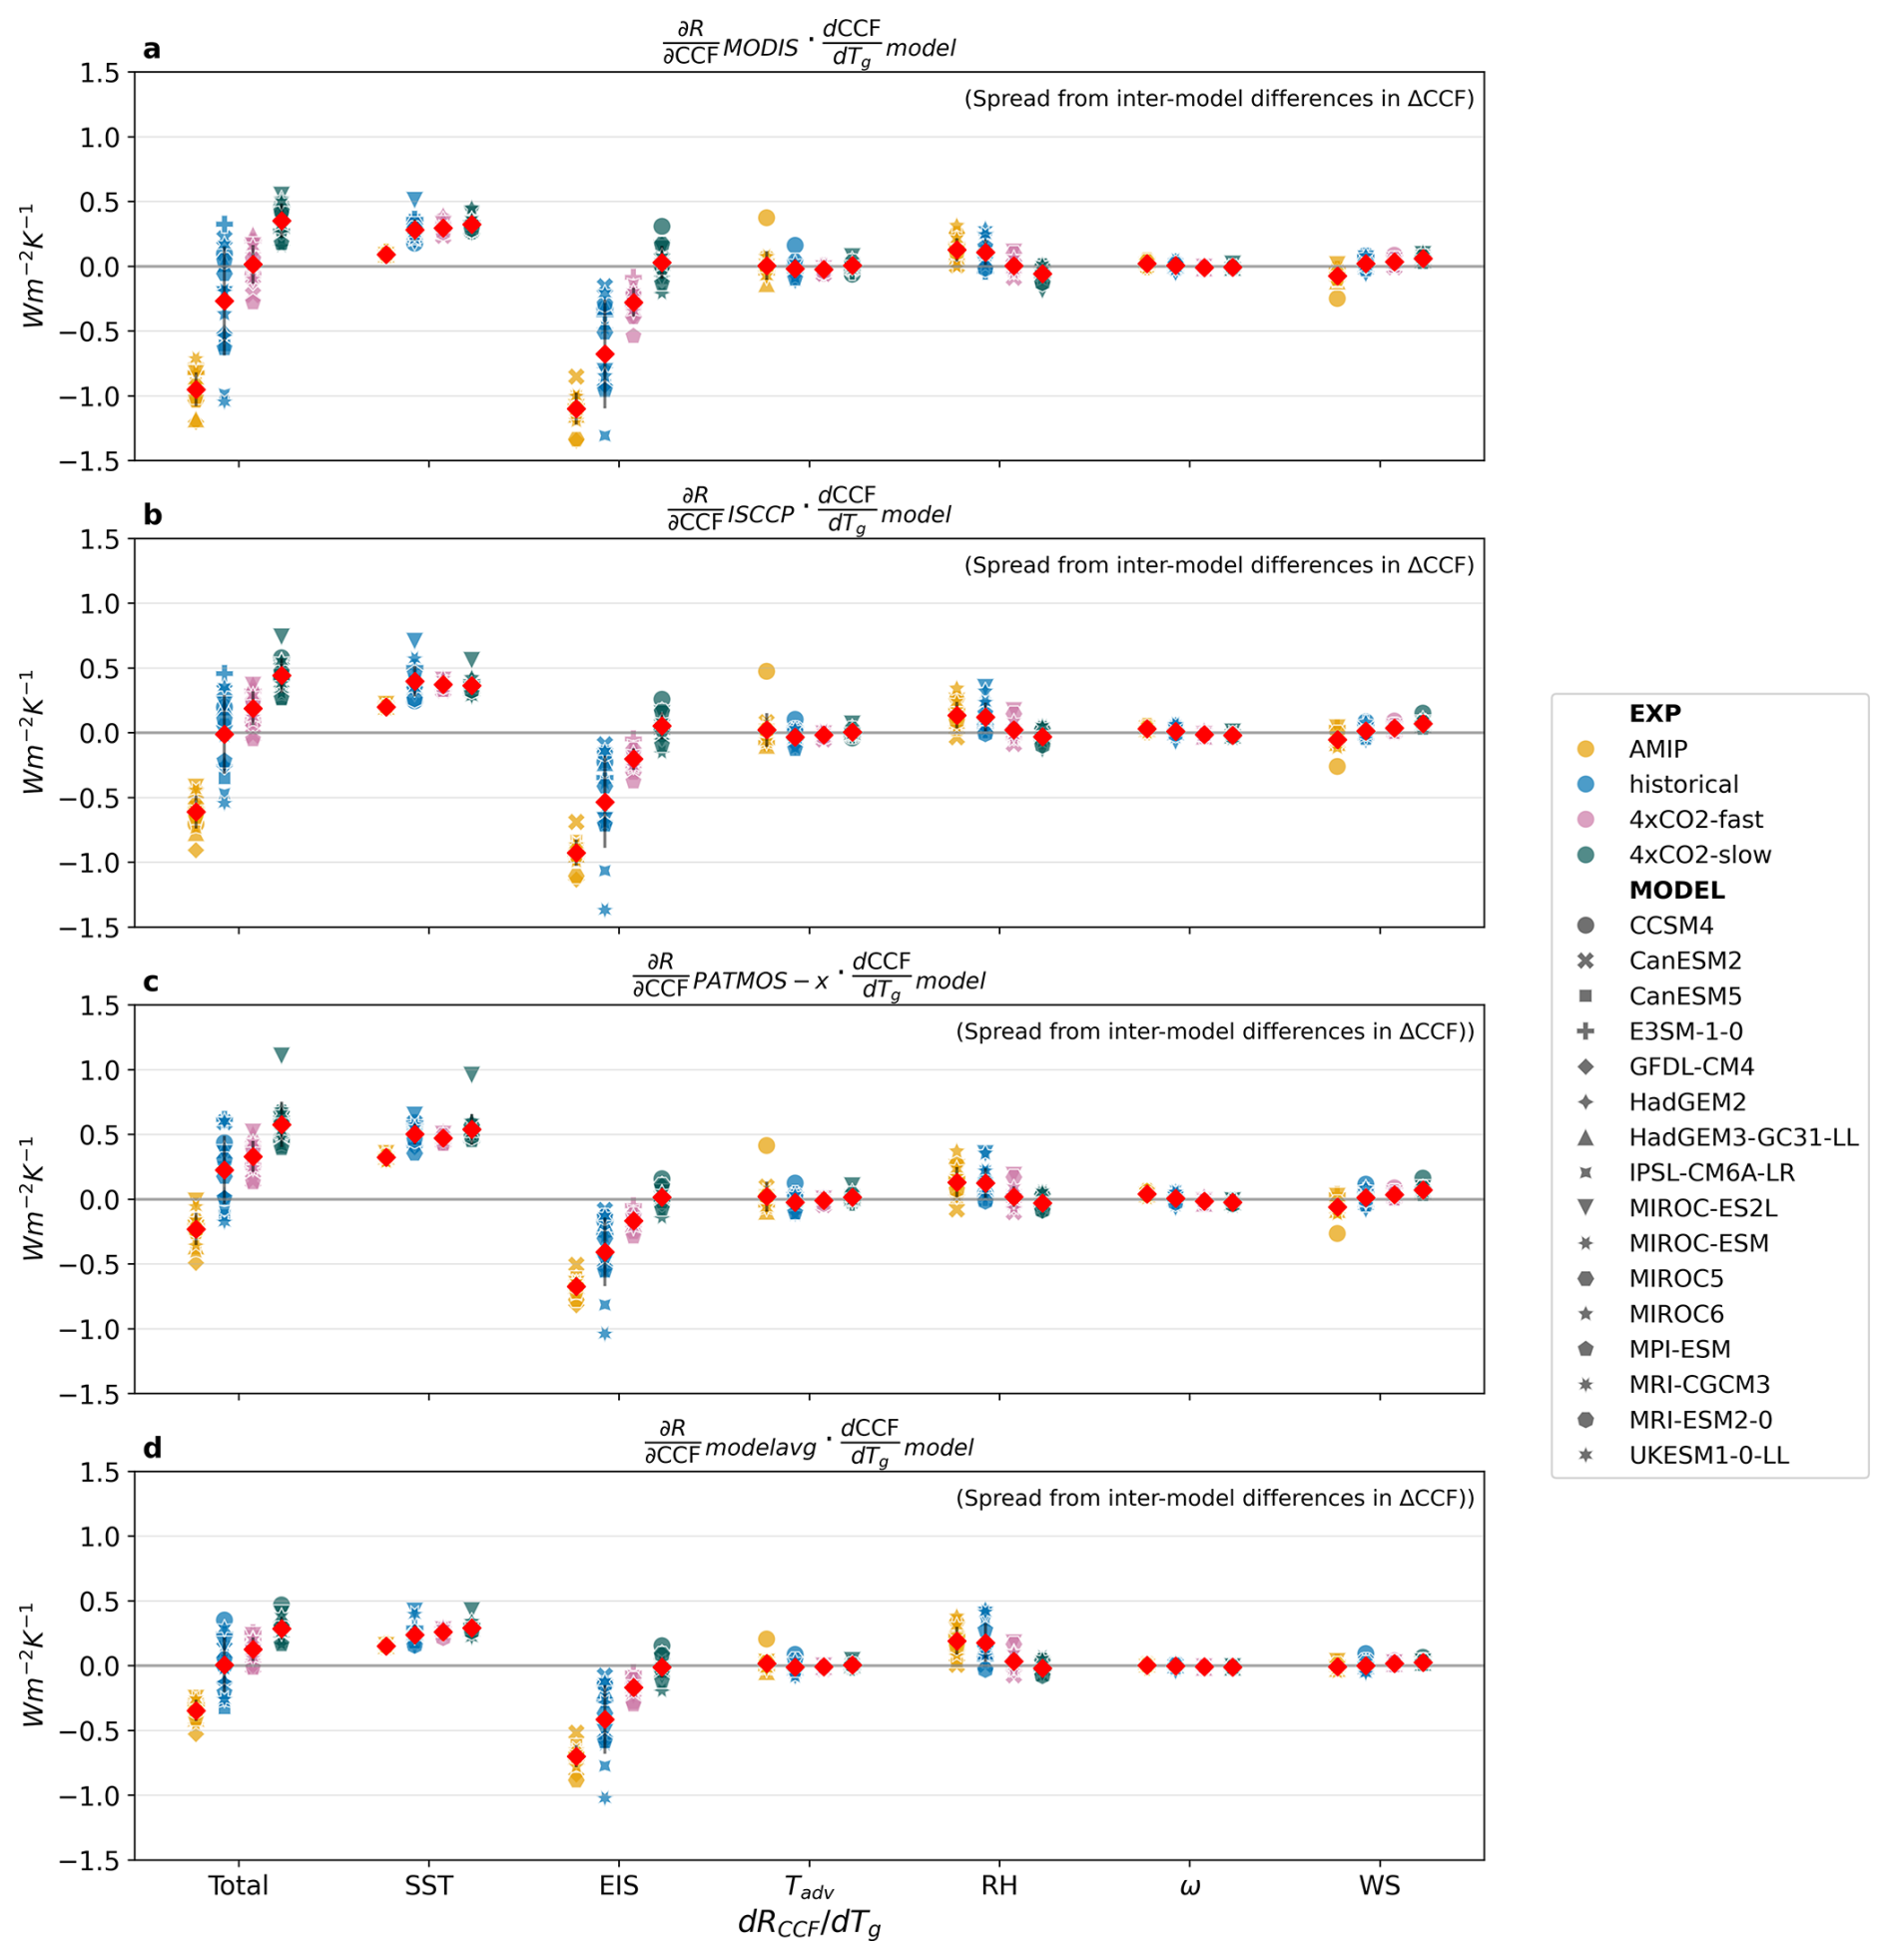
Figure A1Marine-only, spatially-weighted averages of 60° N–60° S low-cloud feedback estimates and its sub-components calculated with radiative flux sensitivities to meteorology () derived from (a) MODIS, (b) ISCCP, (c) PATMOS-x products, and (d) multi-model mean and model-specific meteorological changes (). Each model is represented by an individual marker.
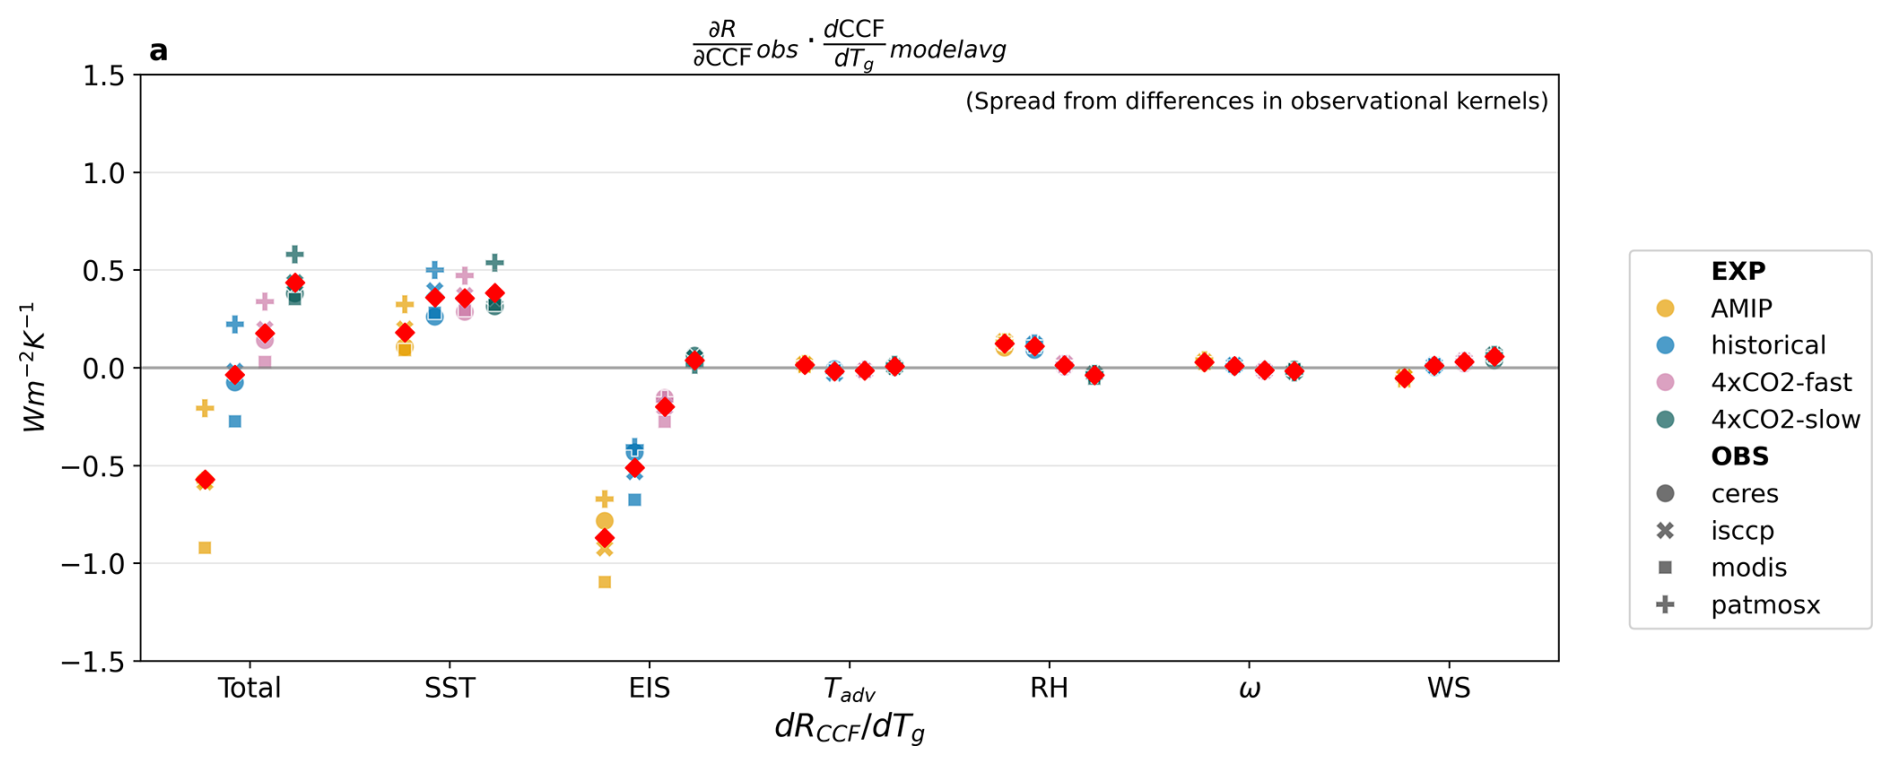
Figure A2Marine-only, spatially-weighted averages of 60° N–60° S low-cloud feedback estimates and its sub-components calculated with radiative flux sensitivities to meteorology () derived from CERES, MODIS, ISCCP, and PATMOS-x products, and ensemble-averaged meteorological changes (). Each observational kernel is represented by an individual marker.
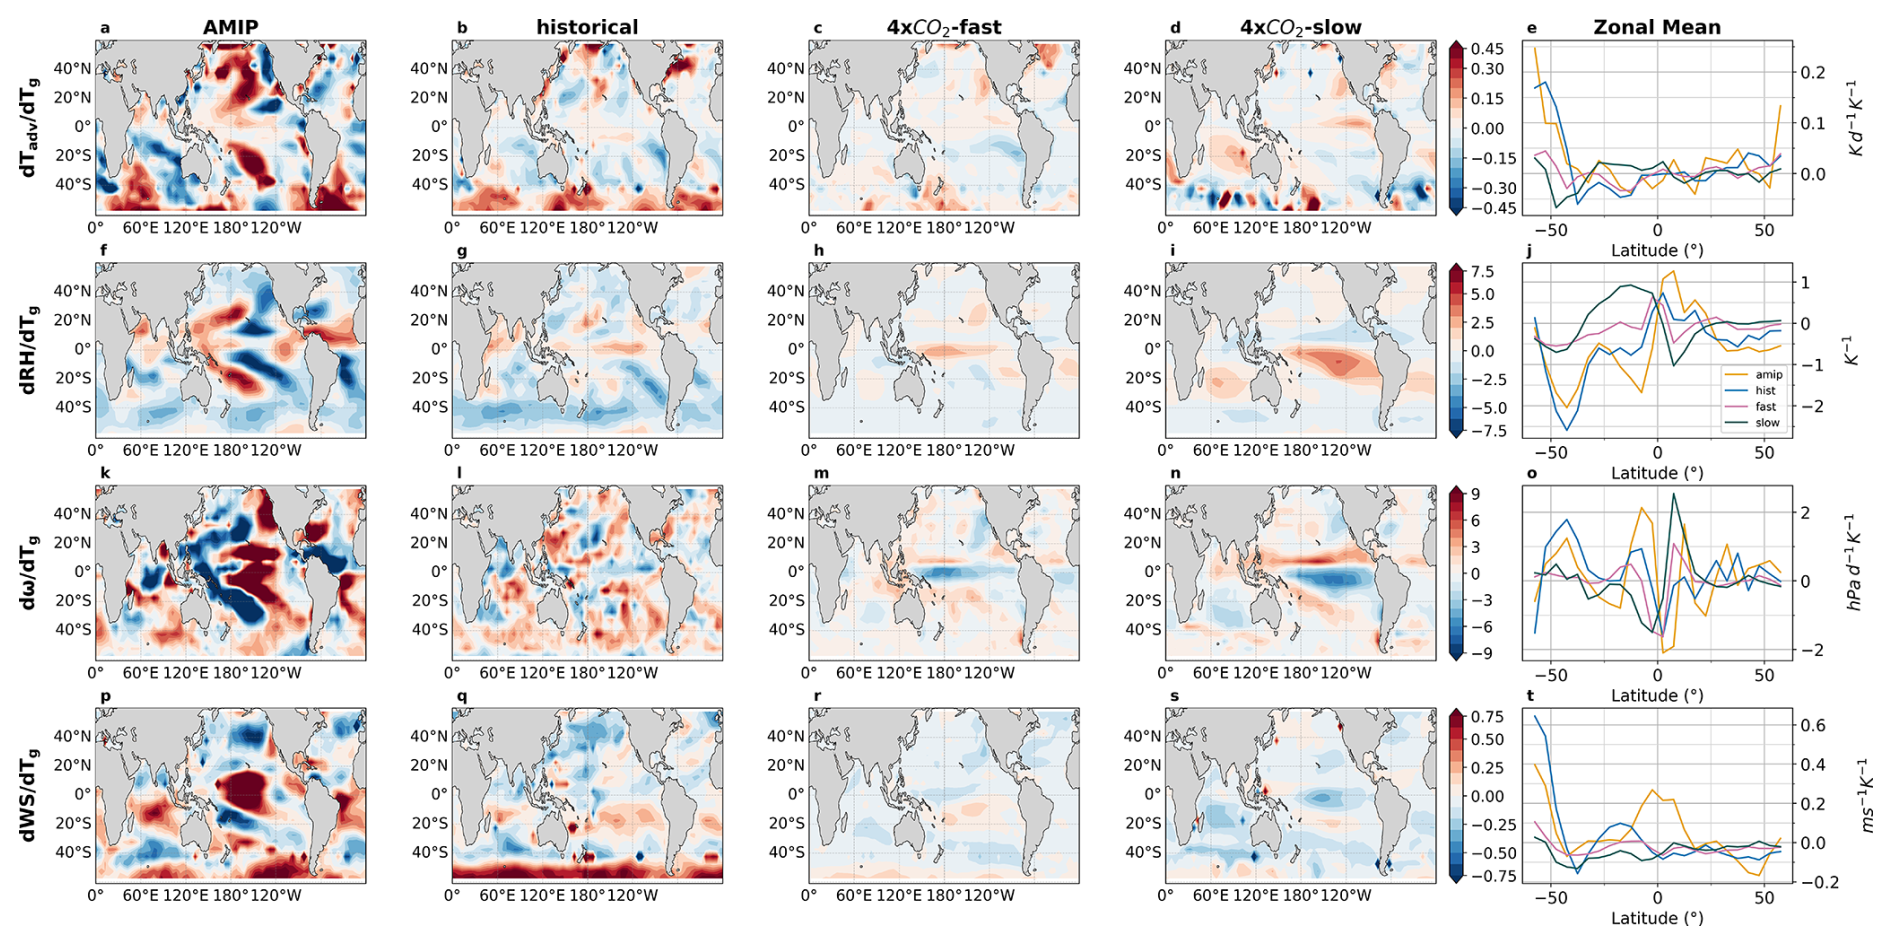
Figure B1Spatial distribution and their zonal averages of (a–e) Tadv, (f–j) RH, (k–o) ω, and (p–t) WS changes per degree warming in AMIP, historical, abrupt-4xCO2-fast, and abrupt-4xCO2-slow experiments. Yellow, blue, magenta and green lines in the zonal average plots represent AMIP, historical, 4xCO2-fast, and 4xCO2-slow experiments.
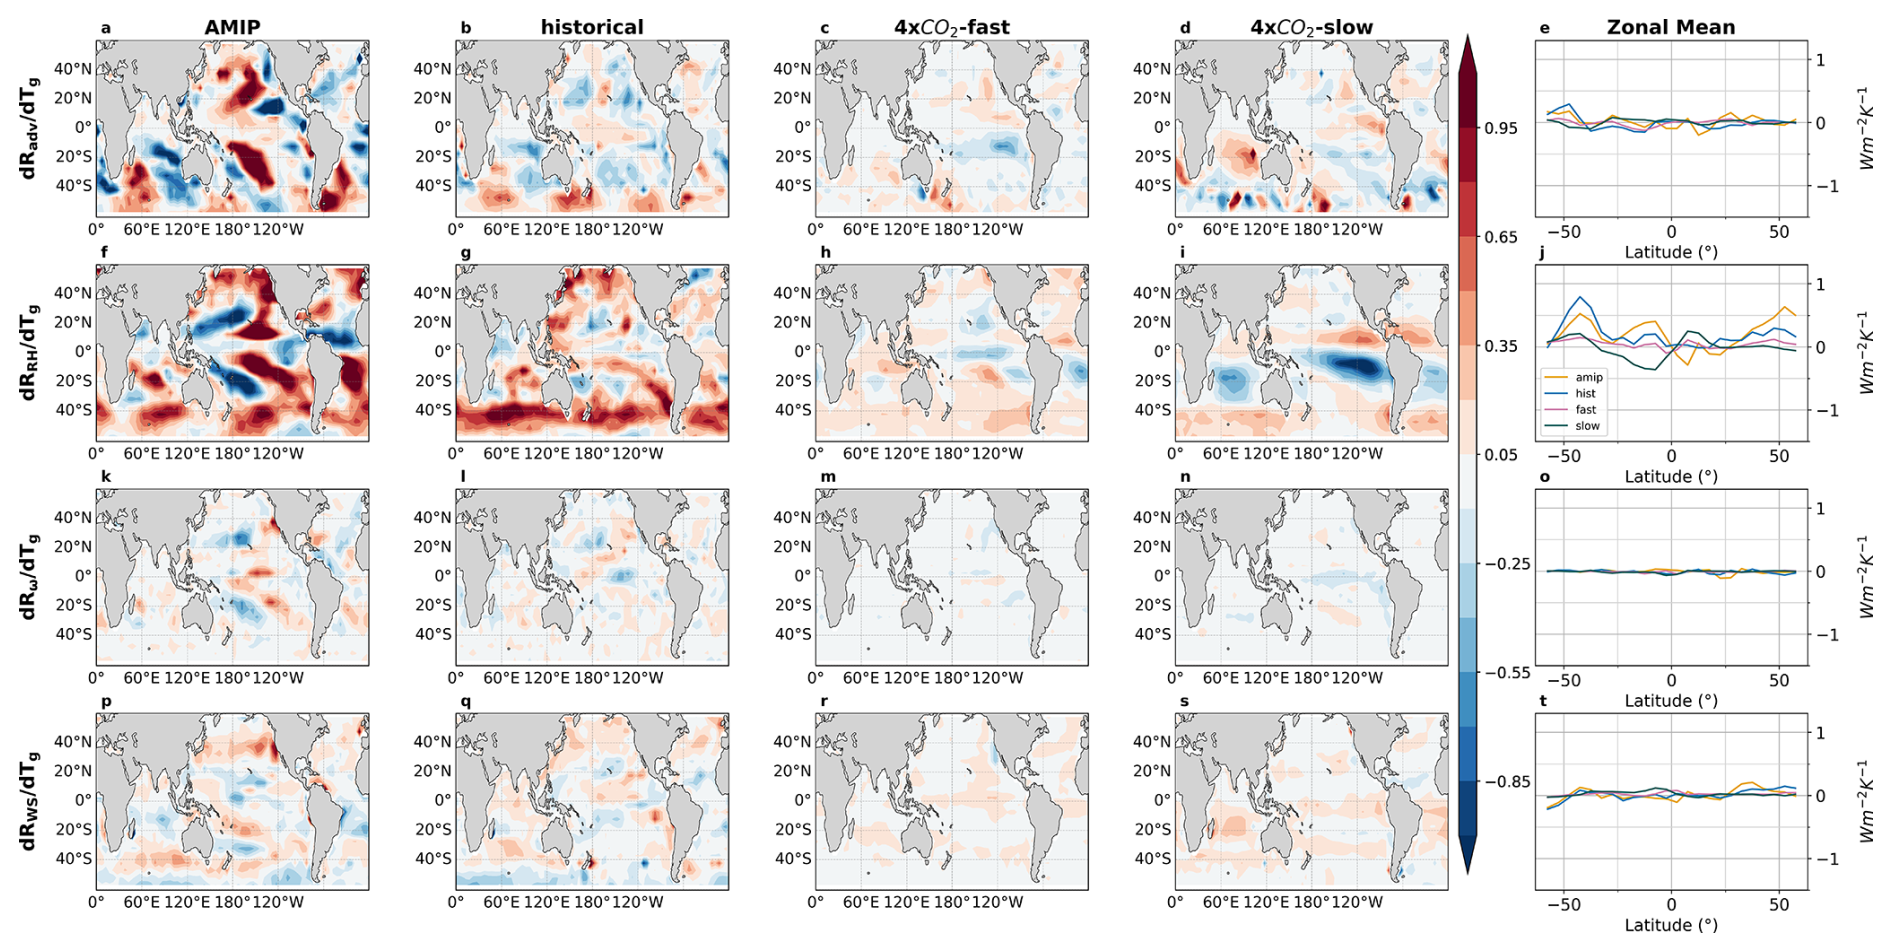
Figure C1Spatial distribution and their zonal averages of (a–e) Tadv-, (f–j) RH-, (k–o) ω-, and (p–t) WS-induced feedback in AMIP, historical, abrupt-4xCO2-fast, and abrupt-4xCO2-slow experiments. Yellow, blue, magenta and green lines in the zonal average plots represent AMIP, historical, 4xCO2-fast, and Slow experiments. Colorbar limits are tightened to better reflect the spatial pattern of the CCF-induced low-cloud feedback.
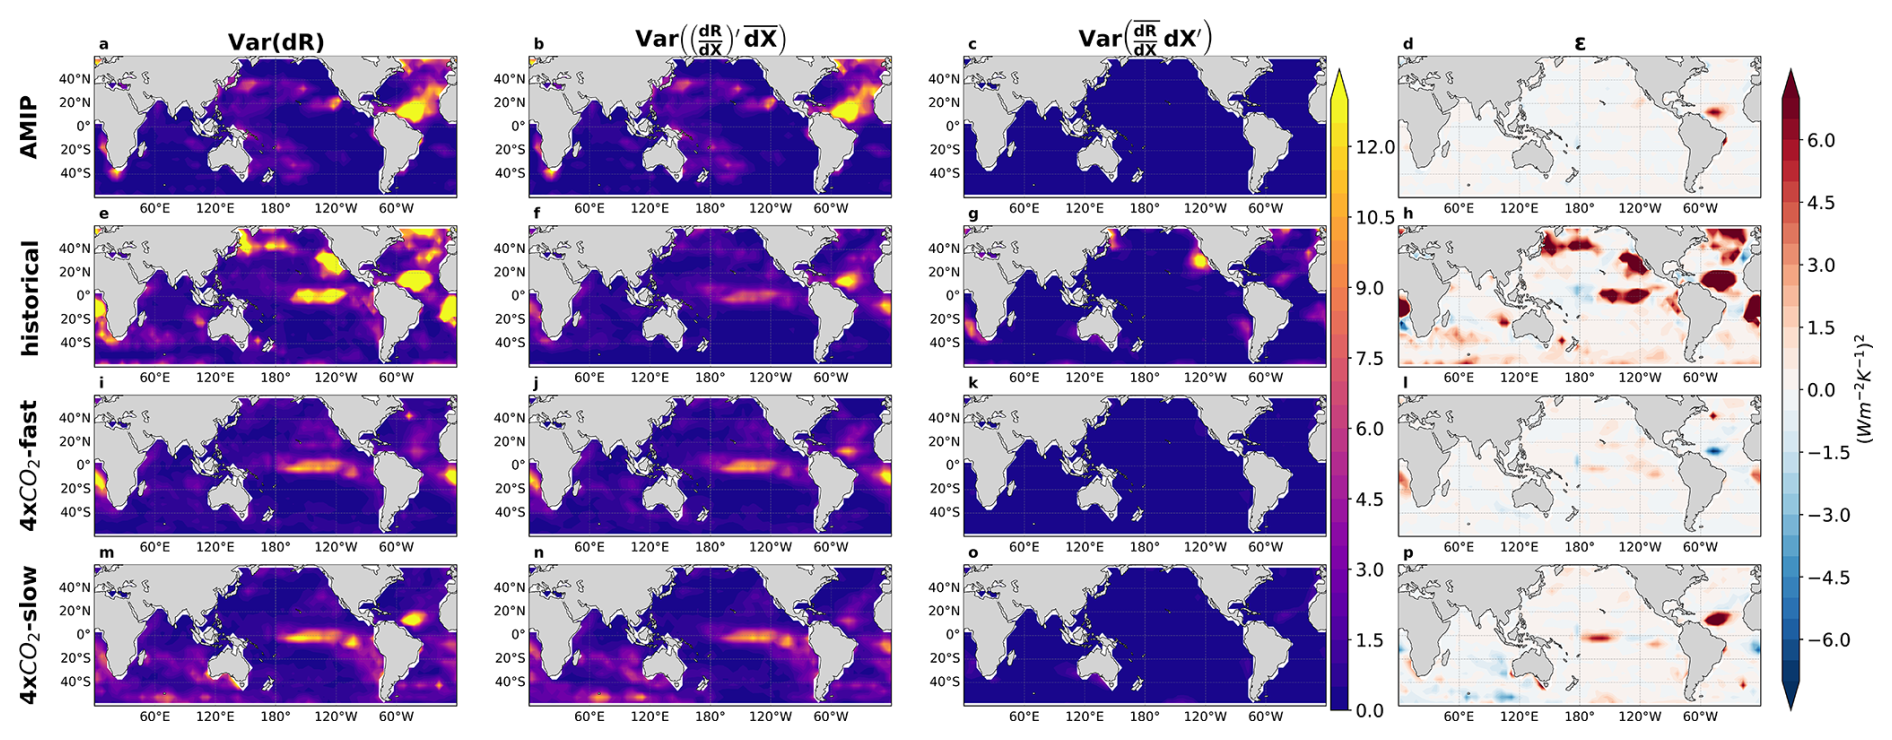
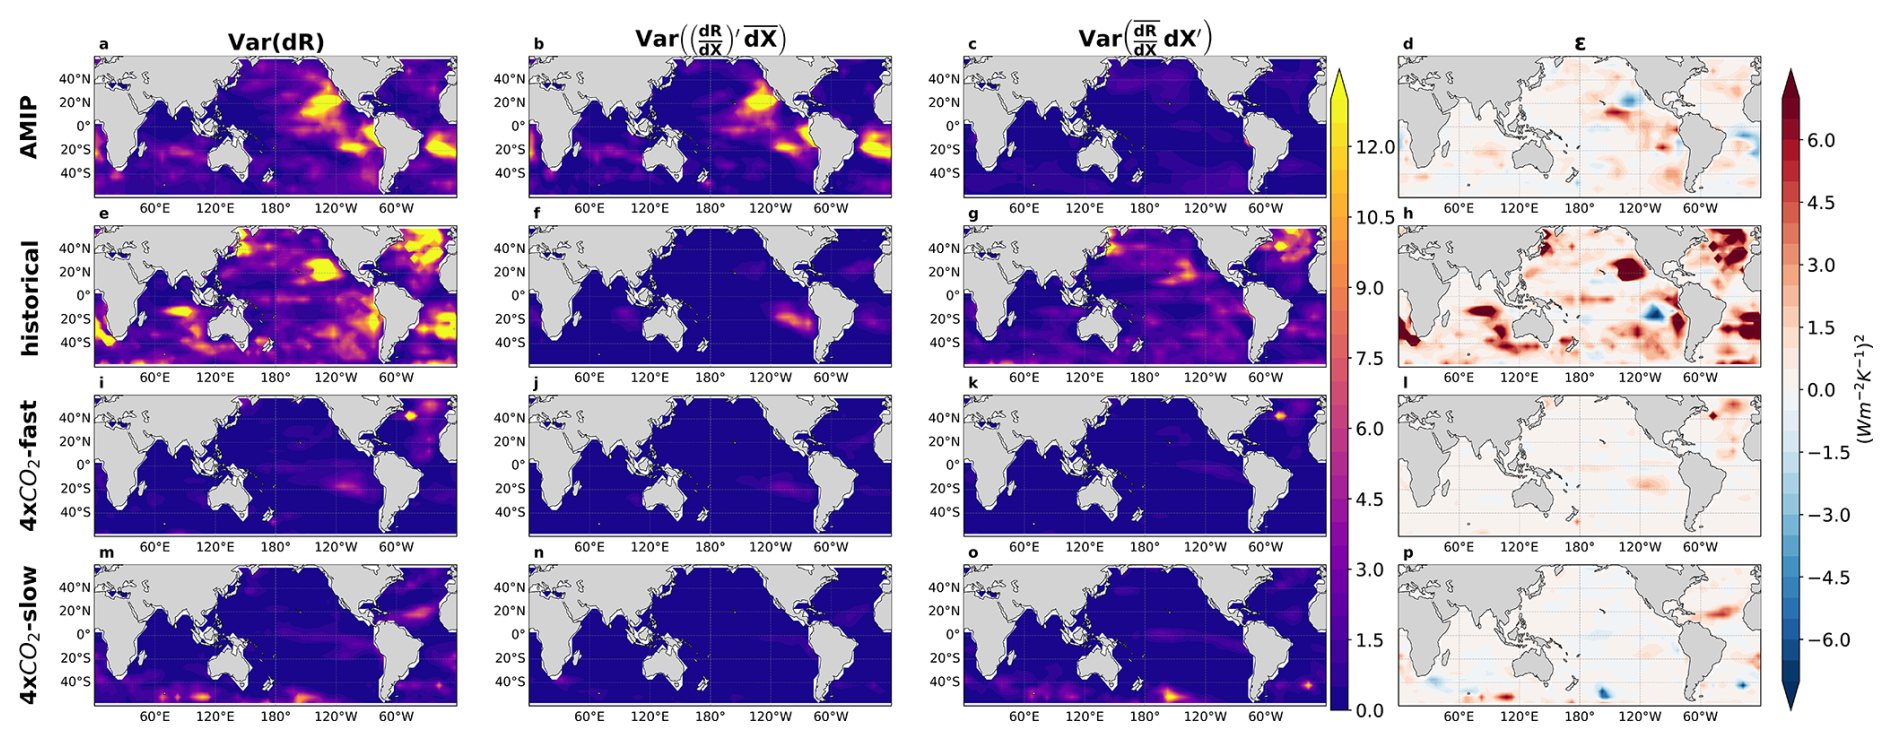
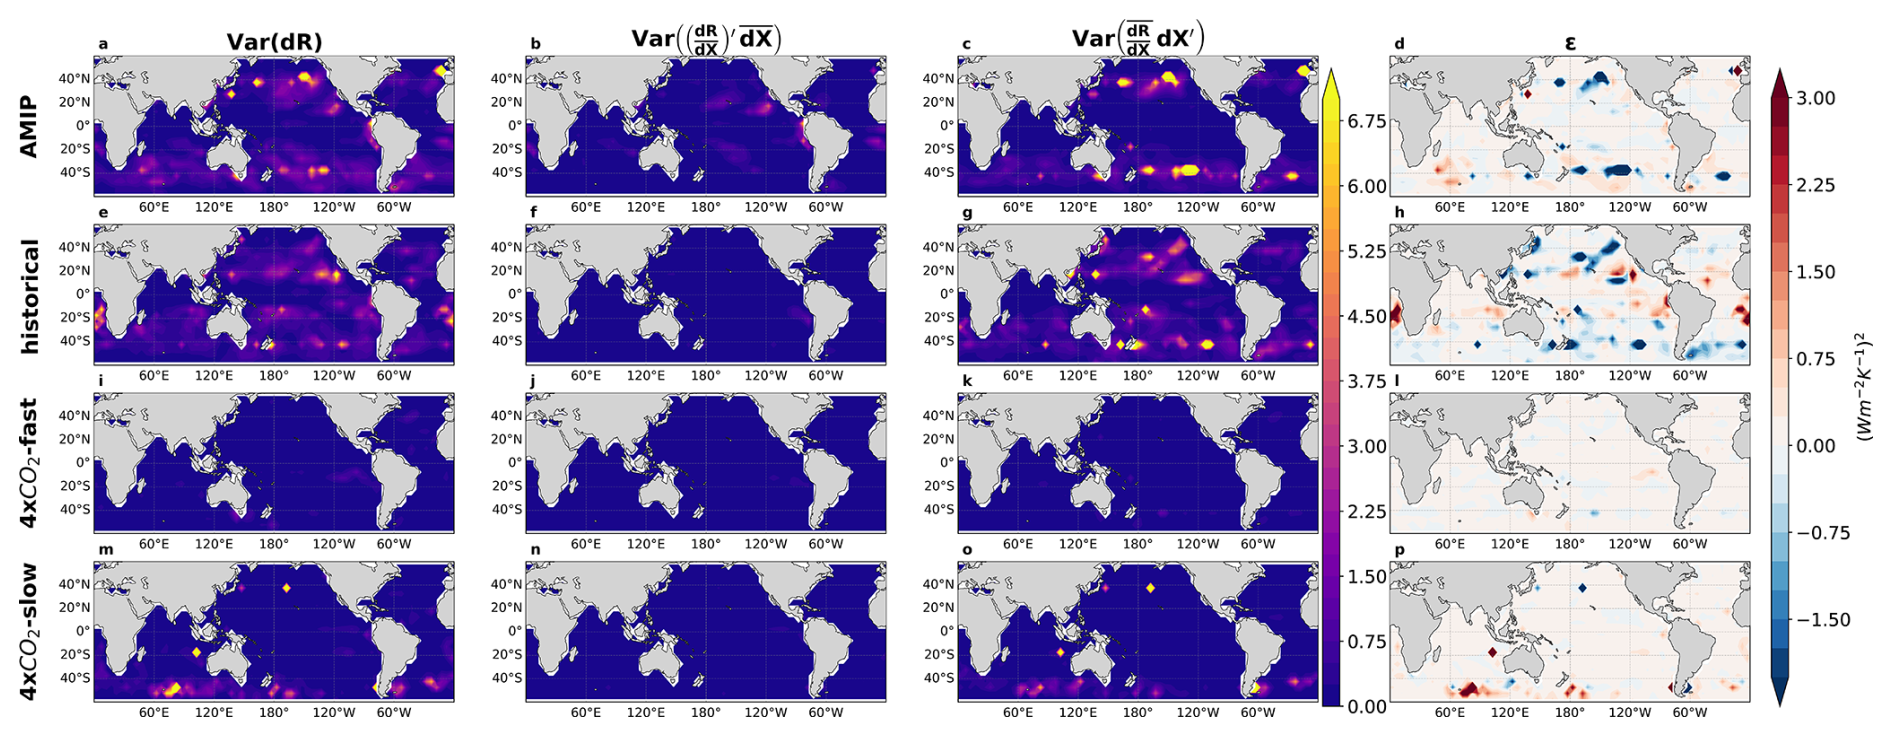
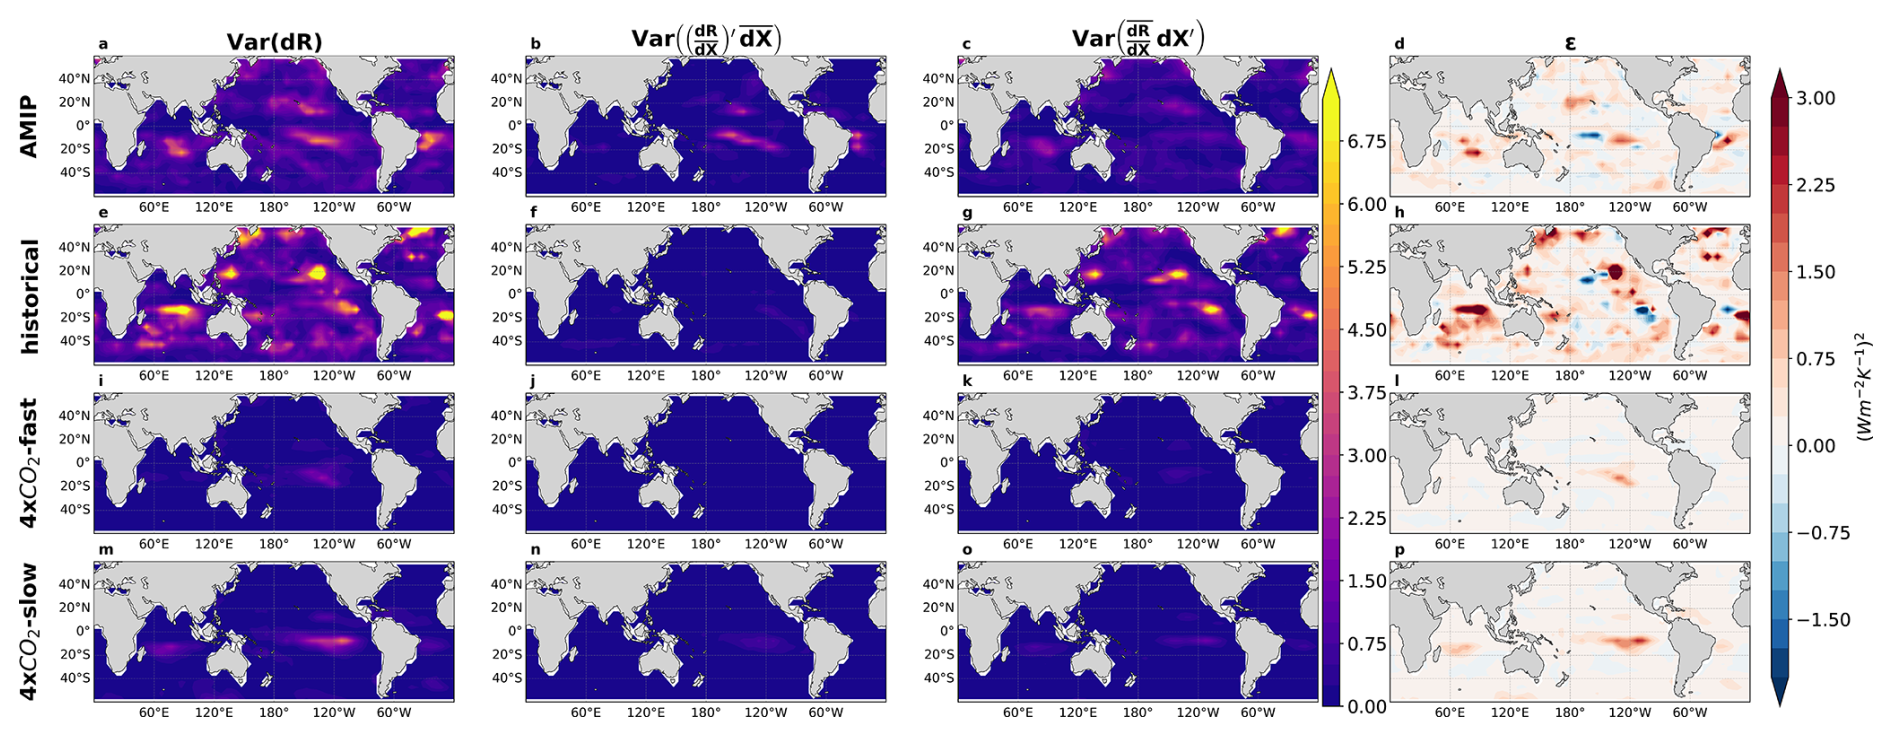

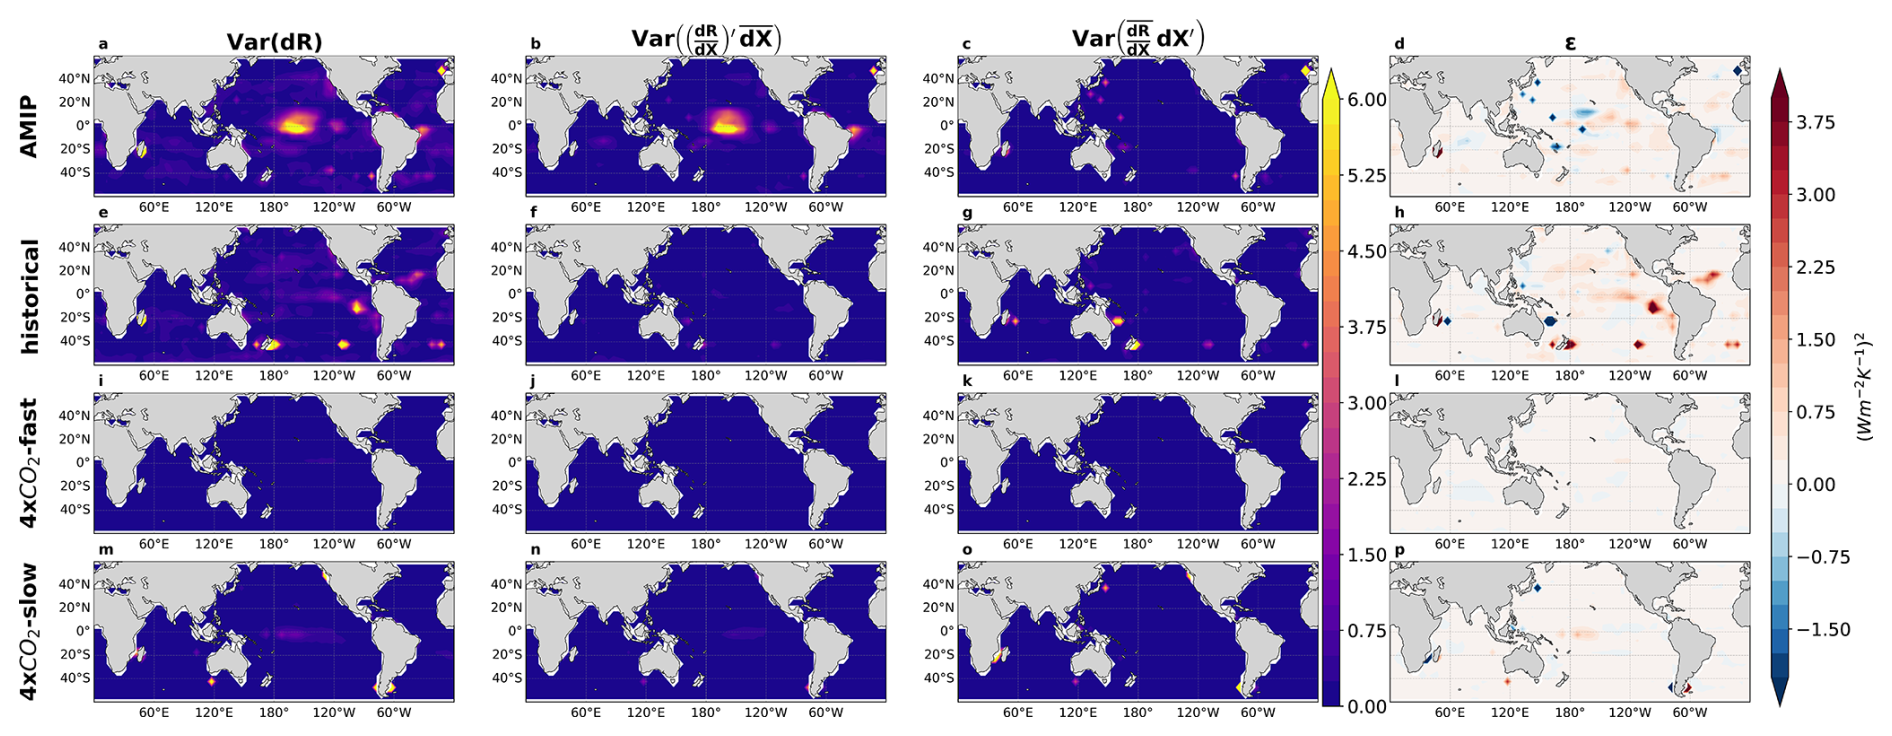
Table E1References and the period used for each experiment from CMIP 5 and 6.
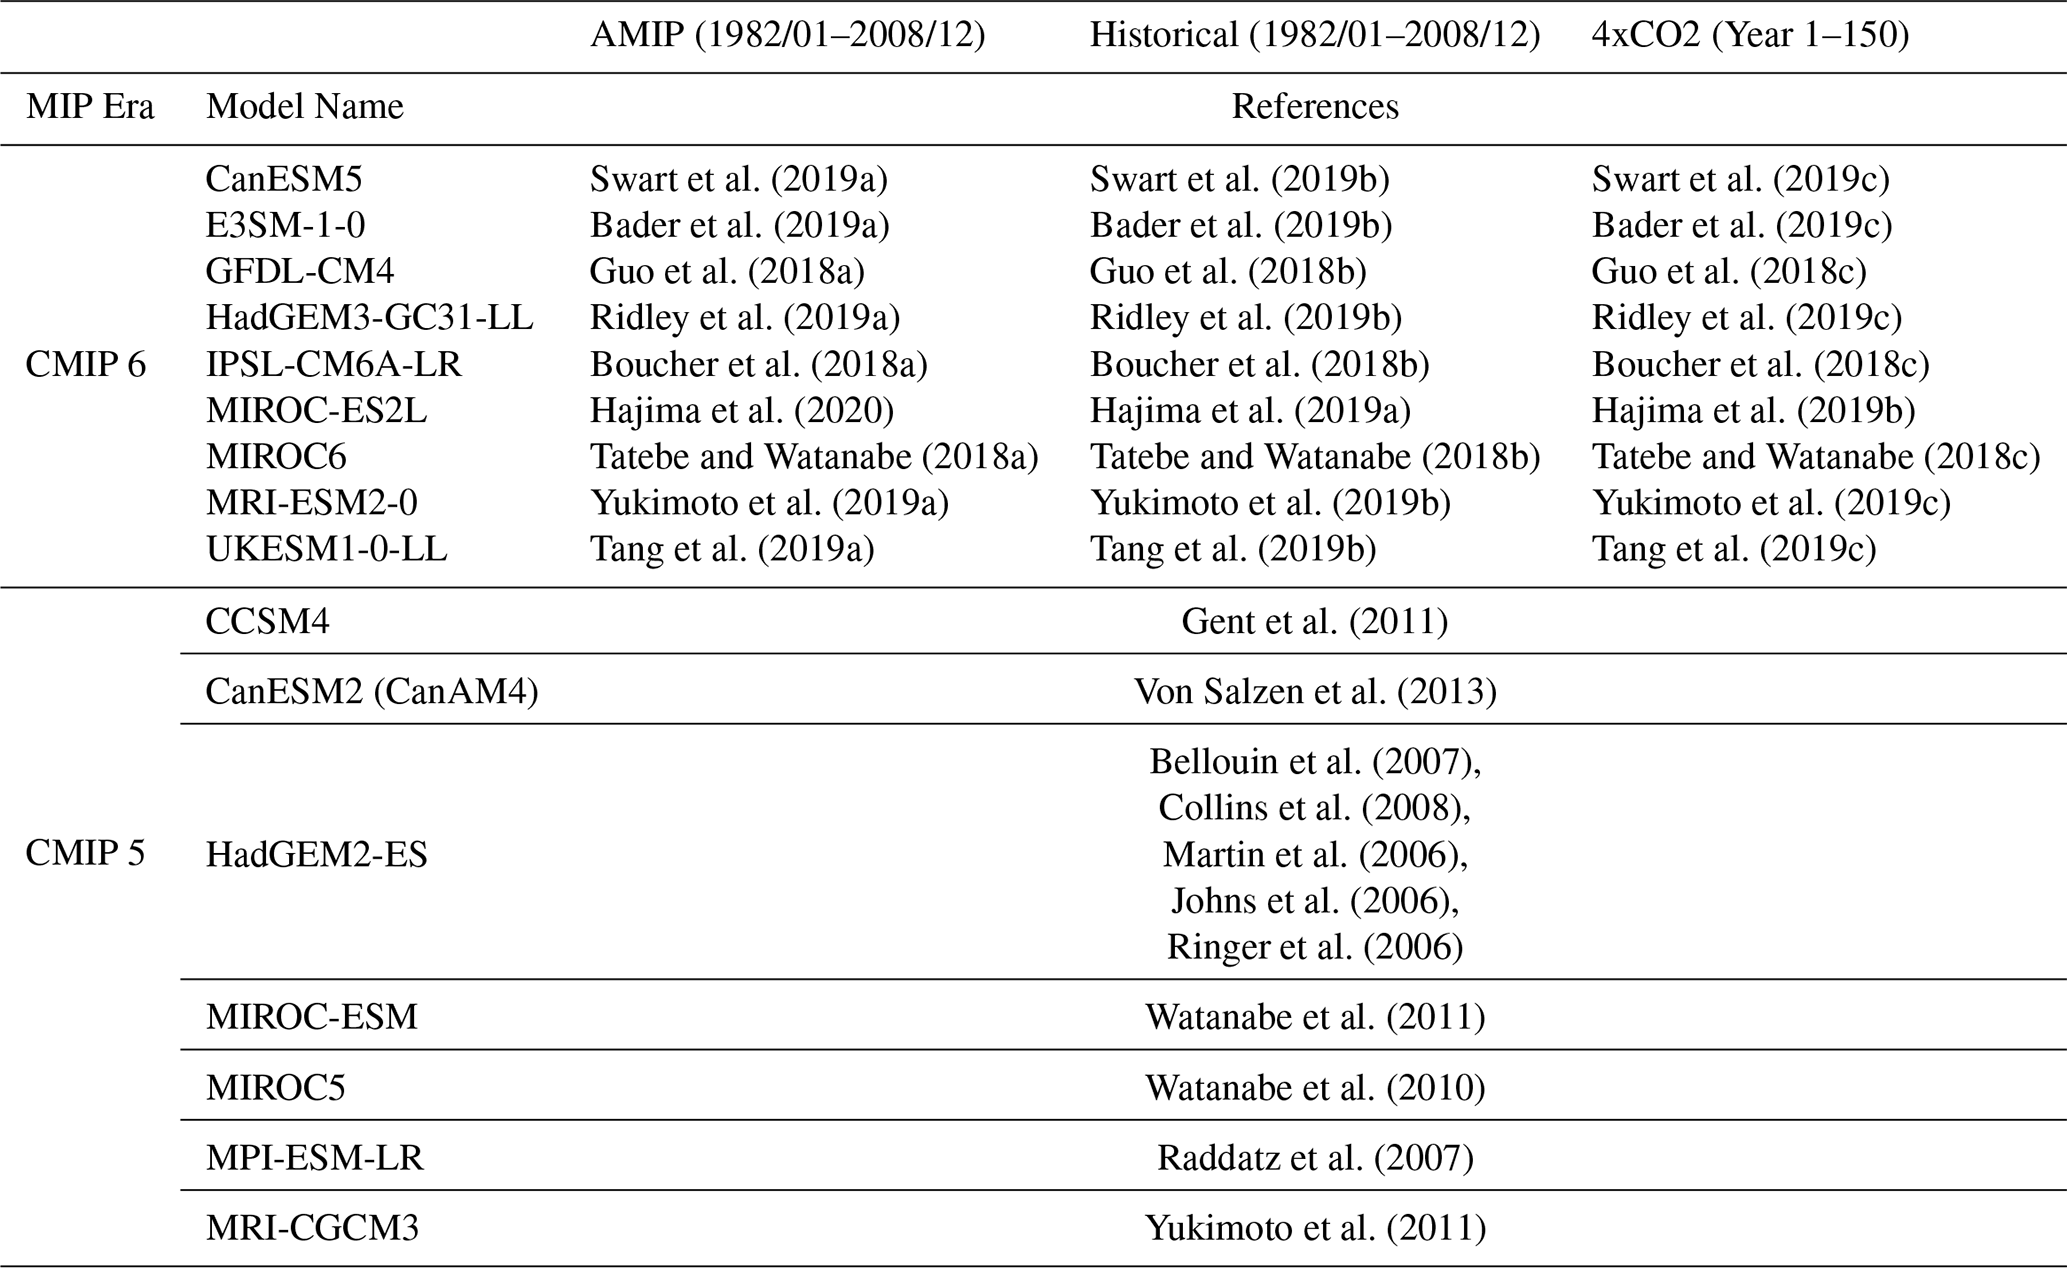
Table F1Values for the ensemble mean (red diamonds in Figs. 1 and A1) of near-global total low-cloud feedback estimates and their 1σ standard deviation (SD) per experiment calculated with various calculation combinations of radiative flux sensitivities to meteorology () and meteorological changes under warming (). Each row represents a combination, where mod stands for model-specific and modelavg stands for ensemble mean. For example, mod × mod represents the product of model-specific kernels and model-specific meteorology, modelavg × mod stands for ensemble mean kernels and model-specific CCFs. In the last row, Mean and SD are the average feedback and standard deviation in each experiment across all 7 feedback calculation methods.
The meteorological cloud radiative kernels are available at https://github.com/tamyers87/meteorological_cloud_radiative_kernels (Myers and Zelinka, 2022), with derivation method detailed in Scott et al. (2020) and Myers et al. (2021). All CMIP5 and CMIP6 model output are accessed from https://esgf-node.llnl.gov, last access: 13 April 2022, with references of each dataset detailed and cited in Table E1. The code used to process and analyze the data is publicly available at https://github.com/rytam2/ccf_project, last access: 4 March 2026 (Tam et al., 2026).
The contact author has declared that none of the authors has any competing interests.
Publisher's note: Copernicus Publications remains neutral with regard to jurisdictional claims made in the text, published maps, institutional affiliations, or any other geographical representation in this paper. The authors bear the ultimate responsibility for providing appropriate place names. Views expressed in the text are those of the authors and do not necessarily reflect the views of the publisher.
RYST, YJL, KM, and CP were supported by Department of Energy (DOE) Award DE-SC0022110 through the Regional and Global Model Analysis (RGMA) program. MDZ's work was performed under the auspices of the United States Department of Energy (DOE) by Lawrence Livermore National Laboratory under contract no. DE-AC52-07NA27344 and was supported by the Regional and Global Model Analysis Program of the Office of Science at the DOE. We thank the three anonymous reviewers for all detailed and valuable comments.
This paper was edited by Michael Byrne and reviewed by three anonymous referees.
Andrews, T. and Ringer, M. A.: Cloud Feedbacks, Rapid Adjustments, and the Forcing–Response Relationship in a Transient CO2 Reversibility Scenario, J. Clim., 27, 1799–1818, https://doi.org/10.1175/JCLI-D-13-00421.1, 2014. a
Andrews, T., Gregory, J. M., Webb, M. J., and Taylor, K. E.: Forcing, feedbacks and climate sensitivity in CMIP5 coupled atmosphere-ocean climate models: Climate Sensitivity in CMIP5 Models, Geophys. Res. Lett., 39, https://doi.org/10.1029/2012GL051607, 2012. a
Andrews, T., Gregory, J. M., and Webb, M. J.: The Dependence of Radiative Forcing and Feedback on Evolving Patterns of Surface Temperature Change in Climate Models, J. Clim., 28, 1630–1648, https://doi.org/10.1175/JCLI-D-14-00545.1, 2015. a, b, c, d, e, f, g
Andrews, T., Gregory, J. M., Paynter, D., Silvers, L. G., Zhou, C., Mauritsen, T., Webb, M. J., Armour, K. C., Forster, P. M., and Titchner, H.: Accounting for Changing Temperature Patterns Increases Historical Estimates of Climate Sensitivity, Geophys. Res. Lett., 45, 8490–8499, https://doi.org/10.1029/2018GL078887, 2018. a
Andrews, T., BodasSalcedo, A., Gregory, J. M., Dong, Y., Armour, K. C., Paynter, D., Lin, P., Modak, A., Mauritsen, T., Cole, J. N. S., Medeiros, B., Benedict, J. J., Douville, H. e., Roehrig, R., Koshiro, T., Kawai, H., Ogura, T., Dufresne, J., Allan, R. P., and Liu, C.: On the Effect of Historical SST Patterns on Radiative Feedback, J. Geophys. Res.-Atmos., 127, https://doi.org/10.1029/2022JD036675, 2022. a, b, c, d
Armour, K. C.: Energy budget constraints on climate sensitivity in light of inconstant climate feedbacks, Nat. Clim. Change, 7, 331–335, https://doi.org/10.1038/nclimate3278, 2017. a
Armour, K. C., Bitz, C. M., and Roe, G. H.: Time-Varying Climate Sensitivity from Regional Feedbacks, J. Clim., 26, 4518–4534, https://doi.org/10.1175/JCLI-D-12-00544.1, 2013. a
Armour, K. C., Proistosescu, C., Dong, Y., Hahn, L. C., Blanchard-Wrigglesworth, E., Pauling, A. G., Jnglin Wills, R. C., Andrews, T., Stuecker, M. F., Po-Chedley, S., Mitevski, I., Forster, P. M., and Gregory, J. M.: Sea-surface temperature pattern effects have slowed global warming and biased warming-based constraints on climate sensitivity, P. Natl. Acad. Sci. USA, 121, e2312093121, https://doi.org/10.1073/pnas.2312093121, 2024. a
Bader, D. C., Leung, R., Taylor, M., and McCoy, R. B.: E3SM-Project E3SM1.0 model output prepared for CMIP6 CMIP amip, Earth System Grid Federation, https://doi.org/10.22033/ESGF/CMIP6.4492, 2019a. a
Bader, D. C., Leung, R., Taylor, M., and McCoy, R. B.: E3SM-Project E3SM1.0 model output prepared for CMIP6 CMIP historical, Earth System Grid Federation, https://doi.org/10.22033/ESGF/CMIP6.4497, 2019b. a
Bader, D. C., Leung, R., Taylor, M., and McCoy, R. B.: E3SM-Project E3SM1.0 model output prepared for CMIP6 CMIP abrupt-4xCO2, Earth System Grid Federation, https://doi.org/10.22033/ESGF/CMIP6.4491, 2019c. a
Bellouin, N., Boucher, O., Haywood, J., Johnson, C., Jones, A., Rae, J., and Woodward, S.: Improved representation of aerosols for HadGEM2, Met Office Hadley Centre, Technical Note No. HCTN 73, Met Office Hadley Centre, Exeter, UK, 43 pp., 2007. a
Bodas-Salcedo, A., Webb, M. J., Bony, S., Chepfer, H., Dufresne, J.-L., Klein, S. A., Zhang, Y., Marchand, R., Haynes, J. M., Pincus, R., and John, V. O.: COSP: Satellite simulation software for model assessment, Bull. Am. Meteorol. Soc., 92, 1023–1043, https://doi.org/10.1175/2011BAMS2856.1, 2011. a
Bony, S. and Dufresne, J.-L.: Marine boundary layer clouds at the heart of tropical cloud feedback uncertainties in climate models, Geophys. Res. Lett., 32, L20806, https://doi.org/10.1029/2005GL023851, 2005. a
Boucher, O., Denvil, S., Levavasseur, G., Cozic, A., Caubel, A., Foujols, M.-A., Meurdesoif, Y., Cadule, P., Devilliers, M., Ghattas, J., Lebas, N., Lurton, T., Mellul, L., Musat, I., Mignot, J., Cheruy, F., Boucher, O., Denvil, S., Levavasseur, G., Cozic, A., Caubel, A., Foujols, M.-A., Meurdesoif, Y., Cadule, P., Devilliers, M., Ghattas, J., Lebas, N., Lurton, T., Mellul, L., Musat, I., Mignot, J., and Cheruy, F.: IPSL IPSL-CM6A-LR model output prepared for CMIP6 CMIP amip, Earth System Grid Federation, https://doi.org/10.22033/ESGF/CMIP6.5113, 2018a. a
Boucher, O., Denvil, S., Levavasseur, G., Cozic, A., Caubel, A., Foujols, M.-A., Meurdesoif, Y., Cadule, P., Devilliers, M., Ghattas, J., Lebas, N., Lurton, T., Mellul, L., Musat, I., Mignot, J., Cheruy, F., Boucher, O., Denvil, S., Levavasseur, G., Cozic, A., Caubel, A., Foujols, M.-A., Meurdesoif, Y., Cadule, P., Devilliers, M., Ghattas, J., Lebas, N., Lurton, T., Mellul, L., Musat, I., Mignot, J., and Cheruy, F.: IPSL IPSL-CM6A-LR model output prepared for CMIP6 CMIP historical, Earth System Grid Federation, https://doi.org/10.22033/ESGF/CMIP6.5195, 2018b. a
Boucher, O., Denvil, S., Levavasseur, G., Cozic, A., Caubel, A., Foujols, M.-A., Meurdesoif, Y., Cadule, P., Devilliers, M., Ghattas, J., Lebas, N., Lurton, T., Mellul, L., Musat, I., Mignot, J., Cheruy, F., Boucher, O., Denvil, S., Levavasseur, G., Cozic, A., Caubel, A., Foujols, M.-A., Meurdesoif, Y., Cadule, P., Devilliers, M., Ghattas, J., Lebas, N., Lurton, T., Mellul, L., Musat, I., Mignot, J., and Cheruy, F.: IPSL IPSL-CM6A-LR model output prepared for CMIP6 CMIP abrupt-4xCO2, Earth System Grid Federation, https://doi.org/10.22033/ESGF/CMIP6.5109, 2018c. a
Bretherton, C. S.: Insights into low-latitude cloud feedbacks from high-resolution models, Philos. T. R. Soc. A, 373, 20140415, https://doi.org/10.1098/rsta.2014.0415, 2015. a
Brient, F. and Schneider, T.: Constraints on climate sensitivity from space-based measurements of low-cloud reflection, J. Clim., 29, 5821–5835, 2016. a
Ceppi, P. and Gregory, J. M.: Relationship of tropospheric stability to climate sensitivity and Earth’s observed radiation budget, P. Natl. Acad. Sci. USA, 114, 13126–13131, https://doi.org/10.1073/pnas.1714308114, 2017. a
Ceppi, P. and Gregory, J. M.: A refined model for the Earth’s global energy balance, Clim. Dynam., 53, 4781–4797, https://doi.org/10.1007/s00382-019-04825-x, 2019. a, b
Cesana, G. V. and Del Genio, A. D.: Observational constraint on cloud feedbacks suggests moderate climate sensitivity, Nat. Clim. Change, 11, 213–218, https://doi.org/10.1038/s41558-020-00970-y, 2021. a, b
Clement, A. C., Seager, R., Cane, M. A., and Zebiak, S. E.: An Ocean Dynamical Thermostat, J. Clim., 9, 2190–2196, https://doi.org/10.1175/1520-0442(1996)009<2190:AODT>2.0.CO;2, 1996. a
Collins, W. J., Bellouin, N., Doutriaux-Boucher, M., Gedney, N., Hinton, T., Jones, C. D., Liddicoat, S., Martin, G., O'Connor, F., Rae, J., Senior, C., Totterdell, I., Woodward, S., Reichler, T., and Kim, J.: Evaluation of the HadGEM2 model, Met Office Hadley Centre, Technical Note No. HCTN 74, Met Office Hadley Centre, Exeter, UK, 2008. a
Cooper, V. T., Armour, K. C., Hakim, G. J., Tierney, J. E., Osman, M. B., Proistosescu, C., Dong, Y., Burls, N. J., Andrews, T., Amrhein, D. E., Zhu, J., Dong, W., Ming, Y., and Chmielowiec, P.: Last Glacial Maximum pattern effects reduce climate sensitivity estimates, Sci. Adv., 10, eadk9461, https://doi.org/10.1126/sciadv.adk9461, 2024. a
Hersbach, H., Bell, B., Berrisford, P., Biavati, G., Horányi, A., Muñoz Sabater, J., Nicolas, J., Peubey, C., Radu, R., Rozum, I., Schepers, D., Simmons, A., Soci, C., Dee, D., and Thépaut, J.-N.: ERA5 Monthly Averaged Data on Single Levels from 1979 to Present, Copernicus Climate Change Service, https://doi.org/10.24381/cds.f17050d764, 2019a. a
Hersbach, H. et al.: ERA5 Monthly Averaged Data on Pressure Levels from 1979 to Present, Copernicus Climate Change Service, https://doi.org/10.24381/cds.6860a573, 2019b. a
Doelling, D.: CERES Monthly Daytime Mean Regionally Averaged Terra and Aqua TOA Fluxes and Associated Cloud Properties Stratified by Optical Depth and Effective Pressure Edition4A, NASA Atmospheric Science Data Center (ASDC), https://doi.org/10.5067/TERRA-AQUA/CERES/FLUXBYCLDTYP-MONTH_L3.004A, 2020. a
Dong, Y., Proistosescu, C., Armour, K. C., and Battisti, D. S.: Attributing Historical and Future Evolution of Radiative Feedbacks to Regional Warming Patterns using a Green’s Function Approach: The Preeminence of the Western Pacific, J. Clim., 32, 5471–5491, https://doi.org/10.1175/JCLI-D-18-0843.1, 2019. a, b, c
Dong, Y., Armour, K. C., Zelinka, M. D., Proistosescu, C., Battisti, D. S., Zhou, C., and Andrews, T.: Intermodel Spread in the Pattern Effect and Its Contribution to Climate Sensitivity in CMIP5 and CMIP6 Models, J. Clim., 33, 7755–7775, https://doi.org/10.1175/JCLI-D-19-1011.1, 2020. a
Dong, Y., Armour, K. C., Proistosescu, C., Andrews, T., Battisti, D. S., Forster, P. M., Paynter, D., Smith, C. J., and Shiogama, H.: Biased Estimates of Equilibrium Climate Sensitivity and Transient Climate Response Derived From Historical CMIP6 Simulations, Geophys. Res. Lett., 48, https://doi.org/10.1029/2021GL095778, 2021. a
Dong, Y., Armour, K. C., Battisti, D. S., and Blanchard-Wrigglesworth, E.: Two-way teleconnections between the Southern Ocean and the tropical Pacific via a dynamic feedback, J. Clim., 35, 6267–6282, 2022. a
Eyring, V., Bony, S., Meehl, G. A., Senior, C. A., Stevens, B., Stouffer, R. J., and Taylor, K. E.: Overview of the Coupled Model Intercomparison Project Phase 6 (CMIP6) experimental design and organization, Geosci. Model Dev., 9, 1937–1958, https://doi.org/10.5194/gmd-9-1937-2016, 2016. a
Gent, P. R., Danabasoglu, G., Donner, L. J., Holland, M. M., Hunke, E. C., Jayne, S. R., Lawrence, D. M., Neale, R. B., Rasch, P. J., Vertenstein, M., Worley, P. H., Yang, Z.-L., and Zhang, M.: The Community Climate System Model Version 4, J. Clim., 24, 4973–4991, https://doi.org/10.1175/2011JCLI4083.1, 2011. a
Guo, H., John, J. G., Blanton, C., McHugh, C., Nikonov, S., Radhakrishnan, A., Rand, K., Zadeh, N. T., Balaji, V., Durachta, J., Dupuis, C., Menzel, R., Robinson, T., Underwood, S., Vahlenkamp, H., Bushuk, M., Dunne, K. A., Dussin, R., Gauthier, P. P., Ginoux, P., Griffies, S. M., Hallberg, R., Harrison, M., Hurlin, W., Lin, P., Malyshev, S., Naik, V., Paulot, F., Paynter, D. J., Ploshay, J., Reichl, B. G., Schwarzkopf, D. M., Seman, C. J., Shao, A., Silvers, L., Wyman, B., Yan, X., Zeng, Y., Adcroft, A., Dunne, J. P., Held, I. M., Krasting, J. P., Horowitz, L. W., Milly, P., Shevliakova, E., Winton, M., Zhao, M., and Zhang, R.: NOAA-GFDL GFDL-CM4 model output amip, Earth System Grid Federation, https://doi.org/10.22033/ESGF/CMIP6.8494, 2018a. a
Guo, H., John, J. G., Blanton, C., McHugh, C., Nikonov, S., Radhakrishnan, A., Rand, K., Zadeh, N. T., Balaji, V., Durachta, J., Dupuis, C., Menzel, R., Robinson, T., Underwood, S., Vahlenkamp, H., Bushuk, M., Dunne, K. A., Dussin, R., Gauthier, P. P., Ginoux, P., Griffies, S. M., Hallberg, R., Harrison, M., Hurlin, W., Lin, P., Malyshev, S., Naik, V., Paulot, F., Paynter, D. J., Ploshay, J., Reichl, B. G., Schwarzkopf, D. M., Seman, C. J., Shao, A., Silvers, L., Wyman, B., Yan, X., Zeng, Y., Adcroft, A., Dunne, J. P., Held, I. M., Krasting, J. P., Horowitz, L. W., Milly, P., Shevliakova, E., Winton, M., Zhao, M., and Zhang, R.: NOAA-GFDL GFDL-CM4 model output historical, Earth System Grid Federation, https://doi.org/10.22033/ESGF/CMIP6.8594, 2018b. a
Guo, H., John, J. G., Blanton, C., McHugh, C., Nikonov, S., Radhakrishnan, A., Rand, K., Zadeh, N. T., Balaji, V., Durachta, J., Dupuis, C., Menzel, R., Robinson, T., Underwood, S., Vahlenkamp, H., Bushuk, M., Dunne, K. A., Dussin, R., Gauthier, P. P., Ginoux, P., Griffies, S. M., Hallberg, R., Harrison, M., Hurlin, W., Lin, P., Malyshev, S., Naik, V., Paulot, F., Paynter, D. J., Ploshay, J., Reichl, B. G., Schwarzkopf, D. M., Seman, C. J., Shao, A., Silvers, L., Wyman, B., Yan, X., Zeng, Y., Adcroft, A., Dunne, J. P., Held, I. M., Krasting, J. P., Horowitz, L. W., Milly, P., Shevliakova, E., Winton, M., Zhao, M., and Zhang, R.: NOAA-GFDL GFDL-CM4 model output abrupt-4xCO2, Earth System Grid Federation, https://doi.org/10.22033/ESGF/CMIP6.8486, 2018c. a
Hajima, T., Abe, M., Arakawa, O., Suzuki, T., Komuro, Y., Ogura, T., Ogochi, K., Watanabe, M., Yamamoto, A., Tatebe, H., Noguchi, M. A., Ohgaito, R., Ito, A., Yamazaki, D., Ito, A., Takata, K., Watanabe, S., Kawamiya, M., and Tachiiri, K.: MIROC MIROC-ES2L model output prepared for CMIP6 CMIP historical, Earth System Grid Federation, https://doi.org/10.22033/ESGF/CMIP6.5602, 2019a. a
Hajima, T., Abe, M., Arakawa, O., Suzuki, T., Komuro, Y., Ogura, T., Ogochi, K., Watanabe, M., Yamamoto, A., Tatebe, H., Noguchi, M. A., Ohgaito, R., Ito, A., Yamazaki, D., Ito, A., Takata, K., Watanabe, S., Kawamiya, M., and Tachiiri, K.: MIROC MIROC-ES2L model output prepared for CMIP6 CMIP abrupt-4xCO2, Earth System Grid Federation, https://doi.org/10.22033/ESGF/CMIP6.5410, 2019b. a
Hajima, T., Abe, M., Arakawa, O., Suzuki, T., Komuro, Y., Ogura, T., Ogochi, K., Watanabe, M., Yamamoto, A., Tatebe, H., Noguchi, M. A., Ohgaito, R., Ito, A., Yamazaki, D., Ito, A., Takata, K., Watanabe, S., Kawamiya, M., and Tachiiri, K.: MIROC MIROC-ES2L model output prepared for CMIP6 CMIP amip, Earth System Grid Federation, https://doi.org/10.22033/ESGF/CMIP6.5421, 2020. a
Hedemann, C., Mauritsen, T., Jungclaus, J., and Marotzke, J.: Reconciling Conflicting Accounts of Local Radiative Feedbacks in Climate Models, J. Clim., 35, 3131–3146, https://doi.org/10.1175/JCLI-D-21-0513.1, 2022. a
Heede, U. K. and Fedorov, A. V.: Eastern equatorial Pacific warming delayed by aerosols and thermostat response to CO2 increase, Nat. Clim. Change, 11, 696–703, https://doi.org/10.1038/s41558-021-01101-x, 2021. a, b
Heidinger, A. K., Foster, M. J., Walther, A., and Zhao, X. T.: The Pathfinder Atmospheres–Extended AVHRR Climate Dataset, Bull. Am. Meteorol. Soc., 95, 909–922, https://doi.org/10.1175/BAMS-D-12-00246.1, 2014. a
Held, I. M., Winton, M., Takahashi, K., Delworth, T., Zeng, F., and Vallis, G. K.: Probing the Fast and Slow Components of Global Warming by Returning Abruptly to Preindustrial Forcing, J. Clim., 23, 2418–2427, https://doi.org/10.1175/2009JCLI3466.1, 2010. a
Huang, B., Liu, C., Banzon, V., Freeman, E., Graham, G., Hankins, B., Smith, T., and Zhang, H.-M.: Improvements of the Daily Optimum Interpolation Sea Surface Temperature (DOISST) Version 2.1, J. Clim., 34, 2923–2939, https://doi.org/10.1175/JCLI-D-20-0166.1, 2021. a
Johns, T. C., Durman, C. F., Banks, H. T., Roberts, M. J., McLaren, A. J., Ridley, J. K., Senior, C. A., Williams, K. D., Jones, A., Rickard, G. J., Cusack, S., Ingram, W. J., Crucifix, M., Sexton, D. M. H., Joshi, M. M., Dong, B.-W., Spencer, H., Hill, R. S. R., Gregory, J. M., Keen, A. B., Pardaens, A. K., Lowe, J. A., Bodas-Salcedo, A., Stark, S., and Searl, Y.: The New Hadley Centre Climate Model (HadGEM1): Evaluation of Coupled Simulations, J. Clim., 19, 1327–1353, https://doi.org/10.1175/JCLI3712.1, 2006. a
Kang, S. M., Yu, Y., Deser, C., Zhang, X., Kang, I.-S., Lee, S.-S., Rodgers, K. B., and Ceppi, P.: Global impacts of recent Southern Ocean cooling, P. Natl. Acad. Sci. USA, 120, e2300881120, https://doi.org/10.1073/pnas.2300881120, 2023. a
Klein, S. A., Hall, A., Norris, J. R., and Pincus, R.: Low-Cloud Feedbacks from Cloud-Controlling Factors: A Review, Surv. Geophys., 38, 1307–1329, https://doi.org/10.1007/s10712-017-9433-3, 2017. a, b
Knutti, R. and Rugenstein, M. A. A.: Feedbacks, climate sensitivity and the limits of linear models, Philos. T. R. Soc. A, 373, 20150146, https://doi.org/10.1098/rsta.2015.0146, 2015. a
Lewis, H., Bellon, G., and Dinh, T.: Upstream Large-Scale Control of Subtropical Low-Cloud Climatology, J. Clim., 36, 3289–3303, https://doi.org/10.1175/JCLI-D-22-0676.1, 2023. a
Li, C., Von Storch, J.-S., and Marotzke, J.: Deep-ocean heat uptake and equilibrium climate response, Clim. Dynam., 40, 1071–1086, https://doi.org/10.1007/s00382-012-1350-z, 2013. a
Lilly, D. K.: Models of cloud‐topped mixed layers under a strong inversion, Q. J. Roy. Meteorol. Soc.y, 94, 292–309, https://doi.org/10.1002/qj.49709440106, 1968. a
Lin, Y.-J., Cesana, G. V., Proistosescu, C., Zelinka, M. D., and Armour, K. C.: The Relative Importance of Forced and Unforced Temperature Patterns in Driving the Time Variation of Low-Cloud Feedback, J. Clim., 38, 513–529, https://doi.org/10.1175/JCLI-D-24-0014.1, 2025. a
Martin, G. M., Ringer, M. A., Pope, V. D., Jones, A., Dearden, C., and Hinton, T. J.: The Physical Properties of the Atmosphere in the New Hadley Centre Global Environmental Model (HadGEM1). Part I: Model Description and Global Climatology, J. Clim., 19, 1274–1301, https://doi.org/10.1175/JCLI3636.1, 2006. a
Mauger, G. S. and Norris, J. R.: Assessing the Impact of Meteorological History on Subtropical Cloud Fraction, J. Clim., 23, 2926–2940, https://doi.org/10.1175/2010JCLI3272.1, 2010. a
Minnis, P., Sun-Mack, S., Young, D. F., Heck, P. W., Garber, D. P., Chen, Y., Spangenberg, D. A., Arduini, R. F., Trepte, Q. Z., Smith, W. L., Ayers, J. K., Gibson, S. C., Miller, W. F., Hong, G., Chakrapani, V., Takano, Y., Liou, K.-N., Xie, Y., and Yang, P.: CERES Edition-2 Cloud Property Retrievals Using TRMM VIRS and Terra and Aqua MODIS Data—Part I: Algorithms, IEEE T. Geosci. Remote Sens., 49, 4374–4400, https://doi.org/10.1109/TGRS.2011.2144601, 2011. a
Modak, A. and Mauritsen, T.: Better-constrained climate sensitivity when accounting for dataset dependency on pattern effect estimates, Atmos. Chem. Phys., 23, 7535–7549, https://doi.org/10.5194/acp-23-7535-2023, 2023. a
Myers, T. A. and Norris, J. R.: On the Relationships between Subtropical Clouds and Meteorology in Observations and CMIP3 and CMIP5 Models, J. Clim., 28, 2945–2967, https://doi.org/10.1175/JCLI-D-14-00475.1, 2015. a
Myers, T. A. and Norris, J. R.: Reducing the uncertainty in subtropical cloud feedback, Geophys. Res. Lett., 43, 2144–2148, https://doi.org/10.1002/2015GL067416, 2016. a
Myers, T. A. and Zelinka, M.: Meteorological Cloud Radiative Kernel code, GitHub [code], https://github.com/tamyers87/meteorological_cloud_radiative_kernels (last access: 4 April 2022), 2022. a
Myers, T. A., Scott, R. C., Zelinka, M. D., Klein, S. A., Norris, J. R., and Caldwell, P. M.: Observational constraints on low cloud feedback reduce uncertainty of climate sensitivity, Nat. Clim. Change, 11, 501–507, https://doi.org/10.1038/s41558-021-01039-0, 2021. a, b, c, d
Myers, T. A., Zelinka, M. D., and Klein, S. A.: Observational Constraints on the Cloud Feedback Pattern Effect, J. Clim., pp. 1–31, https://doi.org/10.1175/JCLI-D-22-0862.1, 2023. a, b, c, d
Olonscheck, D., Rugenstein, M., and Marotzke, J.: Broad Consistency Between Observed and Simulated Trends in Sea Surface Temperature Patterns, Geophys. Res. Lett., 47, e2019GL086773, https://doi.org/10.1029/2019GL086773, 2020. a
Pincus, R., Baker, M. B., and Bretherton, C. S.: What Controls Stratocumulus Radiative Properties? Lagrangian Observations of Cloud Evolution, J. Atmos. Sci., 54, 2215–2236, https://doi.org/10.1175/1520-0469(1997)054<2215:WCSRPL>2.0.CO;2, 1997. a
Platnick, S., Ackerman, S. A., King, M. D., Meyer, K., Menzel, W. P., Holz, R. E., Baum, B. A., and Yang, P.: MODIS atmosphere L2 cloud product (06 L2), NASA MODIS Adaptive Processing System, Goddard Space Flight Center, https://doi.org/10.5067/MODIS/MOD06_L2.006, 2015. a
Proistosescu, C. and Huybers, P. J.: Slow climate mode reconciles historical and model-based estimates of climate sensitivity, Sci. Adv., 3, e1602821, https://doi.org/10.1126/sciadv.1602821, 2017. a
Proistosescu, C., Donohoe, A., Armour, K. C., Roe, G. H., Stuecker, M. F., and Bitz, C. M.: Radiative feedbacks from stochastic variability in surface temperature and radiative imbalance, Geophys. Res. Lett., 45, 5082–5094, 2018. a
Qu, X., Hall, A., Klein, S. A., and DeAngelis, A. M.: Positive tropical marine lowcloud cover feedback inferred from cloudcontrolling factors, Geophys. Res. Lett., 42, 7767–7775, https://doi.org/10.1002/2015GL065627, 2015. a
Raddatz, T. J., Reick, C. H., Knorr, W., Kattge, J., Roeckner, E., Schnur, R., Schnitzler, K.-G., Wetzel, P., and Jungclaus, J.: Will the tropical land biosphere dominate the climate–carbon cycle feedback during the twenty-first century?, Clim. Dynam., 29, 565–574, https://doi.org/10.1007/s00382-007-0247-8, 2007. a
Ridley, J., Menary, M., Kuhlbrodt, T., Andrews, M., and Andrews, T.: MOHC HadGEM3-GC31-LL model output prepared for CMIP6 CMIP amip, Earth System Grid Federation, https://doi.org/10.22033/ESGF/CMIP6.5853, 2019a. a
Ridley, J., Menary, M., Kuhlbrodt, T., Andrews, M., and Andrews, T.: MOHC HadGEM3-GC31-LL model output prepared for CMIP6 CMIP historical, Earth System Grid Federation, https://doi.org/10.22033/ESGF/CMIP6.6109, 2019b. a
Ridley, J., Menary, M., Kuhlbrodt, T., Andrews, M., and Andrews, T.: MOHC HadGEM3-GC31-LL model output prepared for CMIP6 CMIP abrupt-4xCO2, Earth System Grid Federation, https://doi.org/10.22033/ESGF/CMIP6.5839, 2019c. a
Ringer, M. A., Martin, G. M., Greeves, C. Z., Hinton, T. J., James, P. M., Pope, V. D., Scaife, A. A., Stratton, R. A., Inness, P. M., Slingo, J. M., and Yang, G.-Y.: The Physical Properties of the Atmosphere in the New Hadley Centre Global Environmental Model (HadGEM1). Part II: Aspects of Variability and Regional Climate, J. Clim., 19, 1302–1326, https://doi.org/10.1175/JCLI3713.1, 2006. a
Rossow, W., Golea, V., Walker, A., Knapp, K., Young, A., Hankins, B., and Inamdar, A.: International Satellite Cloud Climatology Project (ISCCP) Climate Data Record, H-Series, NOAA National Centers for Environmental Information, https://doi.org/10.7289/V5QZ281S, 2017. a
Rugenstein, M., Bloch-Johnson, J., Abe-Ouchi, A., Andrews, T., Beyerle, U., Cao, L., Chadha, T., Danabasoglu, G., Dufresne, J.-L., Duan, L., Foujols, M.-A., Frölicher, T., Geoffroy, O., Gregory, J., Knutti, R., Li, C., Marzocchi, A., Mauritsen, T., Menary, M., Moyer, E., Nazarenko, L., Paynter, D., Saint-Martin, D., Schmidt, G. A., Yamamoto, A., and Yang, S.: LongRunMIP: Motivation and Design for a Large Collection of Millennial-Length AOGCM Simulations, Bull. Am. Meteorol. Soc., 100, 2551–2570, https://doi.org/10.1175/BAMS-D-19-0068.1, 2019. a
Rugenstein, M., Bloch‐Johnson, J., Gregory, J., Andrews, T., Mauritsen, T., Li, C., Frölicher, T. L., Paynter, D., Danabasoglu, G., Yang, S., Dufresne, J., Cao, L., Schmidt, G. A., Abe‐Ouchi, A., Geoffroy, O., and Knutti, R.: Equilibrium Climate Sensitivity Estimated by Equilibrating Climate Models, Geophys. Res. Lett., 47, e2019GL083898, https://doi.org/10.1029/2019GL083898, 2020. a
Rugenstein, M., Dhame, S., Olonscheck, D., Wills, R. J., Watanabe, M., and Seager, R.: Connecting the SST pattern problem and the hot model problem, Geophys. Res. Lett., 50, e2023GL105488, https://doi.org/10.1029/2023GL105488, 2023a. a
Rugenstein, M., Zelinka, M., Karnauskas, K., Ceppi, P., and Andrews, T.: Patterns of surface warming matter for climate sensitivity, Eos, 104, https://doi.org/10.1029/2023EO230411, 2023b. a
Rugenstein, M. A. A., Gregory, J. M., Schaller, N., Sedláček, J., and Knutti, R.: Multiannual Ocean–Atmosphere Adjustments to Radiative Forcing, J. Clim., 29, 5643–5659, https://doi.org/10.1175/JCLI-D-16-0312.1, 2016. a
Scott, R. C., Myers, T. A., Norris, J. R., Zelinka, M. D., Klein, S. A., Sun, M., and Doelling, D. R.: Observed Sensitivity of Low-Cloud Radiative Effects to Meteorological Perturbations over the Global Oceans, J. Clim., 33, 7717–7734, https://doi.org/10.1175/JCLI-D-19-1028.1, 2020. a, b, c, d, e, f
Seager, R., Cane, M., Henderson, N., Lee, D.-E., Abernathey, R., and Zhang, H.: Strengthening tropical Pacific zonal sea surface temperature gradient consistent with rising greenhouse gases, Nat. Clim. Change, 9, 517–522, https://doi.org/10.1038/s41558-019-0505-x, 2019. a
Senior, C. A. and Mitchell, J. F. B.: The time-dependence of climate sensitivity, Geophys. Res. Lett., 27, 2685–2688, https://doi.org/10.1029/2000GL011373, 2000. a
Sherwood, S. C., Webb, M. J., Annan, J. D., Armour, K. C., Forster, P. M., Hargreaves, J. C., Hegerl, G., Klein, S. A., Marvel, K. D., Rohling, E. J., Watanabe, M., Andrews, T., Braconnot, P., Bretherton, C. S., Foster, G. L., Hausfather, Z., Heydt, A. S., Knutti, R., Mauritsen, T., Norris, J. R., Proistosescu, C., Rugenstein, M., Schmidt, G. A., Tokarska, K. B., and Zelinka, M. D.: An Assessment of Earth's Climate Sensitivity Using Multiple Lines of Evidence, Rev. Geophys., 58, https://doi.org/10.1029/2019RG000678, 2020. a, b, c, d
Stubenrauch, C. J., Rossow, W. B., Kinne, S., Ackerman, S., Cesana, G., Chepfer, H., Di Girolamo, L., Getzewich, B., Guignard, A., Heidinger, A., et al.: Assessment of global cloud datasets from satellites: Project and database initiated by the GEWEX radiation panel, Bull. Am. Meteorol. Soc., 94, 1031–1049, 2013. a
Swart, N. C., Cole, J. N., Kharin, V. V., Lazare, M., Scinocca, J. F., Gillett, N. P., Anstey, J., Arora, V., Christian, J. R., Jiao, Y., Lee, W. G., Majaess, F., Saenko, O. A., Seiler, C., Seinen, C., Shao, A., Solheim, L., von Salzen, K., Yang, D., Winter, B., and Sigmond, M.: CCCma CanESM5 model output prepared for CMIP6 CMIP amip, Earth System Grid Federation, https://doi.org/10.22033/ESGF/CMIP6.3535, 2019a. a
Swart, N. C., Cole, J. N., Kharin, V. V., Lazare, M., Scinocca, J. F., Gillett, N. P., Anstey, J., Arora, V., Christian, J. R., Jiao, Y., Lee, W. G., Majaess, F., Saenko, O. A., Seiler, C., Seinen, C., Shao, A., Solheim, L., von Salzen, K., Yang, D., Winter, B., and Sigmond, M.: CCCma CanESM5 model output prepared for CMIP6 CMIP historical, Earth System Grid Federation, https://doi.org/10.22033/ESGF/CMIP6.3610, 2019b. a
Swart, N. C., Cole, J. N., Kharin, V. V., Lazare, M., Scinocca, J. F., Gillett, N. P., Anstey, J., Arora, V., Christian, J. R., Jiao, Y., Lee, W. G., Majaess, F., Saenko, O. A., Seiler, C., Seinen, C., Shao, A., Solheim, L., von Salzen, K., Yang, D., Winter, B., and Sigmond, M.: CCCma CanESM5 model output prepared for CMIP6 CMIP abrupt-4xCO2, Earth System Grid Federation, https://doi.org/10.22033/ESGF/CMIP6.3532, 2019c. a
Tam, R. Y. S., Myers, T. A., Zelinka, M., Proistosescu, C., Lin, Y. J., and Marvel, K.: ccf_project: Analysis code for Meteorological Drivers of the Low-Cloud Radiative Feedback Pattern Effect and its Uncertainty, Zenodo [code], https://doi.org/10.5281/zenodo.4417809, 2026. a
Tang, Y., Rumbold, S., Ellis, R., Kelley, D., Mulcahy, J., Sellar, A., Walton, J., and Jones, C.: MOHC UKESM1.0-LL model output prepared for CMIP6 CMIP amip, Earth System Grid Federation, https://doi.org/10.22033/ESGF/CMIP6.5857, 2019a. a
Tang, Y., Rumbold, S., Ellis, R., Kelley, D., Mulcahy, J., Sellar, A., Walton, J., and Jones, C.: MOHC UKESM1.0-LL model output prepared for CMIP6 CMIP historical, Earth System Grid Federation, https://doi.org/10.22033/ESGF/CMIP6.6113, 2019b. a
Tang, Y., Rumbold, S., Ellis, R., Kelley, D., Mulcahy, J., Sellar, A., Walton, J., and Jones, C.: MOHC UKESM1.0-LL model output prepared for CMIP6 CMIP abrupt-4xCO2, Earth System Grid Federation, https://doi.org/10.22033/ESGF/CMIP6.5843, 2019c. a
Tatebe, H. and Watanabe, M.: MIROC MIROC6 model output prepared for CMIP6 CMIP amip, Earth System Grid Federation, https://doi.org/10.22033/ESGF/CMIP6.5422, 2018a. a
Tatebe, H. and Watanabe, M.: MIROC MIROC6 model output prepared for CMIP6 CMIP historical, https://doi.org/10.22033/ESGF/CMIP6.5603, 2018b. a
Tatebe, H. and Watanabe, M.: MIROC MIROC6 model output prepared for CMIP6 CMIP abrupt-4xCO2, Earth System Grid Federation, https://doi.org/10.22033/ESGF/CMIP6.5411, 2018c. a
Taylor, K. E., Stouffer, R. J., and Meehl, G. A.: An Overview of CMIP5 and the Experiment Design, Bull. Am. Meteorol. Soc., 93, 485–498, https://doi.org/10.1175/BAMS-D-11-00094.1, 2012. a
Von Salzen, K., Scinocca, J. F., McFarlane, N. A., Li, J., Cole, J. N. S., Plummer, D., Verseghy, D., Reader, M. C., Ma, X., Lazare, M., and Solheim, L.: The Canadian Fourth Generation Atmospheric Global Climate Model (CanAM4), Part I: Representation of Physical Processes, Atmos.-Ocean, 51, 104–125, https://doi.org/10.1080/07055900.2012.755610, 2013. a
Watanabe, M., Suzuki, T., O’ishi, R., Komuro, Y., Watanabe, S., Emori, S., Takemura, T., Chikira, M., Ogura, T., Sekiguchi, M., Takata, K., Yamazaki, D., Yokohata, T., Nozawa, T., Hasumi, H., Tatebe, H., and Kimoto, M.: Improved Climate Simulation by MIROC5: Mean States, Variability, and Climate Sensitivity, J. Clim., 23, 6312–6335, https://doi.org/10.1175/2010JCLI3679.1, 2010. a
Watanabe, M., Dufresne, J.-L., Kosaka, Y., Mauritsen, T., and Tatebe, H.: Enhanced warming constrained by past trends in equatorial Pacific sea surface temperature gradient, Nat. Clim. Change, 11, 33–37, https://doi.org/10.1038/s41558-020-00933-3, 2021. a
Watanabe, M., Kang, S. M., Collins, M., Hwang, Y.-T., McGregor, S., and Stuecker, M. F.: Possible shift in controls of the tropical Pacific surface warming pattern, Nature, 630, 315–324, 2024. a
Watanabe, S., Hajima, T., Sudo, K., Nagashima, T., Takemura, T., Okajima, H., Nozawa, T., Kawase, H., Abe, M., Yokohata, T., Ise, T., Sato, H., Kato, E., Takata, K., Emori, S., and Kawamiya, M.: MIROC-ESM 2010: model description and basic results of CMIP5-20c3m experiments, Geosci. Model Dev., 4, 845–872, https://doi.org/10.5194/gmd-4-845-2011, 2011. a
Wills, R. C. J., Dong, Y., Proistosecu, C., Armour, K. C., and Battisti, D. S.: Systematic Climate Model Biases in the LargeScale Patterns of Recent SeaSurface Temperature and SeaLevel Pressure Change, Geophys. Res. Lett., 49, https://doi.org/10.1029/2022GL100011, 2022. a, b, c, d
Yukimoto, S., Yoshimura, H., Hosaka, M., Sakami, T., Tsujino, H., Hirabara, M., Tanaka, T. Y., Deushi, M., Obata, A., Nakano, H., Adachi, Y., Shindo, E., Yabu, S., Ose, T., and Kitoh, A.: Meteorological Research Institute-Earth System Model Version 1 (MRI-ESM1) -Model Description-, Meteorological Research Institute, https://doi.org/10.11483/mritechrepo.64, 2011. a
Yukimoto, S., Koshiro, T., Kawai, H., Oshima, N., Yoshida, K., Urakawa, S., Tsujino, H., Deushi, M., Tanaka, T., Hosaka, M., Yoshimura, H., Shindo, E., Mizuta, R., Ishii, M., Obata, A., and Adachi, Y.: MRI MRI-ESM2.0 model output prepared for CMIP6 CMIP amip, Earth System Grid Federation, https://doi.org/10.22033/ESGF/CMIP6.6758, 2019a. a
Yukimoto, S., Koshiro, T., Kawai, H., Oshima, N., Yoshida, K., Urakawa, S., Tsujino, H., Deushi, M., Tanaka, T., Hosaka, M., Yoshimura, H., Shindo, E., Mizuta, R., Ishii, M., Obata, A., and Adachi, Y.: MRI MRI-ESM2.0 model output prepared for CMIP6 CMIP historical, Earth System Grid Federation, https://doi.org/10.22033/ESGF/CMIP6.6842, 2019b. a
Yukimoto, S., Koshiro, T., Kawai, H., Oshima, N., Yoshida, K., Urakawa, S., Tsujino, H., Deushi, M., Tanaka, T., Hosaka, M., Yoshimura, H., Shindo, E., Mizuta, R., Ishii, M., Obata, A., and Adachi, Y.: MRI MRI-ESM2.0 model output prepared for CMIP6 CMIP abrupt-4xCO2, Earth System Grid Federation, https://doi.org/10.22033/ESGF/CMIP6.6755, 2019c. a
Zelinka, M. D., Klein, S. A., and Hartmann, D. L.: Computing and Partitioning Cloud Feedbacks Using Cloud Property Histograms, Part II: Attribution to Changes in Cloud Amount, Altitude, and Optical Depth, J. Clim., 25, 3736–3754, https://doi.org/10.1175/JCLI-D-11-00249.1, 2012. a
Zelinka, M. D., Myers, T. A., McCoy, D. T., PoChedley, S., Caldwell, P. M., Ceppi, P., Klein, S. A., and Taylor, K. E.: Causes of Higher Climate Sensitivity in CMIP6 Models, Geophys. Res. Lett., 47, https://doi.org/10.1029/2019GL085782, 2020. a
Zhou, C., Zelinka, M. D., Dessler, A. E., and Yang, P.: An Analysis of the Short-Term Cloud Feedback Using MODIS Data, J. Clim., 26, 4803–4815, https://doi.org/10.1175/JCLI-D-12-00547.1, 2013. a
Zhou, C., Zelinka, M. D., and Klein, S. A.: Impact of decadal cloud variations on the Earth's energy budget, Nat. Geosci., 9, 871–874, https://doi.org/10.1038/ngeo2828, 2016. a, b, c
Zhou, C., Zelinka, M. D., and Klein, S. A.: Analyzing the dependence of global cloud feedback on the spatial pattern of sea surface temperature change with a Green's function approach, J. Adv. Model. Earth Sy., 9, 2174–2189, https://doi.org/10.1002/2017MS001096, 2017. a, b
- Abstract
- Introduction
- Cloud Controlling Factors and the Meteorological Cloud Radiative Kernels Framework
- Global and Regional Cloud Feedback Patterns
- Summary and Conclusion
- Appendix A: Global feedback estimates calculated with meteorological kernels derived from other observations – MODIS, ISCCP, and PATMOS-x
- Appendix B: Spatial maps of changes in subsidence (ω), and surface wind speed components (WS) for AMIP, historical, abrupt-fast and abrupt-slow experiments.
- Appendix C: Spatial maps of cloud feedback changes induced by changes in subsidence (ω), and surface wind speed components (WS) for AMIP, historical, abrupt-fast and abrupt-slow experiments.
- Appendix D: Variances from feedback induced by individual CCFs.
- Appendix E: CMIP Model Datasets Used
- Appendix F: Summary of Near-global Total Low-cloud Feedback Estimates
- Code and data availability
- Competing interests
- Disclaimer
- Acknowledgements
- Review statement
- References