the Creative Commons Attribution 4.0 License.
the Creative Commons Attribution 4.0 License.
 | 26 Mar 2026
Size-resolved condensation sink as an approach to understand pathways how gaseous emissions affect health and climate
Hilkka Timonen
Topi Rönkkö
Miikka Dal Maso
Vapour condensation onto existing aerosol particles is important regarding aerosol health and climate effects. Existing particles can act as carriers for toxic vapours into the human respiratory tract. Also, condensation changes the aerosol optical properties. Condensation sink (CS) is a widely utilised parameter in atmospheric aerosol studies that estimates the attachment rate of vapour molecules onto existing particles. However, typically only the total CS is investigated. Here, we explore the concept of size-resolved condensation sink (CS size distribution). We calibrate an electrical low pressure impactor to measure CS and then utilise the method in urban aerosol measurements conducted in Finland, Germany, Czechia and India, covering road traffic sites, airports, detached housing residential areas, industrial and shipping sites. We report considerably varying shapes and mean sizes of CS size distributions: CS in Finland was more attributable to ultrafine particles (geometric mean diameters being 85–206 nm) than in Central Europe (151–263 nm) and India (278 nm). We introduce a parameter CS attributable to ultrafine particles (CS0.1), which may be especially relevant when considering the formation of cloud condensation nuclei as well as deposition of condensed vapours in the human lung. Furthermore, the results show that the formation and changes of the atmospheric particle size distribution vary in different conditions and environments. Thus, adaptation of CS size distribution could be a simple but effective approach to consider these differences in climate models. Overall, CS size distribution can improve general understanding of the effects of gaseous emissions on health and climate.
- Article
(2064 KB) - Full-text XML
-
Supplement
(2323 KB) - BibTeX
- EndNote


Condensation of vapour molecules onto existing particles is a key aerosol aging process in terms of health and climate effects of ambient aerosols. Existing aerosol particles can contribute to health impact mechanisms as carriers of condensed and potentially toxic compounds into the human respiratory tract (e.g. Ali et al., 2020). For example, a toxicological study by Hakkarainen et al. (2022) indicates that organic coating on soot particles increases the aerosol toxicity. In the atmosphere, condensation of initially gaseous compounds into the particulate phase is an important process in the growth of secondary aerosol particles which contribute a significant fraction of ambient PM2.5 mass around the world (e.g., Chen et al., 2022; Mishra et al., 2023). In general, elevated concentrations of ambient PM2.5 have been linked with adverse health impacts which means that also the condensation processes in PM2.5 formation are relevant from health impact point of view. Furthermore, secondary organic aerosol from anthropogenic sources has been suggested to be one of the most important contributors on aerosol oxidative potential in most parts of Europe (Daellenbach et al., 2020).
Climate-wise, condensation of atmospheric vapours directly affects aerosol optical properties and, thus, on how the particles interact with light. For example, light absorption of soot particles can be increased due to soot particle coating with organic and inorganic compounds, causing a so-called lensing effect (Riemer et al., 2019). On the other hand, particles larger than 50–100 nm can act as cloud condensation nuclei (CCN) (Kerminen et al., 2012) contributing to cloud formation and, thus, to the net cooling effects of clouds (e.g. Fuzzi et al., 2015). Typically, recently formed particles, e.g., in exhaust (Rönkkö et al., 2017) or during new particle formation (NPF) events (Kontkanen et al., 2017), are mostly in the sizes below 10 nm, hence, condensation processes are needed to increase the particles size so that they can act as CCN.
In addition to direct health and climate effects, vapour condensation on existing particles is important to understand also in terms of new particle formation processes (Pirjola et al., 1999; Zhang et al., 2004). The condensation rate of vapour molecules onto particles depends on the existing particle concentration which is commonly estimated with a parameter called condensation sink (CS) (Pirjola et al., 1999). It has been suggested that a high CS of existing particles indicates that vapour molecules in the air mainly condensate onto the existing particles. A low CS, on the other hand, may result in NPF-events as there is not high enough concentration of existing aerosol particles for all vapour molecules to condensate, causing more likely nucleation. Many studies have reported that stronger NPF events tend to occur during low CS periods (e.g., Boy and Kulmala, 2002; Hamed et al., 2007; Zaidan et al., 2018). Therefore, CS can be a highly useful parameter in estimating and modelling the effects aerosol aging on the air quality and climate. On the other hand, NPF-events are still commonly observed also when CS is high, e.g., in high polluted environments and during pollution events, showing the need for deeper understanding on the connection between CS and NPF-events (e.g., Kulmala et al., 2017; Casquero-Vera et al., 2023).
In atmospheric aerosol studies, typically only the total CS of particles is utilised as a parameter. However, both the health and climate effects of aerosol particles are strongly dependent on the particle size, indicating that also the effects related to condensation are strongly affected by the size of the particles the vapour molecules are condensed onto. A common approach to measure total CS is a number size distribution measurement e.g., with scanning or differential mobility particle sizers (SMPS/DMPS) (e.g., Hamed et al., 2007; Dal Maso et al., 2008; Zaidan et al., 2018). However, with this method, the detailed shape information (and, thus, surface area) cannot be accurately considered, causing potentially uncertainty in the CS measurement. Another way to measure total CS is the utilisation of a diffusion charging based instrument (Kuuluvainen et al., 2010) where the number of elementary charges particles carry after diffusion charging is related to particle surface area, similarly as CS. Thus, electric current caused by the measured diffusion charged particles should in principle correlate well with CS. Diffusion charger -based measurement for CS, however, has been previously utilised only in terms of total CS measurement.
Here we explore the condensation sink (CS) size distribution concept and investigate the benefits of size-resolved CS measurement for aerosol studies. We aim to expand the diffusion charger-based measurement to be suitable for CS size distribution by reporting the conversion factors that can be used to convert the raw data measured with the electrical low pressure impactor (ELPI+) instrument to CS. After that, this CS calibration of ELPI+ is utilised with ambient aerosol measurement data collected in various urban environments in Finland, Germany, Czechia and India, including road traffic sites, detached-housing areas, airports, industrial and shipping sites. Furthermore, we compare CS size distribution characteristics with particle number and mass concentration as well as estimate geometric mean diameters of the CS size distributions (GMDCS) and estimate the fraction of CS attributable to ultrafine particles (CS0.1). Moreover, we investigate the differences of CS size distribution measurement between a mobility particle sizer (DMPS) and the ELPI+, and evaluate the methodological and general challenges of CS size distribution measurement.
2.1 Electrical low pressure impactor
The ELPI+ (Keskinen et al., 1992) measures particle size distributions by utilising diffusion charging and a cascade impactor. First, the sampled particles are charged in a diffusion charger. According to Järvinen et al. (2014), the ELPI+ charging efficiency (Pn) as a function of the mobility equivalent diameter (dp) is
where P is the particle penetration through the charger and n is the number of elementary charges carried by particles after charging. The detected electric current on the impactor stages is a multiplication of Pn, elementary charge (e) and sample flow (Q). The nominal sample flow of the ELPI+ is 10 L min−1. After charging, particles are classified according to their aerodynamic size in a 14-staged cascade impactor, enabling size distribution measurement of the diffusion charged current caused by the collected particles with 1 s time-resolution in the size range of 6 nm–10 µm. As the electric current caused by the particles is known as a function of particle size, the electric current data can be converted into particle metrics like number size distribution. As the electric current caused by the particles depends on the mobility equivalent size of particles, and the size classification depends on the aerodynamic size, the particle effective density (ρeff) needs to be determined for an accurate measurement. In this study, all the reported parameters, i.e., CS, PM2.5 and particle number (PN) concentrations are based on the ELPI+ data of the same unit.
The classic ELPI has been calibrated to measure total CS before by Kuuluvainen et al. (2010). Diffusion charging (where ions collide with sampled particles) is related to natural condensation (where vapour molecules collide with existing particles). Thus, conversion of diffusion charged current into CS is a suitable method for CS measurement. Kuuluvainen et al. (2010), however, only calibrated the conversion from total electric current measured from all the impactor stage into total CS, not enabling measurement of size-resolved CS. This conversion is referred here as a single-factor calibration. Also, the renewed ELPI+ has not been utilised in CS measurement earlier according to our knowledge.
2.2 Condensation sink calibration for the electrical low pressure impactor
CS (unit s−1) is calculated as a multiplication of the particle number concentration and the attachment rate factor of vapour molecules onto the particles. The attachment rate factor (ACS) can be calculated with an equation
where dp is the particle diameter, D is diffusion constant for the considered vapour molecule in air and β the Fuchs-Sutugin correction factor (Fuchs and Sutugin, 1971). In this study, dp is referred as the particle mobility equivalent diameter. According to Poling et al. (2000), D is
where Dx is the diffusion volume, P ambient pressure, T ambient temperature and M molecular weight (Poling et al., 2000). For air, molecular weight and diffusion volume were set as 28.965 g mol−1 (Mair) and 19.7 cm3 (Dx,air), respectively. For sulfuric acid, for which the CS in this study was calculated, the same values were 98.08 g mol−1 (Mvap) and 51.66 cm3 (Dx,vap) (Poling et al., 2000). In this study, normal temperature and pressure (NTP) values for temperature (T=20 °C) and pressure (P=1 atm) were used. The Fuchs-Sutugin correction is calculated with a formula
where α is the mass accommodation coefficient and Kn is the Knudsen number, i.e., the relationship between the particle diameter and the mean free path of the condensing vapour molecules (λvap):
The mean free path of the vapour molecules (sulphuric acid) depends on the mass of a single vapour molecule (mvap), and T:
where kb is the Boltzmann constant. The mass accommodation coefficient in Eq. (4) was assumed to be 1.0. Previous studies have not found consensus value on the mass accommodation coefficient (e.g., Pöschl et al., 1998; Hanson, 2005), but it has been suggested to be dependent e.g., on the temperature and composition of existing particles (Roy et al., 2020).
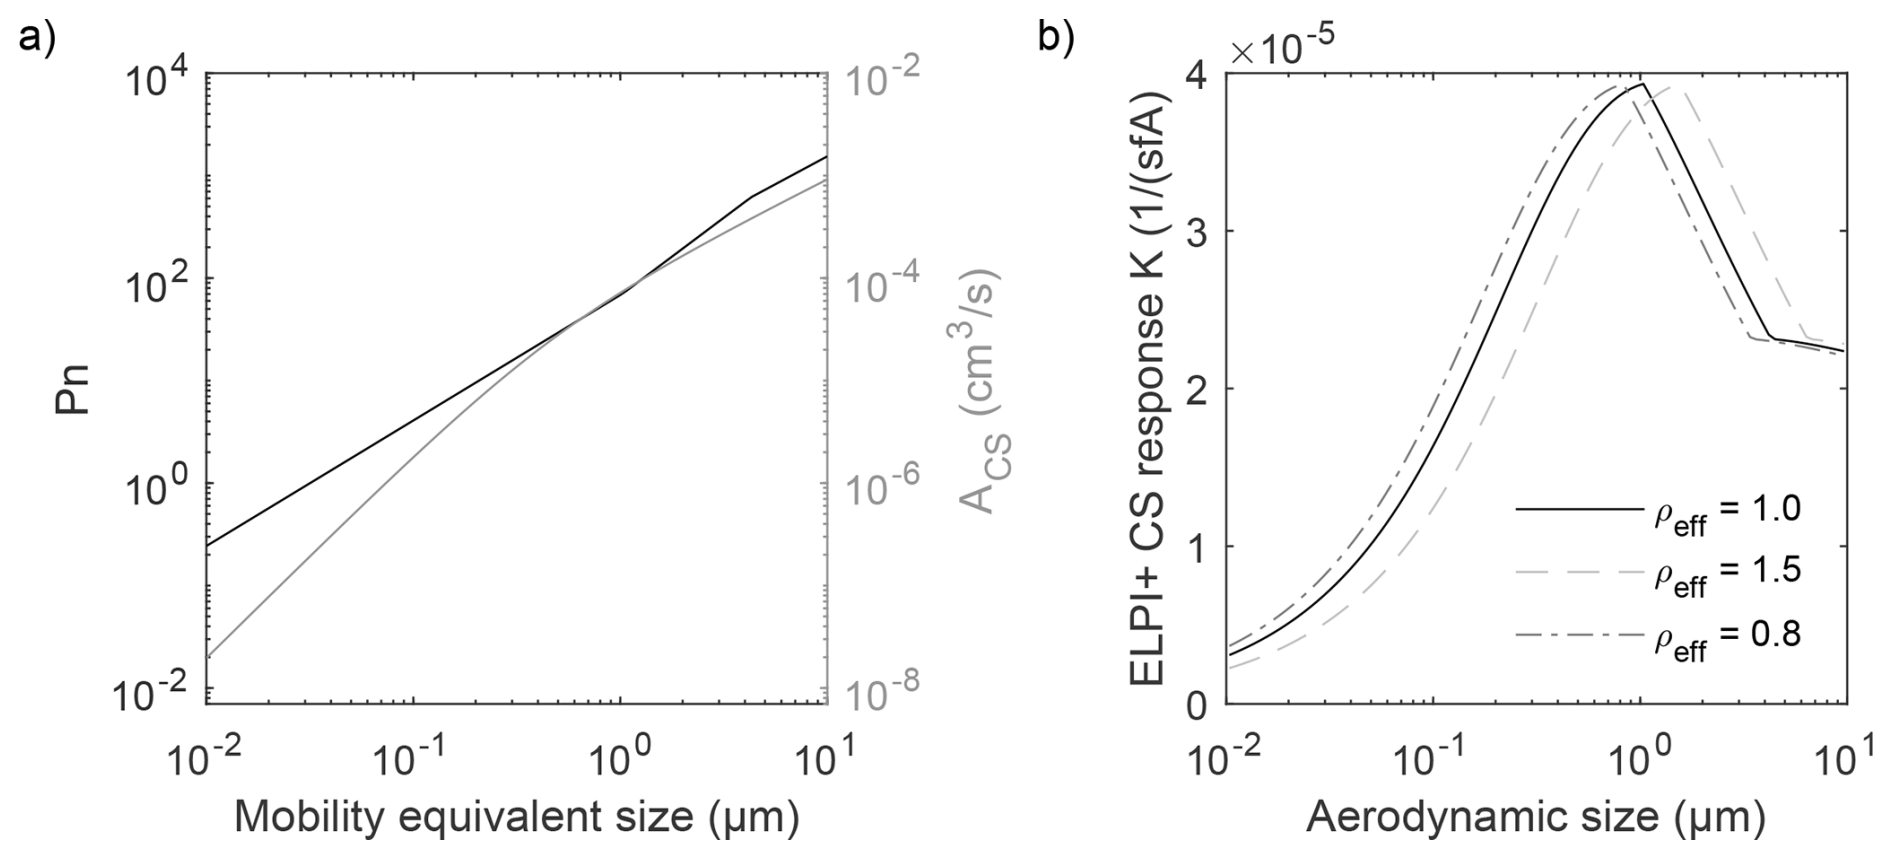
Figure 1(a) ELPI+ charger efficiency (Pn) and attachment rate factor (ACS) as a function of particle mobility equivalent diameter. (b) ELPI+ CS response coefficient K as a function of particle aerodynamic diameter with different particle effective densities.
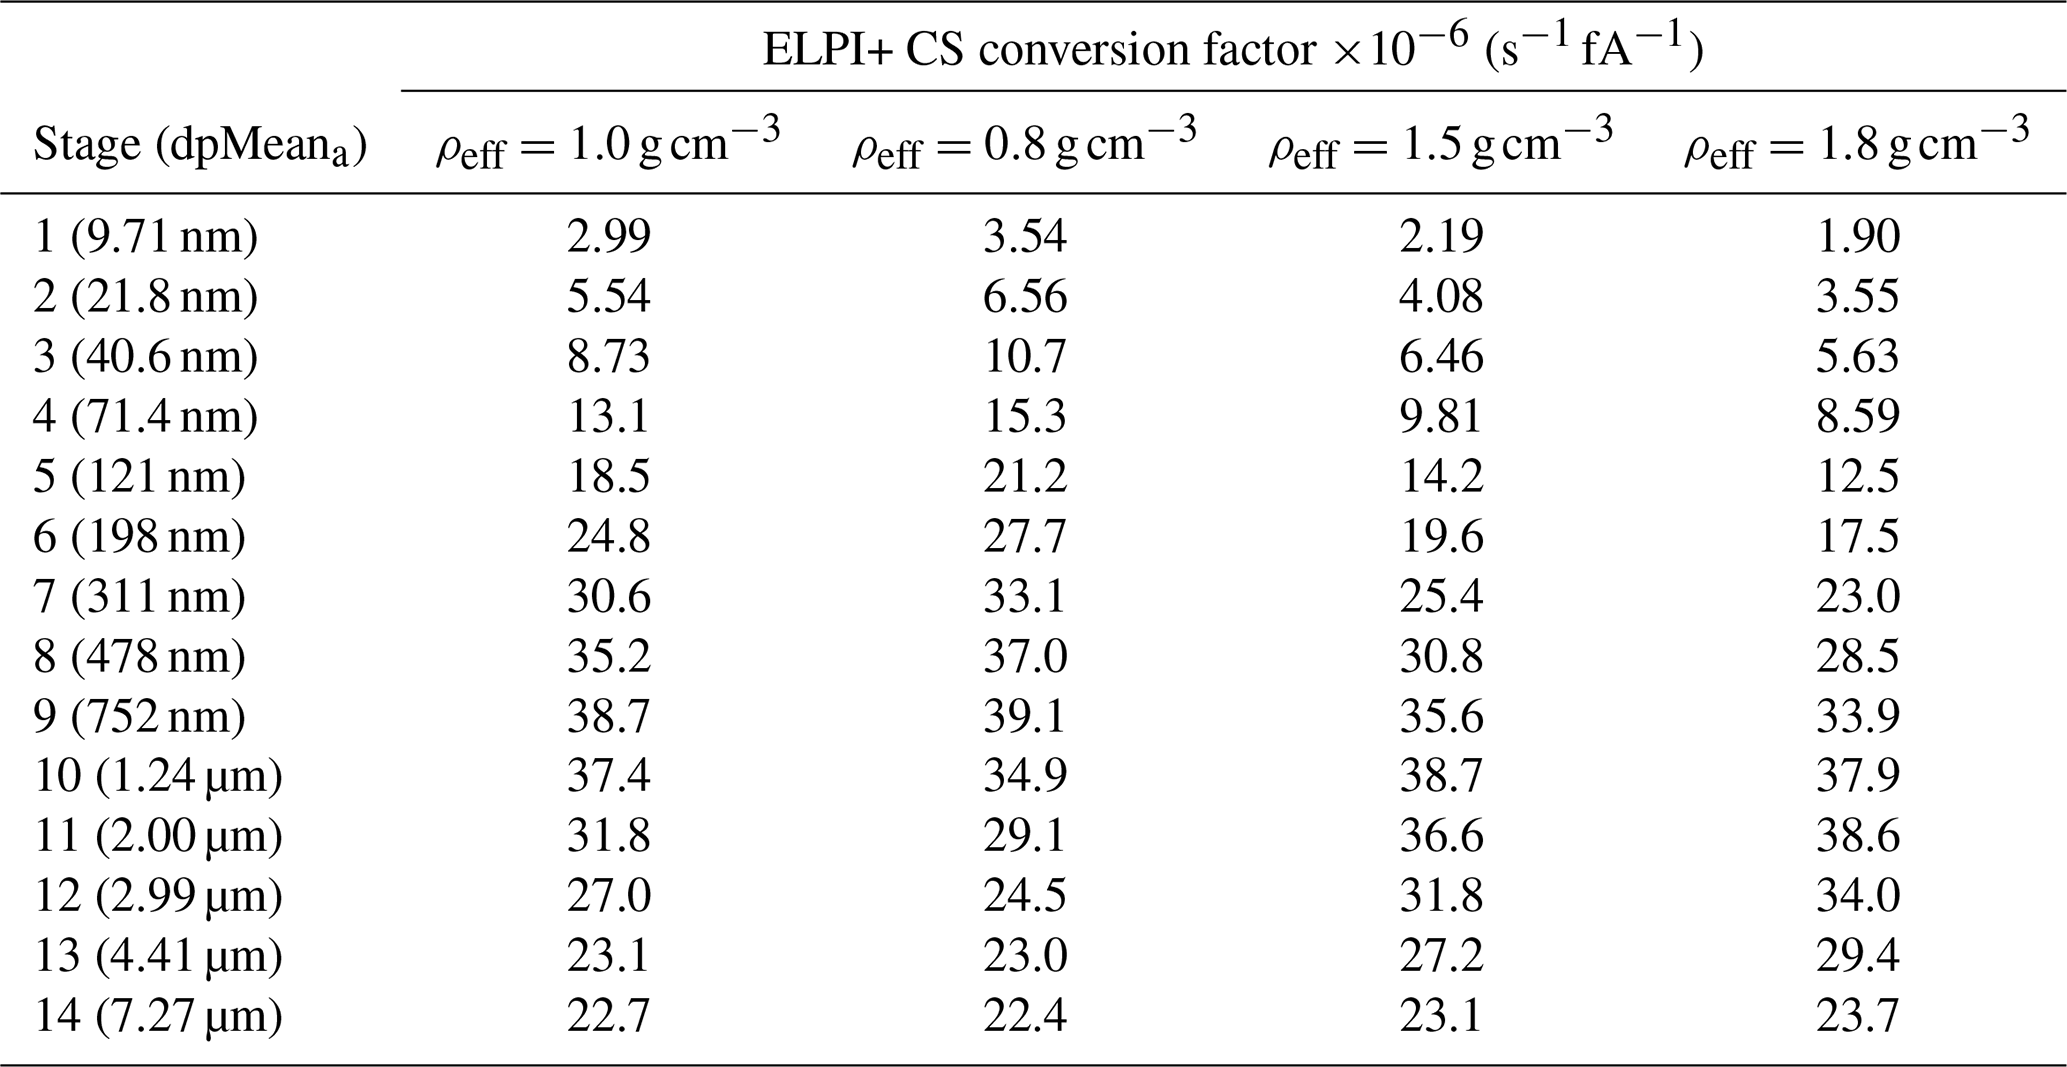
Table 1ELPI+ CS conversion factors from electric current to CS for different stages with four different particle effective densities for the unit used in this study. The dpMeana indicates the nominal mean particle size of collected particles on each impactor stage, represented as the aerodynamic diameter.
Now, to calibrate the ELPI+ to measure size-resolved CS, the charging efficiency of the diffusion charger needs to be considered (Eq. 1). The size dependent CS response function (K) for ELPI+ is
which is shown in Fig. 1 as a function of particle aerodynamic size (Fig. 1b), together with the ELPI+ charging efficiency and attachment rate factor (Fig. 1a). For the CS size distribution measurement, the conversion factor from the electric current into CS can be determined for each impactor stage of the ELPI+ based on the response function and the average (aerodynamic) size of collected particles onto each stage (dpMeana). These conversion factors corresponding to the unit calibrated by Järvinen et al. (2014) are collected in Table 1. This calibration method is referred here as the stage-specific calibration. In addition, the single factor calibration for the ELPI+ was done as it gives valuable information of the performance of diffusion charger -based measurement of CS in cases where particle size is not known (like electrical particle sensors). The single-factor conversion from total measurement electric current to total CS was based on the value of K at 150 nm, being ().
In Eq. (7), K is given as a function of particle mobility equivalent size and it should be noted that the response function depends on the chosen ρeff as described in Sect. 2.1. As the effective density cannot accurately be determined only with ELPI+ measurement, assumptions or additional instruments are needed, which can be considered as a downside of the method. The effect of ρeff on the K is shown in Fig. 1b. On the other hand, as mentioned in Sect. 2.1, the diffusion charger -based measurement likely represents CS better than particle number size distribution measurement e.g., with DMPS or SMPS, where particles typically need to be assumed to be spherical.
In addition, it needs to be noted that the attachment rate factor and, thus, the CS response function, depends on ambient conditions, like temperature and pressure (Eqs. 3 and 6). In general, it is important to note that the obtained CS considerably depends on the chosen vapour in the calculation and the assumed α (Tuovinen et al., 2021). K with different values for ρeff, α, Mvap, Dx,vap, T and P, and the relative change compared to the default values (sulphuric acid in NTP-conditions with α of 1.0 and ρeff of 1.0 g cm−3) are shown in Fig. S1 in the Supplement. Parameter descriptions and utilised values in the ELPI+ CS calibration are collected and summarised in Table S1 in the Supplement.
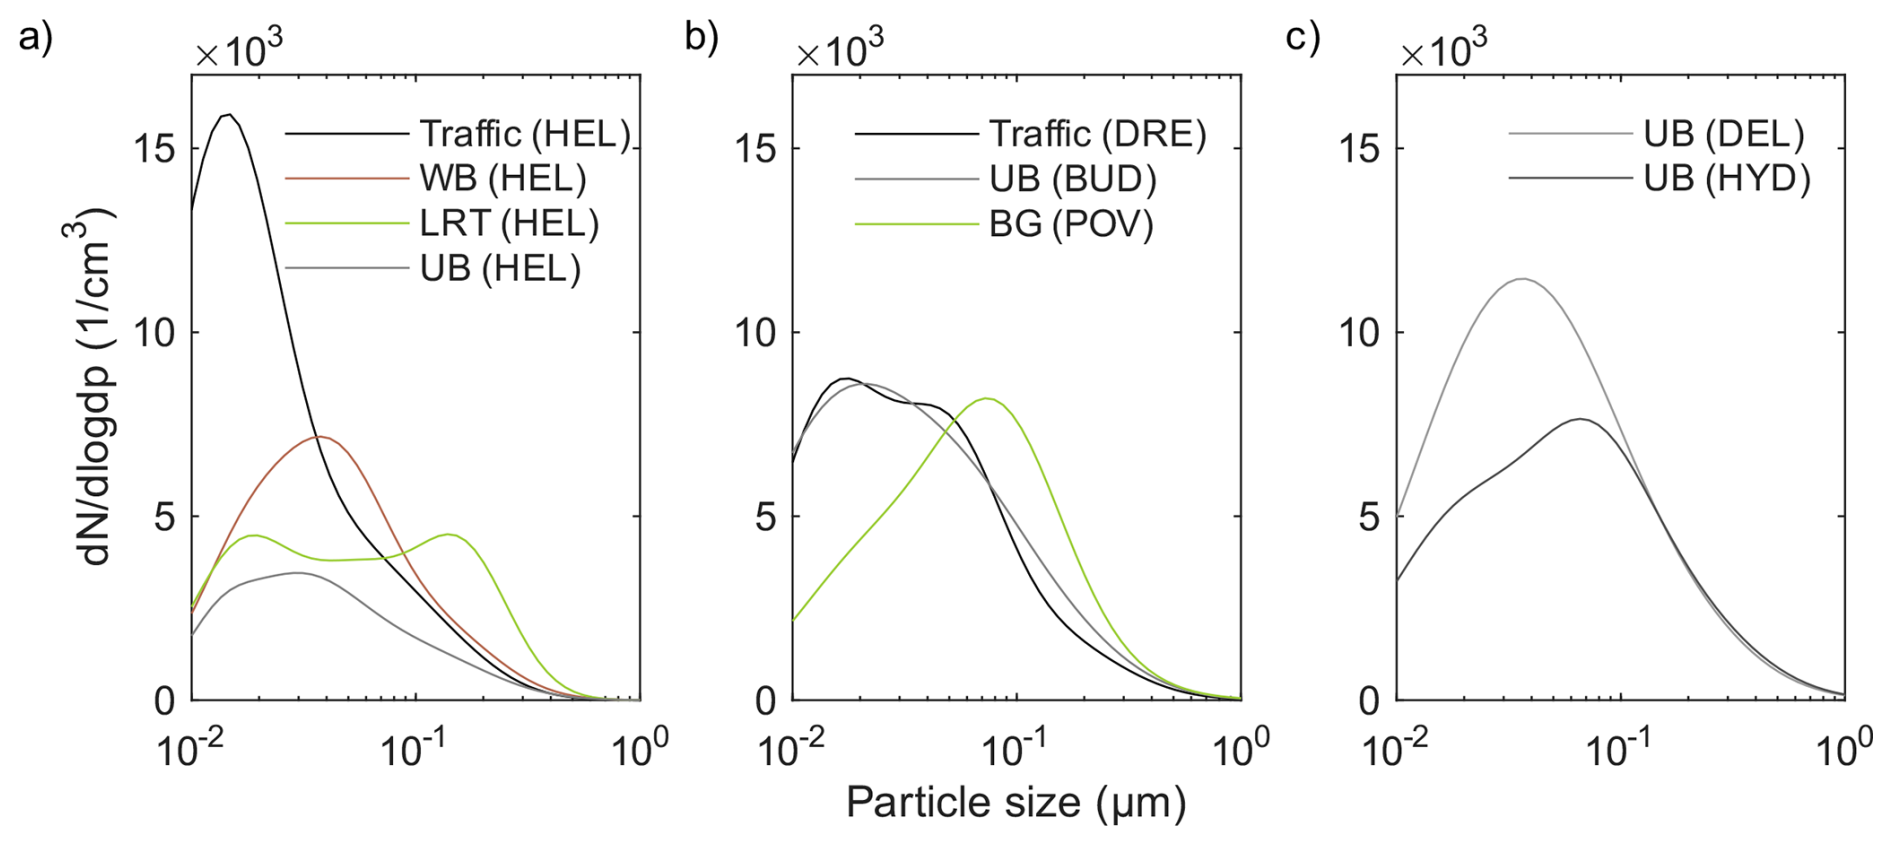
Figure 2Simulated particle number size distributions based on reported particle number size distributions measured in (a) Finland, (b) Central/Southern Europe and (c) India. UB (HEL), WB (HEL) and LRT (HEL) indicate data corresponding to g urban background, residential wood burning and a long-range transported episode in measurements by Teinilä et al. (2022) in Helsinki, respectively. Traffic data from Helsinki, urban background data from Budapest (BUD), traffic data from Dresden (DRE) and rural background (BG) data from Po Valley (POV) are based on study by Trechera et al. (2023). Urban background data from Delhi (DEL) and Hyderabad (HYD) are based on study by Sebastian et al. (2022).
2.3 Validation of the calibration
First, to understand the theoretical performance of the ELPI+ CS measurement, nine different particle number size distributions (Fig. 2) were simulated according to the ELPI+ collection efficiency functions (Järvinen et al., 2014). Then, the simulated ELPI+ CS results were compared to the theoretical one of each simulated distribution, calculated based on Eq. (2). The simulated distributions were based on results reported by Sebastian et al. (2022), Teinilä et al. (2022) and Trechera et al. (2023), covering various environments and conditions in Europe and India with varying regional pollution levels. The distributions were re-created by utilising log-normal size distributions to roughly match the reported particle number size distributions. Also, ρeff was set to 1.0 g cm−3. With the simulations, the uncertainty of the stage-specific calibration in the CS conversion due to the reduced size resolution of the 14-staged impactor measurement can be tested. In addition, the accuracy of the single-factor CS calibration compared to the stage-specific one was tested with the simulated size distributions.
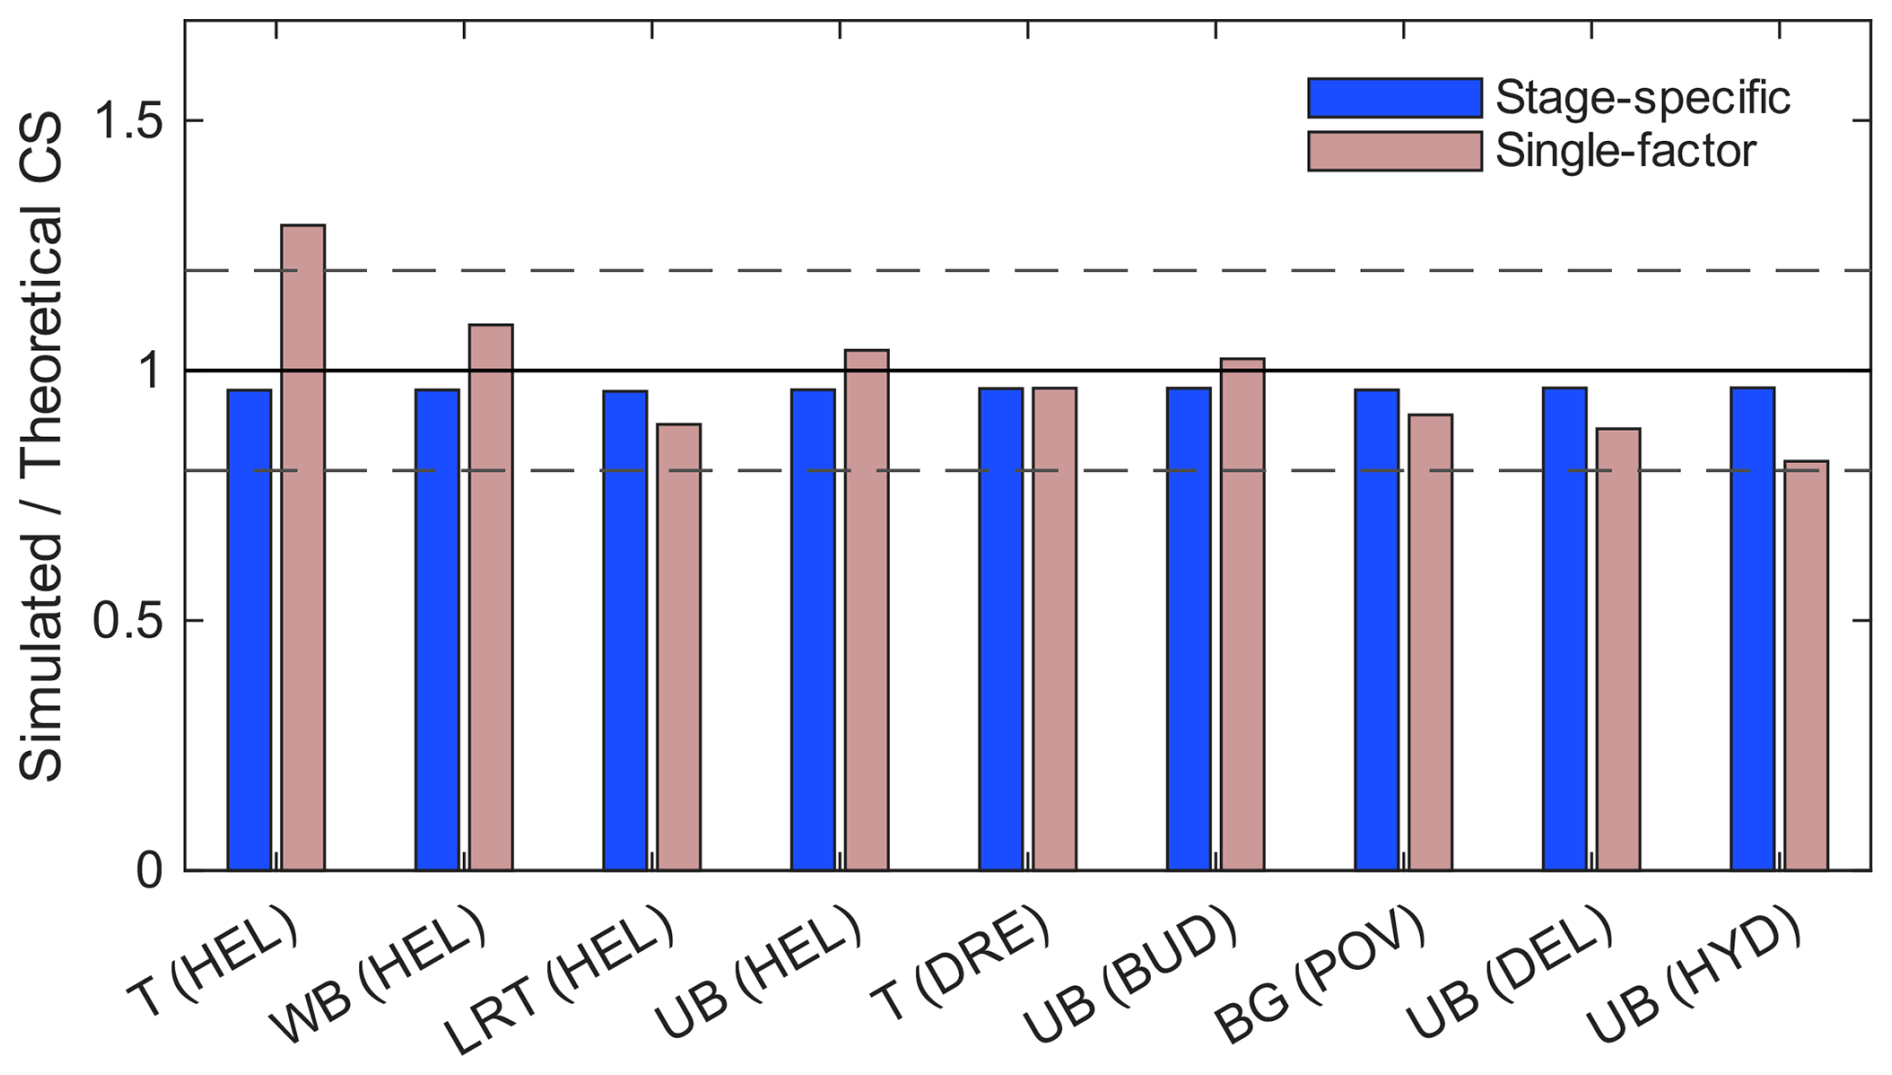
Figure 3Simulated total CS of the size distributions in Fig. 2 with both stage-specific and single-factor calibrations compared to the theoretical value. T indicates traffic site, whereas other abbreviations are the same as in Fig. 2. The shaded lines represent error limits of ±20 %.
Second, to evaluate the effect of particle ρeff on the CS measurement, CS measurement of an ELPI+ and a DMPS were compared based on data measured in a street canyon in Helsinki in winter 2022 (Lepistö et al., 2024; Teinilä et al., 2025). The CS from the DMPS data was calculated with the same approach as for the ELPI+ (Eq. 2). The data were divided into three categories based on conditions: (1) low regional background concentration, (2) temperature inversion, (3) long range transported (LRT) episode. Average PN, PM2.5, NO and black carbon concentrations of these periods are collected in the Supplement (Table S2). Most importantly, the average ρeff was different during the periods, and the ELPI+ CS measurement was compared to DMPS by assuming unit density but also by correcting the measurement by using the estimated average ρeff of the periods based on Eq. (8). The average ρeff was estimated by comparing the peak sizes of particle surface area size distributions of the DMPS and ELPI+ (see Lepistö et al., 2024). In the analysis, all the particles were assumed to have the same ρeff even though, in reality, ρeff has size-dependent and temporal variation. However, the cascade impactor measurement of the ELPI+ fundamentally challenges the use of size-dependent values for ρeff. In addition, the measured ELPI+ data in different countries and locations (Sects. 2.4 and 3.2) were converted into CS by using varying ρeff values from 0.8 to 1.5 g cm−3 to see how ρeff changes the measured total CS and the size distribution. According to many studies, ρeff of ultrafine particles is typically near 1.0 g cm−3 whereas for larger accumulation mode particles ρeff can be around 1.5–1.8 g cm−3 (e.g., Levy et al., 2013; Yin et al., 2015; Lu et al., 2024). The relationship between the particle mobility equivalent diameter (dm) and the aerodynamic diameter (da) can be calculated from
where Cc is the Cunningham slip correction factor. Also, the size distribution results of the DMPS were converted from mobility equivalent diameter to aerodynamic (Fig. 4) by utilising Eq. (8).
Furthermore, as mentioned in Sect. 2.2, the obtained CS is strongly dependent on the parameters related to the condensing vapour molecule (Mvap, Dx,vap), accommodation (α) and ambient conditions (T, P). To better understand the effect of chosen parameters on CS measurement, data from three studied locations (Sect. 2.3, Tampere: Highway, Düsseldorf: Airport, Delhi-NCR: Urban) were utilised in uncertainty analysis where values for ρeff, α, M, Dx, T and P were altered. In this analysis, the effect of the varying parameters was estimated for total CS, CS attributable to ultrafine particles (CS0.1), geometric mean diameter of CS size distribution (GMDCS) and the fraction (i.e. CS0.1 fraction in total CS (CS2.5, particles <2.5 µm)), all of which were also measured at the measurement campaigns included in this study (Sects. 2.4 and 3.2). These locations were chosen for the comparison as they represented clearly different aerosol characteristics in terms of ultrafine and accumulation mode particles (see Sect. 3.2).
Table 2Measurement campaigns included in this study. See campaign descriptions in Table S3.
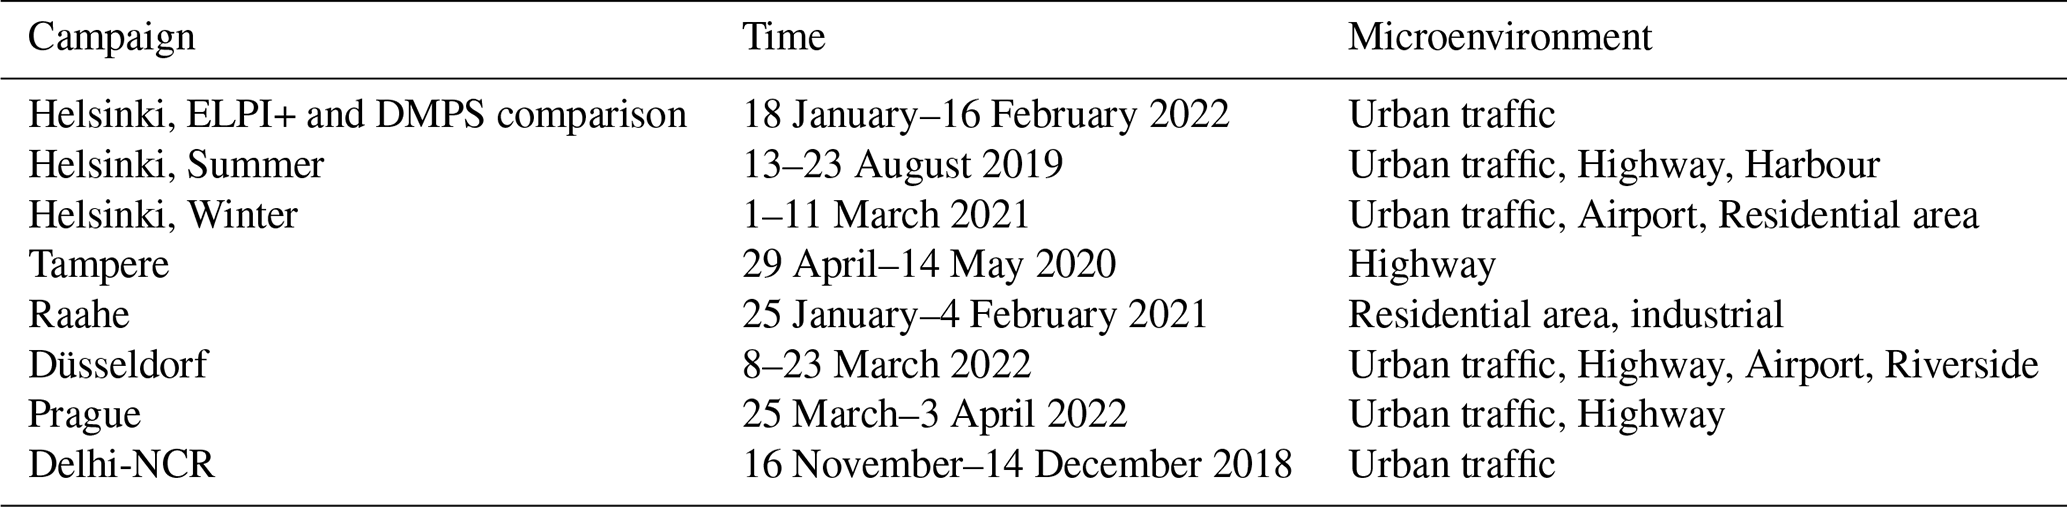
2.4 Measurement campaigns
Our study utilises data from eight measurement campaigns conducted in Helsinki (Finland), Tampere (Finland), Raahe (Finland), Düsseldorf (Germany), Prague (Czechia) and Delhi-NCR (India) in 2018–2022. These campaigns are listed in Table 2, and brief descriptions of the campaigns are provided in Table S3. Data from seven of the campaigns have been utilised in a study where particle lung deposited surface area (LDSAal) concentrations and size distributions were compared by Lepistö et al. (2023), and the same dataset is utilised also in this study. In addition, data from the measurement campaign conducted in Helsinki during winter 2022 (Lepistö et al., 2024; Teinilä et al., 2025) were utilised in the comparison of DMPS and ELPI+ CS measurement.
Briefly, the comparison of CS measurement between the DMPS and ELPI+ was done in a street canyon located in the city centre of Helsinki (60.1963° N, 24.9523° E) on 18 January–16 February 2022. During the measurements, contribution of regional aerosol was mainly low, but on 31 January–5 February an inversion episode, and on 13–16 February a long-range transported (LRT) pollution episode affected the measured aerosol, e.g., in terms of effective density and average particle size, enabling comparison of the methods with different aerosol characteristics. All the other campaigns were conducted next to a certain urban aerosol source (road traffic, shipping, airport, detached housing residential area or industrial area). The focus of the campaigns was to study the characteristic aerosol emissions of the studied sources. Hence, the measurements were targeted to be conducted when the measurement sites were clearly affected by the targeted emission source. For example, near the airports, only downwind periods are considered in the results (see Table S3). Therefore, the presented results should not be considered to represent long-term aerosol characteristics in the studied location. In these measurements ρeff was set to 1.0 g cm−3 and CS was measured up to size 2.5 µm. Also, CS attributable to ultrafine particle (CS0.1) was estimated by summing the CS obtained from the impactor stages 1–4. The upper 50 % cut-off size of the stage 4 was 95.7 nm.
3.1 Validation of the condensation sink calibration for the electrical low pressure impactor
The simulated total CS values with both the stage-specific and single-factor methods are compared to the theoretical ones in Fig. 3. The simulated stage-specific total CS was 3.5 %–4.2 % lower than the theoretical value, showing that the 14-impactor-stage-measurement of the ELPI+ should be good enough to measure CS accurately regardless of the particle size distribution. Also, the simulated CS size distributions were similar compared to the theoretical values (Figs. S2–S4). With the single-factor calibration, the simulated CS was −18.2 %–+29.0 % of the theoretical value, but with 7 of the 9 simulated distribution the difference was less than ±12 %, supporting the results by Kuuluvainen et al. (2010) showing that the diffusion charger-based measurement even without particle size analysis is an effective method for indicative CS measurement. As the single-factor CS calibration factor was chosen based on size 150 nm, the single-factor method overestimates CS of size distributions having high concentrations of ultrafine particles, whereas it underestimates size distributions with high concentrations of >200 nm particles (see Fig. 1).
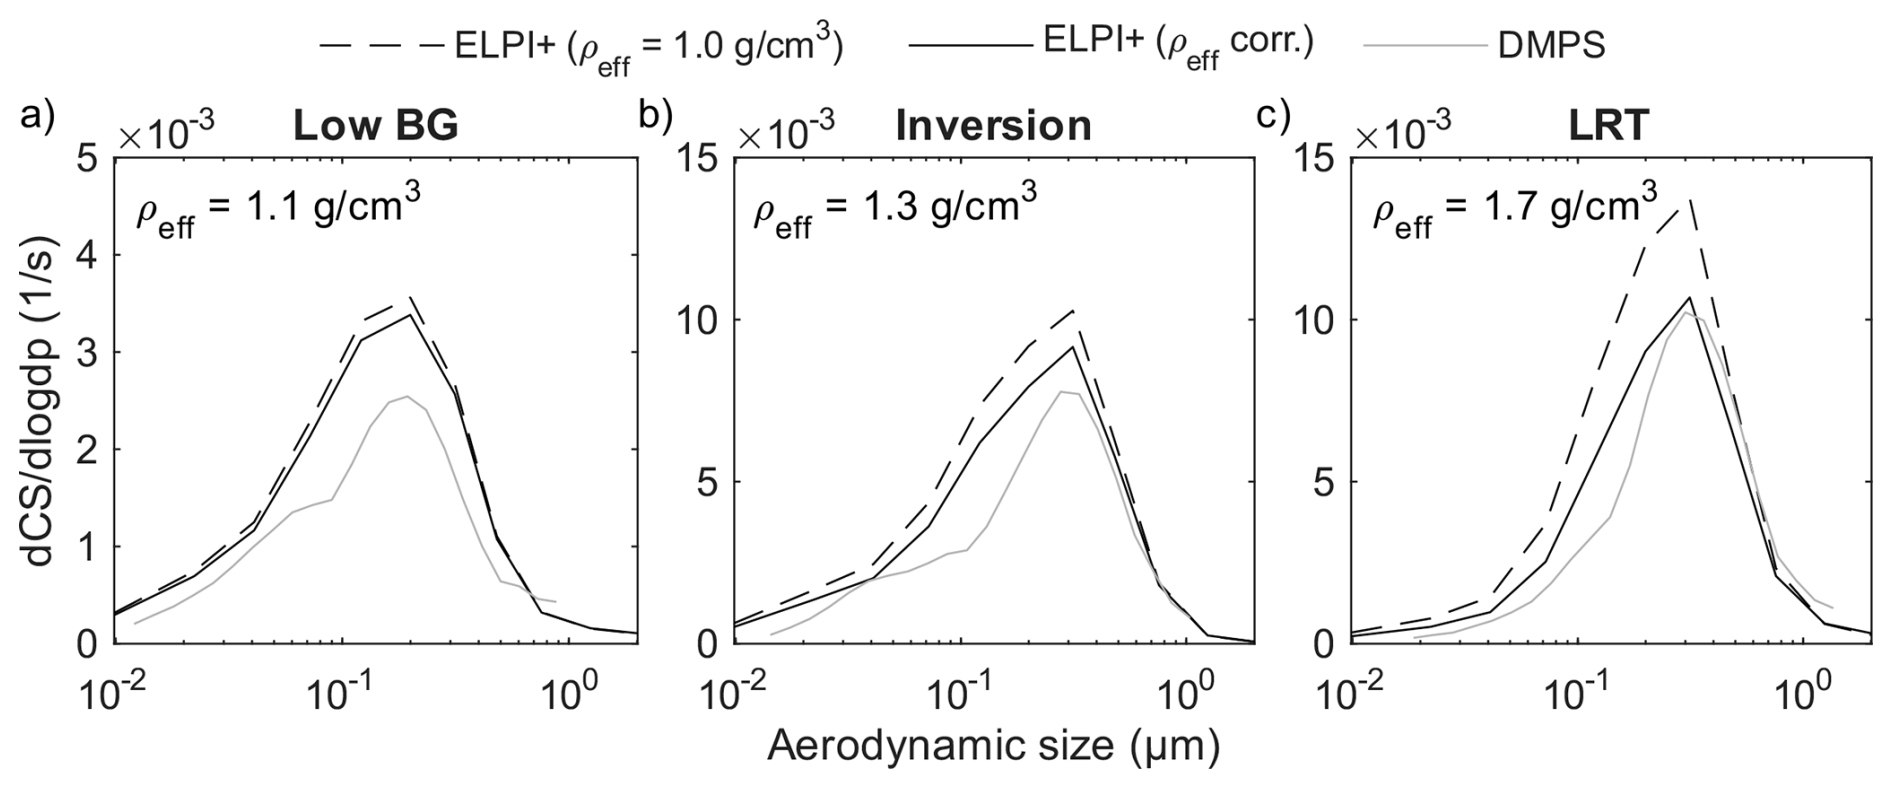
Figure 4Comparison of average ELPI+ and DMPS CS size distributions measured during (a) low background (Low BG), (b) inversion and (c) long range transported (LRT) pollution periods in the ELPI+ and DMPS comparison campaign in Helsinki in winter 2022. The ELPI+ results were calculated by assuming the unit effective density (ρeff=1.0 g cm−3) and by considering the estimated average effective density (ρeff corr.).
The average CS size distributions measured with both the ELPI+ and DMPS in Helsinki during the low background, inversion and LRT periods of the comparison campaign (in 2022, Table 2) are shown in Fig. 4. In principle, both instruments measured rather similarly shaped size distributions. However, the ELPI+ reports higher total CS during all the periods compared to the DMPS. The (density corrected) ELPI+ measured 1.31, 1.25 and 1.10 times higher total CS than the DMPS during the low background, inversion and LRT episodes, respectively. The difference is most likely related to the fractal structure of particles, which can be better observed with the electric current measurement by the ELPI+. Similar results of about 5 %–25 % difference between diffusion-charger based instruments and mobility particle sizers have been reported also in the measurement of particle lung deposited surface area (LDSA, e.g., Chang et al., 2022; Lepistö et al., 2024). The difference between the devices decreased as the average size of CS size distribution and average effective density increased. The larger accumulation mode particles represent aged aerosol, for which it can be considered that the particles are less agglomerated (e.g., Rissler et al., 2014), hence, decreasing the difference between the instruments. The unit-density assumed ELPI+ measured 1.05, 1.15 and 1.32 times higher total CS compared to the density corrected measurement, respectively. Therefore, in terms of total CS measurement, it is important to consider the average effective density with the ELPI+ measurement, especially if the concentration of accumulation mode particles is high, as they typically have a higher effective density.
Table 3Relative differences of the measured CS, CS0.1, GMDCS and values at the studied locations of Highway (Tampere), Airport (Düsseldorf) and Urban (Delhi-NCR) when altering input parameter values of the calculation (ρeff, α, Mvap, Dx,vap, T, P). The reference indicates the default input parameter values utilised in this study, and the results compared to reference shows the obtained values (of all three locations) divided by the reference result. Bold indicates values that were changed compared to the reference.
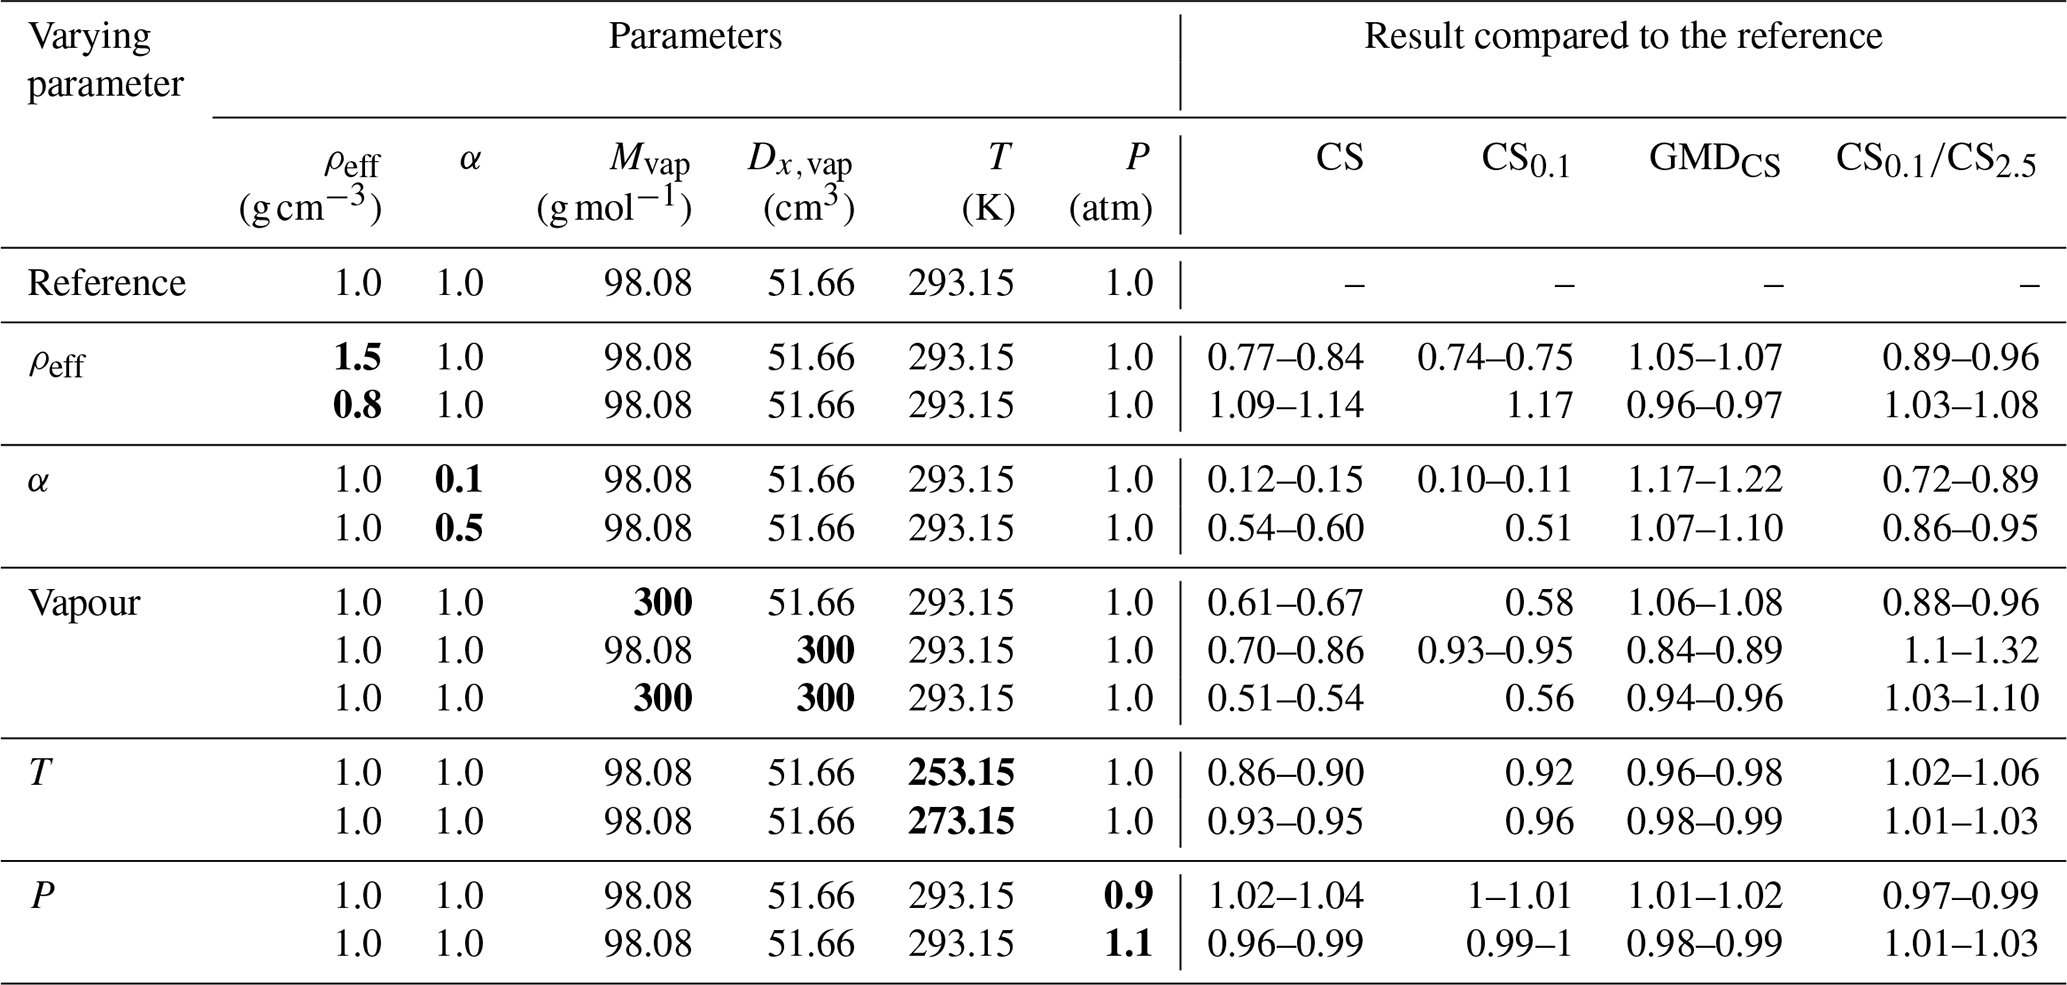
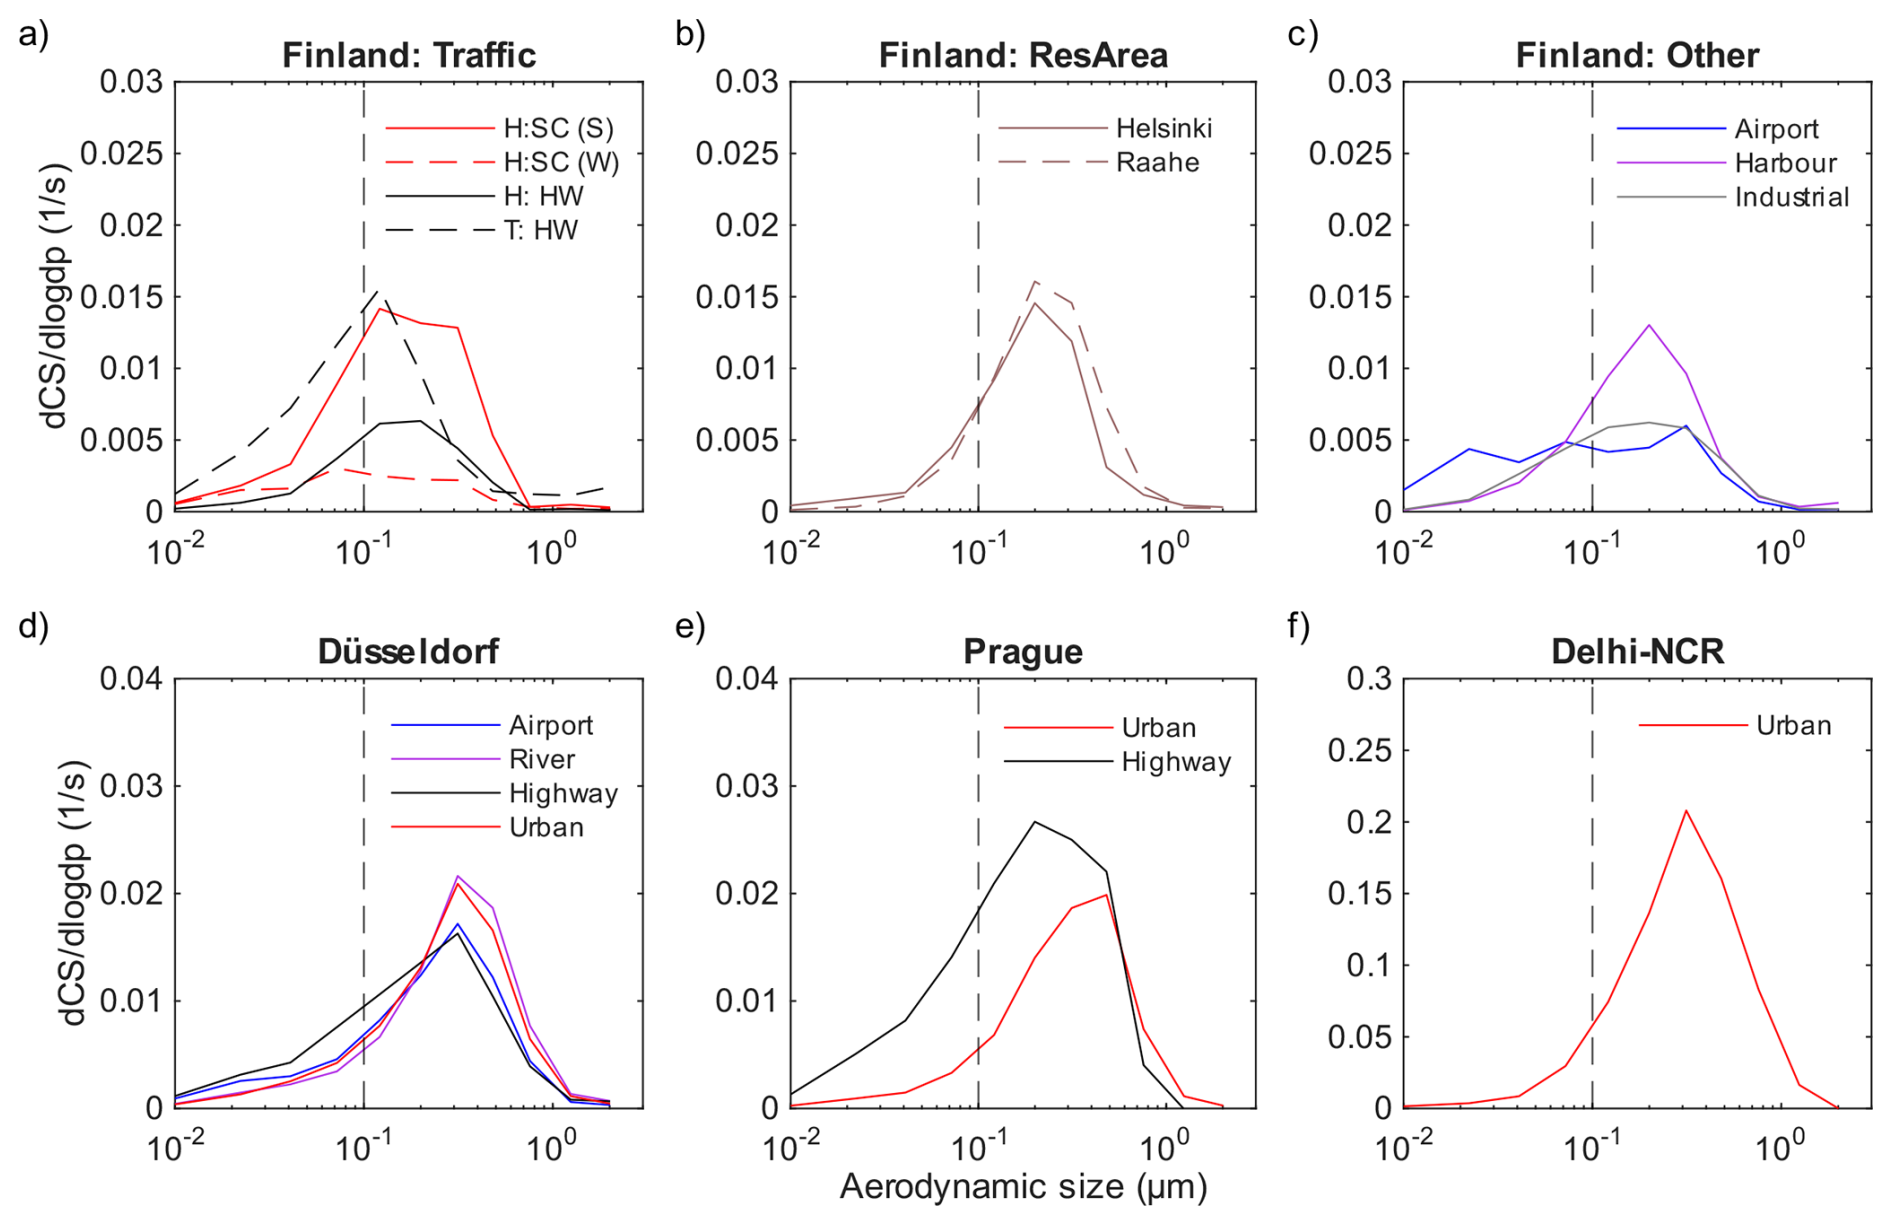
Figure 5The average CS size distributions in the studied environments, including (a) road traffic sites in Finland, (b) detached-housing residential areas in Finland, (c) airport, harbour and industrial areas in Finland, (d) various urban micro-environments in Düsseldorf (e) road traffic sits in Prague and (f) urban site in Delhi-NCR. The dashed line represents the size of 100 nm. Note varying y axis. H and T indicate Helsinki and Tampere, respectively, whereas SC and HW indicate, street canyon and highway. Urban indicates an urban traffic site and ResArea a residential area.
On the other hand, the effective density did not considerably affect the shape of the CS size distribution, showing that ELPI+ is especially suitable to measure the size-resolved CS, even if the effective density of particles cannot be determined. In Sect. 3.2, the size-resolved CS from the other studied sites are presented and compared (Fig. 5). In Figs. S5–S7, the same results are shown with different values of ρeff (0.8 and 1.5 g cm−3) utilised in the calculation. Similar to Fig. 4, the effective density did not considerably affect the shape and average size of the distribution, but the differences in the average total CS varied from 0.77 to 1.14 (Fig. S8).
In Table 3, the effect of α, vapour properties (Mvap, Dx,vap) and conditions (T, P) together with ρeff are shown on the ELPI+ CS measurement with data from the three chosen locations (Tampere: Highway, Düsseldorf: Airport, Delhi-NCR: Urban). The results with the other parameters were rather similar as with ρeff. Especially, α, Mvap, Dx,vap can strongly affect the obtained total CS. For example, the results show that even 100 % differences with total CS values can be obtained with different vapours (as shown by Tuovinen et al., 2021). Also, with α of 0.1, the obtained CS is roughly 10 times lower. Still, the effect of the varying parameters on the shapes of CS size distributions were relatively low (see Figs. S9–S14) which can be seen also with the relative changes in GMDCS and . With all the chosen values for the studied parameters, the GMDCS varied from −16 % to +22 % with the studied data. When considering the estimated -fraction, the differences were from −28 % to +32 % with the chosen data.
Thus, regarding the suitability of ELPI+ in terms of CS measurement, it can be concluded that methodology-dependent challenges (i.e. ρeff) do not considerably affect the size-resolved measurement but, in terms of total CS, the result can vary roughly ±25 % if ρeff cannot be accurately estimated. In addition, the general uncertainty of the ELPI+ measurement is important to acknowledge: According to Järvinen et al. (2014) the uncertainty is approx. 20 % for particles smaller than 40 nm, and 12 % for particles larger than that (with 95 % confidence interval). The uncertainty of the determined cut-point sizes in the ELPI+ calibration is 2 %. Hence, the general uncertainty of ELPI+ should not considerably affect the CS size distribution results but can affect the total CS roughly by 12 % as the CS attributable to particles smaller than 40 nm is typically low (see Sect. 3.2). When considering the difference of ELPI+ compared to particle mobility -based measurement, the mobility-based CS measurement seems to measure roughly 20 %–30 % lower CS (Fig. 4), but it should be noted that this ratio can be different in other environments. Overall, it is important to note the general uncertainties of CS measurement, e.g., related to vapour properties and accommodation as well as conditions. As seen, in Table 3, these uncertainties can cause multiple time differences in the obtained CS, as shown by Tuovinen et al. (2021). However, regarding the CS size distribution measurement, these uncertainties are not as significant, supporting the idea of CS size distribution measurement with ELPI+ and other methods as well.
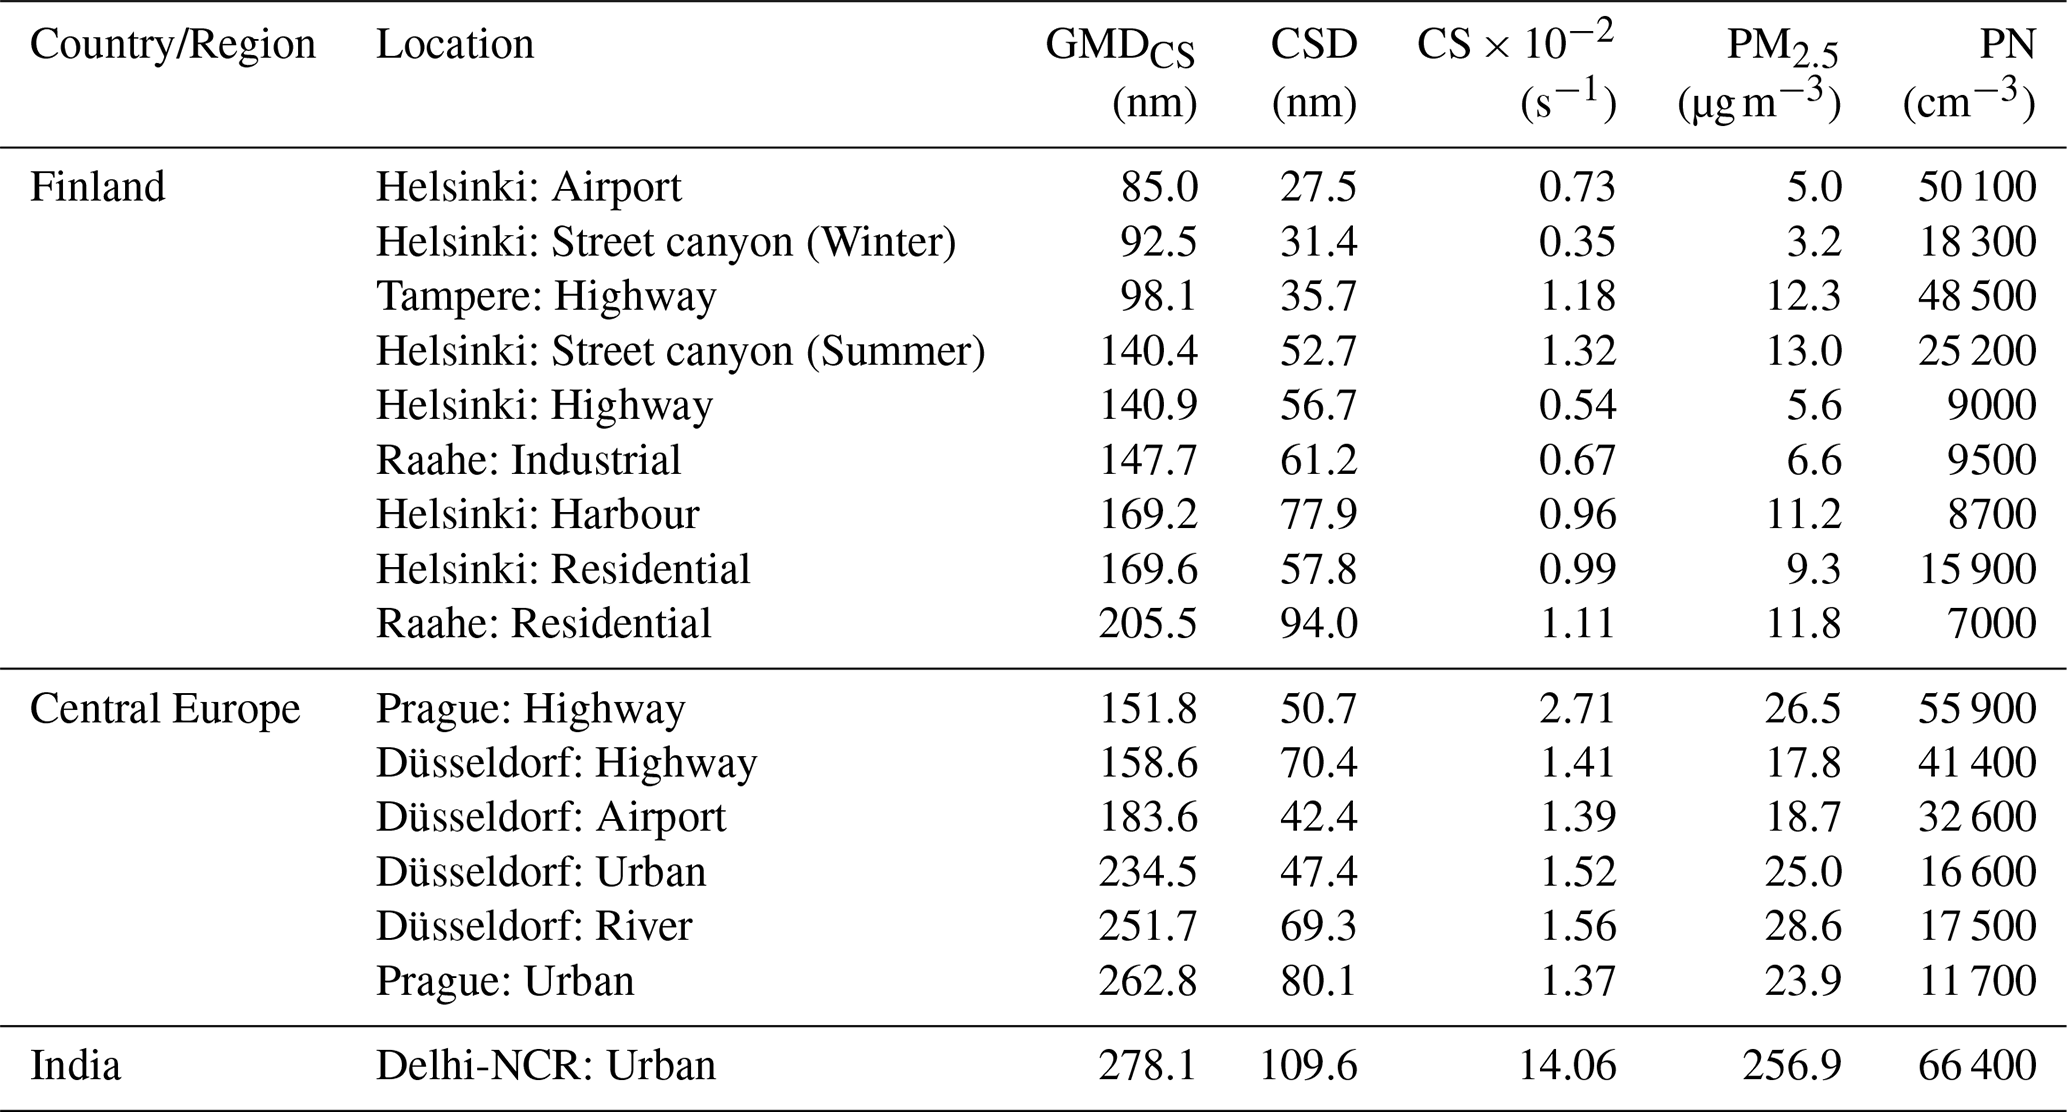
Table 4The average total CS in the studied environments as well as the geometric mean diameter (GMDCS) and condensation sink diameters (CSD, Lehtinen et al., 2003) of CS size distributions. Also, average PM2.5 and PN concentrations are shown.
3.2 Condensation sink in different urban environments
In Fig. 5, the average CS size distributions measured at all the studied environments (except the ELPI+ and DMPS comparison campaign) are shown (see Fig. S15 for the observation ranges of the CS size distributions). In Table 4, geometric mean diameters (GMDCS) of the CS size distributions together with CS diameter (CSD, Lehtinen et al., 2003), as well as total CS, PM2.5 and PN are collected. In principle (in case of a log-normal size distribution), the GMDCS represents the diameter of a particle that roughly 50 % of CS is contributed by particles smaller and larger than the GMDCS size. The CS diameter, on the other hand, represents the diameter of monodisperse aerosol particles that would contribute to equal total CS if the total number of the monodisperse particles was the same as the measured PN concentration. In Fig. 5, CS size distributions clearly varied depending on the environment. In locations, where ultrafine particle concentrations were high (road traffic sites, airport), GMDCS sizes were considerably smaller compared to other sites, being below 100 nm near airport and road traffic in Finland. GMDCS of below 100 nm indicates that vapour molecules condense onto ultrafine particles more likely than on accumulation mode particles (larger than 100 nm), which may be important e.g., in terms of particle lung deposition or in the formation of CCN nuclei. As PM2.5 concentrations increased, also the CS size distributions shifted to larger sizes in terms of both GMDCS and CSD values. In Finland, GMDCS sizes were 85–206 nm, whereas in Central Europe and India, 152–263 nm and 278 nm, respectively. Mostly, GMDCS sizes were between 150–300 nm.
Overall, according to the results, in locations with low PM2.5 and high ultrafine particle concentration, CS can considerably be contributed by particles smaller than 100 nm, whereas in locations with high PM2.5, the average size of CS size distribution seems to reach a plateau size around 300 nm. It should be taken into account that the reported diameters represent the aerodynamic size of particles. For example, if assuming ρeff to be 1.7 g cm−3, the 150–300 nm range would be 100–213 nm in mobility equivalent size (Eq. 8), matching well the typical median size of accumulation mode particles (Rose et al., 2021; Leinonen et al., 2022). Therefore, the CS distributions also explain why the accumulation mode of particles is typically always seen in this size range regardless of the environment, as the GMDCS size does not significantly increase compared the moderately polluted Central Europe (PM2.5: 17.8–28.6 µg m−3) and highly-polluted India (PM2.5: 256.9 µg m−3).
The relationship between GMDCS size and the more commonly utilised CSD size, was rather constant, the CSD size being 26 %–46 % of the GMDCS size (average 35 %). It should be noted that the two parameters have radically different interpretations and uses: the CS diameter is useful when trying to simplify the situation while conserving both CS and PN (and the size in which the number of growing particles is largest), while GMDCS gives an estimate of the size range where the majority of CS is and the number of condensing molecules end up. Literature data on both parameters is scarce; however, in comparison to CSD numbers reported by Dal Maso et al. (2008), we observe CSDs at lower sizes. This is expected as the numbers by Dal Maso et al. are from boreal background stations representing mostly clean air, while our study reports comparatively strong influence of nearby aerosol sources.
In Fig. 6, the average CS contributed by ultrafine particles (CS0.1) is shown for all the studied environments. Also, the fraction of CS0.1 in total CS (CS2.5, contributed by <2.5 µm particles) is shown. As seen, in locations with low PM2.5 and near local ultrafine particle sources like highways and airports, the CS0.1 fraction is the highest. In general, the difference between the highly polluted region (India) to other regions was considerably less significant with the CS0.1 than with the total CS2.5 in Table 4. Overall, the locations with the highest PN concentration also had the highest CS0.1. However, the relationship between CS0.1 and PN concentration varied: In Figs. S16–S19, linear fits and correlations (Pearson) between PN and CS0.1 are shown for all the studied environments. The slopes of the linear fits were 6.4–22.9×10⁸, 7.6–13.3×10⁸, and 14.3×10⁸ s−1 cm3, in Finland, Central Europe and India. Near airports (Helsinki and Düsseldorf), the slopes were 7.0–7.6×10⁸ s−1 cm3, whereas, at the traffic sites (all regions), the slopes were 6.4–14.3×10⁸ s−1 cm3. Thus, only PN concentration is not enough to accurately estimate the condensation sink attributable to ultrafine particles even though the correlation was mainly good (R2>0.6 except highway sites in Helsinki, Tampere and Düsseldorf). The connection between PM2.5 and CS2.5 varied in the studied environments, slopes of the linear fits being 0.35–1.54 s−1µg−1 m3 in Finland, 0.49–1.03 s−1µg−1 m3 in Central Europe, and 0.48 s−1µg−1 m3 in India (Figs. S20–S22). Also, the correlation was poor in road traffic and airport sites in Finland (R2<0.5). Hence, the connection between CS and traditional particle metrics (PN and PM2.5) can be strongly dependent on the environment and region.
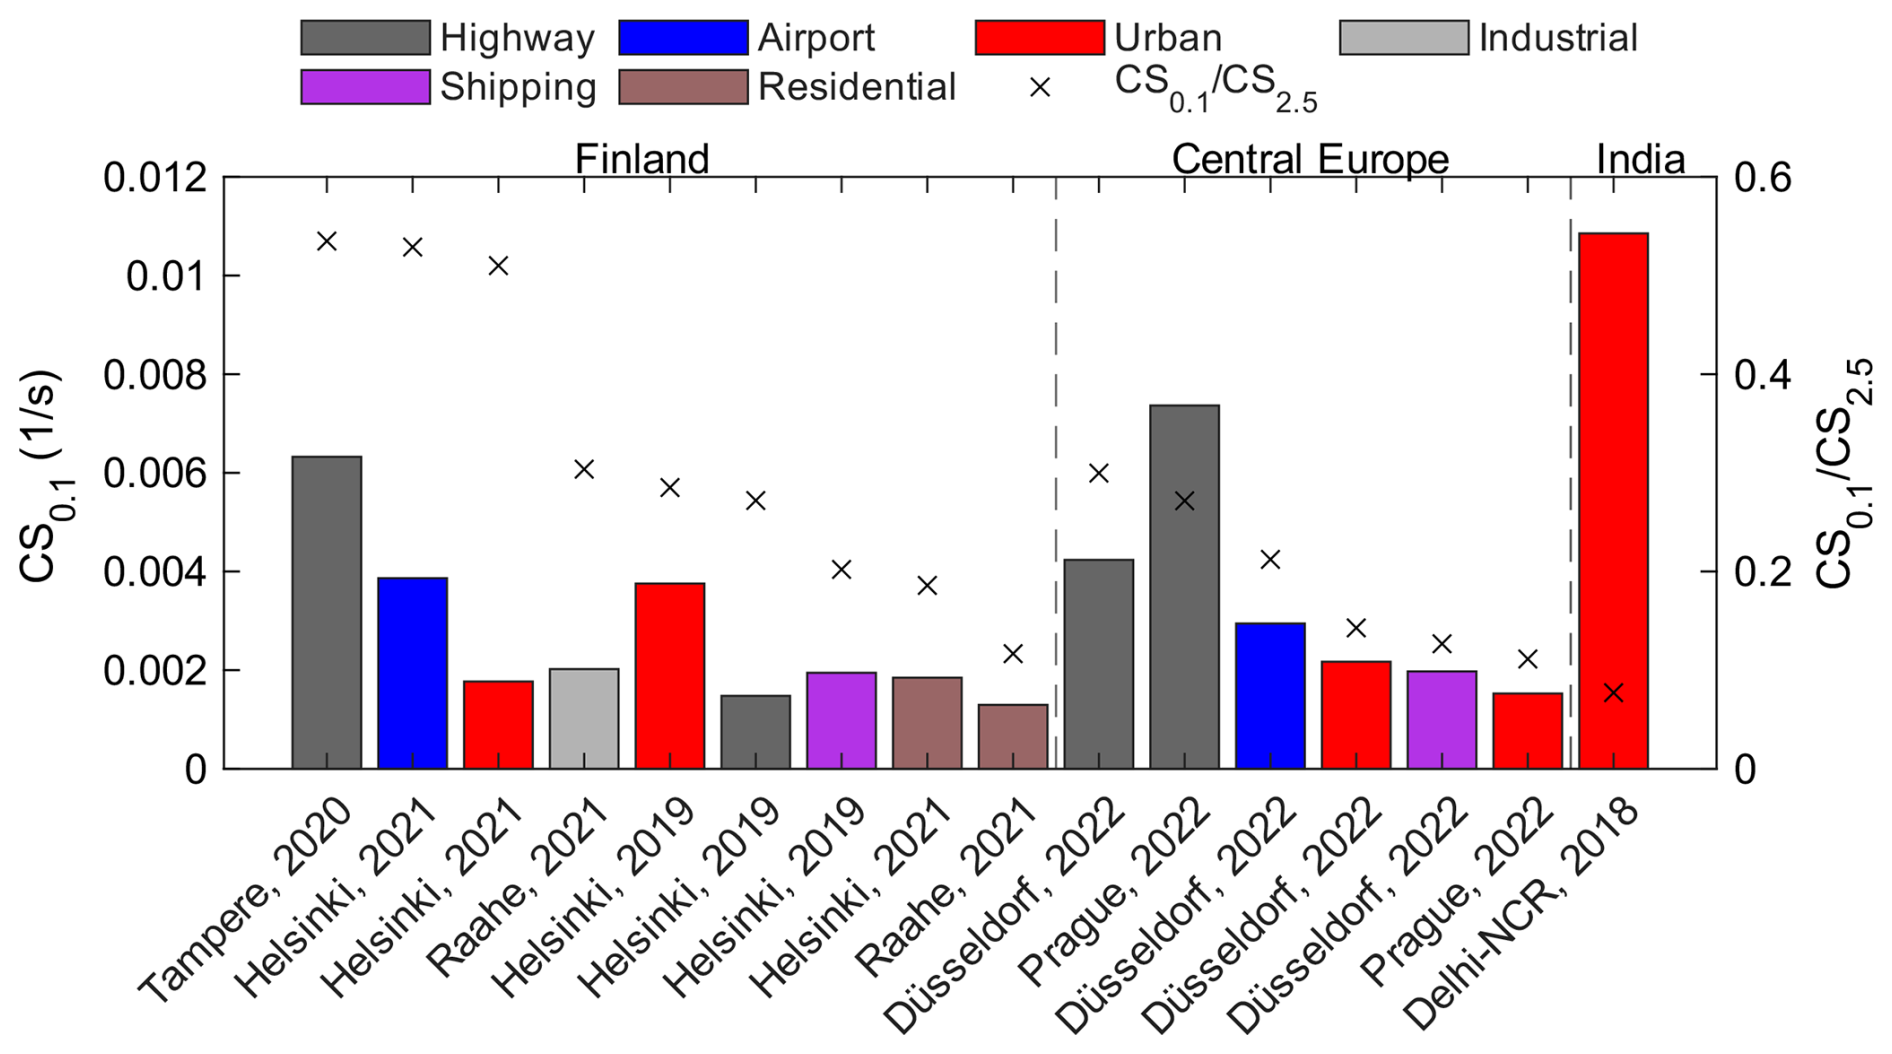
Figure 6CS attributable to ultrafine particles (CS0.1) in the studied environments. Also, the fraction of CS0.1 in total CS2.5 (of particles smaller than 2.5 µm) are shown.
The observed differences in the obtained CS size distributions (Fig. 5) indicate potential differences in both the aerosol health and climate effects of particles collected in different urban environments, and originating from different main sources. In principle, the CS size distribution describes the rate at which condensable vapours condense to different size ranges of the existing particle size distribution. A high value in the CS size distribution implies a higher transfer rate of these vapours from gas phase into particle phase at the certain particle size range. As different particle sizes have strongly varying efficiencies e.g., for lung deposition (e.g., ICRP, 1994; Heusinkveld et al., 2016), knowledge of the CS size distribution gives essential information of the existing particle population's potential for transferring condensable toxic compounds into the human body. For example, the CS size distribution enables the determination of CS contributed by ultrafine particles (CS0.1) which deposit in the lung alveoli more efficiently than larger particles. It was observed that CS0.1 considerably varied in different locations (Fig. 6) depending on the nearby pollution sources. Also, one potential application for the information provided by the CS size distribution in terms of potential health effects could e.g. be the infiltration of outdoor emissions to indoor as particle filtration in building ventilation systems is size-dependent (Karjalainen et al., 2017). For example, the change of the particle size distribution after filtration could indicate varying health effects of the infiltrated or indoor emitted semi-volatile compounds.
Moreover, the observed results provide a valuable point-of-view when considering the health connections of the traditionally measured particle metrics such as PM2.5 and PN concentrations. As seen in Table 4, Figs. 6 and S16–S22, the linkage of CS, and especially CS0.1, with PM2.5 clearly varies depending on the urban environment and geographic region. Lower PM2.5 mass (i.e., lower concentration of larger accumulation mode particles) causes a shift of the CS size distribution to smaller particle sizes, i.e. to sizes that have more efficient deposition efficiency in the lung alveoli. As PM2.5 concentration increases, the vapour condensation onto larger accumulation mode particles increases, relatively reducing the fraction of vapours condensing on ultrafine particles with respect to PM2.5 concentration. Thus, it could even be possible that cleaner ambient air in respect of particulate mass concentration would lead to higher efficiency for semi-volatile compounds to reach e.g. the alveolar parts of lung, which could affect the health effects associated with PM2.5 concentration. For example, studies have reported that the PM2.5 dose-response value seem to increase as the PM2.5 decreases (e.g., Vodonos et al., 2018). Hence, relatively increased condensation of toxic vapours on ultrafine particles could be one partial explanation for the relatively increased health effects of PM2.5 in areas with low pollution level. Also, as the connection between PN and CS (and CS0.1) varies depending on the urban environment (Figs. S16–S19), the potential of ultrafine particle emissions to act as carriers of toxic vapours can vary depending on the location, plausibly affecting the variability of health effects associated with ultrafine particles. Furthermore, it's worth to note that most emitted semi-volatile compounds, e.g., from vehicles, condense to the particle phase already in the cooling process of initially hot aerosols (Ristimäki et al., 2007; Rönkkö and Timonen, 2019). Therefore, the understanding of the CS size distribution of non-volatile primary emissions e.g., with different fuels or after-treatment processes could be valuable regarding the potential toxic effects of fresh exhaust that is a prevailing source of pollutants in urban city environments.
In addition to the health effects, the observed differences in the CS size distribution are interesting in terms of the aerosol climate effects. For example, the vapour condensation on particles changes the coating of particles, thus, affecting how the particles interact with the incoming solar radiation (e.g. Riemer et al., 2019). Therefore, understanding of the CS size distribution could help to estimate for which particle types and sizes condensation is the most important in certain location. Also, the activation of particles as CCN depends on particle size (50–100 nm, e.g., Kerminen et al., 2012). The differences in CS size distribution indicates that nanoparticle growth into sizes where they could act as CCN can depend on the environment and existing particle concentrations. Better characterization of CS size distribution could help to better understand CCN formation in different environments. In order to model the climatic impacts of particles accurately, it is important to characterise the factors affecting formation and change in the atmospheric particle size distribution in different conditions and environments. Accurate modelling of the particle size distribution on a global scale is notoriously difficult and resource-consuming; adapting the CS size distribution in reporting observational data could be useful and rather simple method to potentially provide additional constraining data for the important process of condensation, improving the accuracy of climate models.
To better understand the implications of the CS concentration and size distribution in terms of health and climate effects, it's also important to understand how well the current measurement methodologies enable CS size distribution measurement. In principle, CS measurement requires particle size distribution measurement. However, varying methods for particle size distribution measurement could affect the accuracy of CS size distribution measurement. The benefit of the ELPI+, the main instrument in this study, is that it covers the whole particle size range relevant for CS. Also, the diffusion charging of particles roughly correlates with CS due to the dependence of particle surface area. Hence, the ELPI+ enables a rather simple, but efficient method for CS size distribution measurement. On the other hand, the DMPS measurement also agreed well with the ELPI+ in terms of CS size distribution in this study, especially when considering the shape and mean size of the size distribution (Fig. 4). Therefore, according to the study, the current available size distribution methods seem to be well suitable for CS size distribution measurement, suggesting rather easy adaptation of current particle size distribution monitoring networks for CS size distribution measurement.
One interesting point-of-view is also the reasonably good performance of the ELPI+ single-factor CS calibration (Fig. 3), i.e., converting the diffusion charged current into CS concentration without considering particle size. In principle, the result indicates that also electrical particle sensors, like Partector (Fierz et al., 2014) and Pegasor PPS-M (Järvinen et al., 2015), that have become more popular in air quality monitoring, could measure CS with a reasonable accuracy. Hence, an electrical particle sensor network could help to obtain CS information in various locations without the need for more complicated size distribution measurement devices. On the other hand, the sensors could not be utilised in the CS size distribution measurement, but they still could help to improve the skill of models focusing on condensation.
Still, it must be noted that there are several factors that influence the determination of the CS from experimental measurements that should be carefully considered. For example, in case of ELPI+, the mentioned effective density of particles affects the determination of the CS (see Fig. 4), and the absence of such information introduces a source of potential error, here approximated to be roughly ±25 %. Also, the spherical particle assumption with mobility particle sizers (here DMPS) causes likely underestimation of CS: According to the results of this study, mobility particle sizer -based measurement seem to report 20 %–30 % lower CS than diffusion-charger-based measurement (like ELPI+). Therefore, it is not straightforward to conclude experimentally the most suitable and accurate method for CS measurement.
In addition to the mentioned uncertainties, another typical source of error in atmospheric CS measurements is the typical convention (Wiedensohler et al., 2012) of drying the ambient sample before performing size distribution measurements; this has the effect of reducing the size of hygroscopic particles which in turn can have a significant effect on the total condensation sink as well as the CS size distribution, as particle hygroscopicity is often size-dependent (Vu et al., 2015). This effect is difficult to quantify and require hygroscopicity and/or composition measurements. In cases where the ambient sample is dried either in a controlled manner, or e.g. due to dilution, the observed CS and CS size distribution should be considered a low-limit estimate, with the actual CS higher by a factor of up to 4 (Dal Maso et al., 2002). The ELPI+ measurements of atmospheric aerosols are typically not dried, and they do not have sheath flows, leading to observed distributions that are closer to ambient humidity than e.g. DMPS measurements.
It should also be noted that the CS and CS size distribution reported typically (also here) are a theoretical quantity computed assuming that the condensing vapour is sulphuric acid with an accommodation coefficient of 1.0; in reality, the condensing compound of interest can have strongly different properties, and the actual condensation sink can be only a fraction of the theoretical one (see e.g. Tuovinen et al., 2021). In general, organic compounds are considered to contribute more to condensation than sulphuric acid on particles larger than 10 nm (e.g., Riipinen et al., 2012; Yli-Juuti et al., 2013) which causes uncertainties in the estimation of total CS if the calculation is based on sulphuric acid. These effects may also have implications to the CS size distribution which are difficult to quantify. On the other hand, according to the results, the CS size distribution seemed to be mostly dependent on the existing particle size distribution, hence, the different vapour properties, accommodation coefficient or conditions should not as significantly affect the shape or mean size of the CS size distribution (Table 3, Figs. S9–S14). Thus, the sulphuric acid-based calculation should be a reasonably good approach to estimate the size-dependent condensation of other vapours as well. However, when interpreting the results in Figs. 5 and 6 and Table 4, the methodological and general uncertainties of CS estimation (Sect. 3.1) should be acknowledged. Also, it is important to note that the measurements at the studied locations were relatively short and, thus, the results should not be considered as long-term characteristics of aerosol at the studied locations. Hence, the observation ranges of the CS size distribution should be noted (Fig. S15). In general, the results related to CS size distribution, CS0.1, GMDCS and CSD can be different during other conditions and in long-term measurements. Still, the results show clearly that size-resolved CS can be significantly location-dependent, which is valuable to understand when considering the potential health and climate effects of aerosols.
Overall, it is fair to conclude that CS measurement is a rather crude approximation of a highly complex atmospheric phenomenon, but, still, the results observed in this study suggest significant location dependent differences in vapour condensation, and the measurement of CS size distribution enables a rather easy method to better understand potential health and climate relevant differences in existing particle population regarding vapour condensation. Long-term CS size distribution measurements in various locations and environments could be beneficial to better understand its relevance and impact in aerosol health and climate effects.
In this article, we explored the concept of the condensation sink size distribution. The concept is based on particle size distribution measurements, and it provides an approach which can be used to evaluate how the condensing gases and semi-volatile compounds are distributed as a function of particle size in gas-to-particle processes where the aerosol particles form a condensation sink for those compounds. We demonstrated the concept using ambient aerosol data measured by ELPI+ instrument, which provides the size distribution data with large particle size range, utilising diffusion charging of particles and particle size classification based on aerodynamic particle size. To do that, we determined particle size resolved conversion factors from electric currents to CS for the ELPI+ and investigated how the effective density of particles (and parameters related to vapour, mass accommodation and conditions) affect the conversion factors as well as how the ELPI+ measurement compares with mobility particle size measurement conducted with a DMPS.
Our study shows the potential of CS size distribution measurement in terms of both aerosol climate and health effects studies as well as the suitability of current size distribution methods for CS size distribution measurement. The results show that CS size distribution can considerably vary in different urban environments and regions. In locations where PN concentration is high but PM2.5 low, CS size distribution shifts to smaller particle size ranges (GMDCS<100 nm), indicating more efficient lung deposition of condensable toxic vapour molecules as well as relatively increased growth of particles into the sizes where they could act as CCN. As PM2.5 increases, the GMDCS seem to reach a plateau size around 300 nm (aerodynamic diameter), showing why the accumulation mode of particles typically peaks in the size range between 200–300 nm (aerodynamic diameter) regardless of the environment. Also, the varying CS size distributions show that the formation and changes of the atmospheric particle size distribution vary in different conditions and environments, which is important to understand when developing climate models. The comparison of the ELPI+ and DMPS measurement suggested that both methods seem suitable for CS size distribution measurement, and they agree reasonably well with each other. Overall, adaptation of CS size distribution can potentially provide important additional information regarding aerosol health and climate effects with relatively simple measurement with respect to current measurement methodologies.
In general, the understanding of the gas-to-particle processes and the potential effects of condensable vapours on health and climate requires future research. For example, a large database of measured long-term CS size distribution in different locations could help to identify the potential effects of CS size distribution on health and climate. Also, understanding of the condensation of other compounds than sulfuric acid, e.g., organic compounds, is essential for accurate measurements and analyses.
The utilised data are from publications Lepistö et al. (2023) and (2024). Experimental data shown in Figs. 4–6 are collected in a dataset (https://doi.org/10.5281/zenodo.18997659, Lepistö, 2026).
The supplement related to this article is available online at https://doi.org/10.5194/acp-26-4215-2026-supplement.
TL: Conceptualization, Data curation, Formal analysis, Investigation, Methodology, Validation, Visualization, Writing (original draft preparation), Writing (review and editing); HT: Conceptualization, Funding acquisition, Methodology, Project administration, Writing (review and editing); TR: Conceptualization, Funding acquisition, Methodology, Project administration, Writing (review and editing); MDM: Conceptualization, Funding acquisition, Methodology, Project administration, Writing (review and editing).
The contact author has declared that none of the authors has any competing interests.
Publisher's note: Copernicus Publications remains neutral with regard to jurisdictional claims made in the text, published maps, institutional affiliations, or any other geographical representation in this paper. The authors bear the ultimate responsibility for providing appropriate place names. Views expressed in the text are those of the authors and do not necessarily reflect the views of the publisher.
This study is part of the AEROSURF-project, funded by the Research Council of Finland (grant no. 356752).
This work has received funding from the Horizon Europe research and innovation programme under grant agreement no. 101096133 (PAREMPI: Particle emission prevention and impact: from real world emissions of traffic to secondary PM of urban air).
Also, ACCC-flagship (ACCC: Atmosphere and Climate Competence Center), funded by the Research Council of Finland (grant nos. 337552, 337551) is acknowledged.
This research has been supported by the Research Council of Finland (grant nos. 356752, 337552, and 337551) and the Horizon 2020 (grant no. 101096133).
This paper was edited by Guangjie Zheng and reviewed by three anonymous referees.
Ali, M. U., Siyi, L., Yousaf, B., Abbas, Q., Hameed, R., Zheng, C., Kuang, X., and Wong, M. H.: Emission sources and full spectrum of health impacts of black carbon associated polycyclic aromatic hydrocarbons (PAHs) in urban environment: A review, Crit. Rev. Env. Sci. Tec., 1–40, https://doi.org/10.1080/10643389.2020.1738854, 2020.
Boy, M. and Kulmala, M.: Nucleation events in the continental boundary layer: Influence of physical and meteorological parameters, Atmos. Chem. Phys., 2, 1–16, https://doi.org/10.5194/acp-2-1-2002, 2002.
Casquero-Vera, J. A., Pérez-Ramírez, D., Lyamani, H., Rejano, F., Casans, A., Titos, G., Olmo, F. J., Dada, L., Hakala, S., Hussein, T., Lehtipalo, K., Paasonen, P., Hyvärinen, A., Pérez, N., Querol, X., Rodríguez, S., Kalivitis, N., González, Y., Alghamdi, M. A., Kerminen, V.-M., Alastuey, A., Petäjä, T., and Alados-Arboledas, L.: Impact of desert dust on new particle formation events and the cloud condensation nuclei budget in dust-influenced areas, Atmos. Chem. Phys., 23, 15795–15814, https://doi.org/10.5194/acp-23-15795-2023, 2023.
Chang, P.-K., Griffith, S. M., Chuang, H.-C., Chuang, K.-J., Wang, Y.-H., Chang, K.-E., and Hsiao, T.-C.: Particulate matter in a motorcycle-dominated urban area: Source apportionment and cancer risk of lung deposited surface area (LDSA) concentrations, J. Hazard. Mater., 427, 128188, https://doi.org/10.1016/j.jhazmat.2021.128188, 2022.
Chen, G., Canonaco, F., Tobler, A., Aas, W., Alastuey, A., Allan, J., Atabakhsh, S., Aurela, M., Baltensperger, U., Bougiatioti, De Brito, J. F., Ceburnis, D., Chazeau, B., Chebaicheb, H., Daellenbach, K. R., Ehn, M., El Haddad, I., Eleftheriadis, K., Favez, O., Flentje, H., Font, A., Fossum, K., Freney, E., Gini, M., Green, D. C., Heikkinen, L., Herrmann, H., Kalogridis, A.-C., Keernik, H., Lhotka, R., Lin, C., Lunder, C., Maasikmets, M., Manousakas, M. I., Marchand, N., Marin, C., Marmureanu, L., Mihalopoulos, N., Močnik, G., Nęcki, J., O'Dowd, C., Ovadnevaite, J., Peter, T., Petit, J.-E., Pikridas, M., Platt, S. M., Pokorná, P., Poulain, L., Priestman, M., Riffault, V., Rinaldi, M., Różański, K., Schwarz, J., Sciare, J., Simon, L., Skiba, A., Slowik, J. G., Sosedova, Y., Stavroulas, I., Styszko, K., Teinemaa, E., Timonen, H., Tremper, A., Vasilescu, J., Via, M., Vodička, P., Wiedensohler, A., Zografou, O., Minguillón, M. C., and Prévôt, A. S. H.: European aerosol phenomenology – 8: Harmonised source apportionment of organic aerosol using 22 Year-long ACSM/AMS datasets, Environ. Int., 166, 107325, https://doi.org/10.1016/j.envint.2022.107325, 2022.
Daellenbach, K. R., Uzu, G., Jiang, J., Cassagnes, L. E., Leni, Z., Vlachou, A., Stefenelli, G., Canonaco, F., Weber, S., Segers, A., Kuenen, J. J. P., Schaap, M., Favez, O., Albinet, A., Aksoyoglu, S., Dommen, J., Baltensperger, U., Geiser, M., El Haddad, I., Jaffrezo, J.-L., and Prévöt, A. S. H.: Sources of particulate-matter air pollution and its oxidative potential in Europe, Nature, 587, 414–419, https://doi.org/10.1038/s41586-020-2902-8, 2020.
Dal Maso, M., Kulmala, M., Lehtinen, K. E. J., Mäkelä, J. M., Aalto, P., and O'Dowd, C. D.: Condensation and coagulation sinks and formation of nucleation mode particles in coastal and boreal forest boundary layers, J. Geophys. Res., 107, https://doi.org/10.1029/2001JD001053, 2002.
Dal Maso, M., Hyvärinen, A., Komppula, M., Tunved, P., Kerminen, V. M., Lihavainen, H., Viisanen, Y., Hansson, H.-C., and Kulmala, M.: Annual and interannual variation in boreal forest aerosol particle number and volume concentration and their connection to particle formation, Tellus B, 60, 495–508, https://doi.org/10.1111/j.1600-0889.2008.00366.x, 2008.
Fierz, M., Meier, D., Steigmeier, P., and Burtscher, H.: Aerosol measurement by induced currents, Aerosol Sci. Tech., 48, 350–357, https://doi.org/10.1080/02786826.2013.875981, 2014.
Fuchs, N. A. and Sutugin, A. G.: High-dispersed aerosols, Current Aerosol Research, edited by: Hidy, G. M. and Brock, J., Pergamon, Oxford, 1–60, https://doi.org/10.1016/B978-0-08-016674-2.50006-6, 1971.
Fuzzi, S., Baltensperger, U., Carslaw, K., Decesari, S., Denier van der Gon, H., Facchini, M. C., Fowler, D., Koren, I., Langford, B., Lohmann, U., Nemitz, E., Pandis, S., Riipinen, I., Rudich, Y., Schaap, M., Slowik, J. G., Spracklen, D. V., Vignati, E., Wild, M., Williams, M., and Gilardoni, S.: Particulate matter, air quality and climate: lessons learned and future needs, Atmos. Chem. Phys., 15, 8217–8299, https://doi.org/10.5194/acp-15-8217-2015, 2015.
Hakkarainen, H., Salo, L., Mikkonen, S., Saarikoski, S., Aurela, M., Teinilä, K., Ihalainen, M., Martikainen, S., Marjanen, P., Lepistö, L., Kuittinen, N., Saarnio, K., Aakko-Saksa, P., Pfeiffer, T. F., Timonen, H., Rönkkö, T., and Jalava, P. I.: Black carbon toxicity dependence on particle coating: Measurements with a novel cell exposure method, Sci. Total Environ., 838, https://doi.org/10.1016/j.scitotenv.2022.156543, 2022.
Hamed, A., Joutsensaari, J., Mikkonen, S., Sogacheva, L., Dal Maso, M., Kulmala, M., Cavalli, F., Fuzzi, S., Facchini, M. C., Decesari, S., Mircea, M., Lehtinen, K. E. J., and Laaksonen, A.: Nucleation and growth of new particles in Po Valley, Italy, Atmos. Chem. Phys., 7, 355–376, https://doi.org/10.5194/acp-7-355-2007, 2007.
Hanson, D. R.: Mass accommodation of H2SO4 and CH3SO3H on water-sulfuric acid solutions from 6 % to 97 % RH, J. Phys. Chem. A, 109, 6919–6927, https://doi.org/10.1021/jp0510443, 2005.
Heusinkveld, H., Wahle, T., Campbell, A., Westerink, R. H. C., Tran, L., Johnston, H., Stone, V., Cassee, F. R., and Schins, R. P. F.: Neurodegenerative and neurological disorders by small inhaled particles, Neurotoxicology, 113, 94–106, https://doi.org/10.1016/j.neuro.2016.07.007, 2016.
ICRP: Human respiratory tract model for radiological protection, vol. 66, 24, ISBN 0 08 041154 1, 1994.
Järvinen, A., Aitomaa, M., Rostedt, A., Keskinen, J., and Yli-Ojanperä, J.: Calibration of the new electrical low pressure impactor (ELPI+), J. Aerosol Sci., 69, 150–159, https://doi.org/10.1016/j.jaerosci.2013.12.006, 2014.
Järvinen, A., Kuuluvainen, H., Niemi, J. V., Saari, S., Dal Maso, M., Pirjola, L., Hillamo, R., Janka, K., Keskinen, J., and Rönkkö, T.: Monitoring urban air quality with a diffusion charger based electrical particle sensor, Urban Climate, 14, 441–456, https://doi.org/10.1016/j.uclim.2014.10.002, 2015.
Karjalainen, P., Saari, S., Kuuluvainen, H., Kalliohaka, T., Taipale, A., and Rönkkö, T.: Performance of ventilation filtration technologies on characteristic traffic related aerosol down to nanocluster size, Aerosol Sci. Tech., 51, 1398–1408, https://doi.org/10.1080/02786826.2017.1356904, 2017.
Kerminen, V.-M., Paramonov, M., Anttila, T., Riipinen, I., Fountoukis, C., Korhonen, H., Asmi, E., Laakso, L., Lihavainen, H., Swietlicki, E., Svenningsson, B., Asmi, A., Pandis, S. N., Kulmala, M., and Petäjä, T.: Cloud condensation nuclei production associated with atmospheric nucleation: a synthesis based on existing literature and new results, Atmos. Chem. Phys., 12, 12037–12059, https://doi.org/10.5194/acp-12-12037-2012, 2012.
Keskinen, J., Pietarinen, K., and Lehtimäki, M.: Electrical low pressure impactor, J. Aerosol Sci., 23, 353–360, https://doi.org/10.1016/0021-8502(92)90004-F, 1992.
Kontkanen, J., Lehtipalo, K., Ahonen, L., Kangasluoma, J., Manninen, H. E., Hakala, J., Rose, C., Sellegri, K., Xiao, S., Wang, L., Qi, X., Nie, W., Ding, A., Yu, H., Lee, S., Kerminen, V.-M., Petäjä, T., and Kulmala, M.: Measurements of sub-3 nm particles using a particle size magnifier in different environments: from clean mountain top to polluted megacities, Atmos. Chem. Phys., 17, 2163–2187, https://doi.org/10.5194/acp-17-2163-2017, 2017.
Kulmala, M., Kerminen, V. M., Petäjä, T., Ding, A. J., and Wang, L.: Atmospheric gas-to-particle conversion: Why NPF events are observed in megacities?, Faraday Discuss., 200, 271–288, https://doi.org/10.1039/c6fd00257a, 2017.
Kuuluvainen, H., Kannosto, J., Virtanen, A., Mäkelä, J. M., Kulmala, M., Aalto, P., and Keskinen, J.: Technical Note: Measuring condensation sink and ion sink of atmospheric aerosols with the electrical low pressure impactor (ELPI), Atmos. Chem. Phys., 10, 1361–1368, https://doi.org/10.5194/acp-10-1361-2010, 2010.
Lehtinen, K. E. J., Korhonen, H., Dal Maso, M., and Kulmala, M.: On the concept of condensation sink diameter, Boreal Environ. Res., 8, 405–411, 2003.
Leinonen, V., Kokkola, H., Yli-Juuti, T., Mielonen, T., Kühn, T., Nieminen, T., Heikkinen, S., Miinalainen, T., Bergman, T., Carslaw, K., Decesari, S., Fiebig, M., Hussein, T., Kivekäs, N., Krejci, R., Kulmala, M., Leskinen, A., Massling, A., Mihalopoulos, N., Mulcahy, J. P., Noe, S. M., van Noije, T., O'Connor, F. M., O'Dowd, C., Olivie, D., Pernov, J. B., Petäjä, T., Seland, Ø., Schulz, M., Scott, C. E., Skov, H., Swietlicki, E., Tuch, T., Wiedensohler, A., Virtanen, A., and Mikkonen, S.: Comparison of particle number size distribution trends in ground measurements and climate models, Atmos. Chem. Phys., 22, 12873–12905, https://doi.org/10.5194/acp-22-12873-2022, 2022.
Lepistö, T.: Experimental data shown in Figures: Size-resolved condensation sink as an approach to understand pathways how gaseous emissions affect health and climate, Zenodo [data set], https://doi.org/10.5281/zenodo.18997659, 2026.
Lepistö, T., Lintusaari, H., Oudin, A., Barreira, L. M. F., Niemi, J. V., Karjalainen, P., Salo, L., Silvonen, V., Markkula, L., Hoivala, J., Marjanen, P., Martikainen, S., Aurela, M., Reyes Reyes, F., Oyola, P., Kuuluvainen, H., Manninen, H., Schins, R. P. F., Vojtisek-Lom, M., Ondracek, J., Topinka, J., Timonen, H., Jalava, P., Saarikoski, S., and Rönkkö, T.: Particle lung deposited surface area (LDSAal) size distributions in different urban environments and geographical regions: Towards understanding of the PM2.5 dose–response, Environ. Int., 180, https://doi.org/10.1016/j.envint.2023.108224, 2023.
Lepistö, T., Lintusaari, H., Salo, L., Silvonen, V., Barreira, L. M. F., Hoivala, J., Markkula, L., Niemi, J. V., Ondracek, J., Teinilä, K., Manninen, H. E., Saarikoski, S., Timonen, H., Dal Maso, M., and Rönkkö, T.: Comparison of size distribution and electrical particle sensor measurement methods for particle lung deposited surface area (LDSAal) in ambient measurements with varying conditions, Aerosol Research, 2, 271–289, https://doi.org/10.5194/ar-2-271-2024, 2024.
Levy, M. E., Zhang, E., Khalizov, A. F., Zheng, J., Collins, D. R., Glen, C. R., Wang, Y., Yu, X.-Y., Luke, W., Jayne, J. T., and Olaguer, E.: Measurements of submicron aerosols in Houston, Texas during the 2009 SHARP field campaign, J. Geophys. Res.-Atmos., 118, 10518–10534, https://doi.org/10.1002/jgrd.50785, 2013.
Lu, J., Shen, X., Ma, Q., Yu, A., Hu, X., Zhang, Y., Liu, Q., Liu, S., Che, H., Zhang, H., and Sun, J.: Size-resolved effective density of ambient aerosols measured by an AAC–SMPS tandem system in Beijing, Atmos. Environ., 318, 120226, https://doi.org/10.1016/j.atmosenv.2023.120226, 2024.
Mishra, M., Gulia, S., Shukla, N., Goyal, S. K., and Kulshrestha, U. C.: Review of Secondary Aerosol Formation and Its Contribution in Air Pollution Load of Delhi NCR, Water Air Soil Poll., 234, 47, https://doi.org/10.1007/s11270-022-06047-0, 2023.
Pirjola, L., Kulmala, M., Wilck, M., Bischoff, A., Stratmann, F., and Otto, E.: Effects of aerosol dynamics on the formation of sulphuric acid aerosols and cloud condensation nuclei, J. Aerosol Sci., 30, 1079–1094, 1999.
Poling, B. E., Prausnitz, J. M., and O'Connel, J. P.: The Properties of Gases and Liquids, McGraw-Hill, ISBN 978-0070116825, 2000.
Pöschl, U., Canagaratna, M., Jayne, J. T., Molina, L. T., Worsnop, D. R., Kolb, C. E., and Molina, M. J.: Mass Accommodation Coefficient of H2SO4 Vapor on Aqueous Sulfuric Acid Surfaces and Gaseous Diffusion Coefficient of H2SO4 in N2/H2O, J. Phys. Chem. A, 102, 10082–10089, https://doi.org/10.1021/jp982809s, 1998.
Riemer, N., Ault, A. P., West, M., Craig, R. L., and Curtis, J. H.: Aerosol mixing state: Measurements, modeling, and impacts, Rev. Geophys., 57, 187–249, https://doi.org/10.1029/2018RG000615, 2019.
Riipinen, I., Yli-Juuti, T., Pierce, J. R., Petäjä, T., Worsnop, D. R., Kulmala, M., and Donahue, N. M.: The contribution of organics to atmospheric nanoparticle growth, Nat. Geosci., 5, 453–458, https://doi.org/10.1038/ngeo1499, 2012.
Rissler, J., Nordin, E. Z., Eriksson, A. C., Nilsson, P. T., Frosch, M., Sporre, M. K., Wierzbicka, A., Svenningsson, B., Löndahl, J., Messing, M. E., Sjogren, S., Hemmingsen, J. G., Loft, S., Pagels, J. H., and Swietlicki, E.: Effective Density and Mixing State of Aerosol Particles in a Near-Traffic Urban Environment, Environ. Sci. Technol., 48, 6300–6308, https://doi.org/10.1021/es5000353, 2014.
Ristimäki, J., Vaaraslahti, K., Lappi, M., and Keskinen, J.: Hydrocarbon Condensation in Heavy-Duty Diesel Exhaust, Environ. Sci. Technol., 41, 6397–6402, https://doi.org/10.1021/es0624319, 2007.
Rönkkö, T., Kuuluvainen, H., Karjalainen, P., Keskinen, J., Hillamo, R., Niemi, J. V., Pirjola, L., Timonen, H. J., Saarikoski, S., Saukko, E., Järvinen, A., Silvennoinen, H., Rostedt, A., Olin, M., Yli-Ojanperä, J., Nousiainen, P., Kousa, A., and Dal Maso, M.: Traffic is a major source of atmospheric nanocluster aerosol, P. Natl. Acad. Sci. USA, 114, 7549–7554, https://doi.org/10.1073/pnas.1700830114, 2017.
Rönkkö, T. and Timonen, H.: Overview of Sources and Characteristics of Nanoparticles in Urban Traffic-Influenced Areas, J. Alzheimers Dis., 72, 15–28, https://doi.org/10.3233/JAD-190170, 2019.
Rose, C., Collaud Coen, M., Andrews, E., Lin, Y., Bossert, I., Lund Myhre, C., Tuch, T., Wiedensohler, A., Fiebig, M., Aalto, P., Alastuey, A., Alonso-Blanco, E., Andrade, M., Artíñano, B., Arsov, T., Baltensperger, U., Bastian, S., Bath, O., Beukes, J. P., Brem, B. T., Bukowiecki, N., Casquero-Vera, J. A., Conil, S., Eleftheriadis, K., Favez, O., Flentje, H., Gini, M. I., Gómez-Moreno, F. J., Gysel-Beer, M., Hallar, A. G., Kalapov, I., Kalivitis, N., Kasper-Giebl, A., Keywood, M., Kim, J. E., Kim, S.-W., Kristensson, A., Kulmala, M., Lihavainen, H., Lin, N.-H., Lyamani, H., Marinoni, A., Martins Dos Santos, S., Mayol-Bracero, O. L., Meinhardt, F., Merkel, M., Metzger, J.-M., Mihalopoulos, N., Ondracek, J., Pandolfi, M., Pérez, N., Petäjä, T., Petit, J.-E., Picard, D., Pichon, J.-M., Pont, V., Putaud, J.-P., Reisen, F., Sellegri, K., Sharma, S., Schauer, G., Sheridan, P., Sherman, J. P., Schwerin, A., Sohmer, R., Sorribas, M., Sun, J., Tulet, P., Vakkari, V., van Zyl, P. G., Velarde, F., Villani, P., Vratolis, S., Wagner, Z., Wang, S.-H., Weinhold, K., Weller, R., Yela, M., Zdimal, V., and Laj, P.: Seasonality of the particle number concentration and size distribution: a global analysis retrieved from the network of Global Atmosphere Watch (GAW) near-surface observatories, Atmos. Chem. Phys., 21, 17185–17223, https://doi.org/10.5194/acp-21-17185-2021, 2021.
Roy, S., Diveky, M. E., and Signorell, R.: Mass Accommodation Coefficients of Water on Organics from Complementary Photoacoustic and Light Scattering Measurements on Laser-Trapped Droplets, J. Phys. Chem. C, 124, 2481–2489, https://doi.org/10.1021/acs.jpcc.9b09934, 2020.
Sebastian, M., Kompalli, S. K., Kumar, V. A., Jose, S., Babu, S. S., Pandithurai, G., Singh, S., Hooda, R. K., Soni, V. K., Pierce, J. R., Vakkari, V., Asmi, E., Westervelt, D. M., Hyvärinen, A.-P., and Kanawade, V. P.: Observations of particle number size distributions and new particle formation in six Indian locations, Atmos. Chem. Phys., 22, 4491–4508, https://doi.org/10.5194/acp-22-4491-2022, 2022.
Teinilä, K., Timonen, H., Aurela, M., Kuula, J., Rönkkö, T., Hellèn, H., Loukkola, K., Kousa, A., Niemi, J. V., and Saarikoski, S.: Characterization of particle sources and comparison of different particle metrics in an urban detached housing area, Finland, Atmos. Environ., 272, 118939, https://doi.org/10.1016/j.atmosenv.2022.118939, 2022.
Teinilä, K., Saarikoski, S., Lintusaari, H., Lepistö, T., Marjanen, P., Aurela, M., Hellén, H., Tykkä, T., Lampimäki, M., Lampilahti, J., Barreira, L., Mäkelä, T., Kangas, L., Hatakka, J., Harni, S., Kuula, J., V. Niemi, J., Portin, H., Yli-Ojanperä, J., Niemelä, V., Jäppi, M., Lehtipalo, K., Vanhanen, J., Pirjola, L., Manninen, H. E., Petäjä, T., Rönkkö, T., and Timonen, H.: Measurement report: Wintertime aerosol characterization at an urban traffic site in Helsinki, Finland, Atmos. Chem. Phys., 25, 4907–4928, https://doi.org/10.5194/acp-25-4907-2025, 2025.
Trechera, P., Garcia-Marlès, M., Liu, X., Reche, C., Pérez, N., Savadkoohi, M., Beddows, D., Salma, I., Vörösmarty, M., Casans, A., Casquero-Vera, J. A., Hueglin, C., Marchand, N., Chazeau, B., Gille, G., Kalkavouras, P., Mihalopoulos, N., Ondracek, J., Zikova, N., Niemi, J. V., Manninen, H. E., Green, D. C., Trepmper, A. H., Norman, M., Vratolis, S., Eleftheriadis, K., Gómez-Moreno, F. J., Alonso-Blanco, E., Gerwig, H., Wiedensohler, A., Weinhold, K., Merkel, M., Bastian, S., Petit, J.-E., Favez, O., Crumeyrolle, S., Ferlay, N., Dos Santos, S. M., Putaud, J.-P., Timonen, H., Lampilahti, J., Asvach, C., Wolf, C., Kaminski, H., Altug, H., Hoffmann, B., Rich, D. Q., Pandolfi, M., Harrison, R. M., Hopke, P. K., Petäjä, T., Alastuey, A., and Querol, X.: Phenomenology of ultrafine particle concentrations and size distribution across urban Europe, Environ. Int., 172, https://doi.org/10.1016/j.envint.2023.107744, 2023.
Tuovinen, S., Kontkanen, J., Cai, R., and Kulmala, M.: Condensation sink of atmospheric vapors: the effect of vapor properties and the resulting uncertainties, Environ. Sci.: Atmos., 1, 543–557, https://doi.org/10.1039/D1EA00032B, 2021.
Vodonos, A., Awad, Y. A., and Schwartz, J.: The concentration-response between long-term PM2.5 exposure and mortality; A meta-regression approach, Environ. Res., 166, https://doi.org/10.1016/j.envres.2018.06.021, 2018.
Vu, T. V., Delgado-Saborit, J. M., and Harrison, R. M.: A review of hygroscopic growth factors of submicron aerosols from different sources and its implication for calculation of lung deposition efficiency of ambient aerosols, Air Qual. Atmos. Hlth., 8, 429–440, https://doi.org/10.1007/s11869-015-0365-0, 2015.
Wiedensohler, A., Birmili, W., Nowak, A., Sonntag, A., Weinhold, K., Merkel, M., Wehner, B., Tuch, T., Pfeifer, S., Fiebig, M., Fjäraa, A. M., Asmi, E., Sellegri, K., Depuy, R., Venzac, H., Villani, P., Laj, P., Aalto, P., Ogren, J. A., Swietlicki, E., Williams, P., Roldin, P., Quincey, P., Hüglin, C., Fierz-Schmidhauser, R., Gysel, M., Weingartner, E., Riccobono, F., Santos, S., Grüning, C., Faloon, K., Beddows, D., Harrison, R., Monahan, C., Jennings, S. G., O'Dowd, C. D., Marinoni, A., Horn, H.-G., Keck, L., Jiang, J., Scheckman, J., McMurry, P. H., Deng, Z., Zhao, C. S., Moerman, M., Henzing, B., de Leeuw, G., Löschau, G., and Bastian, S.: Mobility particle size spectrometers: harmonization of technical standards and data structure to facilitate high quality long-term observations of atmospheric particle number size distributions, Atmos. Meas. Tech., 5, 657–685, https://doi.org/10.5194/amt-5-657-2012, 2012.
Yin, Z., Ye, X., Jiang, S., Tao, Y., Shi, Y., Yang, X., and Chen, J.: Size-resolved effective density of urban aerosols in Shanghai, Atmos. Environ., 100, 133–140, https://doi.org/10.1016/j.atmosenv.2014.10.055, 2015.
Yli-Juuti, T., Barsanti, K., Hildebrandt Ruiz, L., Kieloaho, A.-J., Makkonen, U., Petäjä, T., Ruuskanen, T., Kulmala, M., and Riipinen, I.: Model for acid-base chemistry in nanoparticle growth (MABNAG), Atmos. Chem. Phys., 13, 12507–12524, https://doi.org/10.5194/acp-13-12507-2013, 2013.
Zaidan, M. A., Haapasilta, V., Relan, R., Paasonen, P., Kerminen, V.-M., Junninen, H., Kulmala, M., and Foster, A. S.: Exploring non-linear associations between atmospheric new-particle formation and ambient variables: a mutual information approach, Atmos. Chem. Phys., 18, 12699–12714, https://doi.org/10.5194/acp-18-12699-2018, 2018.
Zhang, R., Suh, I., Zhao, J., Zhang, D., Fortner, E. C., Tie, X., Molina, L. T., and Molina, M. J.: Atmospheric new particle formation enhanced by organic acids, Science, 304, 1487–1490, https://doi.org/10.1126/science.1095139, 2004.