the Creative Commons Attribution 4.0 License.
the Creative Commons Attribution 4.0 License.
 | 26 Mar 2026
Understanding the spring cloud onset over the Arctic sea-ice
Hélène Chepfer
Matthew D. Shupe
Hannes Griesche
Using 13 years of space-based lidar cloud observations over the Arctic sea-ice, we show that the low cloud cover increases from 34 % to 71 % between 7 April and 7 May, mainly due to the increase of liquid-containing clouds below 1 km altitude. This study assesses the relative roles of moisture transport from the mid-latitudes and the spring warming driven by the seasonal increase of solar radiation in setting this transition called “spring cloud onset”. We highlight that daily moisture mass advected over the sea-ice in March represents 14 % of the moisture mass already present, exceeding the increase of atmospheric moisture carrying capacity due to the rising temperatures. Consistently, MOSAiC campaign data suggest that moisture is not limiting the spring cloud onset as most of the radiosoundings in spring contained layers saturated with respect to ice (96 %). Instead, we identify a temperature dependency in the ratio of ice to liquid-containing layer occurrence, confirmed by ground-based MOSAiC lidar. While the proportion of ice layers over all atmospheric layers is poorly dependent on temperature below 0 °C, the occurrence of liquid-containing layers increase steeply between −20 and −10 °C. As a result, March lower troposphere temperatures (−20 °C) favor more ice clouds, while May (−13 °C) favors more liquid-containing clouds. Overall, our results suggest that moisture availability is not the limiting factor and that spring warming induced by solar radiation sets the transition toward more liquid-containing low clouds.
- Article
(9510 KB) - Full-text XML
- BibTeX
- EndNote


The melt season of the Arctic sea-ice shows substantial interannual and spatial variability (Smith and Jahn, 2019) and is lengthening due to ongoing warming (Stroeve and Notz, 2018; Markus et al., 2009) both by earlier spring melt onset and later fall refreeze. Studies highlight the role of surface Cloud Radiative Effect (CRE) in initiating the spring melt onset, with significant implications for sea-ice extent and variability during the summer months (Persson, 2012; Cox et al., 2016; Huang et al., 2019; Tjernström et al., 2024). The surface CRE is characterized by a balance between a shortwave cooling effect and a longwave warming effect. Clouds absorb part of the longwave radiation emitted by the sea-ice surface and re-emit it downward, resulting in surface longwave warming relative to clear skies. The LongWave Cloud Radiative Effect (LWCRE) reaches up to 80 W m−2 locally at the surface with spatial and seasonal variability due to specific surface and atmospheric conditions (Lac et al., 2024; Arouf et al., 2022; Sedlar et al., 2011; Intrieri et al., 2002; Dong et al., 2010; Miller et al., 2015; Barrientos-Velasco et al., 2025). Conversely, clouds reflect incoming solar shortwave radiation back to space, leading to surface shortwave cooling. During spring, the surface CRE is dominated by cloud surface longwave warming, as cloud surface shortwave cooling is weak at that time of the year over sea ice (Shupe and Intrieri, 2004; Kay and L'Ecuyer, 2013; Arouf et al., 2024) because incoming solar radiation is half of that in July (Fig. A1) and the surface albedo is still high.
The onset of the Arctic sea-ice melt season occurs around April–May depending on the definition of melt onset (Smith and Jahn, 2019), commonly based either on the first surface temperature threshold crossing or on the first satellite-detected wet snow/liquid water signal from passive microwave observations. It coincides with a seasonal increase in cloud cover, referred to here as the Spring Cloud Onset, that has been observed in ground-based measurements (Sverdrup, 1930; Huschke, 1969; Shupe et al., 2011), satellite observations (Cesana et al., 2012) and simulated by global climate models (Li et al., 2023; Jiang et al., 2024). The increase in cloud cover over sea ice in spring is primarily driven by an increase in low altitude liquid-containing clouds (Cesana et al., 2012). On the one hand, the presence of liquid droplets enhances cloud longwave emissivity (Miller et al., 2015). On the other hand, lower-altitude clouds tend to be warmer than higher-altitude clouds. Both of these processes serve to amplify the downwelling radiative flux at the surface (Arouf et al., 2022). Consequently, the spring increase in low altitude liquid-containing clouds enhances cloud-induced surface radiative warming (L'Ecuyer et al., 2019).
Two broad mechanisms may drive low liquid cloud formation in spring over the Arctic sea ice: changes in large-scale meridional transport of heat and moisture, and changes in temperature associated with the rapid seasonal increase in solar radiation. From the transport perspective, low-level clouds over sea ice form through the condensation of relatively warm and wet air masses transported from the mid-latitudes over the colder Arctic sea ice (Herman and Goody, 1976). Building on that mechanism, a hypothesis is that the spring cloud onset would be connected to an increasing amount of moisture advected over the sea-ice in spring. However, Beesley and Moritz (1999) argue that the poleward moisture transport increases only after the observed cloud onset, potentially challenging the validity of that hypothesis. Modern reanalysis confirms the late timing of the spring poleward moisture flux increase (Naakka et al., 2019), though its connection to the spring cloud onset has not been explored.
Beesley and Moritz (1999) proposed an alternative mechanism in which the spring cloud onset is controlled primarily by the temperature dependence of cloud phase partitioning associated with the Wegener–Bergeron–Findeisen (WBF) process (Wegener, 1926; Bergeron, 1935; Findeisen, 1938). In this framework, the low temperatures prevailing in winter (below °C) favor efficient ice production at the expense of liquid droplets, depleting atmospheric moisture and inhibiting liquid-containing clouds from forming. As spring progresses and the lower troposphere warms, the efficiency of the WBF process decreases, allowing liquid-containing clouds to form more readily and persist. Importantly, the spring warming over sea ice is largely attributable to increasing incoming solar radiation. Estimates of the Arctic energy budget show that moist static energy convergence from the mid-latitudes decreases into spring, while the positive spring tendency of moist static energy stored over the sea-ice aligns with the seasonal increase in solar radiation (Serreze et al., 2007; Mayer et al., 2019; Appendix G). This suggests that the springtime temperature rise relevant for WBF weakening is predominantly forced by solar radiation, rather than driven by increasing large-scale energy transport. Studies have since demonstrated the dependency of cloud phase on temperature across different regions (e.g., Cesana et al., 2016, 2022; Hu et al., 2010; Korolev et al., 2003; Shupe et al., 2006, 2011), primarily in the context of improving the representation of mixed-phase clouds in climate models. However, there remains a need to examine this relationship specifically within the Arctic spring, where rapid temperature changes driven by the transition from polar night to polar day could have a decisive impact on cloud phase partitioning. Aerosol availability can also modulate Arctic cloud phase partitioning, since both liquid droplets and ice crystals form on aerosol particles. Liquid cloud formation depends on the concentration and properties of cloud condensation nuclei (CCN), whereas ice formation in the heterogeneous regime (i.e., for temperatures warmer than °C) depends on ice-nucleating particles (INP) (Eirund et al., 2019; Solomon et al., 2018; Tan et al., 2023). Because long-range transport and surface conditions influence the concentration and type of CCN and INP in the Arctic troposphere (e.g., Creamean et al., 2022; Heutte et al., 2023), aerosol variability represents an additional control on cloud phase over sea ice beyond temperature alone (Filioglou et al., 2019; Shaw et al., 2022). In turn, low-level cloud properties can be influenced by boundary-layer processes (Brooks et al., 2017; Griesche et al., 2021). For example, cloud-top longwave radiative cooling can drive turbulence and mixing in the boundary layer, which sustains low-level Arctic clouds by supplying moisture to the cloud layer (Shupe et al., 2013). With these contrasting perspectives, the mechanisms underlying the spring cloud onset remain an open question, and the two historical hypotheses continue to be cited as plausible explanations (Serreze and Barry, 2014).
A key reason for the remaining question lies in the limitations of available datasets for studying Arctic cloud evolution in spring. Field campaigns such as SHEBA (Uttal et al., 2003) and MOSAiC (Shupe et al., 2022) are restricted in both space and time. These campaigns, while invaluable, offer snapshots that may not fully capture the spatio-temporal variability and trends across the entire Arctic region. The Central Arctic, particularly during spring, is difficult to access due to high sea-ice cover, as noted in the experience of the Art of Melt campaign in 2023 (Tjernström et al., 2024). Passive remote sensing aboard satellites faces reliability issues in the Arctic environment. The combination of solar radiation and extensive ice cover introduces biases in atmospheric observations, leading to potential inaccuracies in data interpretation (Chan and Comiso, 2013). Lastly, models often struggle with the complex physical processes and feedback mechanisms that govern cloud physics in the Arctic (Cesana et al., 2012; Li et al., 2023; Taylor et al., 2019).
Analyzing recent multi-annual cloud observations from satellite active remote sensing offers an improved understanding of the spring cloud onset. Active remote sensing techniques, such as cloud radar and lidar, are valuable tools for cloud detection above both the sea-ice and open water surface in all seasons and offer continuous observation of the whole tropospheric column. However, there are some limitations. The lidar signal can be attenuated by liquid clouds and cloud beyond liquid layers can be missed. Griesche et al. (2024a) showed that if not considered, these limitations can introduce biases in the cloud surface radiative warming of −54 W m−2 locally. The space-based lidar onboard CALIPSO (Winker et al., 2009) provides opportunities to give insights into the Arctic spring cloud onset by examining 13 years of observed cloud profiles over all surface types of the Arctic, at instantaneous high spatial and temporal resolution. By leveraging this extensive dataset, we can reassess the two hypotheses proposed to explain the spring cloud onset.
We first describe (Sect. 2) the different datasets used in this study. In Sect. 3, we present 13 years of space-based observations, analyzing the evolution of cloud properties during the spring cloud onset over Arctic sea ice. We then examine the two main hypotheses proposed to explain this phenomenon: Sects. 4 and 5 explore the mechanism suggested by Herman and Goody (1976), while Sect. 6 investigates the hypothesis put forward by Beesley and Moritz (1999).
2.1 Cloud satellite observations
We used the CALIPSO-GOCCP cloud observation dataset as presented by Chepfer et al. (2010), Cesana and Chepfer (2013) and Guzman et al. (2017) available for 13 years (2008–2020), from 70 to 82° N. Single CALIPSO lidar profiles are available with 480 m vertical resolution and horizontal resolutions of 90 m cross track and 330 m along track. Each profile includes the total ATtenuated Backscatter (ATB), defined as the sum of the components collected in the parallel and cross-polarized directions (). The theoretical attenuated backscatter in clear-sky (ATBmol) is computed based on Collis (1976), where temperature and pressure are from the Goddard Modeling and Assimilation Office (GMAO) atmospheric profiles (Bey et al., 2001). The lidar Scattering Ratio (SR) is computed based on CALIPSO ATB measurements and reflects the contrast between the theoretical backscattered signal in absence of clouds against the actual measured backscattered signal.
Each atmospheric layer within a single profile is classified as a cloudy layer if and SR≥5, otherwise, it is considered clear-sky. Cesana and Chepfer (2013) classified cloudy layers as either liquid layers or ice layers based on the polarization state of the backscattered laser signal from the lidar (). The phase threshold is defined by Cesana and Chepfer (2013) following:
Cloudy layers with ATB⟂ above this threshold are considered ice layers, whereas atmospheric layers with ATB⟂ below the threshold are considered liquid-containing clouds. A remaining category, labeled unclassified phase, encompasses cases where cloudy layers are detected but phase identification as either liquid or ice is not possible. In the Arctic, 86 % of these unclassified layers are found below layers with SR>30, most likely liquid-containing layers (Fig. D1 in Appendix D), which make the depolarization signal too noisy to reliably determine the phase. Given the known vertical structure of Arctic mixed-phase clouds (Morrison et al., 2012), unclassified phase layers are largely attributed to ice layers located below liquid-containing layers (Cesana et al., 2016). We note that, over the Arctic sea-ice, 83 % of profiles with an optically thick layer (SR>30) between 720 and 3200 m are not fully attenuated below that layer, which contributes to the frequent occurrence of unclassified layers near the surface (Fig. 2c). This highlights that the presence of a reflective layer (SR>30) does not necessarily indicate full lidar attenuation, likely explained by Arctic liquid-containing layers being geometrically thin (Shupe et al., 2008).
Using all layers from all profiles for the months March, April and May between 2008 and 2020, above the Arctic sea-ice covered region only, from the surface to 3.2 km altitude, we build two statistics called the atmospheric layer partitioning and the ice phase ratio. (1) The atmospheric layer partitioning is defined as the occurrence of liquid-containing cloud layers (or alternately ice cloud layers, unclassified cloud layers or cloud free layers) divided by the total number of observed layers within 1 °C temperature bins. This parameter informs us on the relative occurrence of cloud free layers, ice cloud layers and liquid cloud layers between the surface and 3.2 km of altitude at each isotherm. (2) The ice phase ratio is defined as the ratio of ice cloud layer occurrences over the sum of ice cloud layer occurrences and liquid cloud layer occurrences, occurring within 1 °C temperature bins (Cesana et al., 2016, 2022). This ratio refers to atmospheric cloudy layers only, contrary to the atmospheric layer partitioning, and informs us on the probability of encountering a specific cloud phase at a specific temperature. Note that this statistical perspective on single lidar profiles differs from previous studies using CALIPSO-GOCCP monthly gridded data (Cesana et al., 2022) or cloud water content ratio (Raillard et al., 2024). We assess sensitivity to CALIPSO-GOCCP phase classification by also computing the ice phase ratio considering unclassified layers as ice layers.
To assess these relationships between atmospheric layers and temperature, we use temperature data that are both spatially and temporally collocated with CALIPSO-GOCCP cloud observations. For a given CALIPSO orbit dataset, we select the closest hour to the orbit time from the ERA5 hourly gridded dataset. We then select ERA5 0.25° × 0.25° pixels that are the closest to the orbit track. Thus, we can attribute to each liquid/ice detection a value of temperature. In addition, because CALIPSO is known to oversample high-latitudes due to its near-polar orbit, we ensure that all 1° latitude bands contribute equally when computing the ice phase ratio and the atmospheric-layer partitioning. First, we computed the total number of profiles available in each 1° latitude bands over the Beaufort sea-ice for the period 2008 and 2020. Then, for each orbits and for each 1° latitude bands, we randomly selected a percentage of the available profiles corresponding to the ratio between the number of profiles at 70° N and the number of profiles at the 1° latitude band considered.
Statistics on the lidar SR are aggregated for each day into altitude-intensity histograms (SR histograms) (Chepfer et al., 2010) over the 13 years of observations and provided through daily gridded data with resolution of 2° × 2° (see Fig. 3). In this study, only data above the Arctic sea-ice are used and we normalize each daily SR histogram by the total number of occurrences in the window we are considering, i.e. SR between 3 and 100 000 and altitude between 0 and 3.2 km, which gives the SR frequency histograms. We identified two important sub-categories in the SR frequency histograms (illustrated in Fig. 3): the low-level thick liquid-containing category (SR>30 and altitude<1 km) and the probable thin ice category ( and altitude<3.2 km). The 1st category, identified from visual inspection of the SR-altitude histograms, is used to emphasize the increase in low-level cloud optical thickness that characterizes the spring cloud onset. It includes reflective layers that, in over 85 % of instances, contain liquid droplets (Fig. D1). However, it does not include all liquid-containing layers considered to compute the liquid-containing cloud fraction (34 %) from CALIPSO-GOCCP (Fig. 2b) as some liquid-containing layers are optically thinner than SR>30. The 2nd category is introduced to highlight the frequent occurrence of layers of thin ice particles within this SR range that fall below the standard CALIPSO-GOCCP cloud detection threshold and are therefore not included in the CALIPSO-GOCCP ice-cloud fraction (Lacour et al., 2017; see Sect. 2.2).
We use the low cloud cover daily gridded dataset at a 2° × 2° resolution (Chepfer et al., 2010) to characterize the spring cloud onset, as done previously to characterize the Arctic cloud seasonality (Li et al., 2023). In each grid box, the low cloud cover is calculated as the ratio of the number of profiles where cloudy layers were detected below 3.2 km above sea level to the total number of valid profiles within that grid box (see Fig. 1). We use liquid, ice and unclassified cloud fraction profiles from the daily gridded dataset at the resolution 2° × 2°. For the gridded data, within each latitude-longitude grid box, the liquid-containing (ice or unclassified) cloud fraction profile is defined as the sum of liquid cloud detections (ice or unclassified) at each altitude level, divided by the number of valid values at that altitude level (see Fig. 2). CALIPSO-GOCCP datasets have been intercompared with multiple pre-existing cloud datasets, demonstrating robust consistency across products (Chepfer et al., 2010; Cesana and Chepfer, 2013).
Figure 1(top panel) Low cloud cover over the Arctic sea-ice covered region between March and May. Each thin blue line is the low cloud cover evolution at each single latitude-longitude pixel averaged over 13 years. The thicker blue line represents the median low cloud cover evolution. (bottom panel) Low cloud cover maps averaged over the first 2 weeks of March (bottom left), the last 2 weeks of April (bottom center) and the last 2 weeks of May (bottom right). Data are from CALIPSO-GOCCP 2° × 2° daily gridded dataset between 2008 and 2020. See Appendix H for additional information on CALIPSO spatial sampling.
Figure 2Daily profiles of (a) liquid-containing cloud fraction, (b) ice cloud fraction and (c) unclassified cloud fraction all over the Arctic ice-covered region for 13 years (2008–2020). White contours are air temperature seasonality built from the ERA5 hourly gridded dataset over the Arctic sea-ice covered region. Colorbars are from 0 % to 40 % for the liquid-containing and unclassified cloud fraction profiles, 0 % to 10 % for the ice cloud fraction profiles. Data are from CALIPSO-GOCCP daily gridded dataset.
2.2 Ground-based observations from the MOSAiC campaign
Opportunities to obtain in-situ measurements of temperature, relative humidity (RH) with respect to (w.r.t) liquid, and clouds over the Arctic sea-ice are limited. However, the Multidisciplinary drifting Observatory for the Study of Arctic Climate (MOSAiC) campaign (Shupe et al., 2022), provides valuable observations for this purpose. We use data for the spring period from 1 March 2020 to 15 May 2020, as the observational site was not drifting with the sea-ice later than the 15 May.
Lidar observations were performed continuously during the MOSAiC expedition by means of a multiwavelength polarization Raman lidar PollyXT (Engelmann et al., 2023; Griesche et al., 2024b). These measurements can give information on clouds and aerosol particles up to roughly 20 km height (e.g., Ohneiser et al., 2021) with a vertical resolution of 7.4 m and temporal resolution of 30 s. Two altitude-range lidar channels are available: a near-range channel optimized for the lowest altitudes with an overlap height at 0.12 km and a far-range channel optimized for the free troposphere with a complete overlap at ∼0.7 km (Engelmann et al., 2016). The “overlap height”, set by the receiver optic configuration, designates the range above which the receiver fully intercepts the backscattered signal and therefore at which the backscattered signal can be analyzed without additional geometric overlap corrections. In this study, we use the far-range channel only, because cross-polarized measurements needed for cloud-phase classification are not available for the near-range channel. Moreover, all lidar profiles affected by blowing snow or by snowfall accumulating on the lidar window were excluded from the analysis using the operational issues record from the campaign (https://doi.org/10.5281/zenodo.7310857, Griesche and Seifert, 2025). Since the ground-based lidar from MOSAiC operates at the same wavelength (532 nm) as the space-based lidar onboard CALIPSO, we applied the same methodology to the MOSAiC lidar as used in the CALIPSO-GOCCP algorithm (Sect. 2.1). Thus, we build a similar dataset of MOSAiC lidar cloud detection and cloud phase diagnosis above the central Arctic sea-ice.
One key difference between the two lidar products is their vertical resolution: 480 m for CALIPSO-GOCCP and 7.4 m for the ground-based lidar. Since the lidar scattering ratio is sensitive to the sampled volume, we conducted a sensitivity study to assess the impact of vertical resolution on the ground-based lidar observations. By degrading the resolution from 7.4 to 480 m, we found that the overall results presented in Fig. 7 remain unaffected (Fig. B1 in Appendix B). While both liquid cloud layer and ice cloud layer detections decreased at the coarser resolution, the ratio between the two remained similar.
In CALIPSO-GOCCP, atmospheric layers with scattering ratio higher than 5 are classified as cloudy. However, CALIPSO-GOCCP is known to miss thin ice clouds in the polar regions (Lacour et al., 2017) due to the SR>5 threshold. Using the less noisy ground-based lidar measurements and looking at the sensitivity of cloud detection to the SR threshold, we highlight frequent ice particles detected within the SR range 3 to 5 (Fig. C1 in Appendix C). This insight reinforces the idea that probable thin ice layers are also seen by the space-based lidar in SR histograms for the SR range 3 to 5.
Additionally, radiosonde measurements of temperature and relative humidity (RH) w.r.t liquid water were collected at least four times daily (at 04:00 a.m., 12:00 p.m., 06:00 p.m., and 12:00 a.m. UTC) during MOSAiC (Maturilli et al., 2022). The radiosonde profiles are re-averaged onto fixed 5 m altitude bins to allow consistent vertical scale across the soundings. From these measurements we compute both specific humidity and RH w.r.t ice. Thus we can estimate if each measurement at each altitude is: fully unsaturated, saturated w.r.t ice but not liquid, or saturated w.r.t liquid. Past studies have used a threshold of 96 % to identify saturation w.r.t liquid, based on radiosonde measurement uncertainties (e.g., Silber and Shupe, 2022). Continuous profiles of humidity products such as RH and water vapor mixing ration can also be derived from the PollyXT lidar (Seidel et al., 2025). However, these products are only available during nighttime conditions and are therefore not considered here.
To investigate the temperature dependence of the ice phase ratio as defined in Sect. 2.1 but for the MOSAiC lidar, we need temperature data that are both vertically and temporally collocated with cloud observations. Each MOSAiC lidar profile is matched to the closest radiosonde measurement in time, and both datasets are interpolated onto the same vertical grid, resulting in a slight degradation of the radiosonde vertical resolution (from ±5 to ±7.4 m). While the temporal resolution of the radiosoundings is not as high as desired, we prioritize their use over the ERA5 hourly dataset due to their greater reliability in providing temperature.
2.3 Temperature and specific humidity
To understand low cloud formation over the Arctic sea-ice, we need insights on the vertical thermodynamic structure, ie the specific humidity and the temperature. Although reanalyses are known to have biases in the Arctic (Herrmannsdörfer et al., 2023), they remain the only viable option due to the lack of observational datasets that cover the entire Arctic on the spatial and temporal scales required for the whole studied period between 2008 and 2020. We used the hourly gridded ERA5 product at a resolution of 0.25°×0.25° (Hersbach et al., 2020) over 137 pressure levels for temperature, specific humidity and meridional wind. These reanalyses provide data at a scale consistent with the CALIPSO dataset, covering the entire Arctic over a 13 year period. To address the potential biases in this reanalysis dataset specifically above the Arctic sea-ice, we compared it with data from the MOSAiC radiosondes. For a given radiosounding, we select the closest ERA5 latitude/longitude pixel at the closest hour to the radiosonde launch. MOSAiC radiosoundings are then vertically averaged between each level of ERA5 vertical pressure levels. ERA5 temperature and specific humidity show good performance above the Arctic sea-ice. We estimate a temperature bias against MOSAiC measurements of 0.21 ± 0.96 °C and a specific humidity bias of −0.03 ± 0.12 g kg−1 below 2 km altitude, with most of the bias located close to the surface, between 1 March 2020 and 15 May 2020. Overall, the ERA5 lower troposphere seems too dry and too warm, and although biases are not large, this results in 85 % of saturation w.r.t liquid misclassified by ERA5 compared to MOSAiC (Fig. E1 in Appendix E), instead assigning them to either not saturated or saturated w.r.t ice only.
These results were obtained although the MOSAiC radiosondes were assimilated into operational models, and thus it is expected that ERA5 performs better in this comparison with MOSAiC than it would at other locations and times.
2.4 Isolating observations over the Arctic sea-ice
Cloud fraction profiles exhibit distinct characteristics over sea ice and open water (Barton and Veron, 2012; Taylor and Monroe, 2023; Kay and Gettelman, 2009; Morrison et al., 2018). In this study, we exclude all observations or reanalysis data that are not above the sea-ice on a daily basis. The extent of sea ice ranges from about 15×106 km2 in March to approximately 12×106 km2 in May in 2020 (Francis and Wu, 2020), with average drift speed of 8 km d−1 (Olason and Notz, 2014). To capture this variability, we used the NSIDC sea ice concentration provided as a 2° × 2° daily gridded product. This product indicates the percentage of each pixel covered by sea ice (Peng et al., 2013) and was already collocated and integrated to CALIPSO-GOCCP v3.1.2. For each day, we define the Arctic sea-ice covered region as the area north of 70° where CALIPSO overpasses and where individual lidar profiles are above sea-ice concentration higher than 95 %. This region dynamically changes over the months and years, reflecting the natural variability of sea ice. In the rest of the paper, we only consider atmospheric data over the Arctic sea-ice covered region.
3.1 Evolution of the low cloud cover
The seasonal variation in low cloud cover is notable (Fig. 1), with March featuring a relatively small median low cloud cover of about 34 %. This contrasts with May, where the low cloud cover increases significantly to approximately 71 %. Around 7 April, an abrupt transition starts in low cloud cover. The transition takes approximately 4 weeks, until 7 May, resulting in an increase of 37 % in median low cloud cover over that period.
From the multiple thin blue lines plotted in Fig. 1, we observe that the majority of the Arctic sea-ice covered region experiences some version of this spring cloud onset. This spatial consistency is illustrated by the relative homogeneity of the mean low cloud cover maps presented in Fig. 1. Through the month of March it is rare for the low cloud cover to exceed 50 % at any location. Within April, nearly every latitude/longitude pixel shows a marked increase in low cloud cover to values typically larger than 50 %. However, 8 % of locations remain exceptions, where low cloud cover stays below 50 % during May despite being within the sea-ice covered region. Most of these outliers are located in the Canadian Archipelago, a finding consistent with several studies at Eureka, an Arctic site in the Canadian Archipelago, showing that this region exhibits distinct cloud seasonality compared to other Arctic locations (Shupe et al., 2011; Blanchard et al., 2014). While both hypotheses for the spring cloud onset, from Herman and Goody (1976) and Beesley and Moritz (1999), suggest that its timing might depend on latitude, due to the moisture flux being larger close to the ice edge and the latitudinal variation in incoming solar radiation, we do not observe a clear latitude-dependent trend. Regarding solar radiation, it is important to note that from 15 April to 15 May, the Arctic region receives approximately latitudinally uniform daily incoming solar radiation from 70 to 82° N (Fig. A1).
3.2 Evolution of the cloud phase profiles
Throughout the entire period, clouds over the Arctic sea-ice-covered region are largely dominated by liquid containing clouds in layers below 2 km altitude (Fig. 2). On average between March and May below 2 km a.s.l., liquid-containing cloud fractions are around 16 %, ice cloud fractions are around 3 % and uncertain cloud fractions are around 1 %, meaning that 80 % of existing clouds contain liquid water. The spring cloud onset is primarily evident in the liquid-containing fraction, increasing from 9.5 % to 25 % between 7 April and 7 May below 1 km altitude. Close to the surface (Fig. 3), the low-level thick liquid-containing (SR>30) category shows a sharp increase in relative frequency from March to May, rising from 6.0 % total occurrence in the first 2 weeks of April to 10.5 % in the last 2 weeks of April and reaching 14.9 % in the first 2 weeks of May.
Figure 3(top panels) Sum of all daily SR histograms over 2 weeks period between March and May from 2008 to 2020 normalized by the total number of occurrences over the period from 0 to 3.2 km altitude and SR 3 to 10 000. Whites boxes correspond to the categories called on bottom panel. (bottom panel) Evolution of the occurrence frequency of two categories: (green) probable thin ice category and (dark blue) low-level thick liquid-containing category over the Arctic sea-ice covered region between March and May. Data from CALIPSO-GOCCP daily gridded dataset between 2008 and 2020.
Low-level ice clouds exist throughout spring (4.3 %), showing minimal variation of occurrence (Fig. 2b). Their occurrence is lowest within the temperature inversion, likely because liquid-containing clouds are frequent at these altitudes, and ice crystals produced near cloud top rapidly sediment out below the inversion (Morrison et al., 2012). Ice fraction values are 6 % lower than previous ground-based measurements above sea-ice (Shupe et al., 2011). This difference is partly due to two forms of ice-related detections not counted in the CALIPSO-GOCCP ice-cloud fraction (Fig. 2b): (1) the probable thin ice () category is frequent across the period from March to May (21 % of the total occurrence). Figure 3 highlights a relative decrease in probable thin ice from the beginning of the spring cloud onset until late-May, going from 27.0 % to 18.5 % of the total occurrences. (2) Unclassified clouds, likely ice sublayers within Arctic mixed-phase cloud structures, are frequently observed especially in May near the surface (18 % unclassified cloud fraction at 280 m). While considering these three elements, the ice cloud fraction, the probable thin ice category and the unclassified cloud phase fraction, it indicates that atmospheric ice particles are ubiquitous in Spring over sea-ice, without specific increasing occurrence between March and May.
As demonstrated in Fig. 1, the mean evolution of low cloud cover (summarized in Fig. 4a) shows an increase of +37 % between early April and early May, marking the spring cloud onset. This increase suggests the need of a significant moisture source to (i) maintain “close to saturation” conditions while the Arctic atmosphere can contain an increasing amount of water vapor as spring temperatures rise and (ii) support the formation of more frequent liquid-containing layers.
During early spring, cold and dry conditions over sea ice limit the total atmospheric water vapor, which totals only 2.1×10¹³ kg in March and 2.9×10¹³ kg in April within the region outlined in Fig. 4. Moisture advected over the Arctic sea-ice (Fig. 4c) does not demonstrate an obvious seasonal increase related to the timing of the spring cloud onset, consistent with Naakka et al. (2019) and Walsh et al. (1994), and the daily advected moisture mass is estimated at around 0.3×10¹³ kg in March and 0.32×10¹³ kg in April. Therefore, on a daily basis, a mass that represents 14 % in March and 11 % in April of the total atmospheric water vapor present above the sea ice is advected into that domain. We investigated the sensitivity of present results on the convergence moisture flux by considering segment of the contour (Fig. J1 in Appendix J): the Atlantic sector, the Pacific Sector, the Canadian archipelago sector and the Siberian sector. Although the Pacific sector highlights an increase in May and the Atlantic sector highlights a decrease of that poleward moisture flux, none of the sector highlights an increase in early April. Overall, we do not see an increase of the moisture transport. either in relative or absolute terms, that would affect the timing of the spring cloud onset, but it is likely that the amount of moisture transported is enough to support “close to saturation” state from March to May over sea-ice. Moreover, since the convergence moisture flux is approximately constant over time (Fig. 4c) but the moisture carrying capacity of the atmosphere increases with seasonal warming (Fig. 4b), this suggests that there could be less excess moisture available to support a “close to saturation” state in April relative to March. This implies that another process likely inhibits the development of optically thick clouds in March, despite sufficient moisture supply.
Figure 4Evolution of (a) the low cloud cover over the Arctic sea-ice covered region between March and May, (b) the total atmospheric water vapor mass and (c) the convergence moisture flux as defined by Groves and Francis (2002), within the contour shown in the upper right panel. The contour is similar to the one used in Walsh et al. (1994) and captures most of the Arctic sea-ice extent in spring. Local surface moisture sources are not considered here, as they are expected to contribute weakly to the overall Arctic moisture budget (Walter et al., 1995; Serreze et al., 2007). Blue lines are the mean evolution between 2008 and 2020 (as in Fig. 1) and each thin blue line is the evolution of a single year. Black lines are for the case study of 2015.
To examine the relationship between the convergence moisture flux and the low cloud cover over the Arctic sea-ice, we examine two events from 2015, one strong Arctic moisture intrusion before the spring cloud onset and one moisture depletion event during the spring cloud onset. During 2015, early March experiences a convergence moisture flux anomaly of kg d−1 (+80 % relative to the long-term mean on 5 March). Looking at synoptic maps and specific humidity maps (Fig. F1 in Appendix F), we assess that cyclonic conditions east of Greenland cause a strong moisture intrusion over the North Atlantic that reaches the Laptev Sea on 10 March. The increase of low cloud cover (50 % instead of the long-term mean of 35 % on 7 March) is localized at the site of the moisture intrusion, therefore the increase is not homogeneous over the Arctic sea-ice covered region. Once the moisture intrusion is passed, the low cloud cover goes back to near average values around 30 % on 18 March. Later in the middle of the spring cloud onset, around 25 April, a blocking event, characterized by a high-pressure system centered north of Greenland and spread across much of the central Arctic prevents more moisture from advecting into the Central Arctic, also visible in the small decrease of total water vapor a week later (Fig. F2). Following a small drop in low cloud cover on 20 April, the blocking period is otherwise marked by a sustained increase of low cloud cover, rising from 45 % on 18 April to 80 % by 1 May. Despite these two moisture transport events that serve to counteract the transition, the spring cloud onset is still observed in 2015, with low cloud cover increasing from 35 % in March (+1 % above the long-term monthly mean evolution) to 74 % in May (+3 % above the long-term monthly mean evolution). However, during this year the timing of the spring cloud onset is shifted a week earlier as it occurs between 1 April and 1 May.
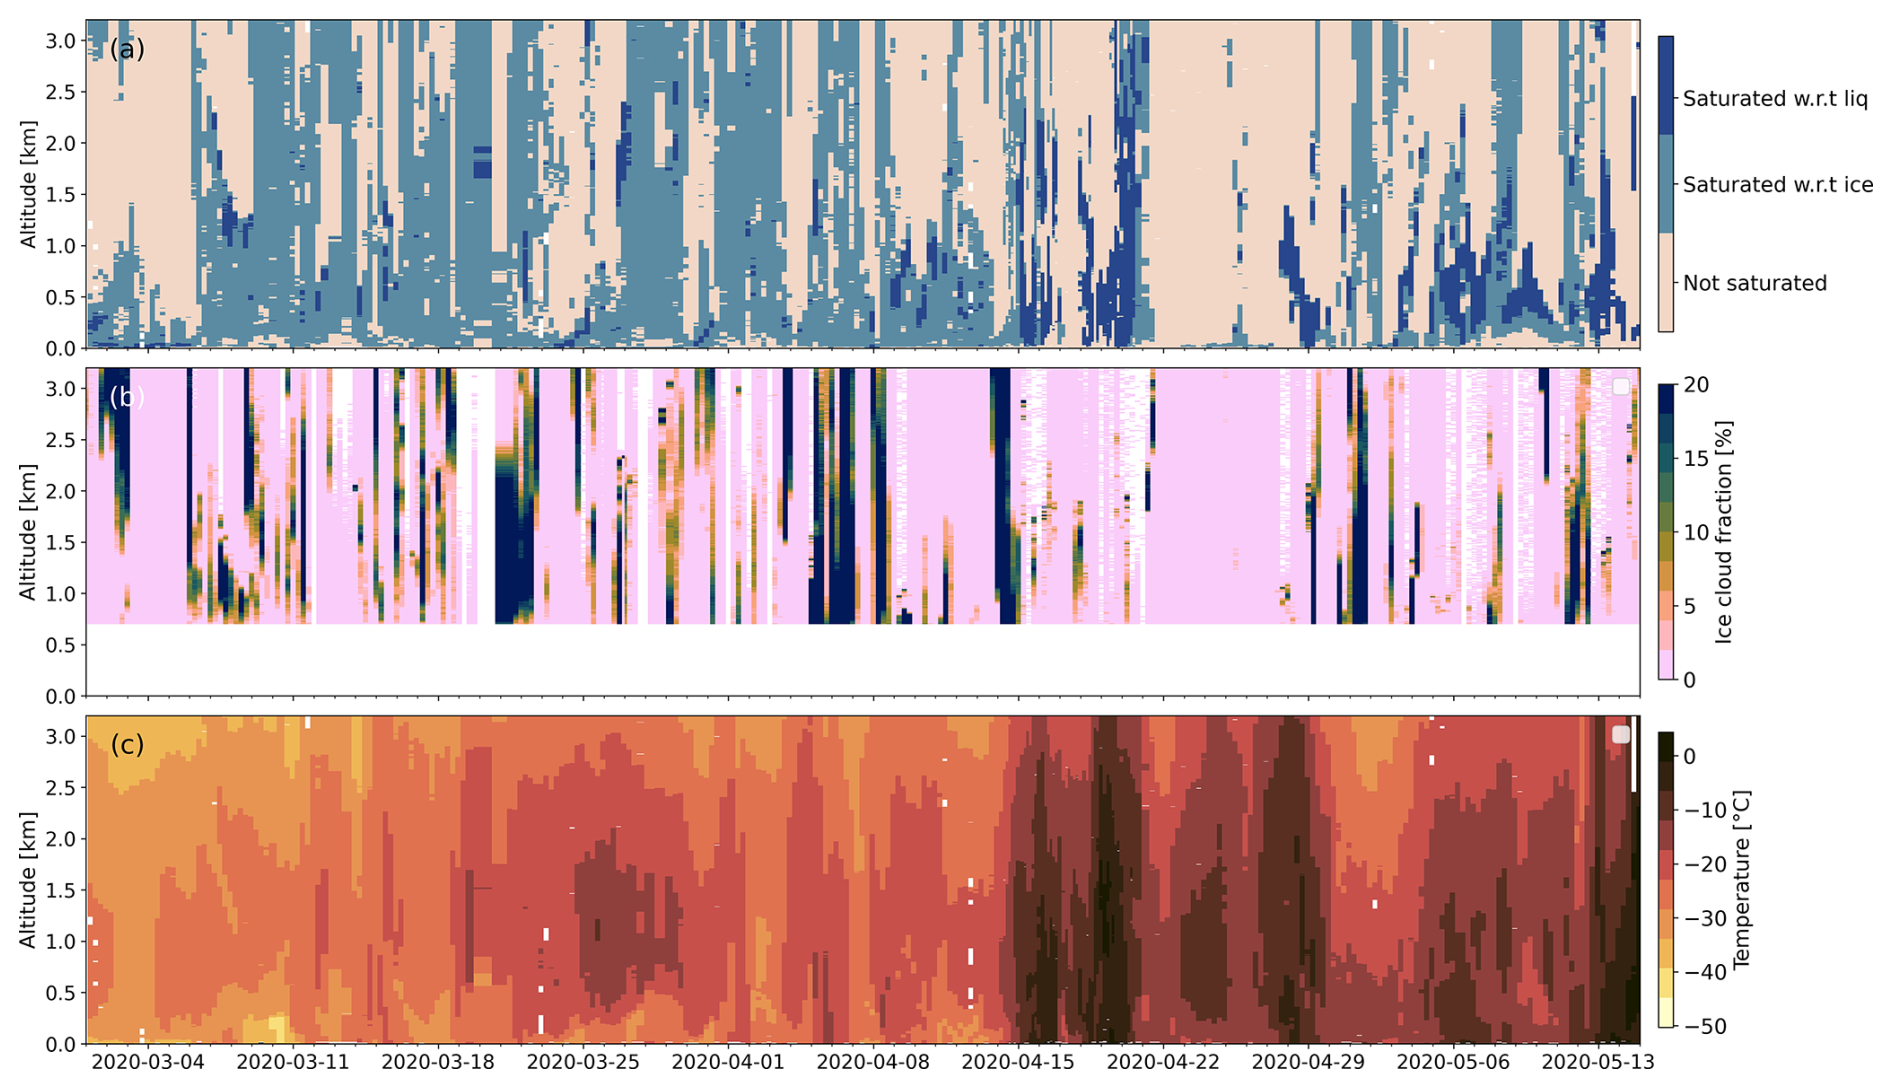
Figure 5MOSAiC campaign time series of (a) water vapor saturation state (beige = non saturated, light blue = saturated w.r.t ice, and dark blue = saturated w.r.t liquid), RH w.r.t to ice is retrieved from MOSAiC temperature and RH w.r.t liquid measurements based on radiosonde profiles, (b) ice cloud fraction profiles from the MOSAiC ground-based lidar observations where the ice cloud fraction at each altitude bin is computed as the number of ice detections (using SR>3) divided by the total number of valid measurements at the same altitude bin over 6 h. (c) Temperature measurements from MOSAiC radiosoundings.
The MOSAiC humidity observations from radiosondes highlight quasi permanent saturation w.r.t ice (Fig. 5a) between March and mid-May, with 96 % of profiles containing at least one level that is saturated w.r.t ice above 700 m altitude, which is consistent with past observations (Andreas et al., 2002). Independent cloud observations made by the ground-based lidar during MOSAiC (Fig. 5b) confirm that ice particles are frequently observed. Using a threshold for cloud detection of SR>3, atmospheric ice layers are observed in 31 % of the lidar profiles, and 94 % of the days see at least one ice detection over the day, highlighting their highly frequent existence in the atmosphere. Although ice saturation is not a sufficient condition for ice formation, which in the heterogeneous regime additionally depends on the availability of INPs, we observe that a large proportion of saturation w.r.t ice occurrence coincide with ice detections from the lidar (60 %). Overall, Fig. 5 shows that the cloud ice detection from the ground-based lidar observations agrees well with the saturation w.r.t ice from the radiosonde profiles. The figure highlights also that, during MOSAiC, there was almost always enough moisture to favor ice particle formation somewhere in the lowest 3.2 km of the atmosphere, with the exception of a one-week period around 25 April when the atmosphere was particularly dry and cloud free.
Examining the thermodynamic conditions, periods with saturation w.r.t liquid were observed to closely align with warmer temperatures. Figure 5a mainly highlights saturation w.r.t liquid after 15 April (85 % of the occurrences of saturation w.r.t liquid), after which time the 800 m temperatures remained around −10 ± 5 °C until mid-May (Fig. 5c). The increase of temperature on 15 April is well documented (Shupe et al., 2022; Kirbus et al., 2023) and is linked to an important moisture intrusion from the mid-latitudes and a general shift in circulation patterns. Figure 5a shows that the atmosphere prior to that event is already often saturated w.r.t ice, and the apparent efficiency of ice processes and colder temperatures during this period may have limited the occurrence of saturation w.r.t liquid. The main occurrences of saturation w.r.t liquid during this period were in late-March, when temperatures periodically increased to −10 °C at 1 km altitude (Fig. 5c).
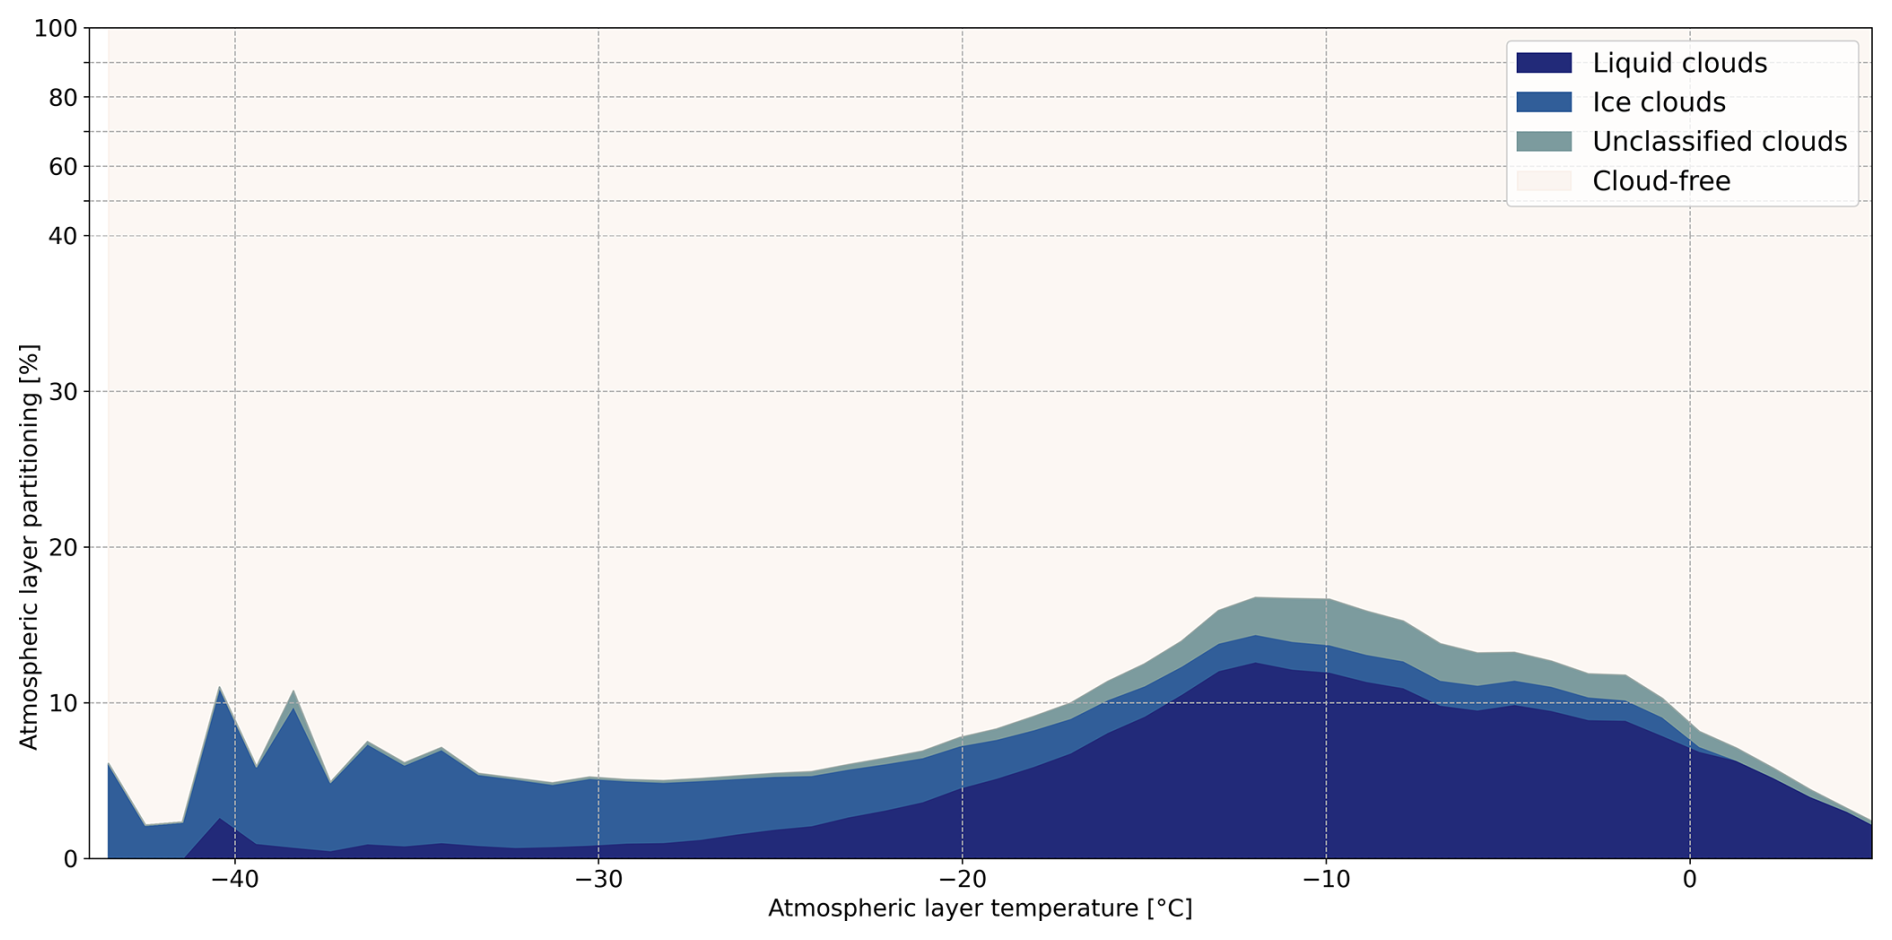
Figure 6Atmospheric layer partitioning (liquid clouds, ice clouds, unclassified phase clouds and cloud-free) as a function of atmospheric layer temperature, over the Arctic sea-ice covered region below 3.2 km altitude.
Figure 6 demonstrates that while only 2 % of atmospheric layers below 3.2 km contain liquid at −25 °C, liquid-containing clouds occur in 12 % of atmospheric layers at −13 °C. This steep increase of the liquid-containing cloud percentage occurs from about −25 °C to about −13 °C, with a small decrease in liquid-containing cloud occurrence at warmer temperatures. Liquid-containing clouds become more frequent than ice-only clouds at about −20 °C. This result is similar to, but slightly colder than past in-situ and ground-based observations of Arctic clouds showing that clouds containing liquid water become more prevalent than those that do not at temperatures above −15 °C. (Boudala et al., 2004; McFarquhar et al., 2007; Shupe et al., 2011). Considering unclassified clouds as ice clouds (Cesana et al., 2016), the sum of ice cloud and unclassified cloud frequencies is almost independent of the temperature, 4 % at −30 °C, 3 % at −20 °C and 5 % at −10 °C. We further observe the increased frequency of unclassified cloud layers to be larger than ice cloud layers around −10 °C (3 % unclassified layers against 2 % ice at −10 °C), which might be a signature of more mixed-phase clouds.
Within clouds, observations from the MOSAiC lidar and from CALIPSO-GOCCP over the Arctic sea-ice covered region agree that three distinct temperature regimes exist for the ice phase ratio (Fig. 7a). First, there is a plateau between −42 to −30 °C with the dominance of ice clouds (ice phase ratio >90 %). Then, a transition occurs between −30 and −13 °C where the ice phase ratio decreases steeply from ∼90 % to ∼20 %. The last temperature regime ranges from −13 to 0 °C, and is dominated by liquid-containing clouds with a ice phase ratio <20 %.
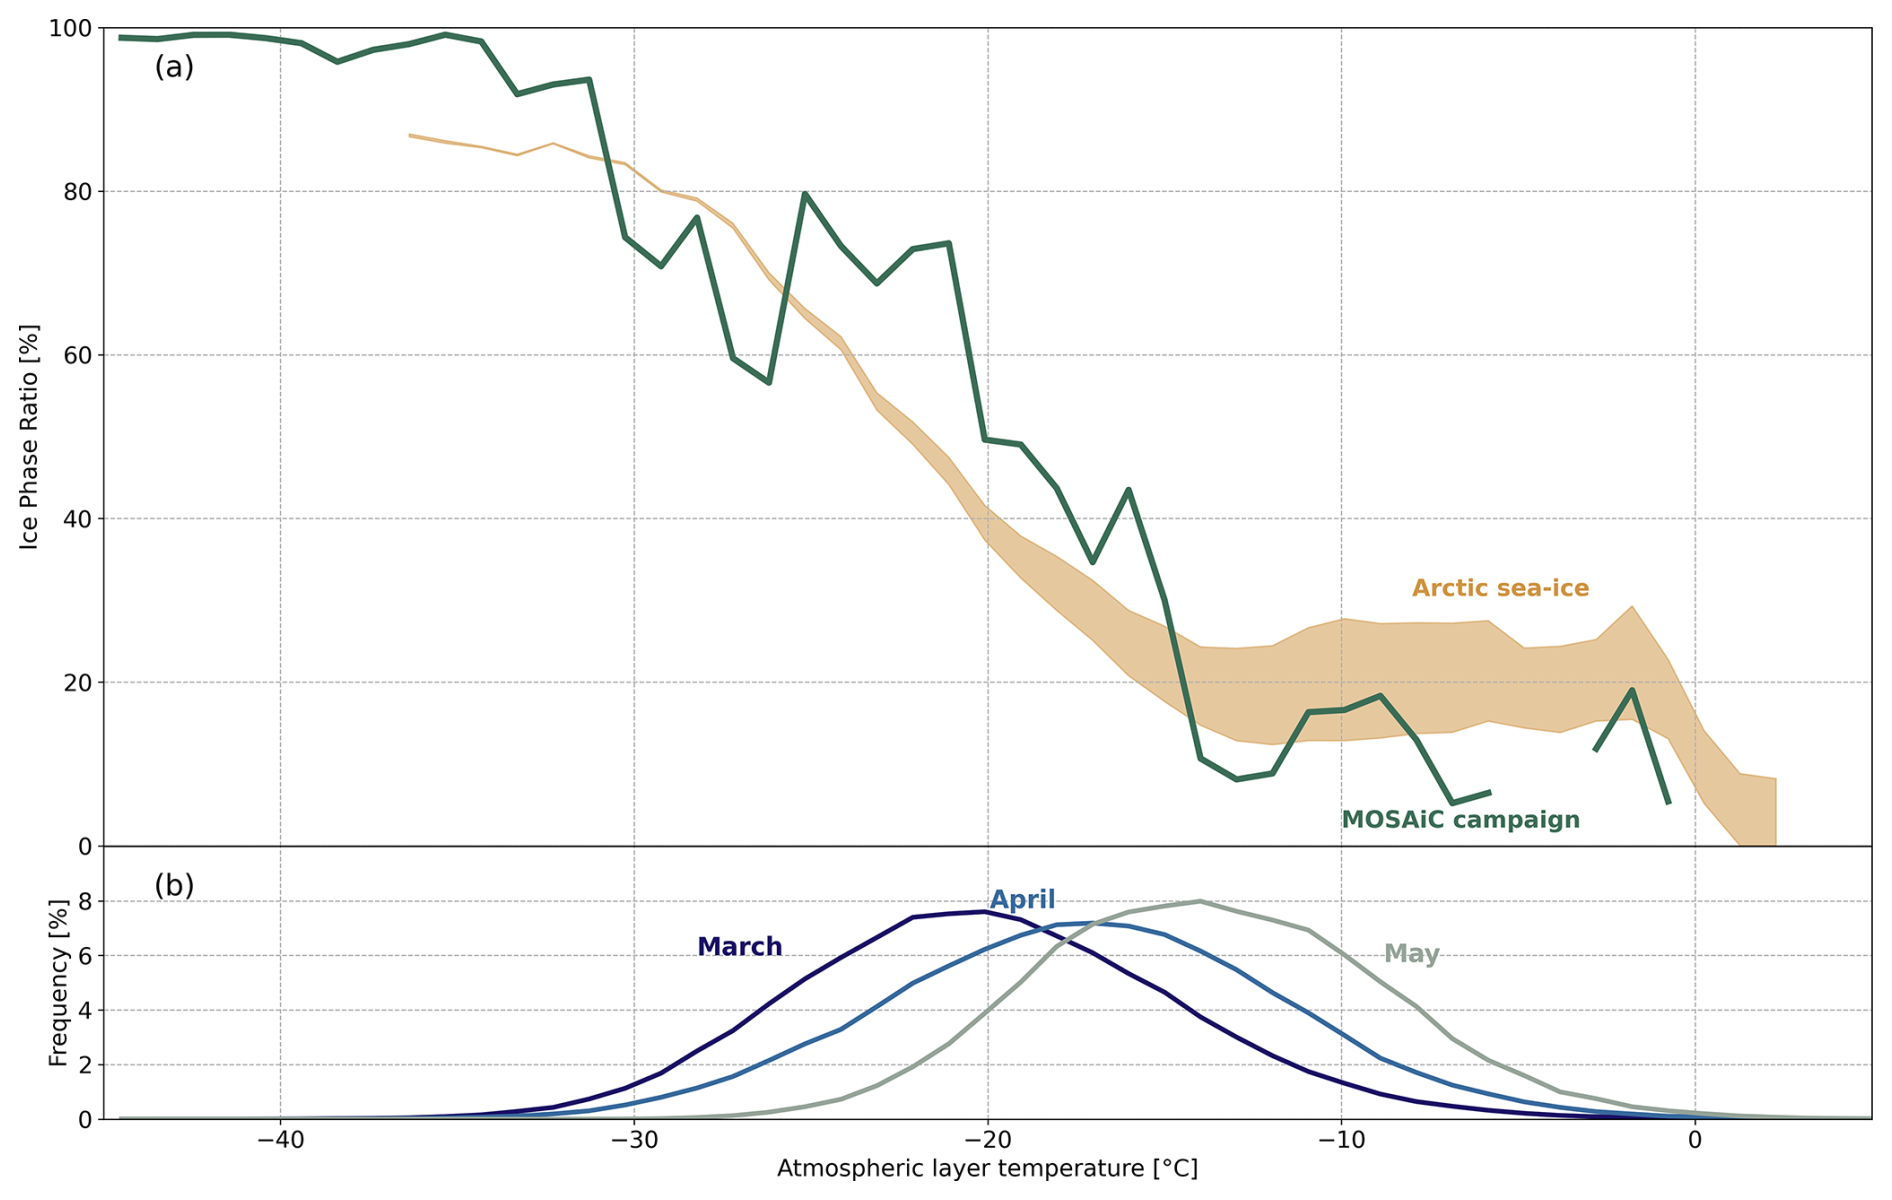
Figure 7(a) Ice phase ratio within clouds as a function of atmospheric layer temperature above the Arctic sea-ice covered region (below 3.2 km of altitude) for the 13 years of CALIPSO-GOCCP (orange) and from the MOSAiC observations (green). The shaded envelope accounts for uncertainty by considering unclassified phase clouds either as ice clouds (upper bound) or excluding them from the ice clouds category (lower bound). The same phase detection methodology is applied to both ground-based and space-based lidar observations. (b) Probability density functions of atmospheric layer temperatures below 3.2 km altitude for the months of March, April and May over the Arctic sea-ice covered region for the 13 years studied.
Despite the general agreement between each observational system, the MOSAiC lidar sees the icy plateau at a higher ice phase ratio than CALIPSO (∼100 % against 90 %), the liquid plateau at a lower ice phase ratio (10 % against 20 %) and a shape of the transition between the two plateaus that is slightly different, mainly due to irregularities in the MOSAiC curve.
Figure 7b shows the temperature distributions of all atmospheric layers below 3.2 km including clear-sky layers, contrary to Fig. 7a which was for cloudy layers only. Figure 7b highlights an increase of atmospheric layer temperature from −19.7 ± 5.7 °C in March to −13.2 ± 5.1 °C in May. This shift in temperature range coincides with a decrease of the ice phase ratio (Fig. 7a), from generally ice-cloud dominated to liquid-containing cloud dominated in May. We recall that this change in ice phase ratio is mainly due to the steep increase of liquid relative frequency between −20 and −10 °C, while the ice occurrence is poorly dependent on temperature between −40 to 0 °C (Fig. 6)
This study shows the seasonal increase of low clouds over the Arctic sea-ice between March and May as seen by 13 years of space-based lidar observations and examines mechanisms leading to this increase. Over most of the Arctic, Fig. 1 shows that the low cloud cover increases from 34 % to 71 % between the first half of April and the first half of May, without strong regional patterns. In particular, the spring cloud onset does not show earlier timing or stronger amplitude when looking at the edge of the sea-ice. This seasonal increase is strongly connected to the increase of liquid-containing optically thick clouds below 1 km altitude (Figs. 2 and 3). However, ice particles are ubiquitous in spring close to the surface either in the form of thin ice particle layers or within Arctic mixed-phase clouds later in May. Figure 4 shows that no clear temporal correlation exists between the spring cloud onset and the seasonal increase of convergence moisture flux above the sea-ice, although individual moisture intrusions from lower latitudes and Arctic atmospheric blockings do appear to influence the low cloud cover over the Arctic sea-ice covered region (Fig. 4). Furthermore, we assess that the magnitude of the moisture flux entering over the Arctic sea-ice in March and April (around 3.1×10¹² kg d−1) is likely sufficient to support a continuous “close to saturation” state over the period by supplying the additional water vapor needed as rising temperatures increase the atmosphere's capacity to hold moisture during this period. The daily advected moisture mass corresponds to 11 % to 14 % of the total water vapor mass over the sea-ice, supporting both the maintenance of near-saturation and the seasonal increase in atmospheric water vapor. In addition, MOSAiC in-situ measurements (Fig. 5) show that 95 % of atmospheric soundings contain layers that are at least saturated with respect to ice, while the ground-based lidar detects atmospheric ice particles below 3.2 km in 94 % of observed days between March and May 2020. These results suggest that water vapor transport is not a limiting factor for the spring cloud onset and that early spring ice cloud production processes, especially at temperatures below −15 °C, might deplete atmospheric moisture and hinder liquid-containing cloud formation. A broader statistical analysis of space-based and ground-based lidar data presented in Figs. 6 and 7 reinforces the temperature dependency of cloud phase. Figure 6 shows the steep increase in liquid-containing layers between −20 and −10 °C while ice particles are observed at all temperatures below 0 °C. Examining the phase ratio within clouds, this rapid increase of liquid-containing cloud occurrences indicates the predominance of liquid-containing clouds over ice-only clouds for temperatures between −15 to 0 °C. As ice is present at all temperatures and liquid is infrequent below −20 °C, the phase ratio within clouds highlights the dominance of ice clouds over liquid-containing clouds for temperatures lower than −20 °C. Additionally, we show that the seasonal variation of lower troposphere temperatures between March and May is consistent with a transition from ice dominant clouds to liquid dominant clouds. The difference of temperature in the lower troposphere between March and May is great enough that March temperatures statistically favor more ice production at the expense of liquid droplets and May temperatures allow for relatively more liquid droplet formation. Considering all these points, it appears that the increase of cloudiness around mid-April across the Arctic sea-ice region is connected to the seasonal increase of temperature, which modifies the balance of cloud phase occurrence, with cloud formation supported by large but steady moisture advection from the mid-latitudes. The predominantly solar radiation origin of the spring warming further reduces the role of atmospheric meridional transport in controlling the spring cloud onset (Appendix G). Overall, this study supports the hypothesis that the spring cloud onset is primarily set by solar radiation constraints, with atmospheric transport mainly modulating day-to-day and interannual variability (See Figs. 4 and I1 in Appendix I).
Three elements following our analysis should be noted. First, this study establishes a hierarchy of mechanisms. The spring warming, induced by the increase of solar radiation, sets the existence of the pan-Arctic transition toward more liquid-containing low clouds between March and May, while atmospheric dynamics may largely control day-to-day short-term variability superimposed on this seasonal evolution. Building on existing Arctic air-mass transformation case-study literature (Pithan et al., 2018), future work could extend these insights by leveraging multi-year, pan-Arctic satellite datasets together with trajectory-based diagnostics to quantify synoptic variability and interannual anomalies. Second, MOSAiC in-situ measurements show that the atmosphere above the Arctic sea-ice is almost always saturated at least w.r.t ice during most of spring, suggesting that water vapor is not a limiting factor for the spring cloud onset. However, a statistical approach for analyzing water vapor saturation over the full 13 years of cloud observations presented here is not possible due to the lack of suitable observations. We found that while ERA5 performs well overall, it fails to capture most of the saturation, making it unsuitable for this specific analysis. Finally, within the temperature range of about −40 to 0 °C, liquid droplets and ice crystals can coexist, and we acknowledge that additional processes influence cloud phase partitioning beyond temperature alone (Korolev et al., 2017). Strong vertical motions can induce adiabatic warming or cooling, while the availability of ice-nucleating particles (INPs) versus cloud condensation nuclei (CCN) also plays a critical role in determining cloud phase partitioning (Lance et al., 2011), although previous studies showed no temporal correlation between the spring cloud onset and a seasonal increase of any type of aerosols (Di Pierro et al., 2013; Ansmann et al., 2023). Beyond that study, further investigation into the relative contributions of these mechanisms could help explain both the timing of the spring cloud onset and its interannual variability. Nevertheless, although the processes driving the projected springtime warming remain debated (Previdi et al., 2021), spring temperatures are expected to increase by 5 °C by the end of the century (Overland et al., 2014). Our results therefore motivate assessing whether the timing of the spring cloud onset may shift earlier in spring in a warmer Arctic, potentially contributing to earlier sea-ice melt onset and a lengthening of the melt season as already observed in recent decades (Stroeve and Notz, 2018). Supporting this interpretation, our short interannual variability analysis suggests that warmer March conditions are associated with increased March cloudiness (see Fig. I1). Current efforts to bridge cloud space-based observations such as the new EarthCARE mission to obtain a longer dataset, from 2008 to the present, seem of high importance in that perspective.
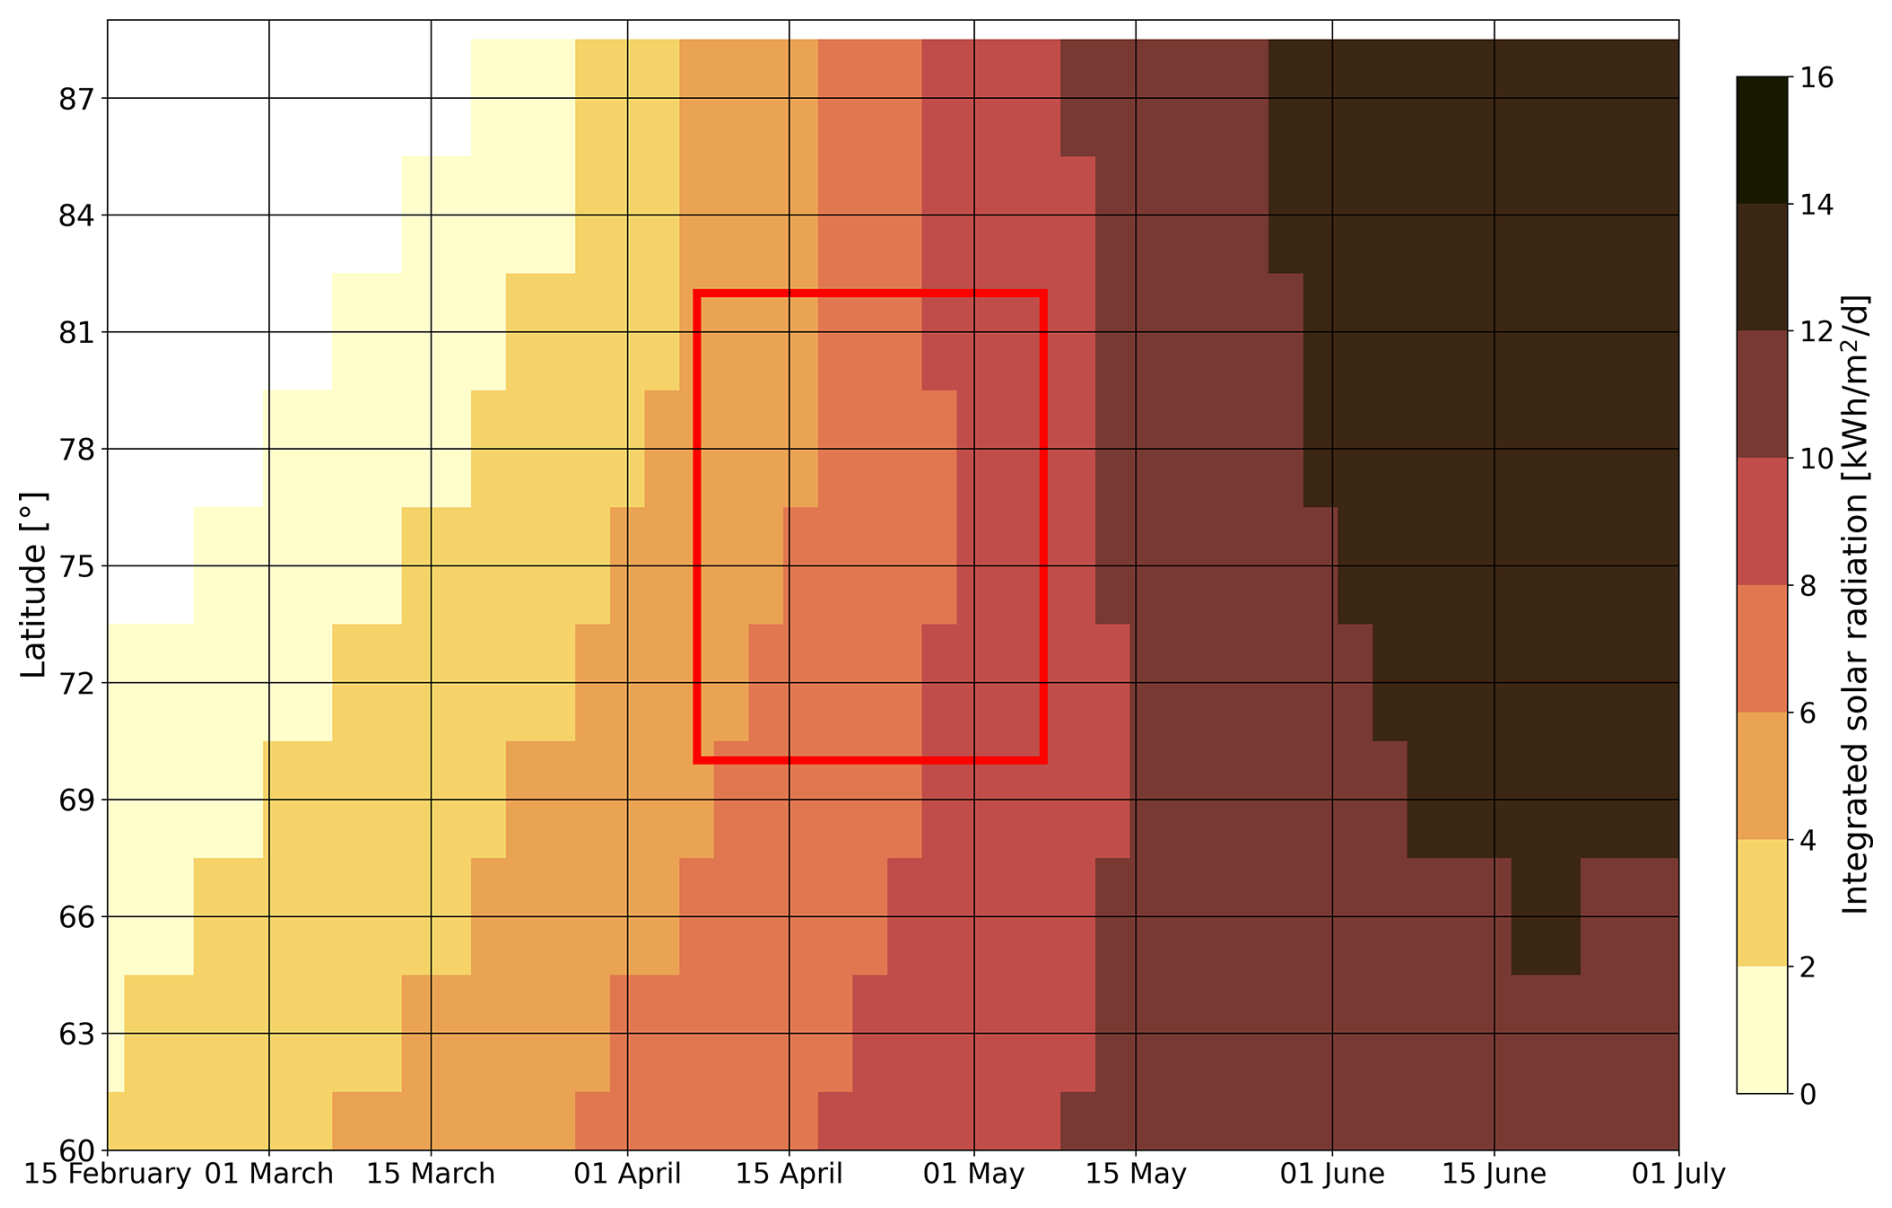
Figure A1Modeled Integrated solar radiation on a daily scale between February and June, based on the hourly solar angle only.
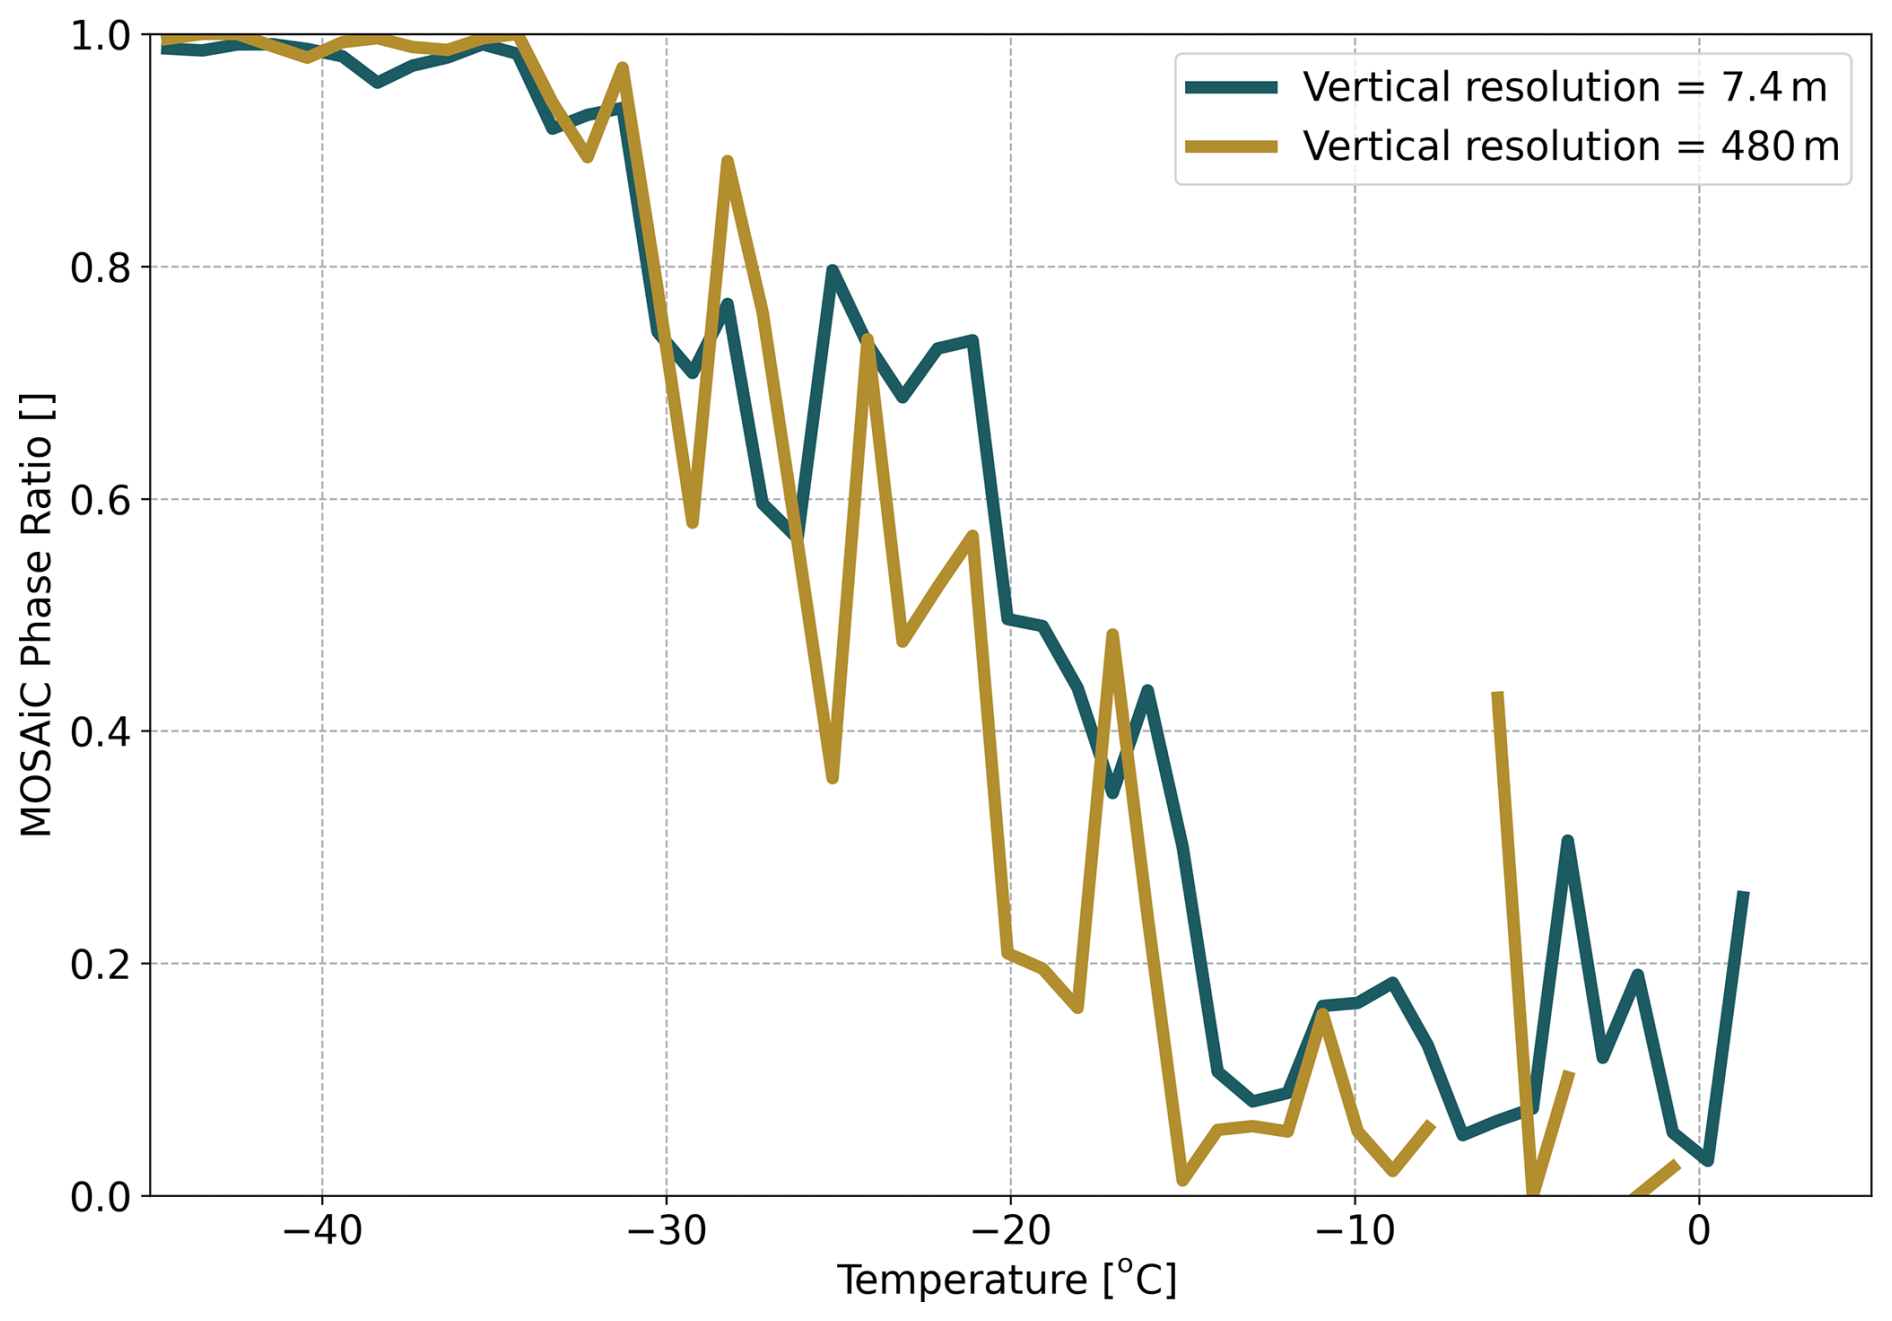
Figure B1Ice Phase Ratio from the MOSAiC ground-based lidar at (green line) 7.4 nominal vertical resolution and (yellow line) 480 m CALIPSO-GOCCP-like vertical resolution.
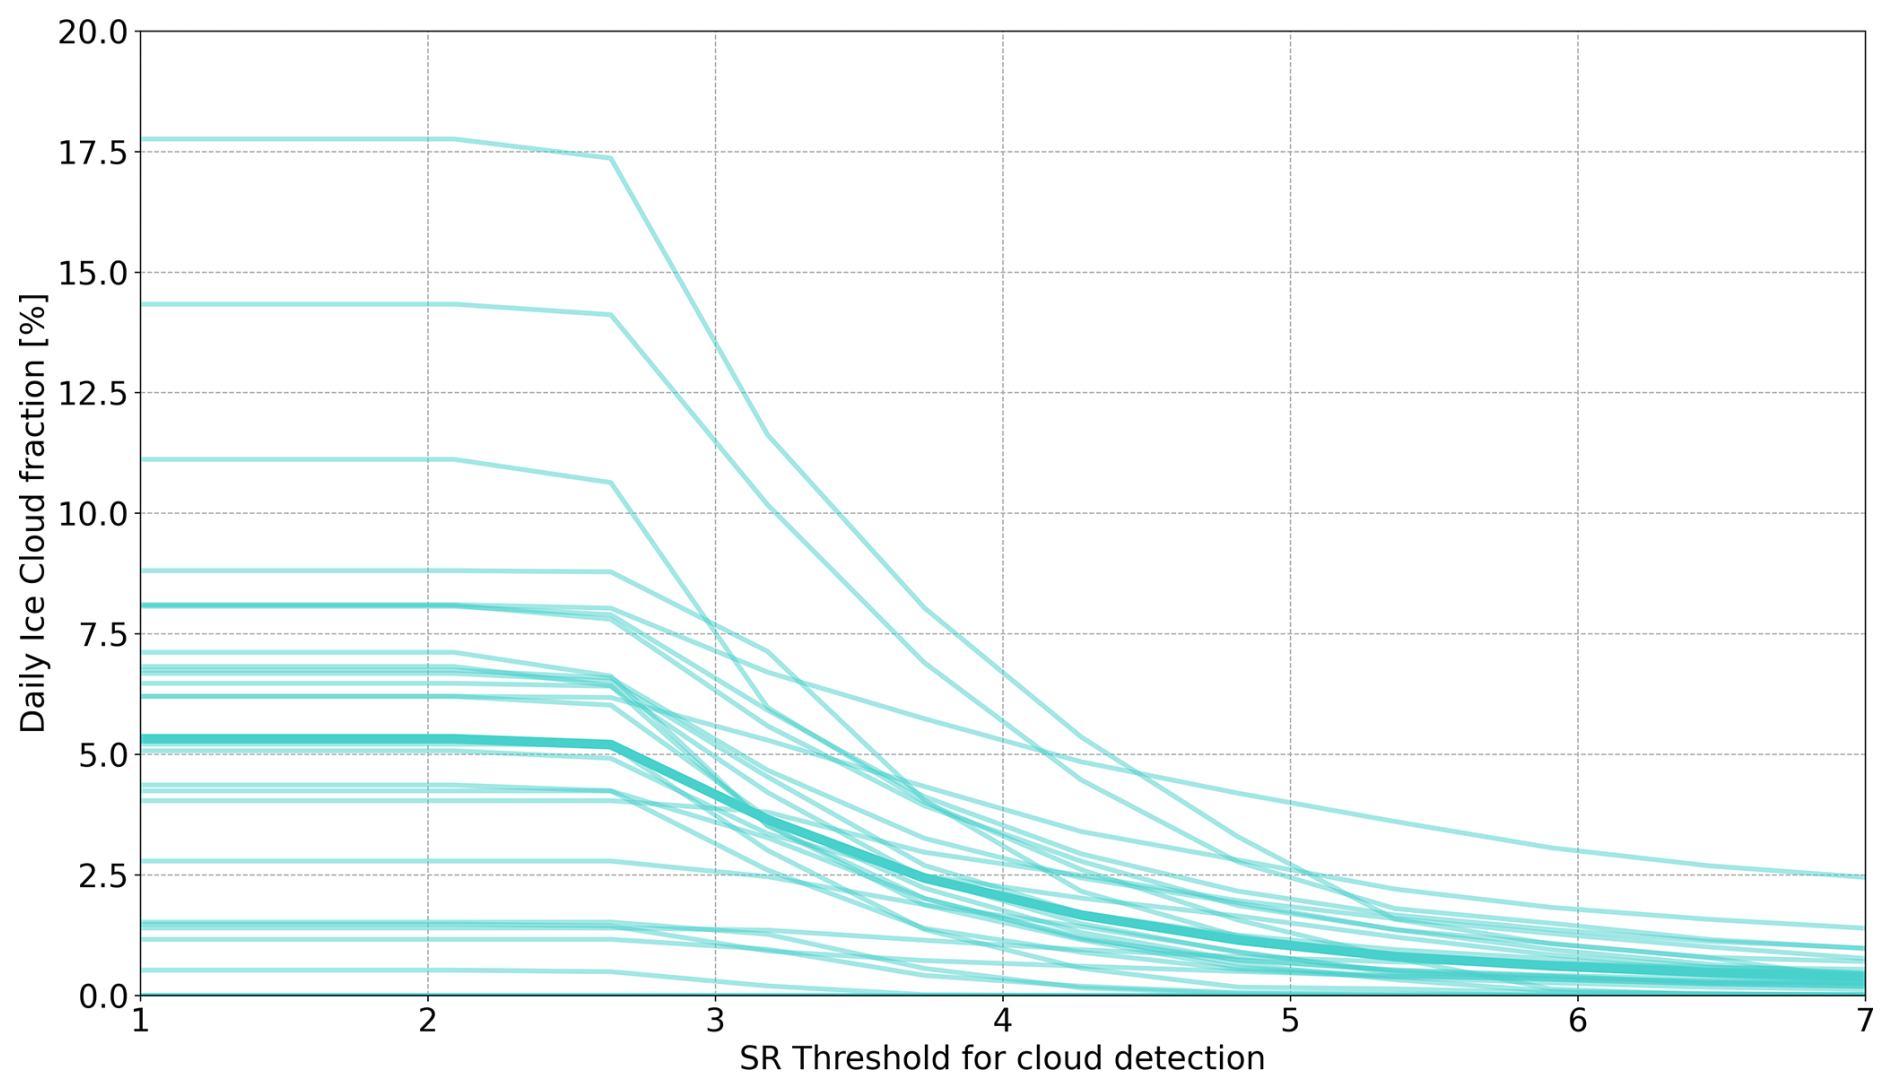
Figure C1(thin lines) Sensitivity of daily ice cloud fraction (number of ice layer detection divided by total number of layers over a day) to SR cloud detection threshold for each day of March 2020 from the MOSAiC lidar cloud observations. The bold line represents the average sensitivity of the daily ice cloud fraction to the SR threshold over March 2020.
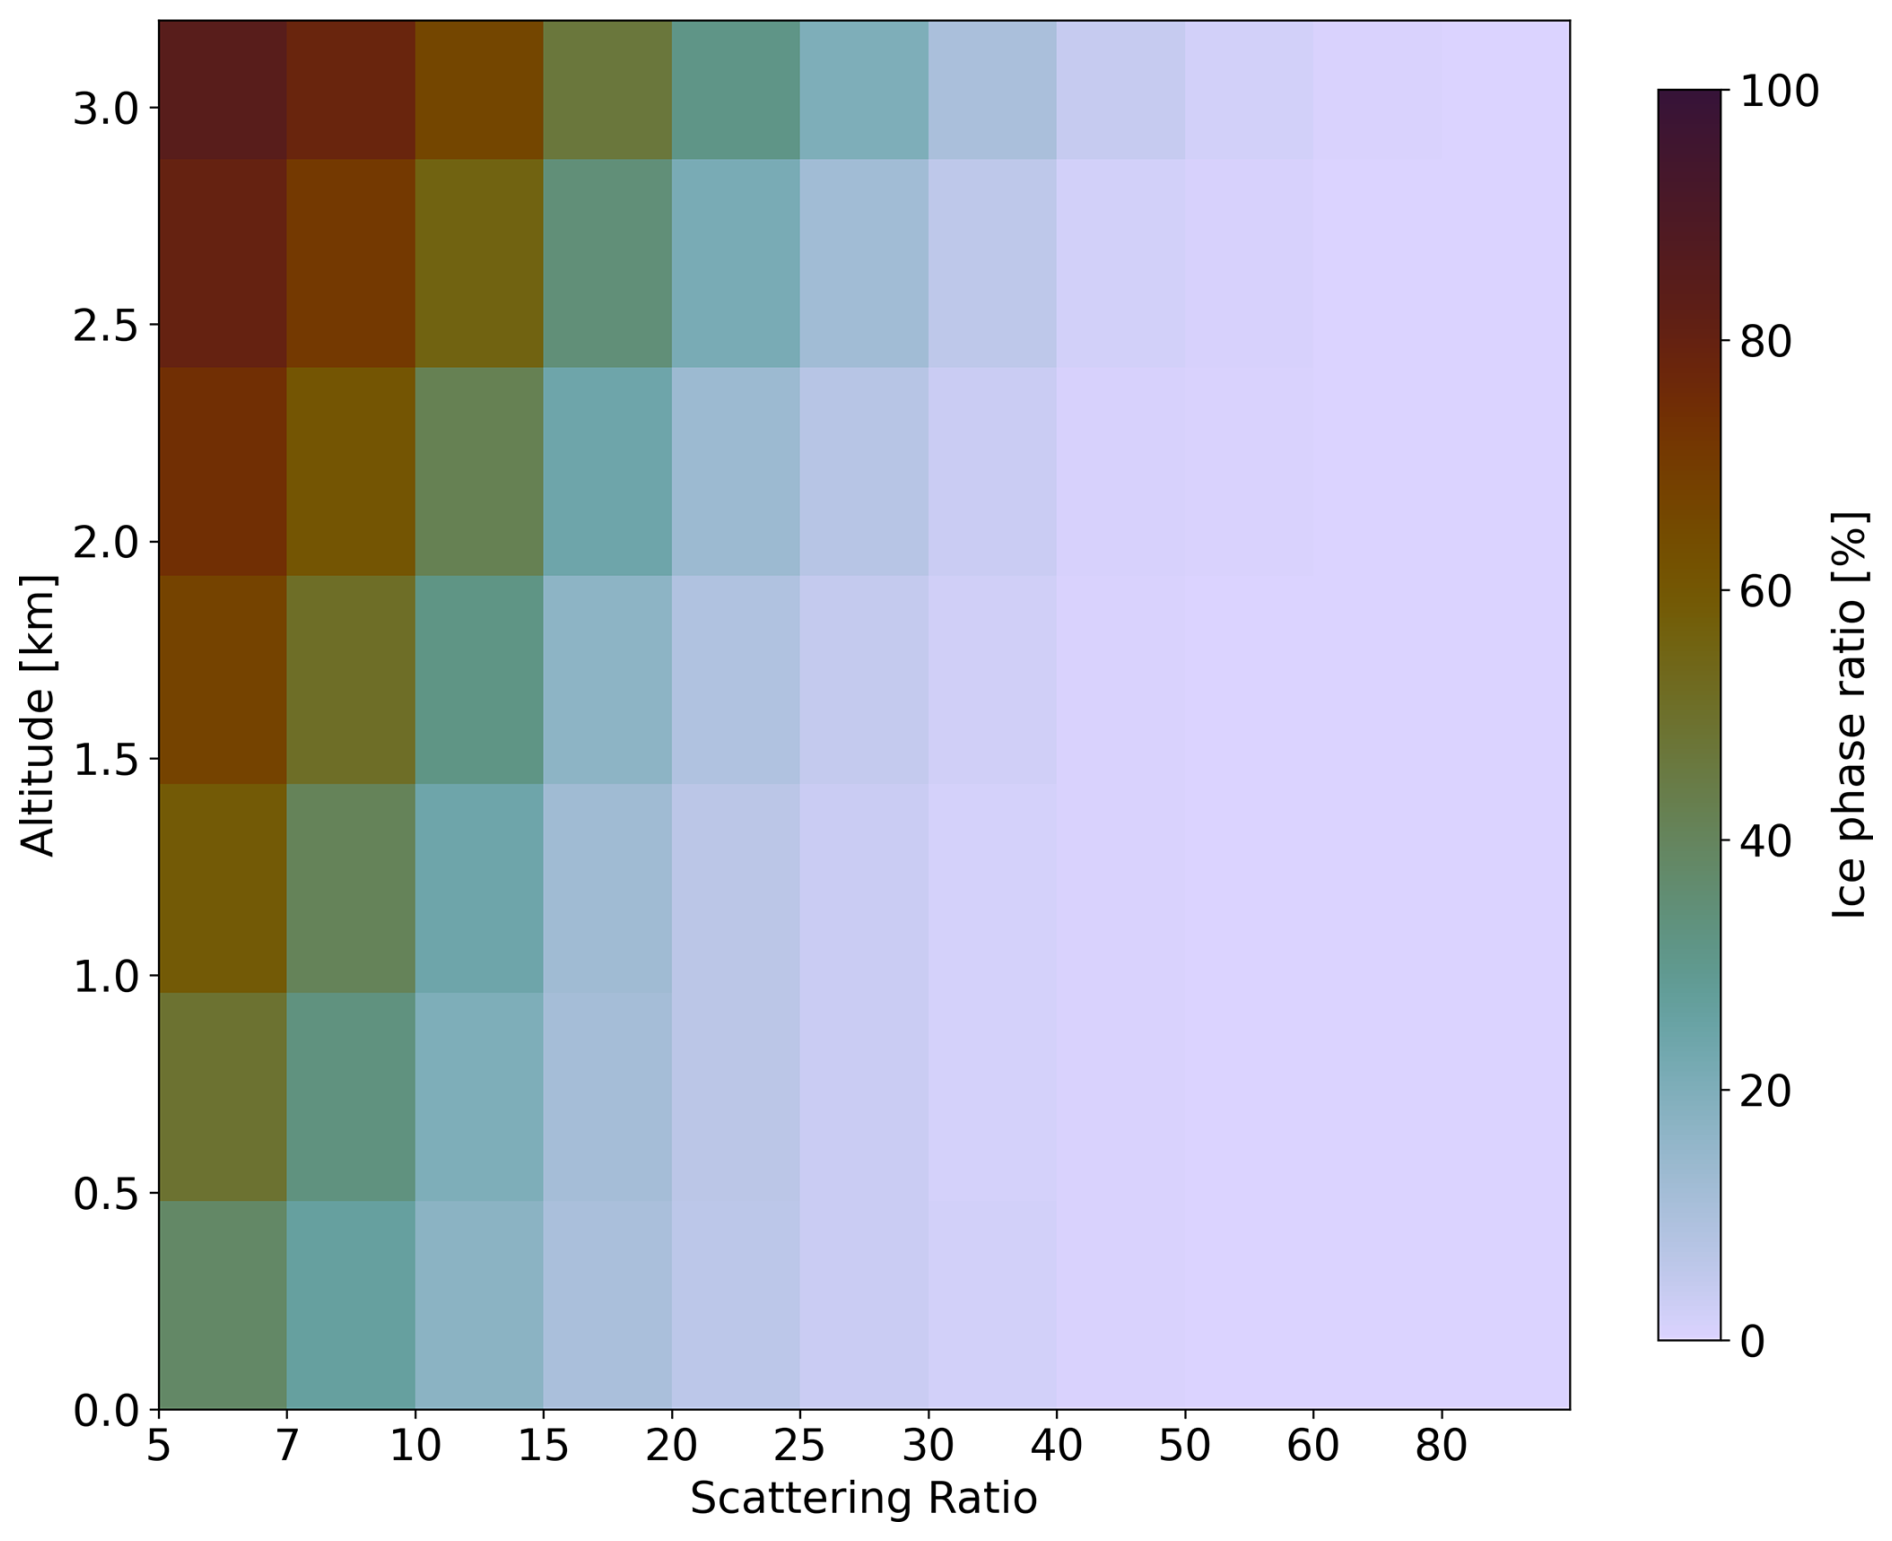
Figure D1Ice phase ratio over the Arctic sea-ice between March and May computed for each bins of SR and altitude. The ice phase ratio is computed as the ratio between the SR-altitude histograms considering layers classified as ice clouds only and SR-altitude histograms considering layers classified as ice and liquid-containing. CALIPSO-GOCCP monthly gridded SR-altitude histograms by cloud phase were published in Cesana and Chepfer (2013). It highlights the predominance of liquid-containing clouds for SR>30.
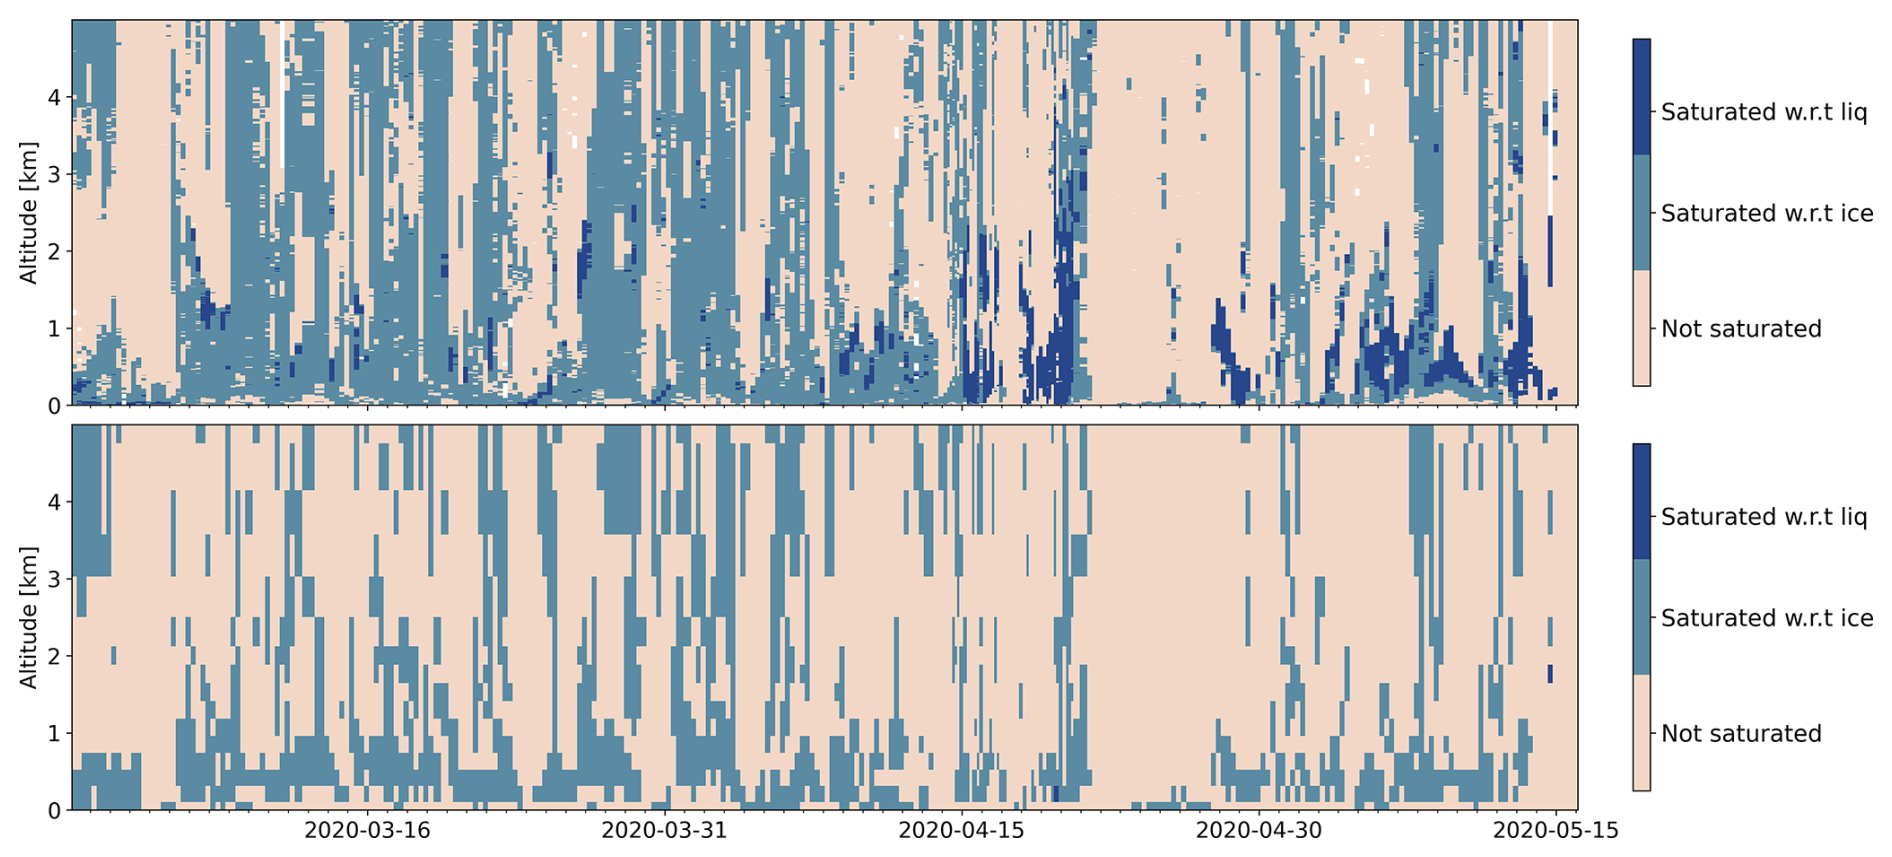
Figure E1Water vapor saturation state for (top line) MOSAiC radiosoundings and (bottom line) ERA5 collocated to radiosoundings between 1 March 2020 and 15 May 2020.
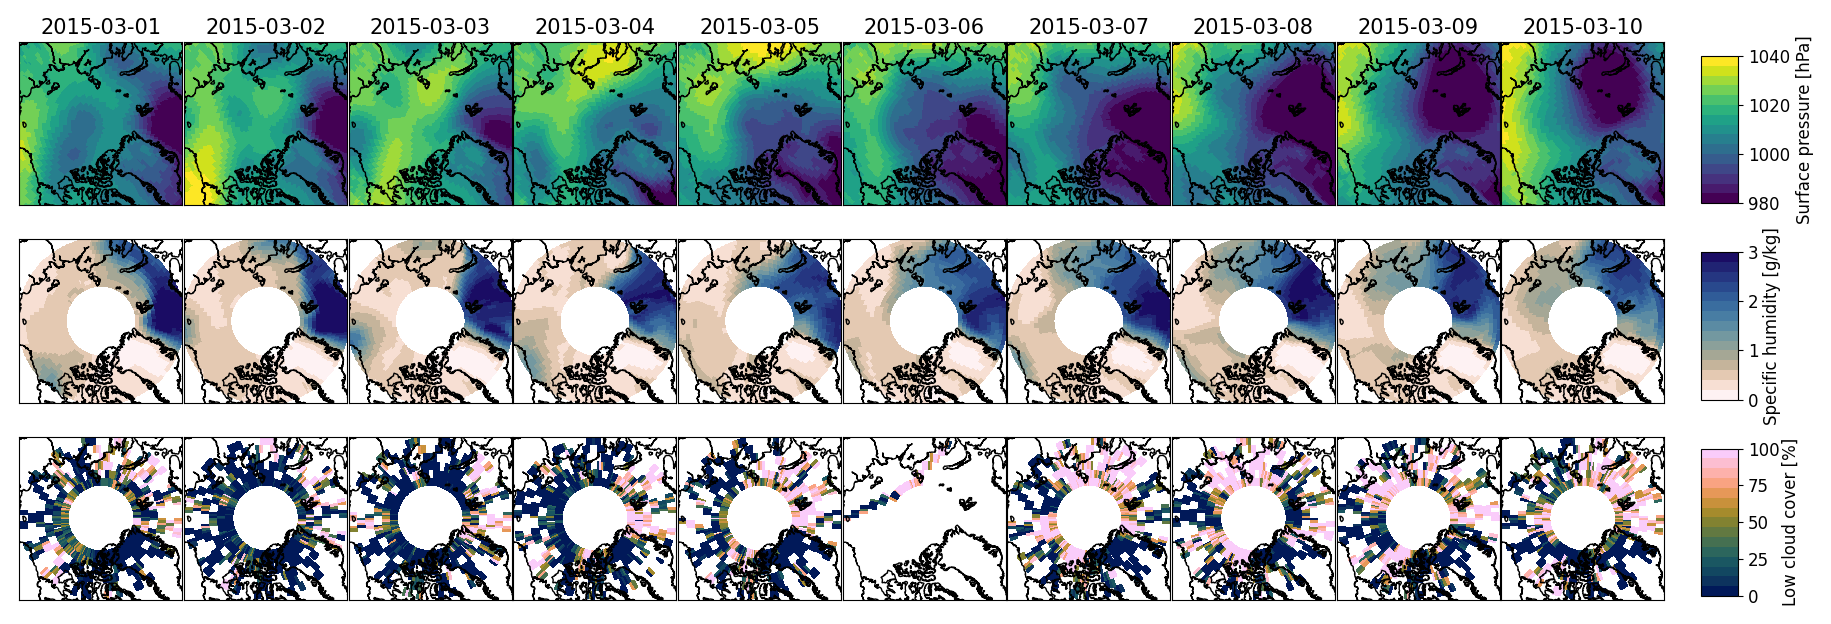
Figure F1Daily maps of (top panels) surface pressure, (middle panels) mean specific humidity below 800 hPa and (bottom panels) low cloud cover during an intrusion event in March 2015. Data of surface pressure and specific humidity are from the ERA5 hourly gridded dataset and low cloud cover from CALIPSO-GOCCP.
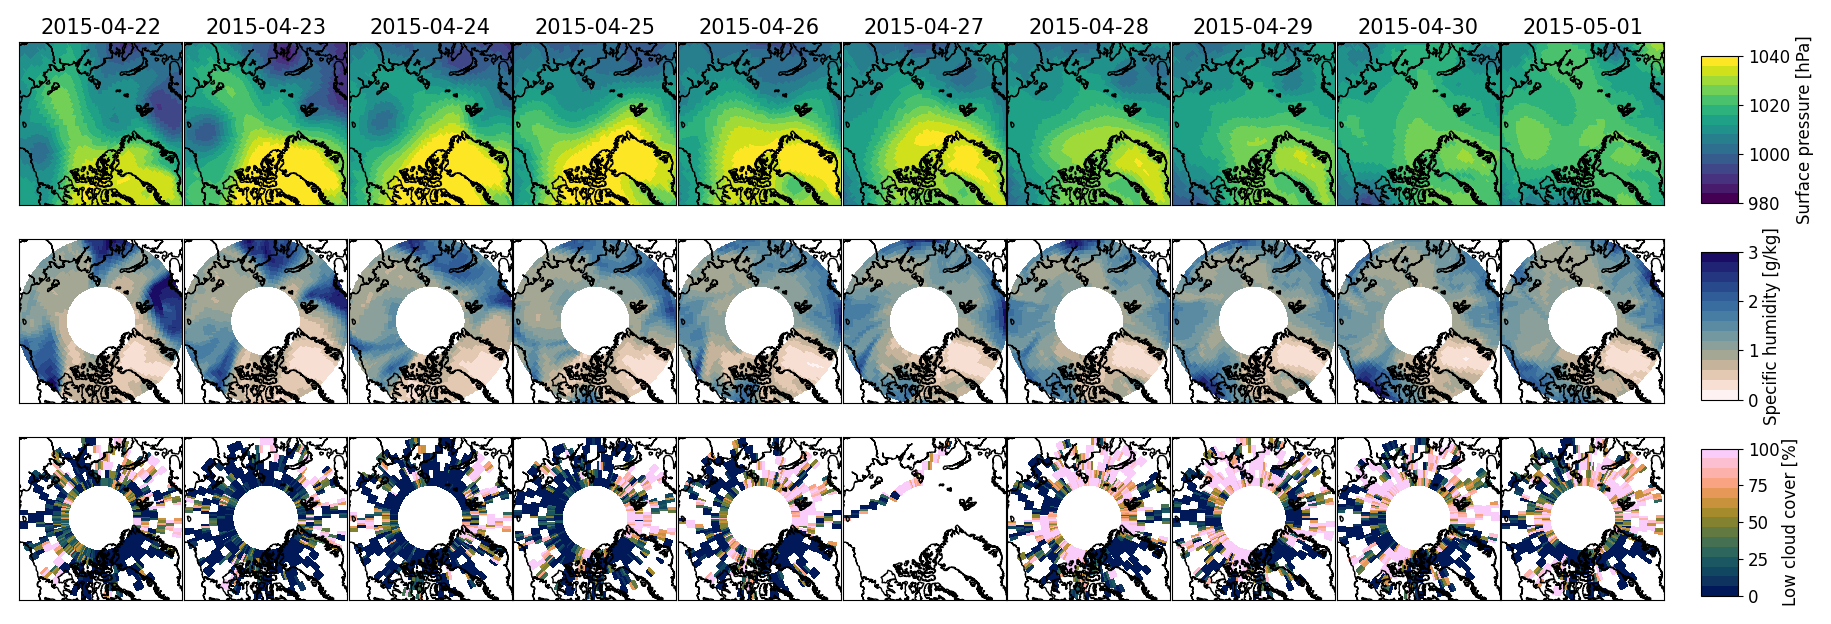
Figure F2Daily maps of (top panels) surface pressure, (middle panels) mean specific humidity below 800 hPa and (bottom panels) low cloud cover during a blocking event in April 2015. Data of surface pressure and specific humidity are from the ERA5 hourly gridded dataset and low cloud cover from CALIPSO-GOCCP.
We provide here a more detailed discussion on the drivers of the spring temperature increase over sea-ice: the increase of solar radiation and the temperature advection from the mid-latitudes. For this reason, using the framework presented by Serreze et al. (2007) and ERA5 outputs only, we have computed both contributions: (1) the moist static convergence flux (see Eq. G1) and (2) the net top-of-the atmosphere shortwave radiation budget.
where is the moist static energy, v the horizontal wind, n the outward unit normal to contour C as defined in Fig. 4, dl the line element, T the temperature, q the specific humidity, cp the specific heat of the atmosphere at constant pressure, L the latent heat of evaporation and ϕ the geopotential.
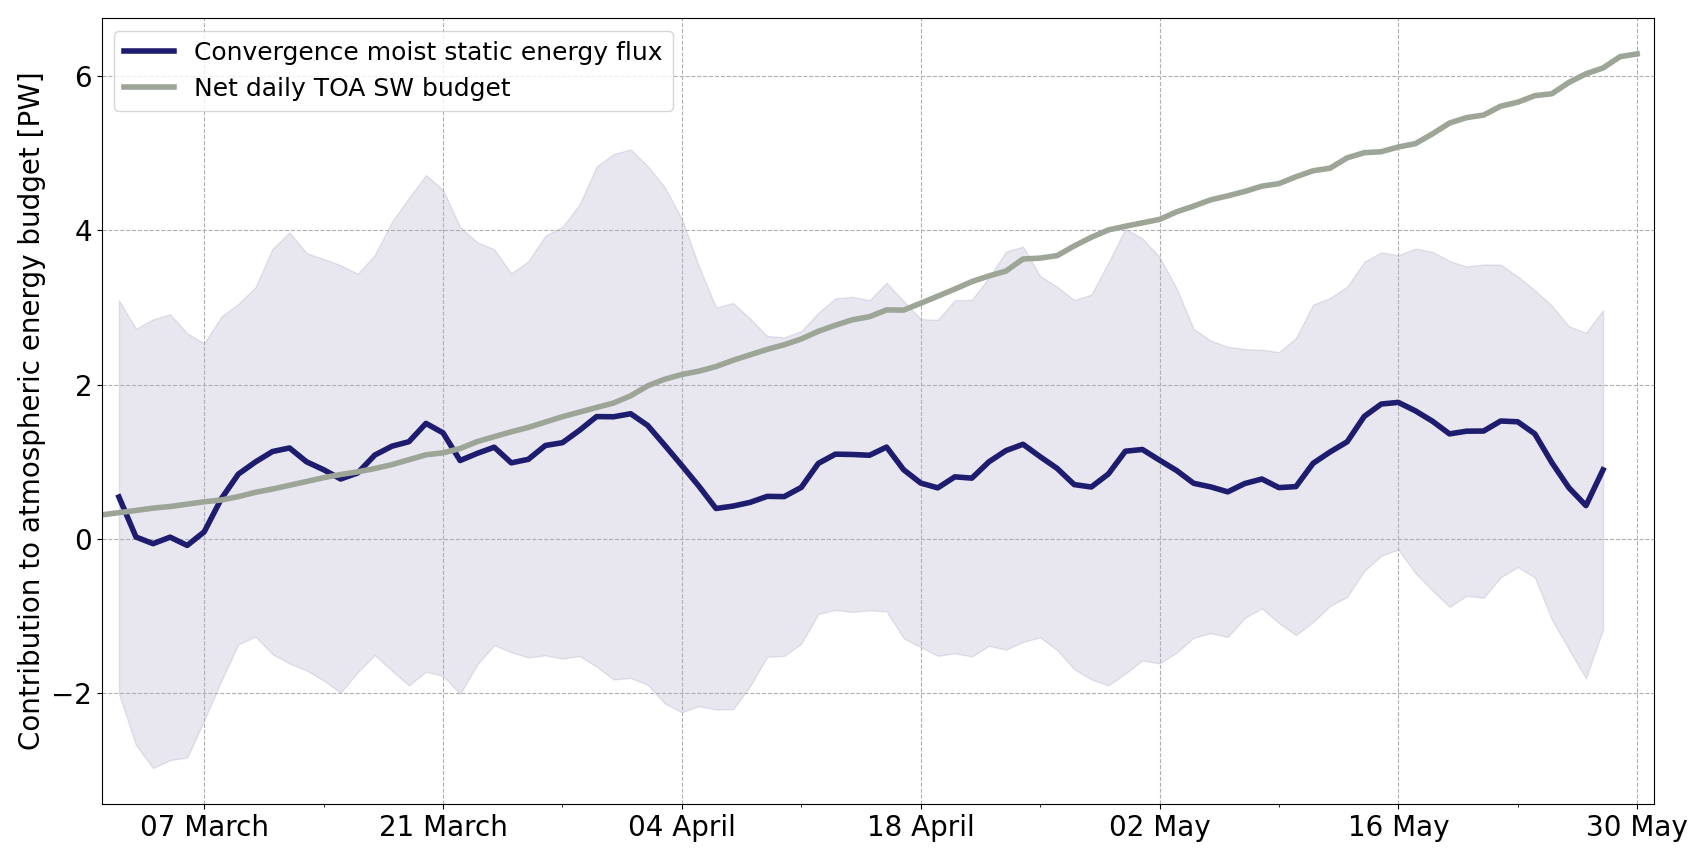
Figure G1Contribution of horizontal transport of moist static energy and solar radiation to the total atmospheric energy stored over the sea-ice. The net top-of-the-atmosphere shortwave radiation budget (grey line) is integrated over the surface defined in Fig. 4 of the present article. The convergence of moist static energy is integrated along the same spatial contour as defined in Fig. 4.
Figure G1 shows a close to constant contribution of the moist static energy transport from the mid-latitudes to the Arctic between March and May, while the contribution of net solar radiation is (1) steeply increasing and (2) several times higher than the advection contribution. Therefore, results presented here emphasize that the increase of lower troposphere temperature between March and May over the sea-ice is solely attributed to the increase of incoming solar radiation and not to the increase of energy transport from the mid-latitudes.
We present here additional information on the limited spatial sampling of CALIPSO and the reasons we consider this not as a limited concern for the present analysis. (1) CALIPSO observations accumulate rapidly: CALIPSO provides ∼14 polar overpasses per day over the Arctic. As shown in Fig. H1, all grid cells in our sea-ice domain are sampled within three days. (2) The Arctic low-level clouds considered here are both spatially extensive and temporally persistent. Previous studies report horizontal scales of 100–500 km for Arctic stratiform clouds and typical lifetimes of one to several days during late winter–spring (Shupe et al., 2011). Thus, while CALIPSO's footprint does not resolve the domain instantaneously, the synoptic-to-multi-day persistence and large spatial extent of these clouds mean that the accumulated sampling (over 1–3 d and longer) captures the relevant cloud features, especially when considering 13 years of CALIPSO observations.
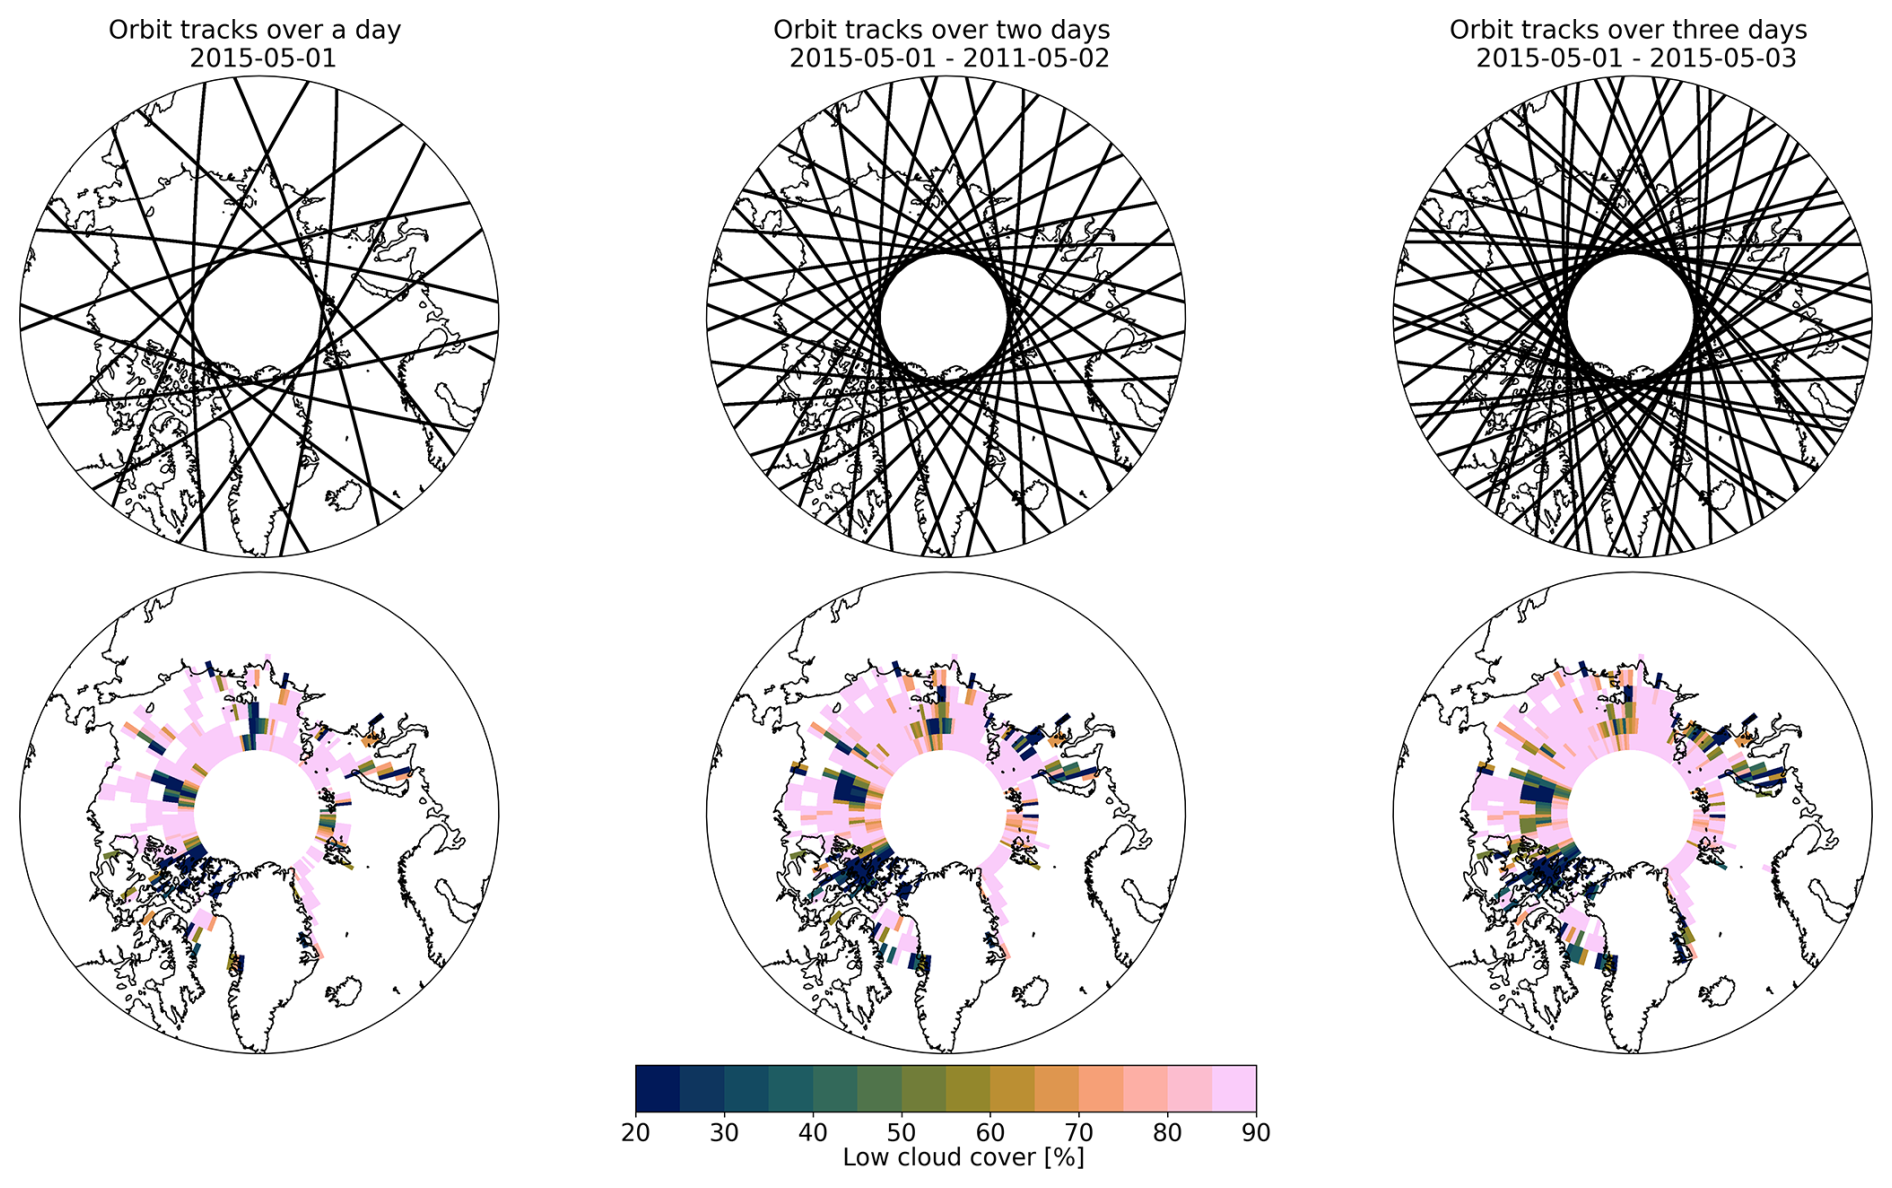
Figure H1(top) Every CALIPSO orbit tracks over one, two and three days. (bottom) Maps of Low cloud cover averaged over one, 2 and 3 d from CALIPSO-GOCCP 2° × 2° daily gridded data.
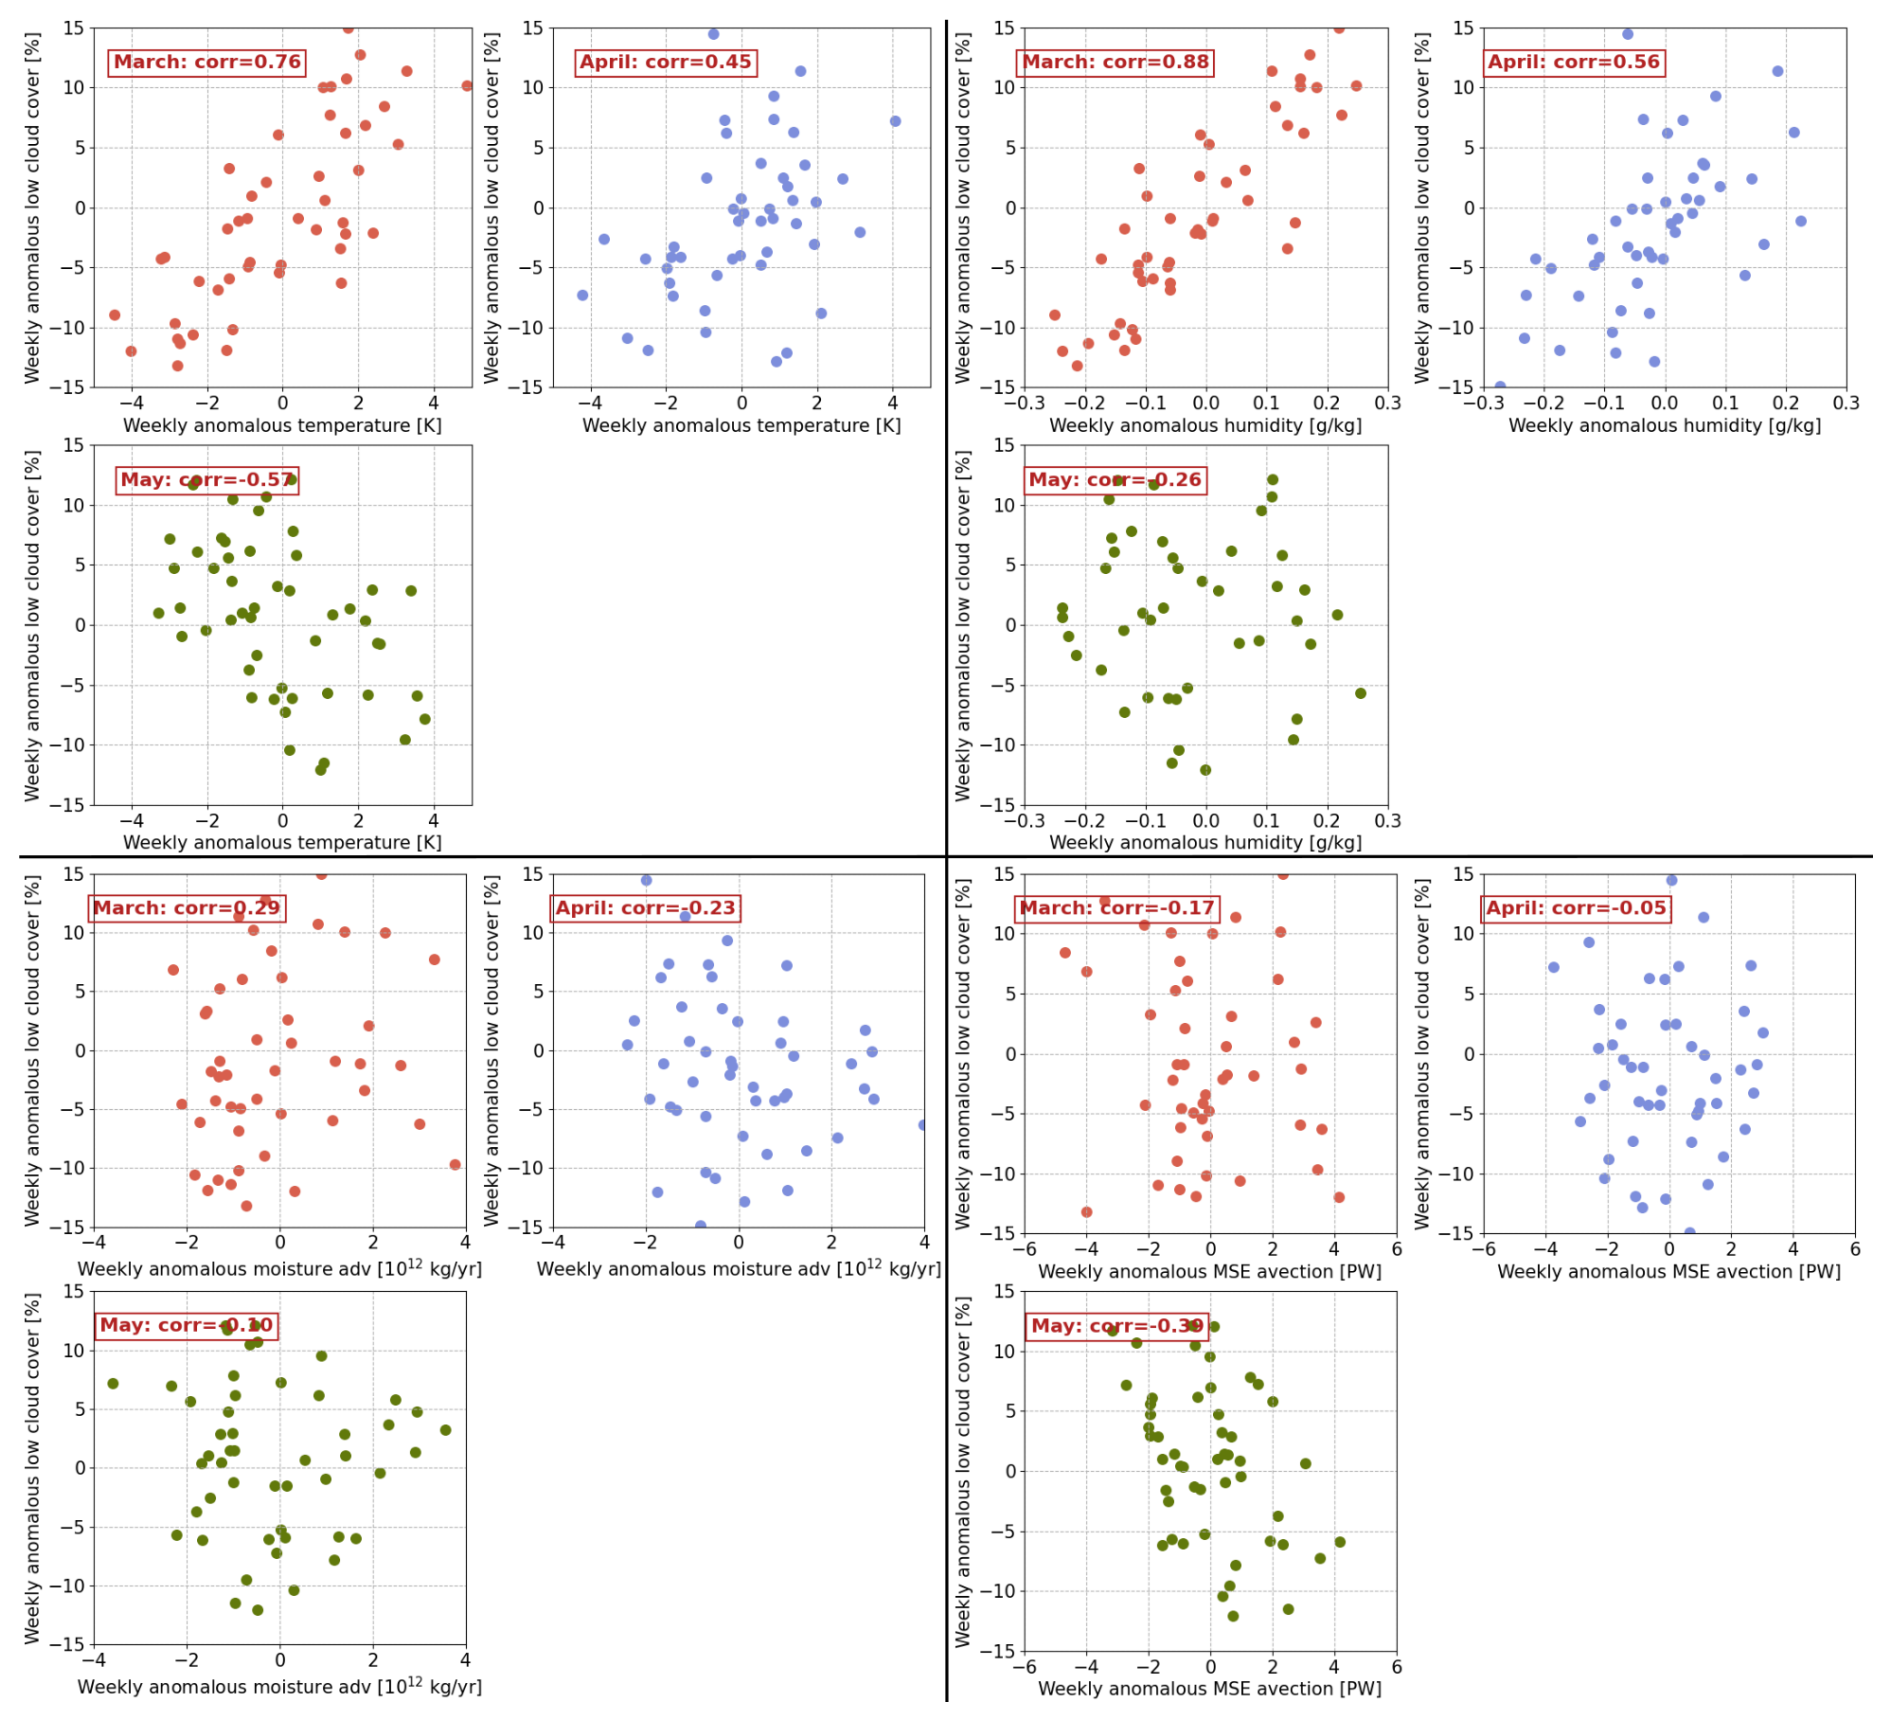
Figure I1Relationship between weekly average low cloud cover over sea-ice and (upper left quadrant) 950 hPa air temperature, (upper right quadrant) 950 hPa moisture content, (lower left quadrant) poleward moisture flux and (lower right) poleward moist static energy flux for the weeks of March (orange dots), April (blue dots) and May (green dots). For each weeks, anomalies are defined as the difference between the weekly mean and the corresponding 2008–2020 mean for that same week.
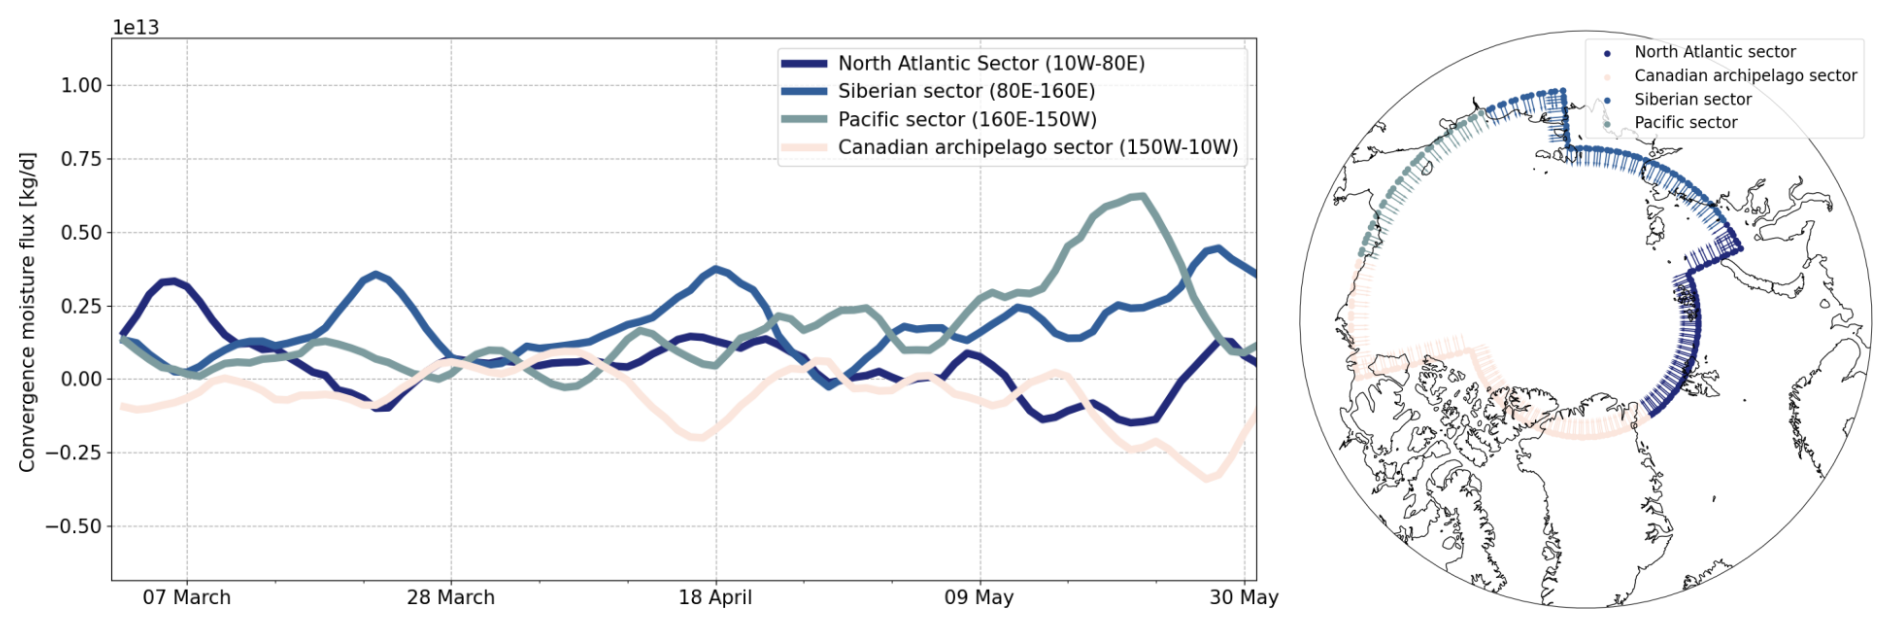
Figure J1(left) Sensitivity of the poleward moisture flux (shown in Fig. 4) to the choice of contour segment (North Atlantic sector, Siberian sector, Pacific sector and the Canadian Archipelago sector). (right) Map of the corresponding contour segments used to compute the poleward moisture flux.
The GOCCP v3.2 products are included in Chepfer et al. (2010). MOSAiC lidar observations are available at https://doi.org/10.60656/59216bca3a304156 (Engelmann et al., 2023), the associated MOSAiC Cloud-net issue data set is available at https://doi.org/10.5281/zenodo.15675285 (Griesche and Seifert, 2025). The ERA5 reanalysis data is publicly available via the Copernicus Climate Change Service (C3S) (Hersbach et al., 2023, https://doi.org/10.24381/cds.bd0915c6).
JL wrote the manuscript draft; HC, MDS, HG reviewed and edited the manuscript. The ground-based lidar data were collected by HG and MDS.
The contact author has declared that none of the authors has any competing interests.
Publisher's note: Copernicus Publications remains neutral with regard to jurisdictional claims made in the text, published maps, institutional affiliations, or any other geographical representation in this paper. The authors bear the ultimate responsibility for providing appropriate place names. Views expressed in the text are those of the authors and do not necessarily reflect the views of the publisher.
We thank NASA/CNES for the CALIPSO level-1 data and the mesocenter ESPRI/IPSL for the computational resources. We recognize the support of CNES, who supported the development of the CALIPSO-GOCCP product through EECLAT project.
Matthew D. Shupe was supported by the US Department of Energy (DE-SC0021341), NOAA Cooperative Agreement (NA22OAR4320151), and the NOAA Global Ocean Monitoring and Observing program (https://doi.org/10.13039/100018302). The authors gratefully acknowledge the funding by the Deutsche Forschungsgemeinschaft (DFG, German Research Foundation) – Project no. 268020496 – TRR 172, within the Transregional Collaborative Research Center “ArctiC Amplification: Climate Relevant Atmospheric and SurfaCe Processes, and Feedback Mechanisms (AC)3”.
This paper was edited by Ivy Tan and reviewed by three anonymous referees.
Andreas, E. L., Guest, P. S., Persson, P. O. G., Fairall, C. W., Horst, T. W., Moritz, R. E., and Semmer, S. R.: Near-surface water vapor over polar sea ice is always near ice saturation, J. Geophys. Res.-Oceans, 107, SHE-8, https://doi.org/10.1029/2000JC000411, 2002. a
Ansmann, A., Ohneiser, K., Engelmann, R., Radenz, M., Griesche, H., Hofer, J., Althausen, D., Creamean, J. M., Boyer, M. C., Knopf, D. A., Dahlke, S., Maturilli, M., Gebauer, H., Bühl, J., Jimenez, C., Seifert, P., and Wandinger, U.: Annual cycle of aerosol properties over the central Arctic during MOSAiC 2019–2020 – light-extinction, CCN, and INP levels from the boundary layer to the tropopause, Atmos. Chem. Phys., 23, 12821–12849, https://doi.org/10.5194/acp-23-12821-2023, 2023. a
Arouf, A., Chepfer, H., Vaillant de Guélis, T., Chiriaco, M., Shupe, M. D., Guzman, R., Feofilov, A., Raberanto, P., L'Ecuyer, T. S., Kato, S., and Gallagher, M. R.: The surface longwave cloud radiative effect derived from space lidar observations, Atmos. Meas. Tech., 15, 3893–3923, https://doi.org/10.5194/amt-15-3893-2022, 2022. a, b
Arouf, A., Chepfer, H., Kay, J. E., L'Ecuyer, T. S., and Lac, J.: Surface cloud warming increases as late fall Arctic sea ice cover decreases, Geophys. Res. Lett., 51, e2023GL105805, https://doi.org/10.1029/2023GL105805, 2024. a
Barrientos-Velasco, C., Cox, C. J., Deneke, H., Dodson, J. B., Hünerbein, A., Shupe, M. D., Taylor, P. C., and Macke, A.: Estimation of the radiation budget during MOSAiC based on ground-based and satellite remote sensing observations, Atmos. Chem. Phys., 25, 3929–3960, https://doi.org/10.5194/acp-25-3929-2025, 2025. a
Barton, N. P. and Veron, D. E.: Response of clouds and surface energy fluxes to changes in sea-ice cover over the Laptev Sea (Arctic Ocean), Clim. Res., 54, 69–84, 2012. a
Beesley, J. and Moritz, R.: Toward an explanation of the annual cycle of cloudiness over the Arctic Ocean, J. Climate, 12, 395–415, 1999. a, b, c, d
Bergeron, T.: On the physics of clouds and precipitation, in: Proc. 5th Assembly UGGI, Lisbon, Portugal, 1935, 156–180, 1935. a
Bey, I., Jacob, D. J., Yantosca, R. M., Logan, J. A., Field, B. D., Fiore, A. M., Li, Q., Liu, H. Y., Mickley, L. J., and Schultz, M. G.: Global modeling of tropospheric chemistry with assimilated meteorology: Model description and evaluation, J. Geophys. Res.-Atmos., 106, 23073–23095, 2001. a
Blanchard, Y., Pelon, J., Eloranta, E. W., Moran, K. P., Delanoë, J., and Sèze, G.: A synergistic analysis of cloud cover and vertical distribution from A-Train and ground-based sensors over the high Arctic station EUREKA from 2006 to 2010, J. Appl. Meteorol. Clim., 53, 2553–2570, 2014. a
Boudala, F. S., Isaac, G. A., Cober, S. G., and Fu, Q.: Liquid fraction in stratiform mixed-phase clouds from in situ observations, Q. J. Roy. Meteor. Soc., 130, 2919–2931, 2004. a
Brooks, I. M., Tjernström, M., Persson, P. O. G., Shupe, M. D., Atkinson, R. A., Canut, G., Birch, C. E., Mauritsen, T., Sedlar, J., and Brooks, B. J.: The turbulent structure of the Arctic summer boundary layer during the Arctic summer cloud–ocean study, J. Geophys. Res.-Atmos., 122, 9685–9704, 2017. a
Cesana, G. and Chepfer, H.: Evaluation of the cloud thermodynamic phase in a climate model using CALIPSO-GOCCP, J. Geophys. Res.-Atmos., 118, 7922–7937, 2013. a, b, c, d, e
Cesana, G., Kay, J., Chepfer, H., English, J., and De Boer, G.: Ubiquitous low-level liquid-containing Arctic clouds: New observations and climate model constraints from CALIPSO-GOCCP, Geophys. Res. Lett., 39, https://doi.org/10.1029/2012GL053385, 2012. a, b, c
Cesana, G., Chepfer, H., Winker, D., Getzewich, B., Cai, X., Jourdan, O., Mioche, G., Okamoto, H., Hagihara, Y., Noël, V., and Reverdy, M.: Using in situ airborne measurements to evaluate three cloud phase products derived from CALIPSO, J. Geophys. Res.-Atmos., 121, 5788–5808, https://doi.org/10.1002/2015JD024334, 2016. a, b, c, d
Cesana, G. V., Khadir, T., Chepfer, H., and Chiriaco, M.: Southern Ocean solar reflection biases in CMIP6 models linked to cloud phase and vertical structure representations, Geophys. Res. Lett., 49, e2022GL099777, https://doi.org/10.1029/2022GL099777, 2022. a, b, c
Chan, M. A. and Comiso, J. C.: Arctic cloud characteristics as derived from MODIS, CALIPSO, and CloudSat, J. Climate, 26, 3285–3306, 2013. a
Chepfer, H., Bony, S., Winker, D., Cesana, G., Dufresne, J., Minnis, P., Stubenrauch, C., and Zeng, S.: The GCM-oriented calipso cloud product (CALIPSO-GOCCP), J. Geophys. Res.-Atmos., 115, https://doi.org/10.1029/2009JD012251, 2010. a, b, c, d, e
Collis, R. T.: Laser monitoring of the atmosphere, Top. Appl. Phys., 14, 71–151, 1976. a
Cox, C. J., Uttal, T., Long, C. N., Shupe, M. D., Stone, R. S., and Starkweather, S.: The role of springtime Arctic clouds in determining autumn sea ice extent, J. Climate, 29, 6581–6596, 2016. a
Creamean, J. M., Barry, K., Hill, T. C., Hume, C., DeMott, P. J., Shupe, M. D., Dahlke, S., Willmes, S., Schmale, J., Beck, I., Hoppe, C. J. M., Fong, A., Chamberlain, E., Bowman, J., Scharien, R., and Persson, O.: Annual cycle observations of aerosols capable of ice formation in central Arctic clouds, Nat. Commun., 13, 3537, https://doi.org/10.1038/s41467-022-31182-x, 2022. a
Di Pierro, M., Jaeglé, L., Eloranta, E. W., and Sharma, S.: Spatial and seasonal distribution of Arctic aerosols observed by the CALIOP satellite instrument (2006–2012), Atmos. Chem. Phys., 13, 7075–7095, https://doi.org/10.5194/acp-13-7075-2013, 2013. a
Dong, X., Xi, B., Crosby, K., Long, C. N., Stone, R. S., and Shupe, M. D.: A 10 year climatology of Arctic cloud fraction and radiative forcing at Barrow, Alaska, J. Geophys. Res.-Atmos., 115, https://doi.org/10.1029/2009JD013489, 2010. a
Eirund, G. K., Possner, A., and Lohmann, U.: Response of Arctic mixed-phase clouds to aerosol perturbations under different surface forcings, Atmos. Chem. Phys., 19, 9847–9864, https://doi.org/10.5194/acp-19-9847-2019, 2019. a
Engelmann, R., Kanitz, T., Baars, H., Heese, B., Althausen, D., Skupin, A., Wandinger, U., Komppula, M., Stachlewska, I. S., Amiridis, V., Marinou, E., Mattis, I., Linné, H., and Ansmann, A.: The automated multiwavelength Raman polarization and water-vapor lidar PollyXT: the neXT generation, Atmos. Meas. Tech., 9, 1767–1784, https://doi.org/10.5194/amt-9-1767-2016, 2016. a
Engelmann, R., Althausen, D., Baars, H., Griesche, H., Hofer, J., Radenz, M., and Seifert, P.: Custom collection of categorize, classification, ice water content, lidar, and liquid water content data from RV Polarstern between 1 Oct 2019 and 1 Oct 2020, ACTRIS Cloud remote sensing data centre unit (CLU) [data set], https://doi.org/10.60656/59216bca3a304156, 2023. a, b
Filioglou, M., Mielonen, T., Balis, D., Giannakaki, E., Arola, A., Kokkola, H., Komppula, M., and Romakkaniemi, S.: Aerosol effect on the cloud phase of low-level clouds over the Arctic, J. Geophys. Res.-Atmos., 124, 7886–7899, 2019. a
Findeisen, W.: Kolloid-meteorologische Vorgänge bei Niederschlagsbildung, Meteorol. Z., 55, 121–133, 1938. a
Francis, J. A. and Wu, B.: Why has no new record-minimum Arctic sea-ice extent occurred since September 2012?, Environ. Res. Lett., 15, 114034, https://doi.org/10.1088/1748-9326/abc047, 2020. a
Griesche, H. J. and Seifert, P.: MOSAiC Cloud-net issue data set (1.1), Zenodo [data set], https://doi.org/10.5281/zenodo.15675285, 2025. a, b
Griesche, H. J., Ohneiser, K., Seifert, P., Radenz, M., Engelmann, R., and Ansmann, A.: Contrasting ice formation in Arctic clouds: surface-coupled vs. surface-decoupled clouds, Atmos. Chem. Phys., 21, 10357–10374, https://doi.org/10.5194/acp-21-10357-2021, 2021. a
Griesche, H. J., Barrientos-Velasco, C., Deneke, H., Hünerbein, A., Seifert, P., and Macke, A.: Low-level Arctic clouds: a blind zone in our knowledge of the radiation budget, Atmos. Chem. Phys., 24, 597–612, https://doi.org/10.5194/acp-24-597-2024, 2024a. a
Griesche, H. J., Seifert, P., Engelmann, R., Radenz, M., Hofer, J., Althausen, D., Walbröl, A., Barrientos-Velasco, C., Baars, H., Dahlke, S., Maturilli, M., Wendisch, M., Ehrlich, A., Crewell, S., Deneke, H., and Macke, A.: Cloud micro-and macrophysical properties from ground-based remote sensing during the MOSAiC drift experiment, Scientific Data, 11, 505, https://doi.org/10.1038/s41597-024-03325-w 2024b. a
Groves, D. G. and Francis, J. A.: Moisture budget of the Arctic atmosphere from TOVS satellite data, J. Geophys. Res.-Atmos., 107, ACL-11, https://doi.org/10.1029/2001JD001191, 2002. a
Guzman, R., Chepfer, H., Noël, V., Vaillant de Guélis, T., Kay, J., Raberanto, P., Cesana, G., Vaughan, M., and Winker, D.: Direct atmosphere opacity observations from CALIPSO provide new constraints on cloud-radiation interactions, J. Geophys. Res.-Atmos., 122, 1066–1085, 2017. a
Herman, G. and Goody, R.: Formation and persistence of summertime Arctic stratus clouds, J. Atmos. Sci., 33, 1537–1553, 1976. a, b, c
Herrmannsdörfer, L., Müller, M., Shupe, M. D., and Rostosky, P.: Surface temperature comparison of the Arctic winter MOSAiC observations, ERA5 reanalysis, and MODIS satellite retrieval, Elem. Sci. Anth., 11, 00085, https://doi.org/10.1525/elementa.2022.00085, 2023. a
Hersbach, H., Bell, B., Berrisford, P., Hirahara, S., Horányi, A., Muñoz-Sabater, J., Nicolas, J., Peubey, C., Radu, R., Schepers, D., Simmons, A., Soci, C., Abdalla, S., Abellan, X., Balsamo, G., Bechtold, P., Biavati, G., Bidlot, J., Bonavita, M., De Chiara, G., Dahlgren, P., Dee, D., Diamantakis, M., Dragani, R., Flemming, J., Forbes, R., Fuentes, M., Geer, A., Haimberger, L., Healy, S., Hogan, R. J., Hólm, E., Janisková, M., Keeley, S., Laloyaux, P., Lopez, P., Lupu, C., Radnoti, G., de Rosnay, P., Rozum, I., Vamborg, F., Villaume, S., and Thépaut, J.-N.: The ERA5 global reanalysis, Q. J. Roy. Meteor. Soc., 146, 1999–2049, https://doi.org/10.1002/qj.3803, 2020. a
Hersbach, H., Bell, B., Berrisford, P., Biavati, G., Horányi, A., Muñoz-Sabater, J., Nicolas, J., Peubey, C., Radu, R., Rozum, I., Schepers, D., Simmons, A., Soci, C., Dee, D., and Thépaut, J.-N.: ERA5 hourly data on pressure levels from 1940 to present, Copernicus Climate Change Service (C3S) Climate Data Store (CDS) [data set], https://doi.org/10.24381/cds.bd0915c6, 2023. a
Heutte, B., Bergner, N., Beck, I., Angot, H., Dada, L., Quéléver, L. L., Laurila, T., Boyer, M., Brasseur, Z., Daellenbach, K. R., Henning, S., Kuang, C., Kulmala, M., Lampilahti, J., Lampimäki, M., Petäjä, T., Shupe, M. D., Sipilä, M., Uin, J., Jokinen, T., and Schmale, J.: Measurements of aerosol microphysical and chemical properties in the central Arctic atmosphere during MOSAiC, Scientific Data, 10, 690, https://doi.org/10.1038/s41597-023-02586-1, 2023. a
Hu, Y., Rodier, S., Xu, K.-m., Sun, W., Huang, J., Lin, B., Zhai, P., and Josset, D.: Occurrence, liquid water content, and fraction of supercooled water clouds from combined CALIOP/IIR/MODIS measurements, J. Geophys. Res.-Atmos., 115, https://doi.org/10.1029/2009JD012384, 2010. a
Huang, Y., Dong, X., Bailey, D. A., Holland, M. M., Xi, B., DuVivier, A. K., Kay, J. E., Landrum, L. L., and Deng, Y.: Thicker clouds and accelerated Arctic sea ice decline: The atmosphere-sea ice interactions in spring, Geophys. Res. Lett., 46, 6980–6989, 2019. a
Huschke, R. E.: Arctic cloud statistics from “air-calibrated” surface weather observations, RAND Corporation Memorandum PM-6173, 79, 1969. a
Intrieri, J. M., Fairall, C., Shupe, M., Persson, P., Andreas, E., Guest, P., and Moritz, R.: An annual cycle of Arctic surface cloud forcing at SHEBA, J. Geophys. Res.-Oceans, 107, SHE-13, https://doi.org/10.1029/2000JC000439, 2002. a
Jiang, Z., Ding, M., Zhong, L., Li, Y., and Hu, X.: Seasonal variations of Arctic cloud in recent 14 years using CALIPSO-GOCCP, Atmos. Res., 309, 107598, https://doi.org/10.1016/j.atmosres.2024.107598, 2024. a
Kay, J. E. and Gettelman, A.: Cloud influence on and response to seasonal Arctic sea ice loss, J. Geophys. Res.-Atmos., 114, https://doi.org/10.1029/2009JD011773, 2009. a
Kay, J. E. and L'Ecuyer, T.: Observational constraints on Arctic Ocean clouds and radiative fluxes during the early 21st century, J. Geophys. Res.-Atmos., 118, 7219–7236, 2013. a
Kirbus, B., Tiedeck, S., Camplani, A., Chylik, J., Crewell, S., Dahlke, S., Ebell, K., Gorodetskaya, I., Griesche, H., Handorf, D., Höschel, I., Lauer, M., Neggers, R., Rückert, J., Shupe, M. D., Spreen, G., Walbröl, A., Wendisch, M., and Rinke, A.: Surface impacts and associated mechanisms of a moisture intrusion into the Arctic observed in mid-April 2020 during MOSAiC, Front. Earth Sci., 11, 1147848, https://doi.org/10.3389/feart.2023.1147848, 2023. a
Korolev, A., McFarquhar, G., Field, P. R., Franklin, C., Lawson, P., Wang, Z., Williams, E., Abel, S. J., Axisa, D., Borrmann, S., Crosier, J., Fugal, J., Krämer, M., Lohmann, U., Schlenczek, O., Schnaiter, M., and Wendisch, M.: Mixed-phase clouds: Progress and challenges, Meteor. Mon., 58, 5-1–5.50, https://doi.org/10.1175/AMSMONOGRAPHS-D-17-0001.1, 2017. a
Korolev, A. V., Isaac, G. A., Cober, S. G., Strapp, J. W., and Hallett, J.: Microphysical characterization of mixed-phase clouds, Q. J. Roy. Meteor. Soc., 129, 39–65, 2003. a
Lac, J., Chepfer, H., Arouf, A., Shupe, M. D., and Gallagher, M. R.: Polar low circulation enhances Greenland's west coast cloud surface warming, J. Geophys. Res.-Atmos., 129, e2023JD040450, https://doi.org/10.1029/2023JD040450, 2024. a
Lance, S., Shupe, M. D., Feingold, G., Brock, C. A., Cozic, J., Holloway, J. S., Moore, R. H., Nenes, A., Schwarz, J. P., Spackman, J. R., Froyd, K. D., Murphy, D. M., Brioude, J., Cooper, O. R., Stohl, A., and Burkhart, J. F.: Cloud condensation nuclei as a modulator of ice processes in Arctic mixed-phase clouds, Atmos. Chem. Phys., 11, 8003–8015, https://doi.org/10.5194/acp-11-8003-2011, 2011. a
Lacour, A., Chepfer, H., Shupe, M. D., Miller, N. B., Noel, V., Kay, J., Turner, D. D., and Guzman, R.: Greenland clouds observed in CALIPSO-GOCCP: Comparison with ground-based summit observations, J. Climate, 30, 6065–6083, https://doi.org/10.1175/JCLI-D-16-0552.1, 2017. a, b
L'Ecuyer, T. S., Hang, Y., Matus, A. V., and Wang, Z.: Reassessing the effect of cloud type on Earth’s energy balance in the age of active spaceborne observations. Part I: Top of atmosphere and surface, J. Climate, 32, 6197–6217, 2019. a
Li, X., Tan, Z., Zheng, Y., Bushuk, M., and Donner, L. J.: Open Water in Sea Ice Causes High Bias in Polar Low-Level Clouds in GFDL CM4, Geophys. Res. Lett., 50, e2023GL106322, https://doi.org/10.1029/2023GL106322, 2023. a, b, c
Markus, T., Stroeve, J. C., and Miller, J.: Recent changes in Arctic sea ice melt onset, freezeup, and melt season length, J. Geophys. Res.-Oceans, 114, https://doi.org/10.1029/2009JC005436, 2009. a
Maturilli, M., Sommer, M., Holdridge, D. J., Dahlke, S., Graeser, J., and Jaiser, R.: Radiosonde measurements in 2020-04 during MOSAiC Leg PS122/3 (level 3 data), PANGAEA [data set], https://doi.org/10.1594/PANGAEA.944529, 2022. a
Mayer, M., Tietsche, S., Haimberger, L., Tsubouchi, T., Mayer, J., and Zuo, H.: An improved estimate of the coupled Arctic energy budget, J. Climate, 32, 7915–7934, 2019. a
McFarquhar, G. M., Zhang, G., Poellot, M. R., Kok, G. L., McCoy, R., Tooman, T., Fridlind, A., and Heymsfield, A. J.: Ice properties of single-layer stratocumulus during the Mixed-Phase Arctic Cloud Experiment: 1. Observations, J. Geophys. Res.-Atmos., 112, https://doi.org/10.1029/2007JD008633, 2007. a
Miller, N. B., Shupe, M. D., Cox, C. J., Walden, V. P., Turner, D. D., and Steffen, K.: Cloud radiative forcing at Summit, Greenland, J. Climate, 28, 6267–6280, 2015. a, b
Morrison, A., Kay, J., Chepfer, H., Guzman, R., and Yettella, V.: Isolating the liquid cloud response to recent Arctic sea ice variability using spaceborne lidar observations, J. Geophys. Res.-Atmos., 123, 473–490, 2018. a
Morrison, H., De Boer, G., Feingold, G., Harrington, J., Shupe, M. D., and Sulia, K.: Resilience of persistent Arctic mixed-phase clouds, Nat. Geosci., 5, 11–17, 2012. a, b
Naakka, T., Nygård, T., Vihma, T., Sedlar, J., and Graversen, R.: Atmospheric moisture transport between mid-latitudes and the Arctic: Regional, seasonal and vertical distributions, Int. J. Climatol., 39, 2862–2879, 2019. a, b
Ohneiser, K., Ansmann, A., Chudnovsky, A., Engelmann, R., Ritter, C., Veselovskii, I., Baars, H., Gebauer, H., Griesche, H., Radenz, M., Hofer, J., Althausen, D., Dahlke, S., and Maturilli, M.: The unexpected smoke layer in the High Arctic winter stratosphere during MOSAiC 2019–2020, Atmos. Chem. Phys., 21, 15783–15808, https://doi.org/10.5194/acp-21-15783-2021, 2021. a
Olason, E. and Notz, D.: Drivers of variability in A rctic sea-ice drift speed, J. Geophys. Res.-Oceans, 119, 5755–5775, 2014. a
Overland, J. E., Wang, M., Walsh, J. E., and Stroeve, J. C.: Future Arctic climate changes: Adaptation and mitigation time scales, Earths Future, 2, 68–74, 2014. a
Peng, G., Meier, W. N., Scott, D. J., and Savoie, M. H.: A long-term and reproducible passive microwave sea ice concentration data record for climate studies and monitoring, Earth Syst. Sci. Data, 5, 311–318, https://doi.org/10.5194/essd-5-311-2013, 2013. a
Persson, P. O. G.: Onset and end of the summer melt season over sea ice: Thermal structure and surface energy perspective from SHEBA, Clim. Dynam., 39, 1349–1371, 2012. a
Pithan, F., Svensson, G., Caballero, R., Chechin, D., Cronin, T. W., Ekman, A. M., Neggers, R., Shupe, M. D., Solomon, A., Tjernström, M., and Wendisch, M.: Role of air-mass transformations in exchange between the Arctic and mid-latitudes, Nat. Geosci., 11, 805–812, 2018. a
Previdi, M., Smith, K. L., and Polvani, L. M.: Arctic amplification of climate change: a review of underlying mechanisms, Environ. Res. Lett., 16, 093003, https://doi.org/10.1088/1748-9326/ac1c29, 2021. a
Raillard, L., Vignon, É., Rivière, G., Madeleine, J.-B., Meurdesoif, Y., Delanoë, J., Caubel, A., Jourdan, O., Baudoux, A., Fromang, S., and Conesa, P.: Leveraging RALI-THINICE observations to assess how the ICOLMDZ model simulates clouds embedded in Arctic cyclones, J. Geophys. Res.-Atmos., 129, e2024JD040973, https://doi.org/10.1029/2024JD040973, 2024. a
Sedlar, J., Tjernström, M., Mauritsen, T., Shupe, M. D., Brooks, I. M., Persson, P. O. G., Birch, C. E., Leck, C., Sirevaag, A., and Nicolaus, M.: A transitioning Arctic surface energy budget: the impacts of solar zenith angle, surface albedo and cloud radiative forcing, Clim. Dynam., 37, 1643–1660, 2011. a
Seidel, C., Althausen, D., Ansmann, A., Wendisch, M., Griesche, H., Radenz, M., Hofer, J., Dahlke, S., Maturilli, M., Walbröl, A., Baars, H., and Engelmann, R.: Close correlation between vertically integrated tropospheric water vapor and the downward, broadband thermal-infrared irradiance at the ground: Observations in the Central Arctic during MOSAiC, J. Geophys. Res.-Atmos., 130, e2024JD042378, https://doi.org/10.1029/2024JD042378, 2025. a
Serreze, M. C. and Barry, R. G.: The Arctic climate system, Cambridge University Press, https://doi.org/10.1017/CBO9781139583817, 2014. a
Serreze, M. C., Barrett, A. P., Slater, A. G., Steele, M., Zhang, J., and Trenberth, K. E.: The large-scale energy budget of the Arctic, J. Geophys. Res.-Atmos., 112, https://doi.org/10.1029/2006JD008230, 2007. a, b
Shaw, J., McGraw, Z., Bruno, O., Storelvmo, T., and Hofer, S.: Using satellite observations to evaluate model microphysical representation of arctic mixed-phase clouds, Geophys. Res. Lett., 49, e2021GL096191, https://doi.org/10.1029/2021GL096191, 2022. a
Shupe, M. D. and Intrieri, J. M.: Cloud radiative forcing of the Arctic surface: The influence of cloud properties, surface albedo, and solar zenith angle, J. Climate, 17, 616–628, 2004. a
Shupe, M. D., Matrosov, S. Y., and Uttal, T.: Arctic mixed-phase cloud properties derived from surface-based sensors at SHEBA, J. Atmos. Sci., 63, 697–711, 2006. a
Shupe, M. D., Kollias, P., Persson, P. O. G., and McFarquhar, G. M.: Vertical motions in Arctic mixed-phase stratiform clouds, J. Atmos. Sci., 65, 1304–1322, 2008. a
Shupe, M. D., Walden, V. P., Eloranta, E., Uttal, T., Campbell, J. R., Starkweather, S. M., and Shiobara, M.: Clouds at Arctic atmospheric observatories. Part I: Occurrence and macrophysical properties, J. Appl. Meteorol. Clim., 50, 626–644, 2011. a, b, c, d, e
Shupe, M. D., Persson, P. O. G., Brooks, I. M., Tjernström, M., Sedlar, J., Mauritsen, T., Sjogren, S., and Leck, C.: Cloud and boundary layer interactions over the Arctic sea ice in late summer, Atmos. Chem. Phys., 13, 9379–9399, https://doi.org/10.5194/acp-13-9379-2013, 2013. a
Shupe, M. D., Rex, M., Blomquist, B., et al.: Overview of the MOSAiC expedition: Atmosphere, Elem. Sci. Anth., 10, 00060, https://doi.org/10.1525/elementa.2021.00060, 2022. a, b
Silber, I. and Shupe, M. D.: Insights on sources and formation mechanisms of liquid-bearing clouds over MOSAiC examined from a Lagrangian framework, Elem. Sci. Anth., 10, 000071, https://doi.org/10.1525/elementa.2021.000071, 2022. a
Smith, A. and Jahn, A.: Definition differences and internal variability affect the simulated Arctic sea ice melt season, The Cryosphere, 13, 1–20, https://doi.org/10.5194/tc-13-1-2019, 2019. a, b
Solomon, A., de Boer, G., Creamean, J. M., McComiskey, A., Shupe, M. D., Maahn, M., and Cox, C.: The relative impact of cloud condensation nuclei and ice nucleating particle concentrations on phase partitioning in Arctic mixed-phase stratocumulus clouds, Atmos. Chem. Phys., 18, 17047–17059, https://doi.org/10.5194/acp-18-17047-2018, 2018. a
Stroeve, J. and Notz, D.: Changing state of Arctic sea ice across all seasons, Environ. Res. Lett., 13, 103001, https://doi.org/10.1088/1748-9326/aade56, 2018. a, b
Sverdrup, H. U.: The Norwegian North Polar Expedition with the “Maud” 1918–1925, Meteorology, 3, John Griegs Boktr, 1930. a
Tan, I., Sotiropoulou, G., Taylor, P. C., Zamora, L., and Wendisch, M.: A review of the factors influencing Arctic mixed-phase clouds: Progress and outlook, in: Clouds and their climatic impacts: Radiation, circulation, and precipitation, Wiley Online Library, 103–132, https://doi.org/10.1002/9781119700357.ch5, 2023. a
Taylor, P. C. and Monroe, E.: Isolating the surface type influence on Arctic low-clouds, J. Geophys. Res.-Atmos., 128, e2022JD038098, https://doi.org/10.1029/2022JD038098, 2023. a
Taylor, P. C., Boeke, R. C., Li, Y., and Thompson, D. W. J.: Arctic cloud annual cycle biases in climate models, Atmos. Chem. Phys., 19, 8759–8782, https://doi.org/10.5194/acp-19-8759-2019, 2019. a
Tjernström, M., Zieger, P., and Murto, S. and the ARTofMELT Science Team: Arctic spring and the onset of sea-ice melt: Early impressions from the ARTofMELT expedition, EGU General Assembly 2024, Vienna, Austria, 14–19 Apr 2024, EGU24-15627, https://doi.org/10.5194/egusphere-egu24-15627, 2024. a, b
Uttal, T., Curry, J. A., McPhee, M. G., Perovich, D. G., Moritz, R. E., Maslanik, J. A., Guest, P. S., Stern, H. L., Moore, J. A., Turenne, R., Heiberg, A., Serreze, M. C., Wylie, D. P., Persson, O. G., Paulson, C. A., Halle, C., Morison, J. H., Wheeler, P. A., Makshtas, A., Welch, H., Shupe, M. D., Intrieri, J. M., Stamnes, K., Lindsey, R. W., Pinkel, R., Pegau, W. S., Stanton, T. P., and Grenfeld, T. C.: Surface Heat Budget of the Arctic Ocean, Bulletin of the American Meteorological Society, 18, 255–276, 2003. a
Walsh, J. E., Zhou, X., Portis, D., and Serreze, M. C.: Atmospheric contribution to hydrologic variations in the Arctic, Atmos. Ocean, 32, 733–755, 1994. a, b
Walter, B. A., Overland, J. E., and Turet, P.: A comparison of satellite-derived and aircraft-measured regional surface sensible heat fluxes over the Beaufort Sea, J. Geophys. Res.-Oceans, https://doi.org/10.1029/94JC02653, 1995. a
Wegener, A.: Thermodynamik der Atmosphäre, in: Anwendung der Thermodynamik, Springer, 156–189, https://doi.org/10.1007/978-3-642-90779-1_3, 1926. a
Winker, D. M., Vaughan, M. A., Omar, A., Hu, Y., Powell, K. A., Liu, Z., Hunt, W. H., and Young, S. A.: Overview of the CALIPSO mission and CALIOP data processing algorithms, J. Atmos. Ocean. Tech., 26, 2310–2323, 2009. a
- Abstract
- Introduction
- Data
- Cloud climatologies above the Arctic sea-ice covered region
- Role of moisture intrusion on spring cloud onset
- Water vapor and ice particle observations
- Role of phase transition on spring cloud onset
- Conclusions
- Appendix A: Incoming solar radiation
- Appendix B: Sensitivity of ground-based lidar to vertical resolution
- Appendix C: Sensitivity of ground-based lidar to cloud detection threshold
- Appendix D: Relationship between scattering ratio and cloud phase
- Appendix E: Comparison between ERA5 and MOSAiC radiosondes
- Appendix F: Case studies of Spring 2015
- Appendix G: Spring temperature increase over sea-ice
- Appendix H: CALIPSO Arctic spatial sampling
- Appendix I: Interannual variability
- Appendix J: Poleward moisture flux sensitivity
- Data availability
- Author contributions
- Competing interests
- Disclaimer
- Acknowledgements
- Financial support
- Review statement
- References