the Creative Commons Attribution 4.0 License.
the Creative Commons Attribution 4.0 License.
 | 24 Mar 2026
Spatiotemporal patterns of temperature inversions and impacts on surface PM2.5 across China
Yonglin Fang
Hancheng Hu
Xiangdong Zheng
Jianping Guo
Xingbing Zhao
Fang Ma
Hao Wu
Temperature inversions (TIs) strongly regulate the accumulation and dispersion of air pollutants, yet their nationwide impacts on surface PM2.5 remain poorly quantified. Here we integrate high-resolution L-band radiosonde profiles with PM2.5 monitoring data from 2016–2021 to characterize the frequency, strength, thickness, and diurnal variability of TIs – including surface-based inversions (SBIs) and elevated inversions (EIs) – across mainland China. We show that TIs are pervasive, occurring on average 52 % of days, with mean strength of 2.1 °C and thickness of 214 m, and are more common at 08:00 than 20:00 Beijing Time (BJT). Distinct regional patterns emerge: SBIs dominate in northern China, whereas EIs prevail in eastern China. Overall, SBIs are 1.3 °C stronger than EIs. TIs intensify seasonal pollution, with 76 % of PM2.5 episodes coinciding with inversion events. SBI strength correlates positively with PM2.5 concentrations nationwide, while EI parameters show negative associations in eastern and southern regions. These findings reveal the spatiotemporal dynamics of TIs, establish quantitative links to surface pollution, and highlight regionally divergent mechanisms, providing critical insight for air-quality forecasting and targeted emission control.
- Article
(9735 KB) - Full-text XML
-
Supplement
(6890 KB) - BibTeX
- EndNote


Fine particulate matter (PM2.5, aerodynamic diameter ≤ 2.5 µm) is a dominant component of atmospheric aerosols and a key indicator and a primary pollutant of air pollution in China (Liang et al., 2021; Luo et al., 2024; Yan et al., 2023; Zang et al., 2021). Over the past two decades, recurrent severe haze episodes characterized by elevated PM2.5 levels have imposed substantial public health burdens, including respiratory, cardiovascular, and reproductive impairments, as well as increased cancer risk (Chan and Yao, 2008; Yan et al., 2021; Garcia et al., 2023; Rentschler and Leonova, 2023; Zuo et al., 2023; Chen et al., 2025). In response, stringent emission control policies since 2013 have markedly improved air quality, with annual mean PM2.5 concentrations declining from 68 µg m−3 in 2013 to 29 µg m−3 in 2022 (Meng et al., 2023; Peng et al., 2025; Zou et al., 2025). Nevertheless, seasonal pollution episodes remain acute, particularly in the Beijing–Tianjin–Hebei (BTH) region, where the 2022 annual mean still reached 44 µg m−3 (Ministry of Ecology and Environment the People's Republic of China, 2022), exceeding the World Health Organization's Stage-1 interim target of 35 µg m−3 (WHO, 2021). Growing evidence shows that such extreme events are not solely determined by anthropogenic emissions but are strongly modulated by adverse meteorological conditions, among which temperature inversion (TI) plays a pivotal role (Feng et al., 2020; Morawska et al., 2021; Deng et al., 2022; Shao et al., 2023; Sun et al., 2025).
In meteorology, TI refers to the anomalous increase of temperature with altitude, most frequently observed in the lower troposphere. TIs arise through multiple mechanisms, including nocturnal radiative cooling, warm-air advection, topographic confinement, as well as under specific synoptic conditions such as stationary high-pressure systems (subsidence warming) and frontal zones (Vihma et al., 2011; Kassomenos et al., 2014; Largeron and Staquet, 2016; Xu et al., 2019). Surface-based inversions (SBIs) typically form at night when radiative cooling produces a shallow, stable layer of cold air near the surface, which usually dissipates after sunrise or under strong winds (> 20 km h−1) (Czarnecka et al., 2019). In contrast, elevated inversions (EIs) are often associated with synoptic-scale phenomena. Key driving mechanisms include synoptic-scale warm advection, subsidence within high-pressure systems, and frontal overrunning (Huang et al., 2021; Palarz et al., 2018).
The presence of TI suppresses turbulent mixing, strengthens atmospheric stability, and traps pollutants near the surface (Kahl, 1990; Zhong et al., 2018). Within the boundary layer, this stable stratification creates a pronounced “capping effect” that critically limits vertical pollutant dispersion (Stull, 1988). The resulting suppression of atmospheric pollutant dispersion and transport operates through three interconnected mechanisms. First, the inversion layer itself acts as a meteorological cap, inhibiting vertical mixing and fostering rapid near-surface accumulation of aerosols (Zhong et al., 2017). Second, synoptic conditions conducive to inversion formation – particularly for surface-based inversions – are often accompanied by weak horizontal winds, further restricting advective transport (Yang and Shao, 2021). Third, the persistence of inversions, especially under wintertime high-pressure systems, prolongs pollution episodes over multiple days, allowing progressive buildup of PM2.5 and compounding air quality deterioration (Feng et al., 2020). Collectively, these processes establish TIs as a pivotal meteorological driver of severe pollution across diverse regions.
Extensive research over the past two decades has examined the characteristics of TIs and their interactions with air pollution (Rendón et al., 2015; Wolf et al., 2014; Wu et al., 2014; Yin et al., 2021). Early studies highlighted their synoptic controls: Milionis and Davies (1992) identified upper-level inversions between 950–800 hPa over Hemsby, UK, primarily associated with subsidence within anticyclonic systems. At a continental scale, Zhang et al. (2011) analyzed radiosonde data from 50 US stations and showed that lower-tropospheric inversions (LTIs) are widespread, with strong zonal wind shear playing a key role in their formation. More recently, advanced remote sensing has enabled quantitative assessment of inversion–aerosol interactions. For example, Liu et al. (2022) combined lidar and radiosonde measurements over the Southern Great Plains to demonstrate that inversion intensity critically determines the aerosol-trapping capacity of the boundary layer.
Nonetheless, most existing studies remain limited to individual cities or specific regions. For example, Wallace and Kanaroglou (2009) showed that nocturnal inversions in Hamilton, Canada increased PM2.5 concentrations by 54 %, with mobile observations further revealing the reinforcing role of local topography in inversion formation and pollutant buildup. In China, Xu et al. (2019) reported that 93 % of heavy pollution episodes in Beijing coincided with inversion conditions, while Feng et al. (2020) found that winter inversions in the Sichuan Basin elevated PM2.5 levels by 64.7 % compared with non-inversion days. Beyond China, Lagmiri and Dahech (2024) identified inversions as the dominant driver of particulate pollution in Cergy-Pontoise, France, with nearly 80 % of PM10 exceedances occurring under inversion conditions persisting 1–3 d in winter. Structural analyses have also revealed multi-layer inversion systems: Li et al. (2012) described a four-tiered inversion structure over central China, linking mid-tropospheric inversions to synoptic cold fronts and regional advection, while upper-level inversions exhibited strong latitudinal dependence.
While these studies underscore the critical role of inversions in pollution accumulation, substantial knowledge gaps remain regarding their nationwide patterns and interactions with PM2.5 across China's diverse climatic and topographic settings. The country's complex geography – spanning plains, basins, and plateaus – produces pronounced regional heterogeneity in inversion mechanisms and vertical structures (Yang et al., 2025). For instance, the North China Plain is frequently subjected to strong wintertime SBIs, whereas the Sichuan Basin is characterized by deep, persistent inversions confined by topography (Guo et al., 2020; Huang et al., 2021; Xu et al., 2021). Such spatial variability drives region-specific impacts on PM2.5 accumulation, underscoring the need for systematic, high-resolution observational analyses. Although Yang and Shao (2021) documented a nationwide increase in inversion frequency over the past three decades using reanalysis products, the coarse vertical resolution of datasets such as ERA5 (25 hPa layers) hampers accurate representation of inversion structure. Similarly, radiosonde-based studies (Guo et al., 2020; Huang et al., 2021; Xu et al., 2021) have provided valuable regional insights but fall short of offering a comprehensive national-scale assessment of boundary-layer inversions and their impacts on PM2.5 pollution.
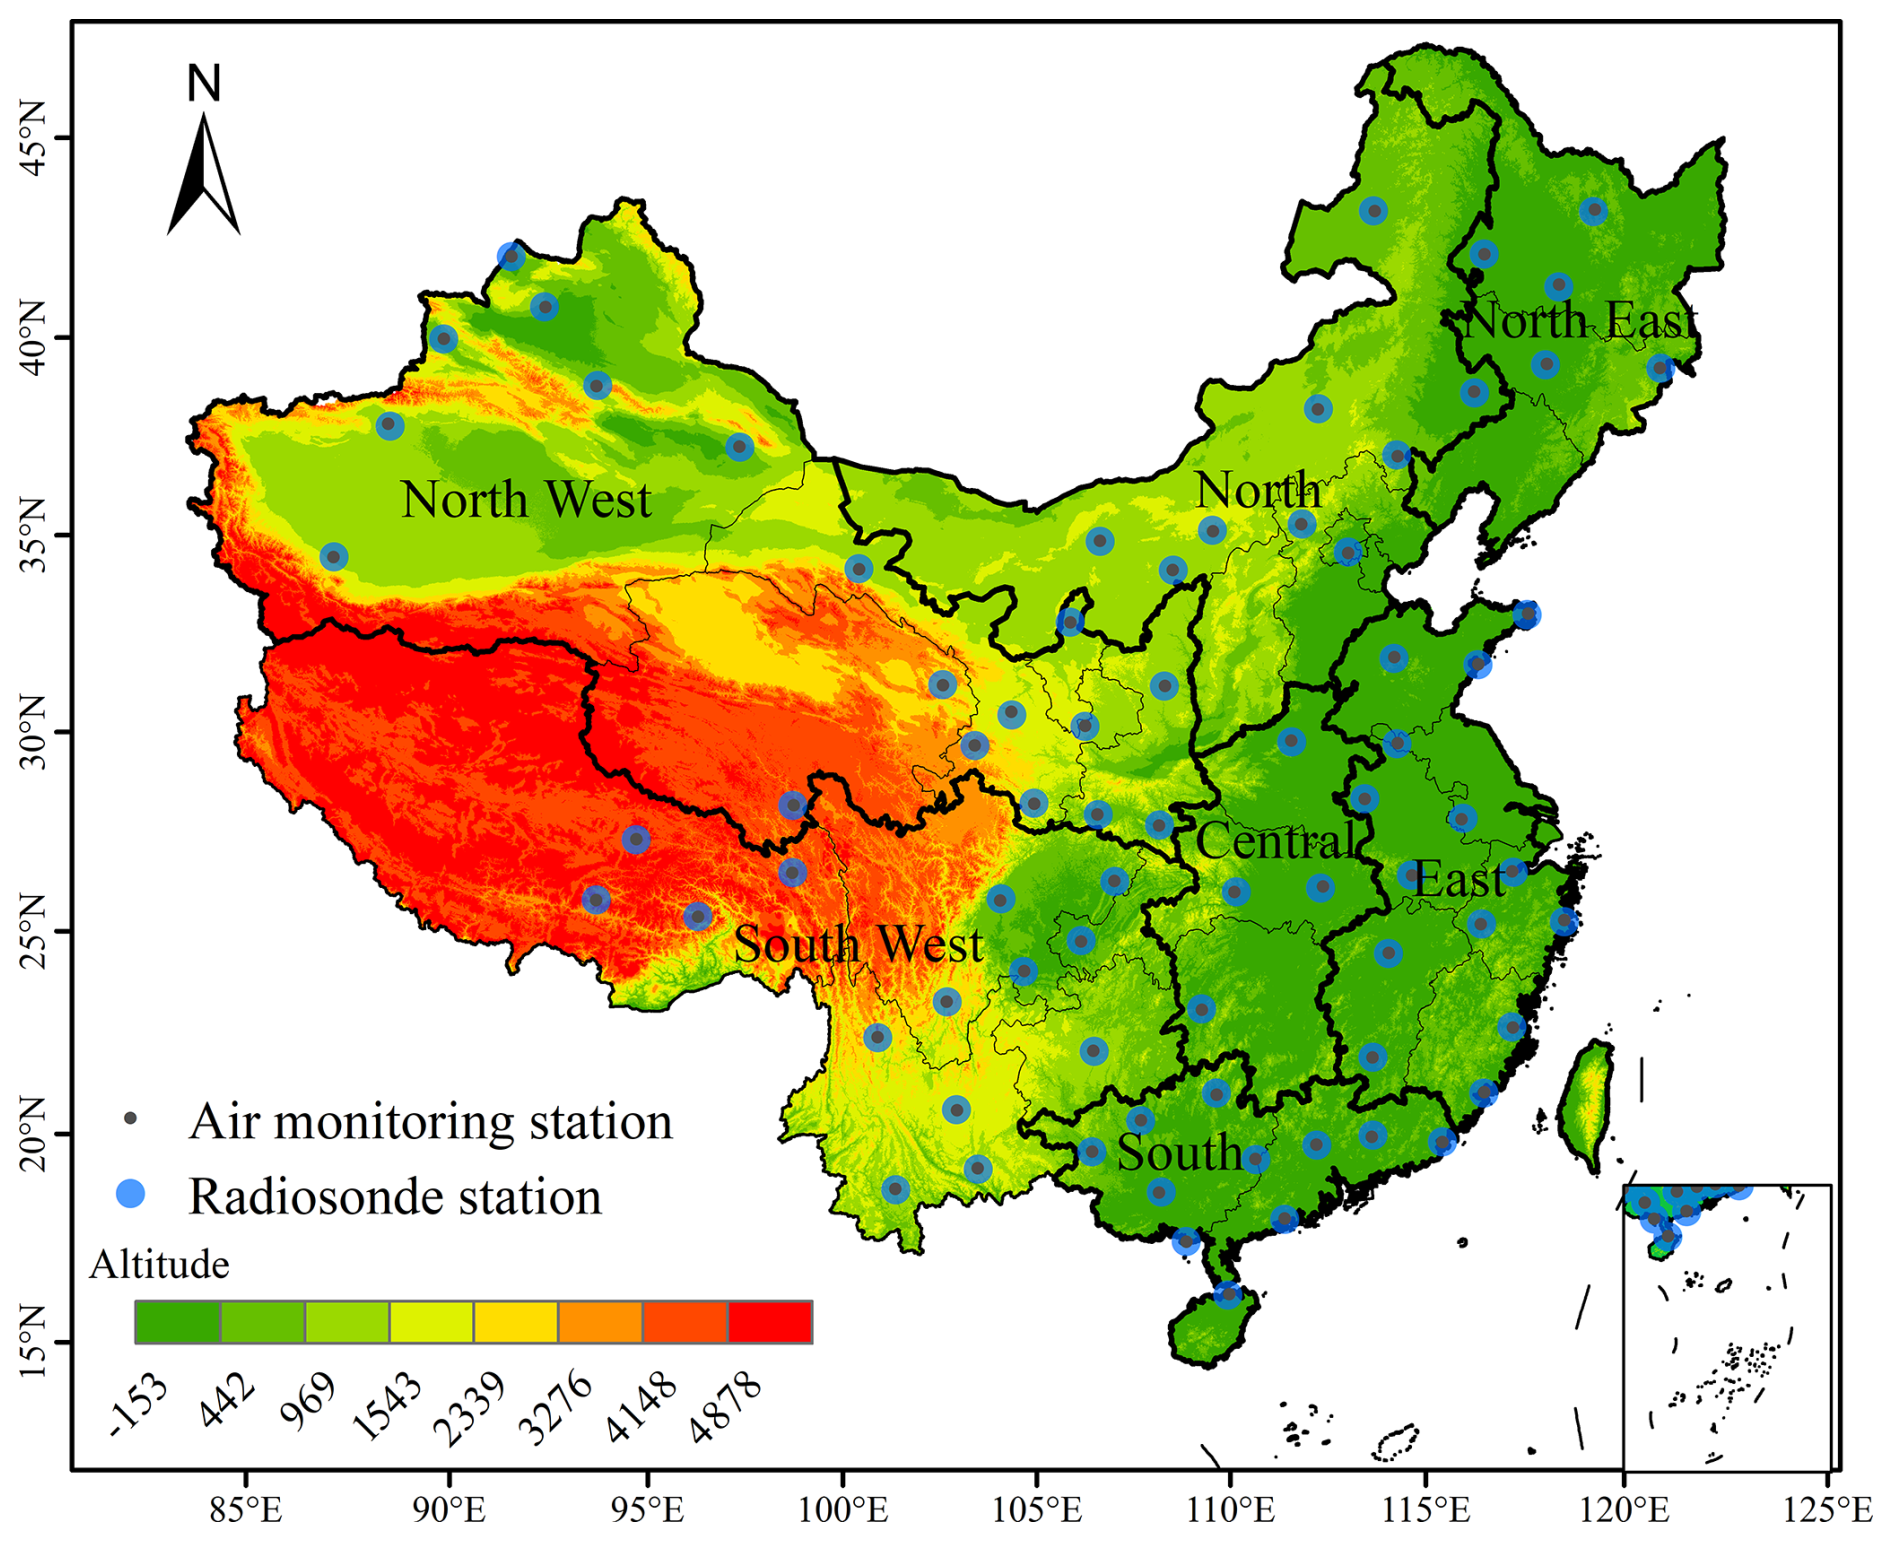
Figure 1Distribution of 75 radiosonde stations in China. The inset map in the lower right shows the South China Sea Islands.
In this study, we employ high–vertical-resolution radiosonde observations (6–8 m) from 2016 to 2021 to accurately detect inversion layers and their vertical structures, thereby overcoming the coarse limitations of reanalysis data. By integrating these measurements with nationwide PM2.5 monitoring records from the Ministry of Ecology and Environment, we systematically characterize the spatiotemporal distribution of TIs across China, quantify the distinct impacts of SBI and EI on surface PM2.5 concentrations, and establish dynamic relationships between inversion parameters and pollution levels. These findings provide new mechanistic insight into inversion–pollution interactions and offer scientific support for region-specific air quality forecasting and management.
2.1 Study area
Our analysis covers mainland China, a region of vast spatial extent and pronounced physiographic complexity where monsoonal and continental regimes interact to produce strong environmental heterogeneity. To capture this diversity, we partition the domain (excluding Hong Kong, Macau, and Taiwan owing to data limitations) into seven regions based on standard administrative divisions, integrated meteorological characteristics and major urban agglomerations (Fig. 1). The Northeast (NE) – a traditional industrial base with cold, dry winters – features emissions dominated by coal-fired heating and heavy industry. North China (NC), including the Beijing–Tianjin–Hebei megacity cluster, is characterized by dense population, intensive industrial and vehicular activity, and frequent severe haze. The Northwest (NW) comprises plateaus, basins, and deserts under a continental climate with strong insolation and large diurnal temperature ranges; dust and energy/chemical sectors are major contributors. East China (EC) and South China (SC) lie in the East Asian monsoon zone and are among the most economically active regions, influenced by industrial and traffic emissions and regional transport. Central China (CC), located in the heart of the country, experiences a transitional monsoon climate between the northern subtropical and warm temperate zones, characterized by a terrain dominated by plains and hills. Pollutants tend to accumulate in basins such as the Jianghan–Dongting Basin due to the region's enclosed topography and stable atmospheric conditions, where they further combine with polluted air masses transported from the north, resulting in regional and complex air pollution. The Southwest (SW) – spanning the Tibetan Plateau, the Yunnan–Guizhou Plateau, and the Sichuan Basin – is the most topographically and climatically diverse, where topographic confinement and local circulations strongly modulate pollution composition and evolution.
2.2 Data
Radiosonde observations. We use L-band high-resolution sounding data from the operational network of the China Meteorological Administration (CMA). Since nationwide deployment in 2011, the system has routinely operated ∼ 120 radiosonde stations with standard launches at 08:00 and 20:00 BJT (00:00 and 12:00 UTC), with additional warm-season soundings (May–August) to capture monsoon processes (Guo et al., 2016; Yan et al., 2020). The GTS1 digital radiosonde provides vertical profiles of temperature, pressure, humidity, wind speed, and direction from the surface (0 ) to ∼ 30 km, with 5–8 m nominal vertical resolution (sampling frequency 1.2 s). By integrating in-situ observations from the co-located surface weather station as the initial record, the valid bottom height for all profiles is strictly maintained at 0 m. Independent assessments indicate temperature errors < 0.1 K in the troposphere and data quality comparable to internationally recognized radiosondes within the planetary boundary layer (Ma et al., 2010). These measurements have been widely applied to studies of cloud microphysics, PBL height, and inversion detection, and as inputs to numerical weather prediction and atmospheric composition research (Li et al., 2019; Zang et al., 2017; Zhang et al., 2020). For this study (2016–2021), we applied routine quality control to remove obvious temperature/height outliers and used the full-resolution vertical profiles to identify inversion layers and derive their properties.
Surface PM2.5 monitoring. Hourly PM2.5 concentrations were obtained from the national air-quality monitoring network operated by the China National Environmental Monitoring Centre (CNEMC; real-time platform: https://www.cnemc.cn/en/, last access: 10 March 2026) (Miao et al., 2020; Yan et al., 2020). As of 1 March 2022, the network comprised 2026 stations with dense coverage in eastern urban clusters and relatively sparse representation in western high-altitude regions. To match radiosonde stations with PM2.5 monitors, we used a distance threshold method with a 10 km search radius. This approach identified 75 valid station pairs, balancing spatial representativeness and sample size (Fig. 1). The 10 km threshold avoids underrepresentation from smaller radii and minimizes spatial error from larger distances, representing the point where further increases yield diminishing returns in matches (the distribution of original sites and the screening method are referenced in Figs. S1 and S2 in the Supplement). For temporal alignment with the soundings, hourly PM2.5 records were extracted around 08:00 and 20:00 BJT. Basic completeness checks and standard plausibility screening were applied before analysis.
Rationale for integration. The combination of meter-scale-resolution vertical thermodynamic profiles with collocated surface PM2.5 enables a consistent, observation-based assessment of inversion frequency, intensity, and thickness – and their diurnal and regional variability – while overcoming the coarse vertical structure inherent in reanalysis products (Li et al., 2019; Yan et al., 2020; Zhang et al., 2020).
The sounding data underwent manual quality control to identify and systematically remove obvious errors in temperature and height measurements. Raw temperature profiles were first interpolated using cubic splines to ensure vertical continuity. TIs were then identified by applying a first-derivative algorithm to the smoothed profiles (Kahl, 1990; Serreze et al., 1992). Each profile was scanned upward from the surface; layers exhibiting a positive vertical temperature gradient were classified as inversion layers, while those with negative gradients were considered non-inversion zones. The base height of an inversion layer was defined as the lowest altitude at which temperature began to increase with height, and the top height was identified as the point where the gradient reverted to negative. Following Kahl et al. (1996), three fundamental TI parameters were derived: inversion thickness (ΔH), inversion strength (ΔT), inversion frequency (FTI). They are defined as:
where Ht and Hb represent the top and bottom heights of the TI layer, respectively; Tt and Tb represent the temperatures at the top and bottom, respectively; N represents the total number of detections, NTI represents the number of detections where TI occurs, and NSBI and NEI represent the number of detections where SBI and EI occur, respectively.
To mitigate false positives from small-scale turbulence (e.g., “sawtooth” noise in balloon-borne measurements), thresholds for ΔH and ΔT were imposed per established practices (Guo et al., 2020; Kahl, 1990). A layer was classified as a valid TI only if ΔH≥ 100 m and ΔT≥ 0.5 °C; otherwise, it was discarded. Non-inversion layers embedded within broader TIs were permitted, provided the overarching TI met these criteria. The temperature profile was scanned upward from the surface, and the first continuous layer satisfying ΔH≥ 100 m and ΔT≥ 0.5 °C was identified as the inversion for that sounding. To specifically target thermodynamic processes influencing surface air quality, this study considers only inversion layers with a base height Hb≤ 2000 m. Inversion can also be classified into SBI and EI based on the base height. When Hb < 100 m, it is called Surface-based inversion (SBI); when 100 m < Hb≤ 2000 m, it is called Elevated inversion (EI). For additional validation at different thickness thresholds, please refer to supplementary Figs. S18–S20 in the Supplement. Theoretical calculations indicate that each station should have a total of 4384 soundings at 12 h intervals from 2016 to 2021. In practice, however, data omissions occurred due to various factors, resulting in an average missing rate of 3.2 % for TI data in the final statistics.
According to China's National Ambient Air Quality Standards (GB3095-2012), the standard for a pollution event is based on a daily mean PM2.5 concentration exceeding 75 µg m−3. In this study, to align with the instantaneous radiosonde observations at 08:00 and 20:00 BJT, we applied this concentration threshold 75 µg m−3 to the hourly PM2.5 data to identify pollution events corresponding to the sounding times. PM2.5 concentrations are further classified into six categories: Excellent: 0–35 µg m−3; Good: 35–75 µg m−3; Light pollution: 75–115 µg m−3; Moderate pollution: 115–150 µg m−3; Severe pollution: 150–250 µg m−3; Extreme pollution: > 250 µg m−3. To align with the spatiotemporal characteristics of the radiosonde data, the hourly PM2.5 data were processed into two time periods corresponding to the radiosonde observations: 08:00 and 20:00 BJT.
4.1 Spatiotemporal distribution of atmospheric temperature inversions in China
The base height of TI sets the effective lid for vertical pollutant dispersion. To resolve its vertical structure within the boundary layer, we quantified the vertical distribution of inversion events. This is defined as the percentage of the total number of inversion events falling within each 100-m height bin from the surface to 2 km (Fig. 2). A distinct non-linear profile emerges: the TI proportion peaks sharply in the lowest 0–100 m bin, which comprises exclusively SBIs and accounts for 22.2 % of all inversion events. This peak is followed by a rapid decline to a minimum of 3.1 % at 600–700 m, and then a gradual recovery to 5.1 % at 1800–1900 m – i.e., a “rapid decline, then slow recovery” with height.
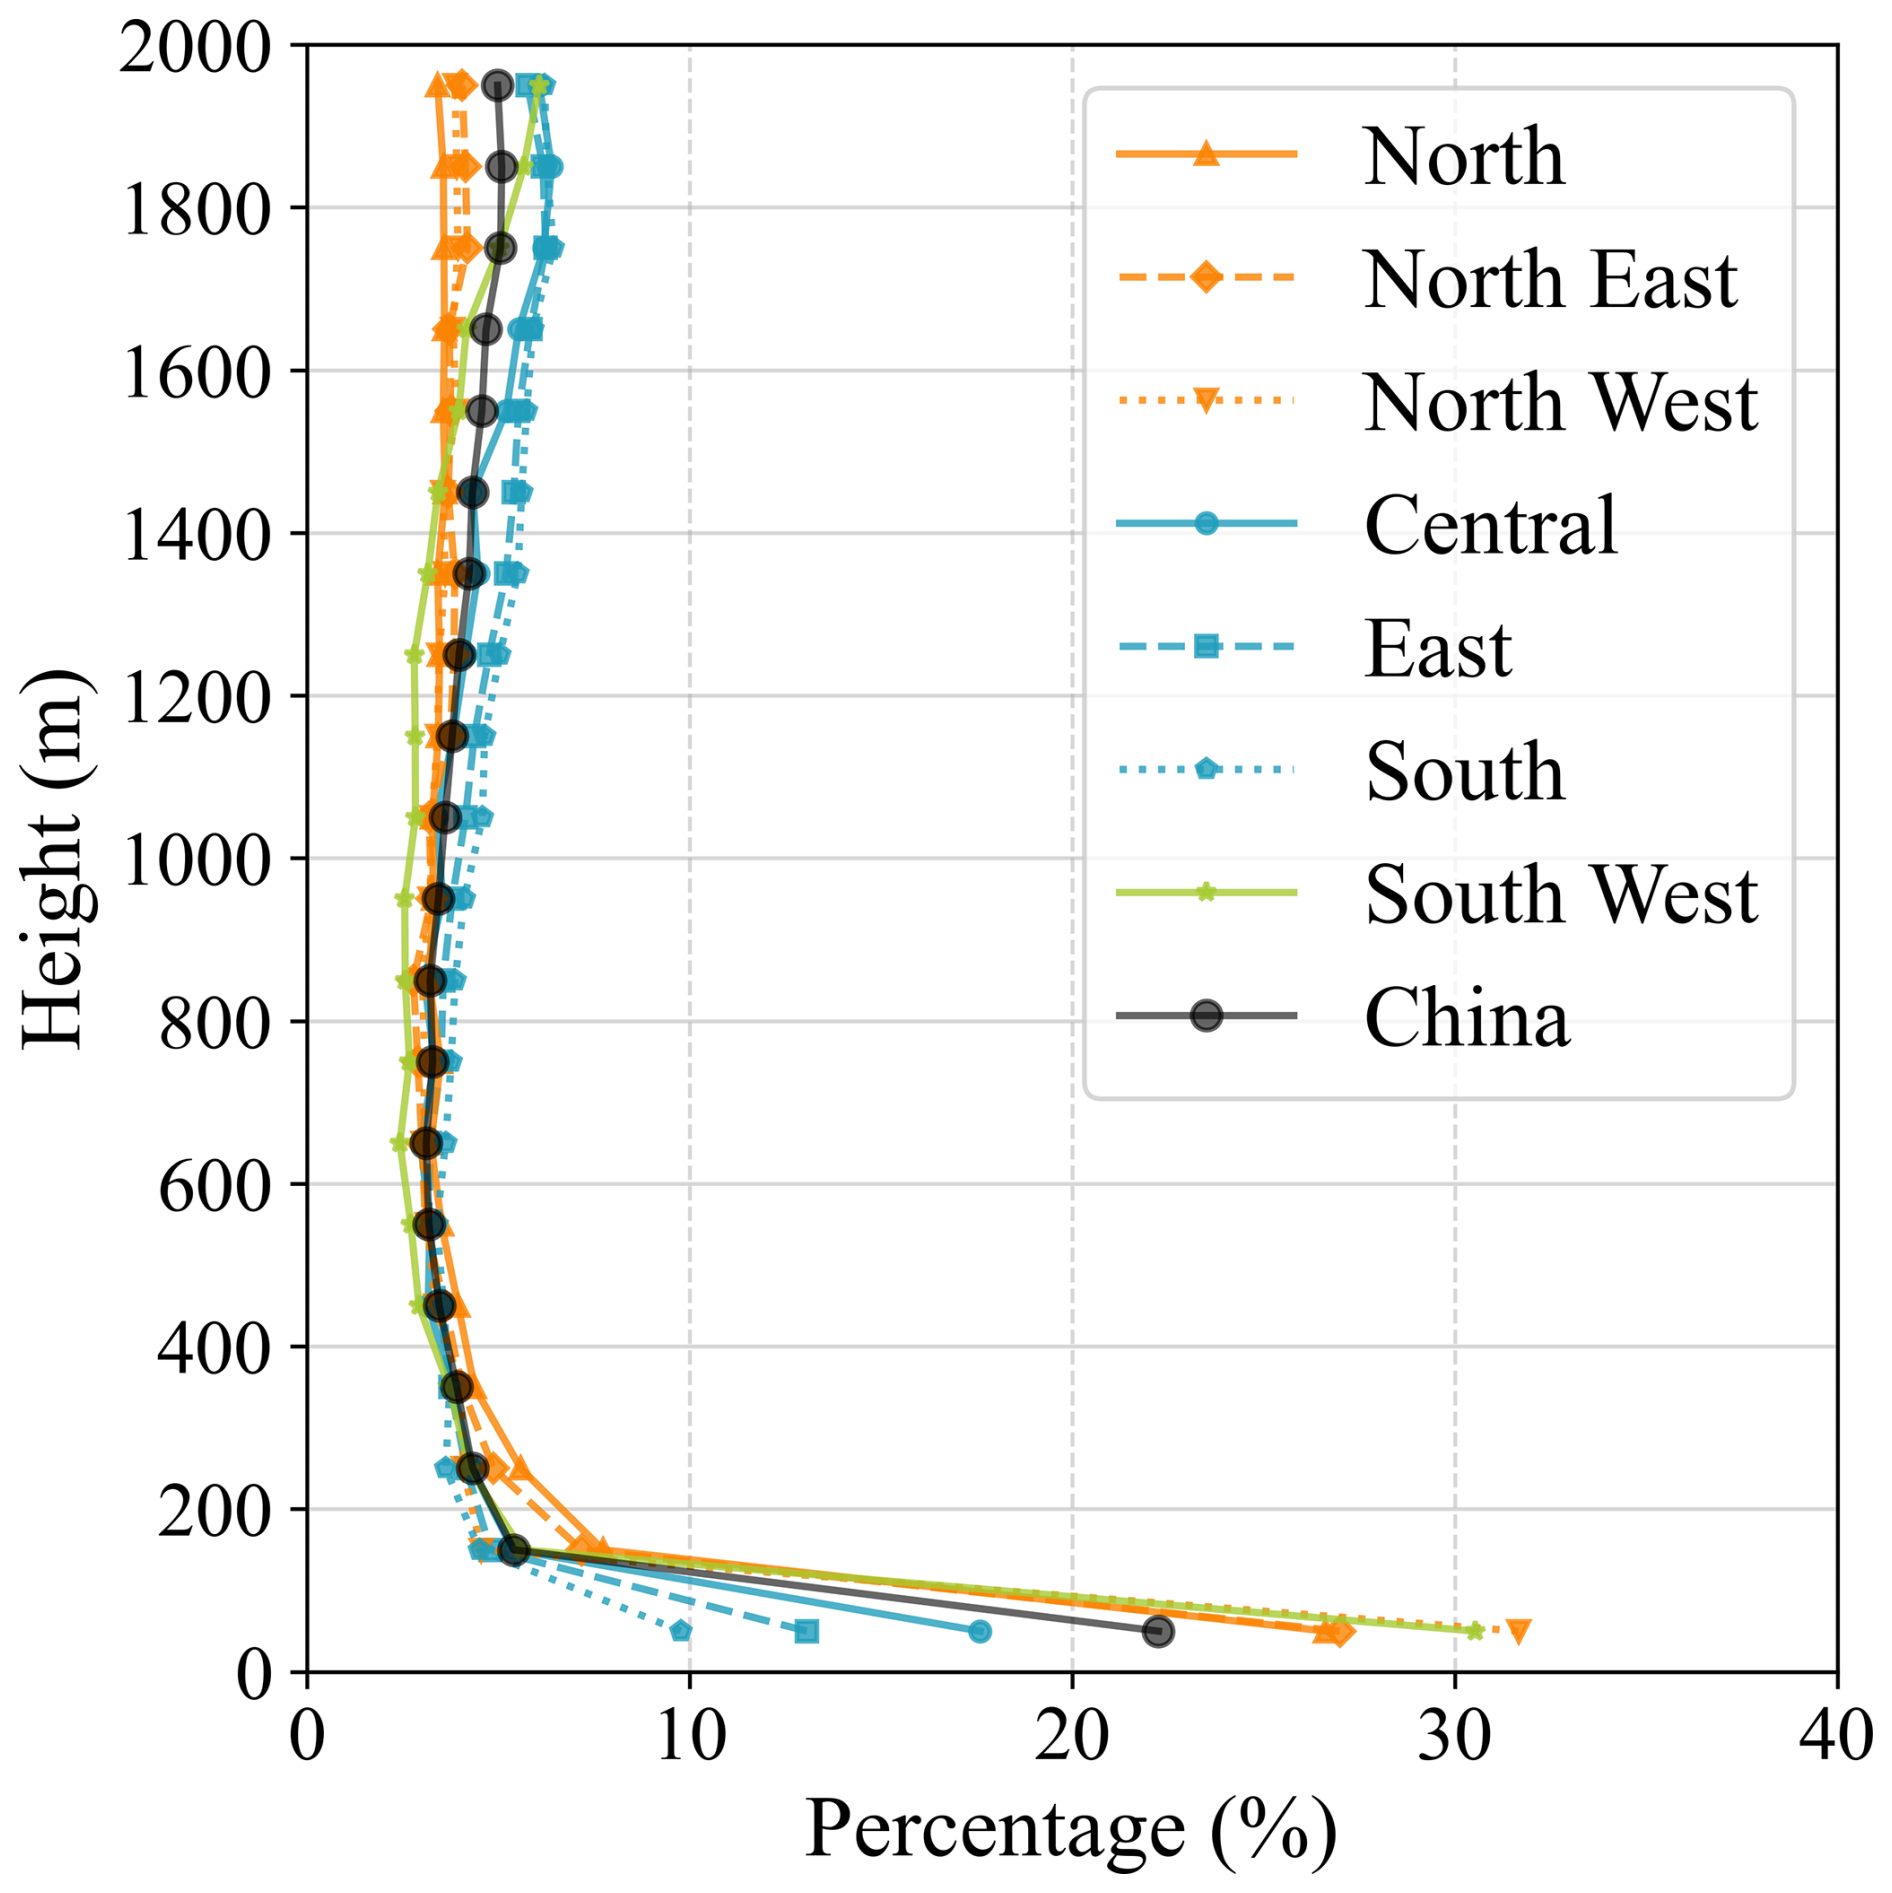
Figure 2Vertical distribution of inversion base height: fraction of total inversions per height bin.
Marked regional contrasts accompany this vertical pattern. In the near-surface layer (0–100 m, i.e., the SBI), the Northwest exhibits the highest TI proportion 31.6 %, followed by Southwest 30.5 %. In comparison, Central, East, and South China show lower near-surface SBI proportions, with South China the lowest 9.8 %. The pattern reverses aloft: for elevated inversions in the 1000–2000 m layer, South China records the highest proportion 56.0 %, whereas northern regions are much less affected. Taken together, intense near-surface trapping by SBIs preferentially occurs over inland northern and southwestern China, while EIs are more common and reach higher altitudes in the southeastern coastal belt. A potential driver of this dipole is the diurnal temperature range (DTR): larger DTRs over inland regions enhance nocturnal radiative cooling, favoring strong SBIs; weaker DTRs in maritime-influenced southeastern areas favor synoptic processes that produce EIs.
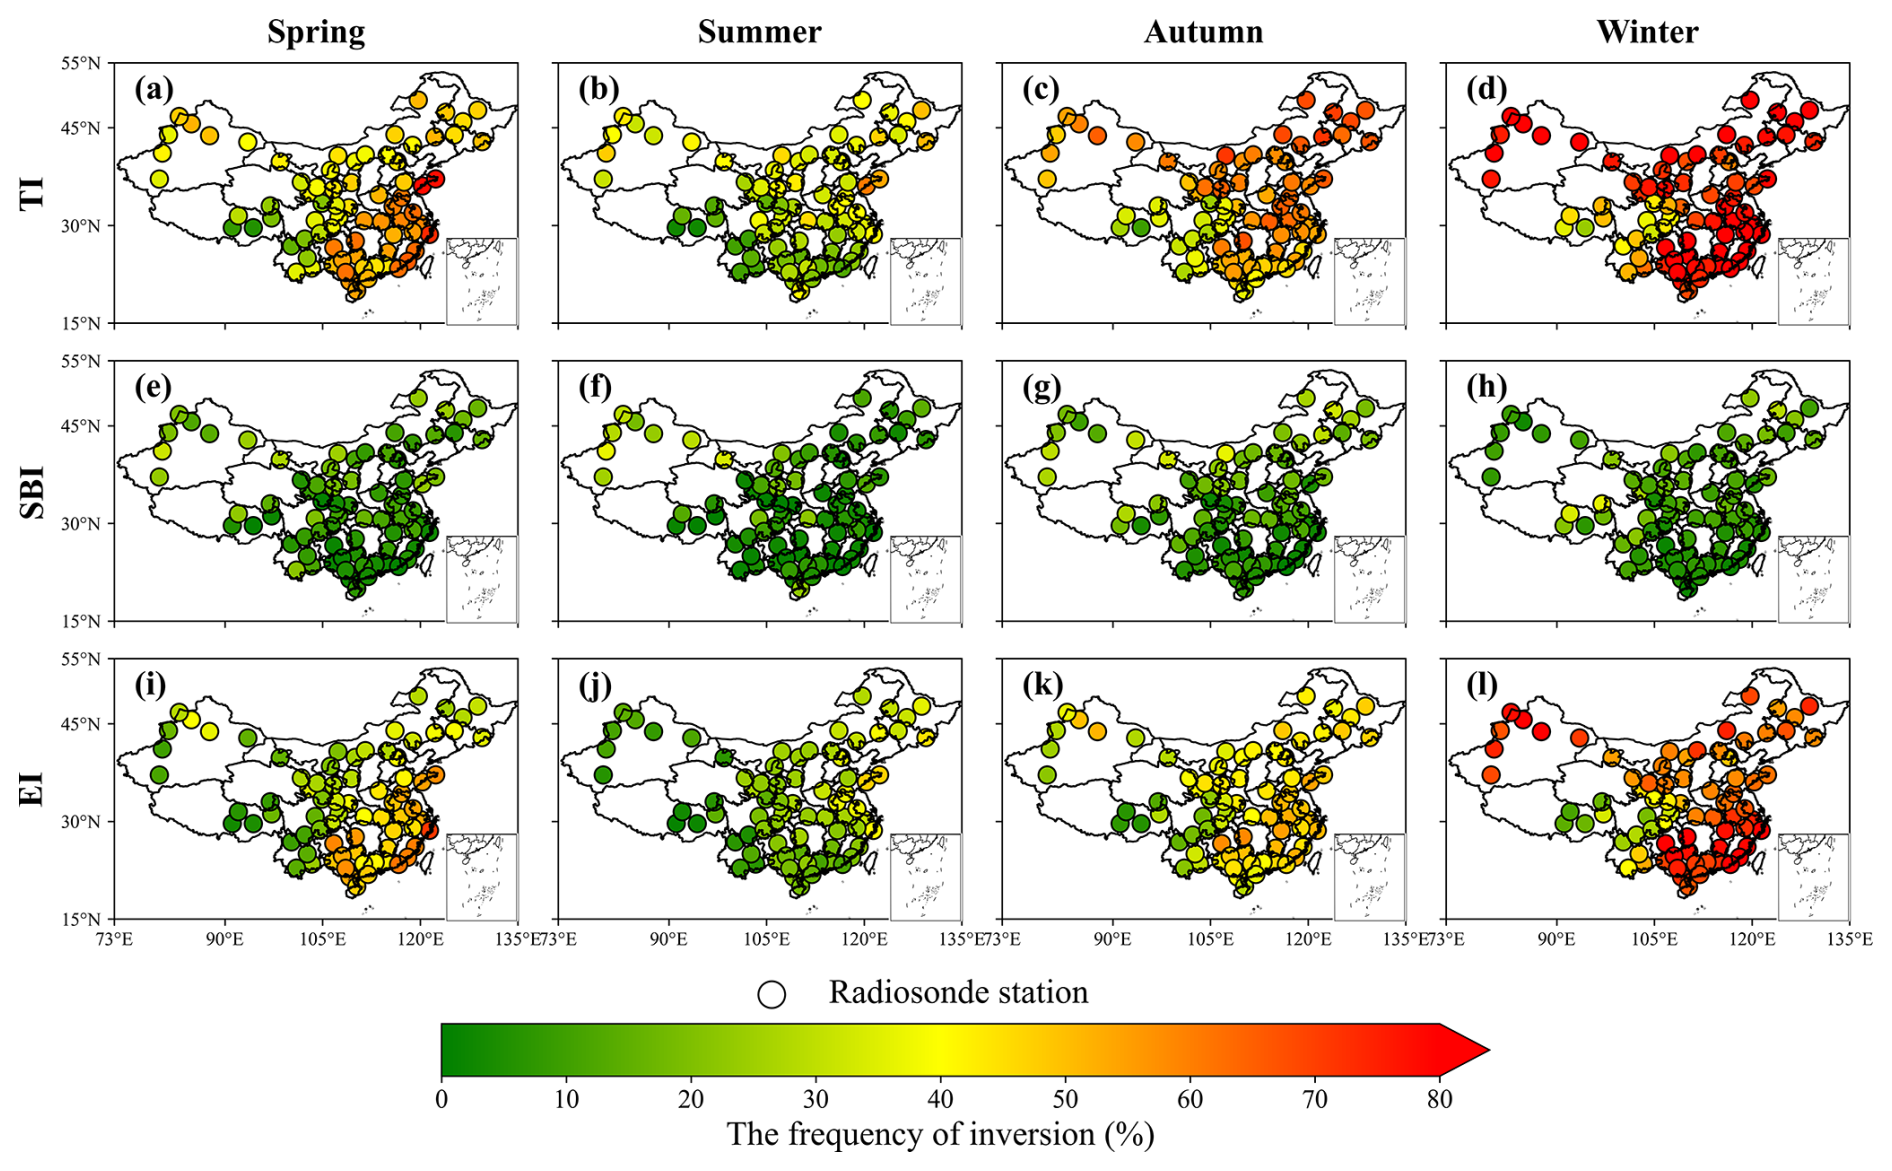
Figure 3Spatial and seasonal distribution of occurrence frequency for different types of TI. For more details about SBI, please refer to Fig. S15 in the Supplement.
4.1.1 Inversion frequency
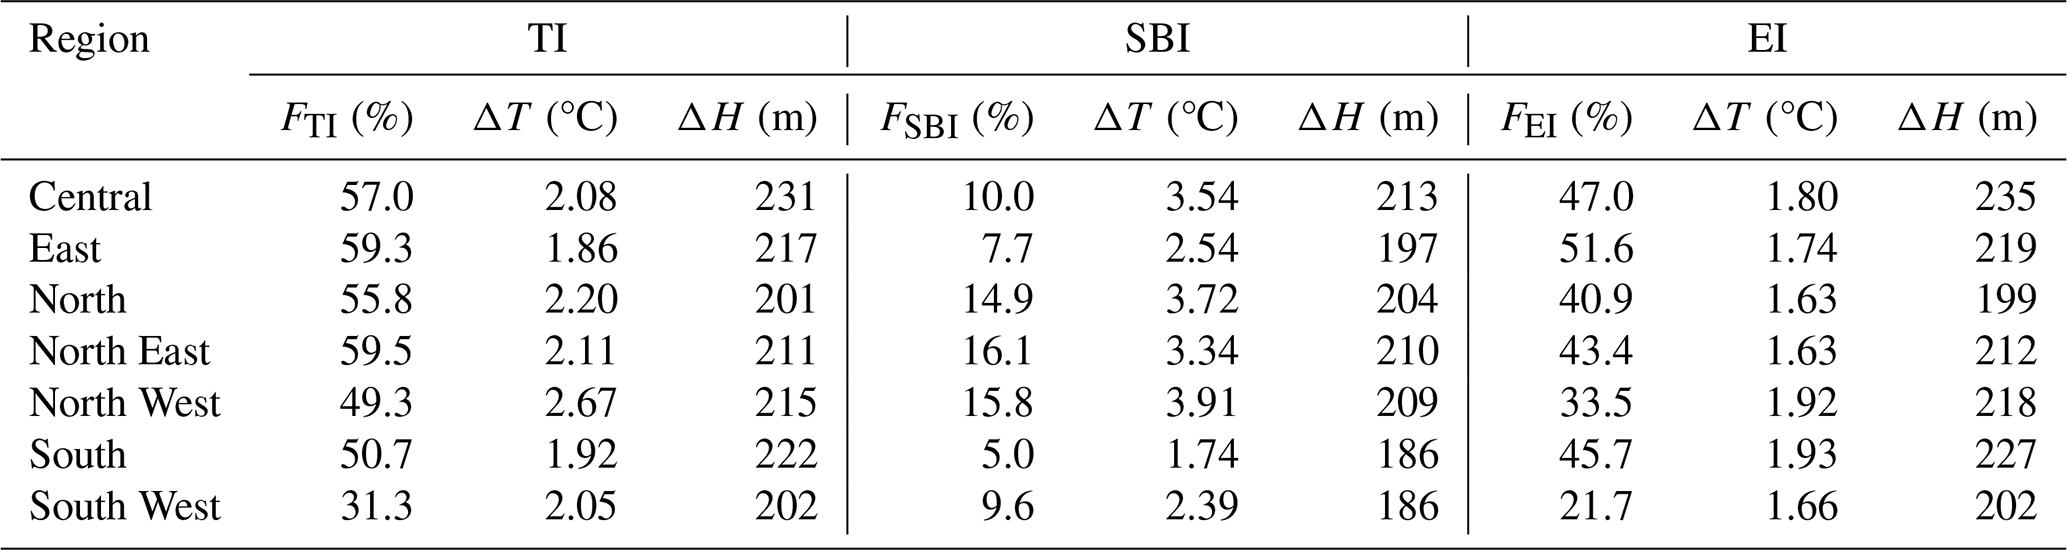
Figure 3 maps the spatial and seasonal variability of TI frequency over China (2016–2021), revealing pronounced regional heterogeneity. High TI occurrence is concentrated along the coasts (East and South China) and across northern China (Northeast, North, Northwest), yielding a national annual mean of 54.9 %. Regionally, Northeast China records the highest frequency (59.5 %), whereas the Southwest exhibits the lowest (31.3 %; Table 1). The suppressed occurrence in the Southwest likely reflects two factors: (i) in the Sichuan Basin, the dominant signal is lower-tropospheric inversions (LTIs) which typically occur at altitudes of 2200–3400 m – well above the 0–2000 m height range examined in this study – resulting in their exclusion from our frequency statistics, and (ii) plateau climate conditions – high elevation, strong solar radiation, low air density, and frequent strong winds linked to the westerly jet – enhance turbulent mixing and disrupt inversion persistence (Feng et al., 2020; Schiemann et al., 2009). National averages by type indicate SBIs ∼ 13 % and EIs ∼ 43 % annually (Fig. 4d and g). EIs dominate total events nationally. The two inversion types exhibit contrasting geography: SBIs cluster over northern China (Northeast, North, Northwest) with annual frequencies of 14.9 %–16.1 %, whereas EIs prevail across the southeastern coastal and central regions (South, East, Central China), averaging 48.1 % and peaking at 51.6 % in East China. This spatial dipole aligns with previous radiosonde climatologies, which report more frequent SBIs in northern/western China and EI dominance in the south and east (Huang et al., 2021). A persistent “east-high, west-low” gradient is also evident. One contributing factor is the fixed launch time relative to local solar time: China spans roughly five time zones, so the 08:00 BJT sounding corresponds to ∼ 05:00 local time in the far west, when nocturnal inversions may not yet have fully developed, biasing frequencies lower there.
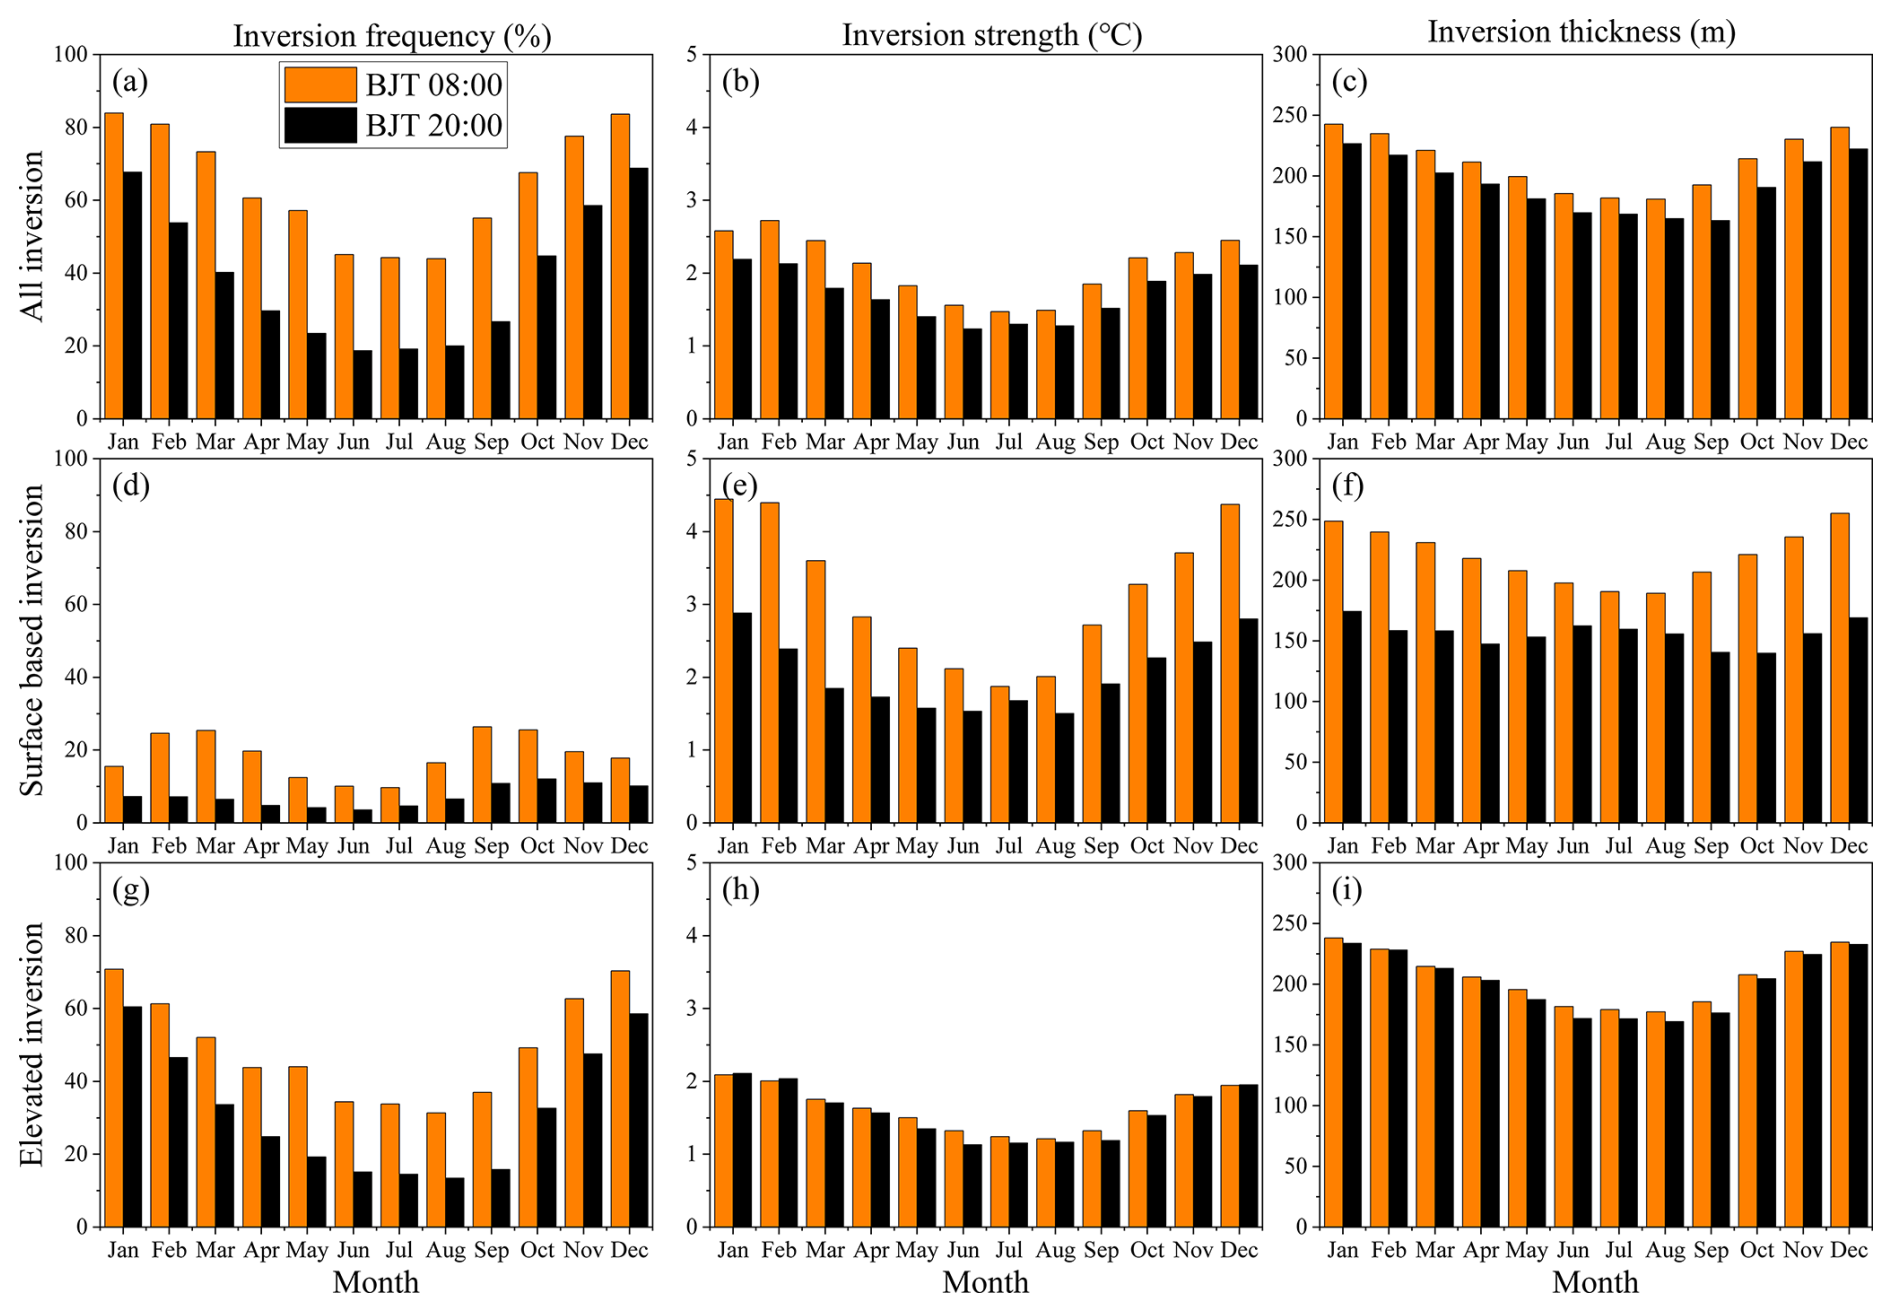
Figure 4a shows pronounced seasonality in TI occurrence. The highest monthly means occur at 08:00 BJT in January (84.0 %) and at 20:00 BJT in December (68.8 %), whereas minima appear in June (31.9 %) and August (32.0 %). SBI occurrence shows relatively high frequencies (> 24 %) in February, March, September, and October, whereas EI frequency exhibits a sharp, single peak in January (75.2 %). Seasonal contrasts are stark: inversions are most frequent in the cold season and relatively rare in the warm season. The spatial footprint of inversion-prone areas expands westward from summer to winter: in summer, only the Northeast exceeds 40 %, and the Southwest falls to 17.5 %; in winter, all regions except the Southwest surpass 70 %, reaching 80.5 % in the Northeast. SBIs and EIs share this seasonal phasing – winter maxima, summer minima – consistent with longer winter nights that enable sustained radiative cooling and stronger stability.
Further analysis (Figs. S5, S6 in the Supplement and 4a) shows a robust dawn–dusk asymmetry: inversions are more likely to occur at 08:00 BJT across all regions and seasons, with daytime launches accounting for 62 % of all TI detections. The contrast is strongest in summer, when 08:00 BJT inversions comprise 71 % of events, and weaker in winter (57 %). This seasonal modulation reflects differences in solar forcing. In summer, long days and short nights curtail both the formation window and stability of inversions: with sunrise near 05:20 BJT, 2–3 h of insolation have already eroded the nocturnal layer by 08:00 BJT, and by 20:00 BJT roughly 12 h of high-angle solar heating have largely dissipated residual stability – yielding a 26.4 % frequency gap between the two launch times. In winter, short days and long nights promote the development of deeper and more persistent inversions through enhanced radiative cooling. With sunrise as late as around 07:20 BJT, the weak early-morning insolation preceding the 08:00 BJT sounding is insufficient to dissipate the TI layer significantly. Furthermore, the wintertime atmosphere is significantly drier (Fig. S7 in the Supplement), which minimizes downward longwave radiation and thereby maximizes the efficiency of nocturnal surface cooling. The subsequent ∼ 10 h of low-angle daylight provide insufficient thermal energy to significantly disturb the stable surface layer before 20:00 BJT. Consequently, the 08:00–20:00 BJT frequency difference contracts to 14.8 % in winter.
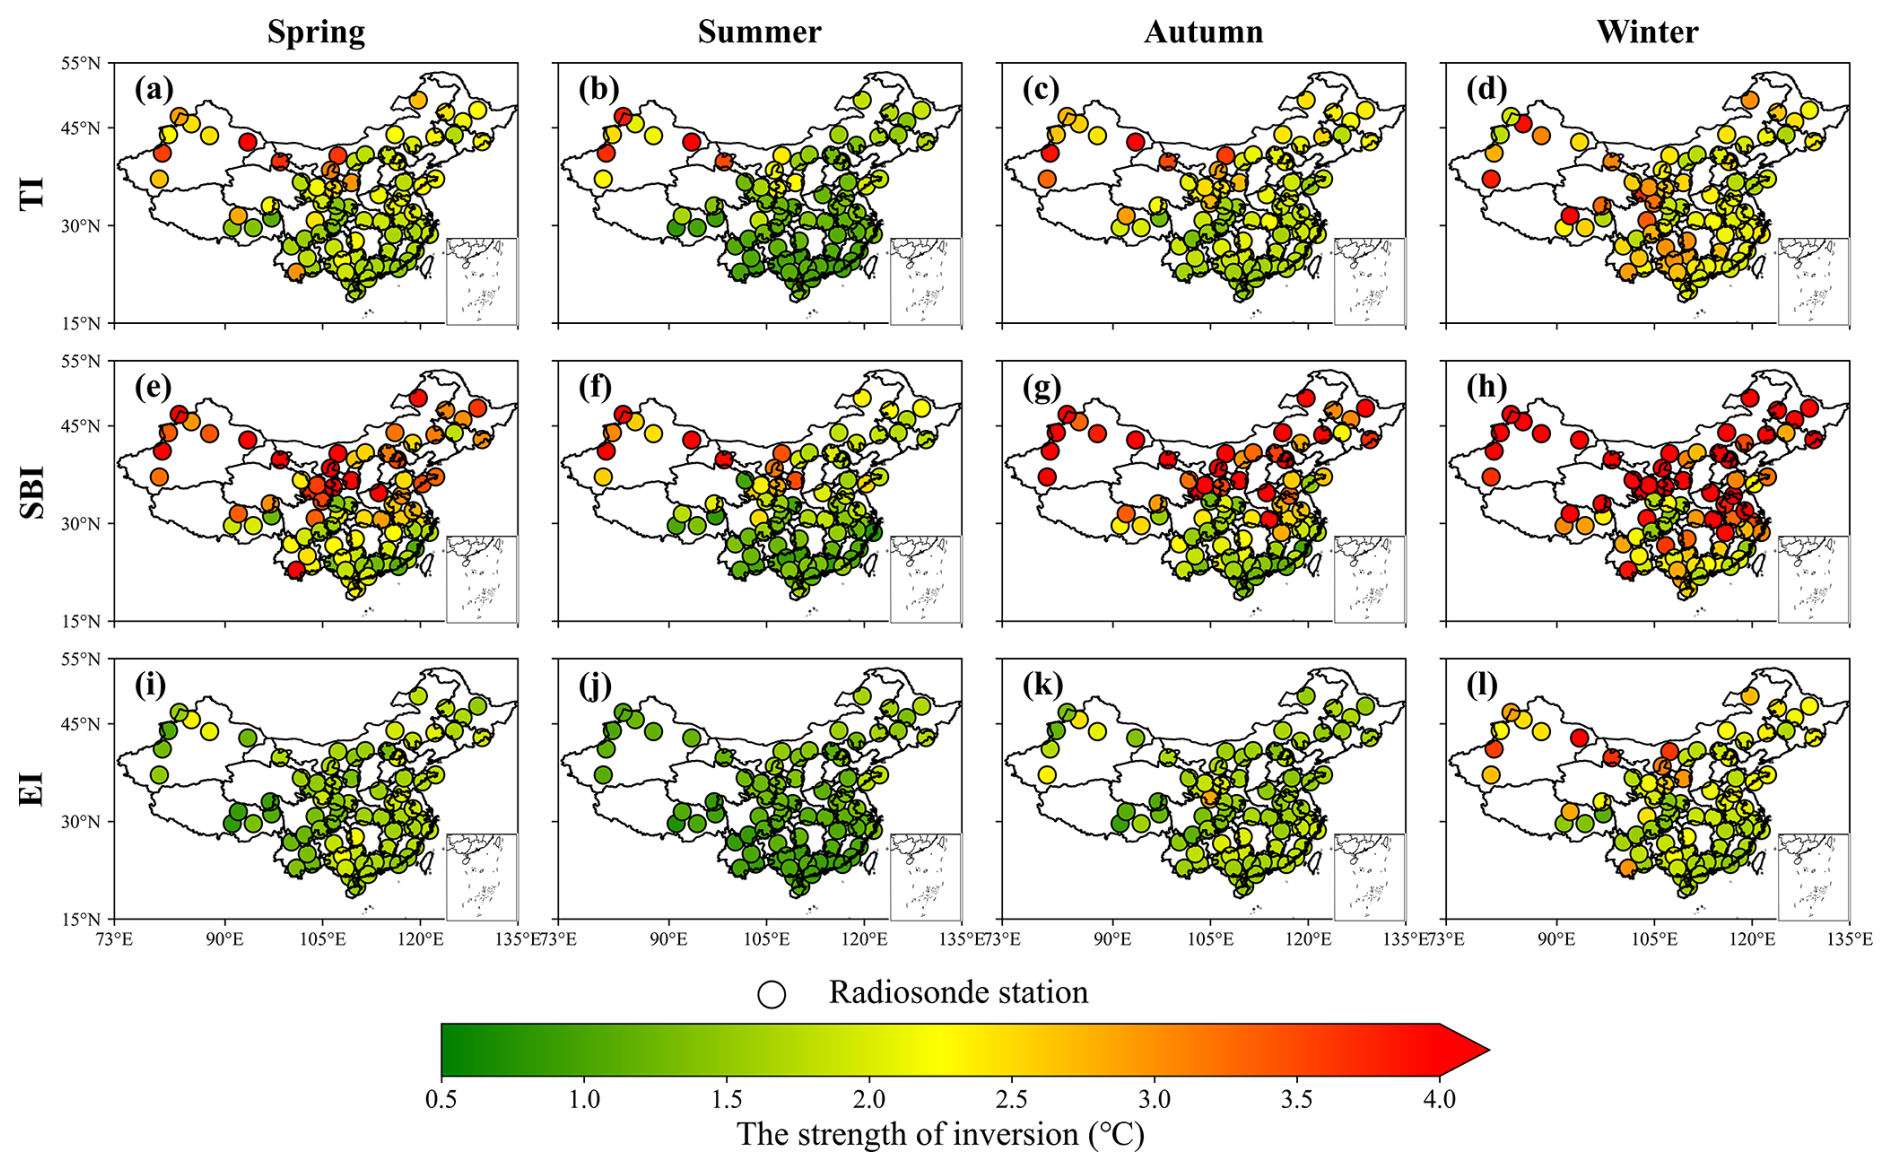
Figure 5Spatial and seasonal distribution of inversion strength for different types of inversions.
4.1.2 Inversion strength
Among the key TI parameters, strength exerts first-order control on pollutant dispersion. Spatially, TI strength is greater over inland northern regions than over southern and eastern coasts (Fig. 5; Table 1): the Northwest has the highest annual mean (2.67 °C), whereas the East is lowest (1.86 °C). Extremes span 4.69 °C in the Southwest to 1.67 °C in the East. Seasonally, TI strength peaks in winter (2.44 °C), weakens in spring and autumn (both ∼ 2.10 °C), and is lowest in summer (1.53 °C) (Fig. 5). Monthly values maximize in February (2.73 °C) and minimize in June (1.23 °C) (Fig. 4b). By inversion type, SBIs are consistently stronger than EIs: peak intensities reach 4.45 °C (SBI) versus 2.11 °C (EI) (Fig. 4e and h). Correspondingly, annual means rank SBI (3.02 °C) > all TI (2.13 °C) > EI (1.76 °C). The strongest seasonal maxima occur in winter in the Northwest for both overall TI (2.78 °C) and SBI (4.88 °C), while EI intensity peaks in winter in the South (2.43 °C). Notably, winter SBI strength exceeds EI by more than a factor of two. Geographically, SBI intensity varies substantially – annual means in northern and northwestern China are over twice those in the south – whereas EI strength is comparatively uniform, ranging from 1.63 °C (North/Northeast) to 1.93 °C (South), a spread of only 0.30 °C. Diurnally, TI, SBI, and EI intensities are generally higher at 08:00 BJT than at 20:00 BJT (Fig. 4b, e, and h). EI shows a regional reversal: daytime – stronger in the Northeast/North, but nighttime – stronger elsewhere. The maximum values by category occur at 08:00 BJT in the Northwest for all TI (2.81 °C), 08:00 BJT in the North for SBI (4.30 °C), and 20:00 BJT in the South for EI (2.02 °C) (Tables S2 and S3 in the Supplement).
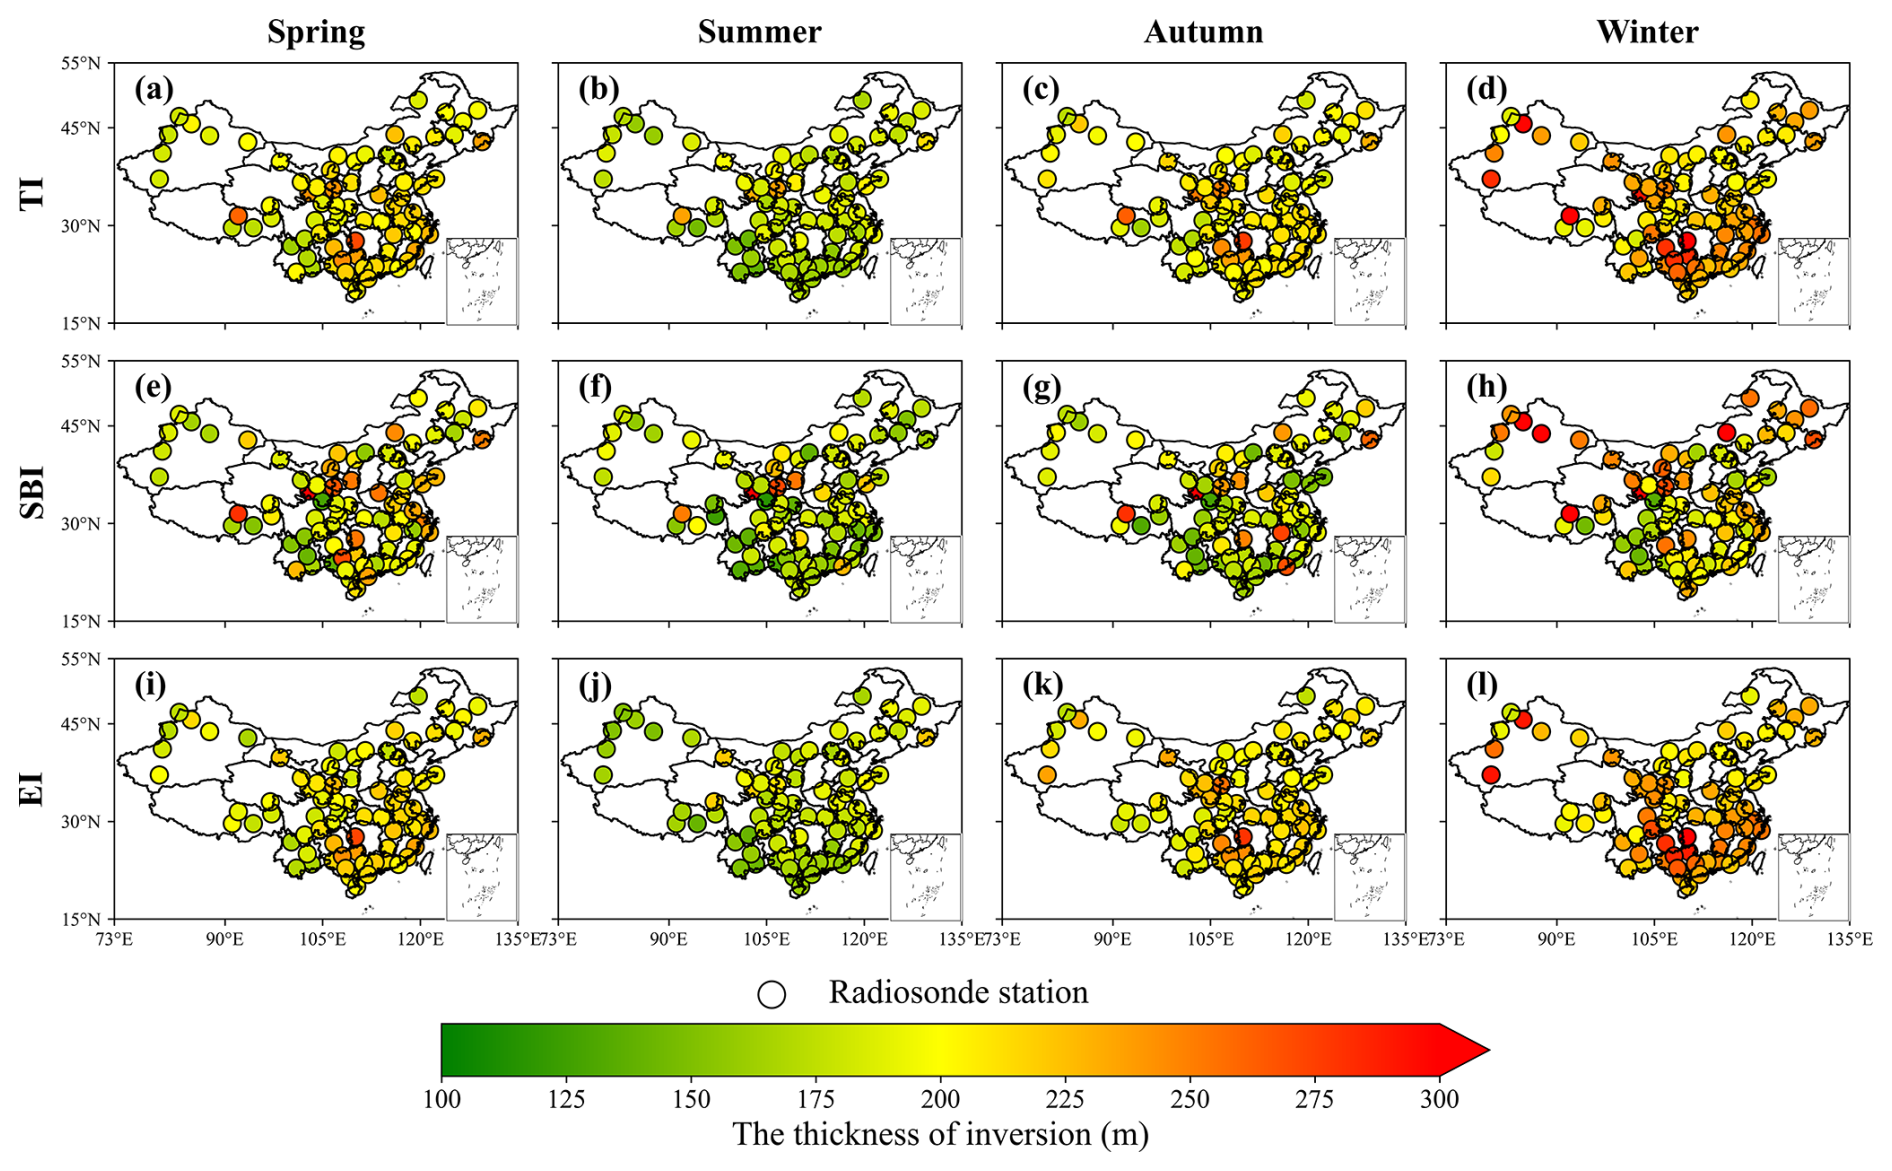
Figure 6Spatial and seasonal distribution of inversion thickness for different types of inversions.
4.2 Inversion thickness
Seasonal and regional patterns of inversion thickness for all TIs, SBIs, and EIs are shown in Fig. 6 and summarized in Table 1. Across the 75 radiosonde stations, the annual mean thickness is 214 m. Layers sampled at 08:00 BJT are generally thicker than those at 20:00 BJT by about 40 m, consistent with the diurnal phasing of inversion intensity. Thickness varies markedly by season, maximizing in winter (231 m; Fig. 6d) and minimizing in summer (179 m; Fig. 6b). Monthly evolution follows a pronounced “V” shape (Fig. 4c), with a January peak of 243 m. By type, EIs are systematically thicker than SBIs, with annual means of 216 and 201 m, respectively. Both exhibit winter maxima and summer minima. At 08:00 BJT, EI and SBI each display a clear “V”-shaped monthly cycle, whereas at 20:00 BJT their behavior diverges: SBI thickness varies only modestly, while EI thickness remains comparatively stable across months (Fig. 4f and i). Spatially, TIs are notably thicker in the eastern and southern regions compared to the northern and western inland areas. Specifically, the average thickness in East, South, and Central China is 223 m, whereas it is 209 m in Northeast, North, and Northwest China. South China shows the largest annual mean thickness (231 m), exceeding the national mean, whereas the Southwest has the thinnest layers (202 m). This pattern aligns with the regional predominance of inversion types: thicker EIs prevail in the eastern/southern regions, while thinner SBIs are more common in the western/northern regions. The lower overall inversion frequency in the Southwest, combined with the intrinsic thickness contrast between EI and SBI, further contributes to these regional differences. Additionally, we discussed the scenario where the lapse rate () was used as a proxy for inversion strength, as elaborated in supplementary Fig. S16, S17 and Table S4 in the Supplement.
Table 2Frequency statistics of TI corresponding to PM2.5 pollution events in seven regions of China from 2016 to 2021.
4.3 The correlation between temperature inversion and PM2.5
4.3.1 Statistical relationship between temperature inversion and PM2.5 pollution events
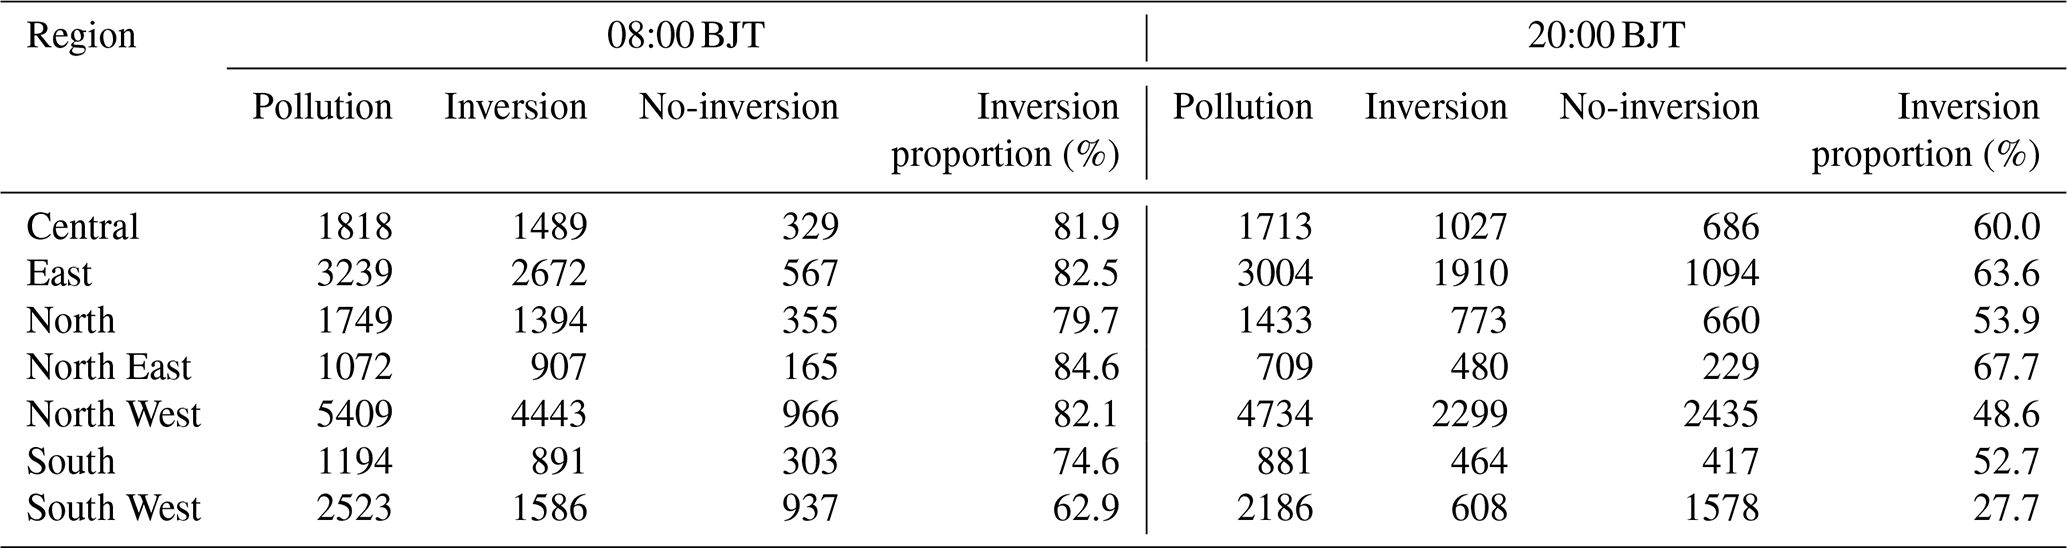
We quantified the linkage between TIs and PM2.5 pollution by comparing the share of polluted days under inversion versus non-inversion conditions in each region (Table 2). At 08:00 BJT, a strong association emerges nationwide: co-occurrence rates span 84.6 % in the Northeast (NE) to 62.9 % in the Southwest (SW), indicating that morning pollution accumulation is substantially conditioned by inversions, with northern regions particularly sensitive – consistent with their higher prevalence of SBIs. By contrast, at 20:00 BJT the TI–PM2.5 coupling weakens markedly; the SW shows the lowest overlap, with only 27.7 % of pollution events coinciding with inversions. This pronounced diurnal asymmetry suggests distinct formation regimes: daytime/morning pollution is frequently meteorology-limited by inversion trapping, whereas evening pollution is more strongly governed by emission timing and chemical processes than by boundary-layer stability.
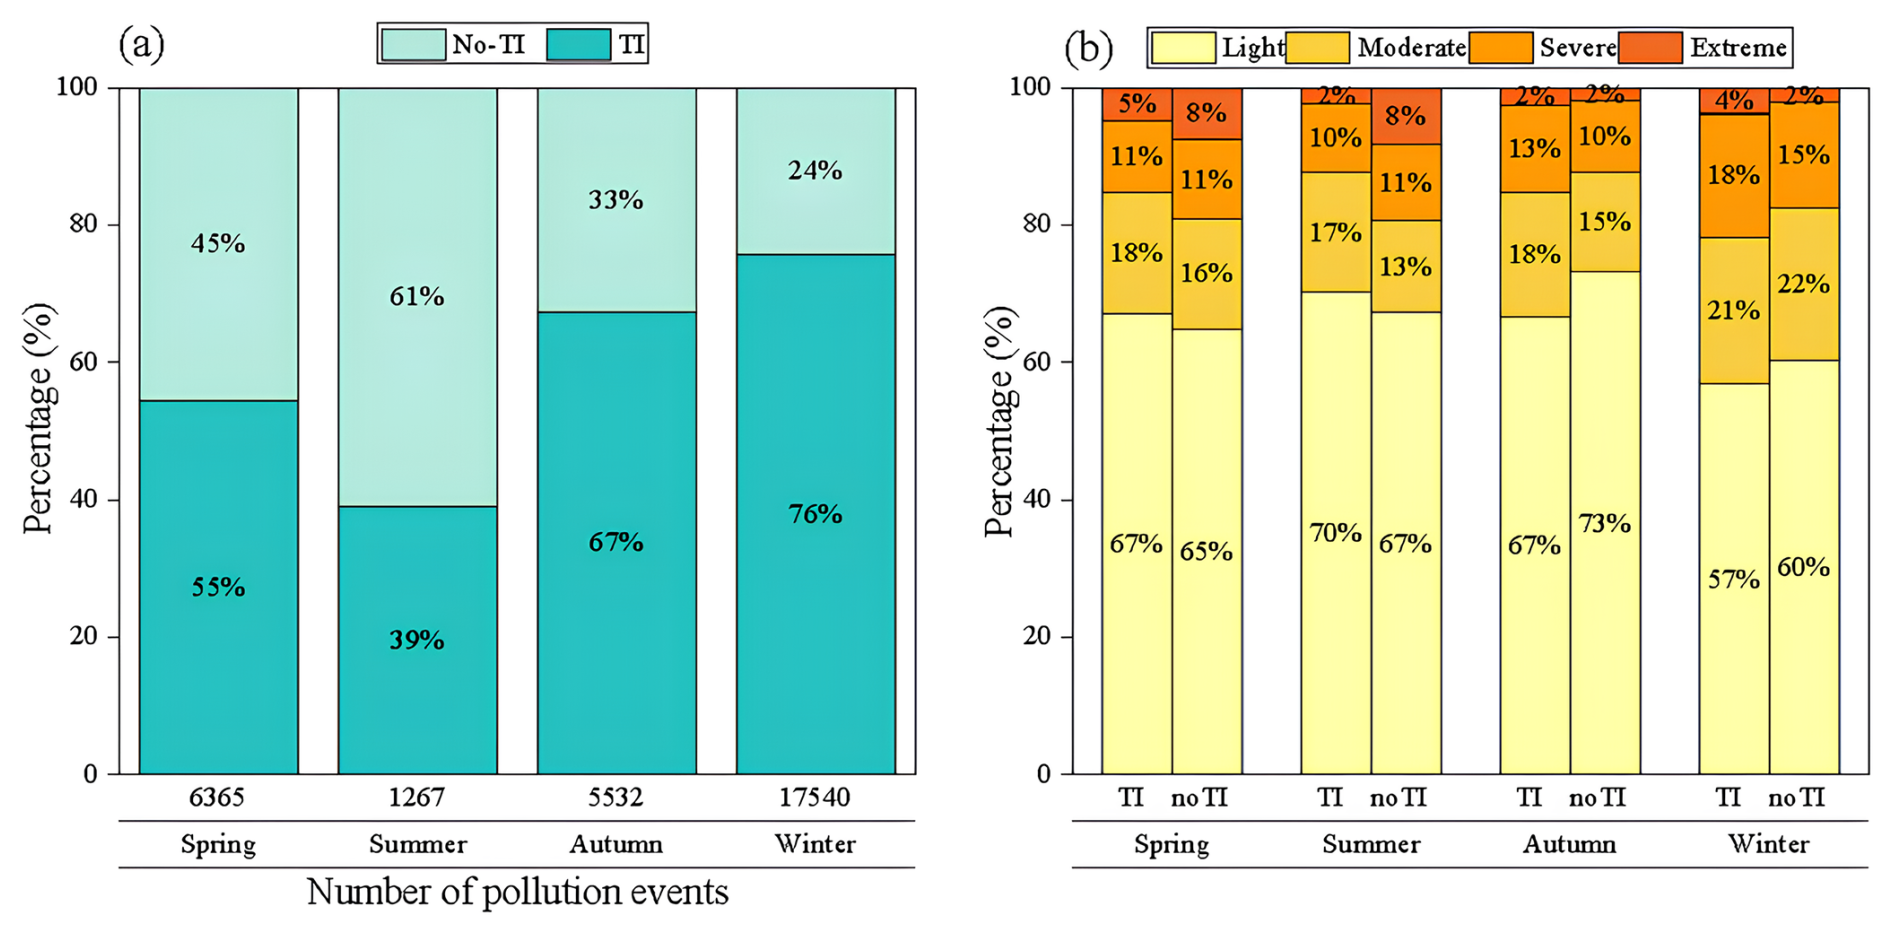
Figure 7(a) Frequency of inversion occurrence during polluted periods and (b) distribution of pollution levels in China (2016–2021).
Figure 7a reveals strong seasonal heterogeneity. Winter registers the most pollution events (17 540), exceeding spring, autumn, and summer by factors of 2.7, 3.2, and 13.8, respectively. TIs substantially amplify this seasonal contrast: relative to no-inversion conditions, the probability of a pollution event rises by +52 % in winter, +34 % in autumn, +10 % in spring, and is negligible in summer. The muted summer response likely reflects a shift toward ozone-dominated chemistry, weakening the coupling between PM2.5 and inversion dynamics. Figure 7b shows that TIs not only increase occurrence but also severity – especially in winter – doubling extreme events (Level 4: 2 % → 4 %) and raising severe events (Level 3) by 3 percentage points (15 % → 18 %). These observations are consistent with the inversion-driven explosive growth conceptual model for PM2.5 (Zhong et al., 2017, 2018) and with the view that extreme haze is tightly linked to inversion meteorology (Yang and Shao, 2021). Autumn TIs exhibit a similar but weaker intensification (+3 % in moderate/severe categories), whereas spring and summer TIs chiefly affect lower-severity bins. Collectively, the results establish TIs as a critical wintertime meteorological driver of both the frequency and intensity of haze in China.
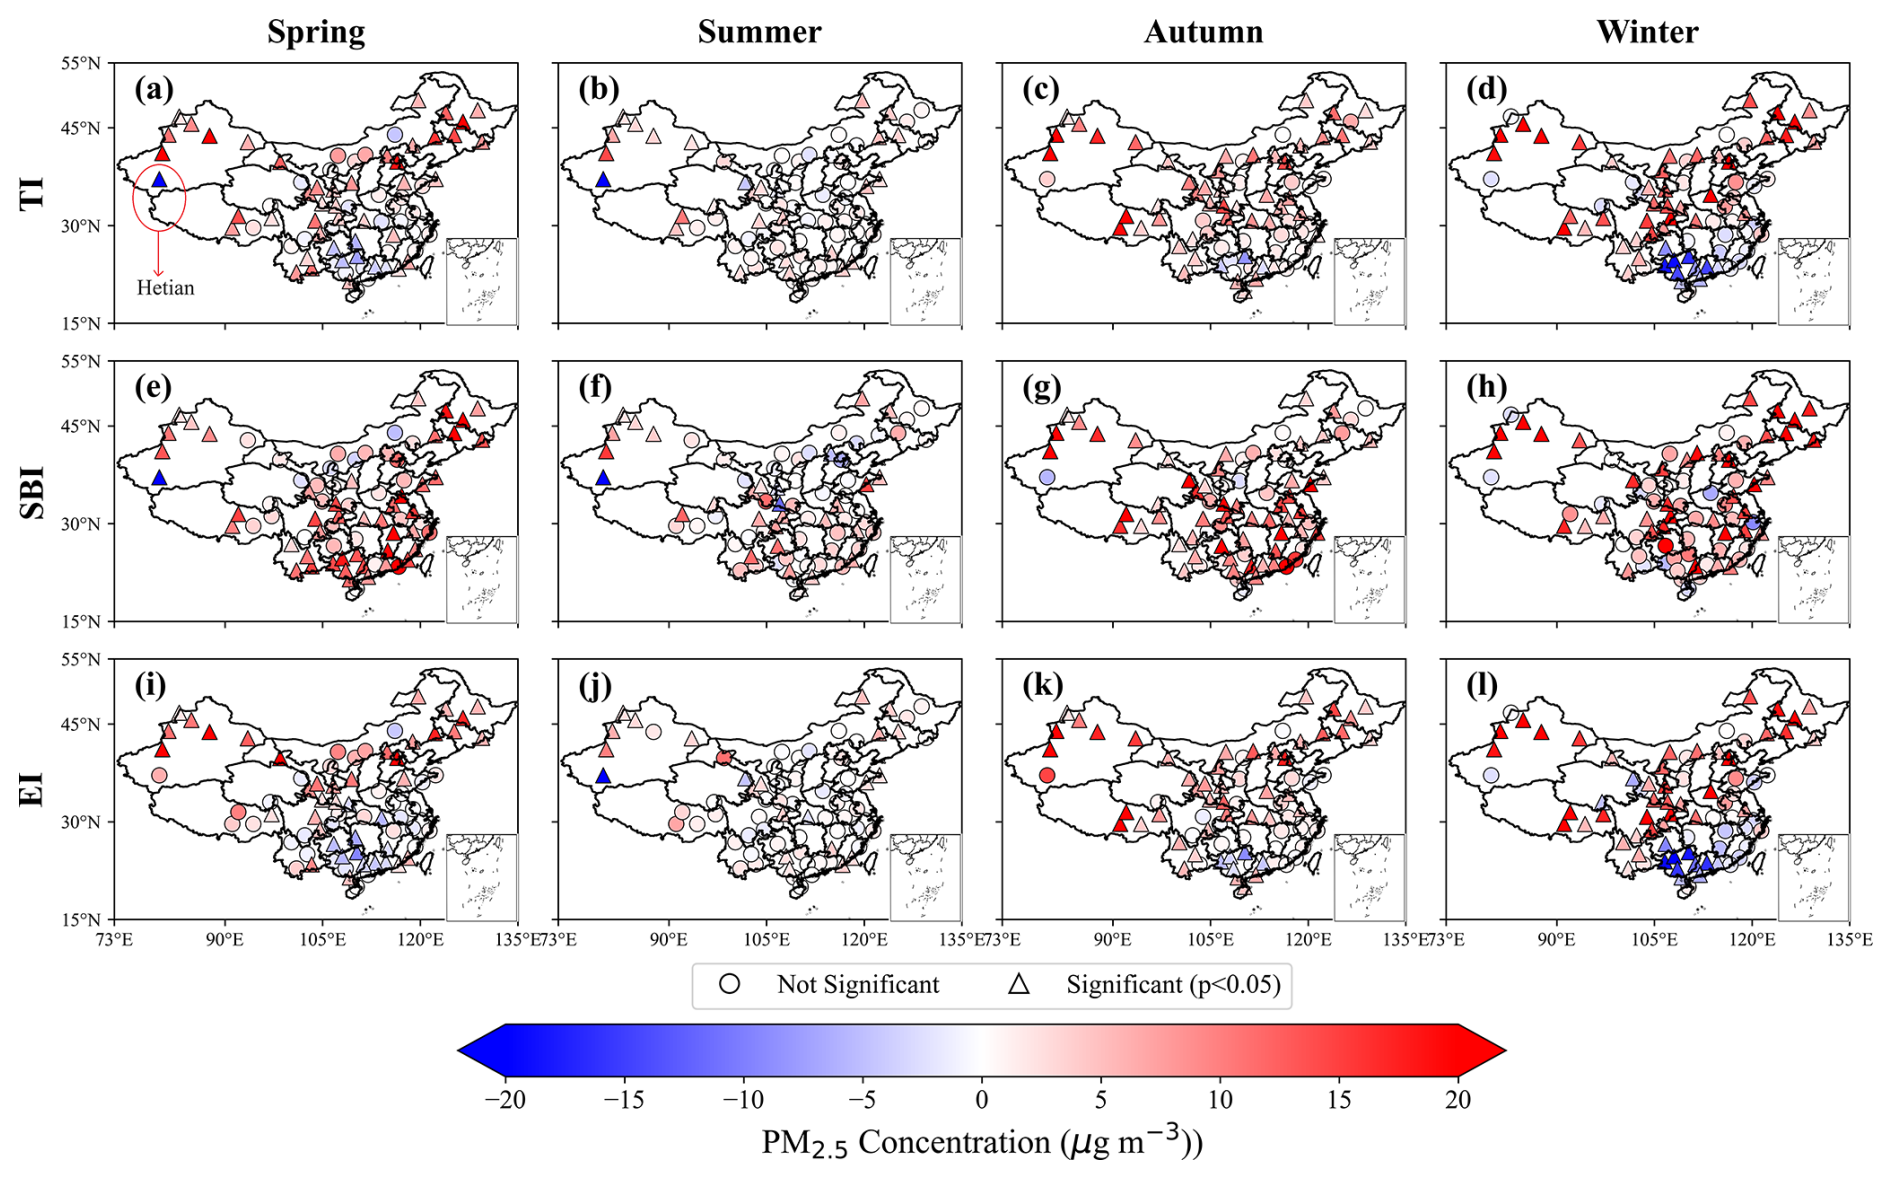
Figure 8Distribution of PM2.5 concentration differences with and without TI. The larger circle indicates significance at the 95 % level (t-test)
4.3.2 Impacts of different TI types on PM2.5 concentrations
We quantify inversion impacts by contrasting the daily mean PM2.5 concentrations under inversion and non-inversion conditions, with statistical significance assessed using twosample ttests (Fig. 8). The time-resolved analyses for 08:00 and 20:00 BJT are shown in Figs. S12 and S13 in the Supplement. In eastern China, results broadly align with Shao et al. (2023): PM2.5 increases significantly under inversions in the Northeast (NEC) and North China (NC), whereas South China (SC) exhibits significant decreases. In western China, most stations also show PM2.5 enhancements during inversions, with a notable exception at Hetian (southern Xinjiang), where spring–summer concentrations decline significantly (Fig. 8a and b). This anomaly likely reflects the dust-dominated composition of PM2.5 (> 90 %) and frequent spring–summer dust storms near the Taklamakan Desert; strong winds that accompany dust events are unfavorable for inversion formation, rendering dust outbreaks and inversion episodes largely mutually exclusive (Aishajiang et al., 2020). Consequently, during inversion periods, the dominant dust component is largely absent, yielding lower PM2.5.
Disaggregating by inversion type reveals fundamentally different mechanisms. Surface-based inversions (SBIs) robustly increase PM2.5 across most regions – especially in winter and autumn (Fig. 8g and h) – consistent with nocturnal radiative cooling that produces a shallow, stable layer, suppresses vertical mixing, and accelerates near-surface accumulation (Stull, 1988; Zhong et al., 2017). The amplification in northern winters reflects longer nights and stronger surface cooling. By contrast, elevated inversions (EIs) exhibit spatially variable effects: they enhance PM2.5 in NEC, NC, and Northwest China (NWC), but reduce concentrations in SC. This pattern supports the hypothesis that EIs can inhibit pollutant transport (Yang and Shao, 2021): in SC, EIs often accompany synoptic subsidence or warm advection, establishing a capping layer that limits vertical exchange and isolates the region from northerly inflow. Such a transport-suppression mechanism is less relevant in northern China, where local emissions dominate. Diurnal contrasts further modulate these responses: morning (08:00 BJT) inversions generally exert stronger effects than evening (20:00 BJT) inversions, particularly in NWC (Figs. S12 and S13). Occasional nighttime PM2.5 decreases under SBIs are observed at some NC/NEC stations, but these changes are not statistically significant.
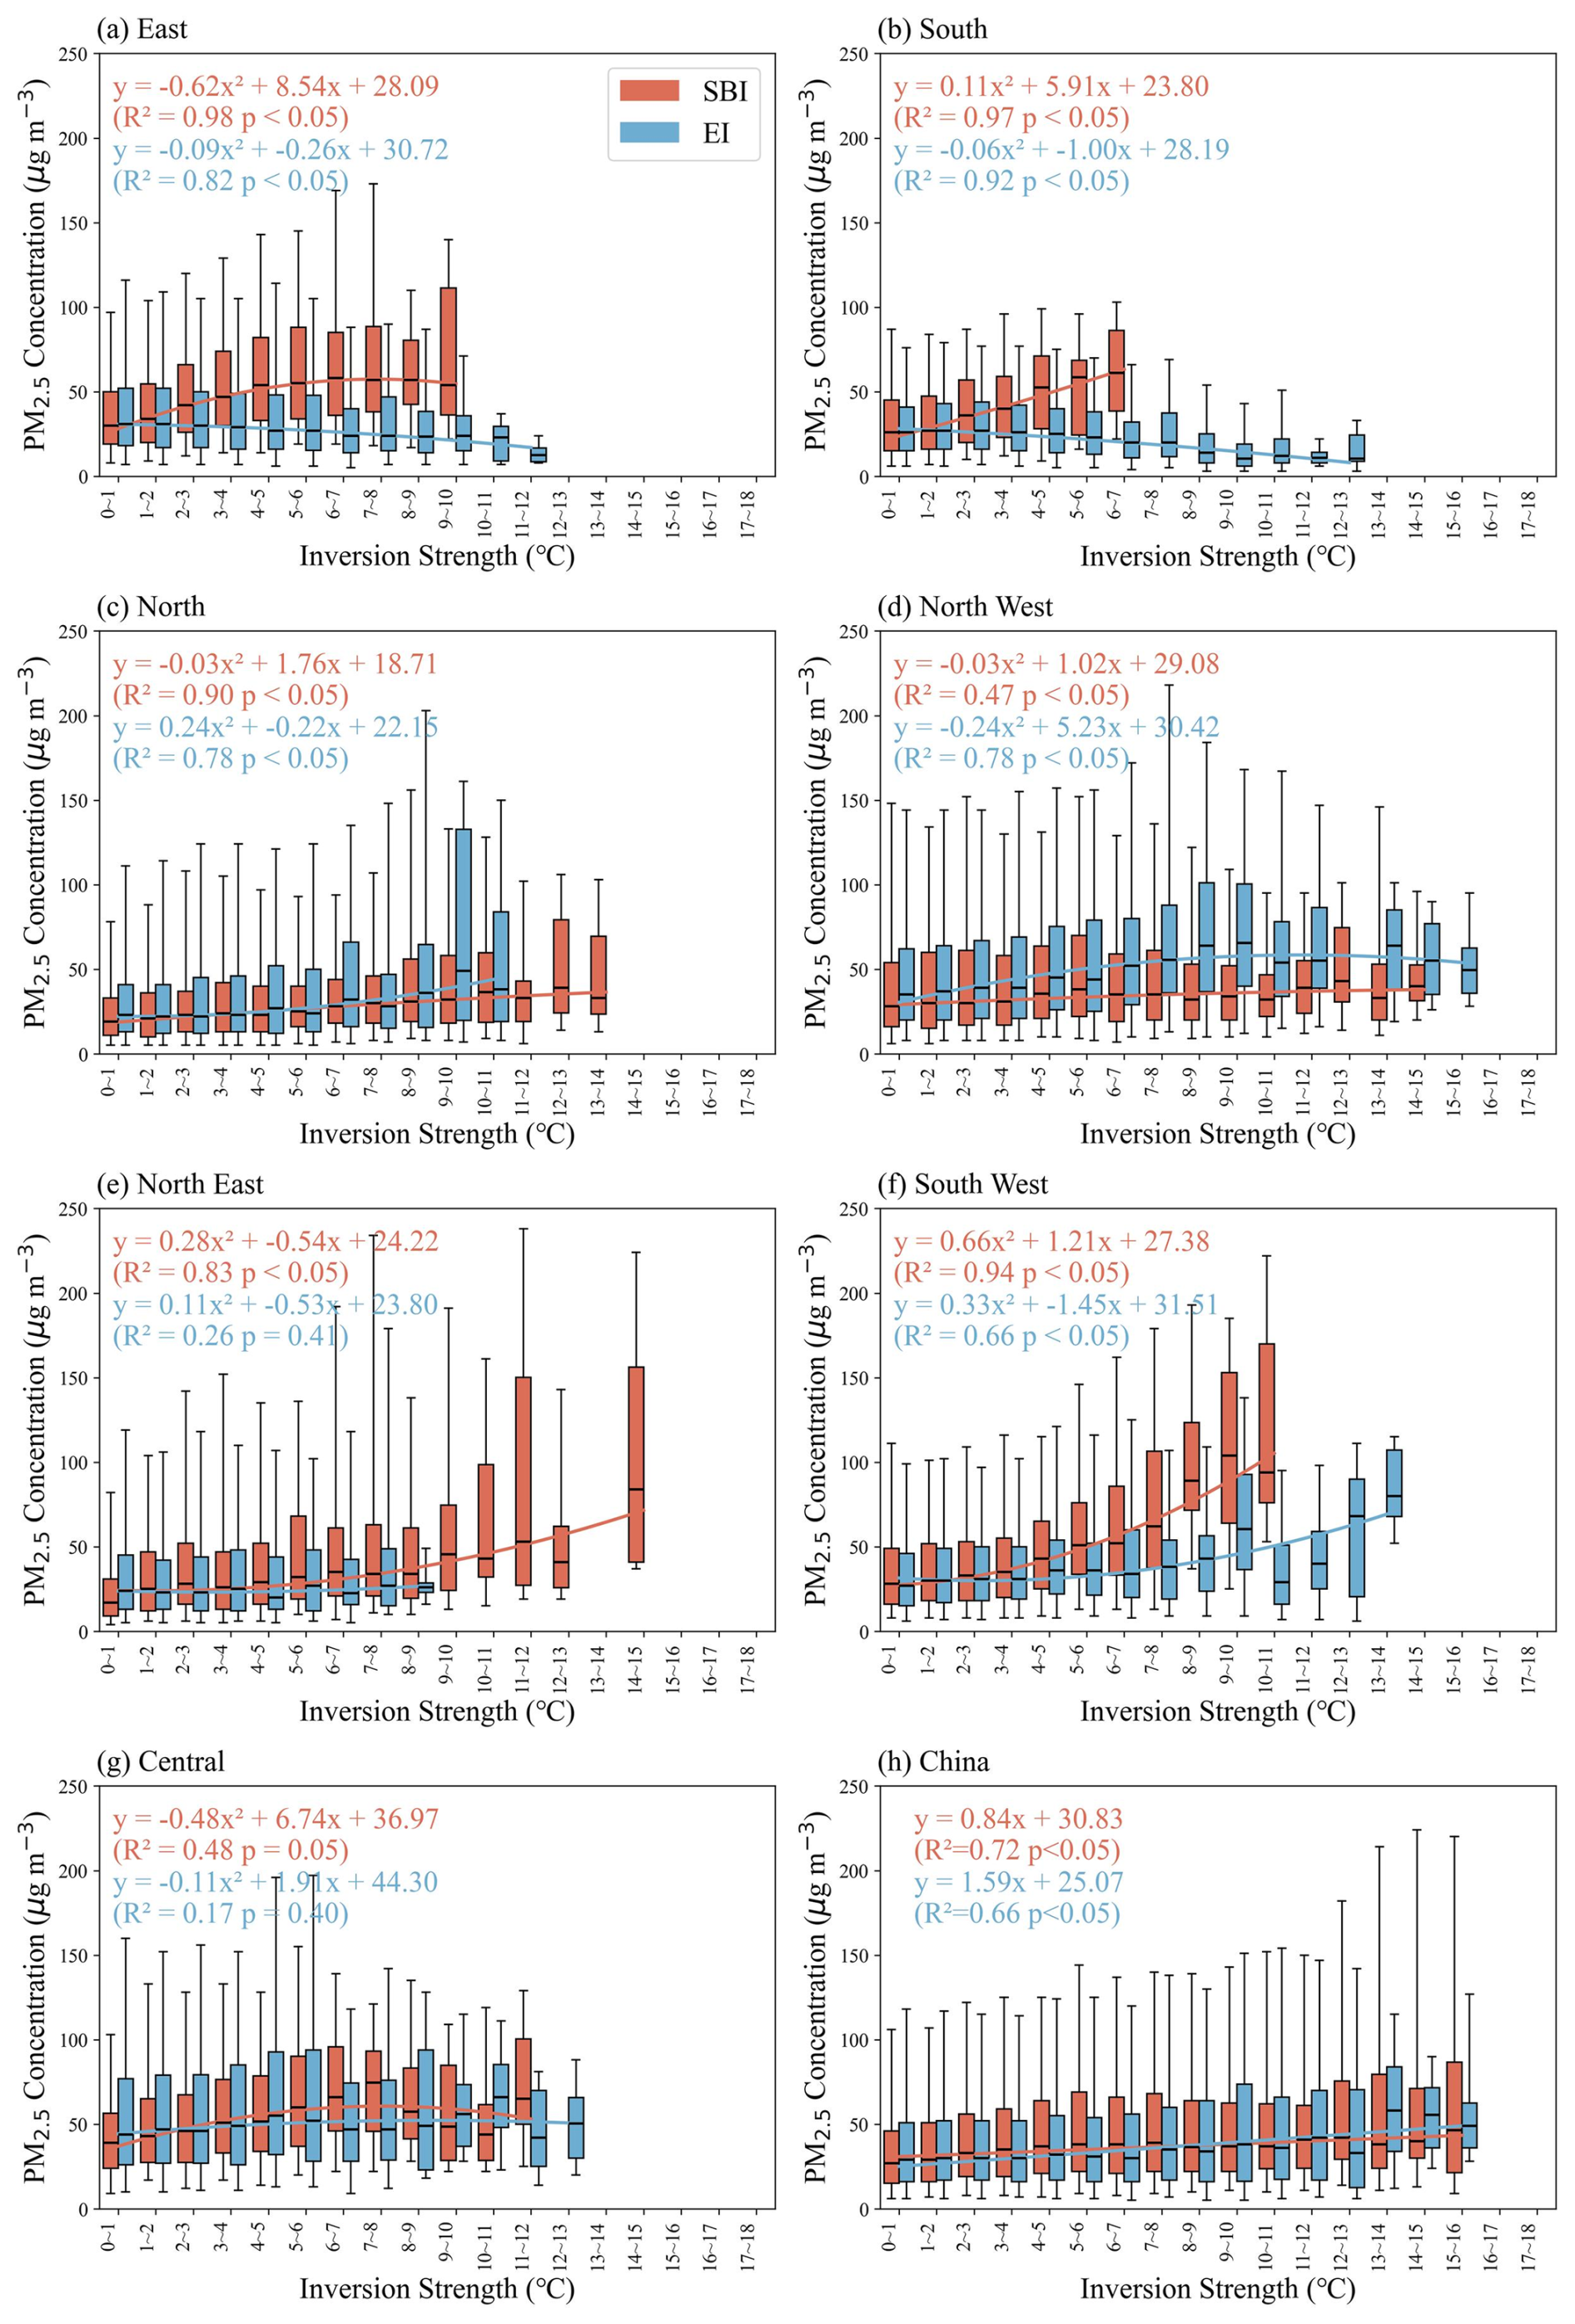
Figure 9Fitting relationship between inversion strength and PM2.5 concentration across seven regions of China from 2016 to 2021. The ends of the boxes, the ends of the bars, and the short line across each box represent the 25th and 75th percentiles, the 5th and 95th percentiles, and the median, respectively. Each strength interval contains a sample size ≥ 10.
We quantified PM2.5 responses to inversion parameters (strength, thickness) at 75 stations. Nationwide, PM2.5 rises near-linearly with inversion strength for both SBIs and EIs (Fig. 9h): below 8 °C, SBIs exert the stronger effect; above 8 °C, EIs become more influential. Regionally, four response regimes emerge: Northern Inland China, Southeastern Coastal China, Central China, and Southwestern China. In EC/SC, SBI intensity correlates positively with PM2.5 (R2 > 0.9), whereas EI intensity correlates negatively (R2 > 0.8); SBI strengths there seldom exceed 10 °C, far weaker than inland values. In NEC/NC, SBI strength can exceed 14 °C and is strongly coupled to PM2.5. EI effects are mixed: NC shows a monotonic increase in PM2.5 with EI strength; NWC peaks at 10.9 °C (58.9 µg m−3 ) then declines; NEC shows no significant correlation. In the SWC, both SBI and EI display a parabolic relationship with PM2.5, with SBI exerting the larger enhancement (correlation up to 0.94). In Central China, overall fits are poor/non-significant, likely reflecting (i) the limited sample (four stations) and (ii) the region's role as a convergence zone receiving substantial inflow from surrounding regions – regional transport contributes > 65 % to PM2.5 in cities such as Wuhan (Yu et al., 2020).
By contrast, inversion thickness shows a much weaker and less uniform association with PM2.5 (Fig. S14 in the Supplement). SBI thickness is generally positively correlated with PM2.5 (except in NEC). For EI, significant thickness–PM2.5 relationships appear only in NEC and NWC (R2 = 0.86 and 0.92, respectively); elsewhere, EI thickness exerts negligible influence. Together, these results establish inversion strength – not thickness – as the dominant predictor of PM2.5 accumulation (Fig. 9 vs. Fig. S14). Thickness primarily defines the volume of the trapping layer: a deep but weak inversion can be eroded by mechanical turbulence more readily than a shallow but intense one. This mechanism ensures that a stronger temperature gradient yields greater static stability and more effective suppression of turbulent mixing (Liu et al., 2022).
Temperature inversions (TIs) are widely recognized as a key meteorological regulator of near-surface PM2.5, yet their nationwide behaviour and impacts have remained incompletely characterized. Leveraging high-vertical-resolution radiosondes from 75 stations (2016–2021) and collocated surface PM2.5, we provide an observation-based assessment of inversion frequency, intensity, thickness, and diurnal variability across China, and quantify how distinct inversion types modulate pollution accumulation.
First, TIs are pervasive: the national annual means are 51.8 % for frequency, 2.13 °C for strength, and 214 m for thickness. Strong regional heterogeneity emerges. SBIs occur more frequently and are substantially stronger over inland northern regions (annual mean 3.02 °C), whereas EIs prevail along the southeastern coast and are thicker (e.g., 235 m in Central China; 227 m in South China). Low-level inversions are comparatively rare in the Southwest. Diurnally, inversions are more frequent, stronger, and thicker at 08:00 BJT than at 20:00 BJT, with the SBI day–night contrast muted in summer and amplified in winter – consistent with radiative control. Second, TIs materially elevate winter haze risk. Relative to non-inversion conditions, the probability of a pollution event increases by 52 % in winter, and the share of extreme events doubles, establishing TIs as a first-order meteorological driver of both frequency and severity of winter haze in China. Third, the type of inversion matters. SBIs robustly enhance PM2.5 across most regions, reflecting efficient near-surface trapping under nocturnal stability. EIs show regionally divergent behaviour: they enhance PM2.5 in the north and northwest but are negatively associated with PM2.5 in the east and south, consistent with a transport-inhibition mechanism that limits northerly inflow under subsidence/warm-advection regimes. Fourth, inversion strength is the dominant predictor of PM2.5 accumulation, while thickness plays a secondary, region-dependent role. Nationally, PM2.5 increases near-linearly with strength for both SBI and EI; below 8 °C SBI effects dominate, whereas above 8 °C EI effects strengthen. Thickness is generally weakly correlated with PM2.5, except in select regions (e.g., NEC/NWC for EI), underscoring that static stability (temperature gradient) governs ventilation more directly than layer depth.
These findings offer concrete avenues for improving air pollution forecasting. (i) Improving the vertical resolution and the predictive skill of TIs in numerical models could enhance the forecast of air pollution events, particularly in winter. (ii) Region-specific strategies are warranted: curbing evening–night emissions and promoting nocturnal ventilation are likely most effective where SBIs dominate (northern basins/plains), whereas transport management and synoptic-regime awareness may be more impactful in the southeast where EIs can isolate the boundary layer from upwind inflow. (iii) The observed diurnal asymmetry suggests targeted mitigation during windows of maximum trapping (pre-sunrise to morning transition).
Our assessment remains limited by sparser coverage over plateau terrain and the lack of vertical PM2.5 profiles, which constrains diagnosis of aerosol layering and entrainment. Future work should augment radiosondes with Raman/HSRL lidar, UAV or aircraft soundings, and assimilate inversion-aware stability metrics into kilometre-scale chemical transport models; leverage geostationary multi-sensor diurnal sampling to resolve inversion evolution; and evaluate co-trends among inversions, emissions, and climate-driven shifts in nocturnal cooling and synoptic patterns. These steps will sharpen causal attribution of TI–pollution coupling and strengthen the forecast-to-policy pipeline for region-tailored air-quality management.
The radiosonde data used in this study are available from the China Meteorological Administration (CMA). The hourly ground-level PM2.5 concentration data can be obtained from the China National Environmental Monitoring Centre (CNEMC; real-time platform: https://www.cnemc.cn/en/, last access: 10 March 2026).
The supplement related to this article is available online at https://doi.org/10.5194/acp-26-4089-2026-supplement.
YF and HW designed the study. HH, JG, XZ and FM contributed to the observation data, provided experimental assistance, and analyzed the methodology. YF wrote the paper with input from all the other authors.
The contact author has declared that none of the authors has any competing interests.
Publisher's note: Copernicus Publications remains neutral with regard to jurisdictional claims made in the text, published maps, institutional affiliations, or any other geographical representation in this paper. The authors bear the ultimate responsibility for providing appropriate place names. Views expressed in the text are those of the authors and do not necessarily reflect the views of the publisher.
This study was funded by the Sichuan Provincial Central Leading Local Science and Technology Development Special Project (2025ZYD0179), the “Challenge and Command” China Meteorological Administration (CMAJBGS202607), the Open Grants of China Meteorological Administration Radar Meteorology Key Laboratory (2025ZD02), the Innovation Fund of the Jilin Field Research Station for Cloud Physics, China Meteorological Administration/Jilin Provincial Key Laboratory of Weather Modification (M202504), and the Key Laboratory of Intelligent Meteorological Observation Technology, China Meteorological Administration (ZNGC2025MS21), the National Natural Science Foundation of China (42325501).
This research has been supported by the Sichuan Provincial Central Leading Local Science and Technology Development Special Project (2025ZYD0179), the “Challenge and Command” China Meteorological Administration (CMAJBGS202607), the Open Grants of China Meteorological Administration Radar Meteorology Key Laboratory (2025ZD02), the Innovation Fund of the Jilin Field Research Station for Cloud Physics, China Meteorological Administration/Jilin Provincial Key Laboratory of Weather Modification (M202504), and the Key Laboratory of Intelligent Meteorological Observation Technology, China Meteorological Administration (ZNGC2025MS21), the National Natural Science Foundation of China (42325501).
This paper was edited by Jason West and reviewed by two anonymous referees.
Aishajiang, A., Liang, F., Xu, H., Muhetaer, W., and Maimaitiaili, M.: Transport pathway of dust storm and its impact on air quality in Hetian Oasis, Acta Scientiae Circumstantiae, 40, https://doi.org/10.13671/j.hjkxxb.2020.0159, 2020.
Chan, C. K. and Yao, X.: Air pollution in mega cities in China, Atmos. Environ., 42, 1–42, https://doi.org/10.1016/j.atmosenv.2007.09.003, 2008.
Chen, J., Lv, H., Wang, Q., Wang, G., Jia, K., Zhao, C., Shi, W., and Yan, X.: Revolutionizing Satellite Real-Time Air Pollution Alerts through New On-Orbit System-on-Chip Technology, Environ. Sci. Technol., 59, https://doi.org/10.1021/acs.est.5c02470, 2025.
Czarnecka, M., Nidzgorska-Lencewicz, J., and Rawicki, K.: Temporal structure of thermal inversions in Łeba (Poland), Theor. Appl. Climatol., 136, 1–13, https://doi.org/10.1007/s00704-018-2459-8, 2019.
Deng, C., Qin, C., Li, Z., and Li, K.: Spatiotemporal variations of PM2.5 pollution and its dynamic relationships with meteorological conditions in beijing-tianjin-hebei region, Chemosphere, 301, 134640, https://doi.org/10.1016/j.chemosphere.2022.134640, 2022.
Feng, X., Wei, S., and Wang, S.: Temperature inversions in the atmospheric boundary layer and lower troposphere over the Sichuan Basin, China: Climatology and impacts on air pollution, Sci. Total Environ., 726, 138579, https://doi.org/10.1016/j.scitotenv.2020.138579, 2020.
Garcia, A., Santa-Helena, E., De Falco, A., De Paula Ribeiro, J., Gioda, A., and Gioda, C. R.: Toxicological Effects of Fine Particulate Matter (PM2.5): Health Risks and Associated Systemic Injuries—Systematic Review, Water Air Soil Poll., 234, https://doi.org/10.1007/s11270-023-06278-9, 2023.
Guo, J., Miao, Y., Zhang, Y., Liu, H., Li, Z., Zhang, W., He, J., Lou, M., Yan, Y., Bian, L., and Zhai, P.: The climatology of planetary boundary layer height in China derived from radiosonde and reanalysis data, Atmos. Chem. Phys., 16, 13309–13319, https://doi.org/10.5194/acp-16-13309-2016, 2016.
Guo, J., Chen, X., Su, T., Liu, L., Zheng, Y., Chen, D., Li, J., Xu, H., Lv, Y., He, B., Li, Y., Hu, X.-M., Ding, A., and Zhai, P.: The Climatology of Lower Tropospheric Temperature Inversions in China from Radiosonde Measurements: Roles of Black Carbon, Local Meteorology, and Large-Scale Subsidence, J. Climate, 33, 9327–9350, https://doi.org/10.1175/JCLI-D-19-0278.1, 2020.
Huang, Q., Chu, Y., and Li, Q.: Climatology of low-level temperature inversions over China based on high-resolution radiosonde measurements, Theor. Appl. Climatol., 144, 415–429, https://doi.org/10.1007/s00704-021-03536-w, 2021.
Kahl, J. D.: Characteristics of the low-level temperature inversion along the Alaskan Arctic coast, Int. J. Climatol., 10, 537–548, https://doi.org/10.1002/joc.3370100509, 1990.
Kahl, J. D. W., Martinez, D. A., and Zaitseva, N. A.: Long-term variability in the low-level inversion layer over the arctic ocean, Int. J. Climatol., 16, 1297–1313, https://doi.org/10.1002/(SICI)1097-0088(199611)16:11<1297::AID-JOC86>3.0.CO;2-T, 1996.
Kassomenos, P. A., Paschalidou, A. K., Lykoudis, S., and Koletsis, I.: Temperature inversion characteristics in relation to synoptic circulation above Athens, Greece, Environ. Monit. Assess., 186, 3495–3502, https://doi.org/10.1007/s10661-014-3632-x, 2014.
Lagmiri, S. and Dahech, S.: Temperature Inversion and Particulate Matter Concentration in the Low Troposphere of Cergy-Pontoise (Parisian Region), Atmosphere, 15, 349, https://doi.org/10.3390/atmos15030349, 2024.
Largeron, Y. and Staquet, C.: Persistent inversion dynamics and wintertime PM10 air pollution in Alpine valleys, Atmos. Environ., 135, 92–108, https://doi.org/10.1016/j.atmosenv.2016.03.045, 2016.
Li, J., Chen, H., Li, Z., Wang, P., Fan, X., He, W., and Zhang, J.: Analysis of Low-level Temperature Inversions and Their Effects on Aerosols in the Lower Atmosphere, Adv. Atmos. Sci., 36, 1235–1250, https://doi.org/10.1007/s00376-019-9018-9, 2019.
Li, Y., Yan, J., and Sui, X.: Tropospheric temperature inversion over central China, Atmos. Res., 116, 105–115, https://doi.org/10.1016/j.atmosres.2012.03.009, 2012.
Liang, C., Zang, Z., Li, Z., and Yan, X.: An Improved Global Land Anthropogenic Aerosol Product Based on Satellite Retrievals From 2008 to 2016, IEEE Geosci. Remote S., 18, 944–948, https://doi.org/10.1109/LGRS.2020.2991730, 2021.
Liu, B., Ma, X., Ma, Y., Li, H., Jin, S., Fan, R., and Gong, W.: The relationship between atmospheric boundary layer and temperature inversion layer and their aerosol capture capabilities, Atmos. Res., 271, 106121, https://doi.org/10.1016/j.atmosres.2022.106121, 2022.
Luo, N., Zhang, Y., Jiang, Y., Zuo, C., Chen, J., Zhao, W., Shi, W., and Yan, X.: Unveiling global land fine- and coarse-mode aerosol dynamics from 2005 to 2020 using enhanced satellite-based monthly inversion data, Environ. Pollut., 348, https://doi.org/10.1016/j.envpol.2024.123838, 2024.
Ma, Y., Yao, W., and Huang, B.: Comparison of temperature and geopotential height records between 59 type and L-band radiosonde systems, Journal of Applied Meteorological Science, 21, 214–220, https://doi.org/10.3969/j.issn.1001-7313.2010.02.011, 2010.
Meng, X., Wei, Z., and Ye, C.: Variation Characteristics of Ambient Air Quality in China during 2013–2022, Environmental Monitoring and Forewarning, 15, 1–7, https://doi.org/10.3969/j.issn.1674-6732.2023.05.001, 2023 (in Chinese).
Miao, Y., Che, H., Zhang, X., and Liu, S.: Integrated impacts of synoptic forcing and aerosol radiative effect on boundary layer and pollution in the Beijing–Tianjin–Hebei region, China, Atmos. Chem. Phys., 20, 5899–5909, https://doi.org/10.5194/acp-20-5899-2020, 2020.
Milionis, A. E. and Davies, T. D.: A five-year climatology of elevated inversions at Hemsby (UK), Int. J. Climatol., 12, 205–215, https://doi.org/10.1002/joc.3370120209, 1992.
Ministry of Ecology and Environment the People's Republic of China: Report on the State of the Ecology and Environment in China 2022, Ministry of Ecology and Environment the People's Republic of China, 72 pp., 2022.
Morawska, L., Zhu, T., Liu, N., Amouei Torkmahalleh, M., De Fatima Andrade, M., Barratt, B., Broomandi, P., Buonanno, G., Carlos Belalcazar Ceron, L., Chen, J., Cheng, Y., Evans, G., Gavidia, M., Guo, H., Hanigan, I., Hu, M., Jeong, C. H., Kelly, F., Gallardo, L., Kumar, P., Lyu, X., Mullins, B. J., Nordstrøm, C., Pereira, G., Querol, X., Yezid Rojas Roa, N., Russell, A., Thompson, H., Wang, H., Wang, L., Wang, T., Wierzbicka, A., Xue, T., and Ye, C.: The state of science on severe air pollution episodes: Quantitative and qualitative analysis, Environ. Int., 156, 106732, https://doi.org/10.1016/j.envint.2021.106732, 2021.
Palarz, A., Celiński-Mysław, D., and Ustrnul, Z.: Temporal and spatial variability of surface-based inversions over Europe based on ERA-Interim reanalysis, Int. J. Climatol., 38, 158–168, https://doi.org/10.1002/joc.5167, 2018.
Peng, Y., Zhao, Y., Gao, N., Sheng, D., Tang, S., Zheng, S., and Wang, M.: Spatiotemporal evolution of PM2.5 and its components and drivers in China, 2000–2023: effects of air pollution prevention and control actions in China, Environmental Geochemistry and Health, 47, 69, https://doi.org/10.1007/s10653-025-02375-2, 2025.
Rendón, A. M., Salazar, J. F., Palacio, C. A., and Wirth, V.: Temperature Inversion Breakup with Impacts on Air Quality in Urban Valleys Influenced by Topographic Shading, J. Appl. Meteorol. Clim., 54, 302–321, https://doi.org/10.1175/JAMC-D-14-0111.1, 2015.
Rentschler, J. and Leonova, N.: Global air pollution exposure and poverty, Nat. Commun., 14, 4432, https://doi.org/10.1038/s41467-023-39797-4, 2023.
Schiemann, R., Lüthi, D., and Schär, C.: Seasonality and Interannual Variability of the Westerly Jet in the Tibetan Plateau Region, J. Climate, 22, 2940–2957, https://doi.org/10.1175/2008JCLI2625.1, 2009.
Serreze, M., Kahl, J., and Schnell, R.: Low-Level Temperature Inversions of the Eurasian Arctic and Comparisons with Soviet Drifting Station Data, J. Climate, 5, 615–629, https://doi.org/10.1175/1520-0442(1992)005%3C0615:LLTIOT%3E2.0.CO;2, 1992.
Shao, M., Xu, X., Lu, Y., and Dai, Q.: Spatio-temporally differentiated impacts of temperature inversion on surface PM2.5 in eastern China, Sci. Total Environ., 855, 158785, https://doi.org/10.1016/j.scitotenv.2022.158785, 2023.
Stull, R. B.: An Introduction to Boundary Layer Meteorology, Springer Dordrecht, ISBN 978-90-277-2768-8, https://doi.org/10.1007/978-94-009-3027-8, 1988.
Sun, M., Xie, Z., Yao, X., Wang, S., and Dong, L.: Multilayer temperature inversion structures and their potential impact on atmospheric pollution in northwest China, Atmos. Environ., 343, 120998, https://doi.org/10.1016/j.atmosenv.2024.120998, 2025.
Vihma, T., Kilpeläinen, T., Manninen, M., Sjöblom, A., Jakobson, E., Palo, T., Jaagus, J., and Maturilli, M.: Characteristics of Temperature and Humidity Inversions and Low-Level Jets over Svalbard Fjords in Spring, Adv. Meteorol., 2011, 1–14, https://doi.org/10.1155/2011/486807, 2011.
Wallace, J. and Kanaroglou, P.: The effect of temperature inversions on ground-level nitrogen dioxide (NO2) and fine particulate matter (PM2.5) using temperature profiles from the Atmospheric Infrared Sounder (AIRS), Sci. Total Environ., 407, 5085–5095, https://doi.org/10.1016/j.scitotenv.2009.05.050, 2009.
WHO: WHO global air quality guidelines: particulate matter (PM2.5 and PM10), ozone, nitrogen dioxide, sulfur dioxide and carbon monoxide, World Health Organization, ISBN 9789240034228, https://www.who.int/publications/i/item/9789240034228/ (last access: 18 March 2026), 2021.
Wolf, T., Esau, I., and Reuder, J.: Analysis of the vertical temperature structure in the Bergen valley, Norway, and its connection to pollution episodes, J. Geophys. Res.-Atmos., 119, https://doi.org/10.1002/2014JD022085, 2014.
Wu, W., Zha, Y., Zhang, J., Gao, J., and He, J.: A temperature inversion-induced air pollution process as analyzed from Mie LiDAR data, Sci. Total Environ., 479–480, 102–108, https://doi.org/10.1016/j.scitotenv.2014.01.112, 2014.
Xu, T., Song, Y., Liu, M., Cai, X., Zhang, H., Guo, J., and Zhu, T.: Temperature inversions in severe polluted days derived from radiosonde data in North China from 2011 to 2016, Sci. Total Environ., 647, 1011–1020, https://doi.org/10.1016/j.scitotenv.2018.08.088, 2019.
Xu, T., Liu, B., Zhang, M., Song, Y., Kang, L., Wang, T., Liu, M., Cai, X., Zhang, H., and Zhu, T.: Temperature inversions in China derived from sounding data from 1976 to 2015, Tellus B, 73, 1898906, https://doi.org/10.1080/16000889.2021.1898906, 2021.
Yan, X., Liang, C., Jiang, Y., Luo, N., Zang, Z., and Li, Z.: A Deep Learning Approach to Improve the Retrieval of Temperature and Humidity Profiles From a Ground-Based Microwave Radiometer, IEEE T. Geosci. Remote, 58, 8427–8437, https://doi.org/10.1109/TGRS.2020.2987896, 2020.
Yan, X., Zang, Z., Jiang, Y., Shi, W., Guo, Y., Li, D., Zhao, C., and Husi, L.: A Spatial-Temporal Interpretable Deep Learning Model for improving interpretability and predictive accuracy of satellite-based PM2.5, Environ. Pollut., 273, 116459, https://doi.org/10.1016/j.envpol.2021.116459, 2021.
Yan, X., Zuo, C., Li, Z., Chen, H. W., Jiang, Y., He, B., Liu, H., Chen, J., and Shi, W.: Cooperative simultaneous inversion of satellite-based real-time PM2.5 and ozone levels using an improved deep learning model with attention mechanism, Environ. Pollut., 327, 121509, https://doi.org/10.1016/j.envpol.2023.121509, 2023.
Yang, J. and Shao, M.: Impacts of Extreme Air Pollution Meteorology on Air Quality in China, J. Geophys. Res.-Atmos., 126, e2020JD033210, https://doi.org/10.1029/2020JD033210, 2021.
Yang, Y., Li, Z., Guo, J., Wang, Y., Wu, H., Shang, Y., Wang, Y., Zhu, L., and Yan, X.: Revolutionizing Clear-Sky Humidity Profile Retrieval with Multi-Angle-Aware Networks for Ground-Based Microwave Radiometers, J. Remote Sens., 5, 0736, https://doi.org/10.34133/remotesensing.0736, 2025.
Yin, P.-Y., Chang, R.-I., Day, R.-F., Lin, Y.-C., and Hu, C.-Y.: Improving PM2.5 Concentration Forecast with the Identification of Temperature Inversion, Appl. Sci., 12, 71, https://doi.org/10.3390/app12010071, 2021.
Yu, C., Zhao, T., Bai, Y., Zhang, L., Kong, S., Yu, X., He, J., Cui, C., Yang, J., You, Y., Ma, G., Wu, M., and Chang, J.: Heavy air pollution with a unique “non-stagnant” atmospheric boundary layer in the Yangtze River middle basin aggravated by regional transport of PM2.5 over China, Atmos. Chem. Phys., 20, 7217–7230, https://doi.org/10.5194/acp-20-7217-2020, 2020.
Zang, Z., Wang, W., You, W., Li, Y., Ye, F., and Wang, C.: Estimating ground-level PM2.5 concentrations in Beijing, China using aerosol optical depth and parameters of the temperature inversion layer, Sci. Total Environ., 575, 1219–1227, https://doi.org/10.1016/j.scitotenv.2016.09.186, 2017.
Zang, Z., Li, D., Guo, Y., Shi, W., and Yan, X.: Superior PM2.5 Estimation by Integrating Aerosol Fine Mode Data from the Himawari-8 Satellite in Deep and Classical Machine Learning Models, Sci. Total Environ., 13, 2775, https://doi.org/10.3390/rs13142779, 2021.
Zhang, J., Zheng, Y., Li, Z., Xia, X., and Chen, H.: A 17-year climatology of temperature inversions above clouds over the ARM SGP site: The roles of cloud radiative effects, Atmos. Res., 237, 104810, https://doi.org/10.1016/j.atmosres.2019.104810, 2020.
Zhang, Y. H., Zhang, S. D., Yi, F., and Chen, Z. Y.: Statistics of lower tropospheric inversions over the continental United States, Ann. Geophys., 29, 401–410, https://doi.org/10.5194/angeo-29-401-2011, 2011.
Zhong, J., Zhang, X., Wang, Y., Sun, J., Zhang, Y., Wang, J., Tan, K., Shen, X., Che, H., Zhang, L., Zhang, Z., Qi, X., Zhao, H., Ren, S., and Li, Y.: Relative contributions of boundary-layer meteorological factors to the explosive growth of PM2.5 during the red-alert heavy pollution episodes in Beijing in December 2016, J. Meteorol. Res., 31, 809–819, https://doi.org/10.1007/s13351-017-7088-0, 2017.
Zhong, J., Zhang, X., Dong, Y., Wang, Y., Liu, C., Wang, J., Zhang, Y., and Che, H.: Feedback effects of boundary-layer meteorological factors on cumulative explosive growth of PM2.5 during winter heavy pollution episodes in Beijing from 2013 to 2016, Atmos. Chem. Phys., 18, 247–258, https://doi.org/10.5194/acp-18-247-2018, 2018.
Zou, J., Chen, H. W., Li, H., Wang, Q., Wang, G., Jia, K., Chen, Z., Zhao, C., Shi, W., Yang, Y., Tang, Y., Chen, J., Zhang, Y., Xu, T., Wang, Y., Liu, G., and Yan, X.: Amplified urban heat island effect in southern china's old towns following atmospheric regulation policies, Sustain. Cities and Soc., 131, 106675, https://doi.org/10.1016/j.scs.2025.106675, 2025.
Zuo, C., Chen, J., Zhang, Y., Jiang, Y., Liu, M., Liu, H., Zhao, W., and Yan, X.: Evaluation of four meteorological reanalysis datasets for satellite-based PM2.5 retrieval over China, Atmos. Environ., 305, 119795, https://doi.org/10.1016/j.atmosenv.2023.119795, 2023.