the Creative Commons Attribution 4.0 License.
the Creative Commons Attribution 4.0 License.
Global NO2 changes between 2019 and 2024 as observed by TROPOMI in urban areas and emerging hotspots
Gaige H. Kerr
M. Omar Nawaz
Sara Runkel
Susan C. Anenberg
Daniel L. Goldberg
We present a global assessment of space-based urban nitrogen dioxide (NO2) observations from 2019 to 2024 using annual and monthly mean tropospheric vertical column densities (VCDs) from the TROPOspheric Monitoring Instrument (TROPOMI). Across 11 500 cities defined by the Global Human Settlement Layer-Settlement Model (GHS-SMOD), we find population-weighted annual mean urban NO2 VCDs were lower in 2024 than 2019 in Europe (−13 %) and Asia and Oceania (−17 %), with seasonal decomposition indicating that annual changes are largely driven by concentration decreases during November–March. Aggregated urban VCD changes in North America, South America and Africa were statistically insignificant, though numerous individual cities exhibited significant changes. Of larger cities, Tehran had the largest annual mean NO2 VCD (> 30 × 1015 molecules cm−2) and Seoul experienced the largest reduction (−9.4 ± 1.0 % yr−1; p < 0.001). We then calculate NO2 VCD urban enhancements (VCDENH) by removing background concentrations from urban signatures and compare VCDENH to changes in nitrogen oxide (NOx) emissions from two emissions inventories, highlighting regions with potential inventory discrepancies. We find VCDENH changes exceed changes in inventory NOx emissions in Europe, North America and Asia and Oceania, with worse agreement in the Global South. We further identify changes in NO2 near fossil fuel operations and note conflict-related changes in NO2, highlighting the responsiveness of satellite NO2 to certain societal disruptions. This work demonstrates the value in space-based remote sensing being an accountability agent for air pollution emissions on a global scale and to identify changes in NO2 in otherwise unmonitored regions.
- Article
(16454 KB) - Full-text XML
-
Supplement
(11109 KB) - BibTeX
- EndNote
Nitrogen dioxide (NO2) is a harmful air pollutant that originates from both anthropogenic and natural emissions sources, including fossil fuel combustion, biomass burning, lightning, and soils (Dix et al., 2020; Jin et al., 2021; Schumann and Huntrieser, 2007; Huber et al., 2024), with fossil fuel combustion accounting for ∼45 % of total global nitrogen oxide emissions (Song et al., 2021). Only a small amount of NO2 is emitted from these sources directly, with nitric oxide (NO) being the primary emissions product that quickly cycles to NO2 in the presence of oxidants such as ozone (O3) or peroxy radicals (HO2 or RO2). The summed concentrations of NO and NO2 are referred to as nitrogen oxides (NOx= NO + NO2), as the concentrations of NO and NO2 are inherently linked. NO2 is more commonly targeted by regulatory measures than NO, as it constitutes the majority of atmospheric NOx concentrations and is linked to increased morbidity and mortality from long-term exposure, particularly within urban environments (Chen et al., 2024). While NOx is commonly associated with health risks, the direct association between NOx exposure and adverse health outcomes remains uncertain (Anenberg et al., 2022). Despite this, NOx contributes to known harmful secondary pollutants, including O3 and fine particulate matter.
NO2 concentrations are measured using: (1) in-situ monitoring, e.g. chemiluminescence analyzers at the surface, or (2) remote sensing instrumentation leveraging the unique spectral properties of NO2, that absorbs light most efficiently in the visible portions (405–465 nm) of the electromagnetic spectrum (Lamsal et al., 2015). The latter method relies upon spectrometers detecting in the UV-Visible spectral range to infer NO2 vertical column densities (VCDs), defined as the summed concentration of NO2 in a column from the surface to an upper limit of the atmosphere, with the tropopause often used as the upper limit. Spectrometers have been used to measure NO2 VCDs from ground-level directed upward, from aircraft directed downward, or from space-based satellites directed downward, including from the TROPOspheric Monitoring Instrument (TROPOMI) onboard the Sentinel-5P satellite (Herman et al., 2009; Fishman et al., 2012; Veefkind et al., 2012). NO2 can also be remotely sensed from ground-based instruments capable of inferring vertical profiles of NO2, such as using multi-axis differential optical absorption spectroscopy (MAX-DOAS; Vlemmix et al., 2010).
The earliest space-based spectrometers detecting NO2 were flown on low-earth polar orbiting satellites and were launched within the mid-1990s to mid-2000s. These include the Global Ozone Monitoring Experiment (GOME; Burrows et al., 1999) and GOME-2 satellites, the SCanning Imaging Absorption spectroMeter for Atmospheric CHartographY (SCIAMACHY; Bovensmann et al., 1999) and the Ozone Monitoring Instrument (OMI; Levelt et al., 2006). The data collected using these instruments provided unique insight into atmospheric chemistry and composition across the globe, including in mostly unmonitored regions. OMI, launched in 2004, provided NO2 VCDs at a spatial resolution of 13×24 km2 at nadir and has remained operable for more than two decades at the time this was written, providing a valuable long-term record of NO2 globally. OMI remained the highest resolution space-based NO2 product until TROPOMI launched in 2017, which ultimately provided NO2 VCDs at a spatial resolution of 3.5×5.5 km2 at nadir. Observations at this resolution facilitated the evaluation of satellite NO2 at previously unprecedented spatial scales, including at the intra-urban level (Goldberg et al., 2021a, 2024).
NO2 trends have been characterized in urban and broader environments using space-based instruments. Earlier satellite studies used the GOME and SCIAMACHY satellites to identify increasing NO2 VCD trends in China from the mid-1990s to the mid-2000s (Richter et al., 2005; Stavrakou et al., 2008; van der A et al., 2008), driven primarily by economic growth and industrialization. Later studies, incorporating OMI observations, highlighted further increases in China through the early 2010s, with VCDs and satellite-inferred surface concentrations steadily declining since (Miyazaki et al., 2017; Wang et al., 2019; Jiang et al., 2022). Europe has exhibited steady NO2 VCD declines since the start of the satellite NO2 record (Richter et al., 2005; Krotkov et al., 2016; Duncan et al., 2016), driven largely by the implementation of various emissions control technologies. In the United States, NO2 concentrations generally exhibited a decreasing trend from 2005 through the mid-2010s (Lamsal et al., 2015), with VCD decreases more gradual since, in part due to an increased influence from regional background NO2 levels (Jiang et al., 2018; Goldberg et al., 2021b; Dang et al., 2023). In contrast, urban regions of India have shown NO2 increases over the past few decades, linked to urbanization and energy demand growth (Hilboll et al., 2013; Ghude et al., 2020). Over Africa and South America, NO2 VCD trends through the mid-2010s have been less pronounced, reflecting limited industrialization and more dominant contributions from biomass burning and natural sources (Geddes et al., 2016; Castellanos et al., 2014). Additionally, numerous studies have highlighted the influence that the COVID-19 pandemic had on NO2 globally, with most regions globally exhibiting broad NO2 decreases in 2020 during numerous lockdowns and subsequent, regionally-distinct rebounds in emissions (Lonsdale and Sun, 2023; Fisher et al., 2024).
Satellite studies have been used to characterize trends within the urban environment specifically, using different methods to characterize the urban extent. Geddes et al. (2016) used GOME, SCIAMACHY and GOME-2 oversampled to a 0.1° × 0.1° grid to highlight NO2 VCD trends globally, as well as in select urban areas, with the urban region defined as the surrounding ∼ 200 km × 200 km. Fioletov et al. (2022) and Fioletov et al. (2025) used urban density from the Gridded Population of the World (SEDAC, 2017) as a proxy for the extent of the urban environment to identify changes in urban NOx emissions. Anenberg et al. (2022) used urban boundaries provided from the 2019 version of the Global Human Settlement Layer-Settlement model (GHS-SMOD) to evaluate NO2 trends from 2000–2019 using surface NO2 estimates derived from OMI NO2 and a land-use regression model.
Here, we use TROPOMI tropospheric NO2 VCDs to quantify general NO2 changes globally from 2019 to 2024, with a particular focus on urban areas. The urban boundaries are defined by the 2023 version of GHS-SMOD, which provides urban cluster boundaries for all urban regions globally. We evaluate changes in annual mean urban NO2 VCDs against NOx emissions inventories and characterize the influence of different seasons on annual variations. We additionally note changes in select oil, gas, and other mining regions, which exhibit the largest changes globally outside of urban areas. This study represents the first detailed global-scale analysis of urban TROPOMI NO2 from 2019 to 2024. Our findings illustrate how NO2 responded to specific societal events during this timeframe, such as the impact of clean air policies, population migration away from urban areas due to war, the increased demand for fossil fuels and rare-Earth minerals, and the emergence and waning of a global pandemic. Furthermore, by directly linking observed NO2 urban enhancements with NOx emission inventory data from the updated EDGARv8.1, our work provides valuable insights into regions where emissions inventories align closely with observations, as well as areas exhibiting potential inventory discrepancies. This work underscores the critical value of satellite-derived NO2 as a tool for urban air quality assessment and emissions management.
2.1 Global Human Settlement Layer Urban Cluster Boundaries
The Global Human Settlement Layer-Settlement Model (GHS-SMOD; Schiavina et al., 2023) is a dataset developed by the Joint Research Centre of the European Commission containing spatial boundaries and population estimates for all urban areas globally with a population of at least 50 000, which can be used to subset gridded or spatially-disaggregated data for any built-up area on Earth. GHS-SMOD uses satellite remote sensing to identify the spatial extent and boundaries of all cohesive built-up areas globally at a spatial resolution of 1 × 1 km2, with each separate, cohesive built-up area referred to as an “urban cluster”. In this study, we use the terms “urban cluster” and “city” interchangeably, although we note that GHS-SMOD urban clusters do not always align with administrative city boundaries. GHS-SMOD has the benefit of providing a globally consistent, satellite-derived definition of built-up areas, whereas administrative boundaries vary widely in definition and availability. Using physical built-up area boundaries from GHS-SMOD instead of administrative ones may shift the absolute spatial extent of some cities, but it does not materially alter the concentrations calculated in this study.
The 2023 version of GHS-SMOD provides boundaries for approximately 11 500 urban clusters, along with population estimates for the year 2020 (Fig. S8 in the Supplement). We note that GHS-SMOD urban clusters do not reflect the traditional boundaries of individual cities as we may understand them, and as such, GHS-SMOD urban clusters can span multiple cities, regions or even countries. For example, the urban cluster encompassing San Diego, California includes the city of San Diego, but also the adjacent surrounding suburbs, as well as the entirety of Tijuana, Mexico (Fig. S9). In such cases, attribution of an urban cluster to one particular city is not possible.
We use the GHS-SMOD boundaries to subset monthly- and annually-averaged satellite NO2 column concentration data for all urban clusters, as described in Sect. 2.2.1.
2.2 TROPOMI NO2 Vertical Column Densities
The TROPOspheric Monitoring Instrument (TROPOMI) is a pushbroom spectrometer on board the Sentinel-5P satellite traveling in low earth orbit, with approximately one overpass each afternoon (Veefkind et al., 2012). Launched in October 2017, TROPOMI detects radiation in spectral bands ranging from the ultraviolet to shortwave infrared to infer concentrations of various atmospheric constituents, including nitrogen dioxide (NO2), which is best inferred from the near-UV and visible portions of the spectrum. We use Level 3 monthly- and annually-averaged TROPOMI tropospheric NO2 vertical column densities (VCDs) on a 0.1° global grid (Goldberg, 2024a), which were created by oversampling daily Level 2 TROPOMI NO2 VCDs derived from version 2.4+ of the European Space Agency retrieval algorithm (van Geffen et al., 2022). These Level 2 data have a nadir spatial resolution of 3.5×7.0 km2 before and 3.5×5.5 km2 after August 06, 2019. Data were quality controlled to remove Level 2 pixels with a qa_value < 0.75 before oversampling, which removes data with quality issues related to clouds, surface reflectivity (e.g. snow and ice) or other retrieval errors. The TROPOMI NO2 data used in this study span six full calendar years from January 2019 to December 2024 (Fig. 1); we use the RPRO version from 1 January 2019–25 July 2022 and the OFFL version from 26 July 2022–31 December 2024. On 7 September 2024 there was an update of the surface reflectivity assumptions and on 16 November 2024 there was an update to the cloud retrieval, both of which induce a small positive step change in the data but likely does not meaningfully affect the 2024 annual average.
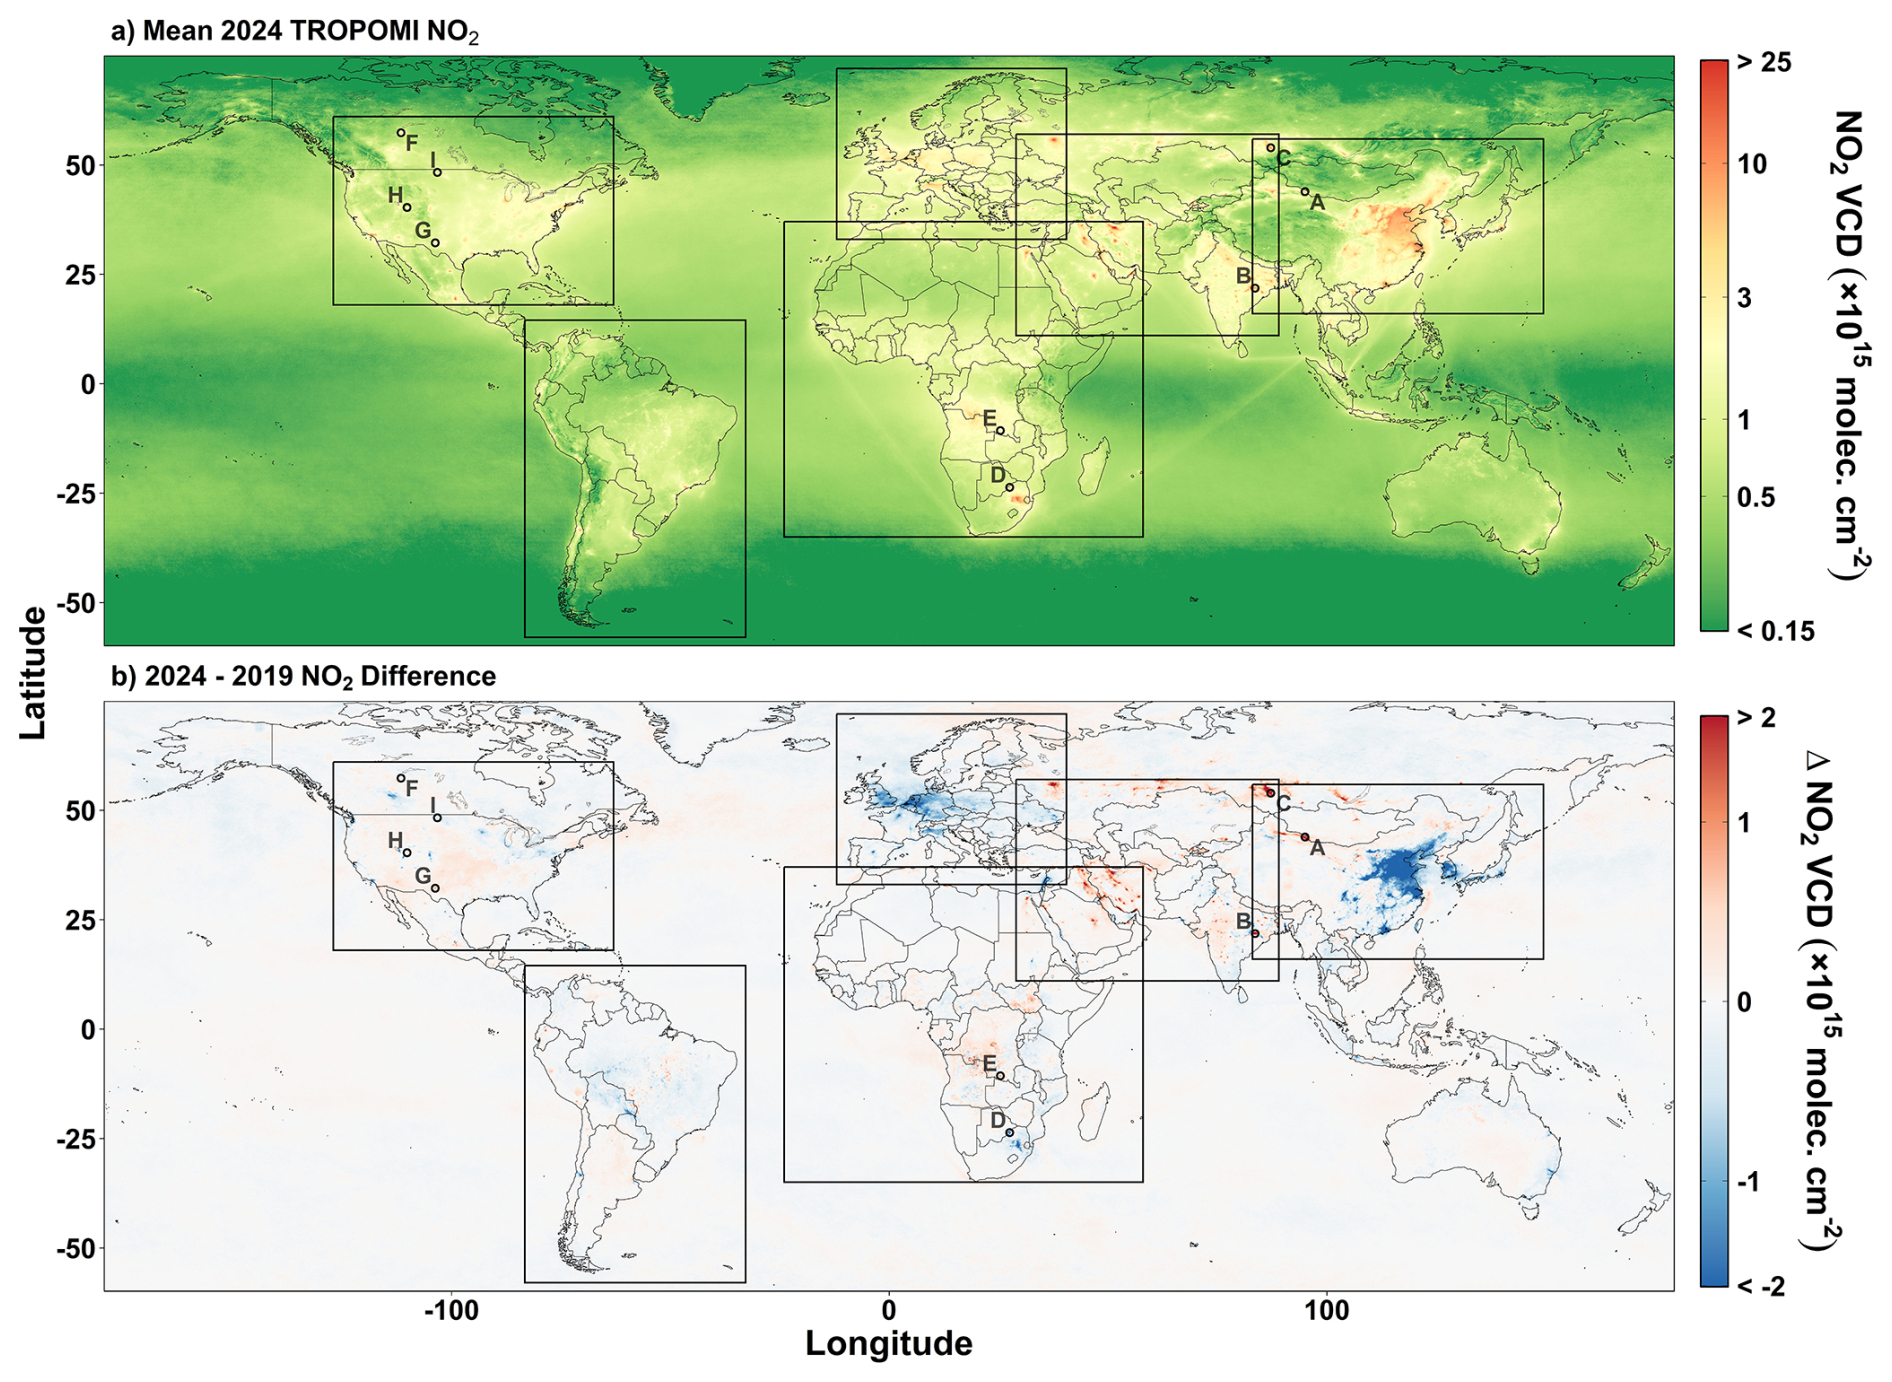
Figure 1(a) Global 2024 annual average NO2 VCDs colored on a log-scale and (b) the difference in VCD from 2019 to 2024 colored on a symmetric log-scale. Points labeled A–I correspond with locations of oil, gas and mining operations highlighted in Fig. 12. Boxes indicate select focus regions in Sect. 5.
TROPOMI NO2 retrievals are subject to measurement and retrieval uncertainties that propagate into the oversampled Level 3 products. Typical uncertainties in monthly or annually averaged tropospheric NO2 vertical column densities are on the order of 15 %–20 %. Systematic biases have also been reported, with overestimation in less polluted regions (+26.5 % bias) and underestimation in areas with high NO2 concentrations (−31.4 % bias), reflecting limitations in the retrieval process (Glissenaar et al., 2025; Lambert et al., 2025).
2.3 Quantifying Average TROPOMI NO2 VCDs for GHS-SMOD Urban Clusters
For each urban cluster, we subset the oversampled TROPOMI data for grid cells that are located within 0.1° of the urban cluster boundary. For most cities, this results in approximately 20–25 grid cells, depending on the extent of the individual cluster. Given that the spatial resolution of GHS-SMOD is roughly an order of magnitude finer than that of the oversampled TROPOMI data (1 km vs. 0.1°) we interpolate the subsetted TROPOMI data to the 0.01° × 0.01° resolution of GHS-SMOD using a nearest neighbor approach. We then calculate an area-weighted average of interpolated grid cells that have a grid cell center falling within the urban cluster boundary (Fig. S9). This approach allows for the portions of oversampled 0.1° × 0.1° grid cells that may not be centered within an urban cluster boundary, but that still overlap with a cluster, to be accounted for within the average NO2 column estimate.
To evaluate the changes in VCDs for broader regions, e.g. countries containing multiple urban clusters, we can calculate a population-weighted average VCD, taking into account varying population sizes in different urban clusters.
In Eq. (1), VCDPW represents the population-weighted VCD for a given country, POPi represents the 2020 GHS-SMOD-estimated population for a given urban cluster i, and VCDi represents the mean NO2 VCD for i.
For each time series, we use monthly TROPOMI NO2 columns from 2019–2024 to estimate a change in % yr−1. We first construct a de-seasonalized anomaly series by computing, for each calendar month at each location, the mean NO2 over the full period and expressing each monthly value as a percent deviation from its corresponding monthly mean. To obtain the percent change per year and its standard error, we fit a linear regression to the original monthly series with time as the predictor and fixed effects for calendar month to control for seasonality. The estimated annual percent change and its standard error were taken directly from the time-slope coefficient and its standard error from this regression. To assess statistical significance, we regressed the de-seasonalized percent anomalies on time and obtained a p-value for the slope using standard errors that account for temporal autocorrelation.
2.4 Accounting for Background NO2
To account for changes in upwind background NO2 concentrations that may influence urban NO2 VCDs, we quantify an urban NO2 enhancement.
In Eq. (2), VCDENH is the urban NO2 VCD enhancement, VCDUC is the NO2 VCD within each urban cluster as described in Sect. 2.2.1, and VCDBG is the background concentration for an urban cluster. We define VCDBG for a given year as the 50th percentile of annual mean NO2 VCDs extending 0.5° in any direction from an urban cluster boundary. Previous studies have used a percentile threshold to determine background concentrations (de Gouw et al., 2020). See Sect. S1 of the Supplement for additional information and sensitivity tests regarding background VCD quantification.
2.5 NOx Emission Inventories
We use data from two inventories to evaluate NOx emissions: (1) version 8.1 of the Emissions Database for Global Atmospheric Research (EDGARv8.1; Crippa et al., 2024), and (2) the 2025 version of Community Emissions Data System (CEDS; Hoesly et al., 2025). EDGAR provides annual summed total and sector-specific NOx emissions at 0.1° × 0.1° spatial resolution globally, derived using a bottom-up method that combines sector-level activity data with corresponding emissions factors for energy generation, industrial sources, transportation, residential sources and agriculture, with data available through 2022. CEDS is a similar bottom-up inventory, also provided at 0.1° × 0.1° spatial resolution, but provides emissions estimates at the monthly level through the end of 2023. Uncertainties are inherent in such emissions inventories, with a roughly 10 %–50 % uncertainty when aggregating emissions to the country level, and even larger uncertainty for individual grid points (Crippa et al., 2018).
Like the handling of TROPOMI data (Sect. 2.3), we use GHS-SMOD to quantify annual NOx emissions for each urban cluster.
Using the method outlined in Sect. 2.2.1, the GHS-SMOD urban cluster boundaries are used to determine mean TROPOMI NO2 concentrations for all urban clusters globally. Of all 11 534 GHS-SMOD urban clusters, 58.1 % are in Asia and Oceania, 18.5 % are in Africa, 10.9 % are in Europe, 6.2 % are in North America and 6.3 % are in South America. Looking at VCD changes from 2019 to 2024 in the 50 cities representing the ten most populous urban clusters on each continent, with Asia and Oceania considered jointly, East Asian cities represent four and European cities represent five of the ten largest VCD decreases (Fig. 2a). Seoul experienced the greatest absolute reduction in annual mean NO2 VCD of any of these 50 cities (Fig. 2b), representing a significant decrease of −9.4 ± 1.0 % yr−1 (p < 0.001; Fig. 2c). London, England produced the greatest NO2 VCD decrease of the ten most populous European cities (−5.4 ± 1.3 % yr−1; p < 0.001), occurring alongside the introduction of the city's ultra-low emission zone introduced in 2019 and expanded in 2023, which has contributed to decreased local NO2 concentrations (Hajmohammadi and Heydecker, 2022).
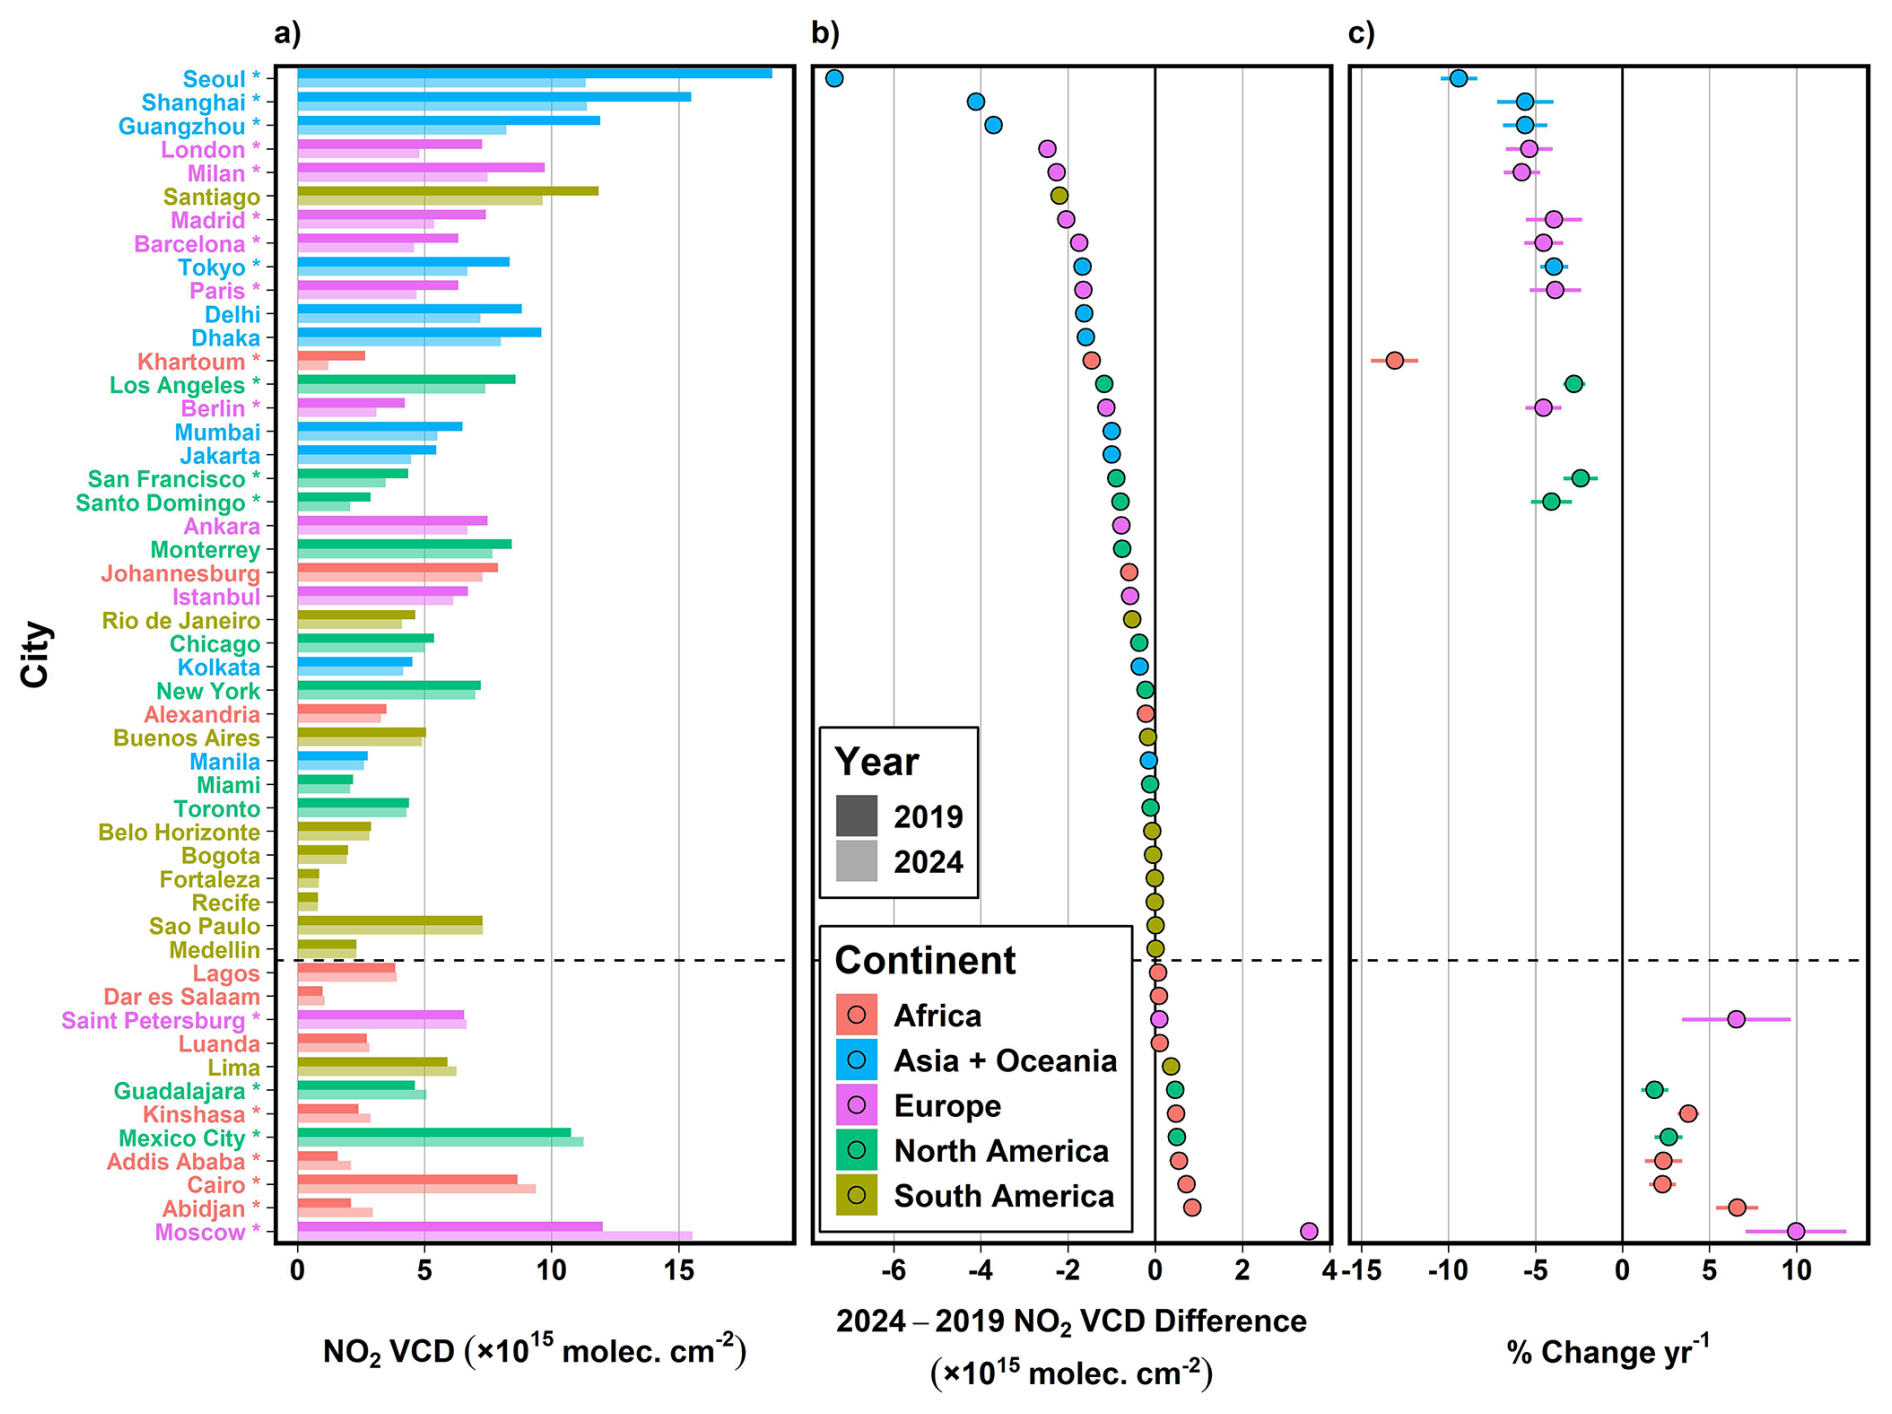
Figure 2(a) NO2 VCD in 2019 (dark bars) and 2024 (light bars) for the 10 most populous urban clusters on each continent, based on GHS-SMOD populations. (b) Absolute difference in NO2 VCD for each city from 2019 to 2024. (c) NO2 VCD percent change yr−1 from 2019 to 2024. Horizontal bars represent standard error, and colors correspond to the respective continent for each city. Cities are ordered by magnitude of absolute VCD decrease. Statistical significance is denoted with an asterisk by each city name. Only statistically significant results are reported in panel (c).
None of the ten largest South American cities experienced statistically significant changes in NO2 VCD, with relative changes typically less than ±0.6 × 10¹⁵ molecules cm−2 (Fig. 2b). The most notable exception is Santiago, Chile, which experienced an annual mean VCD difference of nearly molecules cm−2 between 2019 and 2024. Of the largest North American cities, significant decreases occurred in Los Angeles (−2.8 ± 0.6 % yr−1; p = 0.004), and the San Francisco Bay Area (−2.8 ± 0.6 % yr−1; p = 0.023), while significant increases occurred in the Mexican cities of Guadalajara (+1.9 ± 0.8 % yr−1; p = 0.019) and Mexico City (+2.7 ± 0.8 % yr−1; p = 0.010).
Most of the largest African cities experienced increased NO2 VCDs from 2019 to 2024, with Abidjan, Ivory Coast experiencing the largest urban increase (+6.6 ± 1.2 % yr−1; p < 0.001), with additional increases occurring in Cairo, Egypt (+2.3 ± 0.8 % yr−1; p= 0.006); Addis Ababa, Ethiopia (+2.4 ± 1.1 % yr−1; p= 0.012); and Kinshasa, DR Congo (+3.8 ± 0.6 % yr−1; p < 0.001). In the Sudanese capital of Khartoum, NO2 VCDs started decreasing in 2023, coinciding with the onset of conflict within Sudan (Guo et al., 2023; Fig. S10). This resulted in the largest absolute NO2 VCD decrease of any African city from 2019 to 2024 (Fig. 2b), and a decrease of −13.1 ± 1.4 % yr−1 (p < 0.001).
Of the cities presented in Fig. 2, the three largest absolute decreases between 2019 and 2024 were in the East Asian cities of Seoul, South Korea (Fig. 3a); Shanghai, China (Fig. 3b); and Guangzhou, China (Fig. 3c). Decreases in Seoul coincide with known policies implemented by the South Korean government since the early 2000s to reduce local emissions, as well as changes in emissions that began following the COVID-19 pandemic (Ho et al., 2021; Seo et al., 2021). Moscow experienced the largest NO2 VCD increase of any large GHS-SMOD city through 2024, with a VCD increase of +9.97 % yr−1 (p= 0.001). This increase was accompanied by anomalously high monthly mean concentrations in early 2022 (Fig. S11), following the onset of the Russia-Ukraine war in Ukraine, when monthly mean NO2 VCDs for March reached 59×1015 molecules cm−2 (see Sect. 3.3).
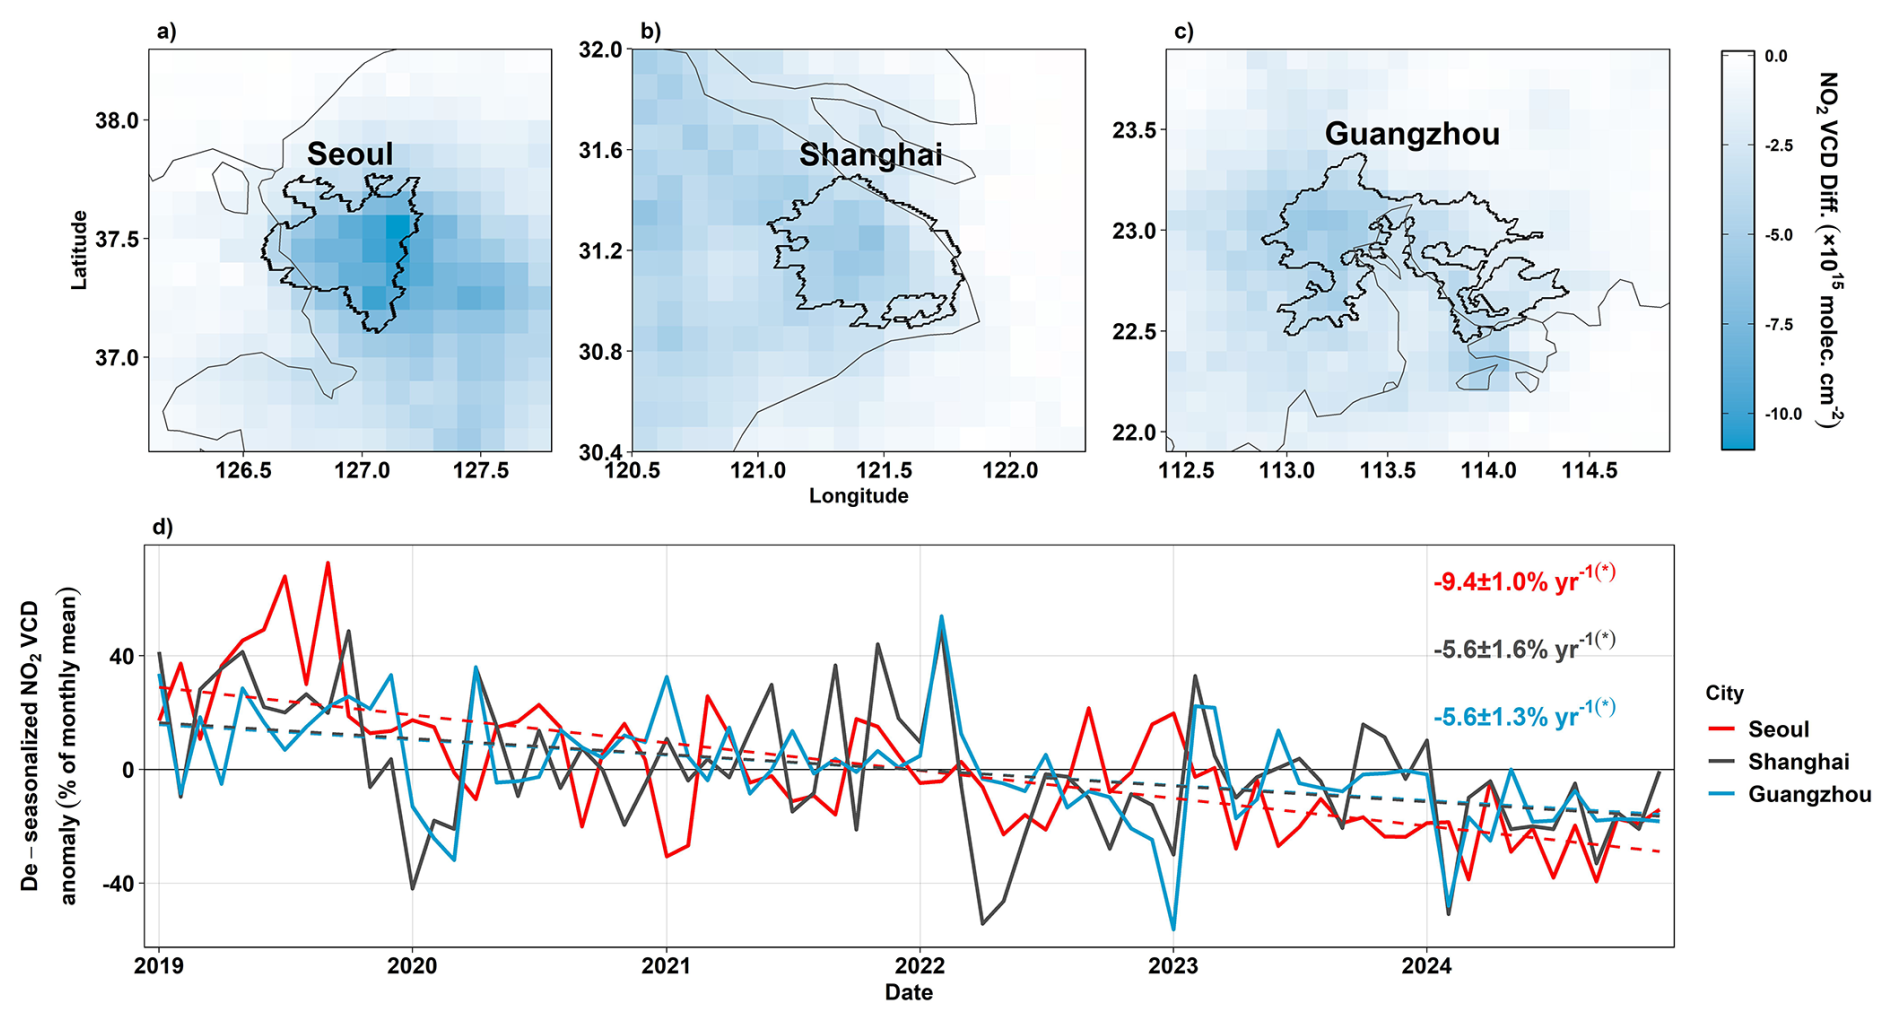
Figure 3Absolute change in mean annual NO2 VCD from 2019 to 2024 for three East Asian cities: (a) Seoul, South Korea, (b) Shanghai, China and (c) Guangzhou, China. Colors in panels a-c show magnitude of VCD change, thin lines show national borders or coastlines, and thick lines show the GHS-SMOD urban boundary. (d) Solid lines show de-seasonalized monthly VCD anomaly from January 2019 through December 2024, colored by city. Dashed lines are produced from ordinary least-squares regression. The % change yr−1, standard error and statistical significance is reported in the top right of panel (d).
Aggregating the NO2 VCD changes to the country level by considering the population of each urban cluster (Eq. 1), we identify population-weighted VCD changes in countries globally (Fig. 4). The majority of urban NO2 VCD increases were observed in much of Central America including Mexico, in Africa, in the Middle East and in Central Asia. Russia experienced the largest population-weighted VCD increase of 6.2 ± 3.6 % yr−1 (p= 0.046). Broad urban VCD decreases were observed in numerous countries across Western and Central Europe, as well as Eastern Asian countries. The largest urban population-weighted decrease occurred in South Korea (−8.74 ± 0.9 % yr−1; p < 0.001).
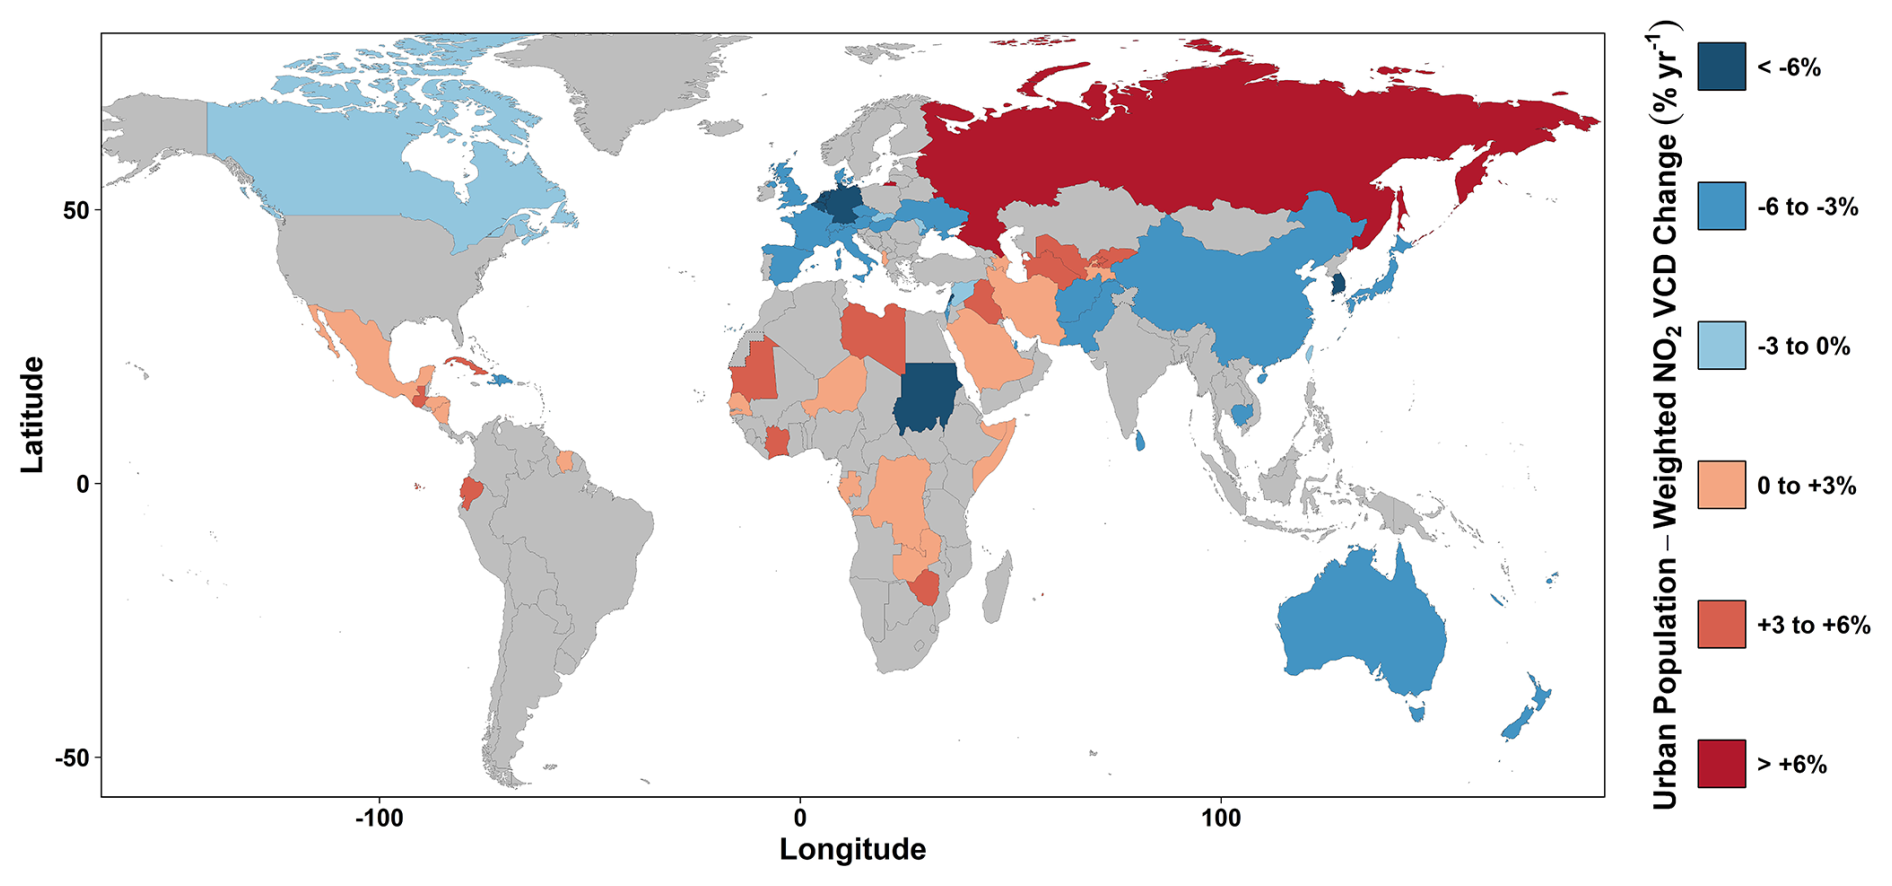
Figure 4Global spatial representation of the urban population-weighted NO2 VCD % change yr−1 from 2019 to 2024. Gray fill denotes statistical insignificance (p > 0.05).
Much of the Middle East exhibited substantial increases in urban population-weighted NO2 VCDs from 2019 to 2024, including in Saudi Arabia (+2.0 ± 0.9 % yr−1; p= 0.009), Iraq (+3.7 ± 0.8 % yr−1; p < 0.001), and Iran (+2.1 ± 0.9 % yr−1; p= 0.013), with broad increases that extend beyond the urban environment. One of the most salient VCD decreases in the Middle East occurred in Lebanon (−8.5 ± 1.0 % yr−1; p < 0.001), coinciding with the country's severe economic and financial crisis that began in late 2019 (Harake et al., 2021). VCD decreases through 2024 were particularly stark in the Lebanese capital Beirut (−7.9 ± 1.1 % yr−1; p < 0.001). Additional Middle Eastern countries that exhibited decreased urban NO2 VCDs through 2024 include much of Israel (−4.5 ± 0.9 % yr−1; p< 0.001), Qatar (−3.4 ± 1.2 % yr−1; p= 0.004), and Afghanistan (−3.8 ± 0.8 % yr−1; p= 0.003). Notable urban NO2 VCD changes in less populated countries of Asia and Oceania include decreases in Cambodia (−5.0 ± 0.9 % yr−1; p< 0.001), Sri Lanka (−5.4 ± 0.9 % yr−1; p< 0.001) and Australia (−3.0 ± 0.9 % yr−1; p= 0.008). Urban increases were observed in much of Central Asia, including Uzbekistan (+4.4 ± 0.9 % yr−1; p< 0.001) and Turkmenistan (+4.5 ± 0.5 % yr−1; p< 0.001).
NO2 VCD decreases for more populous countries with an urban population of at least nine million were largest in East Asia, including China (−6.0 ± 1.0 % yr−1; p< 0.001) and Japan (−4.1 ± 0.6 % yr−1; p< 0.001) (Fig. 5). Urban population-weighted VCD decreases in South Korea were particularly pronounced, with a population-weighted concentration difference of molecules cm−2 between 2019 and 2024. In South Asia, the neighboring countries of Afghanistan (−3.8 ± 0.8 % yr−1; p= 0.003) and Pakistan (−3.0 ± 0.8 % yr−1; p= 0.012) exhibited some of the only significant country-level VCD decreases for the region. Significant decreases also occurred in numerous countries of Western and Central Europe, with Germany experiencing the largest VCD decrease in Europe through 2024 (−6.7 ± 0.9 % yr−1; p< 0.001). Of the most-populous European countries, Russia was the only country to experience increased population-weighted NO2 VCDs through 2024.
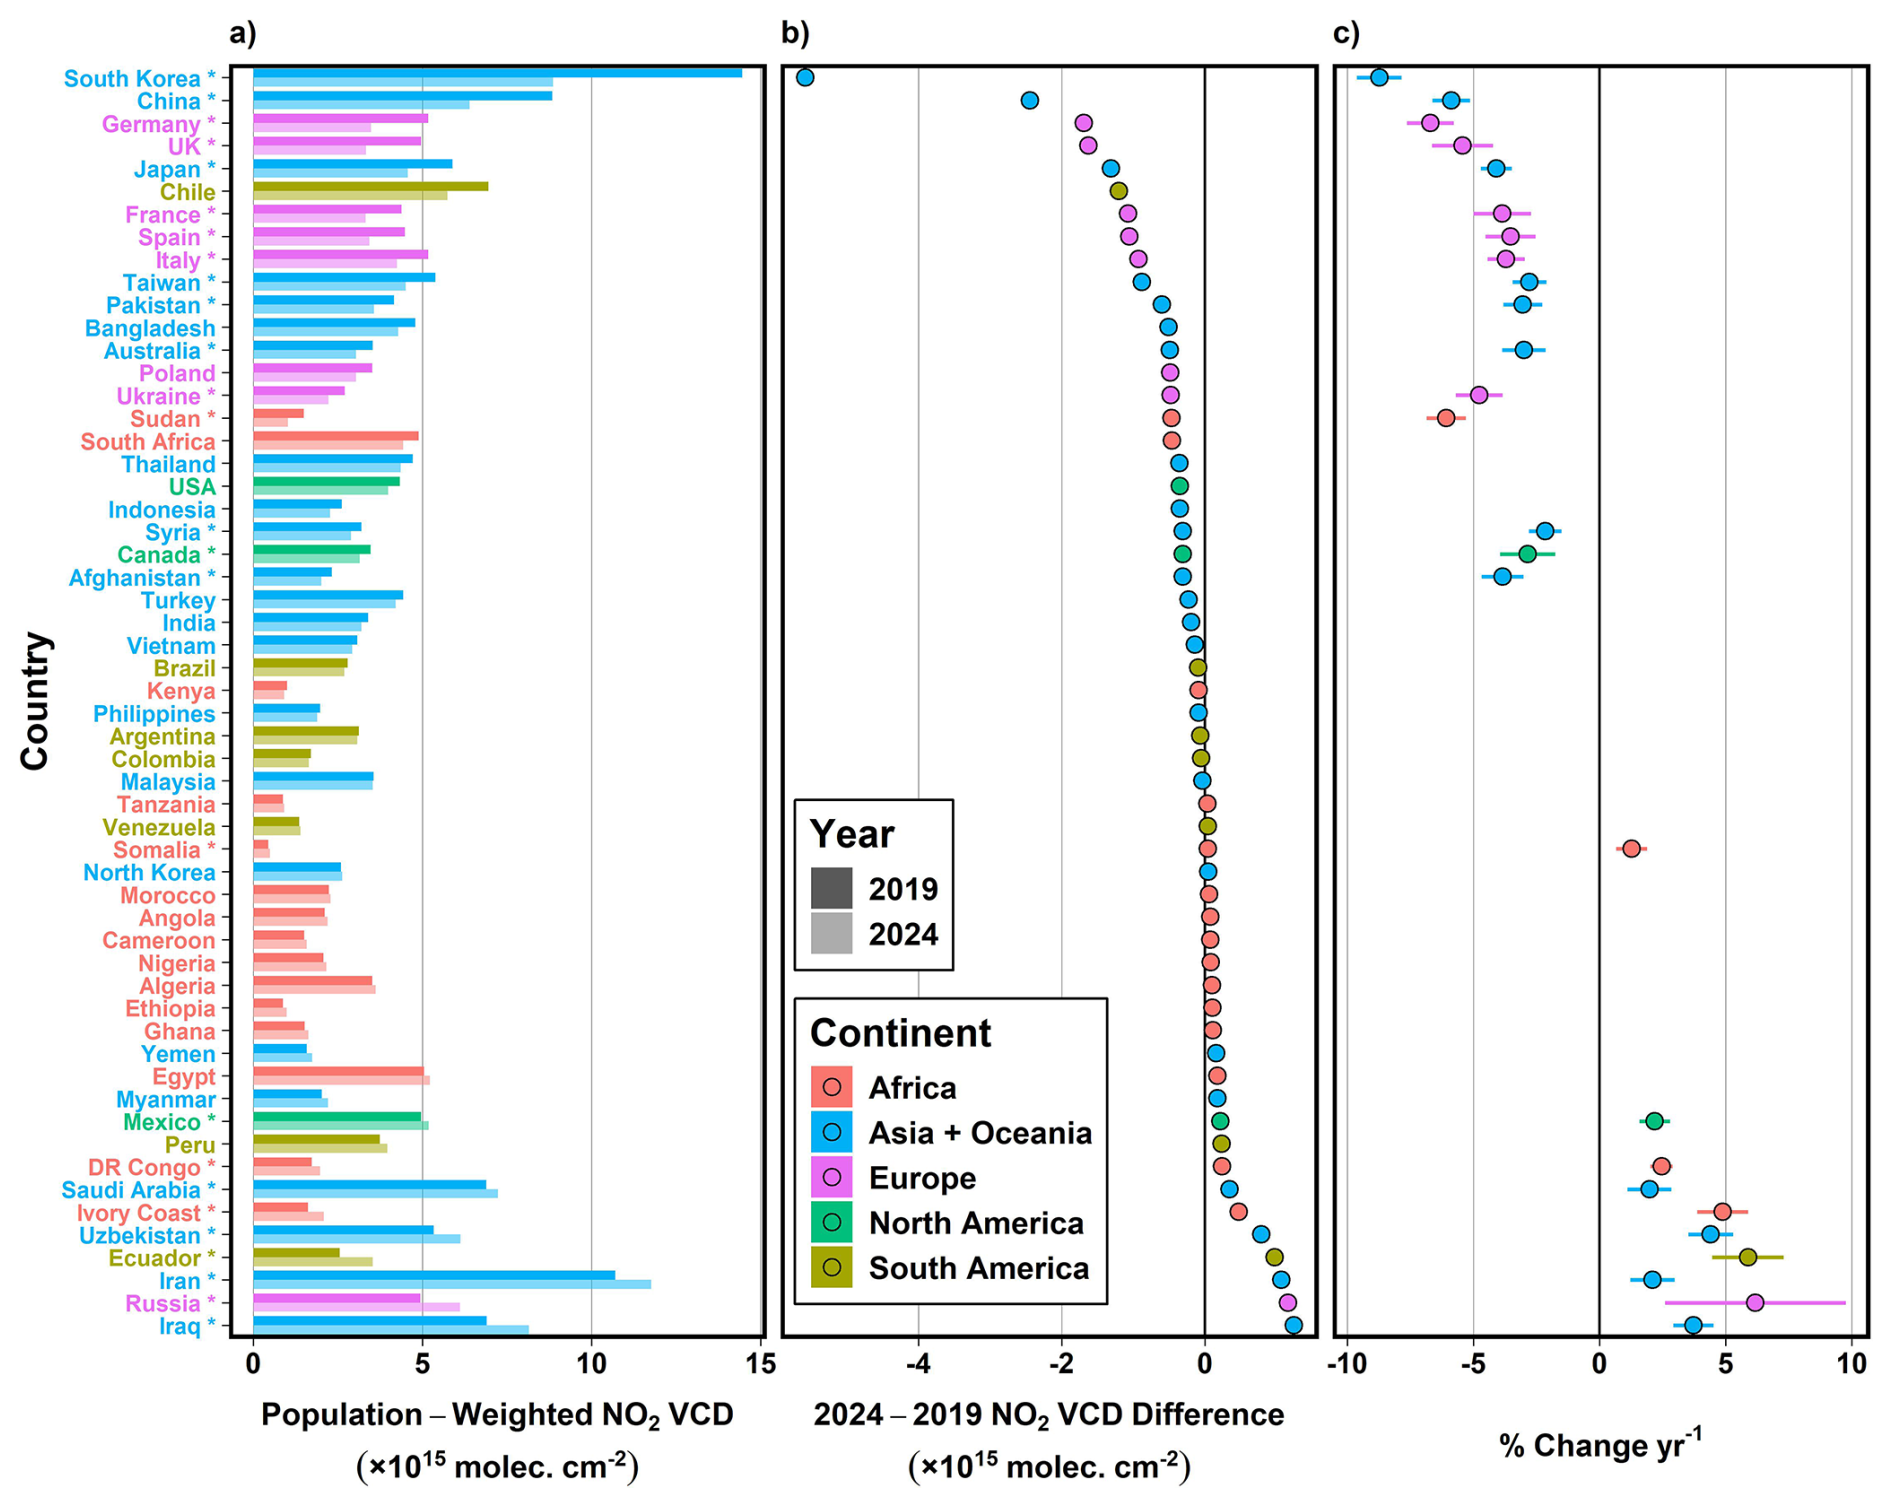
Figure 5Same as Fig. 2 but presenting changes in country-level urban population-weighted NO2 VCDs for countries with an urban population of at least nine million, based on urban cluster populations provided from GHS-SMOD.
A majority of larger African countries exhibited insignificant urban VCD changes, with 2024 population-weighted VCDs changing by less than 0.25×10¹⁵ molecules cm−2 relative to 2019 levels (Fig. 5b). Exceptions include larger changes in Sudan (−6.1 ± 0.8 % yr−1; p < 0.001) and Ivory Coast (+4.9 ± 1.0 % yr−1; p < 0.001). Middle Eastern and Central Asian countries experienced some of the largest urban VCD increases, with Iraq experiencing the largest difference between 2019 and 2024 levels of any larger country ( molecules cm−2). Chile saw the largest difference in annual mean urban NO2 VCD between 2019 and 2024 of any South American country, due in large part to lower 2024 annual mean NO2 VCDs in the capital city of Santiago (Fig. 5b).
The following subsections describe NO2 VCDs in five global subregions: Asia and Oceania, Africa, Europe, North America and South America
5.1 Asia and Oceania
North and East China, one of the most populated regions globally with approximately 11 % of the 1000 largest GHS-SMOD cities, produced the broadest continuous expanse of 2024 annual mean NO2 VCDs at or above 5×10¹⁵ molecules cm−2 (Fig. 6a). Despite this, substantial VCD decreases were observed in this region from 2019 to 2024 (Fig. 6b). NO2 concentrations had already been decreasing in China prior to 2019 (Liu et al., 2016; de Foy et al., 2016), and the decrease continued after the onset of the COVID-19 pandemic, during which numerous lockdowns throughout the country between 2020 and 2022 led to reduced NO2 concentrations (Zheng et al., 2021; Cooper et al., 2022; Levelt et al., 2022; Ma et al., 2023; Zhao et al., 2024). The decrease in NO2 also coincided with general Chinese government policies directed at reducing emissions, including stricter emissions controls for industrial sources, energy generation and the transportation sector (Shi et al., 2022; Li et al., 2024).
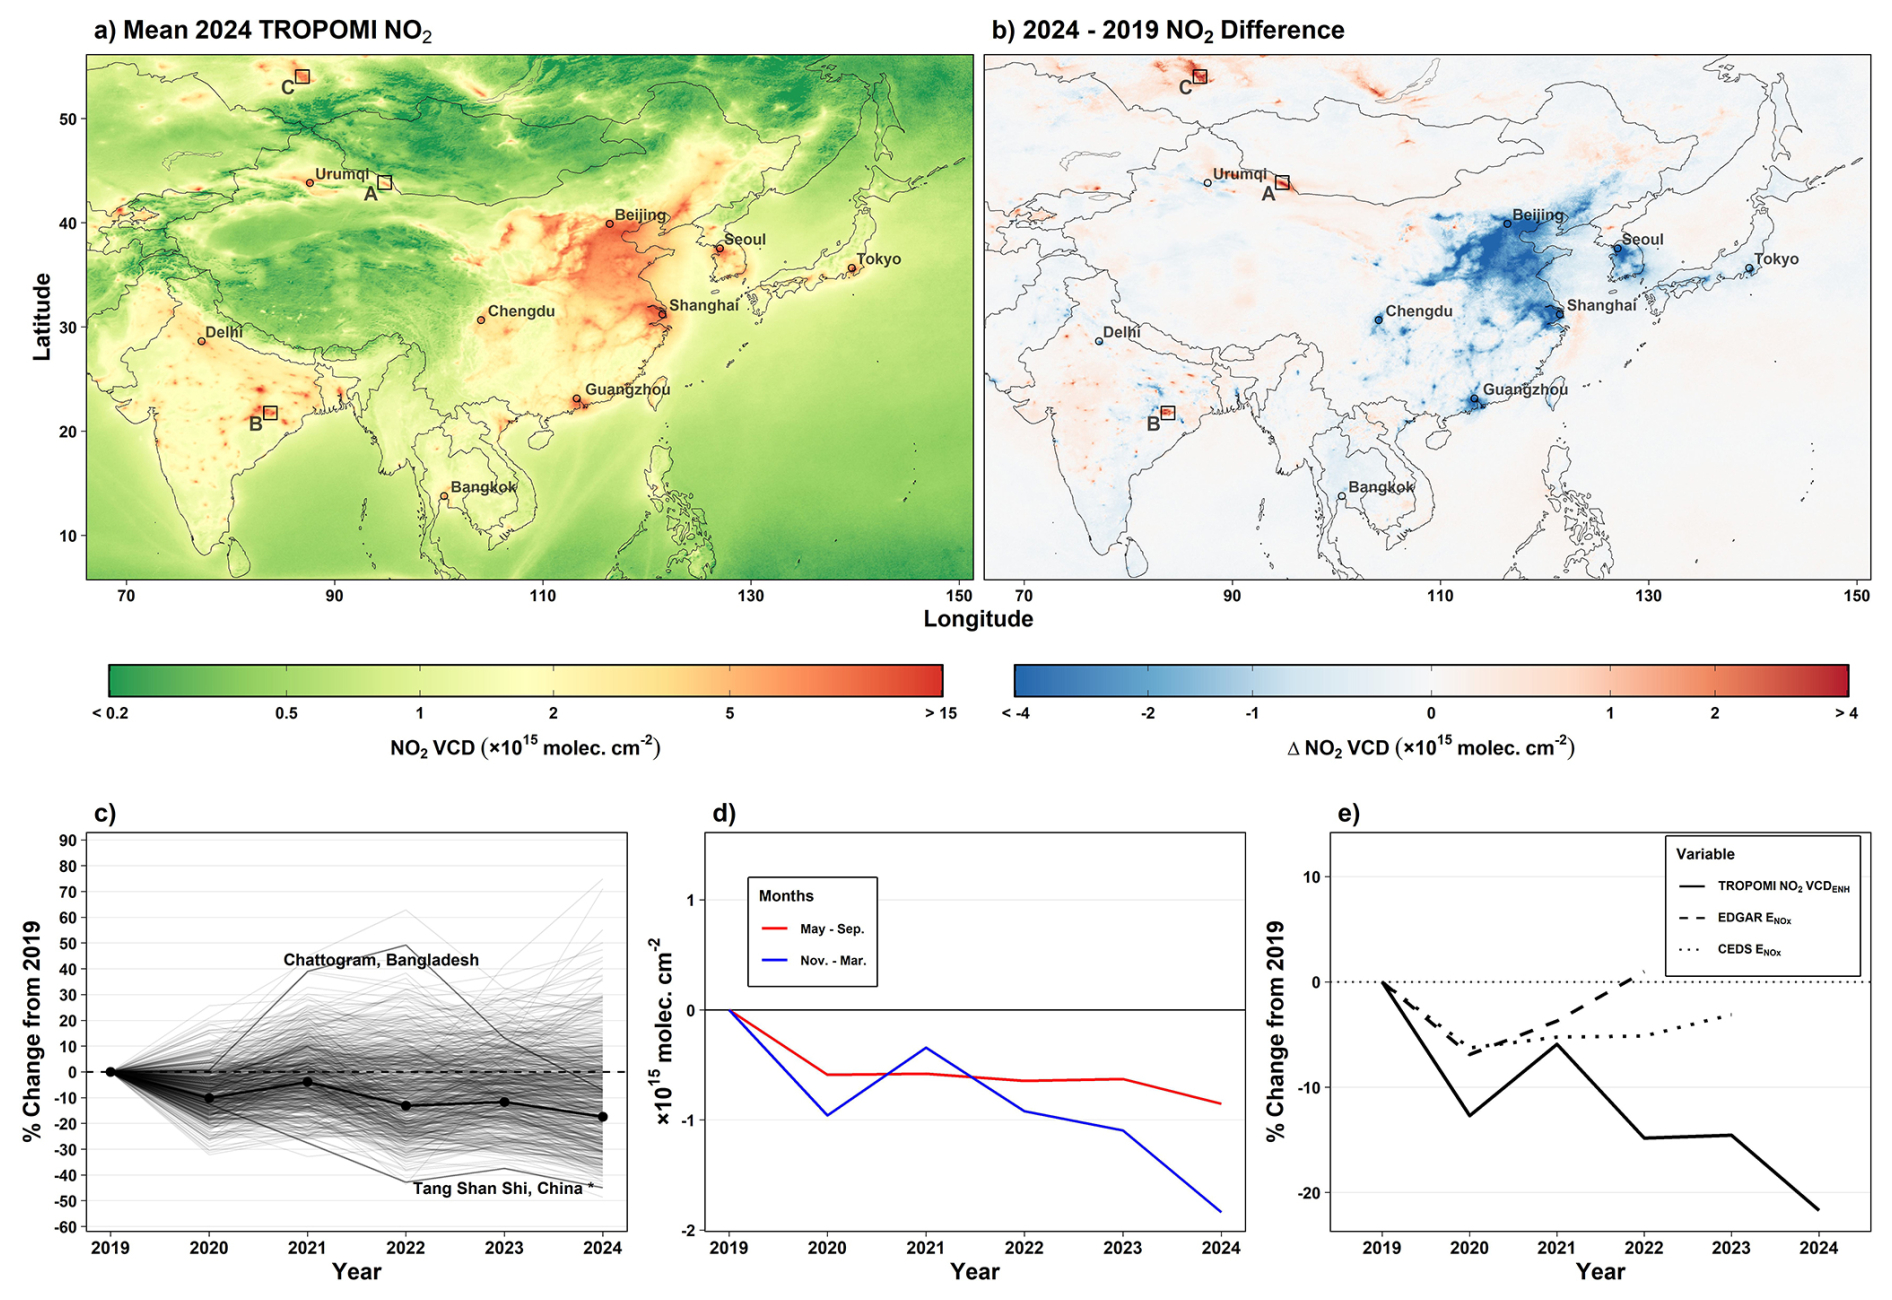
Figure 6(a) Mean 2024 TROPOMI NO2 VCDs and (b) relative difference in annual mean TROPOMI VCDs between 2019 and 2024, centered on South and East Asia. Regions A, B and C represent the Santanghu Basin, the Ib Valley and Kuzbass mining regions, respectively, as highlighted in Fig. 12. (c) Population-weighted percent difference in annual mean TROPOMI NO2 VCD relative to 2019 levels for all GHS-SMOD urban clusters in Asia and Oceania (solid black line), and percent change in VCD for individual clusters with a population of at least 500 000 (gray lines). Asterisks denote statistical significance. (d) Absolute population-weighted difference in VCD for urban clusters in Asia and Oceania in May-September (red line) and November to March (blue line). (e) Relative difference in population-weighted TROPOMI NO2 urban enhancement (VCDENH; solid line, 2019–2024), NOx emissions from the EDGARv8.1 emissions inventory (dashed line, 2019–2022) and CEDS emissions inventory (dotted line, 2019–2023).
In India, the largest differences in urban NO2 VCD between 2019 and 2024 were observed in Delhi ( molecules cm−2) and Mumbai ( molecules cm−2), though neither city exhibited statistically significant decreases over that period. Elevated NO2 near numerous coal-fired power plants and coal mines is a common feature in India (Panda et al., 2023), evidenced by the many apparent point sources in the 2024 annual average TROPOMI VCDs throughout the country (Fig. 6a). NO2 VCDs increased at many of these points sources from 2019 to 2024 (Fig. 6b), suggesting an increase in emissions from energy production and use. In the Middle East and Central Asia, urban regions experienced some of the highest NO2 VCDs globally in the TROPOMI record (Fig. 7). The Iranian capital of Tehran by far has the largest annual average VCD in the TROPOMI tropospheric NO2 record for all GHS-SMOD cities, with annual mean values remaining above 30×1015 molecules cm−2 throughout the entirety of the TROPOMI record (Fig. S12).
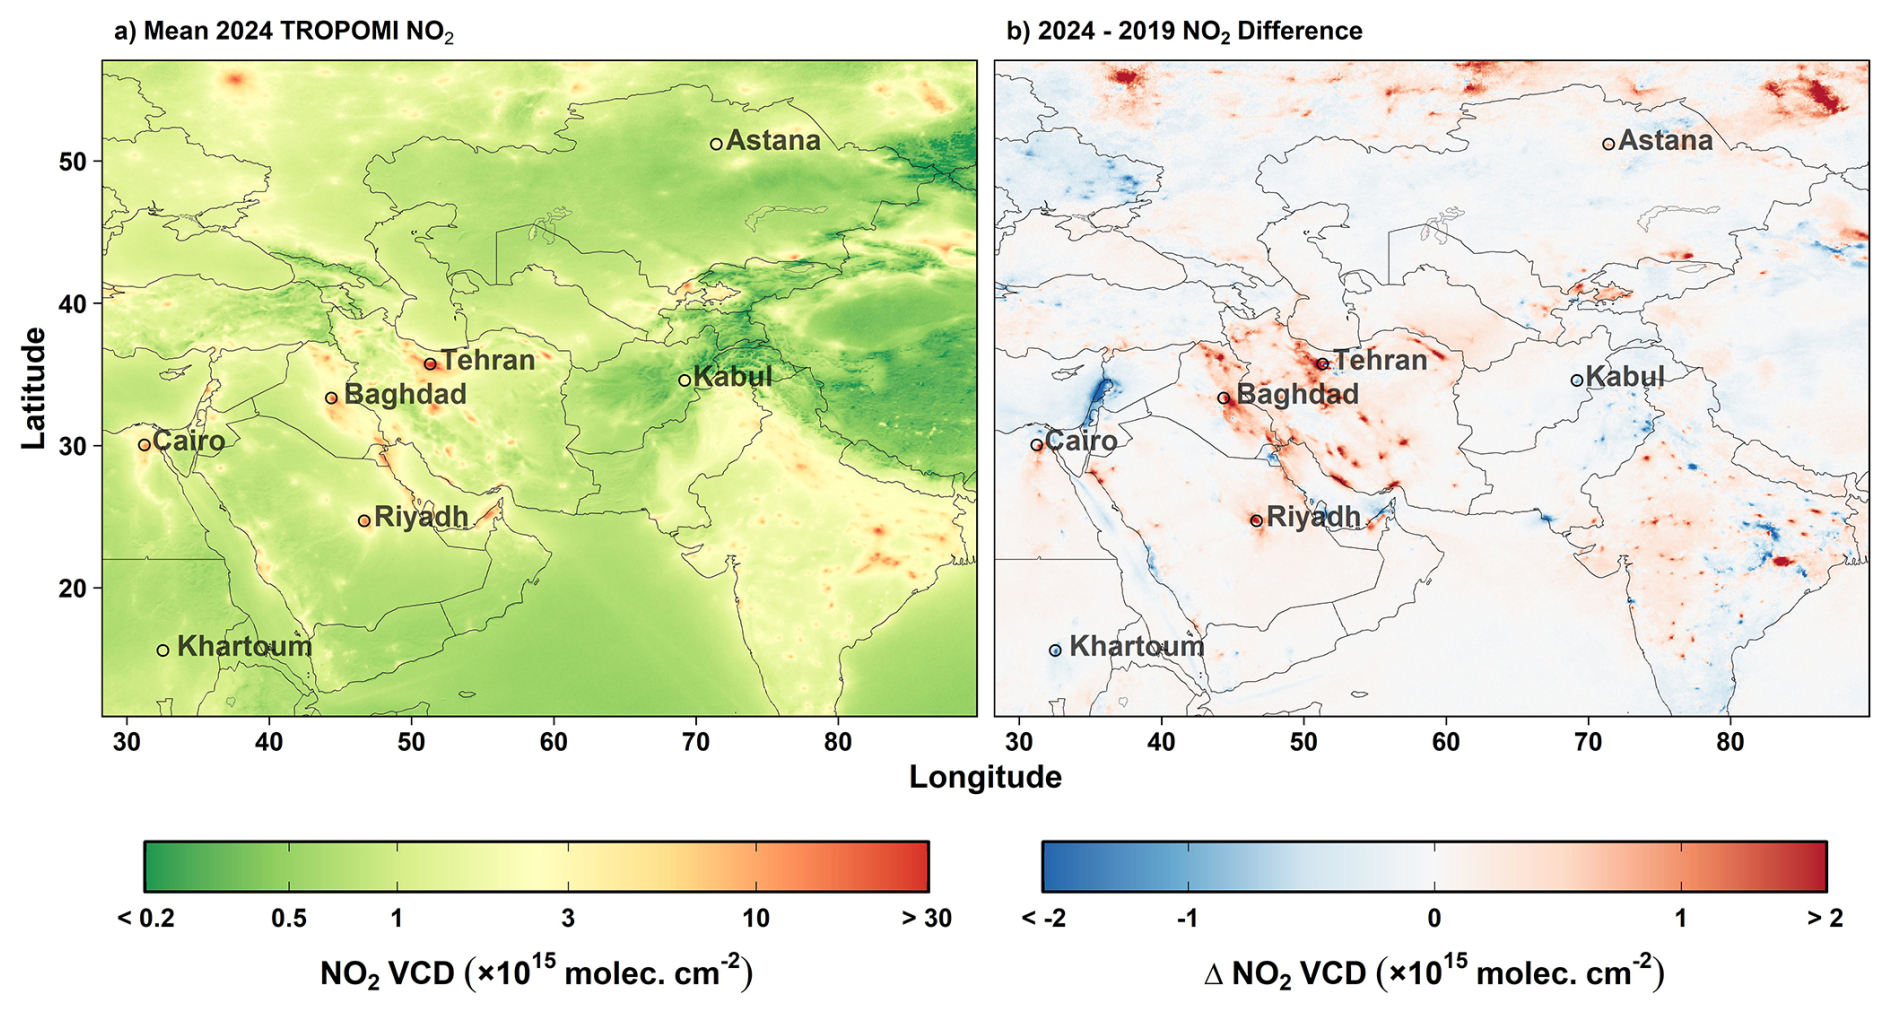
Figure 7(a) Mean 2024 TROPOMI NO2 VCDs and (b) relative difference in annual mean TROPOMI VCDs between 2019 and 2024, centered on the Middle East and Central Asia.
Across Asia and Oceania as a whole, which contain a majority of all urban clusters globally, population-weighted NO2 VCDs were approximately 17 % lower in 2024 than in 2019 (Fig. 6c). One notable decrease in Asia occurred in the Chinese city of Tang Shan Shi, located to the east of Beijing, which experienced an NO2 VCD decrease of nearly 45 % from 2019 to 2024. The largest increase in Asia through 2024 occurred in the Mongolian capital of Ulaanbaatar, where the 2024 mean VCD was more than 70 % larger than in 2019. Numerous Bangladeshi cities, including Chattogram, experienced substantially increased VCDs from 2020 through 2022, with VCDs decreasing again by 2024 to the near 2019 levels (Fig. S13).
Different seasons can have outsize impact on the relative change in annual NO2 VCD. In cities of Asia and Oceania, the bulk of the observed annual decreases through 2024 occurred during November–March (Fig. 6d), with a population-weighted decrease of molecules cm−2. Although the absolute changes in November–March were larger than in May–September, the relative percent changes for the two periods were more comparable (Fig. S14).
Urban NO2 concentrations are not only influenced by local emissions, but also by advection of upwind pollutants into the urban boundary. We account for the role that upwind background concentrations may play in urban NO2 concentrations by identifying changes in the urban enhancement of NO2 (VCDENH), represented by the difference between NO2 VCDs in the urban cluster and the urban background VCD. By removing the background concentrations, we expect that the percent change in VCDENH relative to a baseline year can be primarily attributed to changes in local, urban NOx emissions. We then evaluate changes in VCDENH against changes in gridded NOx emissions inventories from (1) the EDGARv8.1, with data available through 2022 and (2) CEDS, with data available through 2023 (Fig. S15).
In Asia and Oceania, cities experienced sustained decreases in VCDENH, with population-weighted values 22.7 % lower in 2024 than in 2019 (Fig. 6e). Cities in Asia and Oceania experienced VCDENH that tracked relatively well with both inventories from 2019 to 2021, with a mean difference of +4.0 % (EDGARv8.1) and +3.6 % (CEDS) between emissions and VCDENH. However, in 2022, EDGARv8.1 showed increased emissions and CEDS exhibited mostly unchanged emissions, while VCDENH exhibited a sharp decrease for that year. This resulted in a percentage difference of +15.8 % (EDGARv8.1) and +9.7 % (CEDS) between emissions and VCDENH in 2022 relative to 2019 levels (Fig. 6e). The 2022 VCDENH decrease coincided with broad lockdowns in China related to the COVID-19 pandemic, suggesting that EDGAR emissions may not reflect emissions decreases during that lockdown period.
5.2 Africa
Areas to the east of Johannesburg, South Africa and the surrounding region exhibited the broadest enhanced NO2 VCD for the African continent in 2024 (Fig. 8a). Numerous surface coal mines and coal-fired power plants, particularly to the east of Johannesburg, contribute to the region's NO2 signature (Shikwambana et al., 2020). Cairo, Egypt represents the largest urban NO2 signature of any major urban region in Africa in 2024, when the annual mean NO2 VCD reached 9.4×10¹⁵ molecules cm−2. From 2019 to 2024, Cairo experienced a statistically significant VCD increase of 2.3 ± 0.8 % yr−1 (p= 0.006). Along the African Mediterranean coast, most urban areas showed increased NO2 VCDs through 2024.
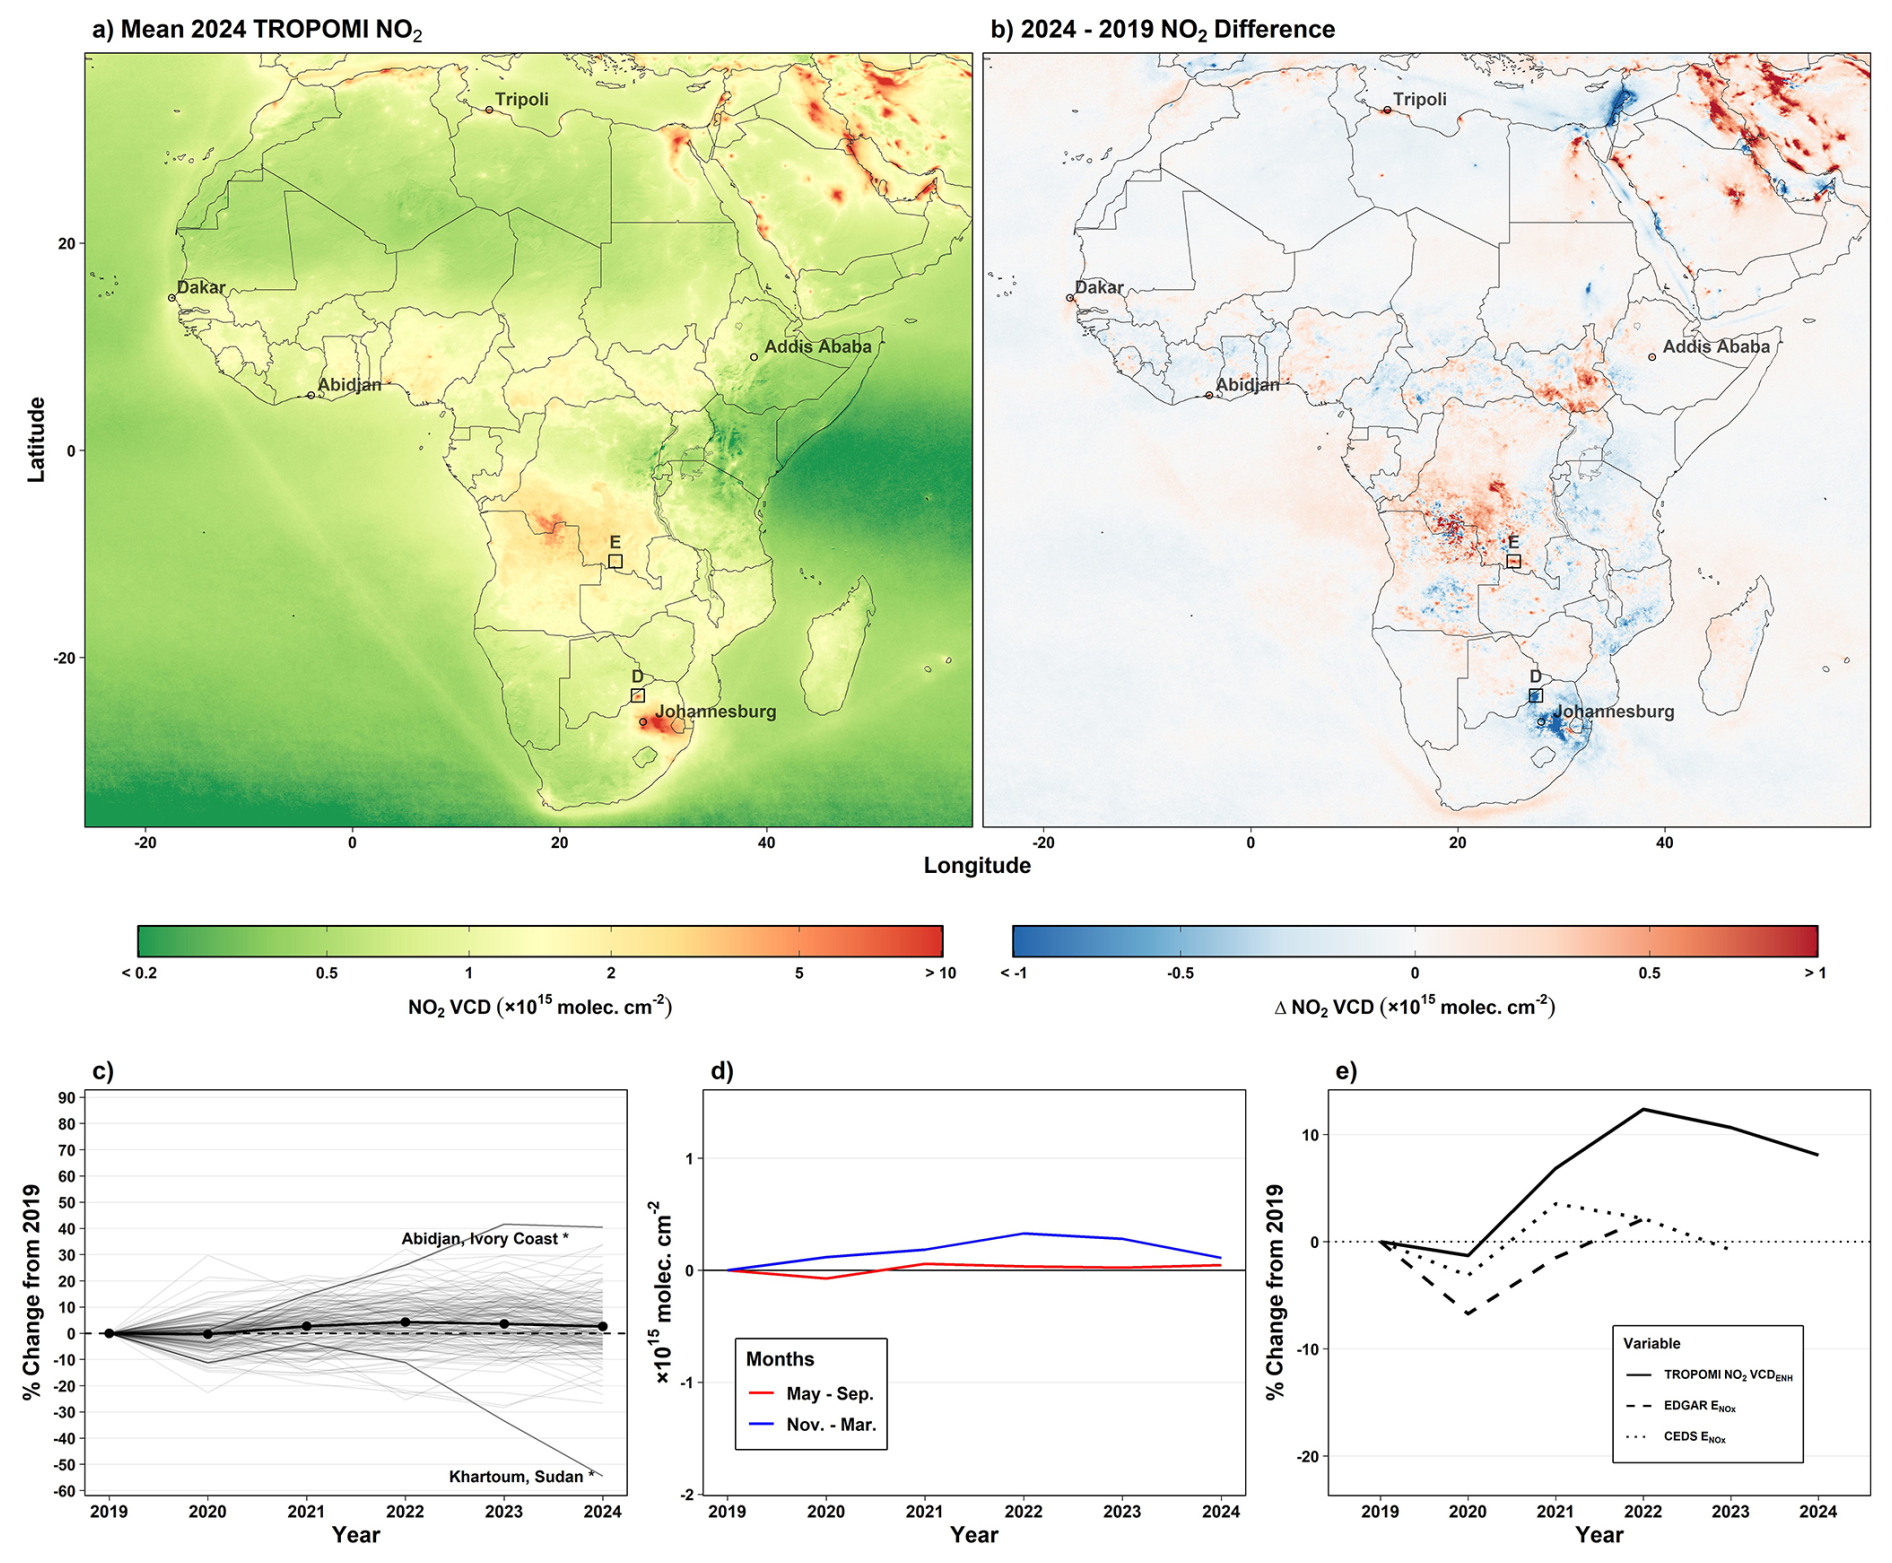
Figure 8Same as Fig. 6, but for the African continent. Regions D and E in panels a and b represent the Grootegeluk and Kolwezi mines, respectively, as highlighted in Fig. 12.
Through 2024, African cities experienced a gradual increase in population-weighted NO2 VCD (Fig. 8c). The largest percent increase occurred in Abidjan, the capital city of Ivory Coast, which experienced an increase in NO2 VCD of more than 40 % from 2019 through 2024. Khartoum, Sudan experienced the largest percent decrease of any large African City, with mean 2024 levels nearly 60 % lower than in 2019.
In African cities (Fig. 8d), population-weighted VCDs during November–March were 0.1×10¹⁵ molecules cm−2 larger in 2024 than 2019, with little to no change occurring on average during May–September. When evaluating changes in VCDENH in African cities, population-weighted VCDENH were +8.1 % larger in 2024 relative to 2019 levels (Fig. 8e). One distinct feature for African cities is the lack of a pronounced decrease in VCDENH during 2020, coinciding with the onset of the COVID-19 pandemic, a feature observed on all other continents. Evaluating NOx emissions inventories in African cities, we find a mean difference of −8.0 % (EDARv8.1) and −6.7 % (CEDS) between inventory NOx emission and VCDENH changes, indicating a potential underestimate in both emissions inventories in African cities for this period.
5.3 Europe
NO2 VCDs in Europe were largest in urban areas, with the largest 2024 mean VCD occurring in Moscow, Russia (15.5×10¹⁵ molecules cm−2) (Fig. 9a). Broad enhanced 2024 annual mean VCDs exceeding 4×10¹⁵ molecules cm−2 were observed in a region encompassing Belgium, the Netherlands and western portions of Germany, with values exceeding 5×10¹⁵ molecules cm−2 in the Po River Valley of northern Italy.
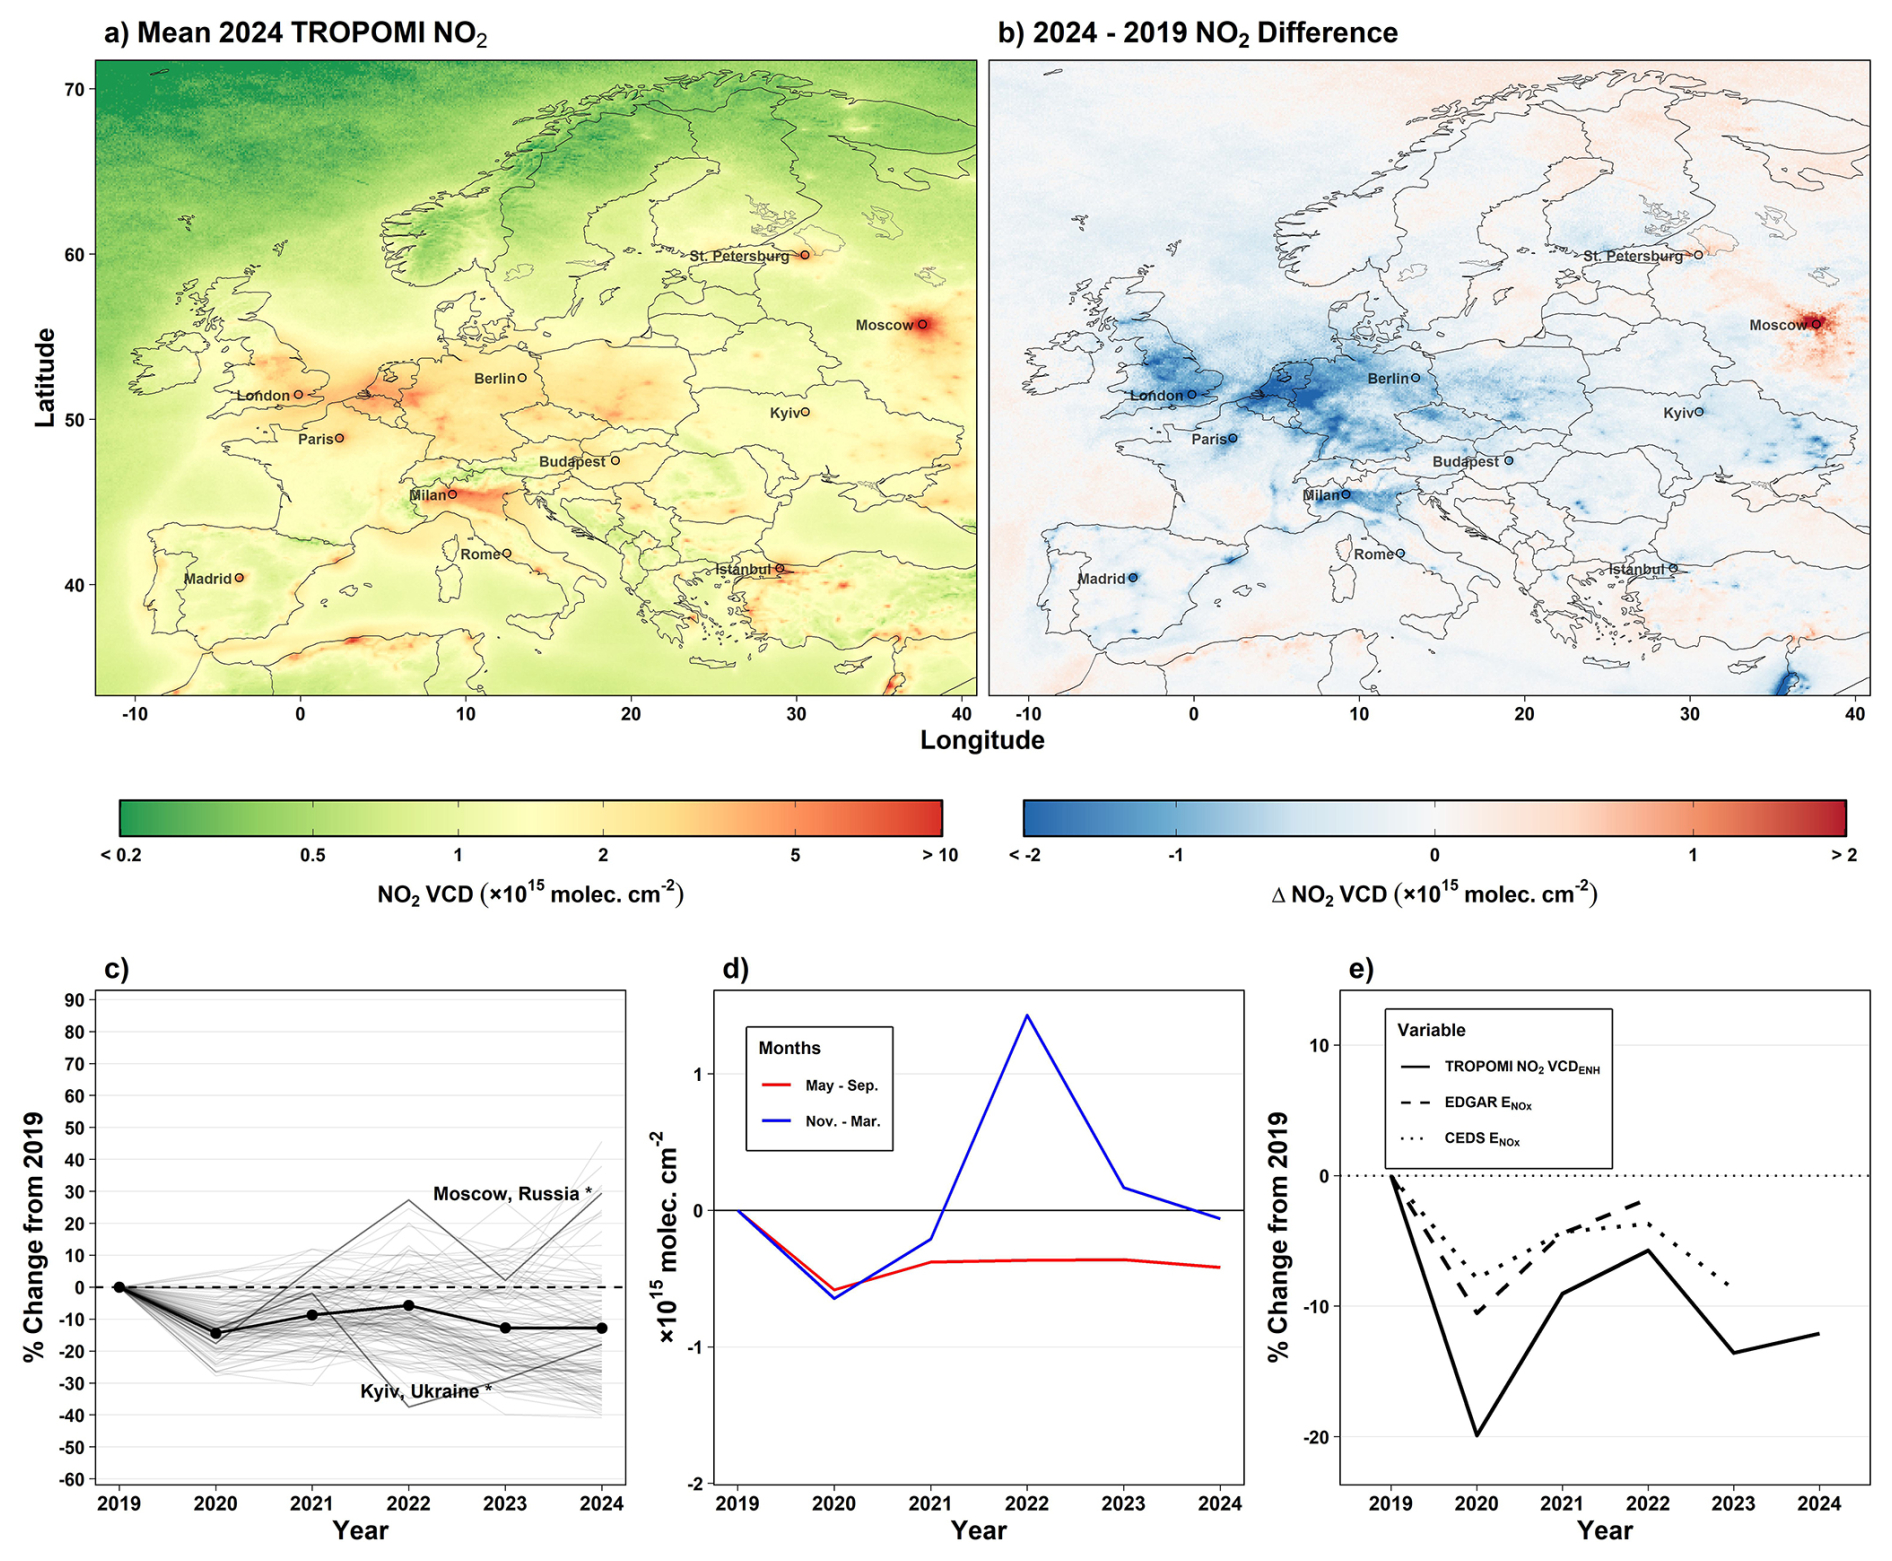
Figure 9Same as Fig. 6, but for Europe.
Of the 1257 urban clusters in Europe, 1007 (80 %) exhibited lower VCDs in 2024 than in 2019. Of the 53 European urban clusters with a population greater than 1 000 000, 2024 VCDs were lower than 2019 VCDs in 48 (91 %), with the exception of Moscow and other cities of western Russia, which experienced increases (Fig. 9b). The broad decreases across large European cities are likely due to a combination of (1) a decrease in emissions that continued following the COVID-19 pandemic, (2) continued transition to alternative energy sources following the start of the Russia-Ukraine war in 2022 and (3) existing policies implemented within the EU (Matthias et al., 2021; Rokicki et al., 2023; Cifuentes-Faura, 2022). These policies include the European Green Deal and European Climate Law, which promote zero-emission vehicles, stricter vehicle emissions targets and updated industrial emissions regulations.
European cities experienced the most pronounced decrease in column NO2 of any continent in 2020, with population-weighted VCDs decreases by 16 % from 2019 to 2020 (Fig. 9c). Previous work has attributed such decreases to the COVID-19 pandemic (Cooper et al., 2022; Levelt et al., 2022). NO2 VCDs rebounded marginally in 2021 and 2022, followed by decreases into 2023 and 2024. Decreases are more pronounced when only analyzing cities in the 27 member countries of the European Union (Fig. S16). One notable feature within the European annual average VCDs is the contrasting VCD directionality in Russian and Ukrainian cities in 2022, at the onset of the Russia-Ukraine War (Fig. S17). In the Ukrainian capital of Kyiv, annual VCDs dropped nearly 40 % in 2022 relative to 2019, coinciding with a large portion of the city fleeing due to conflict in and near the city. To contrast this, VCDs increased nearly 30 % in the Russian capital of Moscow during the same period. Following 2022, VCDs in Kyiv increased steadily, while in Moscow, levels decreased in 2023 then increased again in 2024.
Population-weighted May–September VCDs decreased by 0.4×10¹⁵ molecules cm−2 (−10 %) through 2024, while VCD behavior during November–March has been less consistent, despite a sharp increase in winter-time levels in 2022 during the onset of the Russia-Ukraine war (Fig. 9d). We note that the seasonal changes in Europe show more comparable winter and summer changes if evaluating with Russian cities removed (Fig. S18). When accounting for background concentrations, VCDENH in European cities experienced the largest drop in 2020 of any continent, with population-weighted VCDENH decreasing by −20 % from 2019 to 2020 (Fig. 9e). While both EDGARv8.1 and CEDS exhibited similar mean year to year variability as VCDENH in European cities, changes in the inventories appeared underestimated, with each inventory estimate exhibiting a mean percent difference relative to VCDENH of +6.0 % and +5.9 %, respectively. This suggests a slight underestimate in emissions inventory decreases in European cities relative to observed VCDENH levels.
5.4 North America
Throughout North America, 2024 annual mean NO2 VCDs were largest in urban regions, including Los Angeles (7.4×10¹⁵ molecules cm−2), New York (7.0×10¹⁵ molecules cm−2), and Mexico City (11.3×10¹⁵ molecules cm−2), as well as near fossil fuel-fired power plant and mining operations (Fig. 10a). Most major cities in the US and Canada exhibited decreased or unchanged NO2 VCDs (Fig. 10b). Phoenix, Arizona was one notable exception to these decreases, with mean 2024 VCDs 10 % higher than in 2019 (Fig. S19).
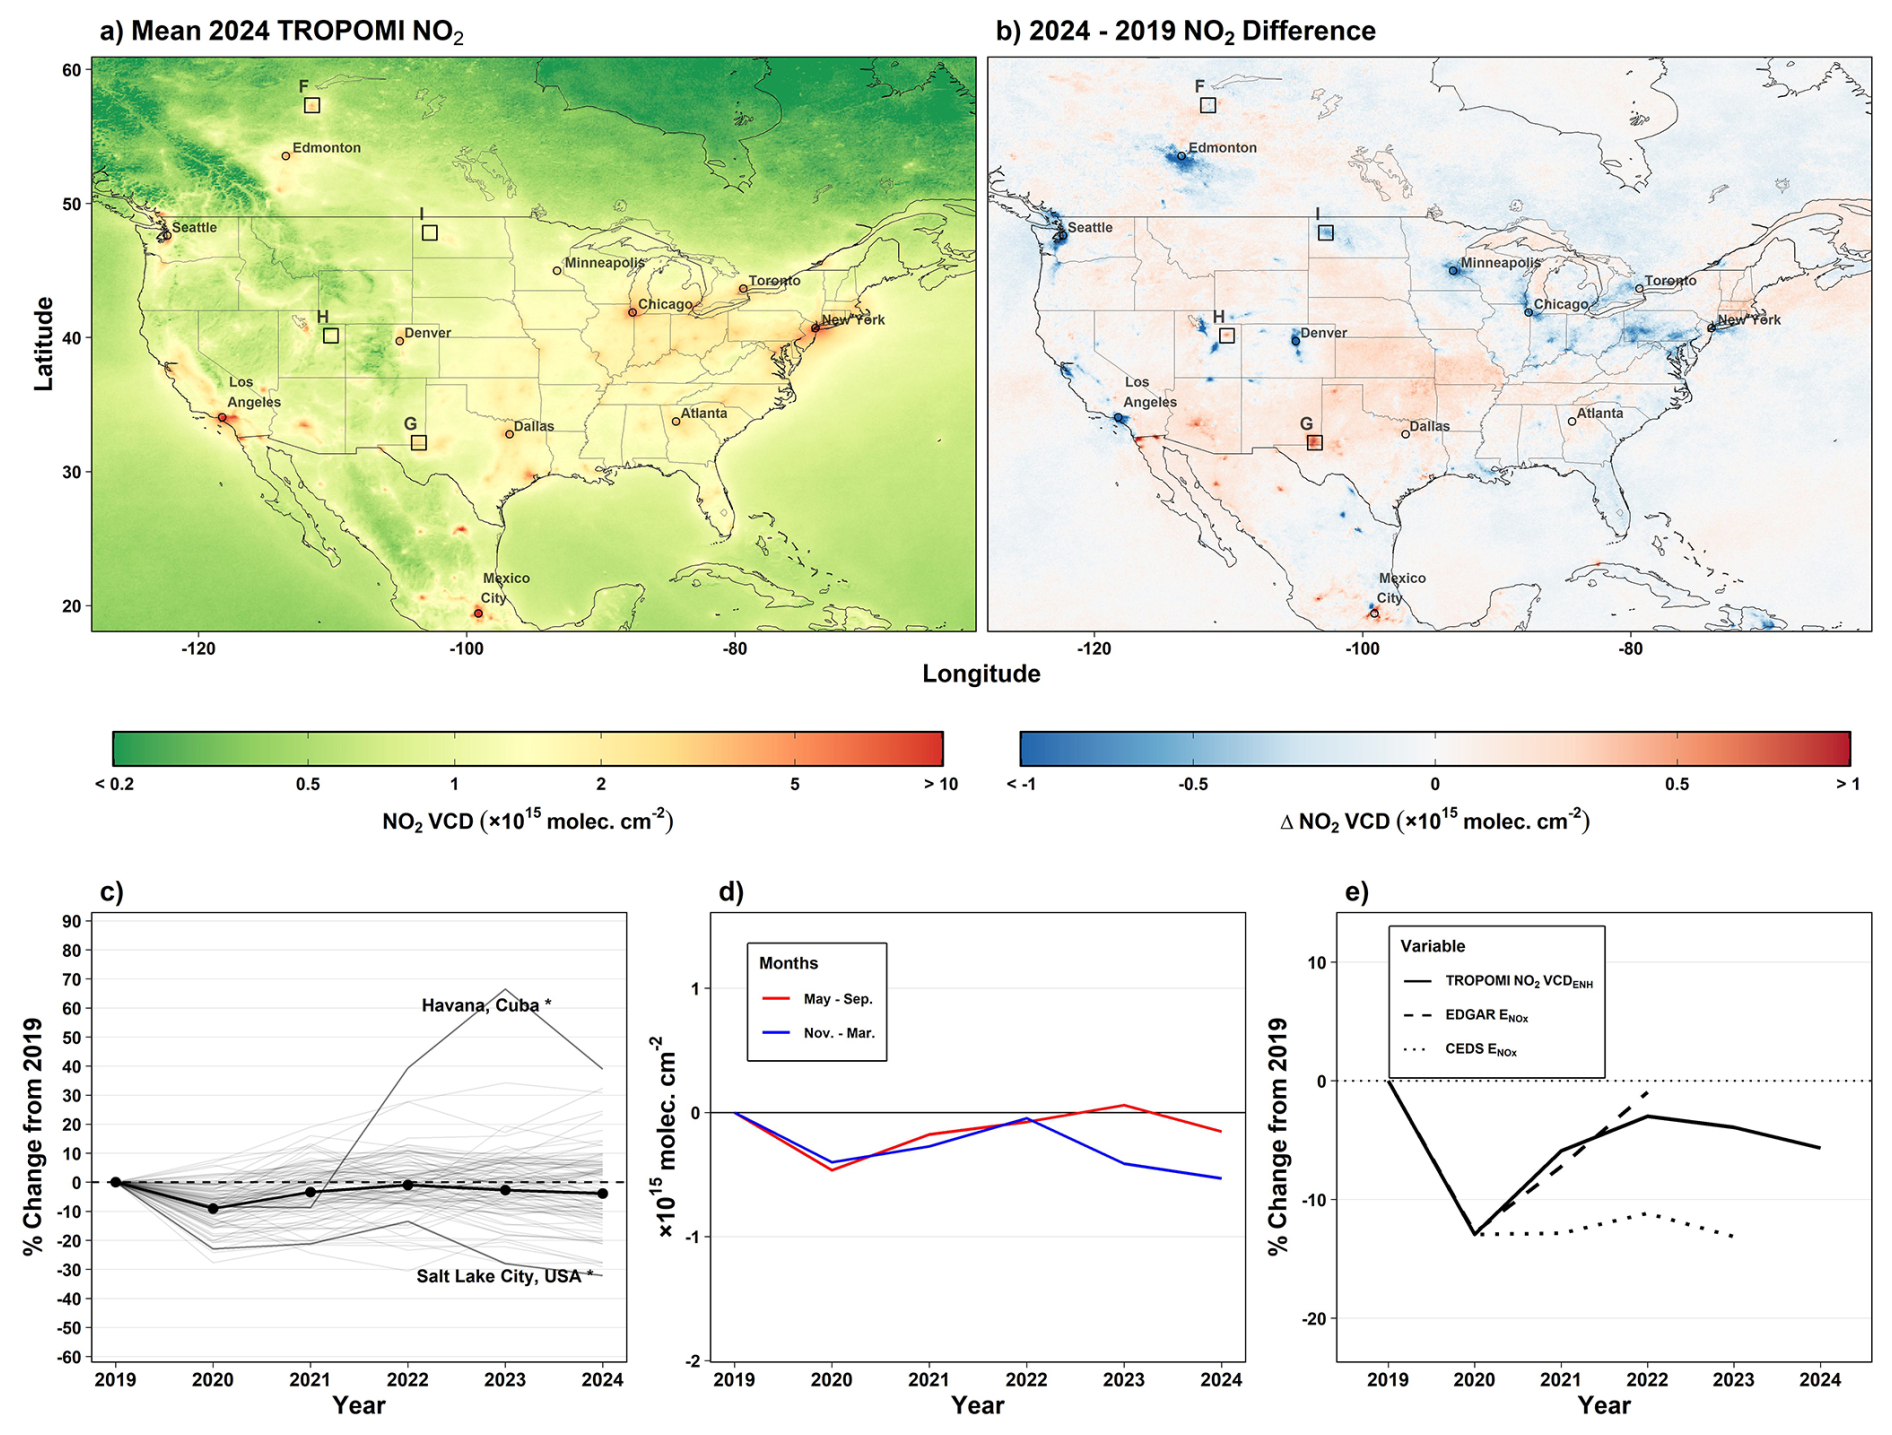
Figure 10Same as Fig. 6, but for North America. Regions F, G, H and I in panels (a) and (b) represent the Athabasca, Permian, Bakken and Uintah, respectively, as highlighted in Fig. 12.
In Canada, the largest difference in VCD between 2024 and 2019 occurred in Alberta Province in and around Edmonton ( molecules cm−2; Fig. 10b), although decreases were not statistically significant for that period. In the US, aside from decreases in urban environments, the largest changes were observed in remote areas near coal power plants with reduced activity, e.g. near the decommissioned Navajo Generating Station in northern Arizona (Goldberg et al., 2021a). Apparent within the US is a slight increase in background concentrations in rural regions, particularly in the Central and Western US It is unclear if this is due to an extension of the NO2 lifetime due to decreasing VOCs and O3 over this 6-year period (e.g., Laughner and Cohen, 2019) or due to increased NOx emissions in rural areas or both. Further work should investigate this.
In Mexico, Central America and the Caribbean, the largest VCDs are observed near Mexico City (11.3×10¹⁵ molecules cm−2) and Monterrey, Mexico (7.7×10¹⁵ molecules cm−2), with numerous other notable urban signatures (Fig. 10a). The largest urban increases were observed at sites in Northern Mexico, including Mexicali (+6.1 ± 0.9 % yr−1; p< 0.001) and Hermosillo (+5.2 ± 0.7 % yr−1; p< 0.001). Additional notable changes occurred in the capital city of Santo Domingo, Dominican Republic (−4.1 ± 1.2 % yr−1; p= 0.006), and Havana, Cuba (+11.2 ± 1.7 % yr−1; p< 0.001) (Fig. 10b).
Most North American cities experienced a decrease in annual NO2 VCD of less than 10 % in 2020, with concentrations generally rebounding to 2019 levels by 2024 (Fig. 10c). Havana, Cuba was a notable exception of North American cities, with VCDs increasing by nearly 70 % through 2023 relative to 2019, with a slight decrease in 2024. Cities in the western US, such as Salt Lake City and Denver experienced some of the largest percent decreases on the continent, decreasing by approximately 30 % through 2024. The bulk of the observed annual decreases through 2024 in North American cities occurred during winter (Fig. 10d), with an average winter decrease of molecules cm−2 during those months. In North America, VCDENH decreased by 13 % from 2019 to 2020 (Fig. 10e), compared with a decrease of 10 % in overall urban VCD from 2019 to 2020, and VCDENH remained approximately 7.5 % below 2019 levels by 2024. Averaged for North America, population-weighted EDGAR NOx emissions and VCDENH exhibited a similar change relative to 2019 levels through 2022, with a mean difference of +0.3 %, while CEDS and VCDENH exhibited a larger mean difference of −6.1 %, with differences most pronounced after 2020. This suggests relatively good agreement between North American EDGAR and TROPOMI relative changes, while CEDS emissions for the region may be underestimated from 2020 onward (Fig. 10e).
5.5 South America
The largest 2024 mean VCDs in South America are observed in urban regions, including near Lima, Peru (6.3×10¹⁵ molecules cm−2); Santiago, Chile (9.7×10¹⁵ molecules cm−2); and Sao Paulo, Brazil (7.3×10¹⁵ molecules cm−2) (Fig. 11a). Regions near Santiago experienced some of the largest differences in VCD in South America between 2019 and 2024 (Fig. 11b) ( molecules cm−2), while Quito, Ecuador experienced a significant increase for that period (+12.7 ± 1.9 % yr−1; p< 0.001).
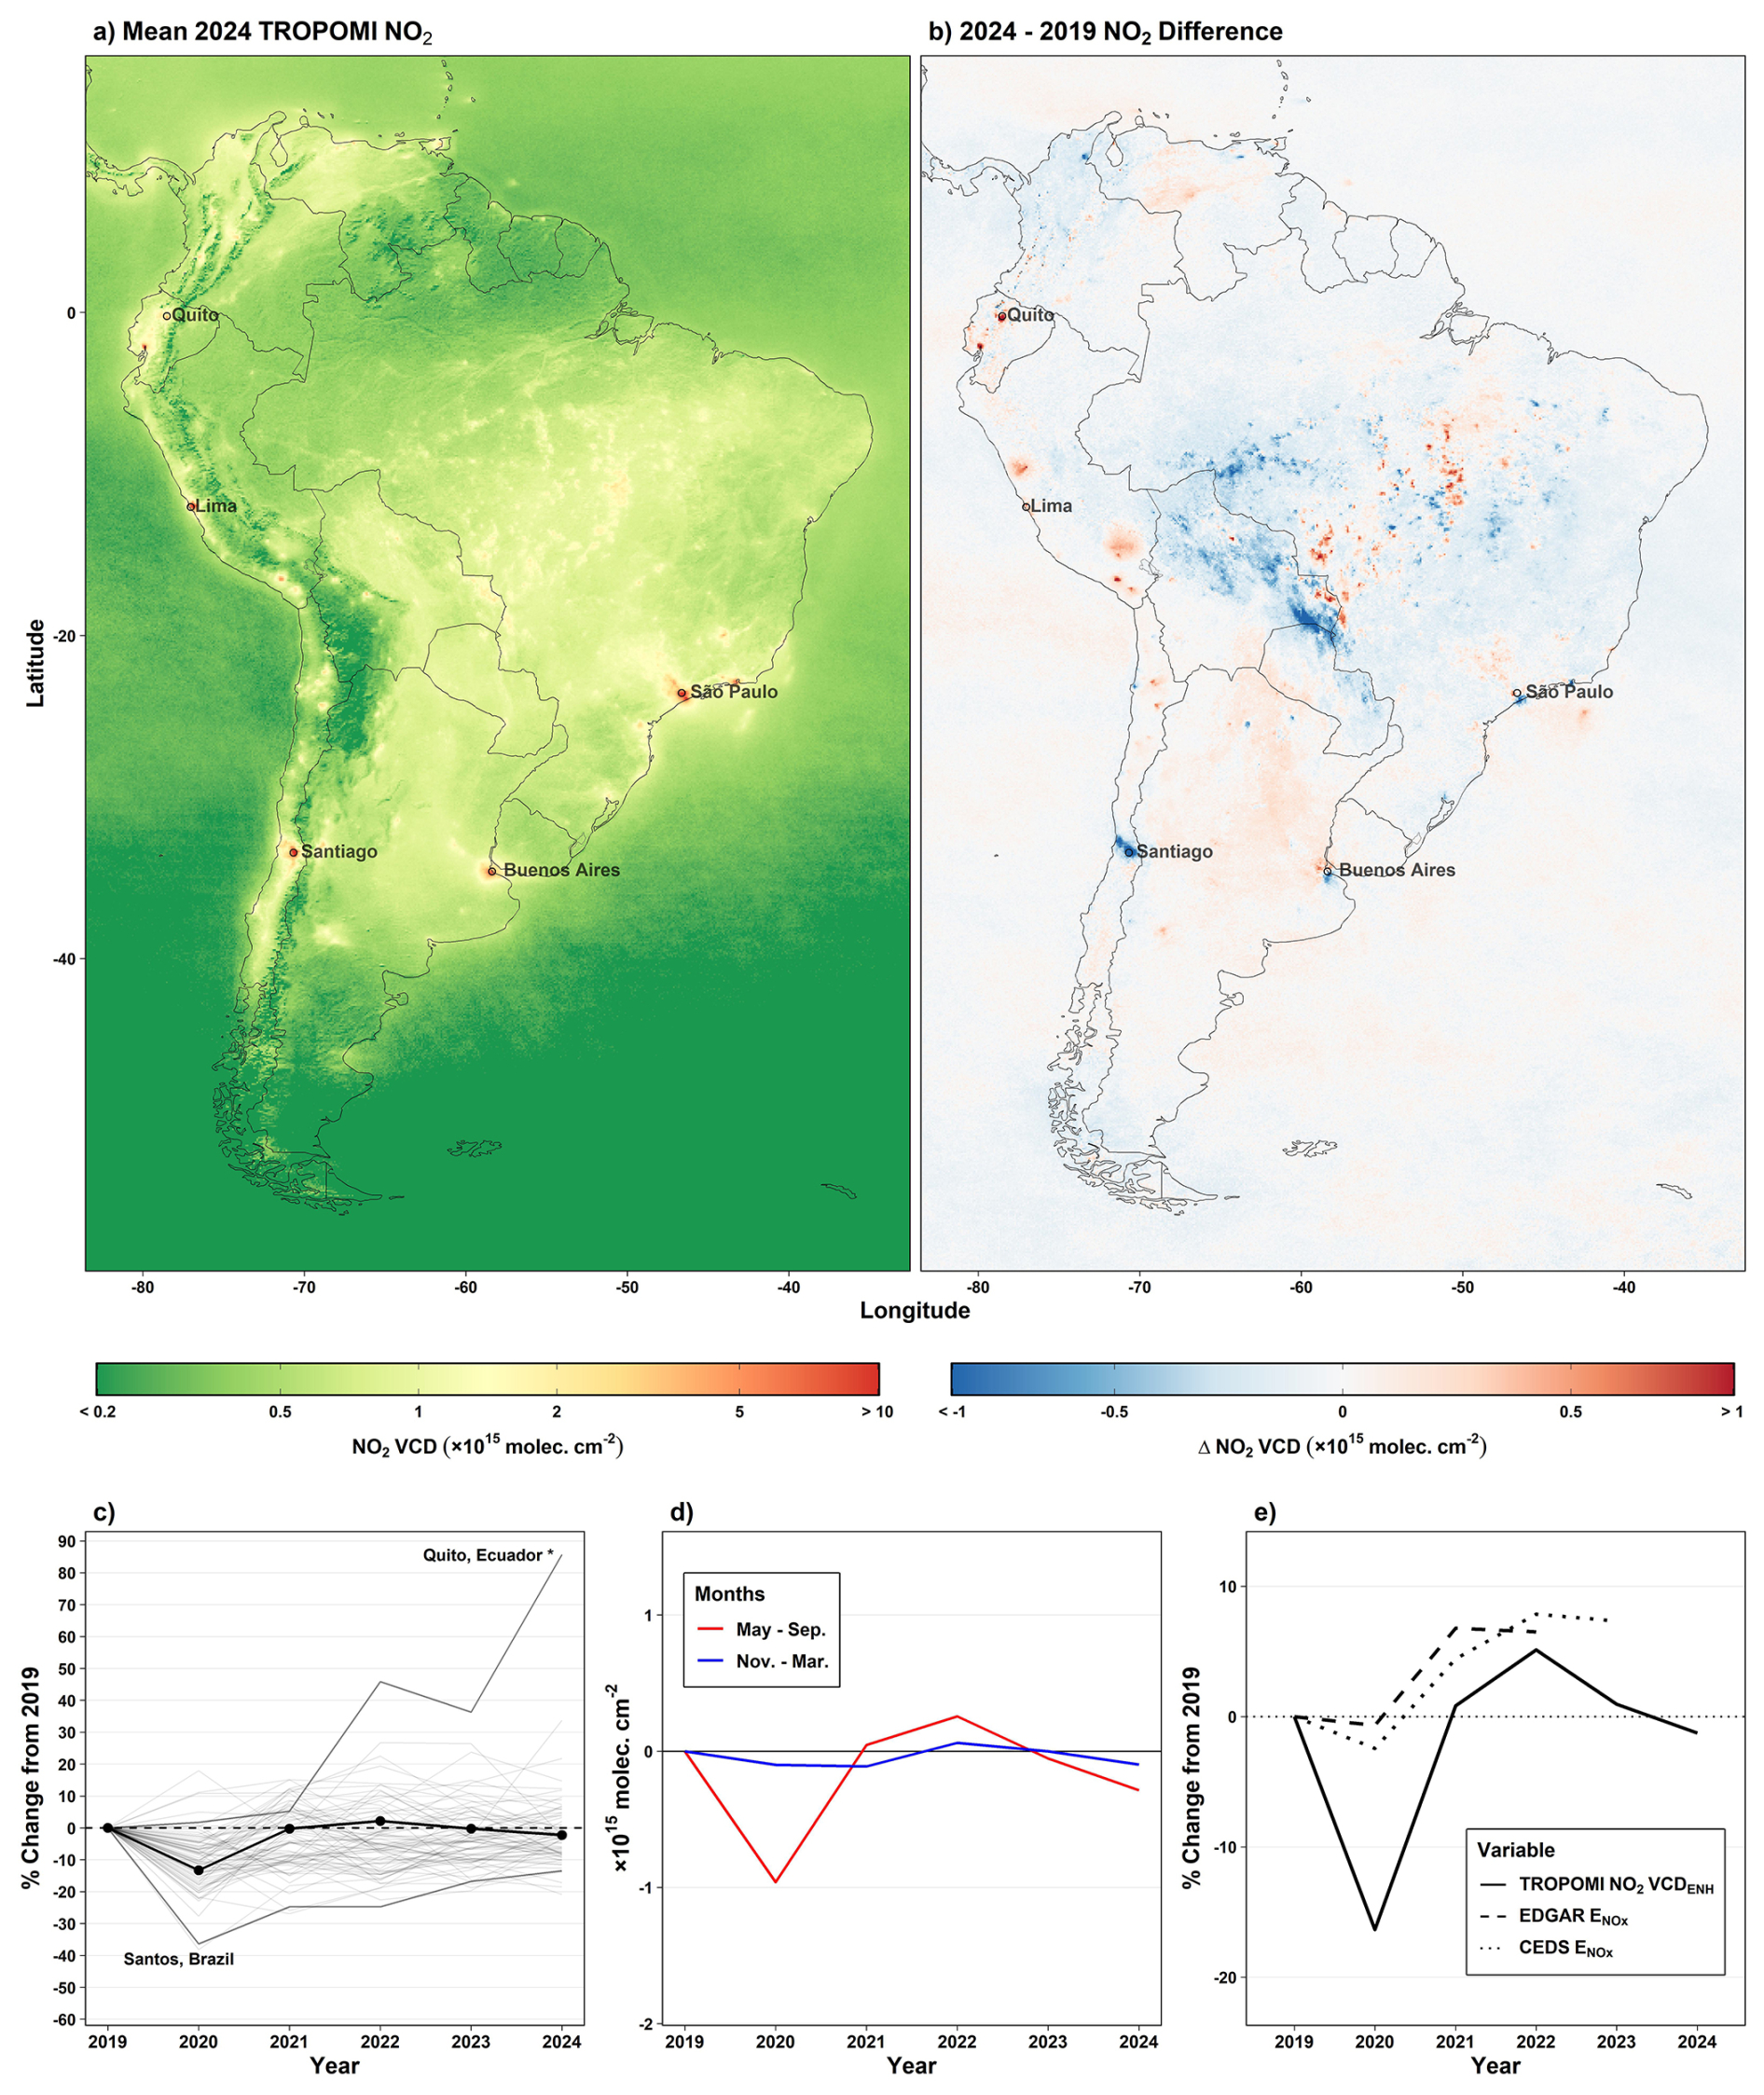
Figure 11Same as Fig. 6, but for South America.
South American cities experienced a 10 % population-weighted VCD decrease in 2020, with mean concentrations rebounding to 2019 values by 2021 and remaining around those levels through 2024 (Fig. 11ce). One notable exception is Quito, Ecuador, which experienced a VCD increase of over 85 % through 2024. Santos, Brazil, an active port town southeast of São Paulo, experienced one of the largest VCD decreases in South America, with a 35 % decrease in VCDs from 2019 to 2020, followed by sustained, gradual annual increases through 2024.
Seasonal changes impacted South American cities less than cities on other continents through 2024 (Fig. 11d), with mean winter and summer VCDs both changing by less than 0.3×10¹⁵ molecules cm−2 through 2024. Accounting for urban background concentrations, South American cities experienced a population-weighted VCDENH decrease of 16 % from 2019 to 2020, with concentrations rebounding to near 2019 levels by 2021 (Fig. 11e). Both EDGAR and CEDS estimated similar relative population-weighted NOx emission changes for the region, though neither inventory appeared to capture the robust 2020 decrease observed by TROPOMI (Fig. 11e). Both inventories experienced a similar mean difference between emissions and VCDENH (+7.7 % and +6.7 %, respectively), suggesting that urban NOx emissions in both inventories may be overestimated for the region.
NO2 can be readily observed over oil, gas, and other mining regions due to emissions from drilling and extraction equipment, processing plants, compressors, truck traffic, and routine or episodic flaring. In these settings, increases or decreases in NO2 can signify shifts in production levels or changes in mining activity. Because NO2 responds quickly to changes in combustion-related activity, satellite retrievals serve as an effective proxy for monitoring relative operational intensity in major extraction regions (Dix et al., 2022).
Known coal-dominated mining regions showed pronounced NO2 VCD increases from 2019 to 2024 (Fig. 12). The sparsely-populated Santanghu Basin (Fig. 12a), a region in eastern Xinjiang Province with a relatively nascent coal mining industry (Zhang et al., 2018; Liu et al., 2018), represented the most substantial increase in VCD over China through 2024 (23.9 ± 1.6 % yr−1; p< 0.001). The recent expansion of mining operations is evident in visible satellite imagery (Fig. S20). The largest regional increase in VCD anywhere in India from 2019 to 2024 ( molecules cm−2) was observed in the Ib Valley in northwestern Odisha state (Fig. 12b). The region contains multiple surface coal mines and coal-fired power plants (Varma et al., 2015), with VCDs increasing at a rate of 8.2 ± 1.3 % yr−1 (p< 0.001). NO2 VCDs near numerous other coal mines and power plants throughout India exhibited changes, but NO2 VCD increases were more prevalent than decreases. In the Kuzbass Region of Siberia, one of Russia's largest coal mining regions, 2024 annual mean VCDs were 2.4×10¹⁵ molecules cm−2 higher than in 2019, though annual changes were not statistically significant (Fig. 12c). A previous study identified a correlation between space-based NO2 observations and regional coal production in the Kuzbass region (Labzovskii et al., 2022), providing relevant context for the observed VCD changes. Increased VCDs were also observed over rare earth metal mines. In a mining region known as the Copperbelt in the south of the Democratic Republic of the Congo (DRC), broad NO2 VCD increases were observed, including at a large surface copper and cobalt mine near the city of Kolwezi (Fig. 12e). VCDs at the Kolwezi mine increased at a rate of 10.1 ± 0.9 % yr−1 (p< 0.001) from 2019 to 2024. Numerous surface mines exist in the region, with most observing increases in NOx emissions from mining operations in recent years (Martínez-Alonso et al., 2023).
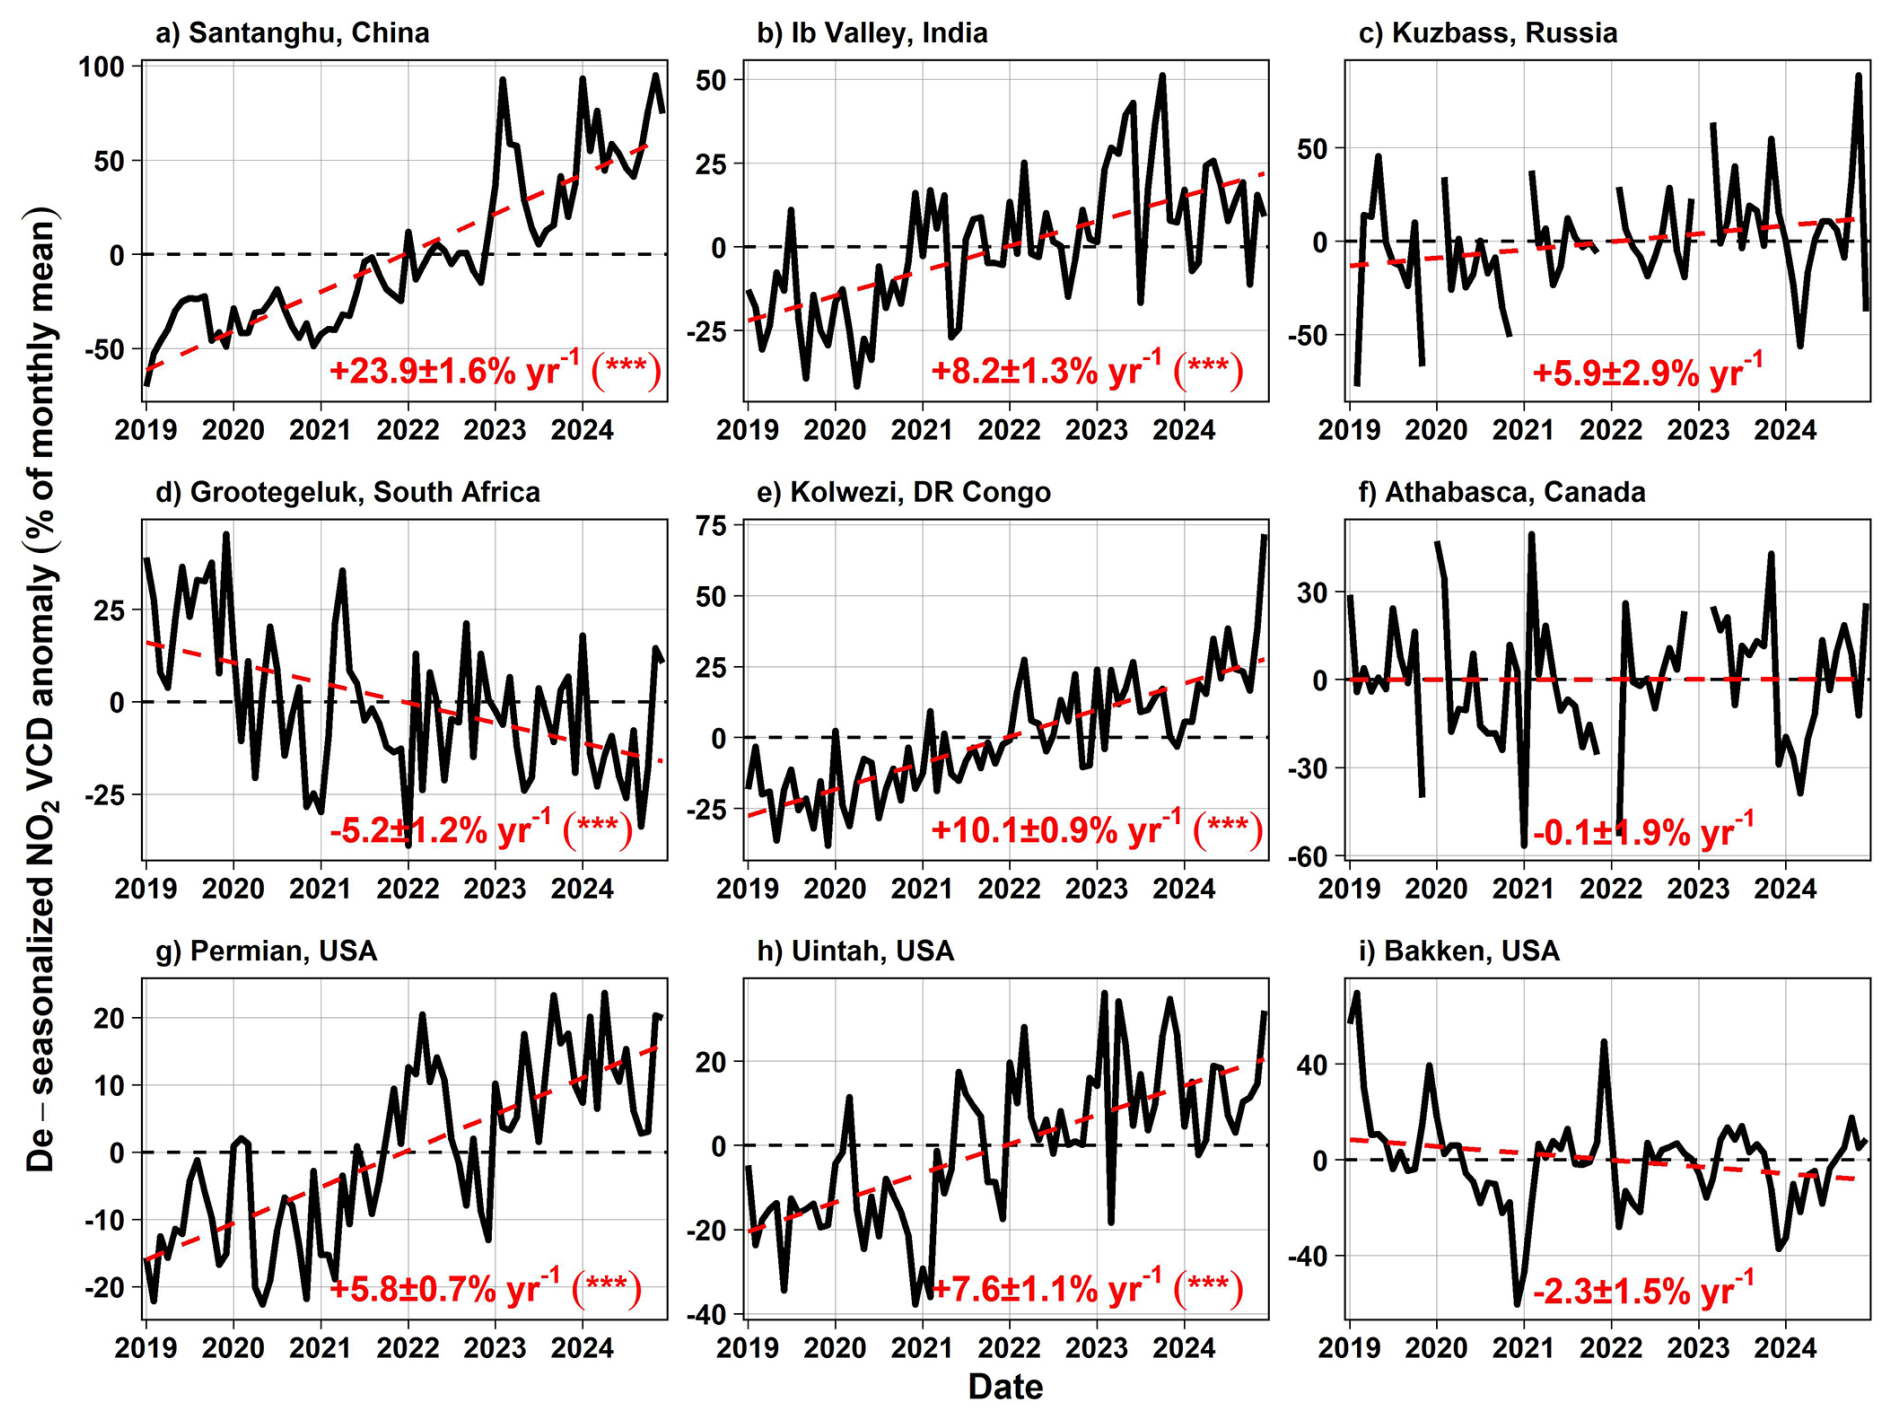
Figure 12Monthly time series of de-seasonalized NO2 VCDs over selected oil, gas, and other mining regions. Black lines denote de-seasonalized VCDs, and dashed red lines represent ordinary least-squares regression for each site. Months with missing data lacked quality-assured TROPOMI observations. The % change yr−1, standard error and statistical significance is reported each panel. Note the differing y-axis extents for each panel.
Not all coal regions experienced increased VCDs. Northwest of Johannesburg, South Africa in Limpopo Province, NO2 VCDs near the Grootegeluk surface coal mine, together with two adjacent power plants (Faure et al., 1996; Shikwambana et al., 2020) decreased at a rate of −5.2 ± 1.2 % yr−1 (p< 0.001) from 2019 to 2024 (Fig. 12d). The region represented one of the largest NO2 signatures in Africa in 2024, despite the significant decrease for this period (Fig. 8a).
Oil and gas extraction areas in North America experienced diverse patterns. Annual mean NO2 VCDs at the Athabasca oil sands in Alberta, Canada were slightly lower in 2024 than in 2019, although the decrease for the period was insignificant (p> 0.05; Fig. 12f). The Bakken region in North Dakota, US experienced a similarly insignificant decrease in VCDs (Fig. 12i). Notable increases occurred in the Permian (Fig. 12g) and Uintah (Fig. 12h) Basins in the southwestern US experiencing significant increases of 5.8 ± 0.7 % yr−1 (p< 0.001) and 7.6 ± 1.1 % yr−1 (p< 0.001), respectively.
We present a global analysis of urban TROPOMI tropospheric NO2 VCD from 2019 to 2024 using GHS-SMOD-defined urban boundaries, encompassing more than 11 500 cities. Our results reveal statistically lower urban population-weighted NO2 VCDs in 2024 than in 2019 in Asia and Oceania (−17 %) and Europe (−13 %) with particularly strong reductions in cities including Seoul (−9.4 ± 1.0 % yr−1; p< 0.001), Guangzhou (−5.6 ± 1.3 % yr−1; p< 0.001), and London, England (−5.4 ± 1.3 % yr−1; p< 0.001). These decreases generally reflect a combination of long-term emissions control policies and economic incentives, indicating policies to tackle NO2 pollution have broadly worked. COVID-19 induced reductions in activity often caused a temporary NO2 reduction but is unlikely to have caused much of the long-term changes between 2019 and 2024. Conversely, urban NO2 in numerous African cities have increased over the same period, with Abidjan (+6.6 ± 1.2 % yr−1; p< 0.001), Cairo (+2.3 ± 0.8 % yr−1; p= 0.006) and Addis Ababa (+2.4 ± 1.1 % yr−1; p= 0.012) representing larger cities that are leading the continent's upward tendency. Though numerous populous North American cities exhibited significant VCD decreases, population-weighted urban levels for the continent as a whole did not show a significant change. Similarly, South American cities exhibited an insignificant VCD change from 2019 to 2024, apart from May-September in 2020. Population-weighted NO2 VCDs increases were most notable in countries in the Middle East and Africa, highlighting a potential degradation in air quality in regions of the world that lack extensive ground-level monitoring.
Evaluating annual changes in TROPOMI NO2 urban enhancements (VCDENH) – the difference between mean urban and background VCDs – against changes in EDGAR and CEDS NOx emissions inventories, we highlight potential discrepancies in inventory estimates in urban regions. In African, Asian and European cities, changes in VCDENH tend to exceed changes in both EDGAR and CEDS emissions, pointing to potential inventory overestimates in NOx emissions. In North America, EDGAR agrees well with VCDENH (mean difference of 0.3 % relative to 2019 values), while CEDS NOx emissions are 6.1 % lower than VCDENH, relative to their respective 2019 values. These mismatches may stem from rapidly evolving emission sources or limitations in the EDGAR and CEDS bottom-up inventory methods. Similar discrepancies in emissions inventories in the Global South have been reported in previous studies (Ahn et al., 2023), suggesting larger emissions uncertainties in regions where unmonitored emissions activity may be significant.
In most regions, VCD changes from 2019 to 2024 were driven by changes during the colder months (November–March). This was most pronounced in Asian cities, where mean cold season VCDs decreased by molecules cm−2 (−18 %) from 2019 to 2024, compared with warm season VCD decreases of molecules cm−2 (−13 %). Large changes in NO2 were not confined to urban regions alone. We identified localized increases near fossil fuel and other mining operations, including in the Santanghu Basin in China (+23.9 ± 1.6 % yr−1; p< 0.001), the Permian (+5.8 ± 0.7 % yr−1; p< 0.001) and Uintah (+7.6 ± 1.1 % yr−1; p< 0.001) Basins in the US, and the Copperbelt region of the DRC (10.1 ± 0.9 % yr−1; p< 0.001), signaling expanding industrial activity. In Khartoum and Kyiv, conflict and displacement drove sharp reductions in NO2, demonstrating the utility of satellite data in detecting societal disruptions.
Several limitations of this work should be noted. First, satellite NO2 column densities may not always reflect surface-level NO2 concentrations, particularly in regions with vertically elevated sources. In urban areas dominated by surface-based transportation emissions, NO2 VCDs are likely more representative of surface exposure. However, in areas with tall-stack sources, such as power plants, NO2 columns may be decoupled from near-surface levels (Brett et al., 2025). Second, we assume static city boundaries defined by the 2023 version of GHS-SMOD, with population estimates from 2020. This is likely a reasonable approximation for urbanized regions in Europe and North America, where built-up area changes are slow, but may introduce uncertainty in rapidly urbanizing regions of Africa and Asia over a six-year period. Future analyses could incorporate time-varying urban boundaries to address this. Additionally, while many of the changes presented here reflect variability in anthropogenic NOx emissions, it is important to recognize that atmospheric chemistry also influences the observed NO2 variability. Seasonal differences in photochemical lifetimes (i.e., longest in winter), boundary layer mixing (i.e., more vertical mixing in summer), chemical partitioning between NO and NO2, meteorological variability, and contributions from additional emissions sources including soil NOx and fire emissions, can all modulate the magnitude and timing of observed NO2 concentrations. These processes likely contribute to some of the regional and seasonal differences highlighted in this study.
Taken together, these results demonstrate the utility of high-resolution satellite instruments for characterizing both broad regional NO2 signals and localized changes, and linking with anthropogenically induced factors such as urban growth, industrial expansion, policy interventions, and conflict. This highlights potential in using TROPOMI observations as an accountability agent to determine how local changes in human activities affect local and global air pollution. As the TROPOMI record lengthens and newer, geostationary satellites come online and begin to detect changes in atmospheric composition, continued space-based monitoring will be essential for improving our understanding of atmospheric composition and chemistry around the globe.
The level 3 annual and monthly average TROPOMI NO2 VCDs are available at https://doi.org/10.5067/ACADNS5UBWPQ (Goldberg, 2024b) and https://doi.org/10.5067/KKPPL39PEIGE (Goldberg, 2024a), respectively. The GHS-SMOD urban boundaries can be downloaded from https://human-settlement.emergency.copernicus.eu/download.php?ds=smod (last access: 1 July 2025). The EDGARv8.1 NOx emissions can be downloaded from https://edgar.jrc.ec.europa.eu/dataset_ap81 (last access: 1 July 2025). The CEDS NOx emissions can be downloaded from https://aims2.llnl.gov/ (20 November 2025). Annual and monthly mean TROPOMI NO2 VCDs for each GHS-SMOD urban cluster can be found at https://doi.org/10.5281/zenodo.18665782 (Huber, 2026).
The Supplement contains additional figures related to the study, including: S1: Background NO2 sensitivity in Beijing. S2: Background NO2 sensitivity in Los Angeles. S3: Background NO2 sensitivity in London. S4: Background NO2 sensitivity in Moscow. S5: Annual background NO2 changes by continent. S6: Relative NO2 VCDENH changes by continent. S7: Background NO2 for adjacent cities. S8: GHS-SMOD urban clusters example. S9: Data disaggregation example. S10: Khartoum NO2 time series. S11: NO2 increases in three global cities. S12: Annual mean NO2 in Tehran, Iran. S13: Annual mean NO2 VCDs for Bangladeshi cities. S14: Seasonal relative NO2 changes by continent. S15: Annual mean NO2 changes in the European Union. S16: Annual mean NO2 changes in Russian and Ukrainian cities. S17: Seasonal NO2 changes by continent, without Russia. S18: NO2 increases in three US cities. S19: Satellite view of surface mines. The supplement related to this article is available online at https://doi.org/10.5194/acp-26-3783-2026-supplement.
D.H. and D.G. contributed to the project design. D.G. processed and provided the annually- and monthly-averaged NO2 vertical column densities. All authors edited the manuscript.
The contact author has declared that none of the authors has any competing interests.
Publisher's note: Copernicus Publications remains neutral with regard to jurisdictional claims made in the text, published maps, institutional affiliations, or any other geographical representation in this paper. The authors bear the ultimate responsibility for providing appropriate place names. Views expressed in the text are those of the authors and do not necessarily reflect the views of the publisher.
We thank the editor and three reviewers for their constructive feedback, which improved the clarity of this manuscript.
This research has been supported by the National Aeronautics and Space Administration, Earth Sciences Division (grant nos. 80NSSC21K0511 and 80NSSC23K1002).
This paper was edited by Tao Wang and reviewed by three anonymous referees.
Ahn, D. Y., Goldberg, D. L., Coombes, T., Kleiman, G., and Anenberg, S. C.: CO2 emissions from C40 cities: citywide emission inventories and comparisons with global gridded emission datasets, Environ. Res. Lett., 18, 034032, https://doi.org/10.1088/1748-9326/ACBB91, 2023.
Anenberg, S. C., Mohegh, A., Goldberg, D. L., Kerr, G. H., Brauer, M., Burkart, K., Hystad, P., Larkin, A., Wozniak, S., and Lamsal, L.: Long-term trends in urban NO2 concentrations and associated paediatric asthma incidence: estimates from global datasets, Lancet Planet Health, 6, e49–e58, https://doi.org/10.1016/S2542-5196(21)00255-2, 2022.
Bovensmann, H., Burrows, J. P., Buchwitz, M., Frerick, J., Noël, S., Rozanov, V. V., Chance, K. V., and Goede, A. P. H.: SCIAMACHY: Mission Objectives and Measurement Modes, J. Atmos. Sci., 56, 127–150, https://doi.org/10.1175/1520-0469(1999)056<0127:SMOAMM>2.0.CO;2, 1999.
Brett, N., Arnold, S. R., Law, K. S., Raut, J.-C., Onishi, T., Barret, B., Dieudonné, E., Cesler-Maloney, M., Simpson, W., Bekki, S., Savarino, J., Albertin, S., Gilliam, R., Fahey, K., Pouliot, G., Huff, D., and D'Anna, B.: Estimating Power Plant Contributions to Surface Pollution in a Wintertime Arctic Environment, ACS ES&T Air, 2, 943–956, https://doi.org/10.1021/ACSESTAIR.5C00030, 2025.
Burrows, J. P., Weber, M., Buchwitz, M., Rozanov, V., Ladstätter-Weißenmayer, A., Richter, A., Debeek, R., Hoogen, R., Bramstedt, K., Eichmann, K. U., Eisinger, M., and Perner, D.: The Global Ozone Monitoring Experiment (GOME): Mission Concept and First Scientific Results, J. Atmos. Sci., 56, 151–175, https://doi.org/10.1175/1520-0469(1999)056<0151:TGOMEG>2.0.CO;2, 1999.
Castellanos, P., Boersma, K. F., and van der Werf, G. R.: Satellite observations indicate substantial spatiotemporal variability in biomass burning NOx emission factors for South America, Atmos. Chem. Phys., 14, 3929–3943, https://doi.org/10.5194/acp-14-3929-2014, 2014.
Center For International Earth Science Information Network-CIESIN-Columbia University (SEDAC): Gridded Population of the World, Version 4 (GPWv4): Population Density, Revision 11 (Version 4.11), Palisades, NY, NASA Socioeconomic Data and Applications Center (SEDAC) [data set], https://doi.org/10.7927/H49C6VHW, 2017.
Chen, X., Qi, L., Li, S., and Duan, X.: Long-term NO2 exposure and mortality: A comprehensive meta-analysis, Environ. Pollut., 341, 122971, https://doi.org/10.1016/J.ENVPOL.2023.122971, 2024.
Cifuentes-Faura, J.: European Union policies and their role in combating climate change over the years, Air Qual. Atmos. Health, 15, 1333–1340, https://doi.org/10.1007/S11869-022-01156-5, 2022.
Cooper, M. J., Martin, R. V., Hammer, M. S., Levelt, P. F., Veefkind, P., Lamsal, L. N., Krotkov, N. A., Brook, J. R., and McLinden, C. A.: Global fine-scale changes in ambient NO2 during COVID-19 lockdowns, Nature, 601, 380–387, https://doi.org/10.1038/s41586-021-04229-0, 2022.
Crippa, M., Guizzardi, D., Muntean, M., Schaaf, E., Dentener, F., van Aardenne, J. A., Monni, S., Doering, U., Olivier, J. G. J., Pagliari, V., and Janssens-Maenhout, G.: Gridded emissions of air pollutants for the period 1970–2012 within EDGAR v4.3.2, Earth Syst. Sci. Data, 10, 1987–2013, https://doi.org/10.5194/essd-10-1987-2018, 2018.
Crippa, M., Guizzardi, D., Pagani, F., Schiavina, M., Melchiorri, M., Pisoni, E., Graziosi, F., Muntean, M., Maes, J., Dijkstra, L., Van Damme, M., Clarisse, L., and Coheur, P.: Insights into the spatial distribution of global, national, and subnational greenhouse gas emissions in the Emissions Database for Global Atmospheric Research (EDGAR v8.0), Earth Syst. Sci. Data, 16, 2811–2830, https://doi.org/10.5194/essd-16-2811-2024, 2024.
Dang, R., Jacob, D. J., Shah, V., Eastham, S. D., Fritz, T. M., Mickley, L. J., Liu, T., Wang, Y., and Wang, J.: Background nitrogen dioxide (NO2) over the United States and its implications for satellite observations and trends: effects of nitrate photolysis, aircraft, and open fires, Atmos. Chem. Phys., 23, 6271–6284, https://doi.org/10.5194/acp-23-6271-2023, 2023.
de Gouw, J. A., Veefkind, J. P., Roosenbrand, E., Dix, B., Lin, J. C., Landgraf, J., and Levelt, P. F.: Daily Satellite Observations of Methane from Oil and Gas Production Regions in the United States, Sci. Rep., 10, 1–10, https://doi.org/10.1038/S41598-020-57678-4, 2020.
Dix, B., de Bruin, J., Roosenbrand, E., Vlemmix, T., Francoeur, C., Gorchov-Negron, A., McDonald, B., Zhizhin, M., Elvidge, C., Veefkind, P., Levelt, P., and de Gouw, J.: Nitrogen Oxide Emissions from U.S. Oil and Gas Production: Recent Trends and Source Attribution, Geophys. Res. Lett., 47, e2019GL085866, https://doi.org/10.1029/2019GL085866, 2020.
Dix, B., Francoeur, C., Li, M., Serrano-Calvo, R., Levelt, P. F., Veefkind, J. P., McDonald, B. C., and de Gouw, J.: Quantifying NOx Emissions from U.S. Oil and Gas Production Regions Using TROPOMI NO2, ACS Earth Space Chem., 6, 403–414, https://doi.org/10.1021/ACSEARTHSPACECHEM.1C00387, 2022.
Duncan, B. N., Lamsal, L. N., Thompson, A. M., Yoshida, Y., Lu, Z., Streets, D. G., Hurwitz, M. M., and Pickering, K. E.: A space-based, high-resolution view of notable changes in urban NOx pollution around the world (2005–2014), J. Geophys. Res., 121, 976–996, https://doi.org/10.1002/2015JD024121, 2016.
Faure, K., Willis, J. P., and Dreyer, J. C.: The grootegeluk formation in the Waterberg Coalfield, South Africa: facies, palaeoenvironment and thermal history – evidence from organic and clastic matter, Int. J. Coal Geol., 29, 147–186, https://doi.org/10.1016/0166-5162(95)00029-1, 1996.
Fioletov, V., McLinden, C. A., Griffin, D., Krotkov, N., Liu, F., and Eskes, H.: Quantifying urban, industrial, and background changes in NO2 during the COVID-19 lockdown period based on TROPOMI satellite observations, Atmos. Chem. Phys., 22, 4201–4236, https://doi.org/10.5194/acp-22-4201-2022, 2022.
Fioletov, V., McLinden, C. A., Griffin, D., Zhao, X., and Eskes, H.: Global seasonal urban, industrial, and background NO2 estimated from TROPOMI satellite observations, Atmos. Chem. Phys., 25, 575–596, https://doi.org/10.5194/acp-25-575-2025, 2025.
Fisher, B. L., Lamsal, L. N., Fasnacht, Z., Oman, L. D., Joiner, J., Krotkov, N. A., Choi, S., Qin, W., and Yang, E. S.: Revised estimates of NO2 reductions during the COVID-19 lockdowns using updated TROPOMI NO2 retrievals and model simulations, Atmos. Environ., 326, 120459, https://doi.org/10.1016/J.ATMOSENV.2024.120459, 2024.
Fishman, J., Iraci, L. T., Al-Saadi, J., Chance, K., Chavez, F., Chin, M., Coble, P., Davis, C., DiGiacomo, P. M., Edwards, D., Eldering, A., Goes, J., Herman, J., Hu, C., Jacob, D. J., Jordan, C., Kawa, S. R., Key, R., Liu, X., Lohrenz, S., Mannino, A., Natraj, V., Neil, D., Neu, J., Newchurch, M., Pickering, K., Salisbury, J., Sosik, H., Subramaniam, A., Tzortziou, M., Wang, J., and Wang, M.: The United States' Next Generation of Atmospheric Composition and Coastal Ecosystem Measurements: NASA's Geostationary Coastal and Air Pollution Events (GEO-CAPE) Mission, B. Am. Meteorol. Soc., 93, 1547–1566, https://doi.org/10.1175/BAMS-D-11-00201.1, 2012.
de Foy, B., Lu, Z., and Streets, D. G.: Satellite NO2 retrievals suggest China has exceeded its NOx reduction goals from the twelfth Five-Year Plan, Sci. Rep., 6, 1–9, https://doi.org/10.1038/srep35912, 2016.
Geddes, J. A., Martin, R. V., Boys, B. L., and van Donkelaar, A.: Long-term trends worldwide in ambient NO2 concentrations inferred from satellite observations, Environ. Health Persp., 124, 281–289, 2016.
van Geffen, J., Eskes, H., Compernolle, S., Pinardi, G., Verhoelst, T., Lambert, J.-C., Sneep, M., ter Linden, M., Ludewig, A., Boersma, K. F., and Veefkind, J. P.: Sentinel-5P TROPOMI NO2 retrieval: impact of version v2.2 improvements and comparisons with OMI and ground-based data, Atmos. Meas. Tech., 15, 2037–2060, https://doi.org/10.5194/amt-15-2037-2022, 2022.
Ghude, S. D., Karumuri, R. K., Jena, C., Kulkarni, R., Pfister, G. G., Sajjan, V. S., Pithani, P., Debnath, S., Kumar, R., Upendra, B., Kulkarni, S. H., Lal, D. M., Vander A, R. J., and Mahajan, A. S.: What is driving the diurnal variation in tropospheric NO2 columns over a cluster of high emission thermal power plants in India?, Atmos. Environ. X, 5, 100058, https://doi.org/10.1016/J.AEAOA.2019.100058, 2020.
Glissenaar, I., Boersma, K. F., Anglou, I., Rijsdijk, P., Verhoelst, T., Compernolle, S., Pinardi, G., Lambert, J.-C., Van Roozendael, M., and Eskes, H.: TROPOMI Level 3 tropospheric NO2 dataset with advanced uncertainty analysis from the ESA CCI+ ECV precursor project, Earth Syst. Sci. Data, 17, 4627–4650, https://doi.org/10.5194/essd-17-4627-2025, 2025.
Goldberg, D. L.: HAQAST Sentinel-5P TROPOMI Nitrogen Dioxide (NO2) GLOBAL Monthly Level 3 0.1 x 0.1 Degree Gridded Data Version 2.4, Goddard Earth Sciences Data and Information Services Center (GES DISC) [data set], https://doi.org/10.5067/KKPPL39PEIGE, 2024a.
Goldberg, D. L.: HAQAST Sentinel-5P TROPOMI Nitrogen Dioxide (NO2) CONUS Annual Level 3 0.01 x 0.01 Degree Gridded Data V2.4, Goddard Earth Sciences Data and Information Services Center (GES DISC) [data set], https://doi.org/10.5067/ACADNS5UBWPQ, 2024b.
Goldberg, D. L., Anenberg, S. C., Kerr, G. H., Mohegh, A., Lu, Z., and Streets, D. G.: TROPOMI NO2 in the United States: A Detailed Look at the Annual Averages, Weekly Cycles, Effects of Temperature, and Correlation With Surface NO2 Concentrations, Earths Future, 9, https://doi.org/10.1029/2020EF001665, 2021a.
Goldberg, D. L., Anenberg, S. C., Lu, Z., Streets, D. G., Lamsal, L. N., E McDuffie, E., and Smith, S. J.: Urban NOx emissions around the world declined faster than anticipated between 2005 and 2019, Environ. Res. Lett., 16, 115004, https://doi.org/10.1088/1748-9326/AC2C34, 2021b.
Goldberg, D. L., Tao, M., Kerr, G. H., Ma, S., Tong, D. Q., Fiore, A. M., Dickens, A. F., Adelman, Z. E., and Anenberg, S. C.: Evaluating the spatial patterns of U.S. urban NOx emissions using TROPOMI NO2, Remote Sens. Environ., 300, https://doi.org/10.1016/j.rse.2023.113917, 2024.
Guo, Z., Abushama, H., Siddig, K., Kirui, O. K., Abay, K., and You, L.: Monitoring Indicators of Economic Activities in Sudan Amidst Ongoing Conflict Using Satellite Data, Defence and Peace Economics, https://doi.org/10.1080/10242694.2023.2290474, 2023.
Hajmohammadi, H. and Heydecker, B.: Evaluation of air quality effects of the London ultra-low emission zone by state-space modelling, Atmos. Pollut. Res., 13, 101514, https://doi.org/10.1016/J.APR.2022.101514, 2022.
Harake, W., Jamali, I., and Abou Hamde, N.: Lebanon Economic Monitor: Lebanon Sinking (to the Top 3), World Bank Group, http://documents.worldbank.org/curated/en/394741622469174252 (last access: 15 June 2025), 2021.
Herman, J., Cede, A., Spinei, E., Mount, G., Tzortziou, M., and Abuhassan, N.: NO2 column amounts from ground-based Pandora and MFDOAS spectrometers using the direct-sun DOAS technique: Intercomparisons and application to OMI validation, J. Geophys. Res.-Atmos., 114, https://doi.org/10.1029/2009JD011848, 2009.
Hilboll, A., Richter, A., and Burrows, J. P.: Long-term changes of tropospheric NO2 over megacities derived from multiple satellite instruments, Atmos. Chem. Phys., 13, 4145–4169, https://doi.org/10.5194/acp-13-4145-2013, 2013.
Ho, C. H., Heo, J. W., Chang, M., Choi, W., Kim, J., Kim, S. W., and Oh, H. R.: Regulatory measures significantly reduced air-pollutant concentrations in Seoul, Korea, Atmos. Pollut. Res., 12, 101098, https://doi.org/10.1016/J.APR.2021.101098, 2021.
Hoesly, R. M., Smith, S. J., Ahsan, H., Prime, N., O'Rourke, P., Crippa, M., Klimont, Z., Guizzardi, D., Feng, L., Harkins, C., McDonald, B. C., and Wang, S: CEDS v_2025_04_18 Gridded Data 0.1 degree, Zenodo [data set], https://doi.org/10.5281/zenodo.15001545, 2025.
Huber, D. E.: Annual and Monthly Mean TROPOMI NO2 Vertical Column Densities Aggregated to GHS-SMOD (R2023A) Urban Areas for 2019 to 2024, Zenodo [data set], https://doi.org/10.5281/zenodo.18665782, 2026.
Huber, D. E., Kort, E. A., and Steiner, A. L.: Soil Moisture, Soil NOx and Regional Air Quality in the Agricultural Central United States, J. Geophys. Res.-Atmos., 129, e2024JD041015, https://doi.org/10.1029/2024JD041015, 2024.
Jiang, Z., McDonald, B. C., Worden, H., Worden, J. R., Miyazaki, K., Qu, Z., Henze, D. K., Jones, D. B. A., Arellano, A. F., Fischer, E. V., Zhu, L., and Folkert Boersma, K.: Unexpected slowdown of US pollutant emission reduction in the past decade, P. Natl. Acad. Sci. USA, 115, 5099–5104, https://doi.org/10.1073/PNAS.1801191115, 2018.
Jiang, Z., Zhu, R., Miyazaki, K., McDonald, B. C., Klimont, Z., Zheng, B., Boersma, K. F., Zhang, Q., Worden, H., Worden, J. R., Henze, D. K., Jones, D. B. A., Denier van der Gon, H. A. C., and Eskes, H.: Decadal Variabilities in Tropospheric Nitrogen Oxides Over United States, Europe, and China, J. Geophys. Res.-Atmos., 127, e2021JD035872, https://doi.org/10.1029/2021JD035872, 2022.
Jin, X., Zhu, Q., and Cohen, R. C.: Direct estimates of biomass burning NOx emissions and lifetimes using daily observations from TROPOMI, Atmos. Chem. Phys., 21, 15569–15587, https://doi.org/10.5194/acp-21-15569-2021, 2021.
Krotkov, N. A., McLinden, C. A., Li, C., Lamsal, L. N., Celarier, E. A., Marchenko, S. V., Swartz, W. H., Bucsela, E. J., Joiner, J., Duncan, B. N., Boersma, K. F., Veefkind, J. P., Levelt, P. F., Fioletov, V. E., Dickerson, R. R., He, H., Lu, Z., and Streets, D. G.: Aura OMI observations of regional SO2 and NO2 pollution changes from 2005 to 2015, Atmos. Chem. Phys., 16, 4605–4629, https://doi.org/10.5194/acp-16-4605-2016, 2016.
Labzovskii, L. D., Belikov, D. A., and Damiani, A.: Spaceborne NO2 observations are sensitive to coal mining and processing in the largest coal basin of Russia, Sci. Rep., 12, 1–11, https://doi.org/10.1038/S41598-022-16850-8, 2022.
Lambert, J.-C., Keppens, A., Compernolle, S., Eichmann, K.-U., de Graaf, M., Hubert, D., Langerock, B., Sha, M. K., van der Plas, E., Verhoelst, T., Wagner, T., Ahn, C., Argyrouli, A., Balis, D., Chan, K. L., Coldewey-Egbers, M., De Smedt, I., Eskes, H., Fjæraa, A. M., Garane, K., Gleason, J. F., Granville, J., Hedelt, P., Heue, K.-P., Jaross, G., Koukouli, M. E., Loots, E., Lutz, R., Martinez Velarte, M. C., Michailidis, K., Pseftogkas, A., Nanda, S., Niemeijer, S., Pazmiño, A., Pinardi, G., Richter, A., Rozemeijer, N., Sneep, M., Stein Zweers, D., Theys, N., Tilstra, G., Topaloglou, C., Torres, O., Valks, P., van Geffen, J., Vigouroux, C., Wang, P., and Weber, M.: S5P MPC Routine Operations Consolidated Validation Report series, Issue #28, Version 28.00.00, 227 pp., Quarterly Validation Report of the Copernicus Sentinel-5 Precursor Operational Data Products #28: April 2018–August 2025, https://mpc-vdaf.tropomi.eu/UploadDir/reports//pdf/S5P-MPC-IASB-ROCVR-28.00.00_FINAL_signed-jcl-AD.pdf, last access: 15 September 2025.
Lamsal, L. N., Duncan, B. N., Yoshida, Y., Krotkov, N. A., Pickering, K. E., Streets, D. G., and Lu, Z.: U.S. NO2 trends (2005–2013): EPA Air Quality System (AQS) data versus improved observations from the Ozone Monitoring Instrument (OMI), Atmos. Environ., 110, 130–143, https://doi.org/10.1016/J.ATMOSENV.2015.03.055, 2015.
Laughner, J. L. and Cohen, R. C.: Direct observation of changing NOx lifetime in North American cities, Science, 366, 723–727, https://doi.org/10.1126/science.aax6832, 2019.
Levelt, P. F., Van Den Oord, G. H. J., Dobber, M. R., Mälkki, A., Visser, H., De Vries, J., Stammes, P., Lundell, J. O. V., and Saari, H.: The ozone monitoring instrument, IEEE T. Geosci. Remote, 44, 1093–1100, https://doi.org/10.1109/TGRS.2006.872333, 2006.
Levelt, P. F., Stein Zweers, D. C., Aben, I., Bauwens, M., Borsdorff, T., De Smedt, I., Eskes, H. J., Lerot, C., Loyola, D. G., Romahn, F., Stavrakou, T., Theys, N., Van Roozendael, M., Veefkind, J. P., and Verhoelst, T.: Air quality impacts of COVID-19 lockdown measures detected from space using high spatial resolution observations of multiple trace gases from Sentinel-5P/TROPOMI, Atmos. Chem. Phys., 22, 10319–10351, https://doi.org/10.5194/acp-22-10319-2022, 2022.
Li, H., Zheng, B., Lei, Y., Hauglustaine, D., Chen, C., Lin, X., Zhang, Y., Zhang, Q., and He, K.: Trends and drivers of anthropogenic NOx emissions in China since 2020, Environmental Science and Ecotechnology, 21, 100425, https://doi.org/10.1016/J.ESE.2024.100425, 2024.
Liu, B., Fu, X., Bechtel, A., Gross, D., Sachsenhofer, R. F., and Li, X.: Middle Permian environmental changes and shale oil potential evidenced by high-resolution organic petrology, geochemistry and mineral composition of the sediments in the Santanghu Basin, Northwest China, Int. J. Coal Geol., 185, 119–137, https://doi.org/10.1016/J.COAL.2017.11.015, 2018.
Liu, F., Zhang, Q., Van Der A, R. J., Zheng, B., Tong, D., Yan, L., Zheng, Y., and He, K.: Recent reduction in NOx emissions over China: synthesis of satellite observations and emission inventories, Environ. Res. Lett., 11, 114002, https://doi.org/10.1088/1748-9326/11/11/114002, 2016.
Lonsdale, C. R. and Sun, K.: Nitrogen oxides emissions from selected cities in North America, Europe, and East Asia observed by the TROPOspheric Monitoring Instrument (TROPOMI) before and after the COVID-19 pandemic, Atmos. Chem. Phys., 23, 8727–8748, https://doi.org/10.5194/acp-23-8727-2023, 2023.
Ma, Q., Wang, J., Xiong, M., and Zhu, L.: Air Quality Index (AQI) Did Not Improve during the COVID-19 Lockdown in Shanghai, China, in 2022, Based on Ground and TROPOMI Observations, Remote Sens.-Basel, 15, 1295, https://doi.org/10.3390/RS15051295, 2023.
Martínez-Alonso, S., Veefkind, J. P., Dix, B., Gaubert, B., Theys, N., Granier, C., Soulié, A., Darras, S., Eskes, H., Tang, W., Worden, H., de Gouw, J., and Levelt, P. F.: S-5P/TROPOMI-Derived NOx Emissions From Copper/Cobalt Mining and Other Industrial Activities in the Copperbelt (Democratic Republic of Congo and Zambia), Geophys. Res. Lett., 50, e2023GL104109, https://doi.org/10.1029/2023GL104109, 2023.
Matthias, V., Quante, M., Arndt, J. A., Badeke, R., Fink, L., Petrik, R., Feldner, J., Schwarzkopf, D., Link, E.-M., Ramacher, M. O. P., and Wedemann, R.: The role of emission reductions and the meteorological situation for air quality improvements during the COVID-19 lockdown period in central Europe, Atmos. Chem. Phys., 21, 13931–13971, https://doi.org/10.5194/acp-21-13931-2021, 2021.
Miyazaki, K., Eskes, H., Sudo, K., Boersma, K. F., Bowman, K., and Kanaya, Y.: Decadal changes in global surface NOx emissions from multi-constituent satellite data assimilation, Atmos. Chem. Phys., 17, 807–837, https://doi.org/10.5194/acp-17-807-2017, 2017.
Panda, M. R., Tyagi, A., Dhanya, C. T., Verma, A., and Swain, A.: Vulnerability assessment of thermal power plants in India under water stress conditions, Energy, 276, 127553, https://doi.org/10.1016/J.ENERGY.2023.127553, 2023.
Richter, A., Burrows, J. P., Nüß, H., Granier, C., and Niemeier, U.: Increase in tropospheric nitrogen dioxide over China observed from space, Nature, 437, 129–132, https://doi.org/10.1038/nature04092, 2005.
Rokicki, T., Bórawski, P., and Szeberényi, A.: The Impact of the 2020–2022 Crises on EU Countries' Independence from Energy Imports, Particularly from Russia, Energies, 16, 6629, https://doi.org/10.3390/EN16186629, 2023.
Schiavina, M., Melchiorri, M., and Pesaresi, M.: GHS-SMOD R2023A - GHS settlement layers, application of the Degree of Urbanisation methodology (stage I) to GHS-POP R2023A and GHS-BUILT-S R2023A, multitemporal (1975–2030), European Commission, Joint Research Centre (JRC) [data set], https://doi.org/10.2905/A0DF7A6F-49DE-46EA-9BDE-563437A6E2BA, 2023.
Schumann, U. and Huntrieser, H.: The global lightning-induced nitrogen oxides source, Atmos. Chem. Phys., 7, 3823–3907, https://doi.org/10.5194/acp-7-3823-2007, 2007.
Seo, S., Kim, S. W., Kim, K. M., Lamsal, L. N., and Jin, H.: Reductions in NO2 concentrations in Seoul, South Korea detected from space and ground-based monitors prior to and during the COVID-19 pandemic, Environ. Res. Commun., 3, 051005, https://doi.org/10.1088/2515-7620/ABED92, 2021.
Shi, Q., Zheng, B., Zheng, Y., Tong, D., Liu, Y., Ma, H., Hong, C., Geng, G., Guan, D., He, K., and Zhang, Q.: Co-benefits of CO2 emission reduction from China's clean air actions between 2013-2020, Nat. Commun., 13, 1–8, https://doi.org/10.1038/s41467-022-32656-8, 2022.
Shikwambana, L., Mhangara, P., and Mbatha, N.: Trend analysis and first time observations of sulphur dioxide and nitrogen dioxide in South Africa using TROPOMI/Sentinel-5 P data, Int. J. Appl. Earth Obs., 91, 102130, https://doi.org/10.1016/J.JAG.2020.102130, 2020.
Song, W., Liu, X. Y., Hu, C. C., Chen, G. Y., Liu, X. J., Walters, W. W., Michalski, G., and Liu, C. Q.: Important contributions of non-fossil fuel nitrogen oxides emissions, Nat. Commun., 12, 1–7, https://doi.org/10.1038/s41467-020-20356-0, 2021.
Stavrakou, T., Müller, J.-F., Boersma, K. F., De Smedt, I., and van der A, R. J.: Assessing the distribution and growth rates of NOx emission sources by inverting a 10-year record of NO 2 satellite columns, Geophys. Res. Lett., 35, https://doi.org/10.1029/2008GL033521, 2008.
van der A, R. J., Eskes, H. J., Boersma, K. F., van Noije, T. P. C., Van Roozendael, M., De Smedt, I., Peters, D. H. M. U., and Meijer, E. W.: Trends, seasonal variability and dominant NOx source derived from a ten year record of NO2 measured from space, J. Geophys. Res.-Atmos., 113, 1–12, https://doi.org/10.1029/2007JD009021, 2008.
Varma, A. K., Biswal, S., Hazra, B., Mendhe, V. A., Misra, S., Samad, S. K., Singh, B. D., Dayal, A. M., and Mani, D.: Petrographic characteristics and methane sorption dynamics of coal and shaly-coal samples from Ib Valley Basin, Odisha, India, Int. J. Coal Geol., 141–142, 51–62, https://doi.org/10.1016/J.COAL.2015.03.005, 2015.
Veefkind, J. P., Aben, I., McMullan, K., Förster, H., de Vries, J., Otter, G., Claas, J., Eskes, H. J., de Haan, J. F., Kleipool, Q., van Weele, M., Hasekamp, O., Hoogeveen, R., Landgraf, J., Snel, R., Tol, P., Ingmann, P., Voors, R., Kruizinga, B., Vink, R., Visser, H., and Levelt, P. F.: TROPOMI on the ESA Sentinel-5 Precursor: A GMES mission for global observations of the atmospheric composition for climate, air quality and ozone layer applications, Remote Sens. Environ., 120, 70–83, https://doi.org/10.1016/J.RSE.2011.09.027, 2012.
Vlemmix, T., Piters, A. J. M., Stammes, P., Wang, P., and Levelt, P. F.: Retrieval of tropospheric NO2 using the MAX-DOAS method combined with relative intensity measurements for aerosol correction, Atmos. Meas. Tech., 3, 1287–1305, https://doi.org/10.5194/amt-3-1287-2010, 2010.
Wang, C., Wang, T., and Wang, P.: The Spatial–Temporal Variation of Tropospheric NO2 over China during 2005 to 2018, Atmosphere, 10, 444, https://doi.org/10.3390/ATMOS10080444, 2019.
Zhang, Y., Tian, J., Feng, S., Yang, F., and Lu, X.: The occurrence modes and geologic origins of arsenic in coal from Santanghu Coalfield, Xinjiang, J. Geochem. Explor., 186, 225–234, https://doi.org/10.1016/J.GEXPLO.2017.12.006, 2018.
Zhao, X., Li, X. X., Xin, R., Zhang, Y., and Liu, C. H.: Impact of Lockdowns on Air Pollution: Case Studies of Two Periods in 2022 in Guangzhou, China, Atmosphere, 15, 1144, https://doi.org/10.3390/ATMOS15091144, 2024.
Zheng, B., Zhang, Q., Geng, G., Chen, C., Shi, Q., Cui, M., Lei, Y., and He, K.: Changes in China's anthropogenic emissions and air quality during the COVID-19 pandemic in 2020, Earth Syst. Sci. Data, 13, 2895–2907, https://doi.org/10.5194/essd-13-2895-2021, 2021.
- Abstract
- Introduction
- Data and Methods
- Global VCD Changes from 2019 to 2024 in Major Urban Areas
- Population-weighted Country-level Urban TROPOMI NO2
- Regional TROPOMI NO2 Vertical Column Densities from 2019 to 2024
- TROPOMI NO2 VCD Changes in Oil, Gas and Other Mining Regions
- Conclusions
- Data availability
- Author contributions
- Competing interests
- Disclaimer
- Acknowledgements
- Financial support
- Review statement
- References
- Supplement