the Creative Commons Attribution 4.0 License.
the Creative Commons Attribution 4.0 License.
 | 10 Mar 2026
Degradation of anhydro-saccharides and the driving factors in real atmospheric conditions: a cross-city study in China
Biao Zhou
Kun Zhang
Qiongqiong Wang
Jiqi Zhu
Anhydro-saccharides (levoglucosan, mannosan, and galactosan), as important components of organic aerosol, have been widely used as molecular markers for biomass burning. Previous studies have shown that levoglucosan degrades in the atmosphere, but most of the results are derived from laboratory experiments, little is known about the decay rates and their driving factors in the real complex ambient environment. In this study, a Thermal Desorption Aerosol Gas Chromatography-Mass Spectrometry (TAG-GC/MS) was utilized to collect PM2.5-bound saccharides in three typical cities across the major city clusters in eastern China (Zibo, North China Plain; Changzhou, Yangtze River Delta; and Hong Kong, Pearl River Delta region) during the autumn and winter seasons, with bihourly time resolution. A total of 31, 21, and 69 valid decay days were identified for Zibo, Changzhou, and Hong Kong, respectively. With the relative rate constant method, we found the daytime (08:00–16:00 LST) decay rate of levoglucosan was fastest in Changzhou, reaching 0.13 ± 0.05 h−1 (with a range of 0.01–0.55 h−1), and the maximum decay rates of mannosan (0.14 ± 0.05 h−1, range: 0.04–0.29 h−1) and galactosan (0.15 ± 0.06 h−1, range: 0.04–0.33 h−1) were observed in Hong Kong. Results from the generalized additive model indicate that the daytime decay rate of anhydro-saccharides is primarily influenced by aerosol liquid water content, relative humidity, and atmospheric oxidation capacity, while temperature and solar surface radiation also contribute to an increase in the decay rates. This study provides valuable field data on the degradation rates of saccharides in real ambient environments and demonstrates that their degradation results are driven by the combined effects of multiple oxidation pathways.
- Article
(4418 KB) - Full-text XML
-
Supplement
(1467 KB) - BibTeX
- EndNote


-
Anhydro-saccharides (levoglucosan, mannosan, and galactosan) exhibit decreasing trends during the daytime in the ambient environment.
-
The decay rate of levoglucosan is fastest in Changzhou, while the decay rates of mannosan and galactosan are fastest in Hong Kong.
-
The daytime decay of anhydro-saccharides is primarily influenced by aerosol liquid water content, relative humidity, and oxidants.
Organic aerosol (OA) constitutes a significant component of PM2.5, accounting for 20 %–80 % of PM2.5 mass (He et al., 2020; Zhang et al., 2007). Biomass burning (BB) is one of the primary sources of OA in the atmosphere and has significant impacts on air quality, visibility, and climate (Bao et al., 2021; Liu et al., 2019). BB releases various organic compounds, such as anhydro-saccharides, polycyclic aromatic hydrocarbons, nitro phenolic and n-alkanes, with levoglucosan generally being the most abundant anhydro-saccharide (Chen et al., 2017; Fang et al., 2024; Yan et al., 2019; Zhang et al., 2022). Levoglucosan and its two isomers, mannosan and galactosan, which are produced during the pyrolysis of cellulose and hemicellulose at temperatures ranging from 150 to 350 °C (Fabbri et al., 2009; Hong et al., 2022; Stevens et al., 2024), have been widely used as molecular markers of BB aerosol in PM2.5 source apportionment (Alvi et al., 2020; Cheng et al., 2022; Hong et al., 2022; Kang et al., 2018; Li et al., 2021; Liang et al., 2016).
For decades, the anhydro-saccharides are considered as stable compounds and the majority of previous studies did not consider the degradation of anhydro-saccharides during the source apportionment of PM2.5. However, researchers found that levoglucosan can undergo oxidation in both the gas phase and liquid phase, or undergo heterogeneous oxidation on the aerosol surface (Bai et al., 2013; Li et al., 2021; Zhao et al., 2014). Recent studies have proved that the contribution of BB to organic carbon (OC) and PM2.5 could be underestimated if the degradation of anhydro-saccharides was ignored (Hong et al., 2022; Li et al., 2023a). For example, Li et al. (2023a) found that approximately 87 % of levoglucosan had already degraded before reaching the receptor site, causing a 14.9 % underestimation of BB-derived OC. A recent study (Wang et al., 2025) in Hong Kong calculated the degradation rate constants and estimated the atmospheric lifetime of levoglucosan, but the universal impact of this phenomenon, and their driving factors that influence this degradation process have not been thoroughly investigated (Wang et al., 2025). Furthermore, it is currently unclear how the variations of atmospheric conditions influence the degradation rate of anhydro-saccharides. Traditional studies on levoglucosan degradation typically rely on offline sampling, laboratory experiments, and model simulations (Arangio et al., 2015; Bai et al., 2013; Hennigan et al., 2010; Liu et al., 2019; Xu et al., 2020). However, low temporal resolution observation limits the in-depth understanding of its degradation process, and discrepancies between laboratory experiments and theoretical studies can introduce large biases in model simulations. With the development of the Thermal Desorption Aerosol Gas Chromatography-Mass Spectrometry (TAG-GC/MS) system, it is now possible to collect organic marker data with high temporal resolution, capturing dynamic changes in emission sources and the aging process of organic aerosols (He et al., 2020; Li et al., 2020; Wang et al., 2020; Zhang et al., 2021a; Zhao et al., 2013; Zhu et al., 2021). Therefore, online observations across multiple cities under different atmospheric environments are essential to better understand the degradation rates of anhydro-saccharides.
Zibo, Changzhou, and Hong Kong are three representative cities located in the North China Plain (NCP), the Yangtze River Delta (YRD) region, and the Pearl River Delta (PRD) region, respectively. These cities exhibit significant disparities in meteorological conditions, anthropogenic sources, and ambient air pollution levels. These divergent environmental conditions imply that the degradation process of anhydro-saccharides in the atmosphere may be influenced by different factors. To investigate this, a comparative analysis of anhydro-saccharides degradation rates in these cities was conducted. The bihourly resolution data of PM2.5-bound levoglucosan, mannosan and galactosan were collected at Zibo, Changzhou and Hong Kong during various cold seasons using the TAG-GC/MS system. The daytime decay rates of anhydro-saccharides in these three cities were calculated using the relative rate constant method, and the driving factors influencing the daytime decay rates of anhydro-saccharides were analyzed with the generalized additive model (GAM). The findings of this study enhance our understanding of atmospheric degradation mechanisms of anhydro-saccharides and provide a scientific foundation for precise source apportionment, especially for refining our knowledge on the source contributions to PM2.5 from biomass burning.
2.1 Site description and field observation
Field observations using TAG-GC/MS were conducted during multiple autumn and winter season deployments in three different typical cities in three regions (Zibo, Shandong province, NCP; Changzhou, Jiangsu province, YRD; and Hong Kong, PRD region) over eastern China (Fig. S1 in the Supplement). The sampling site in Zibo was situated at the Zibo Ecological Environment Monitoring Station (36°50′ N, 118°07′ E). This location is bordered by Lutai Avenue approximately 500 m to the east, Lushan Avenue approximately 100 m to the south, and residential neighborhoods approximately 1 km to the north. It represents the urban atmospheric environment influenced by multiple pollution sources including both anthropogenic and biogenic emissions. The vegetation in the vicinity mainly consists of temperate deciduous broadleaf forests. Organic compounds emitted from this area may significantly impact ground-level aerosols. The observation period was from November 2022 to February 2023.The sampling site in Changzhou was situated at the Changzhou Environmental Monitoring Center (119°59.730′ E, 31°45.510′ N). The surrounding environment includes numerous commercial and residential districts, as well as major roads such as Zhongwu Avenue, Heping Middle Road, and Guanghua Road, representing an urban environment affected by various pollution sources. Data from January to March 2021 was collected, and the detailed information of this field campaign can be found in our previous studies (Li et al., 2023b; Yi et al., 2024). The sampling site in Hong Kong was at the Hong Kong University of Science and Technology Super Station (114°16′ E, 22°19′ N), situated in a suburban area with relatively limited local emissions. Observations were conducted from October 2020 to January 2021. During the observation periods, the anhydro-saccharides data had a temporal resolution of 2 h; however, some data were lost due to instrument malfunctions or maintenance during certain intervals.
During the field campaign, we conducted online measurements at the three stations to collect auxiliary data, including meteorological conditions, air pollutant and PM2.5 concentrations. At the Changzhou site, meteorological parameters including wind speed (WS), wind direction (WD), relative humidity (RH), temperature (T), atmospheric pressure (P), rainfall (RF) were monitored by a WXT520 (VAISALA, FL); PM2.5 by a BAM1020 (Met One, US) via the beta-ray method; O3, and NOx by a MODEL 49i and MODEL450i (Thermo Fisher Scientific, US), respectively; OC/EC by a RT-4 (Sunset Laboratory, US), water-soluble ions (Cl−, NO, SO, Na+, NH, K+, Mg2+, Ca2+) and NH3 by an ADI2080 (Metrohm, CHN). Solar surface radiation (SSR) data were obtained from the ERA5-Reanalysis (https://cds.climate.copernicus.eu/datasets, last access: 20 January 2026). In Zibo, meteorological data including wind speed (WS), wind direction (WD), relative humidity (RH), temperature (T), atmospheric pressure (P), rainfall (RF) were obtained from the China Meteorological Administration (https://www.cma.gov.cn/, last access: 20 January 2026); PM2.5 by a MODEL 5014i (Thermo Fisher Scientific, US); O3, and NOx by a MODEL 49i, and MODEL 42i (Thermo Fisher Scientific, US), respectively; by a MODEL ECOC-610 (Hangzhou Pengpu Technology Co., Ltd., China), water-soluble ions (Cl−, NO, SO, Na+, NH, K+, Mg2+, Ca2+) and NH3 by a MODEL S611 (Fortelice International Co., Ltd., Taiwan, China); solar surface radiation (SSR) by CMP11 (Kipp & Zonen, Zuid-Holland, Netherlands). At the Hong Kong site, PM2.5 was measured by a MODEL 5030i (Thermo Fisher Scientific, US); water-soluble ions (Cl−, NO, SO, Na+, NH, K+, Mg2+, Ca2+), NH3 and OC/EC by an ADI2080 (Metrohm, CHN) and RT-4 (Sunset Laboratory, US), respectively; O3, and NOx by a MODEL 49i, and MODEL 42i (Thermo Fisher Scientific, US); meteorological parameters wind speed (WS), wind direction (WD), relative humidity (RH), temperature (T), atmospheric pressure (P), rainfall (RF), and solar surface radiation (SSR) by the 10 m automatic weather station tower. Standard calibrated sensors on the automatic weather station (AWS) tower were used for measurements: a temperature/humidity sensor (HMP155) for air temperature and relative humidity, an ultrasonic anemometer (CSAT3A) for wind speed and direction, a barometric pressure sensor (CS106) for atmospheric pressure, a pyranometer (LI200R) for shortwave solar radiation, and a tipping-bucket rain gauge (TE525MM) for precipitation at the tower base. The elemental species (K, Ca) by an Xact 625i (Cooper Environmental Services) were measured via an X-ray method. Detailed information about online observations can be found in Table S1.
The TAG-GC/MS system is applied for the online measurement of levoglucosan, galactosan and mannosan. A detailed description and the schematic diagram of the TAG can be found in our previous studies (He et al., 2020; Li et al., 2020; Wang et al., 2020, 2025; Zhang et al., 2021a). During the observations, a deuterium-labeled internal standard solution was injected into each sample to monitor instrument condition and analyze the contamination levels of key species. The detailed description is provided in Sect. S1. This study consistently utilizes deuterated levoglucosan (Levoglucosan-d7) as an internal standard to quantify three anhydro-saccharides. Given that these three target analytes share the same molecular formula and possess highly similar molecular structures, Levoglucosan-d7 can effectively correct for recovery rates during extraction, separation, and detection processes for all three compounds. Furthermore, this internal standard shows no background interference in actual atmospheric samples, ensuring the accuracy and reliability of the quantitative results. The identification of the target saccharides is achieved by comparing their retention times and mass spectra with those of authentic standards. Subsequently, quantitative analysis is performed using internal standard calibration. We plotted the relationship between the peak area ratios of external standard solutions and the concentrations of target compounds in the standard mixture to generate a calibration curve, and the correlation coefficients (R) ranges from 0.92 to 0.99. The detailed information on the preparation of external standard solutions and internal standard solutions for the saccharide compounds analyzed in the field campaign can be found in Tables S2 and S3.
2.2 ISORROPIA-II Model
Aerosol acidity (pHis) and aerosol liquid water content (ALWC) were calculated using the forward mode of the ISORROPIA-II model (https://www.epfl.ch/labs/lapi/models-and-software/isorropia/, last access: 27 February 2026) (Fountoukis and Nenes, 2007). The input parameters required for the model primarily included water-soluble inorganic ions (SO, NO, NH, K+, Ca2+, Na+, Mg2+, and Cl−), NH3, temperature (T), and relative humidity (Hennigan et al., 2015). The calculation formula is as follows:
where H+ represents the liquid-phase mass concentration of hydrogen ions, expressed in µg m−3, ALWC denotes the aerosol liquid water content, expressed in µg m−3.
2.3 Relative Rate Constant Method
Previous studies have indicated that K+ can serve as a tracer for biomass burning (Hong et al., 2022; Pio et al., 2008). Moreover, the ratio of levoglucosan to BB-derived K+ (K) observed in the environment can be used to distinguish different types of biomass burning, such as crop residue burning and wood combustion (Cheng et al., 2013). Additionally, due to the chemical stability of K+ in the atmosphere, this ratio can also serve as an indicator of BB aerosol aging. However, since potassium ions can also originate from sea salt and dust (Karavoltsos et al., 2020; White, 2008). To estimate the potassium ions derived from biomass burning (K), this study subtracted the contributions of sea salt and dust by Eqs. (2)–(7).
In Eq. (2), K and K refer to non-sea-salt potassium and potassium originating from dust, respectively. In Eq. (3), K, Na, and Ca represent the concentrations of potassium, sodium, and calcium in the aerosol samples, which are the measured values. Based on previous literature, the mass ratios of (K) and (Ca) in seawater are 0.037 and 0.038, respectively, and are used for the correction of sea salt aerosols (Kumar et al., 2018; Pio et al., 2007). The study of Kumar et al. (2018) suggests that the maximum and minimum differences in the mass ratio of (K) are considered to represent emissions from biomass burning (Kumar et al., 2018; Pio et al., 2008, 2007). The Ca2+ originating from biomass burning is calculated by using (K minus (K as the denominator.
In this study, the calculation method for the anhydro-saccharides decay rate was adopted from Wang et al. (2025), which is a variant of the relative rate constant approach utilizing inert K as the reference substance (Donahue et al., 2005; Wang et al., 2025). The validity of this method has been demonstrated in previous studies (Wang and Yu, 2021). The detailed derivation of the formula can be found in Sect. S2. The final derived expression is presented as Eq. (8). According to Wang et al. (2025), the Ci represents the particle phase concentration of anhydro-saccharides, represents the concentration of K+ from biomass combustion, k2 represents the second-order reaction rate constant between anhydro-saccharides and oxidants, and represents the average concentration of oxidants in the aerosol phase. The calculated k corresponds to the effective total decay rate of anhydro-saccharides, which results from various atmospheric processes (such as heterogeneous oxidation and aqueous-phase oxidation). We assume that the emission of anhydro-saccharides and K is equivalent, or that no new pollutants are emitted, or that such emissions are negligible within the time frame of the study (i.e., 8 h). Compared to previous studies applying the relative rate constant method to a pair of target and unknown compounds (Donahue et al., 2005; Huff Hartz et al., 2007), this method can be regarded as a special case where the reference species is inert and zero-corrected.
2.4 Generalized Additive Models
Generalized additive models (GAM) are used to construct nonlinear regression relationships between explanatory variables and response variables. Unlike statistical distribution-based models, GAM is primarily data-driven, allowing for flexible adjustment of the functional form of the response variable based on the specific context (Stone, 1985). Compared to other statistical models, GAM offers higher flexibility and degrees of freedom, which does not require a pre-defined parametric model, and can be applied to various distribution types, and can directly handle complex nonlinear relationships between explanatory and response variables (Zhai et al., 2019). The GAM model has been widely applied in studies investigating the influencing factors of nonlinear atmospheric pollutants, such as PM2.5, O3, and SOA (Hu et al., 2022; Zhang et al., 2021b). The basic form of the GAM model is shown in Eq. (9).
In the equation, g(μ) is a continuous function representing the relationship between the nonlinear formula and the expected value; μ denotes the response variable, i.e., the mass concentration of the target substance; β is the intercept; fn (n= 1, 2, …, n) is the smoothing function connecting the explanatory variables; Xn (n=1, 2, …, n) refers to the different explanatory variables. The significance of the explanatory variables is tested using the akaike information criterion, and the most appropriate g(μ) and Xn are selected through multiple linear tests. The R2, deviance explained (%), and p-value calculated from the GAM model are used to assess the significance level, importance of Xn, and the model's goodness of fit. In this study, the generalized additive model (GAM) was implemented using the LinearGAM class from the Python library pygam, with cubic regression splines as the default basis function. The model utilized a linear link function (the default setting for LinearGAM), aligning with the assumption of a linear relationship between the response variable and the smooth terms of the predictor variables. All variables were retained in their original units and ranges, and no scaling was applied before model fitting. To optimize the spline-related parameters, we conducted a two-dimensional grid search over the basis dimension (defined as the number of splines k) and the penalty parameter (λ). The enumerated range for k was set at 8, 10, and 12, while λ was exhaustively tested across a predetermined logarithmic range (from 10−3 to 103, encompassing 10 logarithmic points). This process generated 30 parameter combinations, which were evaluated by minimizing the generalized cross-validation (GCV) loss function. The results indicated that when k= 10, the model achieved optimal performance, with the corresponding optimal penalty parameter λ= 46.42. Moreover, with k= 10, all smooth curves of the variables exhibited no anomalous oscillations or overfitting artifacts, clearly reflecting the true nonlinear trends of the variables. This parameter combination achieved the best balance between fitting accuracy and structural complexity, leading to the final selection of k= 10 for the basis dimension of all predictor variables, thereby determining the optimal effective degrees of freedom (Edf) for each smooth term of the predictors. This optimization step effectively balanced the accuracy of the model fit with its structural complexity, enhancing the model's generalization performance on unseen data. Furthermore, to optimize the set of predictor variables, a multicollinearity check was performed using the variance inflation factor (VIF) before model fitting, with a conservative threshold of 4 used to identify significant multicollinearity; variables with VIF > 4 were carefully evaluated and excluded from the final model. The retained predictor variables demonstrated acceptable levels of collinearity, ensuring the stability of model parameter estimates and improving the reliability and interpretability of subsequent analytical results.
3.1 Overview of the field campaign
The overall environmental condition and air pollutant levels during the three field campaigns are summarized in Table S4. During the field observation period, PM2.5 pollution was the most severe in Zibo, with an average concentration of 69.4 ± 58.0 µg m−3. In comparison, the average PM2.5 concentrations in Changzhou and Hong Kong were 49.9 ± 26.4 and 20.5 ± 8.8 µg m−3, respectively. Zibo is a traditional heavy industrial city with more than 8200 industrial plants, including power plants, chemical factories, and building materials industries (Pan et al., 2025). Due to its high emission intensity, Zibo has been suffering from poor air quality, consistently ranking last in air quality within Shandong Province in recent years. In contrast, the air quality in Hong Kong was relatively good, which is likely related to relatively low emission intensity and favorable meteorological conditions. The average winter temperature in Zibo (−0.2 ± 6.1 °C) was the lowest among the three cities, with a maximum wind speed of 2.2 ± 1.7 m s−1. As a city in northern China, Zibo's cold and windy climate is closely associated with the influence of northern continental air masses during winter. In contrast, Changzhou (10.9 ± 4.9 °C, 1.3 ± 0.7 m s−1) and Hong Kong (19.6 ± 5.2 °C, 1.6 ± 0.5 m s−1), located in southern and coastal regions, are influenced by the subtropical monsoon and oceanic climate, leading to significantly higher winter temperatures and lower wind speeds, resulting in a milder and more stable climate. As shown in Fig. 1, levoglucosan is the dominant anhydro-saccharides in all three cities, with concentrations of 45.5 ± 32.3 ng m−3 in Zibo, 45.1 ± 38.7 ng m−3 in Changzhou, and 27.5 ± 15.6 ng m−3 in Hong Kong, respectively. The average concentration of mannosan in Changzhou (3.6 ± 3.2 ng m−3) is higher than in Zibo (2.4 ± 1.7 ng m−3) and Hong Kong (1.9 ± 1.5 ng m−3). Conversely, the concentration of galactosan in Zibo (4.5 ± 3.4 ng m−3) is significantly higher than in Changzhou (2.4 ± 2.0 ng m−3) and Hong Kong (0.9 ± 0.7 ng m−3). These differences may reflect varying BB source types across the cities. The total concentration of three anhydro-saccharides (levoglucosan, mannosan, and galactosan) in these three cities accounts for 0.7 % (Zibo), 0.9 % (Changzhou), and 0.8 % (Hong Kong) of the measured total organic carbon (OC) mass. Although their proportion is relatively low, these anhydro-saccharides, as characteristic tracers of biomass burning, can be used to inversely estimate the contribution of BB sources to atmospheric OC. Thus, they are key indicators for quantifying the impact of BB source emissions (Cheng et al., 2022; Fabbri et al., 2009; Li et al., 2023a).
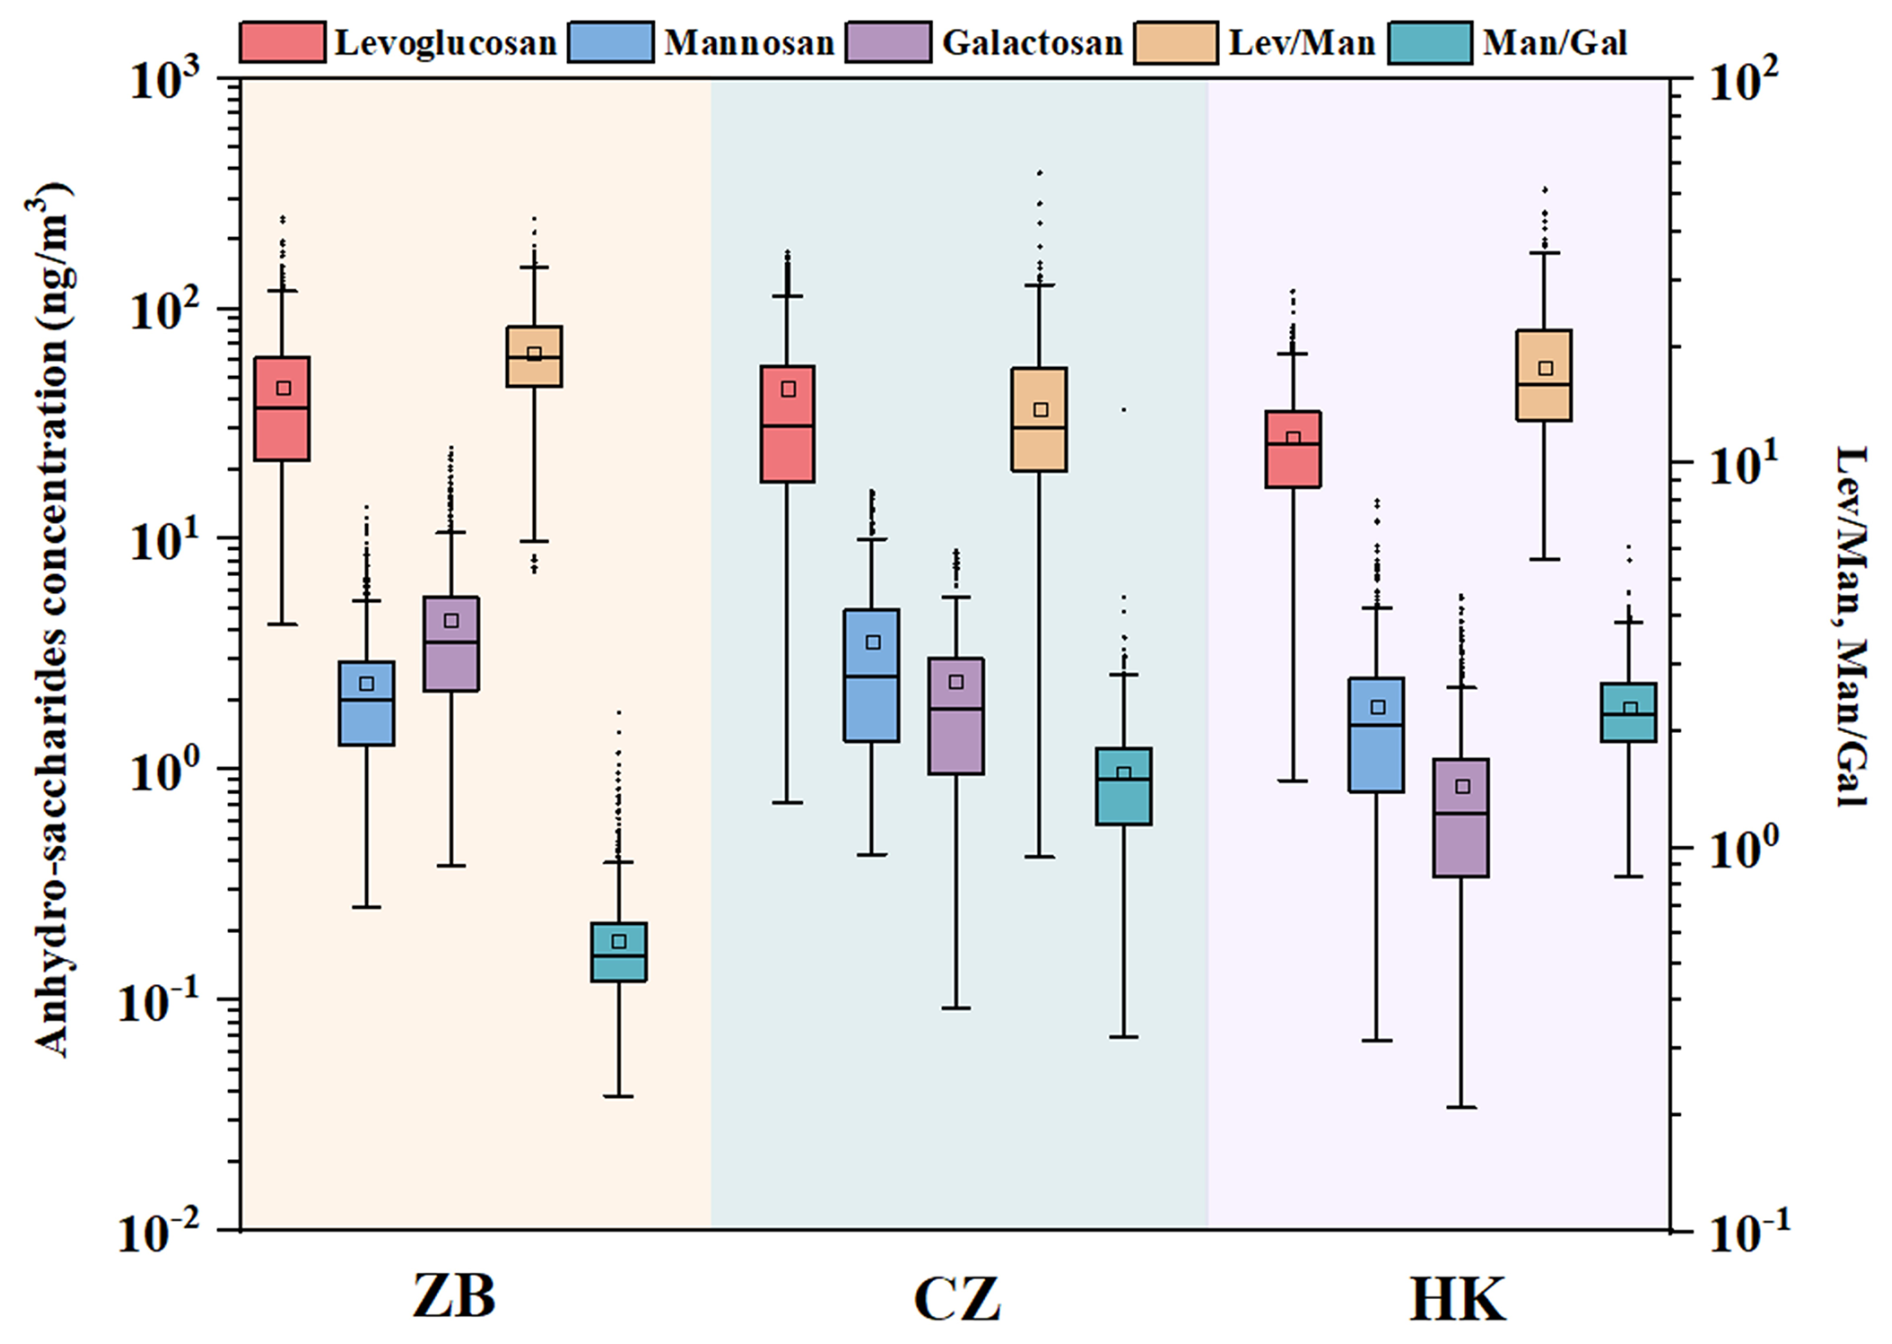
Figure 1Boxplot of the concentrations of levoglucosan (Lev), mannosan (Man), galactosan (Gal), and their ratios (, ) in the cities of Zibo, Changzhou, and Hong Kong.
By analyzing the ratio of levoglucosan (Lev) to mannosan (Man), different types of biomass combustion sources can be identified. For example, previous studies have shown that the ratio from crop straw combustion can exceed 40, while the ratios from hardwood and softwood combustion range from 15 to 25 and 3 to 10, respectively (Engling et al., 2009; Fu et al., 2012; Sang et al., 2013; Xu et al., 2020). We calculated the Lev/Man and ratios for the three cities, as shown in Fig. 1. The average ratios in Zibo, Changzhou, and Hong Kong were 19.3 ± 5.6 (range: 5.2–43.3), 13.9 ± 6.6 (0.9–56.8), and 17.8 ± 6.5 (5.6–51.4), respectively. Figure S2 illustrates the parameter ratio space of and to characterize biomass burning characteristics and distinguish different combustion types. The tracer ratio space diagram for coniferous trees, deciduous trees, hardwood, softwood, and crop residues, proposed by Cheng et al. (2013), overcomes the limitation of relying solely on a single feature ratio (such as or ) for distinguishing biomass burning types (Cheng et al., 2013). It is important to note that, due to insufficient observational data for K+ in Hong Kong, we selected total potassium for the calculation, and after excluding the effects of sea salt and dust, the final calculation yielded potassium produced by biomass combustion (KBB). The calculated KBB accounted for 82 % of total K, confirming that biomass burning (BB) was the dominant source of K in PM2.5 during the observation period. Furthermore, KBB exhibited a good correlation with levoglucosan (Rp= 0.63), which further reinforces that they share the same primary source. Thus, it is reasonable to use KBB as a tracer for BB at the Hong Kong site. However, daily heterogeneity in the sources of potassium cannot be ruled out, which may introduce systematic biases in the estimation of KBB and the inference of k's. Detailed information can be found in our previous study (Wang et al., 2025). The ratio ranges for Zibo, Changzhou, and Hong Kong all fall within the range typically associated with crop residue burning, which is consistent with previous studies. The study period coincided with the autumn and winter seasons, which correspond to the typical period of crop residue burning (Cheng et al., 2013; Wang et al., 2020). In addition, the ratio of mannosan to galactosan () has been used as an auxiliary method for distinguishing biomass combustion sources. During the observation period, the average values for Changzhou and Hong Kong were 1.56 ± 0.75 (range: 0.32–13.81) and 2.30 ± 0.64 (range: 0.84–6.38), respectively, consistent with previous studies which indicate that in the combustion emissions of crop straw, grass, and coal pellets, the content of mannosan (Man) is usually higher than that of galactosan (Gal) (Fabbri et al., 2009; Vicente et al., 2018; Xu et al., 2020). However, the average value in Zibo was 0.56 ± 0.19 (range: 0.23–2.24), significantly lower than those in Changzhou and Hong Kong, with a relatively higher concentration of galactosan, which may be related to differences in the type of combustion source or combustion conditions (Haque et al., 2022; Kuo et al., 2011; Yan et al., 2018). For example, the combustion of coal and certain industrial fuels may lead to higher galactosan content due to differences in the organic composition of these fuels compared to biomass fuels (Yan et al., 2018). Furthermore, incomplete combustion or low-temperature combustion may increase galactosan concentration (Haque et al., 2022), which could be a characteristic feature of combustion in Zibo. As a heavy industrial city, Zibo has more industrial combustion sources and incomplete combustion phenomena, leading to the relative enrichment of galactosan and exhibiting distinct chemical characteristics compared to common biomass combustion. In addition, residential coal combustion for heating was also an important emission source in suburban areas of North China in winter, which is corresponding to the low-temperature combustion scenario in Zibo.
3.2 Diurnal variations of anhydro-saccharides and ratios of , ,
Figure 2 shows the detailed diurnal variations of anhydro-saccharides across three cities. The anhydro-saccharides in all three cities exhibit similar diurnal variation characteristics, indicating the similar source and atmospheric degradation processes. Specifically, the concentrations of anhydro-saccharides in the three cities generally decrease during the daytime (08:00–16:00 LST) and increase at night. Notably, in Fig. 2b, the decline of levoglucosan in Changzhou is most pronounced during the daytime. In Changzhou, daytime levoglucosan concentrations peak at 08:00 LST (49.26 ± 5.71 ng m−3) before gradually declining to a minimum of 29.53 ± 4.54 ng m−3 by 14:00 LST. A slight rebound to 30.56 ± 4.56 ng m−3 occurs at 16:00 LST, followed by a significant increase to a secondary peak of 59.88 ± 5.71 ng m−3 at 20:00 LST. In addition, Fig. 2c show the diurnal variation of levoglucosan in Hong Kong exhibits a pronounced pattern, with peak concentrations occurring in the morning at 08:00 LST, (32.65 ± 1.72 ng m−3). Similar to Changzhou, the levoglucosan concentration drops to a minimum at 14:00 LST (22.40 ± 1.24 ng m−3), followed by a slight rebound to 23.05 ± 1.20 ng m−3 at 16:00 LST. The diurnal variation of levoglucosan in Zibo is relatively flat, peaking at 08:00 LST (48.24 ± 4.29 ng m−3) and declining to 39.83 ± 3.30 ng m−3 at 16:00 LST. Similarly, the concentration of mannosan in Changzhou shows the most significant daytime decrease, from a peak at 08:00 (3.89 ± 0.40 ng m−3) to a minimum at 16:00 (2.42 ± 0.45 ng m−3). A significant decline was also observed in Hong Kong, from 2.42 ± 0.20 ng m−3 at 08:00 to 1.47 ± 0.10 ng m−3 at 16:00 LST. In contrast, the diurnal variation of mannosan in Zibo is relatively smooth, with an initial concentration of 2.38 ± 0.19 ng m−3 at 08:00 LST, and decreases to 2.28 ± 0.18 ng m−3 at 16:00 LST. Galactosan in all three cities exhibited a congruent diurnal trend to the other anhydro-saccharides, characterized by a daytime decrease. For instance, galactosan concentrations in Zibo declined from a peak of 4.60 ± 0.38 ng m−3 at 08:00 LST to 4.00 ± 0.33 ng m−3 at 16:00 LST. In Changzhou, the galactosan concentration was 2.65 ± 2.39 ng m−3 at 08:00 LST, and it dropped to 1.79 ± 0.30 ng m−3 at 16:00 LST. In Hong Kong, the galactosan concentration decreased from 1.08 ± 0.09 ng m−3 at 08:00 LST to 0.67 ± 0.06 ng m−3 by 16:00 LST. The concentration and compositional characteristics of organic aerosols in real atmospheric environments are governed by a combination of factors, including the intensity of air pollutant source emissions, variations in meteorological conditions, atmospheric chemical reactions, atmospheric diffusion capabilities, and deposition processes. These interrelated influences collectively impart high complexity and uncertainty to both the concentration levels and chemical composition of organic aerosols (Chen et al., 2022; Kim et al., 2017; Zhang et al., 2013). However, relative concentration is a more effective indicator for detecting the loss of organic species particles. In addition, previous studies have indicated that the ratio of levoglucosan to potassium ions (K+) from BB sources () is an effective indicator of the aging degree of BB aerosols (Cheng et al., 2013; Li et al., 2021; Mochida et al., 2010). Therefore, to investigate the diurnal decay pattern of anhydro-saccharides, we selected to examine the decay of anhydro-saccharides. As shown in Fig. 2, the diurnal variations of in the three cities also exhibit a decreasing trend from 08:00 to 16:00, providing a key basis for the subsequent calculation of the decay rate of anhydro-saccharides. Furthermore, the utilization of this ratio can effectively eliminate the confounding effects of boundary layer dynamics (e.g., diurnal variations in mixing height and vertical diffusion), since both anhydro-saccharides and K are derived from biomass burning and thus subject to the same boundary layer-driven dilution processes. In Zibo and Changzhou, the K concentrations were calculated using Eqs. (2)–(7), and the results showed that K accounted for 93.4 % and 91.4 % of the total K+, respectively, thus biomass burning as the major source of K+ in PM2.5 during the sampling campaign. Correlation analysis results showed a significant positive correlation between levoglucosan and K across different sites (as shown in Fig. S3). In Zibo, the Pearson correlation coefficients between levoglucosan, mannosan, and galactosan with K were 0.65, 0.52, and 0.52, respectively. In Changzhou, the Pearson correlation coefficients between levoglucosan, mannosan, and galactosan with K were 0.76, 0.58, and 0.54, respectively, further confirming the validity and reliability of the K calculation formulas for Zibo and Changzhou.
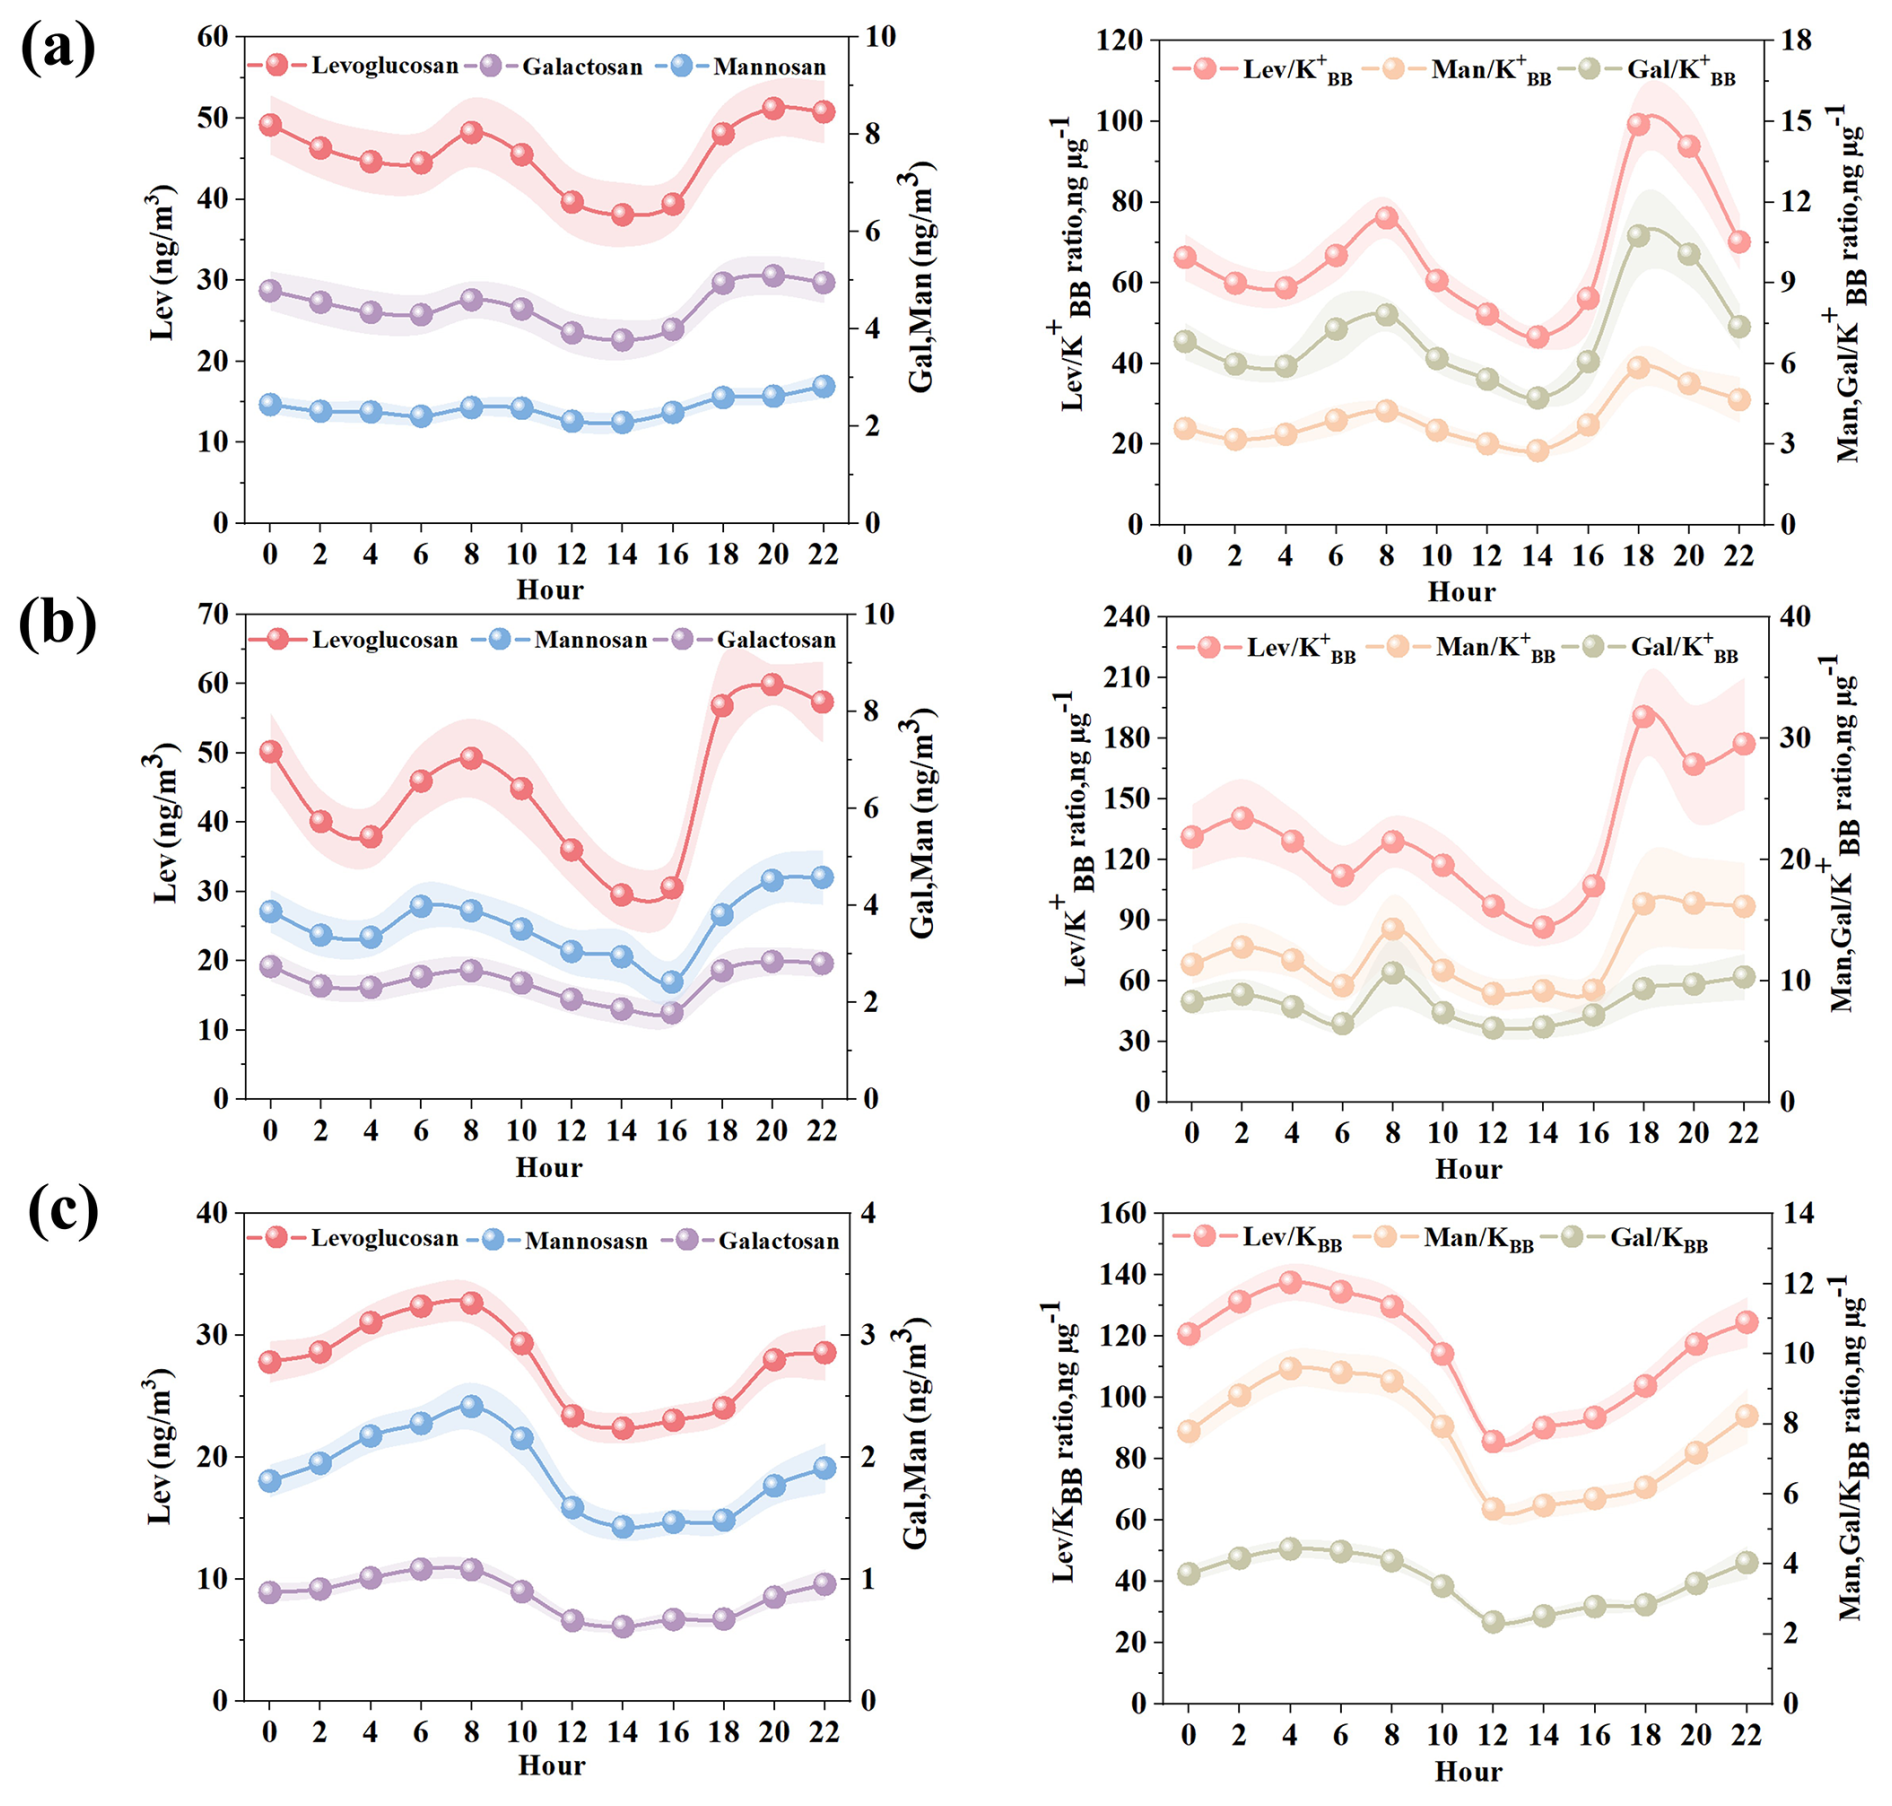
Figure 2Diurnal variations of levoglucosan, mannosan, and galactosan (left column); , , and ratios (right column) at (a) Zibo, (b) Changzhou and (c) Hong Kong.
The detailed time series of anhydro-saccharides and K for the three cities is presented in Fig. S4. Overall, the concentrations of anhydro-saccharides and K in these three locations exhibit a synchronous increase and decrease trend, verifying the similarity in their sources. From Fig. S4a and b, it is evident that the concentrations of anhydro-saccharides and K in Zibo and Changzhou exhibit frequent spikes within a short time frame, aligning with the characteristics of concentrated emissions associated with open burning of straw during the autumn and winter seasons in these regions. Such combustion under high temperatures and strong oxygen supply conditions generates a higher proportion of levoglucosan (Chen et al., 2017; Cheng et al., 2013; Fabbri et al., 2009). Additionally, Zibo, as a typical heavy industrial city, experiences biomass combustion emissions that are influenced by the incomplete combustion processes of industrial burning and residential heating with coal at low temperatures, leading to higher concentrations of galactosan compared to mannosan (Haque et al., 2022; Yan et al., 2018). These factors collectively enhance the chemical characteristic differences between Zibo and other sites. In contrast, Fig. S4c shows that the time series from Hong Kong displays stable fluctuations in the concentrations of anhydro-saccharides and K, without frequent sudden peaks. This aligns with the biomass burning pattern in this region, primarily relying on residential cooking and small-scale commercial activities (such as wood and kitchen waste) (Lee et al., 2013; Leung et al., 2024). The biomass burning sources in Hong Kong are characterized by low emission intensity and a sustained, dispersed release process. The regional characteristics of these three cities provide important background and data support for subsequent analyses of the daytime decay rates of anhydro-saccharides, aiding in the deeper understanding of their sources and variations under different environmental conditions, thereby laying the foundation for developing relevant pollution control strategies and optimization plans.
3.3 Daytime Decay Rate Calculation
Using Eq. (8), we calculated the daytime decay rates of anhydro-saccharides in the three cities. The decay rate of levoglucosan in Changzhou was 0.13 ± 0.05 h−1 (range: 0.01–0.55 h−1), ranking first among the three cities, indicating a significant decay rate. The decay rates of levoglucosan in Zibo and Hong Kong were similar, with values of 0.10 ± 0.08 h−1 (range: 0.001–0.34 h−1) and 0.10 ± 0.05 h−1 (range: 0.02–0.25 h−1), respectively. However, Hong Kong had the fastest decay rates for the other two anhydro-saccharides, especially galactosan, with a decay rate of 0.15 ± 0.06 h−1 (range: 0.04–0.33 h−1), much higher than the other cities. In comparison, Changzhou's galactosan decay rate was 0.13 ± 0.08 h−1 (range: 0.01–0.67 h−1), and Zibo's galactosan decay rate was 0.10 ± 0.03 h−1 (range: 0.004–0.31 h−1), both of which were relatively smaller. Similarly, the decay rate of mannosan in Hong Kong was the highest, reaching 0.14 ± 0.05 h−1 (range: 0.04–0.29 h−1), followed by Changzhou at 0.13 ± 0.07 h−1 (range: 0.01–0.60 h−1), while Zibo had the lowest rate at only 0.09 ± 0.03 h−1 (range: 0.01–0.33 h−1). The detailed decay rates of anhydro-saccharides for the three cities are presented in Table S5. Based on the distribution of decay rates in the three cities shown in Fig. 3, the average decay rate of levoglucosan in Changzhou is higher than in the other two cities, with 33.3 % of the rates exceeding 0.15 h−1. In contrast, the proportions for Zibo and Hong Kong are 12.9 % and 13.0 %, respectively. Moreover, Hong Kong shows a remarkable distribution of decay rates for mannosan and galactosan, with 37.7 % of mannosan decay rates and 37.7 % of galactosan decay rates exceeding 0.15 h−1. These results indicate that in the three cities, Changzhou exhibits the highest average decay rate for levoglucosan, while Hong Kong shows the highest decay rates for mannosan and galactosan, and Zibo has the lowest decay rates for all three sugars.
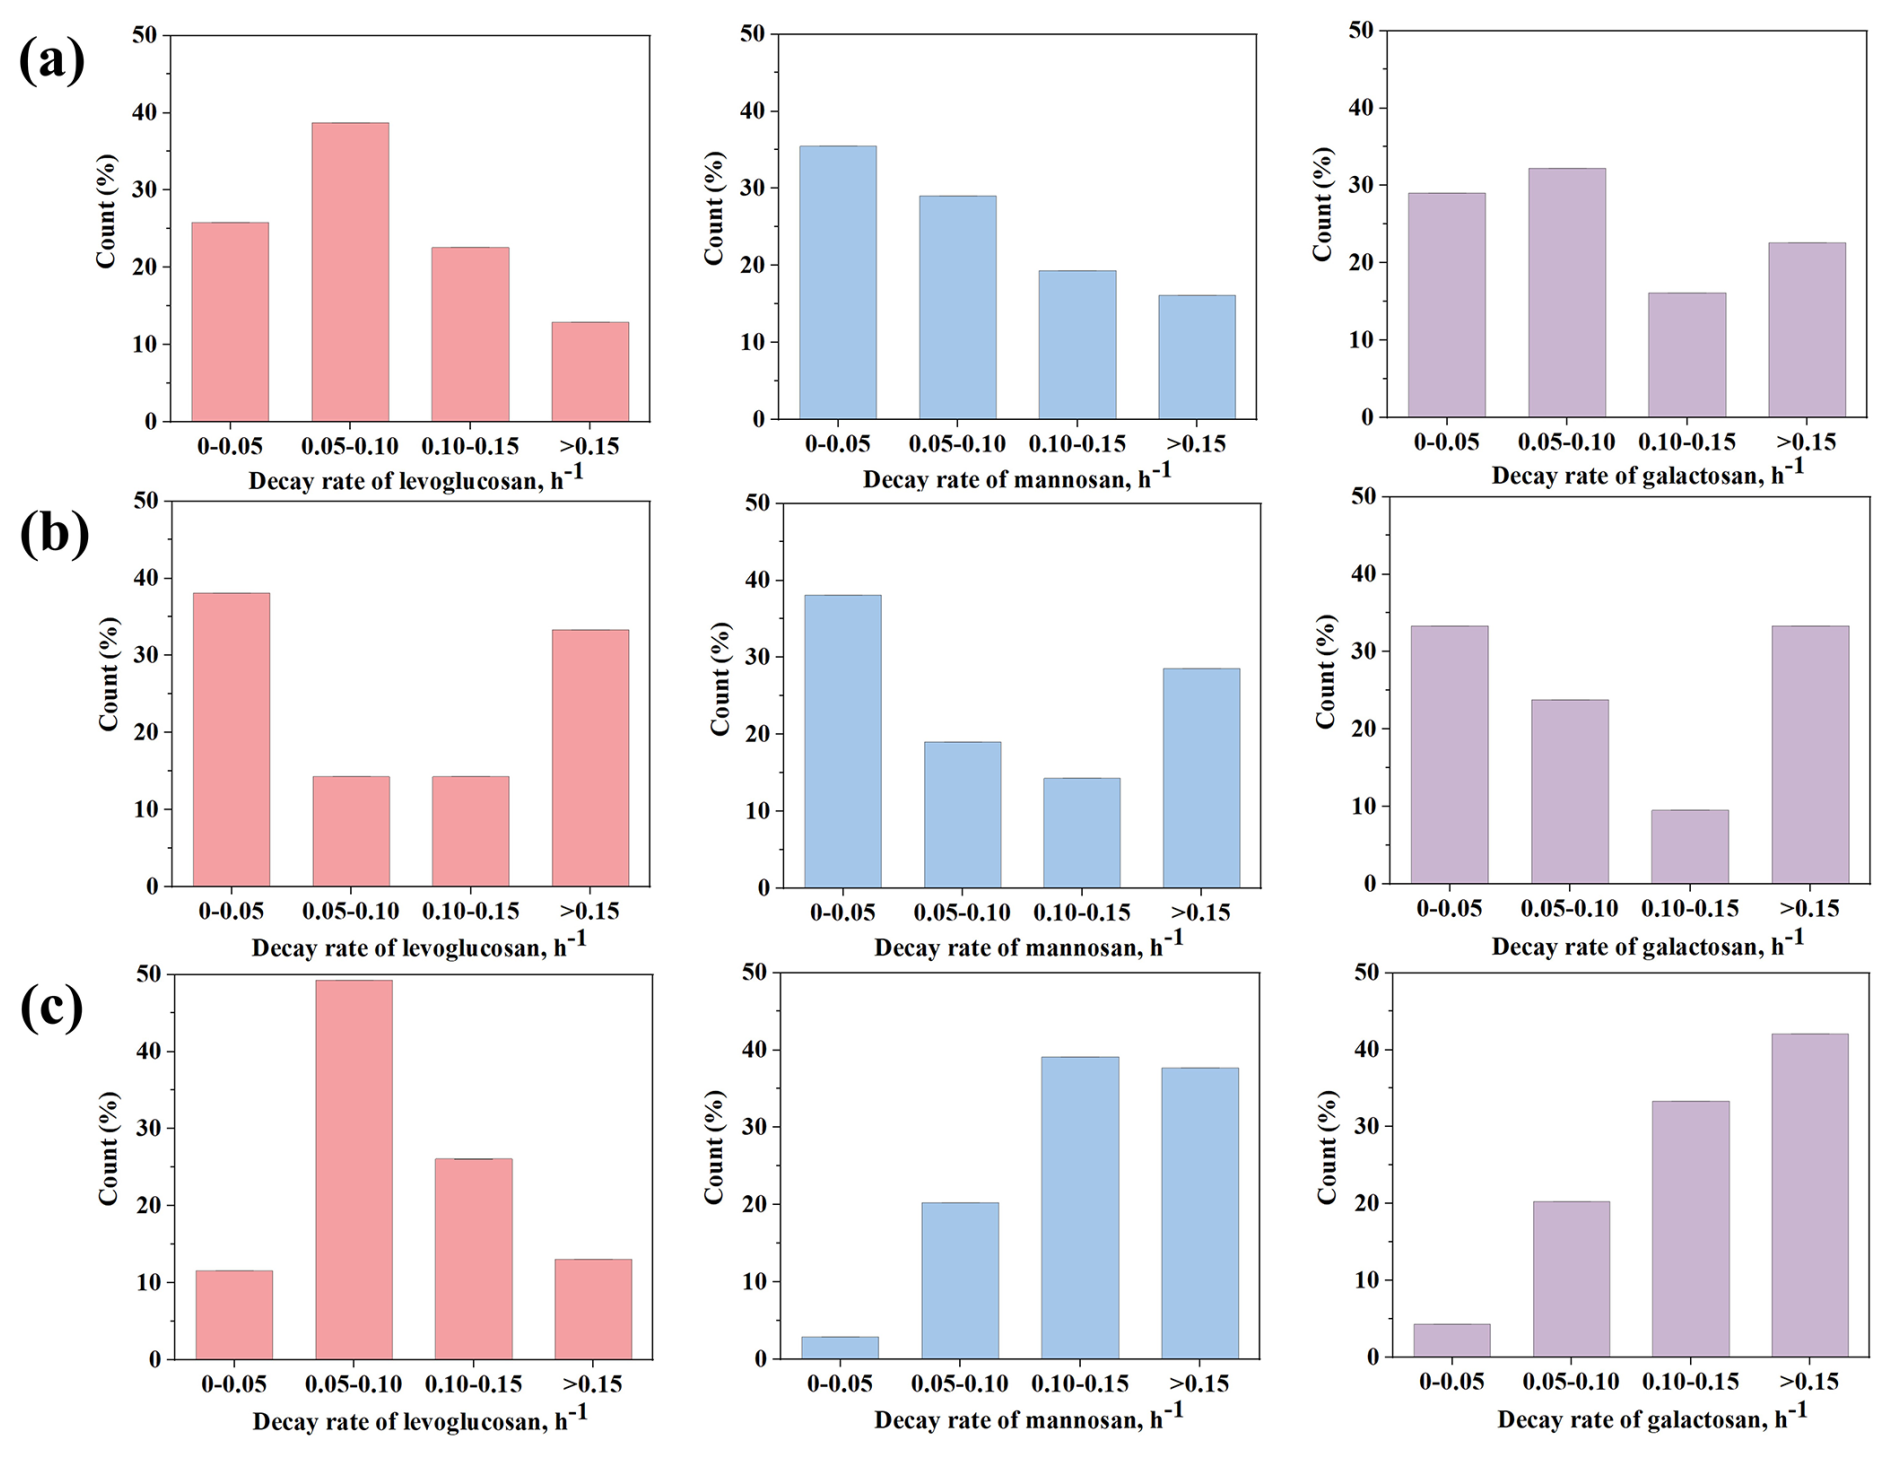
Figure 3Distribution of the decay rates of levoglucosan, mannosan and galactosan for (a) Zibo, (b) Changzhou and (c) Hong Kong.
Figure 4 shows examples of linear fitting in the three cities, with the x axis representing five time points: 08:00, 10:00, 12:00, 14:00 and 16:00 each day, and the y axis representing , with the slope equal to k. In such a short time frame (approximately 8 h), the combustion conditions of burning plants and biomass sources are expected to remain relatively constant, making the influence of source emissions on the changes in normalized sugar concentration negligible. The obtained k values can be regarded as the average daytime decay rate for the day of observation. However, the observational data for certain days do not conform to the linear decay pattern. This phenomenon is primarily attributed to factors such as interference from fresh emissions and changes in air mass origins, which cannot be directly ascertained based solely on ground-based observations. The presence of invalid data during the fitting process does not contradict the research hypothesis; it merely reflects the complexity of real ambient conditions. During the observation period, each day was characterized by distinct biomass burning (BB) emission intensities (or the absence of BB emissions), accompanied by varying meteorological conditions and oxidant levels. For days with poor fitting performance or negative values of the rate constant k, this only indicates that the combination of atmospheric conditions on those days violated the core assumptions underlying Eq. (8). The method employed in this study is only applicable to specific scenarios that satisfy the fundamental assumptions, and the two-hourly measurement data enabled us to sample the target compounds under a wide range of diurnal ambient conditions. The fitting results for the three cities are as follows: Zibo sampled for a total of 67 d, with 31 d fitting the linear decay pattern (46 %); Changzhou sampled 45 d, with 21 d fitting the linear decay pattern (47 %); and Hong Kong sampled 106 d, with 69 d fitting the linear decay pattern (65 %). The proportion of days in Hong Kong that could be linearly fitted is significantly higher than that in Zibo and Changzhou. This outcome may be closely related to the differences in climatic conditions and burning practices across regions.
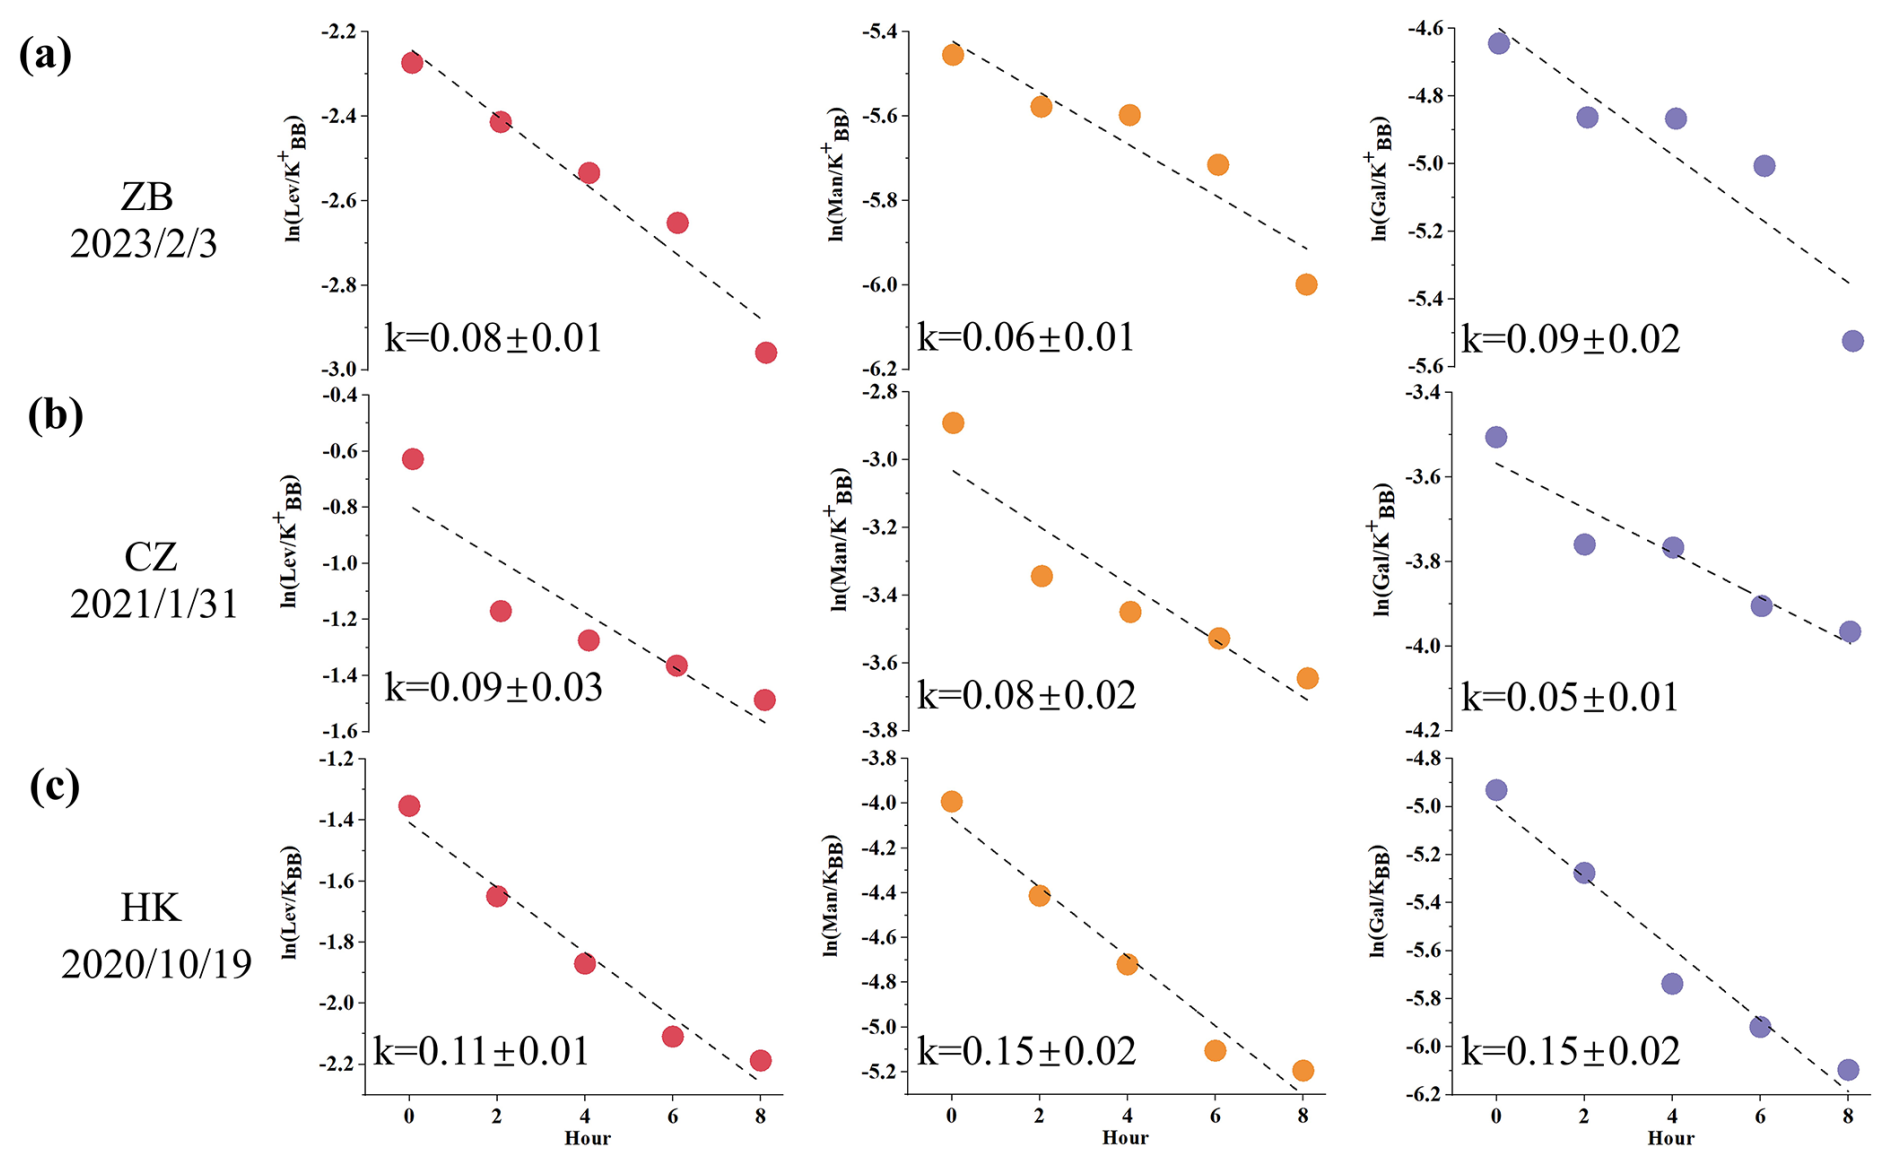
Figure 4Example calculation of the degradation rates of levoglucosan, mannosan and galactosan at (a) Zibo, (b) Changzhou and (c) Hong Kong.
The analysis in Fig. S4 indicates that both Zibo and Changzhou experience frequent outdoor straw burning activities in autumn and winter, where continuous fresh emissions release substantial amounts of anhydro-saccharides and other biomass combustion tracers into the atmosphere. The emission rates of these tracers within an 8 h window far exceed the natural diffusion and chemical degradation rates of pollutants, disrupting the stable concentration changes required for linear decay, ultimately resulting in fitting failures. Furthermore, we compared the concentrations of atmospheric oxidants (Ox) on successful and unsuccessful fitting days. The results show that the mean concentrations of atmospheric oxidants on successful fitting days are higher across all three cities compared to unsuccessful fitting days. Specifically, the atmospheric oxidant concentration on successful fitting days in Zibo was 41.2 ± 8.5 ppb (range: 24.2–61.8 ppb), while it was 37.6 ± 7.8 ppb (range: 17.9–65.7 ppb) on unsuccessful fitting days. In Changzhou, the concentration for successful days was 46.1 ± 13.0 ppb (range: 21.6–81.8 ppb), compared to 44.3 ± 10.6 ppb (range: 14.6–60.8 ppb) on unsuccessful days. In Hong Kong, successful fitting days showed an atmospheric oxidant concentration of 31.9 ± 6.3 ppb (range: 19.7–53.4 ppb), while the concentration on unsuccessful days was 27.8 ± 6.8 ppb (range: 14.9–42.0 ppb). These results suggest that the relative deficiency of atmospheric oxidants may also be a significant factor preventing the concentration of anhydro-saccharides from exhibiting a clear linear decay pattern. To mitigate the bias arising from days with unsuccessful fitting, this study exclusively retained days characterized by positive decay rates and a coefficient of determination (R2>0.5) for the estimation of decay rates and subsequent generalized additive model (GAM) analysis. The inclusion of such poorly fitted data points would artificially depress the average rate constant k, thereby potentially resulting in an underestimation of the authentic degradation rate.
The three anhydro-saccharides exhibit differences in their molecular structures, particularly concerning the C–H bonds situated at various positions on the sugar rings. This results in variations in the reaction potential of hydroxyl radicals (•OH) with each sugar molecule. In the same city, all three sugars undergo oxidation by •OH radicals. We conducted a correlation analysis of the decay rates of these anhydro-saccharides across different cities. As illustrated in Fig. S5, there is a strong correlation among the decay rates of anhydro-saccharides in the three cities. This suggests that despite the differences in molecular structures, the oxidation mechanisms involving •OH are similar, accounting for the high correlation between their decay rates. The differences in decay rates for the three anhydro-saccharides in the same city may also relate to bond dissociation enthalpy (BDE). According to St. John et al. (2020a and b), the BDE of levoglucosan, mannosan, and galactosan can be estimated using the accurate bond dissociation enthalpy tool (ALFABET) available online (https://bde.ml.nrel.gov/, last access: 21 October 2025). The findings indicate that the C–H bonds that are most susceptible to breakage in levoglucosan, mannosan, and galactosan are predominantly located at positions 2 and 3, with corresponding BDE of 85.3–86.9, 84.6–85.1, and 82.9–84.6 kcal mol−1, respectively. This implies that the decay rates of the three anhydro-saccharides should follow the order: galactosan > mannosan > levoglucosan (St. John et al., 2020a, b). However, this trend was only observed in Hong Kong and Changzhou. Hence, besides bond dissociation enthalpy (BDE), there should be other influencing factors affecting the decay rates. Section 3.4 provides a detailed exploration of the environmental factors that influence the decay rates of anhydro-saccharides, with a particular focus on Zibo.
3.4 Driving factors of the decreasing rate of anhydro-saccharides
The three sampling sites represent cities with distinct meteorological conditions. Zibo has a temperate monsoon climate, characterized by cold and dry winters. In contrast, Changzhou falls under the subtropical monsoon climate, with winters being more humid than those in Zibo. Although Hong Kong also has a subtropical monsoon climate, it is significantly influenced by the oceanic climate, resulting in smaller temperature variations and a more humid winter. The differences in climate conditions indirectly lead to variations in environmental factors, which in turn affect the daytime degradation rate of anhydro-saccharides across different cities. Therefore, we compared the environmental factors of the three cities with the calculated degradation rates of anhydro-saccharides. These factors include ALWC related to liquid-phase reactions, the atmospheric oxidative capacity indicator Ox, solar surface radiation (SSR), relative humidity (RH) and temperature (T). Due to the lack of data on gas-phase anhydro-saccharides, the gas-phase oxidation part was not discussed in this study.
As an indicator of the total amount of various oxidants in the atmosphere, Ox is used in this study to explore its impact on the daytime degradation rate of levoglucosan. As shown in Fig. 5b, the Ox concentration in Changzhou is higher than in the other two cities, with an average value of 45.1 ± 11.8 ppb (range: 14.6–81.8 ppb). In contrast, Ox levels in Zibo (39.6 ± 8.3 ppb) are slightly lower than Changzhou but much higher than that in Hong Kong (31.9 ± 6.3 ppb). Hoffmann et al. (2010) reported that the reaction of levoglucosan with •OH is a major degradation pathway, and model calculations indicate that levoglucosan is more readily oxidized by •OH during the daytime. The average degradation flux during the winter daytime is 4.7 ng m−3 h−1 (Hennigan et al., 2010). On the other hand, solar surface radiation (SSR), the key parameter for daytime •OH production, showed similar levels in Changzhou and Hong Kong. The average solar radiation in Changzhou is 381.7 ± 165.6 W m−2 (range: 147.3–779.0 W m−2), while Hong Kong records 354.0 ± 108.1 W m−2 (range: 133.7–547.0 W m−2). Zibo, by contrast, is markedly lower at 273.6 ± 81.8 W m−2 (range: 79.8–427.1 W m−2). Slade and Knopf (2014) reported that the presence of water can reduce particle viscosity, thereby enhancing •OH oxidation (Slade and Knopf, 2014). Therefore, the higher degradation rate of levoglucosan in Changzhou compared to the other two cities may reflect stronger •OH oxidation. As illustrated in Fig. 5b, Changzhou exhibits the highest ALWC among the three cities, averaging 15.6 ± 15.5 µg m−3 (range: 0.4–56.5 µg m−3). Zibo follows closely at 13.4 ± 15.4 µg m−3 (range: 0.7–55.7 µg m−3), while Hong Kong records the lowest levels at 6.4 ± 8.9 µg m−3 (range: 0.2–39.7µg m−3). Furthermore, Slade and Knopf (2014) noted that an increase in relative humidity accelerates the heterogeneous oxidation rate of levoglucosan (Slade and Knopf, 2014). The relative humidity in Hong Kong is significantly higher than in the other two cities, with an average of 52.8 ± 13.0 % (range: 15.8 %–88.0 %). Zibo has the lowest relative humidity, with an average of 41.2 ± 16.4% (range: 18.4 %–89.8 %), while Changzhou has an average relative humidity of 48.9 ± 19.2 % (range: 20.4 %–80.2 %). When the relationship between the response variable and explanatory variables is unclear, the generalized additive model (GAM) can be used to fit the explanatory and response variables by plotting smooth functions, further assessing their linear or nonlinear relationship (Shrestha, 2020; Stone, 1985; Xiao et al., 2018). In this study, we incorporated the calculated effective decay days into the GAM model. The daytime degradation rate of anhydro-saccharides calculated for the three cities was used as the response variable in the GAM model, and the various influencing factors (Ox, ALWC, SSR, RH and T) were used as the corresponding explanatory variables. Additionally, the model's accuracy was assessed by examining the R2, p-values, and deviance explained (DE). The corresponding GAM is expressed as Eqs. (10)–(12). Notably, this study used the natural logarithmic function of the ratio of anhydro-saccharides to K for linear fitting to analyze and calculate the degradation rate of anhydro-saccharides. This ratio effectively mitigates the interference of boundary layer dynamical processes, such as diurnal variations in mixing layer height and atmospheric vertical diffusion, which are meteorological dilution effects. The underlying principle is that both anhydro-saccharides and K originate from biomass combustion and are subject to the same physical dilution effects driven by boundary layer processes during atmospheric transport. Consequently, their ratio can cancel out these physical effects on the concentration of individual species. Thus, the degradation rates included in the GAM model have removed the contributions from meteorological physical dilution effects, reflecting solely the intrinsic chemical degradation process of anhydro-saccharides.
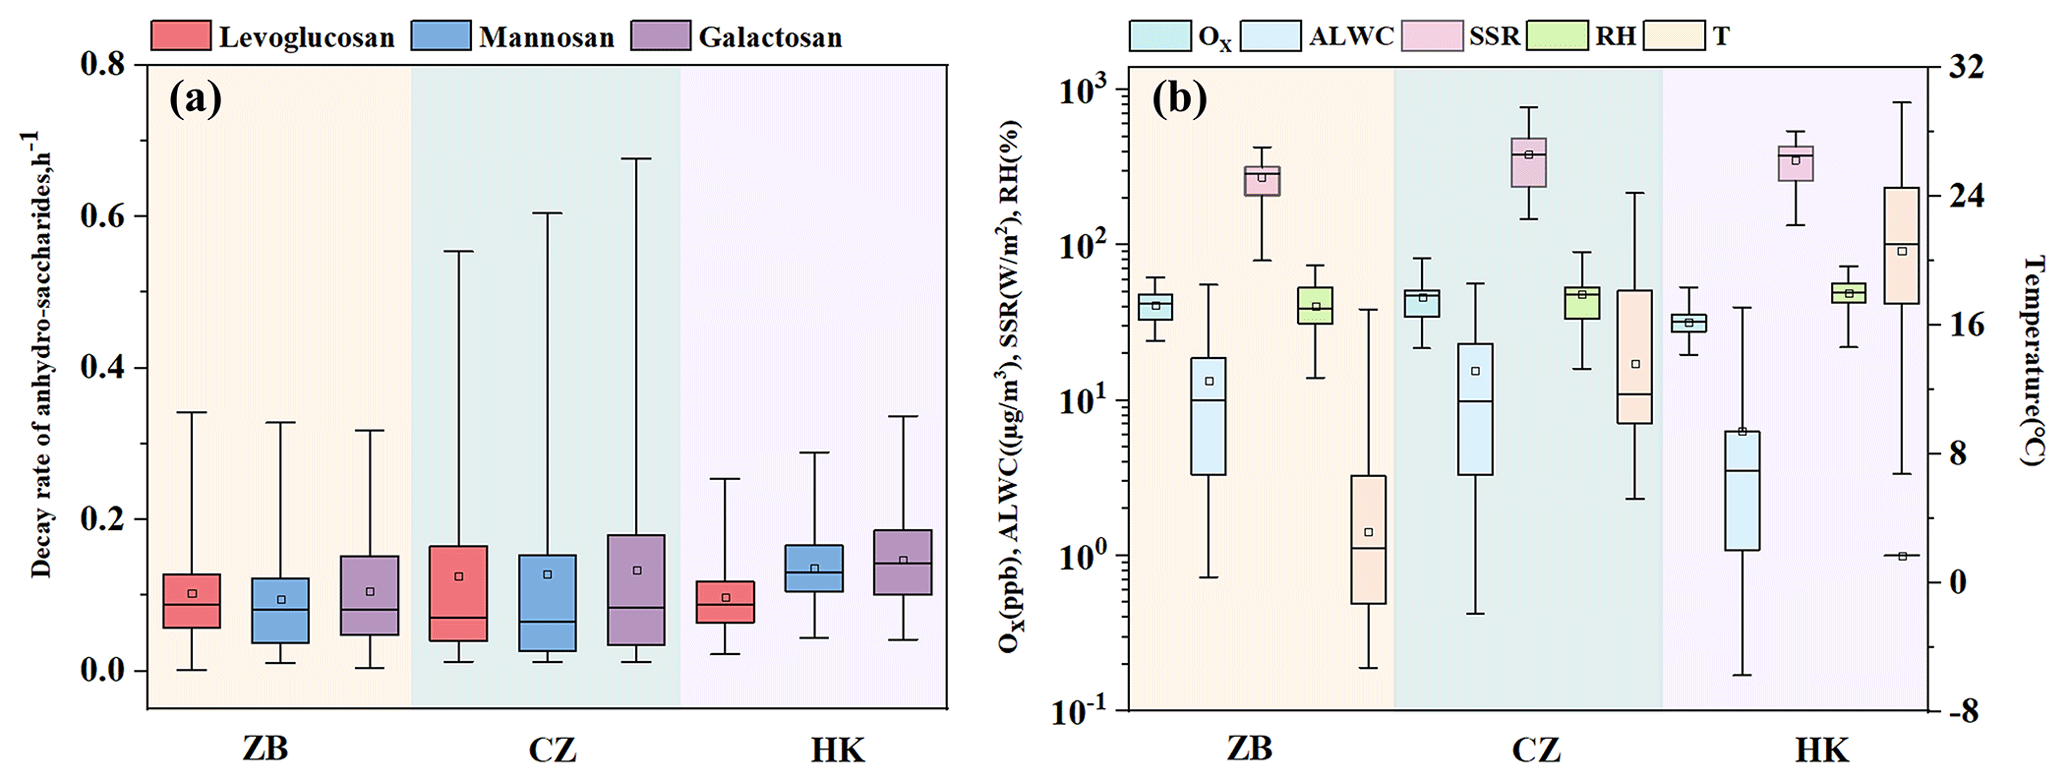
Figure 5Comparison of environmental factors and decay rates across the three cities: (a) decay rates of levoglucosan, mannosan and galactosan, (b) Ox, ALWC, SSR, RH and T.
In the equations, β represents the model intercept, while s(i) denotes the smooth function corresponding to each influencing factor. Table S6 presents the relevant parameters of the GAM smooth functions, including effective degrees of freedom (Edf), reference degrees of freedom (Ref.df), F-statistic (F), and p-value (p). These parameters are used to reflect the strength and significance of the nonlinear associations between each influencing factor and the degradation rate of anhydro-saccharides.
To avoid the potential impact of multicollinearity among variables on the stability of model fitting and the accuracy of parameter estimates, this study performed a multicollinearity assessment on the explanatory variables using the variance inflation factor (VIF) prior to conducting the GAM analysis. A high VIF value points to strong multicollinearity between a given explanatory variable and the remaining explanatory variables; specifically, a VIF value exceeding 4 denotes the existence of significant multicollinearity in regression analysis (Shrestha, 2020; Xiao et al., 2018). The results of the multicollinearity test are presented in Table S7, where the VIF for all explanatory variables is less than 4, indicating that they successfully passed the multicollinearity assessment. The validation results of the GAM model are shown in Fig. S6. From the residual Q–Q plot (Fig. S6a), it can be observed that most of the data points approximately follow a straight line, indicating that the residuals of the GAM model generally follow a normal distribution. Figure S6b shows the scatter plot of the residuals versus the model's predicted values, which indicates that the residuals are randomly distributed. The residual histogram (Fig. S6c) demonstrates a rough symmetric distribution. Additionally, Fig. S6d reveals that the observed values closely follow the “1:1” line, indicating a good fit between the observed and fitted values. These results confirm that the GAM model provides a good fit for the daytime attenuation rate of levoglucosan.
The analysis results from the GAM model for the decay rate of levoglucosan are shown in Table S6. The adjusted R2 between the observed and estimated values was 0.66, with a bias explanation rate of 65.8 %. The daytime decay rate of levoglucosan significantly increased with the rise in ALWC (p<0.05). As shown in Fig. 6a, especially ALWC > 30 µg m−3, the decay rate increased as ALWC increased, indicating that ALWC is an important factor affecting the daytime decay rate. This result is consistent with the findings of Slade and Knopf (2014), which suggest that liquid-phase reactions reduce the viscosity of levoglucosan particles, allowing for easier absorption of •OH and accelerating the daytime decay process (Slade and Knopf, 2014). We also find that the decay rate significantly increased with temperature (T) (p<0.05). However, temperature exerts a modest positive contribution to the decay rate when T<10 °C. In contrast, when T>10 °C, the decay rate increases markedly, indicating that the rise in temperature affects the decay rate. An increase in temperature generally accelerates the molecular thermal motion, elevates the collision frequency between reactive radicals (e.g., •OH and •SO) with anhydro-saccharides molecules, and thereby facilitates the occurrence of oxidative degradation reactions (Bai et al., 2013; Lai et al., 2014). During the daytime, temperature increases are usually accompanied by high solar surface radiation intensity; their synergistic effects can significantly promote atmospheric photochemical reactions and the generation of reactive radicals, thus accelerating the degradation of anhydro-saccharides (Bai et al., 2013; Wennberg, 2006). Additionally, the decay rate significantly increased with the rise of Ox (p<0.05). As shown in Fig. 6a, the decay rate almost increased linearly with Ox. When the Ox>80 ppb, the decay rate is higher than 0.1 h−1, suggesting that oxidants become the key driving factor for the attenuation reaction under this condition. This study also found that relative humidity (p= 0.08) and SSR (p= 0.12) did not significantly affect the decay rate. However, Fig. 6a shows that both are positively correlated with the daytime decay rate of levoglucosan, especially RH > 60 %, which nearly increases linearly. Although SSR did not show a significant upward trend when it was less than 400 W m−2, when SSR exceeded 400 W m−2, the decay rate increased with the rise in SSR, suggesting that SSR still has some effect on the decay rate. Further univariate GAM tests showed that, after excluding the interference of other variables, RH and SSR were significantly positively correlated with the daytime decay rate of levoglucosan (p<0.05). This difference may arise from the weak correlation between RH and SSR and other variables, which was partially masked in the multivariable model. Additionally, the multivariable model had lower statistical power to test individual variables, potentially failing to identify effects that were close to the significance level. The other two anhydro-saccharides, mannosan and galactosan, exhibited similar characteristics to levoglucosan with respect to ALWC, RH, Ox, and SSR. As shown in Fig. 6b and c, when temperature (T) < 10 °C, the positive contribution of temperature to the decay rates of mannosan and galactosan was greater than levoglucosan. This indicates that although all three are anhydro-saccharides derived from biomass burning and their decay processes are generally regulated by similar environmental factors, mannosan and galactosan are more sensitive to temperature, likely attributed to differences in chemical stability induced by variations in their molecular structures. Hong Kong has the highest average temperature among the three cities, which may explain why the daytime degradation rates of mannosan and galactosan are higher in Hong Kong than in the other two cities.
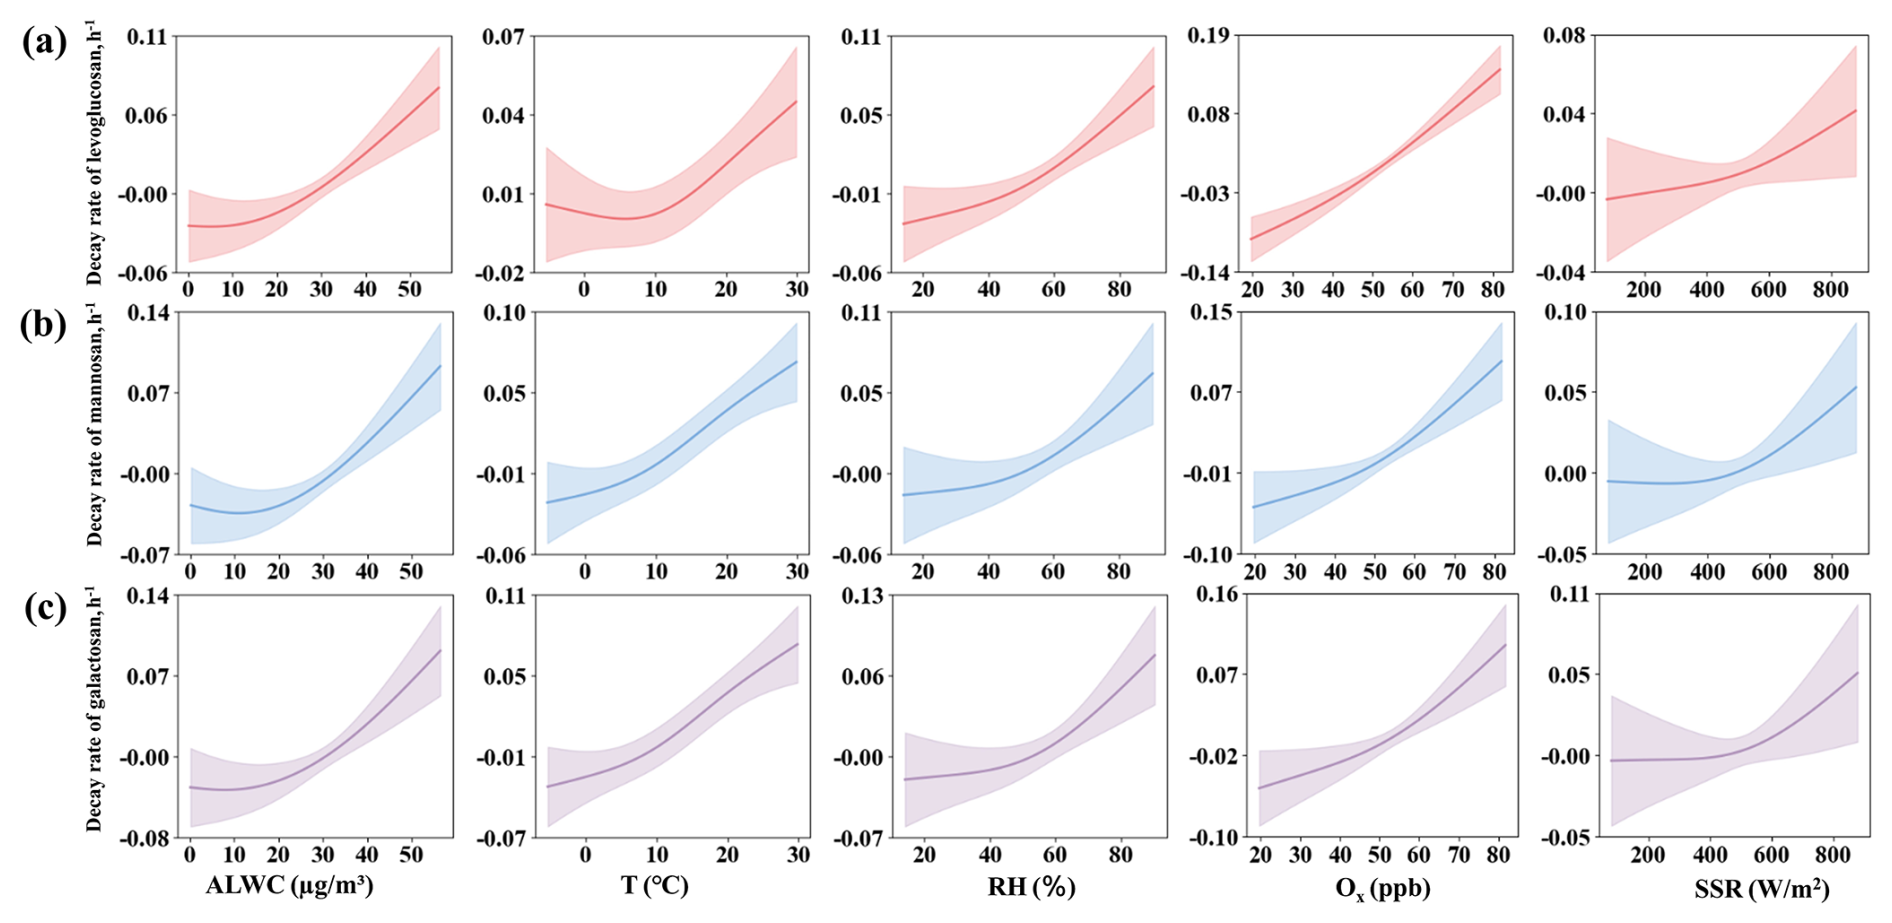
Figure 6Influences of various factors on the daytime degradation rates of different saccharides analyzed using the GAM model: (a) levoglucosan, (b) mannosan, and (c) galactosan, as a function of ALWC, T, RH, Ox, and SSR. (The solid lines in each subplot represent the partial dependence trends of the saccharide degradation rates with respect to the corresponding factors. The shaded areas indicate the 95 % confidence bands, reflecting the uncertainty of the model predictions at a 95 % confidence level).
As shown in Fig. 6, ALWC, RH, and Ox are the three factors that contribute most to the degradation rate of anhydro-saccharides. Therefore, we plotted these factors against the degradation rate to better explore their relationship. As illustrated in Fig. 7, overall, all three factors show a positive correlation with the levoglucosan degradation rate. Specifically, as the concentration of Ox increases, relative humidity (RH) rises, and the liquid water content (ALWC) increases, the degradation rate of levoglucosan tends to increase. In contrast, when the levels of these three factors are relatively low, the degradation rate generally remains in a lower range, further confirming that these factors play a prominent role in the degradation process of levoglucosan.
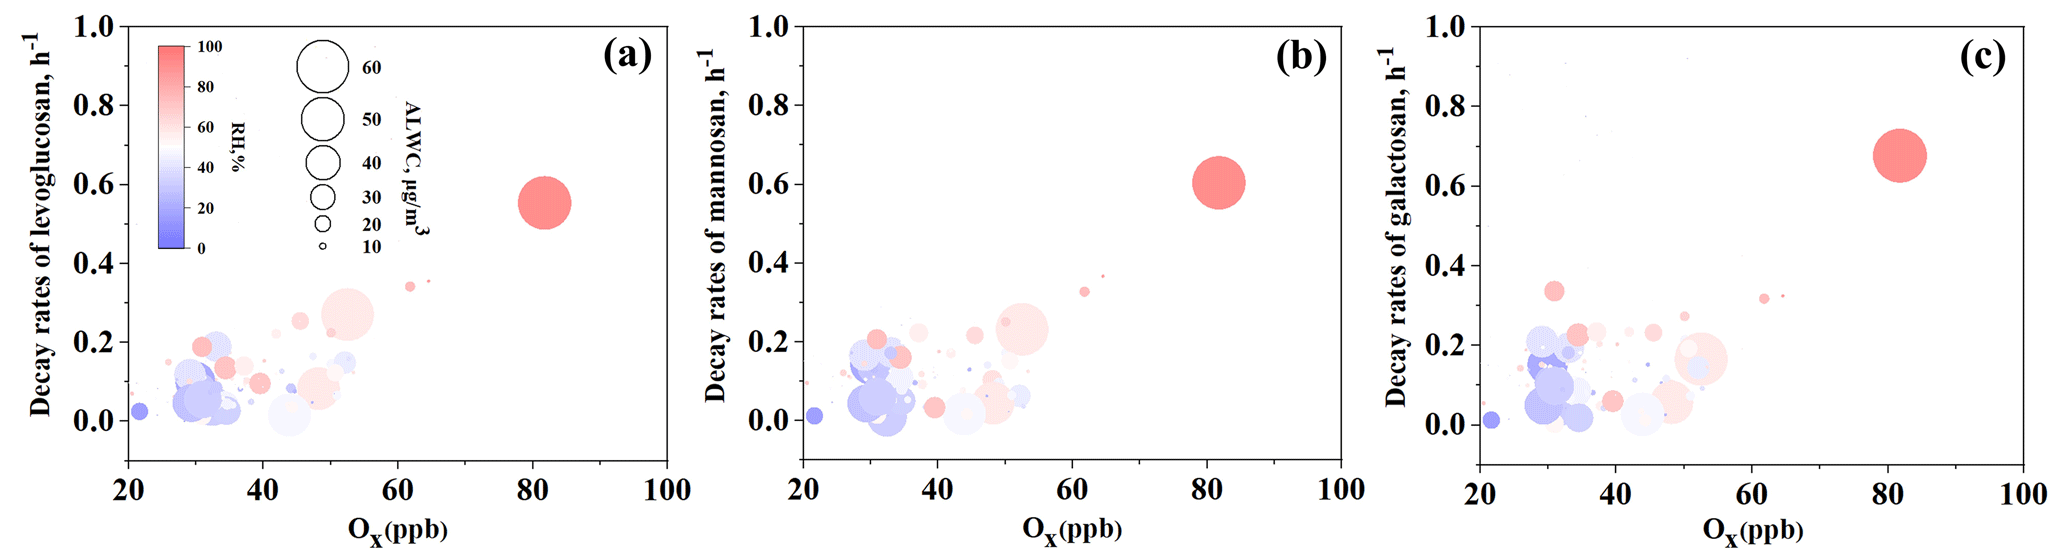
Figure 7Relationships between decay rates of (a) levoglucosan, (b) mannosan, and (c) galactosan with Ox, RH, and ALWC.
Based on the results from the GAM model, we separately examined the contributions of these five factors to the degradation rates of anhydro-saccharides in Zibo, as shown in Fig. 8. The results indicate that Ox contributes more significantly to the degradation rate of levoglucosan than the other two anhydro-saccharides, while aerosol liquid water content (ALWC) contributes similarly to the degradation rates of mannosan and galactosan, which is significantly higher than that of levoglucosan. These findings demonstrate that the degradation rates of anhydro-saccharides are not only correlated with their structural BDE but also regulated by other driving factors with distinct contribution patterns. Even within the macro atmospheric environment of the same city, microenvironmental differences in the aerosol particles hosting the three anhydro-saccharides can modulate their oxidation processes. For instance, variations in aerosol phase state (e.g., viscosity influenced by RH and T) may affect oxidant diffusion, leading to differential rates, as higher RH in Hong Kong could reduce viscosity and enhance heterogeneous oxidation for mannosan and galactosan (Slade and Knopf, 2014). Additionally, aqueous-phase oxidation (promoted by high ALWC) may dominate in Changzhou, while heterogeneous pathways prevail in lower ALWC sites like Hong Kong, explaining pathway-specific sensitivities beyond BDE (Lai et al., 2014; Slade and Knopf, 2014). Differences in aerosol composition, such as inorganic ions (e.g., SO, NO, NH), further influence ALWC and viscosity; for example, higher sulfate in Zibo may acidify aerosols, potentially slowing certain pathways (Riva et al., 2016a, b). Collectively, the combined effects of multiple driving factors and the differential sensitivities of the three anhydro-saccharides to these factors lead to inconsistent intensities of oxidation pathways (e.g., aqueous-phase oxidation and heterogeneous oxidation), thereby producing the divergent degradation rates observed. This may help explain why the degradation rates of the three anhydro-saccharides in Zibo do not follow the pattern predicted by BDE.
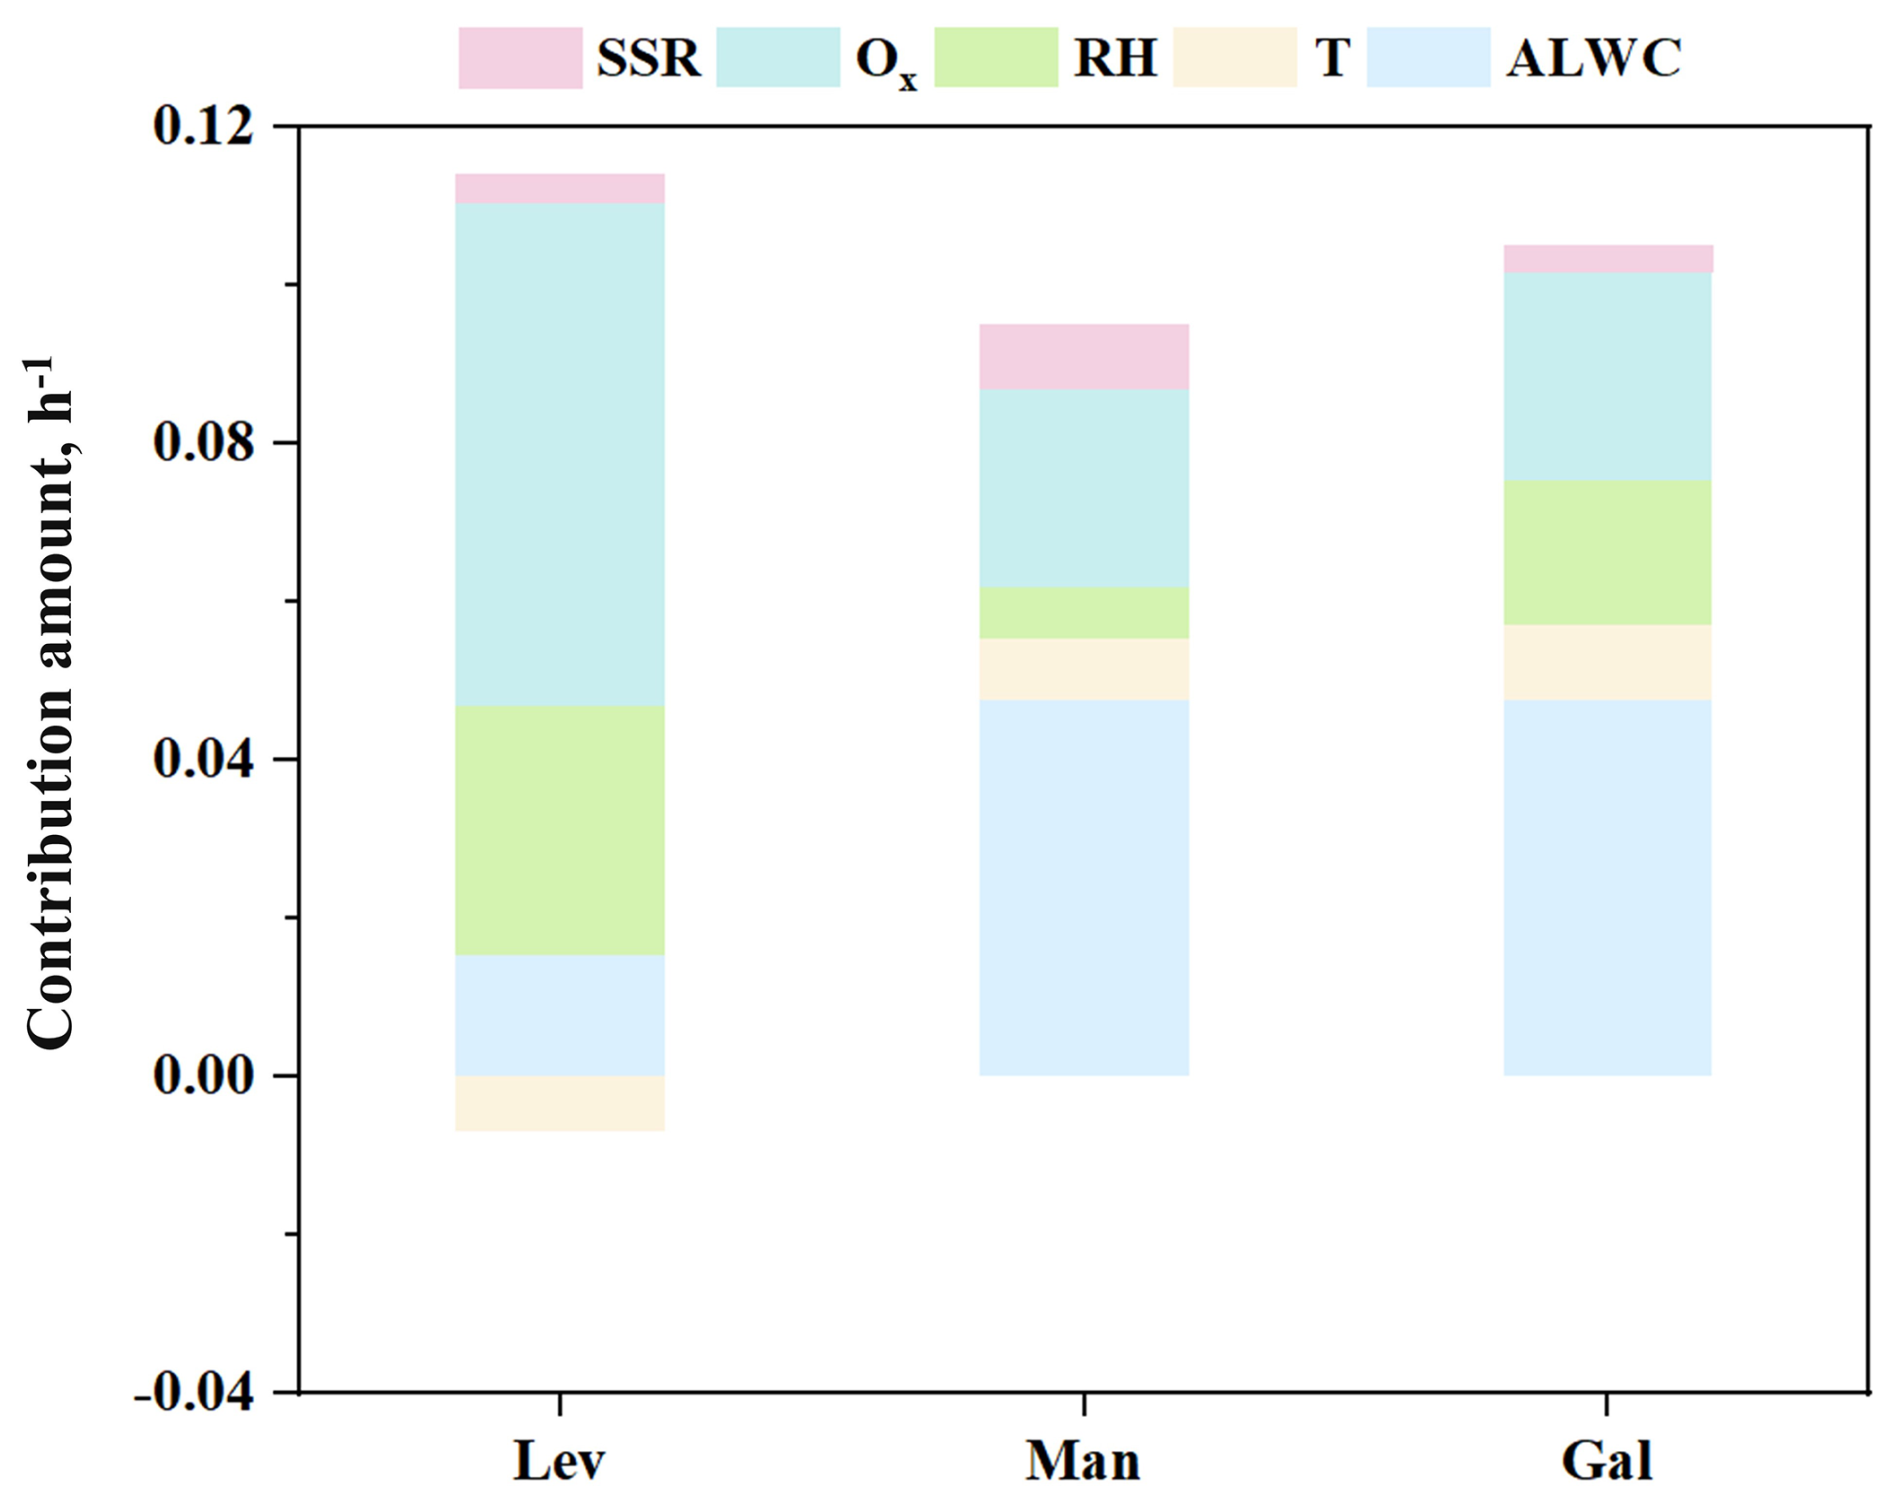
Figure 8Contributions of ALWC, T, RH, SSR and Ox to the decay rates of levoglucosan, mannosan, and galactosan in Zibo.
In conclusion, the analysis results from the GAM model suggest that the daytime decay rate of anhydro-saccharides is influenced by multiple factors, with ALWC, RH, and Ox being the main driving factors. Despite the lack of significance in the effects of T and SSR, they still showed a positive correlation with the decay rate. Given that the sampling times at the three sampling sites in this study were concentrated in the autumn and winter, it is expected that in summer, under conditions of higher Ox, temperature, and SSR, the decay rate of these anhydro-saccharides will significantly increase. Therefore, further investigation into the degradation mechanisms of anhydro-saccharides is crucial for accurately assessing the contribution of BB aerosols to global air quality, particularly in the context of seasonal and environmental changes, and holds significant scientific and practical value.
This study employed a TAG-GC/MS to obtain bihourly time resolution PM2.5-bound anhydro-saccharides (levoglucosan, mannosan, and galactosan) concentrations during the winter season in three typical cities over three regions in China, including Zibo, Changzhou and Hong Kong, located in the NCP, YRD and PRD regions, respectively. The decay rates of levoglucosan, mannosan, and galactosan in the real atmosphere and the driving factors are investigated. Results indicate that levoglucosan had the highest concentration among all the three anhydro-saccharides. In Zibo, the concentration of levoglucosan was 45.5 ± 32.3 ng m−3, higher than Changzhou (45.1 ± 38.7 ng m−3) and Hong Kong (27.5 ± 15.6 ng m−3). The diurnal variation of the three anhydro-saccharides showed a decreasing trend during the daytime (08:00–16:00). We selected K as a reference species and calculated the daytime degradation rates of the three anhydro-saccharides in the three cities using the relative rate constant method. The results indicated that the degradation rate of levoglucosan was highest in Changzhou, at 0.13 ± 0.05 h−1 (range: 0.01–0.55 h−1), while mannosan and galactosan showed the highest degradation rates in Hong Kong, at 0.14 ± 0.05 h−1 (range: 0.04–0.29 h−1) and 0.15 ± 0.06 h−1 (range: 0.04–0.33 h−1), respectively. Due to structural differences, particularly the varying positions of the C–H bond within the sugar ring, the reaction mechanisms of hydroxyl radicals (•OH) with the three sugar molecules differ, leading to variations in the degradation rates of anhydrous sugars within the same city. Environmental factors, such as air quality and climate type, in different cities further contribute to variations in degradation rates. In addition, the differential sensitivity of various anhydro-saccharides to these driving factors leads to differences in the decay rates of the three sugars. The GAM model results indicate that the daytime decay rate of anhydro-saccharides is primarily influenced by ALWC, RH, and Ox. Additionally, increases in T and SSR also contribute to an enhanced decay rate. Our findings highlight that the degradation of anhydro-saccharides in real atmospheric conditions occurs through various oxidative mechanisms. Further investigation into the degradation mechanisms of anhydro-saccharides is crucial for accurately assessing the contribution of BB aerosols to global air quality. The results of this study provide valuable data and insights for future air quality management.
Data will be available upon request to the corresponding authors.
The supplement related to this article is available online at https://doi.org/10.5194/acp-26-3589-2026-supplement.
Conceptualization: LL, JZY, KZ; Formal analysis: BZ, KZ, JZ; Methodology and Investigation: BZ, KZ, QW; Writing – original draft: BZ; Writing – review & editing: KZ, LL, JZY, QW; Funding acquisition and Supervision: LL.
The contact author has declared that none of the authors has any competing interests.
Publisher's note: Copernicus Publications remains neutral with regard to jurisdictional claims made in the text, published maps, institutional affiliations, or any other geographical representation in this paper. The authors bear the ultimate responsibility for providing appropriate place names. Views expressed in the text are those of the authors and do not necessarily reflect the views of the publisher.
This work is supported by the Shanghai Technical Service Center of Science and Engineering Computing, Shanghai University.
This research has been supported by the Jing-Jin-Ji Regional Integrated Environmental Improvement – National Science and Technology Major Project (grant nos. 2025ZD1202005, 2025ZD1202004) and the National Natural Science Foundation of China (grant no. 42375102).
This paper was edited by Sergey A. Nizkorodov and reviewed by three anonymous referees.
Alvi, M. U., Kistler, M., Shahid, I., Alam, K., Chishtie, F., Mahmud, T., and Kasper-Giebl, A.: Composition and source apportionment of saccharides in aerosol particles from an agro-industrial zone in the Indo-Gangetic Plain, Environ. Sci. Pollut. R., 27, 14124–14137, https://doi.org/10.1007/s11356-020-07905-2, 2020.
Arangio, A. M., Slade, J. H., Berkemeier, T., Pöschl, U., Knopf, D. A., and Shiraiwa, M.: Multiphase Chemical Kinetics of OH Radical Uptake by Molecular Organic Markers of Biomass Burning Aerosols: Humidity and Temperature Dependence, Surface Reaction, and Bulk Diffusion, J. Phys. Chem. A, 119, 4533–4544, https://doi.org/10.1021/jp510489z, 2015.
Bai, J., Sun, X., Zhang, C., Xu, Y., and Qi, C.: The OH-initiated atmospheric reaction mechanism and kinetics for levoglucosan emitted in biomass burning, Chemosphere, 93, 2004–2010, https://doi.org/10.1016/j.chemosphere.2013.07.021, 2013.
Bao, M., Zhang, Y.-L., Cao, F., Lin, Y.-C., Wang, Y., Liu, X., Zhang, W., Fan, M., Xie, F., Cary, R., Dixon, J., and Zhou, L.: Highly time-resolved characterization of carbonaceous aerosols using a two-wavelength Sunset thermal–optical carbon analyzer, Atmos. Meas. Tech., 14, 4053–4068, https://doi.org/10.5194/amt-14-4053-2021, 2021.
Chen, G., Canonaco, F., Tobler, A., Aas, W., Alastuey, A., Allan, J., Atabakhsh, S., Aurela, M., Baltensperger, U., Bougiatioti, A., De Brito, J. F., Ceburnis, D., Chazeau, B., Chebaicheb, H., Daellenbach, K. R., Ehn, M., El Haddad, I., Eleftheriadis, K., Favez, O., Flentje, H., Font, A., Fossum, K., Freney, E., Gini, M., Green, D. C., Heikkinen, L., Herrmann, H., Kalogridis, A. C., Keernik, H., Lhotka, R., Lin, C., Lunder, C., Maasikmets, M., Manousakas, M. I., Marchand, N., Marin, C., Marmureanu, L., Mihalopoulos, N., Mocnik, G., Necki, J., O'Dowd, C., Ovadnevaite, J., Peter, T., Petit, J. E., Pikridas, M., Matthew Platt, S., Pokorna, P., Poulain, L., Priestman, M., Riffault, V., Rinaldi, M., Rozanski, K., Schwarz, J., Sciare, J., Simon, L., Skiba, A., Slowik, J. G., Sosedova, Y., Stavroulas, I., Styszko, K., Teinemaa, E., Timonen, H., Tremper, A., Vasilescu, J., Via, M., Vodicka, P., Wiedensohler, A., Zografou, O., Cruz Minguillon, M., and Prevot, A. S. H.: European aerosol phenomenology – 8: Harmonised source apportionment of organic aerosol using 22 Year-long ACSM/AMS datasets, Environ. Int., 166, 107325, https://doi.org/10.1016/j.envint.2022.107325, 2022.
Chen, J., Li, C., Ristovski, Z., Milic, A., Gu, Y., Islam, M. S., Wang, S., Hao, J., Zhang, H., He, C., Guo, H., Fu, H., Miljevic, B., Morawska, L., Thai, P., Lam, Y. F., Pereira, G., Ding, A., Huang, X., and Dumka, U. C.: A review of biomass burning: Emissions and impacts on air quality, health and climate in China, Sci. Total Environ., 579, 1000–1034, https://doi.org/10.1016/j.scitotenv.2016.11.025, 2017.
Cheng, Y., Engling, G., He, K.-B., Duan, F.-K., Ma, Y.-L., Du, Z.-Y., Liu, J.-M., Zheng, M., and Weber, R. J.: Biomass burning contribution to Beijing aerosol, Atmos. Chem. Phys., 13, 7765–7781, https://doi.org/10.5194/acp-13-7765-2013, 2013.
Cheng, Y., Cao, X. B., Liu, J. M., Yu, Q. Q., Zhong, Y. J., Geng, G. N., Zhang, Q., and He, K. B.: New open burning policy reshaped the aerosol characteristics of agricultural fire episodes in Northeast China, Sci. Total Environ., 810, 152272, https://doi.org/10.1016/j.scitotenv.2021.152272, 2022.
Donahue, N. M., Robinson, A. L., Hartz, K. E. H., Sage, A. M., and Weitkamp, E. A.: Competitive oxidation in atmospheric aerosols: The case for relative kinetics, Geophys. Res. Lett., 32, https://doi.org/10.1029/2005gl022893, 2005.
Engling, G., Lee, J. J., Tsai, Y.-W., Lung, S.-C. C., Chou, C. C. K., and Chan, C.-Y.: Size-Resolved Anhydrosugar Composition in Smoke Aerosol from Controlled Field Burning of Rice Straw, Aerosol Sci. Tech., 43, 662–672, https://doi.org/10.1080/02786820902825113, 2009.
Fabbri, D., Torri, C., Simoneit, B. R. T., Marynowski, L., Rushdi, A. I., and Fabiańska, M. J.: Levoglucosan and other cellulose and lignin markers in emissions from burning of Miocene lignites, Atmos. Environ., 43, 2286–2295, https://doi.org/10.1016/j.atmosenv.2009.01.030, 2009.
Fang, Z., Lai, A., Cai, D. M., Li, C. L., Carmieli, R., Chen, J. M., Wang, X. M., and Rudich, Y.: Secondary Organic Aerosol Generated from Biomass Burning Emitted Phenolic Compounds: Oxidative Potential, Reactive Oxygen Species, and Cytotoxicity, Environ. Sci. Technol., 58, 8194–8206, https://doi.org/10.1021/acs.est.3c09903, 2024.
Fountoukis, C. and Nenes, A.: ISORROPIA II: a computationally efficient thermodynamic equilibrium model for K+–Ca2+–Mg2+–NH–Na+–SO–NO–Cl−–H2O aerosols, Atmos. Chem. Phys., 7, 4639–4659, https://doi.org/10.5194/acp-7-4639-2007, 2007.
Fu, P. Q., Kawamura, K., Chen, J., Li, J., Sun, Y. L., Liu, Y., Tachibana, E., Aggarwal, S. G., Okuzawa, K., Tanimoto, H., Kanaya, Y., and Wang, Z. F.: Diurnal variations of organic molecular tracers and stable carbon isotopic composition in atmospheric aerosols over Mt. Tai in the North China Plain: an influence of biomass burning, Atmos. Chem. Phys., 12, 8359–8375, https://doi.org/10.5194/acp-12-8359-2012, 2012.
Haque, Md. M., Zhang, Y., Bikkina, S., Lee, M., and Kawamura, K.: Regional heterogeneities in the emission of airborne primary sugar compounds and biogenic secondary organic aerosols in the East Asian outflow: evidence for coal combustion as a source of levoglucosan, Atmos. Chem. Phys., 22, 1373–1393, https://doi.org/10.5194/acp-22-1373-2022, 2022.
He, X., Wang, Q., Huang, X. H. H., Huang, D. D., Zhou, M., Qiao, L., Zhu, S., Ma, Y., Wang, H., Li, L., Huang, C., Xu, W., Worsnop, D. R., Goldstein, A. H., and Yu, J. Z.: Hourly measurements of organic molecular markers in urban Shanghai, China: Observation of enhanced formation of secondary organic aerosol during particulate matter episodic periods, Atmos. Environ., 240, https://doi.org/10.1016/j.atmosenv.2020.117807, 2020.
Hennigan, C. J., Sullivan, A. P., Collett, J. L., and Robinson, A. L.: Levoglucosan stability in biomass burning particles exposed to hydroxyl radicals, Geophys. Res. Lett., 37, https://doi.org/10.1029/2010gl043088, 2010.
Hennigan, C. J., Izumi, J., Sullivan, A. P., Weber, R. J., and Nenes, A.: A critical evaluation of proxy methods used to estimate the acidity of atmospheric particles, Atmos. Chem. Phys., 15, 2775–2790, https://doi.org/10.5194/acp-15-2775-2015, 2015.
Hoffman, D., Tilgner, A., Iinuma, Y. and Herrmann, H.: Atmospheric stability of levoglucosan A detailed laboratory and modeling study, Environ. Sci. Technol., 44, 694–699, https://doi.org/10.1021/es902476f, 2010.
Hong, Y., Cao, F., Fan, M.-Y., Lin, Y.-C., Gul, C., Yu, M., Wu, X., Zhai, X., and Zhang, Y.-L.: Impacts of chemical degradation of levoglucosan on quantifying biomass burning contribution to carbonaceous aerosols: A case study in Northeast China, Sci. Total Environ., 819, https://doi.org/10.1016/j.scitotenv.2021.152007, 2022.
Hu, C., Wei, Z., Zhan, H., Gu, W., Liu, H., Chen, A., Jiang, B., Yue, F., Zhang, R., Fan, S., He, P., Leung, K. M. Y., Wang, X., and Xie, Z.: Molecular characteristics, sources and influencing factors of isoprene and monoterpenes secondary organic aerosol tracers in the marine atmosphere over the Arctic Ocean, Sci. Total Environ., 853, 158645, https://doi.org/10.1016/j.scitotenv.2022.158645, 2022.
Huff Hartz, K. E., Weitkamp, E. A., Sage, A. M., Donahue, N. M., and Robinson, A. L.: Laboratory measurements of the oxidation kinetics of organic aerosol mixtures using a relative rate constants approach, J. Geophys. Res.-Atmos., 112, https://doi.org/10.1029/2006jd007526, 2007.
Kang, M., Ren, L., Ren, H., Zhao, Y., Kawamura, K., Zhang, H., Wei, L., Sun, Y., Wang, Z., and Fu, P.: Primary biogenic and anthropogenic sources of organic aerosols in Beijing, China: Insights from saccharides and n-alkanes, Environ. Pollut., 243, 1579–1587, https://doi.org/10.1016/j.envpol.2018.09.118, 2018.
Karavoltsos, S., Sakellari, A., Bakeas, E., Bekiaris, G., Plavsic, M., Proestos, C., Zinelis, S., Koukoulakis, K., Diakos, I., Dassenakis, M., and Kalogeropoulos, N.: Trace elements, polycyclic aromatic hydrocarbons, mineral composition, and FT-IR characterization of unrefined sea and rock salts: environmental interactions, Environ. Sci. Pollut. R., 27, 10857–10868, https://doi.org/10.1007/s11356-020-07670-2, 2020.
Kim, N., Park, M., Yum, S. S., Park, J. S., Song, I. H., Shin, H. J., Ahn, J. Y., Kwak, K.-H., Kim, H., Bae, G.-N., and Lee, G.: Hygroscopic properties of urban aerosols and their cloud condensation nuclei activities measured in Seoul during the MAPS-Seoul campaign, Atmos. Environ., 153, 217–232, https://doi.org/10.1016/j.atmosenv.2017.01.034, 2017.
Kumar, V., Rajput, P., and Goel, A.: Atmospheric abundance of HULIS during wintertime in Indo-Gangetic Plain: impact of biomass burning emissions, J. Atmos. Chem., 75, 385–398, https://doi.org/10.1007/s10874-018-9381-4, 2018.
Kuo, L. J., Louchouarn, P., and Herbert, B. E.: Influence of combustion conditions on yields of solvent-extractable anhydrosugars and lignin phenols in chars: implications for characterizations of biomass combustion residues, Chemosphere, 85, 797–805, https://doi.org/10.1016/j.chemosphere.2011.06.074, 2011.
Lai, C., Liu, Y., Ma, J., Ma, Q., and He, H.: Degradation kinetics of levoglucosan initiated by hydroxyl radical under different environmental conditions, Atmos. Environ., 91, 32–39, https://doi.org/10.1016/j.atmosenv.2014.03.054, 2014.
Lee, Y. C., Lam, Y. F., Kuhlmann, G., Wenig, M. O., Chan, K. L., Hartl, A., and Ning, Z.: An integrated approach to identify the biomass burning sources contributing to black carbon episodes in Hong Kong, Atmos. Environ., 80, 478–487, https://doi.org/10.1016/j.atmosenv.2013.08.030, 2013.
Leung, C. W., Wang, X., and Hu, D.: Characteristics and source apportionment of water-soluble organic nitrogen (WSON) in PM2.5 in Hong Kong: With focus on amines, urea, and nitroaromatic compounds, J. Hazard. Mater., 469, 133899, https://doi.org/10.1016/j.jhazmat.2024.133899, 2024.
Li, Q., Zhang, K., Li, R., Yang, L., Yi, Y., Liu, Z., Zhang, X., Feng, J., Wang, Q., Wang, W., Huang, L., Wang, Y., Wang, S., Chen, H., Chan, A., Latif, M. T., Ooi, M. C. G., Manomaiphiboon, K., Yu, J., and Li, L.: Underestimation of biomass burning contribution to PM2.5 due to its chemical degradation based on hourly measurements of organic tracers: A case study in the Yangtze River Delta (YRD) region, China, Sci. Total Environ., 872, https://doi.org/10.1016/j.scitotenv.2023.162071, 2023a.
Li, R., Wang, Q., He, X., Zhu, S., Zhang, K., Duan, Y., Fu, Q., Qiao, L., Wang, Y., Huang, L., Li, L., and Yu, J. Z.: Source apportionment of PM2.5 in Shanghai based on hourly organic molecular markers and other source tracers, Atmos. Chem. Phys., 20, 12047–12061, https://doi.org/10.5194/acp-20-12047-2020, 2020.
Li, R., Zhang, K., Li, Q., Yang, L., Wang, S., Liu, Z., Zhang, X., Chen, H., Yi, Y., Feng, J., Wang, Q., Huang, L., Wang, W., Wang, Y., Yu, J. Z., and Li, L.: Characteristics and degradation of organic aerosols from cooking sources based on hourly observations of organic molecular markers in urban environments, Atmos. Chem. Phys., 23, 3065–3081, https://doi.org/10.5194/acp-23-3065-2023, 2023b.
Li, Y., Fu, T.-M., Yu, J. Z., Feng, X., Zhang, L., Chen, J., Boreddy, S. K. R., Kawamura, K., Fu, P., Yang, X., Zhu, L., and Zeng, Z.: Impacts of Chemical Degradation on the Global Budget of Atmospheric Levoglucosan and Its Use As a Biomass Burning Tracer, Environ. Sci. Technol., 55, 5525–5536, https://doi.org/10.1021/acs.est.0c07313, 2021.
Liang, L., Engling, G., Du, Z., Cheng, Y., Duan, F., Liu, X., and He, K.: Seasonal variations and source estimation of saccharides in atmospheric particulate matter in Beijing, China, Chemosphere, 150, 365–377, https://doi.org/10.1016/j.chemosphere.2016.02.002, 2016.
Liu, X., Zhang, Y.-L., Peng, Y., Xu, L., Zhu, C., Cao, F., Zhai, X., Haque, M. M., Yang, C., Chang, Y., Huang, T., Xu, Z., Bao, M., Zhang, W., Fan, M., and Lee, X.: Chemical and optical properties of carbonaceous aerosols in Nanjing, eastern China: regionally transported biomass burning contribution, Atmos. Chem. Phys., 19, 11213–11233, https://doi.org/10.5194/acp-19-11213-2019, 2019.
Mochida, M., Kawamura, K., Fu, P., and Takemura, T.: Seasonal variation of levoglucosan in aerosols over the western North Pacific and its assessment as a biomass-burning tracer, Atmos. Environ., 44, 3511–3518, https://doi.org/10.1016/j.atmosenv.2010.06.017, 2010.
Pan, R., Zhu, J., Chen, D., Cheng, H., Huang, L., Wang, Y., and Li, L.: Integrated analysis of air quality-vegetation-health effects of near-future air pollution control strategies, Environ. Pollut., 366, 125407, https://doi.org/10.1016/j.envpol.2024.125407, 2025.
Pio, C. A., Legrand, M., Alves, C. A., Oliveira, T., Afonso, J., Caseiro, A., Puxbaum, H., Sanchez-Ochoa, A., and Gelencsér, A.: Chemical composition of atmospheric aerosols during the 2003 summer intense forest fire period, Atmos. Environ., 42, 7530–7543, https://doi.org/10.1016/j.atmosenv.2008.05.032, 2008.
Pio, C. A., Legrand, M., Oliveira, T., Afonso, J., Santos, C., Caseiro, A., Fialho, P., Barata, F., Puxbaum, H., Sanchez-Ochoa, A., Kasper-Giebl, A., Gelencsér, A., Preunkert, S., and Schock, M.: Climatology of aerosol composition (organic versus inorganic) at nonurban sites on a west-transect across Europe, J. Geophys. Res.-Atmos., 112, https://doi.org/10.1029/2006jd008038, 2007.
Riva, M., Da Silva Barbosa, T., Lin, Y.-H., Stone, E. A., Gold, A., and Surratt, J. D.: Chemical characterization of organosulfates in secondary organic aerosol derived from the photooxidation of alkanes, Atmos. Chem. Phys., 16, 11001–11018, https://doi.org/10.5194/acp-16-11001-2016, 2016a.
Riva, M., Budisulistiorini, S. H., Zhang, Z. F., Gold, A., and Surratt, J. D.: Chemical characterization of secondary organic aerosol constituents from isoprene ozonolysis in the presence of acidic aerosol, Atmos. Environ., 130, 5–13, https://doi.org/10.1016/j.atmosenv.2015.06.027, 2016b.
Sang, X., Zhang, Z., Chan, C., and Engling, G.: Source categories and contribution of biomass smoke to organic aerosol over the southeastern Tibetan Plateau, Atmos. Environ., 78, 113–123, https://doi.org/10.1016/j.atmosenv.2012.12.012, 2013.
Shrestha, N.: Detecting Multicollinearity in Regression Analysis, American Journal of Applied Mathematics and Statistics, 8, 39–42, https://doi.org/10.12691/ajams-8-2-1, 2020.
Slade, J. H. and Knopf, D. A.: Multiphase OH oxidation kinetics of organic aerosol The roleof particle phase state and relative humidity, Geophys. Res. Lett., 41, 5297–5306, https://doi.org/10.1002/2014GL060582, 2014.
St. John, P. C., Guan, Y., Kim, Y., Etz, B. D., Kim, S., and Paton, R. S.: Quantum chemical calculations for over 200 000 organic radical species and 40,000 associated closed-shell molecules, Sci. Data, 7, 244, https://doi.org/10.1038/s41597-020-00588-x, 2020a.
St. John, P. C., Guan, Y., Kim, Y., Kim, S., and Paton, R. S.: Prediction of organic homolytic bond dissociation enthalpies at near chemical accuracy with sub-second computational cost, Nat. Commun., 11, 2328, https://doi.org/10.1038/s41467-020-16201-z, 2020b.
Stevens, H., Barmuta, L. A., Chase, Z., Saunders, K. M., Zawadzki, A., Bowie, A. R., Perron, M. M. G., Sanz Rodriguez, E., Paull, B., Child, D. P., Hotchkis, M. A. C., and Proemse, B. C.: Comparing levoglucosan and mannosan ratios in sediments and corresponding aerosols from recent Australian fires, Sci. Total Environ., 945, 174068, https://doi.org/10.1016/j.scitotenv.2024.174068, 2024.
Stone, C. J.: Additive regression and other nonparametric models, Ann. Stat., 13, 689–705, https://doi.org/10.1214/aos/1176349548, 1985.
Vicente, E. D., Vicente, A., Evtyugina, M., Carvalho, R., Tarelho, L. A. C., Oduber, F. I., and Alves, C.: Particulate and gaseous emissions from charcoal combustion in barbecue grills, Fuel Process. Technol., 176, 296–306, https://doi.org/10.1016/j.fuproc.2018.03.004, 2018.
Wang, Q. and Yu, J. Z.: Ambient Measurements of Heterogeneous Ozone Oxidation Rates of Oleic, Elaidic, and Linoleic Acid Using a Relative Rate Constant Approach in an Urban Environment, Geophys. Res. Lett., 48, https://doi.org/10.1029/2021gl095130, 2021.
Wang, Q., He, X., Zhou, M., Huang, D. D., Qiao, L., Zhu, S., Ma, Y.-G., Wang, H.-L., Li, L., Huang, C., Huang, X. H. H., Xu, W., Worsnop, D., Goldstein, A. H., Guo, H., and Yu, J. Z.: Hourly Measurements of Organic Molecular Markers in Urban Shanghai, China: Primary Organic Aerosol Source Identification and Observation of Cooking Aerosol Aging, ACS Earth Space Chem., 4, 1670–1685, https://doi.org/10.1021/acsearthspacechem.0c00205, 2020.
Wang, Q., Wang, S., Chen, H., Zhang, Z., Yu, H., Chan, M. N., and Yu, J. Z.: Ambient Measurements of Daytime Decay Rates of Levoglucosan, Mannosan, and Galactosan, J. Geophys. Res.-Atmos., 130, https://doi.org/10.1029/2024jd042423, 2025.
Wennberg, P. O.: Radicals follow the Sun, Nature, 442, 145–146, https://doi.org/10.1038/442145a, 2006.
White, W. H.: Chemical markers for sea salt in IMPROVE aerosol data, Atmos. Environ., 42, 261–274, https://doi.org/10.1016/j.atmosenv.2007.09.040, 2008.
Xiao, L., Yu, L., and Hao, Y.: The burden associated with ambient PM2.5 and meteorological factors in Guangzhou, China, 2012–2016: A generalized additive modeling of temporal years of life lost, Chemosphere, 212, 705–714, https://doi.org/10.1016/j.chemosphere.2018.08.129, 2018.
Xu, S., Ren, L., Lang, Y., Hou, S., Ren, H., Wei, L., Wu, L., Deng, J., Hu, W., Pan, X., Sun, Y., Wang, Z., Su, H., Cheng, Y., and Fu, P.: Molecular markers of biomass burning and primary biological aerosols in urban Beijing: size distribution and seasonal variation, Atmos. Chem. Phys., 20, 3623–3644, https://doi.org/10.5194/acp-20-3623-2020, 2020.
Yan, C., Zheng, M., Sullivan, A. P., Shen, G., Chen, Y., Wang, S., Zhao, B., Cai, S., Desyaterik, Y., Li, X., Zhou, T., Gustafsson, Ö., and Collett, J. L.: Residential Coal Combustion as a Source of Levoglucosan in China, Environ. Sci. Technol., 52, 1665–1674, https://doi.org/10.1021/acs.est.7b05858, 2018.
Yan, C., Sullivan, A. P., Cheng, Y., Zheng, M., Zhang, Y., Zhu, T., and Collett, J. L.: Characterization of saccharides and associated usage in determining biogenic and biomass burning aerosols in atmospheric fine particulate matter in the North China Plain, Sci. Total Environ., 650, 2939–2950, https://doi.org/10.1016/j.scitotenv.2018.09.325, 2019.
Yi, Y., Li, R., Zhang, K., Yang, X., Li, Q., Geng, C., Chen, H., Yang, W., Yu, J. Z., and Li, L.: Insights Into the Influence of Anthropogenic Emissions on the Formation of Secondary Organic Aerosols Based on Online Measurements, J. Geophys. Res.-Atmos., 129, https://doi.org/10.1029/2024jd041479, 2024.
Zhai, S., Jacob, D. J., Wang, X., Shen, L., Li, K., Zhang, Y., Gui, K., Zhao, T., and Liao, H.: Fine particulate matter (PM2.5) trends in China, 2013–2018: separating contributions from anthropogenic emissions and meteorology, Atmos. Chem. Phys., 19, 11031–11041, https://doi.org/10.5194/acp-19-11031-2019, 2019.
Zhang, K., Yang, L., Li, Q., Li, R., Zhang, D., Xu, W., Feng, J., Wang, Q., Wang, W., Huang, L., Yaluk, E. A., Wang, Y., Yu, J. Z., and Li, L.: Hourly measurement of PM2.5-bound nonpolar organic compounds in Shanghai: Characteristics, sources and health risk assessment, Sci. Total Environ., 789, https://doi.org/10.1016/j.scitotenv.2021.148070, 2021a.
Zhang, L., Hu, B., Liu, X. L., Luo, Z. H., Xing, R., Li, Y. J., Xiong, R., Li, G., Cheng, H. F., Lu, Q., Shen, G. F., and Tao, S.: Variabilities in Primary N-Containing Aromatic Compound Emissions from Residential Solid Fuel Combustion and Implications for Source Tracers, Environ. Sci. Technol., https://doi.org/10.1021/acs.est.2c03000, 2022.
Zhang, L., Zhou, P., Zhong, H., Zhao, Y., Dai, L., Wang, Q. G., Xi, M., Lu, Y., and Wang, Y.: Quantifying the impacts of anthropogenic and natural perturbations on gaseous elemental mercury (GEM) at a suburban site in eastern China using generalized additive models, Atmos. Environ., 247, https://doi.org/10.1016/j.atmosenv.2020.118181, 2021b.
Zhang, Q., Jimenez, J. L., Canagaratna, M. R., Allan, J. D., Coe, H., Ulbrich, I., Alfarra, M. R., Takami, A., Middlebrook, A. M., Sun, Y. L., Dzepina, K., Dunlea, E., Docherty, K., DeCarlo, P. F., Salcedo, D., Onasch, T., Jayne, J. T., Miyoshi, T., Shimono, A., Hatakeyama, S., Takegawa, N., Kondo, Y., Schneider, J., Drewnick, F., Borrmann, S., Weimer, S., Demerjian, K., Williams, P., Bower, K., Bahreini, R., Cottrell, L., Griffin, R. J., Rautiainen, J., Sun, J. Y., Zhang, Y. M., and Worsnop, D. R.: Ubiquity and dominance of oxygenated species in organic aerosols in anthropogenically-influenced Northern Hemisphere midlatitudes, Geophys. Res. Lett., 34, https://doi.org/10.1029/2007gl029979, 2007.
Zhang, R., Jing, J., Tao, J., Hsu, S.-C., Wang, G., Cao, J., Lee, C. S. L., Zhu, L., Chen, Z., Zhao, Y., and Shen, Z.: Chemical characterization and source apportionment of PM2.5 in Beijing: seasonal perspective, Atmos. Chem. Phys., 13, 7053–7074, https://doi.org/10.5194/acp-13-7053-2013, 2013.
Zhao, R., Mungall, E. L., Lee, A. K. Y., Aljawhary, D., and Abbatt, J. P. D.: Aqueous-phase photooxidation of levoglucosan – a mechanistic study using aerosol time-of-flight chemical ionization mass spectrometry (Aerosol ToF-CIMS), Atmos. Chem. Phys., 14, 9695–9706, https://doi.org/10.5194/acp-14-9695-2014, 2014.
Zhao, Y., Kreisberg, N. M., Worton, D. R., Isaacman, G., Weber, R. J., Liu, S., Day, D. A., Russell, L. M., Markovic, M. Z., VandenBoer, T. C., Murphy, J. G., Hering, S. V., and Goldstein, A. H.: Insights into Secondary Organic Aerosol Formation Mechanisms from Measured Gas/Particle Partitioning of Specific Organic Tracer Compounds, Environ. Sci. Technol., 47, 3781–3787, https://doi.org/10.1021/es304587x, 2013.
Zhu, S., Wang, Q., Qiao, L., Zhou, M., Wang, S., Lou, S., Huang, D., Wang, Q., Jing, S., Wang, H., Chen, C., Huang, C., and Yu, J. Z.: Tracer-based characterization of source variations of PM2.5 and organic carbon in Shanghai influenced by the COVID-19 lockdown, Faraday Discuss., 226, 112–137, https://doi.org/10.1039/d0fd00091d, 2021.