the Creative Commons Attribution 4.0 License.
the Creative Commons Attribution 4.0 License.
 | 06 Mar 2026
Characterization of the annual cycle of atmospheric aerosol over Mindelo, Cabo Verde, by means of continuous multiwavelength lidar observations
Athena Augusta Floutsi
Julian Hofer
Moritz Haarig
Annett Skupin
Ronny Engelmann
Cristofer Jimenez
Robert Wagner
Holger Baars
This paper presents an analysis of the annual cycle of aerosol optical and geometrical properties based on multiwavelength-Raman-polarization lidar measurements for Mindelo, Cabo Verde, from July 2021 to August 2023. A quality-assured data set of more than 70 automatically-calibrated lidar profiles was manually evaluated. For the first time, a two-year time series of, e.g. layer-resolved aerosol optical depth (AOD), lidar ratio profiles, and particle depolarization profiles are presented for Cabo Verde to characterize the complete annual cycle of aerosol in the planetary boundary layer (PBL) and in the lofted aerosol layers. The aerosol conditions over Mindelo are complex with different mixing states of dust and non-dust components. A strong annual cycle was found in the overall aerosol layer top height and the geometrical extent, the AOD, and the dust fraction of the lofted layers. Furthermore, the data was used to explicitly define aerosol-related seasons. The dust season (June–September) is characterized by geometrically and optically thick lofted layers dominated by Saharan dust (up to 7 km height) above a slightly polluted marine PBL. Seasonal mean lidar ratios at 355(532) nm are 34±18 (32±19) sr (PBL) and 48±19 (39±18) sr (lofted layers). The particle depolarization ratio is <0.05 (PBL) and 0.16±0.07, 0.22±0.06, and 0.20±0.05 (lofted layers) at 355, 532, and 1064 nm. The mixing season (often mixtures of Saharan dust with biomass burning aerosol, November–March) is characterized by a large variability of aerosol with mean lidar ratios of 60±32 (48±32) sr at 355 (532) nm and depolarization ratios of 0.09±0.06, 0.11±0.07, and 0.16±0.08 at 355, 532, and 1064 nm in the lofted layers.
- Article
(12409 KB) - Full-text XML
- BibTeX
- EndNote


Atmospheric aerosol is an important component of atmospheric research as aerosol particles affect the Earth's climate in a crucial way due to their radiative effects and their interaction with clouds. While the radiative effects are well known for most pure aerosol types, describing the radiative effects of aerosol mixtures is challenging and further research is required (Tegen et al., 1997; Satheesh and Moorthy, 2005; Wandinger et al., 2023). Key for characterizing the aerosol effect on the climate is a proper classification of, both, pure aerosol types and mixtures. The exact knowledge of the optical properties of different aerosol types is fundamental for understanding their effects on radiation and to derive microphysical properties like concentrations of cloud condensation nuclei (CCN), and ice nucleating particles (INP). In this context, mineral dust is particularly important as it is the most abundant component of atmospheric aerosol and dust particles are known to be effective INPs (Choobari et al., 2014).
The Saharan desert as the largest dust source worldwide is an interesting study location for pure dust. Furthermore, the Cabo Verde Islands, located around 640 km west of the coast of West Africa, are an appropriate location to study Saharan dust as well as mixtures with other aerosol types, e.g. marine aerosol and biomass burning aerosol at the beginning of their transport towards South and Central America (Tesche et al., 2011a, b; Tesche, 2011). Even volcanic sulfate has been observed over Cabo Verde in September 2021, originating from the eruption of Cumbre Vieja at La Palma, Canary Islands, Spain (Gebauer et al., 2024).
Several campaigns have already been carried out in West Africa and Cabo Verde, e.g. the Saharan Dust Experiment (SHADE; Formenti et al., 2003), the African Monsoon Multidisciplinary Analysis (AMMA; Lebel et al., 2010; Chen et al., 2011), the Dust Outflow and Deposition to the Ocean project (DODO; McConnell et al., 2008), the Saharan Mineral dust experiments 1 (SAMUM–1; Freudenthaler et al., 2009) and 2 (SAMUM–2; Ansmann et al., 2011; Tesche et al., 2011a, b; Groß et al., 2011), the Fennec campaign (Ryder et al., 2013; Rocha-Lima et al., 2018), the Saharan Aerosol Long-Range Transport and Aerosol-Cloud-Interaction Experiment (SALTRACE; Weinzierl et al., 2017; Rittmeister et al., 2017; Haarig et al., 2019), the SaHAran Dust Over West Africa (SHADOW) campaign (Veselovskii et al., 2016, 2018, 2020) or the Marine biological production, organic aerosol particles and marine clouds: a Process chain project (MarParCloud; Gong et al., 2020). Furthermore, Barreto et al. (2022) used micro-pulse lidar and radiosonde observations from 2007 to 2018 for a long-term characterization of the Saharan air layer (SAL) above the Canary Islands.
Most of these campaigns, however, cover only a certain time of one specific year and not a complete year. Thus, the larger context is not fully resolved. For example, SAMUM–2, performed in two phases (SAMUM–2a, 15 January–15 February 2008 and SAMUM–2b, 15 May–15 June 2008) at Praia, Cabo Verde, revealed significant differences in the aerosol conditions over Cabo Verde between boreal summer and winter, caused by the seasonal shift of the Inter-Tropical Convergence Zone (ITCZ) and the biomass burning regions on the African continent (Tesche et al., 2011a). Although there is a certain overlap, the boreal seasons do not represent the seasonal cycle of aerosol over Cabo Verde in a satisfying way. As learnt from SAMUM–2, based on these two one-month campaigns, the aerosol conditions are better characterized by two main regimes, which we called the dust season (dominated by Saharan dust, SAMUM–2b) and the mixing season (often mixtures of Saharan dust with biomass burning aerosol, SAMUM–2a), rather than the summer and the winter seasons. The study of Barreto et al. (2022), indeed, provides a long-term analysis of multiple complete years above the Canary Islands and reports similar results with a well-stratified SAL up to 6 km in July and August clearly separated from the marine PBL below and a narrow SAL below 2 km partly mixed into the PBL from November to January. However, the observations of Barreto et al. (2022) have some limitations concerning the characterization of the aerosol types, e.g. the separation of the dust and smoke components and concerning the retrieval of the lidar ratio, which is a key component for the aerosol typing.
Hence, a continuous profiling of the atmospheric column in addition to an advanced aerosol typing, is needed and possible since June 2021, when a ground-based aerosol remote sensing station at Mindelo, Cabo Verde, was set up in the framework of the Joint Aeolus-Tropical Atlantic Campaign (JATAC; Fehr et al., 2023). This measurement site includes a continuously-operated PollyXT lidar (Althausen et al., 2009; Engelmann et al., 2016), which is part of the global network of automated Raman-polarization lidars (PollyNET; Baars et al., 2016). With PollyXT, vertically-resolved measurements of aerosol can be performed. Using multiple wavelengths as well as the Raman and polarization techniques, this instrument is ideal for the characterization of the optical properties of aerosol particles. Furthermore, several typing schemes exist to characterize the aerosol components based on the measured optical properties. With the Polarization Lidar Photometer Networking method (POLIPHON; Tesche et al., 2009; Ansmann et al., 2019, 2026) and DeLiAn (Floutsi et al., 2023), well established methods and data bases for the separation and classification of different aerosol types are available.
Thanks to the continuous lidar measurements, we had the chance to investigate the aerosol conditions over Mindelo based on two years of multiwavelength lidar observations, while SAMUM–2 was based on two four-week campaigns. It is the first time that such a long data set of height-resolved aerosol optical properties is available in that region of the world. Based on a carefully selected data set, one major aim of our study was to define more precisely the concrete time frame which covers the dust season and the mixing season and to characterize the aerosol occurrence over Cabo Verde in terms of columnar geometrical extension, optical properties, and dust fraction over the course of the year and for these two seasons. Therefore, automatically-retrieved lidar profiles were used to analyze time series of layer-resolved aerosol properties at different wavelengths for the two-years period.
This article is structured as follows: In Sect. 2, the instrumentation and the data processing and analysis are described. The results of the annual cycle of aerosol geometrical and optical properties are presented and discussed in Sect. 3. In Sect. 4, the definition of the aerosol-related seasons is explained and compared with the findings from previous observations. General conclusions are given in Sect. 5.
2.1 Measurement site and instrumentation
The data used for this study and presented here originated from the measurement site at Mindelo, which is a city on the northwest coast of the island São Vicente belonging to the Cabo Verde Islands (Fig. 1). They are located downwind the Saharan desert and in the trade wind zone with the predominant wind direction being northeast in the lower altitudes. The measurement site at the Ocean Science Center Mindelo (OSCM, 16.878° N, 24.995° W, 10 ) is a coastal site. The marine influence is high for the entire island. Due to the northeasterly trade winds, the measurement site is also affected by the anthropogenic activity on the island. In addition to the measurements at Mindelo, long-term observations of a sun photometer operated in the Aerosol Robotic Network (AERONET; Holben et al., 1998) on the island Sal (similar latitude like São Vicente, but somewhat more east, see Fig. 1) were used for a long-term climatology, setting the measurements from Mindelo into a larger context.
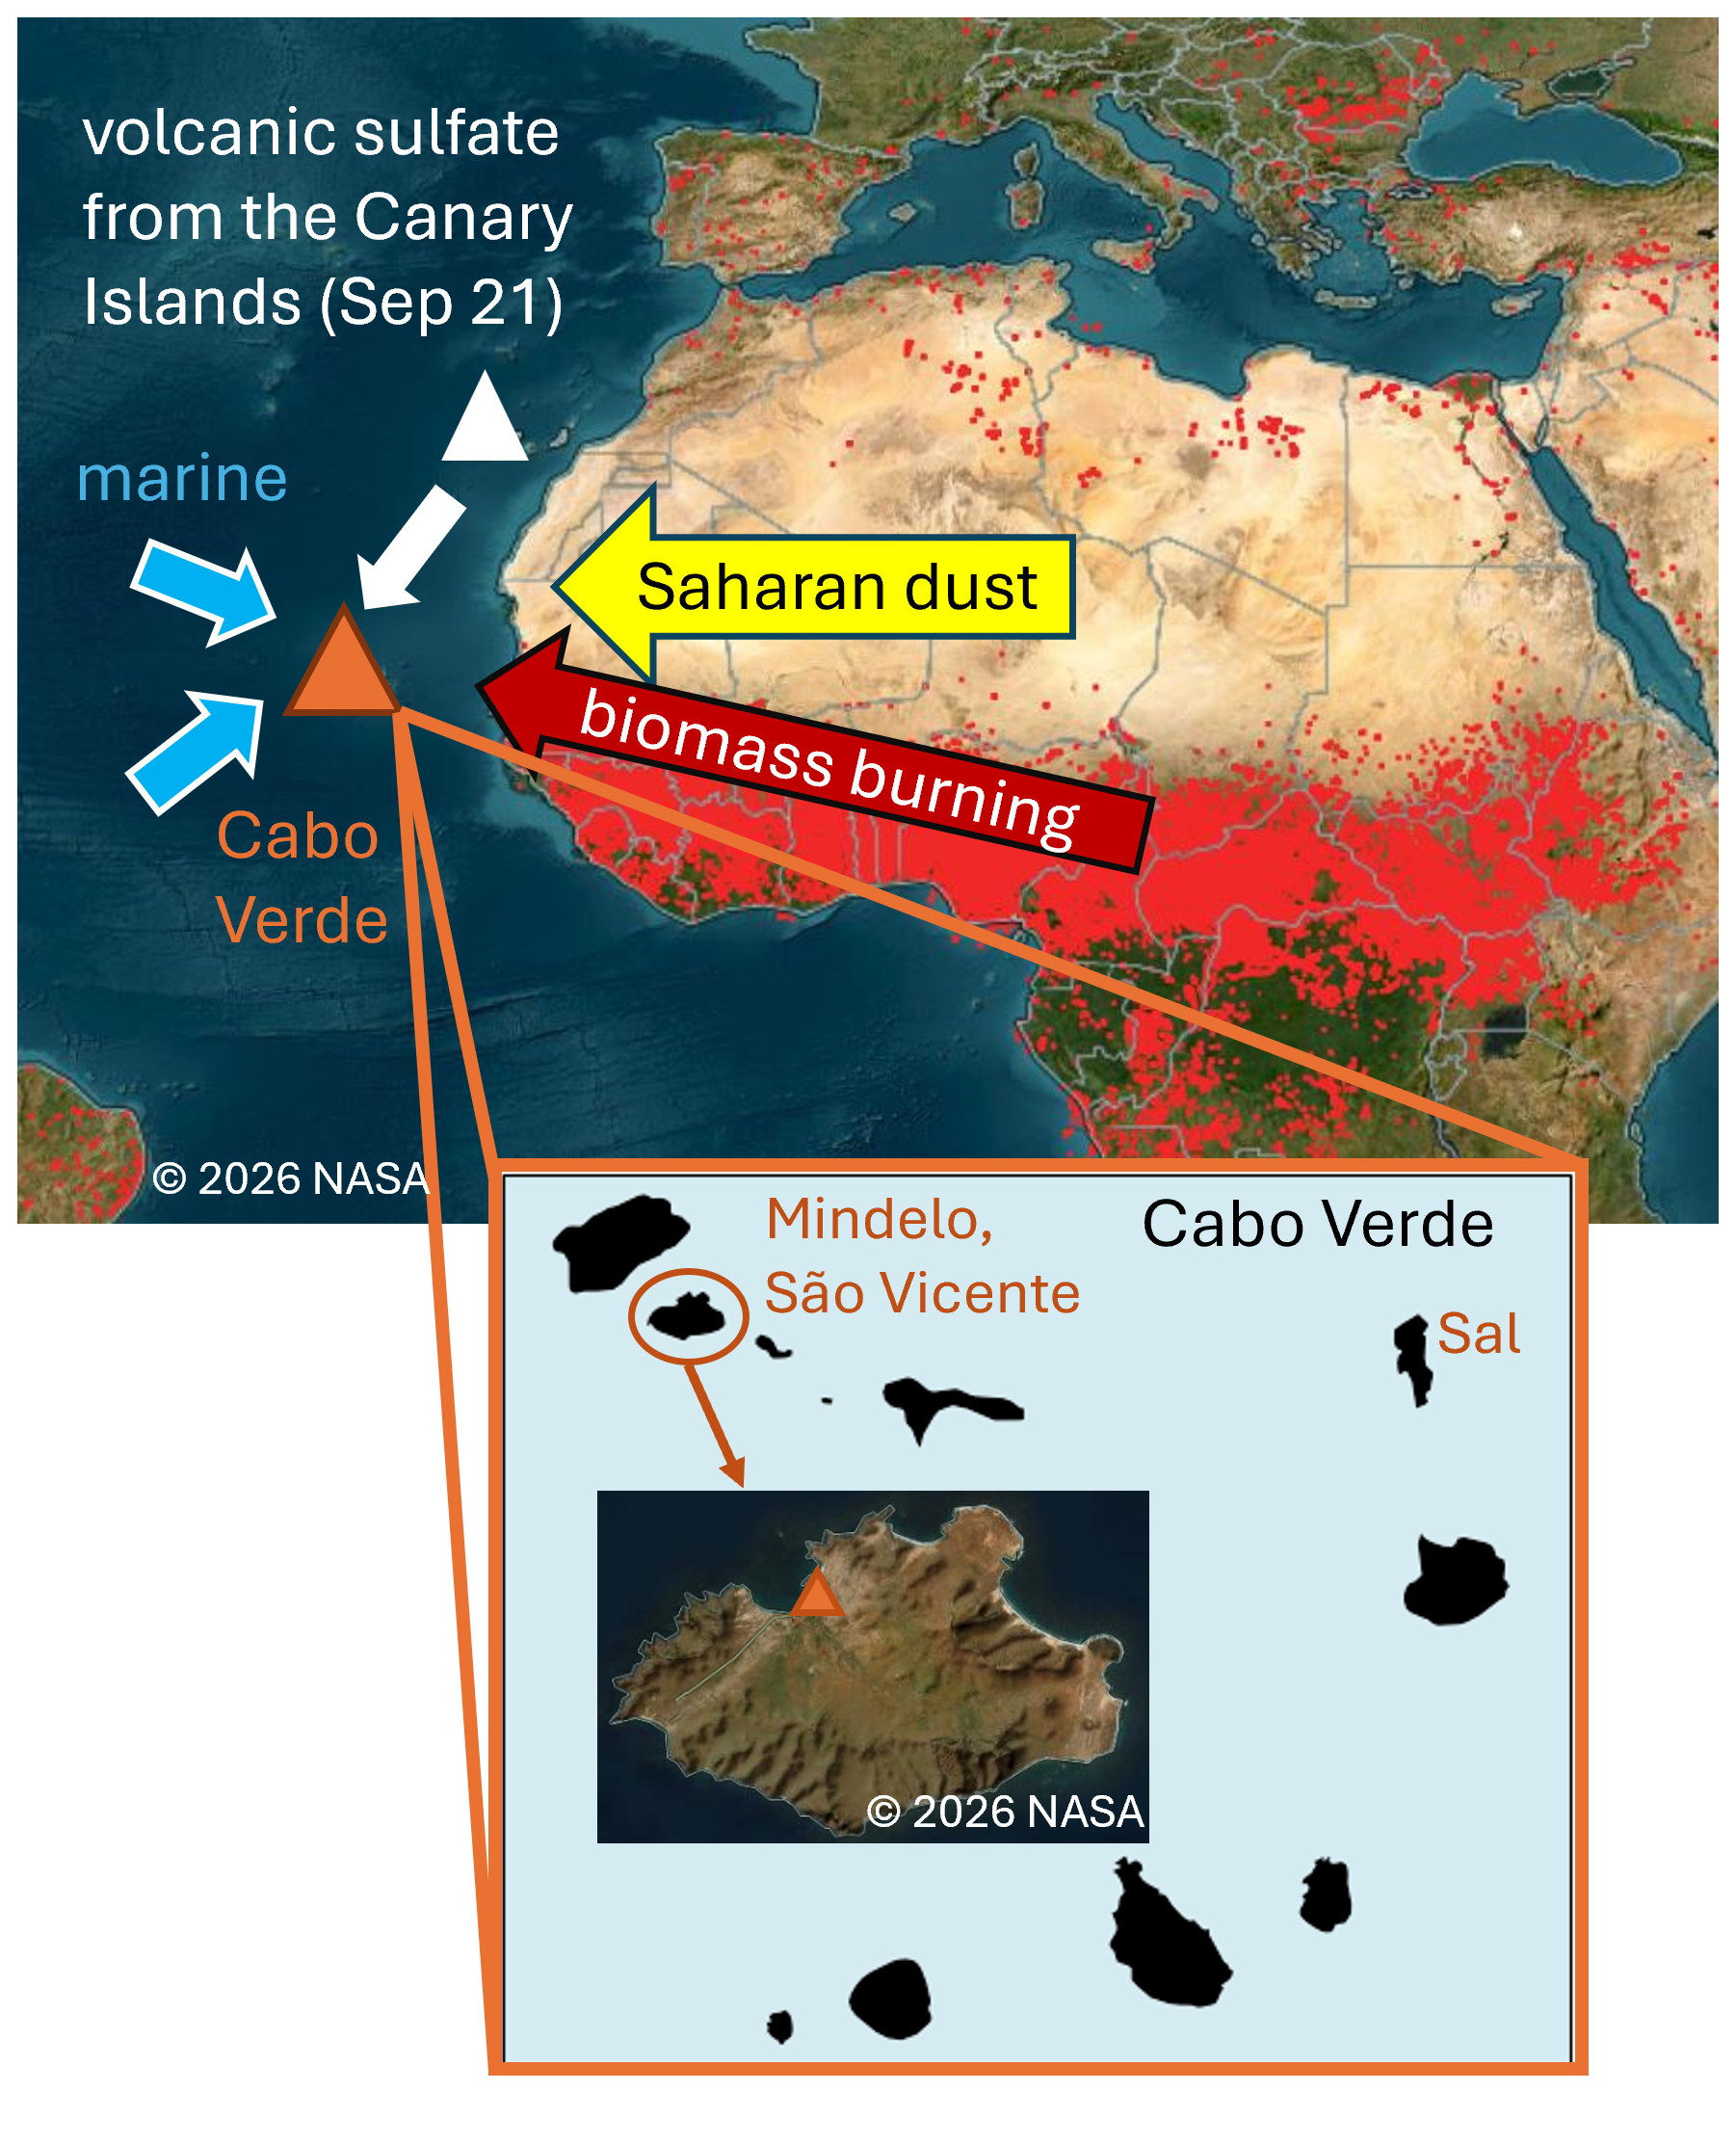
Figure 1Satellite image of the fire activity from the Moderate-resolution Imaging Spectroradiometer (MODIS; Xiong and Barnes, 2006) from 6 February 2022, showing the location of Cabo Verde and of Mindelo within Cabo Verde. The dominant aerosol types influencing Cabo Verde are indicated by the colored arrows. Imagery copyright 2026 NASA.
At the OSCM, the setup of an ACTRIS (Laj et al., 2024) aerosol and cloud remote sensing facility has started in June 2021 in the framework of JATAC (Fehr et al., 2023), which was initiated by the European Space Agency (ESA). The ground-based component of JATAC, called ASKOS (Marinou et al., 2023), took place in three intense phases in September 2021, June 2022, and September 2022. Several international institutions were involved with the main goal of collecting synergistic measurements for a quality-assured reference data set for the calibration and validation activities of ESA's satellite Aeolus (Stoffelen et al., 2005; Reitebuch, 2012; Straume-Lindner et al., 2021). Aeolus was equipped with a wind lidar operated at 355 nm, delivering mainly wind products (Tan et al., 2008). Additionally, aerosol retrievals were available (Flament et al., 2021). During this campaign, Aeolus was measuring directly over Mindelo each Friday evening at around 19:30 UTC (see, e.g. Trapon et al., 2025).
Amongst others, the station is equipped with the multiwavelength-Raman-polarization lidar PollyXT (Althausen et al., 2009; Engelmann et al., 2016) and a CIMEL Sun Sky Lunar photometer of type CE318-T, which is also part of AERONET (Holben et al., 1998). Both instruments were already used for a previous study of Gebauer et al. (2024), where their capabilities are described in detail. For the study presented here, the lidar measurements of the particle backscatter coefficient and the particle linear depolarization ratio, each at 355, 532, and 1064 nm, and of the extinction coefficient and the lidar ratio at 355 and 532 nm were relevant as well as the backscatter-related and extinction-related Ångström exponents between the different wavelengths. The PollyXT system is equipped with two receiving telescopes, one for far-range (FR) and one for near-range (NR) measurements. While the FR measurements reach higher altitudes above the lidar (full overlap at 800 m above the lidar; Engelmann et al., 2016), the NR measurements are more accurate in lower altitudes up to 2 km above the lidar and reach closer to the ground than the FR measurements (full overlap at 120 m above the lidar; Engelmann et al., 2016). Whenever available, NR measurements were preferred to characterize the lower atmosphere. Uncertainties of the lidar-derived optical properties are the statistical error of the particle extinction coefficient, a minimized systematic relative error of 15 % for the particle backscatter coefficient and a constant absolute error of 0.02 at 355 nm and of 0.01 at 532 and 1064 nm for the particle linear depolarization ratio, as intensively described in Gebauer et al. (2024). The errors of the lidar ratio and of the Ångström exponent were calculated via the analytical Gaussian error propagation. From the AERONET sun photometer, the level 2.0 aerosol optical depth (AOD) was used for comparison with the lidar measurements and with the long-term climatology of the AOD from Sal. Uncertainties for a newly calibrated sun photometer are for wavelengths larger than 440 nm and for shorter wavelengths (Holben et al., 1998)
2.2 Data processing and cloud-screening
The above-described PollyXT lidar is, in addition to the ACTRIS network, operated in the international network PollyNET (Baars et al., 2016; Engelmann et al., 2016). Within PollyNET, vertical profiles of the aerosol optical properties are derived and calibrated automatically via the PollyNET processing chain (Yin and Baars, 2021). To retrieve accurate profiles, the raw signal needs to be averaged over a larger cloud-free period (usually around 1 h), which is searched for by the implemented cloud screening algorithm. Clouds are detected using the signal gradient method, which identifies large slopes in the vertical profile of the photon count rate, occurring at the cloud base. If the vertical slope exceeds a certain threshold, the corresponding profile (raw resolution of 30 s) is flagged as cloudy. In our study, we used version 4.0 of the PollyNET processing chain (Klamt et al., 2024), in which the threshold for the slope of the photon count rate has been set to 0.7×10⁵ MHz m−1. To obtain vertical profiles of the optical properties, the raw signal is averaged over 1 h if cloud conditions allow. However, a minimum of 15 min of contiguous cloud-free raw profiles is required. Thus, the automatically-retrieved profiles of the aerosol optical properties are averaged over time periods between 15 min–1 h, depending on the cloud conditions. Version 4.0 of the processing chain also provides outputs of the lidar-based target categorization version 2, which, in addition to the elastic backscatter signal, uses the Raman one as well (Baars et al., 2017). From the target categorization, a cloud information product is derived, including, e.g. the cloud base height. Furthermore, the one-step polarization-lidar photometer networking algorithm (POLIPHON; Ansmann et al., 2019) is implemented in the processing chain so that the profiles of the aerosol optical properties are separated into dust and non-dust components following the methodology described in Tesche et al. (2009). Like in Tesche et al. (2009), the PollyNET processing chain uses by default 0.31±0.03 and 0.23±0.03 as thresholds for the dust particle linear depolarization ratio at 355 and 532 nm, respectively, and 0.05±0.01 as threshold for the non-dust particle linear depolarization ratio at both wavelengths. Thus, the dust fraction can be calculated from the ratio of the dust backscatter to the total particle backscatter coefficient. The uncertainty of the dust fraction was calculated via the analytic Gaussian error propagation using a relative error of 15 % for each, for the total particle backscatter coefficient and the dust backscatter coefficient. The profiles of the aerosol optical properties are vertically smoothed using a moving average filter. The resulting smoothing length is 382.5 m (51 bins) for the NR-measurements and 742.5 m (99 bins) for the FR-measurements, which are the standard values used in the processing chain.
2.2.1 Description of the data set
The basis for this study are data from almost continuous lidar measurements obtained at Mindelo, between 1 July 2021–31 August 2023 and, thus, capturing more than two complete years. Out of these two years, a sub data set was created for the analysis of the seasonal cycle of the aerosol conditions. All nighttime observations from Friday 18:00 UTC to Saturday 06:00 UTC were considered to provide a set of measurements that are independent from each other, i.e. different measurements do not probe the same atmospheric event. The nighttime measurements allowed for a derivation of vertically-resolved aerosol optical profiles with the Raman method (Ansmann et al., 1992). In our study, we exclusively used Raman profiles and did not consider Klett profiles for reasons of consistency. From now on, this sub data set will be referred to as Fri/Sat nights. The measurement time during the Fri/Sat nights was preferred as it coincided with the direct overpass of the Aeolus satellite over Mindelo and, thus, the availability of lidar measurements was especially ensured during these nights. Furthermore, the detailed analysis of these measurement periods as done for our study provides also a mature basis for future Aeolus-PollyXT-intercomparison activities.
In total, the described two-year period includes 113 nights. Despite all efforts to guarantee continuous observations, measurement gaps due to technical issues or maintenance on the lidar system occurred. The data gaps were mostly distributed homogeneously among the two-year period and mainly rare and rather short, except two longer phases, in May 2022 and from the end of July to the beginning of September 2022, both due to problems with the cooling system. Hence, on 24 of the 113 nights no data are available. Thus, data from 89 nights could be used for the processing with the PollyNET processing chain. As a result of the cloud screening, the data set of 89 nights was reduced to 74 nights, as on the other nights, the algorithm did not detect any cloud-free periods of more than 15 min as required for a stable calibration. Furthermore, one profile per night was selected to be used for the further analysis of the aerosol conditions in the atmosphere above Mindelo. For these 74 profiles, a large discrepancy of the number of derived aerosol optical properties at the different wavelengths was observed. The particle extinction coefficient at 355 and 532 nm (for both FR- and NR-measurements) is available in almost all cases, while the particle backscatter coefficient at 355, 532, and 1064 nm (FR-measurements only) was retrieved by the processing chain in only 64, 40, and 16 cases, respectively. The corresponding number of retrieved backscatter profiles in the NR is slightly lower. These differences occur because of the weaker molecular scattering at large wavelengths, which makes the automatic calibration more challenging, especially at 1064 nm (Vaughan et al., 2019).
To guarantee quality-assured profiles, they were manually carefully checked and any profiles with calibration issues (mainly inappropriate reference height) were removed from the data set. Only one nighttime measurement had to be neglected completely, leading to a total number of 73 analyzed cases. In these 73 cases, certain optical properties, certain wavelengths or the NR measurements were discarded according to the visual quality check, i.e. all 73 cases were used but not all of them had the complete set of all five optical properties, all three wavelengths and NR measurements. An overview of the number of the overall retrieved and after the quality assurance used optical properties per wavelengths is shown in Fig. A1.
2.3 Characterization of aerosol layers
For all of the 73 cases, aerosol layers were defined, using a visual inspection. Although automatic retrievals for the detection of the PBL top height (Baars et al., 2008) or the aerosol layer top height (Hofer et al., 2020) exist, the application of an automatic algorithm to the PollyNET processing chain to detect the lower and upper boundaries of (multiple) lofted aerosol layers is still under development. The algorithm of Hofer et al. (2020) can be used only for the detection of the uppermost height where aerosol is present and, thus, is not convenient for defining vertically-homogeneous aerosol layers as well as for cases in which more than one lofted aerosol layer exists. This algorithm also cannot detect the lower boundaries of the lofted aerosol layers. Furthermore, the inhomogeneity of our data set (missing profiles at different wavelengths for different cases) was not a good precondition for applying an automatic algorithm. Therefore, the visual inspection was considered to be the best approach for this study to obtain an optimal data set, including as much profiles of the different aerosol optical properties as possible, while the automatized detection of the aerosol layer top height according to Hofer et al. (2020) was used additionally for checking the consistency with the manually-defined aerosol layer top heights and, thus, the applicability of an automatic retrieval to this data set.
For the definition of the PBL, the NR-measurements of the particle backscatter coefficient at the available wavelengths were used. The PBL top height was manually defined in the middle of the first significant gradient of the backscatter coefficient. For the lofted aerosol layers, the FR-measurements mainly of the particle backscatter coefficient and the particle linear depolarization ratio were used in combination with the backscatter-related Ångström exponent. In four cases, only the extinction coefficients and the extinction-related Ångström exponent were used as all the other optical properties are not available. Also for the lofted aerosol layers, no specific wavelength but all available wavelengths were used for the definition of the layer boundaries. Similarly to the definition of the PBL top, the gradient of the backscatter coefficient gives a first impression for the location of the layer boundaries. As this gradient is usually less pronounced for the lofted layers than for the PBL, the intensive optical properties were used as an additional metric. The layer boundaries were set such that the depolarization ratio and the Ångström exponent remained almost constant within one layer. Usually, there were also transition zones for these two properties at the bottom and the top of the layer. As they are more an effect of vertical smoothing than of aerosol mixing at the layer edges, they were excluded by the quite restrictive layer definition. If indicated by local minima in the backscatter coefficient or the particle depolarization ratio or by noticeable vertical differences in the intensive aerosol optical properties (i.e. differences of at least 0.05 and 0.5 in the depolarization ratio or the Ångström exponent, respectively), the lofted aerosol layer was split into sub-layers. Transition zones of around 100 m were usually neglected between the sub-layers in favor of a better visibility in the plots. However, excluding or including these few meters should affect the results only in a negligible way as the gradient of the above mentioned properties is much weaker between the sub-layers than at the bottom and top of the entire layer. The layer boundaries within this visual inspection were defined as full hundred meters, i.e. an uncertainty of ±50 m was assumed for the derived heights.
For the defined aerosol layers, layer mean values were calculated for the intensive properties (lidar ratio, Ångström exponents, particle linear depolarization ratio, and dust fraction), while the extensive optical properties (total and dust backscatter coefficients and particle extinction coefficient) were integrated vertically. Because of unreasonable values below, profiles of the backscatter and extinction coefficients were cut-off at 100 m and between 400–500 m above the lidar, respectively. For the integration within the PBL, the profiles were interpolated to the ground, assuming the values at the cut-off heights to be constant down to the ground. In case of the extinction coefficient, the integrated value is equivalent to the layer-AOD. The sum of the layer-AODs at 355 and 532 nm was compared with the columnar AERONET AODs at 340 and 532 nm, respectively. Because the directly measured AERONET AOD at 500 nm was not available for the complete study period, we calculated the AODs at 500 nm (for comparison with the long-term climatology) and at 532 nm (for comparison with the lidar AOD) from the AERONET AOD at 440 nm, using the AERONET Ångström exponent between 440–870 nm. As the sun photometer measurements exist only for daytime and the lidar-based AOD was derived during the night, the latest AERONET hourly mean from the day before was averaged with the first hourly mean of the day after. If only one of both measurements was available, this single hourly mean was taken as reference. For the uncertainty of the layer mean optical properties, layer means of the errors of the lidar and depolarization ratio, the Ångström exponents and the dust fraction were calculated, while for the integrated values the errors of the backscatter and extinction coefficients were used as input for the analytic Gaussian error propagation.
As mentioned above, the algorithm of Hofer et al. (2020) was applied and the results were compared with the visually-defined top height of the uppermost lofted aerosol layer. This comparison is shown in Fig. B1. In the automatic algorithm, the layer top of the uppermost aerosol layer is set at the height where the FR-particle backscatter coefficient at 532 nm falls below a certain threshold, i.e. 0.1 for the first time. For the estimation of the uncertainty of the derived height, the algorithm was applied to a slightly varied threshold of the particle backscatter coefficient (±15 %, which is in agreement with the uncertainty of the particle backscatter coefficient) and the differences between these heights and the previously derived layer top height were calculated. The results are used as asymmetric error bars for the automatically-retrieved aerosol layer top heights in Fig. B1. As both methods, the visual inspection and the algorithm of Hofer et al. (2020), strongly differ in their working principle, differences in the retrieved aerosol layer top heights are expected. Generally, the automatically-retrieved heights are around 200 m larger than the visually-defined ones. Furthermore, the algorithm of Hofer et al. (2020) was developed for Tajikistan where the aerosol conditions are different and no low and well-defined marine PBL with a well-defined dust layer above exist but a mixture of dust and pollution from ground to several kilometers of altitude with often geometrically complex lofted layers. The aim behind the algorithm was to detect the top of the first significant layer of aerosol over Tajikistan without considering the layers above. Thus, in some cases, the automatic algorithm failed and did not detect the lofted aerosol layers if the backscatter coefficient dropped below the threshold already between the PBL and the lofted layers. The two outliers of the error bars in Fig. B1 are from 9 December 2022 and from 2 June 2023. In the December case, the backscatter coefficient at 532 nm was smaller than the threshold value already in the altitude range between the PBL and the lofted aerosol layer. Thus, the algorithm stopped and detected the PBL top as overall aerosol layer top height. With the 15 % smaller threshold in the error calculation, the correct overall layer top height was detected (upper error bar). In the June case, the algorithm detected the correct aerosol layer top height but in the error calculation (backscatter threshold increased by 15 % for the lower error bar), the PBL top was detected. In all the other cases, the algorithm detected altitudes closely around the layer top height also with the increased and decreased threshold values. Due to the explained limitations of the algorithm of Hofer et al. (2020) for our dataset, the automatically-retrieved aerosol layer top heights are not considered in the following analysis and discussion.
3.1 Two years of lidar observations – an overview
An overview of the complete measurement period in terms of the vertically-resolved temporal development of (a) the calibrated attenuated backscatter coefficient at 1064 nm and (b) the volume depolarization ratio at 532 nm is provided in Fig. 2. The lidar measurements provide a good basis for studying the annual cycle of the aerosol in the atmosphere above Mindelo. The local PBL, characterized by strong backscattering signal usually up to about 1 km height (red to white colors in Fig. 2a) shows no pronounced seasonal variation. During all the time, clouds could be identified at the top of the PBL, represented by the white color, i.e. very strong backscattering signal. The volume depolarization ratio in the PBL usually was low (blue colors in the lowermost kilometer of Fig. 2b), indicating the presence of spherical particles (marine aerosol and no dust). Very rarely, the volume depolarization ratio exceeded 0.1, e.g. in February 2022, which means the presence of some non-spherical dust particles. Above the PBL, the SAL was visible most of the time. The top height of the aerosol layer strongly varied throughout the two years. Beginning at around 6 km height on 1 July 2021, the aerosol layer top height decreased to around 3 km height in the time of November 2021–February 2022. Afterwards, an increase in the aerosol layer top reaching a maximum of around 6–7 km height in June 2022, followed by a similar pattern as described for the previous period was observed. The backscatter strength in the lofted aerosol layer was much smaller than in the PBL while the volume depolarization ratio varied from values up to 0.3 during the months of northern hemispheric (NH) summer and fall (June–September) to values around 0.1 or even less during the months of NH winter and spring (November–March). The higher values of the depolarization during the summer months indicate the presence of non-spherical particles, i.e. desert dust during that time, while the lower depolarization during NH winter point to a contribution of spherical particles, i.e. smoke as it is known from the previous campaigns.
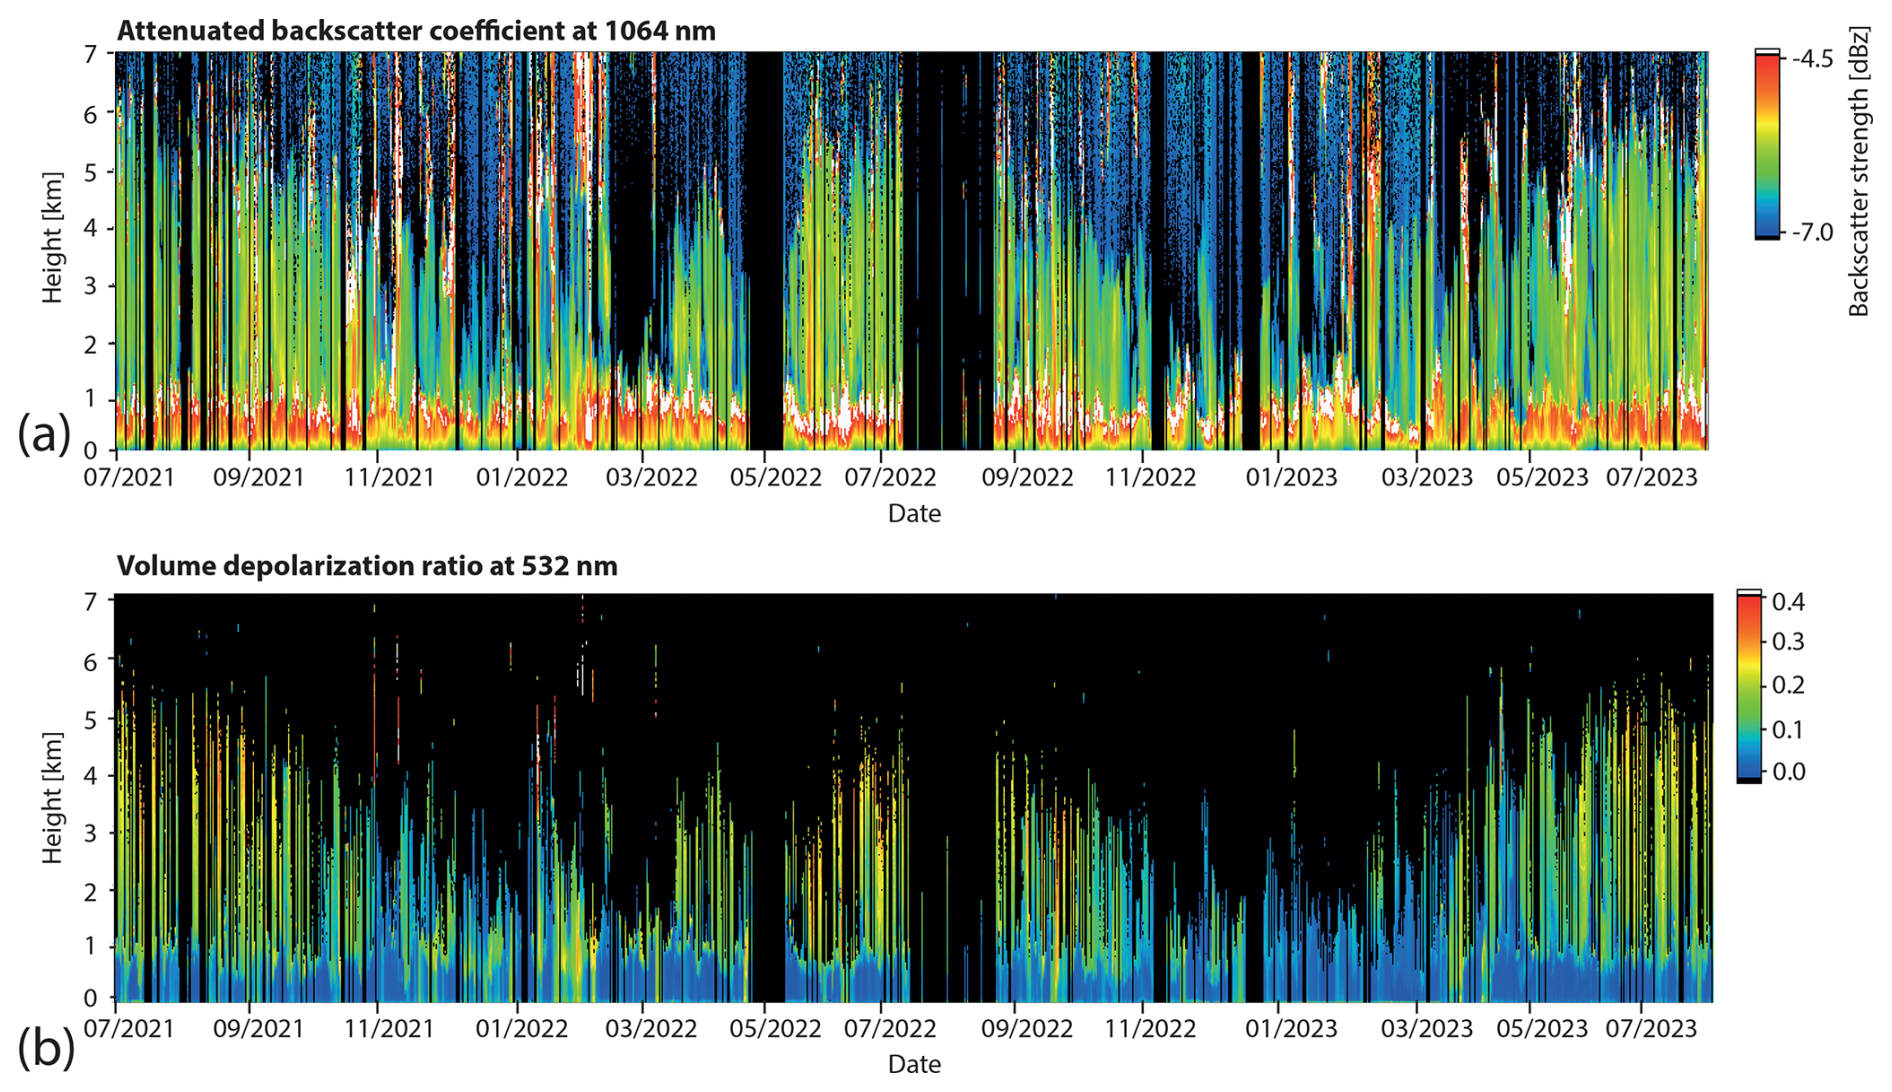
Figure 2Temporal development of the height-resolved (a) calibrated attenuated backscatter coefficient at 1064 nm and (b) the volume depolarization ratio at 532 nm measured with PollyXT at Mindelo between 1 July 2021–31 August 2023.
The temporal development of the manually-defined top height of the uppermost available aerosol layer of the Fri/Sat cases (could be also the PBL if no lofted layer was present) is also illustrated in Fig. 3. Seasonal mean values and their standard deviations for December–February, March–May, June–August, and September–November are added as numbers. Concerning the temporal evolution of the layer top height, from May to December, clear trends with low short-term variability were observed. Until August, the aerosol layer top heights increased and aerosol was present up to heights of 7 km. Afterwards a decrease of the layer top height was observed. In November and December, aerosol usually was present only below 4 km or even below. From January to April in both, 2022 and 2023, there was slightly more variability in the layer top height, which is in agreement with the observations from SAMUM–2a, showing more diverse aerosol structures during January and February 2008.
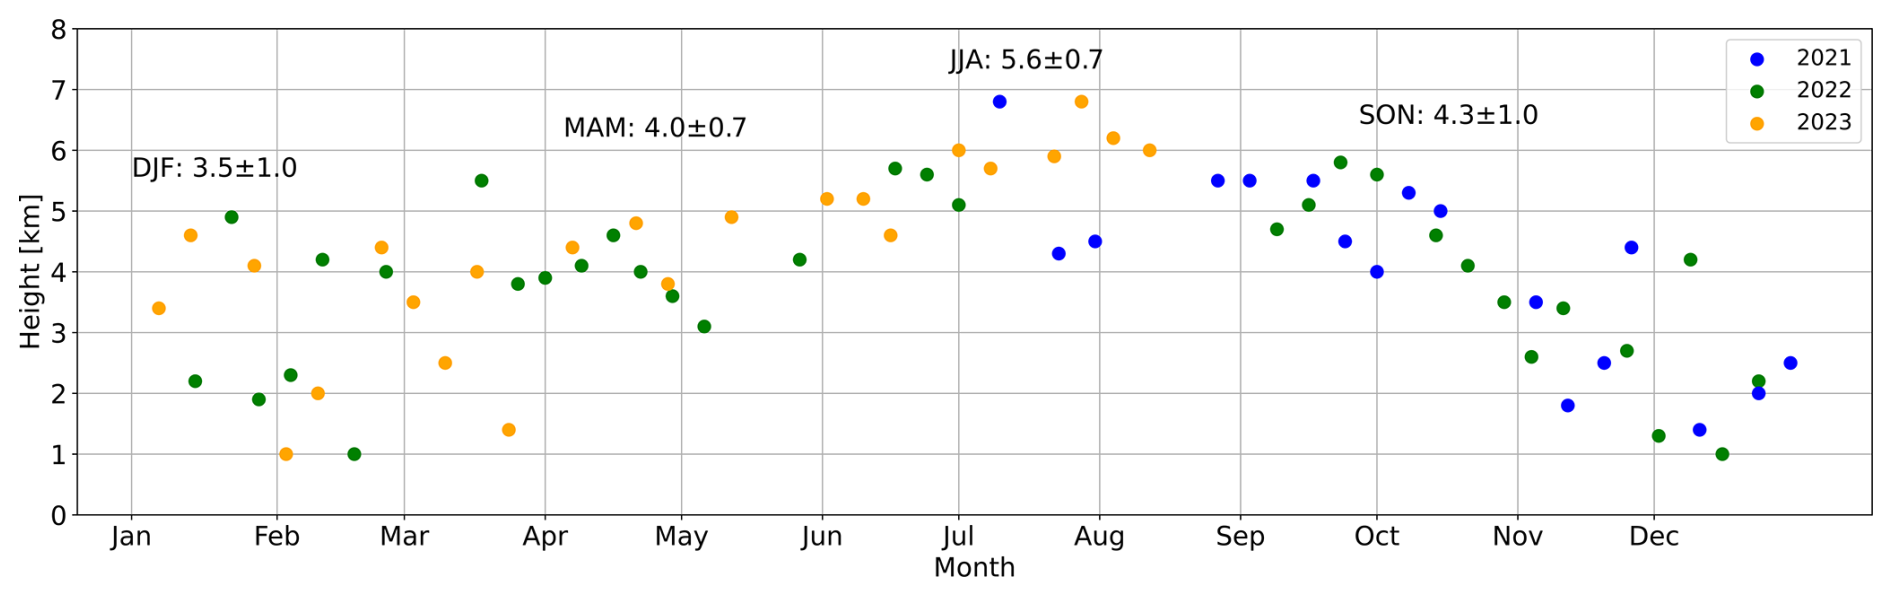
Figure 3Manually-defined top of the uppermost aerosol layer for the Fri/Sat cases. Error bars are neglected as they are very small (±50 m) and constant for all cases. Seasonal mean values and their standard deviation are given as numbers.
3.2 Temporal development of geometrical and optical layer properties
A more detailed and layer-resolved overview of the geometrical properties of the Fri/Sat cases is given in Fig. 4a in terms of time series of the PBL top height and the vertical extent of the lofted aerosol layers. PBL top heights ranged from values as low as 400 m up to 2 km, with the highest values being observed between October–April. The highest observed PBL top heights (between 1–2 km) are often associated with the absence of lofted aerosol layers. However, during October and April, the variation of the PBL top height was large and also low PBL top heights of approximately 400 m occurred. During NH summer, the top height of the PBL was mainly in the range of 700 m up to around 1 km. The top height of the lofted layer distinctly increased during NH spring and summer and was usually lower in NH fall and winter as discussed already in Sect. 3.1. Generally, the lofted layer was geometrically thicker during NH summer having an extent of up to 4–5 km. During NH fall and winter, the occurrence of lofted aerosol layers was more diverse. Shallow layers of around 1 km extent as well as layers of around 4 km extent were observed. Sometimes also no lofted layer was present. Mostly, only one lofted aerosol layer was occurring but in 27 cases, two or even three sublayers were identified. These cases are distributed all over the complete year. Multiple Saharan air layers which were distinctively separated from each other were observed in only two further cases, namely on 13 and 27 January 2023.

Figure 4Time series of the Fri/Sat cases including (a) the PBL height and the occurrence of lofted layers, (b) the layer-resolved lidar-derived AOD at 532 nm in comparison with the columnar AOD from AERONET, (c) the layer-resolved dust fraction at 532 nm, and (d) the integrated dust backscatter coefficient at 532 nm. The corresponding results at 355 nm are shown in Fig. B2.
Besides the geometrical thickness of the layers, the layer-resolved AOD at 532 nm was calculated from the lidar-derived extinction profiles and is shown in Fig. 4b together with the columnar AERONET AOD at 532 nm. In most cases, the AERONET AOD agreed well with the sum of the layer AODs, proofing the concept of this work. The first five cases are not representative as the NR-observation capabilities were not available and, thus, no AOD for the PBL could be retrieved leading automatically to an underestimation of the total AOD derived by the lidar compared to the one of AERONET. The general agreement of both methods to derive the AOD emphasizes the validity and representativeness of the selected profiles while the lidar measurements allow a layer-resolved evaluation of the AOD.
Strong annual variation can be identified in the total and the layer-AOD. Large total AODs up to values of around 0.5 and 0.6 were observed in June–July 2022 and in July–August 2023, respectively. In these periods, the contribution of the lofted layers to the total AOD was usually at least 50 %. Furthermore, a correlation with the layer thickness was found, i.e. during these summer months, the observed lofted layers were, both, geometrically and optically thick. The opposite was observed in the spring season, both, in 2022 and 2023, when geometrically thick lofted layers (extending up to 4 km) contributed to only a small fraction of the AOD (AOD values usually <0.1). During November–February, the total AOD of <0.1 up to around 0.3 was generally lower compared with June–August. Furthermore, the contribution of the lofted layer was usually smaller than the one of the PBL, i.e. the PBL contributed most to the total AOD during November–February. However, single outliers concerning the contribution of the layer-AODs to the total AOD were observed, e.g. on 24 February 2023, when the total AOD was around 0.55 and a lofted aerosol layer, caused by smoke transport from Africa, with an extent of around 4 km and an AOD of around 0.33 was present. Another outstanding pattern was observed in September/October 2021, when the total AOD reached comparably high values of almost 0.9 driven by a large contribution (60 %–80 %) of the PBL. This anomaly was caused by the volcanic eruption at La Palma, Canary Islands, causing the transport of sulfate aerosol in the PBL towards Cabo Verde as described in Gebauer et al. (2024). The evening of 24 September represents the largest total AOD of all analyzed Fri/Sat cases with a value of 0.88 at 532 nm. Additionally to that case, the volcanic influence was evident for at least two more dates: 1 and 15 October 2021.
The observed annual variations of the total AOD can be also seen in the long-term climatology (Fig. C1a). The monthly mean AERONET AOD at 500 nm from Sal, including the years 1999–2024, is lowest in November and December with values slightly above 0.2, starts to increase from January to May (mean values of 0.3–0.4) to a maximum in June (around 0.55) and decreases again from July to October with values between 0.5–0.35. Using these long-term observations, the selected Fri/Sat cases and the period 2021–2023 in general can be set into a larger context. The monthly mean AOD at 500 nm from Mindelo from the years 2021, 2022, and 2023 (star symbols in Fig. C1a) were often lower than the climatological monthly mean values which points to a generally lower aerosol load over Cabo Verde in our study period. More specifically, from January to June in 2022 and 2023 and in June 2021, the monthly mean AOD was around 0.1–0.2 lower than the climatological mean values. Only the monthly mean AOD of April 2021 was exceptionally high compared with the climatological mean but does not need to be further discussed here because it was before our study period. The months July–September 2021 showed a similar aerosol load like in the climatological long-term, whereas in 2023, the mean AODs of these months were also around 0.1 lower than the long-term monthly means. For 2022, the monthly mean AOD agreed with the climatological one in July and August, but was also smaller in September. The best agreement with the climatological mean values was found for October–December in all three years (2021, 2022, 2023), except for December 2022. These deviations of the study period from the climatological long-term statistics lead also to differences between the monthly mean AODs (500 nm) of the Fri/Sat cases and the long-term monthly means if the selected cases are on average representative for the Mindelo monthly mean of the complete period 2021–2023 (e.g. May, cf. Fig. C1b). In other months (e.g. February and June), the selected cases overestimate the average aerosol load of 2021–2023 at Mindelo and, thus, agree with the climatological monthly means (cf. Fig. C1b).
In Fig. 4c, the layer mean dust fraction at 532 nm is illustrated, which is an indicator for the contributions of dust and smoke/pollution components to the observed aerosol mixtures. The corresponding integrated dust backscatter coefficient at 532 nm for the lofted aerosol layer is shown in Fig. 4d. Both were derived with the POLIPHON algorithm, assuming a dust particle linear depolarization ratio of 0.31 (Tesche et al., 2009) as typically particle depolarization values between 0.25–0.35 have been observed for pure Saharan dust conditions (Tesche et al., 2011a; Veselovskii et al., 2016, 2018; Haarig et al., 2017; Bohlmann et al., 2018). However, due to this assumption that pure dust conditions correspond to a particle linear depolarization ratio of at least 0.31, the layer mean dust fraction hardly exceeded 0.9 even in the lofted layers of the summer months, i.e. June–August, when largest dust fractions were observed. Usually, they were in the range of 0.7–0.9. A value of 0.82 was found as the 90th percentile (horizontal line in Fig. 4c). Thus, there was always a non-dust contribution in the lofted layers, which might have been smoke or pollution. For the PBL, the observed layer mean dust fraction was negligibly low for most of the cases and, thus, we conclude that dust was not present in the PBL for most parts of the evaluated period. A higher dust fraction in the PBL with layer mean values up to 0.5 was found between 31 December 2021–18 March 2022 as well as during September 2022 and on 23 December 2022. During the period from December 2021 to March 2022, the dust fraction of the lofted layer was comparably small and in a similar range as for the PBL. These findings indicate a low dust content and a high smoke fraction in the lofted layers during winter and spring and the mixing of the dust down into the PBL as already discussed in Tesche et al. (2011a). In contrast, during summer, the dust contribution was clearly separated between the PBL and the lofted layer with almost no dust in the PBL and dust fractions up to 0.9 in the lofted layer.
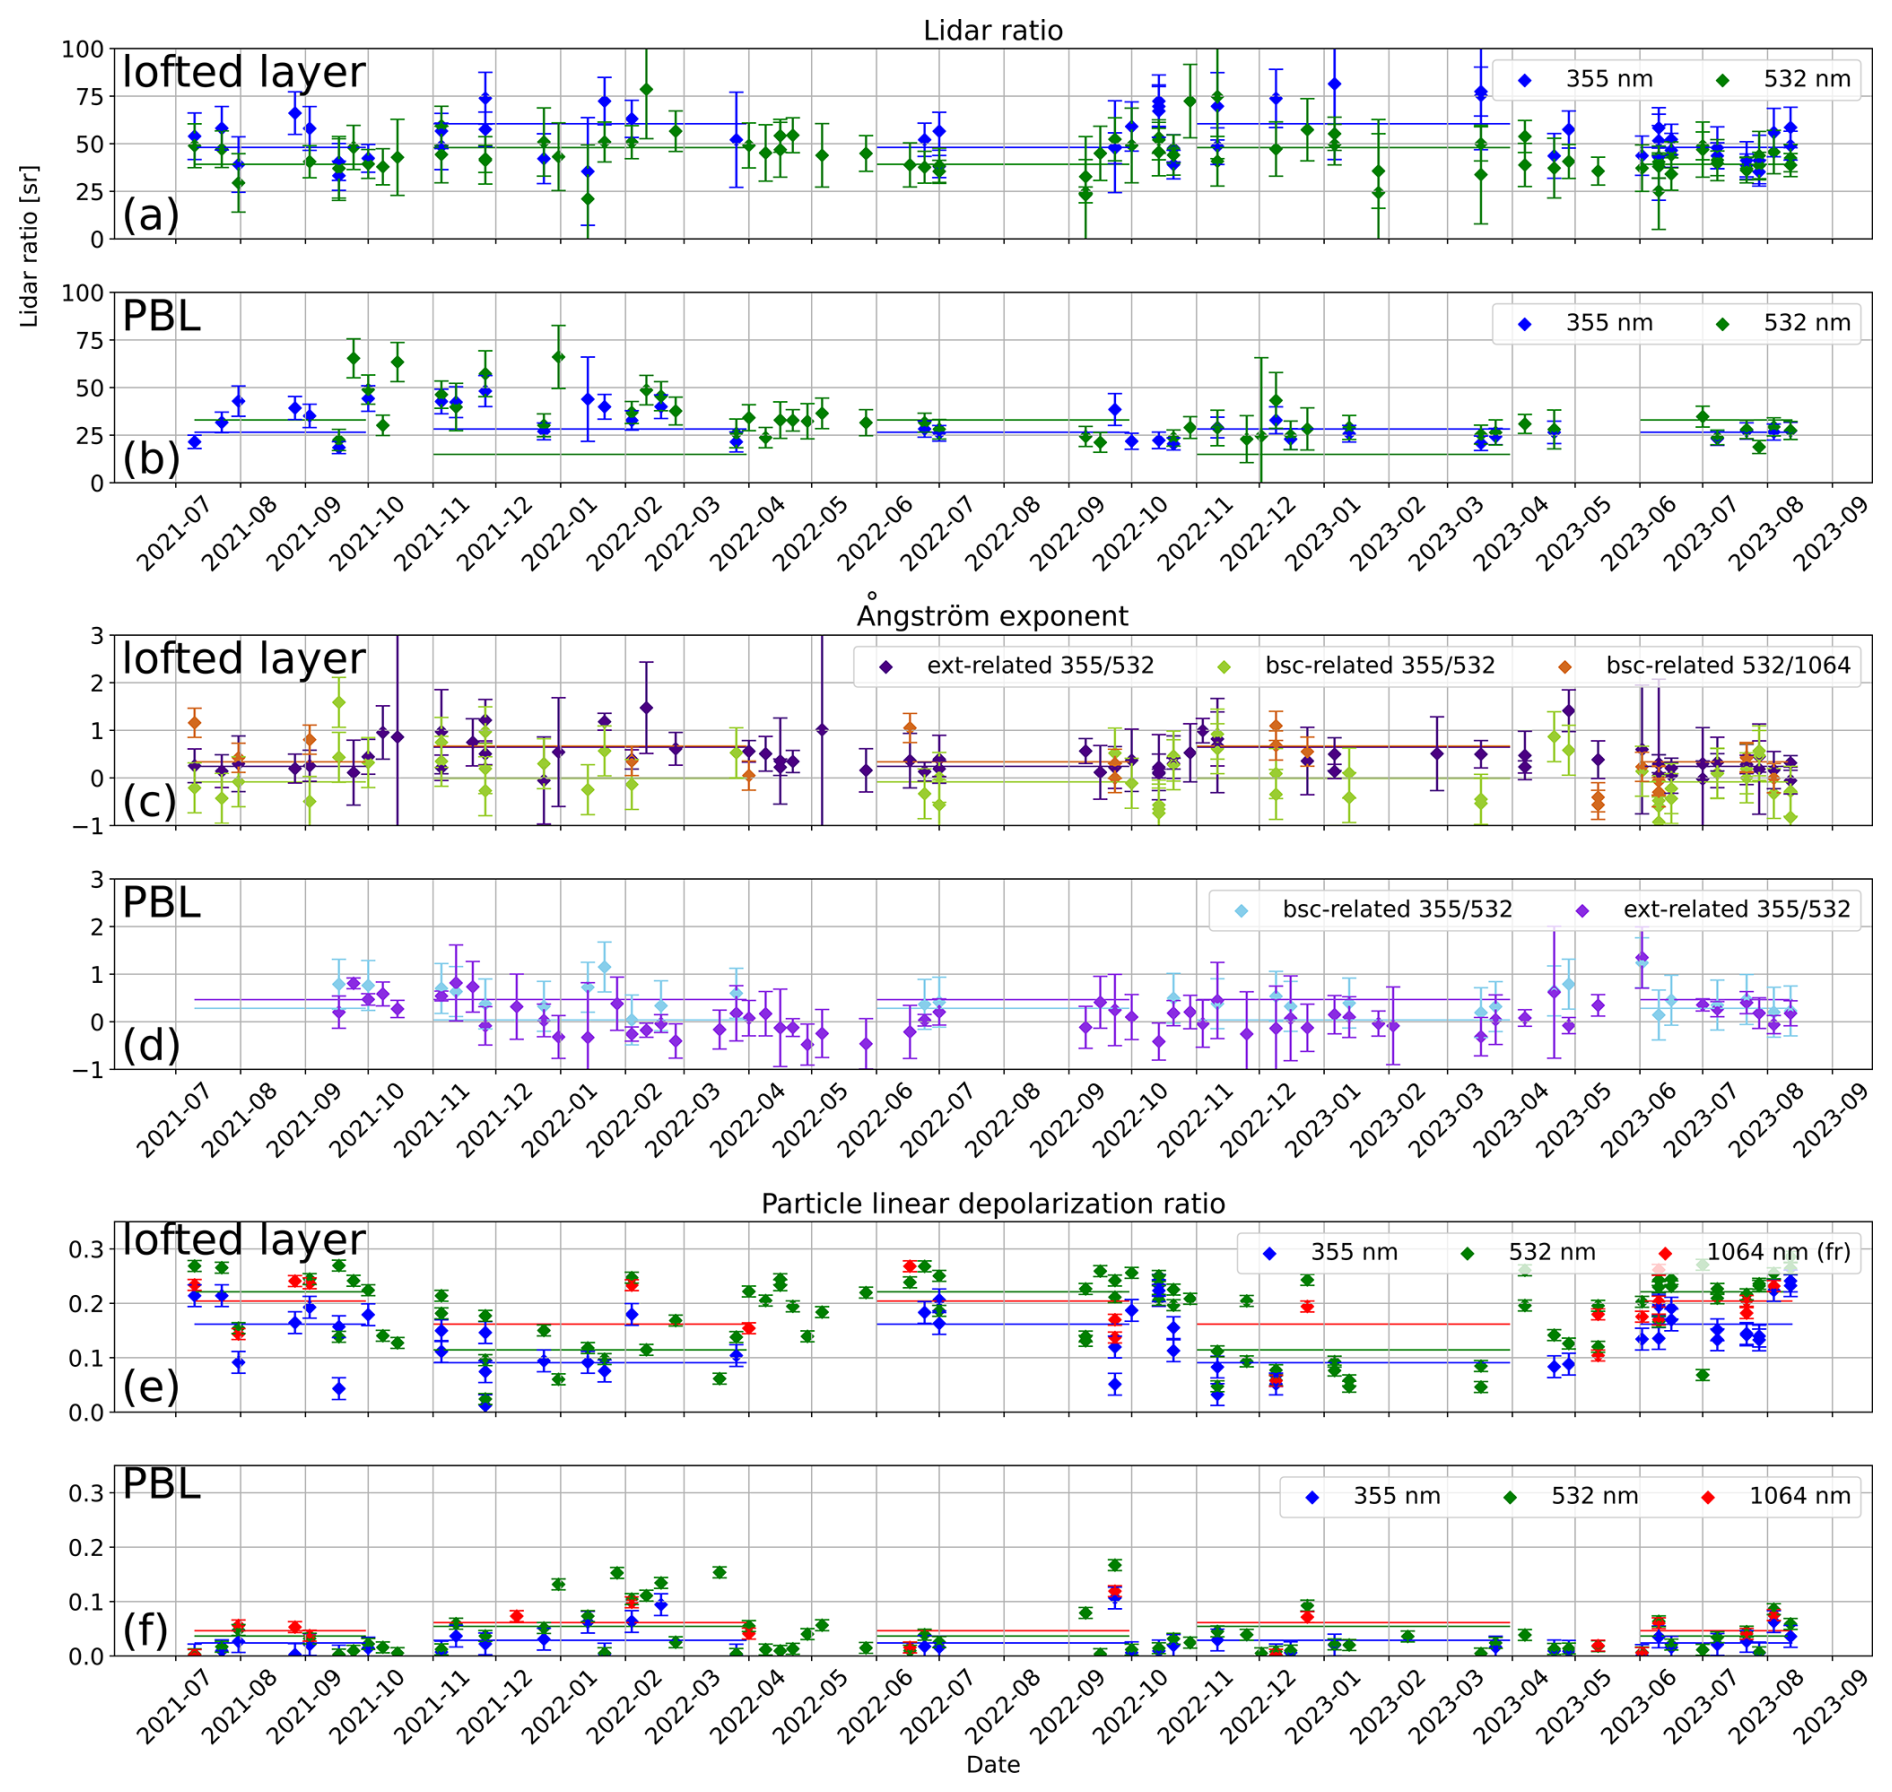
Figure 5Layer resolved time series of the Fri/Sat cases including (a) and (b) the lidar ratio at 355 and 532 nm, (c) and (d) the backscatter- and extinction-related Ångström exponent for the wavelength pairs 355/532 nm and 532/1064 nm, and (e) and (f) the particle linear depolarization ratio at 355, 532, and 1064 nm. The horizontal lines indicate the seasonal mean values for the dust season and the mixing season.
3.3 Layer-resolved intensive optical properties
Time series of the layer-resolved lidar ratios, Ångström exponents, and particle linear depolarization ratios for the different wavelengths are shown in Fig. 5. Slight temporal variations are visible, but the weekly fluctuations and the large error bars of the lidar ratio and the Ångström exponent make it difficult to identify a clear seasonal cycle. The seasonal cycle, especially for the lidar ratio and the depolarization ratio of the lofted aerosol layers, is more visible when monthly averages of the Fri/Sat cases are considered (Fig. B3). Between November and April, the lidar ratio exhibited largest values up to 75 sr (monthly averages, Fig. B3d) and 80 sr (single Fri/Sat cases, Fig. 5a) at 355 nm. During that time of the year, the differences between the lidar ratio values at 355 and 532 nm were largest, especially for the winter period 2022–2023. At 532 nm, usually less than 60 sr were observed. These high values and the strong wavelength dependence indicate a mixture of dust and smoke, which is supported by the large extinction-related Ångström exponent values around 1 and the slightly positive values of the backscatter-related Ångström exponent between 355–532 nm shown in Figs. 5c and B3f (Floutsi et al., 2023). Furthermore, the particle linear depolarization ratio was usually <0.2 at all wavelengths (Figs. 5e and B3h). From April to September, the lidar ratio of the lofted layers was more similar at both wavelengths with values between 30–60 sr, but still slightly larger at 355 nm than at 532 nm. During these months, the extinction- and backscatter-related Ångström exponents mainly varied between −0.5–0.5 with the extinction-related Ångström exponent being always positive and larger than the backscatter-related Ångström exponent. The backscatter-related Ångström exponent in the wavelength range 355–532 nm can be used as an indication for the hematite mass fraction in the dust particles which varies with source region (Gómez Maqueo Anaya et al., 2025). The particle linear depolarization ratio reached values between 0.2–0.3 and was mostly largest at 532 nm, followed by 1064 nm and was smallest at 355 nm. The wavelength dependence for, both, the particle depolarization ratio and the lidar ratio has already been reported by Haarig et al. (2022) for slightly polluted Saharan dust from similar source regions.
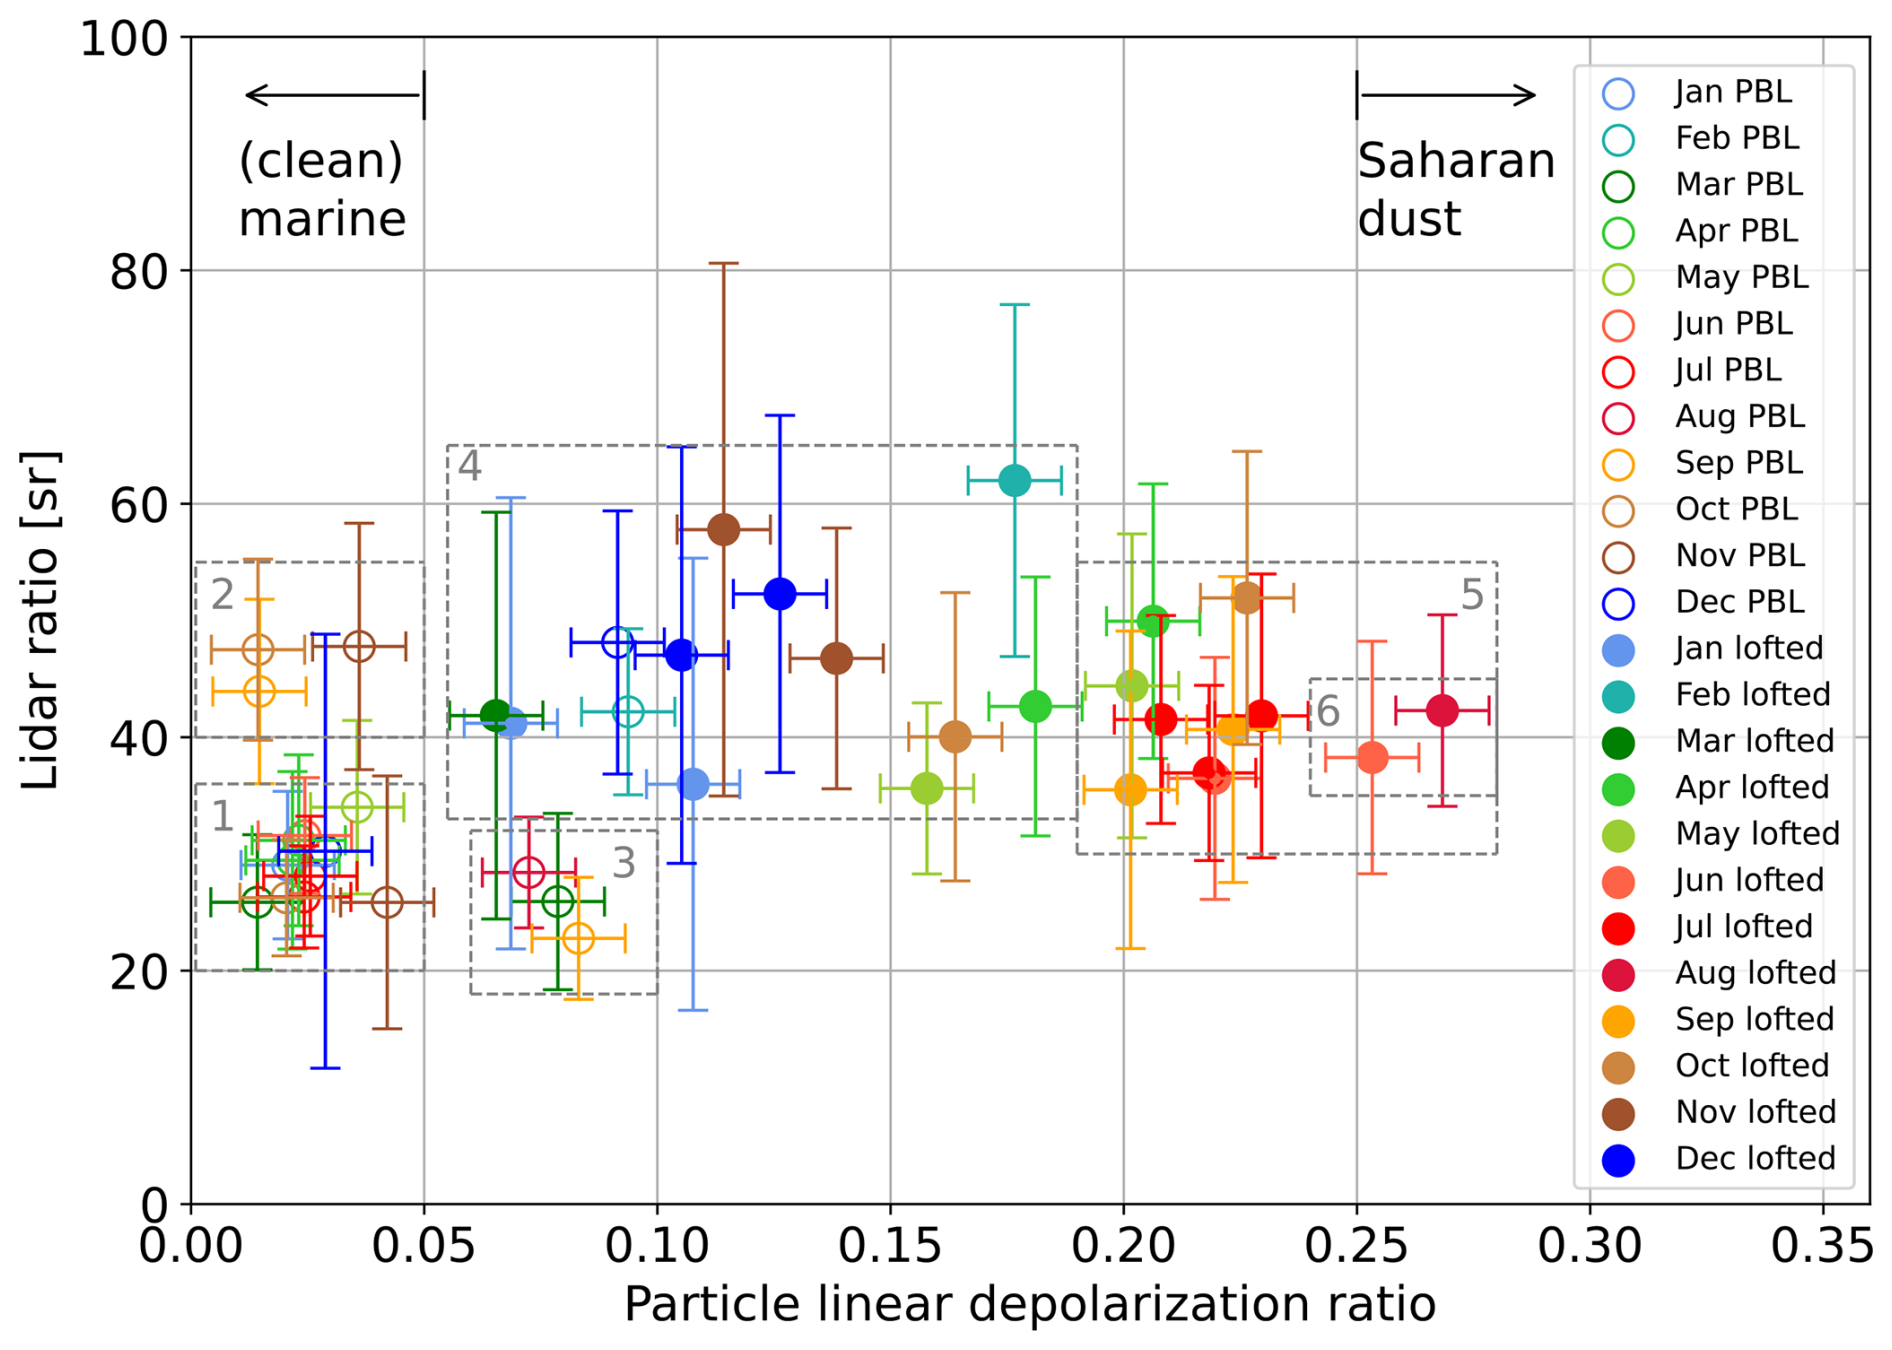
Figure 6Monthly mean lidar ratio vs. monthly mean particle linear depolarization ratio (both at 532 nm) for the PBL and the lofted layer (unfilled and filled circles, respectively) based on the Fri/Sat cases. The error bars include the monthly mean error (described in Sect. 2.1) plus the standard deviation (temporal variability). The gray dashed rectangles mark the clusters of aerosol types which are (1) marine PBL, (2) PBL polluted with volcanic sulfate, (3) PBL with dust-marine-mixture, (4) dust-smoke-mixture, (5) dust-dominated lofted layers, and (6) nearly pure dust lofted layers.
In the PBL, the seasonal cycle was less pronounced. The lidar ratio (Figs. 5b and B3e) was usually below 30 sr at 355 and 532 nm. However, from September to December 2021, values up to almost 70 sr were observed, caused by volcanic sulfate as described in Gebauer et al. (2024). The Ångström exponents between 355–532 nm showed almost no temporal development during the complete time series from July 2021 to August 2023. In almost all cases, the backscatter-related Ångström exponent was, with values between 0–1, larger than the extinction-related one, which varied around 0. Also the particle depolarization ratio was mostly close to 0 at all three wavelengths, except between October 2021–April 2022 and at the beginning of October 2022, when the values increased up to more than 0.1. The observed values of the lidar ratio point to slightly polluted marine conditions as for pure marine conditions lower values between 16–23 sr were reported in previous studies for the vicinity of Cabo Verde and the Canary Islands (Bohlmann et al., 2018; Barreto et al., 2022). In the months of NH fall and winter, the higher particle linear depolarization ratio indicates a contribution of non-spherical particles, i.e. Saharan dust, which has been also observed by Tesche et al. (2011a), Bohlmann et al. (2018), and Barreto et al. (2022) between November–January. As mentioned above, the data of the described time series were also averaged per month for each specific year as shown in Fig. B3. It is important to note that the shown data points are not statistically significant monthly mean values. Each data point shown in Fig. B3 is the average of at most four/eight (PBL/lofted) single values (four weeks per month and year with maximum two lofted sublayers, which were considered separately). However, the temporal trends in the optical properties are visible more clearly. These monthly mean data points were also used for creating a 2D space of the lidar ratio and the particle linear depolarization ratio as shown for 532 nm in Fig. 6, allowing a more concrete aerosol typing for the different layers (unfilled circles for the PBL and filled circles for the lofted layers) and different times of the year (indicated by the different colors).
Figure 6 was created accordingly to Fig. 2 of Floutsi et al. (2023). This combination of the lidar ratio and the particle linear depolarization ratio is commonly used in aerosol classification as in Burton et al. (2012), Groß et al. (2013) or Wandinger et al. (2023). Using the existing knowledge about the typical values of these two parameters for different aerosol types, we defined some clusters of aerosol types in Fig. 6. A cluster of data points of the PBL with a particle linear depolarization ratio below 0.05 and a lidar ratio between 20–40 sr can be attributed to polluted marine aerosol (cluster 1) due to the slightly enhanced lidar ratio around 30 sr compared with 20 sr for clean marine aerosol (Rittmeister et al., 2017; Bohlmann et al., 2018; Floutsi et al., 2023). Most of the data points of the PBL are in cluster 1, but there are also three more data points (March and September 2022 and August 2023) with similar values of the lidar ratio but larger values of the particle linear depolarization ratio between 0.05–0.1, which represents a mixture of marine aerosol with dust (cluster 3). Furthermore, the influence of the volcanic sulfate (cluster 2) can be seen for the three data points of the PBL of September, October, and November 2021, which have particle linear depolarization ratios below 0.05 but enhanced lidar ratios between 40–50 sr. Concerning the lofted aerosol layers, the figure shows quite complex aerosol conditions with lidar ratios between 30–70 sr and a wide range of values of the particle linear depolarization ratio, indicating different contributions of non-spherical and spherical particles. According to Floutsi et al. (2023), data points with a particle linear depolarization ratio larger than 0.25 point to the occurrence of nearly pure dust in the lofted layers (cluster 6). Data points with a particle linear depolarization ratio larger than 0.2 indicate dust-dominated lofted layers (cluster 5), which is used as a threshold for non-spherical particles in the target categorization of Baars et al. (2017) and by Veselovskii et al. (2016) for the identification of aerosol layers with a major dust contribution. All remaining data points were considered to indicate dust-smoke-mixtures (cluster 4) with different contributions of dust and smoke components as the influence of transported biomass burning aerosol has been typically observed in the region over West Africa and Cabo Verde (Tesche et al., 2011b; Bohlmann et al., 2018; Veselovskii et al., 2018, 2020). Furthermore, fires in semi-arid areas might emit additional soil dust together with the biomass burning smoke (e.g. Wagner et al., 2018). In cluster 4 (dust-smoke-mixtures), a few data points of the PBL are included, namely December 2021 and February 2022. Besides them, only data points of the lofted layers can be found in cluster 4 and 5 (dust-dominated). For the data points of the lofted layers, a strong monthly dependence can be observed. The data points in the dust-dominated cluster 5, including the cluster 6 of nearly pure dust, belong to the months June–September of all years and April, May, and October 2022. April, May, and October of the remaining years are located in the more dust-dominated part of the dust-smoke cluster 4 (particle linear depolarization ratio between 0.15–0.2), while the data points of November–January and March are in the more smoke-dominated part of cluster 4 with values of the particle linear depolarization ratio smaller than 0.15. Only the data point of the lofted layer of February 2022 is outstanding with a particle linear depolarization ratio close to 0.18 (lidar ratio around 60 sr). The reason for this anomaly is that the monthly mean data point includes measurements of nearly pure lofted dust layers as well as lofted layers with a large smoke contribution.
The described pattern can be partly explained with the seasonality of the fire activity in 2021–2023 based on assimilated MODIS observations provided by the Global Fire Assimilation System (GFAS; Kaiser et al., 2012), shown in Fig. D1 together with their anomaly compared with 2003–2025. In addition, a seasonal cluster analysis of backward trajectories from the hybrid single-particle Lagrangian integrated trajectories (HYSPLIT; Stein et al., 2015; Rolph et al., 2017; HYSPLIT, 2026) model is shown in Fig. D2. Fire activity in the Sahel zone and south of it was present from September to November with mostly positive anomalies across the entire Sahel zone and especially from December to February with a positive anomaly in the central Sahel and a negative anomaly in large parts of the southern Sahel and south of it. The trajectory analyses indicate air mass transport from Senegal, Mauritania, and Mali, a region with little fire activity but a positive anomaly, with a probability of around 50 % in the time from September to February. Similarly, in Fig. 6, the data points with the lowest particle depolarization ratio, i.e. smaller than 0.15, belong to the months November, December, January, and March. From March to May, there was a strong fire activity with a positive anomaly in Senegal and Guinea and a strongly negative anomaly of the fire radiative power in the countries south of them. Air masses were advected from Senegal and Guinea Bissau with a 43 % probability, which might have caused the large smoke contribution in March 2023 and a certain smoke contribution in April and May 2023. Very little fire activity in Senegal and Guinea Bissau and in further single spots in the Sahel zone was still remaining in the period June–August indicating a slightly positive anomaly across the complete Sahel region. As all of the cluster mean trajectories for June–August pass the Sahel zone and partly Senegal and Guinea Bissau also a low smoke contribution in the lofted layers of Saharan dust might be assumed as even for the dust-dominated cases lower particle linear depolarization ratio values than in the previous studies of pure dust were observed (Tesche et al., 2011a; Veselovskii et al., 2016, 2018; Bohlmann et al., 2018). Furthermore, a pollution component cannot be excluded for the months in the dust-dominated and even the nearly pure dust clusters (5 and 6, respectively).
Based on two years of lidar profiling, a first attempt to distinctively define the dust season (dominated by Saharan dust), the mixing season (dominated by dust-smoke-mixtures), and transition months at Mindelo is discussed in the following. Months are attributed to the dust season if
-
their monthly averages of the lofted layers occurred in the dust-dominated cluster (cluster 5) in Fig. 6 and
-
more than half of their measurement cases exceeded for the lofted layers a layer mean particle linear depolarization ratio of 0.2 (at 532 nm) according to the threshold for non-spherical particles in the target categorization of Baars et al. (2017)
In contrast, for the mixing season, in a first step all months which are no dust months are considered. As during SAMUM–2a the occurrence of dust close to the ground as well as mixtures of dust and smoke in the lofted layers were reported during January and February, we defined different criteria to identify those dates of the Fri/Sat cases with similar aerosol conditions like during SAMUM–2a:
-
a dust fraction larger than 0.1 in the PBL, i.e. dust present close to the ground,
-
a dust fraction lower than 0.5 in the lofted aerosol layers
Following both definitions, the months June–September were attributed to the dust season. The mixing season was defined to range from November–March. April, May, and October were dust months in 2022 but not in the other years, i.e. the dust season can be extended to April–October in some years. Thus, April, May, and October were defined as transition months as they might be dust months in some years but in others not.
Table 1Seasonal mean geometrical and aerosol optical properties for the dust and the mixing regime at Mindelo. The uncertainty includes the seasonal mean of the errors described in Sect. 2.1 plus the temporal standard deviation of the corresponding property. If the uncertainty exceeds the physically possible values, the range of possible values is given in brackets. Sublayers of the lofted layer were considered separately for averaging, except for the AOD and the layer thickness, which are given for the total lofted layer.
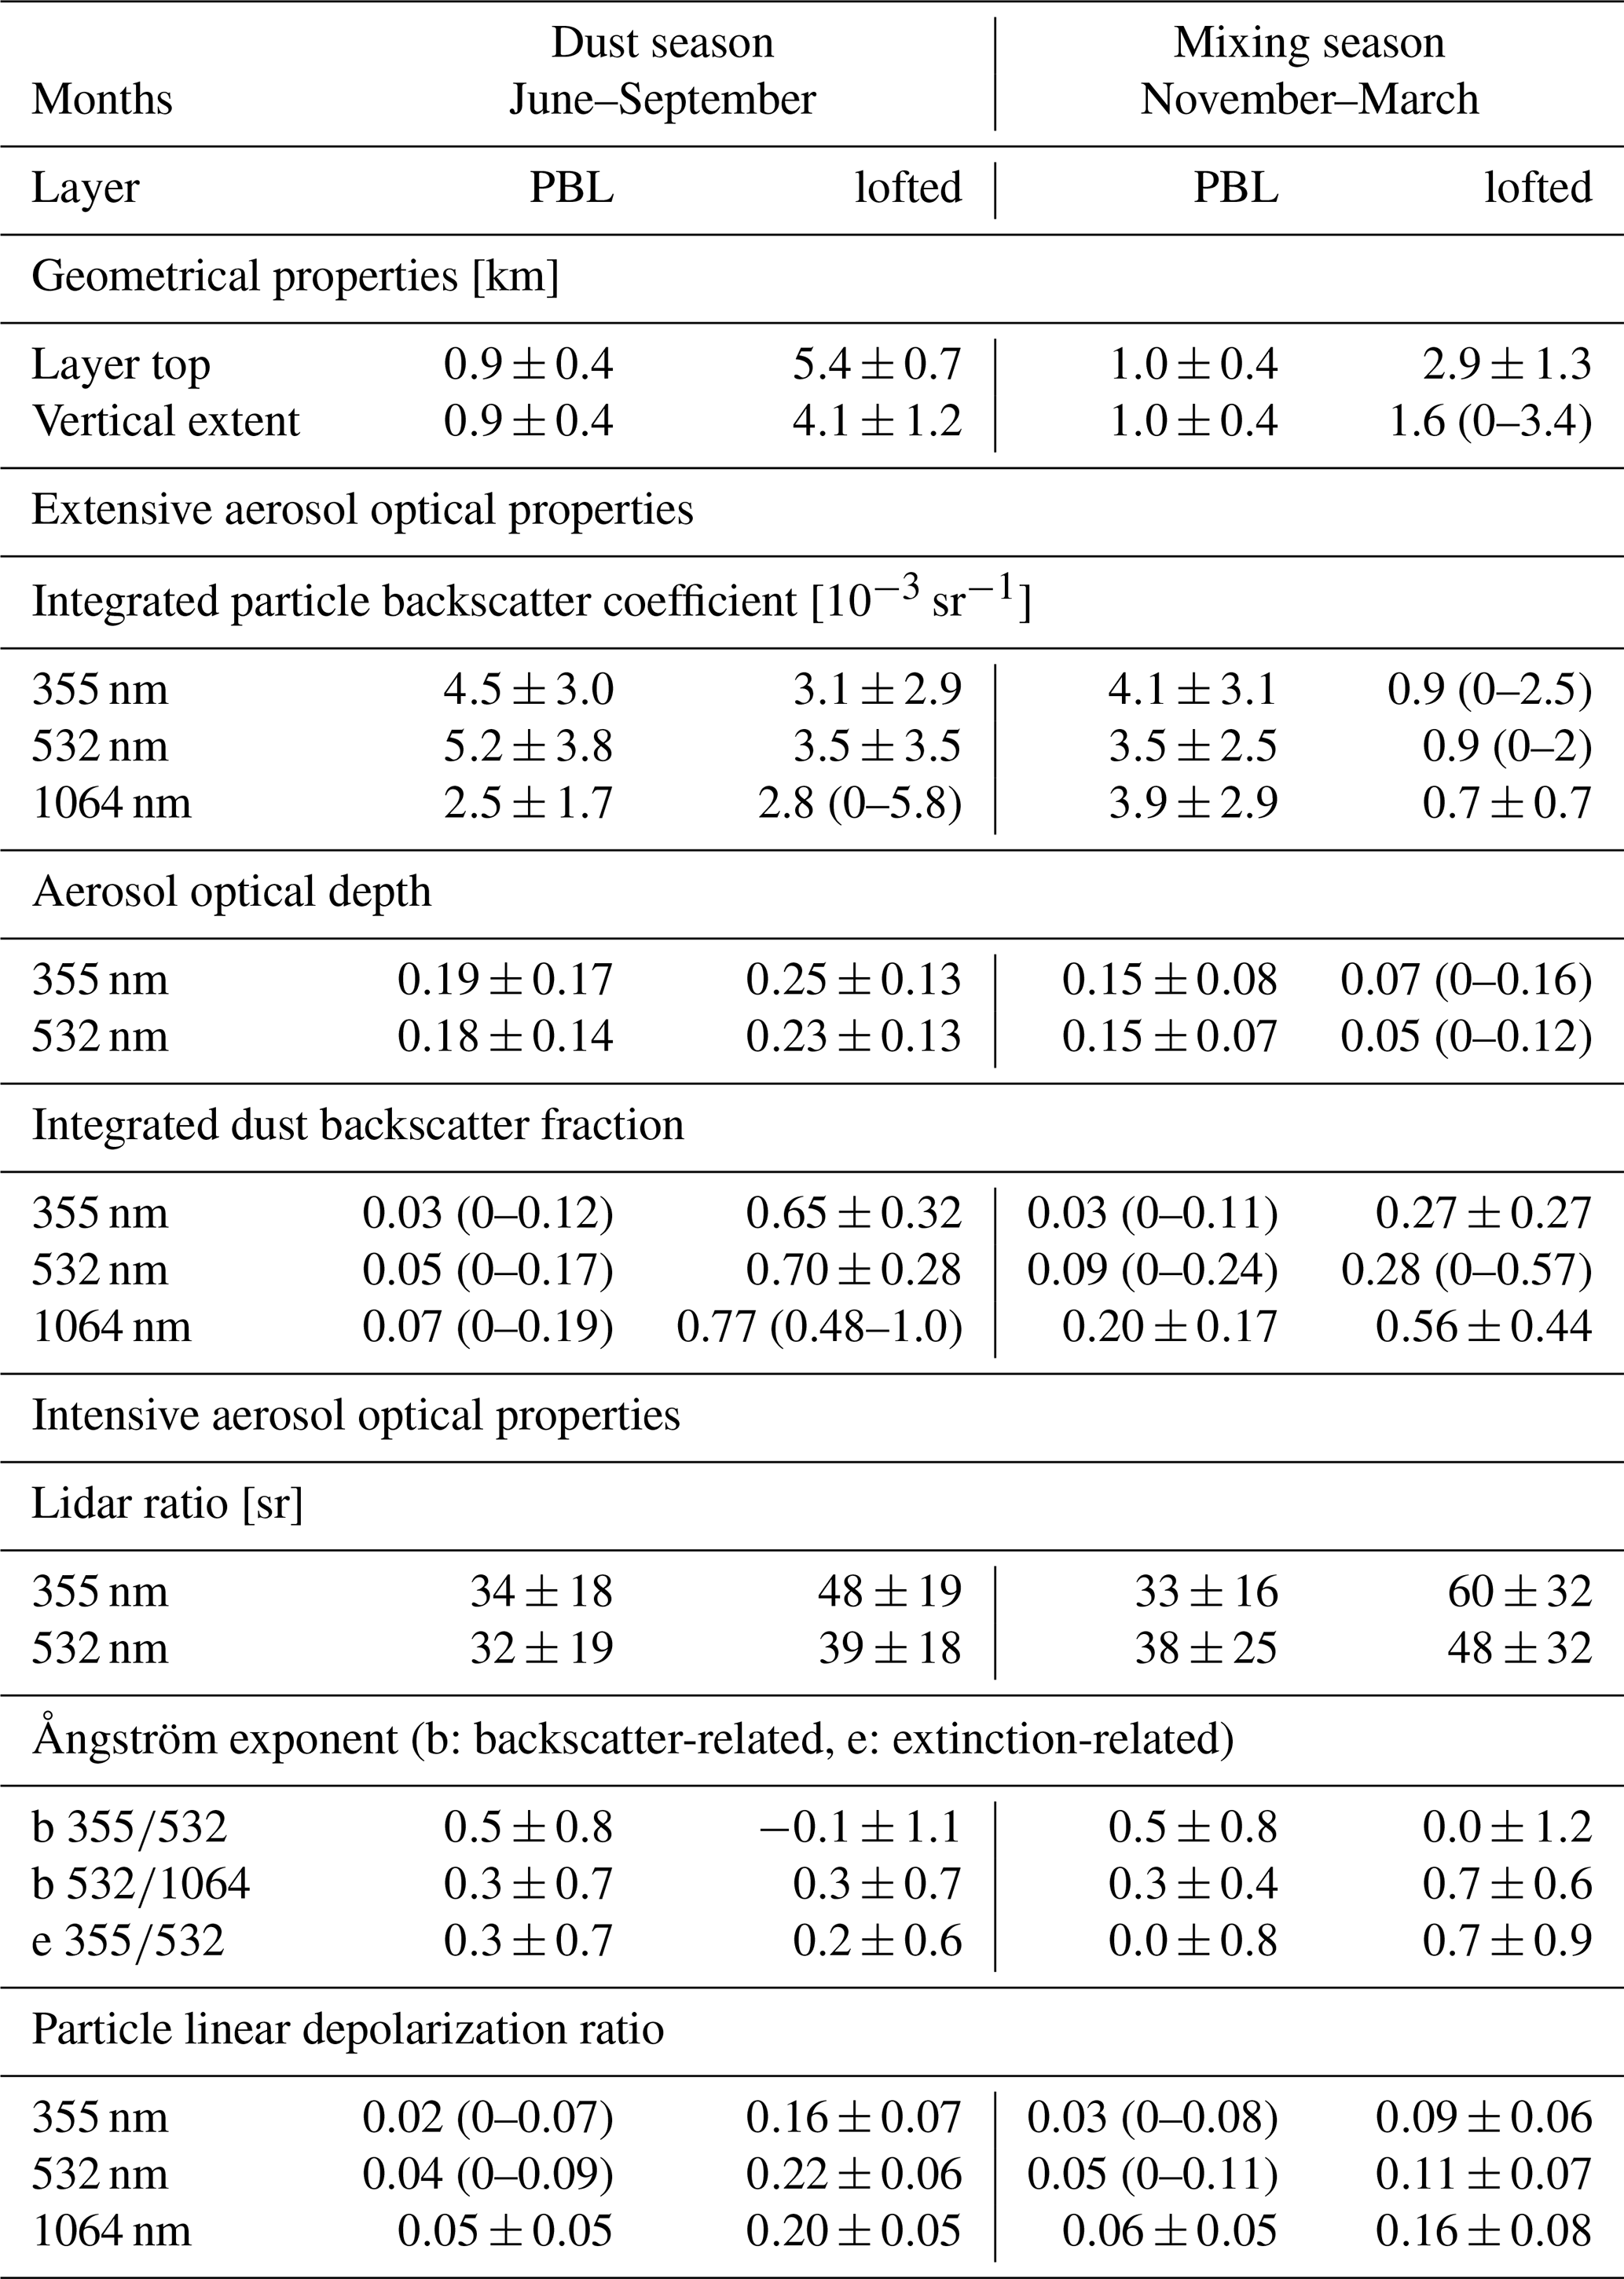
Seasonal mean values of the layer-resolved geometrical and optical properties of the dust season and the mixing season are presented in Table 1. According to these values, the dust season is characterized by geometrically and optically thick lofted layers of Saharan dust with a seasonal mean dust fraction between 0.65–0.77 at 355, 532, and 1064 nm. For this season, a positive correlation between the geometrical and optical thickness of the lofted layers was found, represented by a coefficient of determination (square of correlation coefficient) of 0.71 and illustrated in Fig. B4. The total AOD at 532 nm is usually larger than 0.3 with a contribution of the AOD of the lofted aerosol layer to the total AOD larger than 50 %. The seasonal mean aerosol layer top height is 5.4±0.7 km. In the dust season, the aerosol conditions in the lofted layers and in the PBL strongly differ from each other. The dust content in the PBL is low with a seasonal mean dust fraction below 0.07 at all three wavelengths. Furthermore, we found a seasonal mean lidar ratio of 34±18 and 32±19 sr at 355 and 532 nm, which indicates a slight pollution of the PBL probably due to the anthropogenic influence.
The mixing season is characterized by a large variability of aerosol types and geometrical layer properties within this season. The seasonal mean aerosol layer top height is 2.9±1.3 km. Generally, the aerosol conditions in the PBL and in the lofted layer are more similar than during the dust season. The mean dust fraction of the mixing season is between 0.03–0.2 for the PBL and between 0.27–0.56 for the lofted layers (both at 355, 532, and 1064 nm). In the mixing season, mean lidar ratios of 33±16 and 38±25 sr and of 60±32 and 48±32 sr for the PBL and for the lofted layers, respectively, were observed at 355 and 532 nm, respectively. Compared with the ones from the dust season, the larger seasonal mean lidar ratio values in the lofted layers of the mixing season, especially at 355 nm, indicate a large smoke contribution. Similar values and the observed wavelength dependence with the lidar ratio at 355 nm being larger than at 532 nm have also been reported by Bohlmann et al. (2018), Veselovskii et al. (2018), and Veselovskii et al. (2020) for mixtures of dust and smoke.
Our results are generally in agreement with previous observations of aerosol in the outflow region of the Saharan desert. However, for some of the optical properties, the seasonal mean values differ from the previous results within the uncertainty range. For all the comparisons, it needs to be considered that the uncertainties in all the discussed campaigns are relatively large. Final conclusions should be drawn with care. Barreto et al. (2022) found the same layering over the Canary Islands with the SAL reaching up to 6 km height, clearly separated from the marine boundary layer in July and August, which we found as the peak of the dust season. Furthermore, Veselovskii et al. (2020) reported both, pure dust episodes as well as the presence of smoke over Senegal in April 2015 and in Bohlmann et al. (2018), a case with a dust-smoke-mixture in the vicinity of Cabo Verde, occurring in April 2016, is described. These observations together with our findings that April was a dust month in 2022 but not in 2023 supports its classification as transition month. From November to January, Barreto et al. (2022) observed the SAL being limited to 2 km height and partly mixed into the PBL, which also fits our results for the mixing season. However, the average lidar ratio values at 532 nm retrieved by Barreto et al. (2022) differ from our seasonal mean values at 532 nm. While we observed a higher lidar ratio in the PBL (dust season: 32±19 sr; mixing season: 38±25 sr) than Barreto et al. (2022) (dust season: 19 sr; mixing season: 15 sr) the lidar ratio in the lofted layer (dust season: 39±18 sr; mixing season: 48±32) was lower than in Barreto et al. (2022) (dust season: 47 sr; mixing season: 51 sr). The differences for the PBL might arise from local influences. Furthermore, the lidar ratio in Barreto et al. (2022) was retrieved, using the two-layer approach according to Berjon et al. (2019), while we were able to measure it directly with the PollyXT lidar. In the two-layer approach, the presence of a PBL and a lofted layer is assumed and the lidar ratio for each of them is calculated from measurements of two AERONET sun photometers deployed at two different altitudes, i.e. in the PBL and the lofted layer. These lidar ratios are used to retrieve the particle extinction coefficient from the particle backscatter coefficient measured by an elastic micropulse lidar. Limitations of this approach compared to a direct lidar ratio retrieval are that the boundaries of the layers and the lidar ratio in the transition zone in-between have to be estimated. Furthermore, only a constant lidar ratio for each layer can be retrieved and vertical variability as observed in the cases of dust-smoke-mixtures can not be considered.
To also contextualize the SAMUM–2 campaigns with the time frame of the dust and the mixing season, we can state that SAMUM–2a (15 January–15 February 2008) was performed in the middle of the mixing season, while SAMUM–2b (15 May–15 June 2008) took place really at the beginning of the dust season. Thus, the seasonal mean layer top height of the mixing season is with 3.0±1.8 km height only slightly lower than 3.5±1.2 km during SAMUM–2a (Tesche et al., 2011a). However, the lidar-based seasonal mean total AOD at 532 nm at Mindelo was 0.20±0.14 and, thus, smaller than the mean AERONET AOD of 0.35±0.18 at 500 nm for SAMUM–2a (Tesche et al., 2011a), which can be explained by inter-annual variations. In the long-term AERONET measurements from Sal, the annual mean AERONET AOD at 500 nm was slightly larger in 2008 and 2021 than the long-term climatological average value (0.34±0.15), while the years 2022 and 2023 had on average a lower aerosol load than the long-term mean and, especially, than the year 2008 (Fig. C2a). More specifically, in 2021/22 and 2022/23, the mean AERONET AOD of the complete mixing season was lower than the mixing season long-term mean AOD (0.26±0.05) and around 0.1 lower than the mixing season mean AOD from 2007/08, which was also higher than the long-term mixing season mean (Fig. C2b). These inter-annual variations might be connected to the fact that we observed much less low-level dust events over Mindelo during the mixing season than expected based on the experience from, e.g. SAMUM–2a. If we did not miss these events by the selection of the Fri/Sat cases (e.g. low-level dust events maybe coinciding with cloud occurrence and, thus, not appearing in our dataset), the lower mixing season mean AOD in our sudy period could be a hint for a reduced transport of dust at low altitudes towards Mindelo during the mixing season. However, the AERONET AOD has some limitations as it is a columnar quantity and we can not certainly state that the lower mixing season AODs in our study period were caused by less low-level dust and not less smoke occurrence. The smoke occurrence was probably less than during SAMUM–2a as the anomaly of the fire radiative activity over Africa between December–February 2007/08 and December–February 2021/22 and 2022/23 (Fig. D1k) shows a strong decrease of the fire activity in large parts of the burning areas. This observation might explain why the mixing season mean lidar ratios at Mindelo are also smaller than the ones from SAMUM–2a (60±32 vs. 70±16 sr at 355 nm and 48±32 vs. 69±15 sr at 532 nm; Tesche et al., 2011a). However, we observed a wavelength dependence of the lidar ratio with larger values at 355 nm than at 532 nm in the lofted layers over Mindelo which is typical for dust-smoke-mixtures and which was missing in SAMUM–2a. Also the seasonal mean particle linear depolarization ratio of the lofted layers is smaller compared with SAMUM–2a (0.11±0.07 vs. 0.15±0.05 at 532 nm; Tesche et al., 2011a), which would mean indeed a larger fraction of smoke than during SAMUM–2a.
For the dust season, most of the differences to the findings from SAMUM–2b may be explained with the temporal difference between the campaign and the time frame of the dust season. For example, the mean aerosol layer top height was smaller during SAMUM–2b, because the months with the highest aerosol layer top heights, namely July and August, were missing. Furthermore, in contrast to SAMUM–2b, we did not observe a totally clean marine PBL, but slightly polluted conditions and also a few cases with a dust-marine-mixture. The latter cases occurred in the middle and at the end of the dust season, which is the time period not covered by SAMUM–2b. The main differences to SAMUM–2b we observed in the lofted aerosol layers during the dust season. We found a wavelength dependence and lower seasonal mean values of the lidar ratio (48±19 and 39±18 sr at 355 and 532 nm, respectively, compared with 53±10 and 54±10 at 355 and 532 nm, respecively, during SAMUM–2b Tesche et al., 2011a) and a lower particle linear depolarization ratio (seasonal mean values between 0.16–0.22 at 355, 532, and 1064 nm compared with mean values between 0.26–0.37 at 355, 532, and 710 nm during SAMUM–2b; Tesche et al., 2011a). In the DeLiAn dataset (Floutsi et al., 2023), values of 53.5±7.7 and 53.1±7.9 sr are given as the mean lidar ratios for Saharan dust at 355 and 532 nm., i.e. there is also no wavelength dependence. However, Bohlmann et al. (2018) and Veselovskii et al. (2020) also reported dust observations with a higher lidar ratio at 355 nm compared with the one at 532 nm, like we found in our study, as well as dust episodes with no wavelength dependence, similarly to the findings during SAMUM–2b. They explain these results with a variation in the source regions of the dust and its chemical composition (Veselovskii et al., 2020). Further discussion about the spectral slope of the lidar ratio for mineral dust and other aerosol types is provided in Haarig et al. (2025). The link between aerosol optical properties and the chemical composition of dust is also studied in Gómez Maqueo Anaya et al. (2025). The lidar ratio values of Bohlmann et al. (2018) and Veselovskii et al. (2020) are, indeed, larger than in our study. The values of the particle linear depolarization ratio for pure dust observed by Bohlmann et al. (2018) are 0.25±0.01 and 0.29±0.01 at 355 and 532 nm, respectively, and values between 0.15–0.19 (355 nm) and between 0.2–0.24 (532 nm) are reported for dust-smoke-mixtures. Veselovskii et al. (2016) reported even higher values of the particle linear depolarization ratio at 532 nm for pure dust, which are between 0.3–0.35. Concerning the particle linear depolarization ratio, the results of Bohlmann et al. (2018) and Veselovskii et al. (2016) are similar to the ones from SAMUM–2b. Also the mean particle depolarization ratios of Saharan dust given in DeLiAn (0.24±0.03 and 0.28±0.01 at 355 and 532 nm, respectively) are larger than what we observed. That we measured a lower particle depolarization at Mindelo may point to changes in the mineralogy or a pollution of the dust, maybe due to increased exhaust gas emissions on the African continent because industry may have increased within the last 10 to 13 years. However, the long-term AERONET observations do not show a general trend in the annual mean AOD despite a periodical pattern, repeating every four to five years (see Fig. C2a). Furthermore, a smoke contribution also in the dust season might be possible as discussed above. Like for the differences in the lidar ratio, differences in the dust source region could be another possible explanation for the lower particle depolarization ratios in our study. Observations of the new spaceborne atmospheric lidar (ATLID) onboard of the EarthCARE satellite (Wehr et al., 2023) as well as laboratory studies (Semwal et al., 2026) will enable to investigate such potential regional differences in the aerosol optical properties at small scales. However, the general structure and occurrence of aerosol layers and types between our study, SAMUM–2, and the studies of Barreto et al. (2022), Veselovskii et al. (2016), and Bohlmann et al. (2018) agree, while we can provide additional information about the occurrence of different aerosol types over the course of the year.
In this study, the annual cycle of the aerosol conditions over Mindelo was analyzed based on a two-year data set of multiwavelength-Raman-polarization lidar measurements of PollyXT, covering the period from July 2021 to August 2023. Vertical profiles of the aerosol optical properties were derived automatically with the Raman method by the PollyNET processing chain. One profile per week, originating from the nights from Friday to Saturday, i.e. the nights of the overpass of the Aeolus satellite over Mindelo, was chosen and manually reviewed to ensure a high-quality data set. Layer boundaries of the PBL and lofted aerosol layers were defined based on visual inspection. An automatic retrieval of the aerosol layer top height was used in addition and compared with the manually-derived results even though both approaches do per se use different definitions of the aerosol layer top height. Layer mean and integrated values of the aerosol optical properties were calculated and used for the general analysis of the two-year period. Thus, a quality-assured time series of more than 70 measurement cases was analyzed to obtain detailed insights into the annual cycle of the aerosol conditions using a layer-resolved approach. In contrast to the manual analysis of lidar vertical profiles, which has been most common so far (Tesche, 2011; Hofer et al., 2020; Heese et al., 2022), the automatically-retrieved profiles obtained from the PollyNET processing chain allowed to evaluate a larger amount of data, even thought a fully automated quality control is yet missing.
Plenty of new insights in the aerosol conditions over Mindelo were obtained within this study. It is the first time that a two-year time series of layer-resolved AOD, lidar ratio profiles, and the dust fractions was made for Cabo Verde. In almost all of the cases, lofted aerosol layers were present. The results showed a clear seasonal cycle for the extent, the AOD, and the dust fraction of the lofted layers. An increase in these properties was identified during NH spring and summer reaching a maximum in July/August (main dust period) after which a decrease was found towards a minimum in NH winter (mixing season). Furthermore, a different contribution of the lofted layers to the total AOD was revealed. While during the mixing season, the AOD was driven by the PBL, in the dust season, the lofted layer accounted for the largest contribution.
One major aim of this study was to investigate the time frame of these dust and mixing seasons, respectively. We found that the dust season usually covers June–September and is characterized by aerosol layer top heights up to 7 km and clearly separated aerosol types between layers at different altitudes. The dust-dominated lofted aerosol layers (seasonal mean dust fraction >65 %) are vertically homogeneous and geometrically and optically thick (seasonal mean depth of around 4 km and seasonal mean AOD of 0.23 at 532 nm) and contribute on average with around 56 % to the columnar AOD (seasonal mean 0.41). Mean lidar ratio values of 48±19 sr (355 nm) and 39±18 sr (532 nm) and mean particle linear depolarization ratios of 0.16±0.07, 0.22±0.06, and 0.20±0.05 at 355, 532, and 1064 nm were observed in the lofted layer. In the PBL, slightly polluted marine conditions are characteristic for the dust season. Dust mixed into the PBL was occasionally observed. A nontypical exception was the occurrence of volcanic sulfate in the PBL in September 2021 (Gebauer et al., 2024). The mean lidar ratios for the dust season are 34±18 sr (355 nm) and 32±19 sr (532 nm) and mean particle linear depolarization ratio values of 0.02 (0–0.07), 0.04 (0–0.09), and 0.05±0.05 at 355, 532, and 1064 nm were found in the PBL. In contrast, the mixing season includes the months November–March. This season is characterized by more inner-seasonal variability concerning the occurrence of aerosol layers and different aerosol types compared with the dust season. Lofted aerosol layers can have a depth of 1–4 km or are completely absent. A strong variation in the PBL top height is typical, which reaches values up to 2 km height when no lofted layer is present. Generally, the optical properties of the PBL and of the lofted layers are more similar than during the dust season, often influenced by a smoke-dust-mixture with a dust fraction of around 40 %–50 %. However, a marine PBL was also observed in about 64 % of the time. The total AOD is low (seasonal mean 0.2 at 532 nm) and mainly driven by the PBL (contribution of around 75 %). The mixing season mean lidar ratio values are 60±32 sr (355 nm) and 48±32 sr (532 nm) in the lofted layer and 33±16 sr (355 nm) and 38±25 sr (532 nm) in the PBL. The mean particle linear depolarization ratios in the mixing season are 0.09±0.06, 0.11±0.07, and 0.16±0.08 at 355, 532, ad 1064 nm in the lofted layer and 0.03 (0–0.08), 0.05 (0–0.11), and 0.06±0.05 at 355, 532, ad 1064 nm in the PBL. Furthermore, the months April, May and October were defined as transition months as no clear assignment to either the dust season or the mixing season generally valid for all years was possible.
To conclude, the results of this study provide a detailed in-depth analysis of the different aerosol-related seasons over Mindelo based on two years of lidar observations – thus, only a starting point for inter-annual analyses – and generally confirm the existing knowledge about the aerosol conditions over Cabo Verde, e.g. from SAMUM–2. Mindelo, located in the outflow region of the African continent, is often affected by long-range transported dust. In the dust season, ranging from June to September, the dust is mainly occurring in lofted layers (the so-called SAL) up to on average 5.6 km and clearly separated from the local PBL. Dust is dominating the optical properties in the SAL, while it is negligible in the PBL. During the mixing season, from November to March, dust is strongly mixed with smoke and pollution and extends up to on average 3 km. This far-range transported aerosol is partly mixed into the PBL and frequently the optical properties are similar in both layers. As the measurements at Mindelo are ongoing, data covering a longer time period will be available soon, allowing to study the inter-annual variability of these aerosol conditions. A next step will be to confirm our findings with a larger dataset and a longer time series of measurements. Furthermore, the location of Mindelo surrounded by the Atlantic Ocean but mostly exposed to complex aerosol layering with optically and geometrically thick aerosol layers makes it an ideal location for satellite validation studies.
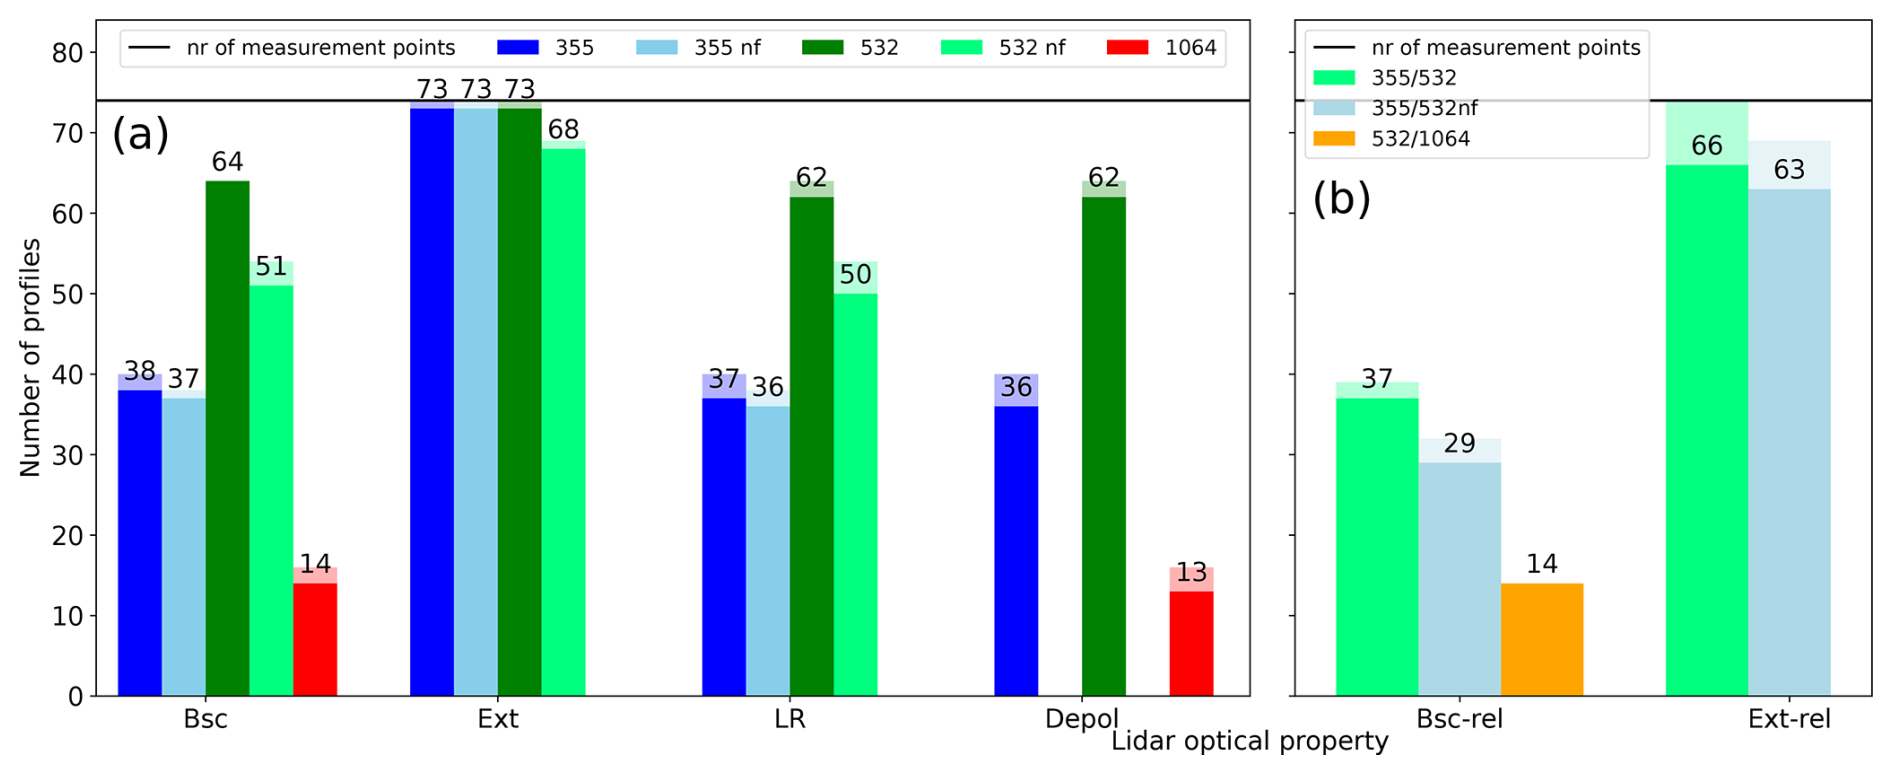
Figure A1Number of used profiles per optical property and wavelength for (a) the backscatter (Bsc) and extinction (Ext) coefficients, the lidar ratio (LR), and the particle linear depolarization ratio (Depol) and (b) the backscatter-related (Bsc-rel) and extinction-related (Ext-rel) Ångström exponents after quality assurance. The transparent extensions of the bars indicate the number of profiles retrieved by the PollyNET processing chain before discarding. The given numbers refer to the non-transparent bars. The horizontal line indicates the number of used Fri/Sat nights (74), i.e. the theoretically possible number of profiles.
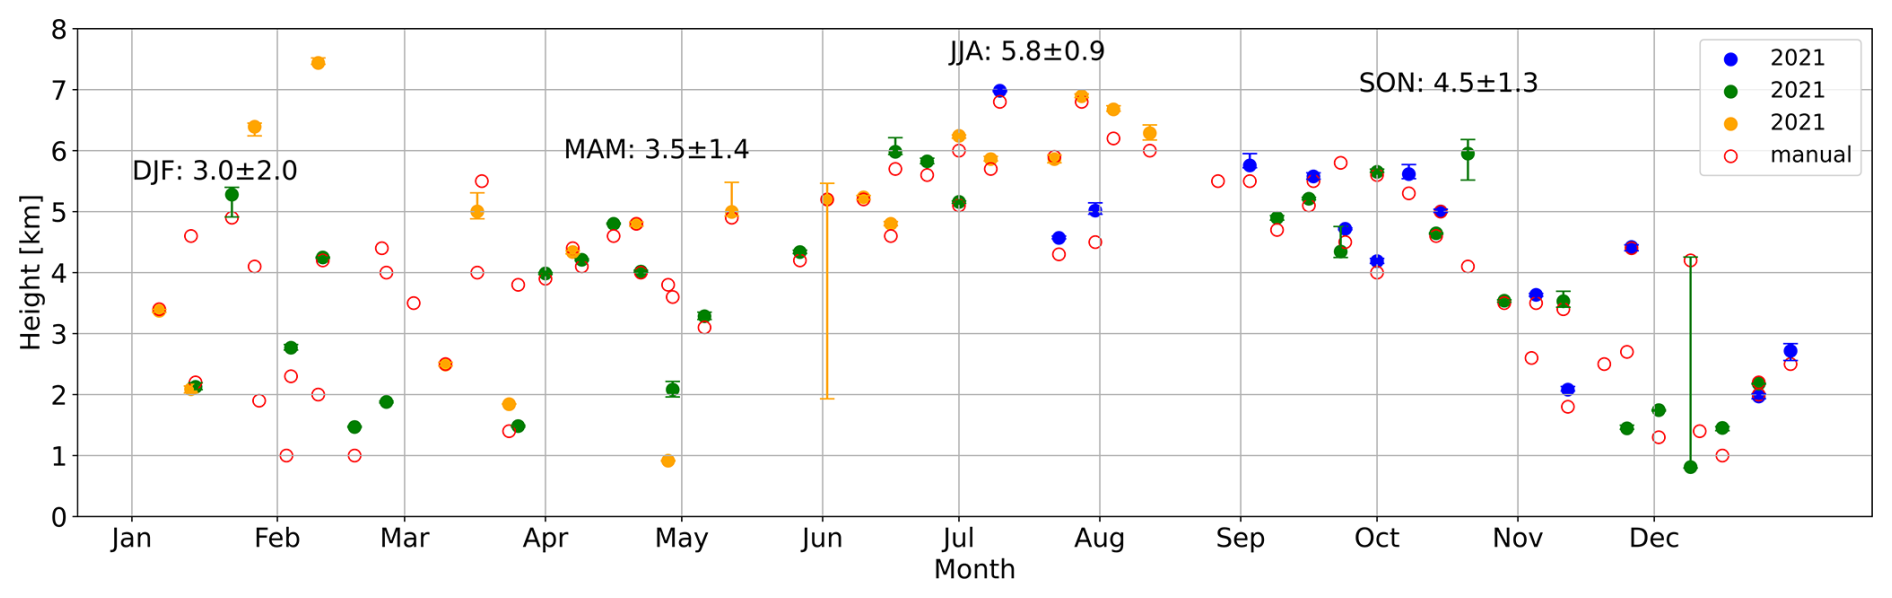
Figure B1Top of the uppermost aerosol layer for the Fri/Sat cases. Comparison of automatically-retrieved layer top heights (algorithm of Hofer et al., 2020) with manually-defined ones. Asymmetric error bars as described in Sect. 2.1 are used for the automatically-retrieved heights. Error bars for the manually-defined heights are neglected as they are constant (±50 m) for all cases. Seasonal mean values, based on the automatical results, and their standard deviation plus the seasonal mean error are given as numbers.
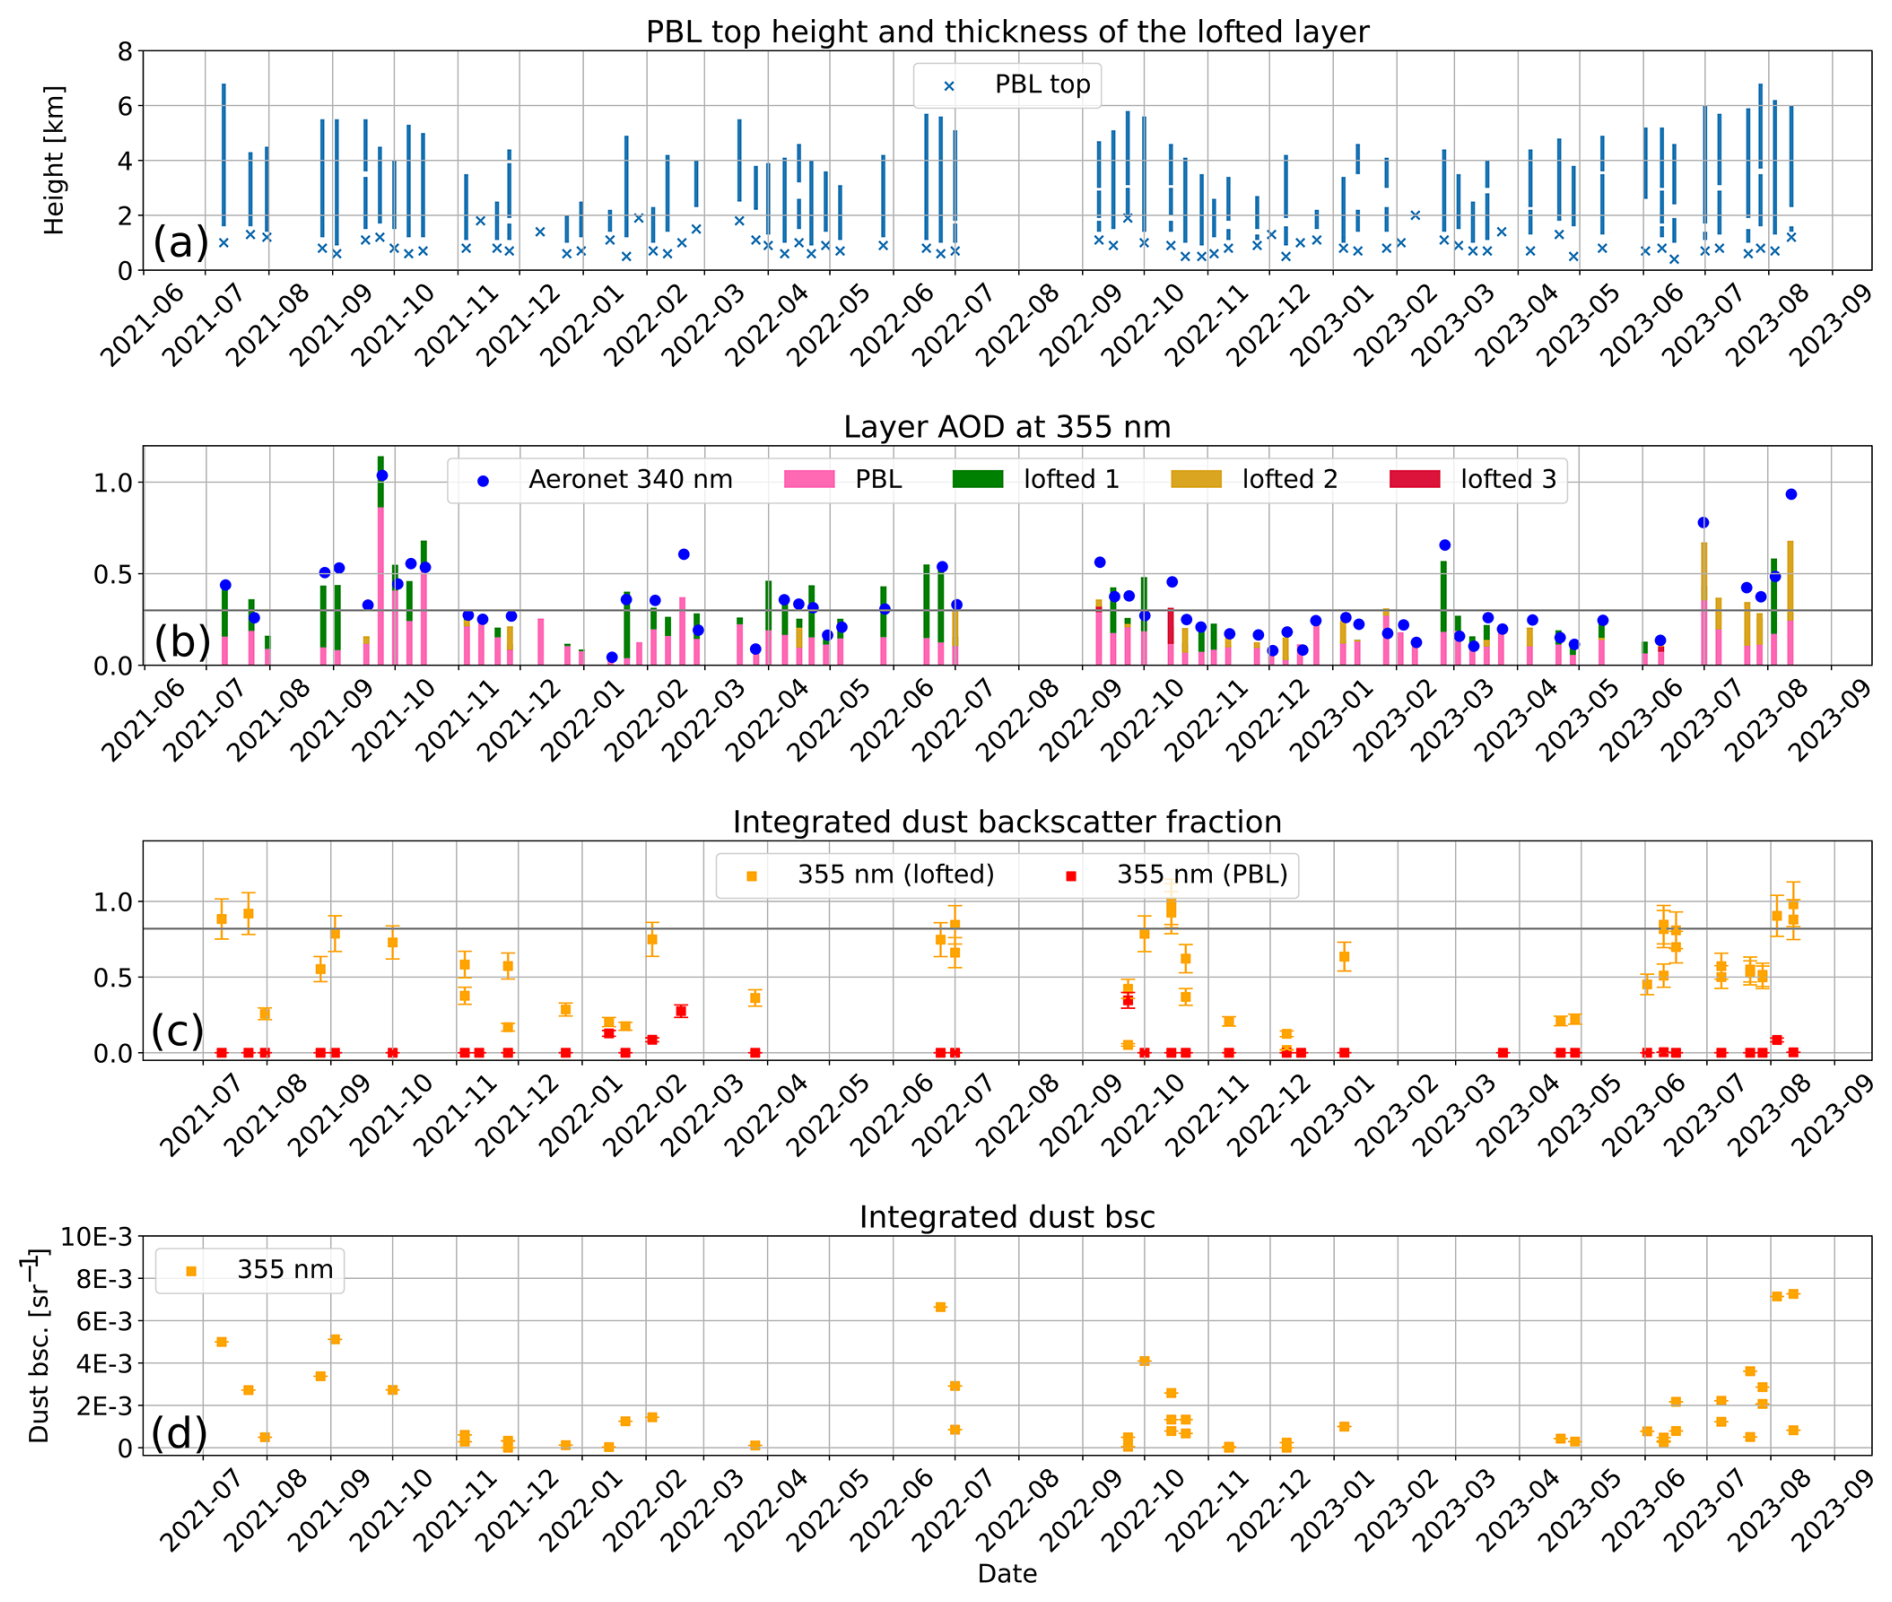

Figure B3Layer resolved time series of monthly means of the Fri/Sat cases including (a) and (b) the lidar ratio at 355 and 532 nm, (c) and (d) the backscatter- and extinction-related Ångström exponent for the wavelength pairs 355/532 nm and 532/1064 nm, and (e) and (f) the particle linear depolarization ratio at 355, 532, and 1064 nm.
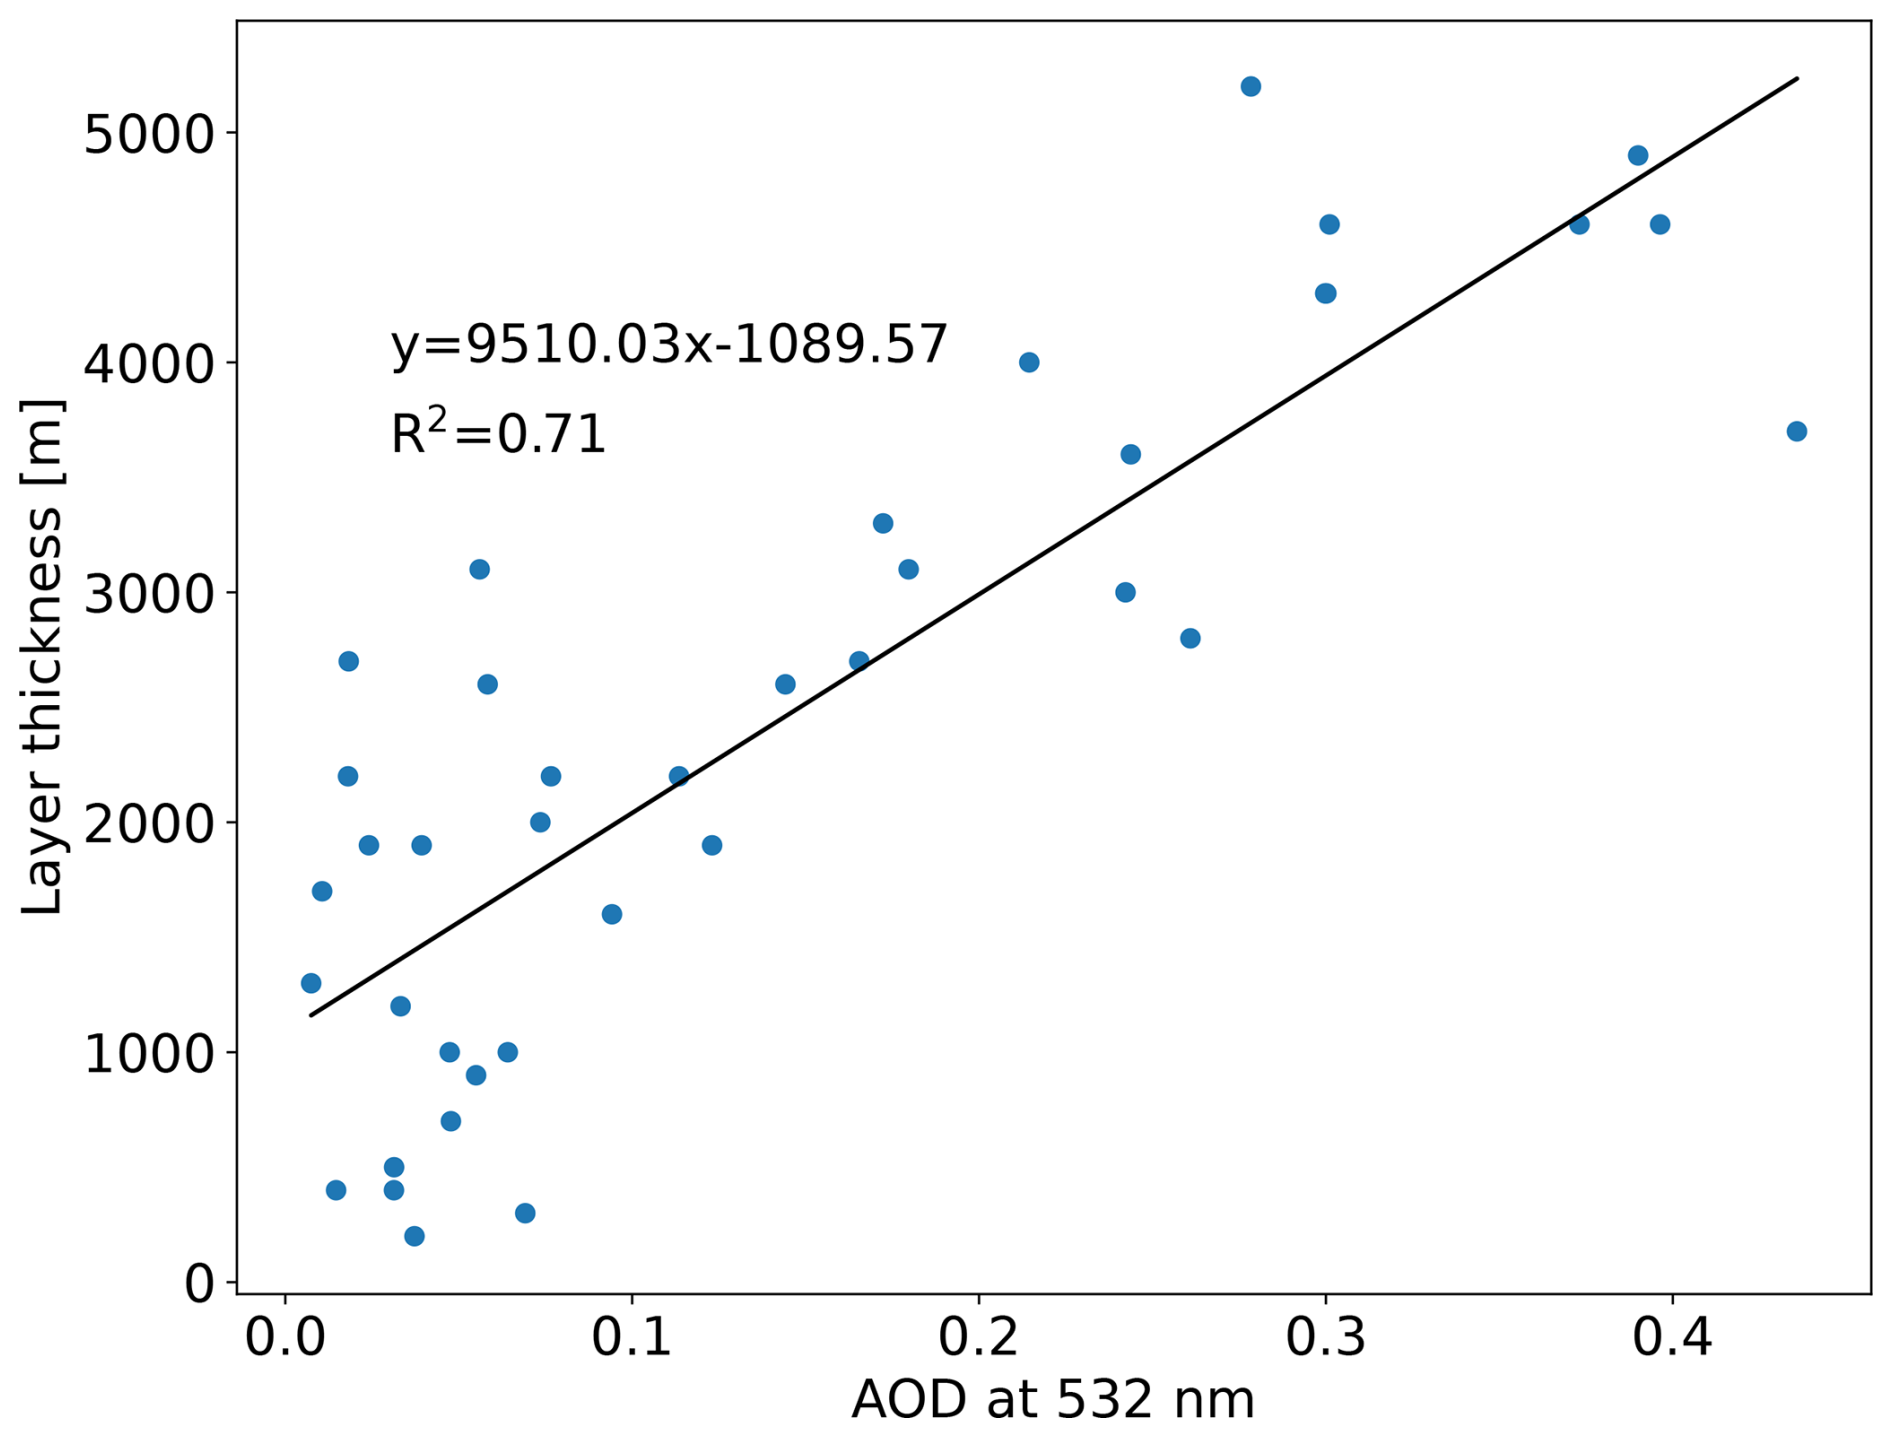
Figure B4Geometrical thickness of the lofted aerosol layer in dependence of its AOD at 532 nm for the Fri/Sat cases of May–September.
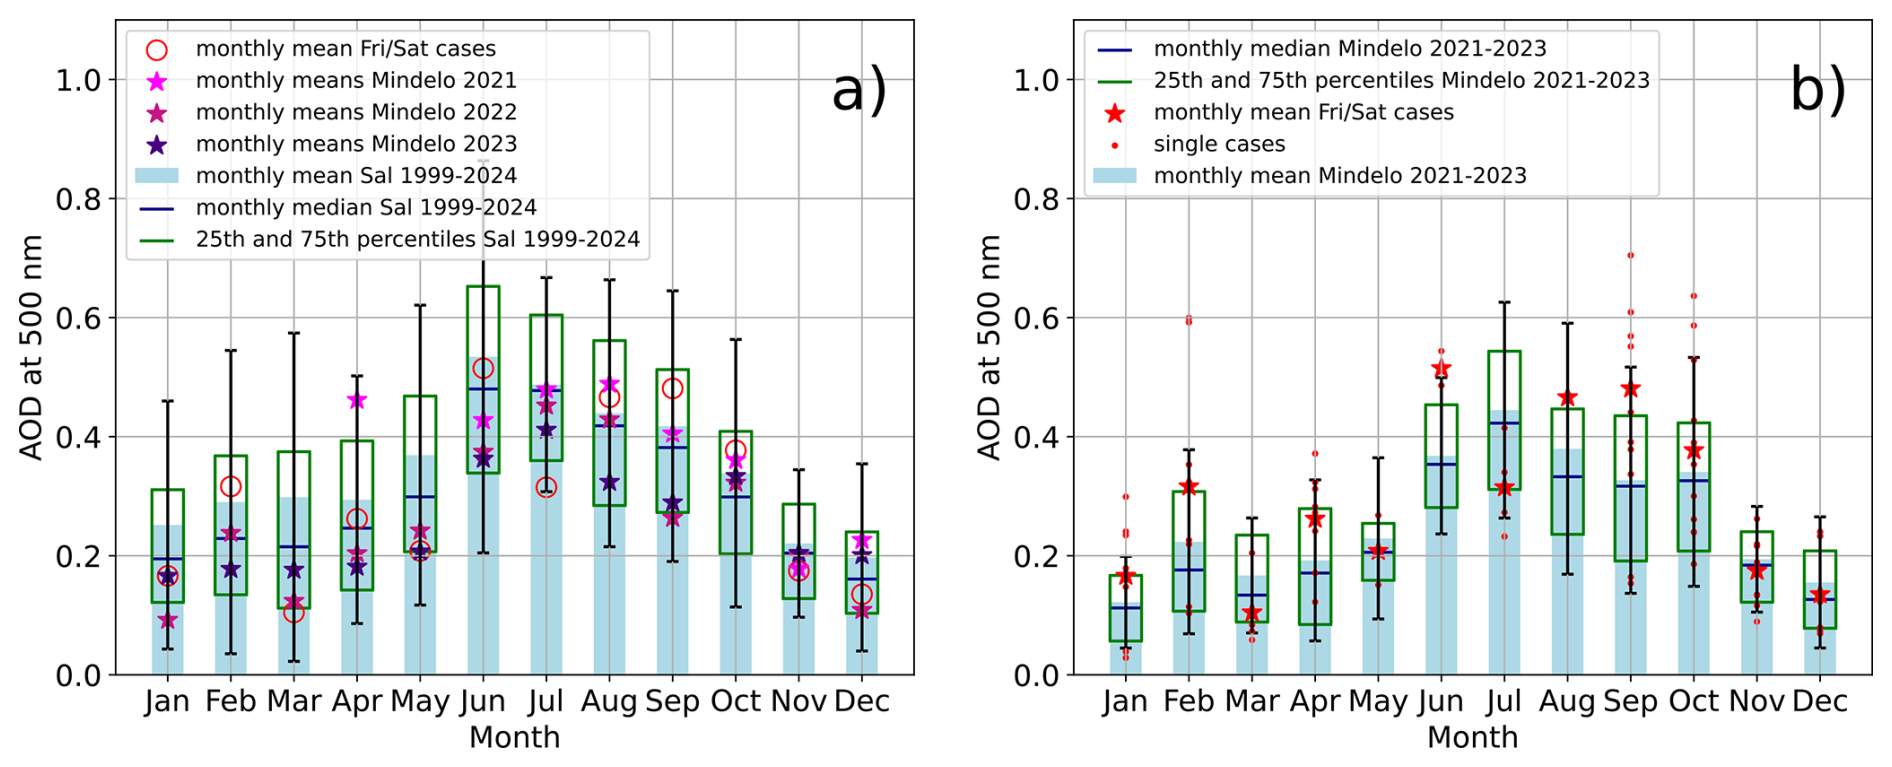
Figure C1AERONET climatology of the level 2.0 AOD at 500 nm, calculated from the AERONET AOD at 440 nm via the AERONET Ångström exponent between 440–870 nm: (a) monthly mean values of the complete years 2021, 2022, and 2023 (star symbols) and of the Fri/Sat cases (red circles) fom Mindelo are compared with the long-term climatological mean values from Sal from 1999 to 2024 (bar chart with the standard deviation as error bars). (b) Monthly mean values of the Fri/Sat cases (red stars) and the unaveraged Fri/Sat cases (red dots) are set into context with the monthly mean values of the complete period 2021–2023 at Mindelo (bar chart with the standard deviation as error bars).
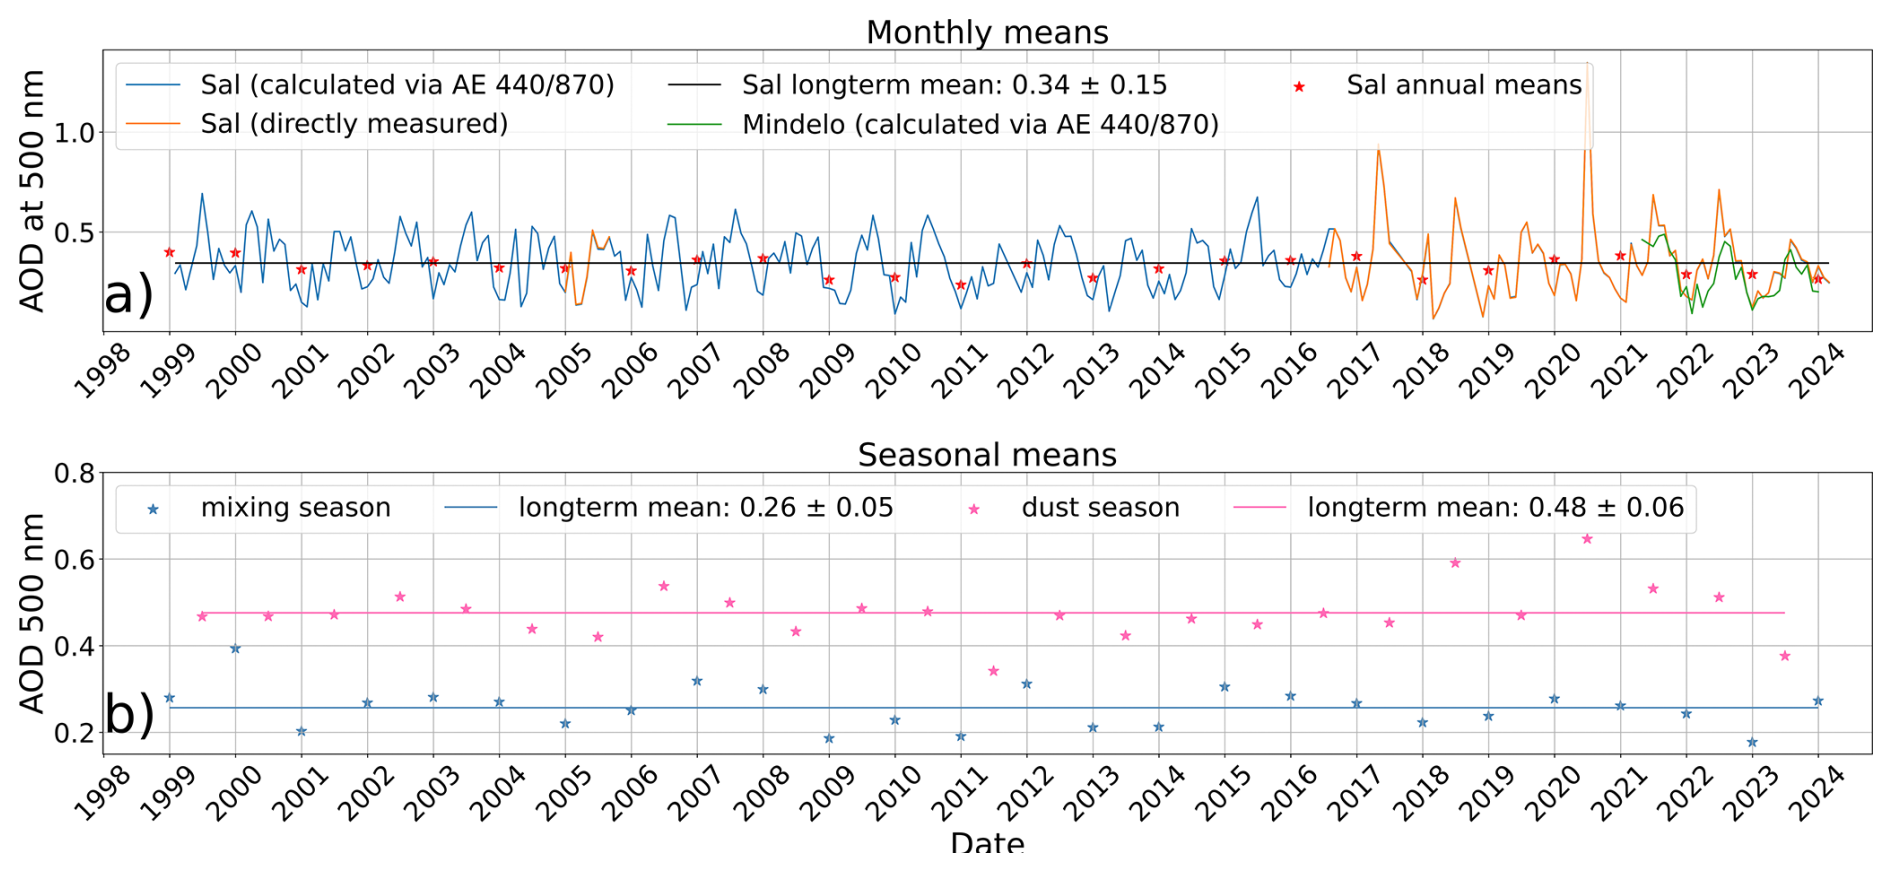
Figure C2AERONET long-term measurements level 2.0 of the AOD at 500 nm, calculated from the AERONET AOD at 440 nm via the AERONET Ångström exponent (AE) between 440–870 nm and directly measured on Sal between 1999–2024: (a) time series of monthly and annual mean values. The AERONET AOD from Mindelo 2021–2023 is added. (b) time series of the seasonal means of the dust and the mixing season together with their long-term means.
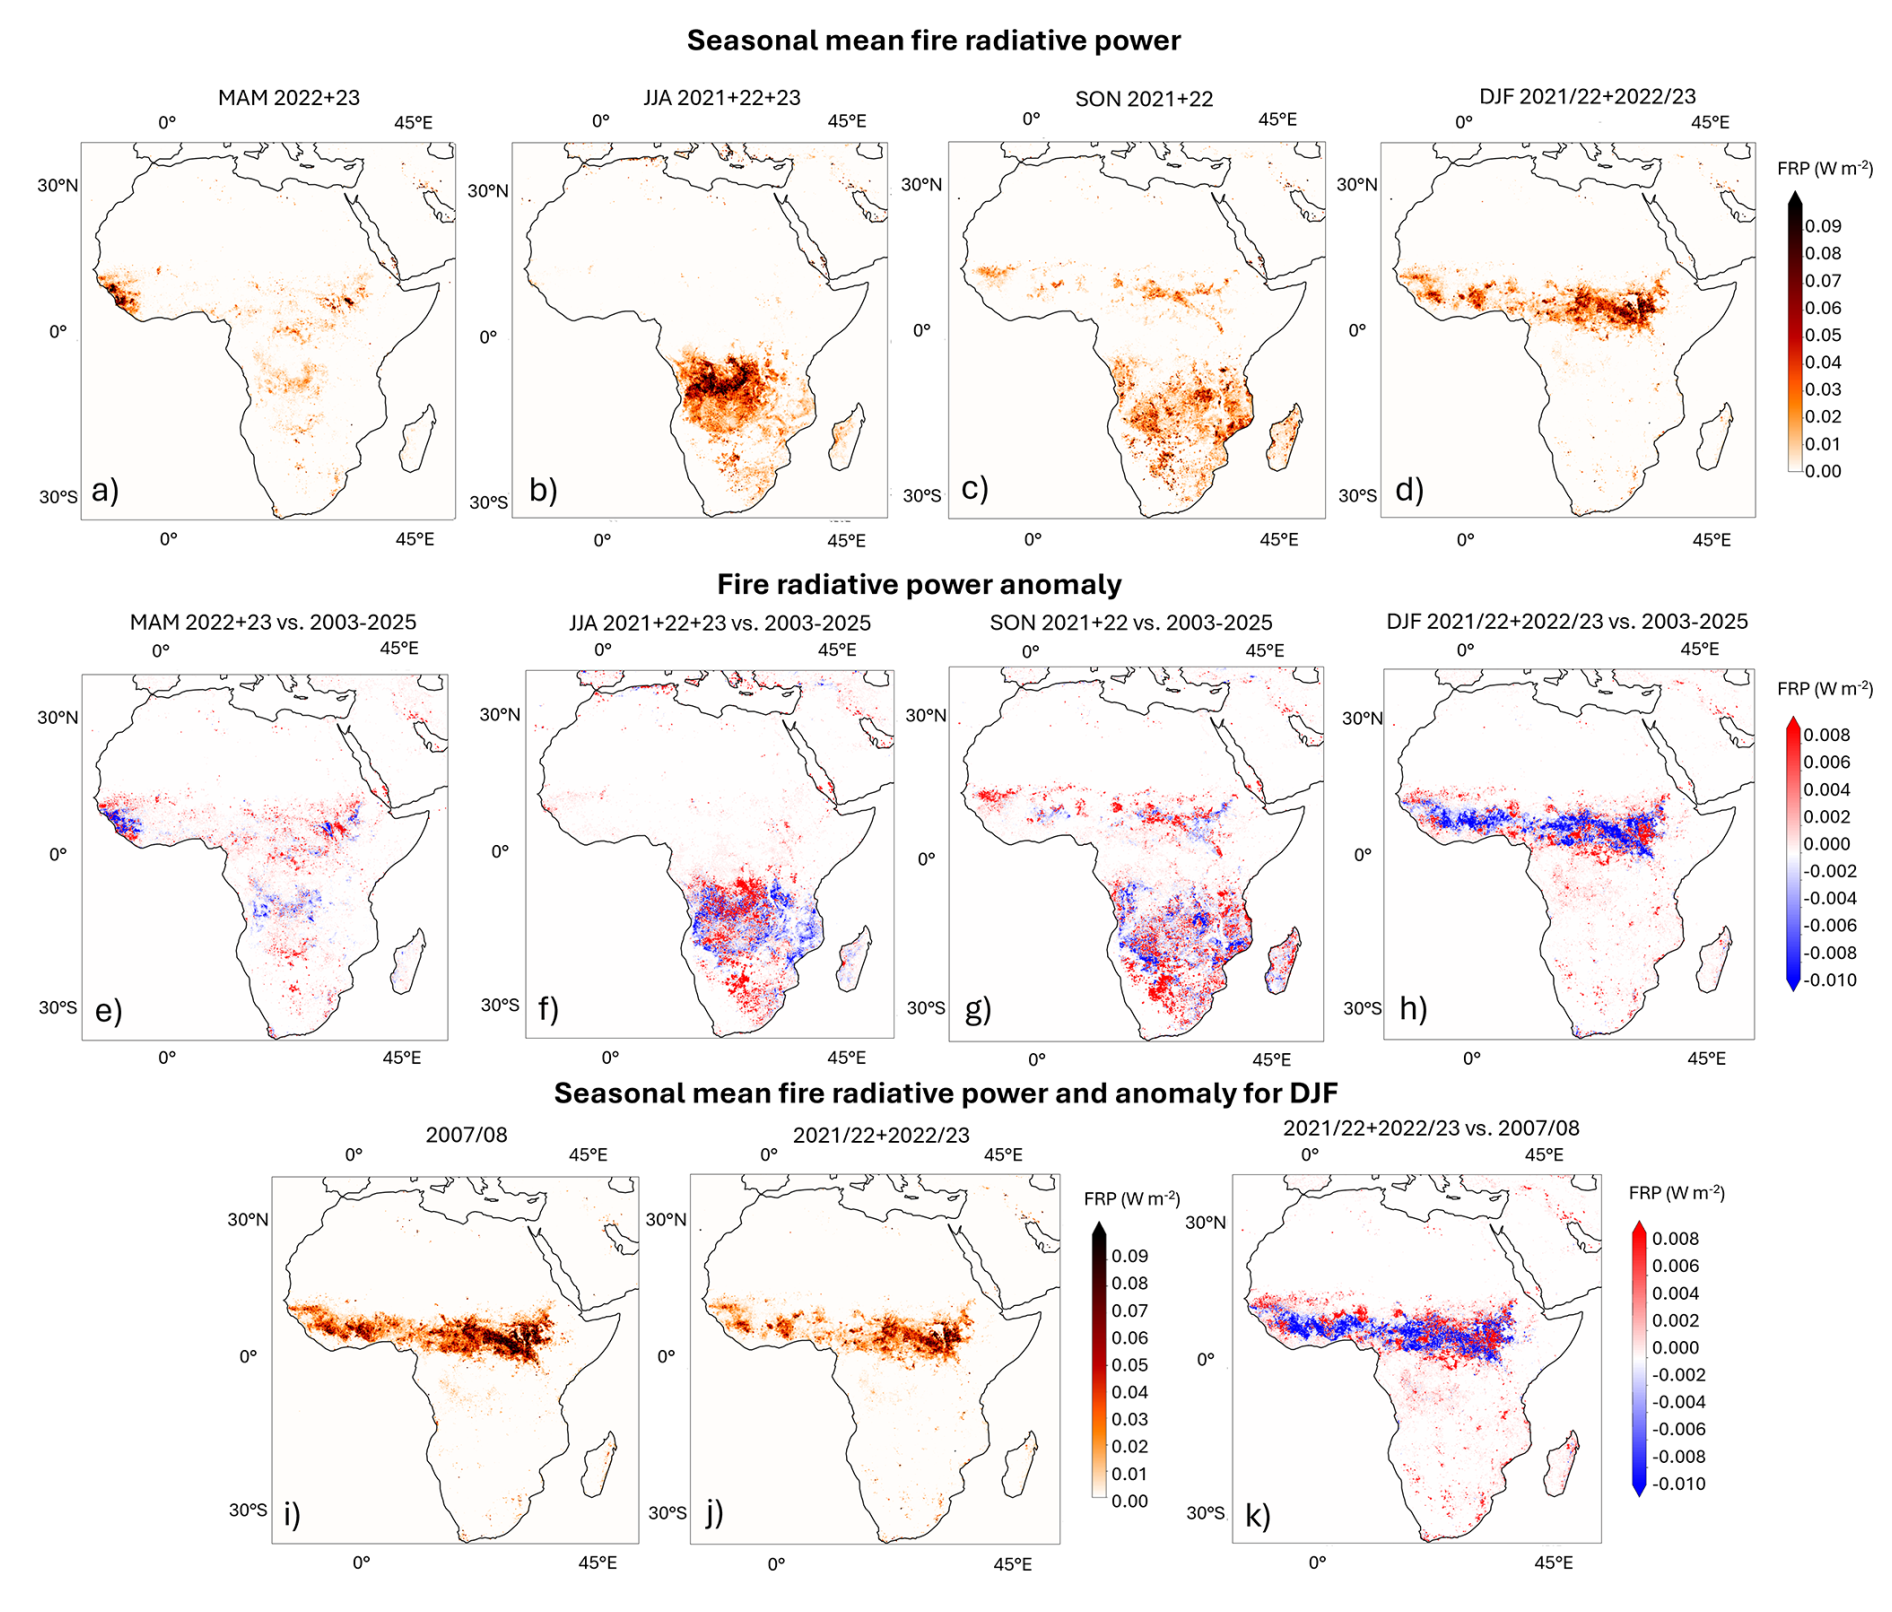
Figure D1MODIS-based fire radiative power (FPR) provided by the Global Fire Assimilation System (GFAS; Kaiser et al., 2012) in 0.1° horizontal and daily temporal resolution, respectively: (a–d) seasonal mean values of the FRP for March–May (MAM), June–August (JJA), September–November (SON), and December–February (DJF) out of the period June 2021–August 2023, (e–h) anomaly of the seasonal mean FRP of (a–d) from the long-term seasonal means of 2003–2025, (i) and (j) seasonal mean FRP of DJF 2007/08 and 2021/22 and 2022/23, respectively, (k) difference of the DJF seasonal mean FRP of 2021/22 and 2022/23 from 2007/08.
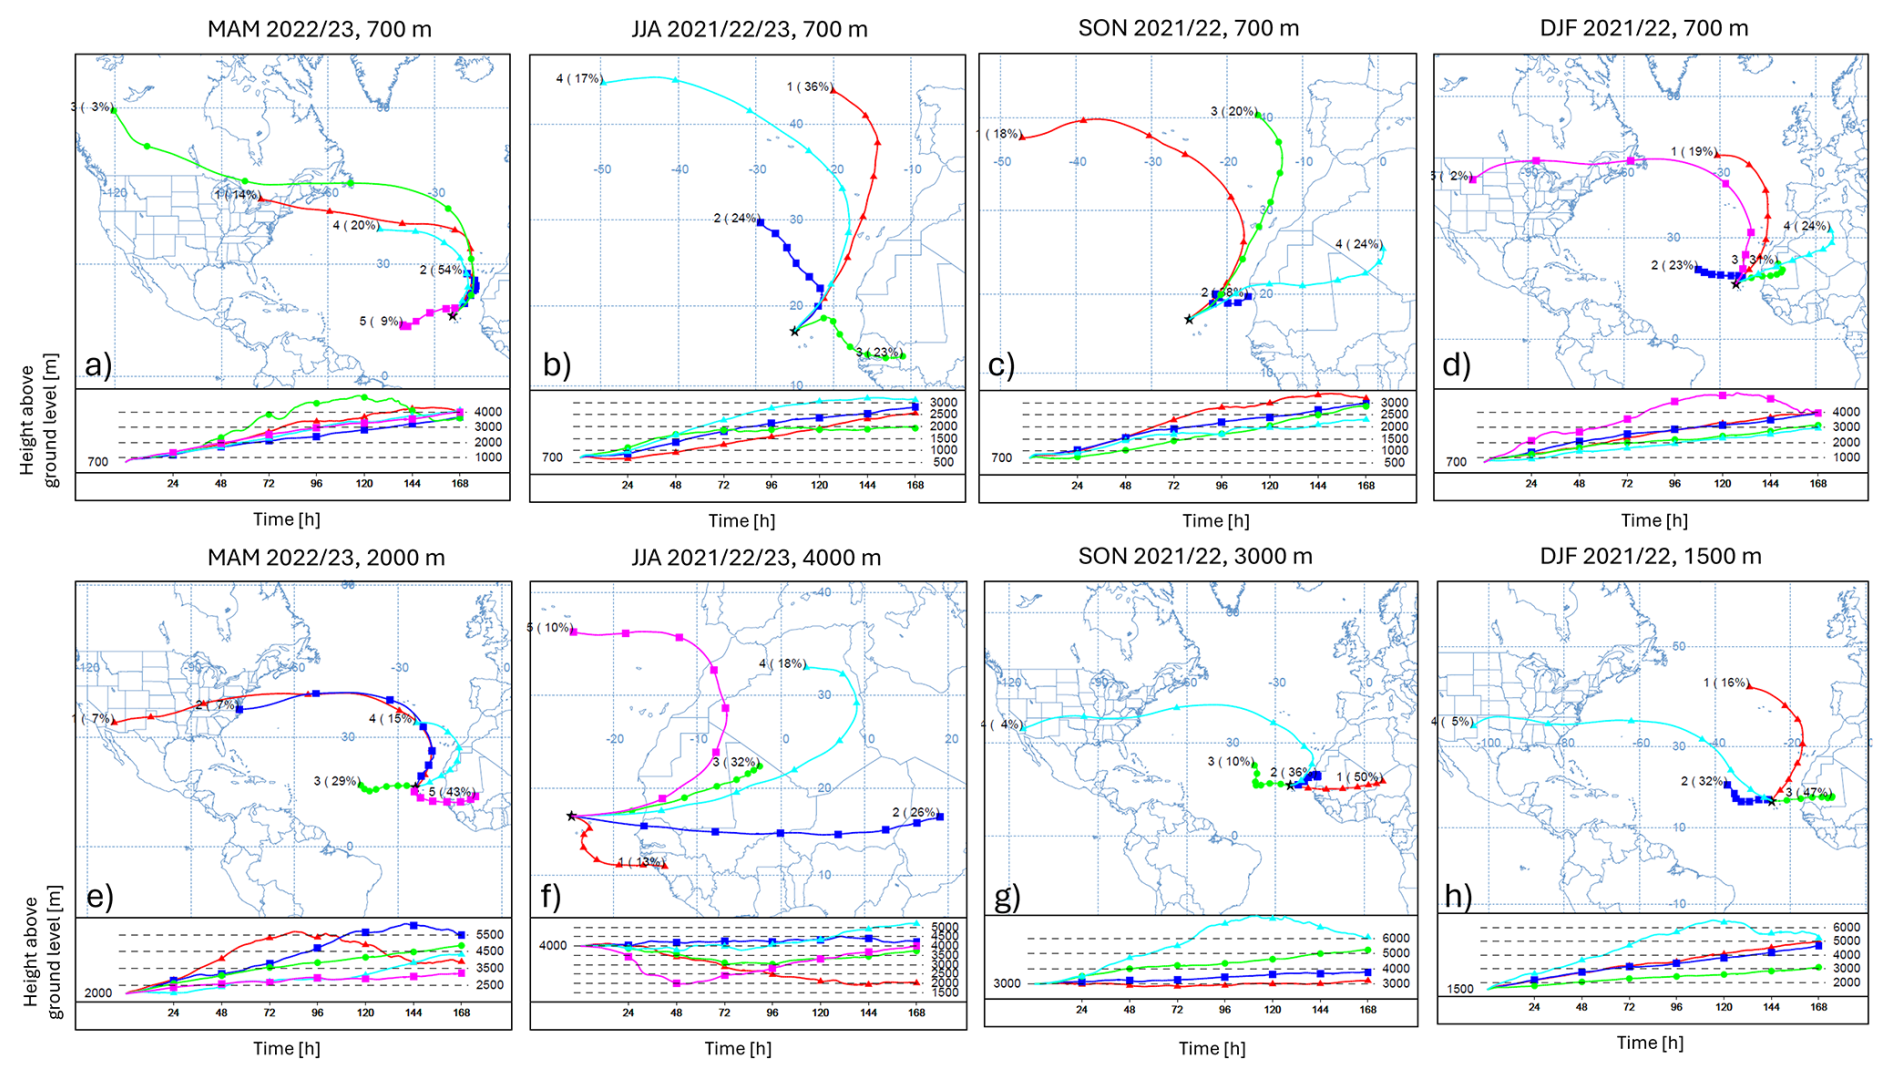
Figure D2Seasonal (MAM, JJA, SON, DJF) cluster analysis of 7 d HYSPLIT backward trajectories arriving at Mindelo (a–d) at 700 m (PBL) and (e–h) 2000, 4000, 3000, and 1500 m, respectively (lofted layer). The cluster analyses are based on daily profiles arriving at 00:00 UTC.
The PollyXT lidar data will be made available via ACTRIS services, but for now they are available at https://doi.org/10.5281/zenodo.15790987 (Gebauer et al., 2025). Near-real-time measurement quicklooks can be found at https://polly.tropos.de/ (last access: 2 March 2026) (PollyNET, 2025). AERONET data (station names “Mindelo_OSCM” and “Capo_Verde”) were downloaded from https://aeronet.gsfc.nasa.gov/ (last access: 13 January 2026) (AERONET, 2026).
This manuscript is based on HG's master thesis and was conceptualized by HG together with HB and AAF. JH contributed the software for the retrieval of the aerosol layer top height and the results of the trajectory cluster analysis. MH, CJ, and AS contributed their expertise to the data analysis. AS and RE have been responsible for the deployment and operation of the ground-based instruments at Mindelo. RW provided the maps of the fire radiative activity. All coauthors were actively involved in the extended discussions and the elaboration of the final design of the manuscript.
The contact author has declared that none of the authors has any competing interests.
Publisher's note: Copernicus Publications remains neutral with regard to jurisdictional claims made in the text, published maps, institutional affiliations, or any other geographical representation in this paper. The authors bear the ultimate responsibility for providing appropriate place names. Views expressed in the text are those of the authors and do not necessarily reflect the views of the publisher.
This article is part of the special issue “The Joint Aeolus Tropical Atlantic Campaign (JATAC) (AMT/ACP inter-journal SI)”. It is not associated with a conference.
We gratefully acknowledge the team of OSCM for their support, without which it would not have been possible to perform the observations. We also thank ESA and the ASKOS/JATAC teams for the organization of the campaign and their support during the entire time. The authors acknowledge AERONET-Europe for providing calibration service. AERONET-Europe is part of ACTRIS Research Infrastructure.
This research has been supported by the Bundesministerium für Forschung, Technologie und Raumfahrt (grant no. 01LK2001A), the Bundesministerium für Wirtschaft und Energie (grant no. 50EE1721C), and the Horizon 2020 (grant nos. 871115 and 739530).
This paper was edited by Stelios Kazadzis and reviewed by four anonymous referees.
AERONET: Aerosol Robotic Network, NASA [data set], https://aeronet.gsfc.nasa.gov/ (last access: 13 January 2026), 2026. a
Althausen, D., Engelmann, R., Baars, H., Heese, B., Ansmann, A., Müller, D., and Komppula, M.: Portable Raman lidar PollyXT for automated profiling of aerosol backscatter, extinction, and depolarization, J. Atmos. Ocean. Tech., 26, 2366–2378, https://doi.org/10.1175/2009JTECHA1304.1, 2009. a, b
Ansmann, A., Wandinger, U., Riebesell, M., Weitkamp, C., and Michaelis, W.: Independent measurement of extinction and backscatter profiles in cirrus clouds by using a combined Raman elastic-backscatter lidar, Appl. Optics, 31, 7113–7131, https://doi.org/10.1364/ao.31.007113, 1992. a
Ansmann, A., Petzold, A., Kandler, K., Tegen, I., Wendisch, M., Mueller, D., Weinzierl, B., Müller, T., and Heintzenberg, J.: Saharan mineral dust experiments SAMUM–1 and SAMUM–2: what have we learned?, Tellus B, 63, 403–429, https://doi.org/10.1111/j.1600-0889.2011.00555.x, 2011. a
Ansmann, A., Mamouri, R.-E., Hofer, J., Baars, H., Althausen, D., and Abdullaev, S. F.: Dust mass, cloud condensation nuclei, and ice-nucleating particle profiling with polarization lidar: updated POLIPHON conversion factors from global AERONET analysis, Atmos. Meas. Tech., 12, 4849–4865, https://doi.org/10.5194/amt-12-4849-2019, 2019. a, b
Ansmann, A., Hofer, J., Mamouri, R.-E., Haarig, M., Baars, H., and Wandinger, U.: Aerosol microphysical properties and CCN/INP information from lidar and ceilometer profiles: POLIPHON update, EGUsphere [preprint], https://doi.org/10.5194/egusphere-2026-648, 2026. a
Baars, H., Ansmann, A., Engelmann, R., and Althausen, D.: Continuous monitoring of the boundary-layer top with lidar, Atmos. Chem. Phys., 8, 7281–7296, https://doi.org/10.5194/acp-8-7281-2008, 2008. a
Baars, H., Kanitz, T., Engelmann, R., Althausen, D., Heese, B., Komppula, M., Preißler, J., Tesche, M., Ansmann, A., Wandinger, U., Lim, J.-H., Ahn, J. Y., Stachlewska, I. S., Amiridis, V., Marinou, E., Seifert, P., Hofer, J., Skupin, A., Schneider, F., Bohlmann, S., Foth, A., Bley, S., Pfüller, A., Giannakaki, E., Lihavainen, H., Viisanen, Y., Hooda, R. K., Pereira, S. N., Bortoli, D., Wagner, F., Mattis, I., Janicka, L., Markowicz, K. M., Achtert, P., Artaxo, P., Pauliquevis, T., Souza, R. A. F., Sharma, V. P., van Zyl, P. G., Beukes, J. P., Sun, J., Rohwer, E. G., Deng, R., Mamouri, R.-E., and Zamorano, F.: An overview of the first decade of PollyNET: an emerging network of automated Raman-polarization lidars for continuous aerosol profiling, Atmos. Chem. Phys., 16, 5111–5137, https://doi.org/10.5194/acp-16-5111-2016, 2016. a, b
Baars, H., Seifert, P., Engelmann, R., and Wandinger, U.: Target categorization of aerosol and clouds by continuous multiwavelength-polarization lidar measurements, Atmos. Meas. Tech., 10, 3175–3201, https://doi.org/10.5194/amt-10-3175-2017, 2017. a, b, c
Barreto, Á., Cuevas, E., García, R. D., Carrillo, J., Prospero, J. M., Ilić, L., Basart, S., Berjón, A. J., Marrero, C. L., Hernández, Y., Bustos, J. J., Ničković, S., and Yela, M.: Long-term characterisation of the vertical structure of the Saharan Air Layer over the Canary Islands using lidar and radiosonde profiles: implications for radiative and cloud processes over the subtropical Atlantic Ocean, Atmos. Chem. Phys., 22, 739–763, https://doi.org/10.5194/acp-22-739-2022, 2022. a, b, c, d, e, f, g, h, i, j, k, l
Berjón, A., Barreto, A., Hernández, Y., Yela, M., Toledano, C., and Cuevas, E.: A 10-year characterization of the Saharan Air Layer lidar ratio in the subtropical North Atlantic, Atmos. Chem. Phys., 19, 6331–6349, https://doi.org/10.5194/acp-19-6331-2019, 2019. a
Bohlmann, S., Baars, H., Radenz, M., Engelmann, R., and Macke, A.: Ship-borne aerosol profiling with lidar over the Atlantic Ocean: from pure marine conditions to complex dust–smoke mixtures, Atmos. Chem. Phys., 18, 9661–9679, https://doi.org/10.5194/acp-18-9661-2018, 2018. a, b, c, d, e, f, g, h, i, j, k, l, m
Burton, S. P., Ferrare, R. A., Hostetler, C. A., Hair, J. W., Rogers, R. R., Obland, M. D., Butler, C. F., Cook, A. L., Harper, D. B., and Froyd, K. D.: Aerosol classification using airborne High Spectral Resolution Lidar measurements – methodology and examples, Atmos. Meas. Tech., 5, 73–98, https://doi.org/10.5194/amt-5-73-2012, 2012. a
Chen, G., Ziemba, L. D., Chu, D. A., Thornhill, K. L., Schuster, G. L., Winstead, E. L., Diskin, G. S., Ferrare, R. A., Burton, S. P., Ismail, S., Kooi, S. A., Omar, A. H., Slusher, D. L., Kleb, M. M., Reid, J. S., Twohy, C. H., Zhang, H., and Anderson, B. E.: Observations of Saharan dust microphysical and optical properties from the Eastern Atlantic during NAMMA airborne field campaign, Atmos. Chem. Phys., 11, 723–740, https://doi.org/10.5194/acp-11-723-2011, 2011. a
Choobari, O. A., Zawar-Reza, P., and Sturman, A.: The global distribution of mineral dust and its impacts on the climate system: a review, Atmos. Res., 138, 152–165, https://doi.org/10.1016/j.atmosres.2013.11.007, 2014. a
Engelmann, R., Kanitz, T., Baars, H., Heese, B., Althausen, D., Skupin, A., Wandinger, U., Komppula, M., Stachlewska, I. S., Amiridis, V., Marinou, E., Mattis, I., Linné, H., and Ansmann, A.: The automated multiwavelength Raman polarization and water-vapor lidar PollyXT: the neXT generation, Atmos. Meas. Tech., 9, 1767–1784, https://doi.org/10.5194/amt-9-1767-2016, 2016. a, b, c, d, e
Fehr, T., McCarthy, W., Amiridis, V., Baars, H., von Bismarck, J., Borne, M., Chen, S., Flamant, C., Marenco, F., Knipperz, P., Koopman, R., Lemmerz, C. L., Marinou, E., Močnik, G., Parrinello, T., Piña, A., Reitebuch, O., Skofronick-Jackson, G., Zawislak, J., and Zenk, C.: The Joint Aeolus Tropical Atlantic Campaign 2021/2022 Overview– Atmospheric Science and Satellite Validation in the Tropics, EGU General Assembly 2023, Vienna, Austria, 23–28 Apr 2023, EGU23-7249, https://doi.org/10.5194/egusphere-egu23-7249, 2023. a, b
Flament, T., Trapon, D., Lacour, A., Dabas, A., Ehlers, F., and Huber, D.: Aeolus L2A aerosol optical properties product: standard correct algorithm and Mie correct algorithm, Atmos. Meas. Tech., 14, 7851–7871, https://doi.org/10.5194/amt-14-7851-2021, 2021. a
Floutsi, A. A., Baars, H., Engelmann, R., Althausen, D., Ansmann, A., Bohlmann, S., Heese, B., Hofer, J., Kanitz, T., Haarig, M., Ohneiser, K., Radenz, M., Seifert, P., Skupin, A., Yin, Z., Abdullaev, S. F., Komppula, M., Filioglou, M., Giannakaki, E., Stachlewska, I. S., Janicka, L., Bortoli, D., Marinou, E., Amiridis, V., Gialitaki, A., Mamouri, R.-E., Barja, B., and Wandinger, U.: DeLiAn – a growing collection of depolarization ratio, lidar ratio and Ångström exponent for different aerosol types and mixtures from ground-based lidar observations, Atmos. Meas. Tech., 16, 2353–2379, https://doi.org/10.5194/amt-16-2353-2023, 2023. a, b, c, d, e, f
Formenti, P., Elbert, W., Maenhaut, W., Haywood, J., and Andreae, M. O.: Chemical composition of mineral dust aerosol during the Saharan Dust Experiment (SHADE) airborne campaign in the Cape Verde region, September 2000, J. Geophys. Res.-Atmos., 108, https://doi.org/10.1029/2002JD002648, 2003. a
Freudenthaler, V., Esselborn, M., Wiegner, M., Heese, B., Tesche, M., Ansmann, A., Müller, D., Althausen, D., Wirth, M., Fix, A., Ehret, G., Knippertz, P., Toledano, C., Gasteiger, J., Garhammer, M., and Seefeldner, M.: Depolarization ratio profiling at several wavelengths in pure Saharan dust during SAMUM 2006, Tellus B, 61, 165–179, https://doi.org/10.1111/j.1600-0889.2008.00396.x, 2009. a
Gebauer, H., Floutsi, A. A., Haarig, M., Radenz, M., Engelmann, R., Althausen, D., Skupin, A., Ansmann, A., Zenk, C., and Baars, H.: Tropospheric sulfate from Cumbre Vieja (La Palma) observed over Cabo Verde contrasted with background conditions: a lidar case study of aerosol extinction, backscatter, depolarization and lidar ratio profiles at 355, 532 and 1064 nm, Atmos. Chem. Phys., 24, 5047–5067, https://doi.org/10.5194/acp-24-5047-2024, 2024. a, b, c, d, e, f
Gebauer, H., Floutsi, A. A., Hofer, J., Haarig, M., Skupin, A., Engelmann, R., Jimenez, C., and Baars, H.: PollyXT lidar profiles from Mindelo, Cabo Verde, between July 2021 and August 2023, Zenodo [data set], https://doi.org/10.5281/zenodo.15790987, 2025. a
Gómez Maqueo Anaya, S., Althausen, D., Hofer, J., Haarig, M., Wandinger, U., Heinold, B., Tegen, I., Faust, M., Baars, H., Ansmann, A., Engelmann, R., Skupin, A., Heese, B., and Schepanski, K.: Investigating the link between mineral dust hematite content and intensive optical properties by means of lidar measurements and aerosol modeling, Atmos. Chem. Phys., 25, 9737–9764, https://doi.org/10.5194/acp-25-9737-2025, 2025. a, b
Gong, X., Wex, H., Voigtländer, J., Fomba, K. W., Weinhold, K., van Pinxteren, M., Henning, S., Müller, T., Herrmann, H., and Stratmann, F.: Characterization of aerosol particles at Cabo Verde close to sea level and at the cloud level – Part 1: Particle number size distribution, cloud condensation nuclei and their origins , Atmos. Chem. Phys., 20, 1431–1449, https://doi.org/10.5194/acp-20-1431-2020, 2020. a
Groß, S, Tesche, M., Freudenthaler, V., Toledano, C., Wiegner, M., Ansmann, A., Althausen, D., and Seefeldner, M.: Characterization of Saharan dust, marine aerosols and mixtures of biomass-burning aerosols and dust by means of multi-wavelength depolarization and Raman lidar measurements during SAMUM 2, Tellus B, 63, 706–724, https://doi.org/10.1111/j.1600-0889.2011.00556.x, 2011. a
Groß, S., Esselborn, M., Weinzierl, B., Wirth, M., Fix, A., and Petzold, A.: Aerosol classification by airborne high spectral resolution lidar observations, Atmos. Chem. Phys., 13, 2487–2505, https://doi.org/10.5194/acp-13-2487-2013, 2013. a
Haarig, M., Ansmann, A., Althausen, D., Klepel, A., Groß, S., Freudenthaler, V., Toledano, C., Mamouri, R.-E., Farrell, D. A., Prescod, D. A., Marinou, E., Burton, S. P., Gasteiger, J., Engelmann, R., and Baars, H.: Triple-wavelength depolarization-ratio profiling of Saharan dust over Barbados during SALTRACE in 2013 and 2014, Atmos. Chem. Phys., 17, 10767–10794, https://doi.org/10.5194/acp-17-10767-2017, 2017. a
Haarig, M., Walser, A., Ansmann, A., Dollner, M., Althausen, D., Sauer, D., Farrell, D., and Weinzierl, B.: Profiles of cloud condensation nuclei, dust mass concentration, and ice-nucleating-particle-relevant aerosol properties in the Saharan Air Layer over Barbados from polarization lidar and airborne in situ measurements, Atmos. Chem. Phys., 19, 13773–13788, https://doi.org/10.5194/acp-19-13773-2019, 2019. a
Haarig, M., Ansmann, A., Engelmann, R., Baars, H., Toledano, C., Torres, B., Althausen, D., Radenz, M., and Wandinger, U.: First triple-wavelength lidar observations of depolarization and extinction-to-backscatter ratios of Saharan dust, Atmos. Chem. Phys., 22, 355–369, https://doi.org/10.5194/acp-22-355-2022, 2022. a
Haarig, M., Engelmann, R., Baars, H., Gast, B., Althausen, D., and Ansmann, A.: Discussion of the spectral slope of the lidar ratio between 355 and 1064 nm from multiwavelength Raman lidar observations, Atmos. Chem. Phys., 25, 7741–7763, https://doi.org/10.5194/acp-25-7741-2025, 2025. a
Heese, B., Floutsi, A. A., Baars, H., Althausen, D., Hofer, J., Herzog, A., Mewes, S., Radenz, M., and Schechner, Y. Y.: The vertical aerosol type distribution above Israel – 2 years of lidar observations at the coastal city of Haifa, Atmos. Chem. Phys., 22, 1633–1648, https://doi.org/10.5194/acp-22-1633-2022, 2022. a
Hofer, J., Ansmann, A., Althausen, D., Engelmann, R., Baars, H., Abdullaev, S. F., and Makhmudov, A. N.: Long-term profiling of aerosol light extinction, particle mass, cloud condensation nuclei, and ice-nucleating particle concentration over Dushanbe, Tajikistan, in Central Asia, Atmos. Chem. Phys., 20, 4695–4711, https://doi.org/10.5194/acp-20-4695-2020, 2020. a, b, c, d, e, f, g, h, i
Holben, B. N., Eck, T. F., Slutsker, I., Tanré, D., Buis, J. P., Setzer, A., Vermote, E., Reagan, J. A., Kaufman, Y. J., Nakajima, T., Lavenu, F., Jankowiak, I., and Smirnov, A.: AERONET – a federated instrument network and data archive for aerosol characterization, Remote Sens. Environ., 66, https://doi.org/10.1016/S0034-4257(98)00031-5, 1998. a, b, c
HYSPLIT: HYbrid Single-Particle Lagrangian Integrated Trajectory model, backward trajectory calculation tool, https://www.ready.noaa.gov/index.php (last access: 8 February 2026), 2026. a
Kaiser, J. W., Heil, A., Andreae, M. O., Benedetti, A., Chubarova, N., Jones, L., Morcrette, J.-J., Razinger, M., Schultz, M. G., Suttie, M., and van der Werf, G. R.: Biomass burning emissions estimated with a global fire assimilation system based on observed fire radiative power, Biogeosciences, 9, 527–554, https://doi.org/10.5194/bg-9-527-2012, 2012. a, b
Klamt, A., Yin, Z., Floutsi, A. A., Griesche, H., Haarig, M., Radenz, M., Jimenez, C., Gast, B., and Baars, H.: PollyNET: Pollynet Processing Chain, Zenodo [code], https://doi.org/10.5281/zenodo.13379737, 2024. a
Laj, P., Myhre, C. L., Riffault, V., Amiridis, V., Fuchs, H., Eleftheriadis, K., Petäjä, T., Salameh, T., Kivekäs, N., Juurola, E., Saponaro, G., Philippin, S., Cornacchia, C., Arboledas, L. A., Baars, H., Claude, A., Mazière, M. D., Dils, B., Dufresne, M., Evangeliou, N., Favez, O., Fiebig, M., Haeffelin, M., Herrmann, H., Höhler, K., Illmann, N., Kreuter, A., Ludewig, E., Marinou, E., Möhler, O., Mona, L., Murberg, L. E., Nicolae, D., Novelli, A., O'Connor, E., Ohneiser, K., Altieri, R. M. P., Picquet-Varrault, B., van Pinxteren, D., Pospichal, B., Putaud, J.-P., Reimann, S., Siomos, N., Stachlewska, I., Tillmann, R., Voudouri, K. A., Wandinger, U., Wiedensohler, A., Apituley, A., Comerón, A., Gysel-Beer, M., Mihalopoulos, N., Nikolova, N., Pietruczuk, A., Sauvage, S., Sciare, J., Skov, H., Svendby, T., Swietlicki, E., Tonev, D., Vaughan, G., Zdimal, V., Baltensperger, U., Doussin, J.-F., Kulmala, M., Pappalardo, G., Sundet, S. S., and Vana, M.: Aerosol, Clouds and Trace Gases Research Infrastructure – ACTRIS, the European research infrastructure supporting atmospheric science, B. Am. Meteorol. Soc., 105, 1098–1136, https://doi.org/10.1175/BAMS-D-23-0064.1, 2024. a
Lebel, T., Parker, D. J., Flamant, C., Bourlès, B., Marticorena, B., Mougin, E., Peugeot, C., Diedhiou, A., Haywood, J. M., Ngamini, J. B., Polcher, J., Redelsperger, J.-L., and Thorncroft, C. D.: The AMMA field campaigns: multiscale and multidisciplinary observations in the West African region, Q. J. Roy. Meteor. Soc., 136, 8–33, https://doi.org/10.1002/qj.486, 2010. a
Marinou, E., Paschou, P., Tsikoudi, I., Tsekeri, A., Daskalopoulou, V., Kouklaki, D., Siomos, N., Spanakis-Misirlis, V., Voudouri, K. A., Georgiou, T., Drakaki, E., Kampouri, A., Papachristopoulou, K., Mavropoulou, I., Mallios, S., Proestakis, E., Gkikas, A., Koutsoupi, I., Raptis, I. P., Kazadzis, S., Baars, H., Floutsi, A., Pirloaga, R., Nemuc, A., Marenco, F., Kezoudi, M., Papetta, A., Močnik, G., Díez, J. Y., Ryder, C. L., Ratcliffe, N., Kandler, K., Sudharaj, A., and Amiridis, V.: An overview of the ASKOS Campaign in Cabo Verde, Environmental Sciences Proceedings, 26, https://doi.org/10.3390/environsciproc2023026200, 2023. a
McConnell, C. L., Highwood, E. J., Coe, H., Formenti, P., Anderson, B., Osborne, S., Nava, S., Desboeufs, K., Chen, G., and Harrison, M. A. J.: Seasonal variations of the physical and optical characteristics of Saharan dust: results from the Dust Outflow and Deposition to the Ocean (DODO) experiment, J. Geophys. Res.-Atmos., 113, https://doi.org/10.1029/2007JD009606, 2008. a
PollyNET: Most recent measurements of operational lidars, PollyNET [data set], https://polly.tropos.de/ (last access: 10 July 2025), 2025. a
Reitebuch, O.: The Spaceborne Wind Lidar Mission ADM-Aeolus, Springer Berlin Heidelberg, https://doi.org/10.1007/978-3-642-30183-4_49, 815–827, 2012. a
Rittmeister, F., Ansmann, A., Engelmann, R., Skupin, A., Baars, H., Kanitz, T., and Kinne, S.: Profiling of Saharan dust from the Caribbean to western Africa – Part 1: Layering structures and optical properties from shipborne polarization/Raman lidar observations, Atmos. Chem. Phys., 17, 12963–12983, https://doi.org/10.5194/acp-17-12963-2017, 2017. a, b
Rocha-Lima, A., Martins, J. V., Remer, L. A., Todd, M., Marsham, J. H., Engelstaedter, S., Ryder, C. L., Cavazos-Guerra, C., Artaxo, P., Colarco, P., and Washington, R.: A detailed characterization of the Saharan dust collected during the Fennec campaign in 2011: in situ ground-based and laboratory measurements, Atmos. Chem. Phys., 18, 1023–1043, https://doi.org/10.5194/acp-18-1023-2018, 2018. a
Rolph, G., Stein, A., and Stunder, B.: Real-time Environmental Applications and Display sYstem: READY, Environ. Modell. Softw., 95, 210–228, https://doi.org/10.1016/j.envsoft.2017.06.025, 2017. a
Ryder, C. L., Highwood, E. J., Rosenberg, P. D., Trembath, J., Brooke, J. K., Bart, M., Dean, A., Crosier, J., Dorsey, J., Brindley, H., Banks, J., Marsham, J. H., McQuaid, J. B., Sodemann, H., and Washington, R.: Optical properties of Saharan dust aerosol and contribution from the coarse mode as measured during the Fennec 2011 aircraft campaign, Atmos. Chem. Phys., 13, 303–325, https://doi.org/10.5194/acp-13-303-2013, 2013. a
Satheesh, S. K. and Moorthy, K. K.: Radiative effects of natural aerosols: a review, Atmos. Environ., 39, 2089–2110, https://doi.org/10.1016/j.atmosenv.2004.12.029, 2005. a
Semwal, E., Haarig, M., Engelmann, R., Althausen, D., Hartmann, M., and Wex, H.: Laboratory setup to study the polarization properties of size-resolved aerosol particles in exact back-scattering direction, EGUsphere, in preparation, 2026. a
Stein, A. F., Draxler, R. R., Rolph, G. D., Stunder, B. J. B., Cohen, M. D., and Ngan, F.: NOAA's HYSPLIT atmospheric transport and dispersion modeling system, B. Am. Meteorol. Soc., 96, 2059–2077, https://doi.org/10.1175/BAMS-D-14-00110.1, 2015. a
Stoffelen, A., Pailleux, J., Källén, E., Vaughan, J. M., Isaksen, L., Flamant, P., Wergen, W., Andersson, E., Schyberg, H., Culoma, A., Meynart, R., Endemann, M., and Ingmann, P.: The atmospheric dynamics mission for global wind field measurement, B. Am. Meteorol. Soc., 86, 73–88, https://doi.org/10.1175/BAMS-86-1-73, 2005. a
Straume-Lindner, A. G., Parrinello, T., Bismarck, J. V., Bley, S., Wernham, D., Kanitz, T., Alvarez, E., Fischey, P., Laurentis, M. D., Fehr, T., Ehlers, F., Tran, V. D., Krisch, I., Reitebuch, O., and Renni, M.: ESA'S Wind Mission Aeolus – Overview, Status and Outlook, in: 2021 IEEE International Geoscience and Remote Sensing Symposium IGARSS, https://doi.org/10.1109/IGARSS47720.2021.9554007, 755–758, 2021. a
Tan, D. G. H., Andersson, E., Kloe, J. D., Marseille, G.-J., Stoffelen, A., Poli, P., Denneulin, M.-L., Dabas, A., Huber, D., Reitebuch, O., Flamant, P., Rille, O. L., and Nett, H.: The ADM-Aeolus wind retrieval algorithms, Tellus A, 60, 191–205, https://doi.org/10.3402/tellusa.v60i2.15180, 2008. a
Tegen, I., Hollrig, P., Chin, M., Fung, I., Jacob, D., and Penner, J.: Contribution of different aerosol species to the global aerosol extinction optical thickness: estimates from model results, J. Geophys. Res.-Atmos., 102, 23895–23915, https://doi.org/10.1029/97JD01864, 1997. a
Tesche, M.: Vertical profiling of aerosol optical properties with multiwavelength aerosol lidar during the Saharan Mineral Dust Experiments, PhD thesis, Leipzig University, https://nbn-resolving.org/urn:nbn:de:bsz:15-qucosa-71257, last access: 10 July 2025, 2011. a, b
Tesche, M., Ansmann, A., Müller, D., Althausen, D., Engelmann, R., Freudenthaler, V., and Groß, S.: Vertically resolved separation of dust and smoke over Cape Verde using multiwavelength Raman and polarization lidars during Saharan Mineral Dust Experiment 2008, J. Geophys. Res.-Atmos., 114, https://doi.org/10.1029/2009JD011862, 2009. a, b, c, d
Tesche, M., Gross, S., Ansmann, A., Mueller, D., Althausen, D., Freudenthaler, V., and Esselborn, M.: Profiling of Saharan dust and biomass-burning smoke with multiwavelength polarization Raman lidar at Cape Verde, Tellus B, 63, 649–676, https://doi.org/10.1111/j.1600-0889.2011.00548.x, 2011a. a, b, c, d, e, f, g, h, i, j, k, l, m
Tesche, M., Müller, D., Gross, S., Ansmann, A., Althausen, D., Freudenthaler, V., Weinzierl, B., Veira, A., and Petzold, A.: Optical and microphysical properties of smoke over Cape Verde inferred from multiwavelength lidar measurements, Tellus B, 63, 677–694, https://doi.org/10.1111/j.1600-0889.2011.00549.x, 2011b. a, b, c
Trapon, D., Baars, H., Floutsi, A. A., Bley, S., Haarig, M., Lacour, A., Flament, T., Dabas, A., Nehrir, A. R., Ehlers, F., and Huber, D.: Cross-validations of the Aeolus aerosol products and new developments with airborne high-spectral-resolution lidar measurements above the tropical Atlantic during JATAC, Atmos. Meas. Tech., 18, 3873–3896, https://doi.org/10.5194/amt-18-3873-2025, 2025. a
Vaughan, M., Garnier, A., Josset, D., Avery, M., Lee, K.-P., Liu, Z., Hunt, W., Pelon, J., Hu, Y., Burton, S., Hair, J., Tackett, J. L., Getzewich, B., Kar, J., and Rodier, S.: CALIPSO lidar calibration at 1064 nm: version 4 algorithm, Atmos. Meas. Tech., 12, 51–82, https://doi.org/10.5194/amt-12-51-2019, 2019. a
Veselovskii, I., Goloub, P., Podvin, T., Bovchaliuk, V., Derimian, Y., Augustin, P., Fourmentin, M., Tanre, D., Korenskiy, M., Whiteman, D. N., Diallo, A., Ndiaye, T., Kolgotin, A., and Dubovik, O.: Retrieval of optical and physical properties of African dust from multiwavelength Raman lidar measurements during the SHADOW campaign in Senegal, Atmos. Chem. Phys., 16, 7013–7028, https://doi.org/10.5194/acp-16-7013-2016, 2016. a, b, c, d, e, f, g
Veselovskii, I., Goloub, P., Podvin, T., Tanre, D., da Silva, A., Colarco, P., Castellanos, P., Korenskiy, M., Hu, Q., Whiteman, D. N., Pérez-Ramírez, D., Augustin, P., Fourmentin, M., and Kolgotin, A.: Characterization of smoke and dust episode over West Africa: comparison of MERRA-2 modeling with multiwavelength Mie–Raman lidar observations, Atmos. Meas. Tech., 11, 949–969, https://doi.org/10.5194/amt-11-949-2018, 2018. a, b, c, d, e
Veselovskii, I., Hu, Q., Goloub, P., Podvin, T., Korenskiy, M., Derimian, Y., Legrand, M., and Castellanos, P.: Variability in lidar-derived particle properties over West Africa due to changes in absorption: towards an understanding, Atmos. Chem. Phys., 20, 6563–6581, https://doi.org/10.5194/acp-20-6563-2020, 2020. a, b, c, d, e, f, g
Wagner, R., Jähn, M., and Schepanski, K.: Wildfires as a source of airborne mineral dust – revisiting a conceptual model using large-eddy simulation (LES), Atmos. Chem. Phys., 18, 11863–11884, https://doi.org/10.5194/acp-18-11863-2018, 2018. a
Wandinger, U., Floutsi, A. A., Baars, H., Haarig, M., Ansmann, A., Hünerbein, A., Docter, N., Donovan, D., van Zadelhoff, G.-J., Mason, S., and Cole, J.: HETEAC – the Hybrid End-To-End Aerosol Classification model for EarthCARE, Atmos. Meas. Tech., 16, 2485–2510, https://doi.org/10.5194/amt-16-2485-2023, 2023. a, b
Wehr, T., Kubota, T., Tzeremes, G., Wallace, K., Nakatsuka, H., Ohno, Y., Koopman, R., Rusli, S., Kikuchi, M., Eisinger, M., Tanaka, T., Taga, M., Deghaye, P., Tomita, E., and Bernaerts, D.: The EarthCARE mission – science and system overview, Atmos. Meas. Tech., 16, 3581–3608, https://doi.org/10.5194/amt-16-3581-2023, 2023. a
Weinzierl, B., Ansmann, A., Prospero, J. M., Althausen, D., Benker, N., Chouza, F., Dollner, M., Farrell, D., Fomba, W. K., Freudenthaler, V., Gasteiger, J., Groß, S., Haarig, M., Heinold, B., Kandler, K., Kristensen, T. B., Mayol-Bracero, O. L., Müller, T., Reitebuch, O., Sauer, D., Schäfler, A., Schepanski, K., Spanu, A., Tegen, I., Toledano, C., and Walser, A.: The Saharan aerosol long-range transport and aerosol–cloud-interaction experiment: overview and selected highlights, B. Am. Meteorol. Soc., 98, 1427–1451, https://doi.org/10.1175/BAMS-D-15-00142.1, 2017. a
Xiong, X. and Barnes, W.: An overview of MODIS radiometric calibration and characterization, Adv. Atmos. Sci., 23, 69–79, https://doi.org/10.1007/s00376-006-0008-3, 2006. a
Yin, Z. and Baars, H.: PollyNET/Pollynet_Processing_Chain: Version 3.0, Zenodo [code], https://doi.org/10.5281/zenodo.5571289, 2021. a
- Abstract
- Introduction
- Methodology
- Results
- Definition of the aerosol-related seasons at Mindelo
- Conclusions
- Appendix A: Data availability
- Appendix B: Geometrical and optical aerosol properties
- Appendix C: AERONET long-term statistics
- Appendix D: Seasonality of biomass burning over Africa and air mass transport towards Mindelo
- Data availability
- Author contributions
- Competing interests
- Disclaimer
- Special issue statement
- Acknowledgements
- Financial support
- Review statement
- References