the Creative Commons Attribution 4.0 License.
the Creative Commons Attribution 4.0 License.
 | 05 Mar 2026
Sub-seasonal and spatial variations in ozone formation and co-control potential for secondary aerosols in the Guanzhong basin, central China
Ruonan Wang
Ningning Zhang
Jiarui Wu
Qian Jiang
Jiaoyang Yu
Yuxuan Lu
Xuexi Tie
Tropospheric ozone (O3) pollution in warm seasons has become the key air-quality issue in the Guanzhong Basin (GZB), threatening human health despite prior successes in particulate matter control. Understanding how O3 formation regimes (OFR) and secondary aerosol (SA) formation regimes (SAFR) evolve with time and space is critical for designing coordinated control strategies. Long-term near-surface observations (2014–2024) are combined with high-resolution WRF-Chem simulations for May–August 2022, employing scenario-based EKMA curves and source-apportionment diagnostics to resolve sectoral contributions. Results indicate a sub-seasonal OFR progression from VOCs-limited in early summer to transitional in midsummer and NOX-limited in late summer, with anthropogenic contribution to the maximum daily averaged 8 h (MDA8) O3 increasing from 32.8 % in May to 55.2 % in July and biogenic share peaking 18.7 % in July. SAFR follows a distinct cycle with NOX-limited in May, VOCs-limited in June, and transitional behavior thereafter. Traffic and industrial emissions are the dominant anthropogenic divers for both O3 and SA. These patterns highlight phases of synergistic control, where anthropogenic VOCs mitigation in June and NOX mitigation in August maximize co-benefits while minimizing trade-offs. This study integrated dynamic OFR/SAFR diagnostics with sectoral emission inventories can provide insights into pathways toward seasonally adaptive, city-specific air quality management in the GZB.
- Article
(31991 KB) - Full-text XML
-
Supplement
(3560 KB) - BibTeX
- EndNote


Tropospheric ozone (O3), despite constituting only approximately 10 % of total atmospheric O3, poses a significant threat to human health and ecosystem integrity (Valacchi et al., 2015; Feng et al., 2022). Long-term observations at regional background stations reveals a persistent upward trend in near-surface O3 concentrations in China in recent decades (Wang et al., 2009; Sun et al., 2016; Xu et al., 2016). The nationwide implementation of the “Air Pollution Prevention and Control Action Plan” since September 2013 has achieved notable success in mitigating fine particulate matter (PM2.5) pollution (Zheng et al., 2018; Zhang et al., 2019). However, O3 pollution has emerged as a paramount challenge for air quality management in China during the warm season (May–August), driving extensive research on formation mechanisms and PM2.5 co-control strategies (Li et al., 2019, 2020; Liu and Wang, 2020; Wang et al., 2022b, 2023b, 2024).
Near-surface O3 is a secondary pollutant formed through intricate photochemical reactions involving nitrogen oxides (NOX) and volatile organic compounds (VOCs) under sunlight (Chapman, 1930; Chameides et al., 1992; Wang et al., 2017). The complex photochemical pathways of O3 formation pose a significant barrier to effective O3 pollution control, resulting in persistent high O3 concentrations. The inherent nonlinearity in tropospheric O3 formation necessitates the assessment of its Formation sensitivity Regime (OFR), which acts as a prerequisite for implementing effective control strategies. OFR is categorized into NOX-limited, VOCs-limited, and transitional regimes according to the relationship of O3 with its precursors (Lu et al., 2019). In NOX-limited regimes, O3 production is primarily terminated by self-reactions of peroxyl radicals, reducing NOX emissions effectively lowers O3. Conversely, in VOCs-limited regimes, termination occurs mainly via NO2+ HO• reactions; reducing NOX can slow HO• loss and reduce O3 titration, resultantly increasing O3 levels (Jenkin and Clemitshaw, 2000). Transitional regimes exhibit comparable sensitivity to both precursors. Current OFR assessment methods include indicator approaches (Sillman, 1995; Martin et al., 2004; Li et al., 2011), observation-based models (OBM) (Cardelino and Chameides, 1995; Wang et al., 2017; Song et al., 2022), and emission-based models (EBMs) utilizing three-dimensional chemical transport models (CTMs) (Li et al., 2018; Xu et al., 2022). Despite computational demands, EBMs provide a robust framework for resolving OFR across horizontal and vertical dimensions and over time, enabling direct investigation of OFR under varying meteorology and emission reduction scenarios (Ou et al., 2016; Wang et al., 2021).
Owing to the common precursors and complex interplay, synergistic control of PM2.5 and O3 has emerged as an essential priority for China's air pollution mitigation in recent years (Xiao et al., 2022; Du et al., 2024; Kong et al., 2024). In addition to the common share of precursors (NOX and VOCs), the ambient O3 and its photochemical derivative, hydroxyl radicals (•OH), constitute the major oxidants that oxidize precursors to form secondary aerosols (SA), such as sulfates, nitrates, and secondary organic aerosols (SOA). Moreover, hydroperoxyl radicals (HO2•), as a critical participate in O3 production, whose concentration can be influenced by heterogeneous uptake on wet aerosol surfaces (Li et al., 2019; Wang et al., 2022a). Furthermore, aerosol-radiation and aerosol-cloud interactions alter solar radiation and temperature in the atmosphere, thereby influencing O3 photochemical production (Baró et al., 2017; Li et al., 2019; Wu et al., 2020a). Therefore, optimizing precursor emission reductions requires not only understanding OFR but also the SA formation sensitivity regime (SAFR) to NOX and VOCs. Integrating OFR and SAFR analyses under diverse meteorological conditions is critical to identifying co-beneficial pathways for simultaneously improving air quality.
The Guanzhong Basin (GZB), a key air pollution control area in central China, experiences severe warm-season O3 pollution. Bei et al. (2022) have revealed that increased summertime unfavorable synoptic conditions are responsible for the deteriorated O3 pollution in the GZB from 2014 to 2018. Biogenic emissions from extensive forests in Qinling mountains, situated south of the GZB, could interact with abundant anthropogenic emissions within the GZB when southerly winds prevail, facilitating O3 formation in the region (Feng et al., 2016; Li et al., 2018; Dai et al., 2024b). However, studies remain limited on the O3 formation characteristics and the synergistic pollutants abetment in the region (Wang et al., 2022b). This study employs a high-resolution online-coupled model to comprehensively resolve spatiotemporal patterns in warm-season O3 formation characteristics and provide insights into O3 pollution mitigation and synergistic air quality management in the GZB.
2.1 The WRF-Chem model
The WRF-Chem model (Weather Research and Forecasting model with Chemistry) (Grell et al., 2005) utilized in this study is a specific version modified by Li et al. (2010, 2011a, b, 2012) and has been extensively used for regional simulations of air pollutants in the GZB. Simulations focus on the atmospheric processes over the GZB in the warm season of 2022. This period is selected for its exceptionally high O3 pollution (with maximum daily averaged 8 h (MDA8) O3 concentration of 134 µg m−3, +7 % above the 2020–2024 mean), enabling a detailed analysis of photochemical mechanisms and co-control pathways. Figure 1 shows the model simulation domain encompassing the GZB and its surrounding regions, with particular focus on five major cities: Xi'an (XA, provincial capital), Xianyang (XY, undergoing rapid industrialization and urbanization), Weinan (WN, energy hub), Tongchuan (TC), and Baoji (BJ). Detailed model configuration can be found in Supplement Text S1 and Table S1 of the Supplement. This setup constitutes the base simulation, which serves as the reference for subsequent sensitivity scenarios.
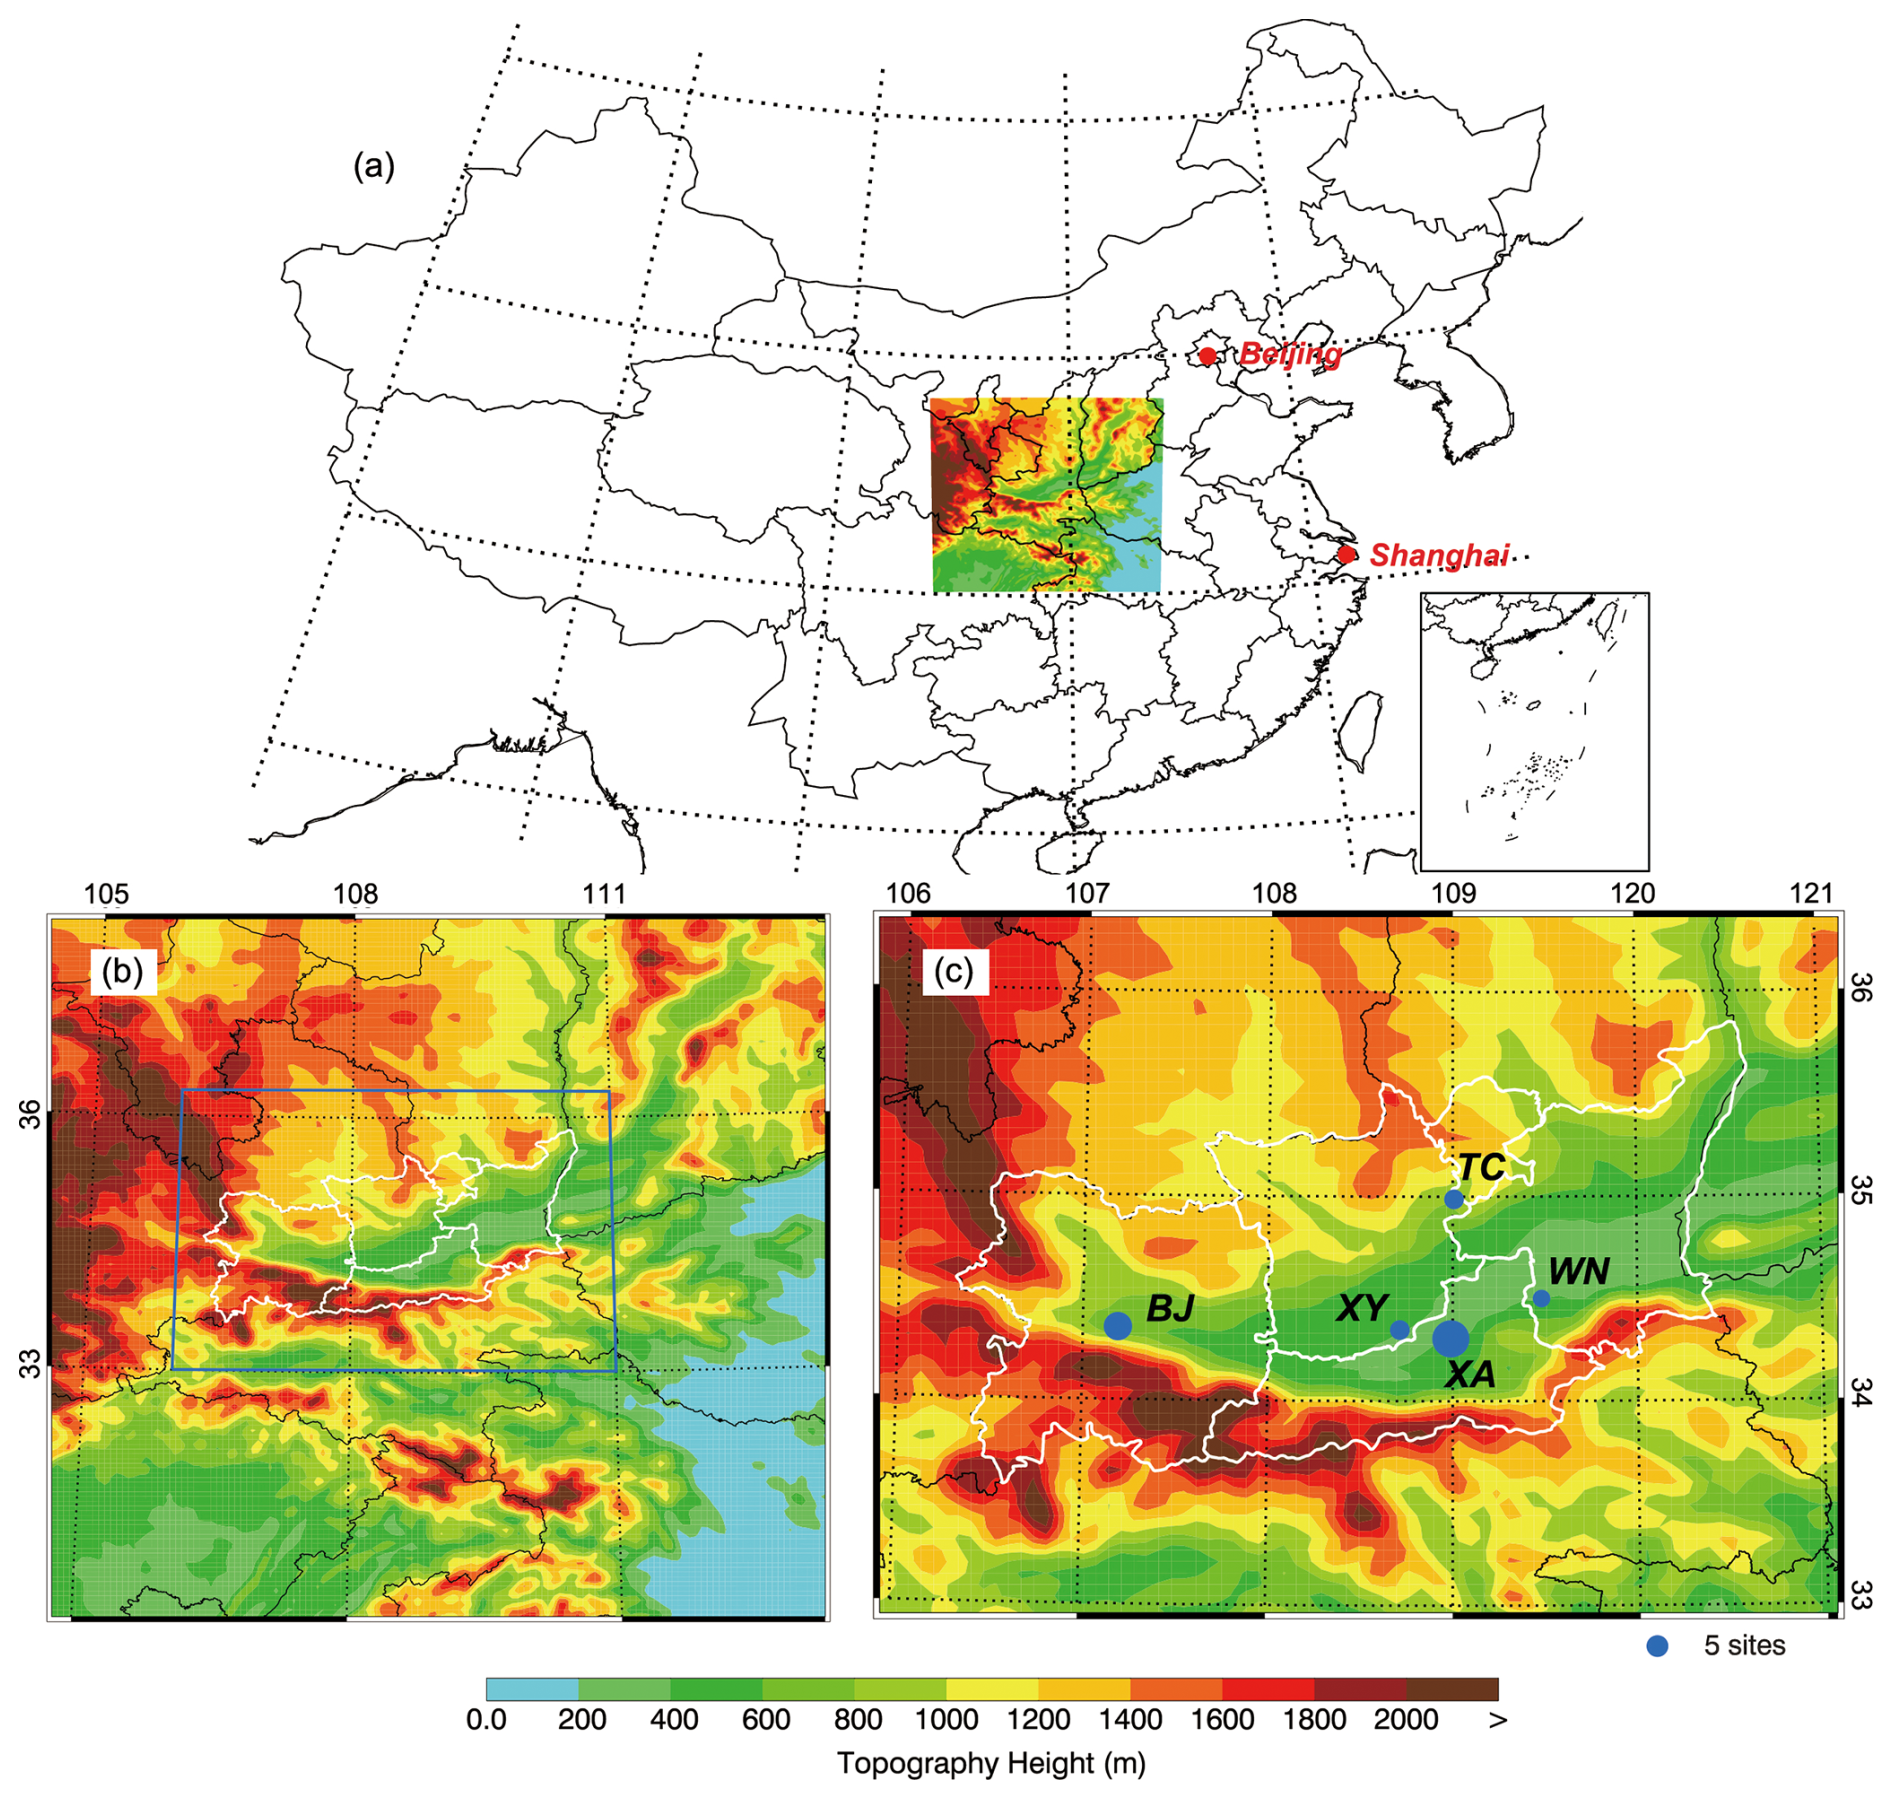
Figure 1Map showing (a) the location of simulation domain in China, (b) WRF-Chem model simulation domain with topography. In (c), the filled blue circles represent centers of cities with ambient monitoring sites and the size of circles denotes the number of ambient monitoring sites of cities. The white boundary outlines the Guanzhong Basin (GZB), the focus region of this study, comprising five cities: Xian (XA), Xianyang (XY), Weinan (WN), Tongchuan (TC), and Baoji (BJ).
2.2 Observations and Statistics for Comparisons
Observations of criteria pollutants (PM2.5, NO2, O3, SO2 and CO) released by China's Ministry of Ecology and Environment (MEE) are used for characterizing recent warm-season (2014–2024) air quality trends across the GZB and validating the simulated air pollutants. Meteorological parameters, including 2 m temperature, relative humidity, and 10 m wind speed/direction, measured at Jinghe station in the GZB (34.26° N and 108.58° E) are employed to evaluate the model performance in simulating synoptic conditions. Model performance of the base simulation is evaluated against observations using statistical metrics including the mean bias (MB), root mean square error (RMSE), and the index of agreement (IOA, shown in S2 of the Supplement).
To evaluate the robustness of the simulated OFR, we have employed satellite-derived column densities of formaldehyde (HCHO) and NO2. Daily Level-3 gridded HCHO data are obtained from the OMI/Aura HCHO Total Column Daily L3 Global 0.1° × 0.1° product (OMHCHOd v003; NASA GES DISC). Daily Level-3 gridded NO2 data are sourced from the OMI/Aura NO2 Cloud-Screened Total and Tropospheric Column L3 Global 0.25° × 0.25° product (OMNO2d v003; NASA GES DISC). A grid cell is excluded from the monthly average calculation if valid data are available for fewer than 8 days in that month.
2.3 Sensitivity simulations
Building upon the base simulation, an emission reduction matrix comprising 121 scenarios is then designed to develop EKMA diagrams to determine the O3 and SA formation regime (Fig. S1). These scenarios include reductions of NOX and AVOCs emissions from 0 % to 100 % with an interval of 10 %. Given that the biogenic VOCs (BVOCs) emissions are uncontrollable, only the AVOCs emission reduction is taken into consideration. It does not mean the insignificance of BVOCs in the O3 formation. However, changes of plant cover and emissions as well as the O3 uptake capacity of plants all affect the near-surface O3 concentration through ecosystem-atmosphere interactions (Lin et al., 2020). The high-resolution, online-coupled WRF-Chem framework simulates all key processes affecting O3 formation (local photochemistry, regional transport, vertical mixing) consistently. By varying emissions under fixed meteorology and boundary conditions, the model isolates the net impact of emission changes on MDA8 O3 concentrations. While the classical EKMA method based on O3 production rates reflects a more localized chemical mechanism, our approach provides an integrated, policy-relevant sensitivity diagnosis that accounts for both formation and transport at the urban-regional scale, offering directly actionable insight for control strategies (Ye et al., 2025). Furthermore, the brute force method (BFM) is used to evaluate the O3 and SA contributions of industry, power, residential, transportation and biogenic sources in the GZB and five cities during the warm season of 2022. The BFM calculates the contribution of a specific source sector by completely removing (setting to zero) all emissions from that sector in the base simulation and comparing the resulting MDA8 O3 or SA concentration with the base case (Dunker et al., 1996). In the present study, MDA8 O3 concentrations are used as the response metric in chemical regime identification and source apportionment for several key reasons. First, MDA8 O3 represents the period of highest daily O3 exposure, offering a robust indicator of actual O3 pollution levels. Second, it is the official metric for ambient O3 standards under China's national air quality regulations. Assessing how MDA8 O3 responds to emission perturbations therefore provides direct, policy-relevant insights for designing effective air quality management and control strategies.
3.1 Air quality during warm seasons in the GZB
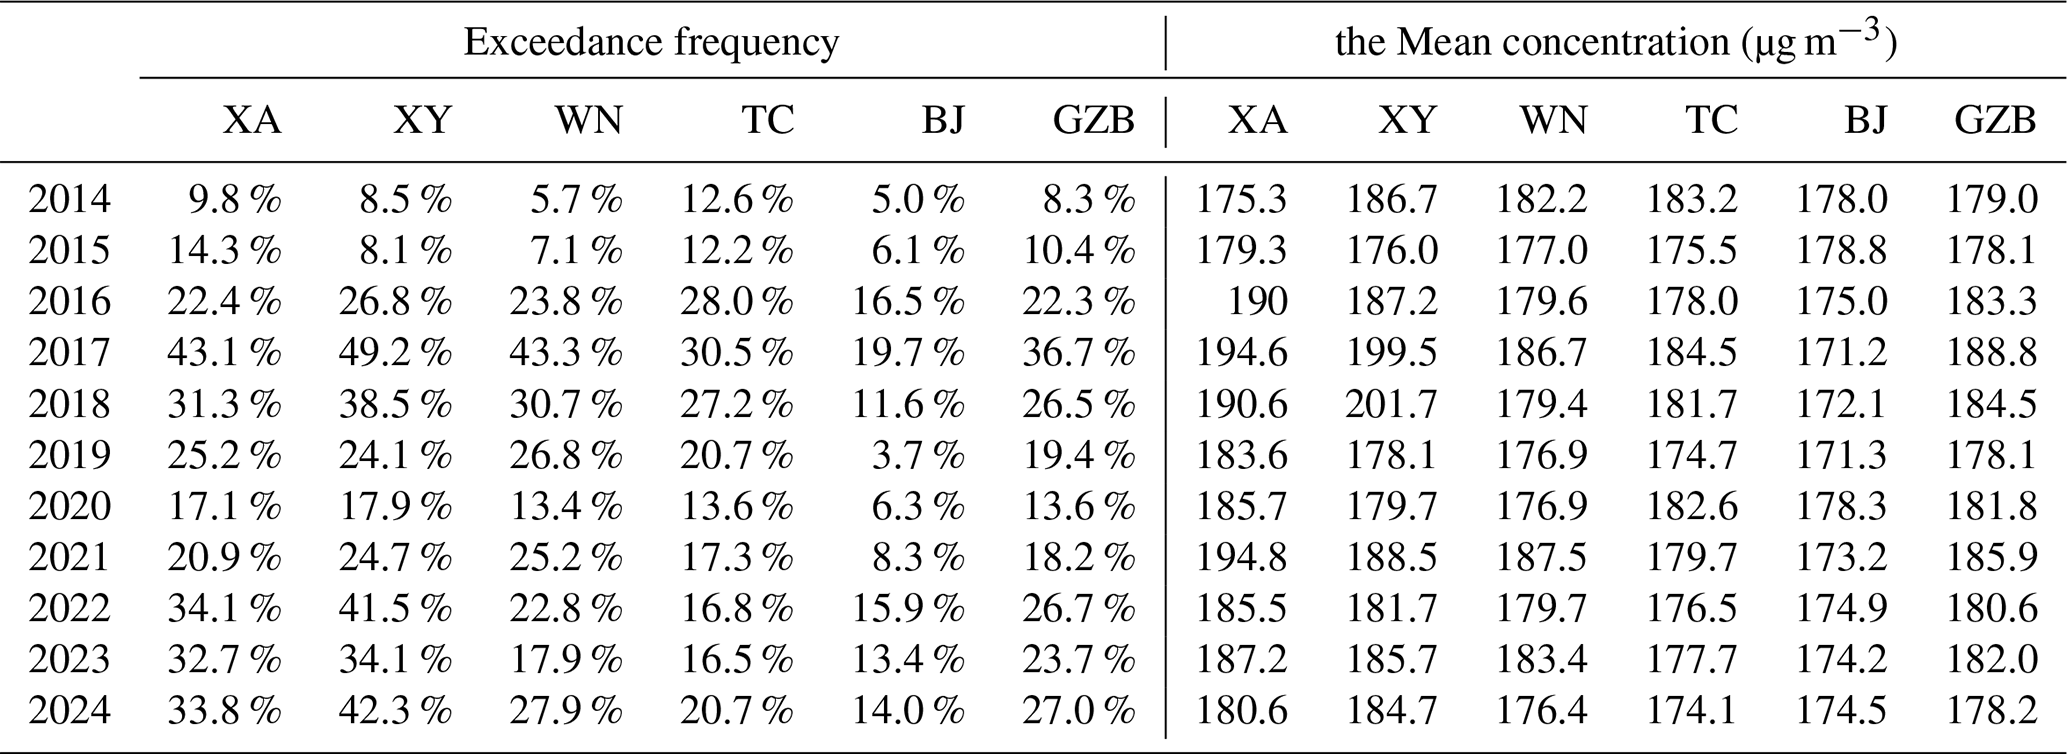
To understand the evolving characteristics of summertime photochemical pollution in the GZB, we first examine recent trends in near-surface O3 and PM2.5 concentrations during the warm seasons from 2022 to 2024. This period represents the most recent stage of air quality management in the region and provides insight into ongoing challenges posed by secondary pollutants. Under China's sequential air pollution policies – the Air Pollution Prevention and Control Action Plan (2013–2017; State Council, 2013), the Three-Year Action Plan to Win the Blue-Sky War (2018–2020; State Council, 2018), and the Air Quality Continuous Improvement Action Plan (2023–2025; MEE, 2023) – the GZB has achieved sustained PM2.5 reductions. Warm-season PM2.5 concentrations have decreased from approximately 43.1 µg m−3 in 2014 to around 21.6 µg m−3 in 2024, representing a nearly 50 % reduction (Fig. 2a). In contrast, the mean MDA8 O3 concentration during the warm season has increased from 96.0 µg m−3 in 2014 to roughly 132.7 µg m−3 in 2024, with a substantial increase from 2014 to 2017, a decrease from 2017 to 2020, followed by a renewed upward trend thereafter (Fig. 2b). While the substantial alleviation in the particulate pollution is mainly due to the anthropogenic emission mitigation, O3 pollution has worsened in the region primarily driven by increased unfavorable conditions and secondarily by changes in anthropogenic emissions (Bei et al., 2022). Near-surface observations have revealed persistent O3 pollution during the warm season, with frequent exceedances of the national ambient air quality standard for MDA8 O3 (160 µg m−3, as shown in Table 1). Year-to-year fluctuations in mean MDA8 O3 levels are governed by the frequency of exceedances, which rise from 8.3 % in 2014 to 36.7 % in 2017, fall to 13.6 % in 2020, and climb again to 27.0 % in 2024; the magnitude of those exceedances remains relatively stable, ranging from 178 to 189 µg m−3 (Table 1).
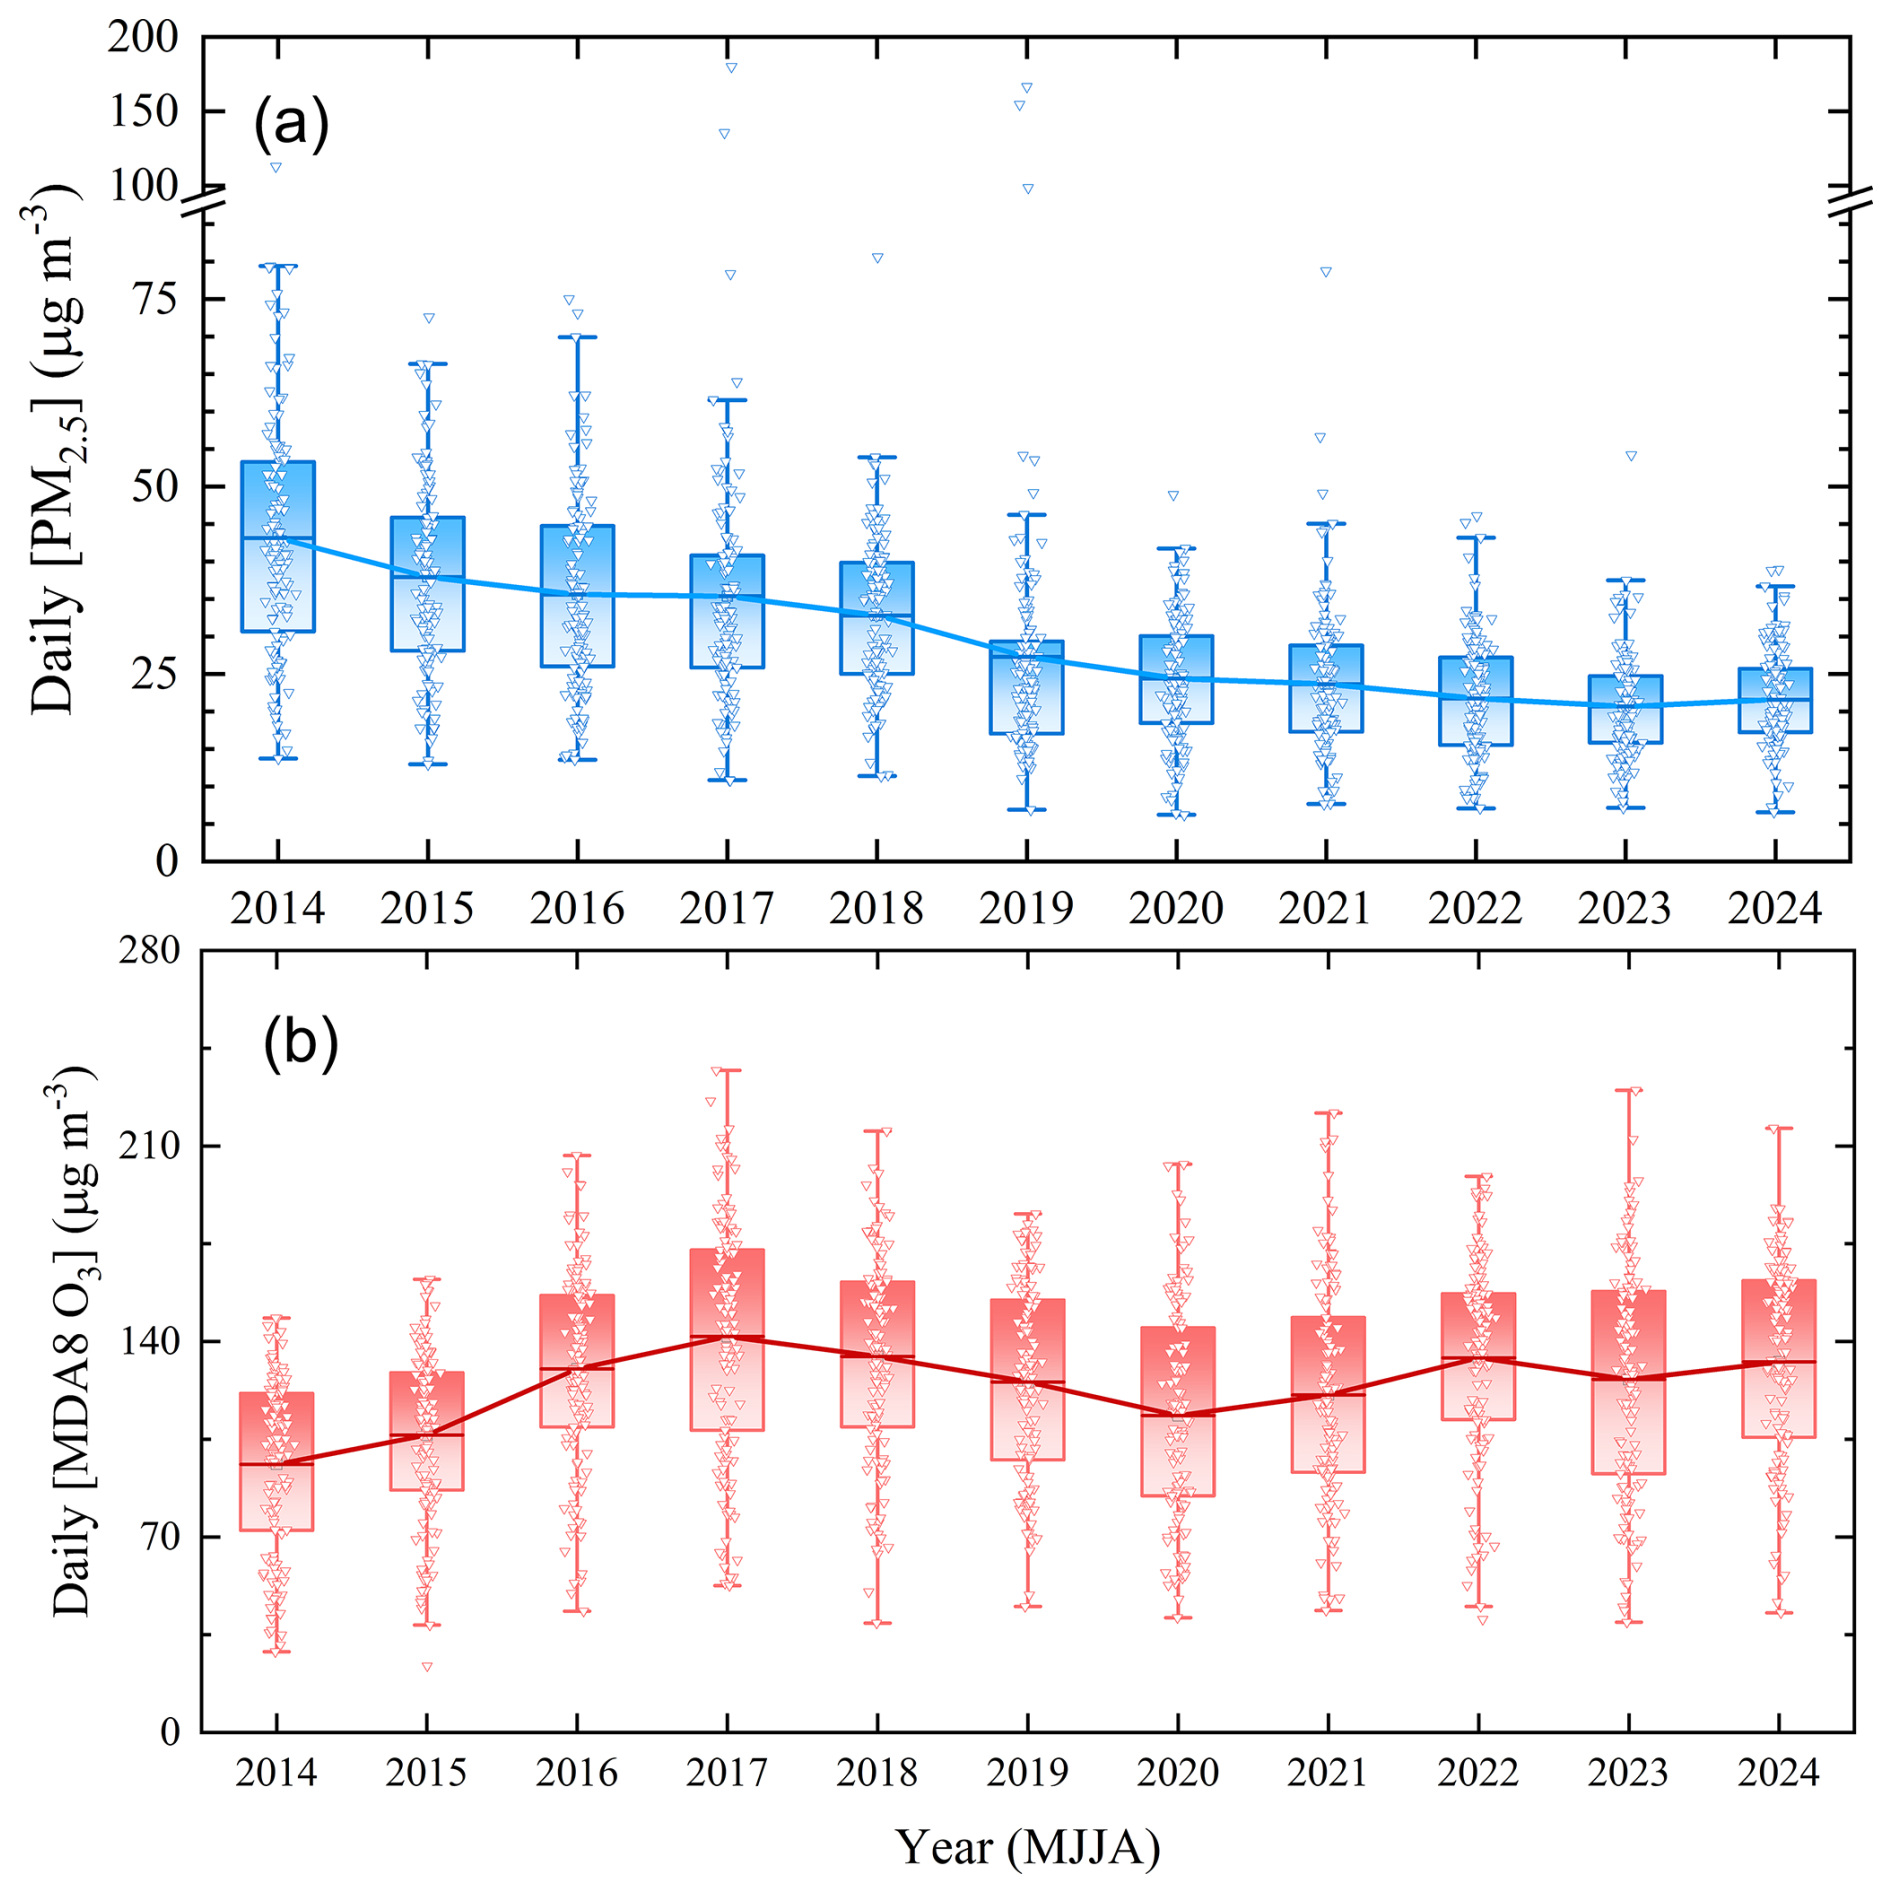
Figure 2Interannual variations of the warm-season (May–August) mean (a) PM2.5 and (b) MDA8 O3 concentrations in the GZB during 2014–2024, based on observations from 33 national monitoring sites. Box plots show the distribution (25th–75th percentiles, mean, whiskers, and outliers), and solid connecting lines indicate annual means, highlighting long-term trends.
The monthly evolution of O3 concentrations reveals a pronounced sub-seasonal pattern in the GZB. June consistently emerges as the peak month for both MDA8 O3 levels and exceedance frequency (Fig. S5 and Table S2). During the warm seasons from 2014 to 2024, the mean MDA8 O3 concentration in June reaches approximately 132 µg m−3, with over 30 % of days with O3 exceedances. The peak corresponds closely with meteorological conditions typically observed in early summer, when the region experiences strong solar radiation, elevated temperatures, and relatively low precipitation conditions that are highly conducive to photochemical O3 formation (Pay et al., 2019). The early-summer O3 peak observed in the GZB is consistent with reports from northern China, where June maxima are evident in the Beijing–Tianjin–Hebei (BTH) region and June–July peaks prevail across the North China Plain (Han et al., 2020; Li et al., 2020). In contrast, in southern China, O3 sub-seasonality is strongly modulated by subtropical high-pressure systems, the East Asian monsoon, typhoon passages, and land–sea breeze circulations. As a result, the peak O3 episodes are tended to emerge in May or during the late summer to early autumn (September–October) in the Yangtze River Delta (YRD) and Pearl River Delta (PRD) (Han et al., 2020; Xu et al., 2020; Ouyang et al., 2022). These regional contrasts highlight that while the precise timing of seasonal O3 peaks is shaped by local climate and meteorology, the emergence of a distinct sub-seasonal maximum is a robust feature across China's major urban clusters. This underscores the sensitivity of regional air quality to meteorological transitions and highlights the need for sub-seasonally adaptive control strategies, in particularly during the high-risk period.
How these basin-wide trends manifest at the city scale is then explored. O3 variations in all five cities mirror the overall pattern in GZB, with MDA8 O3 concentrations rising from 2014 to a maximum in 2017 and then dipping through 2020 before climbing again to 2024 levels. Cities of XA, XY, and WN, located in the central GZB, have the relatively high O3 levels, with the mean MDA8 O3 concentration ranging of 128–129 µg m−3 during the warm seasons of 2014–2024. XY has experienced the fastest MDA8 O3 concentration increase of 6.3 µg m−3 yr−1, nearly twice the basin average of 3.7 µg m−3 yr−1, which likely reflects rapid urban expansion and increasing local precursor emissions. The city also records the highest fraction of exceedance days, averaging 28.7 % of warm-season days during 2014–2024 and peaking at 49.2 % in 2017 (Table 1). XA is also characterized by the sever O3 pollution comparing with other cities, with a growth rate of 3.8 µg m−3 yr−1 and exceedances on 25.9 % of the warm-season days, consistent with its role as the region's primary emission hub. By contrast, BJ, situated on the western edge and often upwind of the basin core, had the lowest O3 burden, with the mean MDA8 O3 concentration of 113.3 µg m−3 and only 10.9 % exceedances of warm-season days during 2014–2024. These spatial differences underscore the importance of both local precursor controls in rapidly urbanizing cities and regional transport pathways in shaping O3 pollution across the GZB.
Generally, the long-term observations reveal not only a basin-wide deterioration in O3 pollution but also strong sub-seasonal and spatial heterogeneity, highlighting the necessity of process-based modeling to resolve spatiotemporal patterns in warm-season O3 formation characteristics and to provide insights into air pollution mitigation in the GZB.
Table 1Warm-season exceedance frequency and mean concentration of MDA8 O3 in the GZB and its Cities from 2014 to 2024.
3.2 Model validation
The meteorological simulations during the warm season of 2022 demonstrate excellent reproduction of diurnal temperature patterns (IOA = 0.99) despite slight overestimation biases (+0.4 °C), while relative humidity variations are well captured (IOA = 0.95) with marginal underestimation (−1.8 %, Fig. S2). Spatially, the model reproduces key air pollutants distributions across the GZB against measurements (Fig. S3). Elevated PM2.5 and O3 in the eastern and central regions arise from northeasterly transport, weak winds over the central basin plain that favor accumulation of air pollutants, and southerly flows carrying BVOCs from the Qinling forests. Temporally, simulated air pollutant concentrations show good agreement with observations with IOAs all exceeding 0.5 (Fig. S4). The model's good performance in replicating synoptic-scale meteorological processes and associated air pollutants warrants its suitability for mechanistic analysis. Comprehensive validation of the WRF-Chem model performance is detailed in S3 of the Supplement.
3.3 Spatiotemporal Patterns of O3 Sensitivity from EKMA Analysis
O3 formation in the planetary boundary layer (PBL) is a complex and nonlinear process driven by sunlight acting on NOX and VOCs. Figures 3 and 4 present EKMA diagrams for four high-O3 pollution episodes from May to August 2022 in urban areas of the GZB and its five cities, respectively. These diagrams depict O3 isopleths for OFR identification, derived from sensitivity simulations with systematically reduced NOX and AVOCs emissions. The ridge line (red lines) delineates the boundary between these regimes: scenarios above it lie in the VOCs-limited regime (O3 falls more with AVOCs cut), those below in the NOX-limited regimes, and scenarios near the line are transitional regimes (mixed sensitivity). The upper-right corner (100 % AVOCs, 100 % NOX emissions) represents the current emission scenario, whose location relative to the ridge line determines the prevailing sensitivity regime.
3.3.1 Spatiotemporal Shifts in OFR
EKMA curves reveal a pronounced sub-seasonal progression of OFR across the GZB. In May and June, the basin as a whole is predominantly VOCs-limited, indicating AVOCs reductions would substantially lower O3 concentrations, whereas moderate NOX cuts could exacerbate O3 pollution (Fig. 3a, b). By July, OFR in urban areas shifts toward a transitional regime (Fig. 3c). In August, the GZB enters a NOX-limited regime (Fig. 3d), where a 40 % NOX reduction yields an 11.1 % decrease in MDA8 O3, compared to only 3 % for an equal AVOCs cut. City-scale analyses show marked spatial heterogeneity (Fig. 4). In early summer, XA, XY, WN, and TC exhibit VOCs-limited regimes. BJ generally falls within NOX-limited or transitional regimes. WN is the most NOX-saturated (VOCs-limited) city. By August, OFRs in all cities except WN (transitional) become NOX-limited.
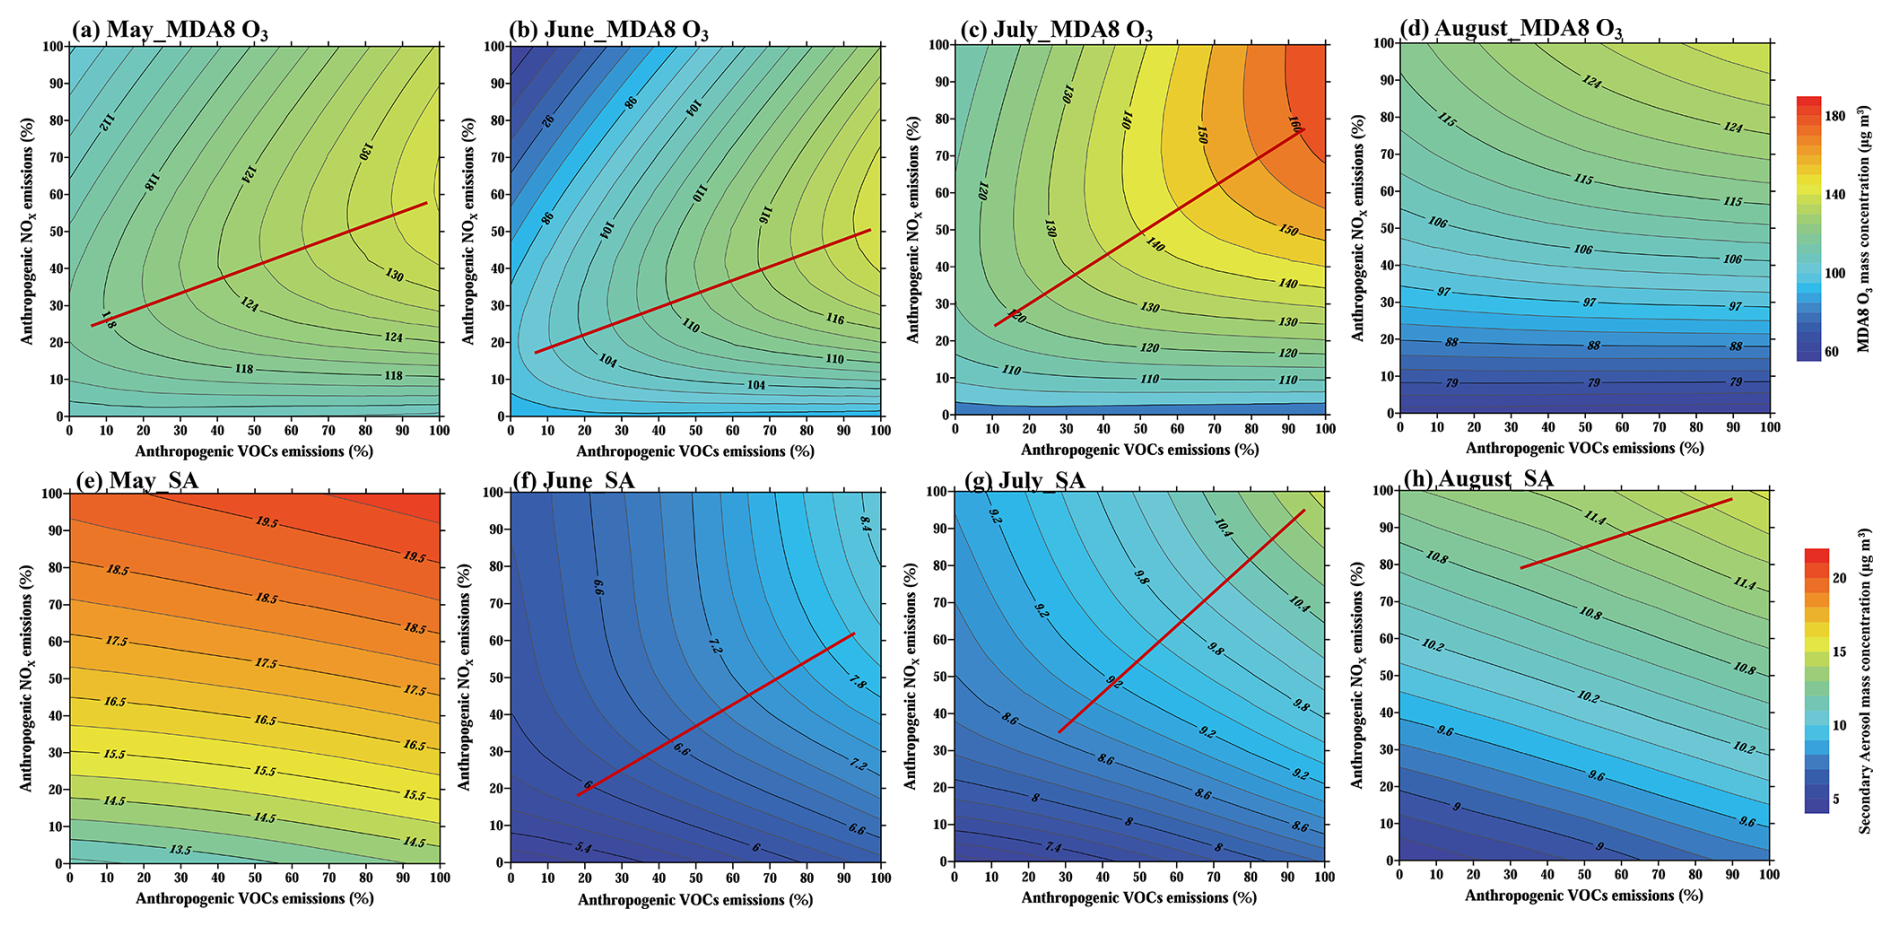
Figure 3MDA8 O3 and SA isopleth profiles (µg m−3) in urban areas of the GZB in high-O3 pollution episode during (a) and (e) May, (b) and (f) June, (c) and (g) July, (d) and (h) August 2022. The VOCs-limited and NOX-limited regimes are separated by the red ridge lines. (d) and (e) indicate the formation regime in the GZB are NOX-limited with no red ridge lines displayed in the isopleth at current emission mitigation scenarios.
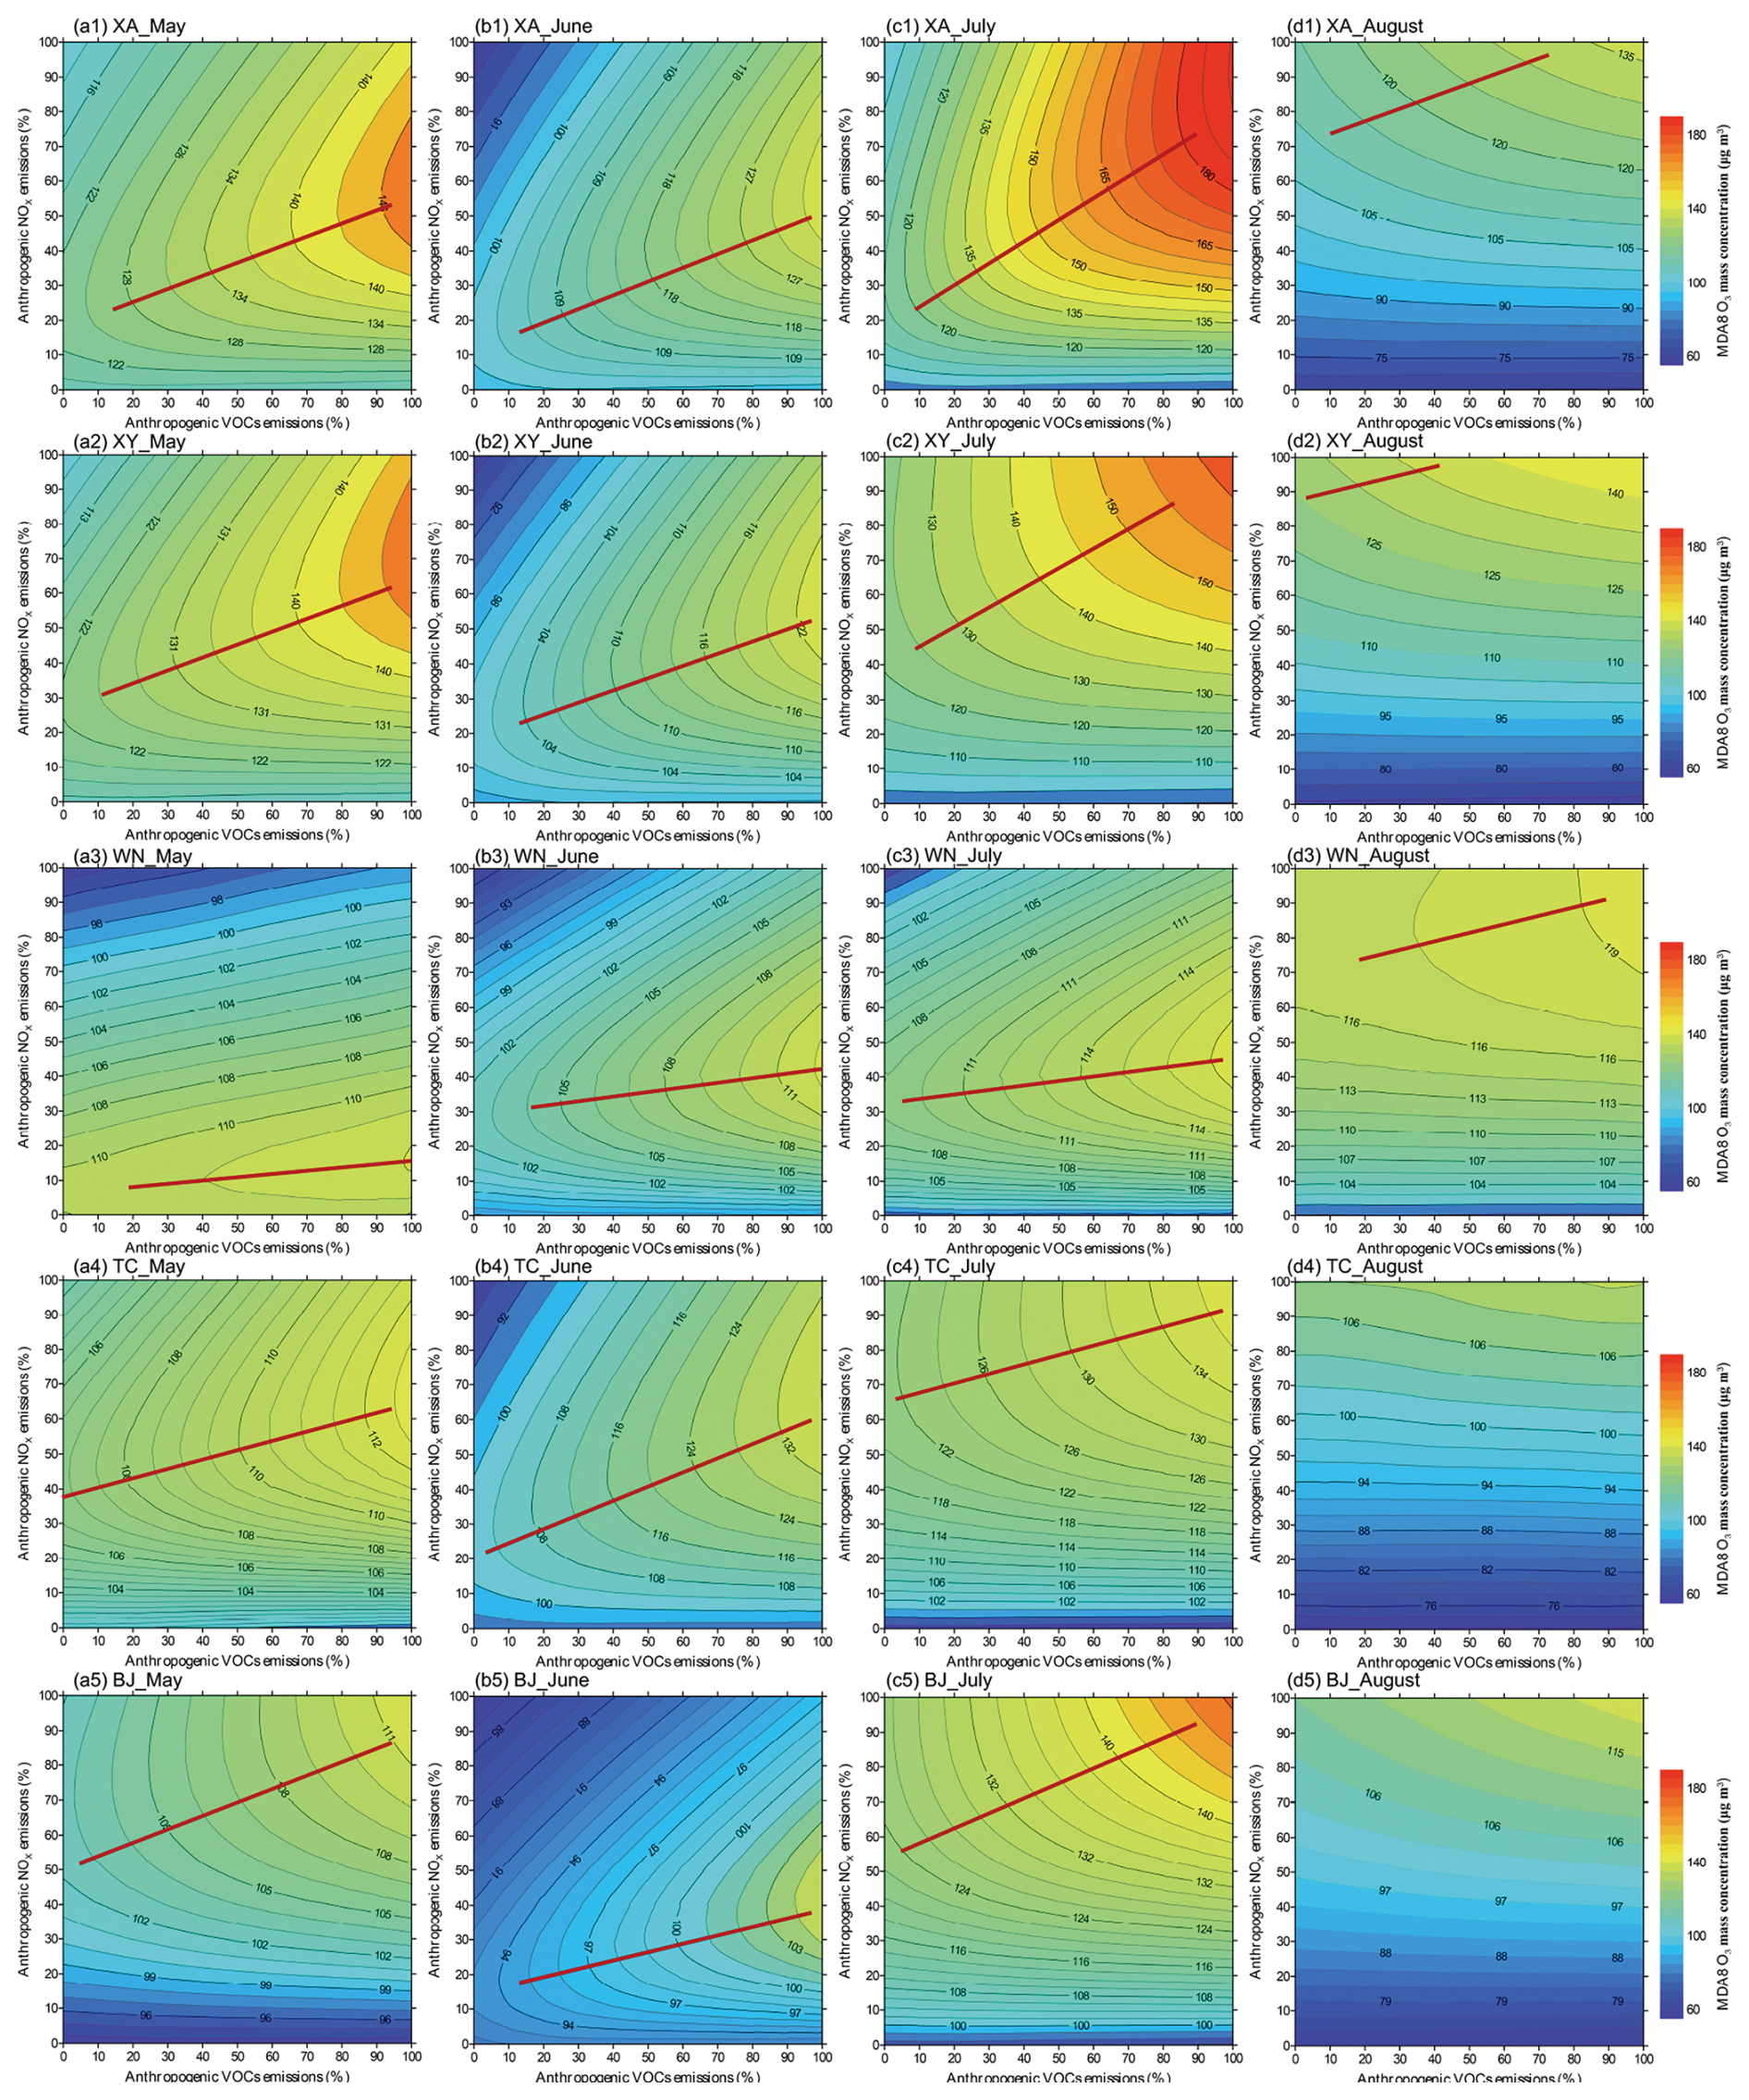
Figure 4MDA8 O3 isopleth profiles (µg m−3) in urban areas of (*1) XA, (*2) XY, (*3) WN, (*4) TC, and (*5) BJ in high-O3 pollution episode during (a*) May, (b*) June, (c*) July, (d*) August 2022. The VOCs-limited and NOX-limited regimes are separated by the red ridge lines. (d4) and (d5) indicate the formation regime are NOX-limited with no red ridge lines displayed in the isopleth at current emission mitigation scenarios.
To assess the robustness of the simulated sub-seasonal OFR progression against interannual variability in meteorology and emissions, we further examine the formaldehyde-to-NO2 ratio (FNR) from satellite retrievals for the GZB region over three consecutive warm seasons (2021–2023). FNR is a widely used indicator for inferring near-surface O3 sensitivity, with thresholds typically defined as: FNR < 1 for VOCs-limited, 1–2 for transitional, and > 2 for NOX-limited regimes (Jin et al., 2015; Hata et al., 2025; Rahman et al., 2025). The monthly FNRs reveal a consistent sub-seasonal evolution pattern across the three years. The spatial distributions transition from being dominated by blue grids (low FNR, VOCs-limited) in early summer to more green (transitional) and eventually yellow/red grids (NOX-sensitive) by late summer, particularly evident in 2021 and 2022 (Fig. S6). At the basin scale, the mean FNR increases consistently from May to August, from 0.90 to 1.61 in 2021 and from 0.91 to 1.77 in 2022, reflecting a systematic seasonal shift toward more NOX-limited O3 formation (Table S3). Despite data gaps in May and August 2023, FNR values of 1.20 in June and 1.43 in July indicate a similar transition from transitional to more NOX-sensitive conditions. Note that although column-based FNR is a useful indicator of surface O3 sensitivity, satellite retrievals are subject to substantial uncertainties arising from measurement errors, cloud contamination, surface reflectivity, profile assumptions, and aerosol effects (Jin et al., 2017; Souri et al., 2023).
This independent, multi-year satellite evidence provides strong support for the central finding of our model-based analyses, namely a recurring sub-seasonal transition in O3 formation regimes over the GZB, evolving from VOCs-limited conditions in early summer to transitional and ultimately NOX-limited regimes by late summer. The consistency of this progression across years with contrasting meteorological conditions, including the extreme heat in 2022, indicates that the diagnosed regime shift is a robust characteristic of the regional photochemical environment. This behavior is therefore more plausibly driven by sub-seasonal factors, such as enhanced solar radiation, higher temperatures, and increased biogenic emissions, rather than by year-specific meteorological or emission anomalies.
3.3.2 Drivers of Temporal Shifts: Meteorology and Associated Chemistry
The temporal OFR transition from VOCs-limited to NOX-limited is primarily driven by evolving meteorology and chemistry from May to August. The AVOCs/NOX emission ratios are relatively stable (0.27–0.34; Table S4) during the warm season. This variation cannot explain the stronger NOX sensitivity detected in July–August, indicating that anthropogenic precursor ratios alone do not fully account for the seasonal OFR shifts. The most important change from May to August is the intensification of solar radiation and the resultant increase in air temperature. Firstly, BVOCs emissions are dependent on solar radiation and air temperature, so increased solar radiation and air temperature in mid-late summer boost BVOCs emissions, providing more background VOCs and pushing the O3 formation toward NOX-sensitive. Secondly, enhancement of solar radiation and higher temperature accelerate photochemical reactions. In addition, higher temperatures favor a deeper PBL, which enhances vertical mixing and can entrain O3-rich air from aloft while diluting near-surface precursor concentrations and thus altering local precursor ratios. Near-surface O3 concentrations tend to increase as the PBL height (PBLH) increases, peaking at the PBLH of approximately 900–1800 m (Wang et al., 2023a). In urban areas of the GZB, the mean PBLH during 11:00–18:00 BJT rises from 1382 m in May to 1720 m in June, then falls to 1412 m in July and 1406 m in August, consistent with the maximum MDA8 O3 level in June. Simulations indicate that HOX radical concentrations increase while near-surface NOX levels decrease from May to August in urban areas of the GZB (Fig. 5 and Table S5). These changes are closely linked to enhanced BVOCs emissions, intensified atmospheric photochemistry and PBL development, which alter relative balance of the O3 precursor levels. Consequently, HOX-loss becomes increasingly dominated by self-reaction of peroxyl radicals rather than HO• + NO2 termination, further shifting O3 production to be more NOX-sensitive.
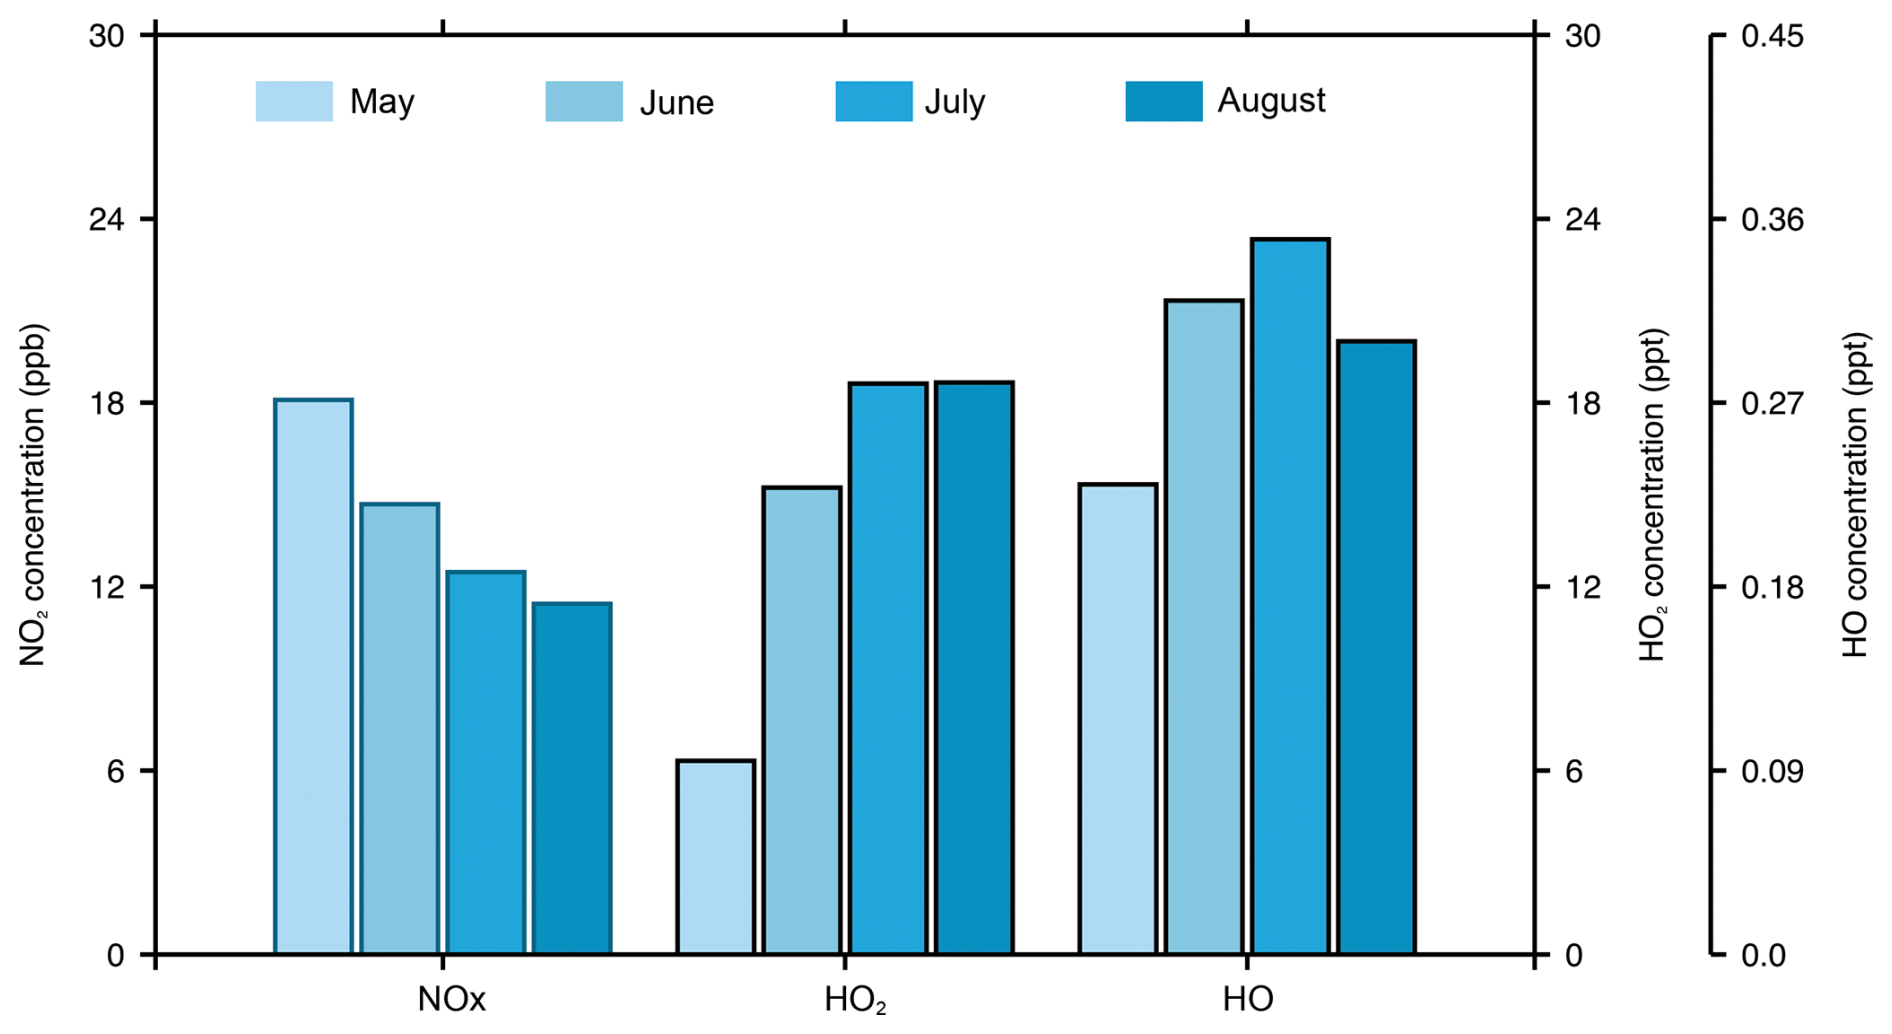
Figure 5The mean daytime (08:00–20:00 BJT) NOX, HO2 and HO concentrations from May to August 2022 in urban areas of the GZB.
The similar transition trend has been found in previous studies. Wu and Xie (2017) have discussed occurrence of a switch from a NOX-saturated to NOX-sensitive O3 formation regime in most suburban and rural areas in China when summer arrives. Ou et al. (2016) have proposed that O3 formation shifts toward VOCs-limited conditions in the PRD from summer to autumn. Sun et al. (2018) have used high-resolution observations in eastern China to show that the photochemical regime during spring and summer tends toward NOX-limited or mixed sensitivity, while in autumn and winter it shifts toward VOCs-limited conditions. Our study extends this understanding by resolving OFR transitions at sub-seasonal (monthly) and city-specific levels, offering feasible insights for dynamic emission control.
3.3.3 Drivers of Spatial Heterogeneity: Emissions and Transport
Spatial differences in OFR are closely tied to local emission profiles and regional transport. A key factor is the local VOCs (AVOCs + BVOCs) NOX emission ratio (Fig. 6). In early summer, XA, XY, WN, and TC had low ratios (2–7), leading to VOCs-limited regimes due to high NOX emissions. In contrast, BJ's higher ratio (11–29) corresponds to NOX-limited or transitional regimes. Notably, the strong VOCs sensitivity in WN is consistent with its relatively low VOCs NOX ratio, reflecting elevated NOX emissions from intensive power plant in the region. This pattern echoes observations in other heavily polluted Chinese cities, which often show strong VOCs sensitivity. These contrasts underscore that effective control strategies must account for both local emissions and inter-regional transport. This inflow elevates local NOX (with relatively longer atmospheric lifetime than that of reactive VOCs) concentrations relative to VOCs, emphasizing the necessity of targeted AVOCs reductions before aggressive NOX cuts can effectively mitigate O3 pollution in this city.
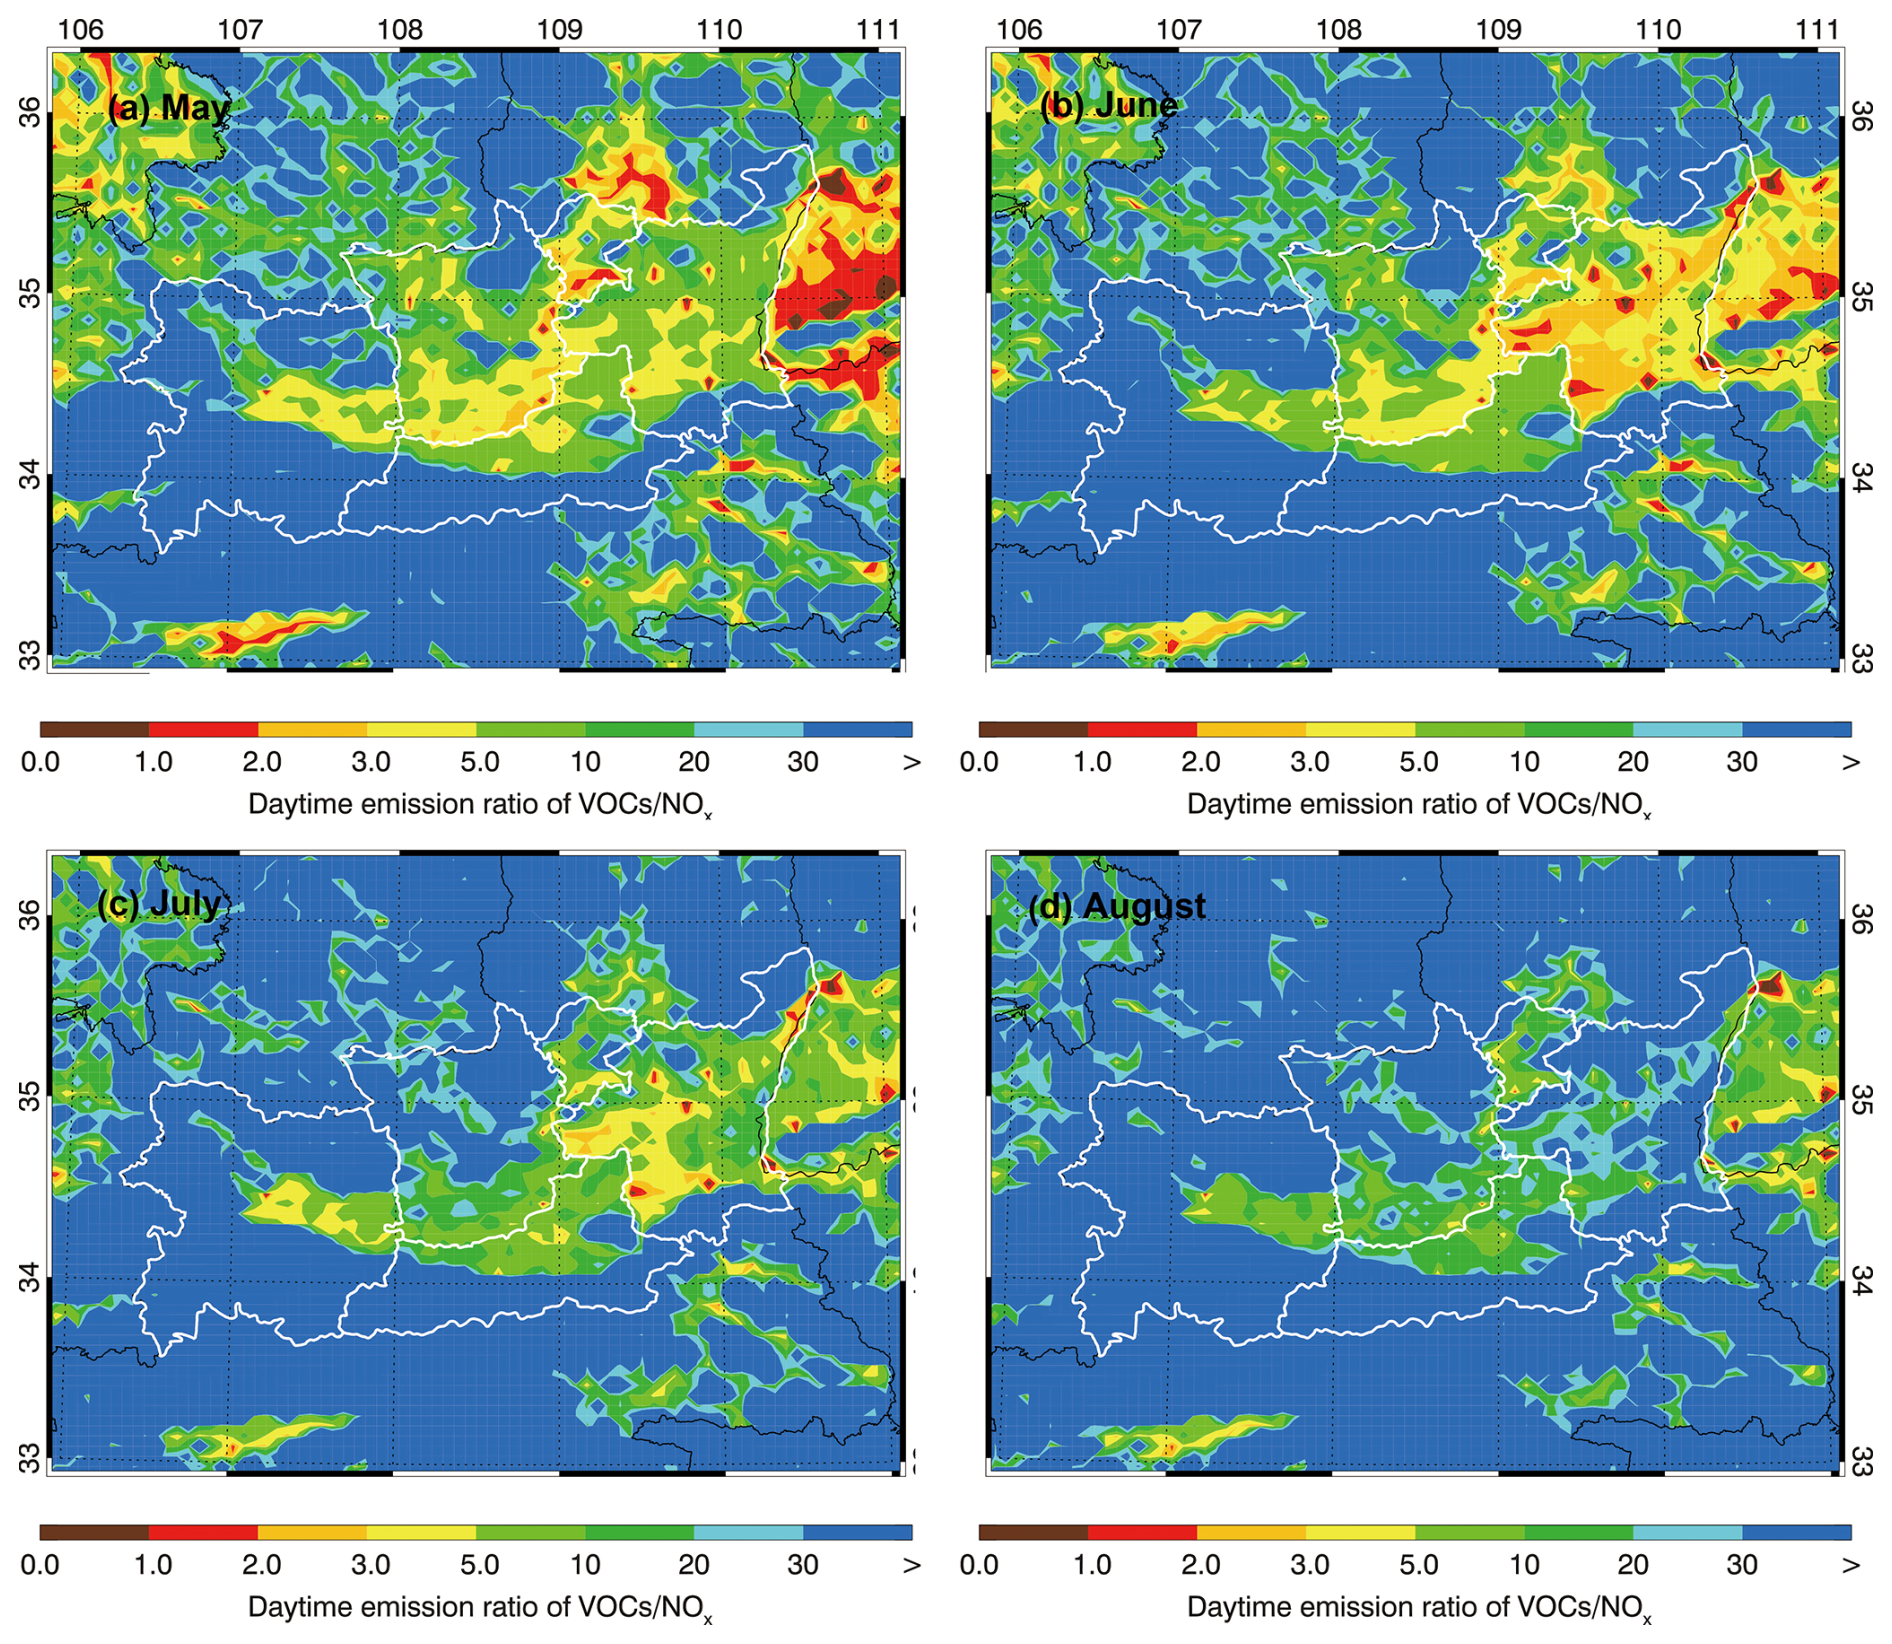
Figure 6The spatial distribution of total VOCs (includes BVOCs and AVOCs) to NOX emission ratios in (a) May, (b) June, (c) July and (d) August 2022.
These intra-region contrasts underscore that control strategies must be tailored to local chemistry. Similar patterns occur elsewhere: Ren et al. (2022) have found heavily polluted Chinese cities (e.g. Wuhan, Xi'an) are strongly VOCs-limited, whereas suburb and rural areas are NOX-limited. Likewise, Yu et al. (2025) have diagnosed Zhengzhou's O3 regime as primarily VOCs-limited, with an optimal ratio of VOCs to NOX emission reductions of approximately 2.9:1, consistent with the strong VOC sensitivity observed in industrialized cities. Likewise, Yu et al. (2025) have diagnosed Zhengzhou's O3 formation regime as primarily VOCs-limited, with an optimal VOCs-to-NOX reduction ratio of approximately 2.9:1, consistent with the strong VOC sensitivity observed in industrialized cities.
Overall, these spatial and sub-seasonal OFR shifts highlight the necessity of dynamic, month-specific O3 control strategies in the GZB. The pronounced VOCs-limited conditions in early summer call for prioritizing AVOCs control, especially in cities with sever O3 pollution like WN and XA, while the transition to NOX-limited conditions by late summer favors NOX-focused measures. Such temporally and spatially optimized approaches could enhance the efficiency of regional O3 mitigation and help avoid unintended increases during seasonal transitions.
It is important to recognize that MDA8 O3 variations in the EKMA diagrams integrate contributions from both local photochemical production and atmospheric transport and advection. Multiple recent modeling studies demonstrate that transport processes can contribute substantially to the regional ozone burden. For example, concentration and mass budget analyses show that horizontal advection from upwind regions and entrainment from the residual layer can supply a significant portion of ozone mass to a receptor region, especially during morning hours or under synoptic transport conditions, even if local photochemistry subsequently drives the daytime increase in surface ozone (Qu et al., 2023). However, the design of our EKMA simulations isolates the chemical sensitivity to precursor emissions by holding the meteorological fields and boundary conditions fixed across all scenarios. Because circulation and transport are invariant in this framework, changes in MDA8 O3 arising from systematic reductions in NOX and VOCs emissions reflect the in-situ chemical response of O3 formation rather than changes in transport dynamics.
It is well-recognized that transport and advection represent a background forcing for region O3 concentration. Studies of tropospheric O3. precursors emphasize that long-range transport of O3 and its precursors can influence surface O3. trends and variability, and that such transport sets the baseline on which local chemistry operates. These transport influences can bias the placement of EKMA isolines in cases where background precursor concentrations (e.g., high transported NOX or VOCs) differ substantially from typical values, potentially shifting the diagnosed sensitivity toward VOCs-limited or NOX-limited regimes under certain conditions (Elshorbany et al., 2024). In this study, to mitigate the influence of transport and advection on EKMA results, we select representative O3 polluted days that exclude anomalous episodes with unusually high backgrounds of transported O3 and its precursor, such as strong synoptic advection or intrusion events. Hence, the EKMA diagnostics predominantly capture the local chemical response to precursor perturbations under typical regional circulation patterns.
3.4 Sectoral Contributions to Warm-Season O3 Production
Quantifying sectoral drivers of warm-season O3 production bridges the sensitivity diagnostics from Sect. 3.2 with operational emission control design. The MDA8 O3 contributions of industrial, residential, traffic, power plants and biogenic sources are assessed from May to August using the BFM (Figs. 7 and 8).
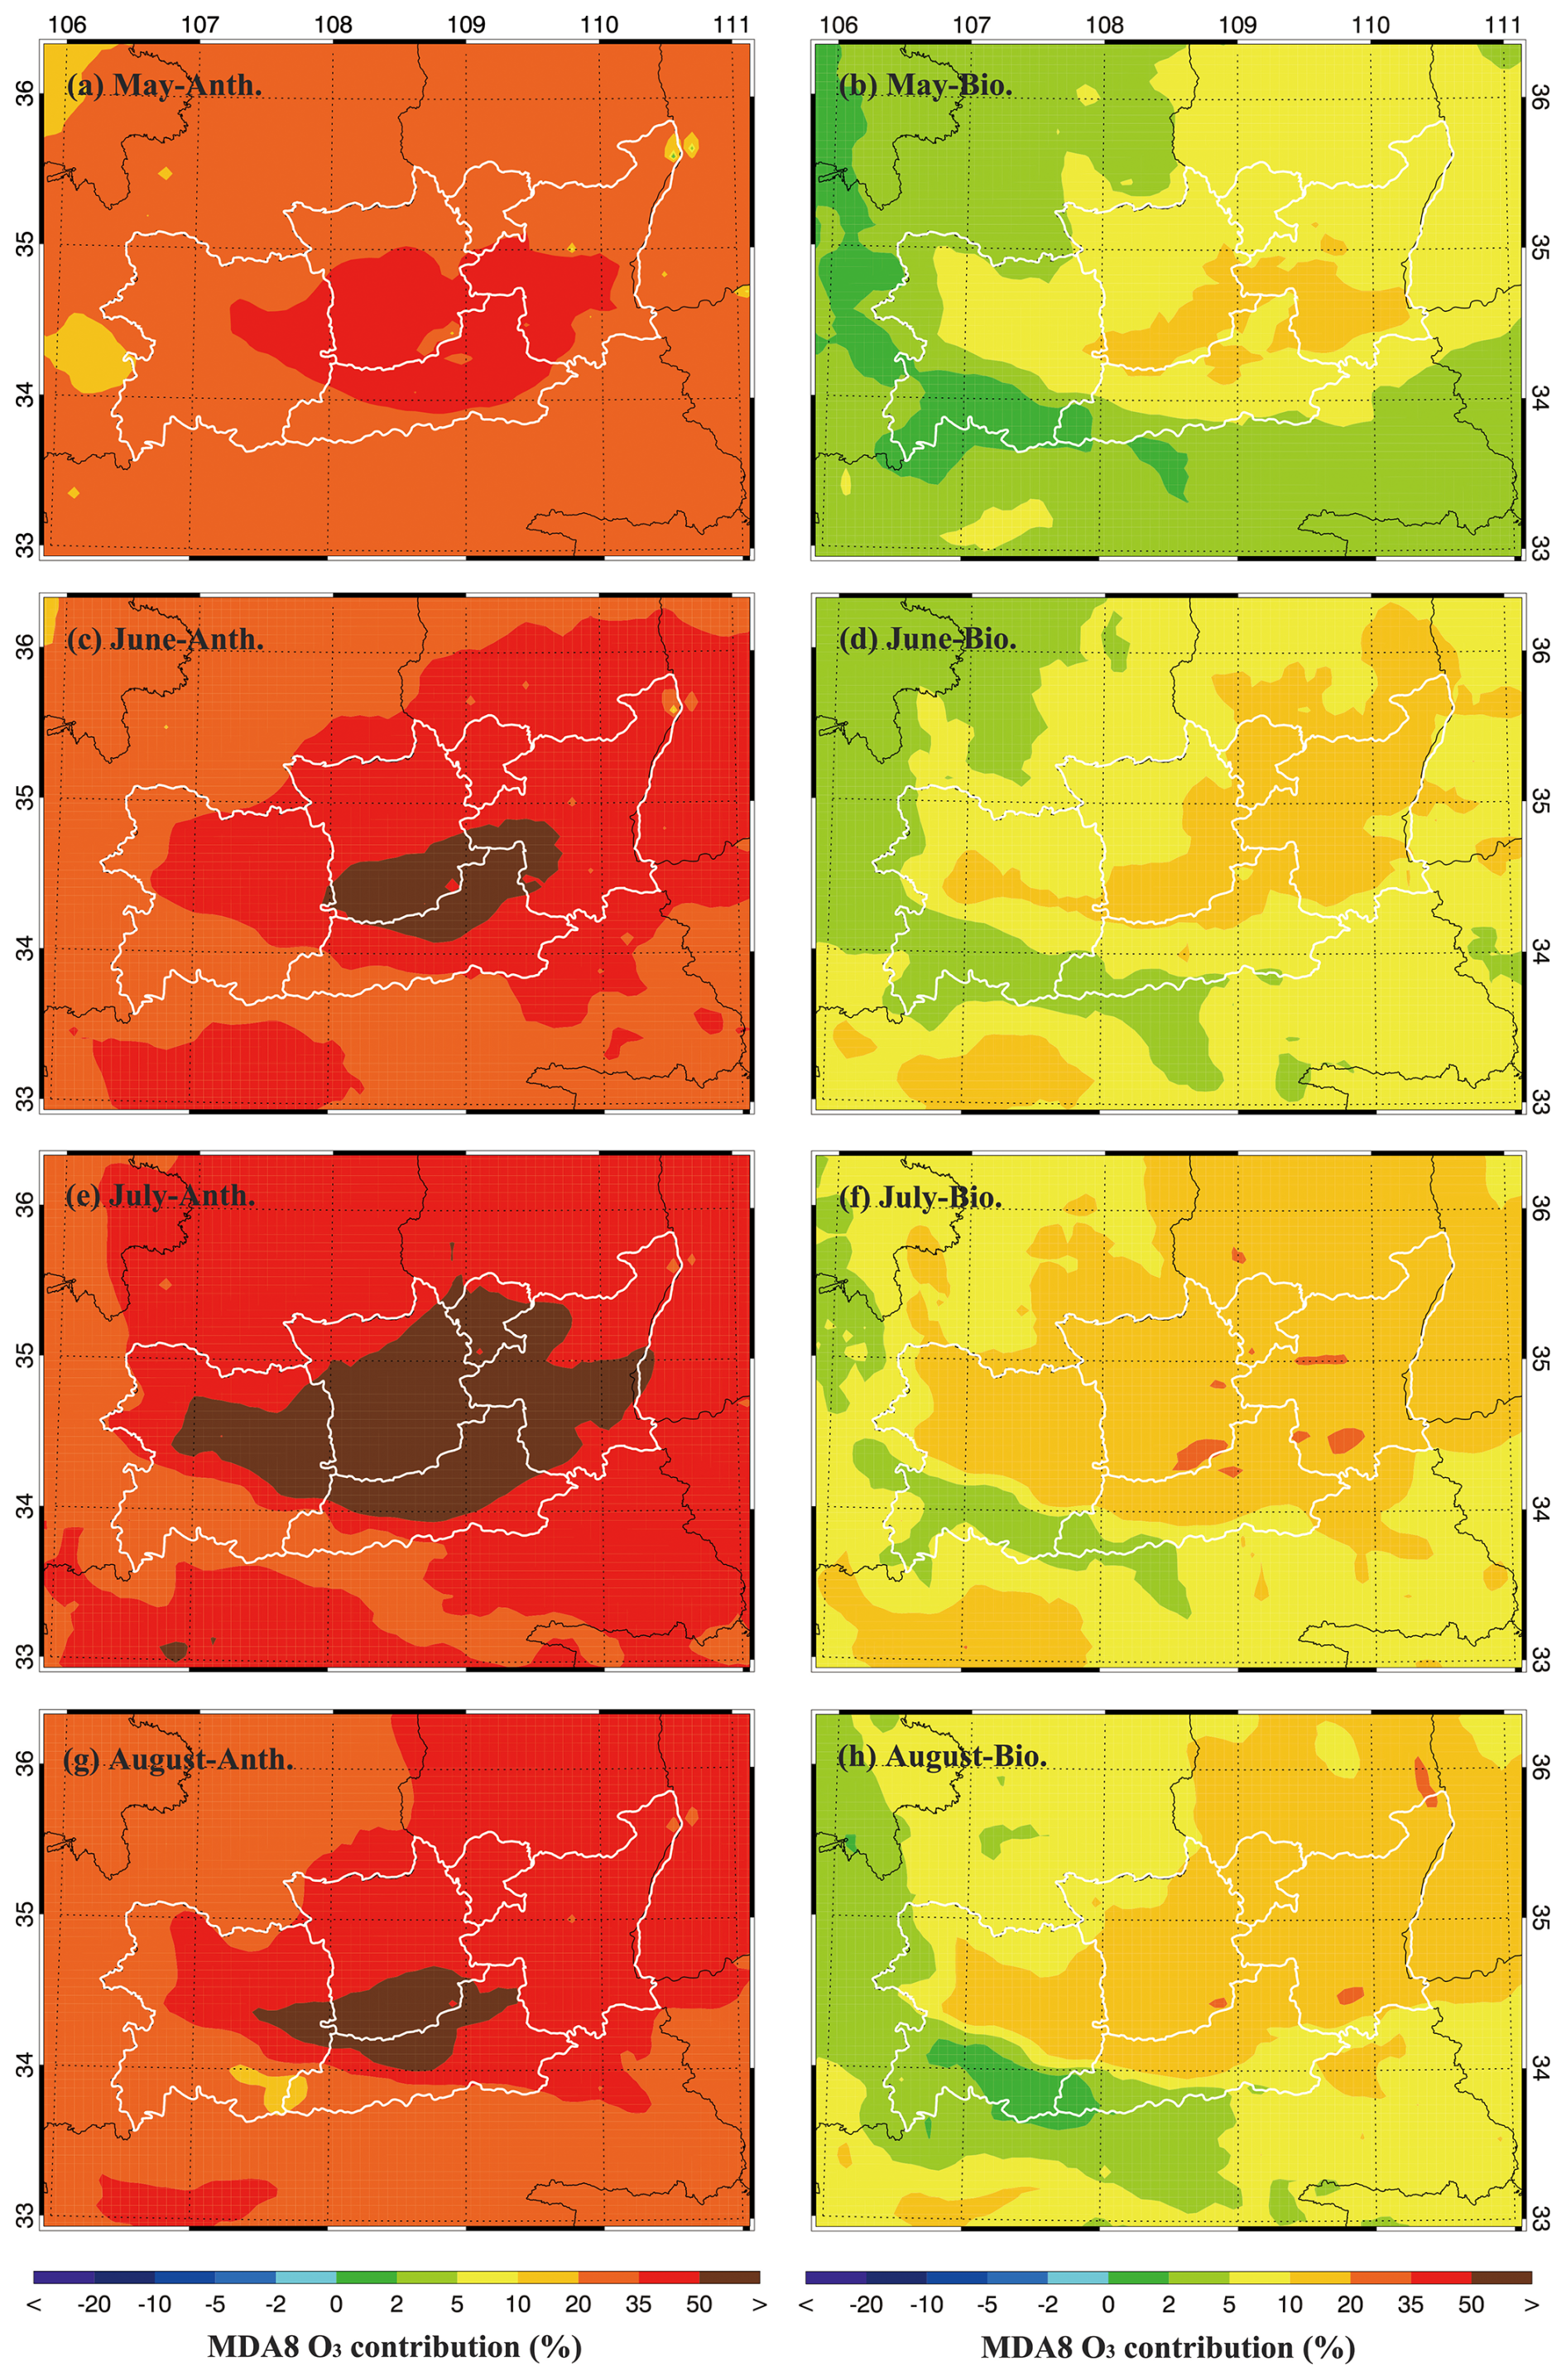
Figure 7The spatial distribution of the mean MDA8 O3 contribution from (a) and (c) and (e) and (g) total anthropogenic, and (b) and (d) and (f) and (h) biogenic sources from May to August 2022.
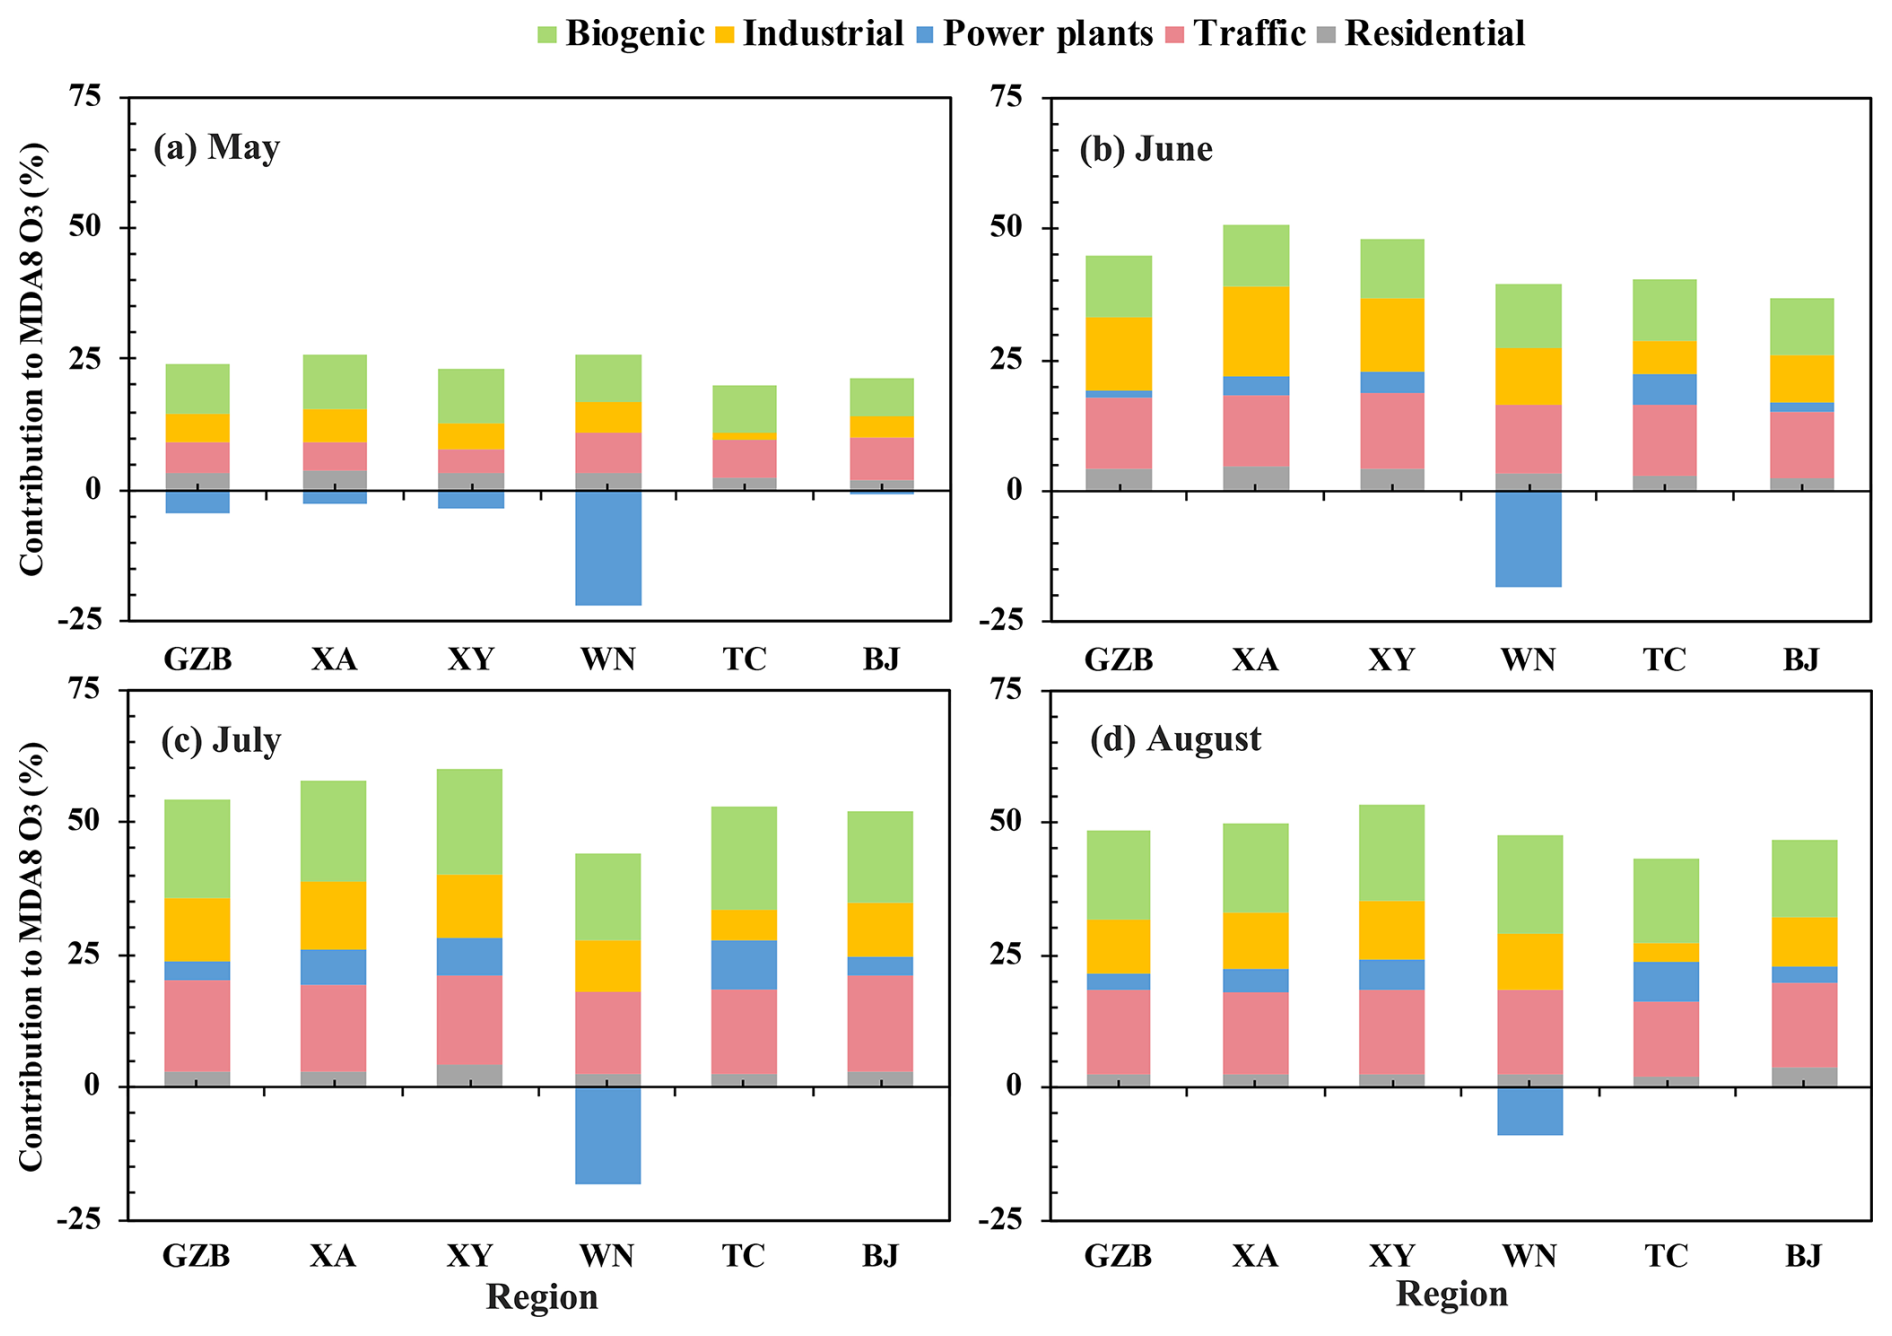
Figure 8Mean MDA8 O3 contributions from various sources in (a) May, (b) June, (c) July, and (b) August 2022 in urban areas of the GZB and five cities.
The attribution results show pronounced spatiotemporal heterogeneous across the GZB. At the basin scale, the contribution of all anthropogenic sources increases from 32.8 % in May to 55.2 % in July, then declines to 48.0 % in August (Fig. 7). The rise is largely driven by increasing industrial and traffic influence: industrial emissions contribute 5.4 % to MDA8 O3 in May, rising to 11.8 % in July, while traffic contributions increase from 5.8 % to 17.0 % during the same period (Fig. 8 and Table 2). Because NOX and AVOCs emissions peak in June and then decline, the continued anthropogenic contribution growth through July indicates that enhanced photochemical activity under strong solar radiation and rising BVOCs emissions further amplify O3 formation. Biogenic contributions notably rise from 9. 7 % in May to 18.7 % in July then slightly decline to 16.7 % in August (Fig. 7 and Table 2), consistent with elevated BVOCs emissions under warmer, sunnier conditions. These sub-seasonal dynamics are consistent with findings from other Chinese urban clusters, such as the BTH, YRD and PRD, where rising BVOCs emissions in summer have been shown to enhance photochemical reactivity and partially offset gains from anthropogenic VOCs and NOX reductions, thereby promoting shifts of OFR toward NOX-limited or transitional regimes (Wu et al., 2020b; Zhao et al., 2022; Gao et al., 2025; Wang et al., 2025a).
Table 2MDA8 O3 contribution of various sources in urban areas of the GZB and five cities during warm season in 2022.
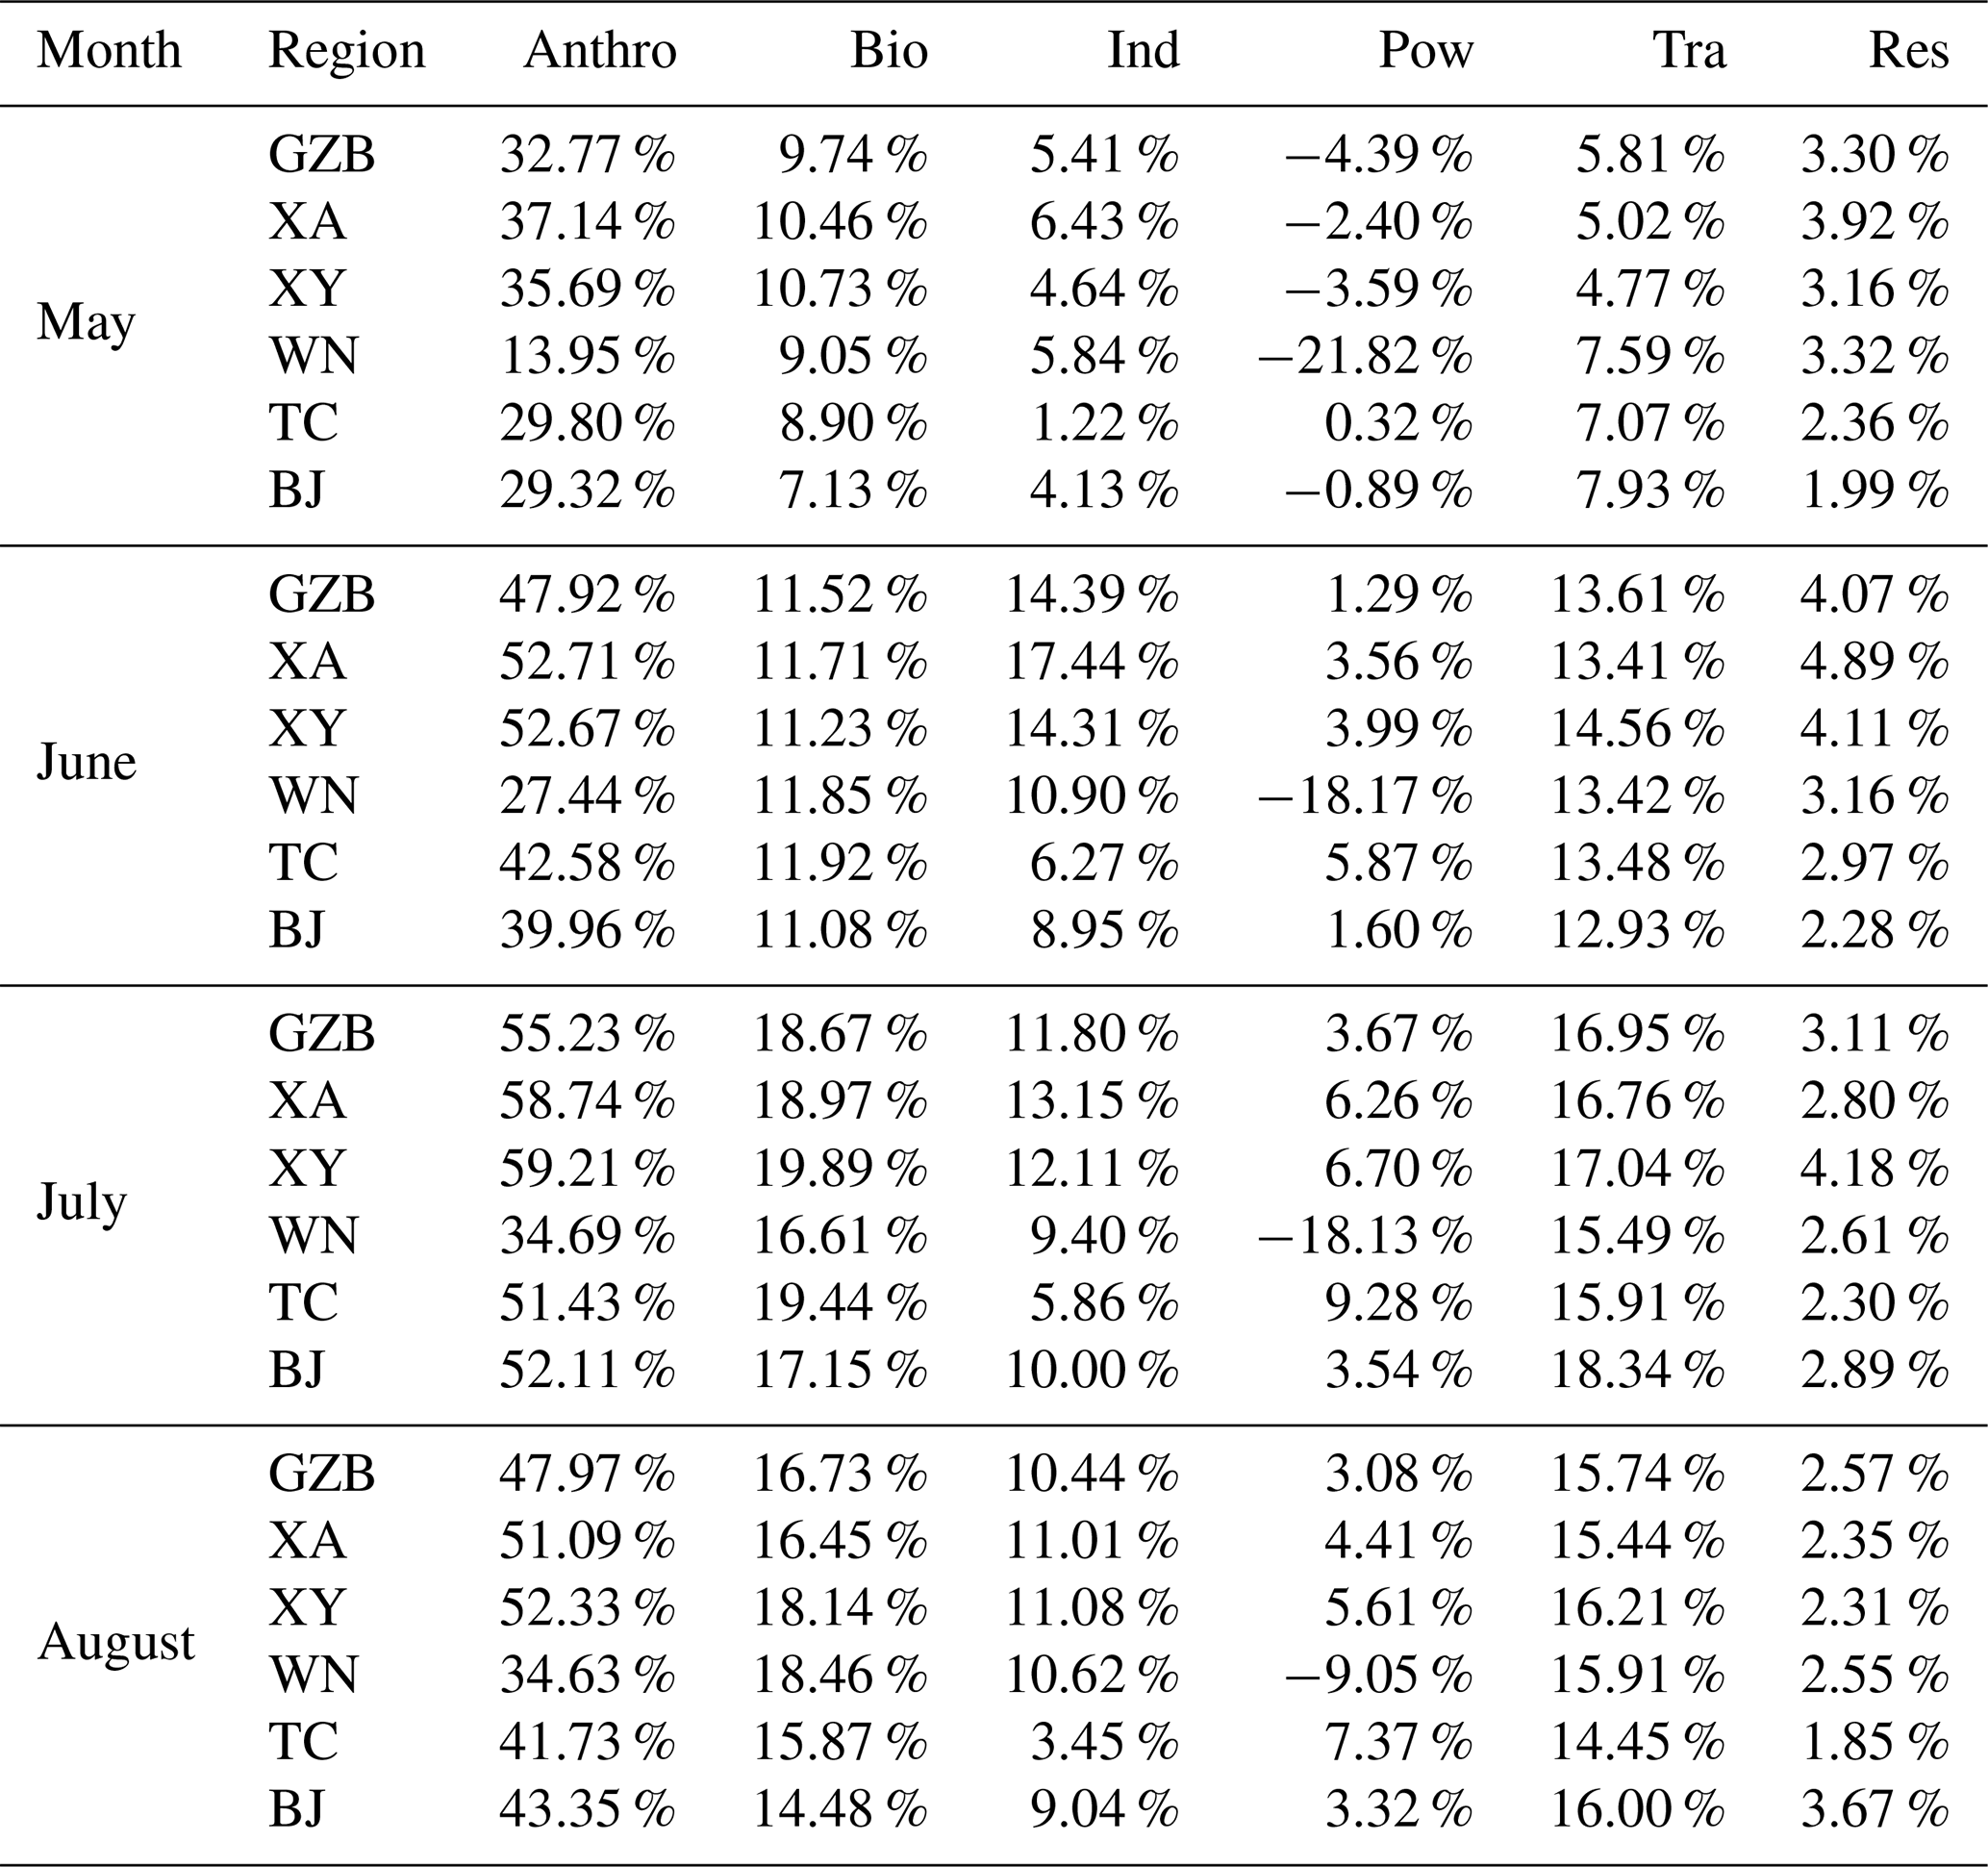
Note: XA, XY, WN, BJ, TC and GZB represent the urban areas in Xi'an, Xianyang, Weinan, Baoji, Tongchuan and the Guanzhong Basin respectively. Anthro, Ind, Tra, Pow, Res, and Bio represent total anthropogenic, industry, tranffic, power plants, residential, and biogenic source, respectively.
Spatial contrasts across the five cities further illustrate how emission profiles interact with chemical regimes and guide targeted mitigation polices. XA and XY show the largest anthropogenic O3 shares, rising from 37.1 % in May to 58.7 % in July in XA, and from 35.7 % to 59.2 % in XY (Fig. 7 and Table 2). In these urban cores, industrial and traffic emissions are dominant, contributing approximately 9 %–12 % (May) and 26 %–31 % (June-August) to MDA8 O3 concentrations (Fig. 8). TC and BJ show intermediate anthropogenic contributions. Traffic dominates their O3 production (7.1 %–15.9 % in TC and 7.9 %–18.3 % in BJ), and industrial emissions are the secondary contributor to the O3 levels. Given their VOCs-limited regime (Sect. 3.2) and higher industrial AVOCs emissions (Table S5) in May–June, prioritizing reductions in industrial AVOCs is advisable to prevent O3 rebound. As the OFR shifts toward transition and NOX-limited conditions in late summer, mitigation efforts should be combined with traffic emissions due to the higher NOX share from vehicular exhaust. In industrial regions, for instance, Dai et al. (2025) have showed that oxygenated VOCs (OVOCs) contribute a high proportion (∼ 30 %–37.8 %) of VOCs pools in industrial cities, enhancing radical production and O3 sensitivity; thus, control strategies must consider VOCs speciation, not just total amounts. By contrast, WN exhibits much lower anthropogenic influence (13.9 %–34.7 %, Fig. 7 and Table 2), with power plant emissions exerting a net consuming effect on local O3. This is attributed to strong local NO titration and enhanced termination pathways reduce OH HO2 recycling. Similar suppression effects have been reported in Zhao et al. (2025) that power plant NOX emissions contribute negative O3 signals in certain regions, indicative of O3 titration under saturating NOX. Meanwhile, analyses in the YRD have showed that during emission reductions, weakened NO titration can drive O3 increases (∼ 20 % of the rise attributed to reduced NO titration) (Wang et al., 2022b). Mechanistic modeling also indicates that NOX reductions in VOCs-limited areas may lead to O3 increases, unless VOCs controls are pursued simultaneously (Dai et al., 2024a; Tang et al., 2021). Therefore, aggressive NOX cuts alone risk raising O3 unless paired with targeted AVOCs reductions in WN.
These variations highlight that a uniform, time-invariant control strategy is insufficient. Instead, effective O3 mitigation in the GZB demands sub-seasonally adaptive, sector-specific emission controls. In early summer, dominant VOCs sensitivity suggests focusing on industrial AVOCs; in mid to late summer, integrating AVOCs and traffic NOX controls aligns better with evolving regimes; and in regions like WN, VOCs-targeted strategies must accompany any NOX reductions. Recent studies similarly argue that tailoring precursor reductions to local O3 regimes yields greater benefits than uniform cuts. For example, Zhu et al. (2022) showed that in the NCP and YRD, formation regimes have shifted from VOCs-limited toward transitional or NOX-limited states as atmospheric oxidation increases. Wang et al. (2025b) reported pronounced vertical and spatial differences in OFRs in eastern Chinese cities, implying that a one-size-fits-all control is often suboptimal. Li et al. (2024) have used FNR (HCHO NO2) diagnostics at multiple altitudes to reveal that optimal precursor strategies vary by vertical layer in the BTH.
The source contributions presented in this study are quantified using the BFM, wherein emissions from a specific sector are entirely removed to evaluate its potential impact on O3 concentrations. While this approach is effective for assessing the control potential of individual sources and is widely used in policy-relevant scenario analysis, it is important to consider the inherent nonlinearity of tropospheric O3 chemistry. The response of O3 concentrations to a given emission change depends strongly on the background chemical regime (NOX- vs. VOCs-limited, as shown in Sect. 3.3). For example, in a VOCs-limited regime, reducing NOX emissions alone may inadvertently increase O3 concentrations, whereas the same reduction in a NOX-limited regime would lower O3 concentrations. Consequently, the attribution derived from complete removal of a source may not scale linearly with incremental emission controls. As discussed in Li et al. (2023), when emission perturbations are large, the assumption of a linear response between emission change and O3 change becomes invalid due to the nonlinear interactions in O3 production chemistry, meaning that attribution results from BFM may differ from those obtained by alternative methods such as source tagging that explicitly follow chemical pathways. Importantly, BFM and tagging methods answer different scientific questions that the BFM estimates the sensitivity of O3 to sector-specific emission changes, whereas tagging method attributes the total mass of O3 to source precursors independent of changes in emissions (Li et al., 2023; Shu et al., 2023). In this study, the BFM results are interpreted in conjunction with the OFR analysis (Sect. 3.3), which delineates the nonlinear photochemical sensitivity to gradual precursor changes. Together, they provide a robust basis for identifying priority source sectors and designing effective, regime-specific control strategies for the GZB.
3.5 Synergistic Control of O3 and Secondary Aerosols
3.5.1 Impacts of Aerosol-Radiation-Chemistry Interactions
The substantial decline in PM2.5 mass in the GZB over the past decade raises the question of whether aerosol–radiation and aerosol–chemistry interactions have notably influenced the observed increase in warm-season O3 and possibly modulated its formation sensitivity. To quantify these effects, we conduct sensitivity experiments to separately isolate (i) aerosol-induced radiative changes (A_Rad) and (ii) changes in heterogeneous HO2• uptake on wet aerosol surfaces (A_HO2) associated with aerosol loading variations during the warm season from 2014 to 2022. In the A_Rad experiment, all model configurations are identical to the base simulation, except that aerosol concentrations within the PBL are fixed at their 2014 levels in the aerosol–radiation transfer module. Similarly, in the A_HO2 experiment, aerosol concentrations are fixed at 2014 levels only in the calculation of heterogeneous HO2• uptake on wet aerosol surfaces, while all other processes remained unchanged. The resulting differences from the base case therefore represent the impacts of aerosol changes between 2014 and 2022 on MDA8 O3 through radiative and HO2• heterogeneous loss pathways, respectively.
Over the period 2014–2022, during which observed PM2.5 concentrations in the GZB have declined by approximately 21.4 µg m−3, the A_Rad and A_HO2 effects exerted comparable influences on MDA8 O3, each contributing between 3 and 7 µg m−3 across most of the region. The combined influence of these two pathways results in an increase of approximately 4.0 µg m−3 in the mean warm-season MDA8 O3 concentration over the GZB, with peak enhancements exceeding 7 µg m−3 in urban core areas with high aerosol levels during June and July (Fig. 9). Although non-negligible, this aerosol-mediated increase accounts for only 10.4 % of the total observed MDA8 O3 rise (38.14 µg m−3) during the warm seasons from 2014–2022 over the GZB. Thus, while the PM2.5 cleanup has exerted a discernible upward pressure on O3 via enhanced photochemistry and modified radical cycling, it is not the dominant driver of the worsening O3 pollution; the primary factors remain the increased frequency of unfavorable synoptic conditions and changes in anthropogenic precursor emissions (Bei et al., 2022; Zhao et al., 2026).
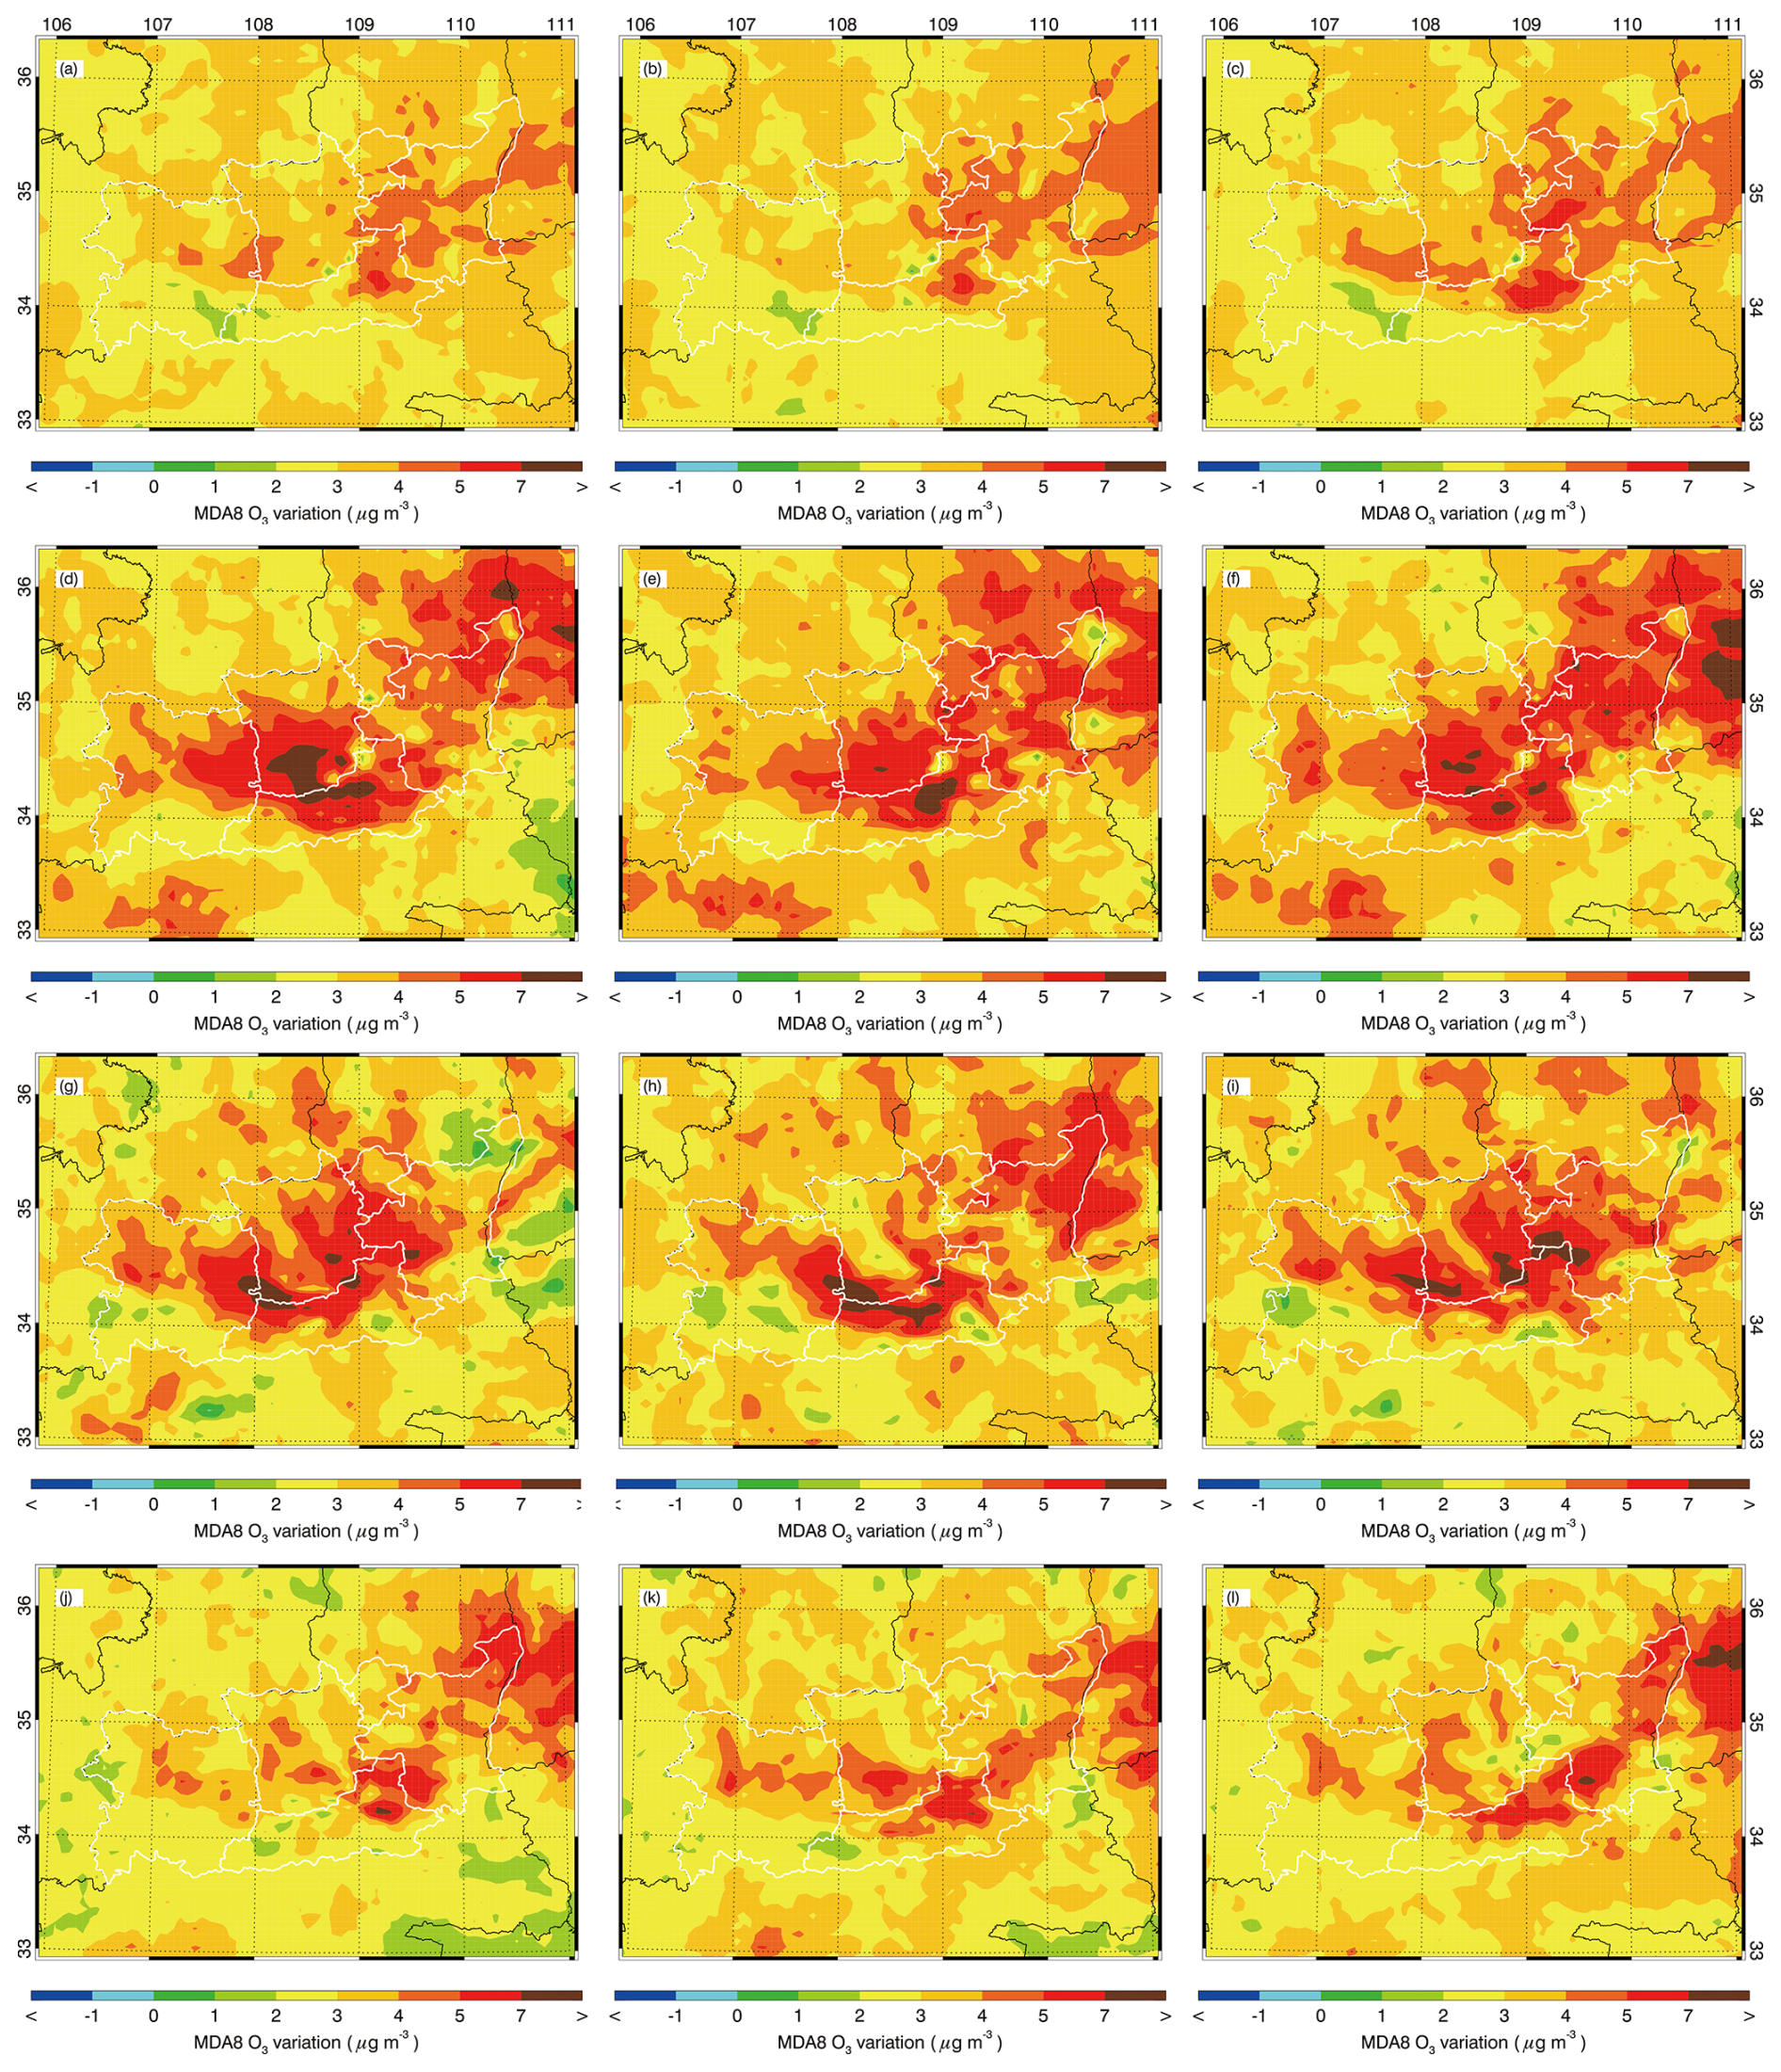
Figure 9Impacts of aerosol changes on warm-season (May–August) MDA8 O3 concentrations over the GZB during 2014–2022. Panels (a), (d), (g), and (j) show the changes in MDA8 O3 attributable to aerosol-radiation effects associated with aerosol variations for May, June, July, and August, respectively. Panels (b), (e), (h), and (k) show the corresponding MDA8 O3 changes driven by variations in heterogeneous uptake of HO2 radicals on wet aerosol surfaces induced by aerosol changes. Panels (c), (f), (i), and (l) present the combined effects of aerosol-radiation interactions and HO2 heterogeneous uptake changes on MDA8 O3 concentrations for the corresponding months.
A key follow-up question is whether these aerosol effects alter the identification of sub-seasonal OFRs. Additional sensitivity simulations for 2022, in which A_Rad and A_HO2 are deliberately switched off, show that the combined A_Rad + A_ HO2 effect modestly suppresses MDA8 O3 concentrations by 0.1–1.0 µg m−3 under current emission levels but does not change the fundamental spatiotemporal progression of the O3 formation sensitivity (Fig. S7). This indicates that the chemical sensitivity of O3 production to its precursors is primarily governed by the evolving balance between NOX and VOCs under the prevailing meteorology, rather than by aerosol-mediated perturbations under contemporary pollution levels.
Therefore, although the historical PM2.5 reduction has provided a modest boost to O3 concentrations, it has not reshaped the intrinsic, meteorologically-driven transitions in OFR. This finding supports the use of OFR diagnostics, which are largely insensitive to aerosol loading in the current environment, as a reliable basis for designing seasonally adaptive control strategies.
Table 3SA contribution of various sources in urban areas of the GZB and five cities during warm season in 2022.
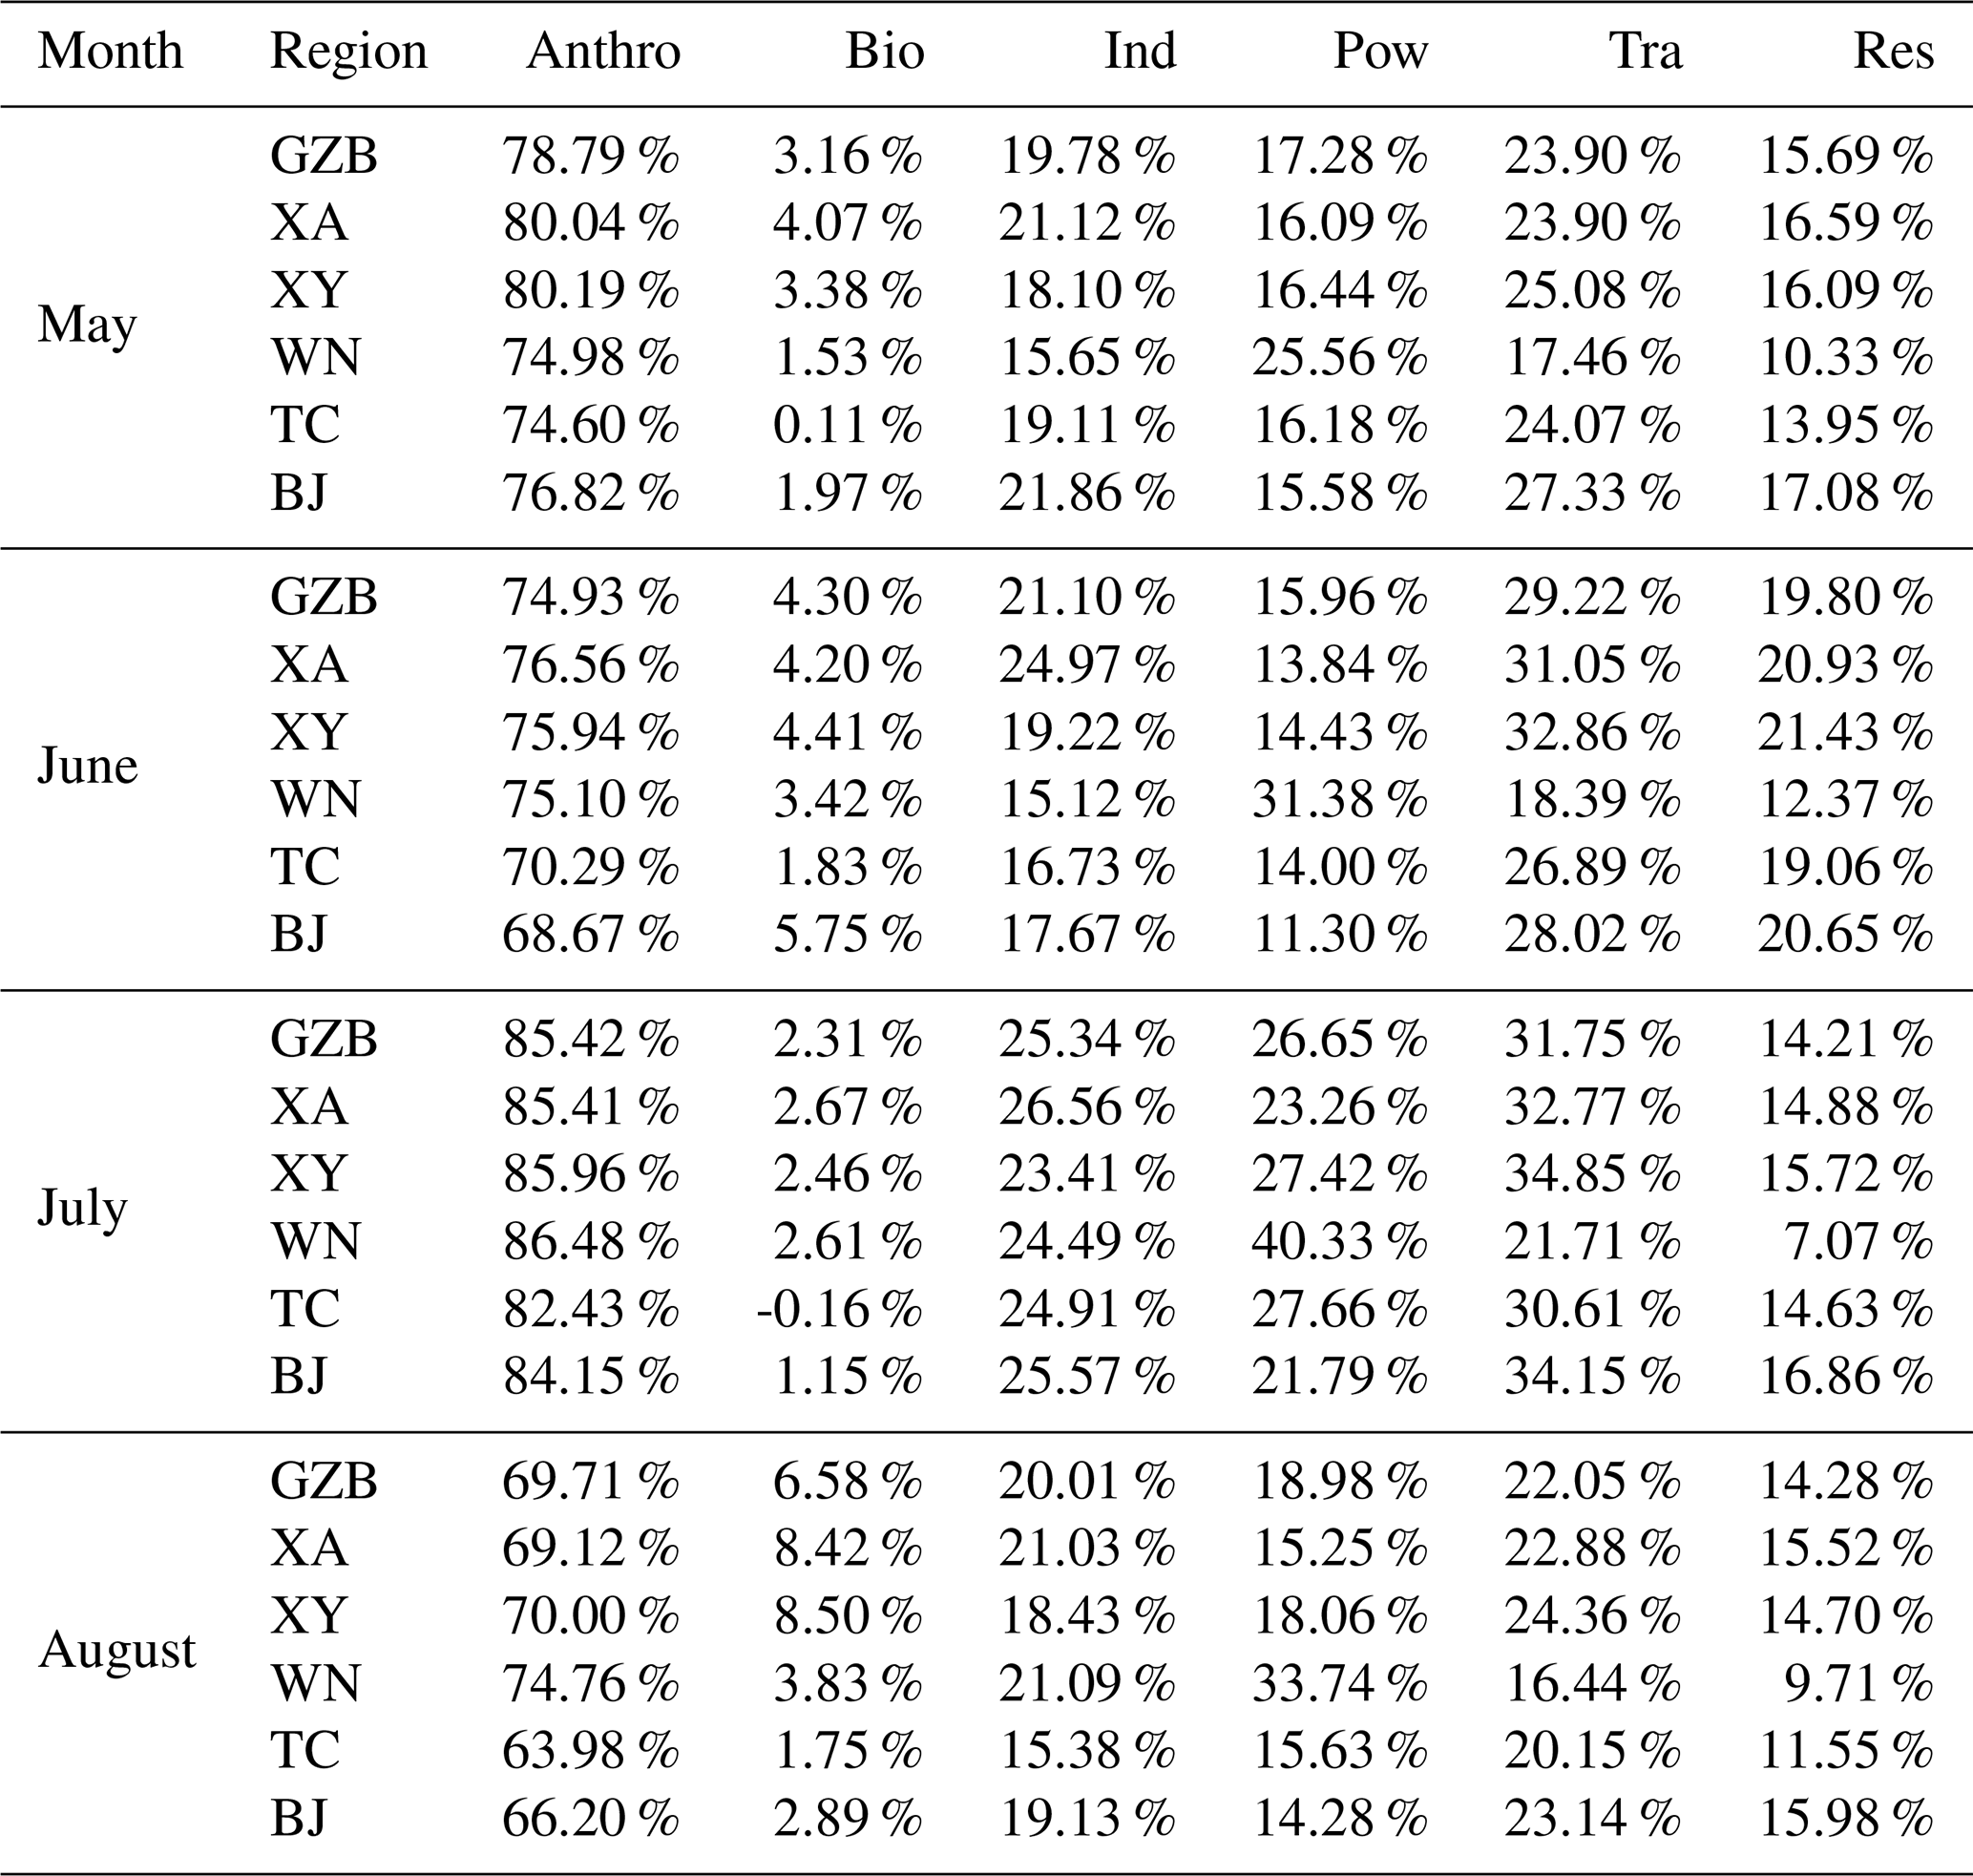
Note: XA, XY, WN, BJ, TC and GZB represent the urban areas in Xi'an, Xianyang, Weinan, Baoji, Tongchuan and the Guanzhong Basin respectively. Anthro, Ind, Tra, Pow, Res, and Bio represent total anthropogenic, industry, tranffic, power plants, residential, and biogenic source, respectively.
3.5.2 Spatiotemporal Patterns of Secondary Aerosol Formation Sensitivity
While summertime air quality in the GZB is dominated by O3 pollution, SA remain non-negligible even when PM2.5 is relatively low. Warm-season SAFR diagnostics show clear seasonal shifts (Figs. 3 and 10). At the basin scale, SA is NOX-limited in May, with reductions in NOX emissions delivering roughly three times the concentration decreases in SA compared to equivalent mitigation in AVOCs emissions (Fig. 3e). In June, the regime shifts to VOCs-limited, with benefits from AVOCs emission reductions outweighing those from NOX controls (Fig. 3f). In July, SAFR exhibits a transitional state with sensitivity varying by location, whereas in August it reverts to a transitional regime tilted toward NOX sensitivity (Fig. 3g and h). City-level patterns follow this broad seasonal evolution but reveal important local deviations (Fig. 10): in June, XA, XY, WN, and TC are VOCs-limited, whereas BJ remains transitional. SAFR of WN stands out by retaining VOCs sensitivity into July, albeit weaker than in June, while other cities transition earlier. By August, SAFR of all cities exhibit transitional responses with a leaning toward NOX sensitivity, indicating that late summer presents an opportunity for NOX-focused co-control.
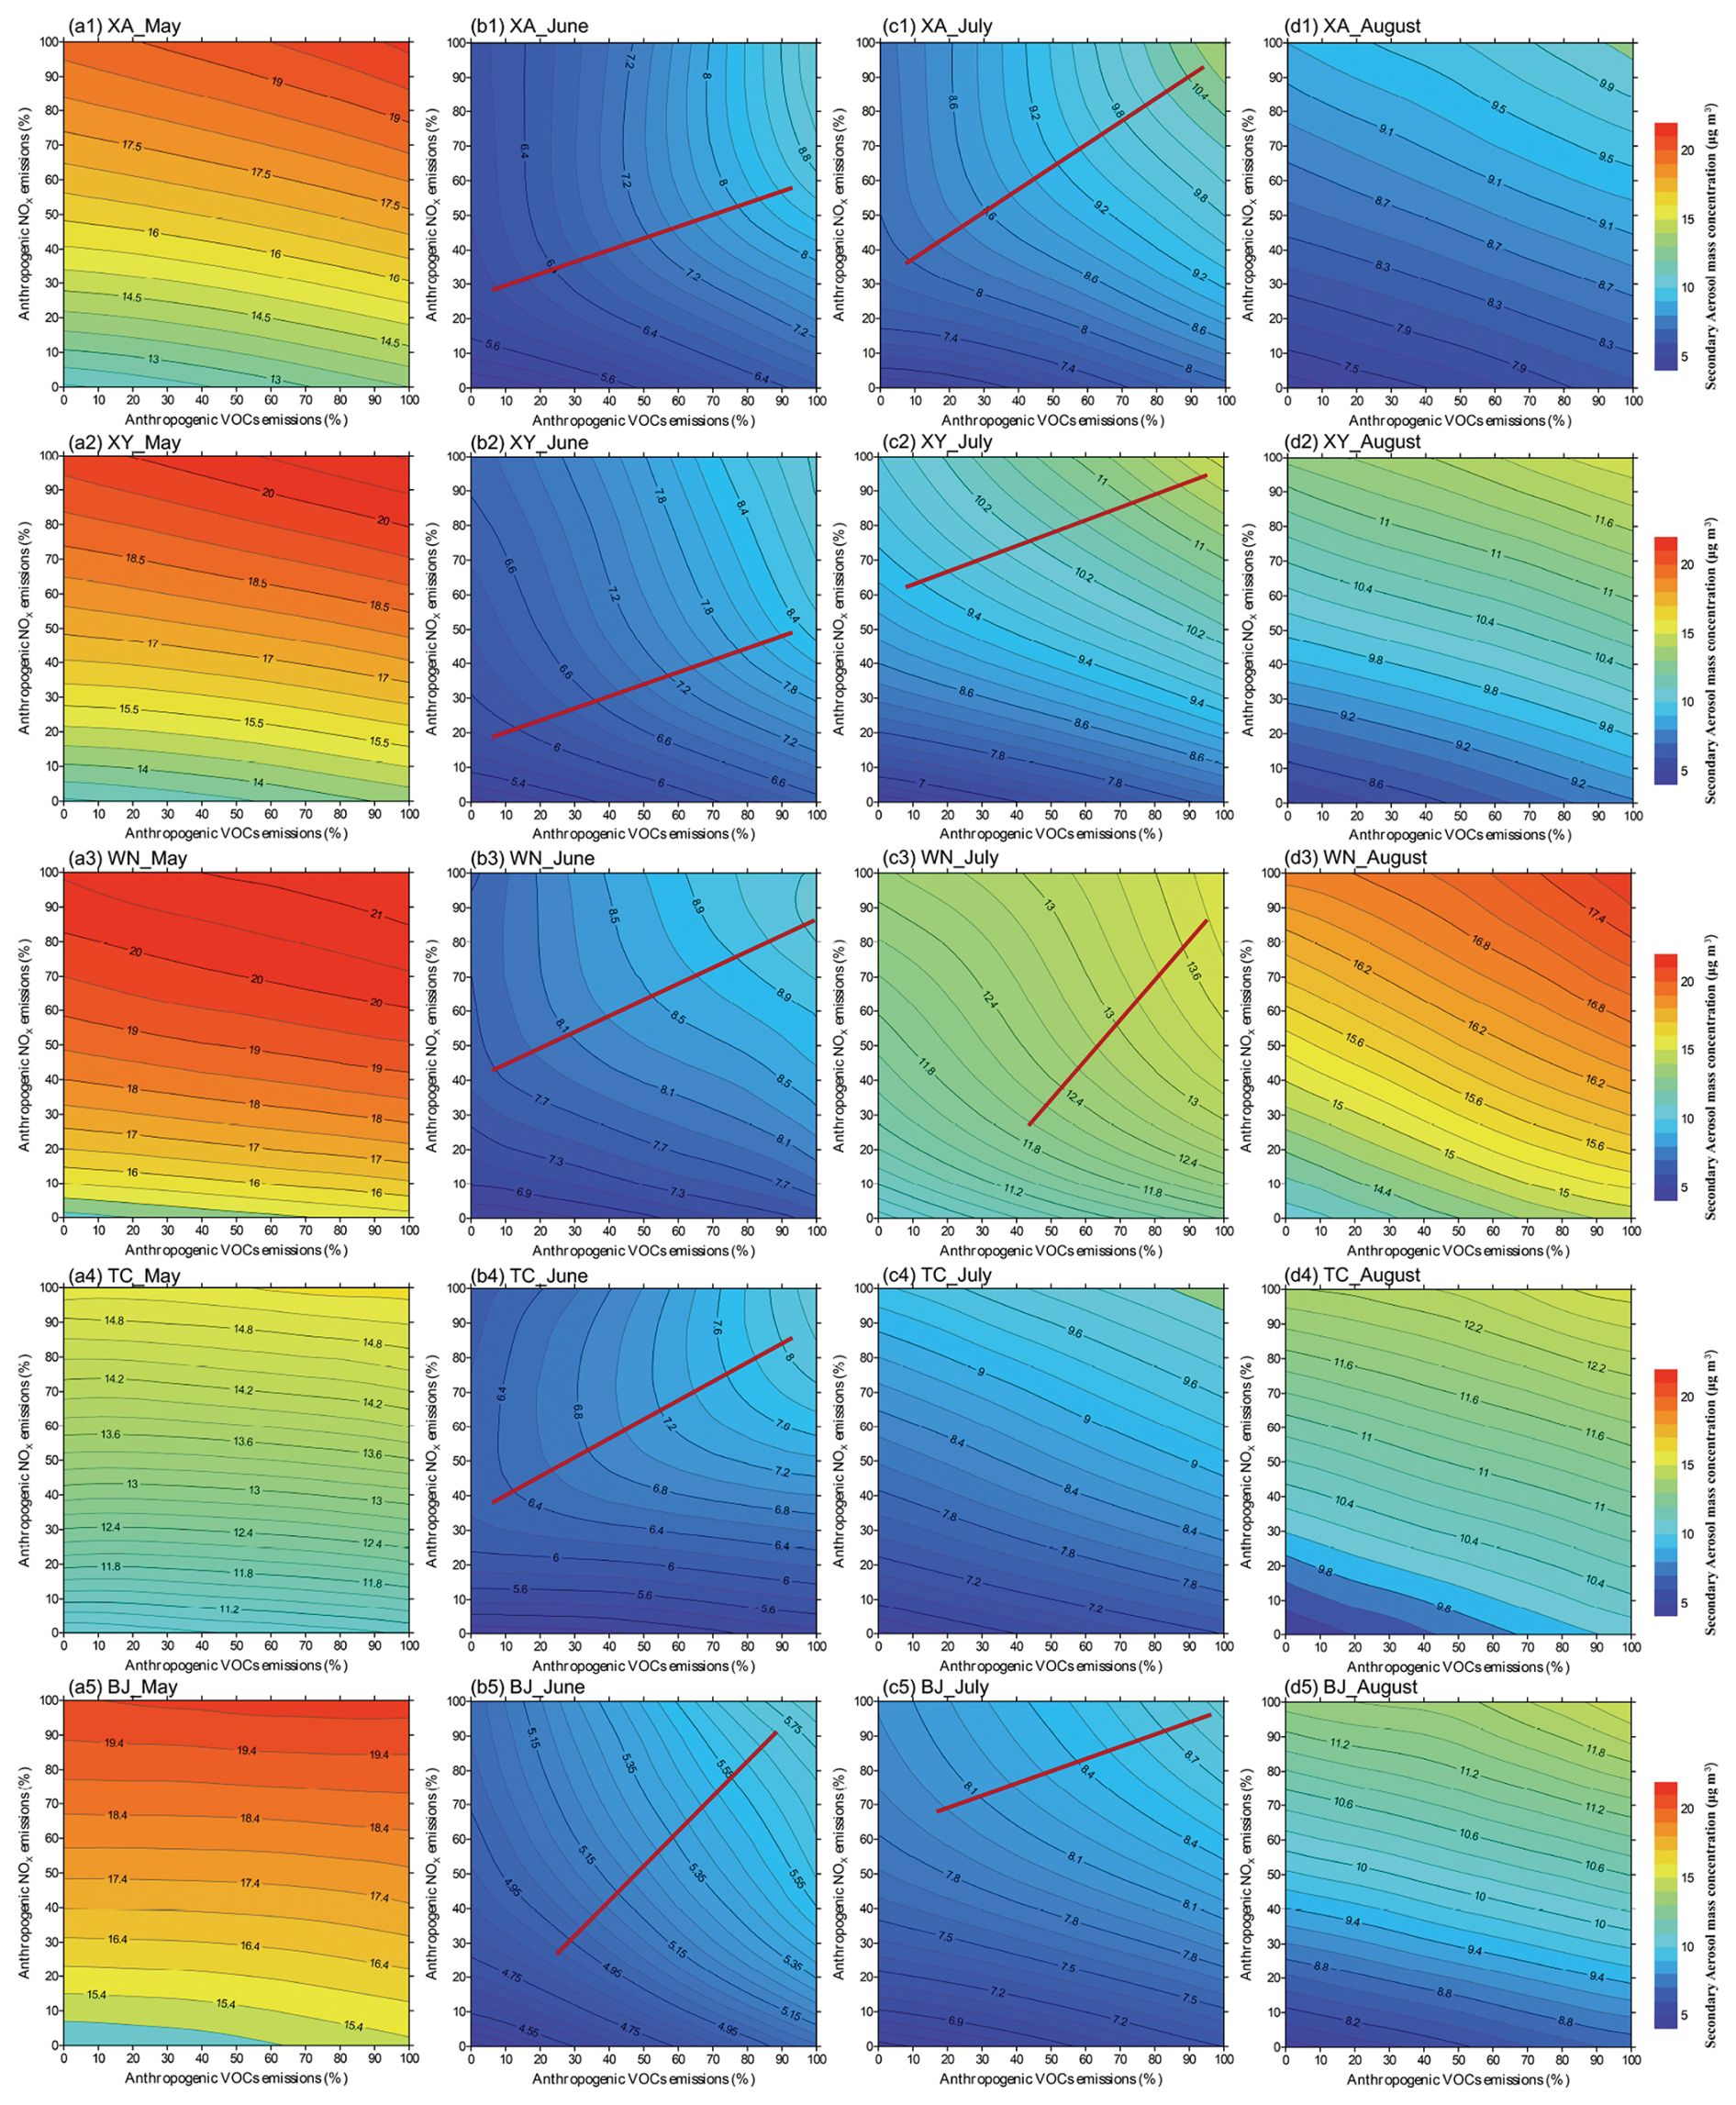
Figure 10SA isopleth profiles (µg m−3) in urban areas of (*1) XA, (*2) XY, (*3) WN, (*4) TC, and (*5) BJ in high-O3 pollution episode during (a*) May, (b*) June, (c*) July, (d*) August 2022. The VOCs-limited and NOX-limited regimes are separated by the red ridge lines. (a*), (c4) and (d*) indicate the formation regime are NOX-limited with no red ridge lines displayed in the isopleth at current emission mitigation scenarios.
The observed spatiotemporal evolution of SAFR can be interpreted in the context of the seasonal progression of key chemical and meteorological drivers. The NOX-limited regime in early summer is likely associated with an enhanced contribution of nitrate to secondary aerosols, under conditions where SA formation remains sensitive to NOX through HNO3 production and subsequent gas–particle partitioning favored by relatively lower temperatures, higher humidity, and weaker photochemical activity. As solar radiation and temperature increase in June, the enhanced atmospheric oxidation capacity, together with temperature-dependent VOCs and biogenic emissions, promotes SOA formation, leading to a shift toward a VOCs-limited SAFR. The persistent VOCs sensitivity in WN into July reflects its relatively high NOX emissions, which decrease the local VOCs NOX ratio and thereby reinforce VOCs-limited chemistry. By late summer (August), warmer and more humid conditions increase aerosol liquid water content and favor efficient nitrate formation and partitioning, contributing to a renewed tendency toward NOX-sensitive SAFR.
Source attributions show anthropogenic sources dominate SA formation (63 %–87 %) across the GZB, with traffic and industry are principal contributions (Table 3). Power plant emissions are particularly influential in WN, where their NOX emissions drive elevated SA formation, while simultaneously exerting a local O3-suppressing effect. Residential emissions contribute moderately, ranging from 7 %–22 % across cities and months, while biogenic sources play a relatively minor role in SA formation.
3.5.3 Implications for Seasonally Adaptive Control Strategies
Considering the multifaceted interactions between O3 and SA, changes in one pollutant often propagate to the other, making it essential to consider them within a unified management framework. During the warm season, when photochemical activity peaks and O3 dominates air pollution, incorporating SA considerations into O3-focused control strategies can provide additional air quality benefits and help prevent counterproductive effects on pollutant levels. In May, SAFR is strongly NOX-limited while O3 is VOCs-limited, indicating that NOX reductions would decrease SA, but VOCs-focused measures must be maintained to avoid O3 rebounds. In June, both pollutants are VOCs-sensitive in most cities, making AVOCs reductions (industry + traffic) especially beneficial. In July, XA, XY, TC, and BJ occupy broader transitional zones, where reductions in NOX and AVOCs emissions both can yield benefits; WN's lingering VOC sensitivity suggests AVOC-focused strategies remain prioritized there. By August, SAFR in all cities tilting toward NOX sensitivity and O3 is largely NOX-limited, suggesting that NOX reductions – particularly from power plants and traffic exhausts – become the most effective co-control approach.
From a policy perspective, warm-season air quality management in the GZB should adopt sub-seasonal sequencing emission controls. AVOCs reductions from traffic and industrial sources are prioritized in early summer, combined NOX–AVOCs strategies in transitional regimes are required in mid-summer, and NOX reductions to maximize co-benefits for both O3 and SA are emphasized in late summer. Embedding SA considerations into an O3-focused framework allows decision-makers to capitalize on synergistic effects where they naturally arise, while avoiding unintended pollutant trade-offs, ultimately providing a more efficient pathway toward cleaner warm season air in the GZB.
This study combines long-term near-surface observations and high-resolution WRF-Chem simulations to diagnose summertime O3 formation and its source attributions across the GZB, and to explore co-control potential with SA. Observational analyses show a nearly 50 % decline in PM2.5 mass concurrent with a marked rise in MDA8 O3 concentrations and increasing O3 exceedance frequency during warm seasons from 2014 to 2024, with June as the climatological O3 peak month.
Incorporating an EKMA framework and BFM into WRF-Chem to simulate warm-season O3 pollution in 2022, we find pronounced spatiotemporal shifts in OFR across the GZB: predominantly VOCs-limited in May–June, shifting toward transitional in July, and becoming NOX-limited in August. Sectoral attribution indicates contribution of anthropogenic sources to MDA8 O3 concentrations rises from 32.7 % to 55.2 % (July), with biogenic shares peaking (18.7 %) in July. City-level differences are notable – XA and XY are high anthropogenic cores with large industrial and traffic influences, WN shows the most and persistent VOCs-limited/NOX-saturated behavior, while BJ on the western edge is comparatively less polluted and more NOX-limited or transitional. SAFR diagnostics shows a different seasonal pattern: the SAFR is NOX-limited in May, VOCs-limited in June, transitional in July, and transitional with a NOX-leaning sensitivity in August across the GZB. Traffic and industry emerge as primary contributors to both O3 and SA, while power plants strongly influence SA in WN.
Based on these findings, we recommend sub-seasonally adaptive, city-specific control strategies: prioritize reductions of AVOCs, particularly from industrial and traffic sources, during early summer (notably June) to capture a VOCs-led co-benefit opportunity; implement combined NOX–AVOCs emission mitigation measures during the transitional month (July); and emphasize NOX mitigation from traffic, power plants emissions in late summer (August) to maximize co-benefits for both O3 and SA while minimizing unintended trade-offs. Integrating real-time OFR and SAFR diagnostics with source attributions will enhance the efficiency and resilience of warm-season air quality management in the GZB.
The hourly ambient surface O3, NO2 and PM2.5 mass concentrations are real-timely released by Ministry of Ecology and Environment, China on the website http://www.aqistudy.cn/ (last access: 20 August 2025). Observations of the near surface meteorological factors are released from http://www.meteomanz.com (last access: 23 August 2025).
The supplement related to this article is available online at https://doi.org/10.5194/acp-26-3417-2026-supplement.
NZ, as the corresponding author, provided the ideas, verified the conclusions, and revised the paper. RW conducted research, designed the experiments, performed the simulation, processed the data, prepared the data visualization, and prepared the manuscript, with contributions from all authors. JW provided the primary data processing and reviewed the manuscript. JY, QJ, and YL analyzed the initial simulation data and visualized the model results. XT reviewed the manuscript and provided critical reviews.
The contact author has declared that none of the authors has any competing interests.
Publisher's note: Copernicus Publications remains neutral with regard to jurisdictional claims made in the text, published maps, institutional affiliations, or any other geographical representation in this paper. The authors bear the ultimate responsibility for providing appropriate place names. Views expressed in the text are those of the authors and do not necessarily reflect the views of the publisher.
The authors thank the editor and the two anonymous reviewers for their constructive comments and valuable suggestions on this manuscript.
This research has been supported by the National Natural Science Foundation of China (grant no. 42307154), the Key Research and Development Projects of Shaanxi Province (grant no. 2024SF-ZDCYL-05-05), and the China Postdoctoral Science Foundation (grant no. 2023M743462).
This paper was edited by Mingyi Wang and reviewed by two anonymous referees.
Baró, R., Palacios-Peña, L., Baklanov, A., Balzarini, A., Brunner, D., Forkel, R., Hirtl, M., Honzak, L., Jiménez-Guerrero, P., Langer, M., Pérez, J. L., Pirovano, G., San José, R., Rodríguez, S., and Tuccella, P.: Regional effects of atmospheric aerosols on temperature: an evaluation of an ensemble of online coupled models, Atmos. Chem. Phys., 17, 9677–9696, https://doi.org/10.5194/acp-17-9677-2017, 2017.
Bei, N., Liang, J., Li, X., and Wang, R.: Worsening summertime ozone pollution in the Guanzhong Basin, China from 2014 to 2018: impacts of synoptic conditions and anthropogenic emissions, Atmos. Environ., 274, 118974, https://doi.org/10.1016/j.atmosenv.2022.118974, 2022.
Cardelino, C. A. and Chameides, W. L.: An observation-based model for analyzing ozone precursor relationships in the urban atmosphere, J. Air Waste Manage. Assoc., 45, 161–180, https://doi.org/10.1080/10473289.1995.10467354, 1995.
Chameides, W. L., Fehsenfeld, F., Rodgers, M. O., Cardelino, C., Martinez, J., Parrish, D., Lonneman, W., Lawson, D. R., Rasmussen, R. A., and Zimmerman, P.: Ozone precursor relationships in the ambient atmosphere, J. Geophys. Res., 97, 6037–6055, https://doi.org/10.1029/91JD03014, 1992.
Chapman, S.: A theory of upper-atmospheric ozone: Edward Stanford, Mem. R. Meteorol. Soc., 3, 103–125, 1930.
Dai, J., Brasseur, G. P., Vrekoussis, M., Kanakidou, M., Qu, K., Zhang, Y., Zhang, H., and Wang, T.: The atmospheric oxidizing capacity in China – Part 2: Sensitivity to emissions of primary pollutants, Atmos. Chem. Phys., 24, 12943–12962, https://doi.org/10.5194/acp-24-12943-2024, 2024a.
Dai, J., Zhang, K., Feng, Y., Yi, X., Li, R., Xue, J., Li, Q., Shi, L., Liao, J., Yi, Y., Wang, F., Yang, J., Chen, H., Huang, L., Tan, J., and Wang, Y.: Significant influence of oxygenated volatile organic compounds on atmospheric chemistry: a case study in a typical industrial city in China, Atmos. Chem. Phys., 25, 7467–7484, https://doi.org/10.5194/acp-25-7467-2025, 2025.
Dai, W., Wang, R., Zhong, H., Li, L., Zhang, Y., Li, J., Huang, T., and Tie, X.: Impact of formaldehyde on ozone formation in Central China: important role of biogenic emission in forest region, Sci. Total Environ., 949, 175182, https://doi.org/10.1016/j.scitotenv.2024.175182, 2024b.
Du, S., He, C., Zhang, L., Zhao, Y., Chu, L., and Ni, J.: Policy implications for synergistic management of PM2.5 and O3 pollution from a pattern–process–sustainability perspective in China, Sci. Total Environ., 916, 170210, https://doi.org/10.1016/j.scitotenv.2024.170210, 2024.
Dunker, A. M., Morris, R. E., Pollack, A. K., Schleyer, C. H., and Yarwood, G.: Photochemical modeling of the impact of fuels and vehicles on urban ozone using Auto/Oil Program data, Environ. Sci. Technol., 30, 787–801, https://doi.org/10.1021/es950175m, 1996.
Elshorbany, Y., Ziemke, J. R., Strode, S., Petetin, H., Miyazaki, K., De Smedt, I., Pickering, K., Seguel, R. J., Worden, H., Emmerichs, T., Taraborrelli, D., Cazorla, M., Fadnavis, S., Buchholz, R. R., Gaubert, B., Rojas, N. Y., Nogueira, T., Salameh, T., and Huang, M.: Tropospheric ozone precursors: global and regional distributions, trends, and variability, Atmos. Chem. Phys., 24, 12225–12257, https://doi.org/10.5194/acp-24-12225-2024, 2024.
Feng, T., Bei, N., Huang, R., Liu, S., Wang, Q., Xue, M., and Li, G.: Summertime ozone formation in Xi'an and surrounding areas, China, Atmos. Chem. Phys., 16, 4323–4342, https://doi.org/10.5194/acp-16-4323-2016, 2016.
Feng, Z., Xu, Y., Kobayashi, K., and Emberson, L.: Ozone pollution threatens the production of major staple crops in East Asia, Nat. Food, 3, 47–56, https://doi.org/10.1038/s43016-021-00422-6, 2022.
Gao, C., Zhang, X., Lun, X., Gao, Y., Guenther, A., Zhao, H., Zhang, S., Huang, L., Song, K., Huang, X., Gao, M., Ma, P., Jia, Z., Xiu, A., and Zhang, Y.: BVOCs' role in dynamic shifts of summer ozone formation regimes across China and policy implications, J. Environ. Manage., 376, 124150, https://doi.org/10.1016/j.jenvman.2025.124150, 2025.
Grell, G. A., Peckham, S. E., Schmitz, R., McKeen, S. A., Frost, G., Skamarock, W. C., and Eder, B.: Fully coupled “online” chemistry within the WRF model, Atmos. Environ., 39, 6957–6975, https://doi.org/10.1016/j.atmosenv.2005.04.027, 2005.
Han, H., Liu, J., Guo, S., Tan, Q., Li, J., Li, Y., and Mao, H.: Formation mechanisms of a severe ozone episode over Beijing–Tianjin–Hebei and its implications for ozone control strategies in summer, Atmos. Chem. Phys., 20, 4399–4414, https://doi.org/10.5194/acp-20-4399-2020, 2020.
Hata, H., Inoue, K., Yoshikado, H., Genchi, Y., and Tsunemi, K.: Impact of introducing electric vehicles on ground-level O3 and PM2.5 in the Greater Tokyo Area: yearly trends and the importance of changes in the Urban Heat Island effect, Atmos. Chem. Phys., 25, 1037–1056, https://doi.org/10.5194/acp-25-1037-2025, 2025
Jenkin, M. E. and Clemitshaw, K. C.: Ozone and other secondary photochemical pollutants: chemical processes governing their formation in the planetary boundary layer, Atmos. Environ., 34, 2499–2527, https://doi.org/10.1016/S1352-2310(99)00478-1, 2000.
Jin, X., and Holloway, T.: Spatial and temporal variability of ozone sensitivity over China observed from the Ozone Monitoring Instrument, J. Geophys. Res.-Atmos., 120, 7229–7246, https://doi.org/10.1002/2015JD023250, 2015.
Jin, X., Pusede, E. A., Wiedinmyer, C. J., Fischer, M. L., and Oetjen, H. J.: Evaluating a space-based indicator of surface ozone–NOX–VOC sensitivity over midlatitude source regions and application to decadal trends, J. Geophys. Res.-Atmos., 122, 10451–10471, https://doi.org/10.1002/2017JD026720, 2017.
Kong, L., Song, M., Li, X., Liu, Y., Lu, S., Zeng, L., and Zhang, Y.: Analysis of China's PM2.5 and ozone coordinated control strategy based on the observation data from 2015 to 2020, J. Environ. Sci., 138, 385–394, https://doi.org/10.1016/j.jes.2023.05.015, 2024.
Li, G., Lei, W., Zavala, M., Volkamer, R., Dusanter, S., Stevens, P., and Molina, L. T.: Impacts of HONO sources on the photochemistry in Mexico City during the MCMA-2006/MILAGO Campaign, Atmos. Chem. Phys., 10, 6551–6567, https://doi.org/10.5194/acp-10-6551-2010, 2010.
Li, G., Bei, N., Tie, X., and Molina, L. T.: Aerosol effects on the photochemistry in Mexico City during MCMA-2006/MILAGRO campaign, Atmos. Chem. Phys., 11, 5169–5182, https://doi.org/10.5194/acp-11-5169-2011, 2011a.
Li, G., Zavala, M., Lei, W., Tsimpidi, A. P., Karydis, V. A., Pandis, S. N., Canagaratna, M. R., and Molina, L. T.: Simulations of organic aerosol concentrations in Mexico City using the WRF-CHEM model during the MCMA-2006/MILAGRO campaign, Atmos. Chem. Phys., 11, 3789–3809, https://doi.org/10.5194/acp-11-3789-2011, 2011b.
Li, G., Lei, W., Bei, N., and Molina, L. T.: Contribution of garbage burning to chloride and PM2.5 in Mexico City, Atmos. Chem. Phys., 12, 8751–8761, https://doi.org/10.5194/acp-12-8751-2012, 2012.
Li, K., Jacob, D. J., Liao, H., Zhu, J., Shah, V., Shen, L., Bates, K. H., Zhang, Q., and Zhai, S.: Anthropogenic drivers of 2013–2017 trends in summer surface ozone in China, P. Natl. Acad. Sci. USA, 116, 422–427, https://doi.org/10.1073/pnas.1812168116, 2019.
Li, K., Jacob, D. J., Shen, L., Lu, X., De Smedt, I., and Liao, H.: Increases in surface ozone pollution in China from 2013 to 2019: anthropogenic and meteorological influences, Atmos. Chem. Phys., 20, 11423–11433, https://doi.org/10.5194/acp-20-11423-2020, 2020.
Li, L., Chen, C., Huang, C., Huang, H., Zhang, G., Wang, Y., and Wang, H.: Ozone sensitivity analysis with the MM5-CMAQ modeling system for Shanghai, J. Environ. Sci., 23, 1150–1157, https://doi.org/10.1016/S1001-0742(10)60531-0, 2011.
Li, N., He, Q., Greenberg, J., Guenther, A., Li, J., Cao, J., Wang, J., Liao, H., Wang, Q., and Zhang, Q.: Impacts of biogenic and anthropogenic emissions on summertime ozone formation in the Guanzhong Basin, China, Atmos. Chem. Phys., 18, 7489–7507, https://doi.org/10.5194/acp-18-7489-2018, 2018.
Li, P., Yang, Y., Wang, H., Li, S., Li, K., Wang, P., Li, B., and Liao, H.: Source attribution of near-surface ozone trends in the United States during 1995–2019, Atmos. Chem. Phys., 23, 5403–5417, https://doi.org/10.5194/acp-23-5403-2023, 2023.
Li, Q., Zhang, L., Wang, T., Wang, Z., Fu, X., and Zhang, Q.: “New” reactive nitrogen chemistry reshapes the relationship of ozone to its precursors, Environ. Sci. Technol., 52, 2810–2818, https://doi.org/10.1021/acs.est.7b05771, 2018.
Li, Y., Gao, M., Liu, Y., Wang, Y., Zhang, L., Chen, X., and Wang, T.: Ozone formation sensitivity at various altitudes: seeking the best control strategies in the Beijing–Tianjin–Hebei region, Environ. Sci. Technol. Lett., 11, 785–791, https://doi.org/10.1021/acs.estlett.4c00777, 2024.
Lin, M., Horowitz, L. W., Xie, Y., Paulot, F., Malyshev, S., Shevliakova, E., Finco, A., Gerosa, G., Kubistin, D., and Pilegaard, K.: Vegetation feedbacks during drought exacerbate ozone air pollution extremes in Europe, Nat. Clim. Change, 10, 444–451, https://doi.org/10.1038/s41558-020-0743-y, 2020.
Liu, Y. and Wang, T.: Worsening urban ozone pollution in China from 2013 to 2017 – Part 2: the effects of emission changes and implications for multi-pollutant control, Atmos. Chem. Phys., 20, 6323–6337, https://doi.org/10.5194/acp-20-6323-2020, 2020.
Lu, H., Lyu, X., Cheng, H., Ling, Z., and Guo, H.: Overview on the spatial–temporal characteristics of the ozone formation regime in China, Environ. Sci. Proc. Imp., 21, 916–929, 2019.
Martin, R. V., Fiore, A. M., and van Donkelaar, A.: Space-based diagnosis of surface ozone sensitivity to anthropogenic emissions, Geophys. Res. Lett., 31, L33102, https://doi.org/10.1029/2004GL020939, 2004.
MEE (Ministry of Ecology and Environment): Action Plan for Continuous Improvement of Air Quality, State Council, Beijing, China, https://www.gov.cn/zhengce/content/202312/content_6919000.htm (last access: 9 September 2025), 2023.
Ou, J., Yuan, Z., Zheng, J., Huang, Z., Shao, M., Li, Z., Huang, X., Guo, H., and Louie, P. K. K.: Ambient ozone control in a photochemically active region: short-term despiking or long-term attainment?, Environ. Sci. Technol., 50, 5720–5728, https://doi.org/10.1021/acs.est.6b00345, 2016.
Qu, K., Wang, X., Cai, X., Yan, Y., Jin, X., Vrekoussis, M., Kanakidou, M., Brasseur, G. P., Shen, J., Xiao, T., Zeng, L., and Zhang, Y.: Rethinking the role of transport and photochemistry in regional ozone pollution: insights from ozone concentration and mass budgets, Atmos. Chem. Phys., 23, 7653–7671, https://doi.org/10.5194/acp-23-7653-2023, 2023.
Ouyang, B., Ling, Z., Guo, H., Wang, X., Wang, D., Zhou, M., and Wang, B.: Seasonal characteristics and meteorological drivers of ozone pollution in the Pearl River Delta, China, Atmos. Environ., 269, 118856, https://doi.org/10.1016/j.atmosenv.2021.118856, 2022.
Pay, M. T., Gangoiti, G., Guevara, M., Napelenok, S., Querol, X., Jorba, O., and Pérez García-Pando, C.: Ozone source apportionment during peak summer events over southwestern Europe, Atmos. Chem. Phys., 19, 5467–5494, https://doi.org/10.5194/acp-19-5467-2019, 2019.
Rahman, M. M., Shults, R., and Ali, M. F.: Formaldehyde-to-nitrogen dioxide ratio (FNR) analysis for ozone sensitivity: a case study over Bangladesh using OMI data, Air Qual. Atmos. Health, 18, 1879–1886, https://doi.org/10.1007/s11869-025-01732-5, 2025.
Ren, S., Wang, Y., Zhang, R., Zhao, Y., Zhang, L., and Wang, X.: Ozone pollution and its precursors in China: trends, drivers, and implications for control, Environ. Sci. Technol., 56, 1794–1804, https://doi.org/10.1021/acs.est.1c06401, 2022.
Shu, Q., Napelenok, S. L., Hutzell, W. T., Baker, K. R., Henderson, B. H., Murphy, B. N., and Hogrefe, C.: Comparison of ozone formation attribution techniques in the northeastern United States, Geosci. Model Dev., 16, 2303–2322, https://doi.org/10.5194/gmd-16-2303-2023, 2023.
Sillman, S.: The use of NOy, H2O2, and HNO3 as indicators for ozone–NOX–hydrocarbon sensitivity in urban locations, J. Geophys. Res., 100, 14175–14188, https://doi.org/10.1029/94JD02953, 1995.
Song, K., Liu, R., Wang, Y., Liu, T., Wei, L., Wu, Y., Shao, M., Zeng, L., and Liu, S. C.: Observation-based analysis of ozone production sensitivity for two persistent ozone episodes in Guangdong, China, Atmos. Chem. Phys., 22, 8403–8416, https://doi.org/10.5194/acp-22-8403-2022, 2022.
Souri, A. H., Johnson, M. S., Wolfe, G. M., Crawford, J. H., Fried, A., Wisthaler, A., Brune, W. H., Blake, D. R., Weinheimer, A. J., Verhoelst, T., Compernolle, S., Pinardi, G., Vigouroux, C., Langerock, B., Choi, S., Lamsal, L., Zhu, L., Sun, S., Cohen, R. C., Min, K.-E., Cho, C., Philip, S., Liu, X., and Chance, K.: Characterization of errors in satellite-based HCHO NO2 tropospheric column ratios with respect to chemistry, column-to-PBL translation, spatial representation, and retrieval uncertainties, Atmos. Chem. Phys., 23, 1963–1986, https://doi.org/10.5194/acp-23-1963-2023, 2023.
State Council: Air Pollution Prevention and Control Action Plan (Guofa (2013) No. 37), Beijing, China, https://www.gov.cn/zwgk/2013-09/12/content_2486773.htm (last access: 5 September 2025), 2013.
State Council: Three-Year Action Plan for Winning the Blue Sky War (2018–2020), Beijing, China, https://www.gov.cn/zhengce/content/2018-07/03/content_5303154.htm (last access: 5 September 2025), 2018.
Sun, L., Xue, L., Wang, T., Wang, X., Gao, J., Nie, W., Wang, X., Xu, P., Gao, R., and Wang, Y.: Significant increase of summertime ozone at Mount Tai in Central Eastern China, Atmos. Chem. Phys., 16, 10637–10650, https://doi.org/10.5194/acp-16-10637-2016, 2016.
Sun, Y., Liu, C., Palm, M., Vigouroux, C., Notholt, J., Hu, Q., Liu, J., and Wang, T.: Ozone seasonal evolution and photochemical production regime in the polluted troposphere in eastern China derived from high-resolution Fourier-transform spectrometry observations, Atmos. Chem. Phys., 18, 14569–14583, https://doi.org/10.5194/acp-18-14569-2018, 2018.
Tang, G., Liu, Y., Zhang, J., Liu, B., Li, Q., Sun, J., Wang, Y., Xuan, Y., Li, Y., Pan, J., Li, X., and Wang, Y.: Bypassing the NOX titration trap in ozone pollution control in Beijing, Atmos. Res., 249, 105333, https://doi.org/10.1016/j.atmosres.2020.105333, 2021.
Valacchi, G., Porada, E., and Rowe, B. H.: Ambient ozone and bacterium Streptococcus: A link between cellulitis and pharyngitis, Int. J. Occup. Med. Environ. Health, 28, 771–774, https://doi.org/10.13075/ijomeh.1896.00267, 2015.
Wang, J., Gao, J., Che, F., Yang, X., Yang, Y., Liu, L., Li, H., and Wang, T.: Summertime response of ozone and fine particulate matter to mixing-layer meteorology over the North China Plain, Atmos. Chem. Phys., 23, 14715–14733, https://doi.org/10.5194/acp-23-14715-2023, 2023a.
Wang, N., Liu, S., Xu, J., Wang, Y., Li, C., Xie, Y., Lu, H., and Yang, F.: Climate-driven biogenic emissions alleviate the impact of human-made emission reductions on O3 control in the Pearl River Delta region, southern China, Atmos. Chem. Phys., 25, 8859–8870, https://doi.org/10.5194/acp-25-8859-2025, 2025a.
Wang, R., Bei, N., Tie, X., Wu, J., Liu, S., Li, X., Liu, L., and Li, G.: Effects of hydroperoxy radical heterogeneous loss on the summertime ozone formation in the North China Plain, Sci. Total Environ., 825, 153993, https://doi.org/10.1016/j.scitotenv.2022.153993, 2022a.
Wang, T., Wei, X. L., Ding, A. J., Poon, C. N., Lam, K. S., Li, Y. S., Chan, L. Y., and Anson, M.: Increasing surface ozone concentrations in the background atmosphere of Southern China, 1994–2007, Atmos. Chem. Phys., 9, 6217–6227, https://doi.org/10.5194/acp-9-6217-2009, 2009.
Wang, T., Xue, L., Brimblecombe, P., Lam, Y. F., Li, L., and Zhang, L.: Ozone pollution in China: a review of concentrations, meteorological influences, chemical precursors, and effects, Sci. Total Environ., 575, 1582–1596, https://doi.org/10.1016/j.scitotenv.2016.10.081, 2017.
Wang, T., Xue, L., Brimblecombe, P., Lam, Y. F., Li, L., and Zhang, L.: Seasonality and reduced nitric oxide titration dominated ozone increases in China, npj Clim. Atmos. Sci., 5, 3, https://doi.org/10.1038/s41612-022-00249-3, 2022.
Wang, W., Parrish, D. D., Wang, S., Bao, F., Ni, R., Li, X., Wu, X., Feng, X., Zhang, F., and Su, H.: Long-term trend of ozone pollution in China during 2014–2020: distinct seasonal and spatial characteristics and ozone sensitivity, Atmos. Chem. Phys., 22, 8935–8949, https://doi.org/10.5194/acp-22-8935-2022, 2022.
Wang, W., Li, X., Cheng, Y., Parrish, D. D., Ni, R., Tan, Z., Wang, S., Bao, F., and Zhang, Y.: Ozone-pollution mitigation strategy informed by long-term trends of atmospheric oxidation capacity, Nat. Geosci., 17, 20–25, https://doi.org/10.1038/s41561-023-01287-7, 2024.
Wang, X., Fu, T. M., Zhang, L., Cao, H., Zhang, Q., Ma, H., Zhao, B., and Henze, D. K.: Sensitivities of ozone air pollution in the Beijing–Tianjin–Hebei area to local and upwind precursor emissions using adjoint modeling, Environ. Sci. Technol., 55, 5752–5762, https://doi.org/10.1021/acs.est.0c08167, 2021.
Wang, Y., Zhao, Y., Liu, Y., Jiang, Y., Zheng, B., Xing, J., Wang, S., Zhang, L., and Nielsen, C. P.: Sustained emission reductions have restrained the ozone pollution over China, Nat. Geosci., 16, 967– 974, https://doi.org/10.1038/s41561-023-01284-2, 2023b.
Wang, Z., Zhang, H., Shi, C., Ji, X., Zhu, Y., Xia, C., Sun, X., Zhang, M., Lin, X., Yan, S., Zhou, Y., Xing, C., Chen, Y., and Liu, C.: Vertical and spatial differences in ozone formation sensitivities under different ozone pollution levels in eastern Chinese cities, npj Clim. Atmos. Sci., 8, 30, https://doi.org/10.1038/s41612-024-00855-3, 2025b.
Wu, J., Bei, N., Hu, B., Liu, S., Wang, Y., Shen, Z., Li, X., Liu, L., Wang, R., Liu, Z., and Li, G.: Aerosol–photolysis interaction reduces particulate matter during wintertime haze events, P. Natl. Acad. Sci. USA, 117, 9755–9761, https://doi.org/10.1073/pnas.1916775117, 2020a.
Wu, K., Yang, X., Chen, D., Gu, S., Lu, Y., Jiang, Q., Bi, X., Wang, X., Li, Z., and Lu, S.: Estimation of biogenic VOC emissions and their corresponding impact on ozone and secondary organic aerosol formation in China, Atmos. Res., 231, 104656, https://doi.org/10.1016/j.atmosres.2019.104656, 2020b.
Wu, R. and Xie, S.: Spatial distribution of ozone formation in China derived from emissions of speciated volatile organic compounds, Environ. Sci. Technol., 51, 2574–2583, https://doi.org/10.1021/acs.est.6b03634, 2017.
Xiao, Q., Geng, G., Xue, T., Liu, S., Cai, C., He, K., and Zhang, Q.: Tracking PM2.5 and O3 pollution and the related health burden in China 2013–2020, Environ. Sci. Technol., 56, 6922–6932, https://doi.org/10.1021/acs.est.1c08835, 2022.
Xu, D., Yuan, Z., Wang, M., Zhao, K., Liu, X., Duan, Y., and Zhao, X.: Multi-factor reconciliation of discrepancies in ozone-precursor sensitivity retrieved from observation- and emission-based models, Environ. Int., 158, 106952, https://doi.org/10.1016/j.envint.2021.106952, 2022.
Xu, W., Lin, W., Xu, X., Tang, J., Huang, K., Gao, W., and Zhang, G.: Long-term trends of surface ozone and its influencing factors at the Mt. Waliguan GAW station, China – Part 1: overall trends and characteristics, Atmos. Chem. Phys., 16, 6191–6205, https://doi.org/10.5194/acp-16-6191-2016, 2016.
Xu, W., Wang, T., Xue, L., Louie, P. K. K., Luk, C. W. Y., Gao, J., Wang, S., Chai, F., Wang, W., and Wang, X.: Long-term measurements of surface ozone and its precursors in the Yangtze River Delta, China: characteristics, trends, and meteorological influences, Sci. Total Environ., 699, 134236, https://doi.org/10.1016/j.scitotenv.2019.134236, 2020.
Ye, X., Yang, J., Wang, R., Sun, J., Liu, Z., Chen, Z., Li, G., and Shen, Z.: From sensitivity regimes to policy action: Evaluating EKMA curve effectiveness with WRF-Chem, OBM, and machine learning, Atmos. Environ., 365, 121689, https://doi.org/10.1016/j.atmosenv.2025.121689, 2025.
Yu, H., Chang, Y., Cheng, L., Duan, Y., and Hu, J.: Measurement report: Long-term assessment of primary and secondary organic aerosols in the Shanghai megacity throughout China's Clean Air actions since 2010, Atmos. Chem. Phys., 25, 5355–5369, https://doi.org/10.5194/acp-25-5355-2025, 2025.
Yu, X., Zhao, B., Chen, Y., Li, J., Wang, S., and Wu, J.: Diagnosing ozone formation regimes and optimal precursor reduction ratios in Zhengzhou, China, Atmos. Environ., 319, 120218, https://doi.org/10.1016/j.atmosenv.2025.120218, 2025.
Zhang, Q., Zheng, Y., Tong, D., Shao, M., Wang, S., Zhang, Y., Xu, X., Wang, J., He, H., Liu, W., Ding, Y., Lei, Y., Li, J., Wang, Z., Zhang, X., Wang, Y., Cheng, J., Liu, Y., Shi, Q., Yan, L., Geng, G., Hong, C., Li, M., Liu, F., Zheng, B., Cao, J., Ding, A., Gao, J., Fu, Q., Huo, J., Liu, B., Liu, Z., Yang, F., He, K., and Hao, J.: Drivers of improved PM2.5 air quality in China from 2013 to 2017, P. Natl. Acad. Sci. USA, 116, 24463–24469, https://doi.org/10.1073/pnas.1907956116, 2019.
Zhao, C., Sun, Y., Yang, J., Li, J., Zhou, Y., Yang, Y., Fan, H., and Zhao, X.: Decadal evolution of aerosol-mediated ozone responses in Eastern China under clean-air actions and carbon-neutrality policies, Atmos. Chem. Phys., 26, 1301–1318, https://doi.org/10.5194/acp-26-1301-2026, 2026.
Zhao, M., Zhang, Y., Pei, C., Chen, T., Mu, J., Liu, Y., Wang, Y., and Xue, L.: Worsening ozone air pollution with reduced NOX and VOCs in the Pearl River Delta region in autumn 2019: implications for national control policy in China, J. Environ. Manage., 324, 116327, https://doi.org/10.1016/j.jenvman.2022.116327, 2022.
Zhao, X., Tian, W., and Chen, D.: Impacts of thermal power industry emissions on air quality in China, Sustainability, 17, 441, https://doi.org/10.3390/su17020441, 2025.
Zheng, B., Tong, D., Li, M., Liu, F., Hong, C., Geng, G., Li, H., Li, X., Peng, L., Qi, J., Yan, L., Zhang, Y., Zhao, H., Zheng, Y., He, K., and Zhang, Q.: Trends in China's anthropogenic emissions since 2010 as the consequence of clean air actions, Atmos. Chem. Phys., 18, 14095–14111, https://doi.org/10.5194/acp-18-14095-2018, 2018.
Zhu, S., Liu, Y., Xie, Y., Ren, J., Cheng, H., and Shen, L.: Shifts of formation regimes and increases of atmospheric oxidation led to ozone increase in North China Plain and Yangtze River Delta from 2016 to 2019, J. Geophys. Res. Atmos., 127, e2022JD038373, https://doi.org/10.1029/2022JD038373, 2022.