the Creative Commons Attribution 4.0 License.
the Creative Commons Attribution 4.0 License.
 | 02 Mar 2026
Contrail formation for aircraft with hydrogen combustion – Part 1: A systematic microphysical investigation
Simon Unterstrasser
Ulrike Burkhardt
The number of ice crystals formed during the contrail's jet phase has a long-lasting impact on the life cycle and radiative forcing of contrail cirrus clouds. For conventional kerosene combustion, suitable parameterizations for early ice crystal number have been developed and employed in general circulation models that are used to estimate the climate impact of contrail cirrus. However, a parameterization for the number of ice crystals formed is lacking for hydrogen combustion. To develop such a parameterization, we present a comprehensive set of contrail formation simulations using the particle-based Lagrangian Cloud Module in a box model approach. Unlike kerosene combustion, no soot particles are emitted. Thus, ice crystals are assumed to form on ambient aerosols entrained into the exhaust plume. The total number of entrained particles primarily governs the nonlinear depletion of water vapor. Consequently, the impact of coarse-mode particles is negligible due to their low abundance. Additionally, ice crystal formation from multiple aerosol populations can be reconstructed from single-population simulations using population-specific properties (size and hygroscopicity) and the total number concentration. We also identify atmospheric conditions where homogeneous droplet nucleation can be safely neglected as potential ice formation pathway. Based on more than 20 000 simulations covering a broad range of atmospheric conditions and aerosol properties, we identify a regime where ice crystal formation becomes nearly independent of ambient relative humidity, aerosol size, and hygroscopicity. Our results provide a basis for a data-driven parameterization of ice crystal number in contrails from hydrogen combustion, to be presented in a companion paper.
- Article
(13079 KB) - Full-text XML
- Companion paper
- BibTeX
- EndNote


1.1 Motivation
A hydrogen economy envisions the widespread use of hydrogen as a clean energy carrier, replacing fossil fuels in sectors such as transportation, industry, and power generation (Staffell et al., 2019). The successful implementation of a hydrogen economy requires large-scale infrastructure for hydrogen production, storage, distribution, and end-use technologies such as fuel cells or gas turbines (Tashie-Lewis and Nnabuife, 2021). Hydrogen produced via electrolysis using renewable energy (commonly referred to as green hydrogen) is free of carbon emissions during its production (Dincer and Acar, 2015; Nikolaidis and Poullikkas, 2017; Ajanovic et al., 2022). Furthermore, hydrogen used in gas turbines or fuel-cell systems produces no direct greenhouse gas emissions except water vapor.
Despite its potential to have net-zero greenhouse gas emissions, the use of hydrogen is not without environmental concerns. One of the risks involves hydrogen leakage, which can indirectly contribute to global warming by extending the atmospheric lifetime of methane and increasing tropospheric ozone and stratospheric water vapor levels (Ocko and Hamburg, 2022; Hauglustaine et al., 2022; Warwick et al., 2023).
Two concepts are being explored for a potential future use of hydrogen in aviation (Tiwari et al., 2024; Soleymani et al., 2024; Richardson, 2025). One is hydrogen fuel-cell propulsion, where the fuel’s chemical energy is converted into electricity that drives propeller-based systems. The other is direct hydrogen combustion in gas turbines, which provide thrust either through a propeller (turboprop) or a high-velocity exhaust jet (turbofan). Propeller systems operate most efficiently at lower speeds and altitudes and could therefore be suited to regional or short-haul flights, whereas turbofan engines enable higher cruise speeds and altitudes and might also be applied to medium- and long-haul missions.
The use of hydrogen in aviation comes with several challenges. On the ground, it requires the development of dedicated production, liquefaction, and storage infrastructure at airports, which demands significant investment and logistical coordination (Hoelzen et al., 2022). Onboard the aircraft, hydrogen's low volumetric energy density necessitates larger and heavily modified fuel tanks, reducing payload capacity or flight distance unless aircraft are redesigned (Tiwari et al., 2024; Soleymani et al., 2024). Cryogenic storage of liquid hydrogen to minimize its volume adds another technical complexity.
Despite these challenges, hydrogen could play a role in decarbonizing aviation in the long term. However, the climate impact of aviation extends beyond CO2 emissions, with non-CO2 effects such as nitrogen oxides (NOx) emissions and contrails contributing to the overall radiative forcing. According to Lee et al. (2021), these non-CO2 effects currently account for over half of aviation’s total effective radiative forcing, although this estimate is associated with a large uncertainty. Therefore, to properly assess a potential new aviation technology such as hydrogen combustion from the perspective of non-CO2 effects, a solid understanding of all relevant processes is required. This includes an understanding of processes ranging from the contrail formation to the impacts of long-lived contrails.
The life cycle of individual contrails is typically divided into three regimes (Paoli and Shariff, 2016): During the jet regime, hot exhaust air rapidly mixes with the cold ambient air and ice crystals form under suitable conditions (e.g., Schumann, 1996; Kärcher and Yu, 2009; Lewellen, 2020; Bier et al., 2022, 2024; Yu et al., 2024). During the vortex regime, contrails increase in vertical extent as parts of the ice crystals become trapped within the descending wake vortices. Adiabatic heating resulting from this downward motion causes partial loss of ice crystals (Sussmann and Gierens, 1999; Unterstrasser et al., 2008; Kleine et al., 2018). After vortex-breakup, the dispersion regime follows associated with the transition into contrail cirrus (Schumann, 2012; Lewellen, 2014; Unterstrasser et al., 2017a). This regime is marked by contrail spreading due to vertical wind shear, ice crystal growth/sublimation, and ice crystal sedimentation. For suitable ambient conditions, this regime can last several hours until dissolution of the contrail cirrus cloud (Jensen et al., 1998; Haywood et al., 2009; Laken et al., 2012; Bier et al., 2017).
The direct contributions to the contrail's total lifetime-integrated radiative effect during the jet and vortex regimes are typically small (Unterstrasser and Gierens, 2010a). However, early processes occurring in these phases have a substantial impact on the properties and life cycle of the contrail cirrus cloud (Burkhardt et al., 2018). Consequently, these initial processes exert a significant indirect influence on the overall radiative effect associated with a contrail (Bier and Burkhardt, 2022). While the total ice mass after the vortex break-up has a low impact, the number of ice crystals at this stage strongly and non-linearly influences the radiative effect of the contrail cirrus cloud for a given set of meteorological conditions (Unterstrasser and Gierens, 2010b; Lottermoser and Unterstrasser, 2025).
The idealized study of a single contrail's life cycle provides helpful insights into the relevant physical processes that influence its radiative impact. However, it cannot deliver an estimate of the radiative impact of the globally-distributed contrail coverage, which varies across time and space. This requires a realistic representation of aircraft traffic and the interaction of the contrails with the background atmosphere. For such purposes, general circulation models (GCM) have been extended to include a parameterization for contrail cirrus (Burkhardt and Kärcher, 2009; Gettelman and Chen, 2013; Bock and Burkhardt, 2016; Schumann et al., 2015). However, due to the coarse spatial and temporal resolution in a GCM, early processes during the jet and vortex phases can not be resolved. Therefore, contrails are typically initialized after the vortex break-up, while earlier processes need to be parameterized. For conventional kerosene combustion, a parameterization for contrail ice crystal formation (Kärcher et al., 2015), valid for the soot-rich regime, and a parameterization for the ice crystal loss during the wake vortex phase (Unterstrasser, 2016) have been implemented in the contrail initialization within ECHAM-CCMod (Bier and Burkhardt, 2019, 2022). Moreover, the parameterization for the ice crystal loss has been recently extended to also include hydrogen combustion scenarios (Lottermoser and Unterstrasser, 2025) and has been implemented in ECHAM-CCMod in the meantime. To date, a suitable parameterization for the number of ice crystals formed during the jet phase does not exist for hydrogen-powered aircraft.
1.2 Scope and outline of the study
Our overarching goal is to develop a parameterization for the final number of ice crystals formed for aircraft with hydrogen combustion, suitable for implementation in GCMs and other large-scale contrail models. Specifically, we seek a functional relationship of the form
where aatmosphere denotes a set of variables characterizing the background atmosphere (e.g., ambient temperature), aaerosol represents properties of ambient aerosols (number concentration, size distribution and solubility) and aaircraft includes aircraft-related parameters (e.g., engine size).
Our objective is to identify a functional relationship that balances simplicity with physical fidelity. In other words, we aim to capture the impact of the key processes that govern ice crystal formation in a form that is simple enough to be easily applied in other models (level of complexity, computing time, ease of implementation). In Parts 1 and 2 of a trilogy of papers, we systematically explore a broad parameter space and address aspects that have not been explored before to gain a deep insight into the physical processes influencing the ice crystal formation. This allows us to select the set of variables that constitute the inputs to the parameterization of Nice,f.
While a previous Nice,f parameterization of contrail formation (Kärcher et al., 2015) used a first-principles-based concept, the current work across Parts 1 to 3 employs a hybrid approach. It combines a data-driven advanced regression method to fit a multidimensional database of contrail formation simulations with analytical scaling relations. To keep the number of dimensions in the simulation database as small as possible, we identify conditions under which the sensitivity to specific variables is negligible, and also employ analytical scaling relations derived from sensitivity simulations.
In Part 1, we focus on the roles of atmospheric variables aatmosphere and aerosol properties aaerosol. Aircraft-related parameters aaircraft are addressed in Part 2. The final parameterization, synthesizing insights from Parts 1 and 2, will be presented in Part 3.
In the current study, we first provide background information on contrail formation for the hydrogen combustion case (Sect. 2.1) and on the properties of ambient aerosol particles (Sect. 2.2), followed by a short review of the contrail formation model employed in the study (Sect. 2.3). This model is then used to investigate further (micro-)physical aspects that were not addressed in a previous publication by Bier et al. (2024). This includes the potential role of coarse mode particles in the contrail formation process (Sect. 3.1.1), a suitable scaling relation capturing the influence of multiple co-existing aerosol populations on the number of ice crystals (Sect. 3.1.2) and an investigation of the potential importance of the homogeneous droplet nucleation process (Sect. 3.2). We then present a large data set of simulations systematically scanning the relevant parameter space (Sect. 3.3) before we discuss the generality and limitations of our results and their relation to conventional kerosene contrails (Sect. 4). The study concludes with a discussion of our findings in the light of the design of a Nice,f parameterization (Sect. 5).
2.1 Contrail formation for the hydrogen combustion case
During the jet phase, the mixing of the hot and humid exhaust (called the plume) with cold ambient air can lead to transient water supersaturation for suitable ambient conditions. In the absence of microphysical processes, the partial pressure of water vapor in the plume and the plume temperature evolve along the so-called mixing line (Fig. 1), whose slope can be determined by
In Eq. (2), EIv is the mass-specific water vapor emission index, Q the combustion heat (lower calorific value), cp is the specific heat capacity at constant pressure, pa the ambient pressure, ϵ=0.622 the ratio of molar masses of dry air and water vapor and η the overall efficiency of propulsion (Schumann, 1996). The slope of the mixing line influences the Schmidt-Appleman threshold temperature (Schmidt, 1941; Appleman, 1953; Schumann, 1996). The Schmidt-Appleman threshold temperature ΘG is defined as the ambient temperature for which the mixing line just touches the saturation curve over water for a given ambient relative humidity over water RHwat,a (Fig. 1). (Note that in some previous studies, e.g., Kärcher et al., 2015 and Ponsonby et al., 2025, ΘG denotes the threshold temperature assuming ambient air at water saturation (RH). Here, it refers to the threshold temperature for the actual ambient relative humidity, following the naming convention of Bier et al., 2024.) If the ambient temperature is below ΘG, transient water supersaturation is generated during the mixing process and plume particles may activate into liquid droplets.
Burning hydrogen instead of kerosene results in a higher energy-specific water vapor emission index of about 2.6 (Schumann, 1996; Bier et al., 2024), thus leading to a steeper slope of the mixing line (Fig. 1). This steeper slope leads to higher and longer-lasting supersaturations compared to conventional kerosene combustion for the same ambient conditions, influencing the contrail formation process (Bier et al., 2024). In particular, the formation of ice crystals is limited by the homogeneous freezing temperature of supercooled droplets, which is typically lower than the classical Schmidt-Appleman threshold temperature in the hydrogen combustion case (Fig. 1). Nevertheless, the extent to which the ambient temperature is below the Schmidt-Appleman threshold temperature still plays an important role, as it determines both the maximum plume supersaturation and the duration of supersaturated conditions, thereby controlling the activation of aerosol particles into liquid droplets.
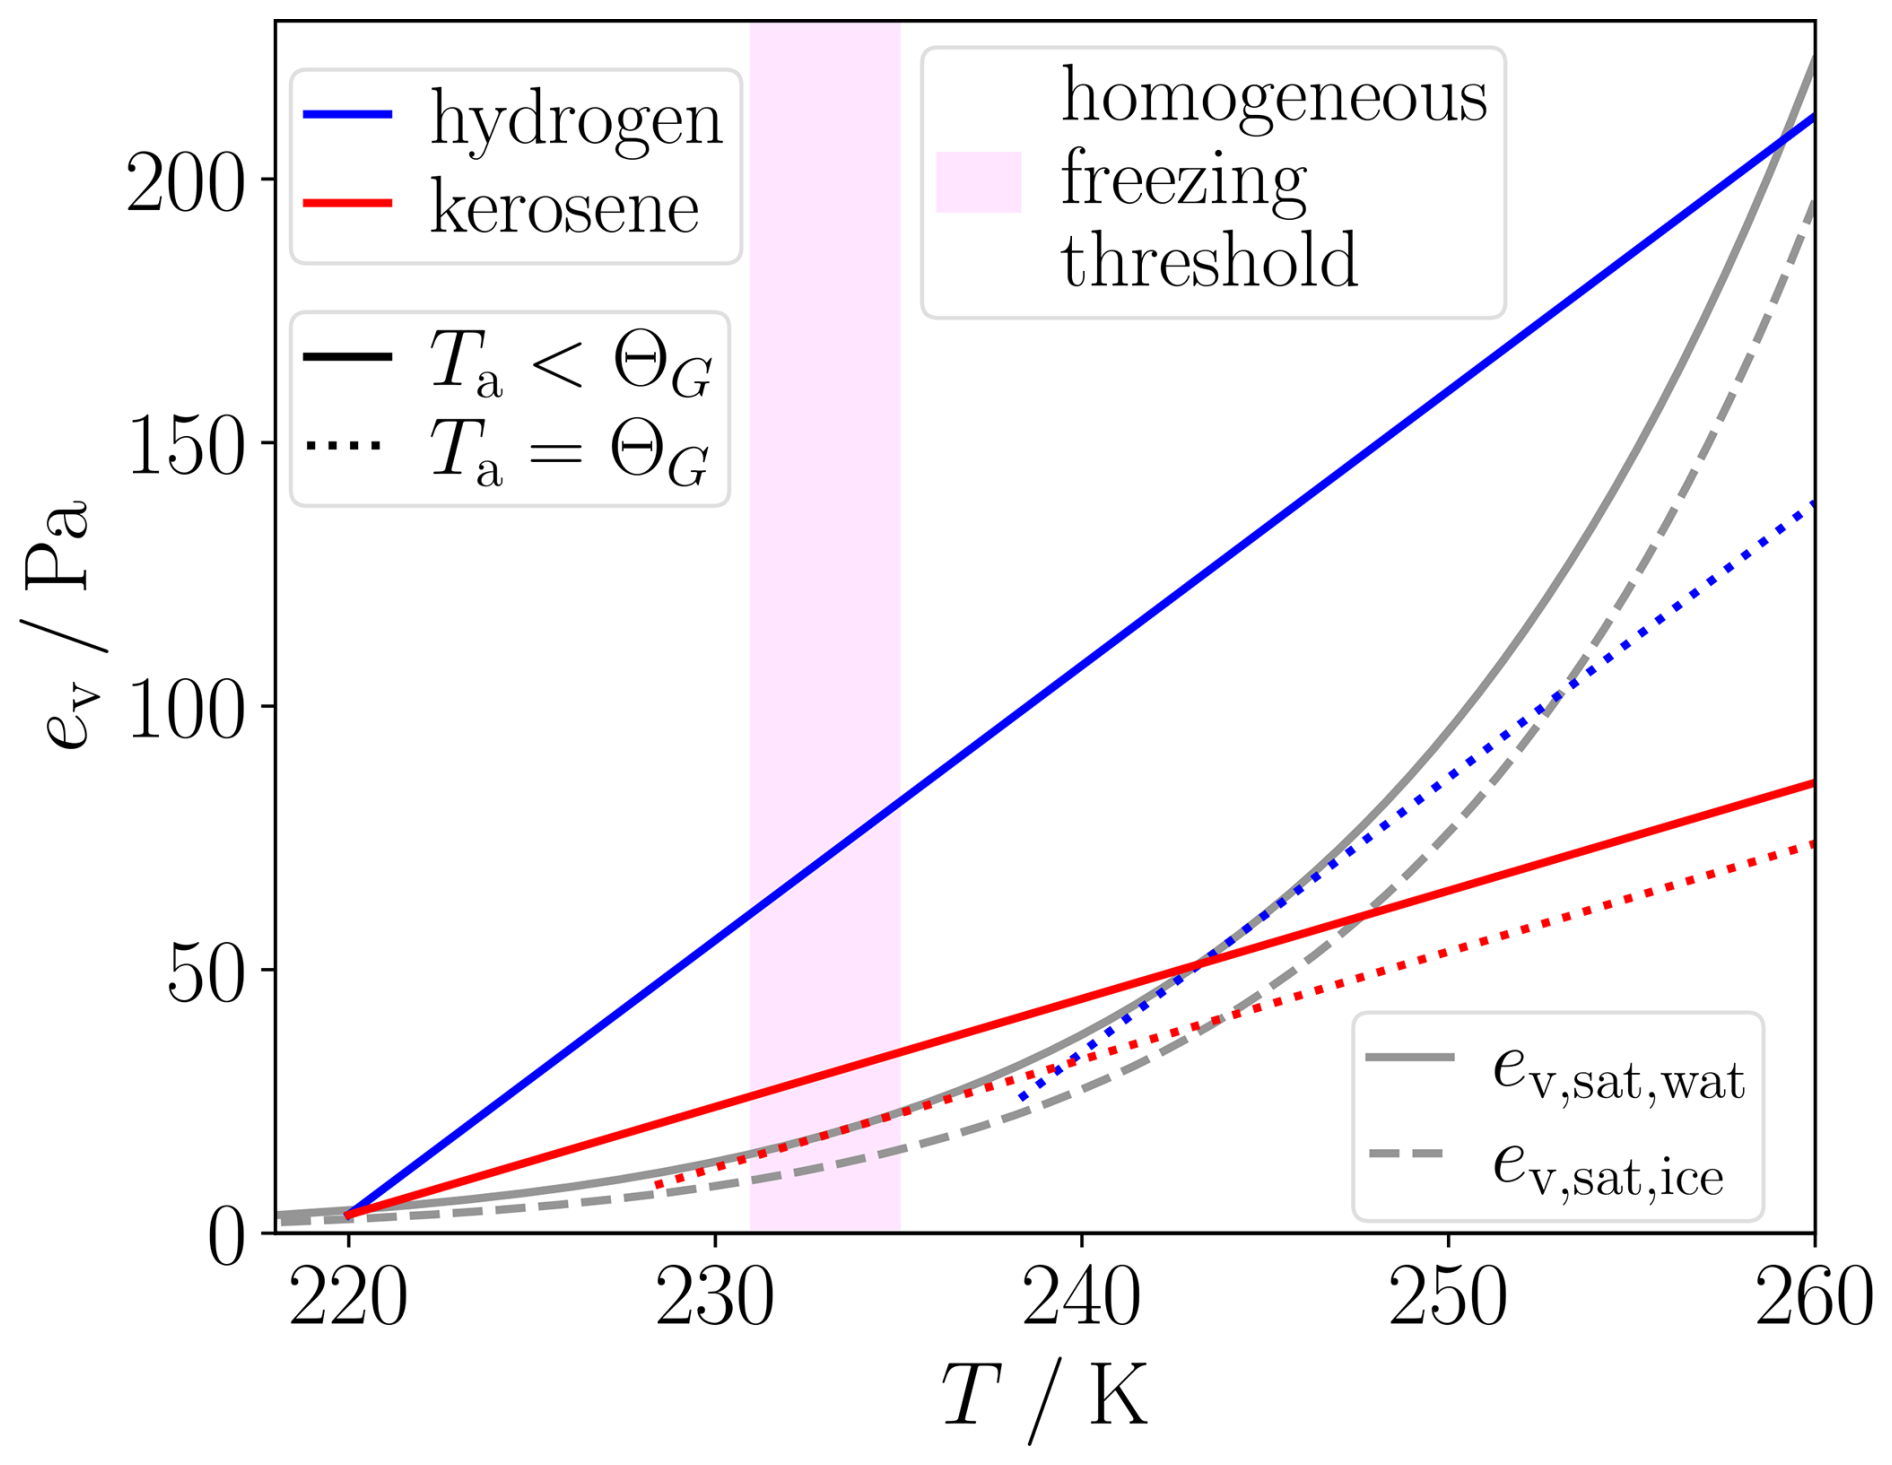
Figure 1Mixing lines (partial pressure of water vapor in the plume ev vs plume temperature T) are depicted for both hydrogen and kerosene combustion cases for the ambient pressure pa=260 hPa, ambient relative humidity over water RH and overall efficiency of propulsion η=0.4. Shown are threshold cases with ambient temperatures Ta=ΘG such that the mixing line just touches the saturation curve over water for the given RHwat,a value. Additionally, cases with a lower ambient temperature of Ta=220 K are displayed. Moreover, the range of homogeneous freezing temperatures for supercooled droplets is indicated.
For conventional kerosene combustion, soot particles are the dominant condensation nuclei for liquid droplet activation, with subsequent freezing into ice crystals (Kärcher and Yu, 2009; Kleine et al., 2018). In addition, volatile particles originating from condensable gaseous species (sulfuric acid, nitric acid, organics) (Kärcher et al., 2000) may contribute to ice crystal formation at high supersaturations, i.e., at low ambient temperatures. A recent study by Yu et al. (2024) hints at the importance of the sulfur content in the fuel for volatile particle formation. Soot particles and sulfur are absent in the hydrogen combustion case. Therefore, other particles acting as condensation nuclei may contribute significantly to ice crystal formation. In this study, we assume that the ice crystals form on entrained ambient aerosols. To date, it is unclear whether volatile particles originating from emitted NOx with associated formation of nitric acid or from lubrication oil (Ungeheuer et al., 2022; Ponsonby et al., 2024; Zink et al., 2025) are abundant enough at cruise altitude to dominate ice crystal formation. Due to the higher supersaturations encountered in the hydrogen combustion case, an additional pathway to ice crystal formation could be homogeneous droplet nucleation (HDN). HDN is the process where small droplets form out of the vapor phase without any condensation nucleus involved. For this process, high relative humidities (≳500 %) are a prerequisite (Wölk and Strey, 2001). Assuming the exhaust air is particle-free and the HDN process is negligible, entrained ambient aerosols are the only precursors of the ice crystal formation. Bier et al. (2024) showed that, at the same ambient temperature and pressure and for typical aerosol number concentrations (Sect. 2.2), the resulting ice crystal number is reduced by roughly one to two orders of magnitude compared to soot-rich kerosene combustion cases.
2.2 Properties of ambient aerosol
Aerosol particles in the atmosphere are typically classified into four modes based on particle diameter (Petzold and Kärcher, 2012): nucleation mode (diameter ≲ 20 nm), Aitken mode (∼ 20–100 nm), accumulation mode (∼ 100–1000 nm), and coarse mode (≳ 1 µm). Nucleation mode particles form by gas-to-particle conversion, where supersaturated vapors (e.g., sulfuric acid, ammonia, nitric acid, and low-volatility organic compounds) nucleate homogeneously or on existing ions (Yu et al., 2010a). Sources of these vapors in the upper troposphere (UT) include both natural and anthropogenic emissions, which are transported from lower altitudes to the UT by deep convection or large-scale atmospheric lifting (e.g., Hermann et al., 2003). Another direct source is aircraft emissions (e.g., Righi et al., 2021, 2023).
Aitken mode particles form by the growth of nucleation mode particles via condensation of vapors and coagulation of smaller particles. Some Aitken particles can also originate directly from combustion sources, such as aviation soot. Growth of Aitken particles via continued condensation and coagulation leads to the formation of accumulation mode particles. The direct contribution of aircraft emissions to the accumulation mode is typically small (Petzold et al., 1999). Unlike secondary aerosols that originate from gas-to-particle conversion, coarse mode particles are mechanically-induced primary aerosols (e.g., sea salt, dust, volcanic ash), which are transported to the UT mainly by deep convection or volcanic eruptions.
The various chemical components, ranging from highly soluble components like sulfuric acid or inorganic salts to weakly/insoluble particles like freshly emitted soot, leads to a wide range of aerosol particle solubilities (Kaiser et al., 2019). The solubility of an aerosol particle depends on its mixing state (Riemer et al., 2019). Both modeled and observed total aerosol number concentrations in the UT exhibit strong seasonal and geographic variability (Petzold et al., 2002; Minikin et al., 2003; Hermann et al., 2003; Borrmann et al., 2010; Kaiser et al., 2019; Brock et al., 2021). These studies report nucleation and Aitken mode particle number concentrations in the UT ranging from ∼ 102 to ∼ 104 cm−3. Number concentrations of accumulation mode particles are typically lower, ranging from ∼ 101 to ≲ 103 cm−3. Due to the larger size, however, the accumulation mode typically contains more mass than the nucleation and Aitken modes. Except in extreme scenarios, such as volcanic eruptions, coarse mode particle concentrations in the UT are generally several orders of magnitude lower, with number concentrations typically well below 1 cm−3 (Kaiser et al., 2019; Beer et al., 2020; Brock et al., 2021).
The strong influence of anthropogenic emissions on aerosol number concentrations in the UT introduces additional variability in future projections, as a potential reduction in emissions could result in a cleaner atmosphere. Such a reduced aerosol load was observed during the BLUESKY campaign during the COVID-19 lockdown (Voigt et al., 2022).
2.3 LCM box model
This section serves as a short review of the used model. Detailed explanations and underlying equations can be found in Bier et al. (2022, 2024).
The Lagrangian Cloud Module (LCM) was first described in Sölch and Kärcher (2010) and uses a particle-based approach (also known as super-droplet method, Shima et al., 2009; Grabowski et al., 2019). Two variants of LCM exist: The first is fully coupled to the fluid solver EULAG and was used to simulate natural cirrus clouds (Sölch and Kärcher, 2011; Unterstrasser et al., 2017b) as well as contrails during the vortex phase (Unterstrasser and Sölch, 2010; Unterstrasser, 2014) and the dispersion phase (Unterstrasser et al., 2017a). The second LCM variant is a box model version with simplified prescribed dynamics. It was for example used to evaluate the numerical implementation and convergence of particle-based algorithms of depositional growth and nucleation (Unterstrasser and Sölch, 2014) and collisional growth (Unterstrasser et al., 2017c, 2020).
Bier et al. (2022, 2024) expanded the LCM box model version by contrail formation physics on soot and ambient aerosols, respectively. In this version, aerosol particles and hydrometeors (liquid droplets and ice crystals) are represented by simulation particles (SIPs). Each SIP represents a certain number of physical particles with identical properties. Each SIP carries information such as particle type, particle phase (dry, liquid, or ice), radius, and the associated liquid or ice water mass.
In this box model version, the dilution is either analytically prescribed or obtained from a previously performed CFD simulation. The dilution governs plume expansion, cooling, and humidity evolution. Moreover, the dilution state determines the total number of entrained ambient aerosol particles for a given ambient aerosol number concentration. The contrail microphysics is then calculated in a time-resolved manner in an offline approach without feedback on the plume dynamics. The microphysical processes considered include hygroscopic growth of aerosol particles and activation into water droplets (described by κ-Köhler theory, Petters and Kreidenweis, 2007), condensational droplet growth, homogeneous freezing of supercooled droplets, depositional ice crystal growth, and latent heat release/consumption during phase transitions. The employed parameterization for homogeneous freezing (described in Appendix B of Bier et al., 2024) accounts for the dependence of the freezing process on droplet water volume and cooling rate (Kärcher et al., 2015), as well as for freezing-point depression caused by dissolved solutes (Koop et al., 2000; O and Wood, 2016). The employed parameterization shows a strong decrease in the freezing fraction toward 235 K, consistent with laboratory experiments (e.g., Murray et al., 2010; O and Wood, 2016; Tarn et al., 2021; Ponsonby et al., 2024). We therefore apply a temperature threshold at 235 K and assume that supercooled droplets do not freeze into ice crystals for Ta≥235 K.
In this study, we use the same box model version with its numerical setup as Bier et al. (2024) to simulate contrail formation on entrained ambient aerosols for hydrogen combustion. As dilution data, we use 1000 trajectories, which are a representative merged subset from the 25000 FLUDILES trajectories. These trajectories were obtained from a large-eddy simulation of the exhaust plume evolution downstream of a CFM56 engine representative for an A340-300 aircraft (Vancassel et al., 2014). Each trajectory represents a fraction of the plume volume/mass. The box model is run for each trajectory separately and results are presented as sums over all trajectories for extensive quantities (e.g., total ice crystal number) and as mass-weighted averages for intensive quantities (e.g., plume temperature).
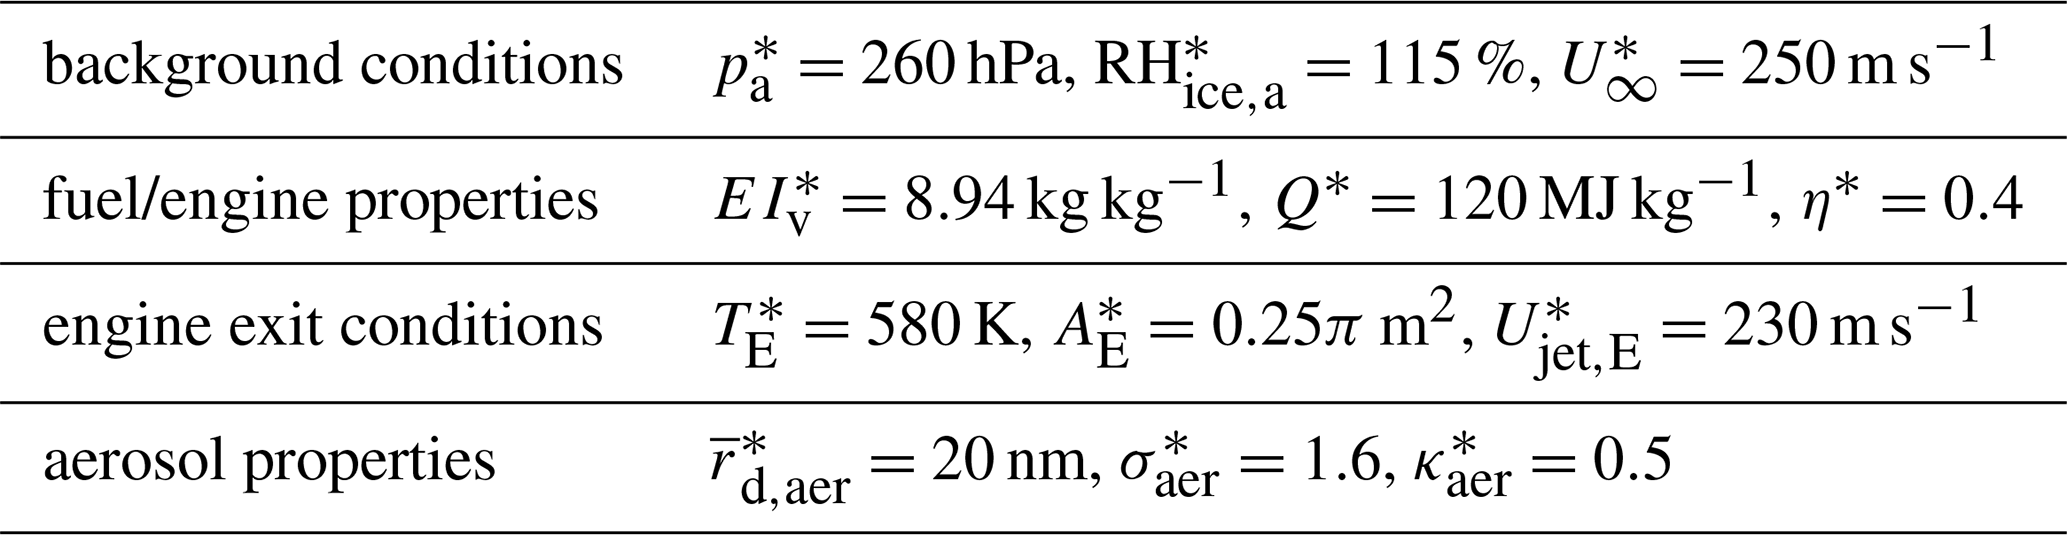
We use the set of baseline values listed in Table 1 (denoted by the asteriks), which are prescribed in the model setup if not stated differently. The prescribed water vapor emission index and specific combustion heat Q* for hydrogen combustion are fixed throughout the whole study. Other parameters that are not listed in Table 1 (ambient temperature Ta, aerosol number concentration naer) are varied in each subsection of Sect. 3 and their prescribed values are explicitly stated there.
Compared to the setup in Bier et al. (2024), we use a higher value for the overall efficiency of propulsion of (increased from 0.36), reflecting a projection towards more efficient engines. The impact of varying the overall efficiency of propulsion on contrail formation is discussed in detail in Part 2 (Zink and Unterstrasser, 2026) of this paper series. Additionally, we correct a discrepancy made in Bier et al. (2024) regarding the geometric width of the log-normal aerosol size distribution. While a value of σaer=1.6 was reported, the actual value used in their simulations was σaer=1.69 (see Sect. A). Although the exact value of the geometric width has a negligible effect on the results (Fig. A1), we have corrected the bug and now use the true value of σaer=1.6 as reported in our setup.
Table 1Baseline values of ambient pressure , ambient relative humidity RH, aircraft speed , water vapor emission index EI, specific combustion heat Q*, overall efficiency of propulsion η*, exit temperature , exit area , exit excess jet velocity (total jet speed minus aircraft speed), geometric mean radius of aerosol particles , geometric width and hygroscopicity .
3.1 Multiple aerosol populations
As outlined in Sect. 2.2, the ambient aerosol size distribution consists of multiple modes. We introduce the term aerosol population, which refers to a set of aerosol particles characterized by a specific mono-modal size distribution and hygroscopicity. The total aerosol can then be a composition of multiple populations (expressed as a superposition of lognormal size distributions).
Clearly, to obtain a realistic picture of ice crystal formation on ambient aerosols, multiple aerosol populations should be considered. At the same time, this comes at the cost of increased complexity due to the larger number of parameters involved. In this section, we present means of reducing the number of parameters, with emphasis placed on the governing physical processes.
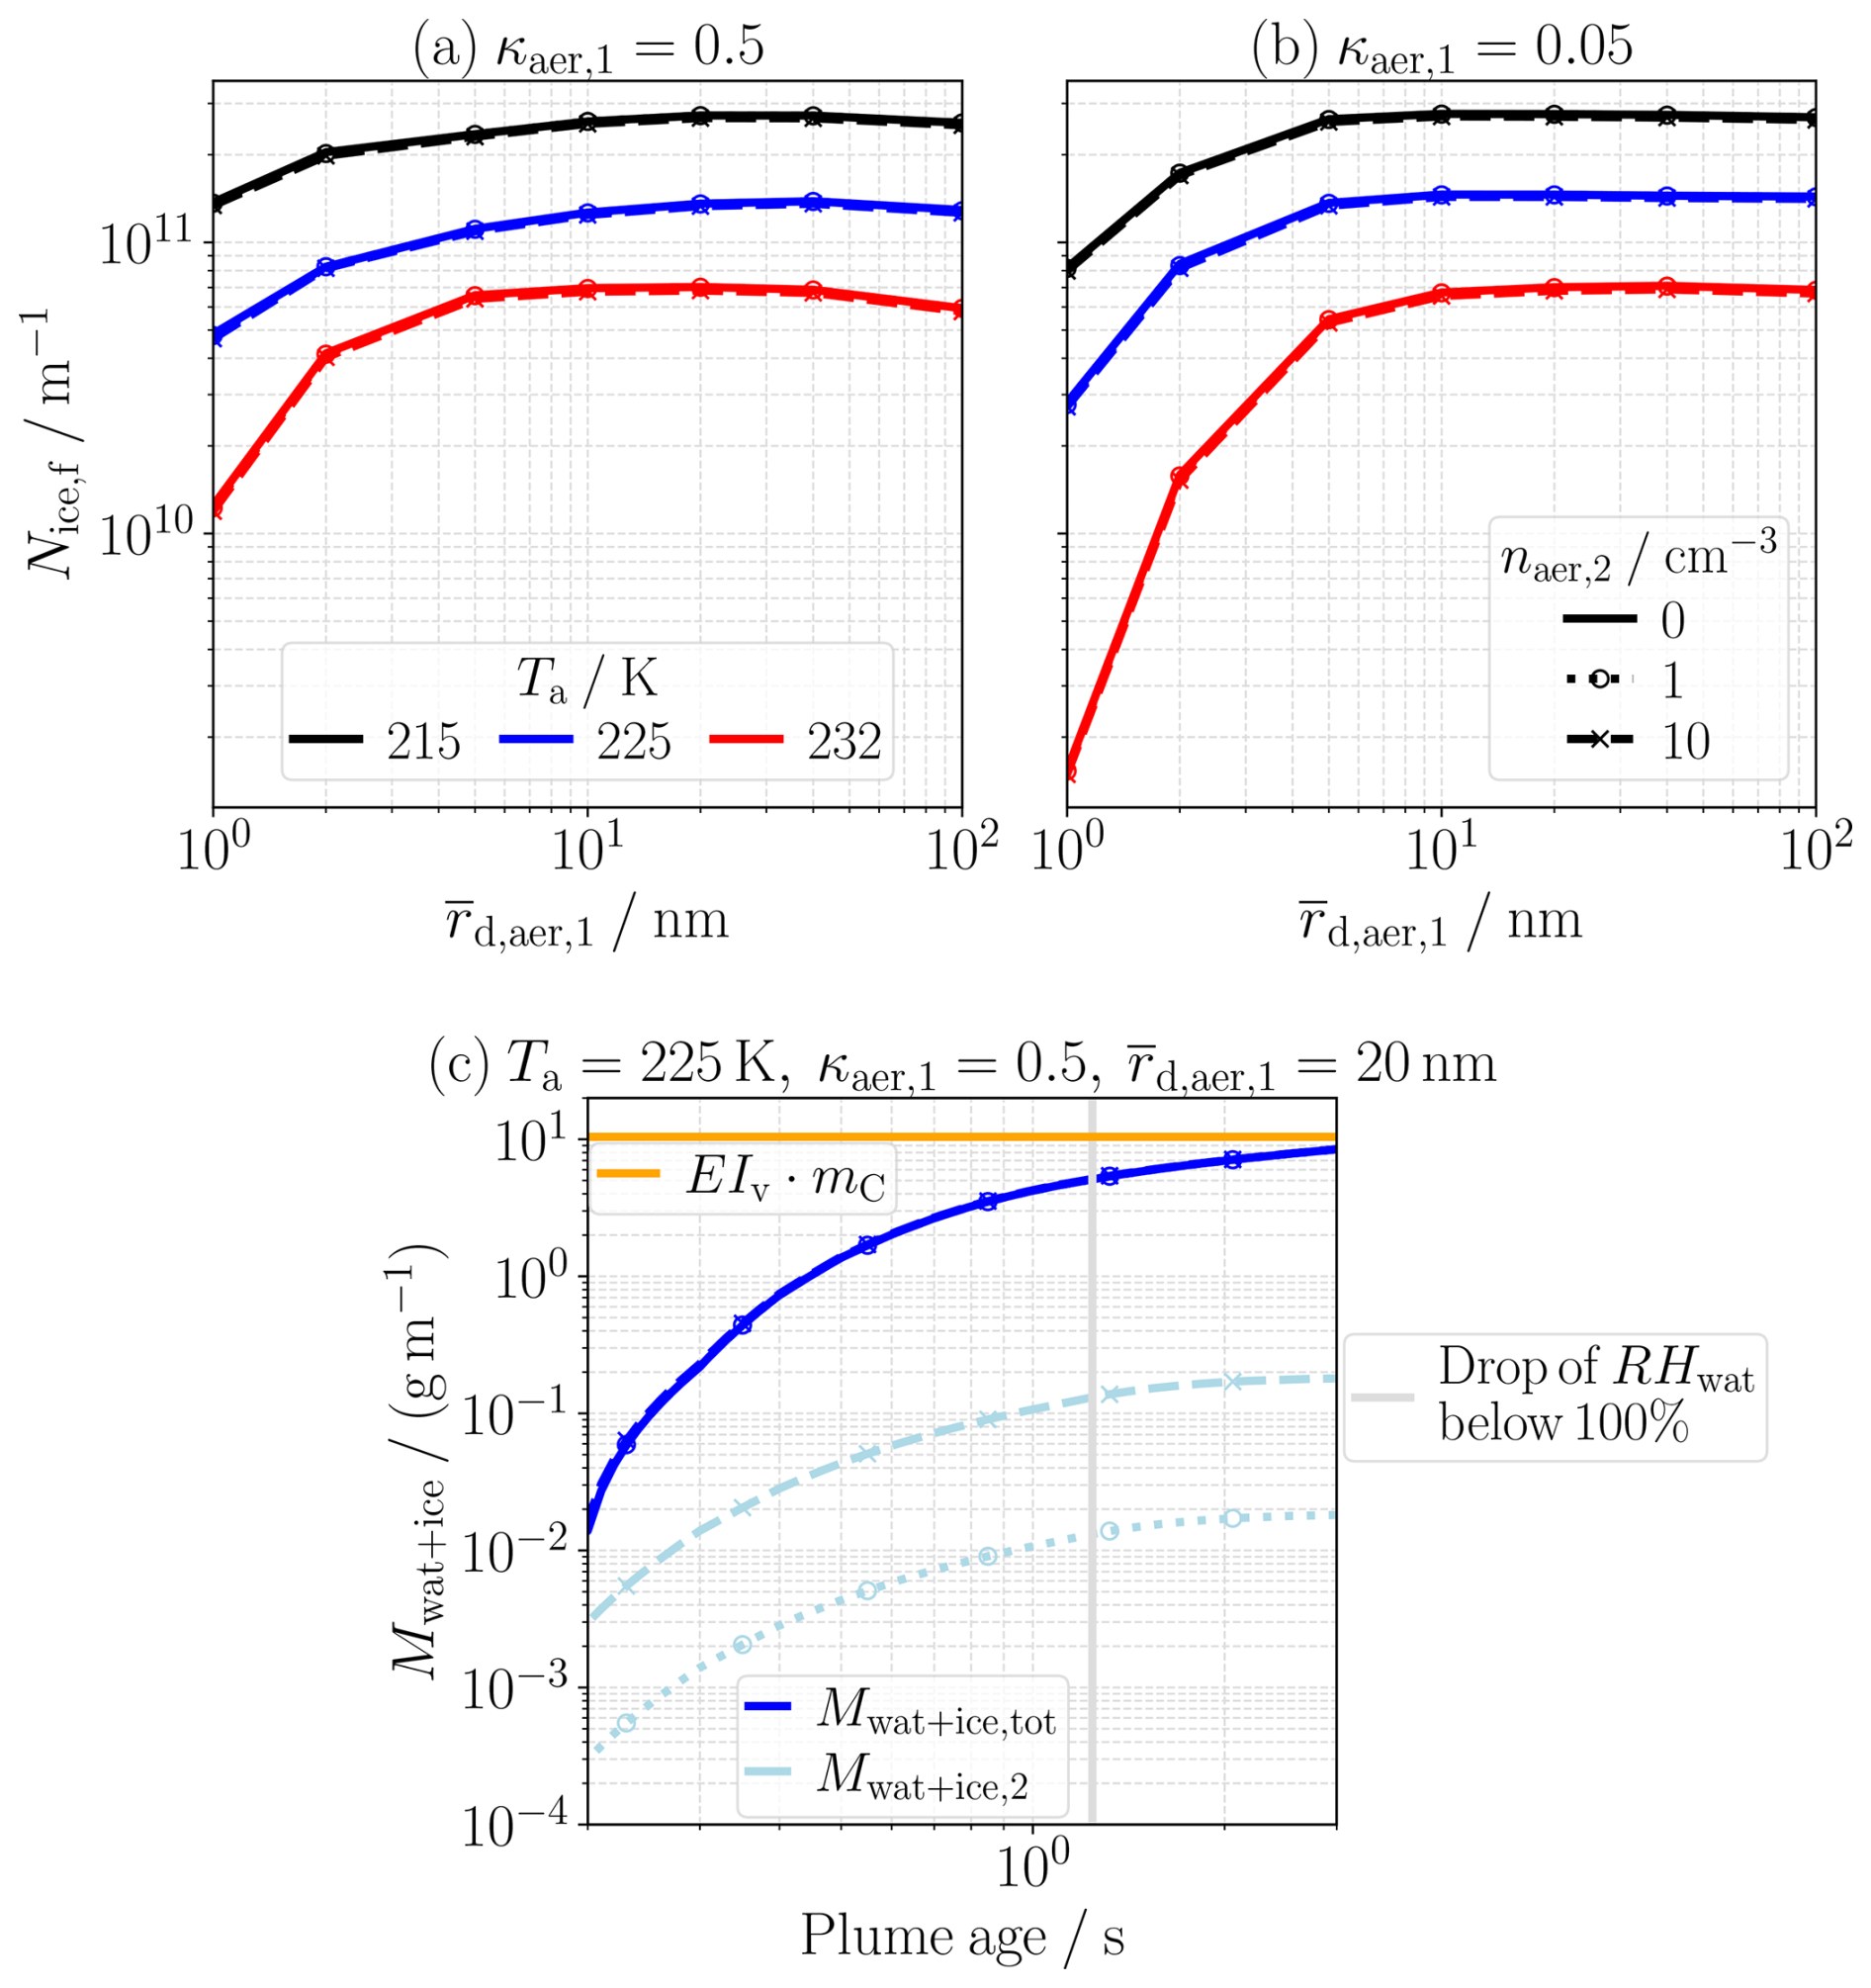
Figure 2(a)–(b) Impact of coarse mode particles ( nm, ) on the final number of ice crystals formed Nice,f. In all simulations, the total aerosol number concentration is cm−3 with varying naer,2 values (different line styles). Shown are results as a function of the geometric mean radius of the smaller aerosol mode for different ambient temperatures Ta (different colors) and different hygroscopicity combinations (panel). (c) Illustrative example of the evolution of depleted water-vapor mass on droplets and ice crystals. Shown are both the total depleted mass and the portion attributed to coarse-mode particles. The orange horizontal line marks the emitted water-vapor mass corresponding to the fuel consumption of mC≈1.17 g m−1. The vertical gray line indicates the time at which the plume relative humidity with respect to water falls below 100 %, marking the approximate end of droplet activation.
3.1.1 Impact of coarse mode particles
As written in Sect. 2.2, coarse mode particles are typically several orders of magnitude fewer in number compared to coexisting nucleation, Aitken, or accumulation mode particles. Due to their low abundance, a significant direct contribution to the total ice crystal number is not expected. However, due to their large size and thus low Kelvin barrier, they can activate into water droplets at lower supersaturations. This raises the question of whether their earlier activation could indirectly influence the activation behavior of smaller particles by changing the water vapor concentration within the plume and therefore the final number of ice crystals formed Nice,f (i.e., the number when ice crystal formation is finished).
To investigate this, we performed simulations using a bimodal size distribution that includes a coarse mode with a geometric mean radius of nm, and a smaller mode with geometric mean radius (Fig. 2). The coarse mode is assumed to be weakly soluble (hygroscopicity ), while the smaller mode is considered either highly soluble () or weakly soluble (). Simulations were performed with a total aerosol number concentration of cm−3, comparing scenarios with cm−3 against those without coarse mode particles ( cm−3).
Across all scenarios, the presence of coarse mode particles does not result in a noticeable change in the ice crystal number (Fig. 2). Due to their low relative abundance and the continuous entrainment of aerosols into the plume over time, they are not abundant enough to significantly deplete the water vapor at an early stage to hinder the smaller-sized particles in their activation. Indeed, the amount of water vapor taken up by the few coarse mode particles is negligible compared to the total water vapor available in the plume (emitted water-vapor mass plus entrained ambient moisture) during droplet and ice crystal formation (Fig. 2c). This low importance of coarse mode particles was also found for other values of naer,tot, κaer,2 and dilution speed (not shown). Therefore, if the coarse mode particles are two or more orders of magnitude fewer in number than another particle mode – as is typically the case in the UT (see Sect. 2.2) – we can safely neglect them in the ice crystal formation process.
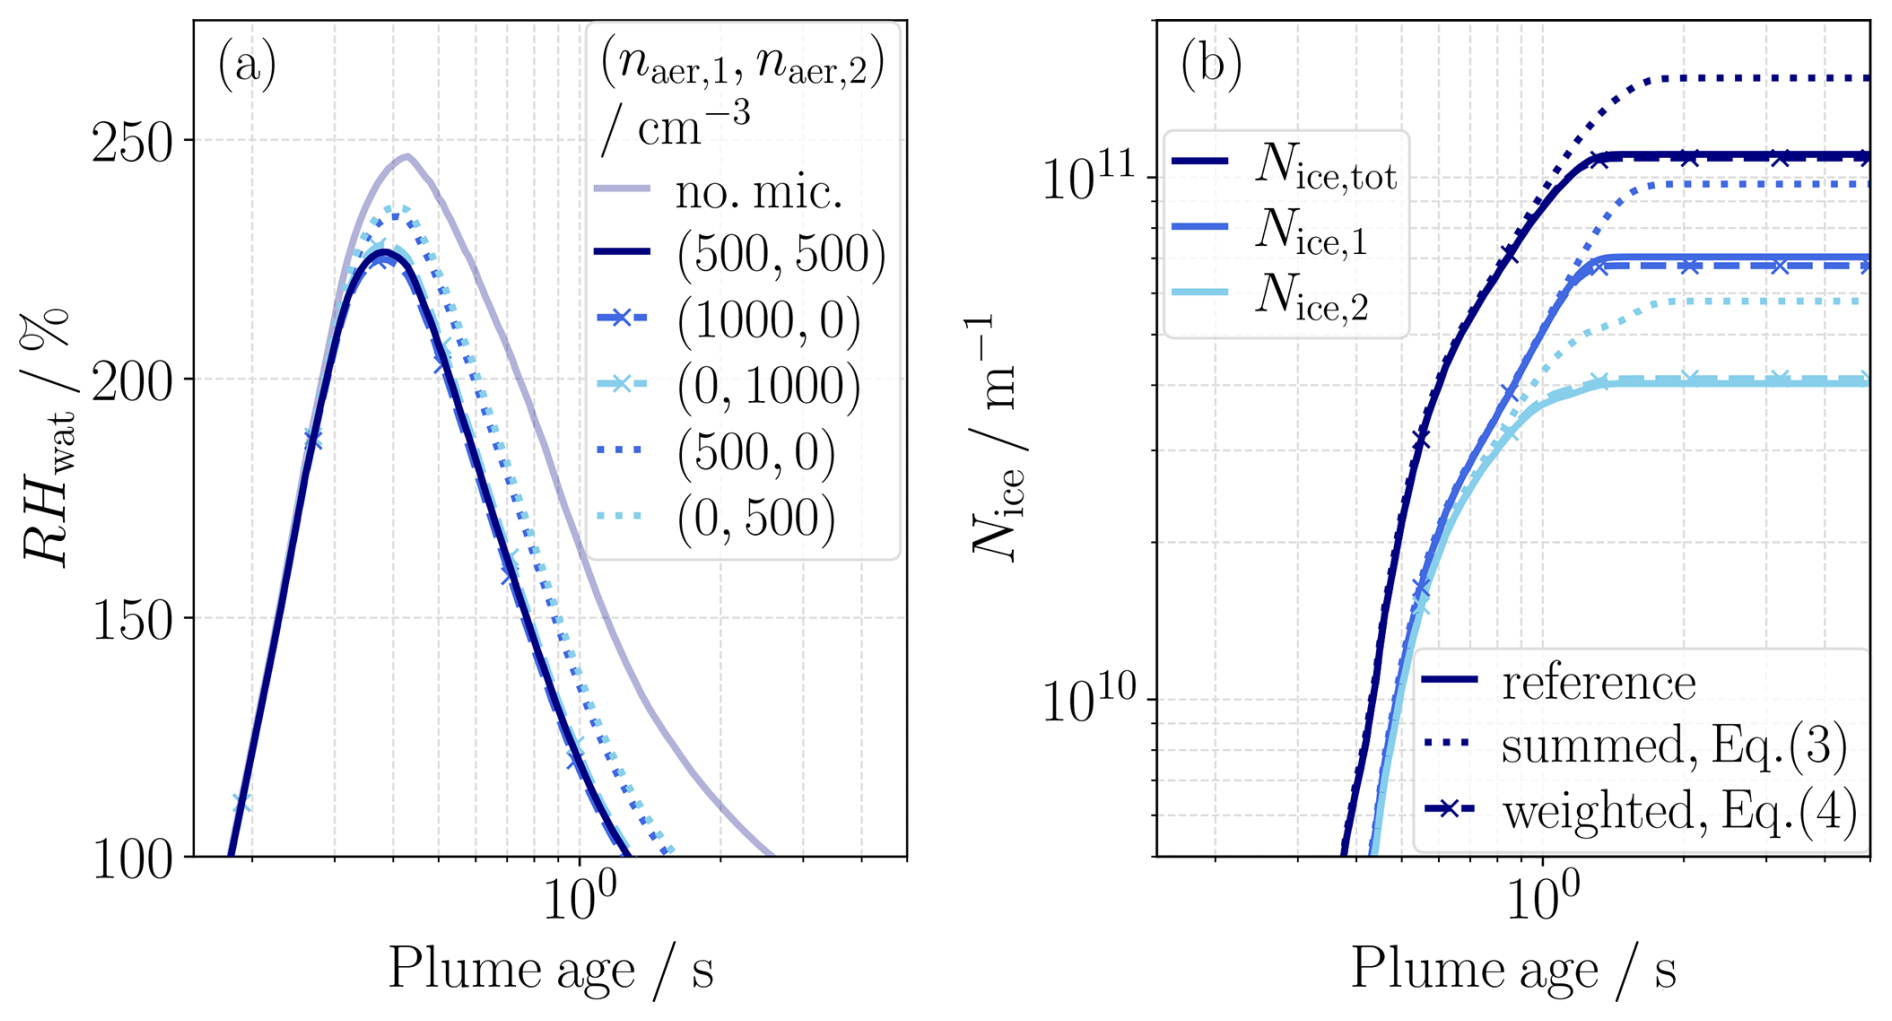
Figure 3Evolution of (a) plume relative humidity RHwat and (b) ice crystal number Nice at an ambient temperature of Ta=225 K for a case with two aerosol populations ( cm−3, , nm, nm). (a) Shown is the RHwat evolution from a simulation excluding microphysical water-vapor depletion (transparent line), together with the evolution when both aerosol populations are included simultaneously (dark-blue line). Also shown are simulation results including only one population at a time, using its respective properties and either its actual number concentration or the total number concentration (different colors and linestyles). (b) Displayed are the total ice crystal number Nice,tot and the contributions from the two aerosol populations, Nice,1 and Nice,2. Additionally, the approximations obtained from Eqs. (3) and (4) are shown.
3.1.2 Scaling relation for multiple aerosol populations
The results in Sect. 3.1.1 show that an aerosol population can be neglected in the ice-crystal formation process when its number concentration is much lower than that of a co-existing population. We now investigate situations in which the number concentrations of co-existing populations are comparable.
We begin with an illustrative example that includes two aerosol populations ( cm−3, , nm, and nm). Water-vapor depletion by activated aerosols alters the evolution of the plume relative humidity RHwat compared to simulations excluding microphysical water-vapor depletion (shown by the difference between the transparent and opaque dark-blue lines in Fig. 3a). The evolution of RHwat is almost the same in simulations where both populations are included simultaneously and in simulations where only one population is included but assigned the total number concentration (Fig. 3a). In contrast, simulations that include only one population with its actual number concentration reach higher RHwat values because the depletion of water vapor that would occur through activation of the second population is not accounted for.
As a consequence, attempting to reproduce the impact of multiple co-existing populations on the final ice crystal number by simply summing
overestimates the actual number of ice crystals formed (Fig. 3b). Here, is the approximated total ice crystal number and is the ice crystal number obtained from a simulation that includes only population i with its respective number concentration naer,i.
In another approach, Bier et al. (2024) attempted to replicate simulations with two co-existing aerosol populations by prescribing a single population with total number concentration and averaged properties (size, hygroscopicity) of the two. Their findings revealed substantial differences from the actual ice crystal number when nucleation-mode particles are involved.
Alternatively, we test a different scaling approach, where we perform separate simulations for each aerosol population i. In each of these simulations, only population i is included, characterized by its log-normal size distribution and hygroscopicity. Instead of using the actual number concentration naer,i of this population, we prescribe the total aerosol number concentration naer,tot. We then apply a weighted-mean approach
where i goes over all aerosol populations. In Eq. (4), is the approximated total ice crystal number and the simulated number of ice crystals formed on population i with assumed total aerosol number concentration naer,tot.
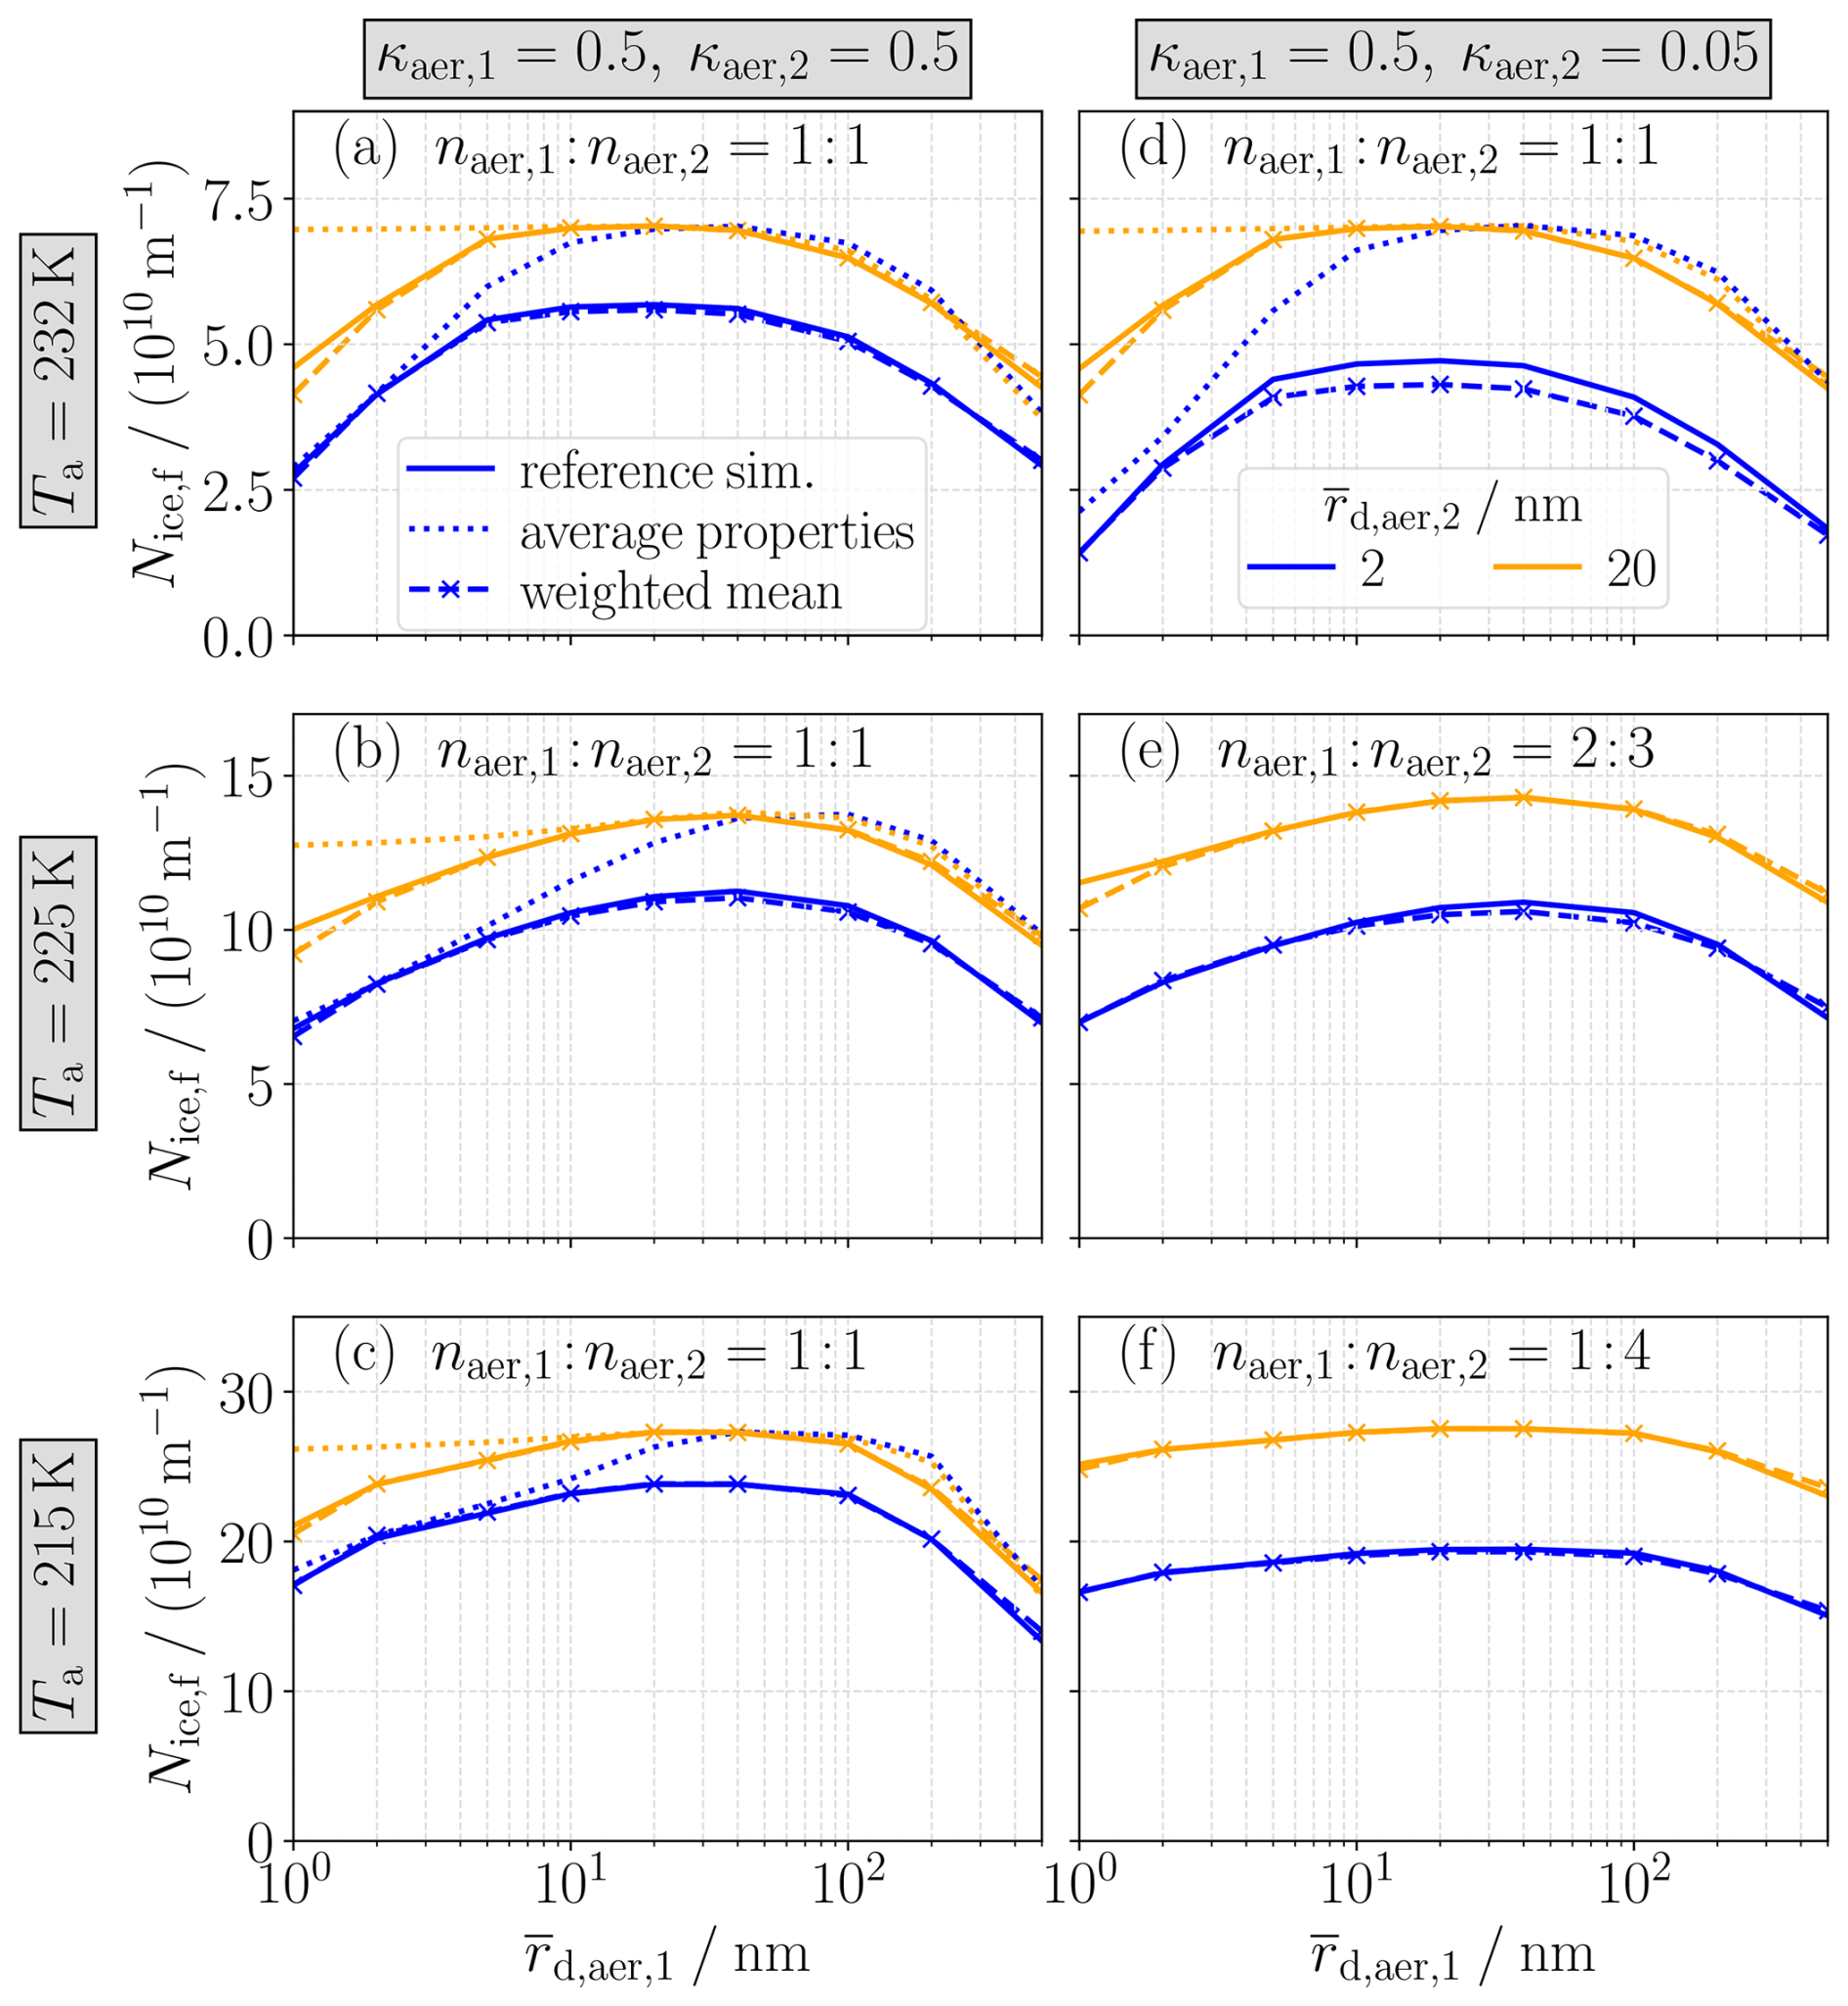
Figure 4Weighted-mean approach for two ambient aerosol populations. Shown is the total number of ice crystals formed Nice,f as a function of the geometric mean radius of the first population . The color of the curves indicates the geometric mean radius of the second population . Each row corresponds to a different ambient temperature Ta and the two columns are for two different combinations of hygroscopicities κaer,1 and κaer,2. Results are shown for a total aerosol number concentration cm−3, the ratio of the two concentrations is displayed in each panel. Reference simulations including both aerosol populations in a single simulation (solid lines) are compared to the weighted-mean approach according to Eq. (4) (dashed lines with marker). For concentration ratios of 1:1, results for simulations including a single aerosol population with average geometric mean radius and average hygroscopicity are displayed additionally (dotted lines).
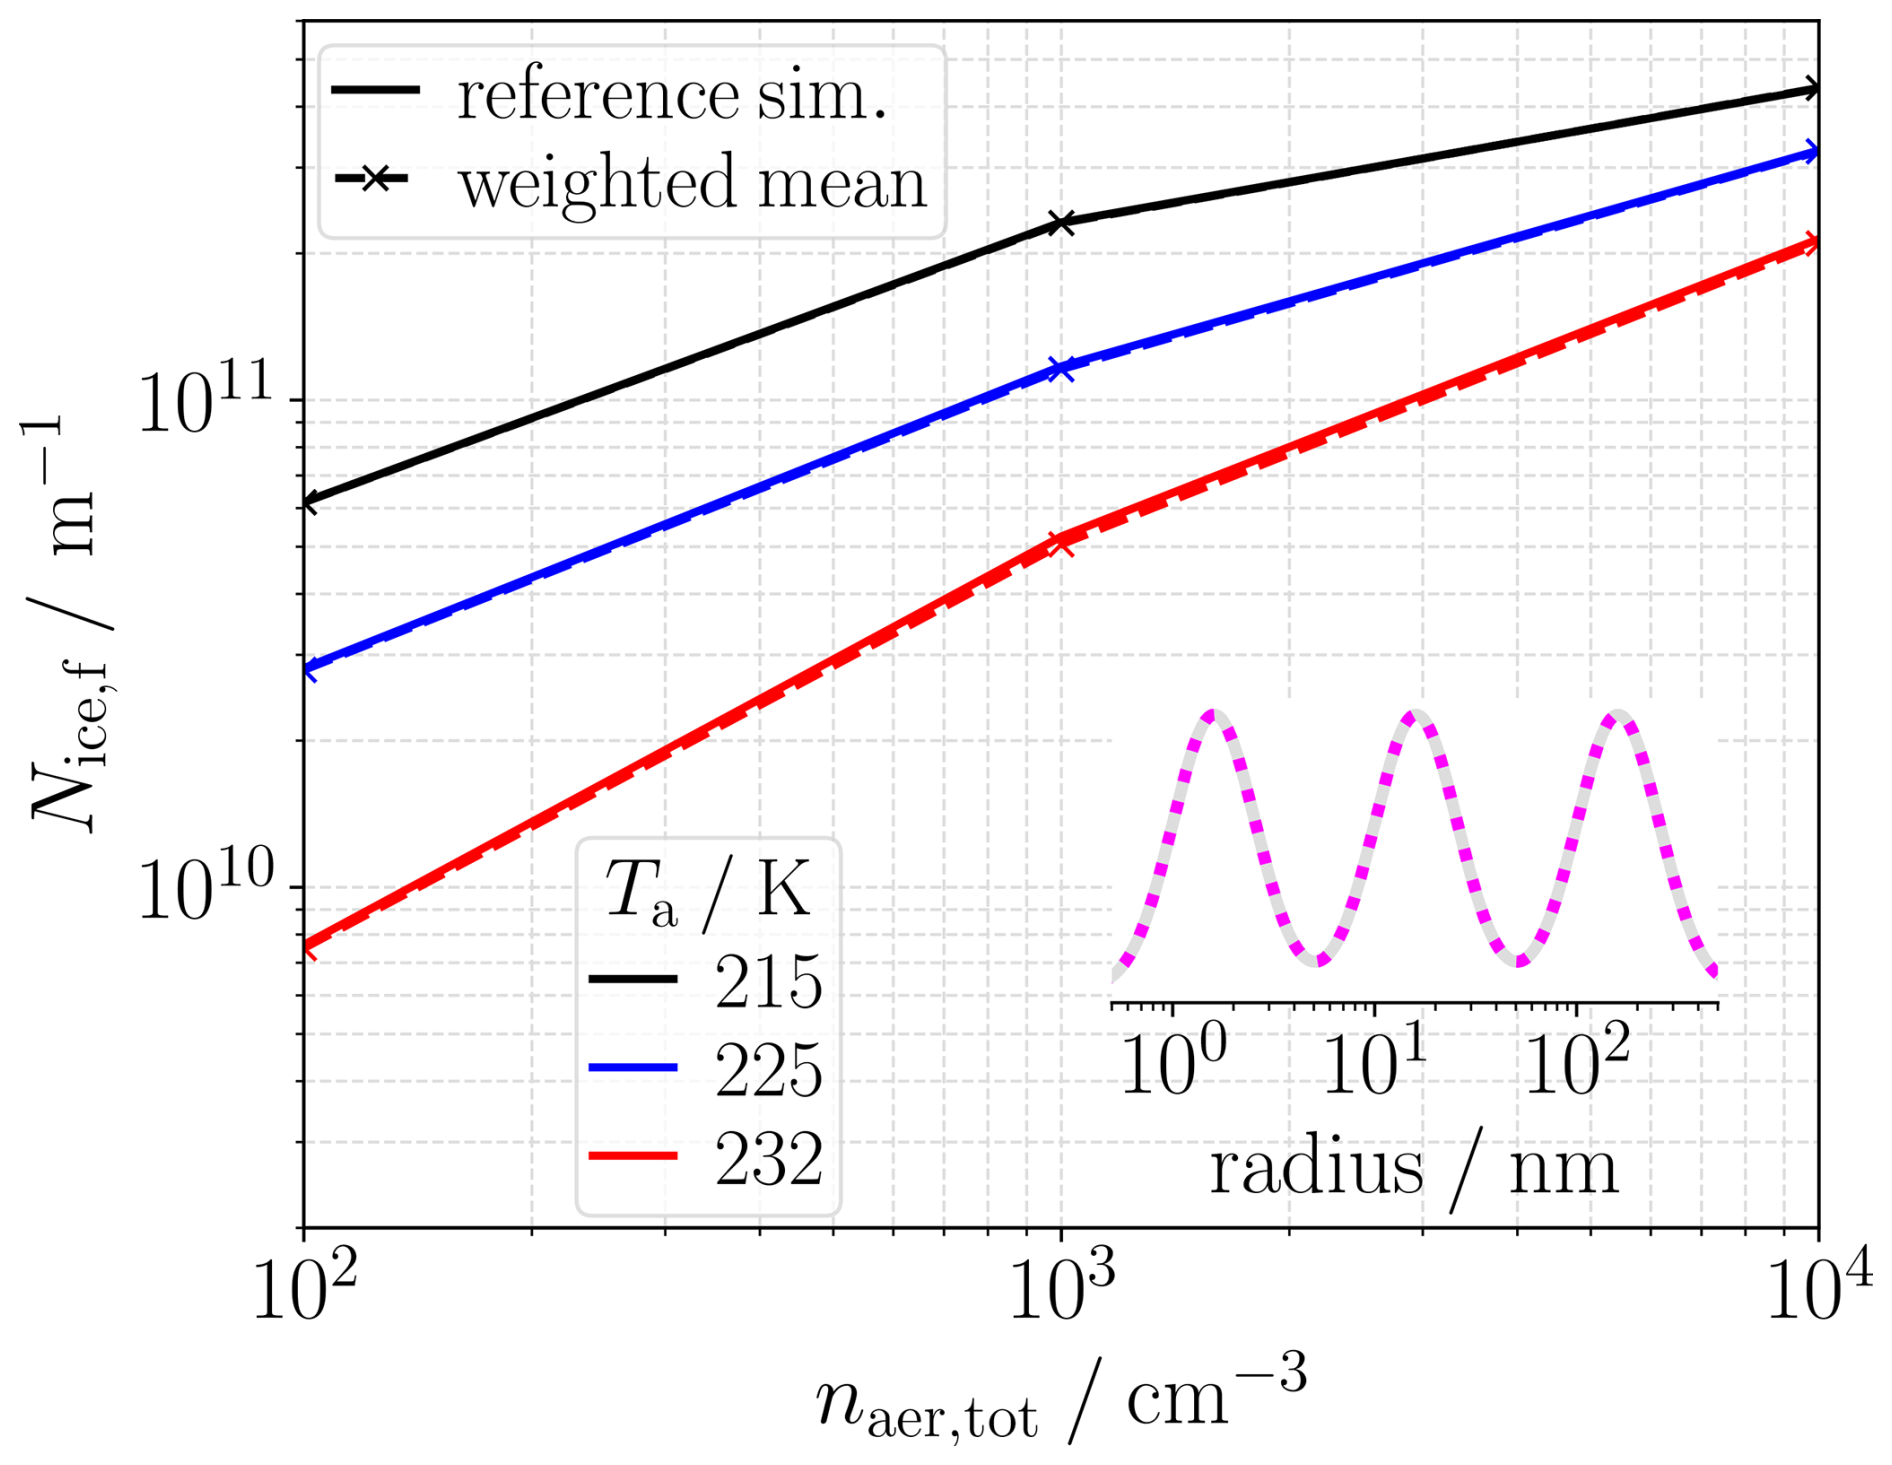
Figure 5Weighted-mean approach for six ambient aerosol populations. Displayed is the final number of ice crystals formed Nice,f as a function of total aerosol number concentration naer,tot for different ambient temperatures Ta. The six populations comprise three geometric mean radii nm each combined with two hygroscopicities (illustrated by the inset; the solid gray and the dotted magenta lines indicate the two hygroscopicities). Each population is assumed to contribute one sixth to the total aerosol number concentration. Reference simulations including all six aerosol populations in a single simulation (solid lines) are compared to the weighted-mean approach according to Eq. (4) (dashed lines with marker).
This weighted-mean approach reasonably reproduces the ice crystal number of the reference simulation in which both aerosol populations are included simultaneously (Fig. 3b). Its success can be attributed to the fact that it is the total number of entrained aerosols that primarily drives the competition for the available water vapor (Fig. 3a). In the hydrogen combustion case, supersaturation levels become sufficiently high for all early entrained aerosol particles – including the nucleation mode particles – to activate into droplets. Toward the end of the supersaturated period, however, the newly entrained small-sized particles do not overcome the Kelvin barrier and therefore do not activate into droplets. As a result, fewer ice crystals eventually form on the nucleation-mode particles (Fig. 3b). Nevertheless, the evolution of plume relative humidity is mainly controlled by the total number of the earlier activated aerosols.
After the illustrative example (Fig. 3), we now explore a broader set of simulations involving two co-existing aerosol populations. We prescribe a total number concentration cm−3 with varying ratios for various combinations of aerosol properties and different ambient temperatures (Fig. 4). We confirm for (as done by Bier et al., 2024) that simulations using a single aerosol population with total number concentration and average properties can reproduce the reference simulations well, except in cases where one geometric mean radius is smaller and the other larger than ∼5 nm (Fig. 4a–d). For the latter cases, the weighted-mean approach strongly reduces the deviations from the reference simulations. The weighted-mean approach works well for equal partitions of the two number concentrations (Fig. 4a–d) as well as for unequal partitions (Fig. 4e–f). In fact, the approach works better the more strongly the two number concentrations differ, as then the contribution of the population with lower concentration becomes less and less important (similarly to the coarse mode particles, Sect. 3.1.1). For the examples shown in Fig. 4, the weighted-mean approach yields a median relative error of 0.74 %, with the errors ranging from a minimum of 0.003 % to a maximum of 9.95 %.
So far, we restricted our analysis to two co-existing aerosol populations and to a fixed total number concentration of cm−3. In the following, we show that the scaling approach (Eq. 4) is generally applicable for multiple co-existing aerosol populations and different total number concentrations naer,tot. To do so, we perform simulations incorporating in total six aerosol populations, obtained by combining three monomodal size distributions (geometric mean radii ) with two hygroscopicities (), such that each population represents a monomodal size distribution with an assigned hygroscopicity. We prescribe different naer,tot with each population assumed to contribute one sixth to the total number concentration. These simulations can be accurately reproduced using the weighted-mean approach (Eq. 4) across all investigated ambient temperatures (Fig. 5), demonstrating the broad applicability of this scaling method. For the examples shown in Fig. 5, the weighted-mean approach yields a median relative error of 0.86 %, with the errors ranging from a minimum of 0.08 % to a maximum of 3.65 %.
The success of the weighted-mean approach – attributed to the fact that the total number of entrained aerosol particles primarily drives water vapor depletion – implies that only the dependence of Nice,f on the properties of a single population needs to be represented. The effect of the co-existence of multiple populations can then be emulated by this approach. This reduces the dimensionality of the parameter space and avoids the curse of dimensionality (Bellman, 1957) without loss of generality.
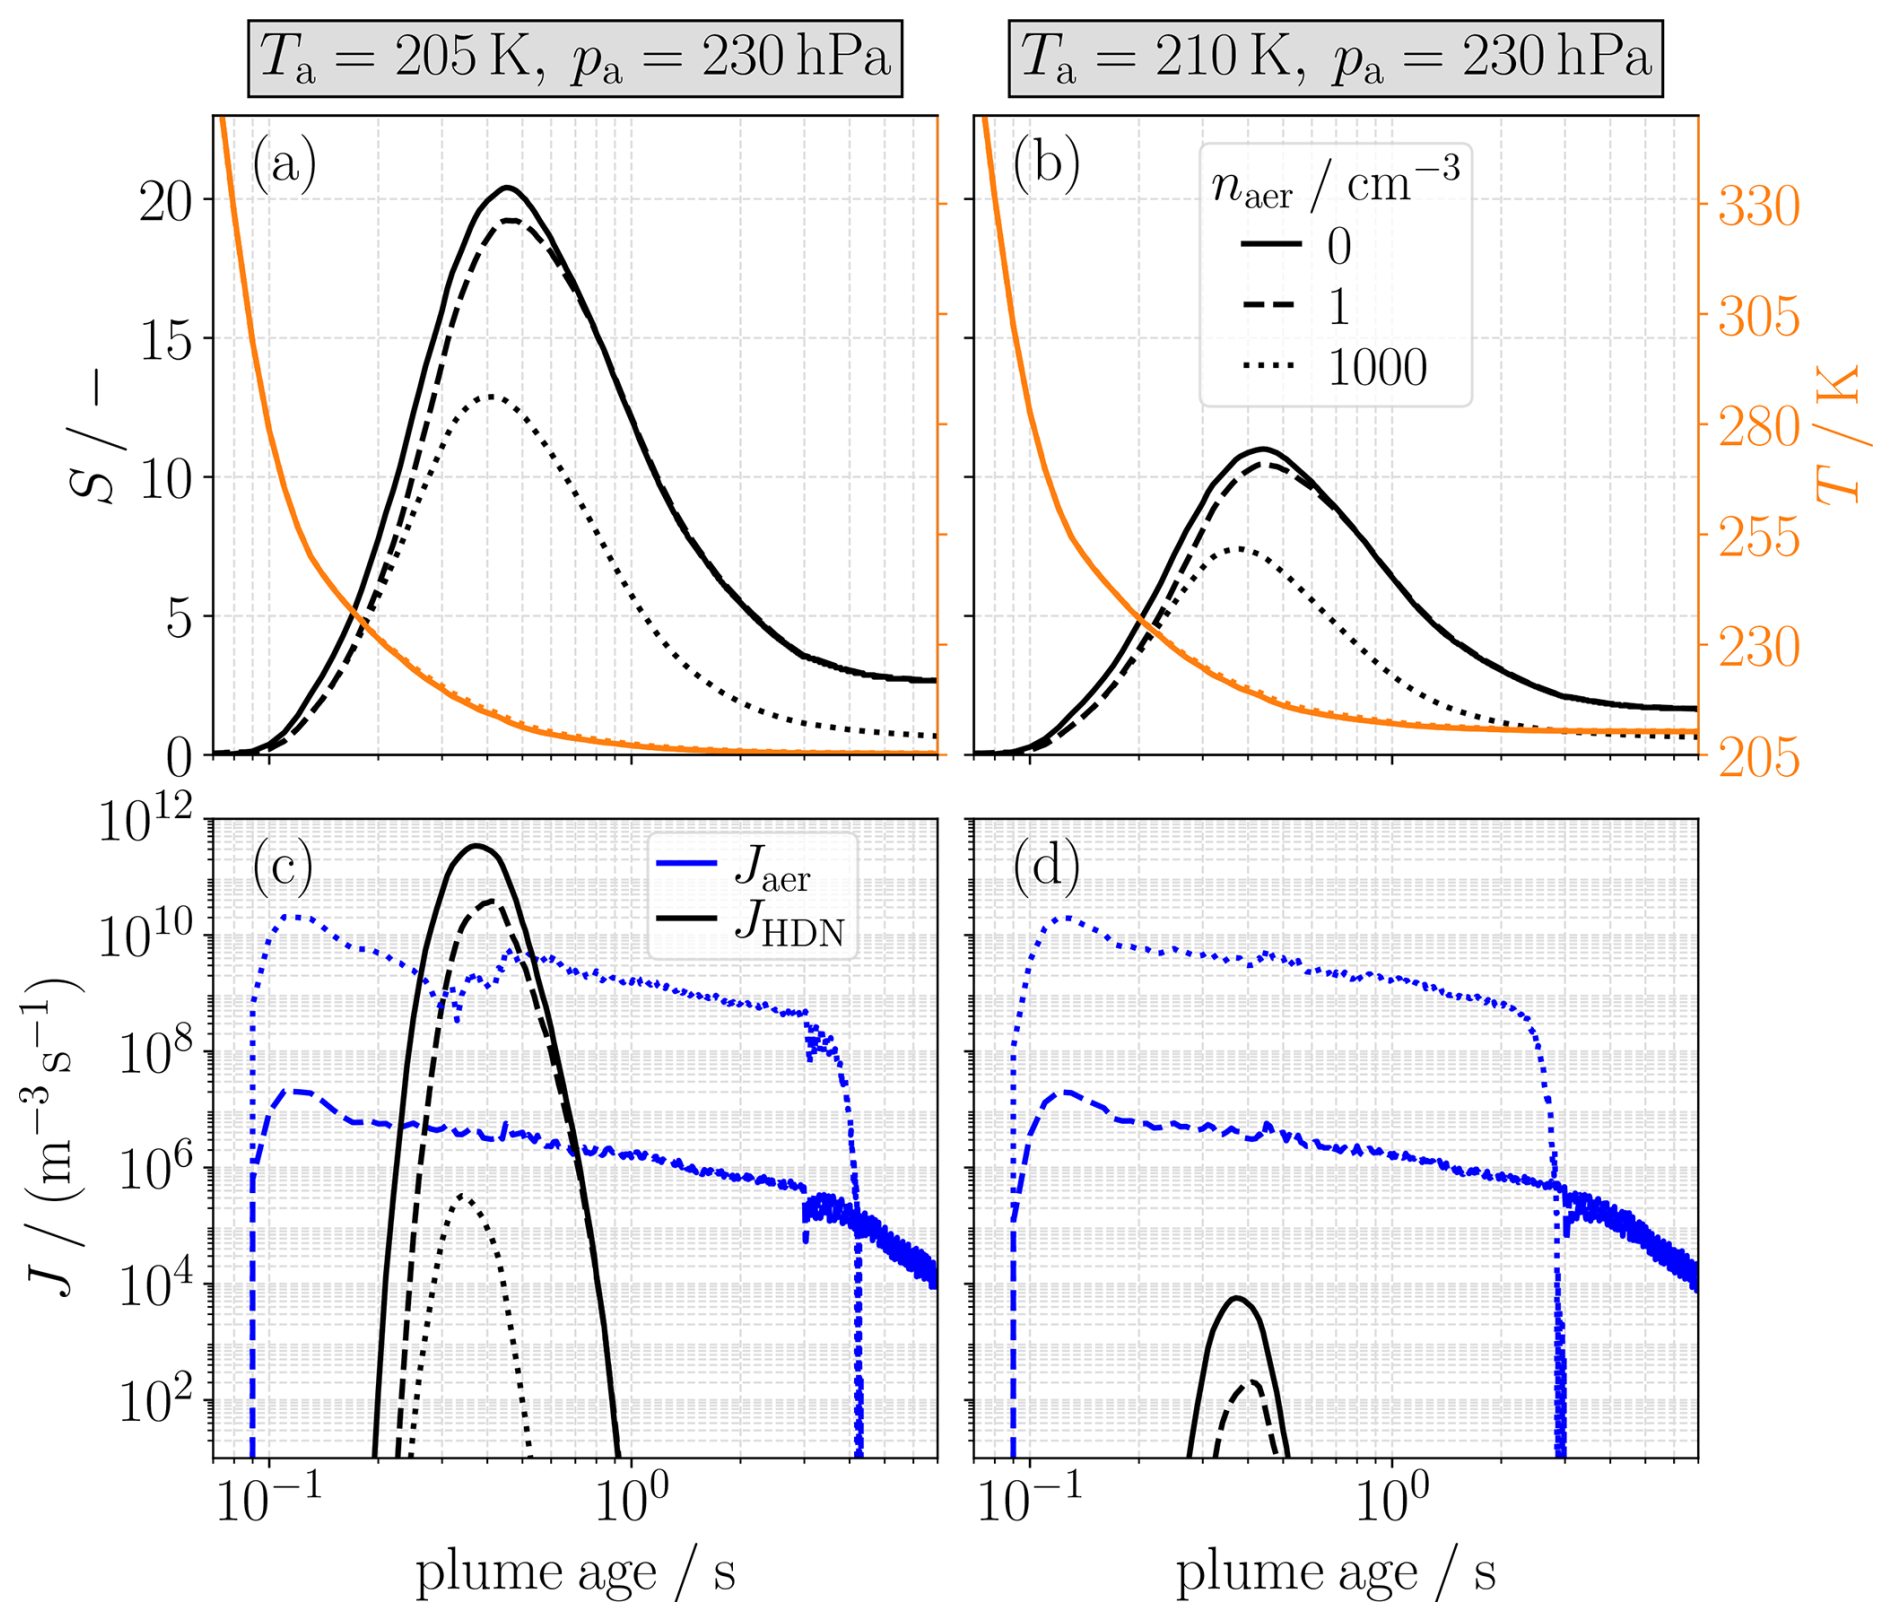
Figure 6(a)–(b) Time evolution of saturation ratio S (black curves) and plume temperature T (orange curves) for different ambient aerosol number concentrations (indicated by the linestyle). (c)–(d) Nucleation rates on ambient aerosols Jaer according to Eq. (5) (blue curves) and homogeneous droplet nucleation rates JHDN obtained by inserting the time evolutions S and T into Eq. (7) (black curves). The two columns are for two different ambient temperatures Ta for the same ambient pressure pa.
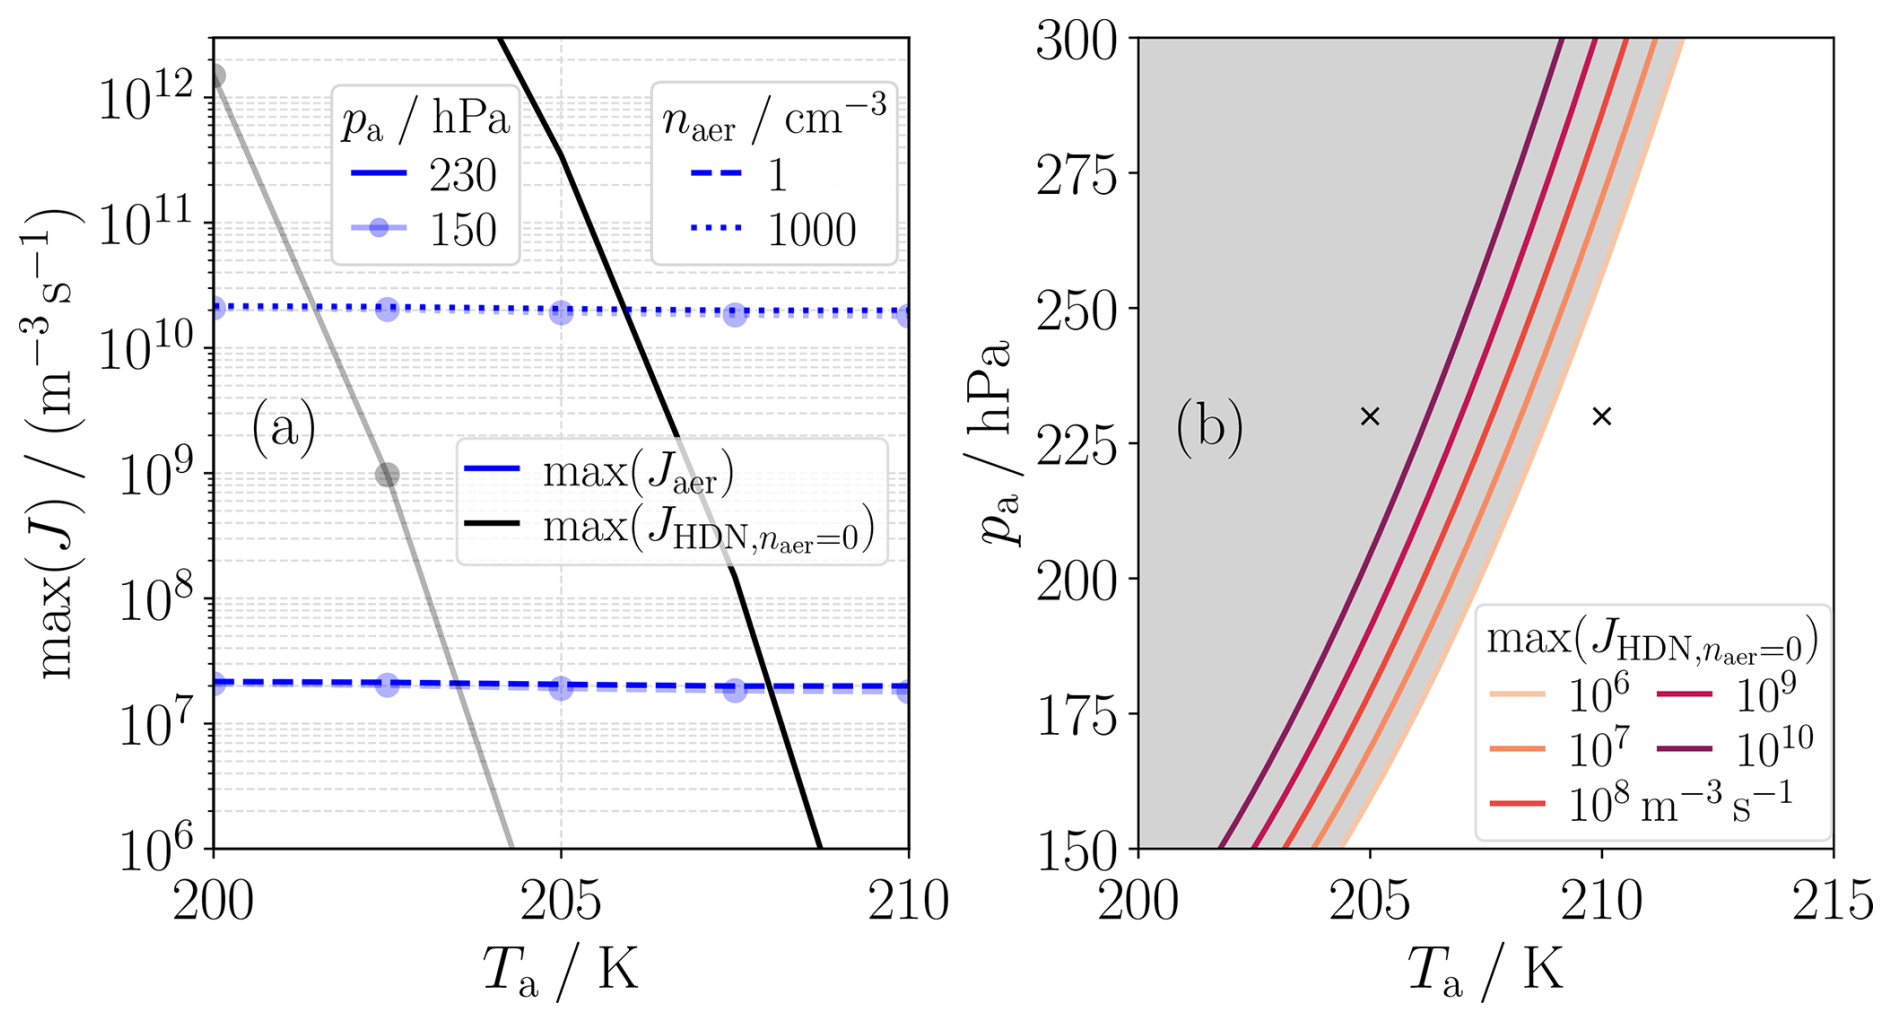
Figure 7(a) Maxima of nucleation rates max(J) as a function of ambient temperature Ta for two ambient pressures pa (indicated by transparency and dotted marker). Depicted are the maximum nucleation rates connected with ambient aerosols max(Jaer) (blue lines) for two aerosol number concentrations naer (different linestyles) and the maximum rates of homogeneous droplet nucleation obtained when moving along the mixing line (black lines). (b) Isolines for maxima of homogeneous droplet nucleation rates obtained when moving along the mixing line for different Ta and pa combinations. The two black crosses indicate the combinations of Ta and pa used in the two columns of Fig. 6.
3.2 Importance of homogeneous droplet nucleation
As described in Sect. 2.1, homogeneous droplet nucleation (HDN) with subsequent freezing into ice crystals could be another contrail ice formation pathway. For this process, high supersaturations are needed. In the hydrogen combustion case, high plume relative humidities are encountered at low ambient temperatures, with increasing peak values with decreasing ambient temperatures (Fig. 3b in Bier et al., 2024) hinting towards a potential importance of the HDN process at low ambient temperatures.
Here, we try to assess the relative importance of the HDN process using an offline approach. To do so, we first evaluate the time-dependent nucleation rate on entrained ambient aerosols from the box model simulations via
with the box model time step δt, the effective plume area and the number of already activated aerosols per meter of flightpath
as sum of droplet number Ndrop and ice particle number Nice. We compare this nucleation rate Jaer to potential homogeneous nucleation rates. For this we use the empirical nucleation rate (Wölk and Strey, 2001; Wölk et al., 2002)
with the empirical constants and B=6500 K and the classical Becker-Döring nucleation rate
in units . In Eq. (8), σ is the surface tension of the critical cluster of water molecules, m is the mass of a water molecule, v is the molecular volume, kB is the Boltzmann constant, T is the temperature, and is the saturation ratio (relative humidity given as ratio and not in percentage) with the actual partial pressure of water vapor ev and the equilibrium partial vapor pressure over a flat water surface .
In our offline approach, we evaluate JHDN(t) via Eq. (7) by using the time series T(t) and S(t) as obtained from existing box model simulations. For simulations with microphysics switched off (ambient aerosol number concentration naer=0 cm−3), the evolution of T and S over time is governed solely by dilution along the mixing line. For naer>0 cm−3, the temperature evolution differs minimally due to latent heating from phase transitions. The evolution of the saturation ratio S is strongly affected by the choice of the naer value due to the water vapor depletion by activated aerosols (Fig. 6a-b).
Since our offline approach does not consider water vapor consumption by homogeneously nucleated droplets, it tends to overestimate JHDN at later times t. Furthermore, it does not determine whether clusters formed at a given time are stable and grow or whether they evaporate thereafter. However, as this approach tends to overestimate JHDN, it allows for a conservative estimate of the importance of the HDN process.
At the ambient temperature Ta=205 K, the encountered saturation ratios S are high (Fig. 6a), and thus also the rates JHDN for low ambient aerosol number concentrations naer (Fig. 6c). At these low naer, the maximum of the calculated rates JHDN exceeds the maximum of the rates Jaer. However, when ambient aerosols are more abundant with substantial depletion of the water vapor, the calculated rates JHDN become several orders of magnitude lower than the corresponding rates Jaer (dotted lines for naer=1000 cm−3 in Fig. 6c).
At an higher ambient temperature (Ta=210 K), the encountered supersaturations S are lower (Fig. 6b), resulting in JHDN values that remain several orders of magnitude below the rates Jaer, even for low naer (Fig. 6d). In addition, the maxima of JHDN occur much later than those of Jaer. Consequently, indirect effects such as a significant activation suppression of ambient aerosols due to the water vapor depletion by a few spontaneously nucleated droplets are highly unlikely (based on the same reasoning as for the coarse-mode particles discussed in Sect. 3.1.1).
After displaying the time evolution of nucleation rates for the two example cases (Fig. 6), we now extend our analysis to a broader set of scenarios. For these scenarios, we evaluate the maxima of the nucleation rates (Fig. 7a). Although these values represent instantaneous rates, they serve as a robust indicator of the integrated total number (Appendix B). The maximum of Jaer is almost independent of ambient temperature Ta and pressure pa at low ambient temperatures and scales nearly linearly with ambient aerosol number concentration naer (Fig. 7a and Fig. B1). In contrast, the maximum of JHDN depends non-linearly on the supersaturation and is therefore highly sensitive to both Ta and pa.
As the highest potential JHDN values occur in the absence of ambient aerosols (), we use these rates for a most conservative estimate. In particular, we evaluate the maxima of the rates for various combinations of pa and Ta. Isolines of are shown in Fig. 7b. Since the maxima of Jaer are at least one order of magnitude above for aerosol number concentrations (Fig. 7a), we choose the isoline as a conservative boundary for an estimation where HDN may be important. This boundary can be approximated by
with Pa K−2, , and .
If a pa−Ta pair lies to the right/below of this boundary (white region in Fig. 7b), we can be very sure that HDN does not play a significant role as the nucleation rates on the ambient aerosols are substantially higher regardless of the ambient aerosol number concentration. In the gray region of Fig. 7b, it remains uncertain whether HDN may significantly contribute to droplet formation. This depends on the aerosol number concentration and requires an explicit, time-resolved simulation of relative humidity and temperature evolution, along with the kinetics of droplet cluster growth/evaporation.
Equation (9) remains valid when the ambient relative humidity deviates from the baseline value , as such a deviation only causes a slight shift of the mixing line and has compared to a change in Ta and pa only a minor effect on the maximum supersaturation.
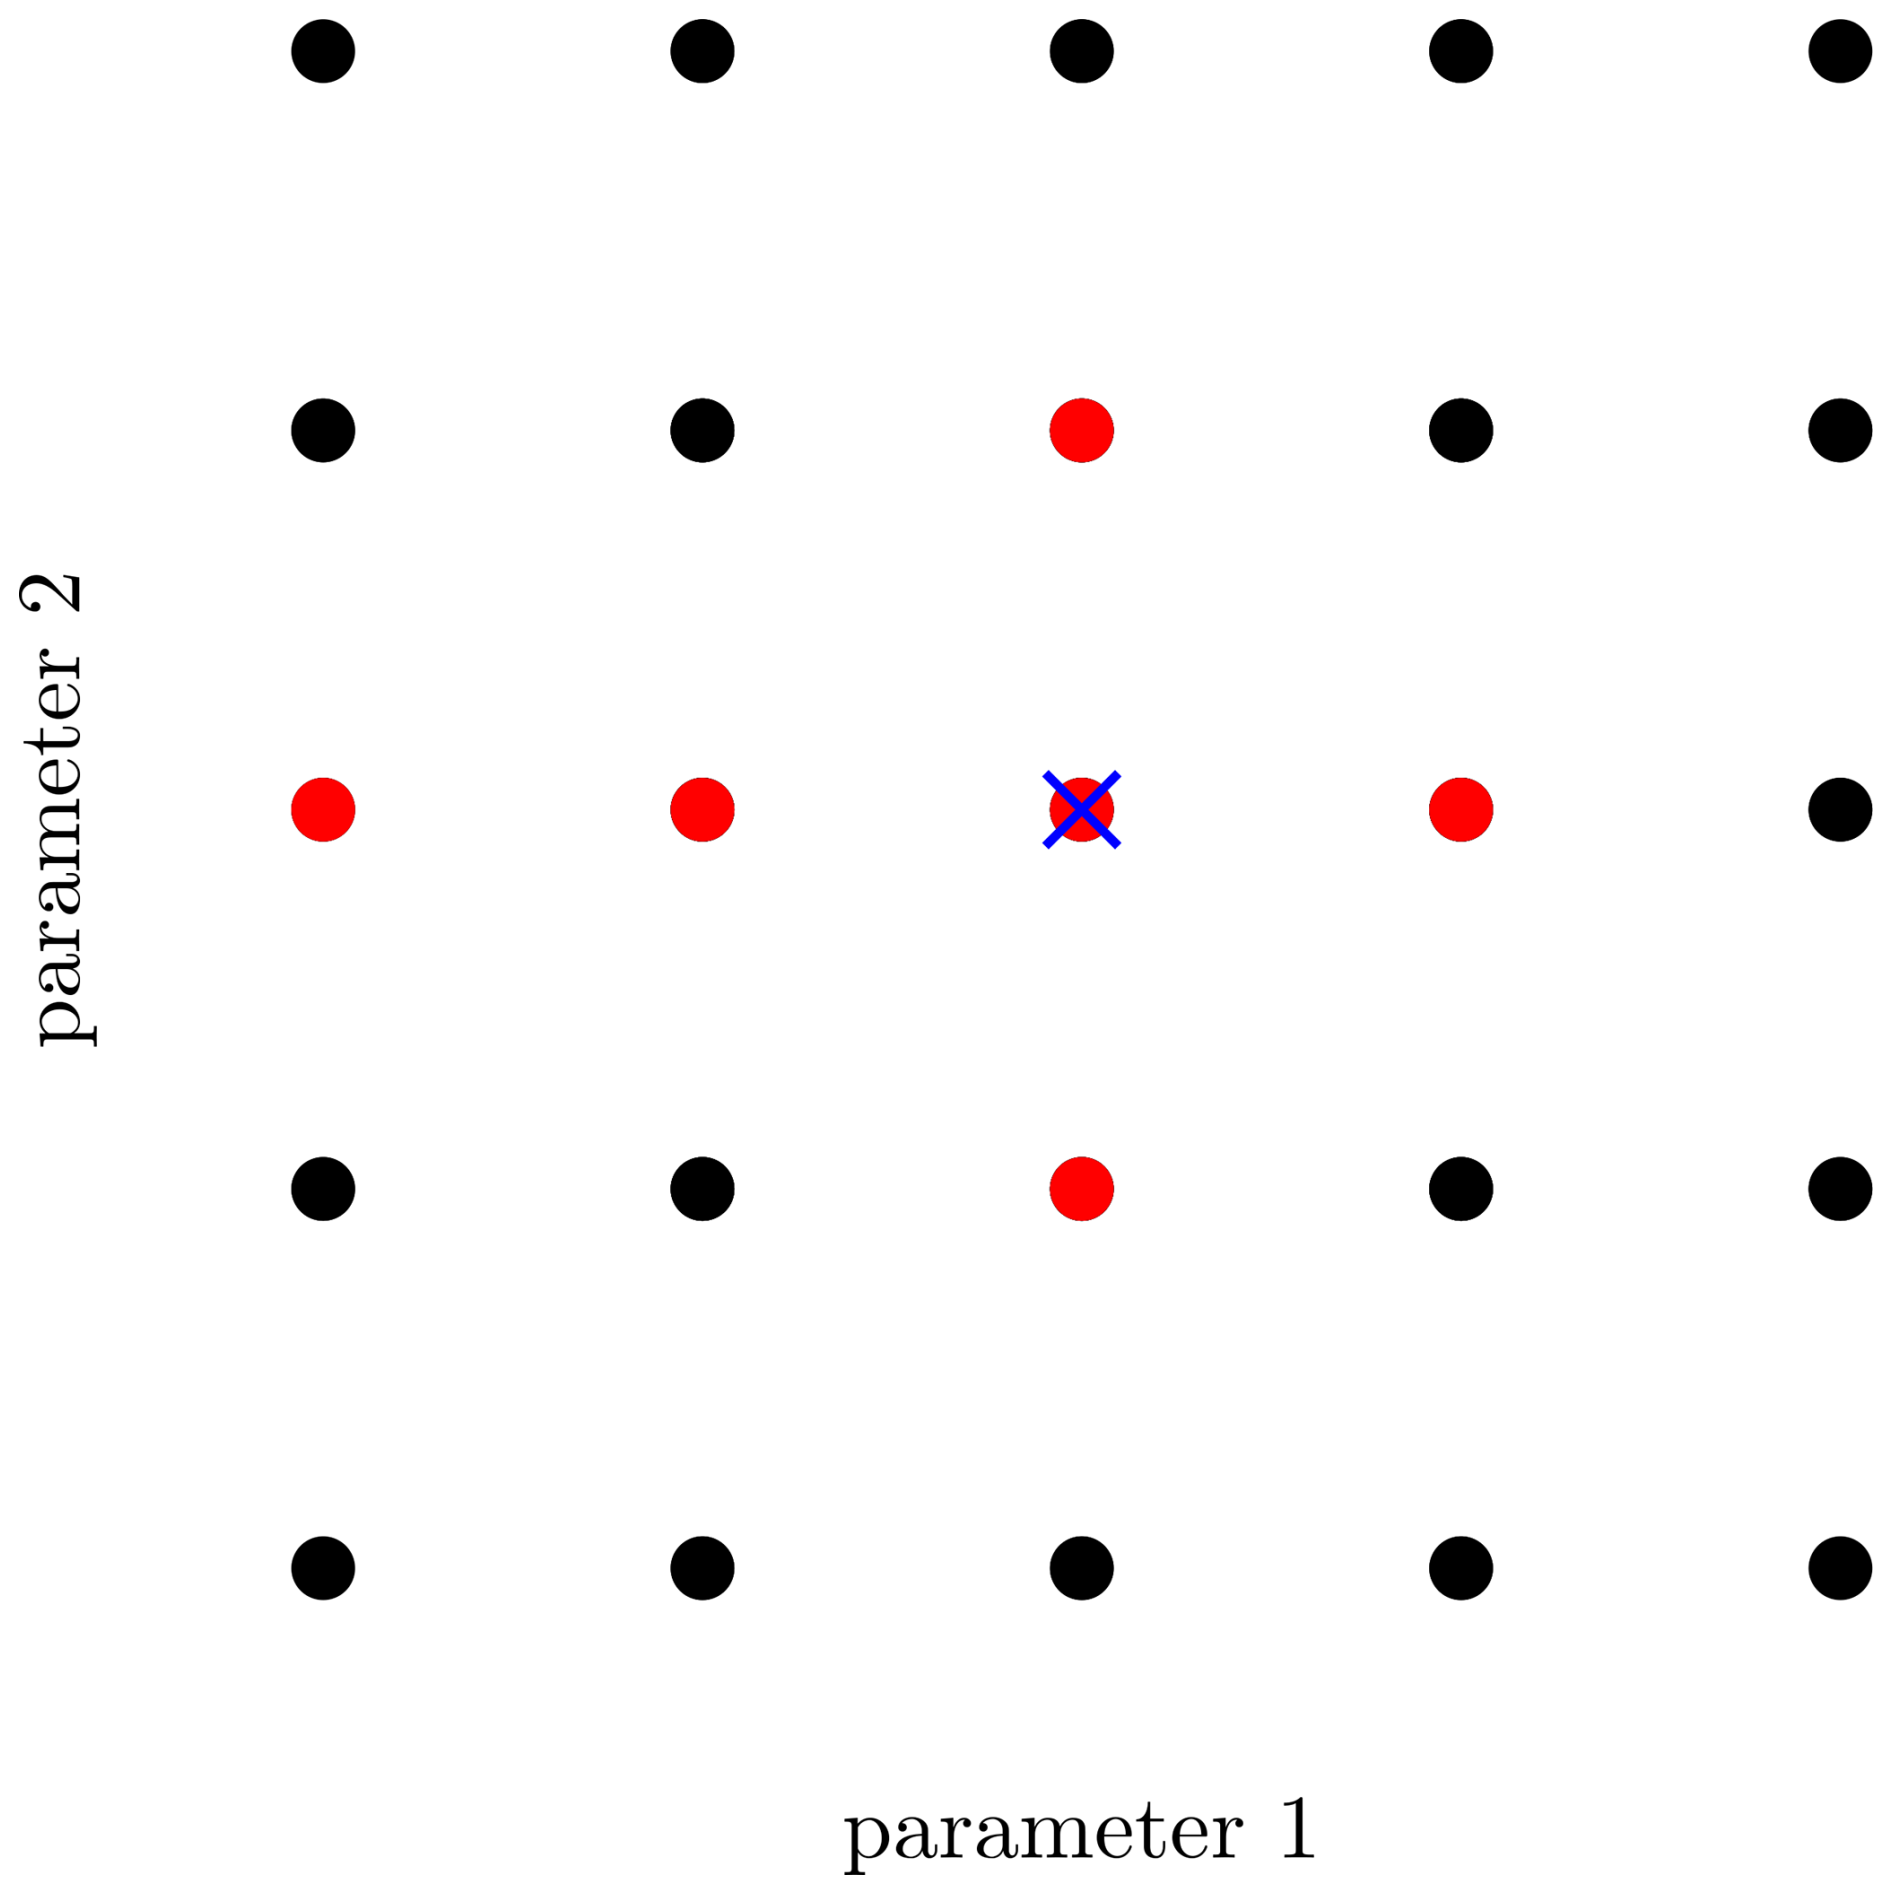
Figure 8Schematic depiction of the difference between a one-at-a-time approach and the simulation setup used in the current study. Starting from a set of baseline values (blue cross), the values of a single parameter are varied in a one-at-a-time approach while all other parameters are kept constant (red dots). In the current study, we set up simulations for all possible combinations of parameter values (black dots).
3.3 Systematic investigation
3.3.1 Simulation data base
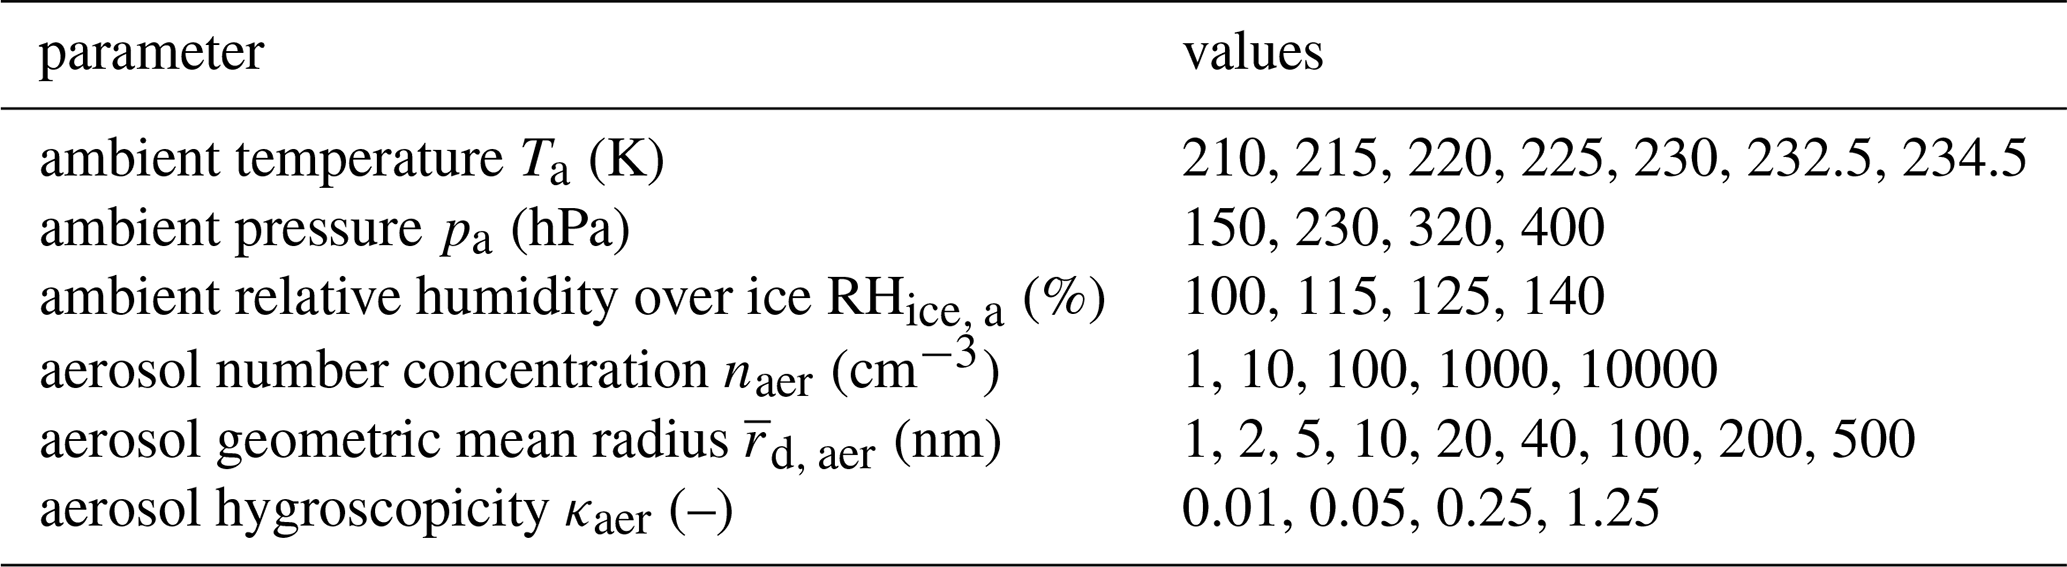
Bier et al. (2024) primarily used a one- or two-at-a-time approach to investigate the main sensitivities of the number of ice crystals formed Nice,f to different parameters. This method involves starting from a set of baseline values and varying one or two parameters at a time while keeping all others fixed. The goal of this section is to explore the parameter space more systematically. First, we expand the range of parameter values beyond those considered by Bier et al. (2024). Second, instead of varying one or two parameters at a time, we perform simulations for all possible combinations of parameter values (schematically illustrated in Fig. 8 for two parameters). This approach results in a total of simulations, where ni denotes the number of values explored for parameter i. For the parameter values listed in Table 2, this leads to more than nsim>20 000 simulations. This systematic investigation enables us to make general statements about the sensitivity of Nice,f to different parameters across various regions of the parameter space. Moreover, the resulting comprehensive dataset provides a suitable basis for a data-driven parameterization approach. Alternative sampling strategies, such as Latin hypercube sampling, could reduce the number of simulations required. However, since the computational cost of the box model is low, we can afford to use the full-factorial sampling strategy.
Ambient temperatures are specified over a broad range, prescribed linearly in 5 K steps from Ta=210 K to Ta=230 K. We use a finer resolution for Ta≥230 K to capture the non-linear dependence on the homogeneous freezing process in this temperature range.
The range of prescribed ambient pressures reflects a wide altitude range for possible aircraft traffic. Clearly, as we performed simulations for all possible combinations of ambient temperature and pressure, highly unlikely atmospheric scenarios are also part of the dataset. Nonetheless, ambient pressure primarily influences supersaturation levels at a given ambient temperature through its effect on the slope of the mixing line (Eq. 2). Thus, even the less likely combinations represent extrapolations that still capture the primary influence of ambient pressure on the contrail formation process and do not deteriorate the representation of contrail formation under more realistic atmospheric conditions. In addition, a small subset of temperature–pressure combinations in the dataset falls into a regime where the estimate presented in Sect. 3.2 suggests that HDN cannot be excluded as a potential contributor to ice formation. As HDN is not included in the simulations, the corresponding ice crystal numbers for these conditions are therefore subject to higher uncertainty.
We only consider ice (super-)saturated conditions (RH %) as only contrails formed under these conditions will persist for a longer time. For the chosen upper limit (RH %), the environment is sub-saturated with respect to water for all investigated ambient temperatures (e.g., RH corresponds to RH at Ta=210 K and to RH at Ta=234.5 K). If the environment were supersaturated with respect to water, natural clouds would be anyway present. Even under water sub-saturated conditions, aerosols may grow hygroscopically large enough to freeze and initiate natural cirrus formation in some scenarios. However, this study does not address contrail formation in the presence of existing natural cirrus, and we therefore assume a cloud-free background in all simulations.
As the impact of multiple coexisting aerosol populations can be inferred from individual simulations, each including only one of the populations with a suitably adjusted number concentration (Sect. 3.1.2), it is sufficient to explore the dependence on the properties of single aerosol populations systematically. The prescribed aerosol number concentrations span several orders of magnitude, representing the large variability in the atmosphere. As the number of ice crystals formed is only weakly dependent on the geometric width (Fig. A1), this parameter is held constant at σaer=1.6 across all simulations (Brock et al., 2021; Bier et al., 2024). In contrast, the geometric mean radius is varied using an approximately logarithmic spacing, covering the full range from small nucleation mode particles to large accumulation mode particles. Based on the findings in Sect. 3.1.1, we do not cover coarse mode particles. The nearly logarithmic spacing provides enhanced resolution in linear space for the small-sized particles to capture the non-linear influence of the Kelvin effect on the droplet activation. Finally, prescribed aerosol hygroscopicity values span several orders of magnitude to account for the diverse solubilities of potential aerosol species (see Table 1 in Petters and Kreidenweis, 2007).
Table 2Box model simulations for all possible combinations of listed parameter values are performed.
3.3.2 Systematic evaluation of the ice crystal number
In this section, we present the results of the nsim>20 000 simulations in a condensed manner. As a first step, we investigate the mean dependence of the final number of ice crystals formed Nice,f on the various parameters. To do so, we look at all simulations that use a specific value k of the parameter i, and calculate the arithmetic mean of Nice,f across these simulations, where ni is the number of values considered for parameter i.
This analysis confirms several findings already reported by Bier et al. (2024). The mean number of ice crystals decreases with increasing ambient temperature Ta (Fig. 9a), owing to lower and shorter-lasting supersaturation at higher temperatures. Above Ta∼ 230 K, a pronounced nonlinear decline in ice crystal number is observed, attributed to the large freezing time scales of supercooled droplets at those temperatures. Unlike conventional contrail formation on soot particles in soot-rich regimes, where ice crystal numbers saturate at low ambient temperatures, our results show a continuous increase in ice crystal number with decreasing Ta due to continuous entrainment of ambient aerosols into the plume and prolonged supersaturation at lower temperatures.
Higher ambient pressure pa results in increased ice crystal numbers (Fig. 9b), driven by enhanced supersaturation caused by a steeper slope of the mixing line (Eq. 2). The mean ice crystal number shows only a weak dependence on ambient relative humidity, with a slight increase with increasing RHice,a (Fig. 9c).
The mean number of ice crystals formed strongly depends on the background aerosol number concentration naer (Fig. 9d). At low naer, the relationship is approximately linear, whereas saturation effects become apparent for high naer. For nm, the mean ice crystal number increases with increasing geometric mean radius (Fig. 9e), driven by the nonlinear Kelvin effect. Between nm and nm, the dependence is weak. Since Bier et al. (2024) only investigated values up to nm, they did not report the decrease in ice crystal number observed for . This decline is due to the freezing-point depression of solution droplets, which will be discussed in more detail further below. In this mean-based analysis, the aerosol hygroscopicity κaer has only a minor impact on the ice crystal number (Fig. 9e).
To gain deeper insight, we refine our analysis by still considering a specific value k of parameter i, while additionally grouping the data by the nj values of a co-parameter j. Within each subgroup, we compute the arithmetic mean over the simulations and plot the obtained nj mean values as colored dots in Fig. 9, where the color denotes the co-parameter used for grouping. The spread of the dots indicates how sensitive the ice crystal number is to the considered co-parameter at a given parameter value k.
This analysis confirms that ambient aerosol number concentration and ambient temperature are the most influential parameters throughout the examined parameter space. Furthermore, the extent of the dots reveals that the ice crystal number is significantly sensitive to RHice,a only when Ta≳230 K (Fig. 9a). Additionally, this analysis indicates that the hygroscopicity κaer becomes influential for and (Fig. 9e). This is caused by two distinct physical processes: A higher hygroscopicity κaer reduces the critical supersaturation required for droplet activation. This becomes important when the Kelvin effect is strong, i.e., for small-sized particles. Conversely, a higher κaer value lowers the freezing temperature of supercooled droplets. While the freezing behavior of weakly soluble activated aerosols is similar to that of pure supercooled droplets, the presence of soluble material within a supercooled droplet inhibits the initiation of the freezing process (Koop et al., 2000). This means that some well-soluble aerosols activate into droplets but do not freeze. This suppression becomes more pronounced for larger dry particle radii due to the higher solute content for a given water content.
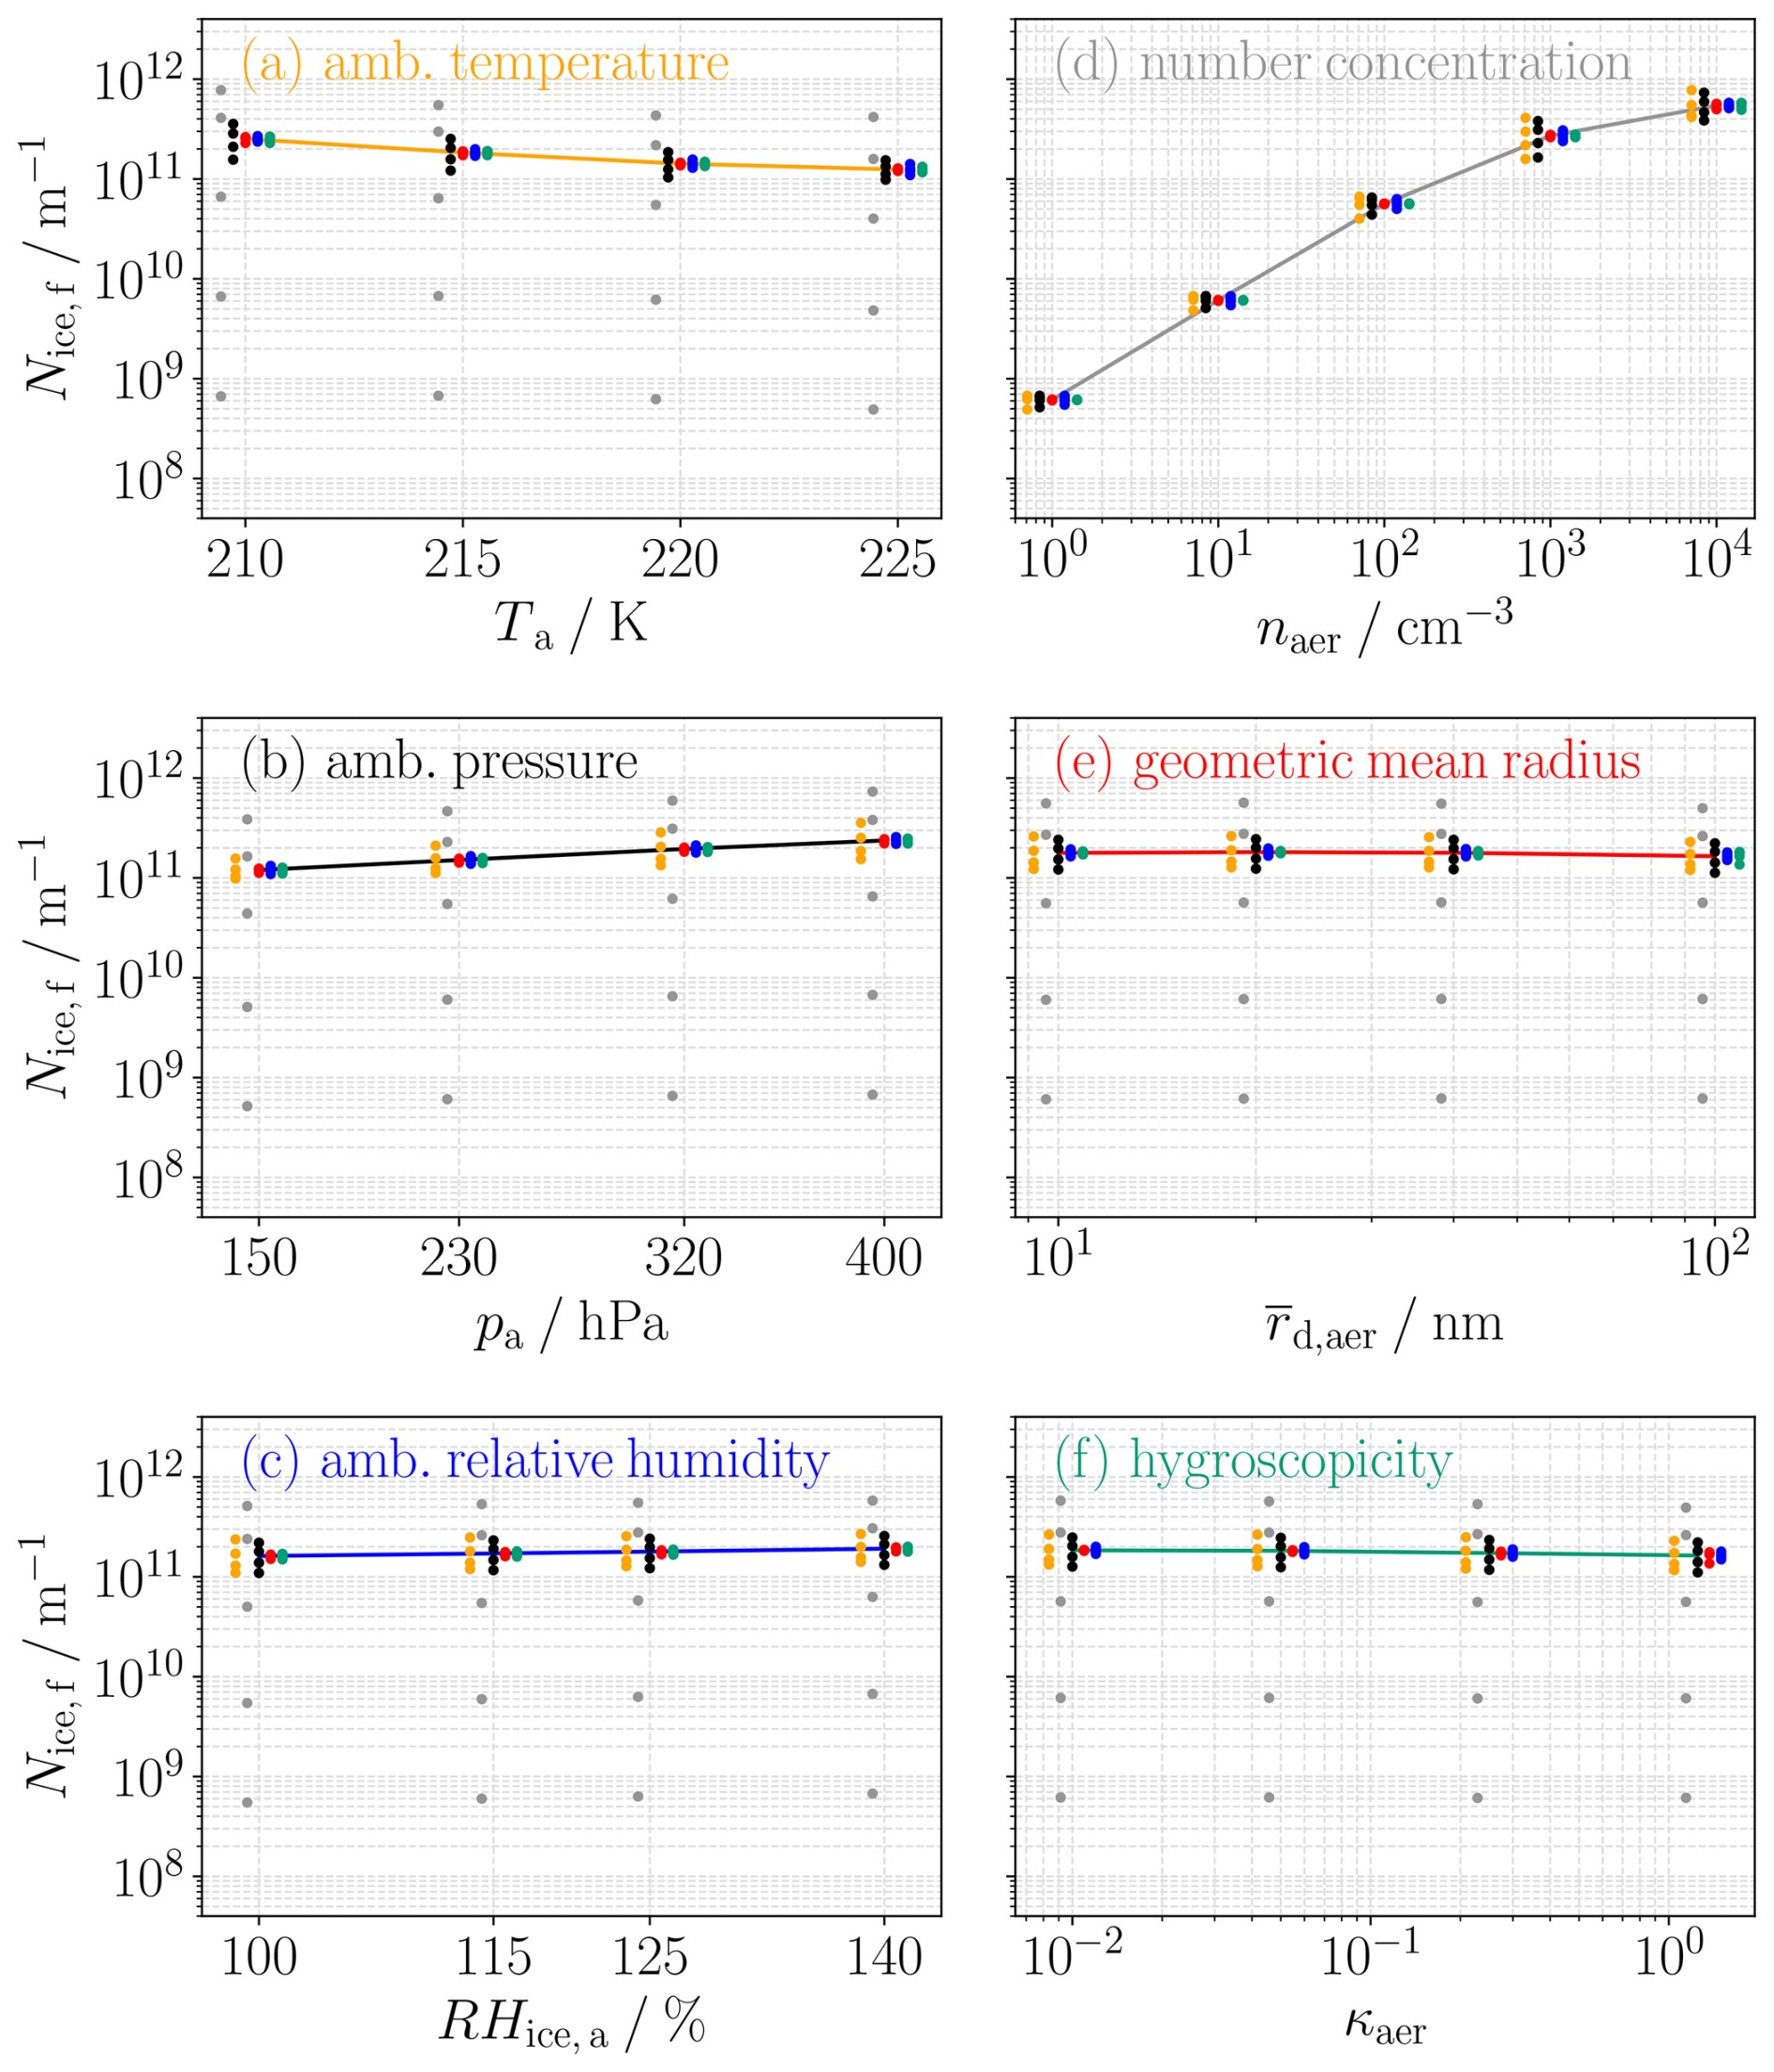
All together, this systematic investigation shows that the number of ice crystals is almost independent of ambient relative humidity, ambient aerosol size, and hygroscopicity for the parameter subspace defined by Ta≤225 K and . This conclusion is supported by an analysis restricted to this subspace, as shown in Fig. 10.
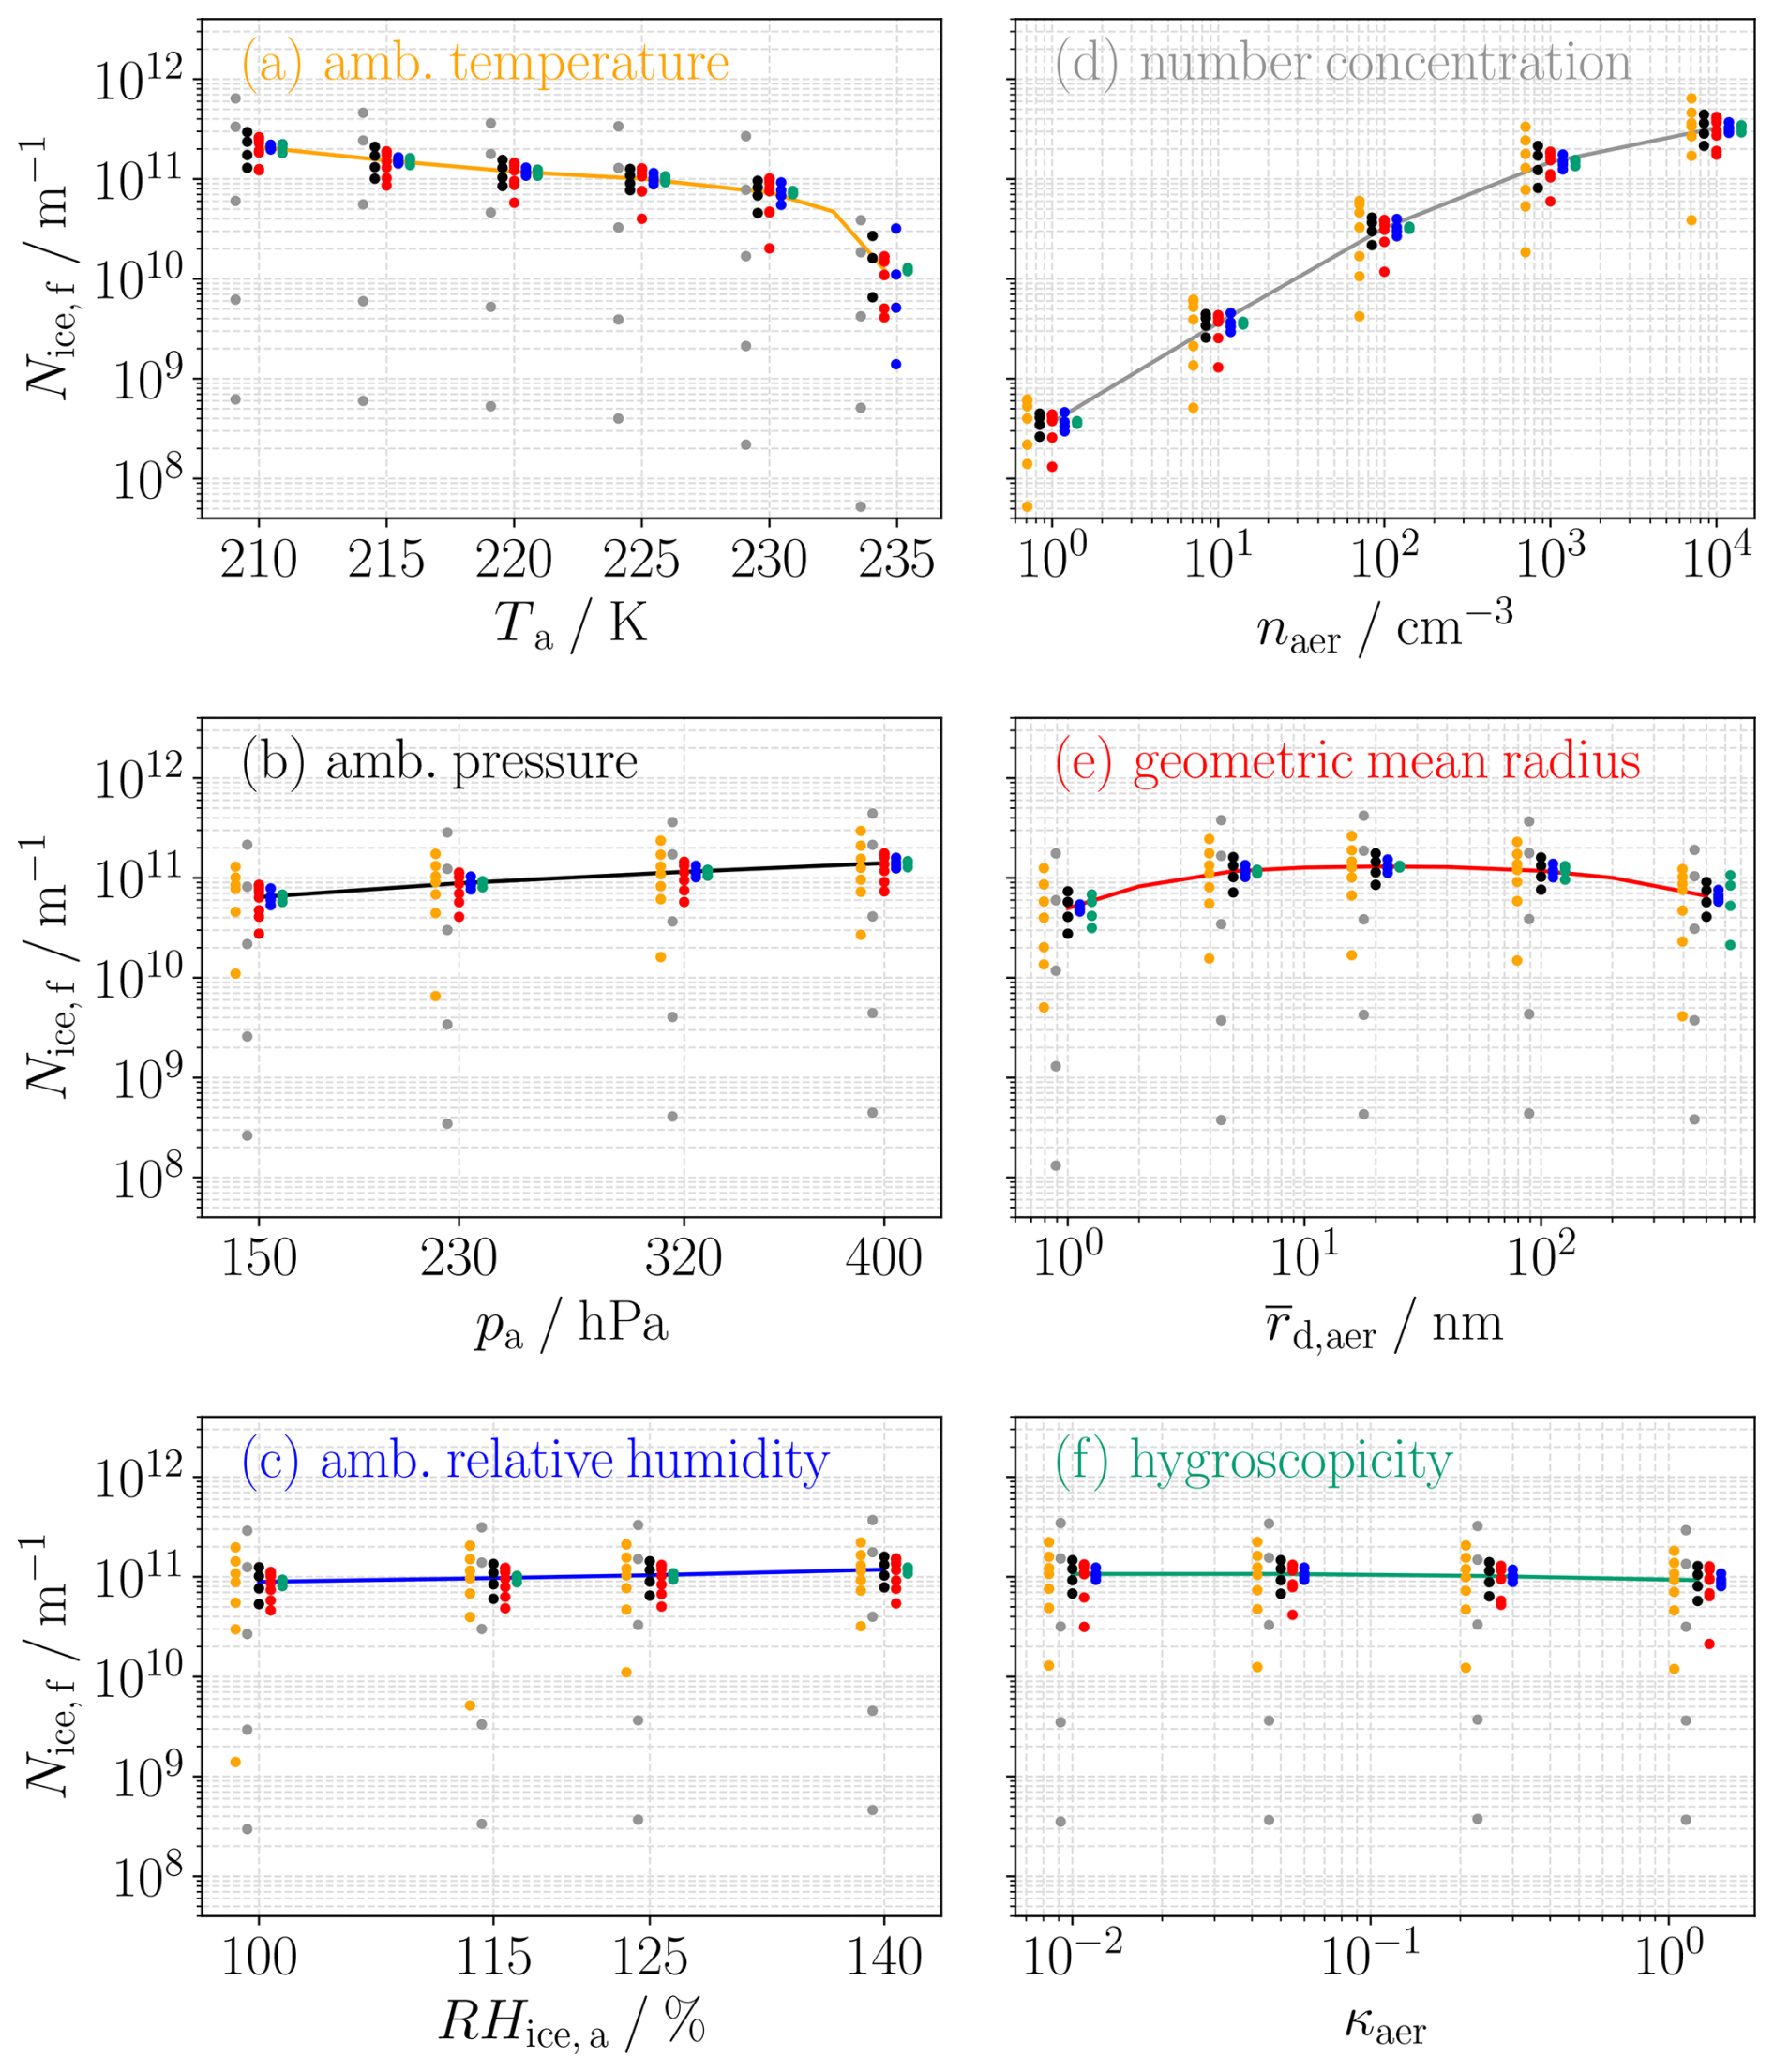
Figure 9Mean dependence of the final number of ice crystals formed Nice,f on the various parameters (different colored solid lines in each panel). The colored dots show the mean Nice,f calculated within subgroups grouped by the specific parameter value at the x-axis and by the values of a co-parameter. Different colors indicate the various co-parameters, with the corresponding parameter ranges taken from Table 2. The dots for the different co-parameters correspond to the parameter value at the center but are shifted for visualization purposes. In (a), the dependence on the co-parameters is not displayed for Ta=232.5 K and in (e) the dependence on the co-parameters is only displayed for each second geometric mean radius.
In this section, we place our findings in a broader context and critically assess their generality, associated uncertainties, and relation to conventional kerosene contrails. All conclusions are based on a systematically conducted model study using the LCM box model with contrail formation assumed on entrained ambient aerosol particles. The LCM box model has previously been compared to other contrail formation models for ice crystal formation on emitted soot particles in kerosene combustion cases (Bier et al., 2022). Clearly, such validation for kerosene contrails does not extend to the microphysical processes that are particularly relevant for hydrogen combustion. This is, for example, the case at temperatures for which kerosene contrails do not form and where homogeneous freezing plays a crucial role. A step toward obtaining measurement data under hydrogen combustion conditions has been taken with the first demonstrator experiment (Blue Condor, 2025). Still, the very limited measurement database constitutes a clear validation gap. Despite this limitation, the conclusions derived in this study are grounded in physical process understanding rather than being specific to the particular model setup.
In our simulations, we did not vary the prescribed dilution, which controls plume cooling and humidity evolution. Changes in dilution speed are expected if engine size or jet speed is changed (Lewellen, 2020). While the dilution speed influences the absolute number of ice crystals formed (see Part 2; Zink and Unterstrasser, 2026), the conclusions drawn here are not affected, which is further elaborated in the subsequent paragraphs.
Because few coarse-mode particles have a negligible influence on the water vapor budget, their role remains unimportant even if additional particle types (e.g., lubrication oil particles) were to contribute to ice crystal formation in hydrogen combustion cases. Water-vapor depletion is dominated by the far more numerous other particles in the plume, leaving coarse-mode particles unable to exert a significant effect, even under slower dilution scenarios. Coarse-mode particles would only become relevant if their number concentrations were of a similar order of magnitude to those of the other involved particle populations, which is typically not the case (Sect. 2.2).
The dilution state not only controls plume temperature and humidity but also determines the number of particles entrained into the plume for a given ambient aerosol number concentration. Because the total number of already entrained and activated aerosol particles primarily governs water-vapor depletion (Sect. 3.1.2), the weighted-mean approach remains valid across different dilution scenarios. However, the weighted-mean approach is not expected to be generally applicable to particle types other than entrained ambient aerosols. In particular, it cannot represent the competition between emitted soot particles and volatile particles that form prior to contrail formation in kerosene combustion cases. Owing to the Kelvin effect, small volatile particles can only activate into droplets at sufficiently high plume supersaturations, that is, when ambient temperatures are well below the Schmidt–Appleman threshold temperature (Kärcher and Yu, 2009; Yu et al., 2024; Ponsonby et al., 2025). Beyond this thermodynamic constraint, the activation of volatile particles is additionally influenced by interactions with the soot particles. Since all particles are present in the plume from the onset of contrail formation, the largest soot particles activate first. Depending on their number, they can substantially deplete the water vapor and thereby partially or fully suppress the activation of smaller volatile particles. Consequently, water-vapor competition is controlled not only by the total particle number but also by the particle properties (size, hygroscopicity), in contrast to what we found for continuously entrained ambient aerosol populations in the hydrogen combustion case.
Using a conservative offline estimate, we identified a large region of parameter space in which HDN can safely be neglected (white region in Fig. 7b). Because this assessment is based on conservative order-of-magnitude considerations, it remains robust against uncertainties in dilution speed. The identified region would also remain valid if other particle types in addition to ambient aerosols were to contribute to water-vapor depletion, which would further suppress the conditions favorable for HDN. For combinations of temperature and pressure in which HDN may potentially become relevant in hydrogen combustion (grey region in Fig. 7b), its actual importance cannot be assessed within the present framework and requires simulations in which HDN is included online. For conventional kerosene combustion, the approximately 2.6-times lower energy-specific water vapor emission index leads to substantially reduced supersaturation, making HDN highly unlikely even at low temperatures and justifying its omission in previous kerosene studies.
Moreover, the regime identified in Sect. 3.3.2, in which Nice,f is only weakly sensitive to particle properties, is a consequence of microphysical processes. In particular, both the Kelvin effect and freezing-point depression are negligible within this regime. The low sensitivity of Nice,f to RHice,a for Ta≲225 K is consistent with findings for conventional kerosene contrails well below the Schmidt–Appleman threshold temperature (e.g., Fig. 4c in Bier et al., 2022). Changes in RHice,a only slightly shift the mixing line and therefore have a weaker impact on the supersaturations encountered than changes in ambient temperature or pressure.
Section 3.3.2 presents a comprehensive analysis of ice crystal number assuming formation on entrained ambient aerosol particles. An additional particle source may arise from lubrication oil released from engine breather vents (Yu et al., 2010b, 2012; Decker et al., 2024), with its impact depending strongly on where the oil is injected into the exhaust plume. If venting occurs close to the hot core flow, high temperatures promote evaporation and subsequent renucleation in the cooling plume. This produces a nucleation-mode particle population (Ungeheuer et al., 2022) that typically forms well before contrail formation begins. These particles can activate into liquid droplets and subsequently freeze into ice crystals (Ponsonby et al., 2024). In contrast, if the breather flow is emitted farther from hot engine sections, the oil is expected to be entrained into the water-vapor plume only after the exhaust has substantially cooled. Under these conditions, the resulting particles are expected to remain relatively large (hundreds of nanometers) and low in number, contributing little to the total ice crystal number.
Recent work by Zink et al. (2025) demonstrates that even very small lubrication oil emissions (on the order of a few milliliters per hour or even less) can generate substantial particle numbers when evaporation and renucleation occur. In many scenarios they investigated, ice crystal formation is dominated by oil particles rather than by entrained ambient aerosol. Lubrication oil emissions therefore represent a potentially important but highly configuration-dependent particle source whose relevance for contrail formation may vary substantially across engine designs. Technical design choices may thus play a key role in determining their importance for contrail formation in hydrogen combustion cases.
In this section, we summarize the key findings of our study and discuss their implications for the development of an upcoming parameterization for the number of ice crystals formed. We conducted simulations using the particle-based LCM box model to investigate contrail formation on entrained ambient aerosol particles for hydrogen combustion. Our focus was on microphysical processes, with the main findings being:
-
Coarse-mode particles typically do not need to be accounted for, as their much lower number concentrations compared to coexisting nucleation, Aitken, or accumulation mode particles result in a negligible depletion of the available water vapor. Consequently, they exert neither a significant direct nor indirect influence on ice crystal formation.
-
We showed that the ice crystal number formed on multiple aerosol populations can be approximated by a weighted-mean approach based on simulations that include only a single population. The success of this weighted-mean approach is physically explained by the fact that the total number of entrained aerosol particles largely governs the competition for the available water vapor. Therefore, it is sufficient to suitably parameterize the dependence of the ice crystal number on the properties of a single population. The ice crystal number formed on multiple populations with different properties can then be obtained by this weighted-mean approach.
-
We provided a formula for a conservative boundary dividing the parameter space into regions where homogeneous droplet nucleation can safely be neglected and regions where this process might play a role in ice crystal formation. For a parameterization based on contrail formation on ambient aerosol particles, the boundary can serve as a first indication of whether neglecting homogeneous droplet nucleation is justified for a specific use case.
-
A systematic investigation confirmed that ambient temperature and aerosol number concentration are the most important predictors for the number of ice crystals formed. Moreover, we showed that for the subspace defined by Ta≤225 K and , the final number of ice crystals formed becomes nearly independent of ambient relative humidity as well as the size and hygroscopicity of ambient aerosol particles. This finding enables the development of a parameterization with reduced complexity within this sub-regime.
The microphysical investigations presented here are complemented by the study of Zink et al. (2025), which explores the potential role of lubrication oil particles in ice crystal formation. In Part 2 of the paper series (Zink and Unterstrasser, 2026), we present findings that focus on engine-related aspects rather than on microphysical processes of contrail formation. Finally, in the forthcoming Part 3, we will introduce a parameterization based on a neural network that has been trained with the full set of simulation results. It is designed to meet the constraints and practical needs for implementation in a general circulation model or other large-scale contrail models. These models can then be used to estimate the radiative impact of contrails from a fleet of aircraft with hydrogen combustion.
The lognormal particle-size distribution reads
where r is the particle radius, n(r) the number density, N the total number, the geometric mean radius and σr>1 the geometric width. The geometric width σm of a corresponding mass distribution is related to σr by
where for spherical particles. In the box model, σm is used internally. By mistake, Bier et al. (2024) used the relation instead of Eq. (A2), resulting in incorrect values shown in their Fig. 5d. The correct values σr,correct are then given by
These corrected values are displayed in Fig. A1.
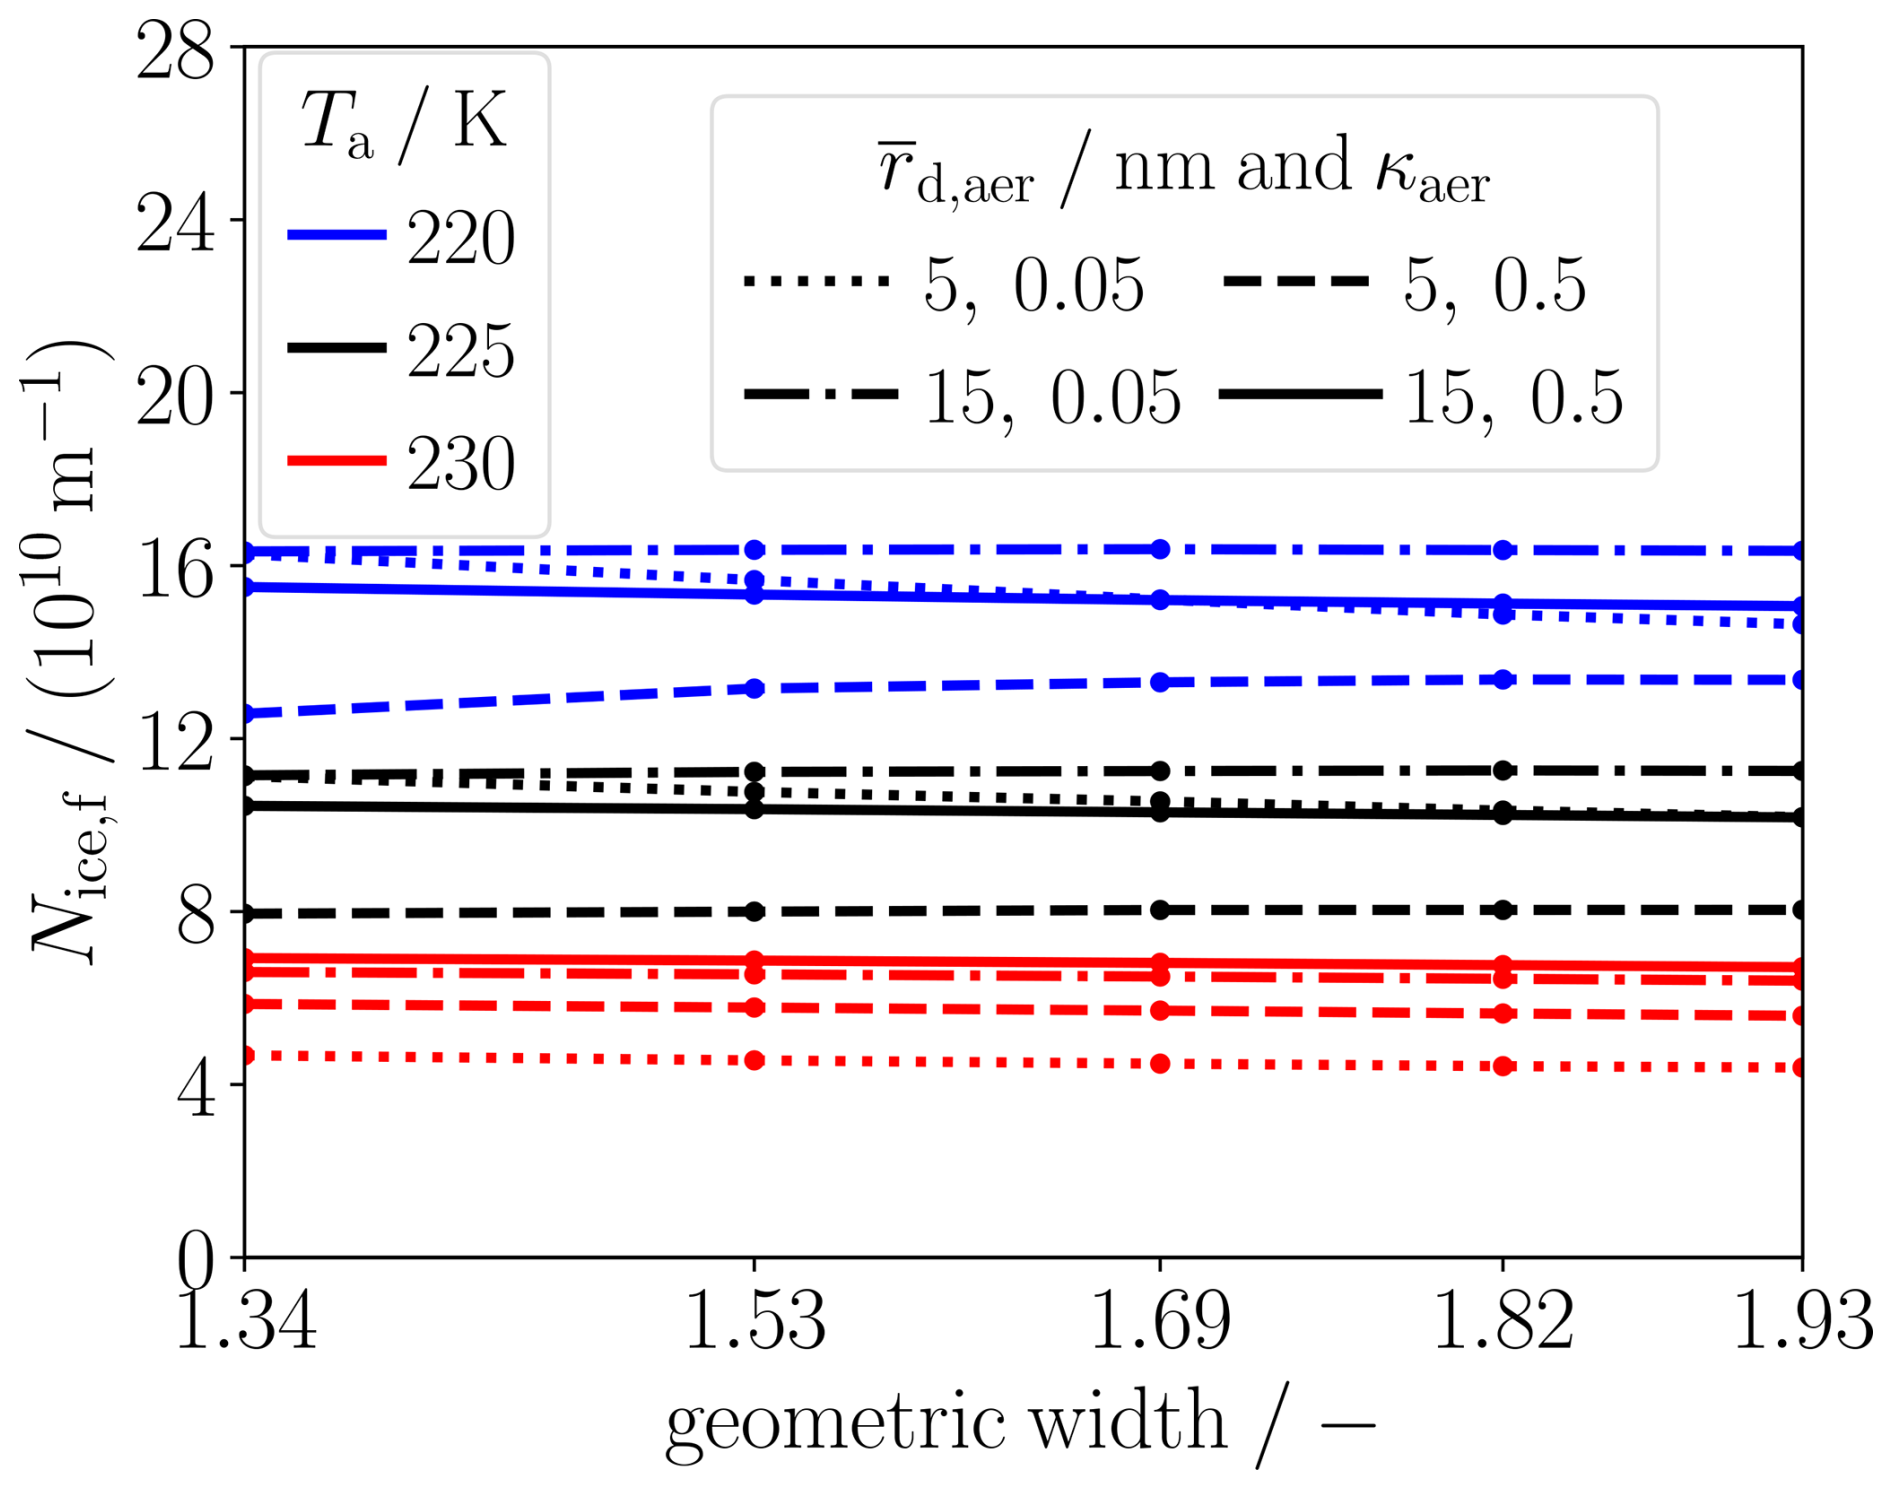
Figure A1Corrected Fig. 5d of Bier et al. (2024). Depicted is the final number of ice crystals formed Nice,f as a function of the geometric width of the background aerosol distribution. Simulation results are shown for different ambient temperatures Ta and different combinations of geometric mean radius and hygroscopicity κaer for the number concentration naer=600 cm−3. In the original figure, wrong values of the geometric width are displayed on the x-axis.
Figure B1 demonstrates that evaluating the maximum nucleation rate, as done in Sect. 3.2, provides a robust indicator of the integrated total number. Shown are results for the ambient temperature and pressure combinations used in Fig. 7a. The maximum nucleation rate on entrained ambient aerosols scales nearly linearly with the ambient aerosol number concentration for the evaluated conditions. This maximum therefore indicates the order of magnitude of the integrated total number. Moreover, under the assumption that plume relative humidity and temperature evolve along the mixing line, a nearly linear relationship between the maximum homogeneous nucleation rate and the integrated number is evident.
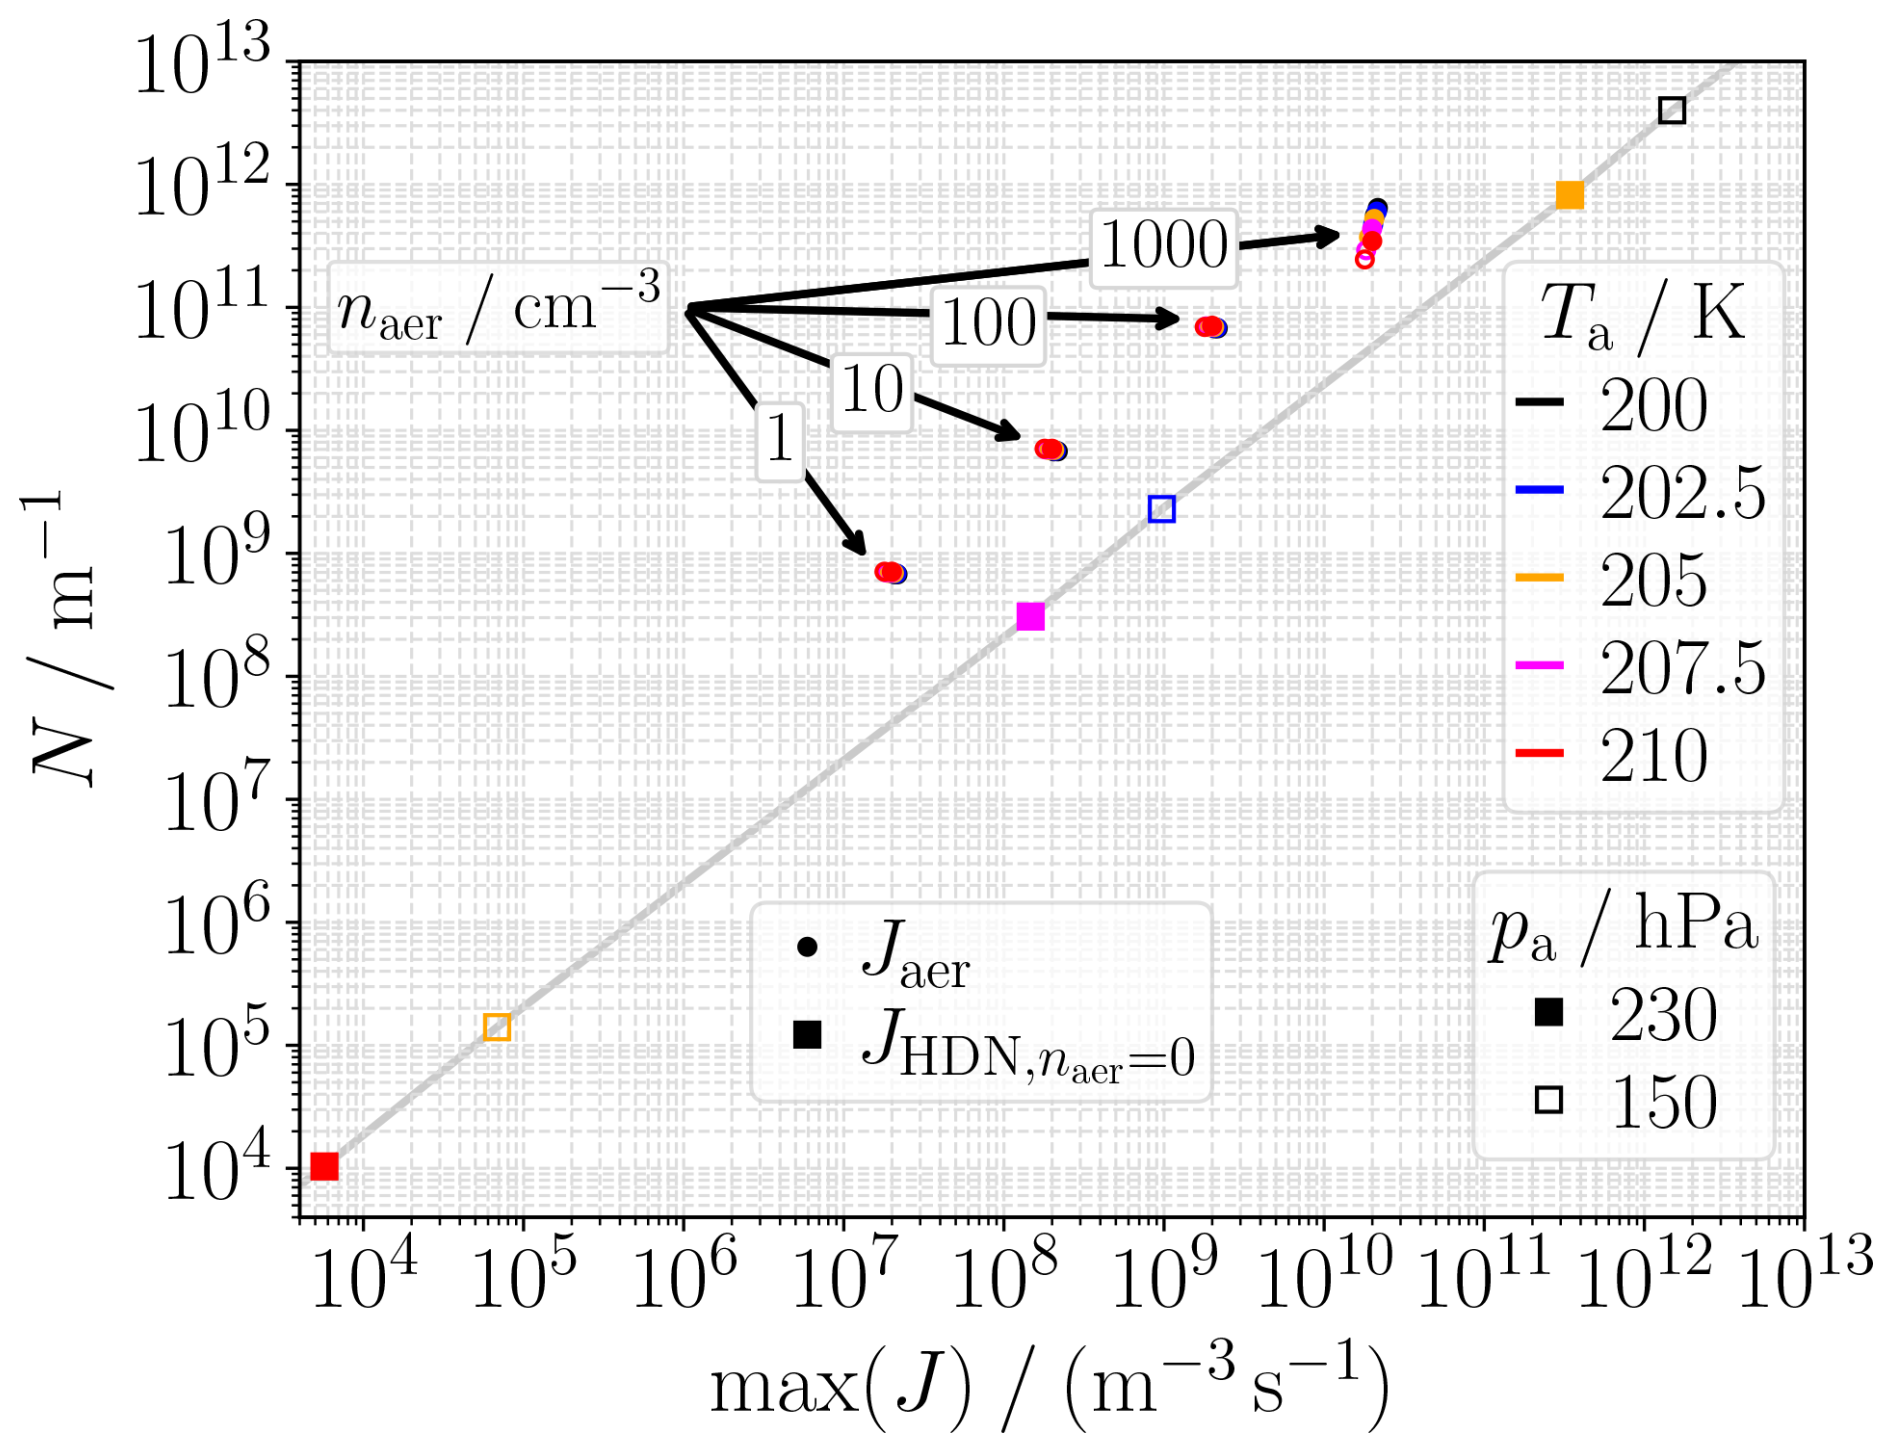
Figure B1Maximum of nucleation rate max(J) and integrated number for different combinations of ambient temperature Ta (indicated by color) and pressure pa (filled vs. unfilled markers). Results are presented for droplet activation on ambient aerosols (circle markers), obtained from box-model simulations using several aerosol number concentrations naer. Moreover, results are shown for the HDN rates that would arise if the plume relative humidity and temperature evolved along the mixing line (square markers). These results are connected by the grey line.
The box-model simulation results, together with the plotting scripts required to reproduce the figures presented in this study, are available in a Zenodo repository (https://doi.org/10.5281/zenodo.17977711, Zink, 2025).
JZ: Conceptualization, Data curation, Formal analysis, Investigation, Methodology, Software, Validation, Visualization, Writing – original draft, Writing – review and editing. SU: Conceptualization, Methodology, Funding acquisition, Software, Supervision, Project Administration, Writing – review and editing. UB: Discussion
The contact author has declared that none of the authors has any competing interests.
Publisher's note: Copernicus Publications remains neutral with regard to jurisdictional claims made in the text, published maps, institutional affiliations, or any other geographical representation in this paper. The authors bear the ultimate responsibility for providing appropriate place names. Views expressed in the text are those of the authors and do not necessarily reflect the views of the publisher.
This work contributes to the DLR internal project “H2CONTRAIL”. We thank Xavier Vancassel (ONERA) for providing CFD data on plume dilution. We thank Mattia Righi for an internal review of the paper draft. Furthermore, we thank Cornelius Weiß-Rehm, and Charles Renard for their comments. The language was polished with the help of ChatGPT.
The article processing charges for this open-access publication were covered by the German Aerospace Center (DLR). All authors received funding from Airbus SAS.
This paper was edited by Carsten Warneke and reviewed by four anonymous referees.
Ajanovic, A., Sayer, M., and Haas, R.: The economics and the environmental benignity of different colors of hydrogen, International Journal of Hydrogen Energy, 47, 24136–24154, https://doi.org/10.1016/j.ijhydene.2022.02.094, 2022. a
Appleman, H.: The formation of exhaust condensation trails by jet aircraft, Bull. Am. Meteorol. Soc., 34, 14–20, 1953. a
Beer, C. G., Hendricks, J., Righi, M., Heinold, B., Tegen, I., Groß, S., Sauer, D., Walser, A., and Weinzierl, B.: Modelling mineral dust emissions and atmospheric dispersion with MADE3 in EMAC v2.54, Geosci. Model Dev., 13, 4287–4303, https://doi.org/10.5194/gmd-13-4287-2020, 2020. a
Bier, A. and Burkhardt, U.: Variability in Contrail Ice Nucleation and Its Dependence on Soot Number Emissions, J. Geophys. Res., 124, 3384–3400, https://doi.org/10.1029/2018JD029155, 2019. a
Bier, A. and Burkhardt, U.: Impact of Parametrizing Microphysical Processes in the Jet and Vortex Phase on Contrail Cirrus Properties and Radiative Forcing, J. Geophys. Res., 127, e2022JD036677, https://doi.org/10.1029/2022JD036677, 2022. a, b
Bier, A., Burkhardt, U., and Bock, L.: Synoptic Control of Contrail Cirrus Life Cycles and Their Modification Due to Reduced Soot Number Emissions, J. Geophys. Res., 122, 11584–11603, https://doi.org/10.1002/2017JD027011, 2017. a
Bier, A., Unterstrasser, S., and Vancassel, X.: Box model trajectory studies of contrail formation using a particle-based cloud microphysics scheme, Atmos. Chem. Phys., 22, 823–845, https://doi.org/10.5194/acp-22-823-2022, 2022. a, b, c, d, e
Bier, A., Unterstrasser, S., Zink, J., Hillenbrand, D., Jurkat-Witschas, T., and Lottermoser, A.: Contrail formation on ambient aerosol particles for aircraft with hydrogen combustion: a box model trajectory study, Atmos. Chem. Phys., 24, 2319–2344, https://doi.org/10.5194/acp-24-2319-2024, 2024. a, b, c, d, e, f, g, h, i, j, k, l, m, n, o, p, q, r, s, t, u, v
Blue Condor: DLR press release for Blue Condor Campaign, DLR, https://www.dlr.de/en/latest/news/2025/, last access: 4 February 2025. a
Bock, L. and Burkhardt, U.: The temporal evolution of a long-lived contrail cirrus cluster: Simulations with a global climate model, J. Geophys. Res., 121, 3548–3565, https://doi.org/10.1002/2015JD024475, 2016. a
Borrmann, S., Kunkel, D., Weigel, R., Minikin, A., Deshler, T., Wilson, J. C., Curtius, J., Volk, C. M., Homan, C. D., Ulanovsky, A., Ravegnani, F., Viciani, S., Shur, G. N., Belyaev, G. V., Law, K. S., and Cairo, F.: Aerosols in the tropical and subtropical UT/LS: in-situ measurements of submicron particle abundance and volatility, Atmos. Chem. Phys., 10, 5573–5592, https://doi.org/10.5194/acp-10-5573-2010, 2010. a
Brock, C. A., Froyd, K. D., Dollner, M., Williamson, C. J., Schill, G., Murphy, D. M., Wagner, N. J., Kupc, A., Jimenez, J. L., Campuzano-Jost, P., Nault, B. A., Schroder, J. C., Day, D. A., Price, D. J., Weinzierl, B., Schwarz, J. P., Katich, J. M., Wang, S., Zeng, L., Weber, R., Dibb, J., Scheuer, E., Diskin, G. S., DiGangi, J. P., Bui, T., Dean-Day, J. M., Thompson, C. R., Peischl, J., Ryerson, T. B., Bourgeois, I., Daube, B. C., Commane, R., and Wofsy, S. C.: Ambient aerosol properties in the remote atmosphere from global-scale in situ measurements, Atmos. Chem. Phys., 21, 15023–15063, https://doi.org/10.5194/acp-21-15023-2021, 2021. a, b, c
Burkhardt, U. and Kärcher, B.: Process-based simulation of contrail cirrus in a global climate model, J. Geophys. Res., 114, D16201, https://doi.org/10.1029/2008JD011491, 2009. a
Burkhardt, U., Bock, L., and Bier, A.: Mitigating the contrail cirrus climate impact by reducing aircraft soot number emissions, npj Climate and Atmospheric Science, 1, 37, https://doi.org/10.1038/s41612-018-0046-4, 2018. a
Decker, Z. C. J., Alpert, P. A., Ammann, M., Anet, J. G., Bauer, M., Cui, T., Durdina, L., Edebeli, J., Gysel-Beer, M., Prévôt, A. S. H., Qi, L., Slowik, J. G., Spirig, C., Tinorua, S., Ungeheuer, F., Vogel, A., Zhang, J., and Brem, B. T.: Emission and Formation of Aircraft Engine Oil Ultrafine Particles, ACS ES&T Air, 1, 1662–1672, https://doi.org/10.1021/acsestair.4c00184, 2024. a
Dincer, I. and Acar, C.: Review and evaluation of hydrogen production methods for better sustainability, International Journal of Hydrogen Energy, 40, 11094–11111, https://doi.org/10.1016/j.ijhydene.2014.12.035, 2015. a
Gettelman, A. and Chen, C.: The climate impact of aviation aerosols, Geophys. Res. Lett., 40, 2785–2789, https://doi.org/10.1002/grl.50520, 2013. a
Grabowski, W. W., Morrison, H., Shima, S.-i., Abade, G. C., Dziekan, P., and Pawlowska, H.: Modeling of Cloud Microphysics: Can We Do Better?, Bull. Am. Meteorol. Soc., 100, 655–672, https://doi.org/10.1175/BAMS-D-18-0005.1, 2019. a
Hauglustaine, D., Paulot, F., Collins, W., Derwent, R., Sand, M., and Boucher, O.: Climate benefit of a future hydrogen economy, Commun. Earth Environ., 3, 295, https://doi.org/10.1038/s43247-022-00626-z, 2022. a
Haywood, J. M., Allan, R. P., Bornemann, J., Forster, P. M., Francis, P. N., Milton, S., Rädel, G., Rap, A., Shine, K. P., and Thorpe, R.: A case study of the radiative forcing of persistent contrails evolving into contrail-induced cirrus, J. Geophys. Res., 114, D24201, https://doi.org/10.1029/2009JD012650, 2009. a
Hermann, J., Heintzenberg, J., Wiedensohler, A., Zahn, A., Heinrich, G., and Brenninkmeijer, C. A. M.: Meridional distributions of aerosol particle number concentrations in the upper troposphere and lower stratosphere obtained by Civil Aircraft for Regular Investigation of the Atmosphere Based on an Instrument Container (CARIBIC) flights, J. Geophys. Res., 108, 4114, https://doi.org/10.1029/2001JD001077, 2003. a, b
Hoelzen, J., Flohr, M., Silberhorn, D., Mangold, J., Bensmann, A., and Hanke-Rauschenbach, R.: H2-powered aviation at airports – Design and economics of LH2 refueling systems, Energy Conversion and Management: X, 14, 100206, https://doi.org/10.1016/j.ecmx.2022.100206, 2022. a
Jensen, E., Ackerman, A., Stevens, D., Toon, O., and Minnis, P.: Spreading and growth of contrails in a sheared environment, J. Geophys. Res., 103, 31557–31568, 1998. a
Kaiser, C., Hendricks, J., Righi, M., Jöckel, P., Tost, H., Kandler, K., Weinzierl, B., Sauer, D., Heimerl, K., Schwarz, J. P., Perring, A. E., and Popp, T.: Global aerosol modeling with MADE3 (v3.0) in EMAC (based on v2.53): model description and evaluation, Geosci. Model Dev., 12, 541–579, https://doi.org/10.5194/gmd-12-541-2019, 2019. a, b, c
Kärcher, B. and Yu, F.: Role of aircraft soot emissions in contrail formation, Geophys. Res. Lett., 36, L01804, https://doi.org/10.1029/2008GL036649, 2009. a, b, c
Kärcher, B., Burkhardt, U., Bier, A., Bock, L., and Ford, I. J.: The microphysical pathway to contrail formation, J. Geophys. Res., 120, 7893–7927, https://doi.org/10.1002/2015JD023491, 2015. a, b, c, d
Kleine, J., Voigt, C., Sauer, D., Schlager, H., Scheibe, M., Jurkat-Witschas, T., Kaufmann, S., Kärcher, B., and Anderson, B. E.: In Situ Observations of Ice Particle Losses in a Young Persistent Contrail, Geophys. Res. Lett., 45, 13553–13561, https://doi.org/10.1029/2018GL079390, 2018. a, b
Koop, T., Luo, B., Tsias, A., and Peter, T.: Water activity as the determinant for homogeneous ice nucleation in aqueous solutions, Nature, 406, 611–614, https://doi.org/10.1038/35020537, 2000. a, b
Kärcher, B., Turco, R. P., Yu, F., Danilin, M. Y., Weisenstein, D. K., Miake-Lye, R. C., and Busen, R.: A unified model for ultrafine aircraft particle emissions, J. Geophys. Res., 105, 29379–29386, https://doi.org/10.1029/2000JD900531, 2000. a
Laken, B. A., Pallé, E., Kniveton, D. R., Williams, C. J. R., and Kilham, D. A.: Contrails developed under frontal influences of the North Atlantic, J. Geophys. Res., 117, D11201, https://doi.org/10.1029/2011JD017019, 2012. a
Lee, D. S., Fahey, D. W., Skowron, A., Allen, M. R., Burkhardt, U., Chen, Q., Doherty, S. J., Freeman, S., Forster, P. M., Fuglestvedt, J., Gettelman, A., De León, R. R., Lim, L. L., Lund, M. T., Millar, R. J., Owen, B., Penner, J. E., Pitari, G., Prather, M. J., Sausen, R., and Wilcox, L. J.: The contribution of global aviation to anthropogenic climate forcing for 2000 to 2018, Atmos. Environ., 244, 117834, https://doi.org/10.1016/j.atmosenv.2020.117834, 2021. a
Lewellen, D. C.: Persistent contrails and contrail cirrus. Part 2: Full Lifetime Behavior, J. Atmos. Sci., 71, 4420–4438, https://doi.org/10.1175/JAS-D-13-0317.1, 2014. a
Lewellen, D. C.: A Large-Eddy Simulation Study of Contrail Ice Number Formation, J. Atmos. Sci., 77, 2585–2604, https://doi.org/10.1175/JAS-D-19-0322.1, 2020. a, b
Lottermoser, A. and Unterstrasser, S.: High-resolution modeling of early contrail evolution from hydrogen-powered aircraft, Atmos. Chem. Phys., 25, 7903–7924, https://doi.org/10.5194/acp-25-7903-2025, 2025. a, b
Minikin, A., Petzold, A., Ström, J., Krejci, R., Seifert, M., van Velthoven, P., Schlager, H., and Schumann, U.: Aircraft observations of the upper tropospheric fine particle aerosol in the Northern and Southern Hemispheres at midlatitudes, Geophys. Res. Lett., 30, 1503, https://doi.org/10.1029/2002GL016458, 2003. a
Murray, B. J., Broadley, S. L., Wilson, T. W., Bull, S. J., Wills, R. H., Christenson, H. K., and Murray, E. J.: Kinetics of the homogeneous freezing of water, Phys. Chem. Chem. Phys., 12, 10380, https://doi.org/10.1039/c003297b, 2010. a
Nikolaidis, P. and Poullikkas, A.: A comparative overview of hydrogen production processes, Renewable and Sustainable Energy Reviews, 67, 597–611, https://doi.org/10.1016/j.rser.2016.09.044, 2017. a
O, K.-T. and Wood, R.: Exploring an approximation for the homogeneous freezing temperature of water droplets, Atmos. Chem. Phys., 16, 7239–7249, https://doi.org/10.5194/acp-16-7239-2016, 2016. a, b
Ocko, I. B. and Hamburg, S. P.: Climate consequences of hydrogen emissions, Atmos. Chem. Phys., 22, 9349–9368, https://doi.org/10.5194/acp-22-9349-2022, 2022. a
Paoli, R. and Shariff, K.: Contrail Modeling and Simulation, Annu. Rev. Fluid Mech., 48, 393–427, https://doi.org/10.1146/annurev-fluid-010814-013619, 2016. a
Petters, M. D. and Kreidenweis, S. M.: A single parameter representation of hygroscopic growth and cloud condensation nucleus activity, Atmos. Chem. Phys., 7, 1961–1971, https://doi.org/10.5194/acp-7-1961-2007, 2007. a, b
Petzold, A. and Kärcher, B.: Aerosols in the Atmosphere, 37–53, Springer Berlin Heidelberg, ISBN 9783642301834, https://doi.org/10.1007/978-3-642-30183-4_3, 2012. a
Petzold, A., Döpelheuer, A., Brock, C. A., and Schröder, F.: In situ observations and model calculations of black carbon emission by aircraft at cruise altitude, J. Geophys. Res., 104, 22171–22181, https://doi.org/10.1029/1999JD900460, 1999. a
Petzold, A., Fiebig, M., Keil, A., Leiterer, U., Schröder, F., Stifter, A., Wendisch, M., and Wendling, P.: Vertical variability of aerosol properties observed at a continental site during the Lindenberg Aerosol Characterization Experiment (LACE 98), J. Geophys. Res., 107, 8128, https://doi.org/10.1029/2001JD001043, 2002. a
Ponsonby, J., King, L., Murray, B. J., and Stettler, M. E. J.: Jet aircraft lubrication oil droplets as contrail ice-forming particles, Atmos. Chem. Phys., 24, 2045–2058, https://doi.org/10.5194/acp-24-2045-2024, 2024. a, b, c
Ponsonby, J., Teoh, R., Kärcher, B., and Stettler, M.: An updated microphysical model for particle activation in contrails: the role of volatile plume particles, Atmos. Chem. Phys., 25, 18617–18637, https://doi.org/10.5194/acp-25-18617-2025, 2025. a, b
Richardson, E. S.: Contrail Formation Criterion for Assessment of Alternative Propulsion Technologies, Journal of Propulsion and Power, 41, 264–276, https://doi.org/10.2514/1.B39430, 2025. a
Riemer, N., Ault, A. P., West, M., Craig, R. L., and Curtis, J. H.: Aerosol Mixing State: Measurements, Modeling, and Impacts, Reviews of Geophysics, 57, 187–249, https://doi.org/10.1029/2018RG000615, 2019. a
Righi, M., Hendricks, J., and Beer, C. G.: Exploring the uncertainties in the aviation soot–cirrus effect, Atmos. Chem. Phys., 21, 17267–17289, https://doi.org/10.5194/acp-21-17267-2021, 2021. a
Righi, M., Hendricks, J., and Brinkop, S.: The global impact of the transport sectors on the atmospheric aerosol and the resulting climate effects under the Shared Socioeconomic Pathways (SSPs), Earth Syst. Dynam., 14, 835–859, https://doi.org/10.5194/esd-14-835-2023, 2023. a
Schmidt, E.: Die Entstehung von Eisnebel aus den Auspuffgasen von Flugmotoren, Schriften der Deutschen Akademie der Luftfahrtforschung, 44, 1–15, 1941. a
Schumann, U.: On conditions for contrail formation from aircraft exhausts, Meteorol. Z., 5, 4–23, https://doi.org/10.1127/metz/5/1996/4, 1996. a, b, c, d
Schumann, U.: A contrail cirrus prediction model, Geosci. Model Dev., 5, 543–580, https://doi.org/10.5194/gmd-5-543-2012, 2012. a
Schumann, U., Penner, J. E., Chen, Y., Zhou, C., and Graf, K.: Dehydration effects from contrails in a coupled contrail-climate model, Atmos. Chem. Phys., 15, 11179–11199, https://doi.org/10.5194/acp-15-11179-2015, 2015. a
Shima, S., Kusano, K., Kawano, A., Sugiyama, T., and Kawahara, S.: The super-droplet method for the numerical simulation of clouds and precipitation: a particle-based and probabilistic microphysics model coupled with a non-hydrostatic model, Q. J. R. Meteorol. Soc., 135, 1307–1320, https://doi.org/10.1002/qj.441, 2009. a
Sölch, I. and Kärcher, B.: A large-eddy model for cirrus clouds with explicit aerosol and ice microphysics and Lagrangian ice particle tracking, Q. J. R. Meteorol. Soc., 136, 2074–2093, https://doi.org/10.1002/qj.689, 2010. a
Sölch, I. and Kärcher, B.: Process-oriented large-eddy simulations of a midlatitude cirrus cloud system based on observations, Q. J. R. Meteorol. Soc., 137, 374–393, https://doi.org/10.1002/qj.764, 2011. a
Soleymani, M., Mostafavi, V., Hebert, M., Kelouwani, S., and Boulon, L.: Hydrogen propulsion systems for aircraft, a review on recent advances and ongoing challenges, International Journal of Hydrogen Energy, 91, 137–171, https://doi.org/10.1016/j.ijhydene.2024.10.131, 2024. a, b
Staffell, I., Scamman, D., Velazquez Abad, A., Balcombe, P., Dodds, P. E., Ekins, P., Shah, N., and Ward, K. R.: The role of hydrogen and fuel cells in the global energy system, Energy & Environmental Science, 12, 463–491, https://doi.org/10.1039/c8ee01157e, 2019. a
Sussmann, R. and Gierens, K.: Lidar and numerical studies on the different evolution of vortex pair and secondary wake in young contrails, J. Geophys. Res., 104, 2131–2142, https://doi.org/10.1029/1998JD200034, 1999. a
Tarn, M. D., Sikora, S. N. F., Porter, G. C. E., Shim, J.-u., and Murray, B. J.: Homogeneous Freezing of Water Using Microfluidics, Micromachines, 12, 223, https://doi.org/10.3390/mi12020223, 2021. a
Tashie-Lewis, B. C. and Nnabuife, S. G.: Hydrogen Production, Distribution, Storage and Power Conversion in a Hydrogen Economy – A Technology Review, Chemical Engineering Journal Advances, 8, 100172, https://doi.org/10.1016/j.ceja.2021.100172, 2021. a
Tiwari, S., Pekris, M. J., and Doherty, J. J.: A review of liquid hydrogen aircraft and propulsion technologies, International Journal of Hydrogen Energy, 57, 1174–1196, https://doi.org/10.1016/j.ijhydene.2023.12.263, 2024. a, b
Ungeheuer, F., Caudillo, L., Ditas, F., Simon, M., van Pinxteren, D., Kilic, D., Rose, D., Jacobi, S., Kürten, A., Curtius, J., and Vogel, A. L.: Nucleation of jet engine oil vapours is a large source of aviation-related ultrafine particles, Commun. Earth Environ., 3, 1–8, https://doi.org/10.1038/s43247-022-00653-w, 2022. a, b
Unterstrasser, S.: Large eddy simulation study of contrail microphysics and geometry during the vortex phase and consequences on contrail-to-cirrus transition, J. Geophys. Res., 119, 7537–7555, https://doi.org/10.1002/2013JD021418, 2014. a
Unterstrasser, S.: Properties of young contrails – a parametrisation based on large-eddy simulations, Atmos. Chem. Phys., 16, 2059–2082, https://doi.org/10.5194/acp-16-2059-2016, 2016. a
Unterstrasser, S. and Gierens, K.: Numerical simulations of contrail-to-cirrus transition - Part 1: An extensive parametric study, Atmos. Chem. Phys., 10, 2017–2036, https://doi.org/10.5194/acp-10-2017-2010, 2010a. a
Unterstrasser, S. and Gierens, K.: Numerical simulations of contrail-to-cirrus transition - Part 2: Impact of initial ice crystal number, radiation, stratification, secondary nucleation and layer depth, Atmos. Chem. Phys., 10, 2037–2051, https://doi.org/10.5194/acp-10-2037-2010, 2010b. a
Unterstrasser, S. and Sölch, I.: Study of contrail microphysics in the vortex phase with a Lagrangian particle tracking model, Atmos. Chem. Phys., 10, 10003–10015, https://doi.org/10.5194/acp-10-10003-2010, 2010. a
Unterstrasser, S. and Sölch, I.: Optimisation of simulation particle number in a Lagrangian ice microphysical model, Geosci. Model Dev., 7, 695–709, https://doi.org/10.5194/gmd-7-695-2014, 2014. a
Unterstrasser, S., Gierens, K., and Spichtinger, P.: The evolution of contrail microphysics in the vortex phase, Meteorol. Z., 17, 145–156, https://doi.org/10.1127/0941-2948/2008/0273, 2008. a
Unterstrasser, S., Gierens, K., Sölch, I., and Lainer, M.: Numerical simulations of homogeneously nucleated natural cirrus and contrail-cirrus. Part 1: How different are they?, Meteorol. Z., 26, 621–642, https://doi.org/10.1127/metz/2016/0777, 2017a. a, b
Unterstrasser, S., Gierens, K., Sölch, I., and Wirth, M.: Numerical simulations of homogeneously nucleated natural cirrus and contrail-cirrus. Part 2: Interaction on local scale, Meteorol. Z., 26, 643–661, https://doi.org/10.1127/metz/2016/0780, 2017b. a
Unterstrasser, S., Hoffmann, F., and Lerch, M.: Collection/aggregation algorithms in Lagrangian cloud microphysical models: rigorous evaluation in box model simulations, Geosci. Model Dev., 10, 1521–1548, https://doi.org/10.5194/gmd-10-1521-2017, 2017c. a
Unterstrasser, S., Hoffmann, F., and Lerch, M.: Collisional growth in a particle-based cloud microphysical model: insights from column model simulations using LCM1D (v1.0), Geosci. Model Dev., 13, 5119–5145, https://doi.org/10.5194/gmd-13-5119-2020, 2020. a
Vancassel, X., Mirabel, P., and Garnier, F.: Numerical simulation of aerosols in an aircraft wake using a 3D LES solver and a detailed microphysical model, Int. J. Sustainable Aviation, 1, 139–159, https://doi.org/10.1504/IJSA.2014.065480, 2014. a
Voigt, C., Lelieveld, J., Schlager, H., Schneider, J., Curtius, J., Meerkötter, R., Sauer, D., Bugliaro, L., Bohn, B., Crowley, J. N., Erbertseder, T., Groß, S., Hahn, V., Li, Q., Mertens, M., Pöhlker, M. L., Pozzer, A., Schumann, U., Tomsche, L., Williams, J., Zahn, A., Andreae, M., Borrmann, S., Bräuer, T., Dörich, R., Dörnbrack, A., Edtbauer, A., Ernle, L., Fischer, H., Giez, A., Granzin, M., Grewe, V., Harder, H., Heinritzi, M., Holanda, B. A., Jöckel, P., Kaiser, K., Krüger, O. O., Lucke, J., Marsing, A., Martin, A., Matthes, S., Pöhlker, C., Pöschl, U., Reifenberg, S., Ringsdorf, A., Scheibe, M., Tadic, I., Zauner-Wieczorek, M., Henke, R., and Rapp, M.: Cleaner Skies during the COVID-19 Lockdown, Bull. Am. Meteorol. Soc., 103, E1796–E1827, https://doi.org/10.1175/BAMS-D-21-0012.1, 2022. a
Warwick, N. J., Archibald, A. T., Griffiths, P. T., Keeble, J., O'Connor, F. M., Pyle, J. A., and Shine, K. P.: Atmospheric composition and climate impacts of a future hydrogen economy, Atmos. Chem. Phys., 23, 13451–13467, https://doi.org/10.5194/acp-23-13451-2023, 2023. a
Wölk, J. and Strey, R.: Homogeneous Nucleation of H2O and D2O in Comparison: The Isotope Effect, The Journal of Physical Chemistry B, 105, 11683–11701, https://doi.org/10.1021/jp0115805, 2001. a, b
Wölk, J., Strey, R., Heath, C. H., and Wyslouzil, B. E.: Empirical function for homogeneous water nucleation rates, The Journal of Chemical Physics, 117, 4954–4960, https://doi.org/10.1063/1.1498465, 2002. a
Yu, F., Luo, G., Bates, T. S., Anderson, B., Clarke, A., Kapustin, V., Yantosca, R. M., Wang, Y., and Wu, S.: Spatial distributions of particle number concentrations in the global troposphere: Simulations, observations, and implications for nucleation mechanisms, J. Geophys. Res., 115, D17205, https://doi.org/10.1029/2009jd013473, 2010a. a
Yu, F., Kärcher, B., and Anderson, B. E.: Revisiting Contrail Ice Formation: Impact of Primary Soot Particle Sizes and Contribution of Volatile Particles, Environ. Sci. Technol., 58, 17650–17660, https://doi.org/10.1021/acs.est.4c04340, 2024. a, b, c
Yu, Z., Liscinsky, D. S., Winstead, E. L., True, B. S., Timko, M. T., Bhargava, A., Herndon, S. C., Miake-Lye, R. C., and Anderson, B. E.: Characterization of Lubrication Oil Emissions from Aircraft Engines, Environ. Sci. Technol., 44, 9530–9534, https://doi.org/10.1021/es102145z, 2010b. a
Yu, Z., Herndon, S. C., Ziemba, L. D., Timko, M. T., Liscinsky, D. S., Anderson, B. E., and Miake-Lye, R. C.: Identification of Lubrication Oil in the Particulate Matter Emissions from Engine Exhaust of In-Service Commercial Aircraft, Environ. Sci. Technol., 46, 9630–9637, https://doi.org/10.1021/es301692t, 2012. a
Zink, J.: Box model simulation results and plotting script for Part 1, Zenodo [data set], https://doi.org/10.5281/zenodo.17977711, 2025. a
Zink, J. and Unterstrasser, S.: Contrail formation for aircraft with hydrogen combustion – Part 2: Engine-related aspects, Atmos. Chem. Phys., 26, 3145–3165, https://doi.org/10.5194/acp-26-3145-2026, 2026. a, b, c
Zink, J., Unterstrasser, S., and Jurkat-Witschas, T.: On the Potential Role of Lubrication Oil Particles in Contrail Formation for Kerosene and Hydrogen Combustion, J. Geophys. Res., 130, e2025JD043487, https://doi.org/10.1029/2025jd043487, 2025. a, b, c