the Creative Commons Attribution 4.0 License.
the Creative Commons Attribution 4.0 License.
 | 07 Jan 2026
Surface radiation trends at North Slope of Alaska influenced by large-scale circulation and atmospheric rivers
Dan Lubin
Johannes Mülmenstädt
Andrew Vogelmann
Maria Cadeddu
Damao Zhang
Arctic amplification manifests as a pervasive warming trend emerging over the past century in near-surface air temperature throughout the Arctic that is double the globally averaged temperature increase throughout most of the year. It results from complex processes involving oceanic, atmospheric and terrestrial components which require detailed study to discern roles of the fundamental processes involved to improve predictions of the Arctic environment. We report on signals that are beginning to emerge, on a timescale predicted by recent satellite remote sensing studies, from the unique 25 year record of detailed surface-based radiometer measurements obtained by the US Department of Energy Atmospheric Radiation Measurement (ARM) Facility North Slope of Alaska (NSA) site at Utqiaġvik, Alaska. Statistically significant warming trends are found at the site in the boreal fall, while a decrease in net radiation occurs in late summer. This decrease is driven primarily by the decrease in shortwave radiation resulting from increasing cloud liquid water path as observed by the microwave radiometer. The magnitude of the liquid water path trends is slightly larger than the root mean square error (RMSE) due to natural variability, while the magnitude of the net radiation trends is smaller than the RMSE natural variability, emphasizing that these signals are only just emerging. Analysis of prevailing meteorological regimes linking NSA with the Arctic Ocean and subarctic latitudes, and atmospheric rivers, suggests that specific changing circulation patterns are the primary driver for these summertime trends.
- Article
(3571 KB) - Full-text XML
- BibTeX
- EndNote


Arctic amplification is recognized as a significant feature of the global climate system (Smith et al., 2017; Serreze and Barry, 2011). Its essence is a pervasive warming of near-surface air temperature throughout the Arctic over the past century, with warming since the start of the present century emerging as double the globally averaged temperature increase throughout most of the year although smaller during summer (Wendisch et al., 2023a). Arctic amplification is a complex process involving a wide variety of oceanic, atmospheric and terrestrial components. Some, including sea ice and ice sheet retreat, involve the long-recognized ice-albedo feedback. Others involve more recently studied land and biosphere changes, aerosol influences on both the surface ice and snow cover and cloud microphysics, and dynamical interaction with subarctic latitudes (Wendisch et al., 2023). Atmospheric components also include effects such as lapse rate and cloud optical depth feedbacks (Taylor et al., 2022). While Arctic amplification emerges consistently in Earth system model (ESM) simulations, large differences still exist within the simulated components requiring state-of-the-art observations to improve ESM physics and chemistry (e.g., Shupe et al., 2022).
Satellite remote sensing has played a vital role in the study of Arctic amplification (Esau et al., 2023). To date the most substantial remote sensing contributions have involved surface properties including trends in sea ice and ice sheet extent, and changes in land cover, while there has also been recent progress with satellite mapping of tropospheric aerosols (Swain et al., 2024). With respect to cloud properties and surface radiative fluxes, satellite remote sensing offers potential in the Arctic particularly over sea ice (Cesana et al., 2024), and related satellite remote sensing products have substantially informed Arctic climate model simulations (Tan and Storelvmo, 2019; Taylor et al., 2024; Tan et al., 2025) but significant retrieval uncertainties persist (e.g., Riihelä et al., 2017). Arctic surface and aircraft-based radiometric observations are an important resource for validating and refining satellite remote sensing retrievals (Smith et al., 2017; Di Biagio et al., 2020; Barrientos-Velasco et al., 2022), and, equally importantly, for detailed understanding of fundamental processes (Tjernström et al., 2014; Miller et al., 2017; Wendisch et al., 2023a).
A number of satellite remote sensing studies have focused on surface radiative fluxes and their governing cloud properties, particularly over the Arctic Ocean and during spring and autumn sea ice transitions (Wang and Key, 2005; Liu et al., 2008; Wang et al., 2012, 2021; Comiso and Hall, 2014; Huang et al., 2017; Sledd and L'Ecuyer, 2021; Lelli et al., 2023). With the larger uncertainties in satellite-based estimates of surface shortwave (SW) and longwave (LW) fluxes, as compared with the direct observations in this work, two of these studies have determined radiative forcing trends over 20 year periods that are not yet statistically significant, and have therefore reported a trend time of emergence (ToE) to 95 % statistical confidence (Sledd and L'Ecuyer, 2021; Lelli et al., 2023). Here we will show in situ observation trends emerging at 95 % confidence that are consistent with these satellite remote sensing projections.
One of the most advanced and comprehensive atmospheric observatories in the high Arctic is operated by the US Department of Energy (DOE) at Utqiaġvik, Alaska (71.323° N, 156.615° W), where the DOE Atmospheric Radiation Measurement (ARM) Facility maintains its North Slope of Alaska (NSA) Central Facility (Verlinde et al., 2016). Since the late 1990s the NSA suite of radiometric, cloud radar and lidar, and meteorological equipment has provided valuable climatological information about the region's cloud properties including seasonal variability (Dong and Mace, 2003) and comparison with other high latitude sites such as the Antarctic (Zhang et al., 2019; Desai et al., 2024). One important discovery from the modern instrumental era involving Arctic stratiform clouds is the persistence of radiatively significant liquid water content in all seasons and to temperatures even below 240 K (Intrieri et al., 2002; Shupe et al., 2013). Analysis of NSA data for mixed-phase clouds (Dong and Mace, 2003; Zhang et al., 2019) shows that cloud liquid water path (LWP) values as large as 60 g m−2 are frequently observed during winter, and values >100 g m−2 are frequently observed throughout the sunlit part of the year, with largest values during spring and autumn. For attenuation of SW radiation at the surface, liquid water content is the dominant component of the cloud optical depth in Arctic stratiform clouds (Lubin and Vogelmann, 2011). For this work NSA provides a nearly continuous time series of broadband SW and LW upwelling and downwelling surface radiation starting in 1999 (Michalsky and Long, 2016), and a similar time series of microwave radiometer (MWR) retrievals of cloud LWP and atmospheric precipitable water vapor (PWV) content starting in 2001 (Cadeddu et al., 2013). These data sets' consistency and quality control enables multidecadal trends in surface net radiative fluxes to now emerge with statistical significance, particularly during summer. Some of these trends are consistent with similarly emerging trends in MWR-measured PWV and LWP. Combining these NSA observations with ERA5 meteorological reanalysis data (Hersbach et al., 2020), we show that these radiation and cloud property trends result mainly from varying moisture transport between subarctic and high Arctic latitudes, as opposed to local feedback between the surface temperature and the column water vapor and cloud optical depth.
Meteorological data analysis is based on ERA5 (Hersbach et al., 2020). All radiometric quantities and cloud properties are from datasets in the DOE ARM Facility archive. Near-surface (2 m) air temperatures are obtained from ERA5 in the single grid cell containing the NSA site, because the ARM NSA meteorological datasets have many gaps during the earlier years. These 2 m air temperatures are diurnally averaged. We subdivide the year into 24 semi-monthly intervals, and average the diurnal averages over each of these intervals. This is to account for the large seasonal cycles in lower troposphere and 2 m temperature, and insolation. Averaging over these intervals, so that there is only one data point per year in the time series for trend analysis, also avoids the possibility of autocorrelation. This approach is also used for the radiative flux and MWR-derived quantities, and allows us to identify statistically significant trends and their physical causes. In this work trends are evaluated first using ordinary linear least squares (OLS), and second using a nonparametric Mann-Kendall (MK) test.
The upwelling and downwelling SW and LW radiative fluxes are obtained from the RADFLUX1LONG data product from September 2003 through November 2024. Between April 1999 and August 2003 the radiative fluxes are taken from the SKYRAD (downwelling) and GNDRAD (upwelling) data products. The measurement uncertainty in the ARM Facility broadband radiometers is relatively small, of order 5–10 W m−2 (Bush et al., 2000; Wang and Dickinson, 2013). During the overlap period between these products in September 2003 the discrepancies between the two are at least 1 order of magnitude smaller than a pyranometer's standard measurement uncertainty (e.g., Bush et al., 2000) and are therefore negligible. From these 1 min data the net (downwelling minus upwelling) fluxes are evaluated and averaged over each hour. PWV and LWP retrievals are obtained from the MWRRET data product. Before making hourly averages from the 30 s data, values of LWP >500 g m−2 are omitted as physically unrealistic and likely resulting from instrumental problems such as transient riming on the microwave antenna. In addition to natural variability, these quantities are expected to have larger uncertainty than the radiative fluxes due to their determination by a remote sensing algorithm as opposed to direct measurement. From the MWR typical PWV retrieval uncertainties are 5 % (Cadeddu et al., 2013) while LWP retrievals from the NSA MWR may be in the range 25–30 g m−2 (Turner, 2007); the latter being a large uncertainty compared with the climatological range in Arctic cloud LWP (Dong and Mace, 2003; Zhang et al., 2019).
The hourly averages of SW and LW fluxes, and PWV and LWP retrievals, are diurnally averaged then averaged over the semi-monthly interval if there are at least 5 d of data in the interval. Intervals with fewer than 5 d are omitted from the time series analysis. For the analysis involving single k-means clusters, these subsets often have fewer than 5 d of data in a semi-monthly interval. To maintain a useful sample size with these subsets while also minimizing the possibility of autocorrelation, adjacent days of data within an interval are averaged into one data point while isolated days are considered by themselves. The resulting variable sample sizes for these subsets are indicated in the figures showing k-means clustering results.
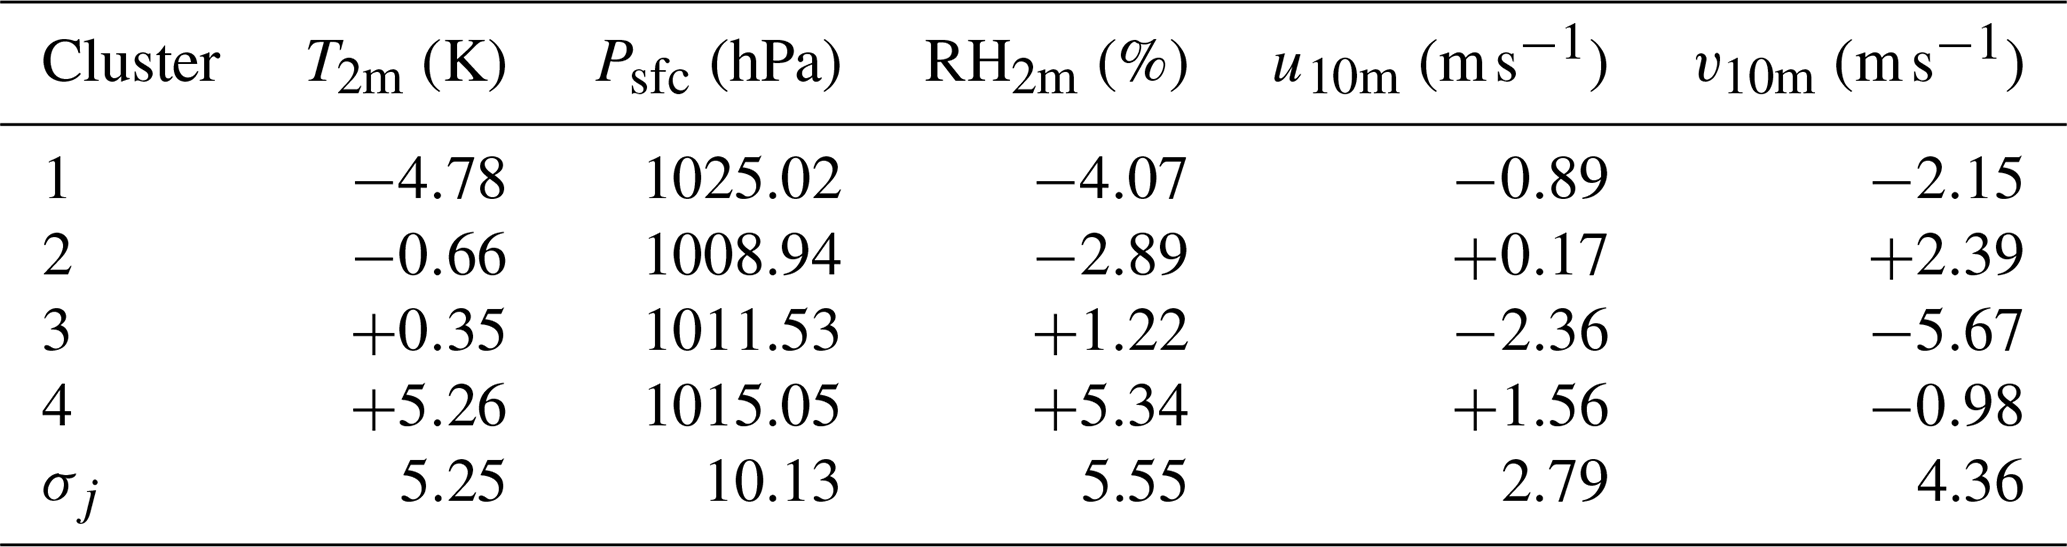
We employ k-means clustering analysis for meteorological regime identification following Mülmenstädt et al. (2012) using the fields: (1) 2 m air temperature anomaly, (2) surface pressure, (3) 2 m relative humidity anomaly, (4) 10 m zonal wind component, and (5) 10 meridional wind component. In this work the cluster centroids are evaluated from the ARM surface meteorology data (NSAMET) between 2004–2021. Anomalies are used for 2 m air temperature and relative humidity to account for the large seasonal variability. The anomalies are calculated relative to the 18 year mean for each month. To omit suspect data we let the ARM data ordering tool omit quality control-flagged data. Analysis was done using days when all five fields have no quality control flags. The k-means clustering was redone with this longer NSAMET dataset. Following Mülmenstädt et al. (2012) the number of clusters was determined by stability analysis against varying random choices of the initial cluster centroids, and four clusters emerges with this longer NSAMET time series as in the earlier work. A confusion matrix between the new and old (years 2004–2010) cluster classification results shows a constinency of > 90 %. The resulting cluster centroids μjk and their normalizations (σj) are shown in Table 1. To make the daily cluster identification in this work the five fields were taken from ERA5. The cluster to which a daily data point xj is associated is the one with minimum Euclidean distance:
where dk is evaluated for each of k clusters using j fields from Table 1.
Table 1Cluster centroids μjk and normalizations σj used to identify the specific meteorological regime in each day at NSA with ERA5 data.
Atmospheric rivers are detected over the NSA site following the polar-adapted AR scale (Zhang et al., 2024). Using ERA5 data with six-hourly time resolution in a 1° × 1° grid cell over the NSA site, the IVT is evaluated from the surface to the top of the atmosphere. IVT is calculated as follows:
where g is the gravity acceleration constant (m s−2), q is specific humidity (kg kg−1), u and v are zonal and meridional wind (m s−1), and dp is the differential pressure (hPa). If IVT > 100 for 24 h this is flagged as a Polar AR level 1 (AR P1). Durations exceeding 48 h then up to 72 h, or IVT increasing to 150–200 then 200–250 , promote the precursor AR to levels AR P2 and AR P3. Further increases in IVT into the range 250–1500 promote the event into the intensity strengths AR 1–5 with thresholds 250, 500, 750, 1000, 1250 and 1500 , respectively. These five thresholds are the same as in the global AR scale (Ralph et al., 2019). The three lower Polar AR thresholds are introduced to recognize that smaller IVT values transported in an AR frontal pattern can be associated with substantial impacts on a local cryosphere environment such as anomalous precipitation or surface melt.
3.1 Observed Trends in Radiative Fluxes and Cloud Properties
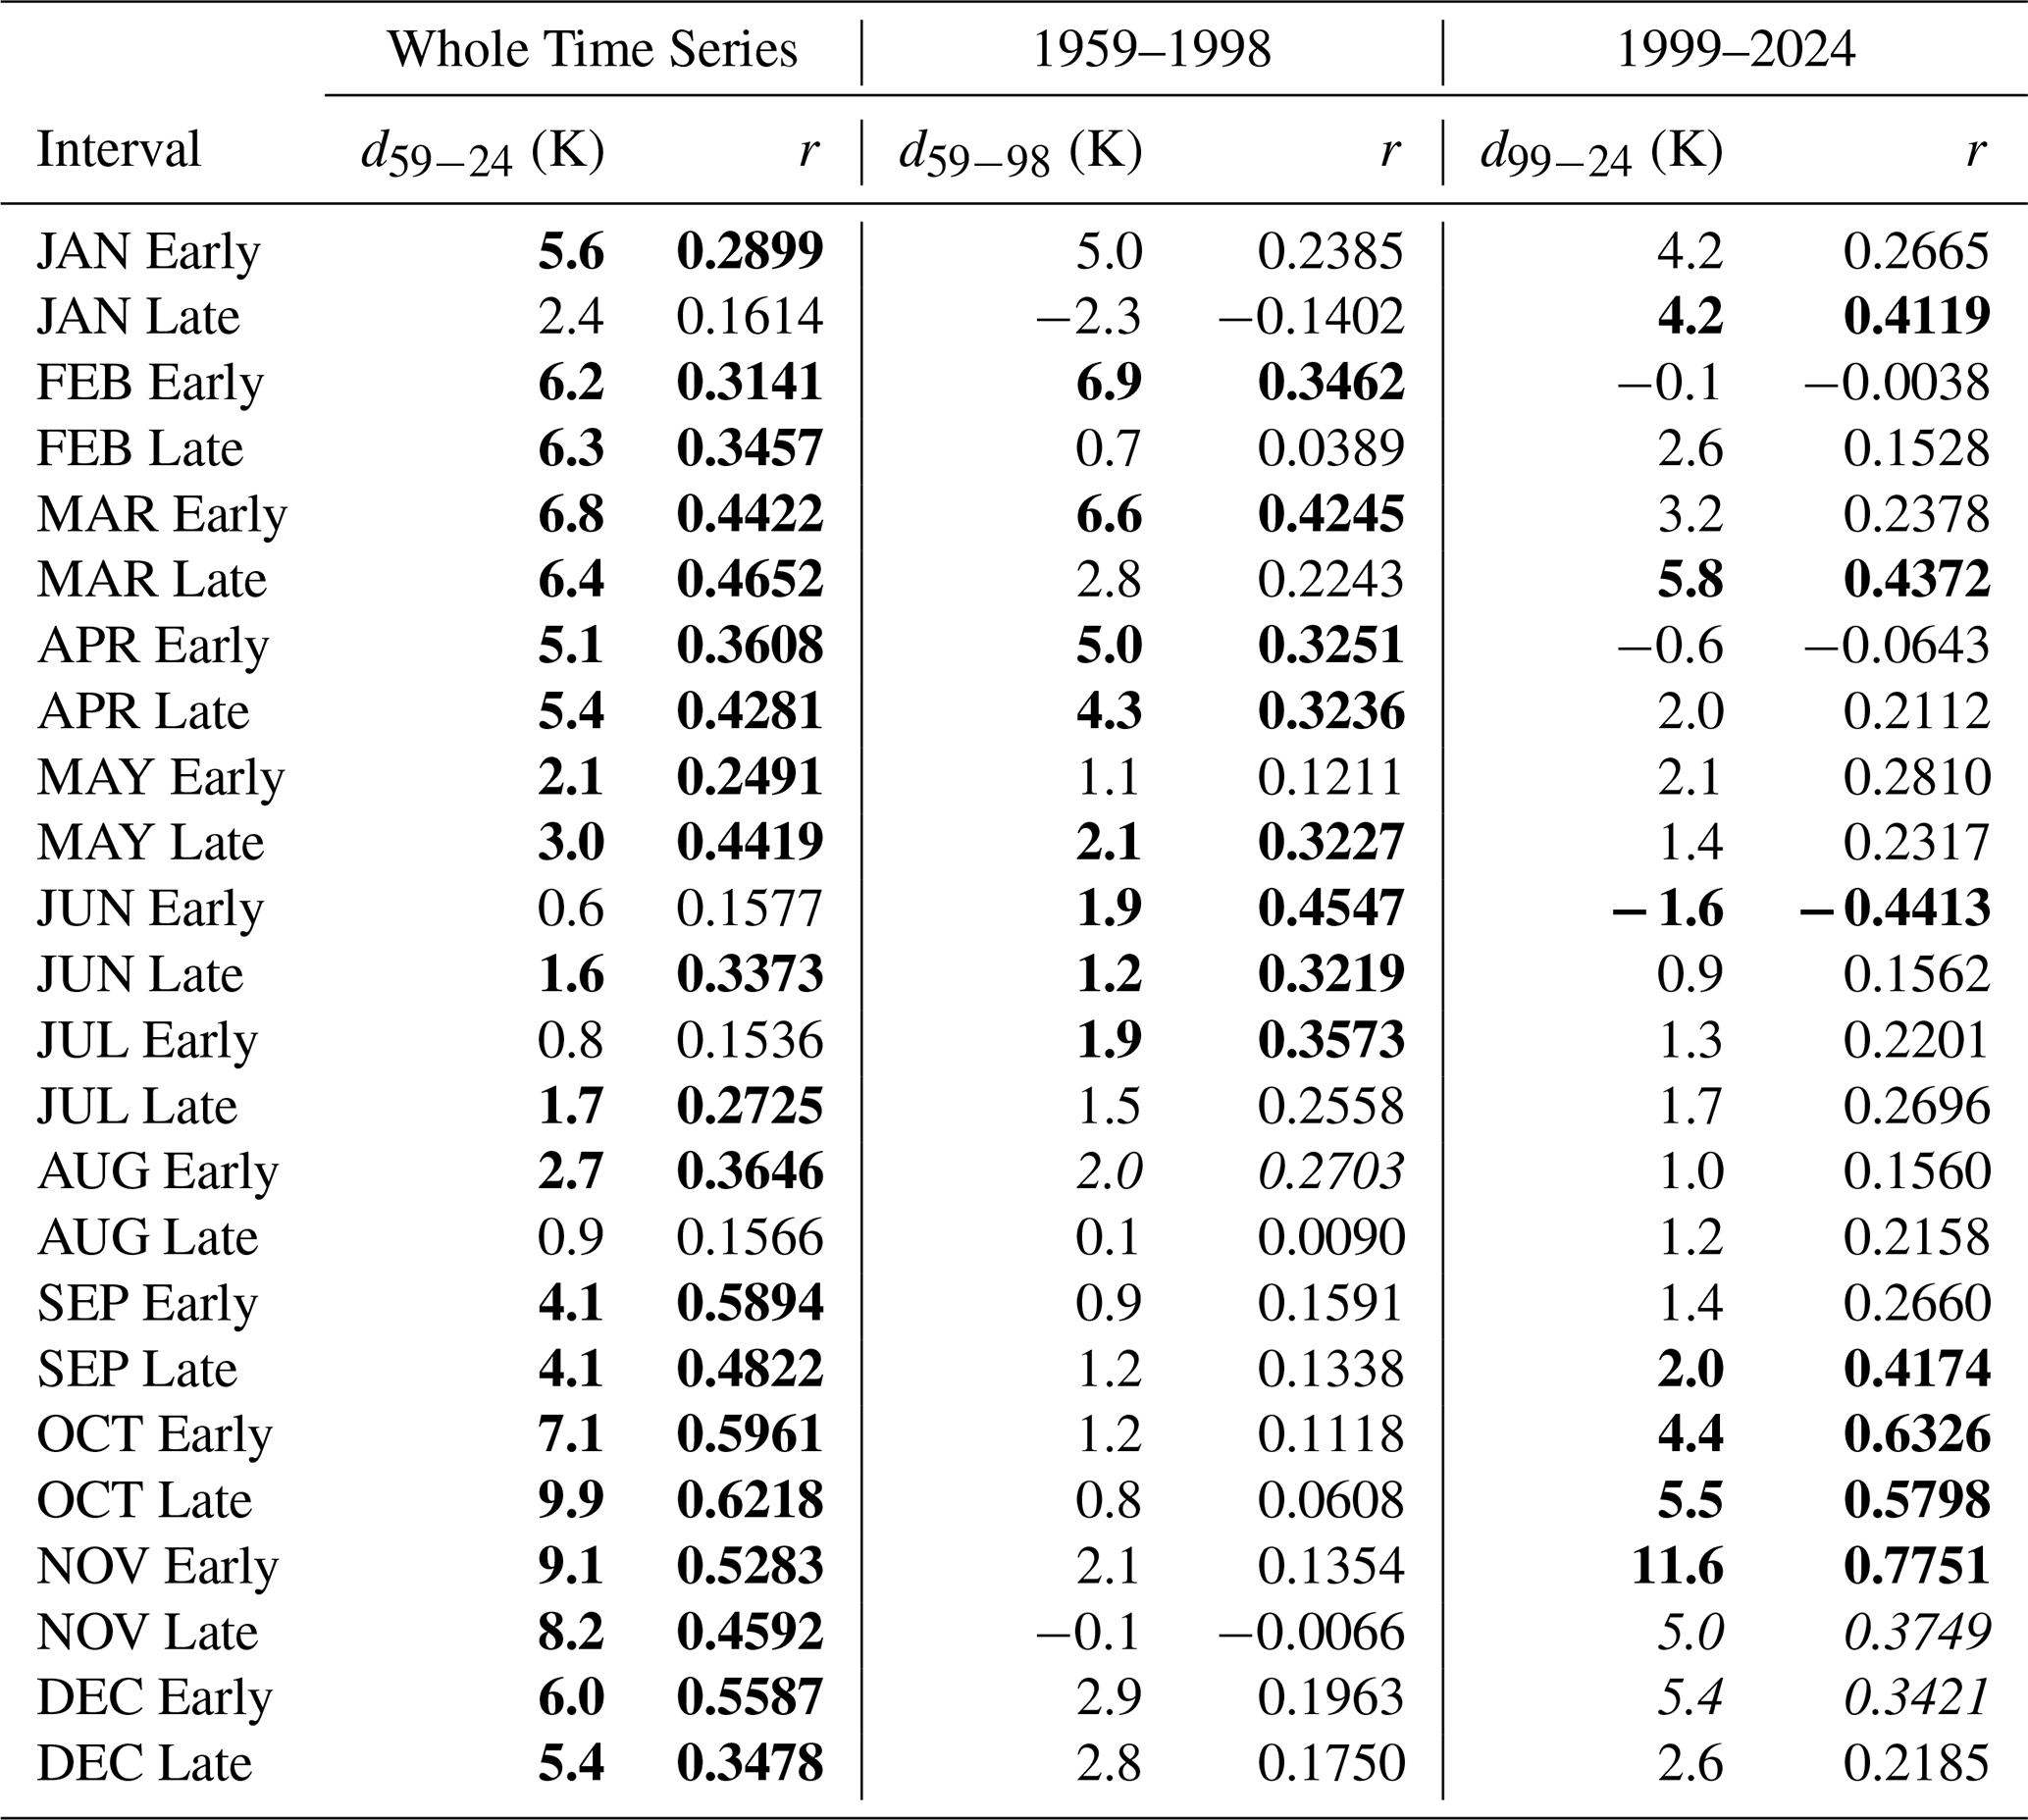
For orientation we first examine the trends in the near-surface (2 m) air temperature at NSA. Trends for the full ERA5 time series (1959–2024) and the period encompassing the ARM NSA Facility data (1999–2024) are given in Fig. 1 and Table 2. Over the full time series 20 of 24 intervals (83 %) show statistically significant upward trends, signifying that Arctic amplification has consistently warmed the NSA region beyond the global-mean warming trend of 0.2 °C per decade, over recent multidecadal timescales. Over the most recent 25 years there is less consistent statistical significance, and some colder intervals (FEB-Early, APR-Early and JUN-Early) show negative trends. The largest positive trends over the most recent 25 years occur during autumn and early winter, while summer positive trends are small and not statistically significant. This contrast in trend significance between the shorter and longer time series suggests that various components of Arctic amplification may be operating over NSA during different seasons and may also be time-varying, or that some trends may need more than 25 years to become statistically significant.
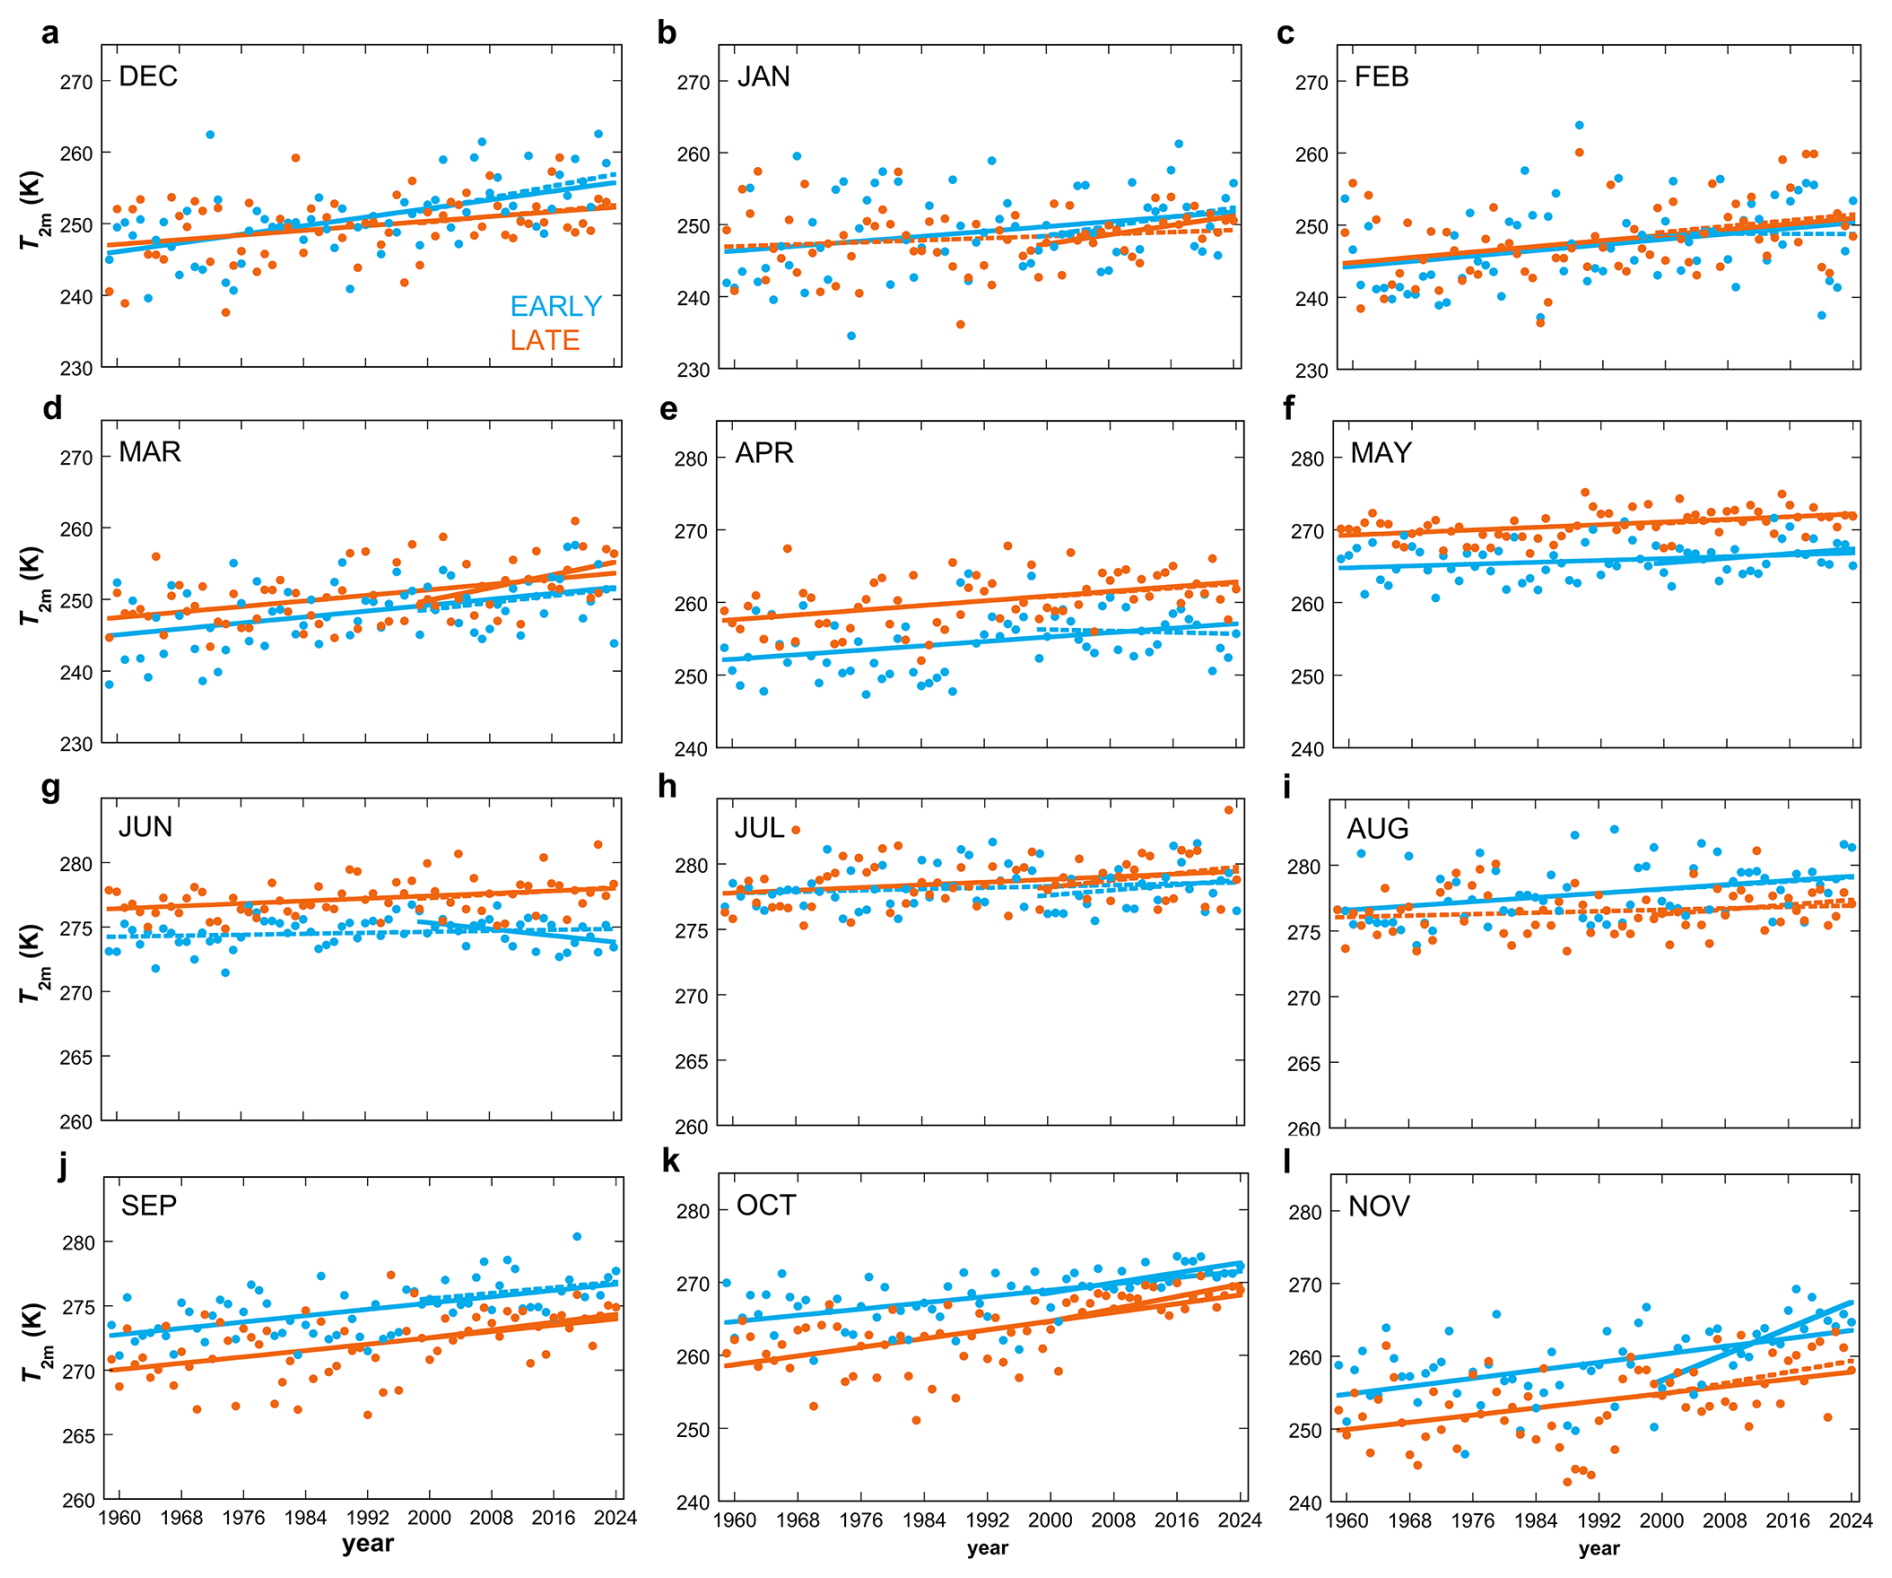
Figure 1Trends in the semi-monthly interval-averaged 2 m near-surface air temperature at the NSA site from ERA5 data, organized by month (a–l) and semi-monthly intervals (light blue for the first 2 weeks, orange for the second). For each interval two linear trend lines are shown, one for the full time series (1959–2024) and one for the period overlapping the NSA data (1999–2024). Trends that are statistically significant with two-tailed confidence are shown as solid lines, while trends with less statistical significance are shown as dotted lines.
Table 2Summary of ERA5 surface temperature trends at the NSA site. Shown for each timespan are the linear temperature change over the timespan and the Pearson correlation coefficient. Two-tailed (one-tailed) significant correlations are indicated in bold (italic).
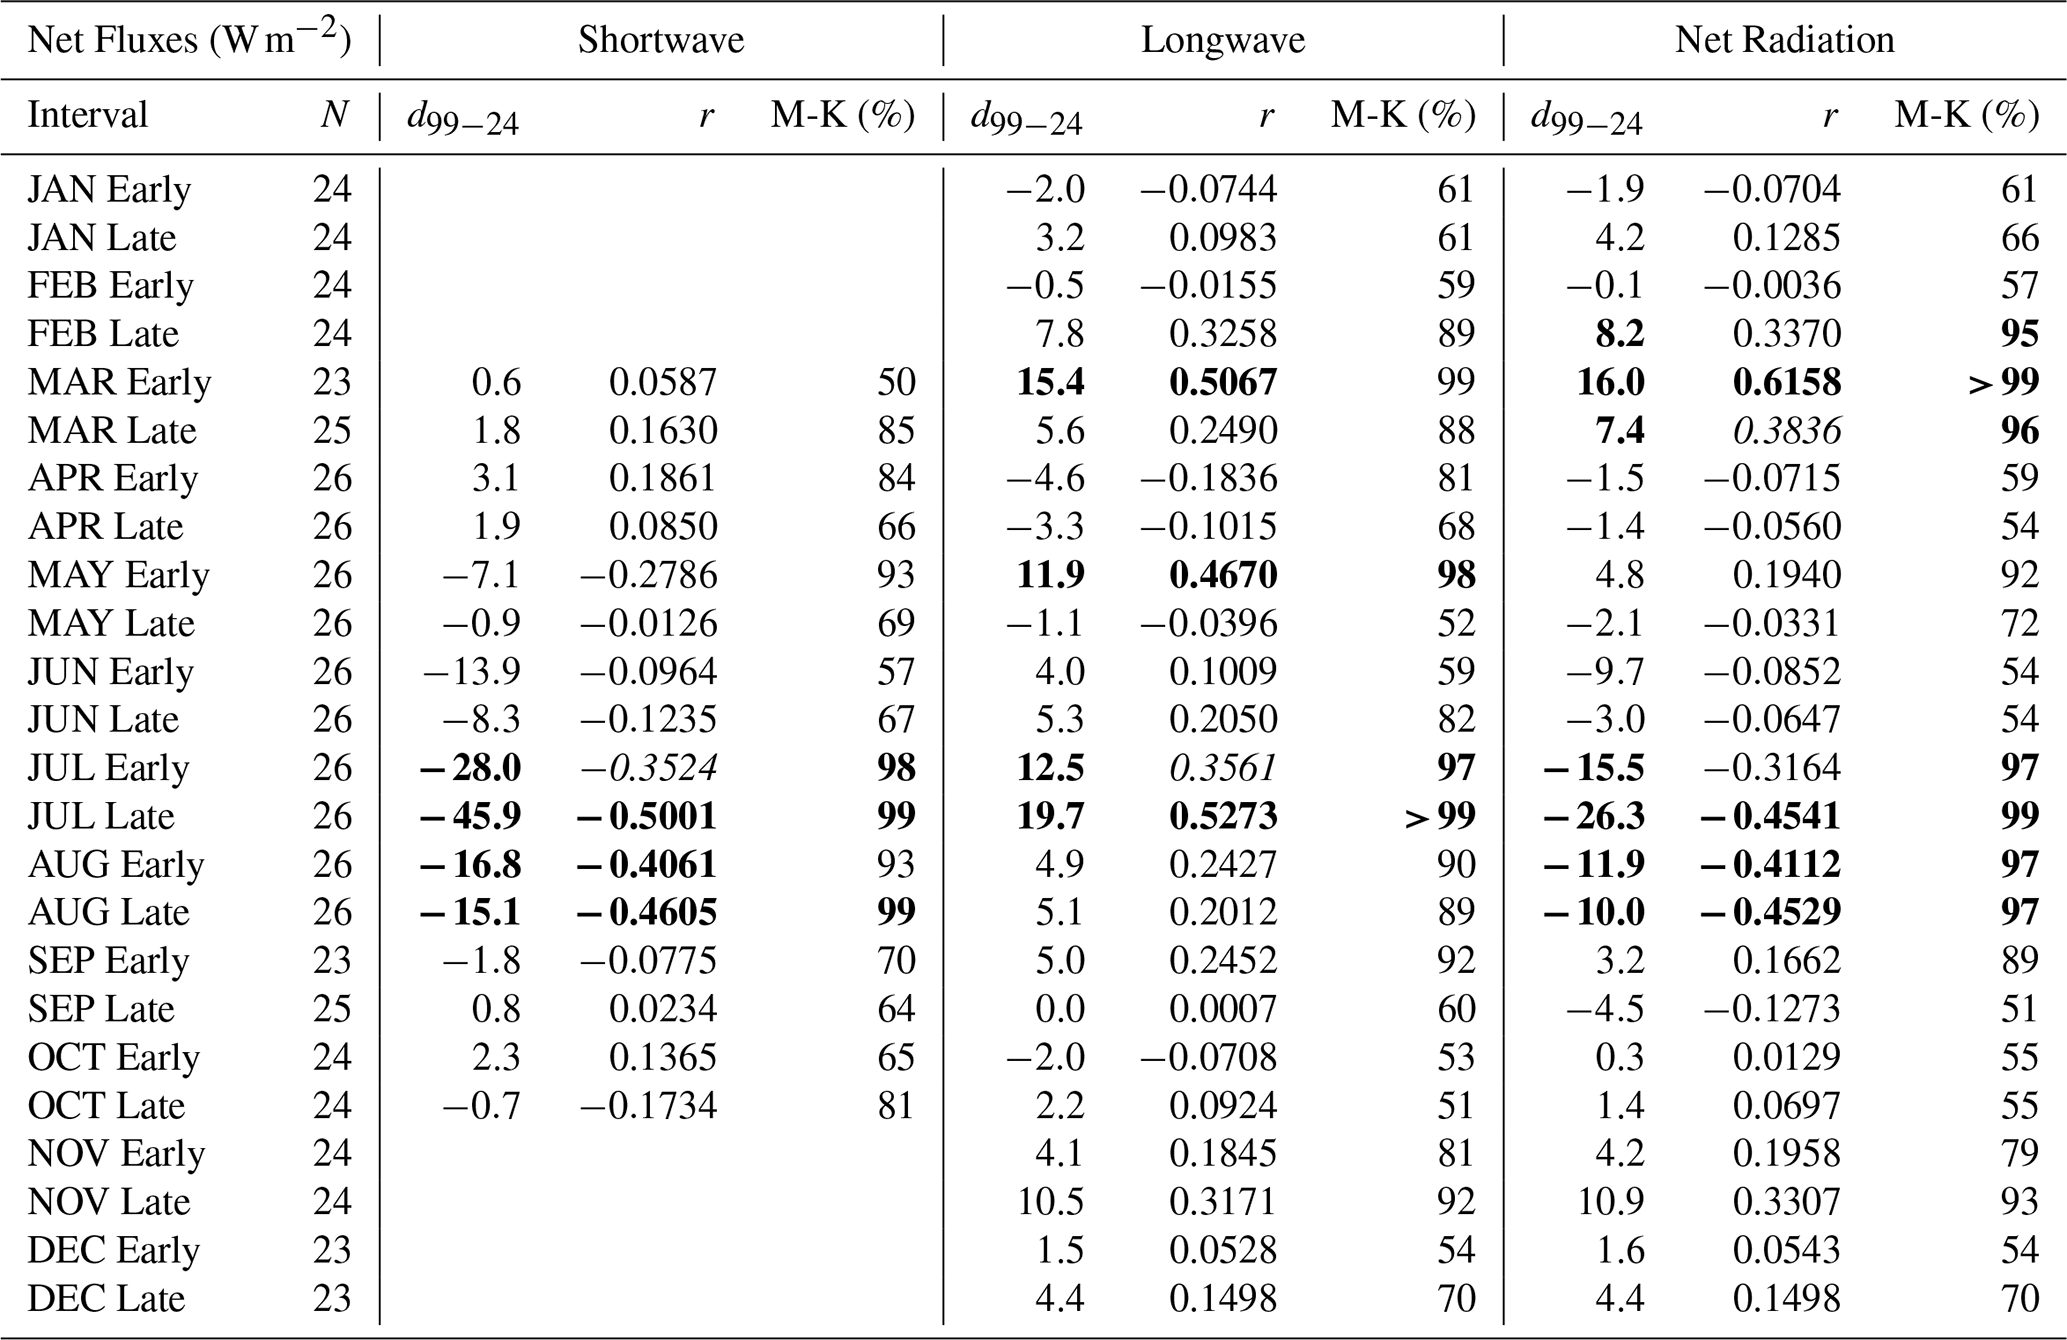
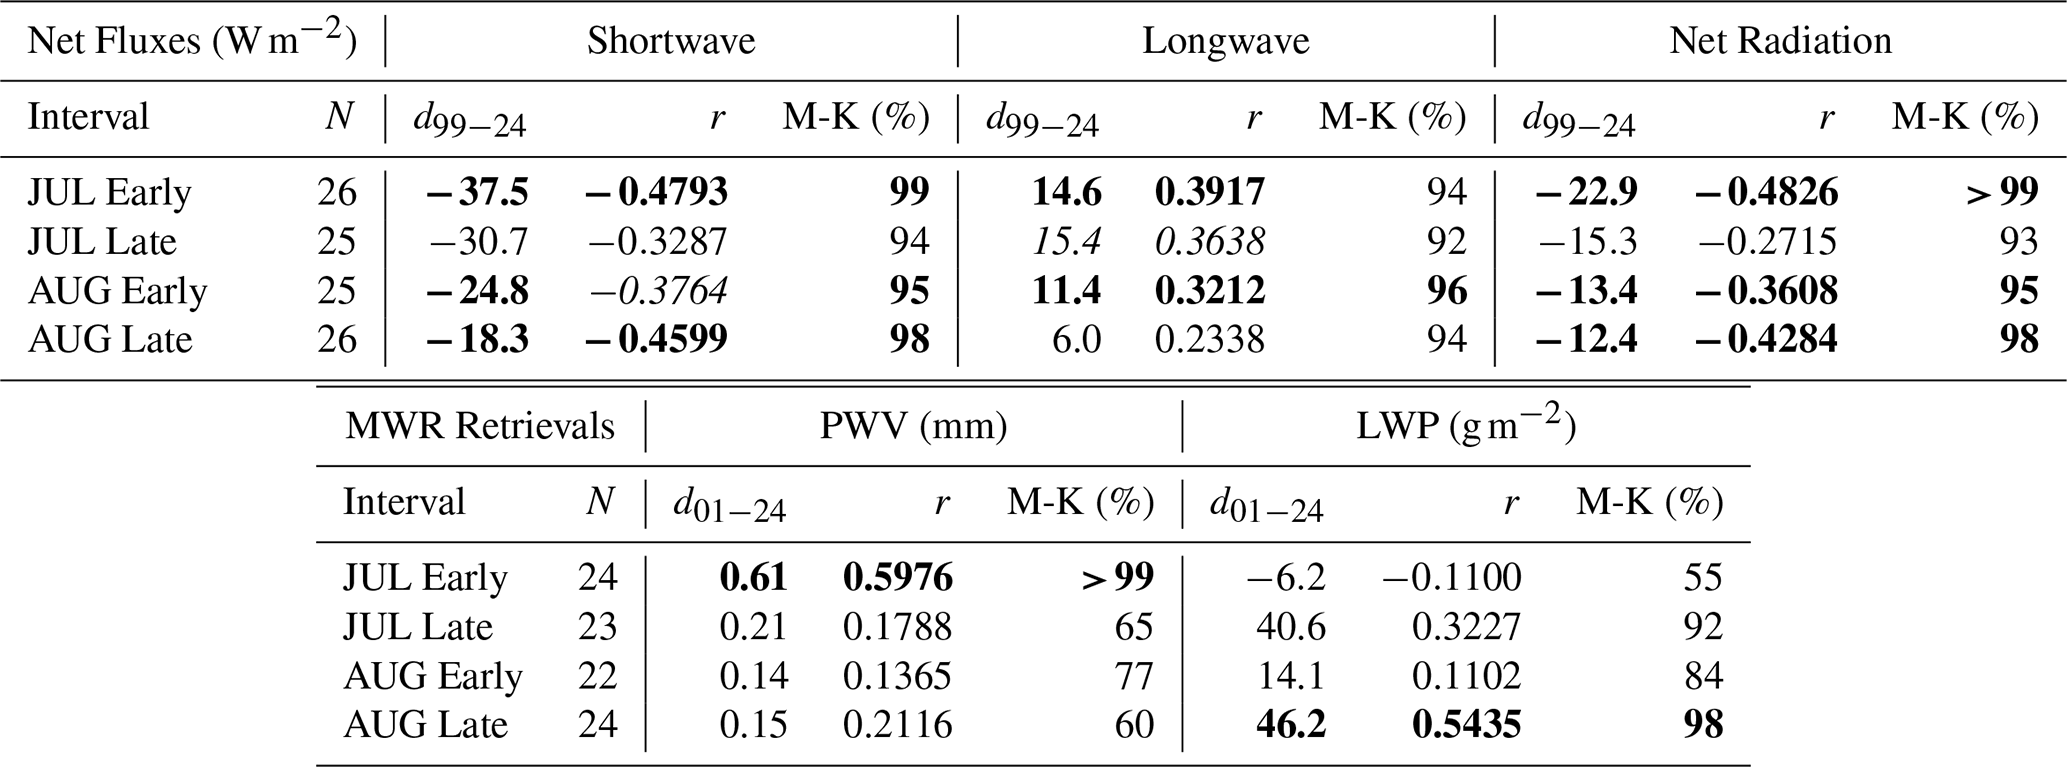
The trends in net radiative fluxes in the intervals with the most statistical significance are shown in Fig. 2, and the full set of net radiative flux trends is shown in Table 3. Given the measurement uncertainty in the ARM Facility broadband radiometers (of order 5–10 W m−2), the variability shown throughout Fig. 2 reflects mainly the natural variability in both cloud amount and optical depth. The most consistent statistical significance in the trends occurs during July and August, during which each of the intervals shows significance in two of the three quantities, net shortwave (SW), net longwave (LW) or their sum (Net). All four of these intervals show a decreasing SW trend with some degree of statistical significance. The LW trend is upward in all of these intervals, statistically significant in July but not in August. As the SW decreases outpace the LW increases the Net radiative flux in all four intervals shows a statistically significant downward trend. This is evidence of a gradual radiative surface cooling between 1999 and 2024, which might partially explain why the concomitant summer 2 m air temperature trends (Fig. 1) are small and not statistically significant.
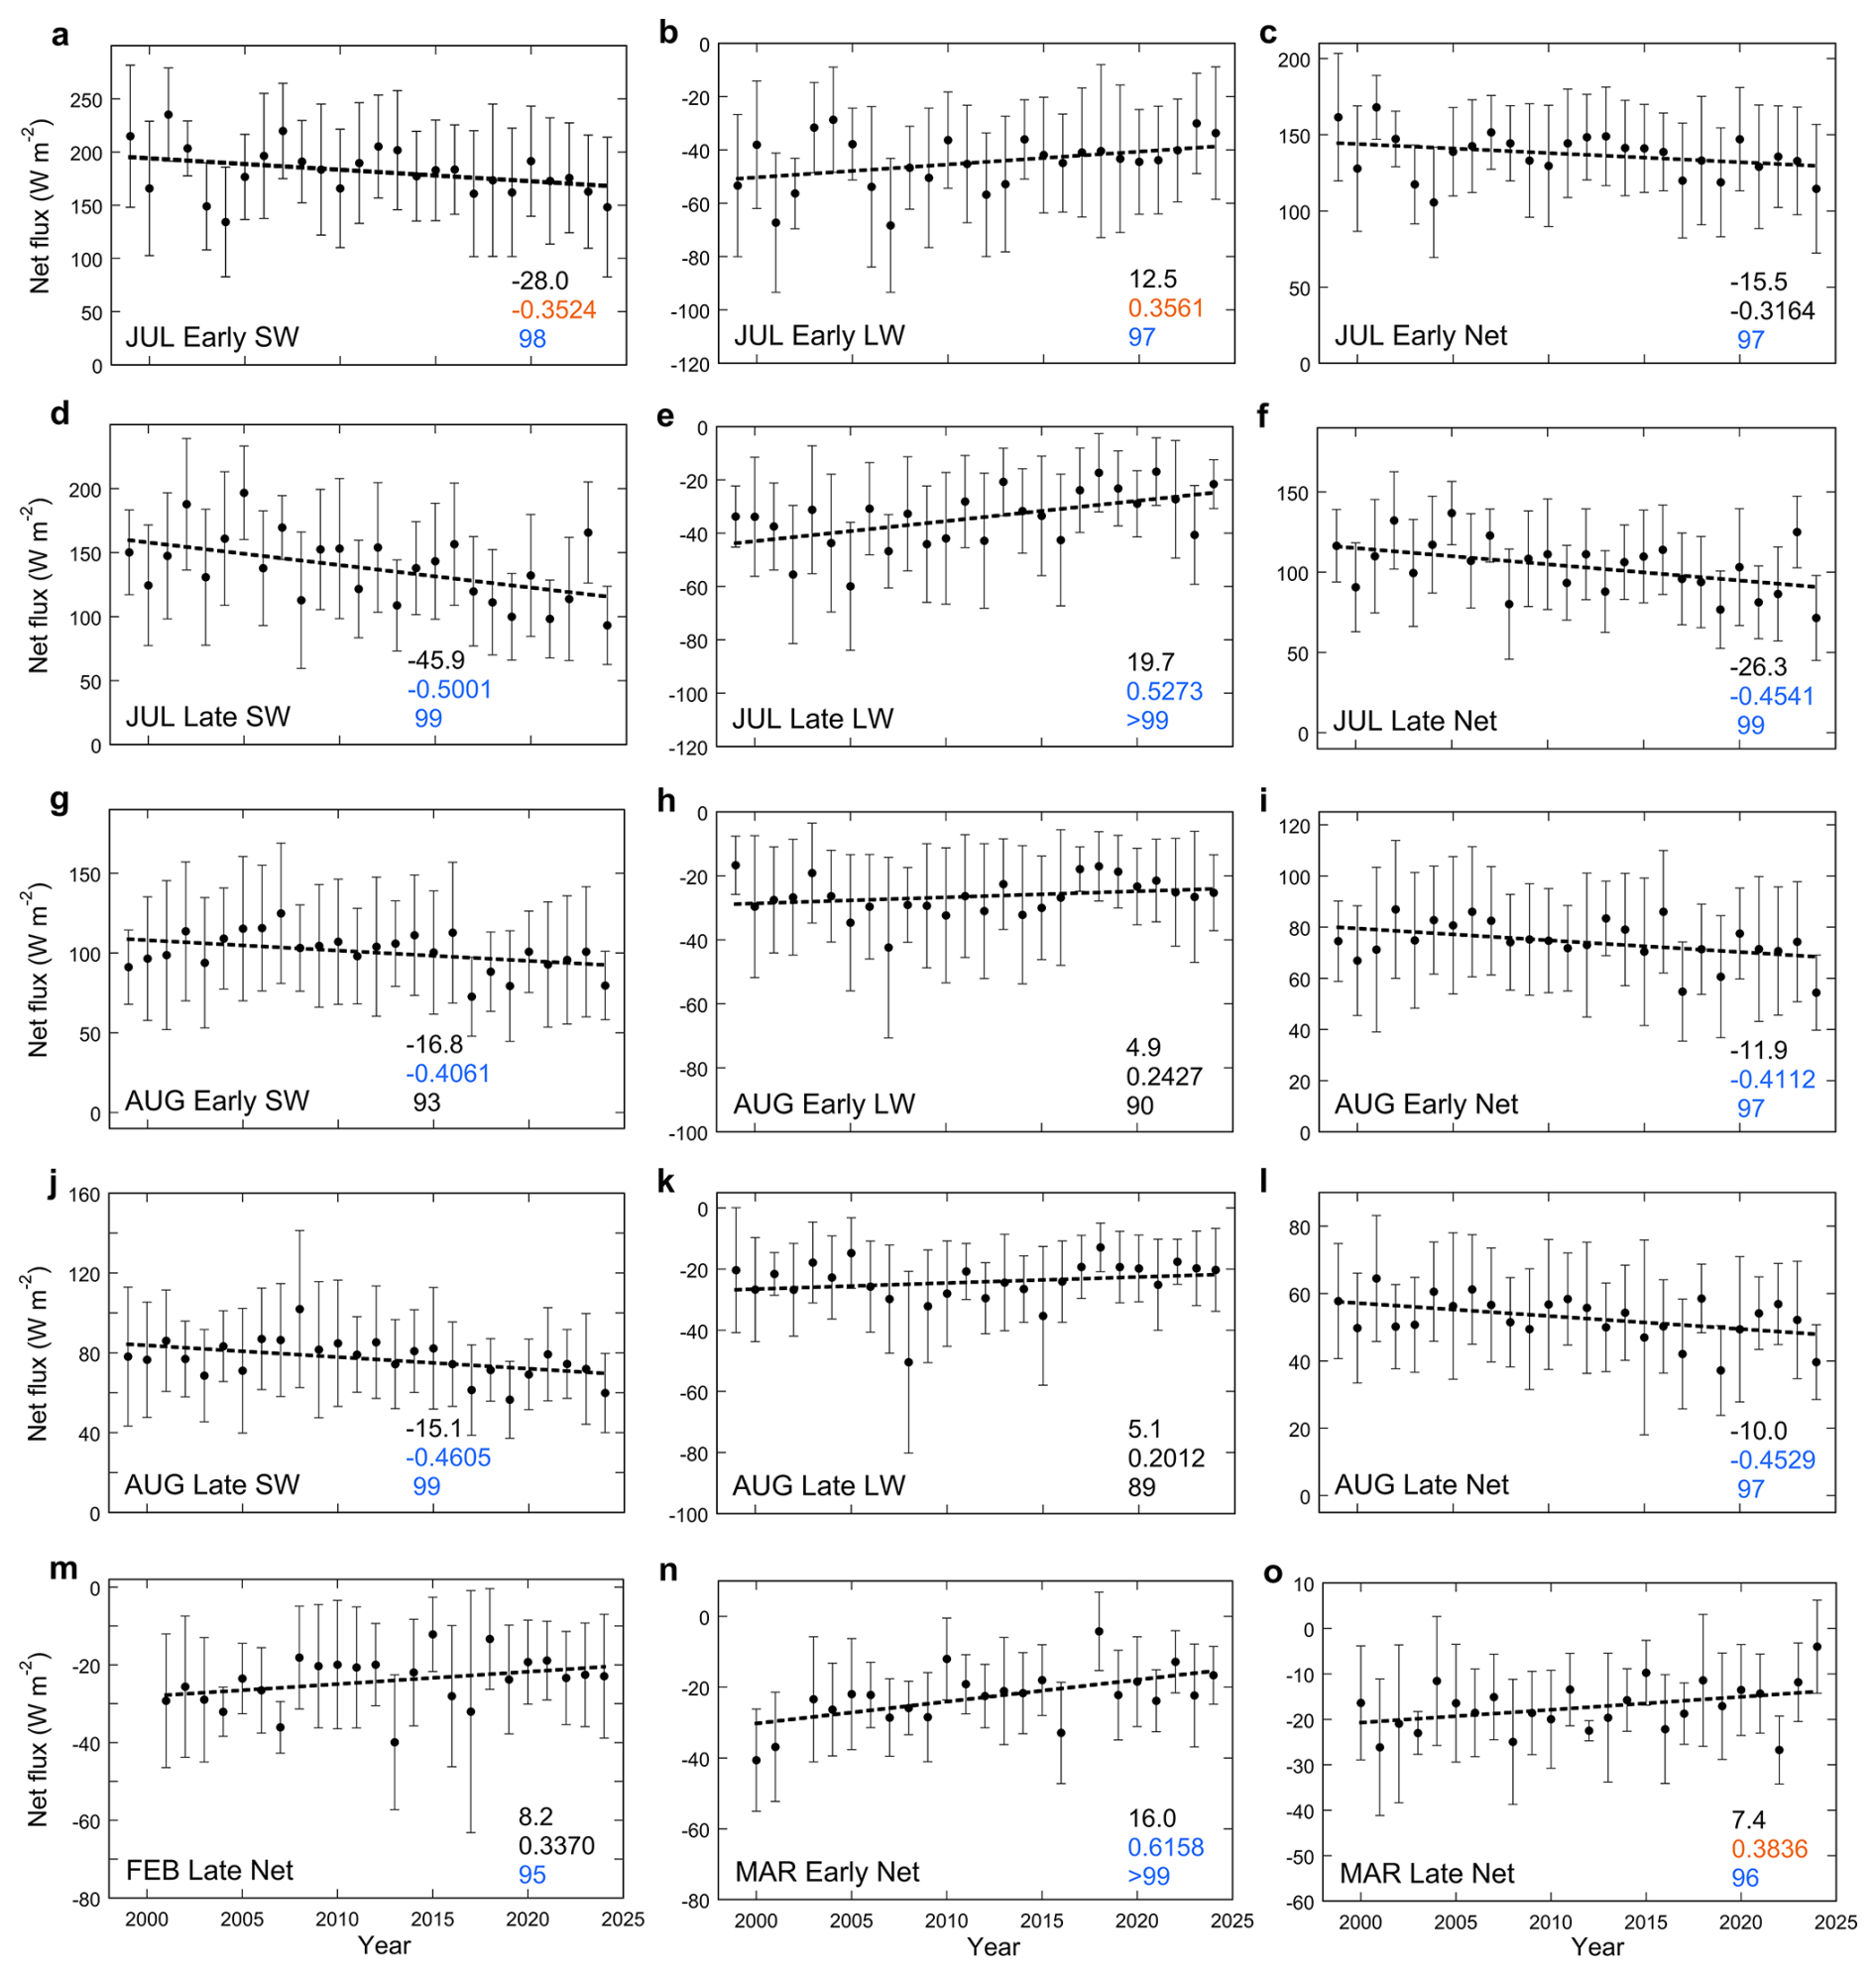
Figure 2Time series of the semi-monthly interval-average net radiative flux components (shortwave SW and longwave LW) and their sum (Net); for the four intervals in July and August (a–l), and for net radiative flux in three other intervals that show some degree of statistical significance in the trend from 1999–2024 (m–o). The mean value in each interval is shown as a dot and the error bars are plus and minus 1 standard deviation about the mean. The linear least-squares trend is shown as a dotted line. The three numbers in each panel are the linear change in the radiative flux between 1999 and 2024 (top), the Pearson correlation coefficient from ordinary least squares (middle) and the percent confidence level in trend detection from a Mann–Kendall test (bottom). For the latter two numbers, values having statistical significance of 95 % or greater are shown in blue, values with one-tailed confidence (90 %–95 %) are shown in orange, and values with less statistical confidence are left in black.
Table 3Summary of the NSA surface radiation trends. N is the number of years having available data in each semi-monthly interval. Shown for each net radiative flux component are the linear change from 1999–2024, the Pearson correlation coefficient and the percent confidence in trend detection from a Mann-Kendall test. Two-tailed (one-tailed) significant correlations are indicated in bold (italic).
We see statistically significant Net radiative flux increases for three colder intervals (FEB-Late, MAR-Early and MAR-Late), also shown in Fig. 2m–o. During most of the autumn and winter intervals there are hints of increasing LW and Net fluxes (Table 3) but as analysed here they do not yet rise to a level of statistical significance. In addition we notice that during the JUN-Early interval the magnitudes of the SW and Net flux trends are almost as large as those of the significant July and August trends, but their statistical significance is poor (Table 3). This is due to the wide variability in surface albedo during this interval, which is a transition period in snow cover. Outside this interval the surface albedo is consistently less than 0.2 during warmer months and greater than 0.7 during colder months. Figure 3 shows that this interval exhibits an obvious correlation between surface albedo and SW net flux, along with wide variability in both these quantities. The same is true during the opposite surface transition interval SEP-Late.
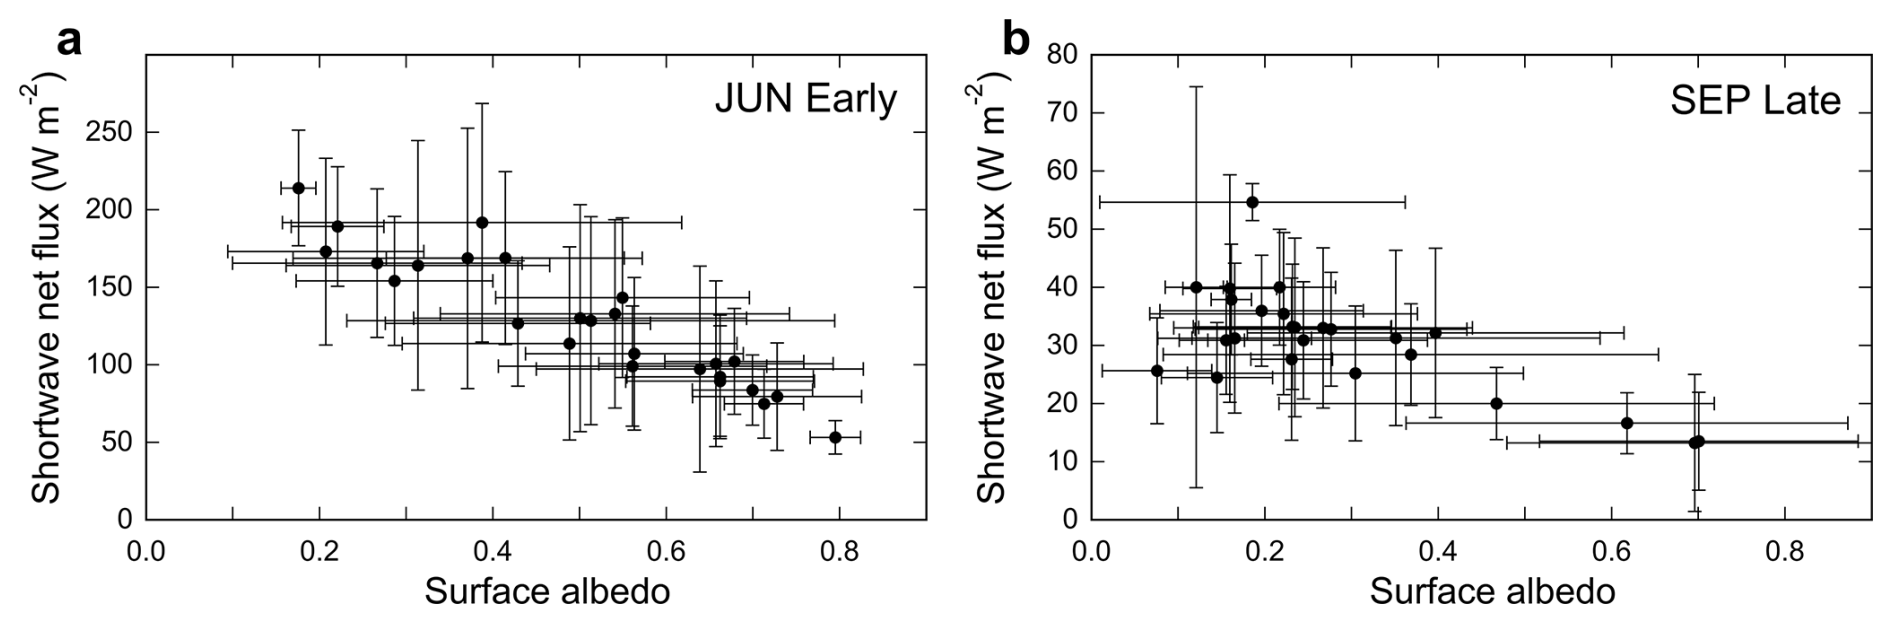
Figure 3Shortwave net flux versus surface albedo during the transitional semi-monthly intervals (a) early June and (b) late September. Error bars on both quantities are 1 standard deviation in the observations.
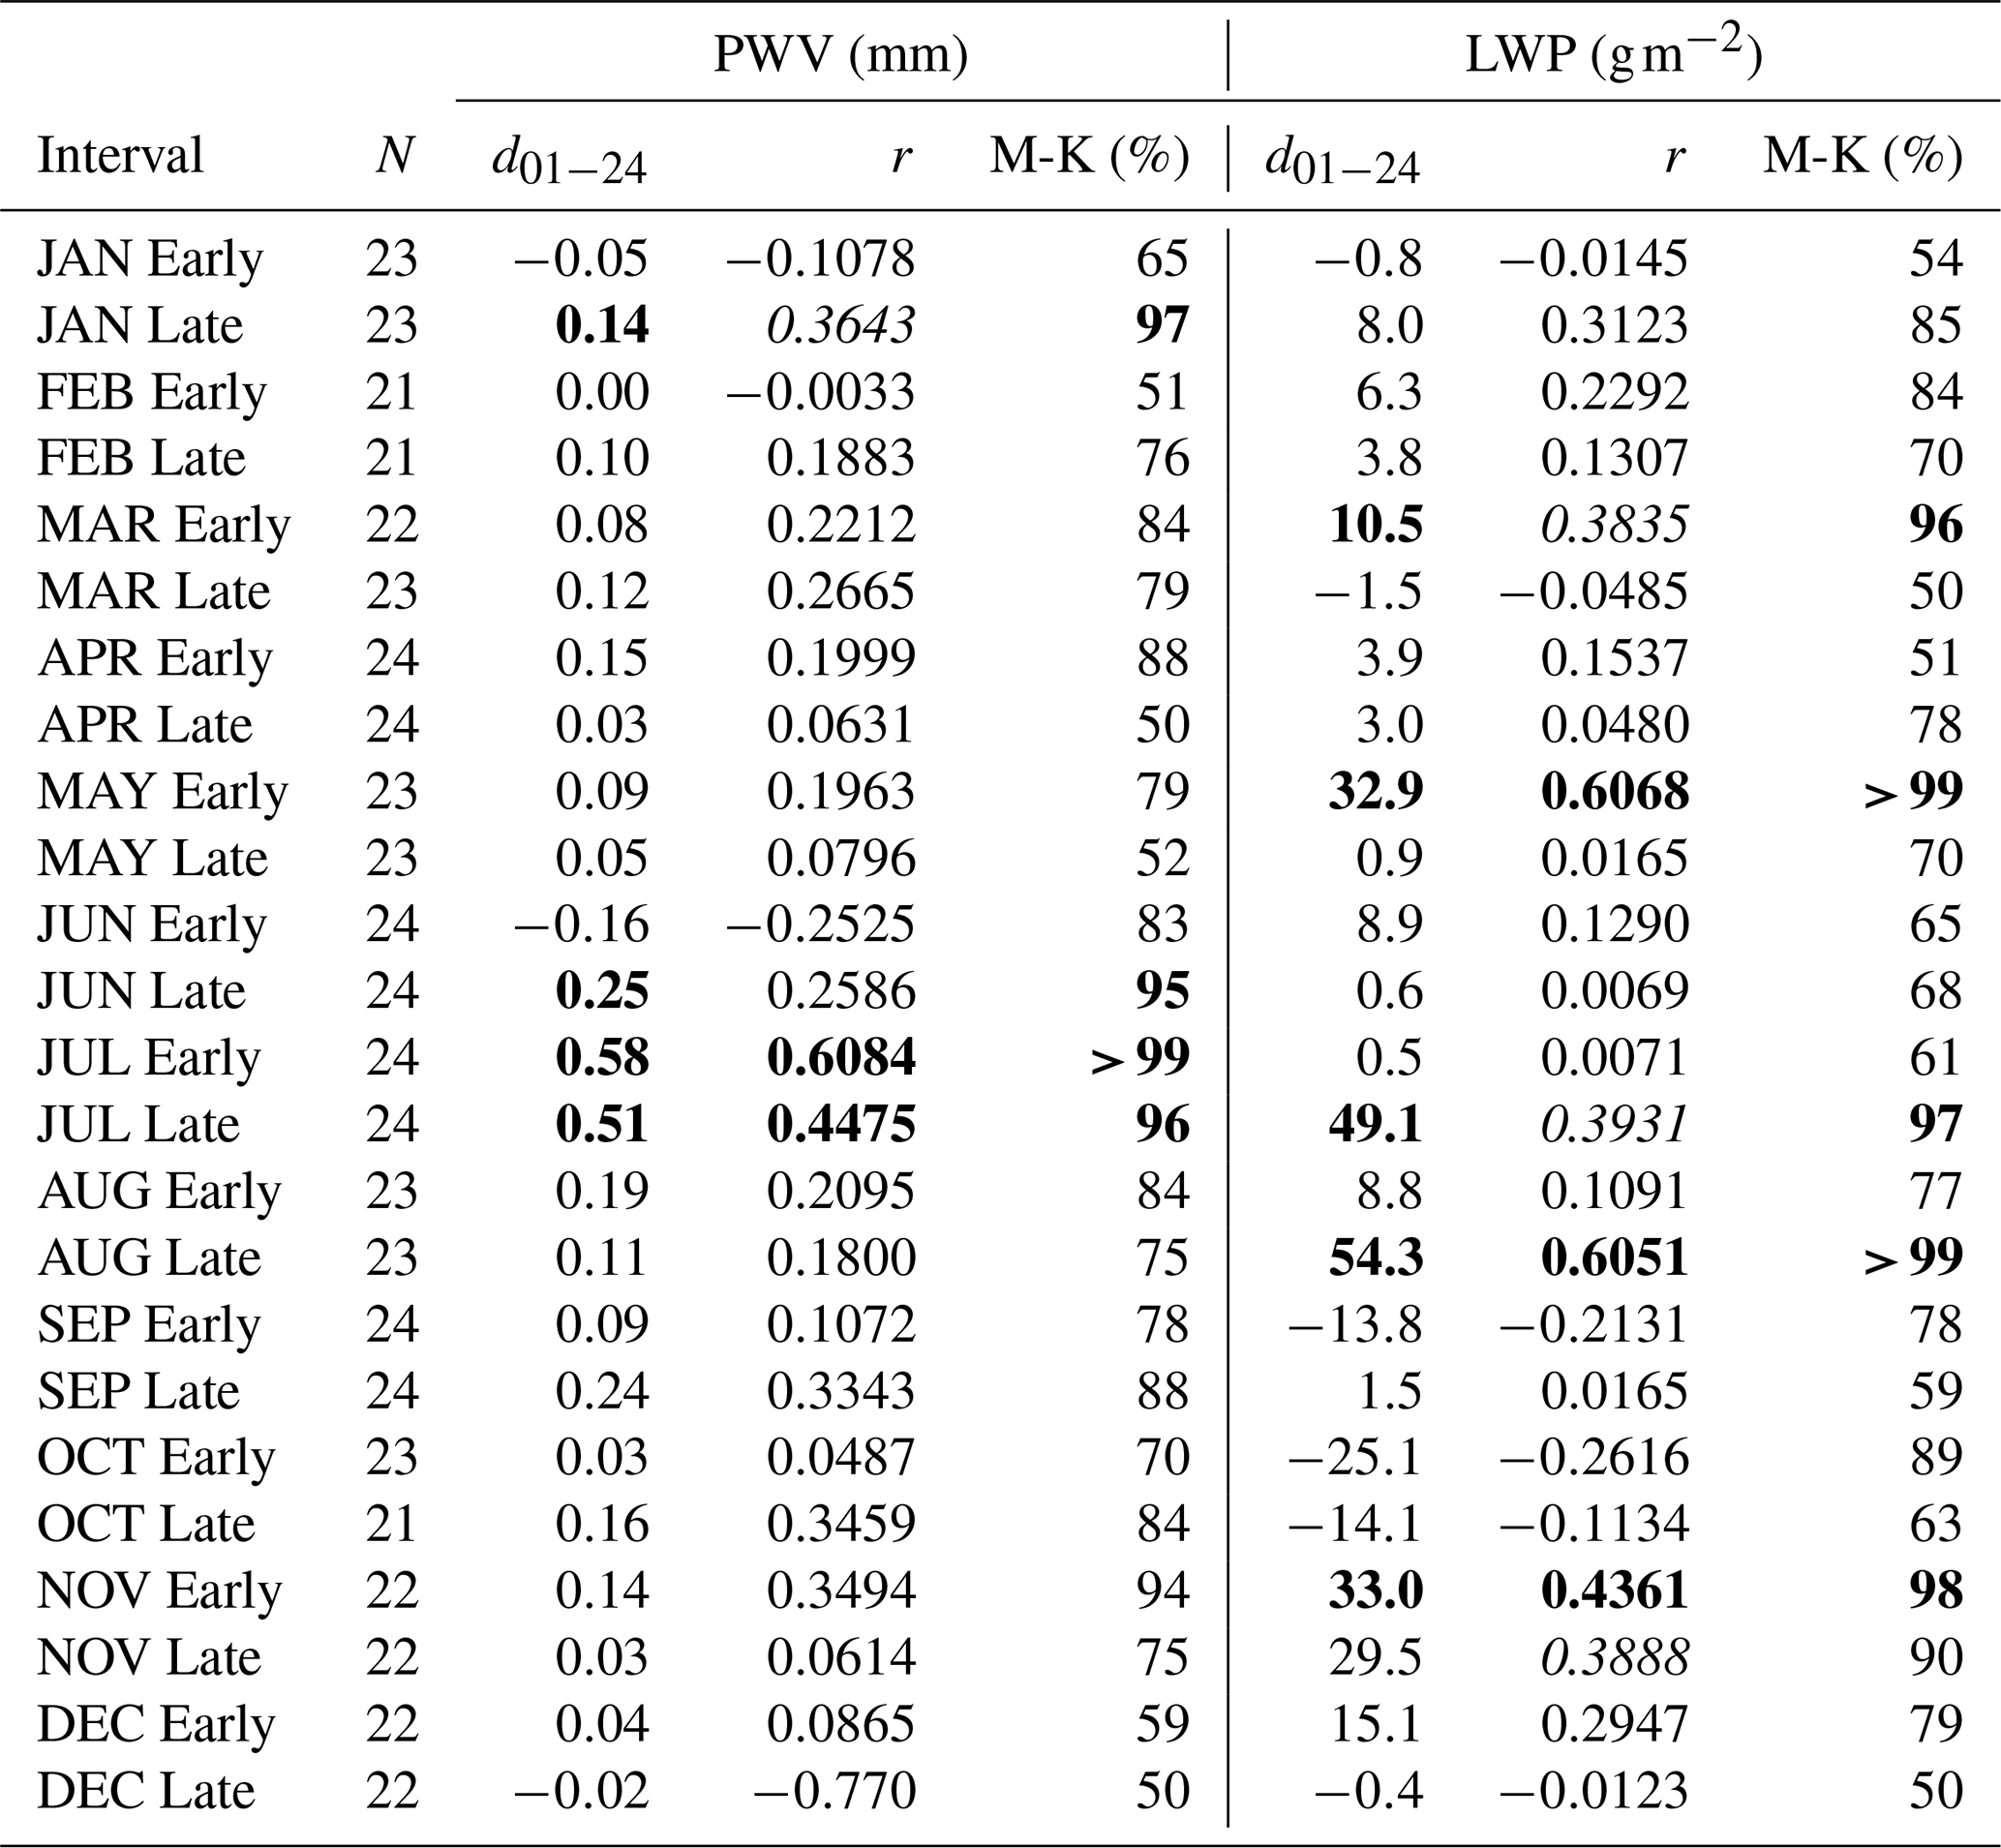
To explain the trends in summertime radiative fluxes, we examine the MWR retrievals of PWV and LWP. Statistically significant trends in MWR-retrieved quantities thus appear in fewer intervals than for the radiative flux measurements, but some trends emerge during summer that correspond to the radiative flux trends (Fig. 4, Table 4). Increasing PWV trends appear in all JUN-Late and all July and August intervals, and appear statistically significant during July corresponding to the statistically significant upward LW flux trends (Fig. 2b and e). This is consistent with a steadily warming lower troposphere. LWP shows no trend in JUL-Early or AUG-Early, but shows statistically significant increasing trends in JUL-Late and AUG-Late. Thus the summer SW and Net flux trends are not yet entirely explained by the present MWR data time series, but a relationship with increasing LWP is emerging for two intervals. We also see statistically significant upward LWP trends during two spring intervals (Fig. 4i and j) that correspond to significant upward LW flux trends (Table 3), and also a significant upward Net flux trend in MAR-Early (Fig. 2n). A significant upward LWP trend in NOV-Early is associated with increasing LW and Net fluxes but these are not yet showing as significant (Table 3). This hints at the same mechanism as in summer of increasing LWP contributing to fall surface warming trends (Table 2), but it is likely that several more years of fall data will be required for a conclusive demonstration. The same is true for a significant upward PWV in JAN-Late (Fig. 4l).
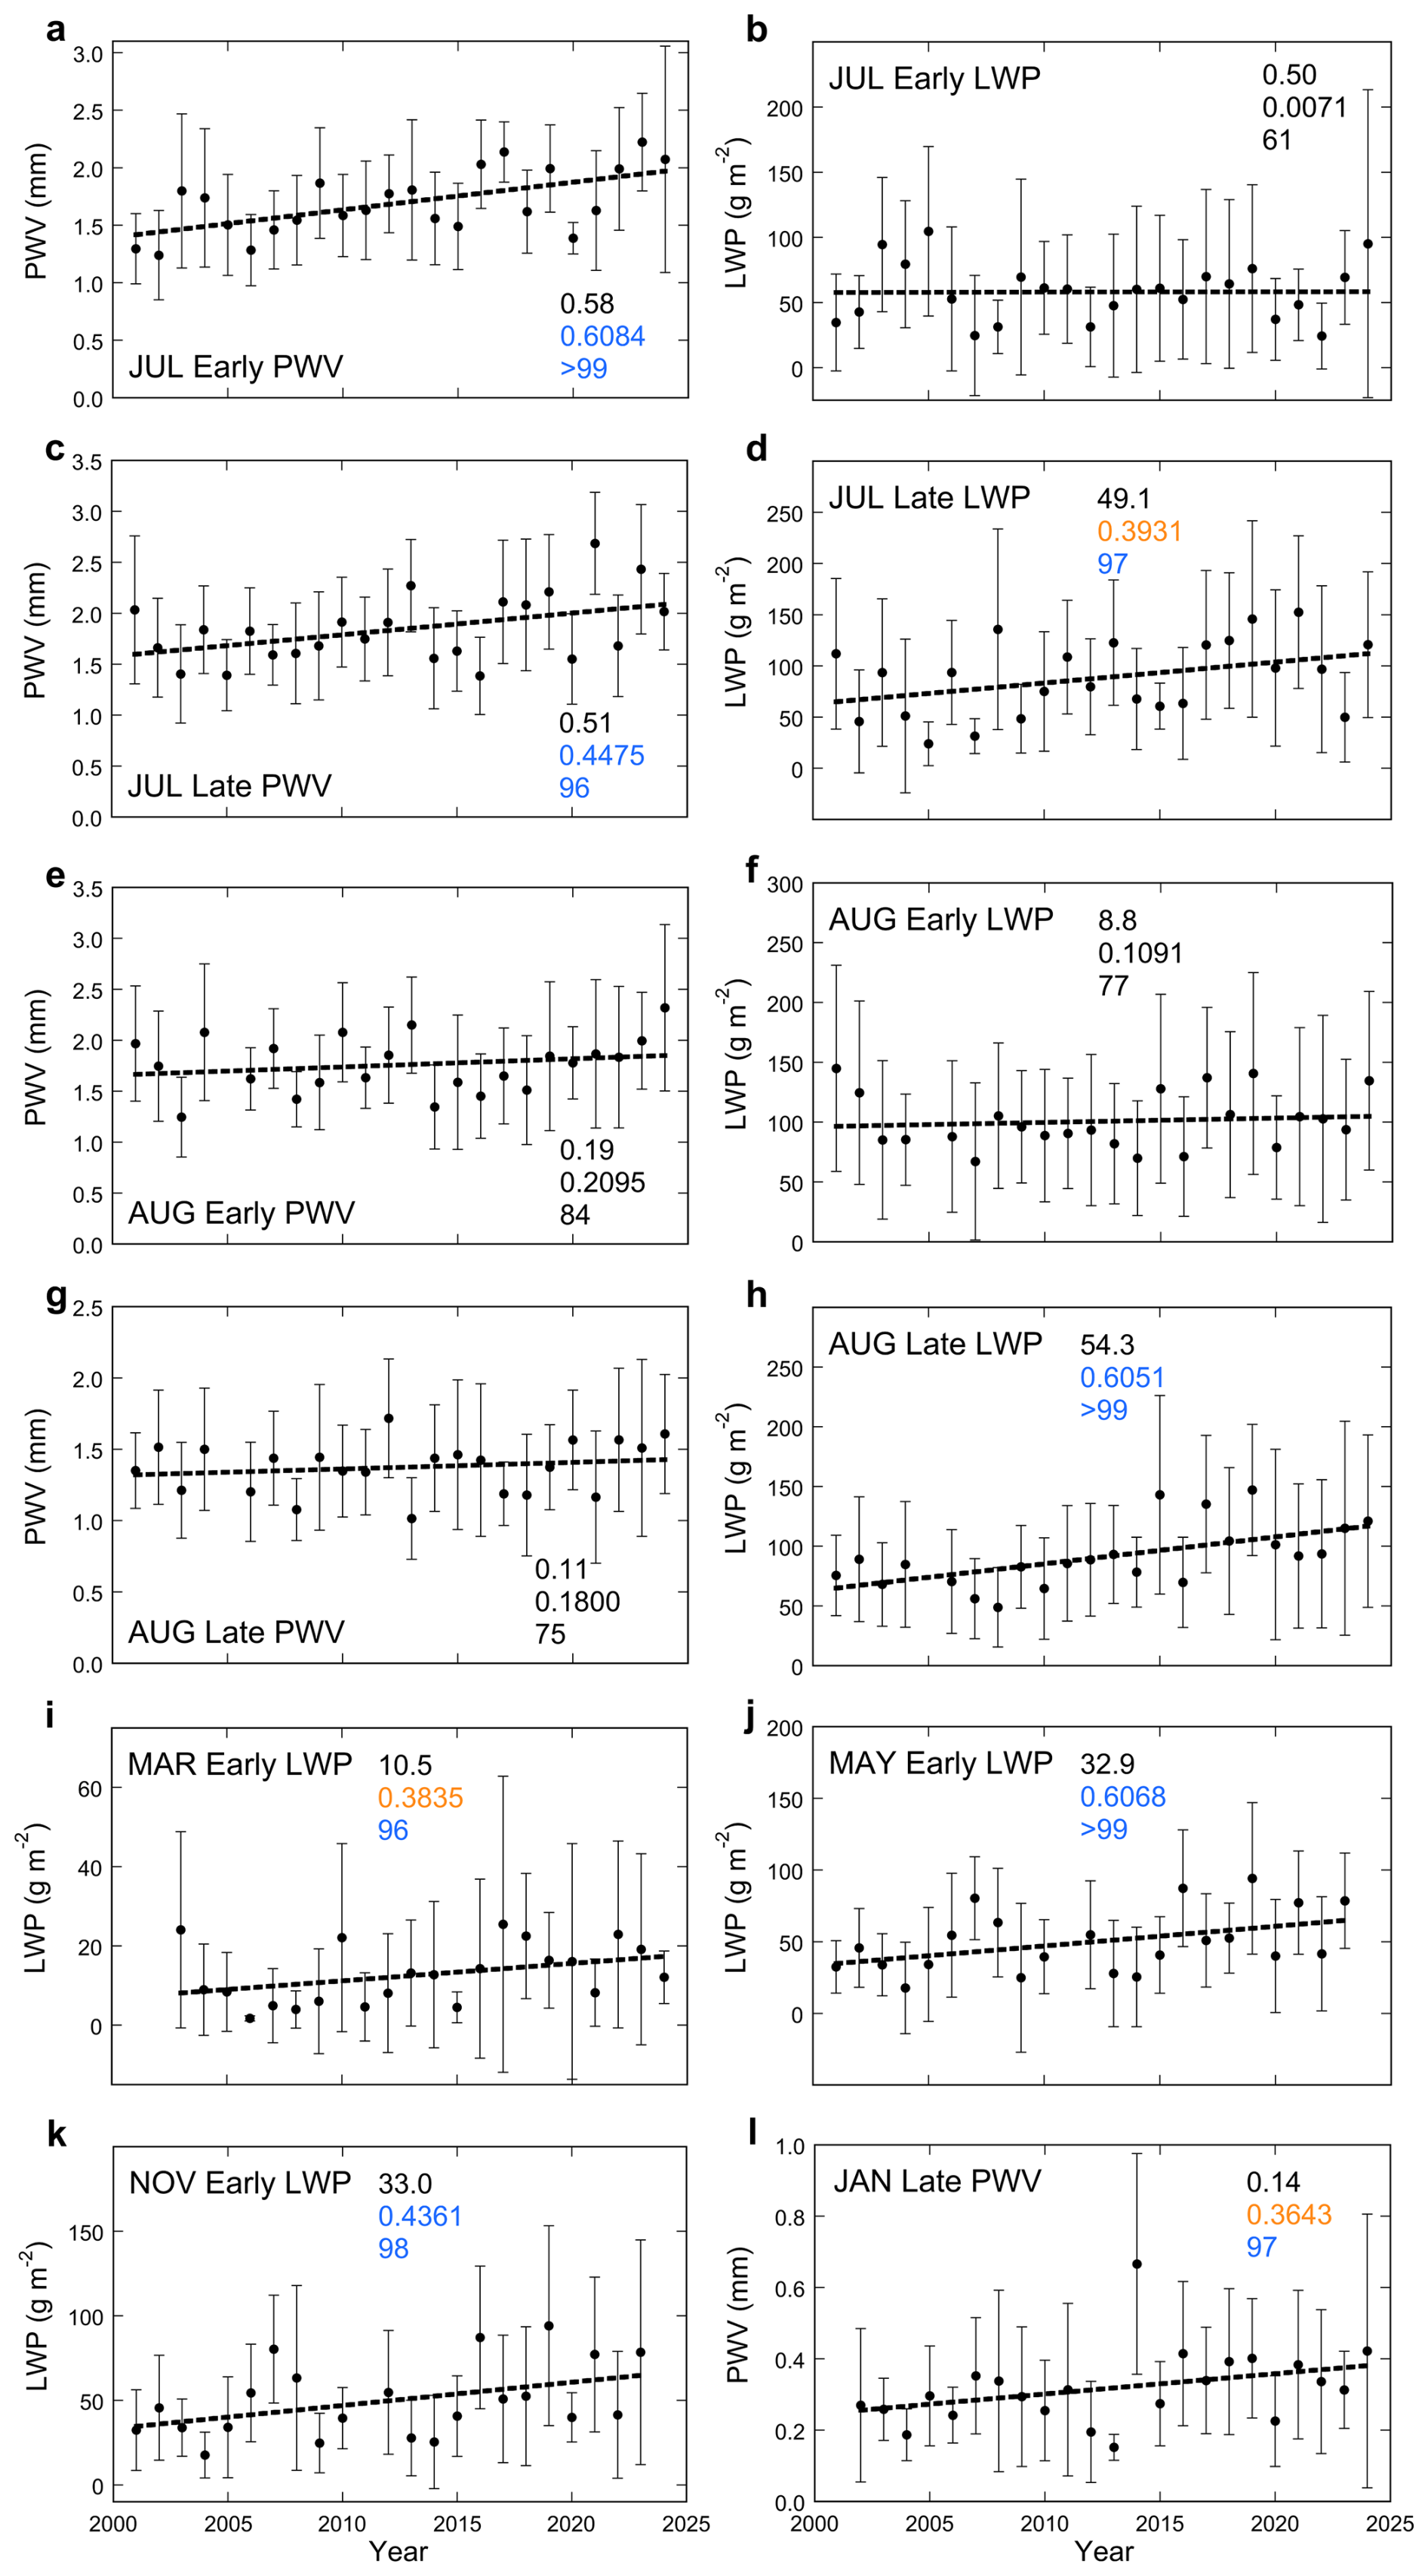
Figure 4Time series of the semi-monthly interval-average microwave radiometer-derived precipitable water vapor (PWV) and cloud liquid water path (LWP) for the four intervals in July and August (a–h), and for four other intervals that show some degree of statistical significance in the trend from 2001–2024 (i–l). Symbols and numbers on each panel are as in Fig. 2.
Table 4Summary of the trends in NSA MWR-retrieved precipitable water vapor and cloud liquid water path. N is the number of years having available data in each semi-monthly interval. Shown for each quantity are the linear change from 2001–2024, the Pearson correlation coefficient and the percent confidence in trend detection from a Mann-Kendall test. Two-tailed (one-tailed) significant correlations are indicated in bold (italic).
3.2 Synoptic-Scale Meteorological Influences
The NSA region is influenced by climatologically persistent cyclonic activity in the northwestern Pacific Ocean and anticyclones in the Beaufort/Chukchi Seas (Serreze et al., 1993; Serreze and Barry, 2014). Analysis of NSA meteorological data using k-means clustering (Mülmenstädt et al., 2012) has shown that these influences lead to four meteorological regimes (clusters) that manifest in all seasons. Cluster 1 describes the coldest regime dominated by the Beaufort Sea High (Serreze and Barry, 2014) and features mainly easterly to northeasterly near-surface winds at NSA. Under Cluster 1 conditions at NSA are closest to a “polar desert.” Cluster 2 describes the second coldest regime, characterized by strong low pressure in the Arctic Ocean and Beaufort Sea connected to low pressure of average strength in the Gulf of Alaska. As the cyclonic flow will carry moisture to NSA from over the open Arctic Ocean even in the colder conditions, cloud cover under Cluster 2 is more extensive than under Cluster 1 but is limited in vertical extent. Cluster 3 describes a mixture of weak high pressure over the Arctic Ocean and strong low pressure over the Aleutian Islands and Bering Sea, thus advecting moisture to NSA from the Gulf of Alaska. This cyclonic flow from the Gulf of Alaska is impeded by coastal mountain ranges at lower altitudes, but at higher altitudes moisture traverses the Alaskan peninsula and the Yukon and arrives at NSA mainly in easterly winds across the Beaufort Sea. Cluster 4 is the warmest and moistest cluster, and is distinct from Cluster 3 by relative westward displacement of the strong low pressure over the Aleutian and Bering Seas. This results in a direct and unimpeded path for warm and moist air through the Bering Strait to NSA. The multiyear time series of NSA data enable us to investigate the contrasting influences of these four clusters on the trends in radiative flux and MWR cloud properties during summer. Using ERA5 reanalysis data over the NSA region, every day between 1999 and 2024 can be identified with one of these four clusters.
Another important meteorological consideration involves atmospheric rivers (ARs). An AR is a narrow region of intense horizontal and vertically integrated water vapor transport (IVT) within a low-level jet most typically generated at the cold front of an extratropical cyclone (Ralph et al., 2018). ARs are now recognized as a major source of moisture transport between midlatitudes and both northern and southern high latitudes (Newman et al., 2012; Guan and Waliser, 2015; Wille et al., 2019; Mattingly et al., 2020). The standard reference scale to characterize the impact of an AR involves a combination of IVT magnitude and duration in a specific region as detected in satellite meteorological data, or weather forecast modelling including reanalysis data (Ralph et al., 2019). This AR scale has been modified for polar regions (Zhang et al., 2024) and tested during the Year of Polar Prediction (Bromwich et al., 2024). In polar regions the potential IVT range is smaller than over midlatitudes but where the AR can nevertheless bring significant climatological impacts including extensive cloud cover and cryosphere surface melt (Wille et al., 2019).
Between 1999–2024 we find using ERA5 an increasing trend in AR occurrence over the NSA site (Fig. 5a). Additionally the seasonal cycle in ARs over the NSA site peaks in July and August, sometimes with as many ARs occurring during these months as for all other months combined. Analysis of AR influences helps to explain the PWV, LWP, and associated radiative flux trends in terms of moisture transport from lower latitudes and the adjacent Arctic Ocean. The JUL-Late interval has been strongly influenced by ARs over NSA during the past 2 decades. The statistically significant trends in SW, LW and Net fluxes, and PWV and LWP (Figs. 2d–f and 4c, d), nearly all lose statistical significance when we omit the AR days, which are ∼ 40 % of the total number of days (Fig. 5b–f). This result does not apply to the other July and August intervals, whose radiative flux trends largely remain significant when we omit the AR days (Table 5).
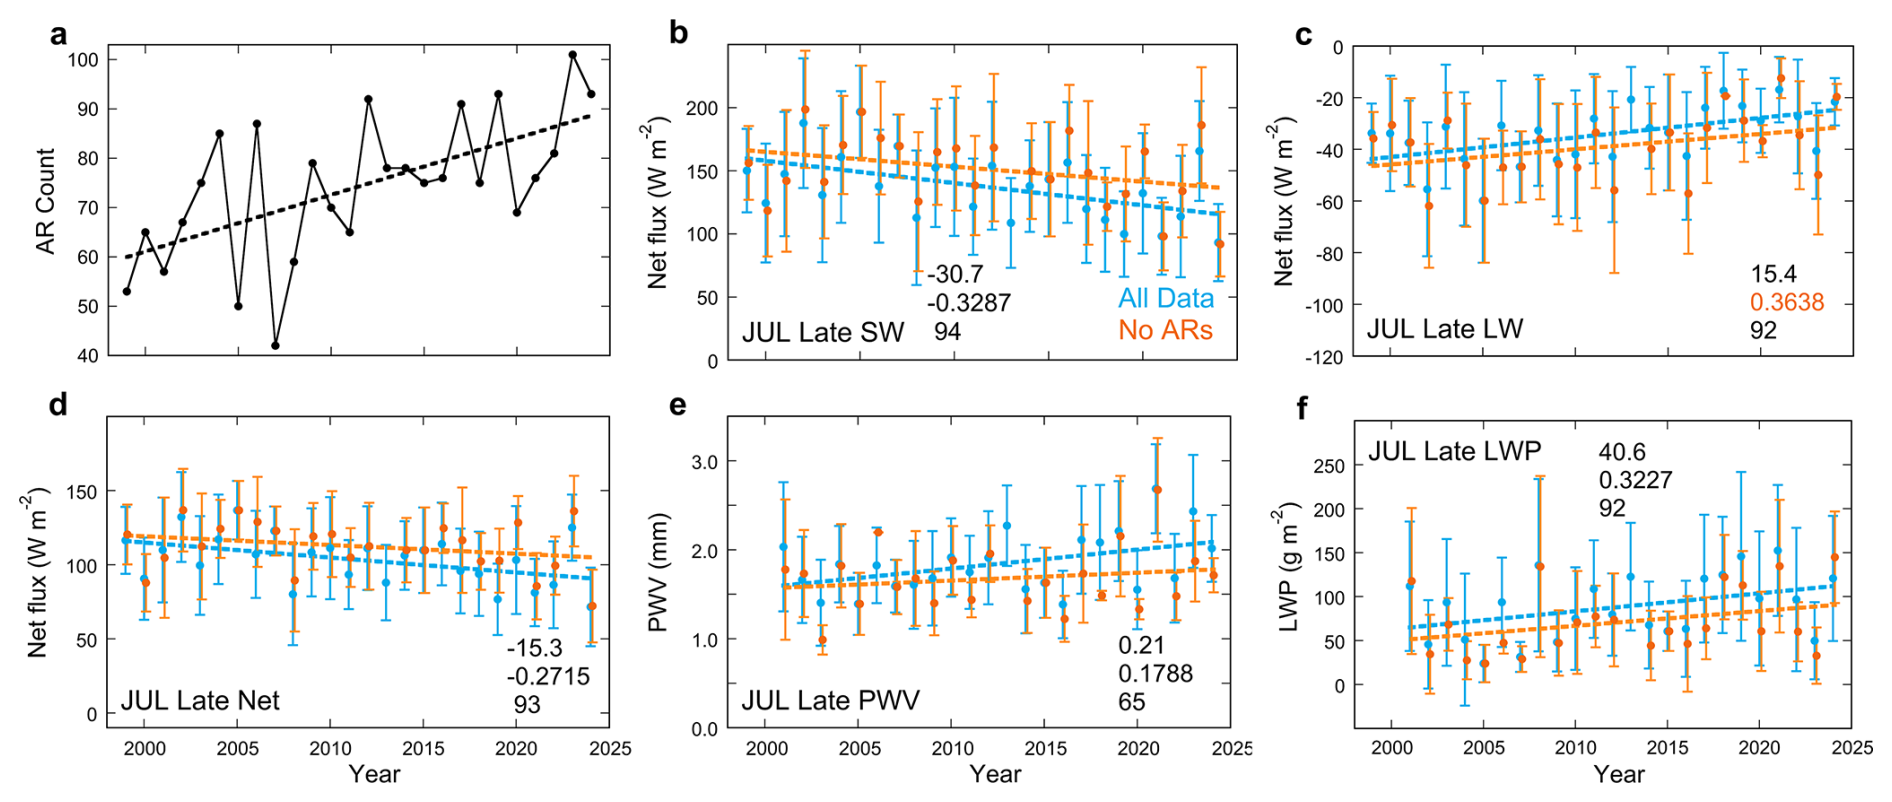
Figure 5Results involving the role of atmospheric rivers (ARs); (a) the total AR count over NSA in each year, with the linear trend shown as a dotted line; (b–f) time series for the Late July interval showing the net radiation flux components and MWR-measured quantities for all data in light blue and with the AR days removed in orange. Symbols and trend lines are as in Fig. 2. The three numbers in each panel are also as in Fig. 2, but are for the trends with the ARs removed.
Table 5Summary of trends in the net radiative flux components and the MWR-retrieved quantities when all days containing atmospheric rivers are removed, presented as in Tables 2 and 3.
We examine the influence of individual meteorological regimes by comparing the trends evaluated for just one cluster with those using all the data. The coldest Cluster 1 occurs infrequently during summer while the second coldest Cluster 2 occurs most frequently (Fig. 6a). We find a consistent influence of the warmer but relatively infrequent Cluster 3. During JUL-Early the SW and LW flux trends which had modest significance (detected with MK but only one-tailed significance with OLS) become more significant with OLS in only the Cluster 3 data (Fig. 6b and c). Similarly in AUG-Early we see much larger changes in SW, LW and Net fluxes in the Cluster 3 data compared with all the data, and under Cluster 3 a significant upward LW trend is detected that does not appear using all the data (Fig. 6g–i). In AUG-Late (Fig. 6k and l) the upward trend in LWP under Cluster 3 is more pronounced than in all the data, and the upward trend in PWV that is negligible in all the data becomes statistically significant under just Cluster 3. We do not detect similar influences of the warmest and more frequent Cluster 4. We do find a role for Cluster 2 during JUL-Late. Here the trends in SW, LW, and Net fluxes (Fig. 6d–f) and LWP (Fig. 6j) all increase in statistical significance under just Cluster 2 compared with all the data. This is also the interval strongly influenced by ARs, and Cluster 2 occurs 53 % of the time, more frequently than in the other July and August intervals.
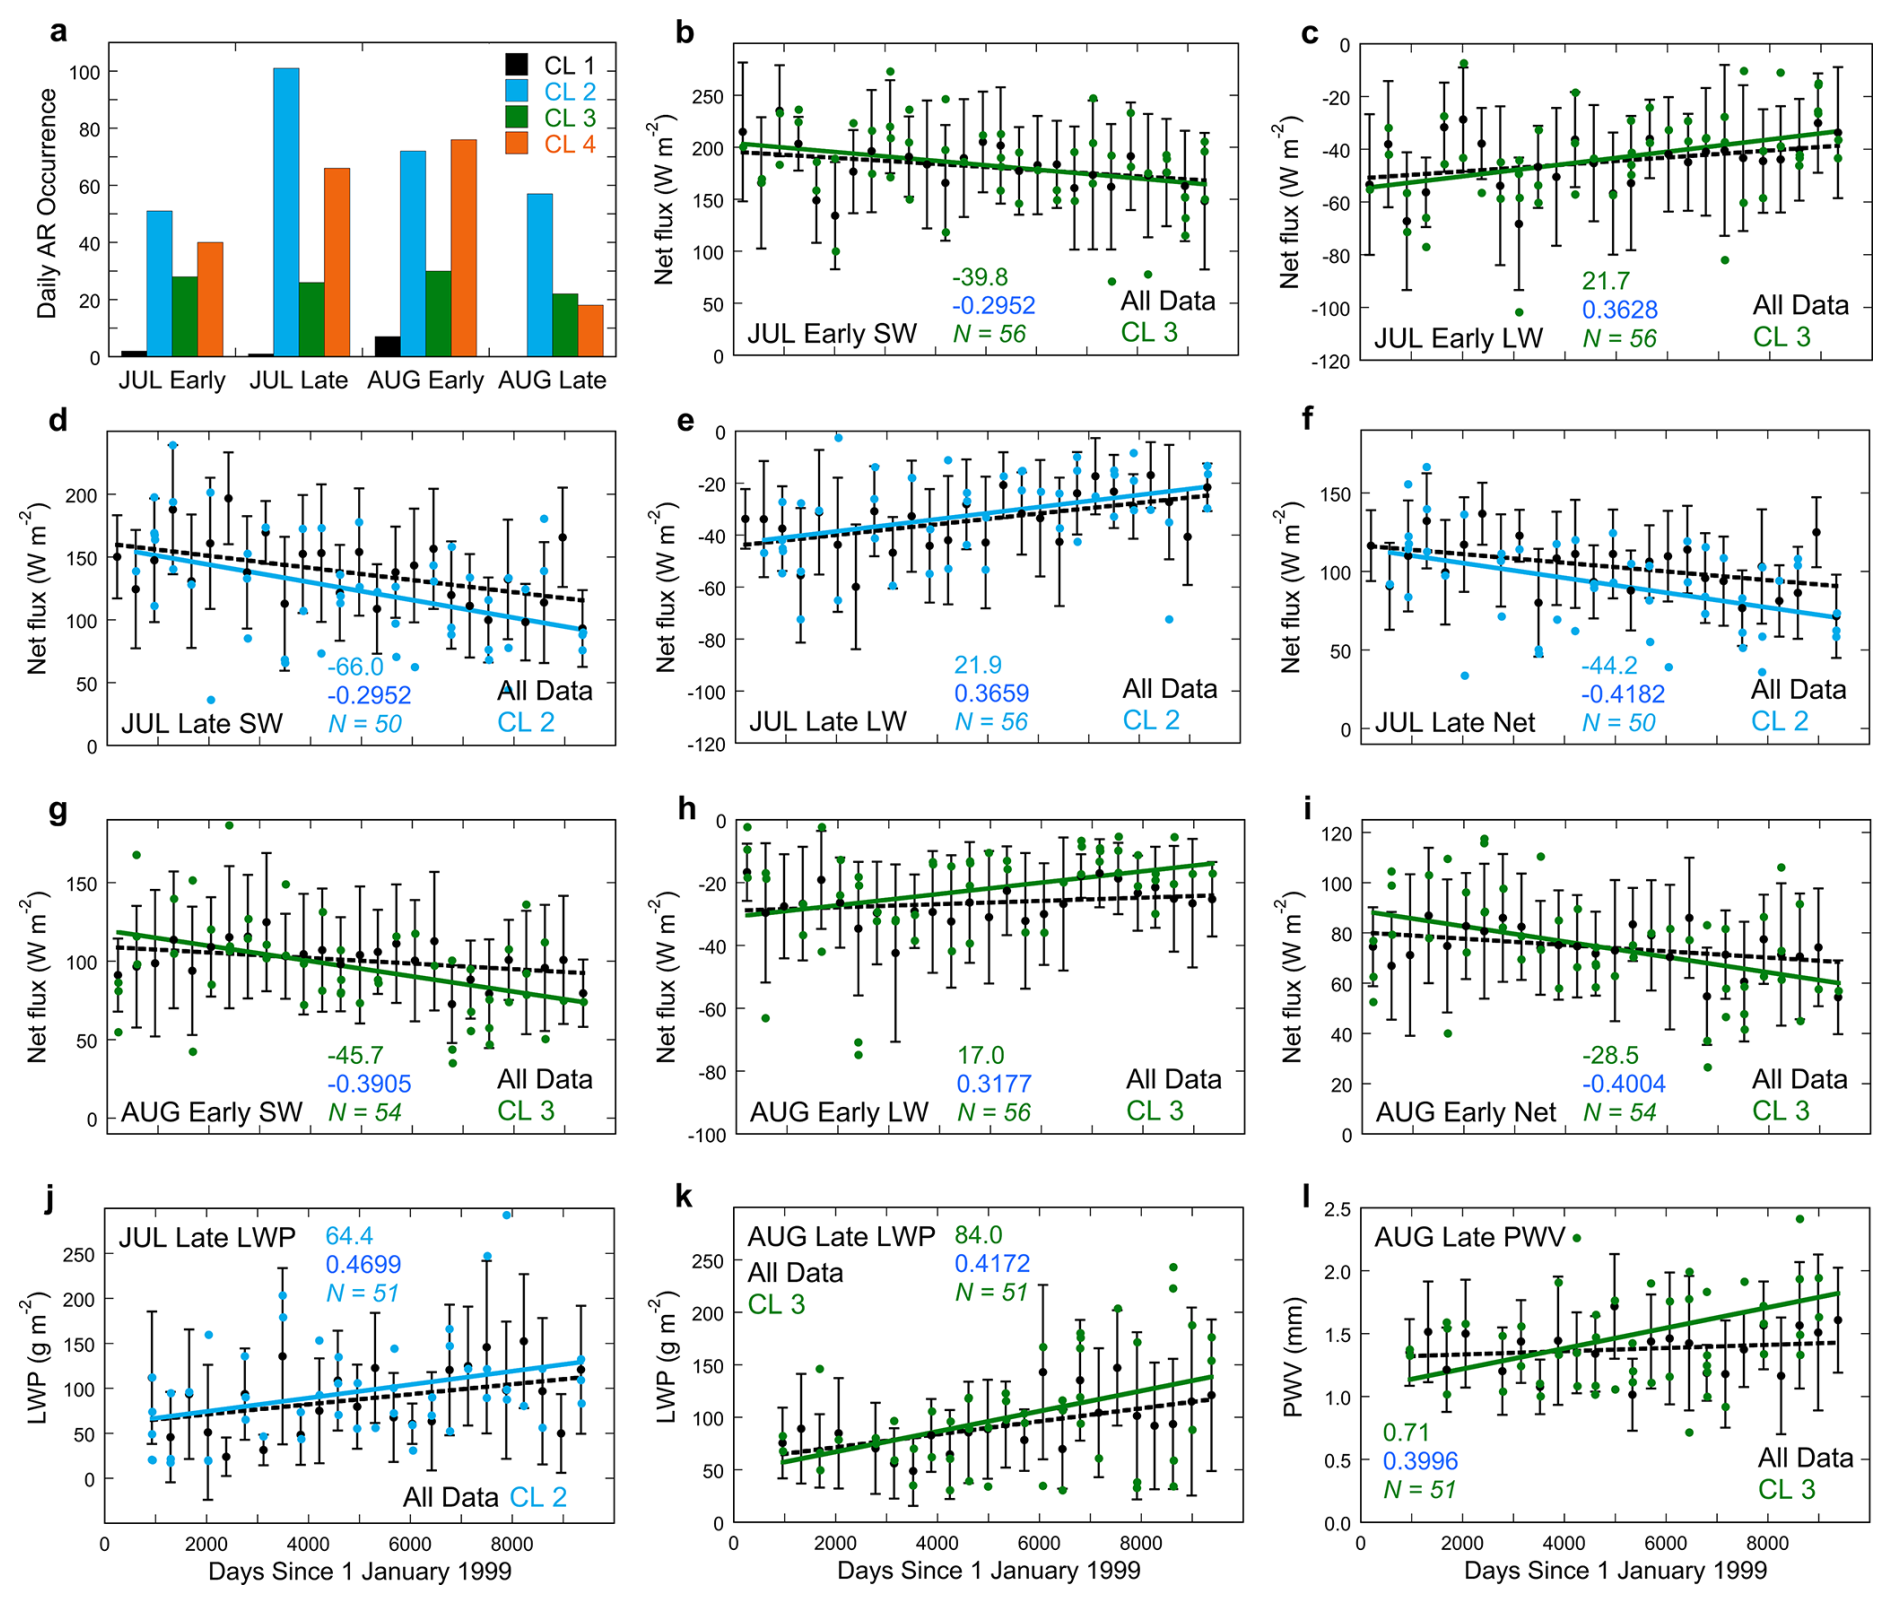
Figure 6Results involving the role of prevailing meteorological regimes identified by k-means clustering; (a) summary bar chart showing how the daily occurrences of ARs over the NSA site, summed over 1999–2024, are sorted into each of the four k-means clusters and each of the four bimonthly intervals for July and August; (b–l) time series of net radiative fluxes and microwave radiometer-derived quantities for all data (black) and for only data from Cluster 2 (light blue) or Cluster 3 (green). Symbols and trend lines are as in Fig. 2, but with the linear trend from the single-cluster data shown as a coloured solid line. The three numbers in each panel are the linear change between 1999 and 2024 (top), the Pearson correlation coefficient from ordinary least squares (middle) and the sample size for the single-cluster data (bottom).
3.3 Natural Variability
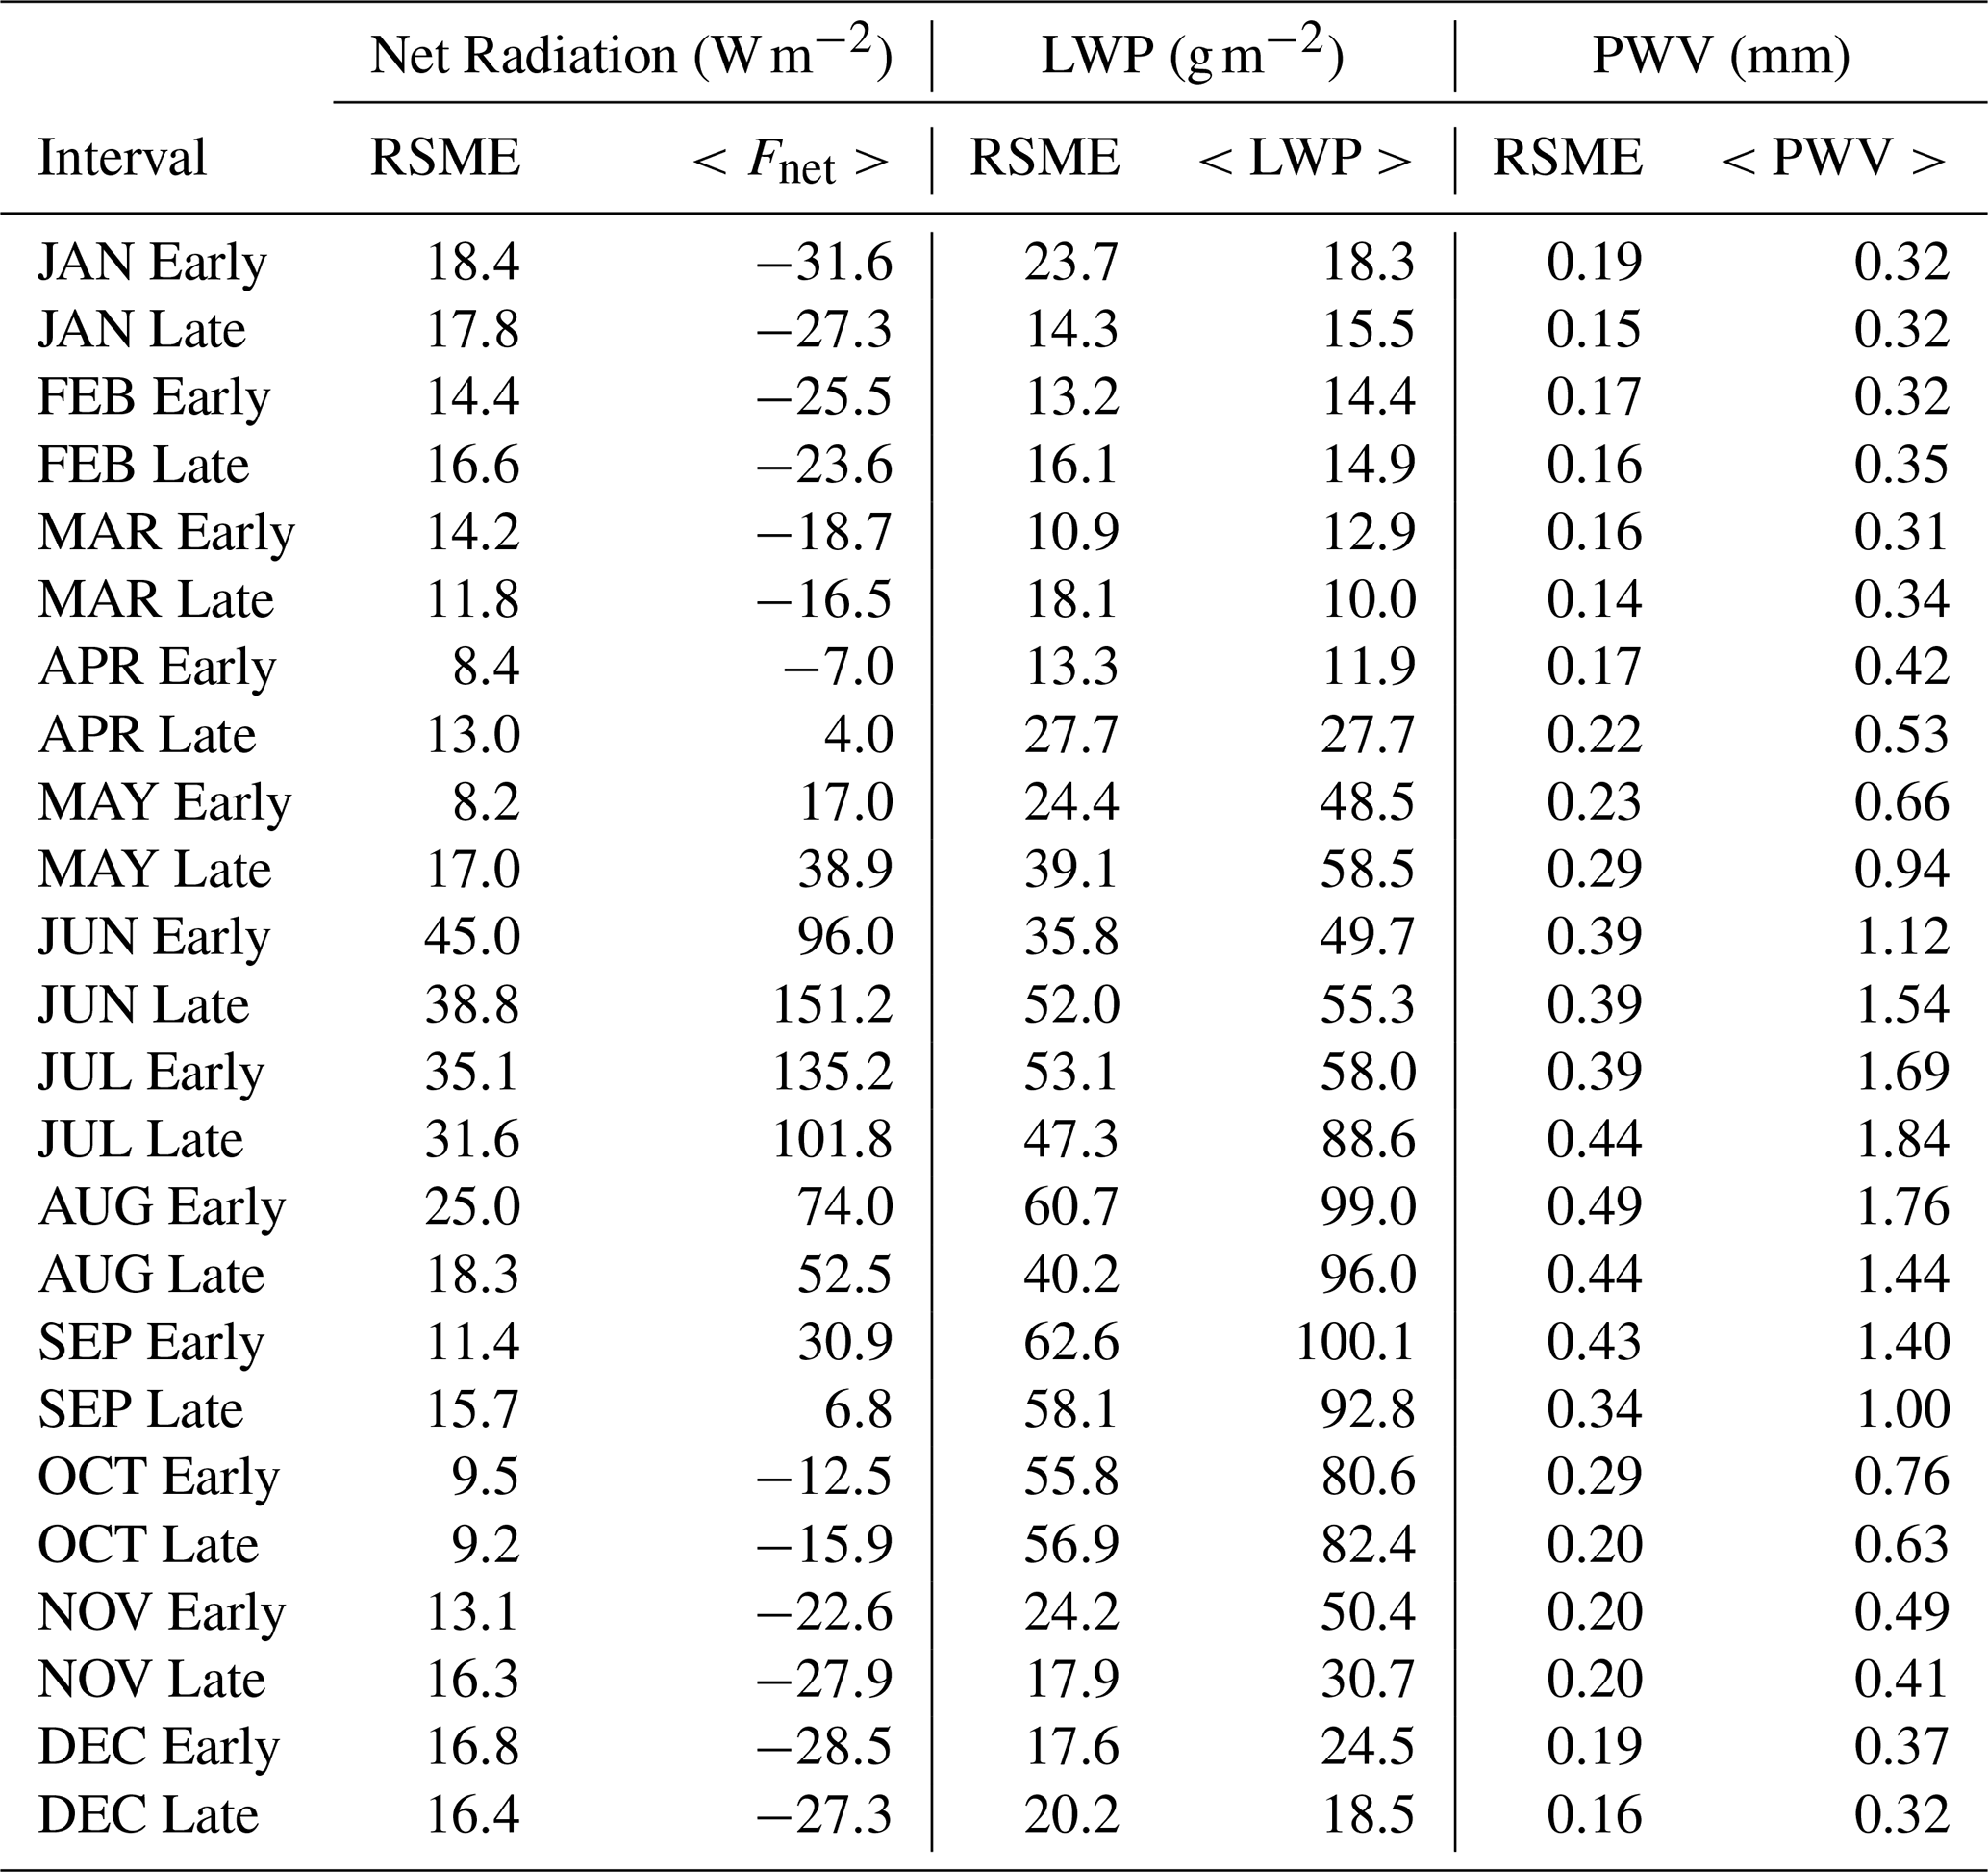
A climatic time series may generally involve a long-term trend, seasonal variability and natural interannual variability. Quantifying the magnitude of natural variability can help elucidate why trends are detected in some seasons for some variables but not others. We have effectively removed the impact of seasonal cycles by subdividing the year into 24 semi-monthly intervals. We quantify the interannual variability by detrending each of these 24 time series and then evaluating the root mean square error (RMSE). Results for Net fluxes, LWP and PWV are summarized in Table 6, which gives the RMSE and average value for each entire time series. During the colder months the Net flux RMSE is 1–2 times that of the typical measurement uncertainty. During late spring and early summer the Net flux RMSE is ∼3–4 times the typical measurement uncertainty. The RMSE for LWP during the colder months is within the typical measurement uncertainty, and up to twice that uncertainty during summer. The RMSE for PWV during the colder months is ∼8–10 times larger than the typical measurement uncertainty, and ∼5–7 times larger than the measurement uncertainty during summer. For LWP the RMSE is a larger fraction of the annual value than for the other variables, which illustrates why fewer trends appear for LWP.
Table 6Summary of root mean square errors (RMSE) and average values over the entire detrended time series.
After two and a half decades of data acquisition by the ARM NSA Facility the broadband radiometric data are beginning to show statistically significant trends consistent with Arctic amplification. These are supported by emerging trends in MWR-retrieved PWV and LWP. These results pertain mainly to summer but significant trends appear in some intervals in all seasons. During summer the trends manifest as increasing LW net flux consistent with both a warming lower troposphere and increasing cloud LWP, with this increase being offset by a larger SW net flux decrease also due to increasing LWP. The result is a statistically significant decrease in Net surface flux throughout July and August between 1999 and 2024.
Although the summertime increases in PWV are consistent with a gradually warming lower troposphere, there is evidence that two synoptic-scale drivers play a larger role in these trends. The warm Cluster 3, associated with low pressure in the Gulf of Alaska, exerts increasing influence on the LWP and surface radiative fluxes over NSA. In addition, the frequent low pressure over the Arctic Ocean (Cluster 2) is associated with increasing AR activity that also brings increasing PWV and LWP over NSA with concomitant trends in surface radiative fluxes. These effects may explain the relatively small surface warming trend at NSA during summer compared with other seasons and many other Arctic locations.
Satellite remote sensing studies covering earlier time periods (1982–2004) have shown radiative cooling effects in summer consistent with increasing cloud amount or optical depth (Wang and Key, 2005; Liu et al., 2008; Wang et al., 2012), but also report trends of different magnitudes and signs than in our more contemporary NSA observations. A recent satellite remote sensing study using NASA Clouds and Earth's Radiant Energy System (CERES) data from 2000–2020 projected that the ToE to 95 % confidence in net surface radiative fluxes under all sky conditions for the Beaufort and Chukchi Seas are 26 and 22 years, respectively (Sledd and L'Ecuyer, 2021). Our summertime NSA trend detections after 26 years observed in situ are consistent with this projection. Another more recent multisensor satellite remote sensing study spanning 1996–2016 reports that over the Beaufort and Chukchi Seas during late spring (AMJ) the ToE to 95 % confidence in surface cloud radiative forcing (CRF) are 29 and 24 years, respectively (Lelli et al., 2023). For their summer period (JAS) the same ToE is 24 years for both the Beaufort and Chukchi Seas. Also during their late spring (AMJ) over the Beaufort and Chukchi Seas they find negative SW CRF trends and smaller positive LW CRF trends, for a negative Net CRF trend, which is qualitatively consistent with our results. Thus the NSA surface radiative flux measurements support these recent satellite remote sensing approaches.
Limitations with this study include the fact that the statistically significant trends are only starting to emerge. This is evident in the RMSE values presented in Table 6, which are large compared to the linear changes over the observed time series. Comparing Table 6 with the trends in the MWR-derived quantities in Table 4, most of the significant linear changes over 24 years are comparable in magnitude to or slightly larger than the RMSE values. Comparing Table 6 with Table 3, the significant linear changes in net radiative flux over 26 years are mostly smaller than the RMSE values. Therefore, while the radiative flux trends in six of the time intervals are statistically significant, they may not yet represent a climatic shift at this location. In all seasons there are similar hints of trends that may be explained by Arctic amplification (Tables 2 and 3), but it remains uncertain whether a few more years of data will bolster or diminish the significance of these patterns. Nor is there any evidence that they will remain insignificant. Another limitation is that aerosol effects on LWP, as demonstrated by Stauffer et al. (2025), could not be addressed in this study based solely on the ground-based NSA measurements. Multidecadal trends in aerosol abundance, possibly involving decreasing Arctic haze in winter and spring (e.g., Schmale et al., 2022) or increasing wildfire-driven aerosol during summer (e.g., Lee et al., 2024) may be a part of the trend detection or lack thereof presented here.
It is important to realize that the statistically significant results here pertain to only one location. They do not signify that the entire Arctic will uniformly experience a surface radiative cooling effect in response to moisture advection from subarctic latitudes. For example, the Greenland Ice Sheet (GIS) is subject to very different synoptic-scale meteorology influenced by the North Atlantic Oscillation (NAO) (e.g., Ding et al., 2014; Pettersen et al., 2018) and the Icelandic Low (Serreze and Barry, 2014). Clustering analysis in that region conceptually similar to this work reveals several regimes that identify with various phases of the NAO and El Niño Southern Oscillation in that North Atlantic – European region (Fereday et al., 2008). Over the GIS, optically thin clouds having LWP<40 g m−2 exert a unique Net radiative surface warming effect that can also inhibit refreeze of surface meltwater (Bennartz et al., 2013; Van Tricht et al., 2016). Other multidecadal surface radiation measurements in the high Arctic show contrasting trends from this work. Surface radiation measurements from western high Arctic land sites covering an earlier time period (1960s until 2004) show negative trends in downwelling SW flux that are qualitatively consistent with this work but that do not reach a threshold of statistical significance (Shi et al., 2010). Surface radiative flux measurements from Alert and Resolute Bay in the Canadian high Arctic, spanning 45–47 years up to 2004, show consistent positive annual net radiative flux trends and a correlation with the Arctic Oscillation (Weston et al., 2007). Baseline Surface Radiation Network (BSRN) measurements spanning 1992–2013 at Ny-Ålesund (Svalbard) show summertime increases in net radiation at the rate of ∼8.4 W m−2 per decade (Maturilli et al., 2015). More generally, the satellite remote sensing studies cited above show considerable spatial variability in surface radiative flux trends.
Nevertheless the results reported here are unique in showing the detection of statistically significant surface net radiative flux trends in direct measurements at a high Arctic coastal site, along with well characterized surface-based observations of trends in PWV and LWP that help explain the radiative flux trends in terms of the local atmospheric moisture content and its transport from both lower latitudes and the adjacent Arctic Ocean. These results highlight the value in establishing and maintaining well-equipped atmospheric observatories at remote high latitude sites capable of measuring the surface energy fluxes, tropospheric moisture and cloud properties, and explaining their atmospheric driving mechanisms.
All observational data are found in the US Department of Energy Atmospheric Radiation Measurement (ARM) Facility archive (https://www.arm.gov, last access: 22 December 2025, and searchable by NSA site and measurement/instrument type). ERA5 data were obtained from the Copernicus Climate Data Store, https://doi.org/10.24381/cds.bd0915c6 (Hersbach et al., 2023a) and https://doi.org/10.24381/cds.adbb2d47 (Hersbach et al., 2023b).
DL led the research effort including acquiring funding, organizing the project, performing NSA data analysis and drafting the manuscript. XZ provided the atmospheric river analysis and contributed to manuscript preparation. JM provided the k-means cluster analysis and contributed to manuscript preparation, AV contributed to funding acquisition, project organization and manuscript preparation. MC assisted with interpreting microwave radiometer data and contributed to manuscript preparation. DZ is the Instrument Mentor (ARM Facility database manager) for the NSA instruments used in this research, and contributed to manuscript preparation.
The contact author has declared that none of the authors has any competing interests.
Publisher's note: Copernicus Publications remains neutral with regard to jurisdictional claims made in the text, published maps, institutional affiliations, or any other geographical representation in this paper. The authors bear the ultimate responsibility for providing appropriate place names. Views expressed in the text are those of the authors and do not necessarily reflect the views of the publisher.
The authors acknowledge the thoughtful comments and suggestions of the two anonymous referees.
This research has been supported by the Biological and Environmental Research (grant no. DE-SC0021974).
This paper was edited by Franziska Aemisegger and reviewed by two anonymous referees.
Barrientos-Velasco, C., Deneke, H., Hünerbein, A., Griesche, H. J., Seifert, P., and Macke, A.: Radiative closure and cloud effects on the radiation budget based on satellite and shipborne observations during the Arctic summer research cruise, PS106, Atmos. Chem. Phys., 22, 9313–9348, https://doi.org/10.5194/acp-22-9313-2022, 2022.
Bennartz, R., Shupe, M. D., Turner, D. D., Walden, V. P., Steffen, K., Cox, C. J., Kulie, M. S., Miller, N. B., and Pettersen, C.: July 2012 Greenland melt enhanced by low-level liquid clouds, Nature, 496, 83–86, https://doi.org/10.1038/nature12002, 2013.
Bromwich, D. H., Gorodetskaya, I. V., Carpentier, S., Alexander, S., Bazile, E., Heinrich, V. J., Massonnet, F., Powers, J. G., Carrasco, J. F., Cayette, A., Choi, T., Chyhareva, A., Colwell, S. R., Cordeira, J. M., Cordero, R. R., Doerenbecher, A., Durán-Alarcón, C., French, W. J. R., Gonzalez-Herrero, S., Guyot, A., Haiden, T., Hirasawa, N., Rodriguez Imazio, P., Kawzenuk, B., Krakovska, S., Lazzara, M. A., Litell, M. F., Manning, K. W., Norris, K., Park, S.-J., Ralph, F. M., Rowe, P. M., Sun, Q., Vitale, V., Wille, J. D., Zhang, Z., and Zou, X.: Winter targeted observing periods during the Year of Prediction in the Southern Hemisphere (YOPP-SH), B. Am. Meteor. Soc., 105, E1662–E1684, https://doi.org/10.1175/BAMS-D-22-0249.1, 2024.
Bush, B. C., Valero, F. P. J., Simpson, A. S., and Bignone, L: Characterization of thermal effects in pyranometers: A data correction algorithm for improved measurement of surface insolation, J. Atmos. Ocean. Tech., 17, 165–175, https://doi.org/10.1175/1520-0426(2000)017<0165:COTEIP>2.0.CO;2, 2000.
Cadeddu, M. P., Liljegren, J. C., and Turner, D. D.: The Atmospheric radiation measurement (ARM) program network of microwave radiometers: instrumentation, data, and retrievals, Atmos. Meas. Tech., 6, 2359–2372, https://doi.org/10.5194/amt-6-2359-2013, 2013.
Cesana, G. V., Pierpaoli, O., Ottaviani, M., Vu, L., Jin, Z., and Silber, I.: The correlation between Arctic sea ice, cloud phase and radiation using A-Train satellites, Atmos. Chem. Phys., 24, 7899–7909, https://doi.org/10.5194/acp-24-7899-2024, 2024.
Comiso, J. C. and Hall, D. K.: Climate trends in the Arctic as observed from space, WIREs Climate Change, 5, 389–409, https://doi.org/10.1002/wcc.277, 2014.
Desai, N., Diao, M., Shi, Y., and Liu, X.: A comparative study of cloud properties between northern and southern high latitudes based on ARM observations and EAMv2 simulations, J. Geophys. Res.-Atmos., 130, e2024JD041588, https://doi.org/10.1029/2024JD041588, 2024.
Di Biagio, C., Pelon, J., Blanchard, Y., Loyer, L., Hudson, S. R., Walden, V. P., Raut, J.-C., Kato, S., Mariage, V., and Granskog, M. A.: Toward a better surface radiation budget analysis over sea ice in the high Arctic Ocean: A comparative study between satellite, reanalysis, and local-scale observations, J. Geophys. Res.-Atmos., 126, e2020JD032555, https://doi.org/10.1029/2020JD032555, 2020.
Ding, Q., Wallace, J. M., Battisti, D. S., Steig, E. J., Gallant, A. J. E., Kim, H.-J., and Geng, L.: Tropical forcing of recent rapid Arctic warming in northeastern Canada and Greenland, Nature, 509, 209–212, https://doi.org/10.1038/nature13260, 2014.
Dong, X. and Mace, G. G.: Arctic stratus cloud properties and radiative forcing derived from ground-based data collected at Barrow, Alaska, J. Climate, 16, 445–461, https://doi.org/10.1175/1520-0442(2003)016<0445:ASCPAR>2.0.CO;2, 2003.
Esau, I., Pettersson, L. H., Cancet, H., Chapron, B., Chernokulsky, A., Donlon, C., Sizov, O., Soromotin, A., and Johannesen, J. A.: The Arctic amplification and its impact: A synthesis through satellite observations, Remote Sens., 15, 1354, https://doi.org/10.3390/rs15051354, 2023.
Fereday, D. R., Knight, J. R., Acaife, A. A., and Folland, C. K.: Cluster analysis or North Atlantic – European circulation types and links with tropical Pacific sea surface temperatures, J. Climate, 21, 3687–3703, https://doi.org/10.1175/2007JCLI1875.1, 2008.
Guan, B. and Waliser, D.: Detection of atmospheric rivers: Evaluation and application of an algorithm for global studies, J. Geophys. Res.-Atmos., 129, 12514–12535, https://doi.org/10.1002/2015JD024257, 2015.
Hersbach, H., Bell, B., Berrisford, P., Hirahara, S., Horányi, A., Muñoz-Sabater, J., Nicolas, J., Peubey, C., Radu, R., Schepers, D., Simmons, A., Soci, C., Abdalla, S., Abella, X., Balsamo, G., Bechtold, P., Biavati, G., Bidlot, J., Bonavita, M., De Chiara, G., Dahlgren, P., Dee, D., Diamantakis, M., Dragani, R., Flemming, J., Forbes, R., Fuentes, M., Geer, A., Haimburger, L., Healy, S., Hogan, R. J., Hólm, E., Janisková, M., Keeley, S., Laloyaux, P., Lopez, P., Lupu, C., Radnoti, G., de Rosnay, P., Rozum, I., Vamborg, F., Villaume, S., and Thépaut, J.-N.: The ERA5 global reanalysis, Q. J. Roy. Meteorol. Soc. A, 146, 1–51, https://doi.org/10.1002/qj.3803, 2020.
Hersbach, H., Bell, B., Berrisford, P., Biavati, G., Horányi, A., Muñoz Sabater, J., Nicolas, J., Peubey, C., Radu, R., Rozum, I., Schepers, D., Simmons, A., Soci, C., Dee, D., and Thépaut, J.-N.: ERA5 hourly data on pressure levels from 1940 to present. Copernicus Climate Change Service (C3S) Climate Data Store (CDS) [data set], https://doi.org/10.24381/cds.bd0915c6, 2023a.
Hersbach, H., Bell, B., Berrisford, P., Biavati, G., Horányi, A., Muñoz Sabater, J., Nicolas, J., Peubey, C., Radu, R., Rozum, I., Schepers, D., Simmons, A., Soci, C., Dee, D., and Thépaut, J.-N.: ERA5 hourly data on single levels from 1940 to present. Copernicus Climate Change Service (C3S) Climate Data Store (CDS) [data set], https://doi.org/10.24381/cds.adbb2d47, 2023b.
Huang, Y., Dong, X., Xi, B., Dolinar, E. K., and Stanfield, R. E.: The footprints of 16 year trends of Arctic springtime cloud and radiation properties on September sea ice retreat, J. Geophys. Res.-Atmos., 122, 2179–2193, https://doi.org/10.1002/2016JD026020, 2017.
Intrieri, J. M., Shupe, M. D., Uttal, T., and McCarty, B. J.: An annual cycle of Arctic cloud characteristics observed by radar and lidar at SHEBA, J. Geophys. Res.-Oceans, 107, 8030, https://doi.org/10.1029/2000JC000423, 2002.
Lee, K.-H., Lee, K.-T., Zo, I.-S., Jee, J.-B., Kim, K., and Lee, D.: Evolving patterns of arctic aerosols and the influence of regional variations over two decades, Sci. Total Environ., 957, 177465, https://doi.org/10.1016/j.scitotenv.2024.177465, 2024.
Lelli, L., Vountas, M., Khosravi, N., and Burrows, J. P.: Satellite remote sensing of regional and seasonal Arctic cooling showing a multi-decadal trend towards brighter and more liquid clouds, Atmos. Chem. Phys., 23, 2579–2611, https://doi.org/10.5194/acp-23-2579-2023, 2023.
Liu, Y., Key, J. R., and Wang, X.: The influence of changes in cloud cover on recent surface temperature trends in the Arctic, J. Climate, 21, 705–715, https://doi.org/10.1175/2007JCLI1681.1, 2008.
Lubin, D. and Vogelmann, A. M.: The influence of mixed-phase clouds on surface shortwave irradiance during the Arctic spring, J. Geophys. Res.-Atmos., 116, D00T05, https://doi.org/10.1029/2011JD015761, 2011.
Mattingly, K. S., Mote, T. L., Fettweis, X., van As, D., Van Tricht, K., Lhermitte, S., Pettersen, C., and Fausto, R. S.: Strong summer atmospheric rivers trigger Greenland Ice Sheet melt through spatially varying surface energy balance and cloud regimes, J. Climate, 33, 6809–6832, https://doi.org/10.1175/JCLI-D-19-0835.1, 2020.
Maturilli, M., Herber, A., and König-Langlo, G.: Surface radiation climatology for Ny-Ålesund, Svalbard (78.9° N), basic observations for trend detection, Theor. Appl. Climatol., 120, 331–339, https://doi.org/10.1007/s00704-014-1173-4, 2015.
Michalsky, J. J. and Long, C. N.: ARM solar and infrared broadband and filter radiometry, Meteor. Mon., 57, 16.1–16.15, https://doi.org/10.1175/AMSMONOGRAPHS-D-15-0031.1, 2016.
Miller, N. B., Shupe, M. D., Cox, C. J., Noone, D., Persson, P. O. G., and Steffen, K.: Surface energy budget responses to radiative forcing at Summit, Greenland, The Cryosphere, 11, 497–516, https://doi.org/10.5194/tc-11-497-2017, 2017.
Mülmenstädt, J., Lubin, D., Russell, L. M., and Vogelmann, A. M.: Cloud properties over the North Slope of Alaska: Identifying the prevailing meteorological regimes, J. Climate, 25, 8238–8257, https://doi.org/10.1175/JCLI-D-11-00636.1, 2012.
Newman, M., Kiladis, G. N., Weickmann, K. M., Ralph, F. M., and Sardeshmukh, P. D.: Relative contributions of synoptic and low-frequency eddies to time-mean atmospheric moisture transport, including the role of atmospheric rivers, J. Climate, 25, 7341–7361, https://doi.org/10.1175/JCLI-D-11-00665.1, 2012.
Pettersen, C., Bennartz, R., Merrelli, A. J., Shupe, M. D., Turner, D. D., and Walden, V. P.: Precipitation regimes over central Greenland inferred from 5 years of ICECAPS observations, Atmos. Chem. Phys., 18, 4715–4735, https://doi.org/10.5194/acp-18-4715-2018, 2018.
Ralph, F. M., Dettinger, M. D., Cairns, M. M., Galarneau, T. J., and Eylander, J.: Defining “atmospheric river”: How the Glossary of Meteorology helped resolve a debate, B. Am. Meteorol. Soc., 99, 837–839, https://doi.org/10.1175/BAMS-D-17-0157.1, 2018.
Ralph, F. M., Rutz, J. J., Cordeira, J. M., Dettinger, M., Anderson, M., Reynolds, D., Schick, L. J., and Smallcomb, C.: A scale to characterize the strength and impacts of atmospheric rivers, B. Am. Meteorol. Soc., 100, 269–289, https://doi.org/10.1175/BAMS-D-18-0023.1, 2019.
Riihelä, A., Key, J. R., Meirink, J. F., Kuipers Munneke, P., Palo, T., and Karlsson, K-G.: An intercomparison and validation of satellite-based surface radiative energy flux estimates over the Arctic, J. Geophys. Res.-Atmos., 122, 4829–4848, https://doi.org/10.1002/2016JD026443, 2017.
Schmale, J., Sharma, S., Decesari, S., Pernov, J., Massling, A., Hansson, H.-C., von Salzen, K., Skov, H., Andrews, E., Quinn, P. K., Upchurch, L. M., Eleftheriadis, K., Traversi, R., Gilardoni, S., Mazzola, M., Laing, J., and Hopke, P.: Pan-Arctic seasonal cycles and long-term trends of aerosol properties from 10 observatories, Atmos. Chem. Phys., 22, 3067–3096, https://doi.org/10.5194/acp-22-3067-2022, 2022.
Serreze, M. C. and Barry, R. G.: Processes and impacts of Arctic amplification: A research synthesis, Global Planet. Change, 77, 85–96, https://doi.org/10.1016/j.gloplacha.2011.03.004, 2011.
Serreze, M. C. and Barry, R. G.: The Arctic Climate System, Cambridge University Press, New York, NY, 404 pp., ISBN 9781107037175, 2014.
Serreze, M. C., Box, J. E., Barry, R. G., and Walsh, J. E.: Characteristics of Arctic synoptic activity, 1952–1989, Meteor. Atmos. Phys., 51, 147–164, https://doi.org/10.1007/BF01030491, 1993.
Shi, X., Wild, M., and Lettenmaier, D. P.: Surface radiative fluxes over the pan-Arctic land region: Variability and trends, J. Geophys. Res.-Atmos., 115, D22104, https://doi.org/10.1029/2010JD014402, 2010.
Shupe, M. D., Turner, D. D., Walden, V. P., Bennartz, R., Cadeddu, M. P., Castellani, B. B., Cox, C. J., Hudak, D. R., Kulie, M. S., Miller, N. B., Neely III, R. R., Neff, W. D., and Rowe, P. M.: High and dry: New observations of tropospheric and cloud properties over the Greenland Ice Sheet, B. Am. Meteorol. Soc., 95, 170–186, https://doi.org/10.1175/BAMS-D-11-00249.1, 2013.
Shupe, M. D., Rex, M., Blomquist, B., Persson, P. O. G., Schmale, J., Uttal, T., Althausen, D., Angot, H., Archer, S., Bariteau, L., Beck, I., Bilberry, J., Bucci, S., Buck, C., Boyer, M., Brasseur, Z., Brooks, I. M., Calmer, R., Cassano, J., Castro, C., Chu, D., Costa, D., Cox, C. J., Creamean, J., Crewell, S., Dahlke, S., Damm, E., de Boer, G., Deckelmann, H., Dethloff, K., Dütsch, M., Ebell, K., Ehrlich, A., Ellis, J., Engelmann, R., Fong, A. A., Frey, M. M., Gallagher, M. R., Ganzeveld, L., Gradinger, R., Graeser, J., Geenamyer, V., Griesche, H., Griffiths, S., Hamilton, J., Heinemann, G., Helmig, D., Herber, A., Heuzé, H., Hofer, J., Houchens, T., Howard, D., Inoue, J., Jacobi, H.-W., Jaiser, R., Jokinen, T., Jourdan, O., Jozef, G., King, W., Kirchgaessner, A., Klingbiel, M., Krassovski, M., Krumben, T., Lampert, A., Landing, W., Laurilia, T., Lawrence, D., Lonardi, M., Loose, B., Lüpkes, C., Maahn, M., Macke, A., Maslowski, W., Marsay, C., Maturilli, M., Mech, M., Morris, S., Moser, M., Nicolaus, M., Ortega, P., Osborn, J., Patzold, F., Perovich, D. K., Petaja, T., C., Pirazzini, R., Posman, K., Powers, H., Pratt, K. A., Preusser, A., Quéléver, L., Radenz, M., Rabe, B., Rinke, A., Sachs, T., Schulz, A., Siebert, H., Silva, T., Solomon, A., Sommerfeld, A., Spreen, G., Stephens, M., Stohl, A, Svensson, G., Uin, J., Viegas, J., Viugt, C., von der Gathen, P., Wehner, B., Welker, J. M., Wendisch, M., Werner, M., Xie, Z. Q., and Yue, F.: Overview of the MOSAiC expedition: Atmosphere, Elementa, 10, 00060, https://doi.org/10.1525/elementa.2021.00060, 2022.
Sledd, A. and L'Ecuyer, T. S.: Emerging trends in Arctic solar absorption, Geophys. Res. Lett., 48, e2021GL095813, https://doi.org/10.1029/2021GL095813, 2021.
Smith, W. L., Hansen, C., Bucholtz, A., Anderson, B. E., Beckley, M., Corbett, J. G., Cullather, R. I., Hines, K. M., Hofton, M., Kato, S., Lubin, D., Moore, R. H., Segal Rosenhaimer, M., Redemann, J., Schmidt, S., Scott, R. Song, S., Barrick, J. D., Blair, J. B., Bromwich, D. H., Brooks, C., Chen, G., Cornejo, H., Corr, C. A., Ham, S.-H., Kittelman, S., Knappmiller, S., LeBlanc, S., Loeb, N. G., Miller, C., Nguyen, L., Palikonda, R., Rabine, D., Reid, E. A., Richter-Menge, J. A., Pilewskie, P., Shinozuka, Y., Spangenberg, D., Stackhouse, P., Taylor, P., Thornhill, K. L., van Gilst, D., and Winstead, E.: Arctic Radiation-IceBridge Sea and Ice Experiment: The Arctic radiant energy system during the critical seasonal ice transition, B. Am. Meteorol. Soc., 98, 1399–1426, https://doi.org/10.1175/BAMS-D-14-00277.1, 2017.
Stauffer, C. L., Tan, I., and Matrosov, S. Y.: Aerosol and meteorological influences on mixed-phase stratiform clouds at the North Slope of Alaska, Geophys. Res. Lett., 52, e2025GL114815, https://doi.org/10.1029/2025GL114815, 2025.
Swain, B., Vountas, M., Deroubaix, A., Lelli, L., Ziegler, Y., Jafariserajehlou, S., Gunthe, S. S., Herber, A., Ritter, C., Bösch, H., and Burrows, J. P.: Retrieval of aerosol optical depth over the Arctic cryosphere during spring and summer using satellite observations, Atmos. Meas. Tech., 17, 359–375, https://doi.org/10.5194/amt-17-359-2024, 2024.
Tan, I. and Storelvmo, T.: Evidence of strong contributions from mixed-phase clouds to Arctic climate change, Geophys. Res. Lett., 46, 2894–2902, https://doi.org/10.1029/2018GL081871, 2019.
Tan, I., Zhou, C., Lamy, A., and Stauffer, C. L.: Moderate climate sensitivity due to opposing mixed-phase cloud feedbacks, Clim. Atmos. Sci., 8, 86, https://doi.org/10.1038/s41612-025-00948-7, 2025.
Taylor, P. C., Boeke, R. C., Boisvert, L. N., Feldl, N., Henry, M., Huang, Y., Langen, P. L., Liu, W., Pithan, F., Sejas, S. A., and Tan, I.: Process drivers, inter-model spread, and the path forward: A review of amplified Arctic warming, Front. Earth. Sci., 9, 758361, https://doi.org/10.3389/feart.2021.758361, 2022.
Taylor, P. C., Boeke, R. C., and Bodas-Salcedo, A.: Influence of parameterization changes on Arctic low cloud properties and cloud radiative effects in two versions of the HadGEM3 atmospheric model: GA7.1 and GA6, Earth Space Sci., 11, e2024EA003579, https://doi.org/10.1029/2024EA003579, 2024.
Tjernström, M., Leck, C., Birch, C. E., Bottenheim, J. W., Brooks, B. J., Brooks, I. M., Bäcklin, L., Chang, R. Y.-W., de Leeuw, G., Di Liberto, L., de la Rosa, S., Granath, E., Graus, M., Hansel, A., Heintzenberg, J., Held, A., Hind, A., Johnston, P., Knulst, J., Martin, M., Matrai, P. A., Mauritsen, T., Müller, M., Norris, S. J., Orellana, M. V., Orsini, D. A., Paatero, J., Persson, P. O. G., Gao, Q., Rauschenberg, C., Ristovski, Z., Sedlar, J., Shupe, M. D., Sierau, B., Sirevaag, A., Sjogren, S., Stetzer, O., Swietlicki, E., Szczodrak, M., Vaattovaara, P., Wahlberg, N., Westberg, M., and Wheeler, C. R.: The Arctic Summer Cloud Ocean Study (ASCOS): overview and experimental design, Atmos. Chem. Phys., 14, 2823–2869, https://doi.org/10.5194/acp-14-2823-2014, 2014.
Turner, D. D.: Improved ground-based liquid water path retrievals using a combined infrared and microwave approach, J. Geophys. Res.-Atmos., 112, D15204, https://doi.org/10.1029/2007JD008530, 2007.
Van Tricht, K., Lhermitte, S., Lenaerts, J. T. M., Gorodetskaya, I. V., L'Ecuyer, T. S., Noël, B., van den Broeke, Turner, D. D., and van Lipzig, N. P. M.: Clouds enhance Greenland ice sheet meltwater runoff, Nat. Commun., 7, 10266, https://doi.org/10.1038/ncomms10266, 2016.
Verlinde, J., Zak, B. D., Shupe, M. D., Ivey, M. D., and Stamnes, K.: The ARM North Slope of Alaska sites, Meteorol. Mon., 57, 8.1–8.13, https://doi.org/10.1175/AMSMONOGRAPHS-D-15-0023.1, 2016.
Wang, K. and Dickinson, R. E.: Global atmospheric downward longwave radiation at the surface from ground-based observations, satellite retrieval, and reanalyses, Rev. Geophys., 51, 150–185, https://doi.org/10.1002/rog.20009, 2013.
Wang, X. and Key, J. R.: Arctic surface, cloud, and radiation properties based on the AVHRR Polar Pathfinder dataset. Part II: Recent trends, J. Climate, 18, 2575–2593, https://doi.org/10.1175/JCLI3438.1, 2005.
Wang, X.,, Key, J., Liu, Y., Fowler, C., Maslanik, J., and Tschudi, M.: Arctic climate variability and trends from satellite observations, Adv. Meteorol., 2012, 505613, https://doi.org/10.1155/2012/505613, 2012.
Wang, X., Liu, J., Yang, B., Bao, Y., Petropoulos, G. P., Liu, H., and Hu, B.: Seasonal trends in clouds and radiation over Arctic seas from satellite observations during 1982–2019, Remote Sens., 13, 3201, https://doi.org/10.3390/rs13163201, 2021.
Wendisch, M., Brückner, M., Crewell, S., Ehrlich, A., Notholt, J., Lüpkes, C., Macke, A., Burrows, J. P., Rinke, A., Quaas, J., Maturilli, M., Schemann, V., Shupe, M. D., Akansu, E. F., Barrientos-Velasco, C., Bärfuss, K., Blechschmidt, A.-M., Block, K., Bougoudis, I., Bozem, H., Böckmann, C., Bracher, A., Bresson, H., Bretschneider, L., Buschmann, M., Chechin, D. G., Chylik, J., Dahlke, S., Deneke, H., Dethloff, K., Donth, T., Dorn, W., Dupuy, R., Ebell, K., Egerer, U., Engelmann, R., Eppers, O., Gerdes, R., Gierens, R., Gorodetskaya, I. V., Gottschalk, M., Griesche, H., Gryanik, V. M., Handorf, D., Harm-Alstädter, B., Hartmann, J., Hartmann, M., Heinold, B., Herber, A., Herrmann, H., Heygster, G., Höschel, I., Hofmann, Z., Holemann, J., Hünerbein, A., Jafariserajehlou, S., Jäkel, E., Jacobi, C., Janout, M., Jansen, F., Jourdan, O., Juranyi, Z., Kalesse-Los, H., Kanzow, T., Käthner, R., Kliesch, L. L., Klingebiel, M., Knudsen, E. M., Kovács, T., Körtke, W., Krampe, D., Kretzschmar, J., Kreyling, d., Kulla, B., Kunkel, D., Lampert, A., Lauer, M., Lelli, L., von Lerber, A., Linke, O., Löhnert, U., Lonardi, M., Losa, S. N., Losch, J., Maahn, M., Mech, M., Mei, L., Mertes, S., Metzner, E., Mewes, D., Michaelis, J., Mioche, G., Moser, M., Nakoudi, K., Neggers, R., Neuber, R., Nomokonova, T., Oelker, J., Papakonstantinou-Presvelou, I., Pätzold, F., Fefanis, V., Pohl, C., van Pinxteren, M., Radovan, A., Rhein, M., Rex, M., Richter, A., Risse, N., Ritter, C., Rostosky, P., Rozanov, V. V., Ruiz Denoso, E., Saavedra Garfias, P., Salzmann, M., Schacht, J., Schäfer, M., Schneider, J., Schnierstein, N., Siefert, P., Seo, S., Siebert, H., Soppa, M. A., Spreen, G., Stachlewska, I. S., Stapf, J., Stratmann, F., Tegen, I., Viceto, C., Voigt, C., Vountas, M., Walbröl, A., Walter, M., Wehner, B., Wex, H., Willmes, S., Zanatta, M., and Zeppenfeld, S.: Atmospheric and surface processes, and feedback mechanisms determining Arctic amplification, B. Am. Meteorol. Soc., 104, E208–E242, https://doi.org/10.1175/BAMS-D-21-0218.1, 2023a.
Wendisch, M., Stapf, J., Becker, S., Ehrlich, A., Jäkel, E., Klingebiel, M., Lüpkes, C., Schäfer, M., and Shupe, M. D.: Effects of variable ice–ocean surface properties and air mass transformation on the Arctic radiative energy budget, Atmos. Chem. Phys., 23, 9647–9667, https://doi.org/10.5194/acp-23-9647-2023, 2023b.
Weston, S. T., Bailey, W. G., McArthur, L. J. B., and Hertzman, O.: Interannual solar and net radiation trends in the Canadian Arctic, J. Geophys. Res.-Atmos., 112, D10105, https://doi.org/10.1029/2006JD008000, 2007.
Wille, J. D., Favier, V., Dufour, A., Gorodetskaya, I. V., Turner, J., Agosta, C., and Codron, F.: West Antarctic surface melt triggered by atmospheric rivers, Nat. Geosci., 12, 911–916, https://doi.org/10.1038/s41561-019-0460-1, 2019.
Zhang, D., Vogelmann, A., Kollias, P., Luke, E., Yang, F., Lubin, D., and Wang, Z.: Comparison of Antarctic and Arctic single-layer stratiform mixed-phase cloud properties using ground-based remote sensing measurements, J. Geophys. Res.-Atmos., 124, 10186–10204, https://doi.org/10.1029/2019JD030673, 2019.
Zhang, Z., Ralph, F. M., Zou, X., Kawzenuk, B., Zheng, M., Gorodetskaya, I. V., Rowe, P. M., and Bromwich, D. H.: Extending the Center for Western Weather and Water Extremes (CW3E) atmospheric river scale to the polar regions, The Cryosphere, 18, 5239–5258, https://doi.org/10.5194/tc-18-5239-2024, 2024.