the Creative Commons Attribution 4.0 License.
the Creative Commons Attribution 4.0 License.
 | 24 Feb 2026
Diurnal and Seasonal Variations of Dust Transport around the Tibetan Plateau: Insights from Multi-Source Observations
Zixu Xiong
Jianming Gong
Huilin Zhang
Tianliang Zhao
Qing He
Dust transport around the Tibetan Plateau (TP) plays a key role in regional climate and air quality, yet its seasonal and diurnal variability remains insufficiently understood. Here, we presented the spatiotemporal characteristics of dust transport in the TP region combining satellite observations, reanalysis datasets and ground-based measurements. A new method for dust mass concentration based on CATS (Cloud-Aerosol Transport System) lidar was developed and showed strong consistency with multiple products in both spatial and temporal scales. Our results revealed persistent dust transport belts on both the northern and southern sides of TP, with peaks in spring. The amounts of dust flux transported to TP were estimated for different directional sources, seasons and heights. The vertical variation and amount of dust backflow in Taklamakan Desert were analyzed. The diurnal characteristics of vertical resolved dust flux were presented in three-hour interval and four sections around TP. Overall, this study deepened the understanding of the dust climatology over the TP region from a satellite perspective.
- Article
(16068 KB) - Full-text XML
-
Supplement
(5763 KB) - BibTeX
- EndNote


The Tibetan Plateau (TP), known as the ”Roof of the World”, is the highest and largest plateau on Earth. It serves as the source of several major rivers in Asia, including the Yangtze, Yellow and Indus Rivers. The plateau's mechanical and thermal forcing has a profound influence on atmospheric circulation, monsoon precipitation, the transport of atmospheric materials, and air-sea interactions (Duan et al., 2012; Huang et al., 2023; Liu et al., 2020; Wu, 2020), playing a critical role in both regional and global climate systems. In addition, TP is located near the Taklamakan Desert (TD), the Thar Desert (TH), and the Gobi Desert (GD), all of which are key sources of dust aerosols in Asia and over the world. The dust aerosols in this region (Xu et al., 2015) can cause an instantaneous atmospheric heating of up to 5.5 K d−1, and significantly impact the atmospheric thermal and dynamic structure (Jia et al., 2018). This can even lead to the intensification of the Tibetan anticyclone and the northward shift and the strengthening of the Mei-Yu rain belt (Lau and Kim, 2018). The dust deposited on snow can reduce the surface albedo by accelerating the snow melting (Zhao et al., 2022), which in turn has profound effects on ecosystems, water resources, and climate change (Wang et al., 2015).
Given the significant impact of TP and dust aerosols in the region, extensive research has been conducted on the sources, distribution, and transport of dust aerosols. In terms of model simulation, Liu et al. (2015) utilized the Spectral Radiation-Transport Model for Aerosol Species in conjunction with a non-hydrostatic regional model, revealing that dust plumes at altitudes of 7–8 km over the TP during summer mainly originated from TD. Due to topographical constraints, the northwesterly winds shifted to northeasterly, carrying the dust to the northern slope of the TP. Similarly, Chen et al. (2013) employed the WRF-Chem model to analyze a severe dust storm event in TD, finding that dust penetrated the boundary layer and extended into the upper troposphere of the northern TP, with dust transport flux of 6.6 Gg d−1. In a more comprehensive study, Hu et al. (2020) utilized the WRF-Chem model with tracer-tagging technique to track dust sources at different altitudes over the TP. Their findings showed that East Asian dust, mainly from the TD and GD, entered TP from the northern slope, with a mass flux of 7.9 Tg yr−1. In contrast, dust from North Africa and the Middle Eastern deserts entered TP from the west, with mass fluxes of 7.8 and 26.6 Tg yr−1, respectively. However, Zhang et al. (2024) highlighted a significant limitation in traditional WRF-Chem simulations, which often underestimated dust emissions over the TP. By adjusting the erodibility factor in the model, they estimated total dust emissions from the TP in 2018 to be 258.82 Tg yr−1. Despite these adjustments, it is important to note that the dust mass concentration (DMC) and transport flux simulated by models might vary considerably due to differences in model configurations and parameterization schemes, leading to substantial uncertainty (Zhao et al., 2020).
On the observational side, Jia et al. (2015) used backward trajectories and weather system analysis to show that summer dust over the TP primarily originated from TD, TH, and the Gurbantunggut Desert, with dust activity being closed linked to cold air advection and low-pressure systems. Using MISR and CALIPSO (Cloud-Aerosol Lidar and Infrared Pathfinder Satellite Operations) data, Xu et al. (2015) illustrated the distribution of aerosol optical thickness over the TP, noting that due to the elevation differences between the northern and southern slopes, aerosols were more likely to reach the TP via the northern slope. Xu et al. (2018) further reported that the dust mass flux was 1010 g across a 2° latitude band downstream of the TP in the upper troposphere in spring based on CALIPSO and ERA-5 datasets. They also found a distinct dust belt extending across the Pacific to North America, observable at altitudes above 6 km along the TP's downwind direction. In a more recent study, Han et al. (2022a) proposed an effective method of converting satellite-observed aerosol data into mass concentration and transport flux, and estimated the dust transport contributions from East Asian and South Asian deserts to mainland China and its neighboring seas based on CALIPSO observations, which were 214.28 and 30.43 Tg, respectively. However, despite these important findings, there remain limitations in observational studies concerning the three-dimensional distribution of DMC in this region. Furthermore, due to the limited spatiotemporal resolution of traditional satellites such as CALIPSO, estimating of diurnal variations in dust transport flux from surrounding deserts (TD, TH, GD) to the TP are still scarce. The operation of the CATS (Cloud-Aerosol Transport System) lidar offers a promising opportunity to fill this gap. While it does not allow continuous monitoring of a specific area throughout the entire day, it enables the reconstruction of an almost complete daily cycle for the region by statistically integrating CATS data over approximately 60 d (Chepfer et al., 2019; Yorks et al., 2016). This study thus applied the method of Han et al. (2022a) to derive relatively accurate seasonal and diurnal cycles of dust over TP and its surroundings based on CATS observational data. In the following, we describe the methods and data in Sect. 2 and present the major results in Sect. 3, which include spatial changes, diurnal and seasonal variability, and vertical distributions of dust transport. Then, we conclude the study in Sect. 4.
As shown in Fig. 1, the main study area included TP and three surrounding deserts: the TD, GD, and TH. Various meteorological and aerosol products, including ground-based, satellite-observed and reanalysis datasets, were used in this study. Details of calculated parameters, source datasets and corresponding variables were shown in Table 1.
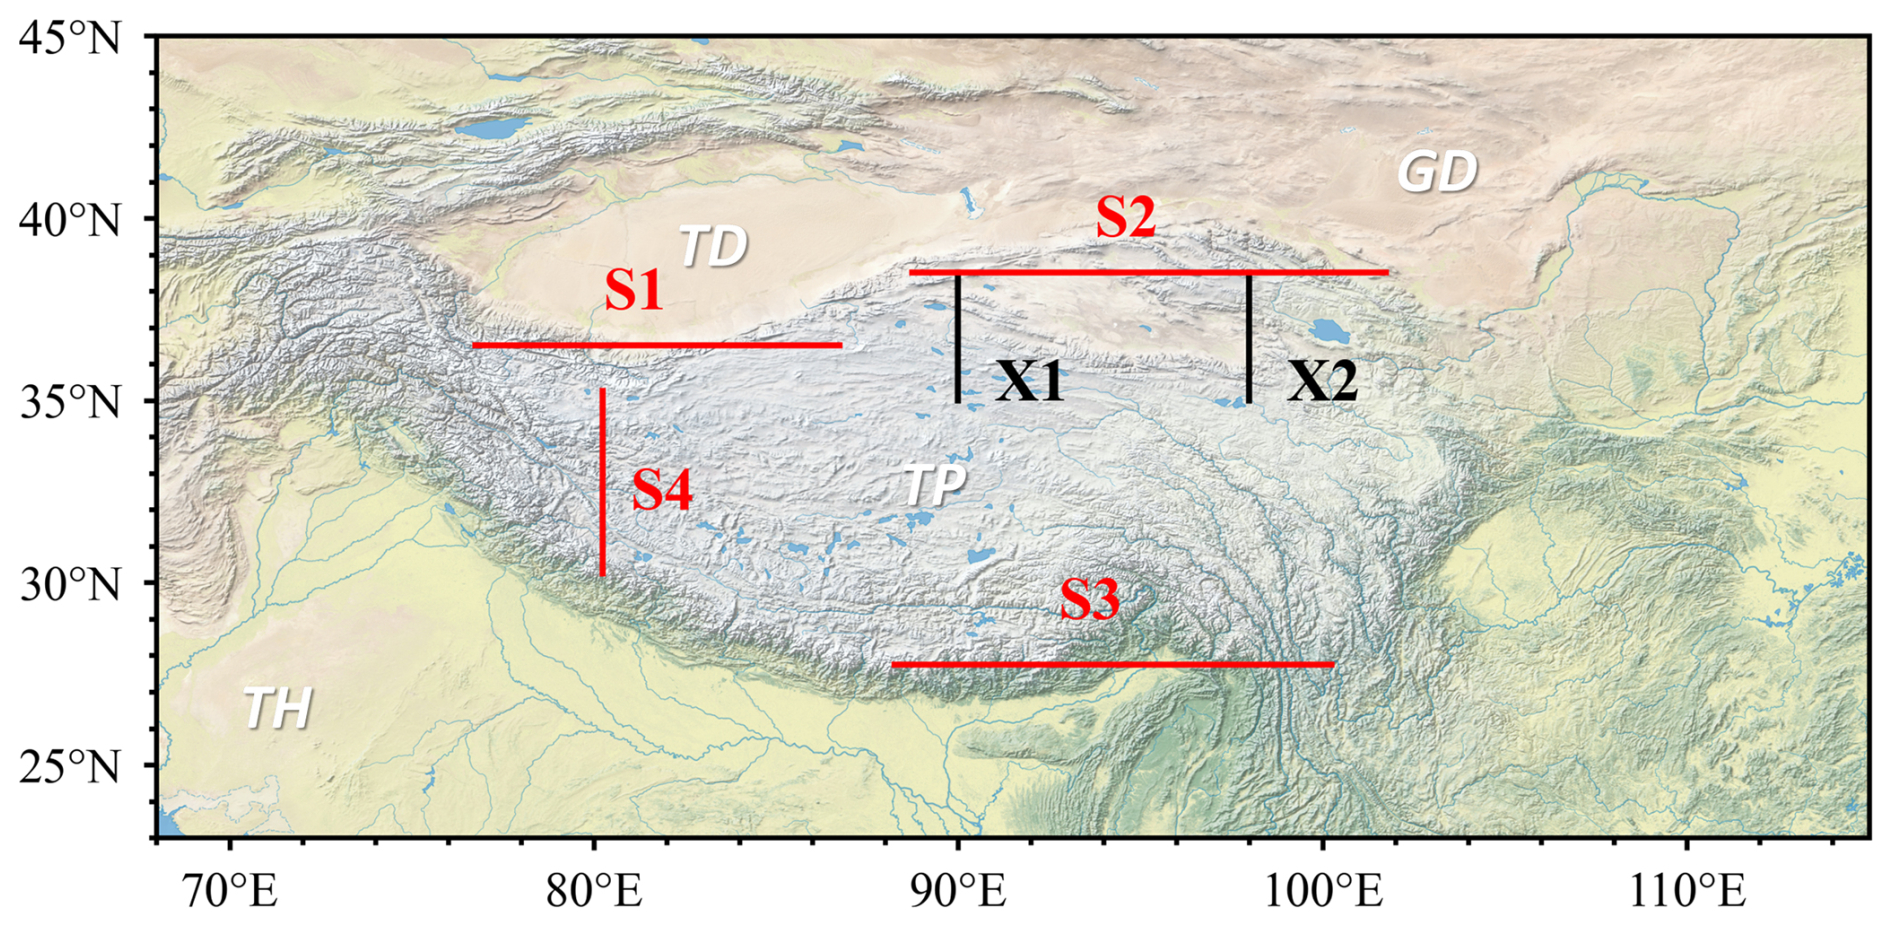
Figure 1The topography of the study aera (23–45° N, 68-115° E). S1 to S4 (S1: 36.5° N, 76.75–86.75° E; S2: 38.5° N, 88.75–101.75° E; S3: 27.75° N, 88.25–100.25° E; S4: 30.25–35.25° N, 80.25° E) were the selected boundaries for the TP-ward dust flux calculation and X1 to X2 (X1: 35–38.5° N, 90° E; X2: 35–38.5° N, 98° E) were used to quantify the dust contribution of the Qaidam Basin to downstream regions.TD, TP, TH, GD are Taklimakan Desert, Tibetan Plateau, Thar Desert and Gobi Desert. Base map data sourced from the Natural Earth dataset.
2.1 Dust extinction coefficient profile
The CATS lidar was installed on the International Space Station (ISS), where it monitored the vertical distribution of atmospheric aerosols and clouds at 1064 nm from March 2015 to October 2017 (McGill et al., 2015). The ISS's orbit at a 51.6° inclination provided CATS a higher temporal resolution from the tropics to mid-latitudes than classical spaceborne sensors such as CALIOP (Cloud-Aerosol Lidar with Orthogonal Polarization). We performed quality control and calculations on the CATS product of Level 2 Operational (L2O) version 3.01 using the method described by Xiong et al. (2023). Two types of dust extinction coefficient σD at 1064 nm were obtained: one is to average out the dust loading over an entire year, characterizing the average dust distribution in climatological state (σD_A), the other considered the dust conditions only during dusty events, describing the short-term and diurnal changes of dust in dusty days (σD_D). Due to the presence of airborne dust layers in the study aera, σD_A and σD_D didn't follow a strict exponential decay with height. Therefore, we relied solely on the available retrieved values for the calculations rather than interpolating at missing values. In most studies, the aerosol optical properties are described in the wavelength of 550 nm, so we firstly introduce a method of converting the σD from 1064 to 532 nm by the aid of CALIPSO.
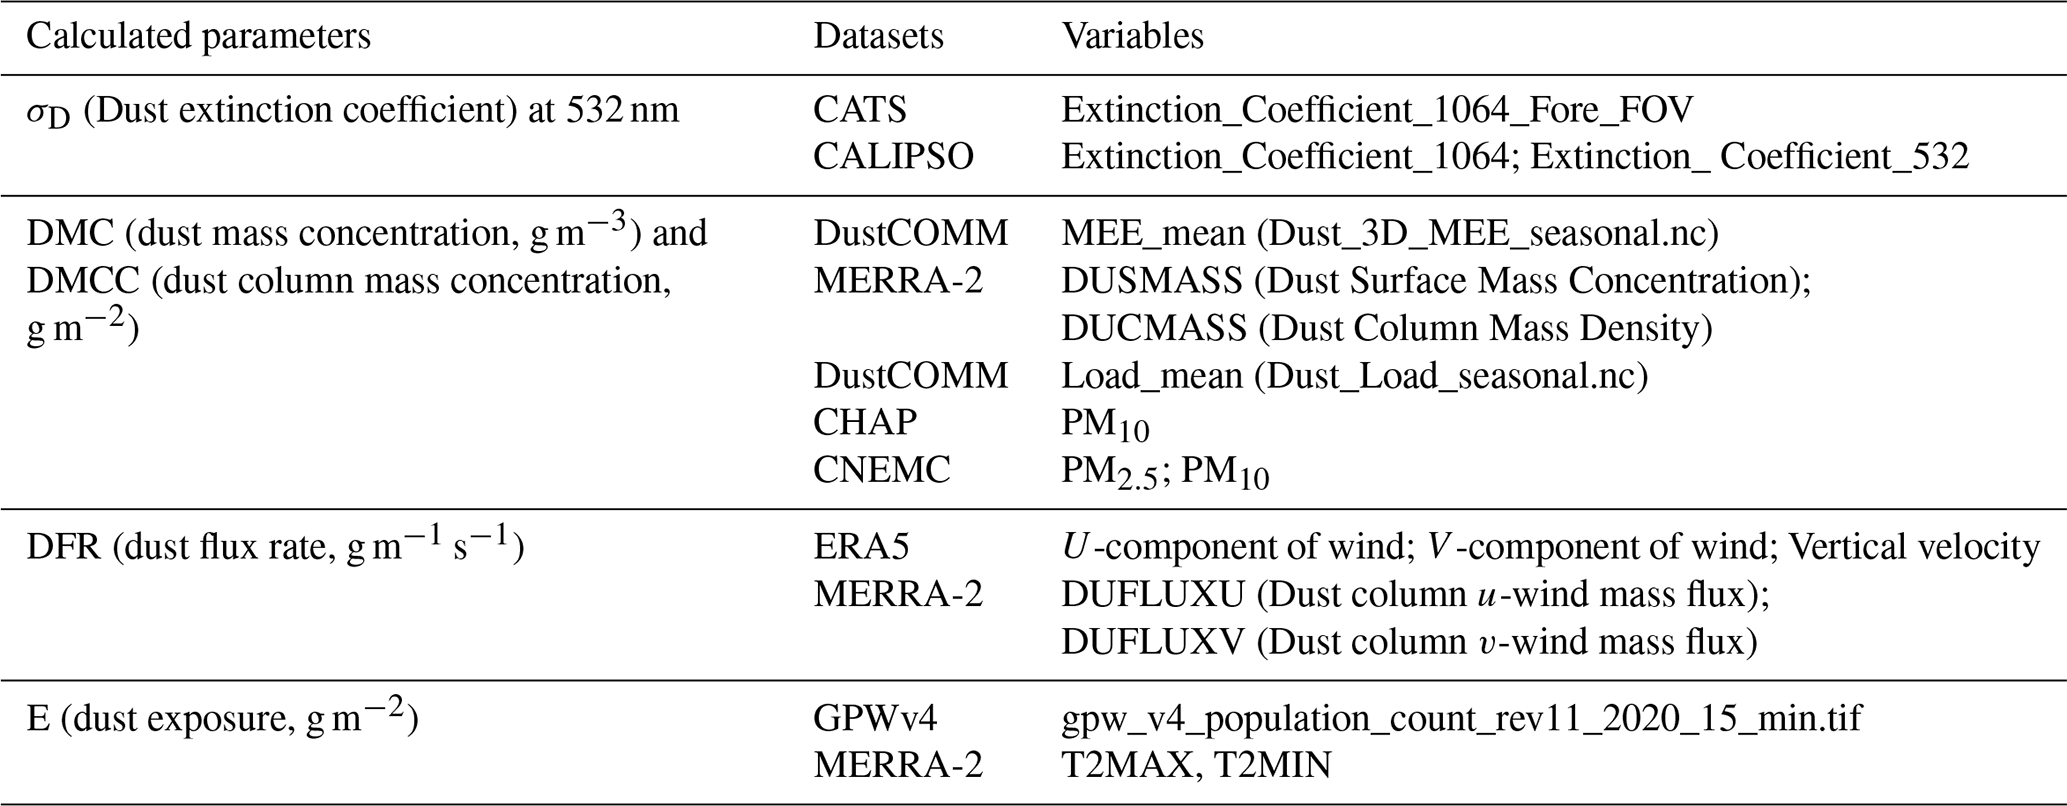
The CALIOP located on the CALIPSO satellite was widely used to study the distribution and transportation of aerosols since its launch in 2006 (Winker et al., 2013). CALIPSO v4.51 L2 aerosol profile product offered the aerosol extinction coefficient at both 1064 and 532 nm. The dust was picked by constraining the Atmospheric Volume Description, which described different feature types and characteristic subtypes. By extracting the CALIPSO σD profiles at two wavelengths on various altitudes in the study area from March 2016 to February 2017, the median profiles of the conversion ratio of extinction coefficient from 1064 to 532 nm (ratio = median of ) in different seasons were showed in Fig. 2. Based on the conversion ratio derived from the CALIOP products, the CATS σD profile at 532 nm was calculated from the CATS product at 1064 nm. Subsequently, these profiles were gridded to a horizontal resolution of 0.5° × 0.5° and a vertical resolution of 60 m.
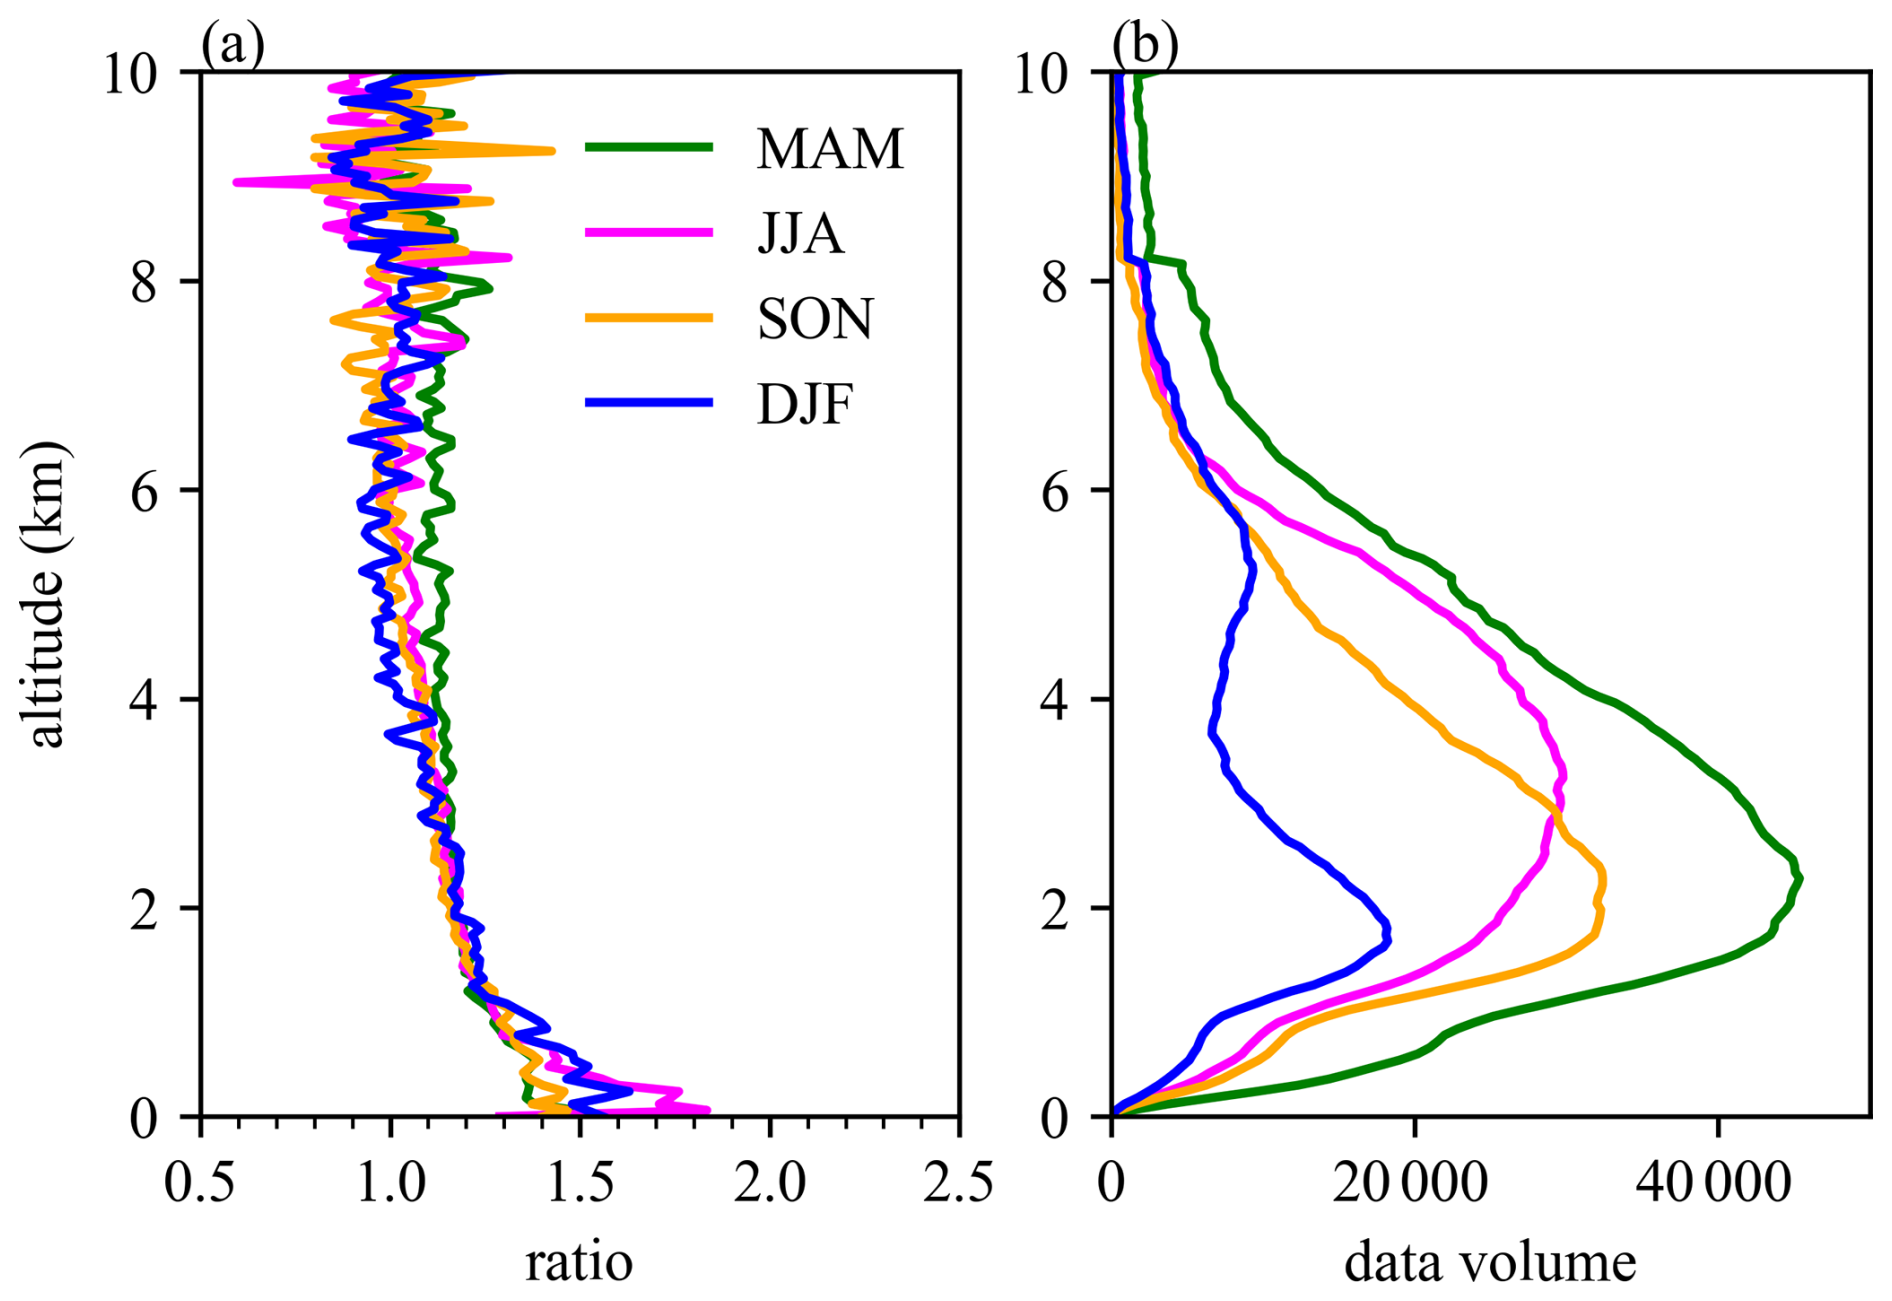
Figure 2(a) The conversion ratio (ratio = median of ) derived from CALIPSO and (b) the data volume of dust samples used in calculation at different altitudes during the period from March 2016 to February 2017.
2.2 Calculation of DMC and flux
MEE (m2 g−1), which was defined as the total light extinction per unit mass of aerosol (Hand and Malm, 2007; Yu et al., 2012) was used to convert the σD to dust mass concentration (DMC) in this study. The MEE was derived from the DustCOMM (Dust Constraints from joint Observational-Modelling-experiMental analysis) dataset (Adebiyi et al., 2020). This dataset integrated the global results of models, observations, and experiments on dust characteristics, providing an unprecedented accuracy of 550 nm dust MEE dataset in three-dimensions (3D) with the spatial resolution of 0.5°×0.625° and 35 pressure levels (Adebiyi et al., 2020). By combining globally averaged dust particle size distribution with spatial variability from model simulations, DustCOMM achieved a more precise dust size distribution in the 0.2–20 µm range, particularly reducing the underestimation of coarse-mode particles in previous models. Additionally, it represented dust particles as a collection of triaxial ellipsoids rather than simple spheres to minimize errors due to particle shape in MEE estimation. The resulting MEE had an error margin reduced to approximately 1 %, rendering it nearly negligible compared to observational data (Adebiyi et al., 2020). The DMC (g m−3) could be derived from the DustCOMM MEE (550 nm, unit: m2 g−1) and CATS σD (532 nm, unit: km−1) as follows, where the error induced by the discrepancy in wavelengths is about several percentage points which could be ignored in subsequent calculations.
Here, the resulting DMCs in the climatological state and in dusty days were calculated as σD_A and σD_D, respectively. Assuming the well mixing of dust in the lowest atmosphere, the average DMC below 180 m was considered as the surface dust mass concentration (DMCS). The total dust loading, also called dust mass column concentration (DMCC, g m−2), was the integral of DMCs from bottom to top of atmosphere. Then, the dust flux rate (DFR, g m−2 s−1) in three directions was calculated as follows:
Where, u, v and w represented the wind speeds in the north-south, east-west, and vertical directions derived from ERA5 reanalysis dataset, respectively. The dust column flux rates of DFRC_U and DFRC_V (g m−1 s−1) were the columnal integrals of the corresponding variables. And total DFRC was the composite of DFRC_U and DFRC_V.
To estimate the contribution of dusts from the Qaidam Basin to downstream cities, it was necessary to exclude the influence from other dust sources, such as TD. As shown in Fig. 1, sections X1 and X2 were defined at the western entrance and eastern exit of the Qaidam Basin, respectively. According to statistics, the annual precipitation in the Qaidam Basin was only 88.31 mm during the period from 1981 to 2010 (Wang et al., 2014). The region experienced an arid climate due to the influence of westerly winds and the Mongolian high-pressure system. Consequently, only the dry deposition process within in the basin was considered, while the wet deposition process was negligible. Then, the net dust flux (Fnet) was calculated following the algorithm proposed by Han et al. (2022a), as below:
where F1 and F2 represented the total integrated dust fluxes at the X1 and X2 cross-sections, respectively. DMCSi and Si denoted the surface dust concentration and grid area at the ith grid point since X1. VD was the dry deposition rate with a constant of 0.02 m s−1 (Han et al., 2022a; Hsu et al., 2009; Wang et al., 2012). fD represented the dust lost fraction at X1 caused by dust deposition and was assumed to be a constant in the basin. Therefore, denoted the remaining integrated dust flux of F1 after travelling k grids eastward from X1. was the remaining dust flux at X2 in the Qaidam Basin. was the total net dust flux at X2 and L was the length of the X2. Fnet was the net flux per unit length along X2 section.
2.3 Other auxiliary data
To assess the reliability of the results, several auxiliary datasets were used. Monthly DMCC, DMCS and DFR from MERRA-2 reanalysis (MERRA2_400.tavgM_2d_aer_Nx) with a horizontal resolution of 0.5°×0.625° were used to compare with our results from CATS. The ground-based observations of PM10 concentration were from the China National Environmental Monitoring Center (CNEMC). Besides, the CHAP dataset, which was produced by an advanced machine learning method, offers a high-resolution (1 km) PM10 data in China, with a high correlation and a low RMSE compared with station observation (Wei et al., 2021). The PM10 concentrations from CHAP and CNEMC, spanning from March 2015 to October 2017, were used to evaluate our calculations of DMCS from CATS. The wind fields of 2016 were derived from the hourly and monthly ERA5 reanalysis products, with a horizontal resolution of 0.5°×0.5° and 20 pressure levels ranging from 1000 to 300 hPa.
3.1 Dust transport features from four datasets
Figure 3 showed the seasonal spatial distribution of climatic-state dust column mass concentration (DMCC) and dust surface mass concentration (DMCS) from four datasets of CATS, MERRA-2, DustCOMM and CHAP during 2015–2017. As to DMCC, CATS demonstrated a good consistency with the other two datasets in both spatial and temporal distributions. In the study aera, the DMCC in the three main dust sources (TD, TH and GD) was significantly higher than that in the other regions throughout the whole year, with the highest loading in TD, which is consistent with the previous studies (Li et al., 2023a; Xu et al., 2015, 2020). A long-standing dust belt existed over TD and surroundings, which could convey dust southward across the Qaidam Basin to TP, and eastward to affect the air quality of East China and North China. It presented consistently a larger dust loading of 2 to 3 times in spring (MAM) and summer (JJA) than in autumn (SON) and winter (DJF) in all three datasets. The differences of annual average among these datasets were also acceptable, showing annual regional means of 0.111 (CATS), 0.138 (MERRA-2) and 0.122 g m−2 (DustCOMM), respectively. The mean DMCCs of MERRA-2 and DustCOMM were about 24 % and 9.9 % higher than the CATS value, respectively. The previous studies also noted the overestimation of MERRA-2 in deserts and surrounding regions (e.g., East Asia deserts, Northwest China, and Australia) relative to CALIPSO and AERONET (Han et al., 2022a; Mukkavilli et al., 2019; Sun et al., 2019). This discrepancy may be attributed to limitations in the chemical transport model used by MERRA-2 (Gueymard and Yang, 2020). In describing the seasonal variations of DMCC, both CATS and DustCOMM showed that the highest DMCC appeared in TD during spring, while that of MERRA-2 peaked in summer. This suggested that MERRA-2 might overestimate dust loading of TD more prominently in summer. Additionally, compared to CATS and DustCOMM, MERRA-2 significantly underestimated dust concentrations in the high dust loading regions in TD during spring. Shi et al. (2023) found that MERRA-2's simulation accuracy in China significantly decreased when the total AOD exceeded 1, which occurred frequently due to the dust events in spring. In brief, CATS provided advantageous results, offering higher temporal and spatial resolution, which facilitated the analysis of diurnal variations of dust.
The distribution characteristics of DMCS was similar to DMCC. Regions of high-value DMCS were found along the southern edge of TD, the southwestern part of TH, the northern part of the GD, and the Qaidam Basin, which corresponded well to the aeras with high wind speeds (Fig. 4). The regional annual average DMCSs of CATS and MERRA-2 were 75 and 66.1 µ g m−3, respectively. The CATS DMCS was slightly higher than MERRA-2 result. This was because the CATS retrievals had more missing values over the areas with weaker dust concentrations on the TP, which might lead to an overestimation of the overall results. Since the primary particulate type in this region was dust, CHAP PM10 could partially reflected the DMCS characteristics. Compared to MERRA-2, CATS and CHAP datasets showed greater consistency in depicting the distribution of DMCS and provided more coherent representations of high value regions within TD. Both datasets identified DMCS maximum over the southwestern part of TD in spring, whereas MERRA-2 located it in the northeast. Similarly, the spatial patterns and magnitudes of DMCC derived from CATS were more consistent with those from DustCOMM, with finer details in the distribution. In contrast, MERRA-2 exhibited notable discrepancies. For instance, MERRA-2 showed a summer peak in DMCC over TD, whereas both CATS and DustCOMM indicated a maximum in spring. Furthermore, MERRA-2 maintained a relatively uniform spatial distribution pattern across seasons for both DMCC and DMCS, with seasonal variations primarily reflected in the magnitude rather than the spatial structure. Additionally, we matched data from over 170 CNEMC sites within the study area with the CATS data. Considering the impact of fine-mode particles, we used the difference of surface observed PM10 and PM2.5 as the surface dust concentration, and then calculated the seasonal mean values and correlations between them. We also calculated the averages and correlations between CATS and MERRA-2 at matching grids in different seasons. The results showed that CATS's DMCS had an acceptable correlation with both ground-based observations and reanalysis data (Figs. S3–S4). The correlation coefficients ranged from 0.5 to 0.7. In conclusion, the dust concentrations retrieved from CATS effectively illustrated the distribution of dust in the study region and exhibited a reliable agreement with reanalysis data and surface observations.

Figure 3The seasonal distributions of (A) DMCC (g m−2) and (B) DMCS (µg m−3) from different datasets during the period from March 2015 to October 2017 (Note: DustCOMM provided climatological dust filed and was shown here as a climatological comparable result).
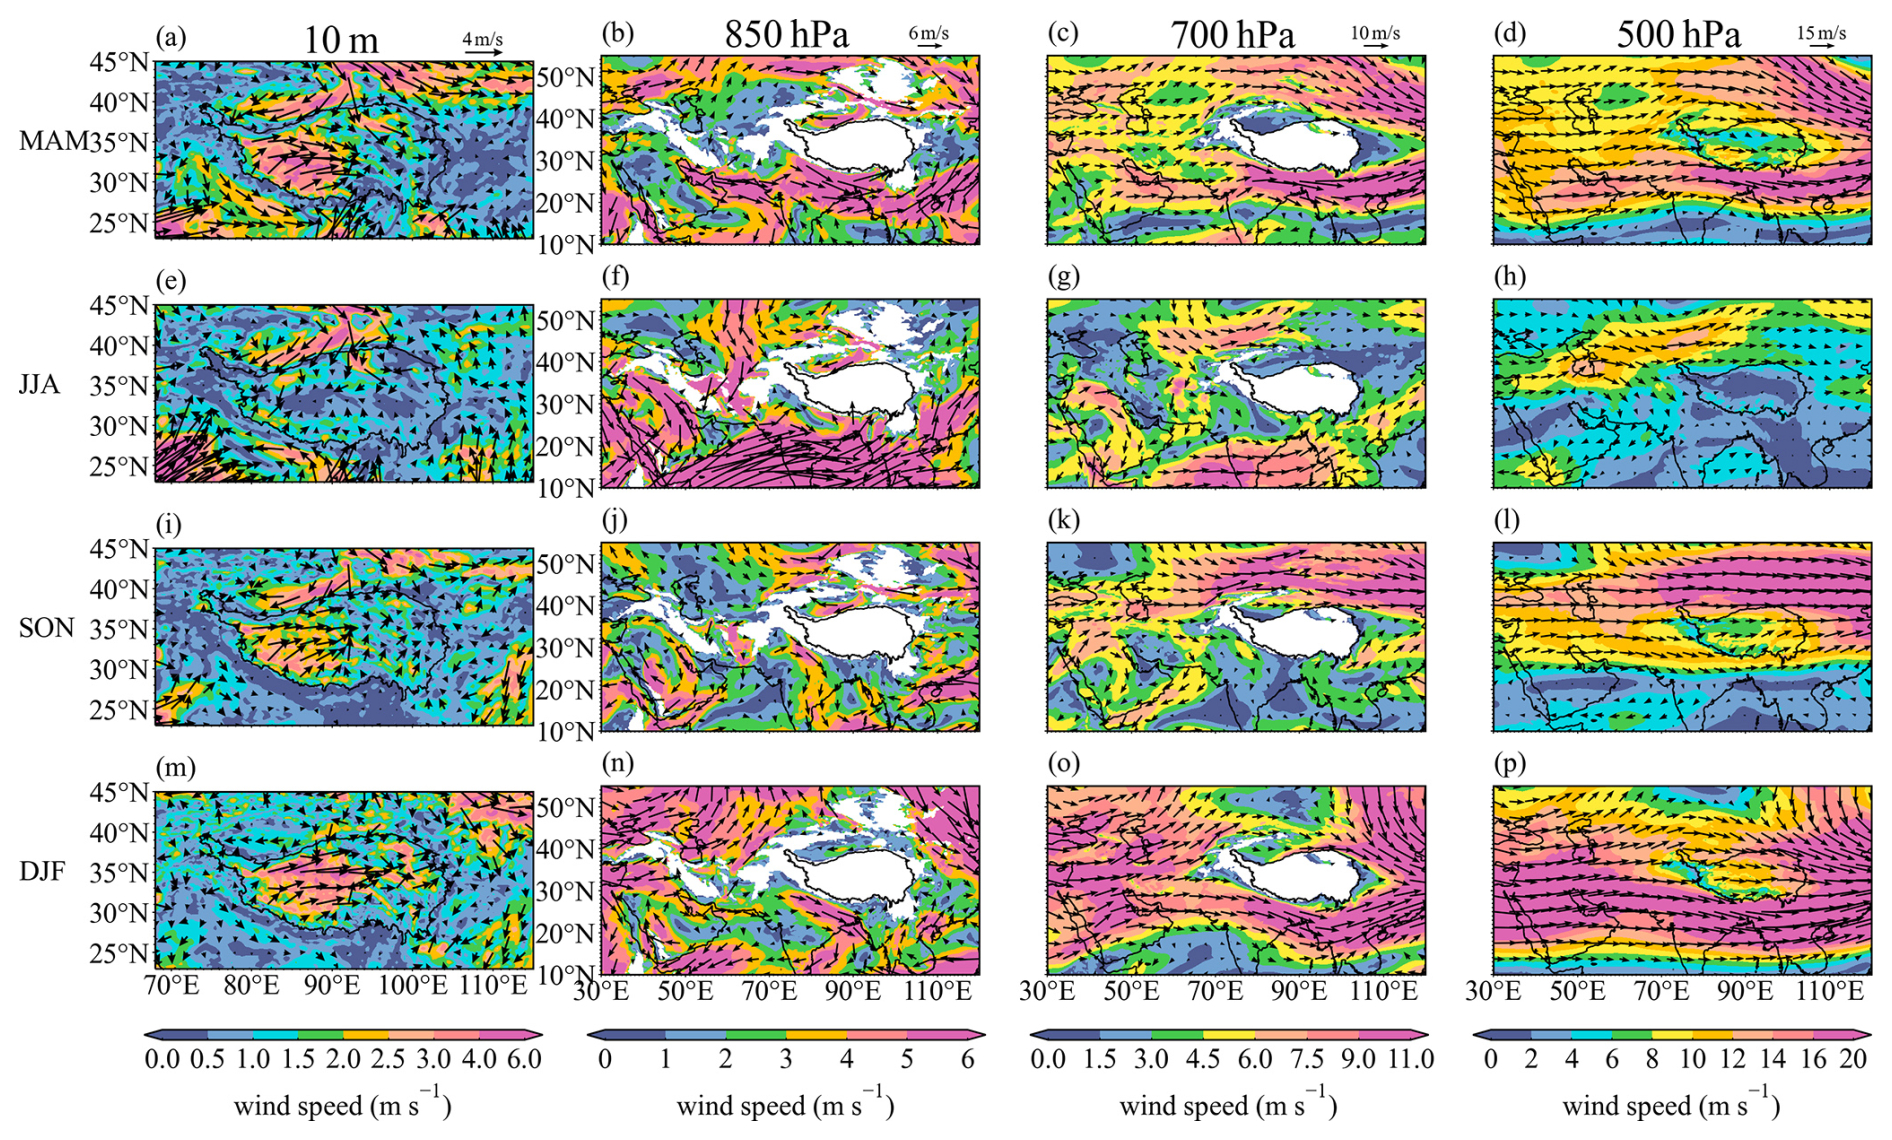
Figure 4Seasonal mean wind fields (m s−1) at 10 m and in three pressure levels of 850, 700, and 500 hPa from the ERA5 reanalysis dataset in 2016.
3.2 Seasonal characteristics of dust transport
To elucidate the dust transport features in different directions within the study area, Fig. 5 illustrated the distributions of DFRC_U (column integral dust flux rates in the east-west direction), DFRC_V (column integral dust flux rates in the north-south direction), and total DFRC derived from MERRA2 and CATS datasets, separately. DFRC represented the net dust flux within the atmospheric column. Figure 6 showed the vertical distribution of dust transport in several cross-sections within TD and TP. The positive values of DFRC_U and DFRC_V corresponded to eastward and northward, respectively. Two dust transport belts could be found on northern and southern sides of TP, respectively. The northern belt extended from TD into the northeastern part of China, while the southern belt started from TH and spread northeast to the areas of 100° E. Both the magnitude and spatial extent of dust flux peaked in spring, with DFRC values exceeding 100 kg m−1 d−1. Significant dust-carrying upward airflows were observed in the 850–600 hPa layers over TD, TH and GD during spring and summer (Fig. 7). Additionally, the DFRC in Qaidam Basin was consistently greater than 60 kg m−1 d−1 throughout the year, which proved it a stable and important channel transporting dust to the TP. Although GD exhibited a low dust uplift efficiency (Chen et al., 2017) and a relatively lower DMCC (Fig. 3), its DFRC was much higher than that of TD. This was attributable to the fact that, unlike TD, which was enclosed by mountainous terrain on three sides, GD possessed a more open topography. Deep convective mixing and frequent intrusions of cold air resulted in higher low-level wind speed in GD (Fig. 4), making it the largest dust contributor in East Asia (Chen et al., 2017; Zhang et al., 2008). Although the DMCC was still high in the three deserts during summer (Fig. 3), the transport flux and eastward extension of dust belt were markedly reduced. This may be due to the lowest wind speed in summer on both southern and northern sides of TP in levels of 500–700 hPa (Fig. 4). Additionally, surface wind in GD and the eastern TH shifted from northwesterly in spring to southeasterly in summer, which partly hindered the transport of dust from the desert regions to the TP and the downstream regions. In autumn and winter, although the magnitude of dust transport decreased, the dust belt on the northern TP still could extend to the far eastern edge of the study area. The influx of strong northerly winds in winter enhanced the westerly jet stream, expanding the area of strong winds region (>16 m s−1) at 500 hPa (Fig. 4p). As a result, large areas in the northwestern TP and downstream regions, extending as south as ∼ 30° N, were impacted by the northern dust belt.
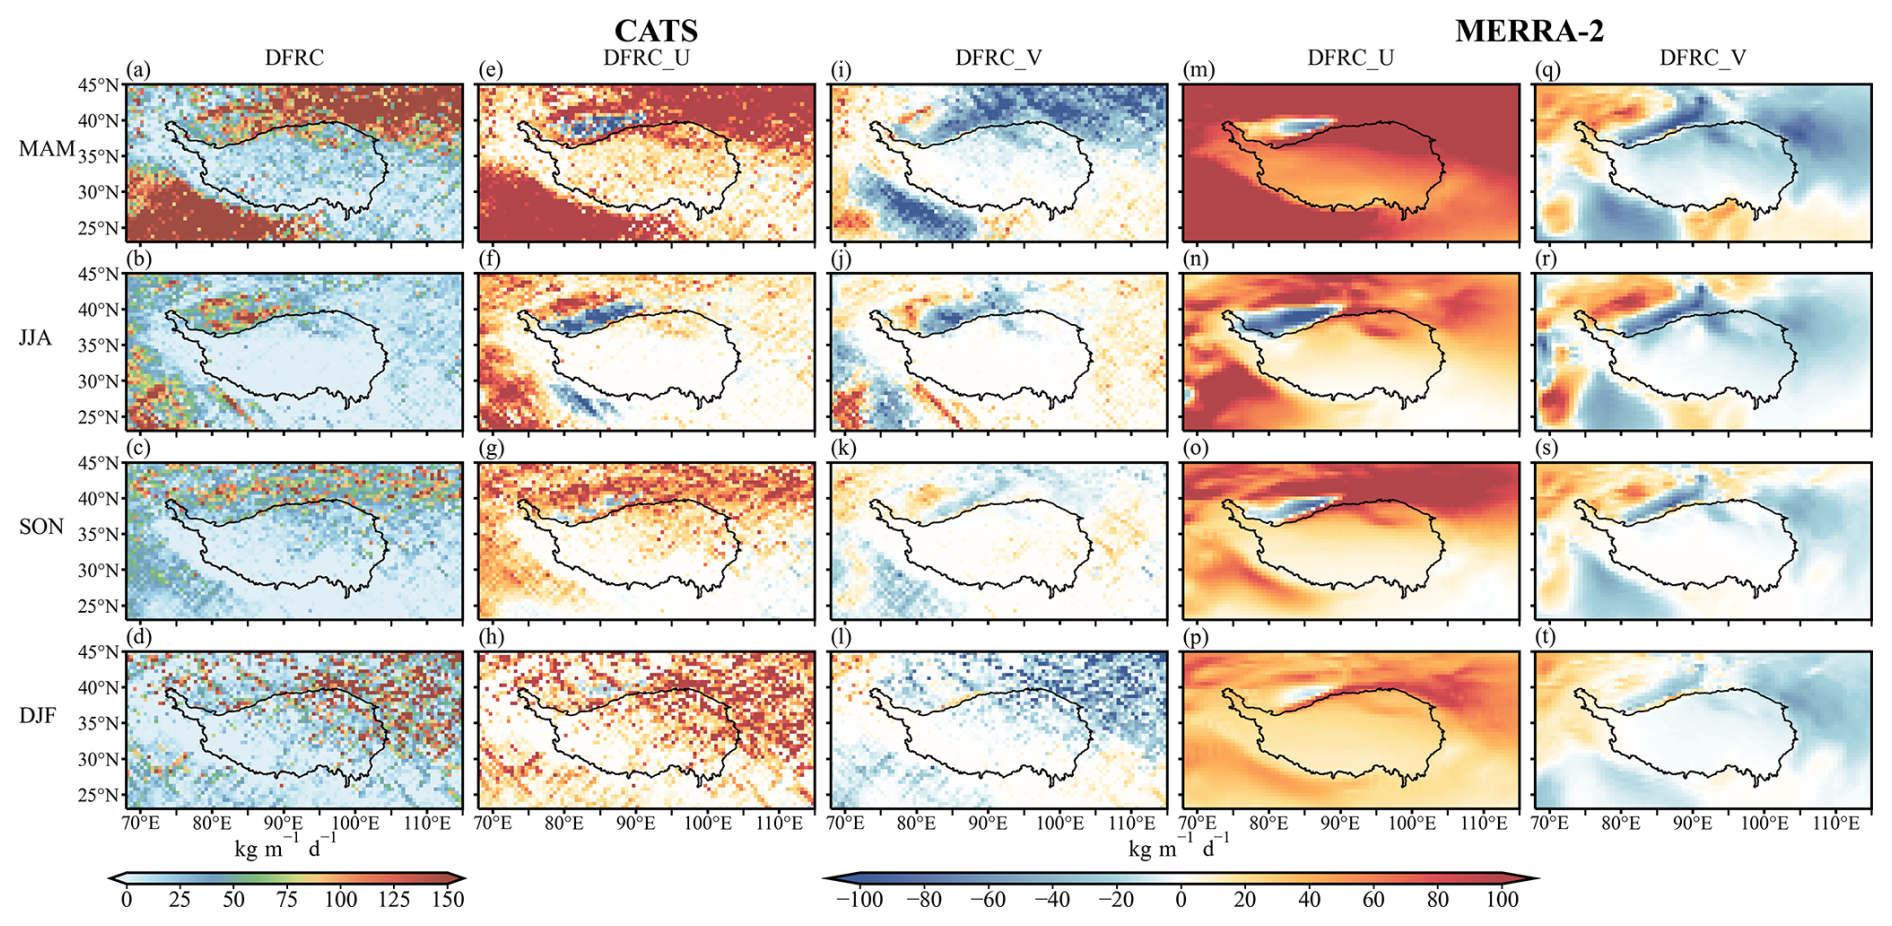
Figure 5Seasonal distribution of CATS DFRC (kg m−1 d−1, a–d), and DFRC_U and DFRC_V from CATS (kg m−1 d−1, e–l) and MERRA-2 (m–t) datasets during the period from March 2015 to October 2017, respectively (Positive values of DFRC_U and DFRC_V corresponded to eastward and northward transport, respectively).
Based on the distributions of DFRC_U and DFRC_V (Fig. 6), the dust entering TP has multiple sources, such as TD, TH, Central Asia, and even Africa (Hu et al., 2020; Mao et al., 2019). Notably, it existed a dust backflow throughout the year in TD (Fig. 6b). The dust swept from the eastern entrance into the interior of TD, which was especially apparent in spring and summer. Due to the obstruction of the Pamir Plateau and the Tianshan Mountains, the cold air mainly invaded from the east side. During spring and summer, intense surface-atmosphere heat exchange leaded to the formation of a thermal low pressure in TD (Han et al., 2005). The combined effect of the cold air and thermal low pressure caused the strong easterly and northeasterly winds at the TD surface, and subsequently led to the dust backflow. Additionally, two pathways of transporting dust from TD to TP were clear according to Fig. 5i–l, q–t. The first path is of climbing the northern slopes of the Kunlun Mountains under the effect of rising air (Fig. 6a). The second path is of crossing the Qaidam Basin along with the northwesterly and northerly winds. In summer, the reduction of winds in 500 hPa and the northward shift of the westerly jet stream to the northern TP (Chen et al., 2017) diminished the eastward transport of the TD dust (Fig. 5f, n) while enhanced its southward transmission into the TP (Fig. 5j, r). Under the westerly and northerly winds, the GD dust was primarily transported eastward and southward to the downstream regions, and influenced less to the northeastern part of TP. TH is another significant dust source contributing to TP. The strong upward motion driven by the secondary circulation in this area provided essential dynamics for the vertical lifting of dust (Wang et al., 2021). Along with the increasing altitudes, the wind direction shifted from north to south, which facilitated the transport of floating dust to TP (Fig. 6). Additionally, a certain part of dust reaching TP was mainly from its eastern side of about 88° E. During summer, the southwest monsoon also provided significant assistance in lifting the dust and other aerosols onto the plateau (Liu et al., 2015).
As shown in Fig. 7 significant dust-carrying upward airflows were observed in the 850–600 hPa layers over the three major dust source regions during spring and summer. The largest upward dust flux was in TD. Previous studies had revealed that airflows typically converged and ascended along the southern and northwestern margins of the Tarim Basin. This promoted the dust emission, and made these regions having the most frequent dust events in TD (Han et al., 2005; Yang et al., 2016). In TH, it showed the largest aera of dust uplift in summer. The highest surface temperature in summer intensified the convective instability in desert, leading to stronger convective activities. Meanwhile, the strong westerly winds above 700 hPa could further carry dust to more distant regions in the east, such as Yunnan Province in China and some parts of Southeast Asia. Additionally, a relatively large quantity of DFR_W existed through the whole year at 500 hPa over TP, which was an important dust source for the downstream areas.
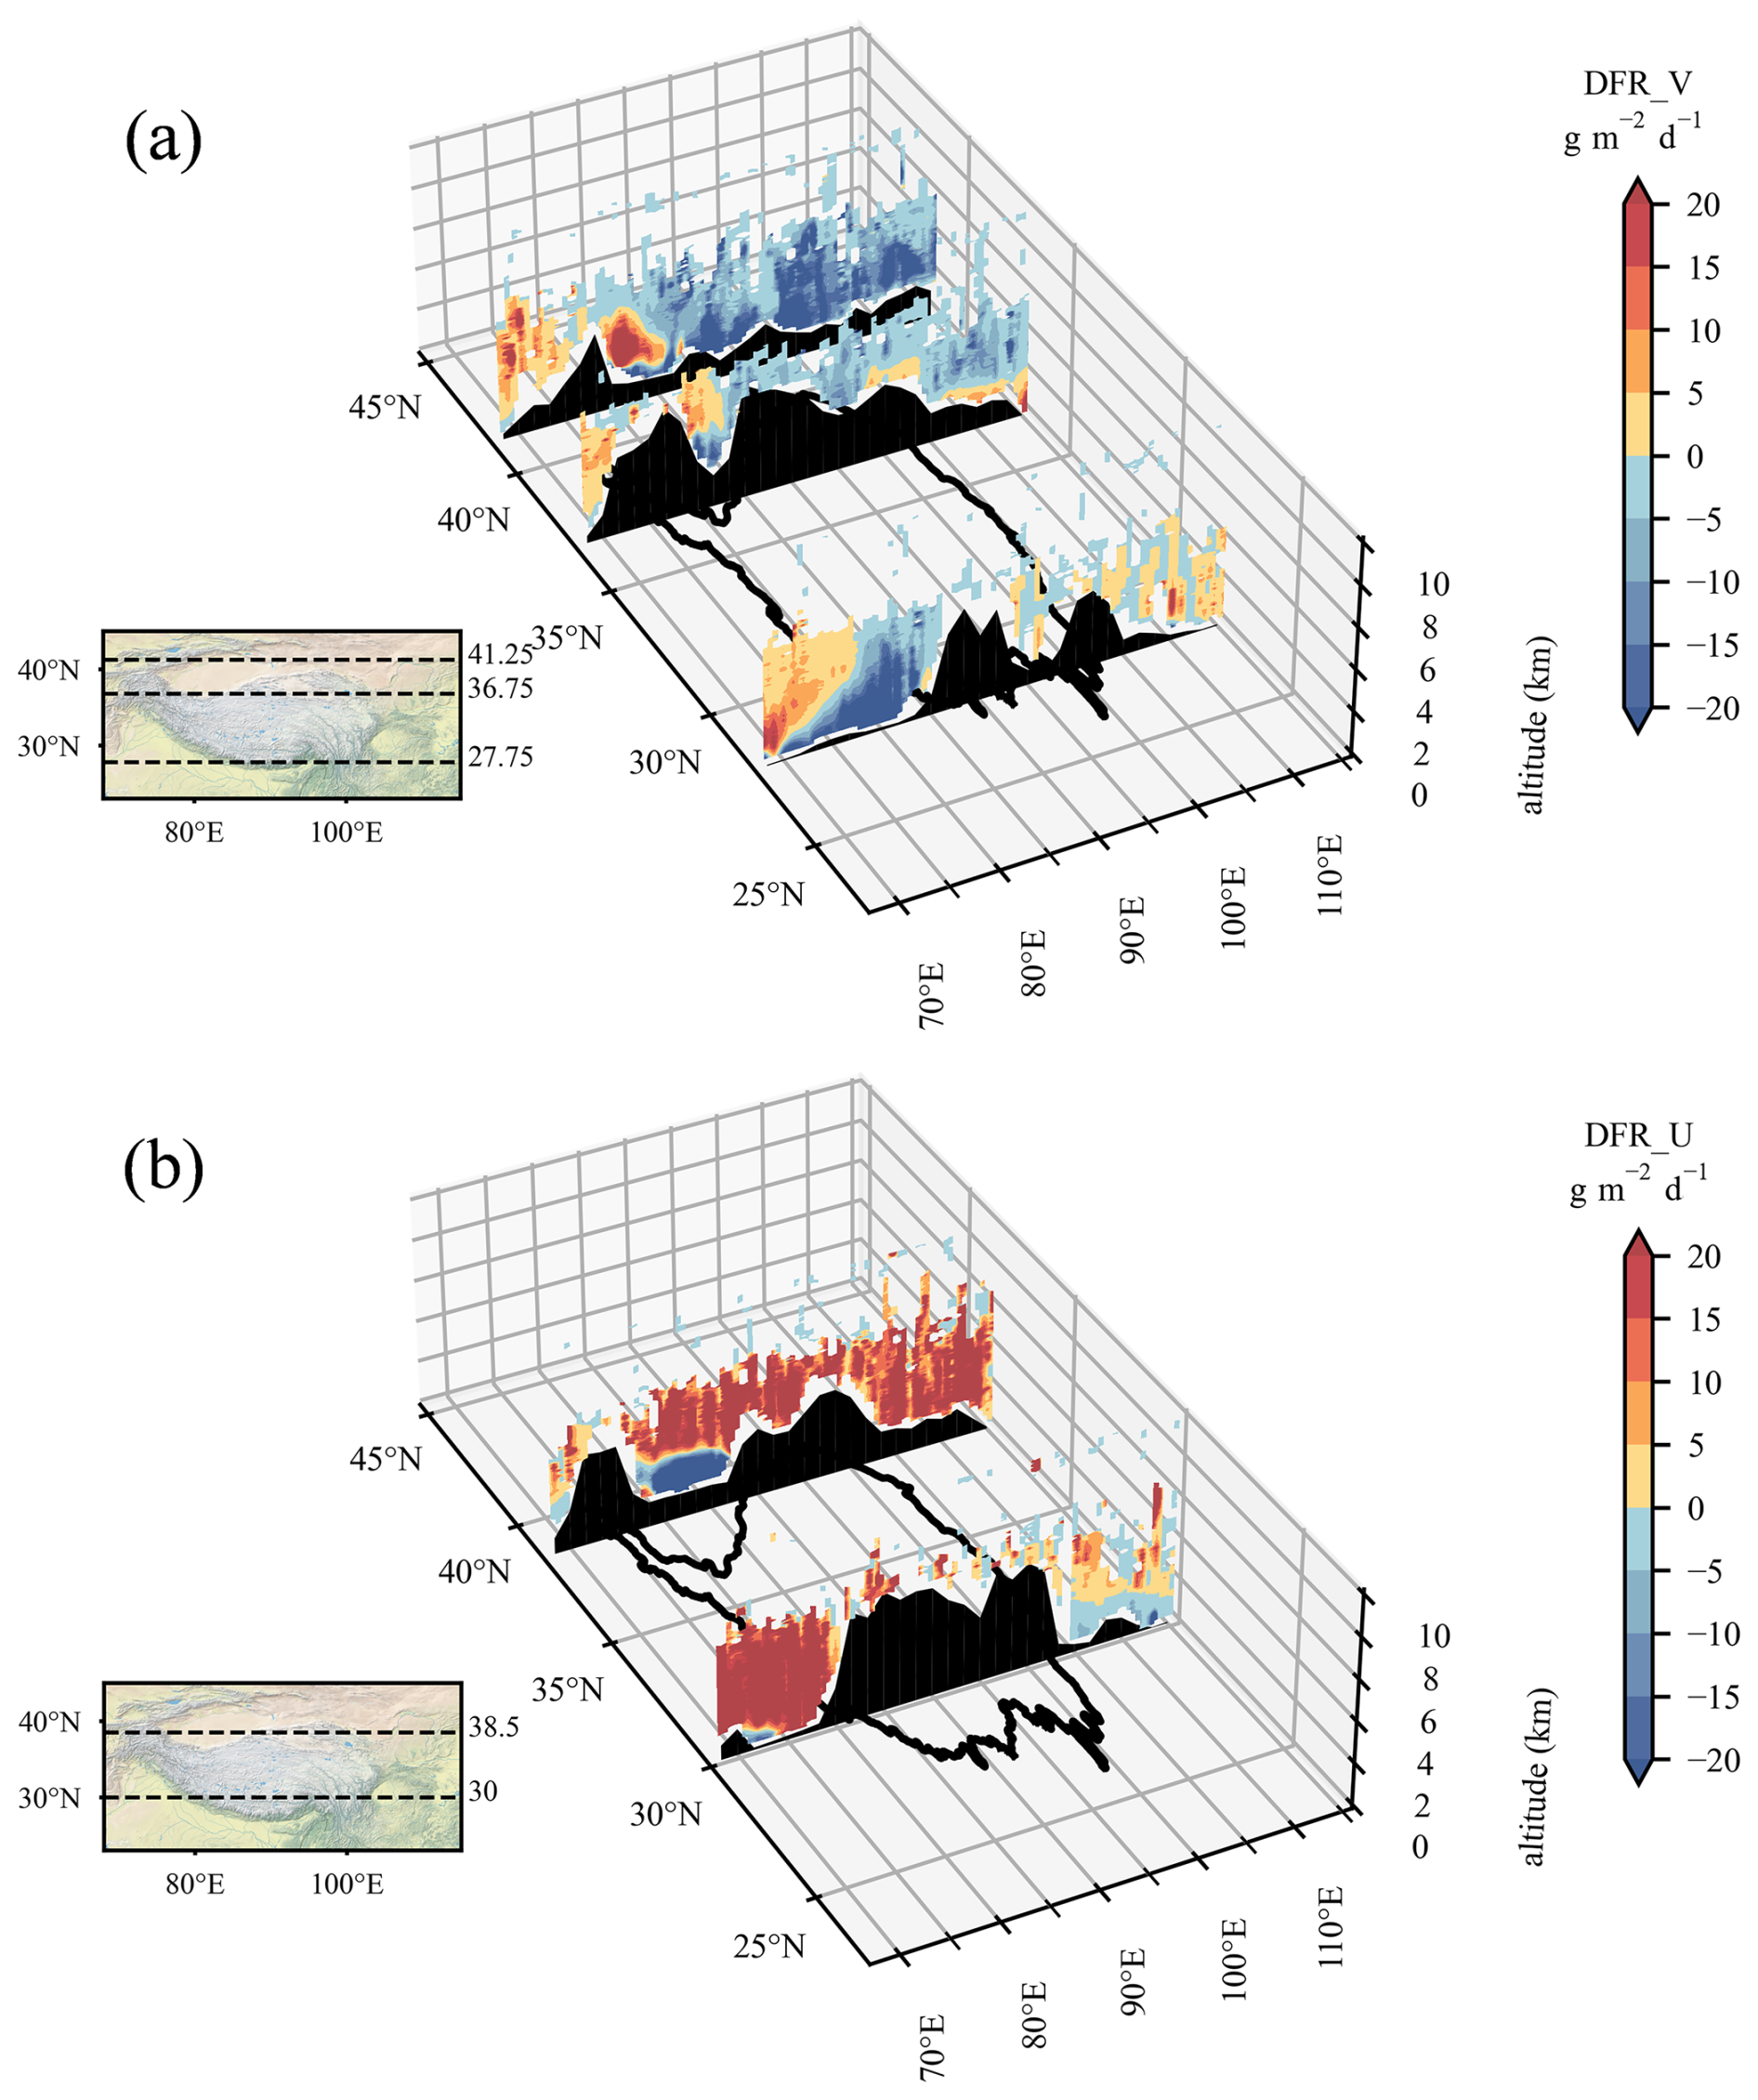
Figure 6Vertical cross-sections of (a) DFR_V and (b) DFR_U (g m−2 d−1) in TD and TP in spring during the period from March 2015 to October 2017 (the blue area near 38.5° N in b represents the easterly dust backflow).
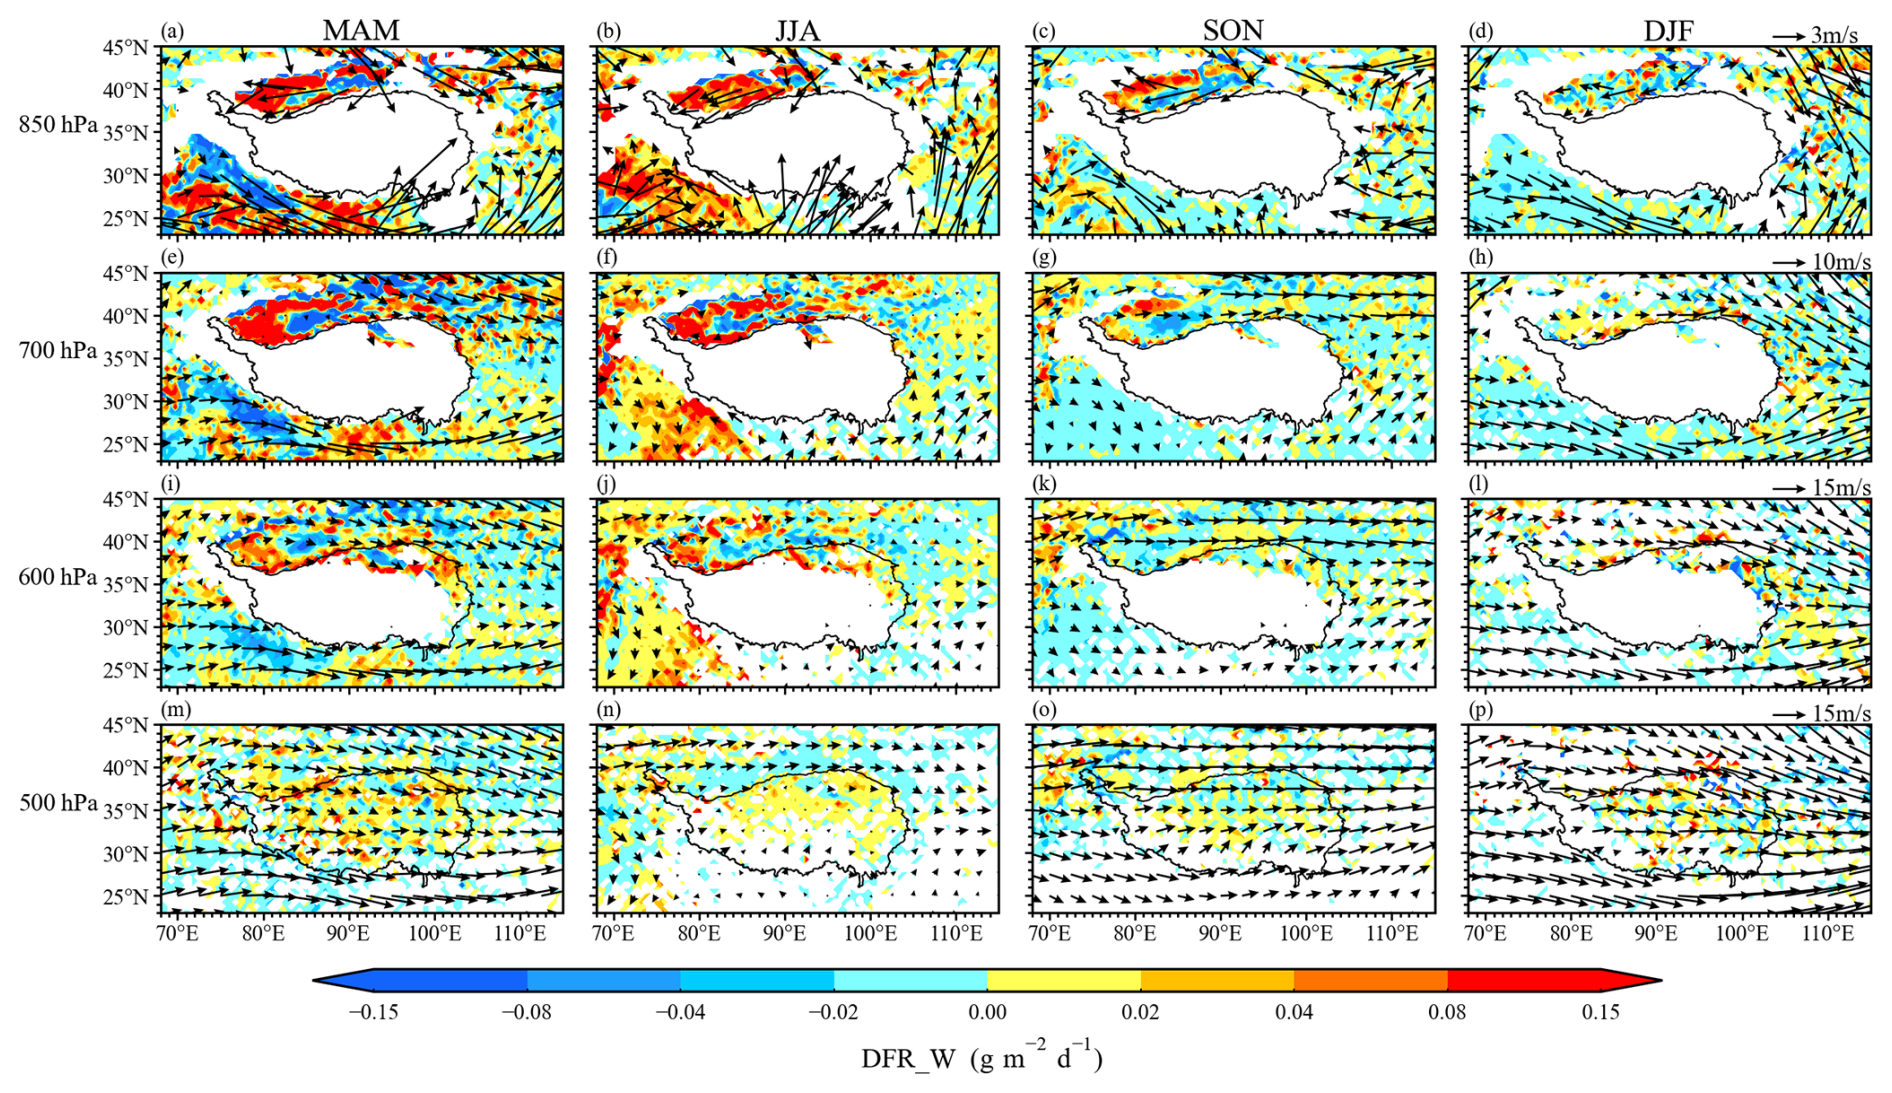
Figure 7Seasonal distribution of DFR_W (dust flux rates at vertical direction, g m−2 d−1) at four pressure levels from CATS during the period from March 2015 to October 2017 (the arrows represent the horizontal wind field. The positive values of DFR_W corresponded to upward transport).
3.3 Dust backflow in TD
As mentioned above, given the west-to-east dust transport dominated in the study area, the year-round east-to-west dust backflow in the TD was notably unusual, and the vertical characteristics of dust transport deserved further investigation. Figure 8 illustrated the zonal mean seasonal dust transport fluxes in TD. The dust backflows (east-to-west transport) primarily occurred in the lower atmosphere with the altitude below 2.5 km, which was slightly higher in spring and summer. This phenomenon, named “East irrigation” weather, is caused by the cold air that crosses the Tianshan Mountains and then enters the Tarim Basin. Besides, Han et al. (2022b) found that the nocturnal low-level jet during summer could also contribute to the westward dust transport. The amount of backflow dust exhibited distinct seasonal variations, which was maximum in spring with an average of 83.1 t km−2 d−1 (Fig. 8b). The backflow dust flux decreased with altitudes, showing the maximum of 134 t km−2 d−1 near the surface in spring (Fig. 8a). The dust backflow decreased a lot in autumn and summer, and the weakest was in winter, showing an average of 7.4 t km−2 d−1. This reduction was mainly attributed to the stable atmospheric stratification and weaker easterly winds during winter (Fig. 4). Analysis of HYSPLIT backward trajectories showed that the dusts in “East irrigation” region primarily originated from the short-range transport in the lower atmosphere from the east and northeast (Fig. 8c, d). The Gurbantunggut Desert and TD served as the largest two sources, which contributed about 40 % and 27 % of the occurrences, respectively. Above 3 km, the amount of east-to-west dust flux presented a trend of increasing first then decreasing, which was the synergy of the strengthening westerly winds and the decreasing dust concentration. The seasonal dust flux in layers of 4–6 km could exceed 50 t km−2 d−1. The average west-to-east dust flux above 2 km was larger in winter and spring, with the averages of 34.4 and 26.0 t km−2 d−1, respectively. Iwasaka et al. (2008) conducted some balloon observations in Dunhuang under calm weather conditions from 2001 to 2004 and found that, in the free troposphere, the horizontal flux of Asia background dust driven by westerlies ranged from 5.3 to 68.7 t km−2 d−1, and it was approximately 50 t km−2 d−1 at altitudes of 4–6 km. These in-situ measurements were in good agreement with our satellite-based estimation.
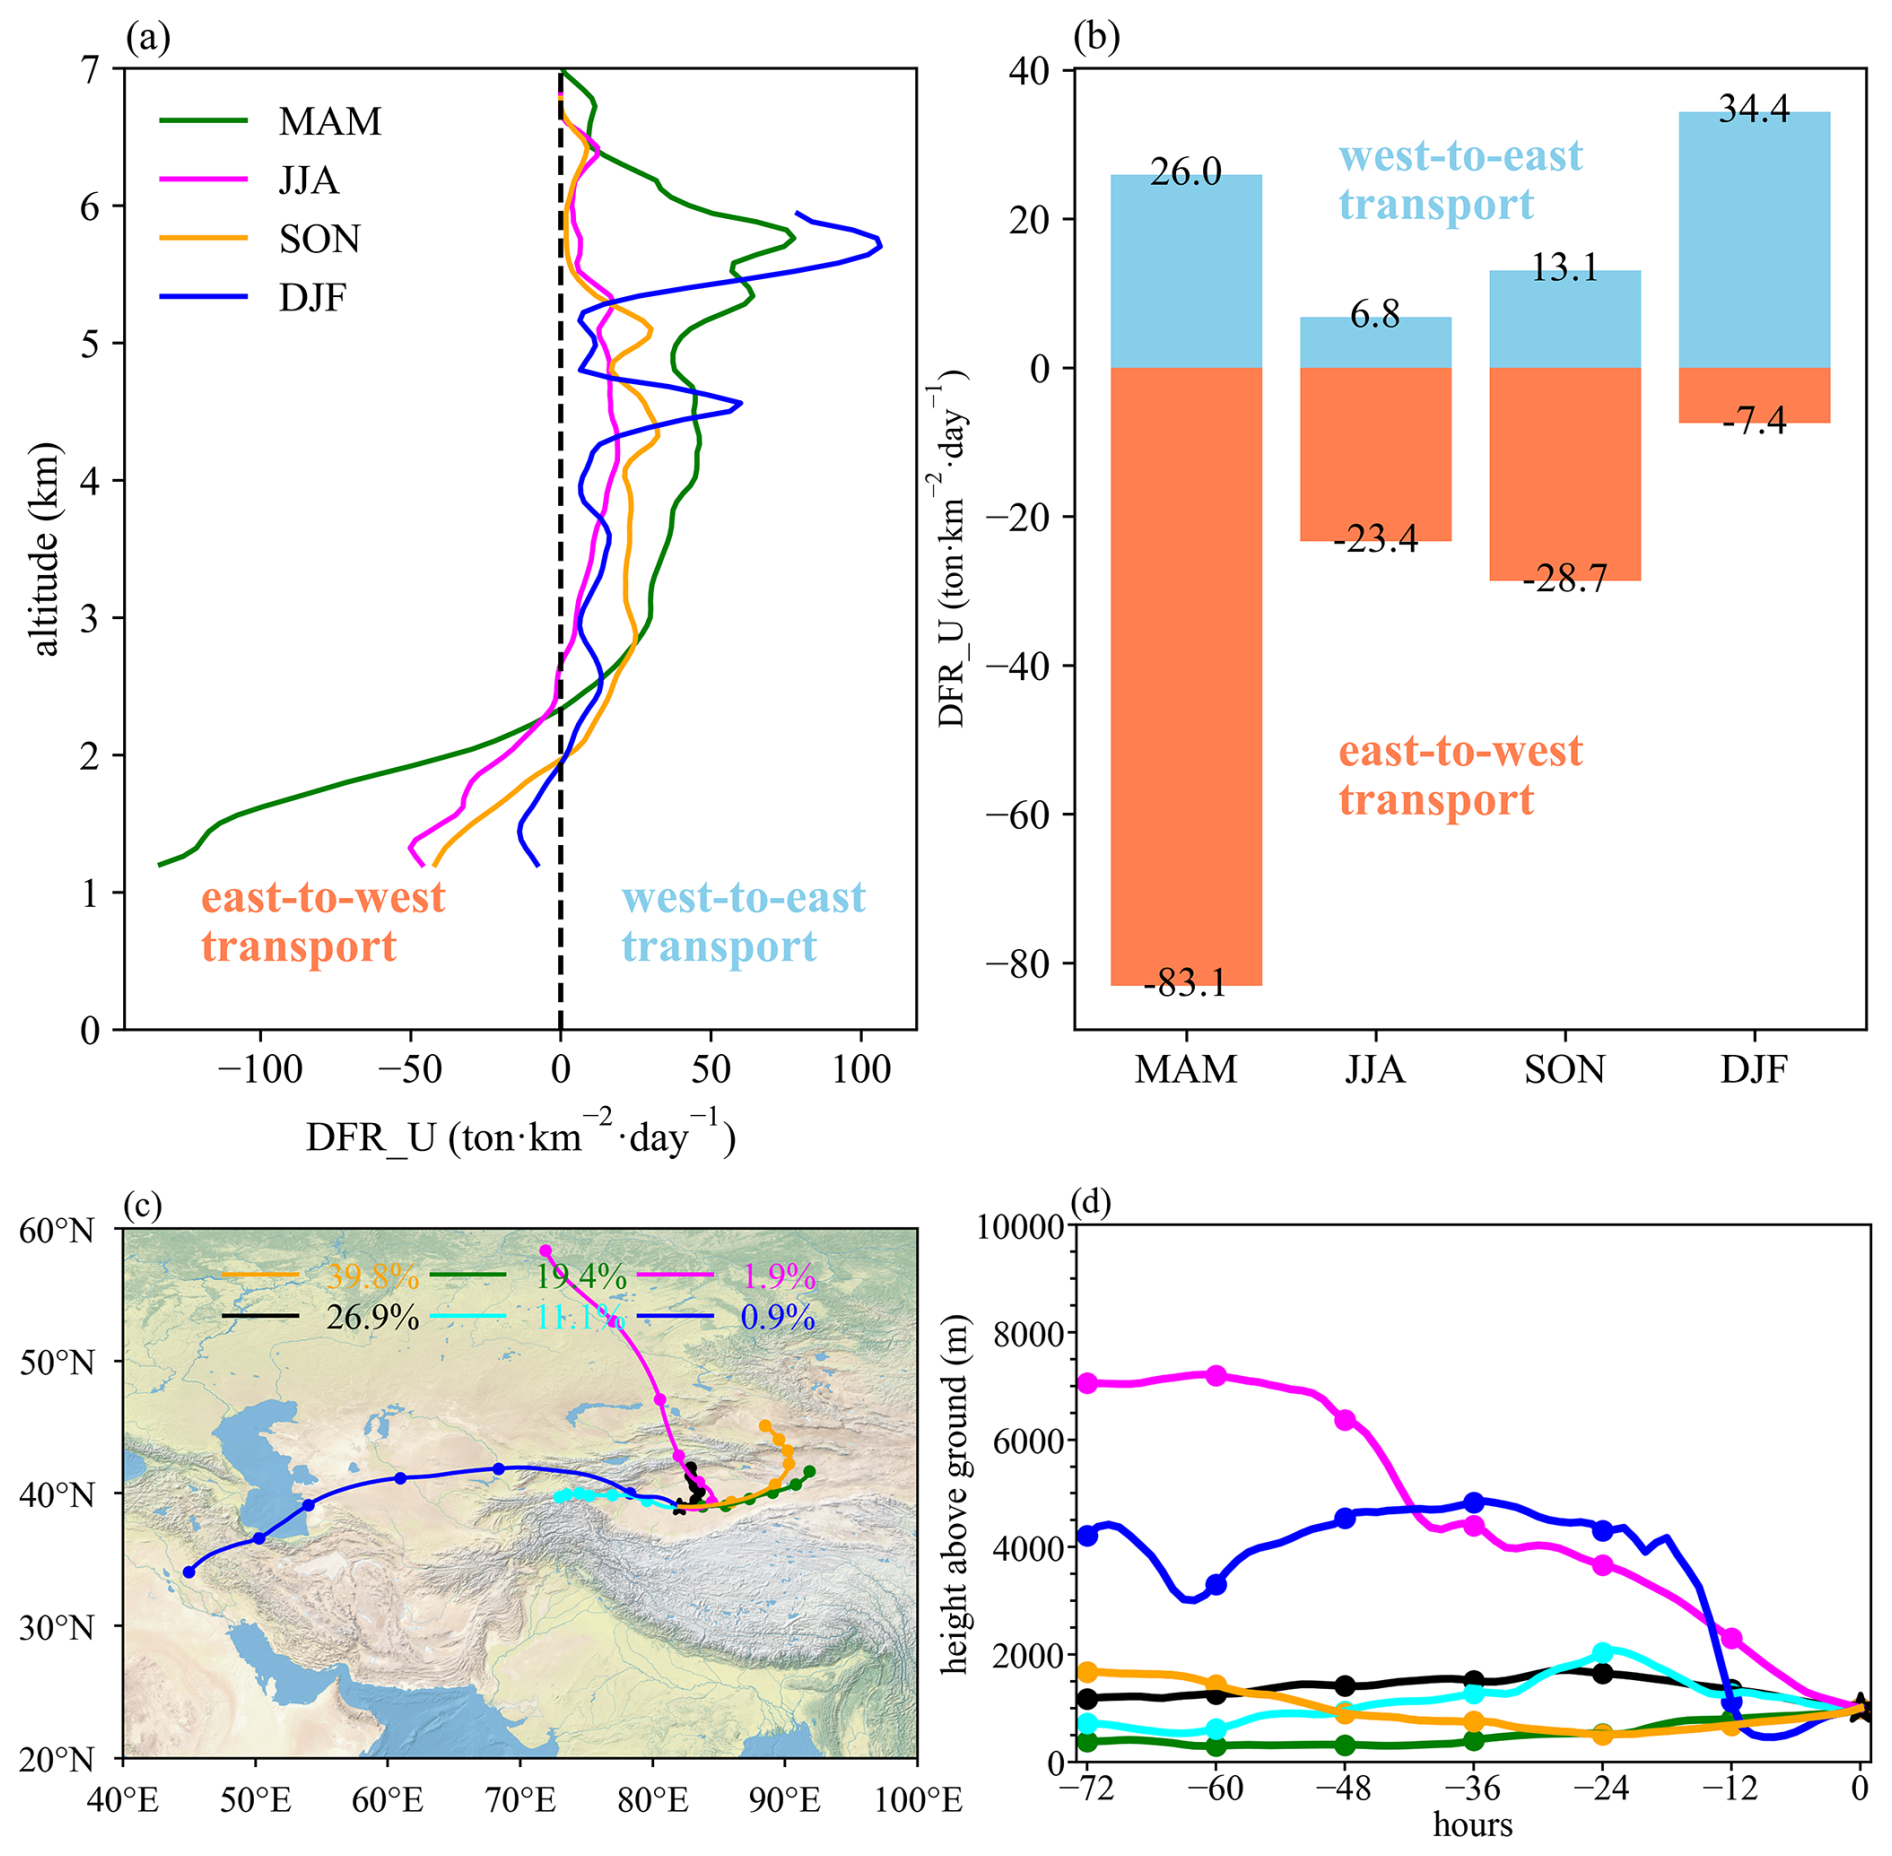
Figure 8(a) Vertical distribution of DFR_U (t km−2 d−1), with the curve subjected to 5-point smoothing processing; (b) the average values of DFR_U in the lower atmosphere (below 2 km, dominated by easterly winds) and the upper atmosphere (dominated by westerly winds); (c) the cluster statistics and (d) transport altitude variations from the HYSPLIT 72h backward trajectory analysis in TD (40–42.5° N, 86° E) in spring. Calculation period: March 2015 to October 2017; Base map data sourced from the Natural Earth dataset.
3.4 Dust transport to TP
To quantify the amount of dust transported to TP, four cross-sections of S1–S4 (Fig. 1) were selected along the main dust transport routes toward TP. S1 and S2 accounted for the northerly dust flux to TP, which represented the TD-Kunlun Mountains route (via the northwestern slope of TP) and the TD/GD-Qaidam Basin route (via the northeastern slope of TP), respectively. S3 and S4 considered the dust flux from TH along the western entrance and the southern slope of TP, respectively. It was important to note that the total dust flux toward TP calculated here included dust not only from these three main deserts but also potentially from other sources, such as deserts in Africa and the Middle East. In addition, due to the high elevation, intense solar radiation, and blocking moisture mountains, the climate in the Qaidam Basin is extremely arid (Jiang et al., 2022), which makes it a major dust source region in TP. The dust lifted here could not only influence the local environment, but also continually affect the downstream cities, such as Xining and Lanzhou, through westerly winds (Yang et al., 2024). Therefore, the X1 and X2 cross-sections (Fig. 1) were selected to quantify the dust contribution of the Qaidam Basin to the downstream regions.
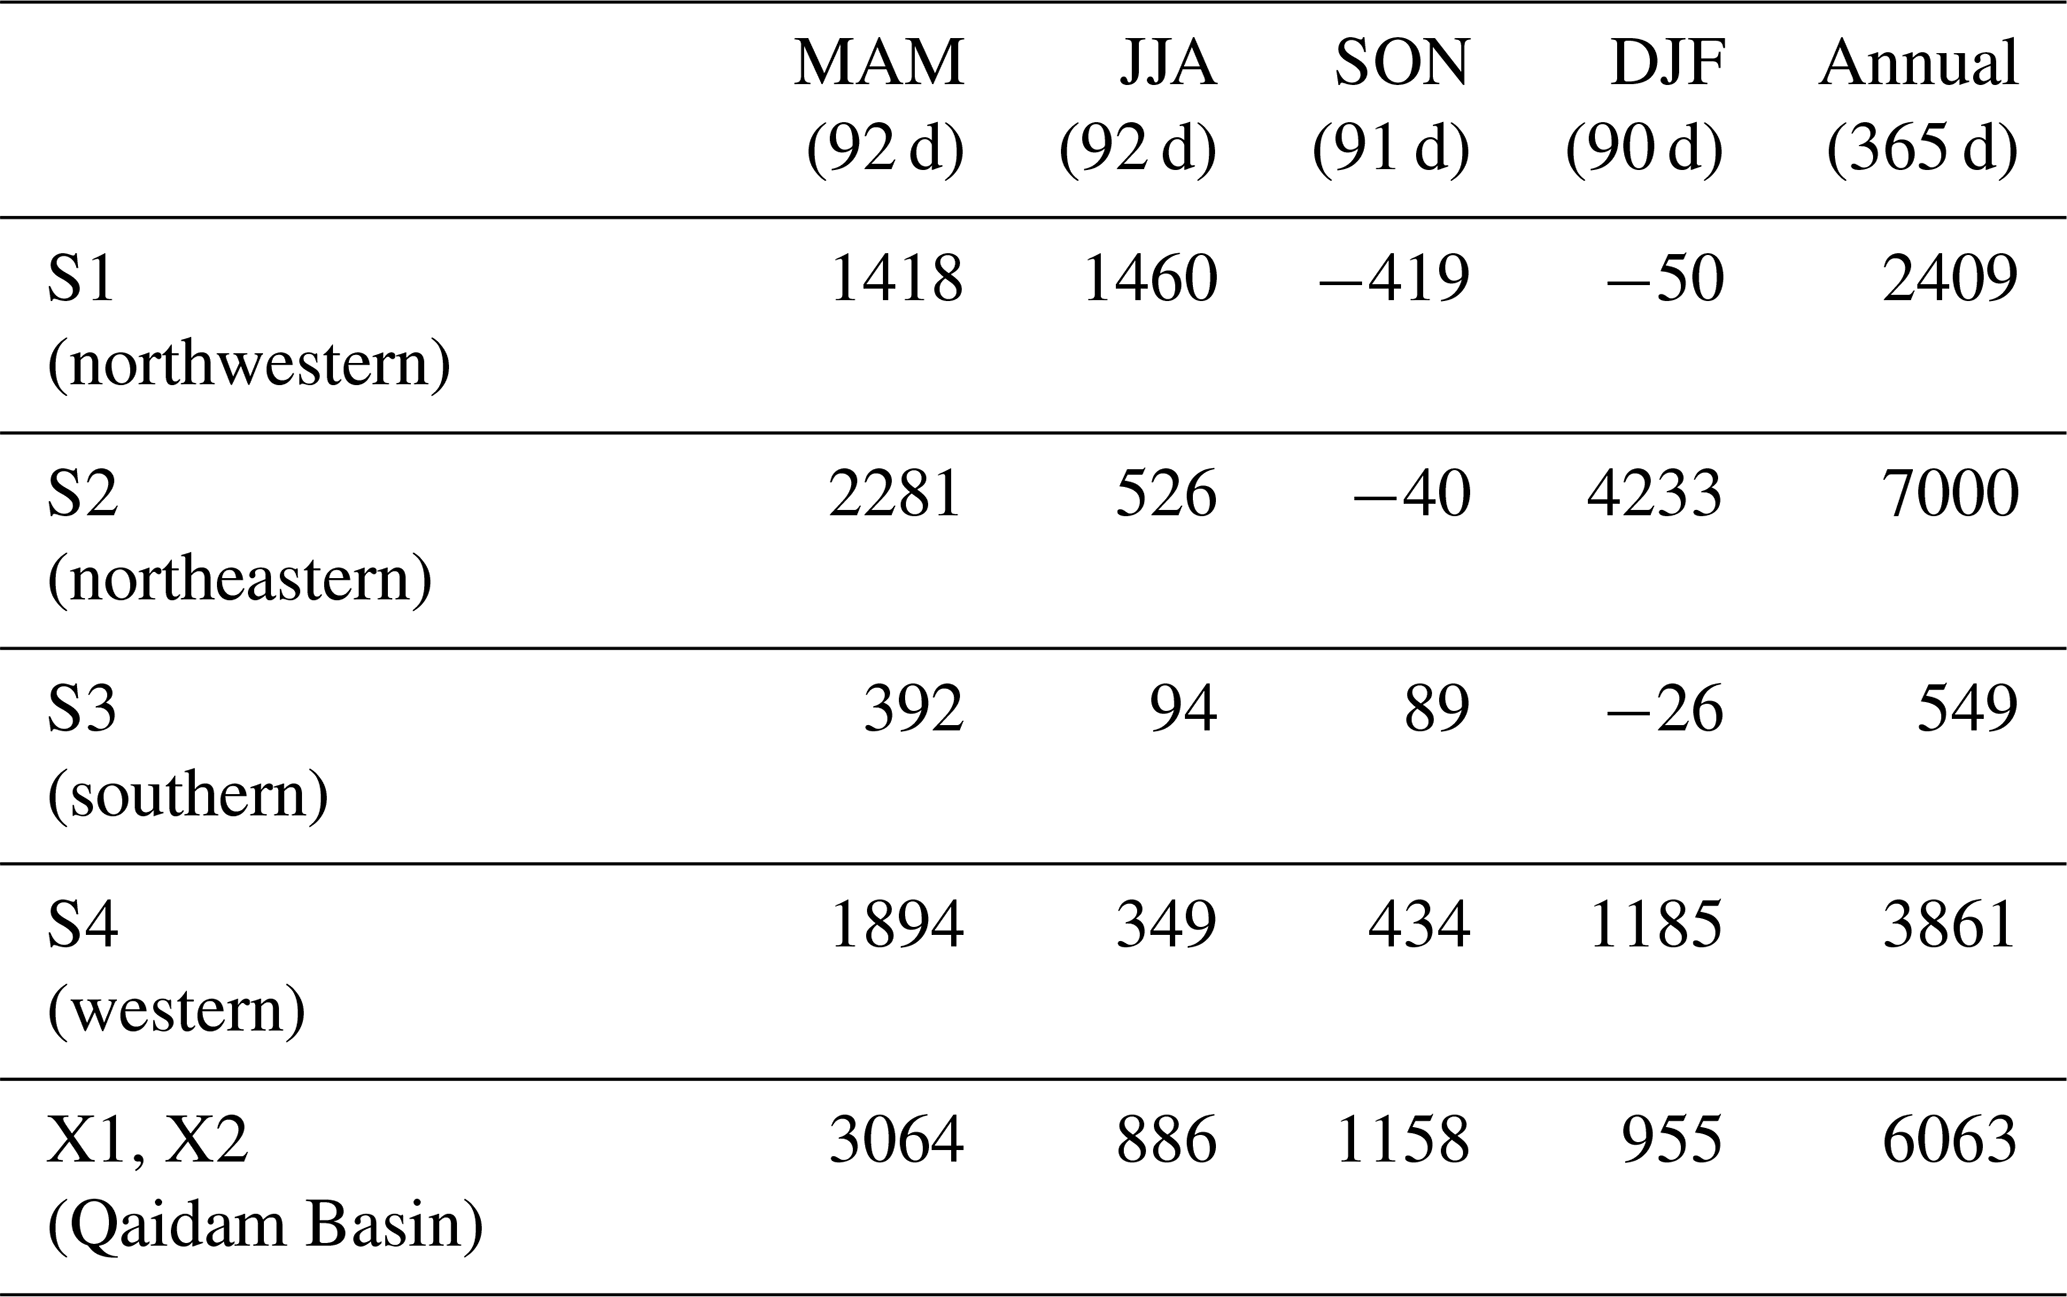
As shown in Table 2, the dust route via the Qaidam Basin (S2) was the most important contributor, with an annual total of 7000 t km−1. The main dust transports along this route were in winter and spring, with seasonal totals of 4233 and 2281 t km−1, respectively. The annual dust amount to the TP via northern slope of the Kunlun Mountains (S1) was 2409 t km−1, which is only about 34 % of the amount at S2. Dust transport along this route was primarily occurred in spring and summer, with seasonal total exceeding 1400 t km−1. The sum of dust reaching the TP via the S1 and S2 paths was about 10.2 Tg yr−1, which was close to the 8.0 Tg yr−1 estimated by Hu et al. (2020) from WRF-Chem simulations. Additionally, the dust imported from S4, dominated by westerly winds, contributed an annual total of 3861 t km−1, which was the second largest contributor. This route also showed net incomes in all seasons. At the southern slope (S3), due to the obstruction of Himalaya, it appeared as the smallest annual dust contributor of 549 t km−1. Dust transport along this route was primarily occurred in spring, with a seasonal total of 392 t km−1, which was more than four times of that in summer and autumn. This was related to the extensive updrafts over the Indian plains in spring (Fig. 7) and the helpful southerly winds between 90–100° E (Fig. 4), of which the former facilitated the transport of dust beyond the desert under the westerly winds. For the dust flux in the Qaidam Basin, it was found that the west-to-east dust transport occurred throughout the year, with the net total annual amount reaching 6063 t km−1 after considering both the income and outcome. The highest contribution occurred in spring, which accounted for more than half of the annual total, which was closely related to the strong surface winds in the northeastern plateau during spring (Fig. 4a). In short, our satellite-based estimation confirmed that the Qaidam Basin was a significant source of dust aerosols for the downstream regions.
Table 2Seasonal and annual totals of column dust flux (unit: t km−1) toward the TP across the four sections of S1–S4 and the contribution of Qaidam Basin to the downstream regions due to westerly winds (the dust flux at sections of S1–S3 only considered the north-south direction, while at S4 only considered the east-west direction. X1 and X2 represented the western and eastern calculation boundaries for the Qaidam Basin, respectively. The geographic coordinates of the cross-sections are shown in Fig. 1. The negative values represented the exporting dust flux).
3.5 Diurnal variations of dust transport
The diurnal variations in the vertical distribution and column-averaged intensity of dust mass flux during dusty days at the four cross sections of S1 to S4 (in Fig. 1) were shown in Fig. 9. The positive and negative values of dust mass flux indicated the incoming and outgoing of dust as to TP, respectively. It was important to note that precipitation on the TP occurred mainly from May to October, accounting for 91 % of the annual total (Wan et al., 2017). The effects of cloud cover might result in more missing data at the S3 and S4 sections during summer and autumn, which potentially introduced underestimation of the dust transport flux during these seasons. The dust mass flux across the four sections exhibited relatively consistent diurnal features. Dust transported to the TP mainly occurred during the daytime, particularly from midday to afternoon, which was generally coincided with the period of high wind speed toward the TP (Fig. 10). In the northern TP, dust transport was stronger in the afternoon compared to the morning, while in the southern and western TP, the transport was more intense in the morning. However, there remained pronounced seasonal differences. First, the strongest transport periods varied across seasons. In spring, summer, and autumn, the peak transport mainly occurred during the daytime, while in winter it predominantly happened at night. Furthermore, the dominant heights for strong dust transport varied by season. In spring, the dust activity was most intense, and the dust transport occurred throughout the entire atmospheric column. In summer, precipitation suppressed the raising and mixing of dust in vertical, leading to a slight decrease in dust transport. In autumn, enhanced atmospheric stability confined the dust transport in the lower atmosphere, while in winter stronger winds at higher altitudes increased dust transport in the upper air. The pattern of diurnal dust transport peaks varied with the seasons. During spring, summer, and autumn, dust transport generally followed a unimodal pattern with peaks occurring during the daytime, whereas in winter it exhibited a bimodal pattern (e.g., at S2 and S4), with peaks occurring in both daytime and nighttime. The nighttime secondary peak was closely associated with the strong high-altitude winds. Fig. 10(m-p) also showed that intense westerly winds carried large amounts of dust from surrounding regions, such as Central Asia and the deserts of Africa, into the TP. The strongest three-hour dust flux in dusty days occurred at the western entrance of the TP, with peaks of 5068 and 3297 kg km−2 hr−1 at 05:00–07:00 UTC in spring and at 23:00–01:00 UTC in winter, respectively.

Figure 9The three-hourly interval diurnal variations in the vertical distribution and column-averaged intensity of dust mass flux (kg km−2 hr−1) at cross-sections S1–S4 during dusty days during the period from March 2015 to October 2017 (the positive and negative values indicated the dust transport towards and away from TP, respectively. The dashed line denoted the 12:00 local time).
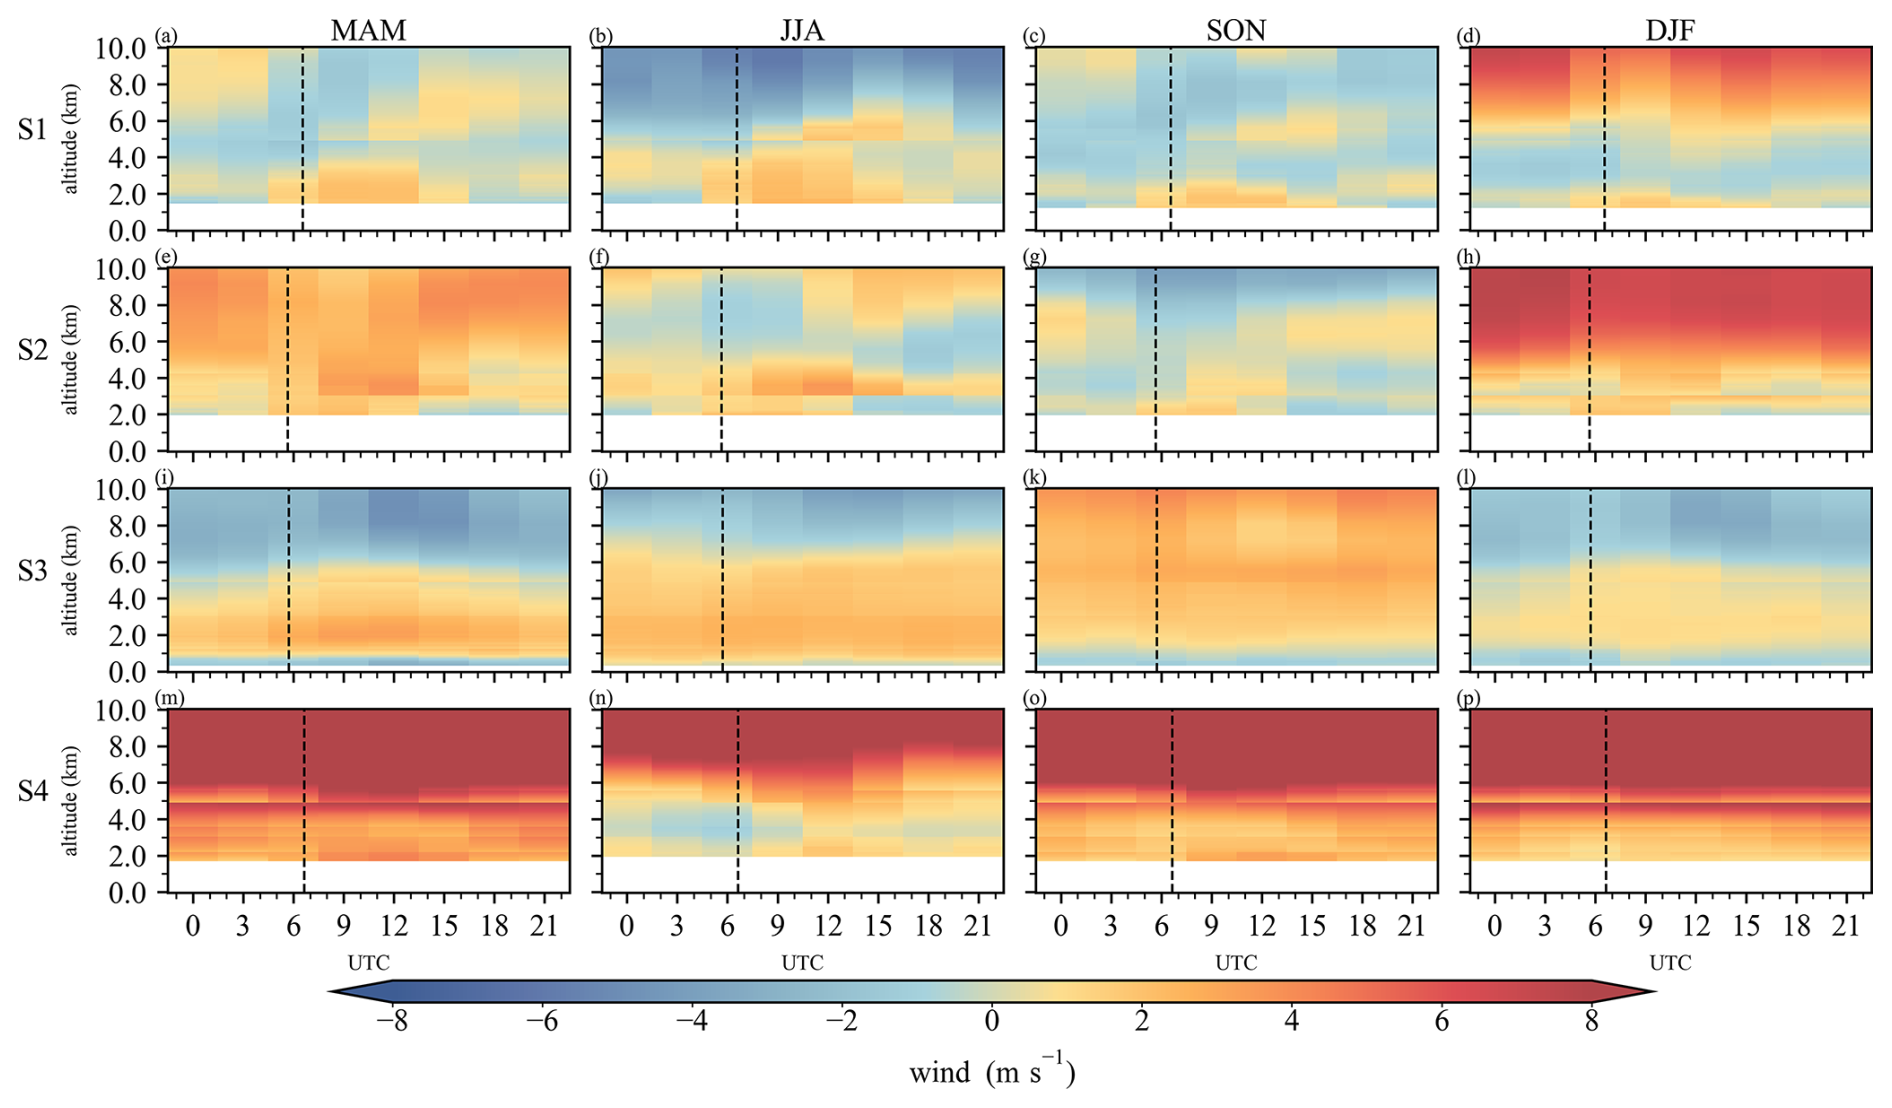
Figure 10The three-hourly interval diurnal variations of wind speed (m s−1) at cross-sections S1–S4 during dusty days during the period from March 2015 to October 2017 (3 h averages from hourly ERA5 data) (the positive and negative values indicated the wind flowing towards and away from TP, respectively. The dashed line denoted the 12:00 local time).
3.6 Application in a dust event
Figures 11–12 presented a case study of an intense dust event on 31 March 2015 (UTC), aiming to evaluate the consistency between the CATS-retrieved dust properties and ground-based environmental monitoring observations. This episode was also reported by Li et al. (2018). At 22:00 UTC on 31 March (06:00 Beijing Time, BJT, on 1 April), CATS overpassed the study region (Fig. 11a). At that time, the aerosol optical depth (AOD) within TD exceeded 1. The vertical profiles indicated that aerosols over both TD and TP were dominated by dust, and the DMC below 4 km in the TD exceeded 300 µ g m−3 (Fig. 11e, f). During this overpass, the CATS ground track approached the Aksu site located at the northern margin of the TD and the Nagqu site on the TP, providing an opportunity for satellite–surface comparison.
During the CATS overpass, the PM10 concentration at Aksu was only 154 µg m−3 (Fig. 12a), and the nearby AOD was also clearly below 1, indicating that the near-surface air had not yet been substantially affected by the main dust plume. The near-surface dust mass concentrations retrieved from the four pixels of the trajectory closest to Aksu (approximately 115 km) ranged from 100–250 µ g m−3, showing a good correspondence with surface observed PM concentrations. Concurrently, weak northerly winds prevailed near Aksu (Fig. 11a). After sunrise, near-surface winds gradually shifted from northerly to southerly. By 03:00 UTC on 1 April (11:00 BJT), both the 10 m and 850 hPa wind fields near Aksu exhibited coherent southerly flow (∼ 5 m s−1), which favored northward transport of dust from the TD toward Aksu. Meanwhile, the boundary layer height (BLH) rose from ∼ 250 to ∼ 1500 m, enhancing the mixing of the aloft dust into the near-surface layer. Under the combined effects of advection and mixing, surface PM10 at Aksu increased rapidly to 965 µ g m−3 at 12:00 BJT (Fig. 12a). This PM10 magnitude is comparable to the DMC (≥1000 µ g m−3) retrieved by CATS over TD during the 06:00 BJT overpass (Fig. 11f), indicating that the dust transported by the southly wind from the interior of the TD desert has affected the particulate matter concentration in Aksu..These remaining deviations are mainly due to spatial collocation mismatches, temporal offsets, and the inequality of PM10 and DMC intrinsically.
In contrast, Nagqu exhibited better spatial collocation with the CATS ground track (only ∼ 23 km away from the closest pixel point). At 06:00 BJT, the observed PM10 and PM2.5 concentrations at Nagqu were approximately 60 and 20 µ g m−3, respectively, whereas the CATS-retrieved near surface DMC was 25–40 µ g m−3, showing a close agreement in magnitude (Fig. 12b, d). Overall, this case study suggested that the CATS retrievals could reasonably capture the vertical distribution and magnitude of dust, and give a comparable result of dust variation relative to the ground-based measurements.
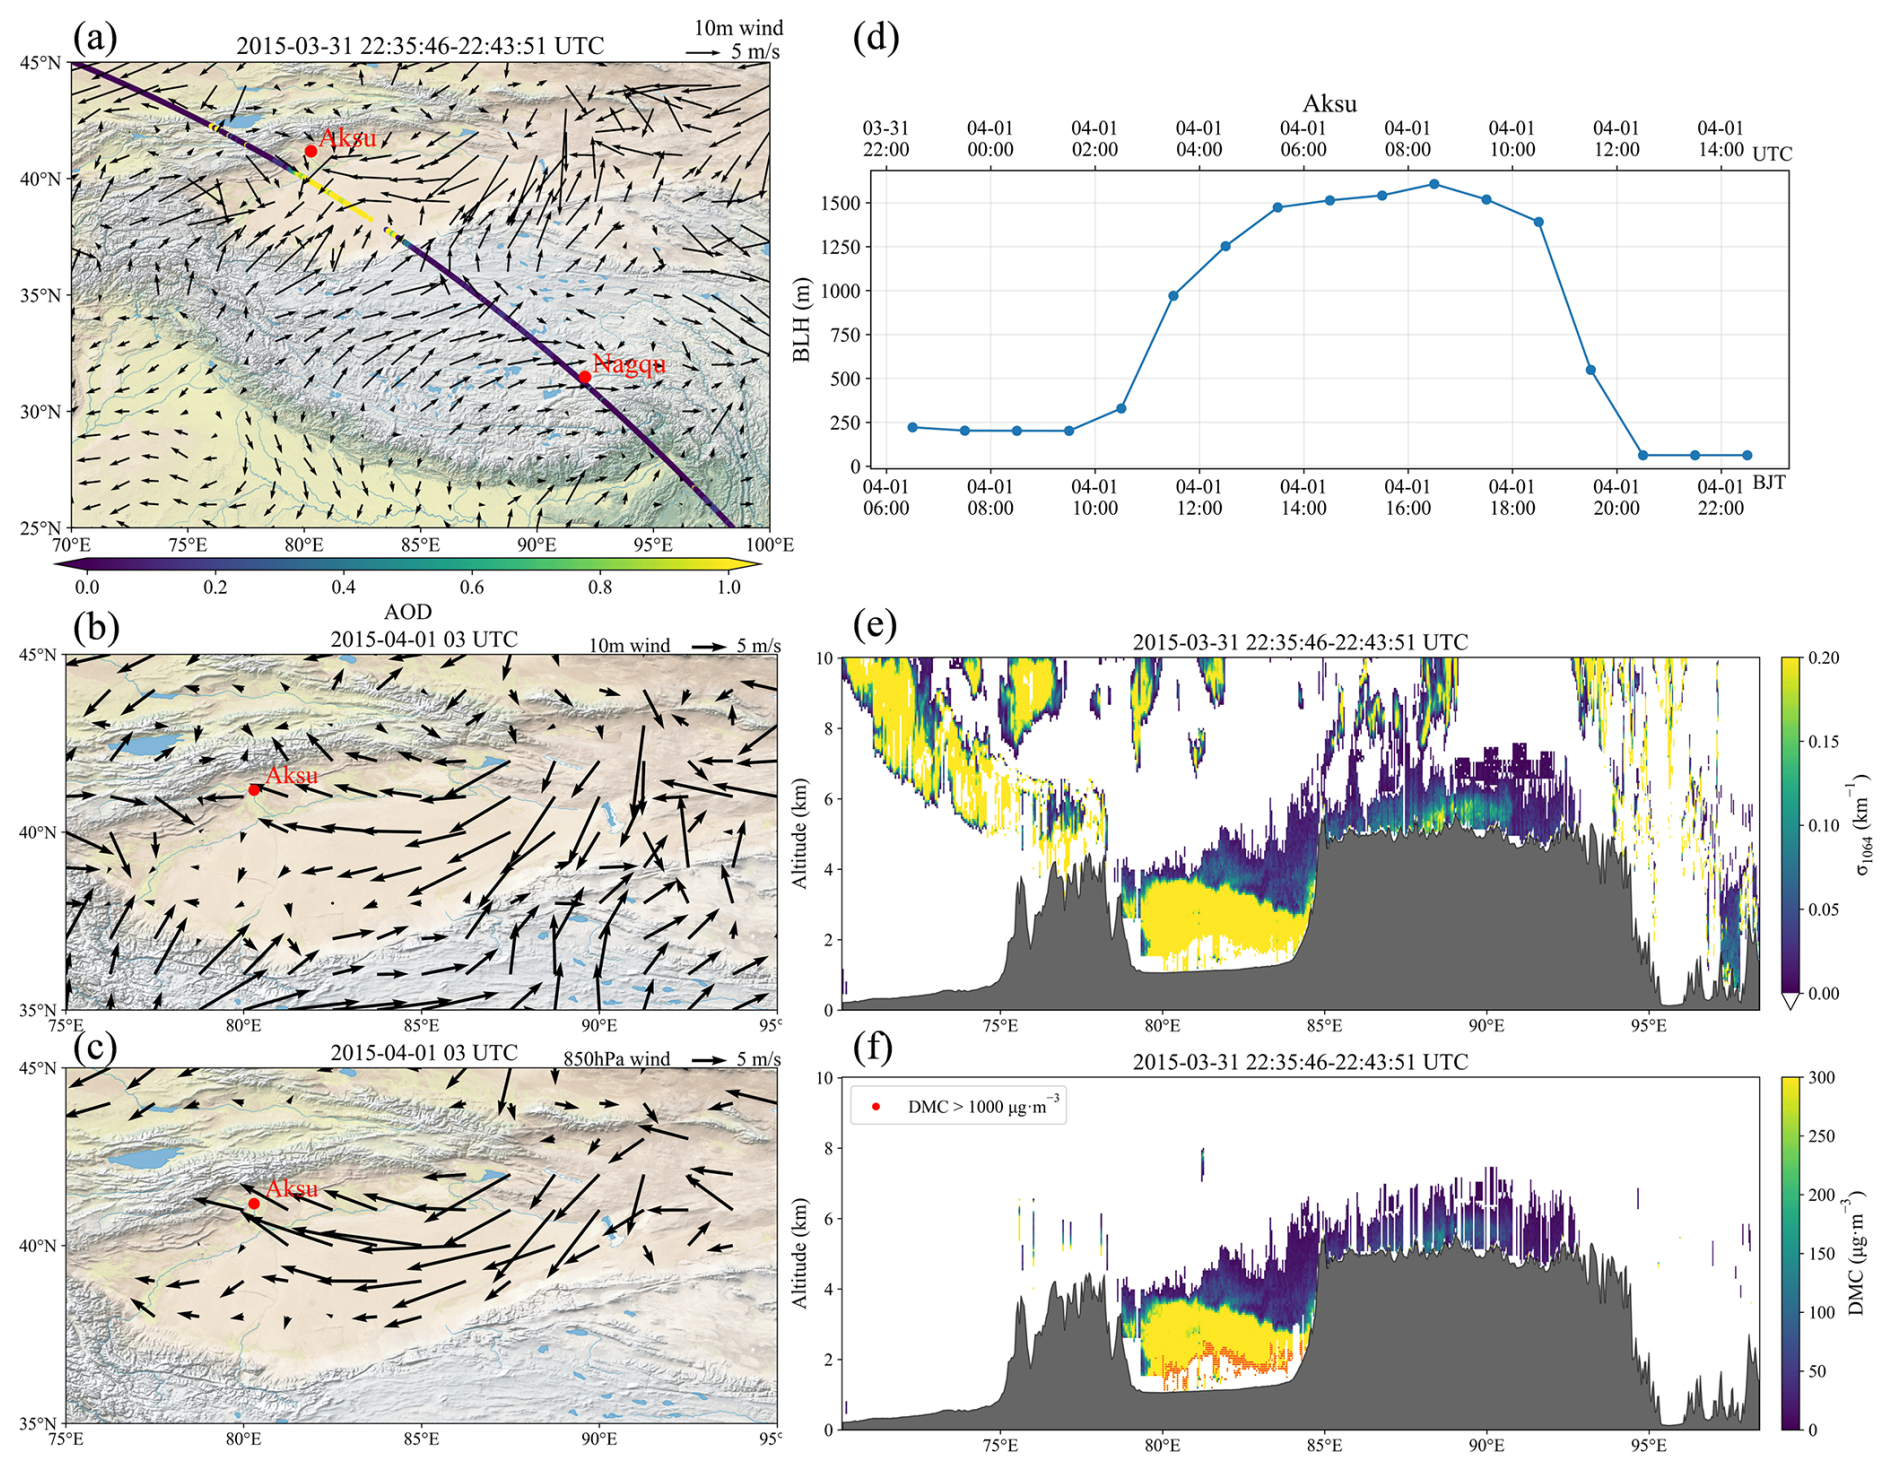
Figure 11Integrated analysis of a springtime dust event in 2015 based on CATS observations. (a) CATS overpass track and 10 m wind field at 22:00 UTC on 31 March (06:00 BJT on 1 April). Track colours indicated different aerosol optical depths (AODs). Red markers denote the locations of the ground-based environmental monitoring stations of Aksu (41.18° N, 80.29° E) and Nagqu (31.48° N, 92.06° E), respectively. (b, c) Wind fields at 10 m and 850 hPa at 03:00 UTC on 1 April (11:00 BJT on 1 April). (d) Hourly boundary-layer height (BLH) at Aksu. (e, f) Vertical profiles of total extinction coefficient at 1064 nm (σ1064) and DMC retrieved from CATS. Wind and BLH data are from the MERRA-2 reanalysis. The basemap is from the Natural Earth dataset.
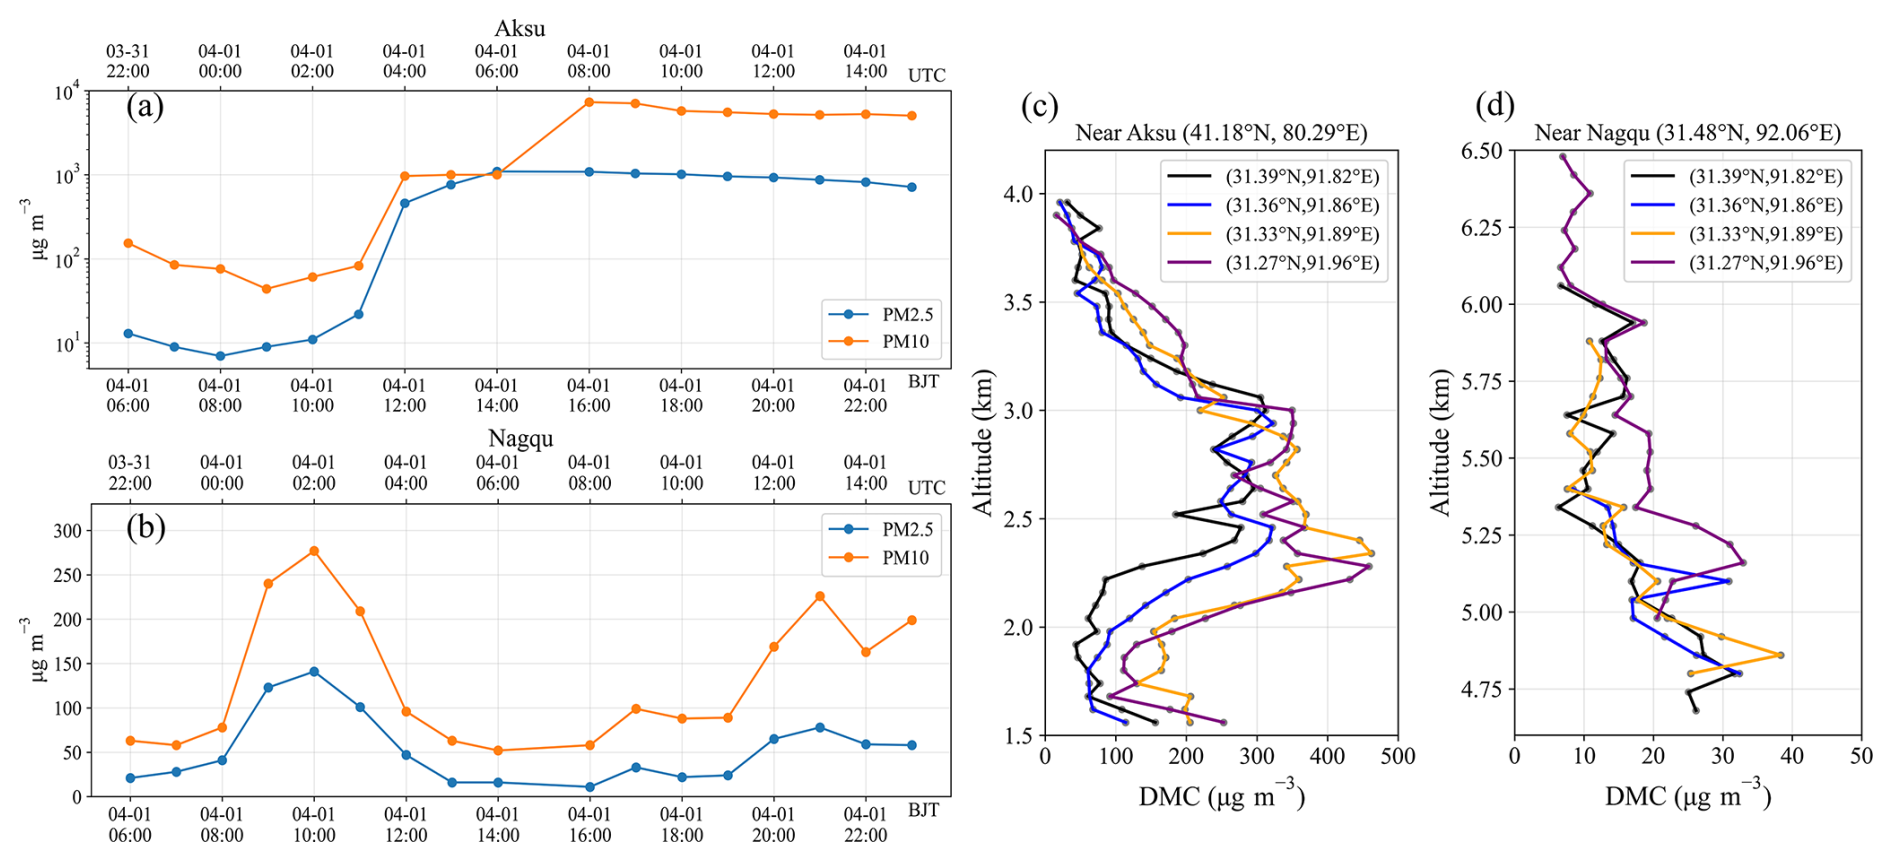
Figure 12(a, b) Temporal variations of PM10 and PM2.5 concentrations measured at Aksu (41.18° N, 80.29° E) and Nagqu (31.48° N, 92.06° E) ground-based environmental monitoring stations. (c, d) Vertical profiles of DMC retrieved from CATS along the ground track segments closest to Aksu and Nagqu during the 22:00 UTC overpass on 31 March 2015 (06:00 BJT on 1 April).
3.7 Uncertainty and limitation
In this study, DMC is derived from CATS extinction coefficients and subsequently used to estimate the transport fluxes. The overall uncertainty mainly arose from the choice of MEE, CATS sampling characteristics and potential cloud aerosol misclassification, wavelength conversion of extinction, uncertainties in the driving wind fields, and simplified treatment of deposition processes. Each error source was discussed below in detail.
3.7.1 MEE
To the DMC retrieval, we adopt the three-dimensional climatological MEE at 550 nm provided by DustCOMM. DustCOMM was a global dust climatology constructed from a multi-model ensemble that was constrained by multi-site observations, and it had a clear physical basis (Adebiyi et al., 2020). Its production explicitly accounted for particle size distributions, regional variability, and vertical structure, yielding a climatology seasonal mean MEE field that varied with space and altitude on a 0.5° × 0.625° grid and across 35 pressure levels (Figs. S1–S2). The dataset was generated by integrating global model ensembles from 2004–2008 (except WRF-Chem and IMPACT, which covered 2007–2016 and 2004, respectively) with observational data and experimental constraints. The evaluation in Adebiyi et al. (2020) indicated that the mean difference between DustCOMM MEE and observations was ∼ 1 %. Compared with the unconstrained model ensemble, DustCOMM better reproduced lower MEE near source regions and higher MEE farther downwind due to transport and aging. For the source and downwind regions examined here (including TD, TH, TP), several recent studies (Han et al., 2022a, b; Tang et al., 2024), which characterized dust loading and transport based on DustCOMM MEE, have proven the effectiveness of this product to a certain extent. It should be pointed out that although no humidity effect was explicitly accounted in DustCOMM MEE product, some studies suggested that the hygroscopic growth of mineral dust under subsaturated conditions was generally weak, for example the water uptake mass was only ∼ 2 % for dry dust at RH = 90 % in Qinghai and Xinjiang (Chen et al., 2020), and the diameter growth factor of natural mineral dust was typically <1.1 for RH ≤ 90 % (Koehler et al., 2009). Moreover, we selected the aerosol type of “Dust” rather than “Dust mixture” in CATS. Together with the generally dry background over the study region, we inferred that the humidity-induced enhancement of MEE under this condition was likely on the order of several percent, which was smaller than other uncertainty sources such as extinction retrieval and wind bias.
3.7.2 Sampling and cloud contamination
Although CATS provides higher spatiotemporal resolution than some spaceborne lidars such as CALIPSO, its effective observing period spans only about three years and its local-time sampling is not temporally uniform. Therefore, it is important to clarify that the diurnal variations presented in this work do not represent a “true” 3-hourly evolution for any specific day; rather, it depicts the average dependence on local time for different seasons over the study region. Not only aerosol, CATS retrievals also have been used to investigate the diurnal variations of clouds, and planetary boundary layer height (Noel et al., 2018; Yu et al., 2021; Li et al., 2023b; Wang et al., 2024). Regarding cloud screening and aerosol typing, the CATS Level-2 product applies a cloud–aerosol discrimination (CAD) algorithm and multiple quality-control tests to separate clouds from aerosols and to flag potential cloud contamination (CATS L2O Profile Products Quality Statements, Version Release 3.00). These procedures include thresholds in cloud fraction, tests based on layer-integrated attenuated backscatter, and relative humidity checks, aiming to better distinguish optically thick clouds from strongly scattering dust/smoke layers and to reduce misclassification (e.g., lofted dust as ice cloud, or dense smoke as cloud). Building on these product-level controls, our processing further applies more strict filtering to improve retrieval reliability (Xiong et al., 2023). Prior studies have also validated the credibility of CATS classification and retrieval results from different perspectives (Proestakis et al., 2019; Nowottnick et al., 2022).
3.7.3 Extinction wavelength conversion
A key step of this study was to derive the CATS 532 nm extinction coefficient from CATS 1064 nm measurements, using the extinction conversion ratio of 1064-to-532 nm from CALIPSO observation. Comparisons with CALIPSO Level-3 dust extinction at 532 nm (Fig. S6) show that CATS captured the major spatial patterns and the vertical decay of dust extinction, as well as regional differences, such as the strongest extinction near the surface over the TH with rapid decreases aloft, and an elevated dust layer around ∼ 3 km over the TD. However, relative to CALIPSO, CATS appeared to be slightly higher in the mid-troposphere (∼ 4–6 km). Annual statistics (Fig. S7) further demonstrated overall regional consistency between CATS and CALIPSO, with high correlation (r=0.88) and small biases (mean bias ≈ 0.01 km−1, MAE ≈ 0.01 km−1, RMSE ≈ 0.02 km−1). These results suggest that CATS retrievals reliably presented the spatiotemporal variations in dust extinction, which ensured the reliability of the analysis on spatial distribution, seasonal variability, and local-time dependence. Following the Ångström relation and weak-to-moderate spectral dependence in the visible exhibited by mineral dust, we adopt α=0.5–1.0 as the typical range. This choice introduced a mass change of only −1.7 % to −3.3 %. Even under the conservative upper limit of α=1.5, the shift remains within −5 %. Thus, the mass concentration bias due to the conversion from 532 to 550 nm were only a few percent (<5 %).
3.7.4 Mass concentration, wind, and deposition
In DMC calculation, the average value of the layer below 180 m is regarded as the near-surface concentration. To evaluate the uncertainty of this approximation, we systematically compared the CATS-derived dust concentrations with reanalysis products (MERRA-2) and surface observations. Seasonal-mean surface dust concentrations between CATS and MERRA-2 showed the correlation coefficients between 0.54 and 0.74. CATS results were slightly higher than MERRA-2 ones in spring (approximately +13 µ g m−3 of mean bias) but lower more in summer, autumn, and winter (approximately −18 to −27 µ g m−3), which resulted in an overall underestimation of about 10 to 20 µ g m−3 in annual means. The ranges of seasonal MAEs (Mean Absolute Error) and RMSEs (Root Mean Square Error) were ∼ 41–68 and ∼ 57–98 µ g m−3, respectively. Compared to the typical concentrations of ∼ 150–250 µ g m−3 over the study region, the MAE of CATS retrievals was about 20 %–40 % (Fig. S3). Moreover, seasonal-mean comparisons between CATS DMCS and in situ observations of differences between PM10 and PM2.5 (as a dust proxy) showed correlations of 0.56–0.68, and a slightly positive bias (+8 µg m−3) in spring and negative biases (−20 µ g m−3) in other seasons (Fig. S4). For column DMC, the seasonal correlations between CATS and MERRA-2 were 0.57–0.84, and the seasonal mean bias, MAE, and RMSE were −0.06 to +0.01, 0.05 to 0.09 and 0.06 to 0.12 µ g m−2, respectively (Fig. S5). In conclusion, the uncertainty of seasonal-mean DMC retrieval was approximately inferred as 20 %–40 %.
In flux calculation, the bias of wind speed is a major impactor. Some studies indicated that ERA5 10 m wind speed agreed well with surface observations, with a global mean bias of about −4.5 % (Fan et al., 2021), and it performs better than MERRA-2 one over East Asia (Li et al., 2025). In addition, the wind speed biases in different vertical layers for ERA5 and MERRA-2 were in a reasonable range (Wu et al., 2024). Given that the regional mean systematic bias is <5 % and the random deviation at different vertical levels is <0.5 m s−1, we conservatively assume a random uncertainty of 10 %–20 % for ERA5 wind speeds in the subsequent error-propagation analysis. It should be noticed that the boundary fluxes in this work are primarily used to diagnose major transport pathways and their seasonal evolution, rather than to construct a strictly closed mass budget under mass conservation. This study only considered dry deposition and didn't take into account wet deposition, which would lead to a certain degree of overestimation of the flux. However, the precipitation in the study area is relatively small, the major deposition contribution is from dry deposition in most seasons (Fig. S8). Furthermore, when calculating the dust contribution from the Qaidam Basin, this study exclusively accounted for dry deposition while neglecting wet removal processes. This omission introduced a systematic bias that likely inflated the estimated outward dust flux. In brief, considering the combined uncertainties associated with concentration retrieval, wind speed variability, and deposition mechanisms, we estimated an overall error margin of 25 %–45 %. Consequently, these results should be interpreted primarily as a characterization of the spatiotemporal patterns of dust vertical distribution and transport, rather than as a rigorous quantitative budget.
This study utilized the observations from CATS and CALIPSO, combined with datasets of DustCOMM, MERRA-2, CHAP and ERA5, to depict the seasonal and diurnal variation characteristics of dust transport around TP (Tibetan Plateau). The main conclusions were as follows:
-
The four datasets of CATS, MERRA2, CHAP and DustCOMM depicted a similar pattern of dust distribution in the study region. All datasets showed consistent locations of high dust concentration, which are the southern edge of TD (Taklimakan Desert), the southwestern TH (Thar Desert), the northern GD (Gobi Desert), and the Qaidam Basin in TP (Tibetan Plateau). The dust concentration calculated from CATS showed a correlation coefficient of 0.4–0.6 with the ground-based observations and reanalysis datasets.
-
Two distinct dust transport belts are located respectively on both the northern and southern sides of TP. The northern branch originated from the TD and extended to the northeastern China, while the southern one began from the TH and stretched eastly to 100° E. The coverage and total amount of dust transport are at their maximum during spring for both dust belts. The annual TP-ward dust fluxes via the northern slope were 2409 and 7000 t km−1 through the Kunlun Mountains route and the Qaidam Basin route, respectively. The TP-ward dust fluxes from the western entrance and the southern slope were 3861 and 549 t km−1, respectively. CATS observations demonstrated that the Qaidam Basin was an important dust source for the downstream cities, with an annual exporting dust flux of 6063 t km−1 , in which more than half was contributed in spring.
-
A dust backflow from east to west existed all year round in the lower air over the eastern TD due to the favorable terrain and special weather systems. The seasonal flux rate of the dust backflow ranged from 7.4 to 83.1 t km−2 d−1, with the maximum in spring.
-
The diurnal variations of dust entering the TP at different altitudes were analyzed along four major transport routes. The dust fluxes were more intense from midday to afternoon, which was partly favored by the wind speed. The dust flux showed pronounced seasonal variations both in vertical distribution and transport intensity. It was strongest in spring both for the total column and different altitude layers, while it primarily concentrated into the lower atmosphere in autumn. Dust flux during winter showed a bimodal pattern, one of which appeared at night.
Overall, this study provides a satellite-lidar-constrained characterization of the average features of dust mass concentration distribution and transport around the Tibetan Plateau. In the future, more constraint factors will be considered, such as BLH-constrained profile, wet-deposition, topography and so on, which could further reduce the estimation uncertainty.
The CALIPSO, CATS, and MERRA-2 data are available at website: https://search.earthdata.nasa.gov/ (last access: 17 August 2025). The DustCOMM data can be downloaded from website: https://doi.org/10.5281/zenodo.2620475 (Adebiyi et al., 2019). The CHAP data are available at: https://www.geodata.cn (last access: 17 August 2025). The particulate matter observation data is downloaded from http://www.cnemc.cn/ (last access: 17 August 2025). The ERA5 data are available at https://cds.climate.copernicus.eu/ (last access: 17 August 2025).
The supplement related to this article is available online at https://doi.org/10.5194/acp-26-2721-2026-supplement.
XX conceived the overall idea, designed the methodology, conducted formal analysis and revised the manuscript. ZX curated the data, prepared the original draft, and created visualizations. JG and HZ contributed to visualization and investigation. TZ and QH commented on the manuscript.
The contact author has declared that none of the authors has any competing interests.
Publisher's note: Copernicus Publications remains neutral with regard to jurisdictional claims made in the text, published maps, institutional affiliations, or any other geographical representation in this paper. The authors bear the ultimate responsibility for providing appropriate place names. Views expressed in the text are those of the authors and do not necessarily reflect the views of the publisher.
The authors are grateful to the data providers. We thank NASA Earthdata for providing the CATS, CALIPSO, and MERRA-2 datasets, the European Centre for Medium-Range Weather Forecasts (ECMWF) for the ERA5 dataset, the Aerosol-Climate Interactions research group for the DustCOMM dataset, the National Earth System Science Data Center for the CHAP dataset, and the China National Environmental Monitoring Center for particulate matter observation data.
This research has been supported by the National Natural Science Foundation of China (grant no. 42030612).
This paper was edited by Suvarna Fadnavis and reviewed by two anonymous referees.
Adebiyi, A., Jasper, K., Wang, Y., Ito, A., Ridley, D. A., Nabat, P., and Zhao, C.: Dust Constraints from joint Observational-Modelling-experiMental analysis – DustCOMM Version 1, Zenodo [data set], https://doi.org/10.5281/zenodo.2620475, 2019.
Adebiyi, A. A., Kok, J. F., Wang, Y., Ito, A., Ridley, D. A., Nabat, P., and Zhao, C.: Dust Constraints from joint Observational-Modelling-experiMental analysis (DustCOMM): comparison with measurements and model simulations, Atmos. Chem. Phys., 20, 829–863, https://doi.org/10.5194/acp-20-829-2020, 2020.
Chen, L., Peng, C., Gu, W., Fu, H., Jian, X., Zhang, H., Zhang, G., Zhu, J., Wang, X., and Tang, M.: On mineral dust aerosol hygroscopicity, Atmos. Chem. Phys., 20, 13611–13626, https://doi.org/10.5194/acp-20-13611-2020, 2020.
Chen, S., Huang, J., Zhao, C., Qian, Y., Leung, L. R., and Yang, B.: Modeling the transport and radiative forcing of Taklimakan dust over the Tibetan Plateau: A case study in the summer of 2006: Transport and Radiative Forcing of Dust, J. Geophys. Res. Atmos., 118, 797–812, https://doi.org/10.1002/jgrd.50122, 2013.
Chen, S., Huang, J., Li, J., Jia, R., Jiang, N., Kang, L., Ma, X., and Xie, T.: Comparison of dust emissions, transport, and deposition between the Taklimakan Desert and Gobi Desert from 2007 to 2011, Science China Earth Sciences, 60, 1338–1355, https://doi.org/10.1007/s11430-016-9051-0, 2017.
Chepfer, H., Brogniez, H., and Noel, V.: Diurnal variations of cloud and relative humidity profiles across the tropics, Sci. Rep., 9, 16045, https://doi.org/10.1038/s41598-019-52437-6, 2019.
Duan, A., Wu, G., Liu, Y., Ma, Y., and Zhao, P.: Weather and climate effects of the Tibetan Plateau, Adv. Atmos. Sci., 29, 978–992, https://doi.org/10.1007/s00376-012-1220-y, 2012.
Fan, W., Liu, Y., Chappell, A., Dong, L., Xu, R., Ekström, M., Fu, T.-M., and Zeng, Z.: Evaluation of Global Reanalysis Land Surface Wind Speed Trends to Support Wind Energy Development Using In Situ Observations, Journal of Applied Meteorology and Climatology, 60, 33–50, https://doi.org/10.1175/JAMC-D-20-0037.1, 2021.
Gueymard, C. A. and Yang, D.: Worldwide validation of CAMS and MERRA-2 reanalysis aerosol optical depth products using 15 years of AERONET observations, Atmospheric Environment, 225, 117216, https://doi.org/10.1016/j.atmosenv.2019.117216, 2020.
Han, Y., Fang, X., Song, L., Zhang, Q., and Yang, S.: A study of atmospheric circulation and dust storm causes of formation in the Tarim Basin – the restructured wind field by shapes of dune and observed prevailing wind, Chinese Journal of Atmospheric Sciences, 29, 627, https://doi.org/10.3878/j.issn.1006-9895.2005.04.14, 2005.
Han, Y., Wang, T., Tang, J., Wang, C., Jian, B., Huang, Z., and Huang, J.: New insights into the Asian dust cycle derived from CALIPSO lidar measurements, Remote Sens. Environ., 272, 112906, https://doi.org/10.1016/j.rse.2022.112906, 2022a.
Han, Z., Ge, J., Chen, X., Hu, X., Yang, X., and Du, J.: Dust Activities Induced by Nocturnal Low-Level Jet Over the Taklimakan Desert From WRF-Chem Simulation, Journal of Geophysical Research: Atmospheres, 127, e2021JD036114, https://doi.org/10.1029/2021JD036114, 2022b.
Hand, J. L. and Malm, W. C.: Review of aerosol mass scattering efficiencies from ground-based measurements since 1990, Journal of Geophysical Research: Atmospheres, 112, https://doi.org/10.1029/2007JD008484, 2007.
Hsu, S.-C., Liu, S. C., Arimoto, R., Liu, T.-H., Huang, Y.-T., Tsai, F., Lin, F.-J., and Kao, S.-J.: Dust deposition to the East China Sea and its biogeochemical implications, Journal of Geophysical Research: Atmospheres, 114, https://doi.org/10.1029/2008JD011223, 2009.
Hu, Z., Huang, J., Zhao, C., Jin, Q., Ma, Y., and Yang, B.: Modeling dust sources, transport, and radiative effects at different altitudes over the Tibetan Plateau, Atmos. Chem. Phys., 20, 1507–1529, https://doi.org/10.5194/acp-20-1507-2020, 2020.
Huang, J., Zhou, X., Wu, G., Xu, X., Zhao, Q., Liu, Y., Duan, A., Xie, Y., Ma, Y., Zhao, P., Yang, S., Yang, K., Yang, H., Bian, J., Fu, Y., Ge, J., Liu, Y., Wu, Q., Yu, H., Wang, B., Bao, Q., and Qie, K.: Global Climate Impacts of Land-surface and Atmospheric Processes over the Tibetan Plateau, Reviews of Geophysics, e2022RG000771, https://doi.org/10.1029/2022RG000771, 2023.
Iwasaka, Y., Li, J. M., Shi, G.-Y., Kim, Y. S., Matsuki, A., Trochkine, D., Yamada, M., Zhang, D., Shen, Z., and Hong, C. S.: Mass Transport of Background Asian Dust Revealed by Balloon-Borne Measurement: Dust Particles Transported during Calm Periods by Westerly from Taklamakan Desert, in: Advanced Environmental Monitoring, edited by: Kim, Y. J. and Platt, U., Springer Netherlands, Dordrecht, 121–135, https://doi.org/10.1007/978-1-4020-6364-0_9, 2008.
Jia, R., Liu, Y., Chen, B., Zhang, Z., and Huang, J.: Source and transportation of summer dust over the Tibetan Plateau, Atmospheric Environment, 123, 210–219, https://doi.org/10.1016/j.atmosenv.2015.10.038, 2015.
Jia, R., Liu, Y., Hua, S., Zhu, Q., and Shao, T.: Estimation of the aerosol radiative effect over the Tibetan Plateau based on the latest CALIPSO product, J. Meteorolog. Res., 32, 707–722, https://doi.org/10.1007/s13351-018-8060-3, 2018.
Jiang, L., Liu, Y., Li, W., Yuan, S., Yuan, J., Li, S., and Liu, Z.: Cenozoic double-layered structure in the western Qaidam Basin, northern Tibetan Plateau, China, Journal of Asian Earth Sciences, 232, 105123, https://doi.org/10.1016/j.jseaes.2022.105123, 2022.
Koehler, K. A., Kreidenweis, S. M., DeMott, P. J., Petters, M. D., Prenni, A. J., and Carrico, C. M.: Hygroscopicity and cloud droplet activation of mineral dust aerosol, Geophysical Research Letters, 36, https://doi.org/10.1029/2009GL037348, 2009.
Lau, W. K. M. and Kim, K.-M.: Impact of snow darkening by deposition of light-absorbing aerosols on snow cover in the Himalayas–Tibetan plateau and influence on the Asian summer monsoon: a possible mechanism for the blanford hypothesis, Atmosphere, 9, 438, https://doi.org/10.3390/atmos9110438, 2018.
Li, J., He, Q., Jin, L., and Ge, X.: Three-dimensional distribution of dust aerosols over the Tarim Basin and the Tibet Plateau during 2007–2021 derived from CALIPSO lidar observations, Journal of Cleaner Production, 400, 136746, https://doi.org/10.1016/j.jclepro.2023.136746, 2023a.
Li, S., Wang, K., Miao, H., Zhu, X., Liu, Y., Li, J., Wang, W., Zheng, X., Feng, J., and Wang, X.: Evaluation of surface wind speed over East Asia and the adjacent ocean in three reanalyses using satellite and in-situ observations, Atmospheric and Oceanic Science Letters, 18, 100587, https://doi.org/10.1016/j.aosl.2024.100587, 2025.
Li, X., Liu, X., and Yin, Z.-Y.: The Impacts of Taklimakan Dust Events on Chinese Urban Air Quality in 2015, Atmosphere, 9, 281, https://doi.org/10.3390/atmos9070281, 2018.
Li, Y., Li, J., Xu, S., Li, J., He, J., and Huang, J.: Diurnal variation in the near-global planetary boundary layer height from satellite-based CATS lidar: Retrieval, evaluation, and influencing factors, Remote Sensing of Environment, 299, 113847, https://doi.org/10.1016/j.rse.2023.113847, 2023b.
Liu, Y., Sato, Y., Jia, R., Xie, Y., Huang, J., and Nakajima, T.: Modeling study on the transport of summer dust and anthropogenic aerosols over the Tibetan Plateau, Atmos. Chem. Phys., 15, 12581–12594, https://doi.org/10.5194/acp-15-12581-2015, 2015.
Liu, Y., Lu, M., Yang, H., Duan, A., He, B., Yang, S., and Wu, G.: Land–atmosphere–ocean coupling associated with the Tibetan Plateau and its climate impacts, Natl. Sci. Rev., 7, 534–552, https://doi.org/10.1093/nsr/nwaa011, 2020.
Mao, R., Hu, Z., Zhao, C., Gong, D.-Y., Guo, D., and Wu, G.: The source contributions to the dust over the Tibetan Plateau: A modelling analysis, Atmospheric Environment, 214, 116859, https://doi.org/10.1016/j.atmosenv.2019.116859, 2019.
McGill, M. J., Yorks, J. E., Scott, V. S., Kupchock, A. W., and Selmer, P. A.: The Cloud-Aerosol Transport System (CATS): a technology demonstration on the International Space Station, in: Lidar Remote Sensing for Environmental Monitoring XV, Backup Publisher: International Society for Optics and Photonics, 34–39, https://doi.org/10.1117/12.2190841, 2015.
Mukkavilli, S. K., Prasad, A. A., Taylor, R. A., Huang, J., Mitchell, R. M., Troccoli, A., and Kay, M. J.: Assessment of atmospheric aerosols from two reanalysis products over Australia, Atmospheric Research, 215, 149–164, https://doi.org/10.1016/j.atmosres.2018.08.026, 2019.
Noel, V., Chepfer, H., Chiriaco, M., and Yorks, J.: The diurnal cycle of cloud profiles over land and ocean between 51° S and 51° N, seen by the CATS spaceborne lidar from the International Space Station, Atmos. Chem. Phys., 18, 9457–9473, https://doi.org/10.5194/acp-18-9457-2018, 2018.
Nowottnick, E. P., Christian, K. E., Yorks, J. E., McGill, M. J., Midzak, N., Selmer, P. A., Lu, Z., Wang, J., and Salinas, S. V.: Aerosol Detection from the Cloud–Aerosol Transport System on the International Space Station: Algorithm Overview and Implications for Diurnal Sampling, Atmosphere, 13, 1439, https://doi.org/10.3390/atmos13091439, 2022.
Proestakis, E., Amiridis, V., Marinou, E., Binietoglou, I., Ansmann, A., Wandinger, U., Hofer, J., Yorks, J., Nowottnick, E., Makhmudov, A., Papayannis, A., Pietruczuk, A., Gialitaki, A., Apituley, A., Szkop, A., Muñoz Porcar, C., Bortoli, D., Dionisi, D., Althausen, D., Mamali, D., Balis, D., Nicolae, D., Tetoni, E., Liberti, G. L., Baars, H., Mattis, I., Stachlewska, I. S., Voudouri, K. A., Mona, L., Mylonaki, M., Perrone, M. R., Costa, M. J., Sicard, M., Papagiannopoulos, N., Siomos, N., Burlizzi, P., Pauly, R., Engelmann, R., Abdullaev, S., and Pappalardo, G.: EARLINET evaluation of the CATS Level 2 aerosol backscatter coefficient product, Atmos. Chem. Phys., 19, 11743–11764, https://doi.org/10.5194/acp-19-11743-2019, 2019.
Shi, S., Zhu, H., and Wang, X.: Validation of MERRA-2 AOT Modeling Data over China Using SIAVNET Measurement, Atmosphere, 14, https://doi.org/10.3390/atmos14101592, 2023.
Sun, E., Xu, X., Che, H., Tang, Z., Gui, K., An, L., Lu, C., and Shi, G.: Variation in MERRA-2 aerosol optical depth and absorption aerosol optical depth over China from 1980 to 2017, Journal of Atmospheric and Solar-Terrestrial Physics, 186, 8–19, https://doi.org/10.1016/j.jastp.2019.01.019, 2019.
Tang, J., Wang, T., Han, Y., Zhang, X., Tan, R., Dong, Y., He, S., Abdullaev, S. F., and Amonov, M. O.: Dominating Remote Source and Its Potential Contribution of Airborne Dust Over the Tibetan Plateau, Geophysical Research Letters, 51, e2024GL111178, https://doi.org/10.1029/2024GL111178, 2024.
Wan, G., Yang, M., Liu, Z., Wang, X., and Liang, X.: The Precipitation Variations in the Qinghai-Xizang (Tibetan) Plateau during 1961–2015, Atmosphere, 8, https://doi.org/10.3390/atmos8050080, 2017.
Wang, J., Pan, H., and An, D.: Seasonal vertical distributions of diurnal variation of ice cloud frequency by CATS measurements over a global region (51° S–51° N), Journal of Atmospheric and Solar-Terrestrial Physics, 258, 106222, https://doi.org/10.1016/j.jastp.2024.106222, 2024.
Wang, K., Zhang, L., Qiu, Y., Ji, L., Tian, F., Wang, C., and Wang, Z.: Snow effects on alpine vegetation in the Qinghai-Tibetan plateau, Int. J. Digital Earth, 8, 58–75, https://doi.org/10.1080/17538947.2013.848946, 2015.
Wang, S.-H., Hsu, N. C., Tsay, S.-C., Lin, N.-H., Sayer, A. M., Huang, S.-J., and Lau, W. K. M.: Can Asian dust trigger phytoplankton blooms in the oligotrophic northern South China Sea?, Geophysical Research Letters, 39, https://doi.org/10.1029/2011GL050415, 2012.
Wang, T., Tang, J., Sun, M., Liu, X., Huang, Y., Huang, J., Han, Y., Cheng, Y., Huang, Z., and Li, J.: Identifying a transport mechanism of dust aerosols over South Asia to the Tibetan Plateau: A case study, Science of The Total Environment, 758, 143714, https://doi.org/10.1016/j.scitotenv.2020.143714, 2021.
Wang, X., Yang, M., Liang, X., Pang, G., Wan, G., Chen, X., and Luo, X.: The dramatic climate warming in the Qaidam basin, northeastern Tibetan plateau, during 1961–2010, Int. J. Climatol., 34, 1524–1537, https://doi.org/10.1002/joc.3781, 2014.
Wei, J., Li, Z., Xue, W., Sun, L., Fan, T., Liu, L., Su, T., and Cribb, M.: The ChinaHighPM10 dataset: generation, validation, and spatiotemporal variations from 2015 to 2019 across China, Environment International, 146, 106290, https://doi.org/10.1016/j.envint.2020.106290, 2021.
Winker, D. M., Tackett, J. L., Getzewich, B. J., Liu, Z., Vaughan, M. A., and Rogers, R. R.: The global 3-D distribution of tropospheric aerosols as characterized by CALIOP, Atmos. Chem. Phys., 13, 3345–3361, https://doi.org/10.5194/acp-13-3345-2013, 2013.
Wu, G.: Land–air coupling over the Tibetan Plateau and its climate impacts, Natl. Sci. Rev., 7, 485, https://doi.org/10.1093/nsr/nwaa012, 2020.
Wu, L., Su, H., Zeng, X., Posselt, D. J., Wong, S., Chen, S., and Stoffelen, A.: Uncertainty of Atmospheric Winds in Three Widely Used Global Reanalysis Datasets, Journal of Applied Meteorology and Climatology, 63, 165–180, https://doi.org/10.1175/JAMC-D-22-0198.1, 2024.
Xiong, Z., Xu, X., Yang, Y., and Luo, T.: Diurnal vertical distribution and transport of dust aerosol over and around Tibetan Plateau from lidar on International Space Station, Atmos Res, 294, 106939, https://doi.org/10.1016/j.atmosres.2023.106939, 2023.
Xu, C., Ma, Y. M., You, C., and Zhu, Z. K.: The regional distribution characteristics of aerosol optical depth over the Tibetan Plateau, Atmos. Chem. Phys., 15, 12065–12078, https://doi.org/10.5194/acp-15-12065-2015, 2015.
Xu, C., Ma, Y., Yang, K., and You, C.: Tibetan Plateau Impacts on Global Dust Transport in the Upper Troposphere, J. Climate, 31, 4745–4756, https://doi.org/10.1175/JCLI-D-17-0313.1, 2018.
Xu, X., Wu, H., Yang, X., and Xie, L.: Distribution and transport characteristics of dust aerosol over Tibetan Plateau and Taklimakan Desert in China using MERRA-2 and CALIPSO data, Atmospheric Environment, 237, 117670, https://doi.org/10.1016/j.atmosenv.2020.117670, 2020.
Yang, L., She, L., Che, Y., Zhang, J., Feng, Z., and Yan, C.: A comprehensive insight into trajectory climatology and spatiotemporal distribution of dust aerosols in China, EGUsphere [preprint], https://doi.org/10.5194/egusphere-2024-357, 2024.
Yang, X., Shen, S., Yang, F., He, Q., Ali, M., Huo, W., and Liu, X.: Spatial and temporal variations of blowing dust events in the Taklimakan Desert, Theoretical and Applied Climatology, 125, 669–677, https://doi.org/10.1007/s00704-015-1537-4, 2016.
Yorks, J. E., McGill, M. J., Palm, S. P., Hlavka, D. L., Selmer, P. A., Nowottnick, E. P., Vaughan, M. A., Rodier, S. D., and Hart, W. D.: An overview of the CATS level 1 processing algorithms and data products, Geophysical Research Letters, 43, 4632–4639, https://doi.org/10.1002/2016GL068006, 2016.
Yu, H., Remer, L. A., Chin, M., Bian, H., Tan, Q., Yuan, T., and Zhang, Y.: Aerosols from Overseas Rival Domestic Emissions over North America, Science, 337, 566–569, https://doi.org/10.1126/science.1217576, 2012.
Yu, Y., Kalashnikova, O. V., Garay, M. J., Lee, H., Choi, M., Okin, G. S., Yorks, J. E., Campbell, J. R., and Marquis, J.: A global analysis of diurnal variability in dust and dust mixture using CATS observations, Atmos. Chem. Phys., 21, 1427–1447, https://doi.org/10.5194/acp-21-1427-2021, 2021.
Zhang, B., Tsunekawa, A., and Tsubo, M.: Contributions of sandy lands and stony deserts to long-distance dust emission in China and Mongolia during 2000–2006, Global and Planetary Change, 60, 487–504, https://doi.org/10.1016/j.gloplacha.2007.06.001, 2008.
Zhang, Z., Liang, J., Ji, H., Li, M., Ding, J., Tang, C., Zhang, M., Yu, Z., Cao, X., Tian, P., Ren, Y., and Zhang, L.: Quantifying Mineral Dust Emissions on the Tibetan Plateau With a Modified Dust Source Map, Geophysical Research Letters, 51, e2023GL107042, https://doi.org/10.1029/2023GL107042, 2024.
Zhao, D., Chen, S., Chen, Y., Gong, Y., Lou, G., Cheng, S., and Bi, H.: Influence of dust aerosols on snow cover over the Tibetan Plateau, Front. Environ. Sci., 10, 839691, https://doi.org/10.3389/fenvs.2022.839691, 2022.
Zhao, J., Ma, X., Wu, S., and Sha, T.: Dust emission and transport in Northwest China: WRF-Chem simulation and comparisons with multi-sensor observations, Atmospheric Research, 241, 104978, https://doi.org/10.1016/j.atmosres.2020.104978, 2020.