the Creative Commons Attribution 4.0 License.
the Creative Commons Attribution 4.0 License.
 | 20 Feb 2026
Experimental Determination of the Global Warming Potential of Carbonyl Fluoride (COF2)
Dongkyum Kim
Hyeon Ki Park
Carbonyl fluoride (COF2) has gained interest as a low-GWP replacement candidate for the high-GWP fluorinated gases employed in semiconductor and display manufacturing. In this study, the infrared absorption cross-section of COF2 was experimentally measured using Fourier Transform Infrared (FTIR) spectroscopy, and its radiative efficiency was determined to be 0.119 W m−2 ppb−1 using the stratospheric-adjusted Pinnock curve. Atmospheric e-folding lifetimes derived from exponential decay measurements were 7.56 h in dry O2 and 54.86 and 36.67 min under low- and high-humidity ambient air, respectively. Incorporation of these lifetimes into the absolute GWP framework yielded GWP100 values of (dry air), (low humidity), and (high humidity), demonstrating that rapid hydrolysis in the presence of water vapor suppresses the climate impact of COF2 to effectively zero under typical tropospheric conditions. Because CO2 is the terminal atmospheric degradation product, the long-term climate impact of COF2 emissions is equivalent to releasing only the stoichiometrically corresponding amount of CO2. These findings provide a fully experimental basis for determining the GWP100 of COF2 under atmospherically relevant conditions and demonstrate that its GWP100 is effectively near zero. This experimentally validated assessment confirms that COF2 is a viable low-GWP replacement gas for chamber-cleaning applications in semiconductor and display manufacturing.
- Article
(1936 KB) - Full-text XML
-
Supplement
(1111 KB) - BibTeX
- EndNote


The growing climate crisis has intensified global attention on greenhouse gases (GHGs), which warm the Earth by absorbing and re-emitting infrared radiation from the surface and atmosphere (IPCC, 2023). The principal GHGs in Earth's atmosphere are water vapour (H2O), carbon dioxide (CO2), methane (CH4), nitrous oxide (N2O), and ozone (O3). In addition to these dominant natural gases, a class of industrially synthesized fluorinated gases (F-gases), including hydrofluorocarbons (HFCs), perfluorocarbons (PFCs), sulfur hexafluoride (SF6), and nitrogen trifluoride (NF3), also plays an increasingly important role in global climate forcing, despite being emitted in far smaller quantities.
To provide policy makers with a unified basis for comparing the climate impacts of different GHGs, the Intergovernmental Panel on Climate Change (IPCC) introduced the Global Warming Potential (GWP) metric in its First Assessment Report (Houghton et al., 1990). GWP is defined as the time-integrated radiative forcing resulting from a pulse emission of a unit mass of a gas relative to that from an equivalent mass of CO2 over a specified time horizon. The most commonly used metric, GWP100, uses a 100-year time horizon and thus quantifies the cumulative warming influence of the pulse over a century, with CO2 assigned a reference value of 1. This metric was later adopted in the Kyoto Protocol as the standard basis for comparing emissions of different GHGs, and under the Paris Agreement Parties continue to report national inventories using GWP100 (Hodnebrog et al., 2020).
F-gases exhibit exceptionally high radiative efficiency values and often possess atmospheric lifetimes ranging from decades to millennia, resulting in GWP values that are thousands to tens of thousands of times higher than that of CO2. For example, NF3 and SF6 have GWP values of 17 400 and 24 300, respectively (Smith et al., 2021). Because of these extremely high GWP100 values, HFCs, PFCs, SF6, and NF3 are regulated under major international climate agreements, including the Kyoto Protocol and its Doha Amendment, as well as the Paris Agreement (UNFCCC, 1997, 2012, 2015).
Because plasma etching and chamber-cleaning operations rely heavily on F-gases, the semiconductor and display industries have become significant contributors to atmospheric F-gas emissions (Song et al., 2022; An and Hong, 2023; Jung et al., 2024; Kai et al., 2024; Kim et al., 2024). The large-scale fabrication of integrated circuits and flat-panel displays involves repeated chamber conditioning and removal of deposition by-products, leading to substantial consumption of F-gases. A portion of these gases remains unreacted during processing and is released through exhaust systems, making the sector a non-negligible contributor to global F-gas emissions. In response to increasingly stringent international climate regulations and to sustain reliable high-throughput manufacturing operations, the industry is actively seeking low-GWP alternatives to the high-GWP F-gases currently used in chamber-cleaning processes.
To mitigate the environmental footprint of semiconductor and display manufacturing, carbonyl fluoride (COF2) has recently gained attention as a promising candidate to replace high-GWP cleaning gases, particularly NF3, in plasma-based chamber-cleaning processes (Mitsui et al., 2004; Lugani et al., 2024; Jo et al., 2025; Park et al., 2025a, bb). According to Mitsui et al. (2004), COF2 is formed as a byproduct during plasma cleaning with C2F6/O2 mixtures and has been experimentally shown to deliver cleaning performance comparable to that of C2F6 while reducing global warming emissions by more than 95 %. Its molecular structure contains fewer fluorine atoms, and its rapid hydrolysis in the presence of moisture suggests a shorter atmospheric lifetime and thus a lower GWP. COF2 is also non-flammable and non-explosive, making it suitable for industrial use under existing safety protocols.
The hydrolysis of COF2 has been investigated in several theoretical studies (Francisco, 1993; Zachariah et al., 1995; Uchimaru et al., 2004). Francisco (1993) and Zachariah et al. (1995) demonstrated that COF2 reacts with H2O to form HF and CO2 via transient intermediates, while Uchimaru et al. (2004) showed that the involvement of multiple water molecules facilitates a proton-relay mechanism that further accelerates hydrolysis by lowering the activation barrier. Together, these findings indicate that COF2 is likely to undergo rapid degradation under humid atmospheric conditions.
COF2 is also known to occur in the atmosphere as a secondary degradation product of halocarbons such as CFC-12, HCFC-22, and CFC-113 and acts as a major fluorine reservoir species in the stratosphere, second only to HF (Harrison, 2020; Harrison et al., 2014). Thornhill et al. (2024) further demonstrated that stratospheric COF2 contributes to radiative forcing and modestly enhances the GWP100 of its precursor halocarbons (Thornhill et al., 2024). Here, we focus specifically on COF2 that may be directly emitted from semiconductor and display manufacturing, rather than that produced in the stratosphere. Accordingly, this study evaluates the intrinsic radiative efficiency and atmospheric lifetime of COF2 under controlled near-surface laboratory conditions to derive its GWP100.
Recent studies have also characterized the infrared absorption and radiative impact of COF2 using existing spectroscopic datasets (Hodnebrog et al., 2020; Thornhill et al., 2024). Hodnebrog et al. (2020) and Thornhill et al. (2024) used the COF2 absorption cross-section (ACS) spectrum available in the Pacific Northwest National Laboratory (PNNL) database, both reporting an integrated ACS of cm molec.−1 over the 0–3000 cm−1 range. The integrated ACS represents the total infrared absorption strength of a molecule across the spectrum. The radiative efficiency (RE) values of COF2 derived from these datasets were estimated as 0.123 W m−2 ppb−1 (Hodnebrog et al., 2020) and 0.126 W m−2 ppb−1 (Thornhill et al., 2024). RE is defined as the radiative forcing resulting from a unit increase in the atmospheric mixing ratio of a halocarbon, quantifying the additional infrared energy retained per ppb increase of the gas. This quantity serves as a fundamental input to the calculation of GWP100. Additionally, line-by-line spectroscopic parameters for the major COF2 absorption bands are available in the HITRAN database (Gordon et al., 2026).
Although spectroscopic data for COF2 exist in databases such as HITRAN and the PNNL spectral library, our goal was not to replace or revise these datasets. Rather, by comparing our measurements with previously reported values, we sought to independently verify their reproducibility and assess the robustness of existing spectroscopic parameters. Furthermore, because a consistent and self-contained set of parameters is required for a complete GWP100 evaluation, we experimentally re-determined the ACS and RE of COF2 to ensure internal consistency throughout the entire GWP100 assessment process.
Therefore, the objective of this study is to experimentally determine the GWP100 of COF2 by measuring its infrared absorption characteristics using laboratory-based Fourier Transform Infrared (FTIR) spectroscopy and by estimating its atmospheric lifetime through controlled decay experiments conducted under well-defined O2- and H2O-containing gas environments with continuous time-resolved FTIR measurements. Importantly, the experimental decay method employed here captures the dominant atmospheric loss processes of COF2, enabling a realistic assessment of its near-surface lifetime. By integrating the experimentally derived RE and atmospheric lifetime, this work provides the first quantitative experimental determination of the GWP100 of COF2. The results offer fundamental scientific evidence supporting the suitability of COF2 as a low-GWP alternative to high-GWP F-gases used in semiconductor and display manufacturing, particularly as a replacement candidate for NF3 in plasma-based chamber cleaning.
2.1 FTIR Systems for Absorption Cross-Section and Atmospheric Lifetime Measurements
The infrared transmittance spectrum required for ACS calculations was measured using a Nicolet iS50 FTIR spectrometer (Thermo Fisher Scientific, USA) equipped with a 2.4 m multipass gas cell (Pike Technologies, 2.4±0.0065 m) and a DTGS detector (spectral range: 4000–650 cm−1). The COF2 transmittance spectrum was acquired at 40.244±0.002 Torr and 296.77±0.01 K under well-controlled laboratory conditions, with a spectral resolution of 0.5 cm−1 and Boxcar apodization, and signal averaging over 128 scans. The FTIR instrument records transmittance as the primary observable, and ACS values were subsequently derived from the measured transmittance using the Beer–Lambert law combined with the ideal gas law, incorporating the recorded pressure, temperature, and optical path length. Temperature and pressure inside the gas cell were recorded simultaneously during each spectral acquisition.
For determining the atmospheric e-folding lifetime of COF2, an Arcoptix GASEX OEM FTIR spectrometer (Arcoptix S.A., Switzerland) was employed together with a 5.0±0.01 m gas cell and a 4-TEC MCT detector (spectral range: 5000–830 cm−1). Time-resolved spectra were collected at 1 min intervals following the introduction of reactive gases, with a spectral resolution of 0.5 cm−1, and all measurements were performed within the linear response range of the FTIR system (Fig. S1 in the Suppolement). An in-house LabVIEW-based control system synchronously recorded temperature and pressure during each spectral acquisition to minimize operational uncertainty. The overall experimental configuration and measurement sequence are shown in Fig. 1. In this setup (Fig. 1a), the FTIR spectrometer, MKS 626D Baratron capacitance manometer, PT100 RTD temperature sensor, and Fluke 1586A Super-DAQ temperature scanner were integrated into a single synchronized system. Each measurement cycle consisted of 2.7 s of simultaneous pressure and temperature logging, 10.3 s of FTIR spectral acquisition averaged over 16 scans, and a 47 s idle period, producing synchronized pressure, temperature, and spectral datasets at 1 min intervals (Fig. 1b).
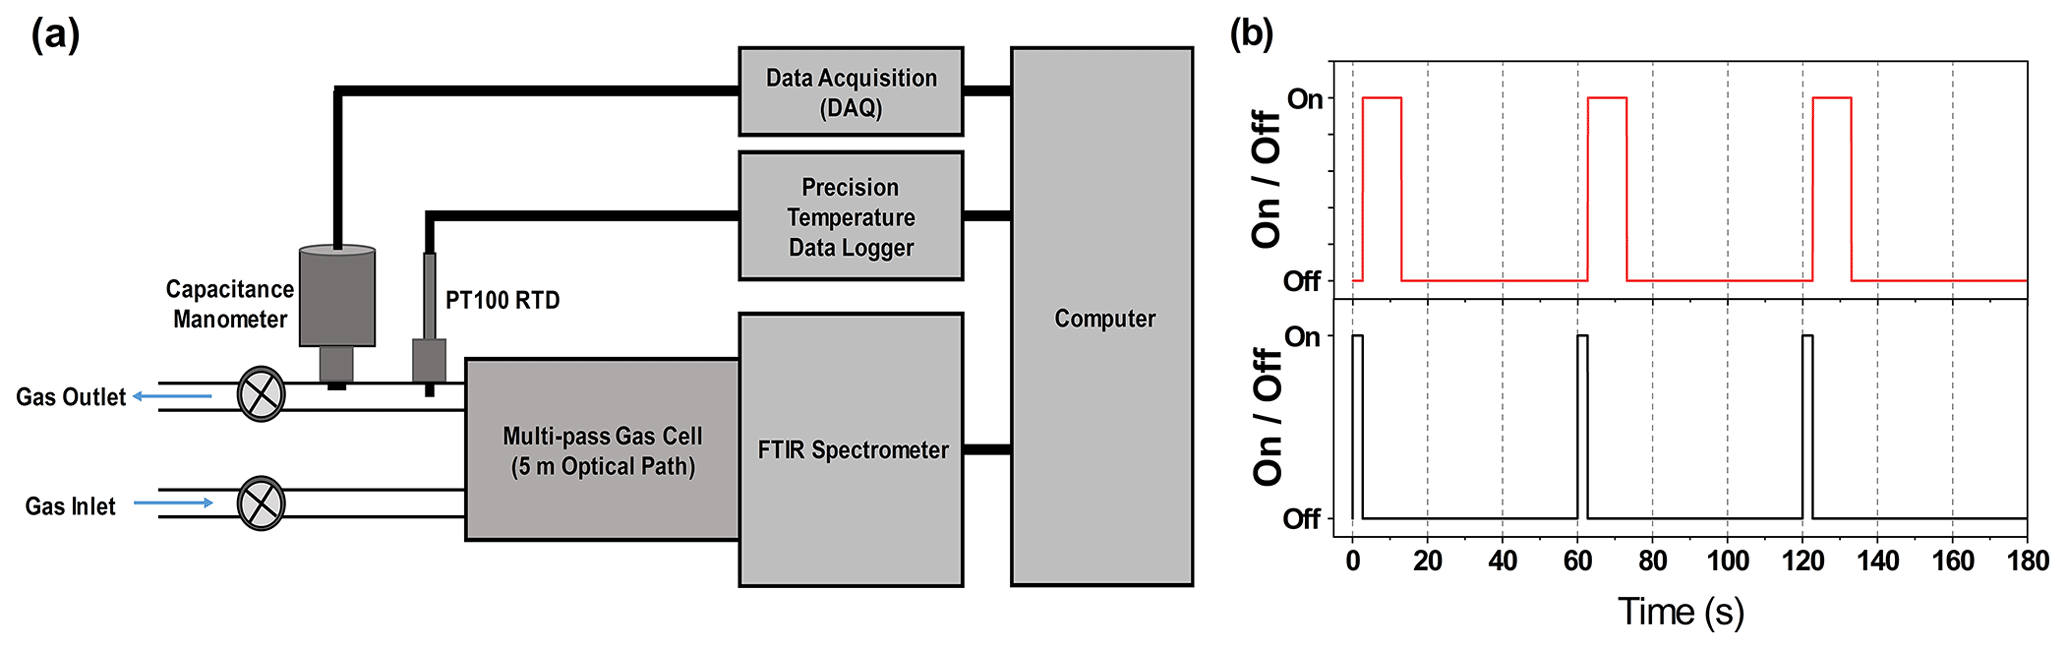
Figure 1Schematic representation of the experimental system and its measurement sequence. (a) Experimental setup consisting of an FTIR spectrometer, a capacitance manometer with data acquisition (DAQ), and a PT100 RTD sensor with temperature logging, all integrated and controlled via LabVIEW for synchronized measurement control. (b) Time sequence of the measurement cycle: each cycle begins with simultaneous pressure and temperature acquisition for 2.7 s (black solid line), followed by FTIR spectral acquisition for 10.3 s (red solid line, 16 scans averaged). The sequence then includes a 47 s idle period before the next cycle begins, resulting in one complete measurement cycle per minute. This protocol yields synchronized pressure, temperature, and infrared absorption spectra at 1 min intervals.
2.2 Gas Mixtures and Preparation Methods
Three certified gas mixtures, along with humid ambient air used to simulate realistic atmospheric conditions, are summarized in Table 1. Three certified gas mixtures, each contained in high-pressure cylinders, were used for the experiments. Humid ambient air drawn from outside the laboratory was introduced when required to simulate realistic atmospheric conditions. The first cylinder contained COF2 diluted in nitrogen (COF2/N2, 3.360×10³ µmol mol−1; Sole Materials Co., Ltd., Republic of Korea), which served as the primary sample for infrared measurements and enabled kinetic monitoring of COF2 decay for atmospheric lifetime determination. The COF2 mixture (3360±67 µmol mol−1, k=2) was prepared by diluting pure COF2 with high-purity N2, and its concentration was verified using the stoichiometric conversion reaction COF2+ O2→ CO2, calibrated against a certified CO2 reference gas (expanded uncertainty 2 %, k=2). The second cylinder held an NF3/N2 mixture (299.8±6.0 µmol mol−1, k=2), which was gravimetrically prepared and certified by the Korea Research Institute of Standards and Science (KRISS). Since NF3 is chemically stable under the experimental conditions, any observed changes in its spectral signature indicated physical leakage rather than chemical reaction. The third cylinder supplied rigorously dehydrated synthetic air (20.9±1.05 % O2 in N2, k=2; Air Liquide Korea Co., Ltd., Republic of Korea), which provided a moisture-free oxidizing matrix for isolating the O2-initiated degradation pathway of COF2. Humid ambient air was introduced at atmospheric pressure through a carbon-fiber inlet line fitted with a 2 µm mesh filter, providing a realistic atmospheric matrix containing both O2 and variable water vapor (approximately 41 %–45 % relative humidity (RH) at 25 °C). This carefully controlled gas environment enabled clear identification of the primary COF2 degradation pathways, driven by reactions with oxygen and water vapor, and provided a basis for estimating its atmospheric lifetime under conditions representative of the real atmosphere.
For the dry synthetic air experiment, the reaction cell was initially evacuated to the 10−1 Torr range and then filled with 8.18 Torr of COF2/N2 at 23.6 °C. Subsequently, 746.44 Torr of dehydrated synthetic air (N2: 79.1 %, O2: 20.9 %, H2O <2 ppm) was introduced to bring the system to atmospheric pressure. Under these anhydrous conditions, any observed decay of COF2 was attributed solely to oxygen-initiated reactions. Pressure and temperature remained stable within ±0.1 % over a 6 h period, confirming the integrity of the sealed system.
For the humid air experiment, ambient outdoor air, routed through a carbon-fiber inlet line fitted with a 2 µm mesh filter, was mixed with the COF2 and NF3/N2 gas mixture. Two separate experimental fills were conducted to assess the influence of daily variations in atmospheric conditions. In the first run (10:30), 15.55 Torr of COF2 and 40.12 Torr of NF3/N2 were combined with 754.19 Torr of ambient air at 25.7 °C and 44.3 % RH. In the second run (20:00), 15.17 Torr of COF2 and 40.23 Torr of NF3/N2 were combined with 753.18 Torr of ambient air at 24.9 °C and 41.8 % RH. The stability of the NF3 absorption signal confirmed that changes in COF2 concentration originated from chemical degradation rather than system leakage. Ambient outdoor conditions were measured and recorded using a LUTRON MHB-382SD humidity, temperature, and barometric pressure meter.
Table 1Composition and intended purpose of gas samples. Concentration values are reported with expanded uncertainties (coverage factor k=2, corresponding to approximately 95 % confidence).
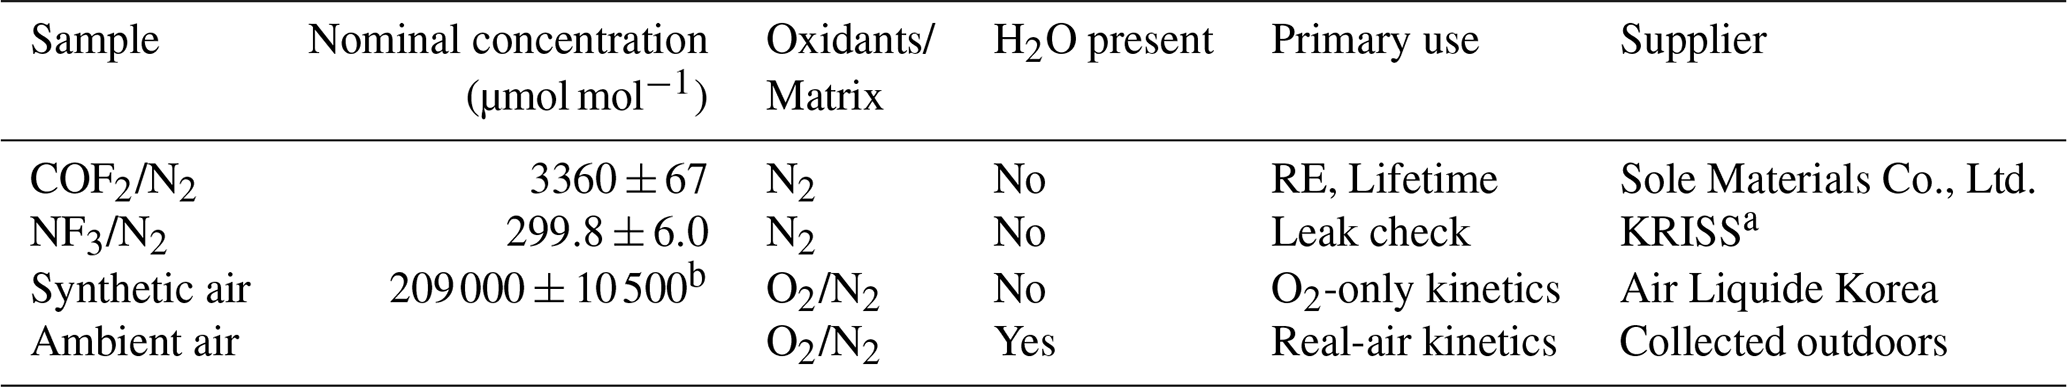
a Korea Research Institute of Standards and Science. b Uncertainty estimated from supplier specifications; oxygen content of synthetic air: 20.9±1.05 % (k=2).
2.3 GWP Framework: Radiative Efficiency and Atmospheric Lifetime
In this study, the GWP100 of COF2 was evaluated using the absolute GWP (AGWP) formulation adopted in recent climate assessments (Hodnebrog et al., 2013; Myhre et al., 2013; Hodnebrog et al., 2020). GWP is defined as the ratio of the time-integrated radiative forcing from a 1 kg pulse emission of gas i at time t=0 to that from an equivalent 1 kg emission of CO2 over a chosen time horizon H:
For a non-CO2 gas with a single dominant atmospheric sink, the radiative forcing following a pulse emission is well described by an exponential decay, and the AGWPi is expressed as:
where REi (W m−2 kg−1) denotes the radiative efficiency of gas i per unit mass emission, τi (years) is its atmospheric lifetime, and H=100 years is the time horizon used in this work. The reference AGWP(100) for CO2 used in this study is W m−2 yr kg−1 (Smith et al., 2021), which serves as the denominator in Eq. (1). GWP100 is obtained by calculating AGWPi(100) from the REi and the τi using Eq. (2) and normalizing the result by the reference AGWP(100) via Eq. (1).
To calculate RE, the absorption cross-section (ACS) spectrum is first obtained from either experimental measurements or theoretical calculations. The ACS describes how strongly a molecule absorbs infrared radiation at each wavenumber and is therefore the fundamental quantity from which RE is derived. To obtain the ACS from FTIR measurements, the recorded transmittance spectra are converted into molecular absorption cross sections using a formulation based on the Beer–Lambert law combined with the ideal gas law (Harrison, 2015, 2020). The ACS at a given wavenumber , denoted as , is calculated as:
where T is the absolute temperature (K), kB is the Boltzmann constant ( Pa m3 K−1), is the measured spectral transmittance, PTotal is the total pressure (Pa), and L is the optical path length (cm). The term xi denotes the mole fraction of COF2 in the gas mixture, so that xi⋅PTotal corresponds to the partial pressure of gas i appearing explicitly in the denominator of Eq. (3). The factor 104 accounts for the unit conversion and ensures that is expressed in cm2 molec.−1. This formulation enables direct determination of ACS spectra from experimental transmittance data by linking macroscopic observables to molecular-scale absorption.
RE was obtained by multiplying the ACS and the Pinnock-curve value at each wavenumber grid point and summing the products over the infrared domain (Pinnock et al., 1995; Elrod, 1999; Hodnebrog et al., 2013, 2020; Shine and Myhre, 2020). The present work employs the stratospheric-adjusted Pinnock curve developed by Shine and Myhre (2020). Using a uniform 10 cm−1 wavenumber grid, RE is calculated as:
where σi is the absorption cross section at grid point i (cm2 molec.−1), Fi is the value of the stratospheric adjusted Pinnock curve at wavenumber i (W m−2 cm), and cm−1 is the constant wavenumber spacing. The summation is performed over the spectral range 0–3000 cm−1.
The atmospheric lifetime τi is defined as the e-folding time over which the atmospheric burden of species i decreases after emission, following an exponential decay of the form . Lifetimes are controlled by a combination of chemical and physical loss processes, including stratospheric photolysis, reaction with tropospheric hydroxyl radicals (⋅ OH), hydrolysis in the presence of water vapor, dry and wet deposition. Because the RE calculation implicitly assumes that the gas is uniformly mixed in the atmosphere, species with short lifetimes or strong spatial gradients require a lifetime dependent correction to account for their limited vertical and horizontal distribution. Practical parameterizations for applying such corrections have been developed, including separate formulations for compounds removed predominantly by stratospheric photolysis and those removed primarily through reaction with tropospheric ⋅ OH (Hodnebrog et al., 2013, 2020).
COF2 is expected to have a very short atmospheric lifetime (τ≪1 year), as its removal is governed primarily by rapid hydrolysis in the presence of water vapor rather than by stratospheric photolysis or reaction with ⋅ OH. Because such rapid and surface-confined removal prevents COF2 from attaining a well-mixed atmospheric distribution, a lifetime-dependent correction to the RE must be applied to ensure consistency with established GWP metric formulations. Accordingly, a fractional correction factor f(τ) was used in this study to adjust the RE prior to computing GWP100, employing the ⋅ OH-type parameterisation (Hodnebrog et al., 2013, 2020):
which is recommended for compounds degraded mainly by tropospheric ⋅ OH and is valid for 10 years. Although COF2 is removed predominantly through hydrolysis under humid conditions rather than by ⋅ OH oxidation, this parameterisation represents the closest internally consistent approach currently available for treating short-lived fluorinated species within the GWP framework. Because neglecting the lifetime correction would otherwise lead to an overestimate of the RE and thus the GWP, applying this correction provides a more appropriate representation of the limited atmospheric influence of COF2. It should be noted, however, that lifetime corrections for very short-lived compounds involve elevated uncertainty, as the effective atmospheric removal of such species is governed strongly by local humidity, boundary-layer dynamics, and emission location rather than by global-scale mixing.
3.1 Absorption Cross-Section (ACS)
The ACS spectrum of COF2 was derived from the measured FTIR transmittance spectrum using the Beer–Lambert law combined with the ideal gas law, incorporating pressure (40.244 Torr) and temperature (296.77 K) values recorded synchronously during each acquisition (Fig. 2a-lower frame). For RE calculations, the ACS data were averaged onto a 10 cm−1 grid so that the wavenumber spacing matches that of the stratospheric-adjusted Pinnock curve used in the RE integration. Because the FTIR detector responds over 650–4000 cm−1 and the stratospheric-adjusted Pinnock curve is defined up to 3000 cm−1, the RE-relevant ACS spectrum spans 650–3000 cm−1. The processed ACS spectrum exhibits smooth, physically consistent line shapes across all vibrational bands, indicating the absence of detector saturation or nonlinear optical artifacts. Four dominant infrared absorption features are identified, consisting of a strong band near 1935 cm−1, intense bands at 1245 and 965 cm−1, and a well-defined feature at 775 cm−1.
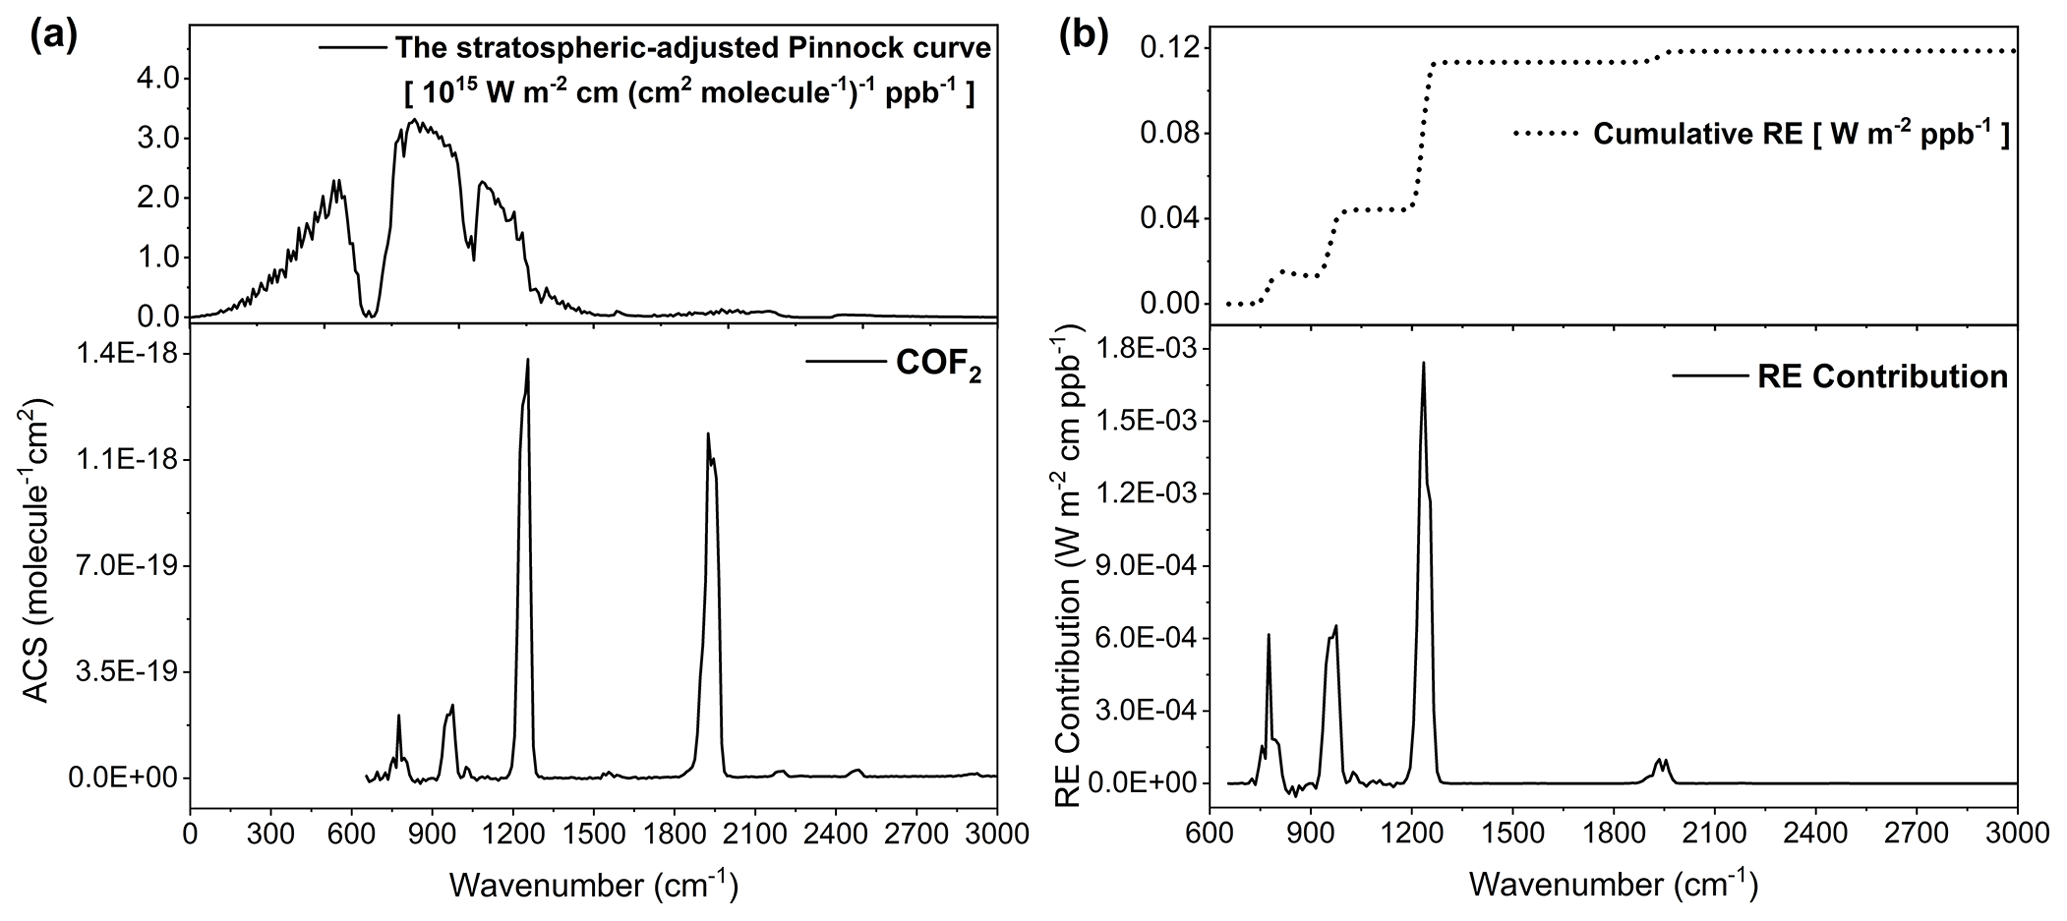
Figure 2Framework for calculating the radiative efficiency (RE) of carbonyl fluoride (COF2) from its infrared absorption characteristics and the stratospheric-adjusted Pinnock curve. (a) The down-frame shows the infrared absorption cross-section (ACS) spectrum of COF2, while the up-frame presents the stratospheric-adjusted Pinnock curve (Shine and Myhre, 2020). The ACS spectrum was obtained under a single laboratory condition of 296.77 K and 40.244 Torr. (b) The down-frame displays the RE contribution spectrum, computed as the pointwise product of the COF2 ACS and the stratospheric-adjusted Pinnock curve according to Eq. (4). The up-frame shows the cumulative RE obtained by integrating the RE contribution across the wavenumber domain, yielding a final RE value of 0.119 W m−2 ppb−1.
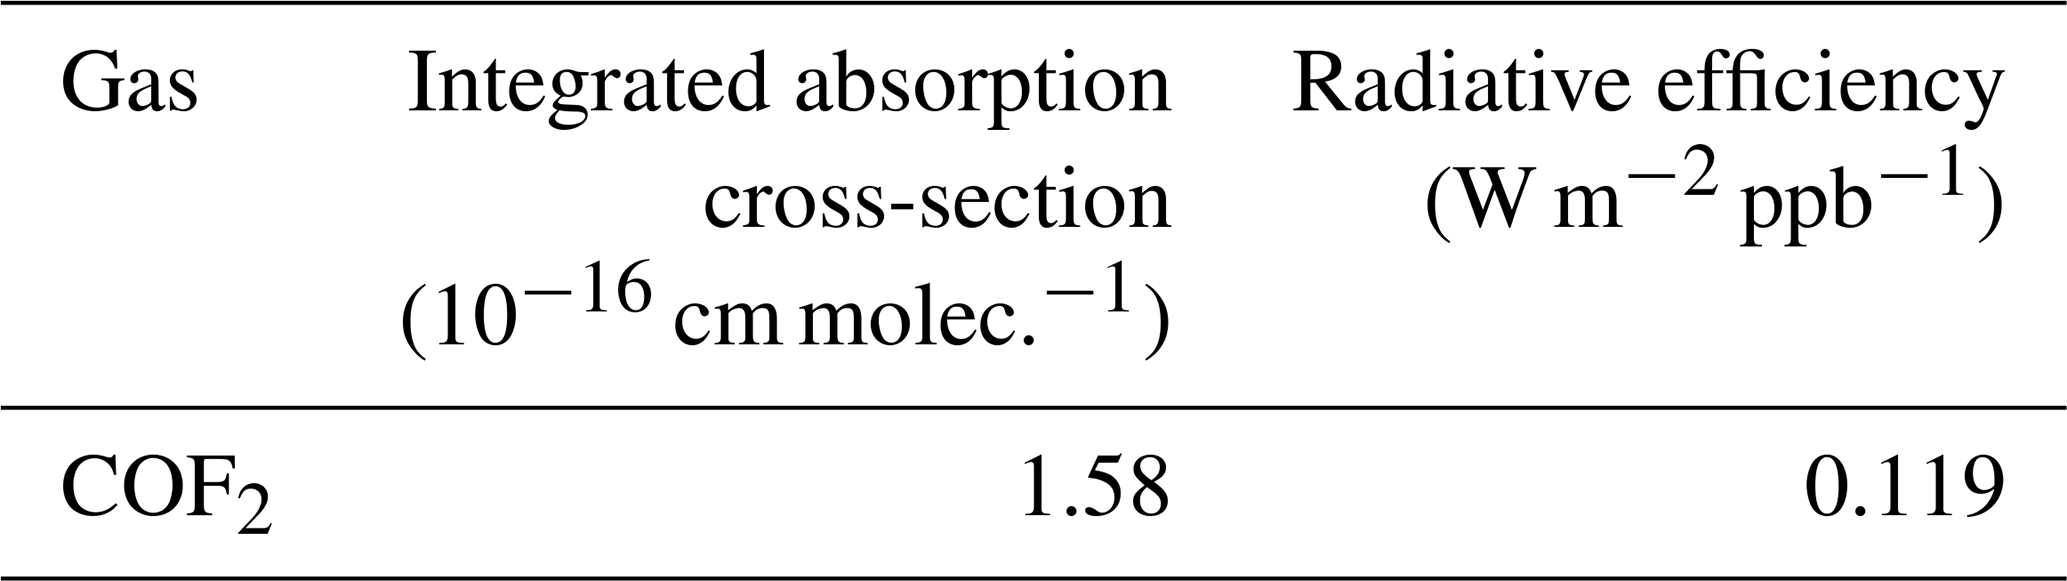
Integrated over the 0–3000 cm−1 interval (with the effective measurement domain being 650–3000 cm−1), the ACS spectrum yields an integrated value of cm molec.−1 (Table 2). This value shows close agreement with the integrated ACS of cm molec.−1 reported by Hodnebrog et al. (2020) and Thornhill et al. (2024), who used the PNNL experimental spectrum, differing by only about 2 %. The small positive bias in the present result is attributable to a slightly elevated spectral baseline in regions where discrete absorption lines are absent, an effect inherent to FTIR measurements. In contrast, integration of the ACS derived from the line-by-line parameters for COF2, identified as Gas ID 29 in the HITRAN database (Gordon et al., 2026), yields a substantially lower value of cm molec.−1, reflecting differences between the HITRAN-based result and the experimentally derived spectra.
To investigate the origin of the discrepancy between the experimentally derived integrated absorption cross-sections and those obtained from the HITRAN line-by-line parameters, the COF2 spectrum was decomposed into four infrared bands represented in the HITRAN database: 695–865, 925–995, 1175–1305, and 1845–2005 cm−1 (Fig. S2 and Table S1 in the Supplement). A band-resolved comparison with the PNNL experimental spectrum and the present FTIR measurements shows good agreement across datasets for Band 1 (695–865 cm−1), with negligible differences between HITRAN and the experimental results. Band 2 (925–995 cm−1) shows a moderate difference, while Band 4 (1845–2005 cm−1) contributes secondarily to the overall discrepancy.
In contrast, Band 3 (1175–1305 cm−1) exhibits the most pronounced difference, with the HITRAN-based integrated absorption being approximately 18 %–19 % lower than both the PNNL spectrum and the present measurements. Together with Band 4, which shows a comparable relative difference of approximately 17 %–18 %, the underestimation in these higher-intensity bands dominates the overall discrepancy in the integrated absorption cross-section. These results indicate that the discrepancy is band-specific for COF2, arising primarily from differences observed in the representation of the 1175–1305 and 1845–2005 cm−1 bands between the experimentally derived spectra and the HITRAN line-by-line data, rather than reflecting a general limitation of line-by-line methodologies.
Table 2The integrated absorption cross-section of COF2 in the 0–3000 cm−1 spectral interval and its radiative efficiency.
3.2 Radiative Efficiency (RE)
The RE of COF2 was evaluated by multiplying the ACS with the stratospheric-adjusted Pinnock curve at each 10 cm−1 wavenumber grid point and summing the products over the infrared spectral domain (Eq. 4). The stratospheric-adjusted Pinnock curve provides a physically consistent weighting function, representing the radiative forcing response of a weak, uniformly distributed absorber while incorporating the effects of stratospheric temperature adjustment (Fig. 2a, upper frame). Figure 2a also presents the measured ACS spectrum of COF2 (lower frame) and the stratospheric-adjusted Pinnock curve (upper frame). The spectral overlap between the COF2 absorption features and the Pinnock curve highlights the wavenumber regions that contribute most effectively to radiative forcing. To quantify this relationship, the pointwise product of the ACS and the Pinnock-curve value was calculated, yielding the spectral RE-contribution distribution shown in Fig. 2b (lower frame).
The RE-contribution spectrum reveals that the dominant contributions arise within the 700–1300 cm−1 interval (Fig. 2b, lower frame), where several strong COF2 absorption bands coincide with effective Pinnock-curve weighting. Within this region, three distinct absorption bands produce a stepwise increase in the cumulative RE, with each band contributing incrementally to the total radiative forcing. This behavior is reflected in the cumulative RE curve shown in Fig. 2b (upper frame), which increases sharply through three successive steps across this interval and then levels off above approximately 1300 cm−1, indicating that most of the radiative forcing impact of COF2 is captured within this spectral range. An additional increase in the cumulative RE is observed near 1935 cm−1. However, despite the high absorption intensity of this band in the ACS spectrum, its contribution to the total RE remains modest because the Pinnock-curve weighting is substantially lower at higher wavenumbers.
Integration of the weighted ACS over the 0–3000 cm−1 interval yields a total RE of 0.119 W m−2 ppb−1 (Table 2). This value is 3.3 % lower than the value of 0.123 W m−2 ppb−1 reported by Hodnebrog et al. (2020) and 5.6 % lower than the value of 0.126 W m−2 ppb−1 reported by Thornhill et al. (2024), both derived from the PNNL experimental spectrum. The difference primarily reflects the narrower valid spectral range of the present FTIR measurements (650–3000 cm−1), which excludes the 550–650 cm−1 region where minor absorption features contribute to radiative forcing. When the literature RE values are recalculated over the same restricted spectral domain, the discrepancy decreases to approximately 1 %, demonstrating close consistency between the datasets.
3.3 Atmospheric Lifetime
Understanding the atmospheric removal mechanisms of COF2 is essential for accurately estimating its atmospheric lifetime and GWP. In the troposphere, COF2 can be removed via oxidation by molecular oxygen (O2) and hydrolysis by water vapor (H2O), with the latter generally expected to dominate under humid conditions. To distinguish between two pathways, experiments were conducted under two contrasting atmospheric conditions: (i) a dried synthetic air mixture containing O2 with H2O below 2 ppm and (ii) ambient outdoor air containing O2 along with typical atmospheric water vapor concentrations. The dried synthetic air experiments provided a reference kinetic profile for O2-only oxidation, whereas the humid air experiments quantified the enhancement in COF2 loss attributable to hydrolysis. Scheme 1 summarizes the atmospheric removal pathways of COF2 considered in this study. Gas-phase hydrolysis with water vapor, yielding CO2 and HF, has been investigated mainly through theoretical studies, which indicate that COF2 is likely to undergo rapid hydrolysis under humid conditions (Francisco, 1993; Uchimaru et al., 2004; Zachariah et al., 1995). In addition, oxidative loss involving O2 is chemically plausible and may contribute to COF2 removal under dry or near-anhydrous conditions. This pathway is therefore included as a comparative reference, enabling quantitative assessment of the contribution of moisture-driven hydrolysis to COF2 removal and its resulting atmospheric lifetime.
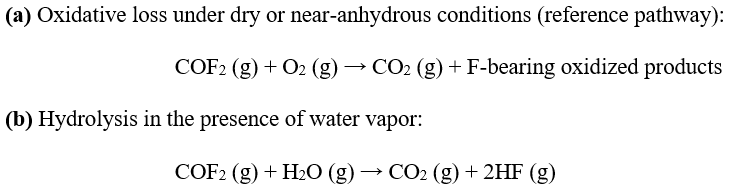
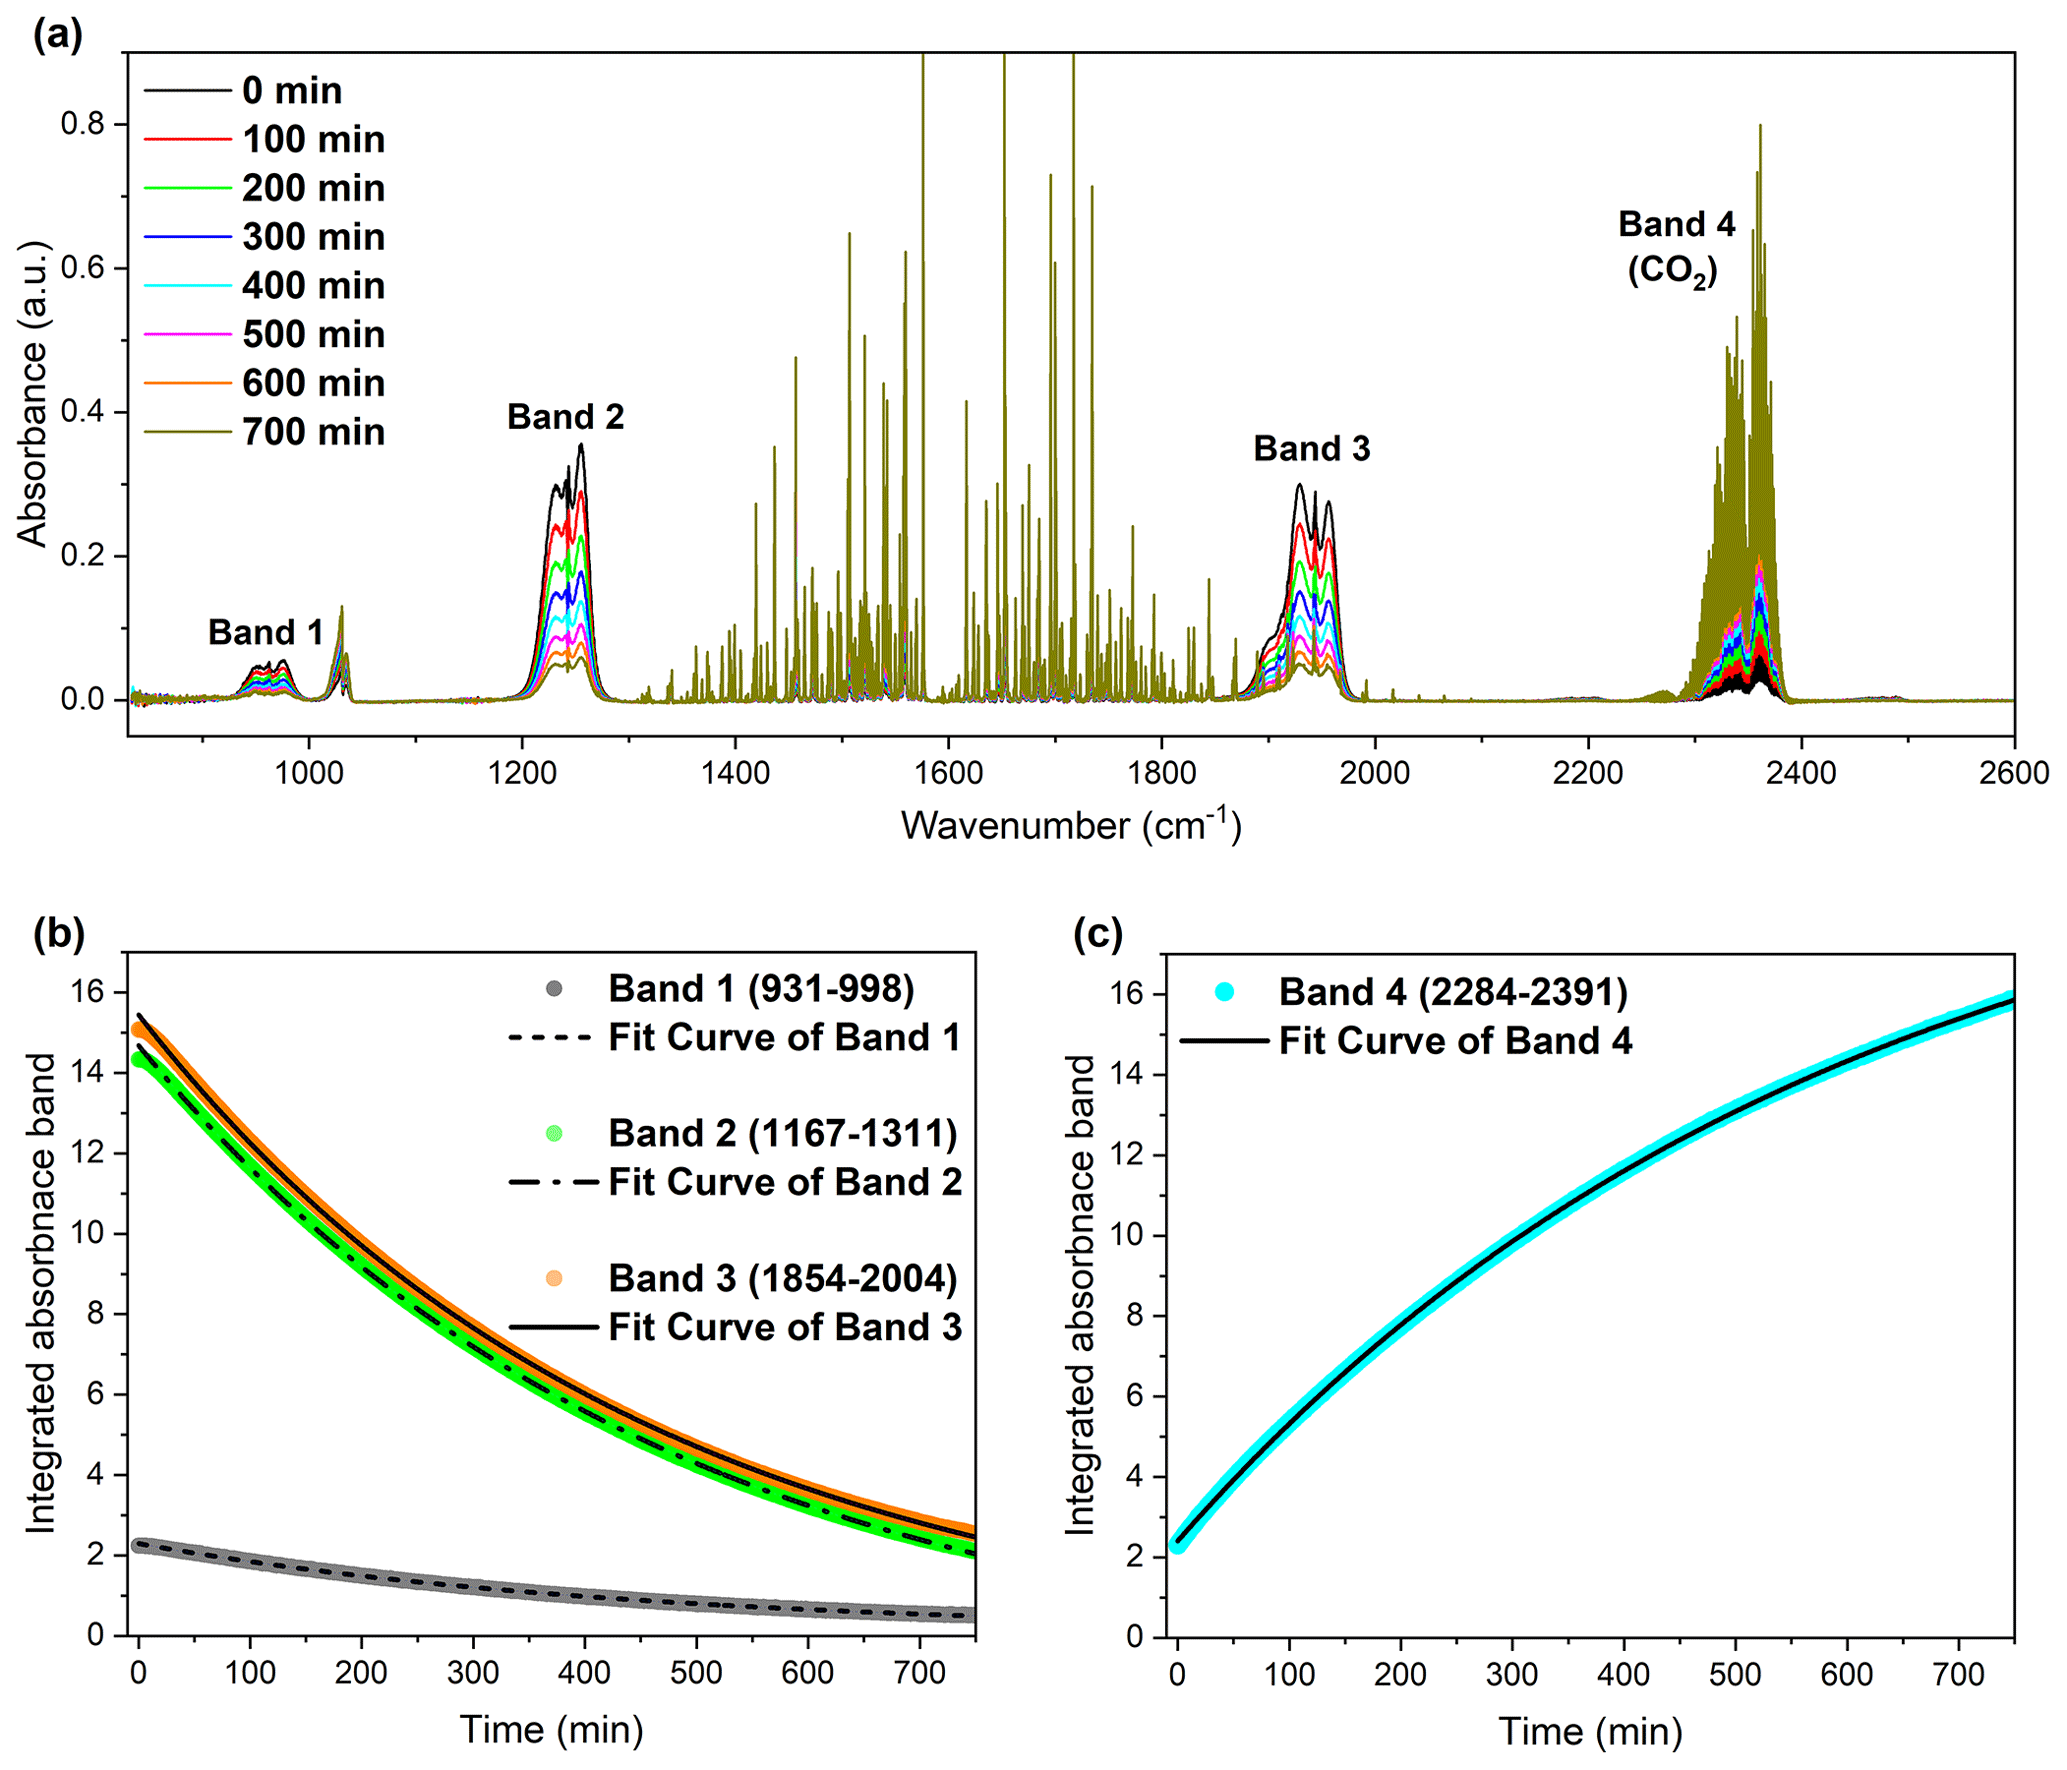
Figure 3Infrared spectroscopic analysis of the reaction between carbonyl fluoride (COF2) and molecular oxygen (O2), showing both the depletion of COF2 and the formation of CO2 over time. (a) Time-resolved infrared absorbance spectra of COF2 during its reaction with O2, showing the gradual decay of COF2 and concurrent increase in CO2 absorption features. Spectra were recorded at 100 min intervals up to 700 min. (b) Integrated absorbance of COF2 bands (Band 1: 931–998, Band 2: 1167–1311, Band 3: 1854–2004 cm−1) as a function of time, illustrating the exponential decay of COF2. (c) Integrated absorbance of the CO2 band (Band 4: 2284–2391 cm−1), indicating the formation and accumulation of CO2 over time.
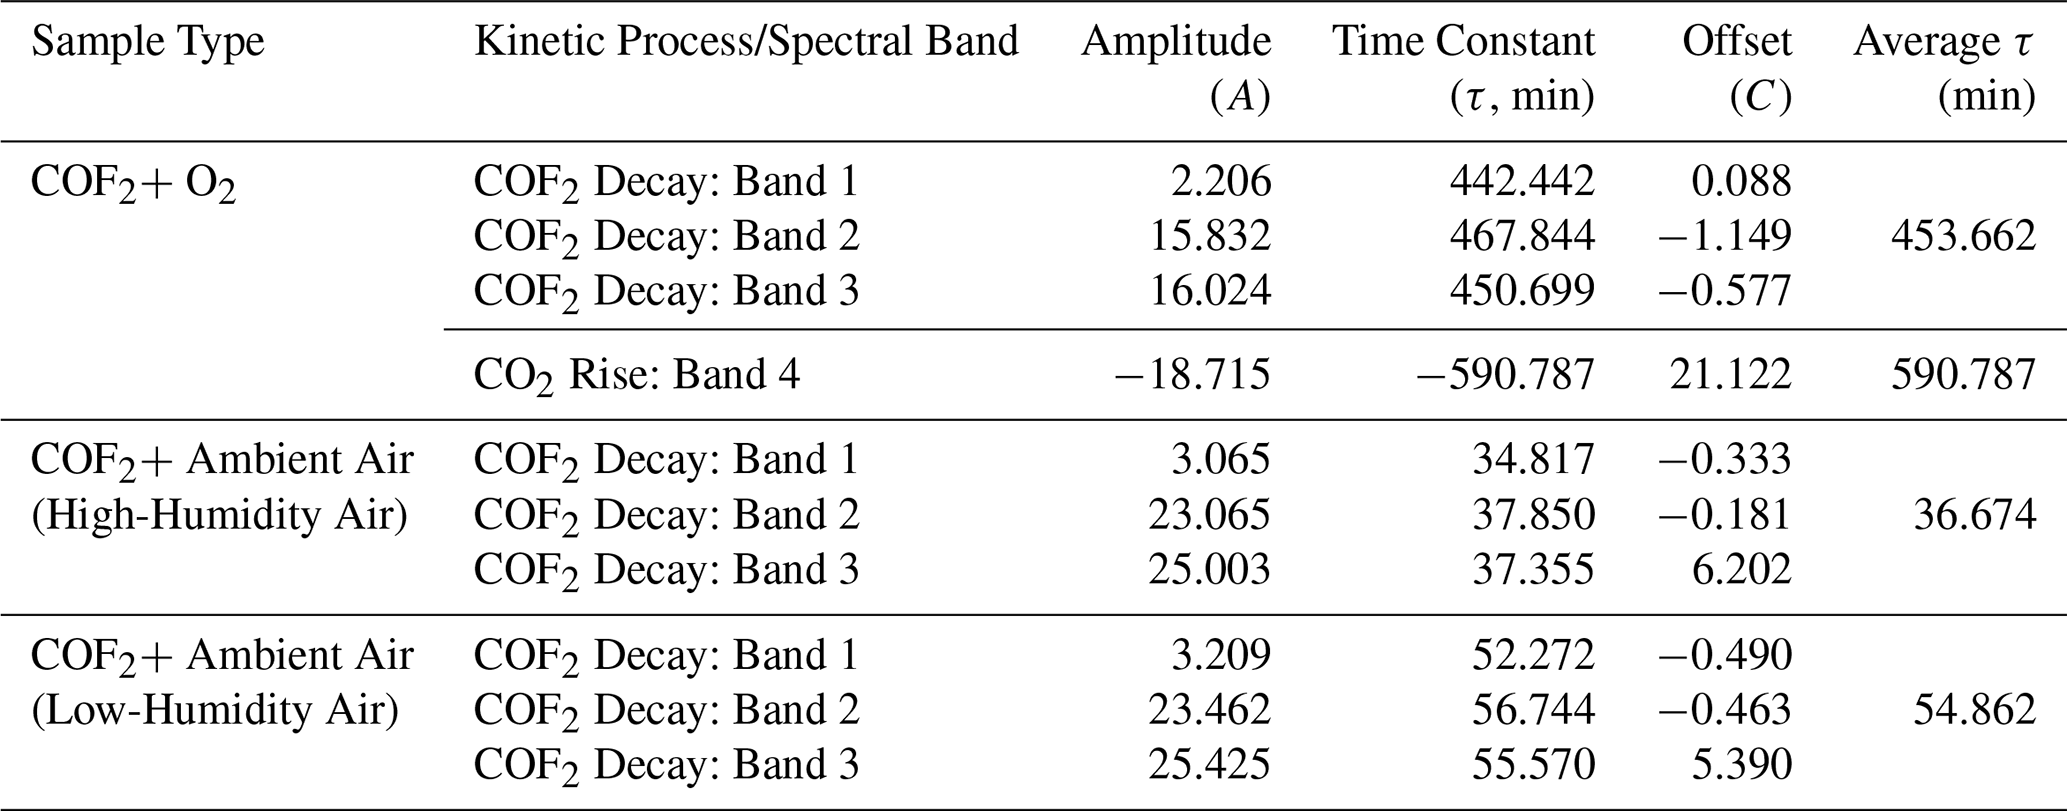
The primary objective of the COF2+ O2 experiments in dried synthetic air was to establish a baseline reaction profile under controlled, water-free conditions. This approach isolates the oxidative pathway involving O2, enabling direct comparison with real atmospheric mixtures containing multiple reactive species. The time-resolved FTIR spectra (Fig. 3a) showed the progressive decay of COF2 absorption bands alongside the concurrent growth of CO2 features during oxidation. Integrated absorbance profiles for the COF2 bands (Band 1: 931–998 cm−1; Band 2: 1167–1311 cm−1; Band 3: 1854–2004 cm−1) followed exponential decay trends (Fig. 3b), while the CO2 band (Band 4: 2284–2391 cm−1) exhibited exponential growth (Fig. 3c). The fitted time constants (τ), summarized in Table 3, yielded average values of 453.66 min for COF2 decay and 590.79 min for CO2 production, indicating a direct kinetic linkage between the two processes. These results correspond to an atmospheric lifetime of 7.56 h for COF2 under dry synthetic air conditions, where the dominant oxidative pathway is reaction with O2 and the principal product is CO2. The slight difference between the decay rate of COF2 and the growth rate of CO2 suggests the formation of intermediate species during the COF2–O2 reaction. However, the quantity of such intermediates is likely below the detection limit of the FTIR spectrometer used, reflecting both their low abundance and inherent instability. These O2-only kinetics provide a baseline reference for assessing the role of water vapor in subsequent experiments. The small water-related absorption features observed near 1400–1900 cm−1 in Fig. 3a are most likely attributable to trace water vapor. Although the dehydrated synthetic air contained less than 2 ppm of H2O, the reaction cell was filled to near atmospheric pressure, meaning that the absolute number of water molecules present was still sufficient to produce weak but detectable absorption bands in the FTIR spectrum.
Table 3Exponential fitting parameters for the decay of COF2 or increase of CO2 under various atmospheric conditions. Each entry corresponds to a specific vibrational band, with parameters obtained from fitting the time-resolved data to the function . COF2–Ambient Air (Morning)” and “COF2–Ambient Air (Afternoon)” indicate experiments conducted during different times of the day to reflect ambient variation. The time constant (τ) represents the characteristic time of the exponential process, and the average τ was calculated across all bands within each sample type.
The ambient air experiments were designed to evaluate COF2 removal under realistic atmospheric conditions and quantify the relative contribution of hydrolysis. Ambient air contains, in addition to oxygen and nitrogen, water vapor, argon, and other trace-level gases. The sampling location did not have any unusual atmospheric characteristics; therefore, the air composition is considered representative of typical outdoor conditions. Two time-separated fills were performed to assess the effect of daily variations in atmospheric parameters. Morning (10:30) and evening (20:00) trials on the same day leveraged differences in relative humidity to probe the sensitivity of COF2 degradation to the water vapor content. Comparative results (Fig. 4) showed that COF2 decays significantly faster under higher humidity in the morning (Fig. 4a, b) than under the lower humidity in the evening (Fig. 4c, d). As summarized in Table 3, the average τ in the morning (36.67 min) was markedly shorter than that in the evening (54.86 min). This accelerated removal in humid air was consistent with the hydrolysis pathway, in which H2O reacted with COF2 more rapidly and dominantly than O2. NF3 was introduced into the reaction cell as an inert indicator gas to verify system airtightness. No change was observed in the NF3 absorption bands during the experiments (Fig. 4a, c), confirming that the reaction cell remained sealed with no exchange of gases with the external environment.
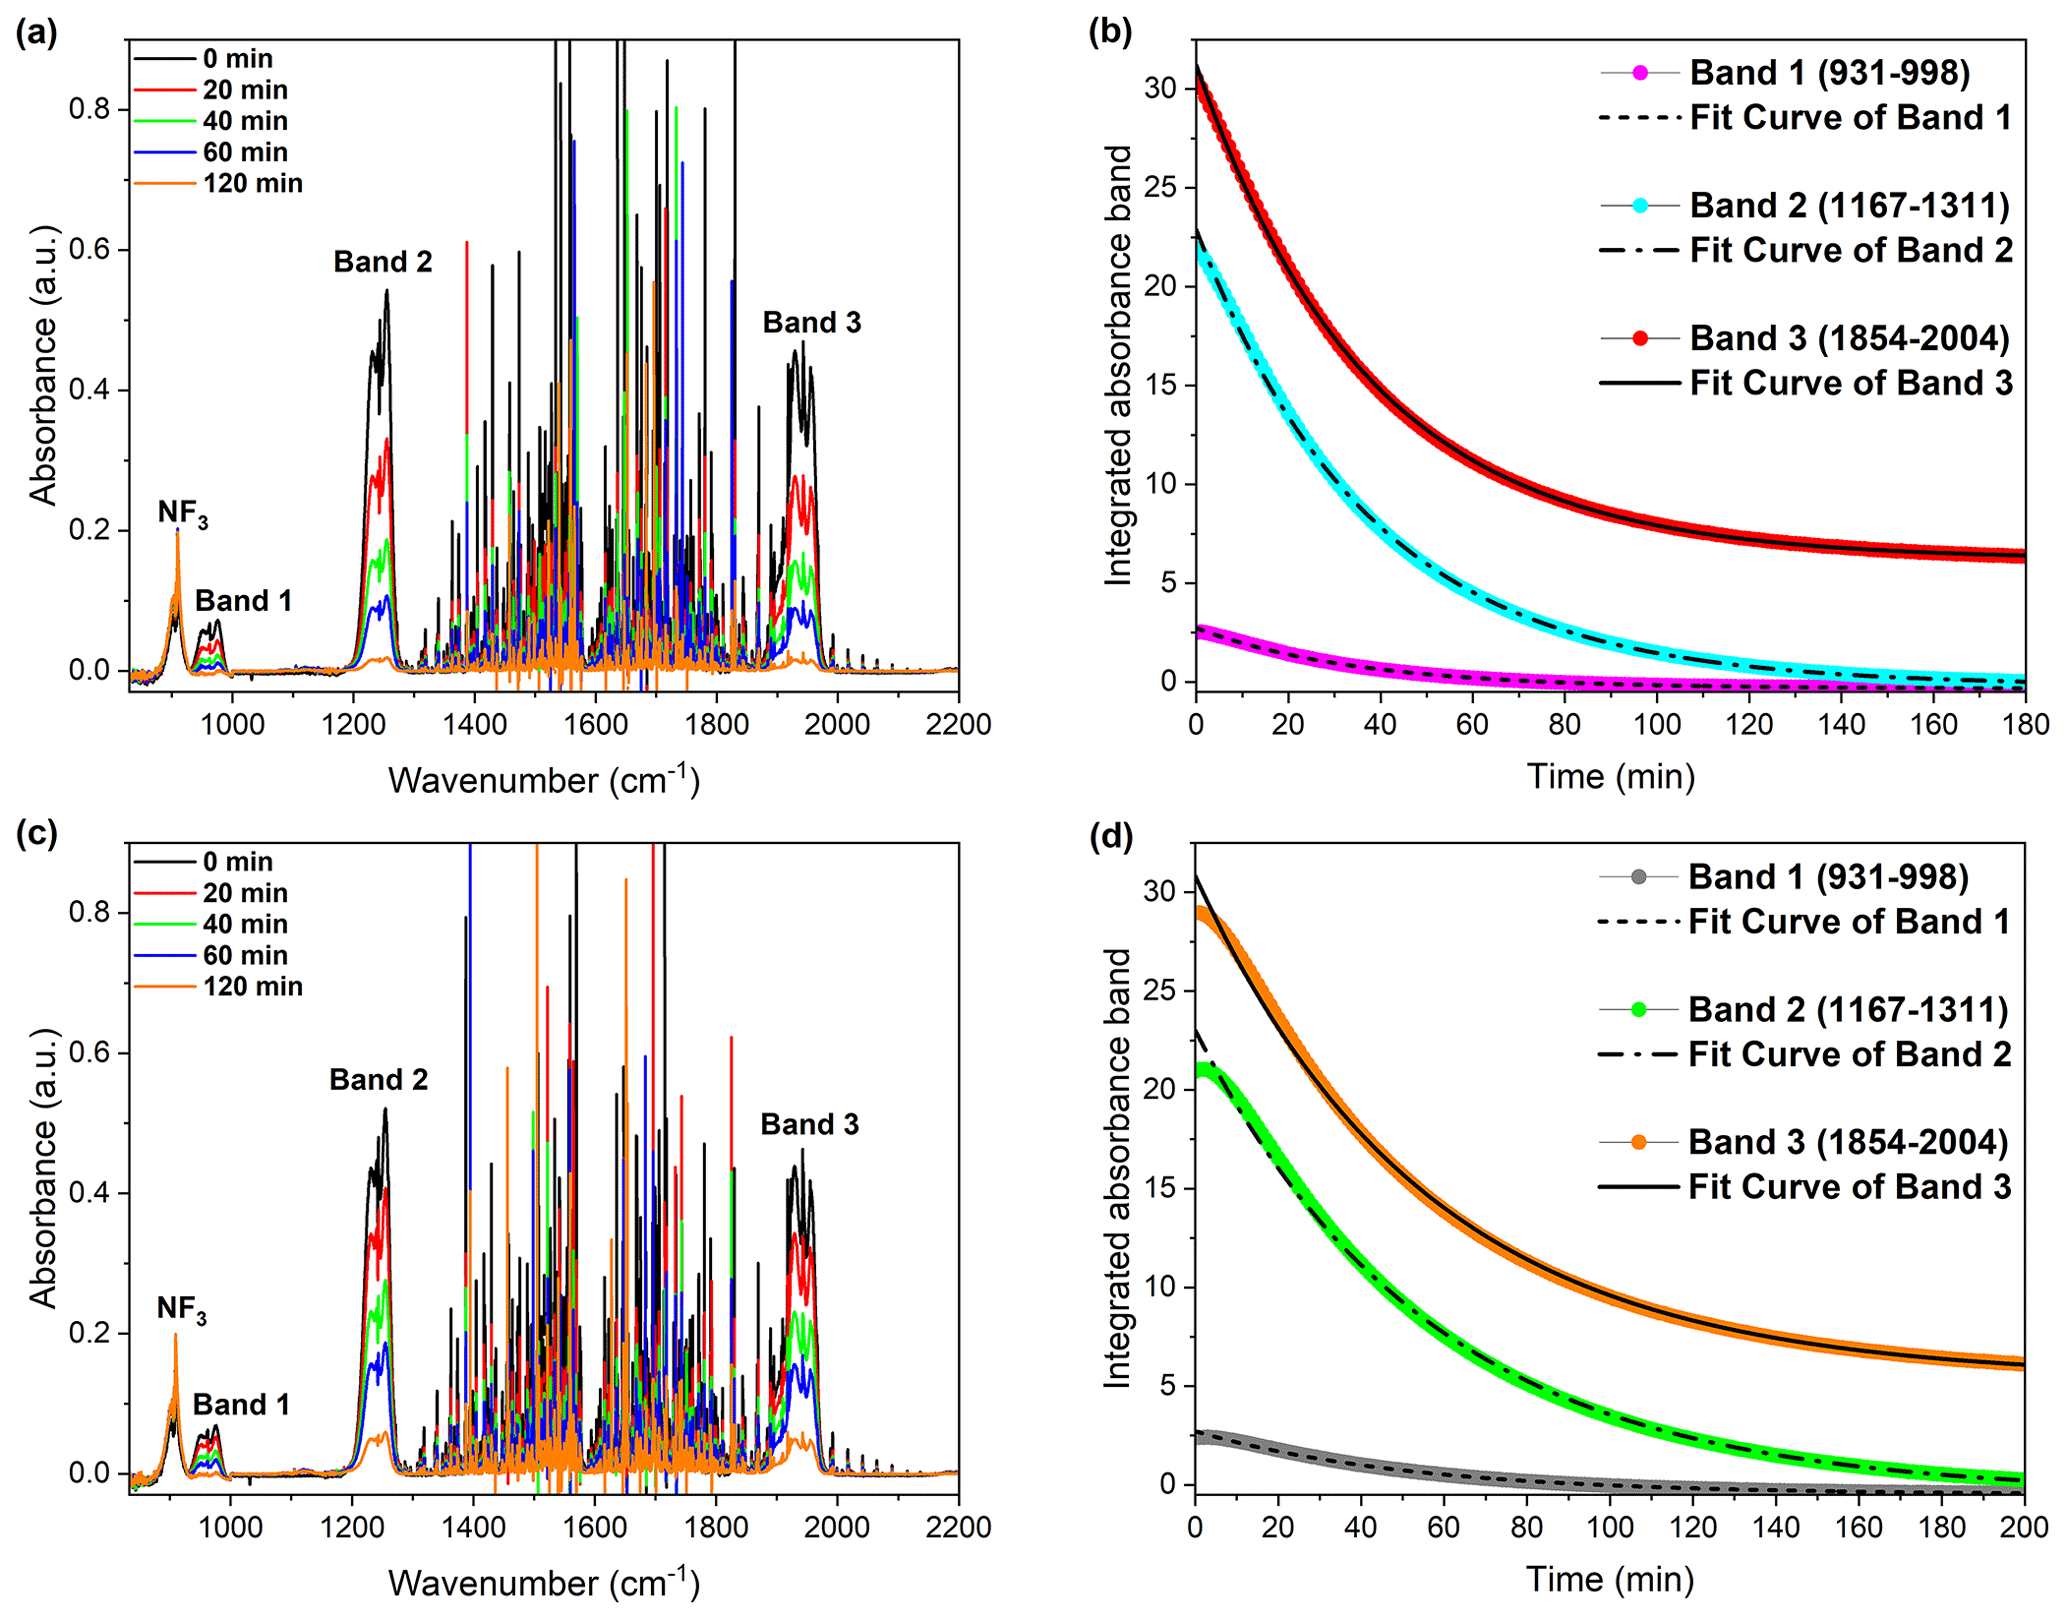
Figure 4Atmospheric degradation behavior of COF2 under ambient air conditions, illustrating the influence of atmospheric moisture on the reaction kinetics. (a, b) Spectral and kinetic analysis of COF2 decay measured in the morning, when the relative humidity was higher. (a) Time-resolved FTIR absorbance spectra showing the decay of COF2 features. (b) Integrated absorbance of three representative COF2 bands (Band 1: 931–998, Band 2: 1167–1311, Band 3: 1854–2004 cm−1) and corresponding exponential decay fits. (c, d) Measurements taken in the afternoon under relatively lower humidity conditions. (c) Time-resolved spectra showing slower spectral decay. (d) Kinetic profiles of the same COF2 bands as in (b) but highlighting the slower decay under drier atmospheric conditions. These results confirm that the presence of higher ambient moisture accelerates the degradation of COF2 in air. (a, c) Water-vapor–corrected FTIR spectra were obtained by subtracting a background recorded under (a) higher-humidity morning conditions and (c) lower-humidity afternoon conditions; see Supplement for acquisition and subtraction details (Figs. S3–S4).
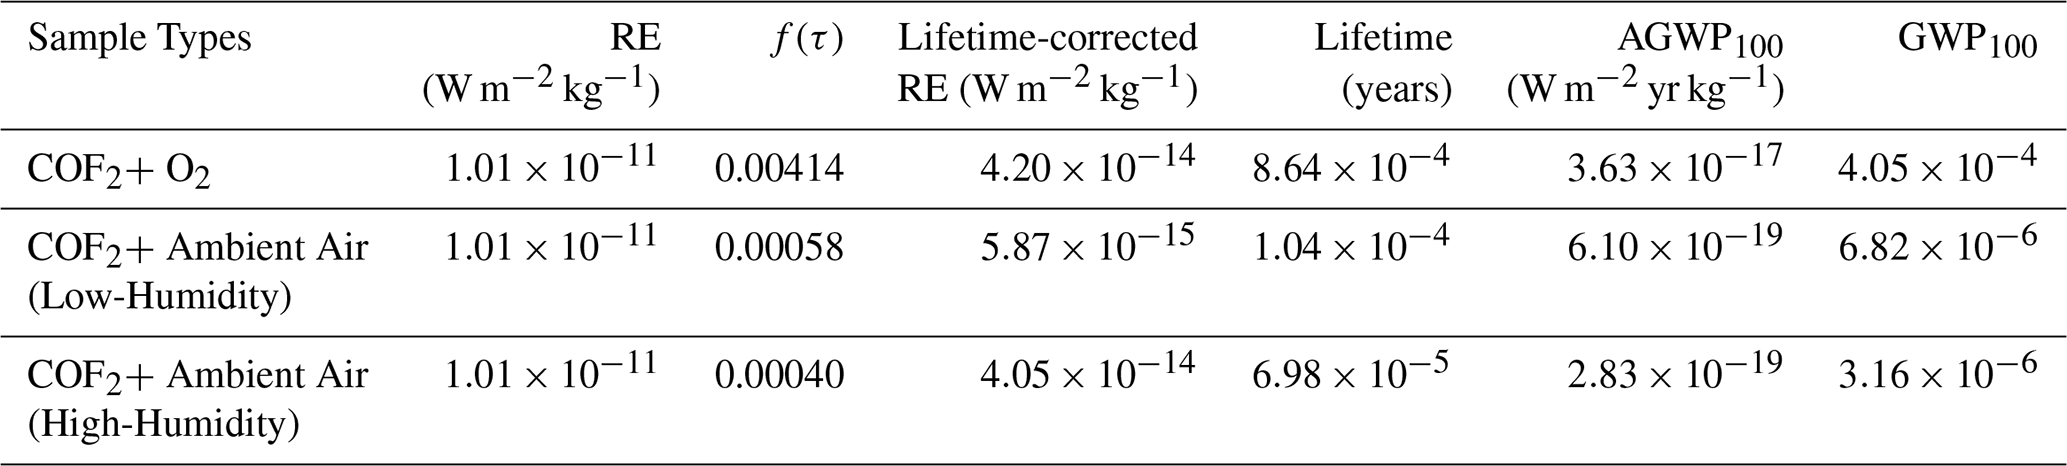
Table 4Radiative efficiency (RE), lifetime-corrected RE, experimentally determined atmospheric lifetimes, AGWP100, and resulting GWP100 values for COF2 under different reaction conditions. The lifetime correction factor f(τ) was applied to RE following Hodnebrog et al. (2013, 2020) (Eq. 5). Corrected RE values were integrated over a 100-year horizon to obtain AGWP100, which was then normalized by the reference AGWP100 for CO2 ( W m−2 yr kg−1) to compute GWP100 (Eq. 1). COF2 decay was examined under three atmospheric conditions: a dry O2 environment (Relative Humidity (RH) <0.007 %, 23.9 °C), and two ambient-air conditions representing high humidity (44.3 % RH, 10.6 g m−3, 25.7 °C) and low humidity (41.8 % RH, 9.6 g m−3, 24.9 °C). These controlled humidity levels enabled assessment of moisture-driven COF2 removal.
Direct comparisons between the O2-only and ambient air experiments confirmed the experimental objective of separating and quantifying the roles of major atmospheric oxidants in COF2 degradation. The results clearly indicate that hydrolysis with H2O proceeded faster and was more dominant than oxidation by O2. In the actual atmosphere, ⋅ OH – another potential oxidant – were present at concentrations of ∼106 molec. cm−3 during daylight hours, although these levels were still several orders of magnitude lower than those of water vapor or oxygen (Seinfeld and Pandis, 2006). Furthermore, the reactivity of COF2 toward H2O and O2, combined with their much higher atmospheric abundances, rendered the ⋅ OH pathway negligible in comparison. Therefore, hydrolysis overwhelmingly governed the atmospheric removal rate of COF2, with O2 oxidation playing a secondary role.
3.4 Uncertainties
The uncertainties in the ACS were evaluated by propagating the uncertainties of all input quantities appearing in Eq. (3), including total pressure, temperature, optical path length, the COF2 mole fraction, and FTIR transmittance. The experimental precision of pressure, temperature, optical path length, and mole fraction was determined from repeated measurements, yielding relative uncertainties of 0.0047 %, 0.059 %, 0.27 %, and 1.0 %, respectively. The relative uncertainty in transmittance, 0.63 %, was instead estimated from the baseline noise of the FTIR spectra, which reflects random instrumental fluctuations and therefore provides a representative measure of spectral measurement precision. The combined standard uncertainty of the ACS was obtained by analytical uncertainty propagation, resulting in a combined relative standard uncertainty of approximately 2.1 %, which corresponds to an expanded relative standard uncertainty of 4.2 % with a coverage factor of k=2 (Table S2). Overall, the uncertainty budget is dominated by contributions from the COF2 mole fraction and FTIR spectral noise, while all other sources play a minor role. This level of uncertainty is consistent with the approximately 5 % ACS uncertainty reported by Hodnebrog et al. (2020), confirming that the present ACS dataset provides a robust basis for subsequent integrated ACS and RE calculations. Because both the integrated ACS and the RE are obtained as linear spectral integrals of the measured ACS, the relative standard uncertainty derived at the ACS level applies directly to both the IACS and the RE.
3.5 GWP100
RE, atmospheric lifetime, and the resulting AGWP100 and GWP100 values under different reaction environments are summarized in Table 4. The RE of COF2 was evaluated as 0.119 W m−2 ppb−1 by spectrally weighting the experimentally measured ACS spectrum with the stratospheric-adjusted Pinnock curve and integrating over wavenumber. Because RE is conventionally reported per unit mixing ratio (W m−2 ppb−1), whereas AGWP and GWP calculations require mass-based units (W m−2 kg−1), a conversion factor of the form was applied, where MA is the mean molecular weight of air (28.97 kg kmol−1), Mx is the molecular weight of COF2 (66.01 g mol−1), and TM is the total atmospheric mass (5.14×10¹⁸ kg). Applying this conversion yields a mass-based RE of W m−2 kg−1 (Myhre et al., 2013).
Under dry O2 conditions (RH <0.007 %), the measured atmospheric lifetime of years (7.56 h) resulted in a lifetime correction factor of 0.00414. Multiplication of this factor by the mass-based RE reduced the effective RE to W m−2 kg−1, leading to an AGWP100 of W m−2 yr kg−1 and a corresponding GWP100 of . These results reflect the fact that, in the near-anhydrous O2 environment, hydrolysis is effectively absent and COF2 removal proceeds almost exclusively through the oxygen-driven pathway. Even under these dry conditions, the resulting GWP100 remains far below unity, indicating a negligible contribution to long-term climate forcing.
When COF2 was exposed to humid ambient air, its atmospheric lifetime decreased markedly relative to the dry O2 condition, in which removal occurred solely via the oxygen-driven pathway. Even modest levels of water vapor substantially accelerated COF2 loss through hydrolysis. Under the low-humidity condition (41.8 % RH), the lifetime shortened to years (54.86 min), reducing the correction factor to 0.00058 and yielding a corrected RE of W m−2 kg−1. In the high-humidity condition (44.3 % RH), the lifetime decreased further to years (36.67 min), corresponding to a correction factor of 0.00040 and a corrected RE of W m−2 kg−1. As a result, the AGWP100 decreases to W m−2 yr kg−1 under low-humidity conditions and further to W m−2 yr kg−1 under high-humidity conditions, yielding extremely small GWP100 values of (low humidity) and (high humidity).
Once hydrolysis becomes operative, COF2 is removed so rapidly that its radiative contribution is effectively suppressed to near zero. The low- and high-humidity experiments further demonstrate that even small increases in atmospheric moisture, on the order of only a few percentage points in relative humidity, are sufficient to significantly accelerate COF2 hydrolysis. Collectively, these results indicate that COF2, when released under typical near-surface atmospheric humidity, exerts minimal climate forcing, underscoring its suitability as a very low-GWP alternative to high-GWP F-gases currently used in semiconductor chamber-cleaning processes. It should be noted that the lifetimes and corresponding GWP values reported here are representative of the near-surface humidity conditions under which the measurements were conducted; in drier environments, at higher altitudes, or in high-latitude regions, reduced hydrolysis rates may lead to longer effective lifetimes and, consequently, higher GWP values than those reported in this study.
This study presents an integrated experimental evaluation of the infrared absorption properties, atmospheric reactivity, and climate impact of COF2. FTIR measurements provided a well-resolved ACS spectrum, from which the corresponding RE of 0.119 W m−2 ppb−1 was determined using the stratospheric-adjusted Pinnock curve. This value quantifies the radiative forcing exerted by COF2 per unit increase in atmospheric mixing ratio.
Kinetic experiments conducted under controlled dry synthetic air (O2-only) conditions and under realistic humid ambient air environments were designed to determine the e-folding lifetime of COF2 from exponential decay behavior. The results show that hydrolysis driven by atmospheric water vapor overwhelmingly governs the decay, whereas removal via O2-driven oxidation plays a secondary role. The measured atmospheric lifetime under dry conditions was 7.56 h, while lifetimes under low- and high-humidity ambient air conditions decreased to 54.86 and 36.67 min, respectively. These pronounced differences in atmospheric lifetime translate directly into order-of-magnitude differences in the calculated GWP100, with a value of under dry conditions, compared with 6 and under low- and high-humidity conditions, respectively. Consequently, under tropospheric conditions where water vapor is present, the resulting GWP100 values remain well below unity and are therefore climatically insignificant.
Even when considering only reactions with O2 and H2O, the GWP100 of COF2 remains markedly lower than that of most fluorinated compounds classified as greenhouse gases. Furthermore, because CO2 is the confirmed terminal atmospheric degradation product, the ultimate climate impact of COF2 emissions is effectively equivalent to that of releasing an equal molar quantity of CO2.
Overall, this study provides the first experimentally based determination of the GWP100 of COF2. While its radiative efficiency was derived directly from high-quality ACS measurements, its atmospheric lifetime had not previously been quantified in a systematic experimental manner. Although the kinetic experiments were performed under controlled laboratory conditions, they clearly demonstrate that COF2 released near the surface is removed rapidly through reactions with water vapor and oxygen, resulting in atmospheric lifetimes on the order of minutes under humid conditions. By combining experimentally determined RE and lifetime, this work shows that the resulting GWP100 of COF2 is negligible under typical atmospheric humidity. These findings indicate that COF2 has minimal climate impact and is a strong candidate for use as a low-GWP alternative to high-GWP fluorinated gases in semiconductor and display chamber-cleaning processes.
Data are available at Zenodo at https://doi.org/10.5281/zenodo.18015708 (Kim, 2025).
The supplement related to this article is available online at https://doi.org/10.5194/acp-26-2707-2026-supplement.
DK designed the experimental strategy; developed the FTIR instrumentation and a measurement workflow tailored to GWP determination; performed measurements and formal analysis; and wrote the original draft. JL, as a project leader, conceived the project and experimental design; supervised the research as principal investigator; contributed to data interpretation; and reviewed and edited the manuscript. Both authors discussed the results and approved the final manuscript. HK prepared and analysed the COF2.
The contact author has declared that none of the authors has any competing interests.
Publisher's note: Copernicus Publications remains neutral with regard to jurisdictional claims made in the text, published maps, institutional affiliations, or any other geographical representation in this paper. The authors bear the ultimate responsibility for providing appropriate place names. Views expressed in the text are those of the authors and do not necessarily reflect the views of the publisher.
We gratefully acknowledge Sole Materials Co., Ltd. (Republic of Korea) for supplying the COF2-in-nitrogen (COF2/N2) gas mixture used in this study.
This work was supported by the Technology Innovation Program (RS-2022-00155753, “GWP 1,000 or Less Chamber Cleaning Gas and its Remote Plasma System for Low GWP Gas”; RS-2023-00262743, “Development of GWP 150 or lower alternative gas and process technology for chemical vapor deposition chamber cleaning process for display TFT gate insulator film”) funded by the Ministry of Trade, Industry and Energy (MOTIE, Republic of Korea) and the basic program of the Korea Research Institute of Standards and Science (KRISS).
This paper was edited by Ivan Kourtchev and reviewed by three anonymous referees.
An, S. and Hong, S. J.: Spectroscopic analysis of NF3 plasmas with oxygen additive for PECVD chamber cleaning, Coatings, 13, 91, https://doi.org/10.3390/coatings13010091, 2023.
Elrod, M. J.: Greenhouse warming potentials from the infrared spectroscopy of atmospheric gases, J. Chem. Educ., 76, 1702–1705, https://doi.org/10.1021/ed076p1702, 1999.
Francisco, J. S.: A study of the gas-phase reaction of carbonyl fluoride with water, J. Atmos. Chem., 13, 285–292, https://doi.org/10.1007/BF00696901, 1993.
Gordon, I. E., Rothman, L. S., Hargreaves, R. J., Gomez, F. M., Bertin, T., Hill, C., Kochanov, R. V., Tan, Y., Wcisło, P., Makhnev, V. Y., Bernath, P. F., Birk, M., Boudon, V., Campargue, A., Coustenis, A., Drouin, B. J., Gamache, R. R., Hodges, J. T., Jacquemart, D., Mlawer, E. J., Nikitin, A. V., Perevalov, V. I., Rotger, M., Robert, S., Tennyson, J., Toon, G. C., Tran, H., Tyuterev, V. G., Adkins, E. M., Barbe, A., Bailey, D. M., Bielska, K., Bizzocchi, L., Blake, T. A., Bowesman, C. A., Cacciani, P., Čermák, P., Császár, A. G., Denis, L., Egbert, S. C., Egorov, O., Ermilov, A. Y., Fleisher, A. J., Fleurbaey, H., Foltynowicz, A., Furtenbacher, T., Germann, M., Guest, E. R., Harrison, J. J., Hartmann, J.-M., Hjältén, A., Hu, S.-M., Huang, X., Johnson, T. J., Jóźwiak, H., Kassi, S., Khan, M. V., Kwabia-Tchana, F., Lee, T. J., Lisak, D., Liu, A.-W., Lyulin, O. M., Malarich, N. A., Manceron, L., Marinina, A. A., Massie, S. T., Mascio, J., Medvedev, E. S., Meshkov, V. V., Mellau, G. Ch., Melosso, M., Mikhailenko, S. N., Mondelain, D., Müller, H. S. P., O’Donnell, M., Owens, A., Perrin, A., Polyansky, O. L., Raston, P. L., Reed, Z. D., Rey, M., Richard, C., Rieker, G. B., Röske, C., Sharpe, S. W., Starikova, E., Stolarczyk, N., Stolyarov, A. V., Sung, K., Tamassia, F., Terragni, J., Ushakov, V. G., Vasilchenko, S., Vispoel, B., Vodopyanov, K. L., Wagner, G., Wójtewicz, S., Yurchenko, S. N., and Zobov, N. F.: The HITRAN2024 molecular spectroscopic database, J. Quant. Spectrosc. Radiat. Transfer, 353, 109807, https://doi.org/10.1016/j.jqsrt.2026.109807, 2026.
Harrison, J. J.: Infrared absorption cross sections for 1,1,1,2-tetrafluoroethane, J. Quant. Spectrosc. Radiat. Transfer, 151, 210–216, https://doi.org/10.1016/j.jqsrt.2014.09.023, 2015.
Harrison, J. J.: New infrared absorption cross sections for the infrared limb sounding of sulfur hexafluoride (SF6), J. Quant. Spectrosc. Radiat. Transfer, 254, 107202, https://doi.org/10.1016/j.jqsrt.2020.107202, 2020.
Harrison, J. J., Chipperfield, M. P., Dudhia, A., Cai, S., Dhomse, S., Boone, C. D., and Bernath, P. F.: Satellite observations of stratospheric carbonyl fluoride, Atmos. Chem. Phys., 14, 11915–11933, https://doi.org/10.5194/acp-14-11915-2014, 2014.
Hodnebrog, Ø., Etminan, M., Fuglestvedt, J. S., Marston, G., Myhre, G., Nielsen, C. J., Shine, K. P., and Wallington, T. J.: Global warming potentials and radiative efficiencies of halocarbons and related compounds: A comprehensive review, Rev. Geophys., 51, 300–378, https://doi.org/10.1002/rog.20013, 2013.
Hodnebrog, Ø., Aamaas, B., Fuglestvedt, J. S., Marston, G., Myhre, G., Nielsen, C. J., Sandstad, M., Shine, K. P., and Wallington, T. J.: Updated global warming potentials and radiative efficiencies of halocarbons and other weak atmospheric absorbers, Rev. Geophys., 58, e2019RG000691, https://doi.org/10.1029/2019RG000691, 2020.
Houghton, J. T., Jenkins, G. J., and Ephraums, J. J.: Climate Change: The IPCC Scientific Assessment, Cambridge University Press, Cambridge, UK, and New York, NY, USA, ISBN 9780521403603, 1990.
Intergovernmental Panel on Climate Change (IPCC): Annex VII: Glossary, in: Climate Change 2021: The Physical Science Basis, Cambridge University Press, Cambridge, UK, 2215–2256, https://doi.org/10.1017/9781009157896.022, 2023.
Jo, S. Y., Park, A. H., and Hong, S. J.: Effects of the applied power of remote plasma system with green alternative chamber cleaning gas of carbonyl fluoride, IEEE Trans. Semicond. Manuf., 38, 624–633, https://doi.org/10.1109/TSM.2025.3572285, 2025.
Jung, J., Kim, J.-H., Lim, C.-M., Choi, J.-E., Bae, J., Kim, H.-D., and Chung, C.-W.: Low-damage etching of poly-Si and SiO2 via a low-energy electron beam in inductively coupled CF4 plasma, Plasma Sources Sci. Technol., 33, 105013, https://doi.org/10.1088/1361-6595/ad8217, 2024.
Kai, T., Yuang, K., Chou, C., Chuah, K., Peng, L., and Jun, X.: TEOS Integrated High-Low Pressure RPS Clean: APC: Advanced Process Control, in: Proceedings of the 35th Annual SEMI Advanced Semiconductor Manufacturing Conference (ASMC), https://doi.org/10.1109/ASMC61125.2024.10545361, 2024.
Kim, D.: Experimental Determination of the Global Warming Potential of Carbonyl Fluoride (COF2), Zenodo [data set], https://doi.org/10.5281/zenodo.17955208, 2025.
Kim, G., Kwon, J.-W., Lee, I., Seo, H., Park, J.-B., Shin, J.-H., and Kim, G.-H.: Application of plasma information-based virtual metrology (PI-VM) for etching in C4F8/Ar/O2 plasma, IEEE Trans. Semicond. Manuf., 37, 602–614, https://doi.org/10.1109/TSM.2024.3447074, 2024.
Lugani, G. S., Skaggs, R., Morris, B., Tolman, T., Tervo, D., Uhlenbrock, S., Hacker, J., Seng, C. Tan, Nehlsen, J. P., Ridgeway, R. G., Wong, L. Broadway, and Rudy, F. P.: Direct emissions reduction in plasma dry etching using alternate chemistries: Opportunities, challenges, and need for collaboration, IEEE Trans. Semicond. Manuf., 37, 445–452, https://doi.org/10.1109/TSM.2024.3444465, 2024.
Mitsui, Y., Ohira, Y., Yonemura, T., Takaichi, T., Sekiya, A., and Beppu, T.: The possibility of carbonyl fluoride as a new CVD chamber cleaning gas, J. Electrochem. Soc., 151, G297, https://doi.org/10.1149/1.1669010, 2004.
Myhre, G., Shindell, D., Bréon, F.-M., Collins, W., Fuglestvedt, J., Huang, J., Koch, D., Lamarque, J.-F., Lee, D., Mendoza, B., Nakajima, T., Robock, A., Stephens, G., Takemura, T., and Zhang, H.: Anthropogenic and Natural Radiative Forcing, Supplementary Material, in: Climate Change 2013: The Physical Science Basis, Contribution of Working Group I to the Fifth Assessment Report of the Intergovernmental Panel on Climate Change, edited by: Stocker, T. F., Qin, D., Plattner, G.-K., Tignor, M., Allen, S. K., Boschung, J., Nauels, A., Xia, Y., Bex, V., and Midgley, P. M., Cambridge University Press, Cambridge, UK, https://doi.org/10.1017/CBO9781107415324, 2013.
Park, A. H., Byun, H., and Hong, S. J.: High-power remote plasma source with alternative gas COF2 for PECVD chamber dry cleaning, Jpn. J. Appl. Phys., 64, 04SP23, https://doi.org/10.35848/1347-4065/adc1d6, 2025a.
Park, A. H., Lee, Y., Jo, S., and Hong, S. J.: An alternative PECVD chamber cleaning gas of COF2 for low-GWP consideration, IEEE Trans. Semicond. Manuf., 38, 596–604, https://doi.org/10.1109/TSM.2025.3559471, 2025b.
Pinnock, S., Hurley, M. D., Shine, K. P., Wallington, T. J., and Smyth, T. J.: Radiative forcing of climate by hydrochlorofluorocarbons and hydrofluorocarbons, J. Geophys. Res. Atmos., 100, 23227–23238, https://doi.org/10.1029/95JD02323, 1995.
Seinfeld, J. H. and Pandis, S. N.: Atmospheric Chemistry and Physics: From Air Pollution to Climate Change, 2nd ed., John Wiley & Sons, Inc., Hoboken, New Jersey, USA, 204–279, ISBN 9780471720188, 2006.
Shine, K. P. and Myhre, G.: The spectral nature of stratospheric temperature adjustment and its application to halocarbon radiative forcing, J. Adv. Model. Earth Syst., 12, e2019MS001951, https://doi.org/10.1029/2019MS001951, 2020.
Smith, C., Nicholls, Z. R. J., Armour, K., Collins, W., Forster, P., Meinshausen, M., Palmer, M. D., Watanabe, M., Masson-Delmotte, V., Zhai, P., Pirani, A., Connors, S. L., Péan, C., Berger, S., Caud, N., Chen, Y., Goldfarb, L., Gomis, M. I., Huang, M., Leitzell, K., Lonnoy, E., Matthews, J. B. R., Maycock, T. K., Waterfield, T., Yelekçi, O., Yu, R., and Zhou, B.: The Earth’s energy budget, climate feedbacks, and climate sensitivity (supplementary material), Intergovernmental Panel on Climate Change, Geneva, Switzerland, https://doi.org/10.1017/9781009157896, 2021.
Song, W. S., Kang, J. E., and Hong, S. J.: Spectroscopic analysis of CF4/O2 plasma mixed with N2 for Si3N4 dry etching, Coatings, 12, 1064, https://doi.org/10.3390/coatings12081064, 2022.
Thornhill, G. D., Smith, L. A., and Shine, K. P.: Radiative forcing from halogen reservoir and halocarbon breakdown products, J. Geophys. Res. Atmos., 129, e2024JD040912, https://doi.org/10.1029/2024JD040912, 2024.
Uchimaru, T., Tsuzuki, S., Sugie, M., Tokuhashi, K., and Sekiya, A.: Ab initio study of the hydrolysis of carbonyl difluoride (CF2O): importance of an additional water molecule, Chem. Phys. Lett., 396, 110–116, https://doi.org/10.1016/j.cplett.2004.08.022, 2004.
United Nations Framework Convention on Climate Change (UNFCCC): Kyoto Protocol to the United Nations Framework Convention on Climate Change, https://unfccc.int/process-and-meetings/the-kyoto-protocol (last access: 15 September 2025), 1997.
United Nations Framework Convention on Climate Change (UNFCCC): Doha Amendment to the Kyoto Protocol, https://unfccc.int/process/the-kyoto-protocol/the-doha-amendment (last access: 18 February 2026), 2012.
United Nations Framework Convention on Climate Change (UNFCCC): Paris Agreement, https://unfccc.int/process-and-meetings/the-paris-agreement/the-paris-agreement (last access: 15 December 2025), 2015.
Zachariah, M. R., Tsang, W., Westmoreland, P. R., and Burgess Jr., D. R. F.: Theoretical prediction of the thermochemistry and kinetics of reactions of CF2O with hydrogen atom and water, J. Phys. Chem., 99, 12512–12519, https://doi.org/10.1021/j100033a023, 1995.