the Creative Commons Attribution 4.0 License.
the Creative Commons Attribution 4.0 License.
 | 19 Feb 2026
Growing role of secondary organic aerosol in the North China Plain from 2014 to 2024
Chunshui Lin
Ru-Jin Huang
Jing Duan
Jing Qu
Jiahua Liu
Yi Liu
Yan Luo
Wei Huang
Yanan Zhan
Zhitao Liu
Sihan Liu
Qingshuang Zhang
Zirui Liu
Shengrong Lou
Huinan Yang
Dan Dan Huang
Cheng Huang
Hongli Wang
Since the Clean Air Act was implemented in 2013, China has witnessed a reduction of over 50 % in the annual average concentration of fine particulate matter (PM2.5). Despite emission cuts, the formation mechanism of secondary organic aerosols (SOA), a crucial constituent of PM2.5, remains inadequately understood. In this study, we performed a model-assisted analysis of field sampling data collected in Shijiazhuang. The results show that, compared to 2014, the contribution of SOA to the total organics (from 27 % in 2014 to 75 % in 2024) exceeded that of primary organic aerosol (POA) during the winter haze in 2024. The current model, which includes SOA formation pathways involving aromatic oxidation, aqueous formation, and SVOC/IVOC oxidation, underestimates the measured SOA levels by 60 % in 2024. However, incorporating the transformation of transported POA into SOA (accounting for up to 50 % of SOA) under high relative humidity (RH) conditions helps bridge the gap between model predictions and field measurements. The pathway of SOA formation via POA aging is consistent with the identified POA aging factor derived from biomass burning and coal combustion. The increase in SOA contribution occurred amidst large emission reductions, which accounted for 70 % of the decline in POA levels, while meteorological factors contributed an additional 10 %. Increased contribution of SOA was also found in other North China Plains areas, which underscores the pressing necessity for coordinated regional initiatives to effectively mitigate SOA levels across the NCP, thereby tackling the transboundary nature of air pollution.
- Article
(3826 KB) - Full-text XML
-
Supplement
(2893 KB) - BibTeX
- EndNote


Ambient PM2.5 pollution is a critical environmental issue in China, contributing to millions of premature deaths annually (Zhao et al., 2018; Zhang et al., 2021; Chen et al., 2024). Since the implementation of the Clean Air Act in 2013, there have been large reductions in PM2.5 concentrations nationwide (Zhang et al., 2019; Geng et al., 2021). However, improvements have slowed in recent years, e.g., from 2018–2020, compared to the initial surge of progress between 2013 and 2017 (Geng et al., 2024). The North China Plain (NCP), one of the country's most polluted areas, continues to experience severe haze episodes with elevated PM2.5 levels, especially during winter months (Huang et al., 2014; Daellenbach et al., 2024). This persistent pollution usually stems from a complex interplay of local emission sources, transboundary pollutant transport, secondary formation, specific topographical features, and unfavorable meteorological conditions (Chang et al., 2022; Nie et al., 2022).
Organic aerosols (OA) represent a large portion (20 %–90 %) of PM2.5 in the atmosphere, arising from both primary and secondary processes (Jimenez et al., 2009; Lin et al., 2018; Huang et al., 2023; Chen et al., 2024). Recent research has increasingly focused on the budgets, formation pathways, and photochemical evolution of SOA due to their impacts on climate and human health (Chen et al., 2024; Daellenbach et al., 2024). SOA formation involves precursor VOCs released from both natural sources, such as forests and wildfires, and anthropogenic sources, including biomass burning and vehicular emissions (Chang et al., 2022). Despite this understanding, many SOA precursors remain unidentified, leading to uncertainties in global SOA budget estimations, as numerous climate models do not account for these unknowns (Shrivastava et al., 2017; Chang et al., 2022). Therefore, a better understanding of SOA formation, particularly in the context of emission reductions, is essential for evaluating their future implications for climate and human health (Chen et al., 2024).
In the capital city of Beijing, a recent study indicates that SOA primarily originates from solid-fuel combustion and aqueous processes involving multiphase chemistry with aromatic compounds (Daellenbach et al., 2024), with the most severe haze events linked to the transport from south of Beijing. Kuang et al. (2020) explored the effects of gas-phase and aqueous-phase photochemical processes on SOA formation, revealing that photochemical aqueous-phase processes contributed largely to daytime oxygenated organic aerosol (OOA) formation during winter in a sampling site near Beijing. While much of the existing research has focused on Beijing and nearby areas, studies in Shijiazhuang (SJZ) are relatively scarce (Huang et al., 2019; Lin et al., 2020). As the capital of Hebei Province and one of the most polluted cities in China, particularly during the winter heating season, Shijiazhuang presents a critical context for further investigation (Huang et al., 2019; Lin et al., 2020). Huang et al. (2019) utilized a high-time resolution Aerosol Chemical Speciation Monitor (ACSM) and found that in wintertime Shijiazhuang 2014, submicron organic aerosol was primarily sourced from direct emissions without extensive atmospheric aging, indicating opportunities for improving air quality through emission reductions. Moreover, during pollution events with high relative humidity (RH), SOA prevailed due to intensified aqueous-phase chemistry highlighting the critical role of meteorological factors in PM pollution in this heavily polluted city (Huang et al., 2019).
In this study, we deployed a high-time and high-mass resolution Soot Particle (SP) Long Time of Flight (LToF) Aerosol Mass Spectrometer (AMS) (Onasch et al., 2012) in Shijiazhuang from January–March 2024. We conducted a model-assisted analysis of variations in OA sources and formation, comparing data to 2014 levels (Huang et al., 2019). Our objectives were: (1) to elucidate the chemical mechanisms underlying SOA formation in light of emission reductions, and (2) to evaluate the relative contribution of emission reductions versus meteorological factors by comparing measurements and simulations from 2014 and 2024.
2.1 Field Sampling
Shijiazhuang (SJZ), the capital of Hebei Province, is located approximately 270 km southwest of Beijing (Huang et al., 2019; Lin et al., 2020). In 2024, an SP-LToF-AMS (laser off mode) was deployed from January–March in the Luan Cheng district of southern SJZ. The sampling site was selected as a suburban background location, without strong nearby emission sources.
The design of the SP-LToF-AMS is detailed in Onasch et al. (2012), and its setup followed our previous studies (Lin et al., 2021, 2022). Briefly, ambient air was drawn through a stainless-steel tube via a PM2.5 cyclone at a consistent flow rate of 5 L min−1. After being dried with a Nafion dryer (MD-700-24S, Perma Pure, Inc.), the sampled aerosol was focused into a particle beam using a PM2.5 aerodynamic lens, then vaporized by a thermal standard vaporizer at approximately 600 °C and ionized through electron ionization (70 eV) to generate positive fragments. The resulting ion fragments were detected and analyzed by the LToF mass spectrometer.
Ionization efficiency (IE) and relative ionization efficiency (RIE) were calibrated using pure NH4NO3 and (NH4)2SO4 in the 300–350 nm range. Data acquired from the SP-LToF AMS were analyzed using SQUIRREL (version 1.61D) and PIKA (1.21D) software, coded in Igor Pro 6.37 (WaveMetrics). To identify OA sources, positive matrix factorization (PMF) combined with multilinear engine (ME-2) analysis was performed on the high-mass spectra of OA. The data and error matrices for OA mass spectra in the range of 12–120 were preprocessed, removing ions with a signal-to-noise ratio (SN) <0.2 and down-weighting those with by a factor of 2 (Lin et al., 2018, 2022; Duan et al., 2024). An unconstrained PMF analysis was then conducted to explore a range of solutions and determine the potential number and types of OA factors. Subsequently, an ME-2 approach with a-value constraints was employed to obtain the most interpretable profiles and environmentally meaningful results. As a result, the time series of AMS + BC is strongly correlated with total PM2.5 with slope of the linear fit close to 1, and the OA explained by PMF closely aligns with the measured OA (Fig. S1 in the Supplement).
2.2 Model Analysis
The Community Multiscale Air Quality (CMAQ) model (version 5.4) (Pye et al., 2023) was employed to simulate ambient variations in emission reductions and the meteorological impacts on ambient aerosol on a regional scale in January 2024, compared to January 2014. The CMAQ model was configured with the aero7 aerosol module and the CB6r5 gas-phase mechanism. To generate the meteorological fields required for the CMAQ simulations, the Weather Research and Forecasting (WRF) model (version 4.4) was utilized with the National Centers for Environmental Prediction (NCEP) Final (FNL) dataset.
The emission inventory for 2014 was derived from the Multiresolution Emission Inventory for China (MEIC) (http://meicmodel.org.cn; last access: 1 May 2025) (Geng et al., 2024), while the 2023 emission inventory was used as the base emission data for 2024 (Fig. S2 in the Supplement). The modeling period covered 11–31 January for both years, coinciding with the availability of ACSM/AMS data in January. The first three days were designated as a spin-up phase to stabilize the model, ensuring that subsequent data accurately reflected steady-state atmospheric conditions. Model performance metrics – including Mean Bias (MB), Normalized Mean Bias (NMB), Root Mean Square Error (RMSE), and correlation coefficient (R) – indicated good agreement between modeled and measured PM2.5 levels (Fig. S2).
High relative humidity (RH) increases the availability of aerosol liquid water content (ALWC), thereby enhancing the uptake of both organic and inorganic gases. These gases are oxidized in aerosol water to form secondary aerosols (Zheng et al., 2015; Mcfall et al., 2020). High RH also promotes the uptake of oxidants, including hydroxyl (OH) and hydrogen peroxide (H2O2), which can generate OH radicals via Fenton chemistry (Nguyen et al., 2013). These oxidants oxidize POA and form SOA. To characterize the RH-mediated conversion of POA to SOA, we introduce a simplified surrogate equation for SOA formation:
In this equation, atmospheric water vapor (H2O) is linked to RH and ALWC estimation. Higher ALWC and RH (i.e., increased H2O) facilitates the apparent conversion of more POA into SOA. The conversion rate was tested until a closure was achieved between measured and simulated SOA. Different scenarios were designed (Table S1 in the Supplement). This simplified calculation serves as an empirical approach to account for the underestimated SOA formed during the aging of POA. Further research is needed to determine the effective uptake coefficients of precursor VOCs and oxidants, as well as the dynamics of POA aging. As a result of this addition of the simplified SOA formation scheme, the model SOA and POA tracked the observed ones with a moderate correlation coefficient (Fig. S3 in the Supplement). The diurnal pattern of SOA was simulated relatively well in 2024, whereas the model underestimated the midday peak of SOA in 2014 (Fig. S4 in the Supplement), suggesting that daytime SOA formation (including SOA formation from aromatics, S/IVOCs, and aqueous pathway; Figs. S5 and S6 in the Supplement) was likely underestimated in the 2014 model run. This underestimation stems from underestimated precursor emissions and/or low yields of these reactions during the day. In particular, SOA formation from aromatics, SVOCs/IVOCs, and the aqueous pathway exhibited a daytime increasing trend, while POA-aging SOA showed higher nighttime concentrations (Figs. S5 and S6). The current POA aging scheme assumes POA conversion occurs both day and night (Fig. S5), consistent with observations of bulk SOA during the 2024 field campaign (Fig. S4). As evidence of the underestimation of daytime SOA formation, our previous winter study in Shijiazhuang using comprehensive PMF identified a daytime-dominant OOA-NO3 factor (Lin et al., 2020), which accounted for the majority (38 %–48 %) of OOA formation pathways. This demonstrates that daytime processes can produce fresh SOA with formation pathways and volatility similar to those of inorganic nitrate. Other identified OOA factors include sulfate-related OOA (i.e., regional and low-volatility; 25 %–26 % of total SOA) and aged POA (26 %–37 %) from biomass burning and fossil fuel combustion (Lin et al., 2020). In contrast, direct PMF analysis in 2024 revealed that more oxidized oxygenated organic aerosol (MOOOA; 35 % of total SOA) and POA aging-derived SOA (34 %) were more important than less oxidized, relatively fresh OOA (LOOOA; 30 % of SOA; Fig. S7 in the Supplement). While SOA accounted for approximately 75 % of total OA in 2024, its contribution was only 27 % in 2014 (Fig. S7). Therefore, this comparison indicates that regional transport and POA aging during transport outweighed fresh SOA formation in 2024.
ALWC was calculated using the ISORROPIA II thermodynamic model in forward mode (Fountoukis and Nenes, 2007), with input parameters including the inorganic aerosol components (sulfate, nitrate, ammonium and chloride) quantified by AMS or ACSM, as well as RH and temperature from the field campaign. The forward mode of ISORROPIA II enables the thermodynamically consistent prediction of aerosol liquid water content by simulating the equilibrium partitioning of inorganic species between the gas and condensed phases, leveraging the constraint of measured inorganic composition and ambient RH/temperature to yield ALWC estimates.
3.1 Increased Secondary Aerosol Contribution in 2024 vs. 2014
Figure 1a shows the variations of the major components of NR-PM (i.e., organics, sulfate, nitrate, ammonium, and chloride) at SJZ in 2014, while Fig. 1b presents the data for 2024, categorizing non-refractory PM into deciles, ranging from the least polluted 10th percentile to the most polluted 10th percentile. As NR-PM increases from the lowest 10th percentile to the highest 10th percentile, organics remain the largest component, with mean concentrations rising from 16.8–206.0 µg m−3 in 2014, and from 2.9–45.4 µg m−3 in 2024. In 2014, sulfate was the second largest component, with concentrations rising from 4.0–90.3 µg m−3. In 2024, however, sulfate became less prominent than nitrate, with mean concentrations increasing from 1.3–21.7 µg m−3. In 2024, nitrate emerged as the second dominant component, rising from 1.0–33.6 µg m−3, although its concentrations were still slightly lower than in 2014, which saw an increase from 3.6–43.5 µg m−3.
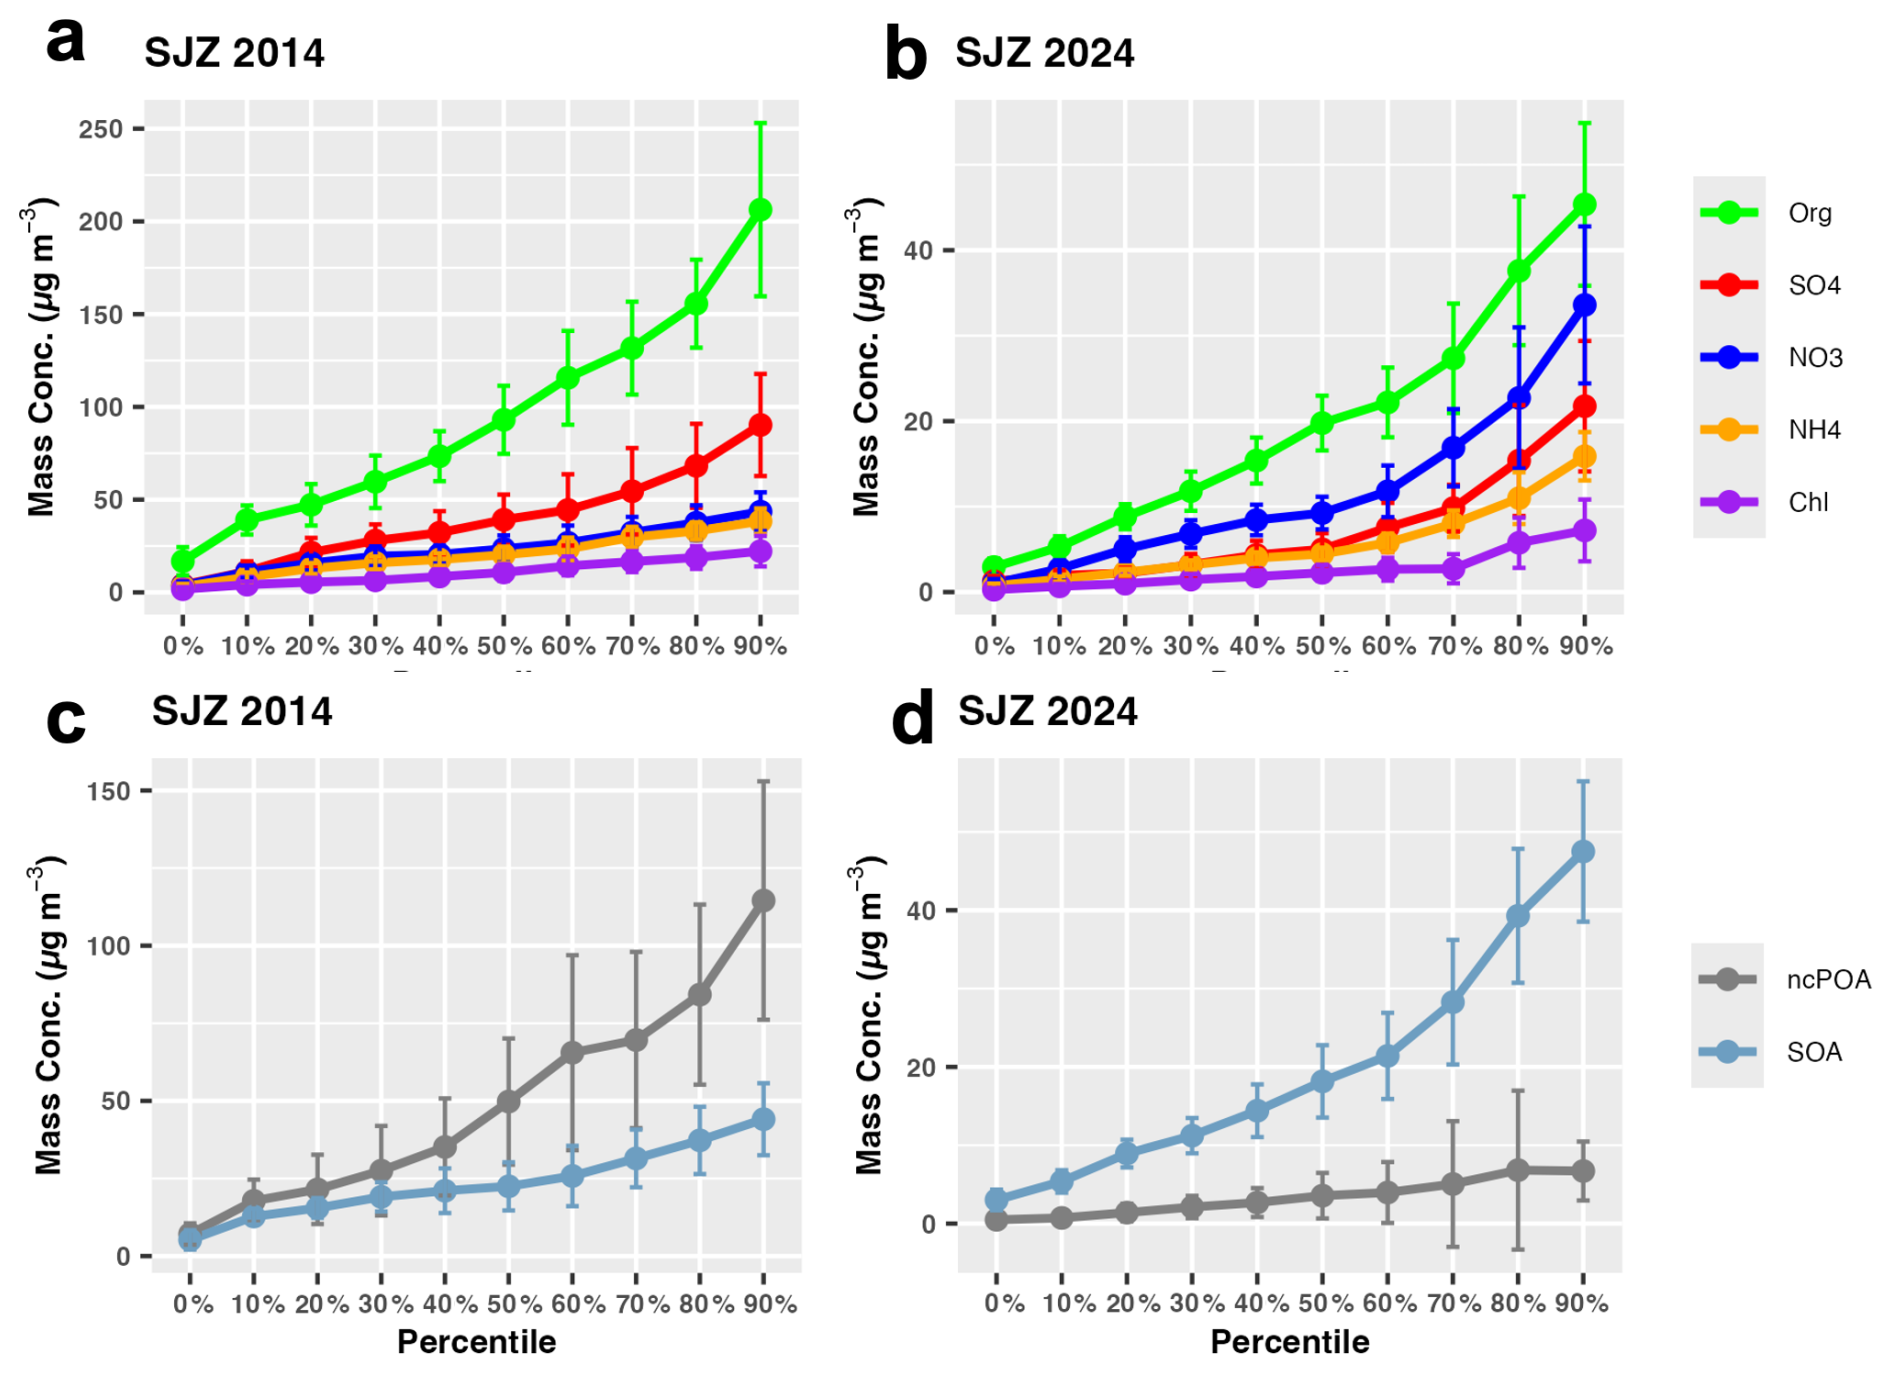
Figure 1Aerosol Components and Organic Aerosol Subtypes. Aerosol components in (a) 2014 and (b) 2024 as a function of non-refractory PM deciles, ranging from the least polluted 10th percentile to the most polluted. Organic sources in (c) 2014 and (d) 2024, including non-cooking primary organic aerosol (ncPOA) and secondary organic aerosol, as a function of NR-PM deciles. Detailed source apportionment of OA is shown in Fig. S7.
The dominance of organic aerosol is linked to direct emissions from various combustion sources, such as biomass burning and coal combustion, as well as the formation of SOA. Figure 1c shows that non-cooking primary organic aerosol (ncPOA) – the sum of biomass burning organic aerosol (BBOA), coal combustion organic aerosol (CCOA), and hydrocarbon-like organic aerosol (HOA) – increased from 7.1–115.0 µg m−3 in 2014, while oxygenated organic aerosol (OOA, a surrogate for SOA) rose from 5.2–44.1 µg m−3. In contrast, in 2024, OOA became more dominant than ncPOA, with OOA increasing from 3.0–47.5 µg m−3 (Fig. 1d), while ncPOA rose from less than 1–6.7 µg m−3. This shift in dominance of OOA, underscores the increasing role of secondary aerosol formation processes in affecting air quality and public health, highlighting the need for enhanced monitoring, adaptive policy measures to control emissions, and interdisciplinary research efforts to tackle the emerging challenges posed by organic aerosols.
In contrast to organics, the reduction in inorganics was relatively straightforward. Specifically, the decrease in sulfate is linked to the reduction of its precursor, SO2, and its conversion from SO2 to sulfate. During the sampling period in 2014, the measured SO2 concentration was (± one standard deviation), while in 2024, it dropped to . This represents an average reduction of 95.6 % in SO2 concentrations from 2014–2024. For measured sulfate, the average reduction was less pronounced than that of its precursor, at 82 %. This indicates higher conversion efficiency from SO2 to sulfate in 2024, resulting in a higher sulfur oxidation ratio () of 0.42 compared to 0.15 in 2014. It's important to note that the observed may represent an upper limit, as regional transport and background sulfate levels were not factored into the calculation. In contrast to sulfate, nitrate experienced a smaller reduction, resulting in an increased nitrate fraction in 2024 compared to 2014. This change is partly linked to NOx emissions, which have seen less reduction than SO2 (Fig. S8 in the Supplement). The increase in oxidizing capacity (as evidenced by the rising wintertime ozone Shijiazhuang; Fig. S9 in the Supplement) may convert more NOx into nitrate in the presence of abundant ammonia in recent years (Zang et al., 2022). Ozone plays a key role in nitrate formation (e.g., by reacting with NO2 to generate N2O5, a critical intermediate for nitrate production) and its photolysis in the presence of atmospheric water vapor forms hydroxyl radicals (OH radicals), which can oxidize NOx as well as other reactive inorganic and organic gases. Ammonium (NH4) is associated with ammonia emissions, which are converted to ammonium in the presence of sulfate and nitrate. Given the abundant ammonia emissions over the years (Liu et al., 2019), ammonium concentrations were influenced more by sulfate and nitrate than by ammonia itself. Chloride is connected to biomass burning and coal combustion. Therefore, the reduction in ncPOA likely reflects a decrease in the corresponding emission strength, leading to lower chloride emissions.
On average, the measured NR-PM concentrations showed a reduction of 75 % over the sampling period from 2014–2024, with NR-PM1 averaging in 2014 and NR-PM2.5 averaging in 2024. Considering the differences in size cuts (i.e., PM1 from ACSM in 2014 and PM2.5 from AMS in 2024) and the sampling sites between the two campaigns (Huang et al., 2019), a direct comparison of the two campaigns may introduce limitations. PM1 mass typically accounts for 50 %–80 % of PM2.5 mass concentration in ambient air (Elser et al., 2016), and simulations from the CMAQ model indicate that PM1 (within the AMS/ACSM PM1 size range) constitutes approximately 80 % of total PM2.5 mass (Fig. S10 in the Supplement). Therefore, comparing 2014 PM1 data (which correlates to a higher PM2.5 level) directly with 2024 PM2.5 data would underestimate the actual reduction in PM2.5 concentrations between the two periods. However, given the strong time-series correlation in bulk PM2.5 concentrations across cities in the NCP (as discussed in Sect. 3.4), this comparison can still reflect an overall trend.
Comparing Fig. 1a and b, we observed that all components were reduced to varying extents across different pollution levels, from the cleanest 10th percentile to the most polluted 10th percentile. On average, organic compounds were reduced by 79 % in 2024 compared to 2014. During the most polluted 10 % of the sampling period, organics saw a similar reduction of 78 % compared to 2014. Sulfate experienced an average reduction of 82 %, with a 76 % reduction during the most polluted 10 %. Ammonium was reduced by an average of 72.1 %, with a 79 % reduction in the most polluted period. Chloride also saw an average reduction of 76 %, although during the most polluted period, the reduction was only 67 %. In contrast, nitrate experienced the least reduction, with an average decrease of 50 % and only a 23 % reduction during the most polluted period. This indicates that all major components saw similar reductions in 2024, except for nitrate, which became more important in driving pollution levels compared to 2014. Previously dominated by direct emissions (as indicated by high levels of ncPOA in Fig. 1c), organics are now increasingly influenced by secondary production. On average, ncPOA was reduced by 93 % in 2024, while SOA was reduced by 16 % (Fig. S7).
3.2 Formation and Transport of Secondary Organic Aerosol
During the polluted periods, the shift in dominance from ncPOA to SOA in 2024 compared to 2014 indicates that secondary formation processes are becoming more important than primary emissions (Fig. 1). Figure 2 shows that as ALWC increased, OOA in both 2014 and 2024 exhibited an increasing trend. In 2024, when ALWC rose from 5 µg m−3 to over 100 µg m−3, OOA increased from 18.4–35.7 µg m−3. In 2014, OOA increased from 12.6–28.9 µg m−3. In contrast to OOA, ncPOA showed a plateau or decreasing trend at higher ALWC. ALWC plays an important role in SOA formation: elevated ALWC enhances the dissolution of gaseous precursors (e.g., VOCs and OVOCs) into the aerosol liquid phase, where they undergo acid-catalyzed oxidation, oligomerization, and other heterogeneous reactions. The observed decrease in ncPOA with rising ALWC implies ncPOA can undergo further oxidation and chemical modification, reducing their volatility and transforming them into SOA species.
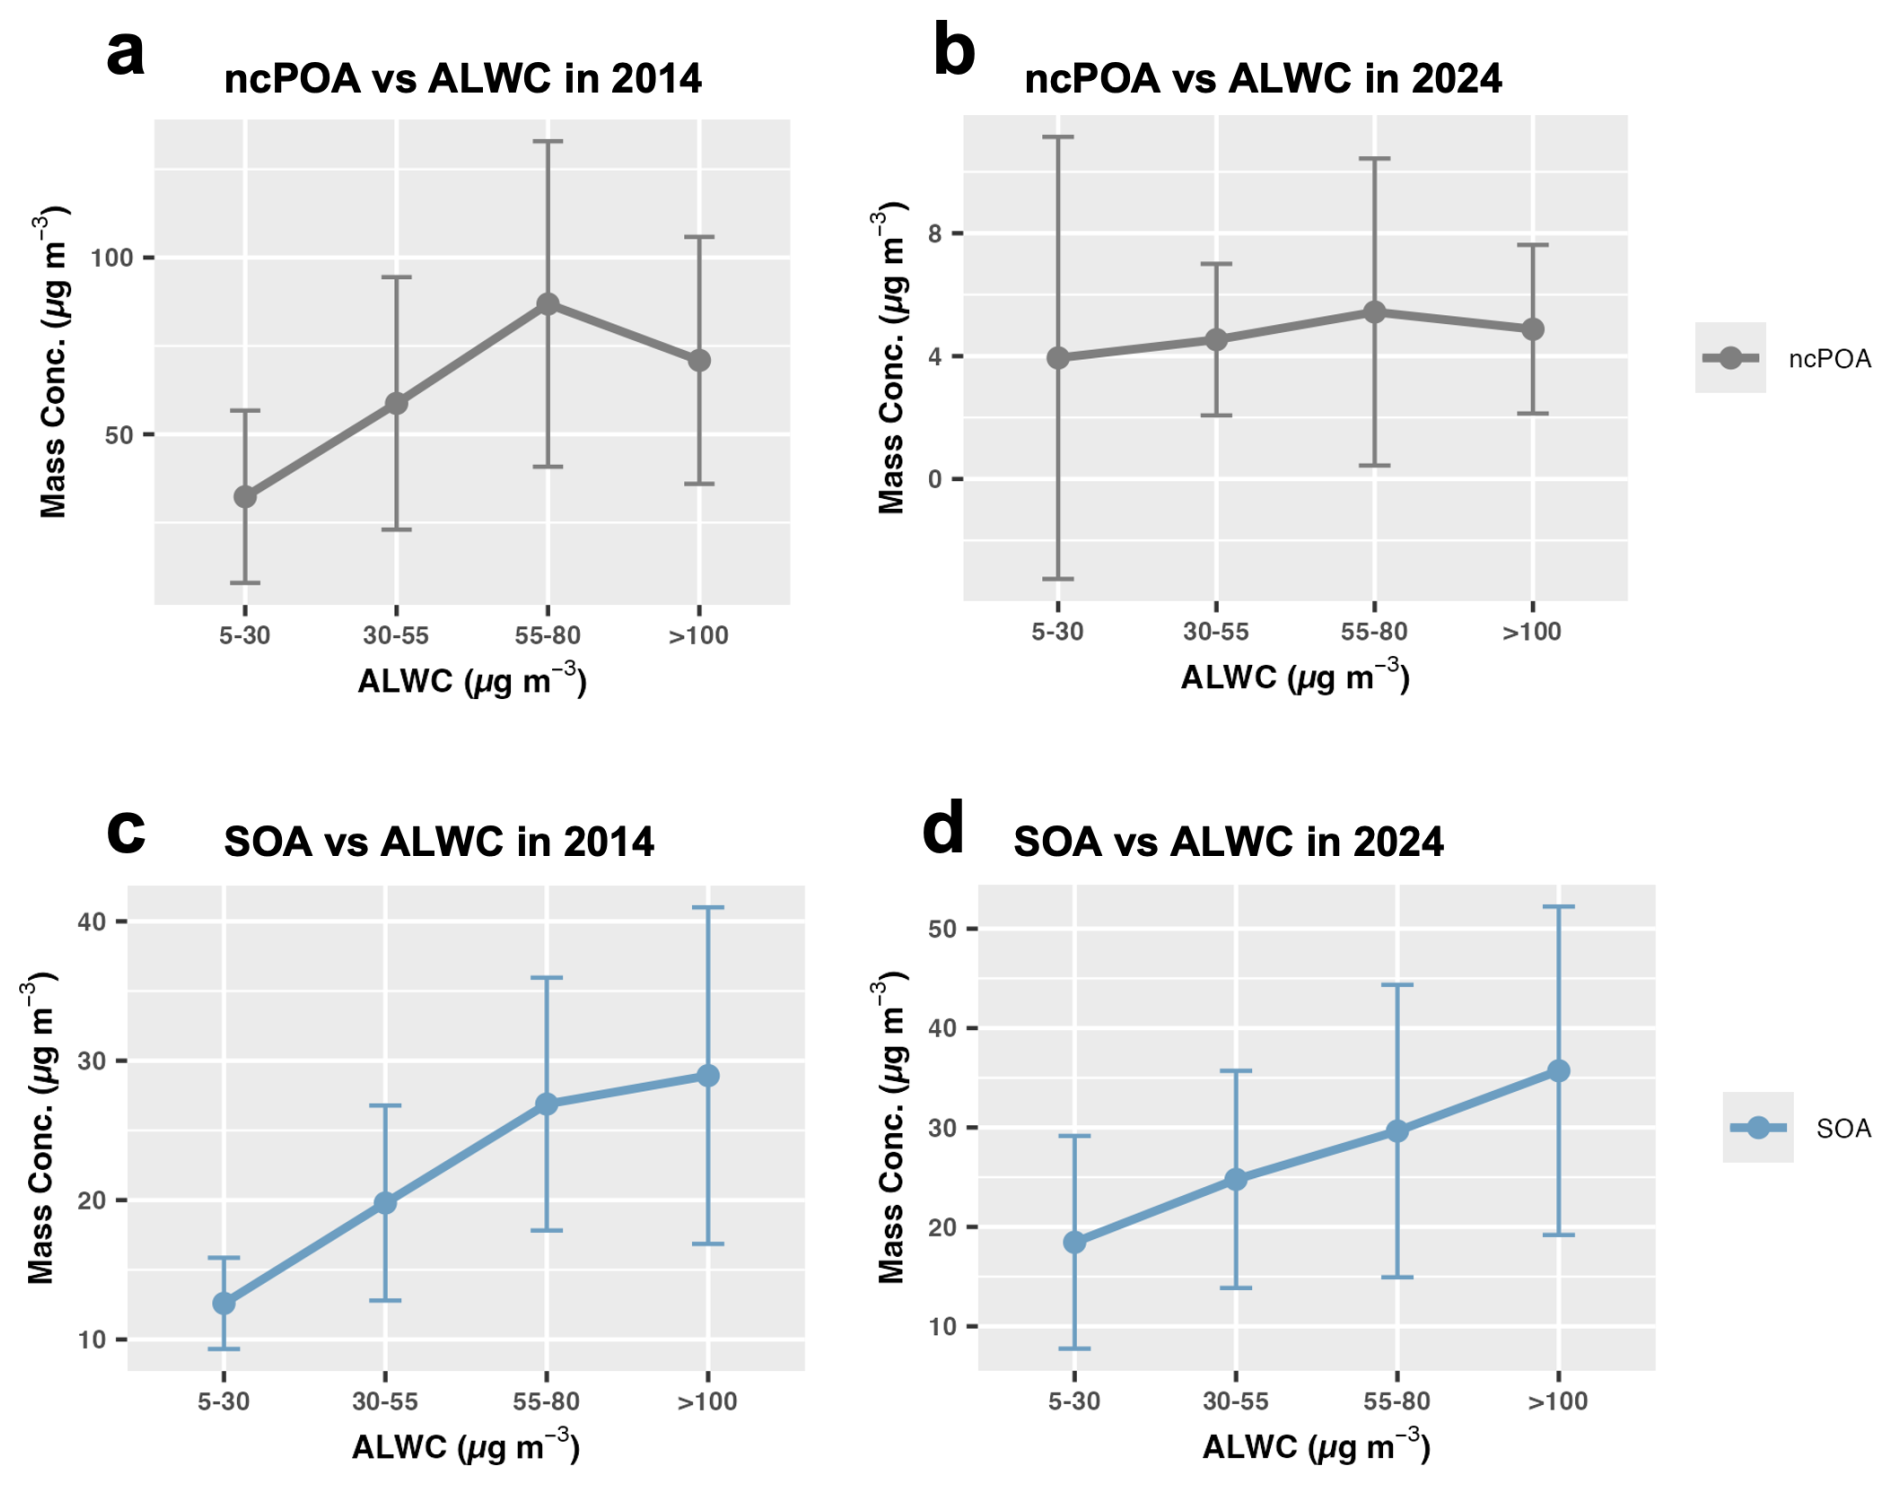
Figure 2Organic Aerosol Subtypes vs. ALWC. Variation of non-cooking primary organic aerosol (ncPOA) and secondary organic aerosol (SOA) across different ALWC ranges in 2014 (a, b) and in 2024 (c, d). The error bars represent one standard deviation. Only RH from 35 %–95 % was considered.
Similarly, plotting SOA against relative humidity (RH) reveals that as RH increases, SOA levels also rise (Fig. S11 in the Supplement). The mean SOA in different RH brackets increased from 15.6–27.9 µg m−3 in 2024, while in 2014, it rose from 21.9–28.9 µg m−3 as RH increased from 35 %–95 % (Fig. S11). The positive correlation between SOA and RH suggests that RH modulates aqueous phase reactions, facilitating SOA formation, consistent with previous studies indicating enhanced SOA production at high RH (Huang et al., 2019; Lin et al., 2020). In contrast to SOA, ncPOA reached a plateau at high RH, with mean concentrations ranging from 58.4–60.9 µg m−3 at RH levels above 55 % in 2014, and from 4.4–5.0 µg m−3 in 2024. While the continuous increase in SOA at high RH suggests enhanced SOA formation through heterogeneous reactions, the plateau in ncPOA concentrations at high RH may indicate either that ncPOA emissions ceased at high RH (which is unlikely) or that ncPOA was converted to SOA through aging processes. This conversion likely requires an oxidizing environment, and the increasing ozone (O3) concentrations observed in recent winters may reflect a more oxidizing atmosphere (Fig. S9). Consequently, more ncPOA is likely converted to SOA during transport.
POA aging and its conversion into SOA aligns with findings from winter case studies in Beijing, suggesting that ncPOA aging may partly explain the recent increase in SOA levels during the case study in Beijing (Wang et al., 2021). Consistently, in Shijiazhuang winter, our previous study identified a POA-aging factor using ACSM-PMF method (Lin et al., 2020). This factor was traced to the aging of primary emissions from biomass burning and coal combustion. In 2024, an aged BBOA factor (regarded as SOA) was directly identified from AMS-PMF (Fig. S7). The identification of this POA-aging factor in both 2014 and 2024 provides direct evidence that POA from these combustion sources can undergo chemical aging processes, especially under high ALWC conditions. During such aging, POA are oxidized and transformed into low-volatility SOA species, leading to a measurable reduction in ncPOA while concurrently increasing SOA mass.
In 2014, ncPOA was relatively well simulated (Fig. 3a). However, in 2024, ncPOA concentrations were overestimated by more than 100 % (Fig. 3b). In contrast, SOA levels were underestimated by approximately 60 %. The base run considered the default SOA formation mechanism, which includes ncPOA evaporation (S/IVOCs) and subsequent aging driven by hydroxyl (OH) radicals in addition to aromatics and aqueous phase chemistry related to the uptake of glyoxal and methylglyoxal. The underestimation of SOA can be partly attributed to insufficient consideration of the conversion of ncPOA at high RH levels, which may not necessarily be driven by OH radicals. This factor has likely become more important in recent years due to a more oxidizing environment (Fig. S7). The overestimation of ncPOA in 2024 suggests that a greater fraction of ncPOA should be converted to SOA.
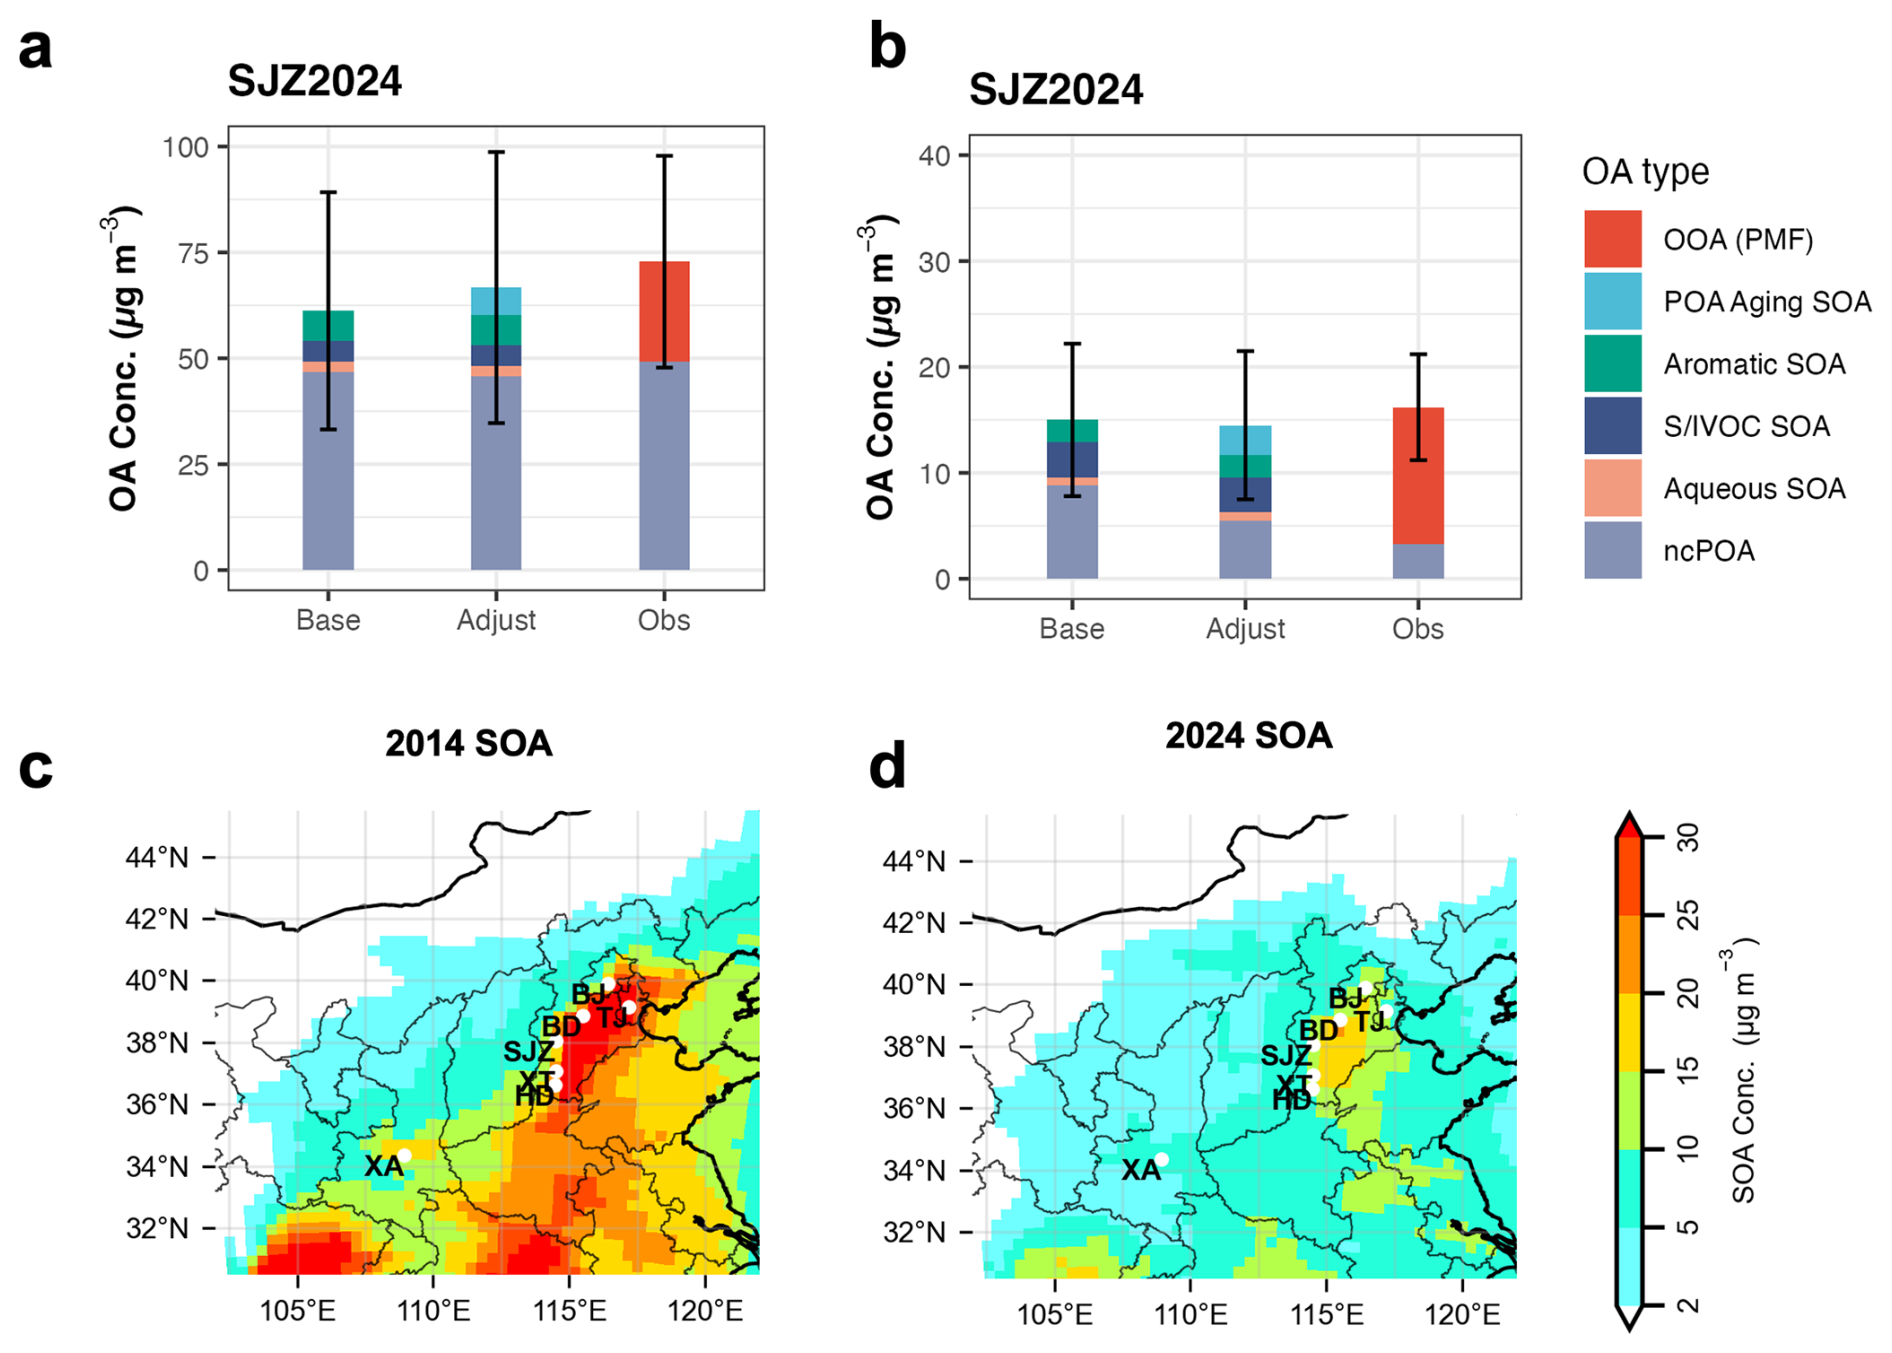
Figure 3SOA Underestimation in the Model. (a) the base run (Base), and the adjusted (Adjust) CMAQ model for SJZ in 2014, along with (b) the corresponding data for 2024 as a comparison to the observation (Obs) from PMF result. (c) Distribution of the adjusted SOA in 2014 and (d) in 2024 during the pollution period. Error bars indicate one standard deviation.
In this study, emissions from SJZ set to zero for January 2014 and 2024 to study the local vs. regional transport of ncPOA, which can be converted into SOA during transport. The differences between simulations with and without SJZ emissions were treated as the emissions impact. CMAQ simulations indicate that, on average, 39 % of ncPOA in 2014 was from regional transport, while 61 % originated from local emissions in SJZ. In 2024, 65 % was from local emissions and 35 % from regional transport. However, during pollution episodes (), approximately 50 % of ncPOA was sourced from regional transport in both 2014 and 2024 (Fig. S12 in the Supplement). Given the large contribution from regional ncPOA, accounting for the aging of transported ncPOA into SOA could help resolve these model-measurement discrepancies.
By adjusting the model with RH or ALWC-related parameters, we can improve SOA simulations and narrow the gap between simulated and observed SOA levels (see Methods). After these adjustments, SOA concentrations in NCP were elevated to over 10 µg m−3 in 2014 (Fig. 3c). In 2024, the mean SOA levels were reduced by 30 %–50 %, which is a smaller reduction compared to the more than 90 % decrease observed in ncPOA (Fig. 3b and d). In 2024, SOA constituted approximately 60 % of the total OA for the adjusted model (Table S2 in the Supplement) and 75 % of the total OA for the observed OA (Fig. 3b), highlighting its dominance over POA. As a result, the aging of POA under high RH, which leads to the formation of SOA, contributed to 25 %–50 % of the total SOA in 2014–2024 (Fig. 4). Additionally, SOA generated from the oxidation of intermediate and semi volatile compounds comprised 19 %–24 % of the total. Aromatic precursor oxidation accounted for 8 %–11 % of the SOA, while SOA resulting from aqueous phase chemistry involving glyoxal and methylglyoxal contributed 22 %–38 %. Compared to 2014, the contribution of the POA aging to total SOA increased substantially in 2024, becoming the dominant component (approximately 50 %) in most cities, while the proportions of the aqueous reactions, S/I VOCs and Aromatic oxidation all declined to varying degrees (Fig. 4). Note that biogenic SOA was not considered in the CMAQ configuration. However, given a reduced emission of biogenic VOCs in winter, SOA formation potential from biogenic SOA was less important in winter than in summer (Dou et al., 2025), and may have a minor impact on the overall contribution of the anthropogenic sources.
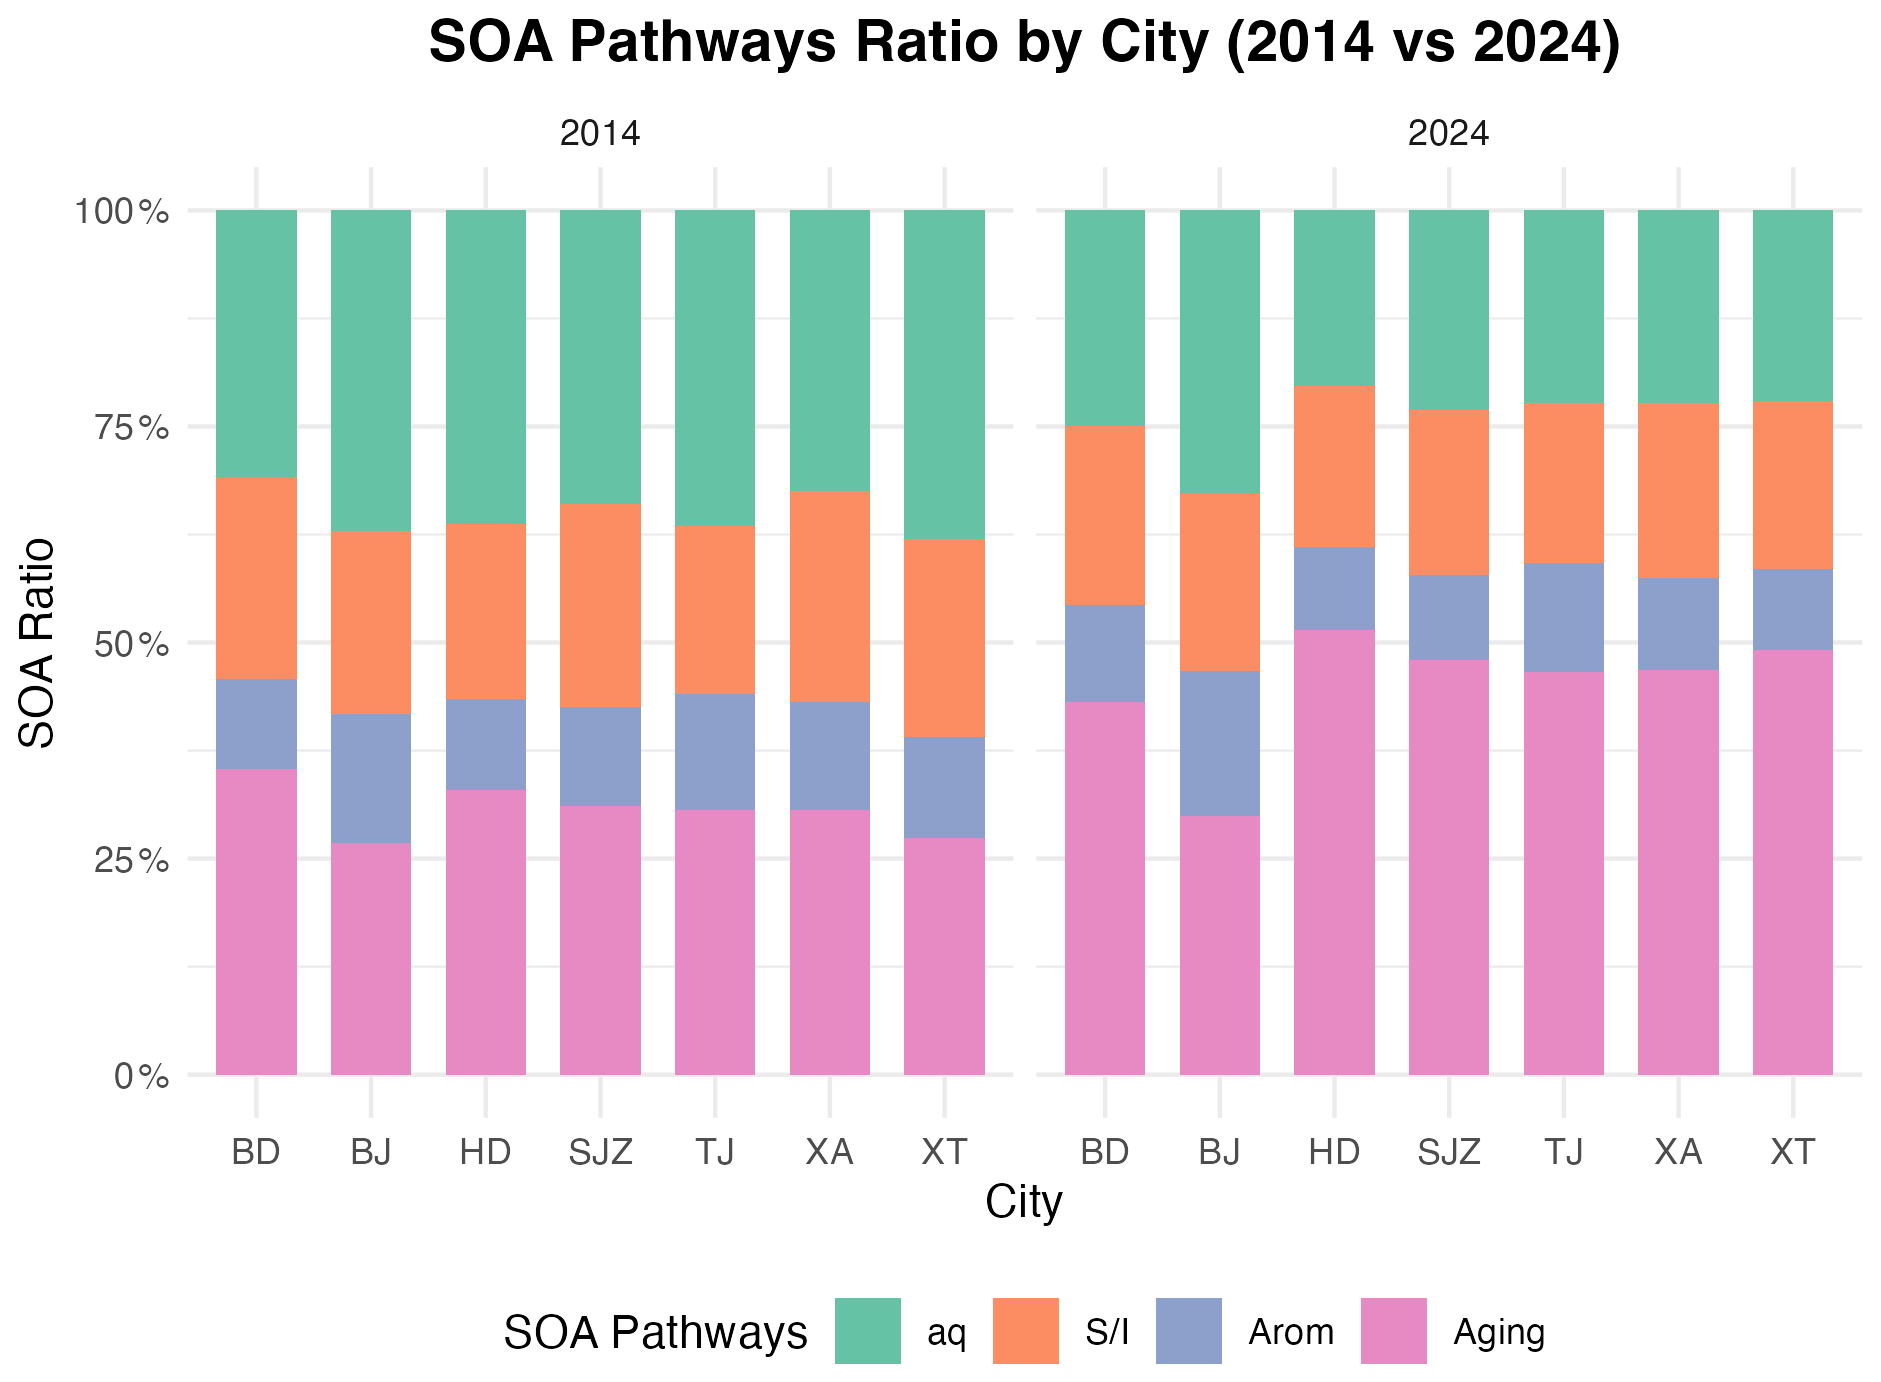
Figure 4Fraction of different SOA formation pathways in cities of Baoding (BD), Beijing (BJ), Handan (HD), Shijiazhuang (SJZ), Tianjin (TJ), Xi'an (XA), and Xingtai (XT) in 2014 vs. 2024.
3.3 Rising contribution of SOA to the total OA Amidst Emission Reduction
As discussed in Sect. 3.1, the measured OA were reduced by an average of 79 %. However, different types of organic aerosols were reduced to varying extents, with ncPOA decreasing by 93 % and OOA by 16 % from 2014–2024. POA is directly emitted from emission sources. By utilizing the emission inventory while keeping meteorological parameters constant, we can simulate how emissions reductions contributed to this decrease in 2024 compared to 2014 (Fig. 5 and Table S1).
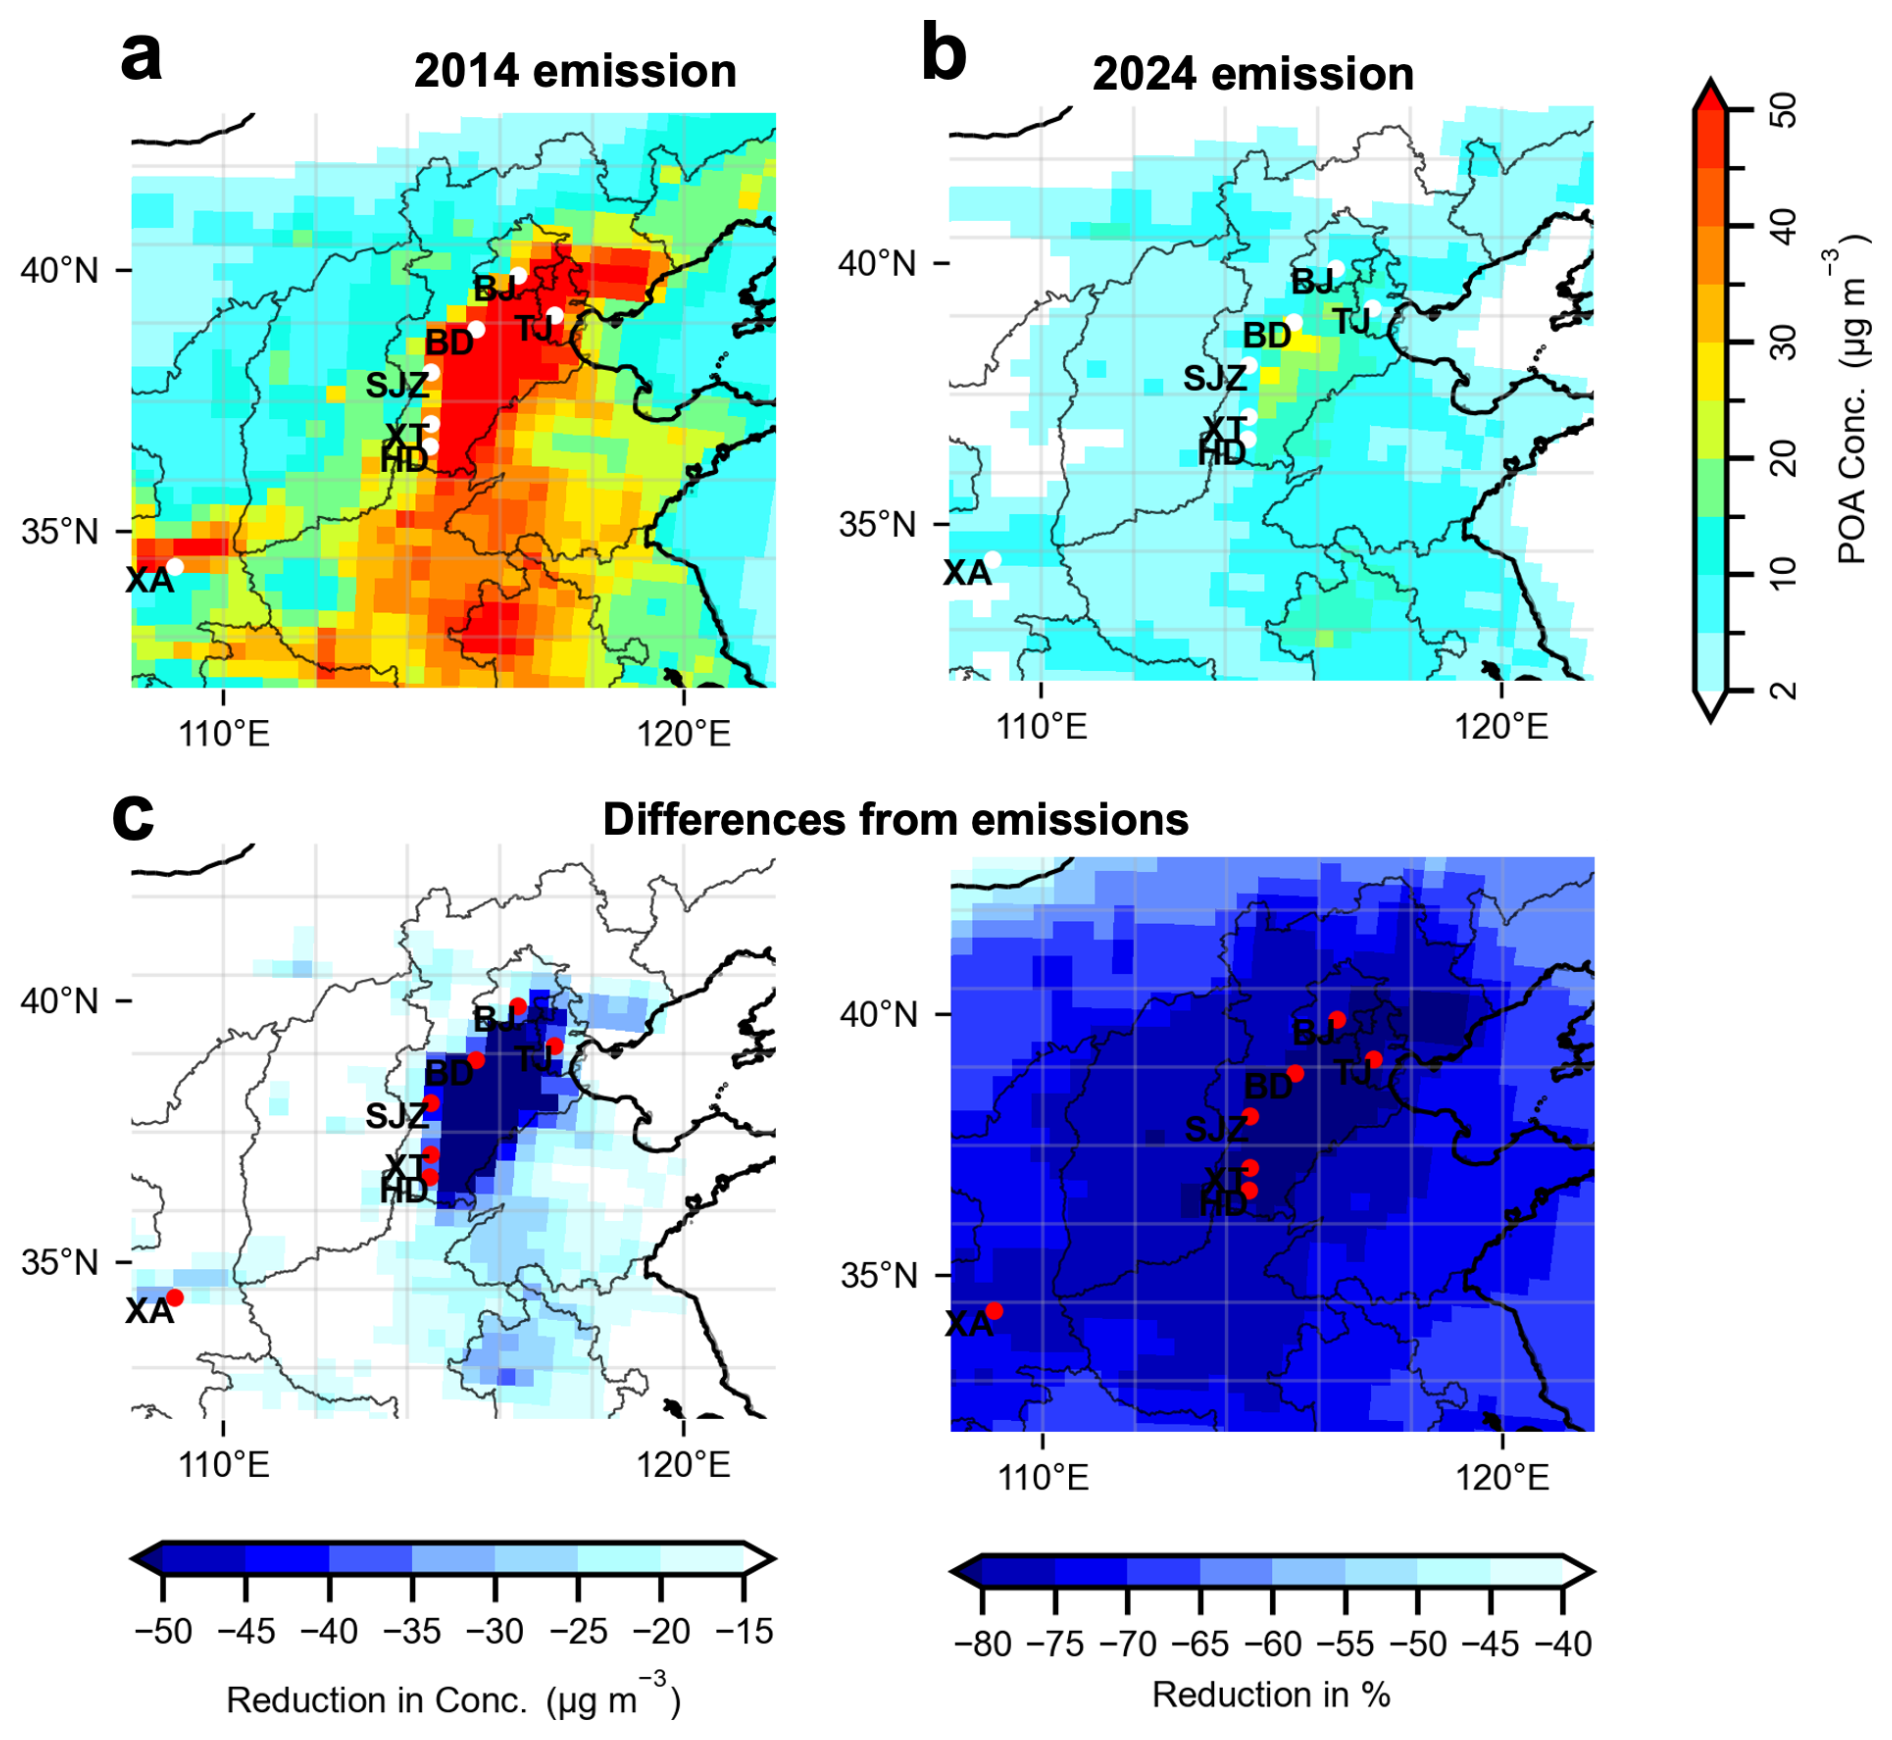
Figure 5Emission Reduction Explains the Reduction in POA. CMAQ simulated monthly mean POA concentrations in (a) scenario using MEIC 2014 + Meteorology 2024; (b) base run with MEIC 2024 + Meteorology 2024. The difference (in µg m−3) due to emission is shown in (c) (equivalent to b−a) and in percentages (equivalent to ).
Figure 5a shows the mean POA concentrations using the 2014 emission inventory alongside the 2024 meteorological fields, while Fig. 5b presents mean POA concentrations with the 2024 emission inventory and the 2024 meteorological fields. The differences between these two scenarios highlight the impact of emissions reduction (Fig. 5c). In the 2014 emissions scenario, POA concentrations were elevated across the NCP and the Fenwei Plain (FWP), with average concentrations around 50 µg m−3. Notably, POA concentrations in Shijiazhuang (SJZ), Beijing (BJ), Tianjin (TJ), Baoding (BD), Xingtai (XT), Handan (HD), and Xi'an (XA) were comparable, indicating widespread regional air pollution affecting multiple cities with hundreds of millions of residents.
In contrast, the 2024 emissions scenario showed a substantial reduction in POA concentrations, decreasing by up to 70 %, with mean concentrations ranging from 1–10 µg m−3 in the North China Plain (NCP) and Fenwei Plain (FWP). This reduction indicates that emission decrease accounts for approximately 30–40 µg m−3 of the decline in POA levels in these regions, representing approximately 70 % of the overall reduction. Thus, the modeled decrease in emission strength explains the majority of the observed reduction.
Figure S13 in the Supplement shows the impact of meteorological variations on modeled POA concentrations in January 2024 compared to 2014, accounting for about a 10 % reduction attributed to these variations. In Fig. S13, we compared mean POA concentrations using 2014 meteorological conditions alongside 2024 emissions with those under 2024 meteorological conditions and the same emissions. The differences between these two scenarios highlight the influence of meteorological factors. The results indicate that mean POA concentrations under the 2014 meteorological conditions were higher than those under the 2024 conditions. Overall, the emission reduction explained approximately 70 % of POA in the NCP, with meteorological conditions contributing to an additional reduction of around 10 %. The remaining unexplained reduction of 10 %–20 % in POA is likely due to the conversion of POA to SOA, as discussed in Sect. 3.2.
3.4 Comparable Reduction in other Cities
Starting in 2013, China initiated two phases of clean air actions: Phase 1 (2013–2017) and Phase 2 (2018–2020). The years 2021-2024 are considered Phase 3, following these initial phases. Figure 6 illustrates the evolution of PM2.5 during the heating periods (from November to the next March) across Phases 1, 2, and 3 for the seven cities. From Phase 1 to Phase 2, reductions were greater in the six cities of the NCP, with mean concentrations decreasing from 58–106 µg m−3 in Phase 1 to 38–73 µg m−3 in Phase 2. However, from Phase 2 to Phase 3, the reduction was less pronounced, with some cities experiencing a plateau or even a slight rebound, resulting in PM2.5 concentrations around 30–52 µg m−3. An overall reduction in regional PM2.5 has been observed for major cities in the NCP and FWP over the last decade (Fig. 6). This trend is consistent with the modeling results that compare 2024–2014 (Fig. 3), highlighting a regional decrease in PM2.5 concentrations attributed to emission reductions over the past decade.
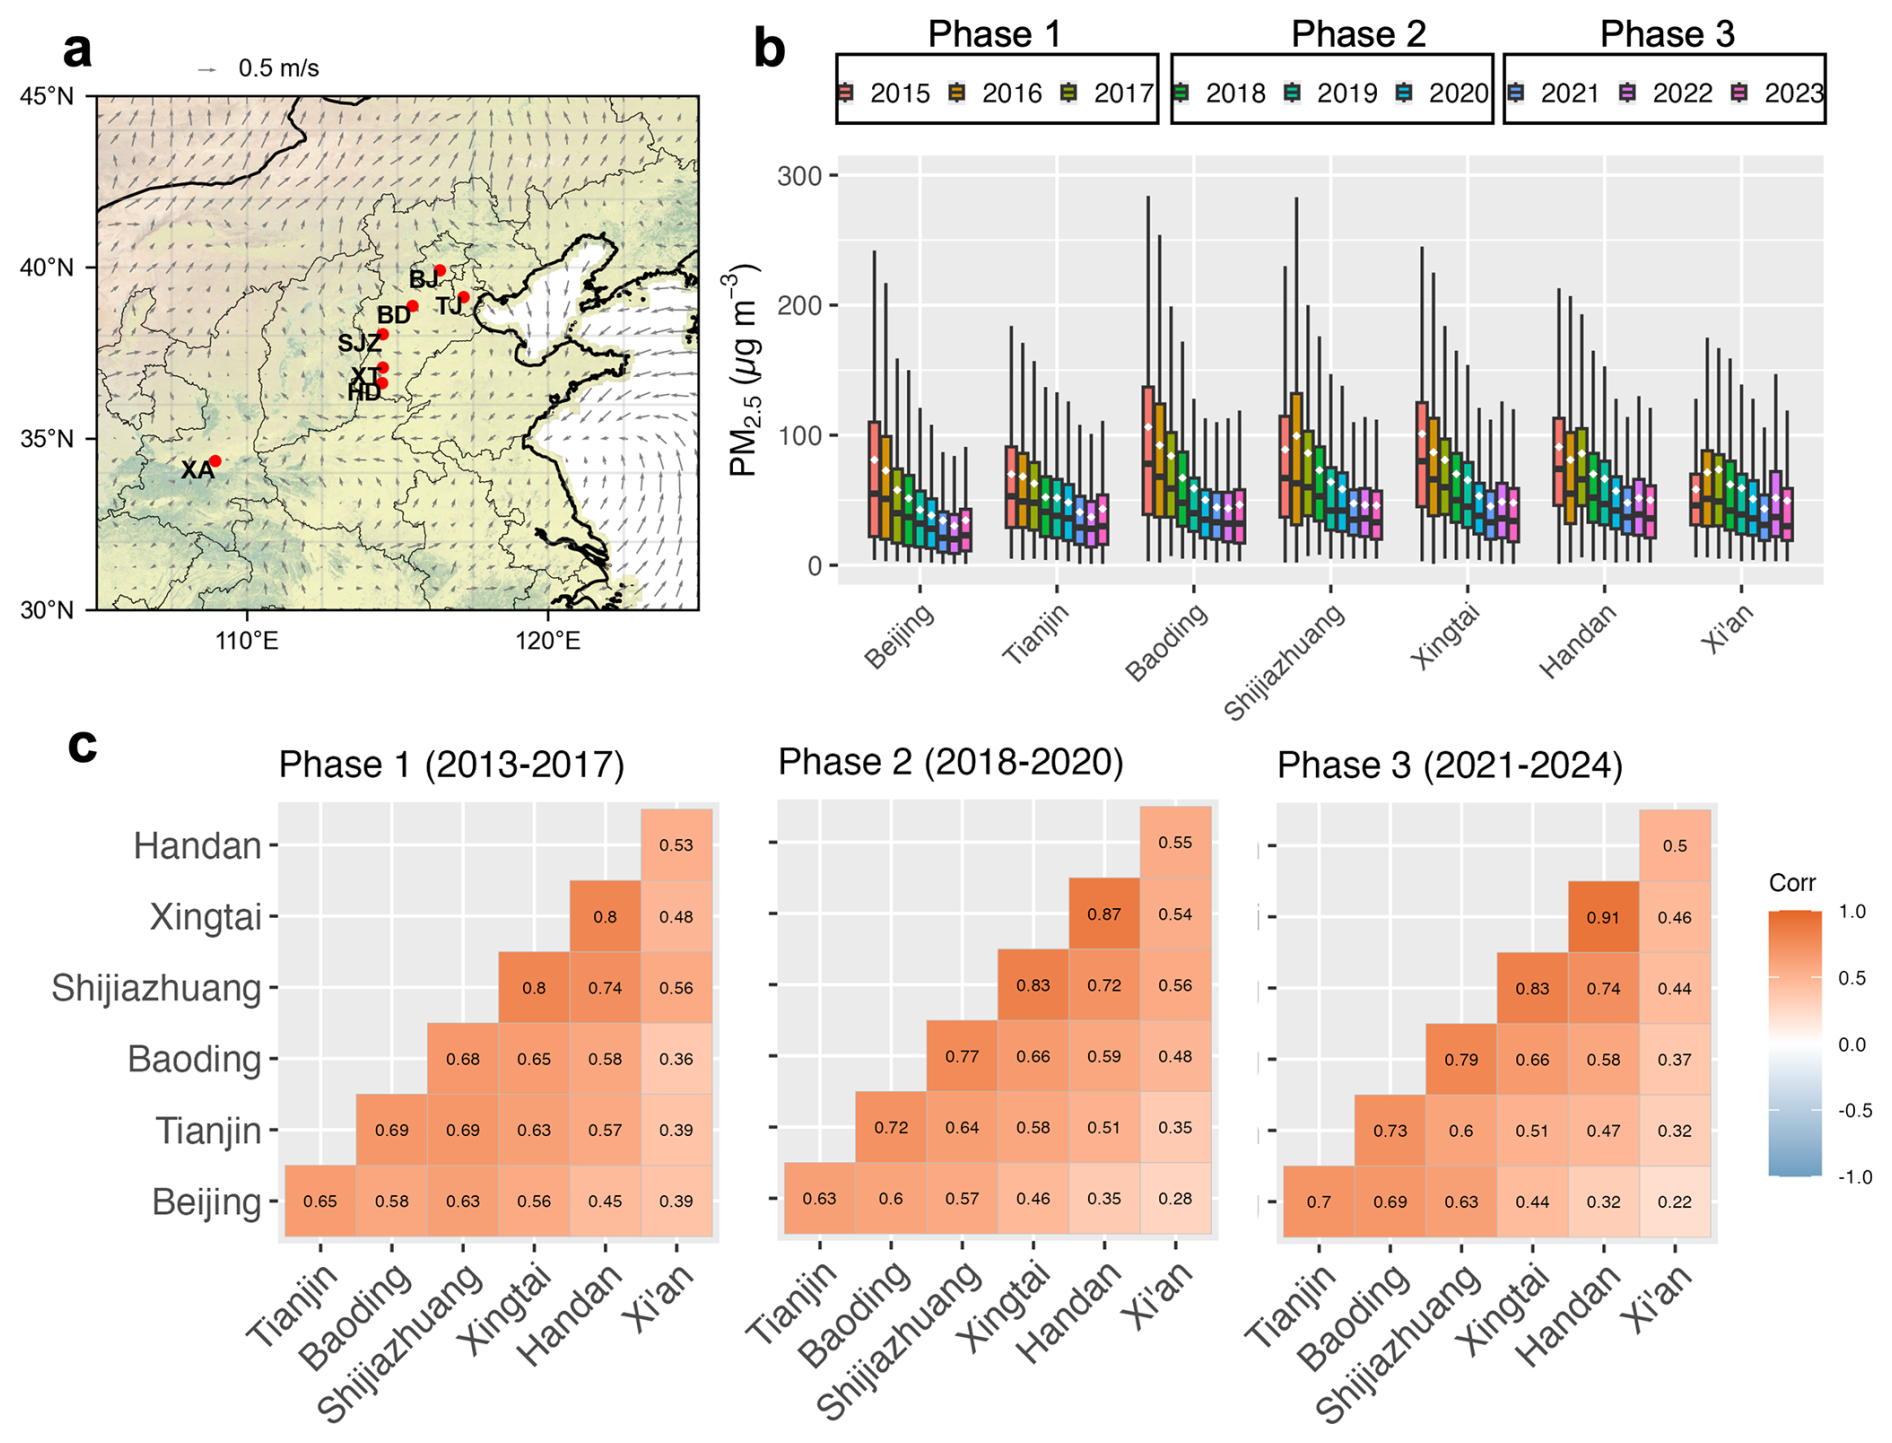
Figure 6Regional reduction in PM. The wind field at ground level (a); box plot of PM2.5 concentrations during the heating period (15 November–15 March) for the cities of Beijing, Tianjin, Shijiazhuang, Xingtai, Handan, and Xi'an. The years 2013–2017 are considered Phase 1 of the Clean Air Action Plan, 2018–2020 as Phase 2 of the three-year action plan to win the blue sky war, and 2021–2024 as Phase 3. Only three full years of measurements are included in (b). The correlation coefficient (r) between the seven cities for winter across the three phases is also shown.
Xi'an (XA), the largest city in the FWP, exhibited different PM2.5 variations compared to cities in the NCP. At the end of Phase 1, PM2.5 concentrations increased slightly from 58–74 µg m−3, followed by a reduction in Phase 2 (from 62–51 µg m−3), and a rebound during Phase 3 (from 43–50 µg m−3). The differences in PM2.5 variations between XA and other NCP cities are linked to emissions patterns in the Guanzhong Basin, which is more isolated from NCP emissions. Figure 6a illustrates the wind fields during haze periods at ground level. The wind patterns reveal anticyclonic flow at low speeds in NCP, while the winds in FWP were more stagnant, indicating that emissions were confined within the basin rather than being influenced by external sources. This observation aligns with previous studies in Xi'an that often saw higher pollution levels than in NCP (Zhong et al., 2020; Lin et al., 2023), whereas pollution in NCP has been primarily associated with southerly winds transporting emissions from nearby sources (Daellenbach et al., 2024). Figure 6c demonstrates that from Phase 1 to Phase 3, the correlation between PM2.5 time series in NCP cities remain similarly elevated if not slightly increased. For example, the correlation coefficients (r) between BJ and TJ, BD, and SJZ were 0.65, 0.58, and 0.63 during Phase 1, 0.63, 0.60, and 0.57 during Phase 2, and 0.70, 0.69, and 0.63 in Phase 3. The correlation between SJZ and XT and HD was 0.80 and 0.74 in Phase 1, 0.83 and 0.72 in Phase 2, and remained 0.83 and 0.74 in Phase 3. In contrast, the correlation with XA and other cities remained low, ranging from 0.39–0.56 in Phase 1, 0.28–0.56 in Phase 2, and 0.22–0.50 in Phase 3. Thus, the high correlations among PM2.5 levels in NCP cities highlight the increased importance of regional transport, while the lower correlations with XA indicate isolated emission sources in the FWP.
Removing emissions from SJZ alone was insufficient to reduce PM2.5 levels to safe standards of less than 25 µg m−3 (Fig. S14 in the Supplement). This is largely due to the fact that approximately half of the PM2.5 in SJZ was transported from outside the city (Fig. S14). However, the transport of pollutants appears similar in both 2014 and 2024. During pollution episodes (), around 56 %–60 % of PM2.5 were transported from regional sources and the remaining 40 %–44 % were attributed to local emissions (Fig. S14). During relatively clean periods (), approximately 46 %–51 % of PM2.5 originates from local sources, while 49 %–54 % is derived from regional transport, highlighting the need for a coordinated regional effort to further reduce PM2.5 levels across the NCP.
Figure S15 in the Supplement shows the contributions of five key sectors (in µg m−3) to the total PM2.5 in January 2014 and 2024: power generation, industry (including industrial boilers, cement production, iron production, and other processes), residential burning (covering domestic biomass and fossil fuel burning), transportation (both on-road and off-road vehicles), and agriculture. In both years, residential domestic burning was the primary contributor to PM2.5, accounting for approximately 51 % of PM2.5 in 2014 % and 48 % in 2024. The industrial sector followed as the second-largest contributor, representing about 34 % of PM2.5 in 2014 % and 33 % in 2024. Combined, traffic, power generation, and agriculture accounted for 15 % of total PM2.5 in 2014, with a similar level of 18 % in 2024. When comparing contributions between 2024 and 2014, the domestic sector experienced a large reduction, decreasing from 68.5 µg m−3in 2014 to 22.4 µg m−3 in 2024 – a reduction of 67 %. The industrial sector also saw a notable decrease of 65 %, from 44.7 µg m−3 in 2014 to 15.6 µg m−3 in 2024. Other sectors contributed minimally to PM2.5, but the reductions in these areas exhibited greater uncertainty, as indicated by larger error bars. The dominant contribution of residential and industrial emissions aligns with modelling results from other regions in other BTH area (Chang et al., 2019). This highlights the importance of targeting residential burning and industry in future mitigation strategies. Given the similar temporal and spatial distributions of sub-sectors within each major sector, it is feasible to estimate contributions from more detailed sectors based on specific emission rates. For instance, in SJZ, domestic biomass burning accounted for 57 % of the primary PM2.5 emissions, with the remaining 43 % from fossil fuel combustion. Domestic burning SO2, a precursor of sulfate, was predominantly from domestic fossil fuel burning. In the industrial sector, industrial boilers, cement production, and steel manufacturing were responsible for 82 % of the primary PM2.5 emissions, with the rest coming from other industrial activities. Additionally, pollutants from domestic sources are primarily emitted at ground level, resulting in a larger impact compared to emissions from elevated industrial sources.
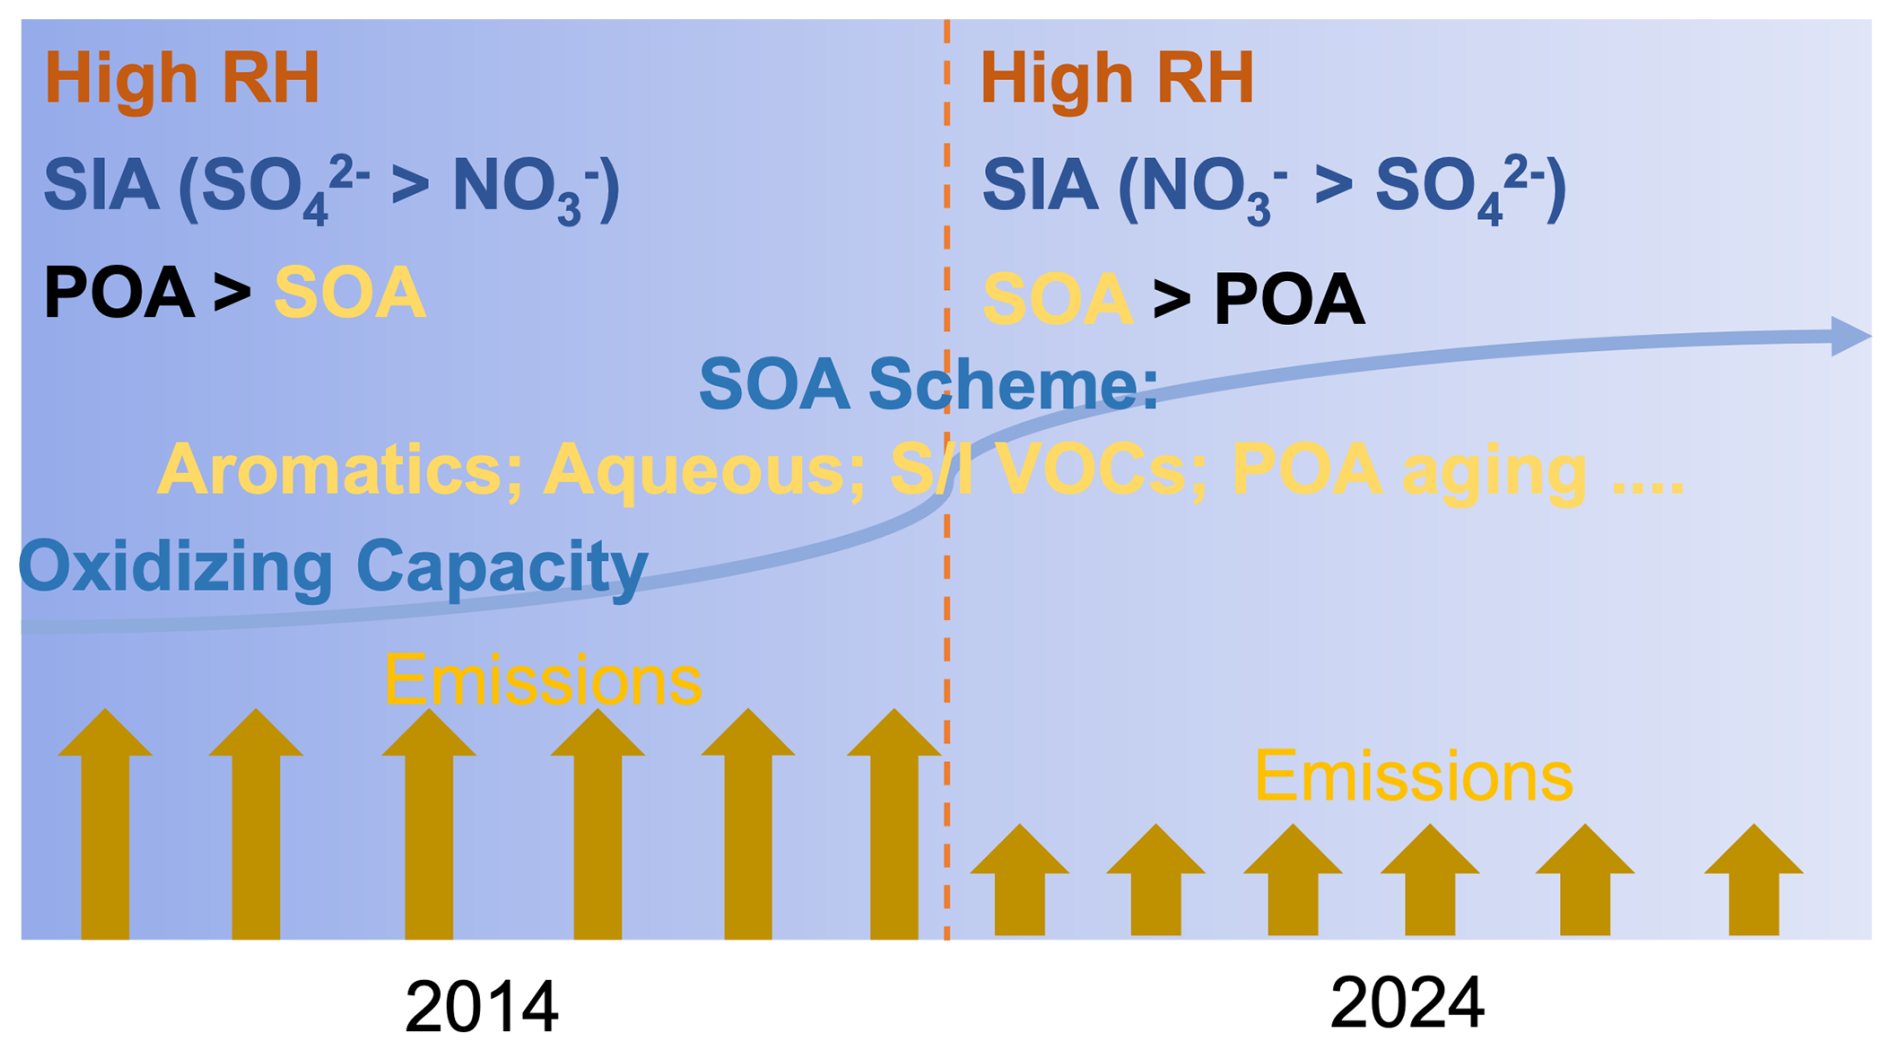
Figure 7Conceptual schematic illustrating the variations in chemical components (shift from sulfate to nitrate) and aerosol sources (shift from POA to SOA) from 2014–2024 against a backdrop of emission reductions.
In conclusion, organics remain the most important component of non-refractory PM (NR-PM) in 2024. Emission reductions account for 70 % of the decrease in POA compared to 2014, with meteorological conditions contributing an additional 10 %. Haze pollution in 2024 was characterized by high RH and ALWC, with nitrate levels exceeding those of sulfate and SOA levels surpassing POA levels, representing a reversal of the situation in 2014. This was found in the context of increasing oxidizing capacity as summarized in Fig. 7. Therefore, further reductions in VOCs and NOx could lead to additional decreases in overall aerosol pollution levels. The transport of pollutants appears similar in both 2014 and 2024 during pollution episodes, with approximately half of PM2.5 transporting from regional transport , highlighting the need for coordinated regional efforts to further reduce PM2.5 levels across the NCP. The positive correlation between SOA and RH or ALWC suggests that RH and RH-related ALWC modulates aqueous phase reactions (particularly the POA aging processes the aerosol phase), facilitating SOA formation in both 2014 and 2024. Accounting for the aging of transported ncPOA into SOA could help reconcile these model-measurement discrepancies. This factor is likely becoming increasingly important given the rising levels of oxidants.
The CMAQ (v5.4) code is created by US EPA and is publicly available at: https://github.com/USEPA/CMAQ (last access: 1 February 2026; https://doi.org/10.5281/zenodo.7218076, US EPA Office of Research and Development, 2022).
Source data for this study is available at https://doi.org/10.5281/zenodo.18315918 (Lin, 2026). It is also available from the corresponding author upon request.
The supplement related to this article is available online at https://doi.org/10.5194/acp-26-2635-2026-supplement.
C.L. and R.J.H. Designed the study, C.L. wrote the main manuscript text, C.L. prepared all figures. C.L., J.D., J.Q., J.L., Yi L., Yan L., W.H., W.X., and Y.Z, conducted the field sampling, S.L., Q.Z, Q.L., Z.L., D.D.H., C.H., and H.W provided guidance on the research design and contributed to the interpretation of results, R.J.H. coordinated the project. All authors read and approved the final version of the manuscript.
The contact author has declared that none of the authors has any competing interests.
Publisher's note: Copernicus Publications remains neutral with regard to jurisdictional claims made in the text, published maps, institutional affiliations, or any other geographical representation in this paper. The authors bear the ultimate responsibility for providing appropriate place names. Views expressed in the text are those of the authors and do not necessarily reflect the views of the publisher.
This work was supported by the National Natural Science Foundation of China (NSFC) under grant-nos.: 42525301, 42277092, 42430708, and 42107126, the Key Research Program of Frontier Sciences from the Chinese Academy of Sciences (ZDBS-LY-DQC001), the Shaanxi Innovation Team for Science and Technology (2024RS-CXTD-40), the Shaanxi Innovation Capability Support Plan – Youth Science and Technology Star Project (2024ZC-KJXX-055), and the Natural Science Basic Research Program of Shaanxi Province (2023-JC-QN-0319).
This research has been supported by the National Natural Science Foundation of China (grant nos. 42525301, 42277092, 42430708, and 42107126), the Key Research Program of Frontier Sciences from the Chinese Academy of Sciences (grant no. ZDBS-LY-DQC001), the Shaanxi Innovation Team for Science and Technology (grant no. 2024RS-CXTD-40), the Shaanxi Innovation Capability Support Plan – Youth Science and Technology Star Project (grant no. 2024ZC-KJXX-055), and the Natural Science Basic Research Program of Shaanxi Province (grant no. 2023-JC-QN-0319).
This paper was edited by Guangjie Zheng and reviewed by three anonymous referees.
Chang, X., Wang, S., Zhao, B., Xing, J., Liu, X., Wei, L., Song, Y., Wu, W., Cai, S., Zheng, H., Ding, D., and Zheng, M.: Contributions of inter-city and regional transport to PM2.5 concentrations in the Beijing–Tianjin–Hebei region and its implications on regional joint air pollution control, Sci. Total Environ., 660, 1191–1200, 2019.
Chang, X., Zhao, B., Zheng, H., Wang, S., Cai, S., Guo, F., Gui, P., Huang, G., Wu, D., Han, L., Xing, J., Man, H., Hu, R., Liang, C., Xu, Q., Qiu, X., Ding, D., Liu, K., Han, R., Robinson, A. L., and Donahue, N. M.: Full-volatility emission framework corrects missing and underestimated secondary organic aerosol sources, One Earth, 5, 403–412, 2022.
Chen, Q., Miao, R., Geng, G., Shrivastava, M., Dao, X., Xu, B., Sun, J., Zhang, X., Liu, M., Tang, G., Tang, Q., Hu, H., Huang, R.-J., Wang, H., Zheng, Y., Qin, Y., Guo, S., Hu, M., and Zhu, T.: Widespread 2013–2020 decreases and reduction challenges of organic aerosol in China, Nat. Commun., 15, 4465, https://doi.org/10.1038/s41467-024-48902-0, 2024.
Daellenbach, K. R., Cai, J., Hakala, S., Dada, L., Yan, C., Du, W., Yao, L., Zheng, F., Ma, J., Ungeheuer, F., Vogel, A. L., Stolzenburg, D., Hao, Y., Liu, Y., Bianchi, F., Uzu, G., Jaffrezo, J.-L., Worsnop, D. R., Donahue, N. M., and Kulmala, M.: Substantial contribution of transported emissions to organic aerosol in Beijing, Nat. Geosci., 17, 747–754, 2024.
Dou, J., Liu, T., Ge, D., Zhang, Y., Yin, J., Wang, L., Liu, H., Li, D., Niu, G., Chen, L., Wang, J., Qi, X., Nie, W., Chi, X., Huang, X., and Ding, A.: In-situ secondary organic aerosol formation from ambient air in suburban Eastern China: Substantially distinct characteristics between summer and winter, Atmos. Environ., 356, 121295, https://doi.org/10.1016/j.atmosenv.2025.121295, 2025.
Duan, J., Huang, R.-J., Wang, Y., Xu, W., Zhong, H., Lin, C., Huang, W., Gu, Y., Ovadnevaite, J., Ceburnis, D., and O'Dowd, C.: Measurement report: Size-resolved secondary organic aerosol formation modulated by aerosol water uptake in wintertime haze, Atmos. Chem. Phys., 24, 7687–7698, https://doi.org/10.5194/acp-24-7687-2024, 2024.
Elser, M., Huang, R.-J., Wolf, R., Slowik, J. G., Wang, Q., Canonaco, F., Li, G., Bozzetti, C., Daellenbach, K. R., Huang, Y., Zhang, R., Li, Z., Cao, J., Baltensperger, U., El-Haddad, I., and Prévôt, A. S. H.: New insights into PM2.5 chemical composition and sources in two major cities in China during extreme haze events using aerosol mass spectrometry, Atmos. Chem. Phys., 16, 3207–3225, https://doi.org/10.5194/acp-16-3207-2016, 2016.
Fountoukis, C. and Nenes, A.: ISORROPIA II: a computationally efficient thermodynamic equilibrium model for K+–Ca2+–Mg2+––Na+–––Cl−–H2O aerosols, Atmos. Chem. Phys., 7, 4639–4659, https://doi.org/10.5194/acp-7-4639-2007, 2007.
Geng, G., Zheng, Y., Zhang, Q., Xue, T., Zhao, H., Tong, D., Zheng, B., Li, M., Liu, F., Hong, C., He, K., and Davis, S. J.: Drivers of PM2.5 air pollution deaths in China 2002–2017, Nat. Geosci., 14, 645–650, 2021.
Geng, G., Liu, Y., Liu, Y., Liu, S., Cheng, J., Yan, L., Wu, N., Hu, H., Tong, D., Zheng, B., Yin, Z., He, K., and Zhang, Q.: Efficacy of China's clean air actions to tackle PM2.5 pollution between 2013 and 2020, Nat. Geosci., 17, 987–994, 2024.
Huang, R.-J., Zhang, Y., Bozzetti, C., Ho, K.-F., Cao, J.-J., Han, Y., Daellenbach, K. R., Slowik, J. G., Platt, S. M., Canonaco, F., Zotter, P., Wolf, R., Pieber, S. M., Bruns, E. A., Crippa, M., Ciarelli, G., Piazzalunga, A., Schwikowski, M., Abbaszade, G., Schnelle-Kreis, J., Zimmermann, R., An, Z., Szidat, S., Baltensperger, U., Haddad, I. E., and Prévôt, A. S. H.: High secondary aerosol contribution to particulate pollution during haze events in China, Nature, 514, 218–222, 2014.
Huang, R.-J., Wang, Y., Cao, J., Lin, C., Duan, J., Chen, Q., Li, Y., Gu, Y., Yan, J., Xu, W., Fröhlich, R., Canonaco, F., Bozzetti, C., Ovadnevaite, J., Ceburnis, D., Canagaratna, M. R., Jayne, J., Worsnop, D. R., El-Haddad, I., Prévôt, A. S. H., and O'Dowd, C. D.: Primary emissions versus secondary formation of fine particulate matter in the most polluted city (Shijiazhuang) in North China, Atmos. Chem. Phys., 19, 2283–2298, https://doi.org/10.5194/acp-19-2283-2019, 2019.
Huang, X., Liu, Z., Ge, Y., Li, Q., Wang, X., Fu, H., Zhu, J., Zhou, B., Wang, L., George, C., Wang, Y., Wang, X., Su, J., Xue, L., Yu, S., Mellouki, A., and Chen, J.: Aerosol high water contents favor sulfate and secondary organic aerosol formation from fossil fuel combustion emissions, npj Clim. Atmos. Sci., 6, 173, https://doi.org/10.1038/s41612-023-00504-1, 2023.
Jimenez, J. L., Canagaratna, M. R., Donahue, N. M., Prevot, A. S. H., Zhang, Q., Kroll, J. H., DeCarlo, P. F., Allan, J. D., Coe, H., Ng, N. L., Aiken, A. C., Docherty, K. S., Ulbrich, I. M., Grieshop, A. P., Robinson, A. L., Duplissy, J., Smith, J. D., Wilson, K. R., Lanz, V. A., Hueglin, C., Sun, Y. L., Tian, J., Laaksonen, A., Raatikainen, T., Rautiainen, J., Vaattovaara, P., Ehn, M., Kulmala, M., Tomlinson, J. M., Collins, D. R., Cubison, M. J., E., Dunlea, J., Huffman, J. A., Onasch, T. B., Alfarra, M. R., Williams, P. I., Bower, K., Kondo, Y., Schneider, J., Drewnick, F., Borrmann, S., Weimer, S., Demerjian, K., Salcedo, D., Cottrell, L., Griffin, R., Takami, A., Miyoshi, T., Hatakeyama, S., Shimono, A., Sun, J. Y., Zhang, Y. M., Dzepina, K., Kimmel, J. R., Sueper, D., Jayne, J. T., Herndon, S. C., Trimborn, A. M., Williams, L. R., Wood, E. C., Middlebrook, A. M., Kolb, C. E., Baltensperger, U., and Worsnop, D. R.: Evolution of Organic Aerosols in the Atmosphere, Science, 326, 1525–1529, 2009.
Kuang, Y., He, Y., Xu, W., Yuan, B., Zhang, G., Ma, Z., Wu, C., Wang, C., Wang, S., Zhang, S., Tao, J., Ma, N., Su, H., Cheng, Y., Shao, M., and Sun, Y.: Photochemical Aqueous-Phase Reactions Induce Rapid Daytime Formation of Oxygenated Organic Aerosol on the North China Plain, Environ. Sci. Technol., 54, 3849–3860, 2020.
Lin, C.: Data for SOA measurement and simulation paper in Shijiazhuang, Zenodo [data set], https://doi.org/10.5281/zenodo.18315918, 2026.
Lin, C., Huang, R.-J., Ceburnis, D., Buckley, P., Preissler, J., Wenger, J., Rinaldi, M., Facchini, M. C., O'Dowd, C., and Ovadnevaite, J.: Extreme air pollution from residential solid fuel burning, Nat. Sustain., 1, 512–517, 2018.
Lin, C., Huang, R.-J., Xu, W., Duan, J., Zheng, Y., Chen, Q., Hu, W., Li, Y., Ni, H., Wu, Y., Zhang, R., Cao, J., and O'Dowd, C.: Comprehensive Source Apportionment of Submicron Aerosol in Shijiazhuang, China: Secondary Aerosol Formation and Holiday Effects, ACS Earth Space Chem., 4, 947–957, 2020.
Lin, C., Huang, R.-J., Duan, J., Zhong, H., and Xu, W.: Primary and Secondary Organic Nitrate in Northwest China: A Case Study, Environ. Sci. Technol. Lett., 8, 947–953, 2021.
Lin, C., Huang, R.-J., Duan, J., Zhong, H., and Xu, W.: Polycyclic aromatic hydrocarbons from cooking emissions, Sci. Total Environ., 818, 151700, https://doi.org/10.1016/j.scitotenv.2021.151700, 2022.
Lin, C., Huang, R.-J., Zhong, H., Duan, J., Wang, Z., Huang, W., and Xu, W.: Elucidating ozone and PM2.5 pollution in the Fenwei Plain reveals the co-benefits of controlling precursor gas emissions in winter haze, Atmos. Chem. Phys., 23, 3595–3607, https://doi.org/10.5194/acp-23-3595-2023, 2023.
Liu, M., Huang, X., Song, Y., Tang, J., Cao, J., Zhang, X., Zhang, Q., Wang, S., Xu, T., Kang, L., Cai, X., Zhang, H., Yang, F., Wang, H., Yu, J. Z., Lau, A. K. H., He, L., Huang, X., Duan, L., Ding, A., Xue, L., Gao, J., Liu, B., and Zhu, T.: Ammonia emission control in China would mitigate haze pollution and nitrogen deposition, but worsen acid rain, P. Natl. Acad. Sci. USA, 116, 7760–7765, 2019.
McFall, A. S., Johnson, A. W., and Anastasio, C.: Air–Water Partitioning of Biomass-Burning Phenols and the Effects of Temperature and Salinity, Environ. Sci. Technol., 54, 3823–3830, 2020.
Nguyen, T. B., Coggon, M. M., Flagan, R. C., and Seinfeld, J. H.: Reactive Uptake and Photo-Fenton Oxidation of Glycolaldehyde in Aerosol Liquid Water, Environ. Sci. Technol., 47, 4307–4316, 2013.
Nie, W., Yan, C., Huang, D. D., Wang, Z., Liu, Y., Qiao, X., Guo, Y., Tian, L., Zheng, P., Xu, Z., Li, Y., Xu, Z., Qi, X., Sun, P., Wang, J., Zheng, F., Li, X., Yin, R., Dallenbach, K. R., Bianchi, F., Petäjä, T., Zhang, Y., Wang, M., Schervish, M., Wang, S., Qiao, L., Wang, Q., Zhou, M., Wang, H., Yu, C., Yao, D., Guo, H., Ye, P., Lee, S., Li, Y. J., Liu, Y., Chi, X., Kerminen, V.-M., Ehn, M., Donahue, N. M., Wang, T., Huang, C., Kulmala, M., Worsnop, D., Jiang, J., and Ding, A.: Secondary organic aerosol formed by condensing anthropogenic vapours over China's megacities, Nat. Geosci., 15, 255–261, 2022.
Onasch, T. B., Trimborn, A., Fortner, E. C., Jayne, J. T., Kok, G. L., Williams, L. R., Davidovits, P., and Worsnop, D. R.: Soot Particle Aerosol Mass Spectrometer: Development, Validation, and Initial Application, Aerosol Sci. Tech., 46, 804–817, 2012.
Pye, H. O. T., Place, B. K., Murphy, B. N., Seltzer, K. M., D'Ambro, E. L., Allen, C., Piletic, I. R., Farrell, S., Schwantes, R. H., Coggon, M. M., Saunders, E., Xu, L., Sarwar, G., Hutzell, W. T., Foley, K. M., Pouliot, G., Bash, J., and Stockwell, W. R.: Linking gas, particulate, and toxic endpoints to air emissions in the Community Regional Atmospheric Chemistry Multiphase Mechanism (CRACMM), Atmos. Chem. Phys., 23, 5043–5099, https://doi.org/10.5194/acp-23-5043-2023, 2023.
Shrivastava, M., Cappa, C. D., Fan, J., Goldstein, A. H., Guenther, A. B., Jimenez, J. L., Kuang, C., Laskin, A., Martin, S. T., and Ng, N. L.: Recent advances in understanding secondary organic aerosol: Implications for global climate forcing, Rev. Geophys., 55, 509–559, 2017.
US EPA Office of Research and Development: CMAQ (5.4), Zenodo [code], https://doi.org/10.5281/zenodo.7218076, 2022.
Wang, J., Ye, J., Zhang, Q., Zhao, J., Wu, Y., Li, J., Liu, D., Li, W., Zhang, Y., Wu, C., Xie, C., Qin, Y., Lei, Y., Huang, X., Guo, J., Liu, P., Fu, P., Li, Y., Lee, H. C., Choi, H., Zhang, J., Liao, H., Chen, M., Sun, Y., Ge, X., Martin, S. T., and Jacob, D. J.: Aqueous production of secondary organic aerosol from fossil-fuel emissions in winter Beijing haze, P. Natl. Acad. Sci. USA, 118, e2022179118, 2021.
Zang, H., Zhao, Y., Huo, J., Zhao, Q., Fu, Q., Duan, Y., Shao, J., Huang, C., An, J., Xue, L., Li, Z., Li, C., and Xiao, H.: High atmospheric oxidation capacity drives wintertime nitrate pollution in the eastern Yangtze River Delta of China, Atmos. Chem. Phys., 22, 4355–4374, https://doi.org/10.5194/acp-22-4355-2022, 2022.
Zhang, Q., Zheng, Y., Tong, D., Shao, M., Wang, S., Zhang, Y., Xu, X., Wang, J., He, H., Liu, W., Ding, Y., Lei, Y., Li, J., Wang, Z., Zhang, X., Wang, Y., Cheng, J., Liu, Y., Shi, Q., Yan, L., Geng, G., Hong, C., Li, M., Liu, F., Zheng, B., Cao, J., Ding, A., Gao, J., Fu, Q., Huo, J., Liu, B., Liu, Z., Yang, F., He, K., and Hao, J.: Drivers of improved PM2.5 air quality in China from 2013 to 2017, P. Natl. Acad. Sci. USA, 116, 24463–24469, 2019.
Zhang, W., Yun, X., Meng, W., Xu, H., Zhong, Q., Yu, X., Ren, Y. A., Shen, H., Chen, Y., Shen, G., Ma, J., Cheng, H., Li, B., Liu, J., Wang, X., and Tao, S.: Urban residential energy switching in China between 1980 and 2014 prevents 2.2 million premature deaths, One Earth, 4, 1602–1613, 2021.
Zhao, B., Zheng, H., Wang, S., Smith, K. R., Lu, X., Aunan, K., Gu, Y., Wang, Y., Ding, D., Xing, J., Fu, X., Yang, X., Liou, K.-N., and Hao, J.: Change in household fuels dominates the decrease in PM2.5 exposure and premature mortality in China in 2005–2013, P. Natl. Acad. Sci. USA, 115, 12401–12406, 2018.
Zheng, B., Zhang, Q., Zhang, Y., He, K. B., Wang, K., Zheng, G. J., Duan, F. K., Ma, Y. L., and Kimoto, T.: Heterogeneous chemistry: a mechanism missing in current models to explain secondary inorganic aerosol formation during the January 2013 haze episode in North China, Atmos. Chem. Phys., 15, 2031–2049, https://doi.org/10.5194/acp-15-2031-2015, 2015.
Zhong, H., Huang, R.-J., Duan, J., Lin, C., Gu, Y., Wang, Y., Li, Y., Zheng, Y., Chen, Q., Chen, Y., Dai, W., Ni, H., Chang, Y., Worsnop, D. R., Xu, W., Ovadnevaite, J., Ceburnis, D., and O'Dowd, C. D.: Seasonal variations in the sources of organic aerosol in Xi'an, Northwest China: The importance of biomass burning and secondary formation, Sci. Total Environ., 737, 139666, https://doi.org/10.1016/j.scitotenv.2020.139666, 2020.