the Creative Commons Attribution 4.0 License.
the Creative Commons Attribution 4.0 License.
 | 07 Jan 2026
Decadal trends (2013–2023) in PM10 sources and oxidative potential at a European urban supersite (Grenoble, France)
Vy Ngoc Thuy Dinh
Jean-Luc Jaffrezo
Pamela A. Dominutti
Rhabira Elazzouzi
Sophie Darfeuil
Céline Voiron
Anouk Marsal
Stéphane Socquet
Gladys Mary
Julie Cozic
Catherine Coulaud
Marc Durif
Olivier Favez
Gaëlle Uzu
The identification of particulate matter (PM) sources and the quantification of their contribution to the urban environment is a necessary input for policymakers to reduce the air pollution impacts. The association between the PM sources and the oxidative potential (OP) is also a key indicator for evaluating the ability of PM sources to induce in-vivo oxidative stress and lead to adverse health effects, which becomes an emerging metric in the Directive on ambient air quality (22024/2881/EU). Most studies in Europe have focused on PM and OP sources in the short term, for only 1 or 2 years. However, the efficiency of reduction policies, trends, and epidemiological impacts cannot be properly evaluated with such short-term studies due to a lack of statistical robustness. Here, long-term PM10 filter sampling at the Grenoble (France) urban background supersite and detailed chemical analyses were used to investigate decadal trends of the main PM sources and related OP metrics. Positive matrix factorization (PMF) analyses were conducted on the corresponding 11-year dataset (January 2013 to May 2023, n=1570), enlightening the contributions of 10 PM sources: mineral dust, sulfate-rich, primary traffic, biomass burning, primary biogenic, nitrate-rich, MSA-rich, aged sea salt, industrial and chloride-rich. The stability of the chemical profile of these sources was validated by comparison with the profiles retrieved from shorter-term (3 years) successive PMF analyses. A Seasonal-Trend using LOESS decomposition was then applied to evaluate the trends of these PM10 sources, which revealed a substantial decrease in PM10 (−0.73 ) as well as that of many of the PM10 sources. Specifically, negative trends for primary traffic and biomass burning sources are detected, with a reduction of 0.30 and 0.11 , respectively. The OP PM10 source apportionment in 11 years confirmed the high redox activity of the anthropogenic sources, including biomass burning, industrial, and primary traffic. Eventually, downward trends were also observed for OPAA and OPDTT, mainly driven by the reduction of residential heating and transport emissions, respectively.
- Article
(5177 KB) - Full-text XML
-
Supplement
(2371 KB) - BibTeX
- EndNote


Particulate matter (PM) is the main atmospheric pollutant that significantly impacts human health, climate, and the environment (Fuzzi et al., 2015; Grantz et al., 2003; Pope and Dockery, 2006), which is emitted directly or formed through complex processes in the atmosphere from natural and anthropogenic gaseous precursors. The identification of PM sources is important to investigate their composition, contribution, and evolution, which is one necessary input for policymakers to apply strategies in reducing their impact. There are various methodologies to identify these sources, where receptor models are widely used to perform source apportionment (SA) due to their flexibility and performance. Positive Matrix factorization (PMF) is one of the most popular among these receptor models, as it has been developed to allow SA analysis without any prior information other than the measurement and uncertainty input matrices (Hopke, 2016). Scores of studies using PMF have been applied in different typologies of sites over the last 15 years, with urban areas being the most common (Hopke et al., 2020; Viana et al., 2008).
The adverse health effects of PM can be assessed through different pathways, one of which uses the concept of oxidative stress within the lung (Pope and Dockery, 2006). PM has the ability to generate reactive oxygen species (ROS), which can cause an imbalance with antioxidants in the lungs, eventually causing oxidative stress. This capacity is evaluated as the oxidative potential (OP) of PM (Ayres et al., 2008; Li et al., 2008; Lodovici and Bigagli, 2011; Mudway et al., 2020; Nelin et al., 2012; Rao et al., 2018). The redox activity of PM is mainly dependent on their compositions; nevertheless, the correlation between individual components of PM and OP is probably not the best approach for understanding the impact of ambient PM because of their complex mixture preventing the quantification of all components of interest (Borlaza, 2021b; Calas et al., 2018; Weber et al., 2018). Therefore, the relationship between OP and PM sources has been investigated as a more holistic approach (Bates et al., 2018; Dominutti et al., 2023; Weber et al., 2021). The implementation steps of such an approach can include, first, a PM source apportionment (SA) (usually using PMF), allowing the identification of PM sources and their contribution to PM. Then, the relationship between OP and PM sources is investigated by performing some regression techniques, potentially including linear and non-linear ones (Ngoc Thuy et al., 2024).
The OP of PM is becoming an emerging metric for the European regulation on air quality, included in the new European Air Quality Directive (Directive (EU) 2024/2881) as a recommended measurement at super sites in each member state in order to improve the knowledge about the variability of the OP and eventually allow the connections with epidemiological studies. Most previous studies have focused on PM and OP sources over a relatively short period, typically less than 1 or 2 years (Borlaza et al., 2022; Pietrodangelo et al., 2024; Weber et al., 2019). Such short-term studies assess the PM and OP sources as well as their contribution, providing information on the intrinsic OP of PM sources, allowing for the development of OP modeling (Daellenbach et al., 2020; Vida et al., 2025) and eventually designing some public policies (Borlaza et al., 2021b). However, long-term series are needed both for evaluating the efficiency of such reduction policies in connection with the evolution of contributions from sources and also for implementing epidemiological studies (Borlaza-Lacoste et al., 2024).
The present study is based on a long-term measurement program conducted in the city of Grenoble (France), resulting from a sustained collaboration between the local network (Atmo AuRA), the French Reference Laboratory for Air Quality Monitoring (LCSQA), and the Institute of Environmental Geosciences (IGE) to investigate long-term evolution of PM10 sources and OP in the PM10 as well as their tendencies in the urban background of the city. Here, we assessed these source contributions from daily ambient PM10 samples obtained from 2013 to 2023 (n=1570) using the EPA PMF model at this site selected as one of the French urban supersites for the new EU 2024/2881 Air Quality Directive. The database was augmented using imputation techniques in order to fill some of the gaps in the data, relative to metallic trace elements. Since PMF is rarely applied to such a long-term database, several evaluations of the validity of solutions were also implemented. The PMF-derived PM10 sources were then used to perform OP SA from 2013 to 2022 (n=1570). The trend of PM10 concentration, of the PM10 sources, and the OP measurements are eventually discussed in relation to several potential factors of influence.
2.1 Sampling site
PM10 daily samples were collected at an urban background site (Grenoble – Les Frênes), in the southern area of Grenoble, France (45°09′41′′ N, 5°44′07′′ E). This city is known as the French Alps' capital, sprawling over 18.13 km2 with about 154 000 inhabitants in 2023, but nearly 500 000 within the larger urbanized area (about 15 km radius). With an average altitude of about 200 m a.s.l., the city sits within a complex mountainous geomorphology and is surrounded by three mountain massifs: Chartreuse, Vercors, and Belledonne (Fig. 1). A pendular wind regime between the three valleys of the basin regulates the ventilation of the atmosphere, with frequent thermal inversion during cold periods, leading to the accumulation of pollutants. The air quality is monitored at several sites in Grenoble by the regional agency (Atmo AuRA), including the urban background site of this study, which is equipped with a large array of instruments. Particularly, the chemistry of PM10 collected on filters has been speciated at this site since 2008, within several programs, including the CARA program from the French Ministry of Environment (Favez et al., 2021) and several research programs such as QAMECS (Borlaza et al., 2021a), or SOURCES (Weber et al., 2019). Many aspects of air quality in Grenoble were reported for this site, including the characteristics of secondary anthropogenic PM fraction (Baduel et al., 2010, 2012; Favez et al., 2010; Tomaz et al., 2016, 2017), of the biogenic PM components (Brighty et al., 2022; Samaké et al., 2019a, b), as well as the PM OP (Borlaza, 2021b; Dominutti et al., 2023; Weber et al., 2021). Several studies of one-year PM sources apportionment were also performed in 2013 (Srivastava et al., 2018) and 2017–2018 (Borlaza et al., 2021a). Despite the difference in input data and periods of the studies, similar main sources of PM were quantified in both studies, including residential heating, traffic, and secondary inorganic aerosol (SIA).
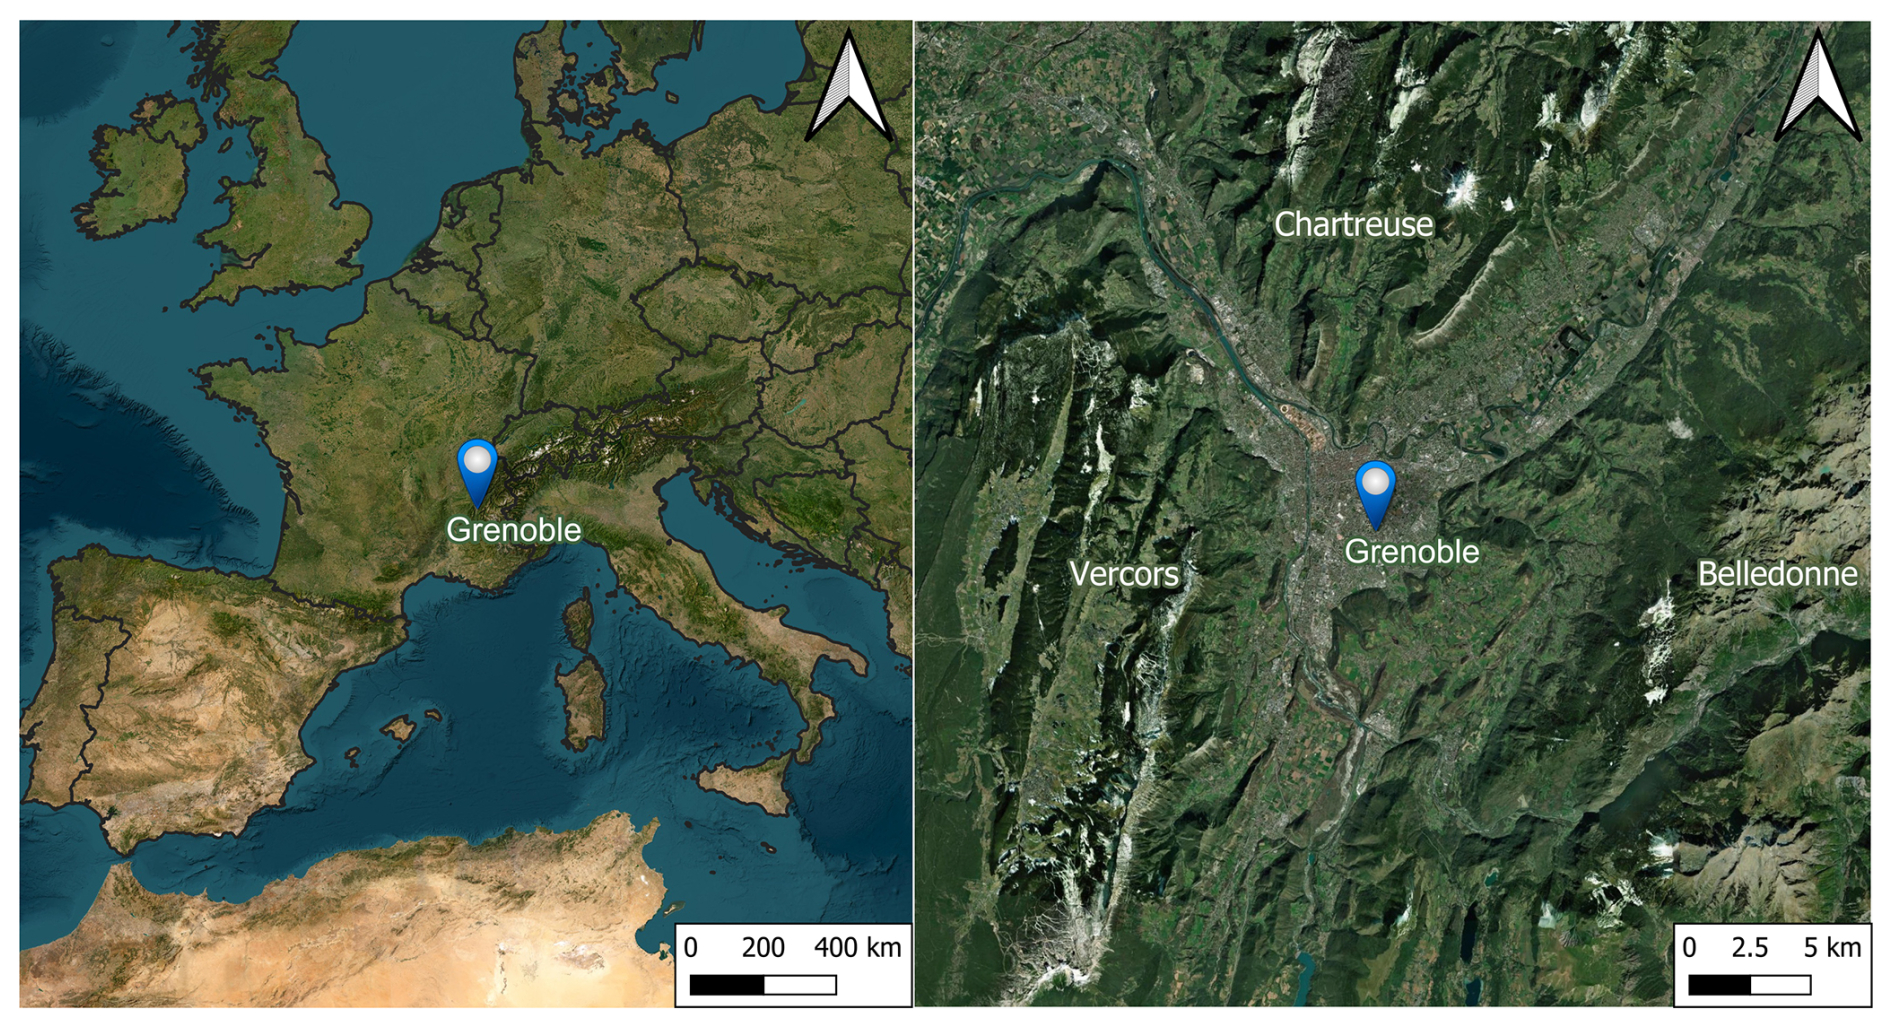
Figure 1The sampling site is located in the Southeast of France (left panel), surrounded by 3 mountains massifs (Vercors, Chartreuse, and Belledonne). Background map: ESRI satellites.
2.2 Sampling and chemical analyses
2.2.1 PM10 and their inorganic and organic composition
The daily PM10 sampling was performed every third day from 2 January 2013 to 28 May 2023, on 150 mm-diameter quartz fibre filter (Tissu-quartz PALL QAT-UP 2500 diameter 150 mm) using high-volume samplers (Digitel DA80, 30 m3 h−1). A weekly PM10 sampling was conducted during the same period using a low-volume sampler (Partisol, 1 m3 h−1) onto 47 mm diameter quartz fibre filters (Tissuquartz PALL QAT-UP 2500 diameter 47 mm). The processes of preparation, handling, and storing filters, in order to guarantee optimum quality for chemical analyses were presented in Borlaza et al. (2021a). Field blank filters were also collected (about 8 %–10 % of the total samples) to estimate the detection limits and evaluate the filter contamination during the overall handling and analysis processes.
The daily PM10 samples (n=1570) and field blanks were analyzed for elemental carbon (EC) and organic carbon (OC), major ions (Cl−, NO, SO, Na+, NH, K+, Mg2+, Ca2+), methanesulfonic acid (MSA), anhydrous sugar and saccharides (levoglucosan, mannosan, arabitol, mannitol), and trace elements (As, Ba, Cd, Cr, Cu, Mn, Ni, Pb, Sb, V, Zn). However, the concentrations of the daily trace elements were analyzed only in 3 periods, including: (1) from 2 January 2013 to 31 December 2013 (n=122), (2) from 28 February 2017 to 13 March 2018 (n=125), (3) from 30 June 2020 to 18 June 2021 (n=115). The weekly samples and blanks were analyzed for trace metal concentrations for the whole sampling period (n=842).
All analyses were previously described in detail (Borlaza et al., 2021a). In brief, EC and OC analysis was performed using a Sunset Lab analyser with the EUSAAR2 thermo-optical protocol. The eight major ionic components and MSA were analyzed, after aqueous extraction of the filters using orbital shacking, by ionic chromatography using an ICS3000 dual-channel chromatograph (Thermo-Fisher) with a CS16 column for cation analysis and an AS11 HC column for anion analysis. The anhydrous-sugar and saccharides analyses were performed on the same water extract by an HPLC method using PAD (Pulsed Amperometric Detection) (model Dionex DX500 + ED40) with Metrosep columns (Carb 1-Guard+A Supp15-150+Carb1-150) in the period before the year 2017. From 2017 to the present, the measurement with ICS 5000 with pulsed amperometric detection (HPLC-PAD) was performed following the CEN method (European committee for standardization, 2024). The analysis is isocratic with 15 % eluent of sodium hydroxide (200 mM), sodium acetate (4 mM), and 85 % water at 1 mL min−1.
The daily and weekly metals were measured by Inductively coupled plasma mass spectroscopy (ICP-MS) (ELAN 6100 DRC II PerkinElmer or NEXION PerkinElmer). The measurement was performed on the mineralization of a 38 mm diameter punch of each filter, using 5 mL of HNO3 (70 %) and 1.25 mL of H2O2 for 30 min at 180 °C in a microwave.
2.2.2 OP analysis
Two complementary OP assays, including the two probes ascorbic acid (AA) and dithiothreitol (DTT) were performed on the same filters with PM10 components analysis (from 2 January 2013 to 28 May 2023, n=1570). Filter samples are extracted using a simulated lung fluid which is the mixing of Gamble and DPPC (dipalmitoylphosphatidylcholine) solutions, during 1 h 15 min at 37 °C, pH 7.4 , creating a physiological environment for the extraction (Calas et al., 2017) . The AA method quantifies the consumption of ascorbic acid, an endogenous antioxidant in the lung, by PM and was described in Calas et al. (2017, 2018). The reaction mixture (extract + AA) was transferred to UV-transparent 96-well plates (CELLSTAR, Greiner-Bio), and the residual AA was measured at 265 nm with a TECAN Infinite M200 Pro spectrophotometer. The AA consumption rate (nmol min−1) reflects the capacity of PM10 to catalyze electron transfer from AA to molecular oxygen.
DTT assay relies on dithiothreitol, a chemical surrogate for cellular reducing agents, allowing for emulation of in vivo interaction among PM10 and biological reducing agents (for example, nicotinamide adenine dinucleotide (NADH), nicotinamide adenine dinucleotide phosphate oxidase (NADPH)). After incubation of the PM suspension within the lining fluid with DTT, the remaining DTT was titrated with 5,5′-dithiobis-(2-nitrobenzoic acid) (DTNB) to form 5-mercapto-2-nitrobenzoic acid (TNB). Absorbance at 412 nm (TECAN Infinite M200 Pro) in 96-well plates provided the concentration of unconsumed DTT, from which the DTT consumption rate (nmol min−1) was calculated. The batches were standardized using a common control (lab's rooftop filter analysis for every batch) to ensure consistency between batches.
After analysis, the OP activities were blank subtracted and then normalized using the PM10 mass concentration and the sampling air volumes. The mass-normalized OP (OPm, ) represents the intrinsic OP of 1 µg PM, while the volume-normalized OP (OPv, nmol min−1 m−3) represents PM-derived OP per m3 of air. Each sample is analyzed in triplicate for AA and triplicate for DTT, respectively. Consequently, the OP values presented in the study are the mean and the standard deviation of these replicates.
2.2.3 Vertical temperature and other ancillary measurements
Vertical temperature and humidity were measured every 30 min from November 2017 to May 2023 using Tinytag TGP-4500 from Gemini Data Loggers. A Stevenson Type Screen protects each Tinytag loggers from radiant heat (direct sunlight). Sensors are installed at a minimum of 3 m from the ground. The measurements have been performed at different elevations of the Bastille hill, located a few hundred meters from the city center (5°43′37.0′′ E, 45°11′40.8′′ N), including z=230, 309, 496, 916 m altitudes.
Further, measurement of the PM10 mass was conducted (hourly) using tapered element oscillating microbalances equipped with filter dynamics measurement systems (TEOM-FDMS) at the same site as the filter collection. The PM concentration used in this study is the 24 h average concentration, which is associated with the days of filter-based sample measurement (from 2 January 2013 to 28 May 2023).
2.3 Multivariate imputation by chained equations (MICE)
The daily concentration of metals was only accessed in some periods, with the number of samples being 362 of the total of 1570 samples, which would severely limit the size of the inputs for the PMF processing. We used the weekly concentration measured over the whole period to estimate the missing daily data using an imputation method. The daily concentration of metals was imputed by using the MICE algorithm implemented with multilinear regression (Azur et al., 2011). These values were modeled conditionally depending on the observed values of the daily PM10 and PM10 components concentration (i.e., weekly concentration, PM10, and PM10 components concentration). These components are OC, EC, MSA, Levoglucosan, Mannosan, Polyols, NO, SO, Na+, NH, K+, Mg2+, Cl−, Ca2+. The data preparation and imputation processes are implemented through 4 main steps, as presented in Sect. S1 and Fig. S1 in the Supplement. The validation of this imputation is shown in Table S1 and Fig. S2.
2.4 Persistent inversions detection
Thermal inversion occurs when the vertical temperature gradient between the ground-based and higher-altitude stations is positive. However, this constraint is restrictive and limits thermal inversion detection, especially when the calculation is on average daily temperature (Largeron and Staquet, 2016). Hence, the persistent inversion is detected, as discussed in Largeron and Staquet (2016), for days with:
for more than 72 consecutive hours with: T916−T230 is the difference between temperature at ground-base station (z=230 m altitude) and at high-elevation station (z=916 m); Δz is the difference between the height of high and low elevations; is the bulk temperature gradient between z=230 and z=916 m; is the mean bulk temperature gradient in wintertime (from November to March).
2.5 Positive Matrix Factorisation (PMF)
2.5.1 PMF input
EPA PMF 5.0 (Norris et al., 2014) was used to identify and quantify the PM10 sources based on the observed concentrations and their related uncertainties. The concept of PMF is to use the weighted least square fit method and apply a non-negative constraint with the weight calculated based on analysis uncertainties (Paatero and Tappert, 1994) (Eq. S1, Sect. S2). In this study, the input matrix of the PMF comprises 25 chemical species, including PM10 (set as the total variable), carbonaceous fractions (OC*, EC), ions (Cl−, NO, SO, Na+, NH, K+, Mg2+, Ca2+), organic tracers (MSA, levoglucosan, mannosan, polyols) and trace metals (As, Ba, Cd, Cr, Cu, Ni, Pb, Sb, V, Zn). The trace metals were the daily measured metals in some periods (2013, 2017–2018, 2020–2021) and the daily imputed metals. The OC* (= OC minus the sum of the carbon mass from the organic tracers used in the input variables) was used to avoid considering twice the mass of C atoms in organic markers. Polyols were calculated as the sum of arabitol and mannitol, supposing that their origin is similar (Samaké et al., 2019b). The input uncertainties were calculated based on the concentrations and the uncertainties in the analysis (Gianini et al., 2012; Waked et al., 2014). Details on the calculation of OC* and uncertainties of PMF input are presented in Sect. S3 in the Supplement. The selection of the input variables is guided by our previous yearly PMF studies at this site (Borlaza et al., 2021a; Srivastava et al., 2018; Weber et al., 2019).
2.5.2 Set of constraints
The application of PMF constraints is recommended in the European guide on air pollution source apportionment with receptor models (Belis et al., 2014) to avoid mixing between some factors and reduce the uncertainty of the rotational ambiguity. The constraints used in this study are also based on the previous PMF studies in Grenoble (Borlaza et al., 2021a; Srivastava et al., 2018; Weber et al., 2019) and are detailed in Table S3.
2.5.3 Choice of the final PMF solution
Several solutions, including those from 4 to 11 factors, were investigated to determine the optimal output. This selection is based on the ratio of (evaluating the outlier's effect), the clarity of the chemical profile, the contribution of factors to PM10, the correlation between measured and predicted concentration, and the stability of the solution. This stability was evaluated using the bootstrapping (BS) and displacement (DISP) methods. BS analysis randomly resamples the data observation matrix and uses it to run a new PMF. The base-run and boot-run factors are matched if their correlation exceeds the threshold (generally chosen at 0.6). DISP estimates each species' uncertainty in the factor profile by fitting the model many times until this variable turns displaced (upper or lower) from its fitted value. The details of the set criteria for validation are presented in Sect. S4.
To evaluate the stability of the PMF solution over time (including possible changes in the chemical profiles of the sources), we also implemented separated PMF SA for every successive period of 3 years (2013–2016, 2017–2020, 2021–2023) and then we investigated the homogeneity of the chemical profiles by using the Pearson distance (PD) and standardized identity distance (SID) metrics (Belis et al., 2015). The chemical profiles of PMF solutions every 3 years and 11 years, and those published in Borlaza et al. (2021a) are compared to assess the homogeneity of the chemical profiles.
2.6 Regression techniques for PM10 OP SA
The regression technique is applied to apportion OPv (AA, DTT) and PMF-derived PM10 sources' contribution, as expressed in Eq. (2). Principally, OPv (nmol min−1 m−3) is treated as a dependent variable, and PMF-derived PM10 sources' contribution (µg m−3) are independent variables. The OP SA methodology in this study follows the methodology reported by Ngoc Thuy et al. (2024).
Where: OPv is the volume-normalized OP (nmol min−1 m−3); p is the number of PMF-derived PM10 sources; is the regression slope, denoted as the intrinsic OP of source i (); PMi is the contribution of source i to PM10 (µg m−3); e is the residual of the regression technique (nmol min−1 m−3).
The appropriate regression tool is selected based on the collinearity among independent variables and the variance of regression residuals (Ngoc Thuy et al., 2024). The collinearity among PMF-derived sources was tested using the variance inflation factor (VIF), which is calculated using Eq. (S3) in Sect. S2 (Craney and Surles, 2002; O'Brien, 2007; Rosenblad, 2011). The variance of the regression residual is assessed using the Goldfeld-Quandt test (Goldfeld and Quandt, 1965) to investigate if the regression residual varies by the value of the dependent variable (OPv). The most appropriate regression method is selected among a wide choice of possible tools (including ordinary least square, weighted least square, positive least square, Ridge, Lasso, random forest, and multiple layer perceptron), following the methodology developed by Ngoc Thuy et al. (2024). It is performed with considering the characteristics of the data and comparing the accuracy metrics (R-square, root mean square error, and mean absolute error) for each of them. For instance, if the regression residual is constant (homoscedasticity), the model ordinary least square (OLS) and Positive least square (PLS) are satisfactory. On the other hand, if the regression residual varied with the dependent variable (heteroscedasticity), the models incorporating some sort of weighting are chosen (including weighted least squares (WLS) and weighted positive least squares (wPLS)), where the weighting is the standard deviation of replicated OP analyses.
The most appropriate model was trained by randomly choosing 80 % of the dataset and validated with the remaining 20 %. The model was run 500 times to ensure the robustness of the results, especially considering the remarkable seasonality of many components in the dataset. The contribution to OP of each source is calculated by multiplying its contribution to PM10 with the arithmetic mean intrinsic OP (or regression slope) of the 500 iterations.
2.7 Seasonal-trend using LOESS decomposition
Seasonal-trend decomposition using LOESS (STL) was developed by Cleveland et al. (1990) and is a robust method for decomposing time series into trends, seasonality, and residuals. This method uses LOESS, a method for estimating the non-linear relationships to decompose a time series. In our case, we used monthly average concentration as input data in order to have a more robust data set, smoothing high variability noise. The trend component is first calculated by applying a convolution filter to the data. Then, this trend is removed from the series. Finally, the average of this detrended in each period is the seasonal component. The residuals can be explained neither by trend nor by season. The STL is an iterative model that uses LOESS to smooth seasonal and trend components to obtain the minimum residuals. Further, in STL decomposition, the outliers in the data are given less weight in the estimation of trend and season. The STL model is described in the equation below:
where, in our case, yt is the monthly contribution of PMF-derived sources, St is the seasonal component, Tt is the trend component, and Rt denotes the residual component. The seasonal frequency was chosen 6 months before and 6 months after the evaluated month (seasonal frequency = 13 months) to estimate the yearly trend cycle. Hence, the first and last 6 months of the decomposition time series were removed from the results to prevent edge effects.
The long-term trend of PM10 sources was accessed by applying the STL model to the monthly contribution of sources to PM10 (output of PMF). The fit line of the trend was assessed by using ordinary least squares linear (OLS). The annual rate change of the trend is the slope of the fit line multiplied by 12 months ( and for PM10 sources and OPm, respectively). The STL decomposition and the fit line of the trend were performed in Python 3.9 using the package “statsmodels” (Seabold and Perktold, 2010).
3.1 Evolution of PM10 concentration and chemical components
The annual average concentration of PM10, considering all available daily measurements, is 19.0±10.6 µg m−3 for the whole studied period (2013–2023). The highest annual concentration is observed in 2013 (24.4±13.7 µg m−3), and the lowest is in 2021 (15.3±9.8 µg m−3). The number of days with concentrations surpassing the European standard daily thresholds (40 µg m−3) is 176 d in 11 years, representing 4.6 % of the total observed days, which are principally found in the cold season (November, December, January, February, March).
The PM10 main components are organic matter (assuming OM = 1.8⋅OC; Favez et al., 2010), representing on average over the overall period 41.3±8.0 % of PM10 mass concentration, followed by dust (9.6±4.4 %), nitrate (NO, 7.5±6.2 %), non-sea salt sulfate (nss-SO, 7.4±2.4 %), elemental carbon (EC, 5.5±2.5 %), ammonium (NH, 3.9±2.0 %), sea salt (Na+ and Cl−, 1.7±0.8 %) and other non-dust elements (Cu, Pb, V, Zn, representing 0.2±0.1 %). These main composition fractions are estimated using the formula as shown in Sect. S2, Eq. (S4). The monthly evolutions of PM10 and its main chemical components for the whole period are shown in Fig. 2. The maximum concentration of PM10 was observed in winter months (December, January, and February), corresponding to the highest concentration of OM and EC (7.82±3.11 and 1.09±0.74 µg m−3, respectively). Nitrate concentrations are higher in the middle of winter and the early spring, corresponding also with the high concentrations of ammonium (1.63±1.87 and 0.78±0.62 µg m−3). The agricultural activities (especially manure spreading) could explain this high contribution in spring under humidity and temperature conditions favoring the condensation of ammonium nitrate in the particulate phase. Nss-sulfate concentrations are more abundant in the warmer season (summer), where the photochemical production is favorable. No clear seasonal pattern could be observed for other components (sea salt, dust, non-dust, estimated as described in Sect. S2), suggesting that the emissions of these components are stable for the whole year. At first glance, decreasing trends appear visible for PM10 and OM, EC, NO, NH, and non-dust components, while sea salt, dust, and nss-SO do not seem to present significant trends. With chemical components coming from several emission sources, an advanced analysis, including a PMF model followed by an STL decomposition, was performed to assess the trend of PM10 sources. The result of the PMF model is presented in Sect. 3.2, and the tendencies of PM10 sources and OP are shown in Sect. 3.3 and 3.4, respectively.
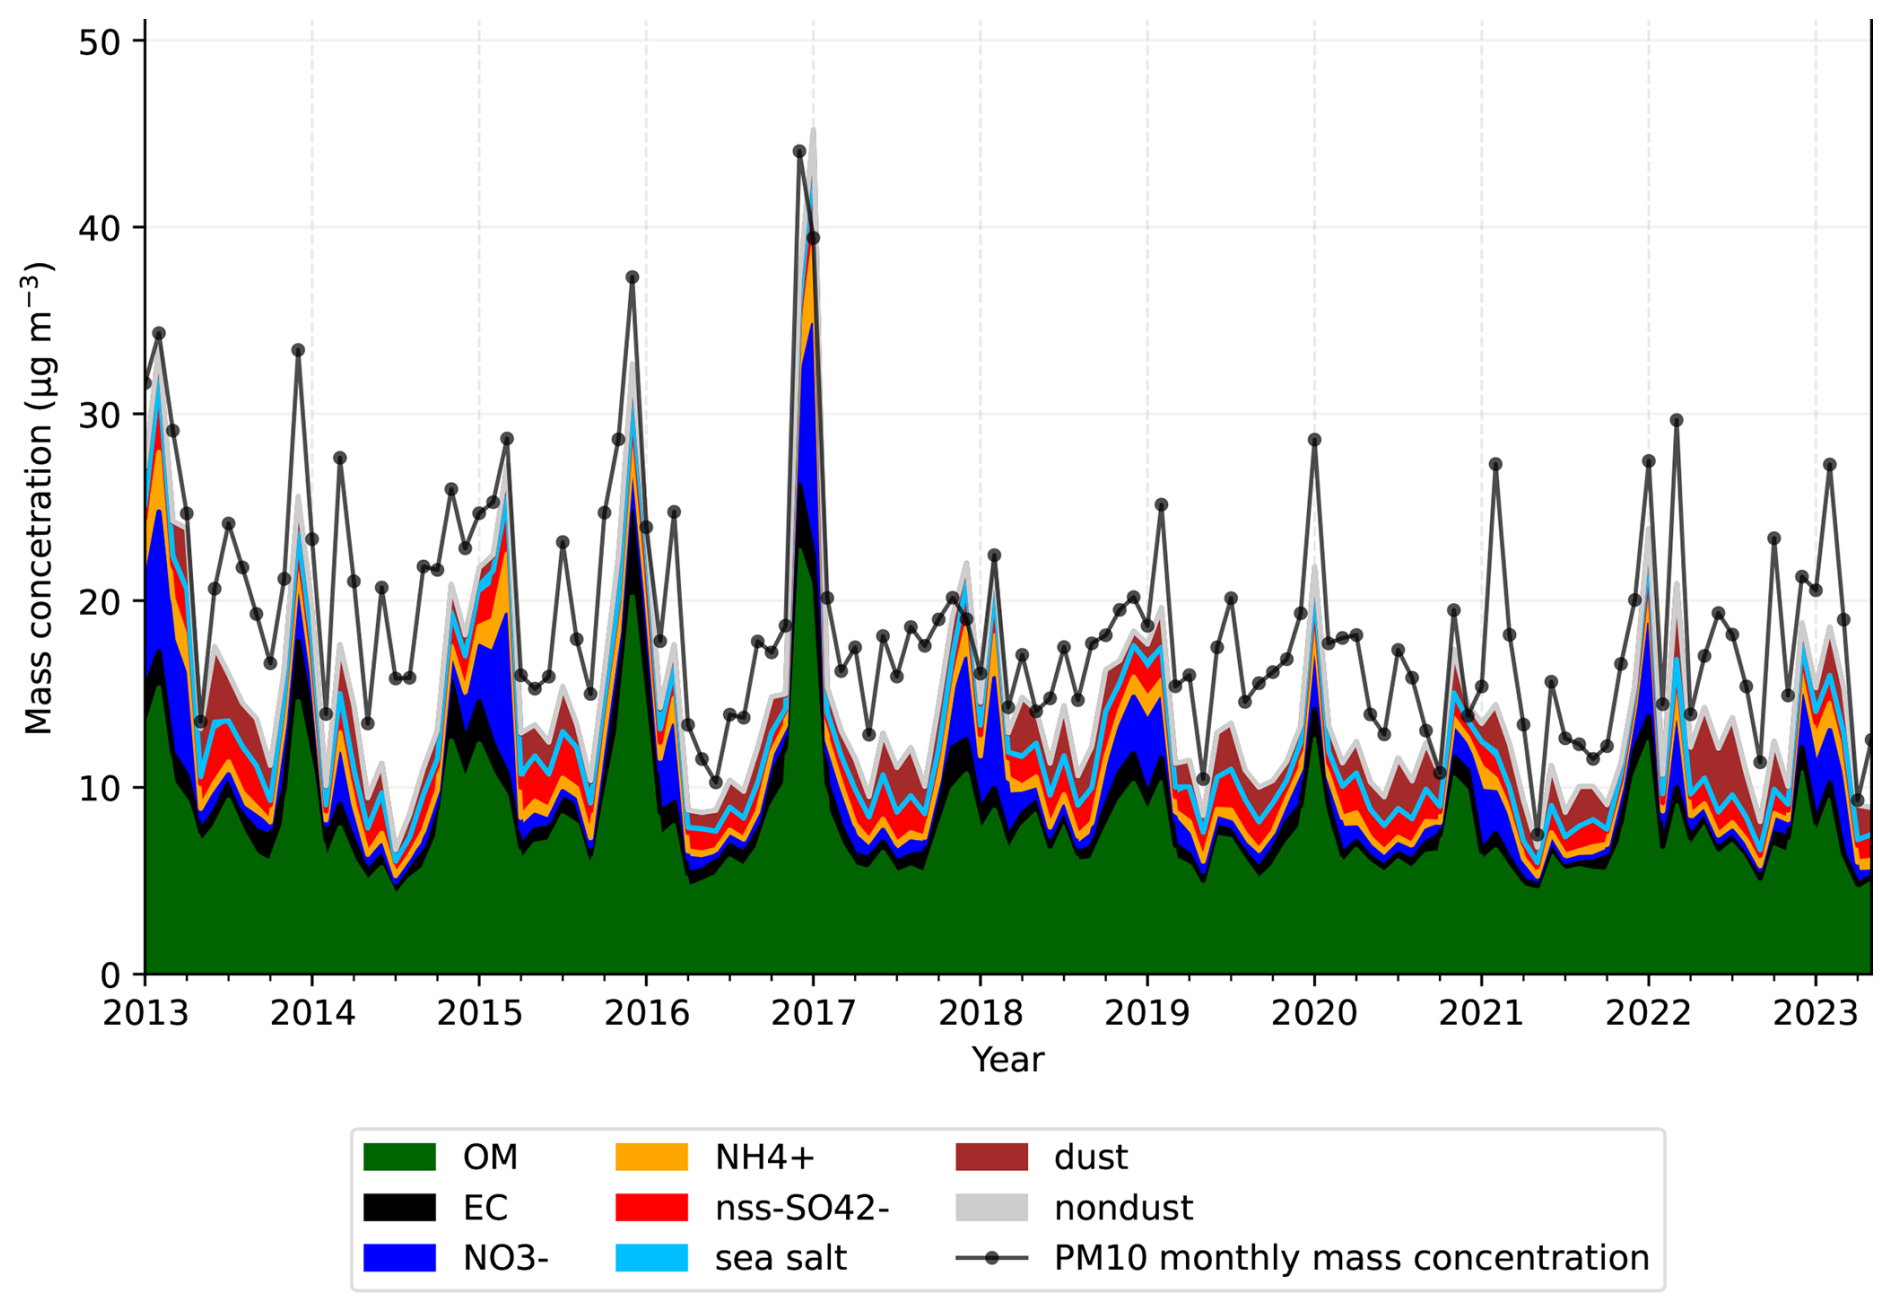
Figure 2The average monthly evolution of PM10 and its main components from 2013 to 2023. The line represents the monthly average concentration of PM10 measured by TEOM-FDMS.
3.2 PM10 sources apportionment
3.2.1 PMF chemical profiles
Using a unique chemical profile for each of the sources for such a long-term period can potentially limit the assessment of its evolution (Borlaza et al., 2022). To evaluate such a phenomenon in our case, we investigated the chemical profile and contribution of PM10 sources for three distinct periods (2013–2016, 2017–2020, 2021–2023) and compared the results with those for the full 11-year period, as well as to the results presented in Borlaza et al. (2021a) for the year 2017. Particularly, we checked the similarity of the chemical profiles of these PMF solutions using PD and SID metrics (Belis et al., 2015).
For each SA, the PMF solution was tested from 4 to 11 factors and validated by the criteria presented in Sect. S4. The results of these validations (, bootstrap run, displacement run, and statistical validation) are presented in Sect. S5, Tables S4, S5 and S6. The runs of 4 to 9 factors returned at least one merging factor, and the solution with 11 factors led to a factor without geochemical identity. Finally, for each PMF tested (11 years, 2013–2016, 2017–2021, 2022–2023), the best solution includes 10 PM10 sources, with mineral dust, sulfate-rich, primary traffic, biomass burning, primary biogenic, nitrate-rich, MSA-rich, aged sea salt, industrial, and chloride-rich.
The similarity of the chemical profiles is presented in Fig. 3. Most of the factors (i.e., aged sea salt, mineral dust, primary biogenic, biomass burning, primary traffic, industrial, nitrate-rich, and sulfate-rich) present quite homogenous chemical profiles over the 3 successive periods, indicating that these source profiles are quite stable during the full 11-year period and similar compared to sources reported in Borlaza et al. (2021a). The MSA-rich and chloride-rich sources are the most divergent but are still within the limit of the accepted PD and SID range; however, their standard deviations for PD are slightly higher than for the other sources (Fig. 3). This is due to differences in the contributions of SO in the chemical profile of MSA-rich, which varied from 6 % to 17 %, and that of Cl− (73 %–83 %) in the chloride-rich factor. In a previous study, Weber et al. (2019) also reported that the proportion of SO in the MSA-rich source can significantly vary across French sites, from 6 % to 24 %. The chloride-rich source in this study (previously named sea/road salt in Borlaza et al. (2021a) is essentially composed of a high proportion of Cl−, with less than 10 % of Na+ and some metals (Cu, Mn, Ni, V). This source is detected in other alpine valley environments (Glojek et al., 2024), with a similar temporal evolution as here. Since chloride depletion from the particulate phase can greatly depend on solar radiation, relative humidity, and temperature, the chemical profile of this factor can vary on different time scales. This source was also observed to be heterogeneous in the three neighboring sites investigated within 15 km in the previous study in Grenoble (Borlaza et al., 2021a). Nevertheless, it should be noted that it represents only a very minor fraction of the PM10 total mass (about 1 %).
With these stabilities of the chemical profiles over the years, the solution for the 11-year SA is considered suitable for further data analyses in this paper. In the next section (Sect. 3.3.2), we investigate how the contribution of these sources to total PM10 loadings changed over time.
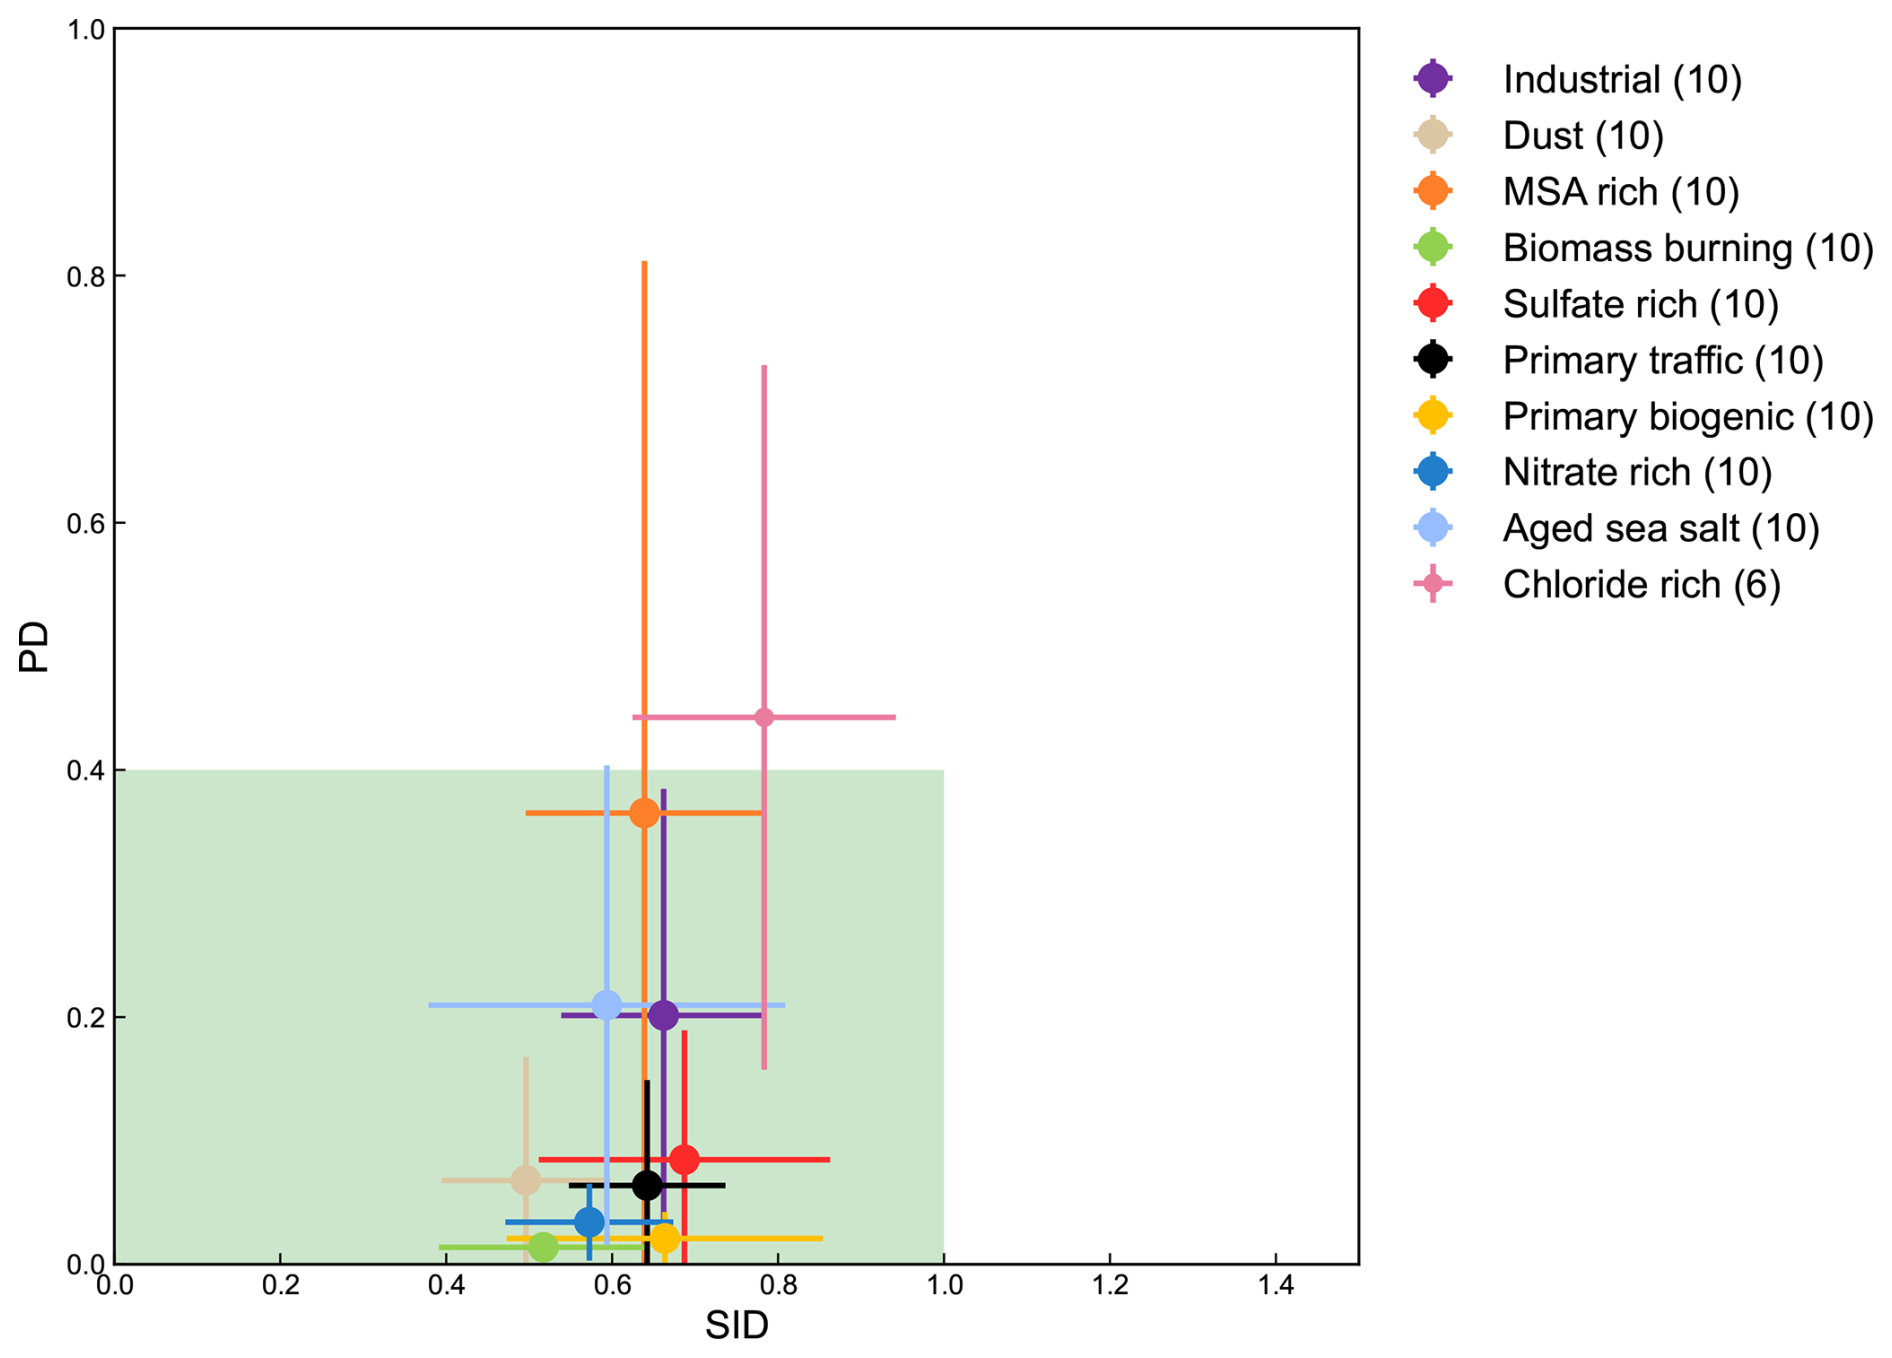
Figure 3Similarity plots of the chemical profiles of the solution for the 11-year SA against the 3 SA solutions every 3 years, and those presented by Borlaza et al. (2021a). The shaded area (in green) shows the limit of the homogeneous chemical profile. For each point, the error bars represent the standard deviation when comparing all pairs of SA solutions (number of pairs in parentheses in the legend).
3.2.2 Variations of the source's contribution in the 11-year PMF SA
As presented in Fig. 4, the optimal PMF solution for the 11-year time series identifies 10 PM10 sources, with the contributions of mineral dust (20.9 %), sulfate-rich (19.7 %), traffic (16.0 %), biomass burning (13.5 %), primary biogenic (10.7 %), nitrate-rich (7.2 %), MSA-rich (6.2 %), industrial (2.2 %), aged sea salt (2.5 %), and chloride-rich (1.0 %). The chemical profile and contribution of each source are shown in Figs. S3 and S4, respectively. Even though the chemical profiles are homogenous, the contributions of these sources show minor differences from those reported for this same site by Borlaza et al. (2021a) and Srivastava et al. (2018), partly because of the differences in the respective periods of the studies. However, the main sources are similar, i.e., SIA (nitrate and sulfate-rich), mineral dust, biomass burning, and primary traffic. Similar general results are also presented for Swiss Alpine (Ducret-stich and Tsai, 2013), French Alpine (Weber et al., 2018), and Slovenian Alpine areas (Glojek et al., 2024), showing biomass burning and secondary inorganic aerosols being the most abundant contributions to PM mass. Primary biogenic and MSA-rich sources are the biogenic sources rarely reported in the literature; however, they account together for 17 % of total PM10 mass on average in this study, which is in line with those reported in urban background sites in France (Samaké et al., 2019a; Weber et al., 2019). The absolute PM10 source contributions are also compared to the average annual concentration of PM10 mass to demonstrate the ability of the PMF model to reconstruct the PM10 mass. The difference between observed and reconstructed PM10 concentrations on the 11-year average is about 1 µg m−3 (5 %), with no more than 2 µg m−3 for any single year, demonstrating that the PMF model performs well at reconstructing the PM10 concentrations.
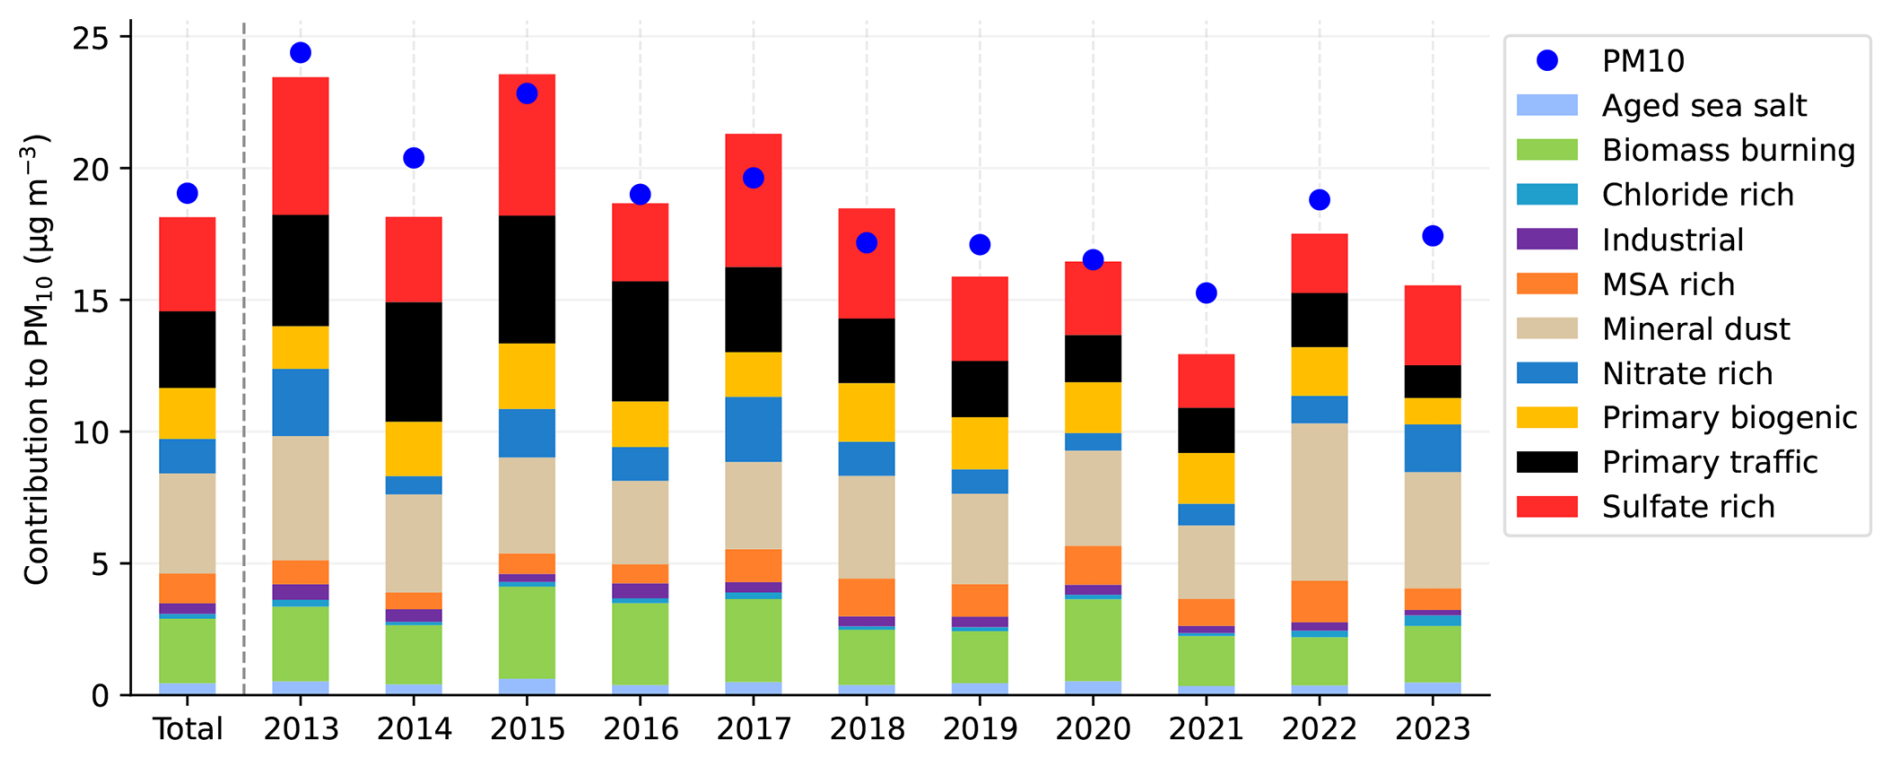
Figure 4The absolute average contribution of sources to PM10 for every year and the 11 years (total), and the concentration of PM10 (blue circle).
Significant trends in source contributions over this 11-year period are detected (and discussed in Sect. 3.3); nevertheless, the main contributors to the total PM10 mass do not change, with mineral dust, biomass burning, sulphate-rich, nitrate-rich, and primary traffic being the main contributors to PM10. The highest PM10 concentrations (observed in winter/spring 2013 and 2015) are associated with the highest contribution of SIA and biomass burning sources. On the other hand, the relative contribution of SIA and biomass burning showed a negligible difference (varied from 0.3 % to 4 %) between these years compared to 2014 and 2016 (Fig. S5). The lowest PM10 annual concentration was detected in 2021, notably when the third COVID-19 pandemic lockdown restrictions applied in France. In addition, the relative contributions (see Fig. S5) showed only small changes compared to those in other years, with an increasing contribution of primary biogenic sources in 2021 (4 % compared to 2020), and only a very light decrease in the anthropogenic sources.
The decrease in PM10 annual average concentrations observed since 2017 is associated with decreases in the contribution of some of the anthropogenic PM10 sources. However, using yearly averages for trend analysis may prevent a proper understanding of the variation in time and of the estimation of the trends based on monthly averages, which might be more informative, as discussed in Sect. 3.3.
3.3 Trends in sources' contributions
3.3.1 Mean rate change in the contribution of PM10 sources
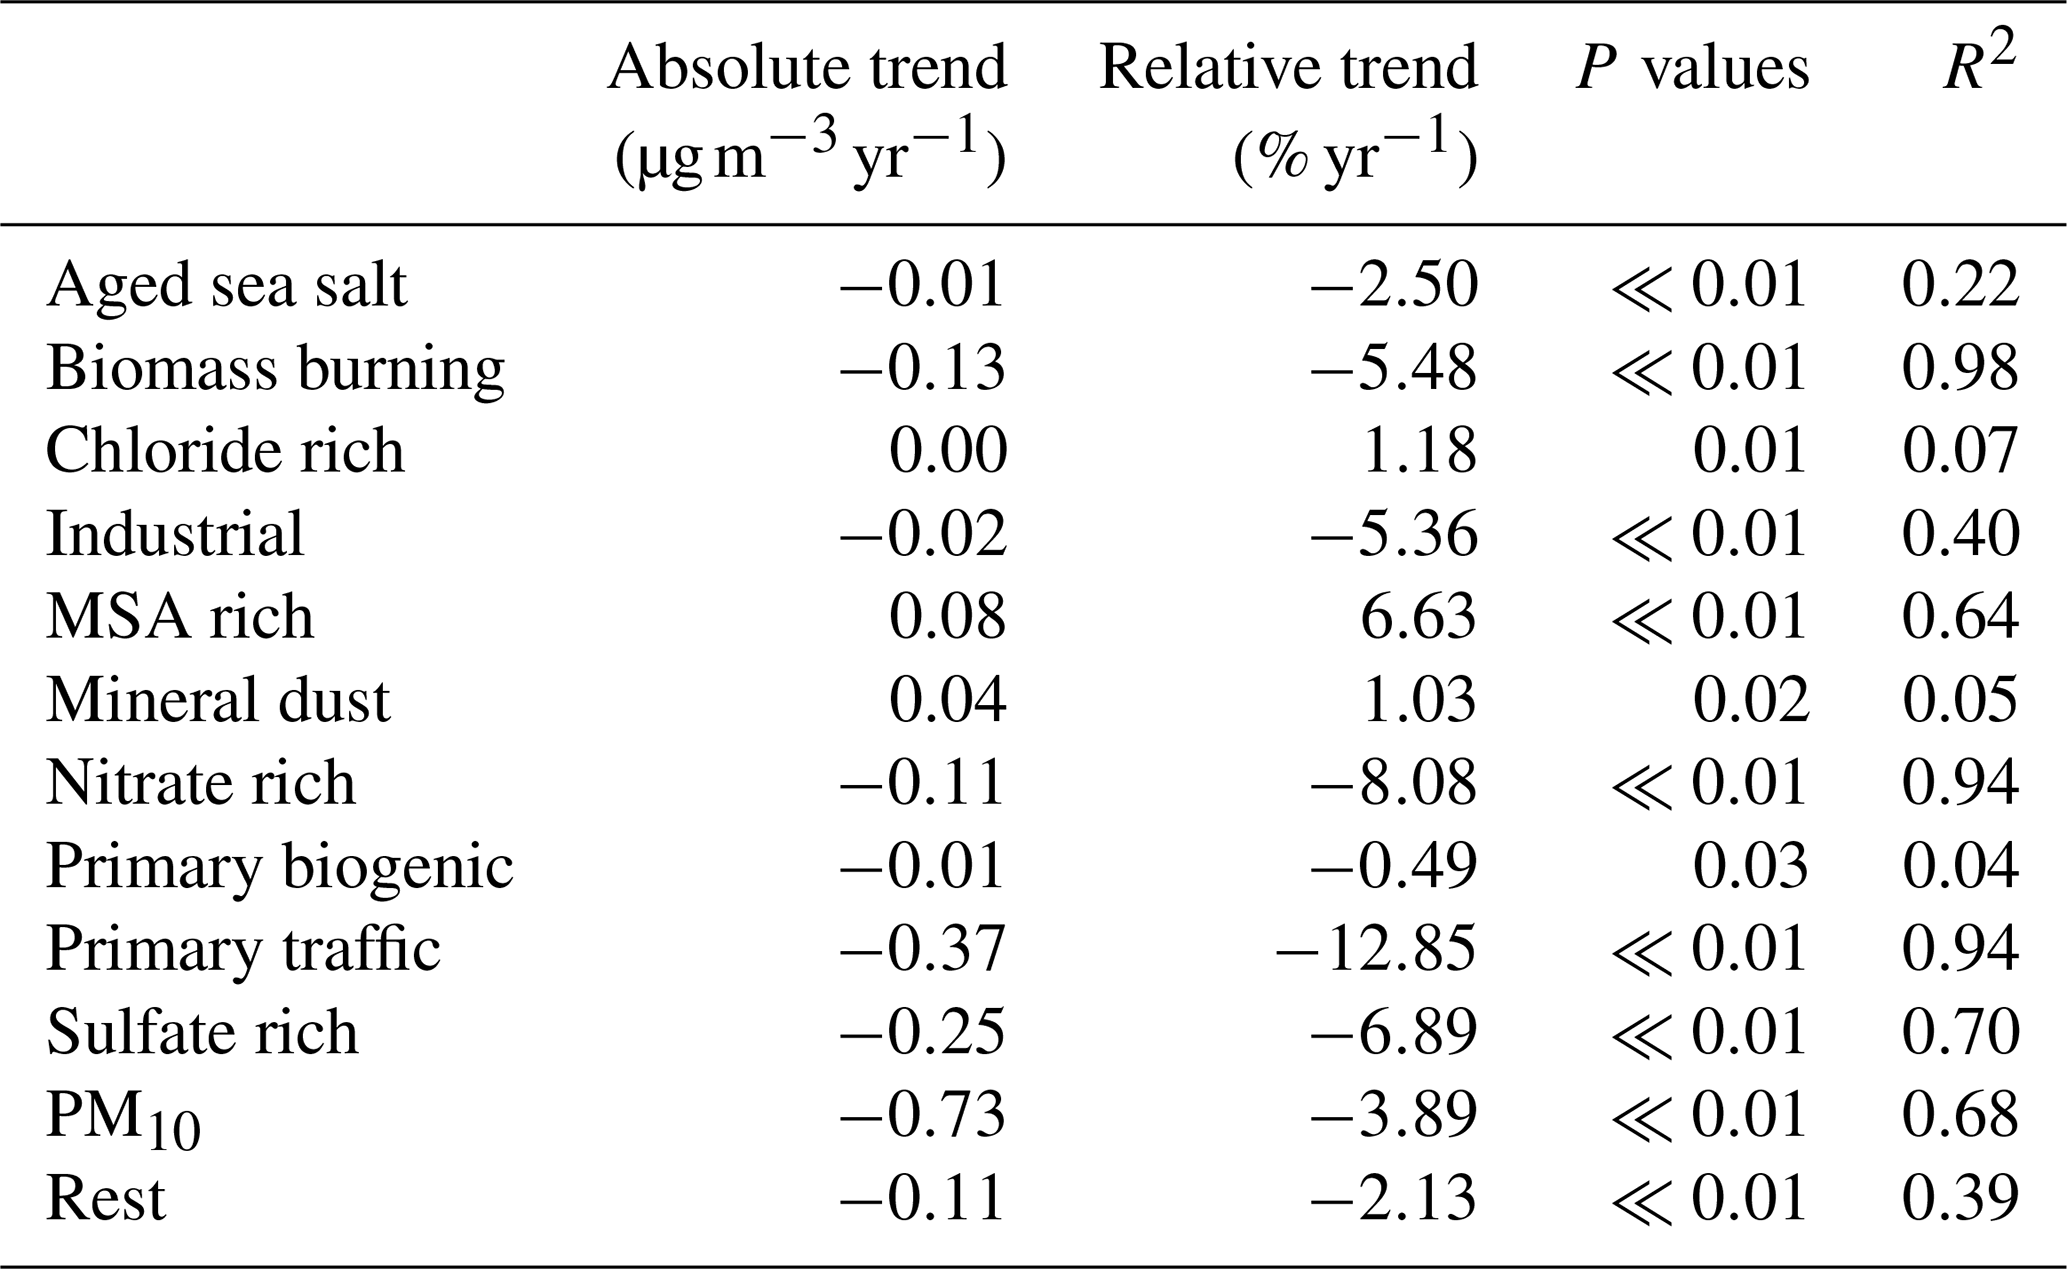
The source contribution trend analysis was achieved through STL deconvolution (see Sect. 2.6). These trends for all sources over the full period of the study are presented in Table 1. In this table, the part labeled “Rest” represents the difference between the total PM10 measured mass and the sum of the mass of all PMF-derived factors in order to assess any trend of the unresolved part of PM10 within our SA study.
PM10 concentrations present a downward trend from 2013 to 2023, with an average diminution of 0.73 (3.9 %) (Sect. S6, Fig. S6). Such a downward trend of PM10 in Grenoble is in line with that observed in other urban sites in Europe (Aas et al., 2024; Borlaza et al., 2022; Caporale et al., 2021; Colette et al., 2020; Gama et al., 2018; Li et al., 2018; Pandolfi et al., 2016).
The reduction of PM10 in Grenoble during this period is significantly larger than that in 30 rural sites of the European Monitoring and Evaluation Programme (EMEP) from 2000 to 2017, which show reductions of PM10 from −1.5 % to −2.5 % (−0.008 to −0.58 µg m−3) (Colette et al., 2020). However, the results of this study are highly coherent with results from Aas et al. (2024), presenting a reduction of PM10 in 2 rural sites in France (La Tardière and Revin) of −3.5 % yr−1 between 2005 and 2019. The reduction of PM in this Grenoble site, as an urban site, being higher than those at the rural sites, is due to the changes in specific emission activities at the site. While in the rural sites, the PM emission are influenced by long range transport activities, the PM at the urban site is usually largely impacted by different local activities (Borlaza et al., 2022). Further, France is amongst the EU countries with the highest reduction trend, as presented by Aas et al. (2024).
The anthropogenic sources, such as primary traffic, sulfate-rich, and biomass burning, display the highest decrease between 2013 and 2023 in Grenoble, with a reduction of 12.9 %, 6.9 %, and 5.5 % (0.37, 0.25, and 0.13 ), respectively. The other anthropogenic sources also present significant decreasing trends; however, these trends are much lower (nitrate-rich: −0.11 , industrial: −0.02 ). The downward trends of these anthropogenic sources (mainly traffic, SIA, and industrial) were also underlined for other European urban sites (Colette et al., 2020; Diapouli et al., 2017; Pandolfi et al., 2016) with various approaches. For instance, a similar approach using PMF (albeit without organic markers) was followed by Pandolfi et al. (2016), investigating the Mann-Kendall trend of PMF-derived sources, and reported an almost equivalent downward trend of the sulfate-rich factor of 53 % (i.e., 0.53 % yr−1) between 2004 and 2014 in Spain. The decreasing trends of primary traffic, domestic biomass burning, and industrial emissions are potentially influenced by the reduction in primary emissions due to various abatement strategies (as discussed in the following subsections, notably in Sect. 3.3.3 and 3.3.4).
Conversely, natural sources such as mineral dust and chloride-rich factors do not show any significant trend or follow a very weak one (aged sea salt, primary biogenic). MSA-rich is the only source that displays a significant upward trend, with an increase of 0.08 ; further studies would be needed to relate this last increase to changes in precursor emissions or reactivity during transport. Finally, the low evolutions in the contributions of the natural sources demonstrate that the reduction in PM10 in Grenoble is essentially related to the reduction of anthropogenic activities, especially sources related to traffic and domestic biomass burning activities.
3.3.2 Potential influence of meteorology
The STL deconvolution is inherently constructed to separate the yearly and seasonal variations from the long-term trends. While we discuss the long-term trends of the sources in other sections (Sect. 3.3.1, 3.3.3, and 3.3.4), it is also interesting to evaluate the impact of the meteorology on the seasonal variations of the concentrations. It is well known that inversion layers in the lower atmosphere are extremely important for the modulation of the concentrations at the ground, particularly in the context of Alpine valleys during winter (Carbone et al., 2010; Glojek et al., 2022). In this section, we tried to better evaluate these impacts on the concentrations from the sources of PM in the case of our time series.
This was considered with the measurements of temperature along the slopes of the mountains very close to the city center (as described in Sect. 2.2.3), for the winter periods of 2017–2023. It has been previously shown by Allard et al. (2019) that such measurements are representative of the temperature in the valley, despite the potential influence of wind slopes. We particularly considered the temperature gradient over the first 700 m above ground and the number of days with persistent inversion, as defined in Sect. 2.2.3.
The analysis of the relationship between the PM10 and bulk temperature vertical gradients ( in winter (November, December, January, February, March), summer (May, June, July, August), and transition season (remaining months) reveals that thermal inversion events and high PM10 concentration are mainly occurring in winter time (Sect. S7, Fig. S8) during the 5 years of the study. Periods of persistent temperature inversion were assessed based on the condition in Eq. (1), which detected 79 persistent inversion days in series from 4 to 22 consecutive days, for the winter periods 2017–2023. A meaningful correlation is obtained between PM10 concentrations and bulk temperature vertical gradient (r reaching 0.60, p≪0.001) for these winter months and even better when considering only the persistent inversion periods (r reaching 0.67, p≪0.001) for individual years (Table S7).
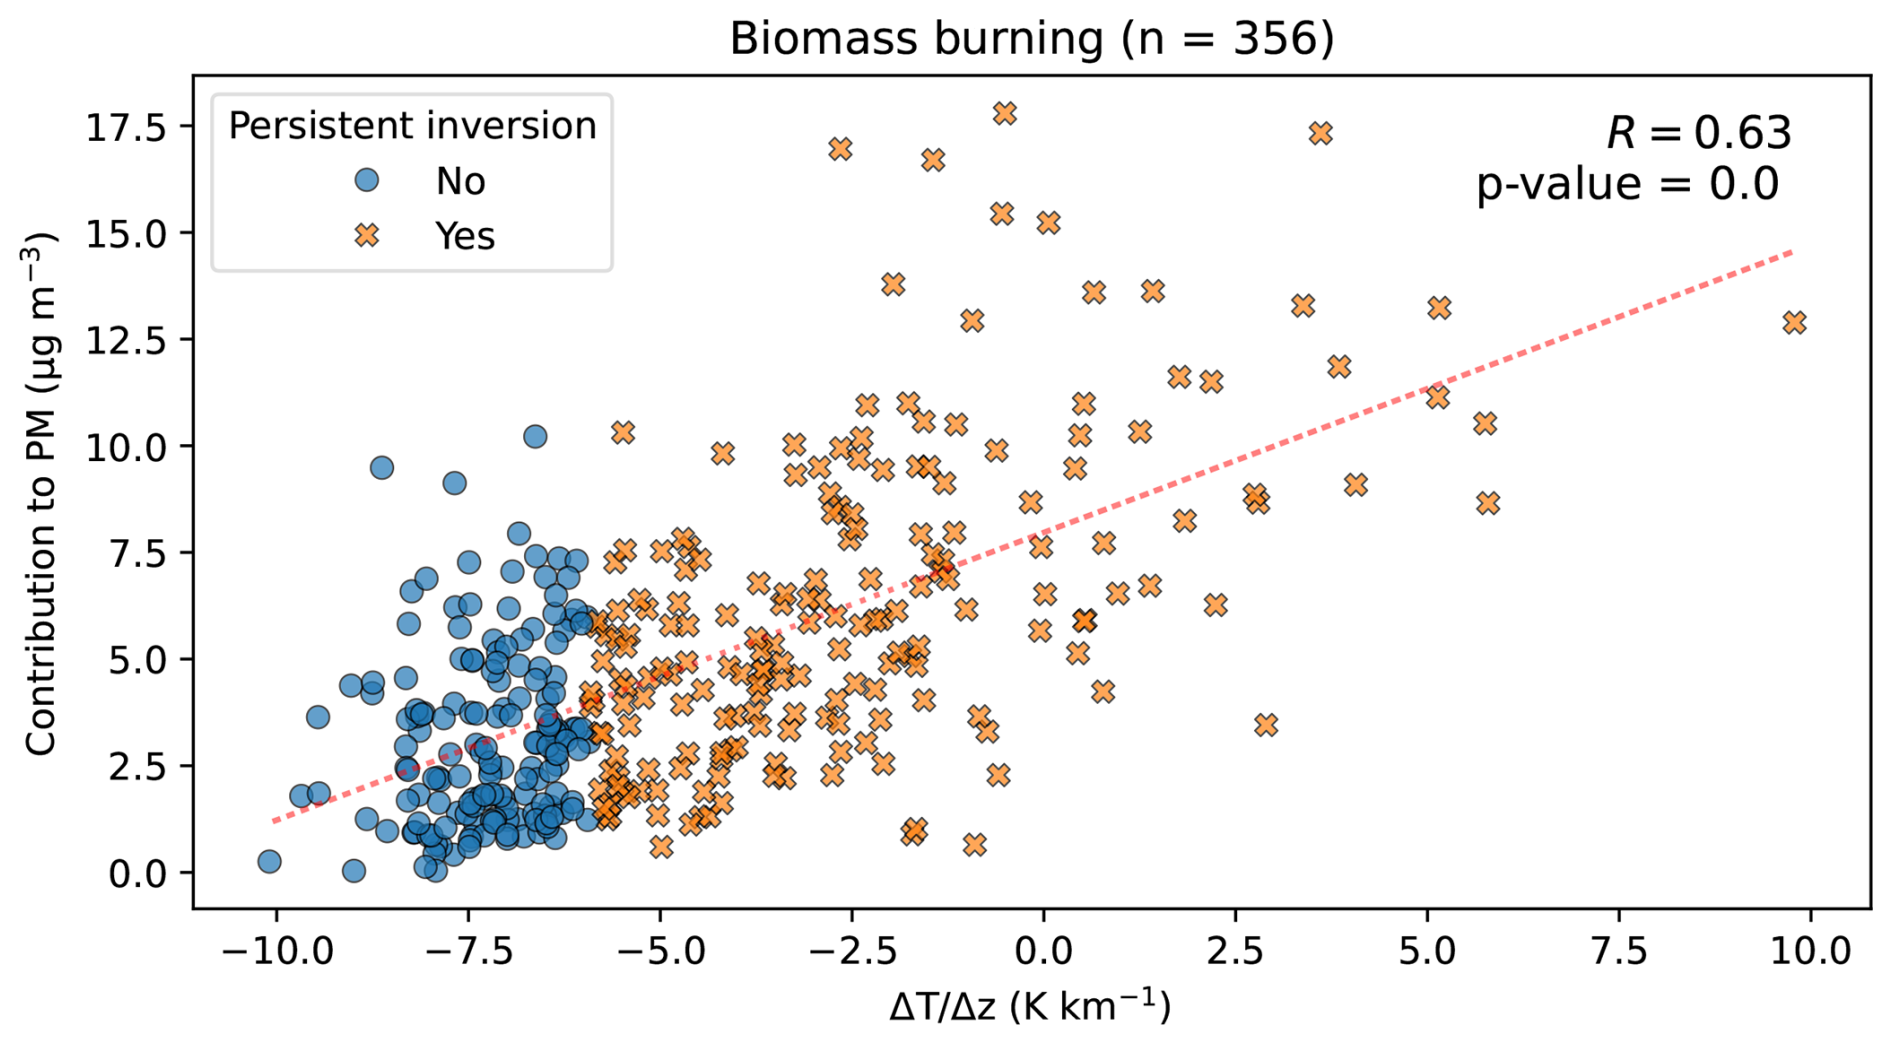
Figure 5Daily concentrations of biomass burning to PM10 and daily temperature gradients () during the winter periods (from November to March) of 2017–2023. The dotted red line is the linear regression fit. The blue circle symbols denote days when persistent inversion does not occur, and the orange multiple symbol denotes days when persistent inversion occurs.
The distribution between the daily PM10 concentration and daily average in winter months revealed that the majority of PM10 concentration peaks (in excess of 40 µg m−3) occur during the persistent inversion days (Fig. S9). However, it also shows that a few high PM10 concentrations could be found on the days without persistent inversion; meanwhile, the days with persistent inversion do not always have high PM10 concentrations. This result is not surprising since the concentration of PM10 is not only associated with thermal inversion events but also depends on other meteorological conditions (precipitation, heat deficit) and the variation of pollutant emissions (Carbone et al., 2010; Largeron and Staquet, 2016).
Interestingly, the impact of persistent inversion days on PM10 concentrations from the residential biomass burning source is larger than that for other sources or total PM10 (Fig. 5), with a higher correlation (0.63). In addition, the contribution of this source is systematically lower during non-inversion days, and large concentrations are essentially made during persistent days. The large impact of the inversions on the local sources is confirmed when comparing the source contribution of the inversion days vs. non-inversion days (Fig. 6). This figure shows both the large increase in average PM10 concentrations and also the contributions of the local sources (emissions from residential biomass burning, traffic, industries, mineral dust probably from resuspension) in the cases of inversion days during winter. Conversely, long-range transport sources (sulfate-rich, nitrate-rich) tend to be less important during these inversion days. A similar pattern is observed for the relative contribution of sources to PM (Fig. S10), in which the significant contribution of biomass burning, dust, industrial, and primary traffic is detected during inversion events. The trends of the two most important local anthropogenic sources (domestic biomass burning and traffic) are further discussed in the next sections.
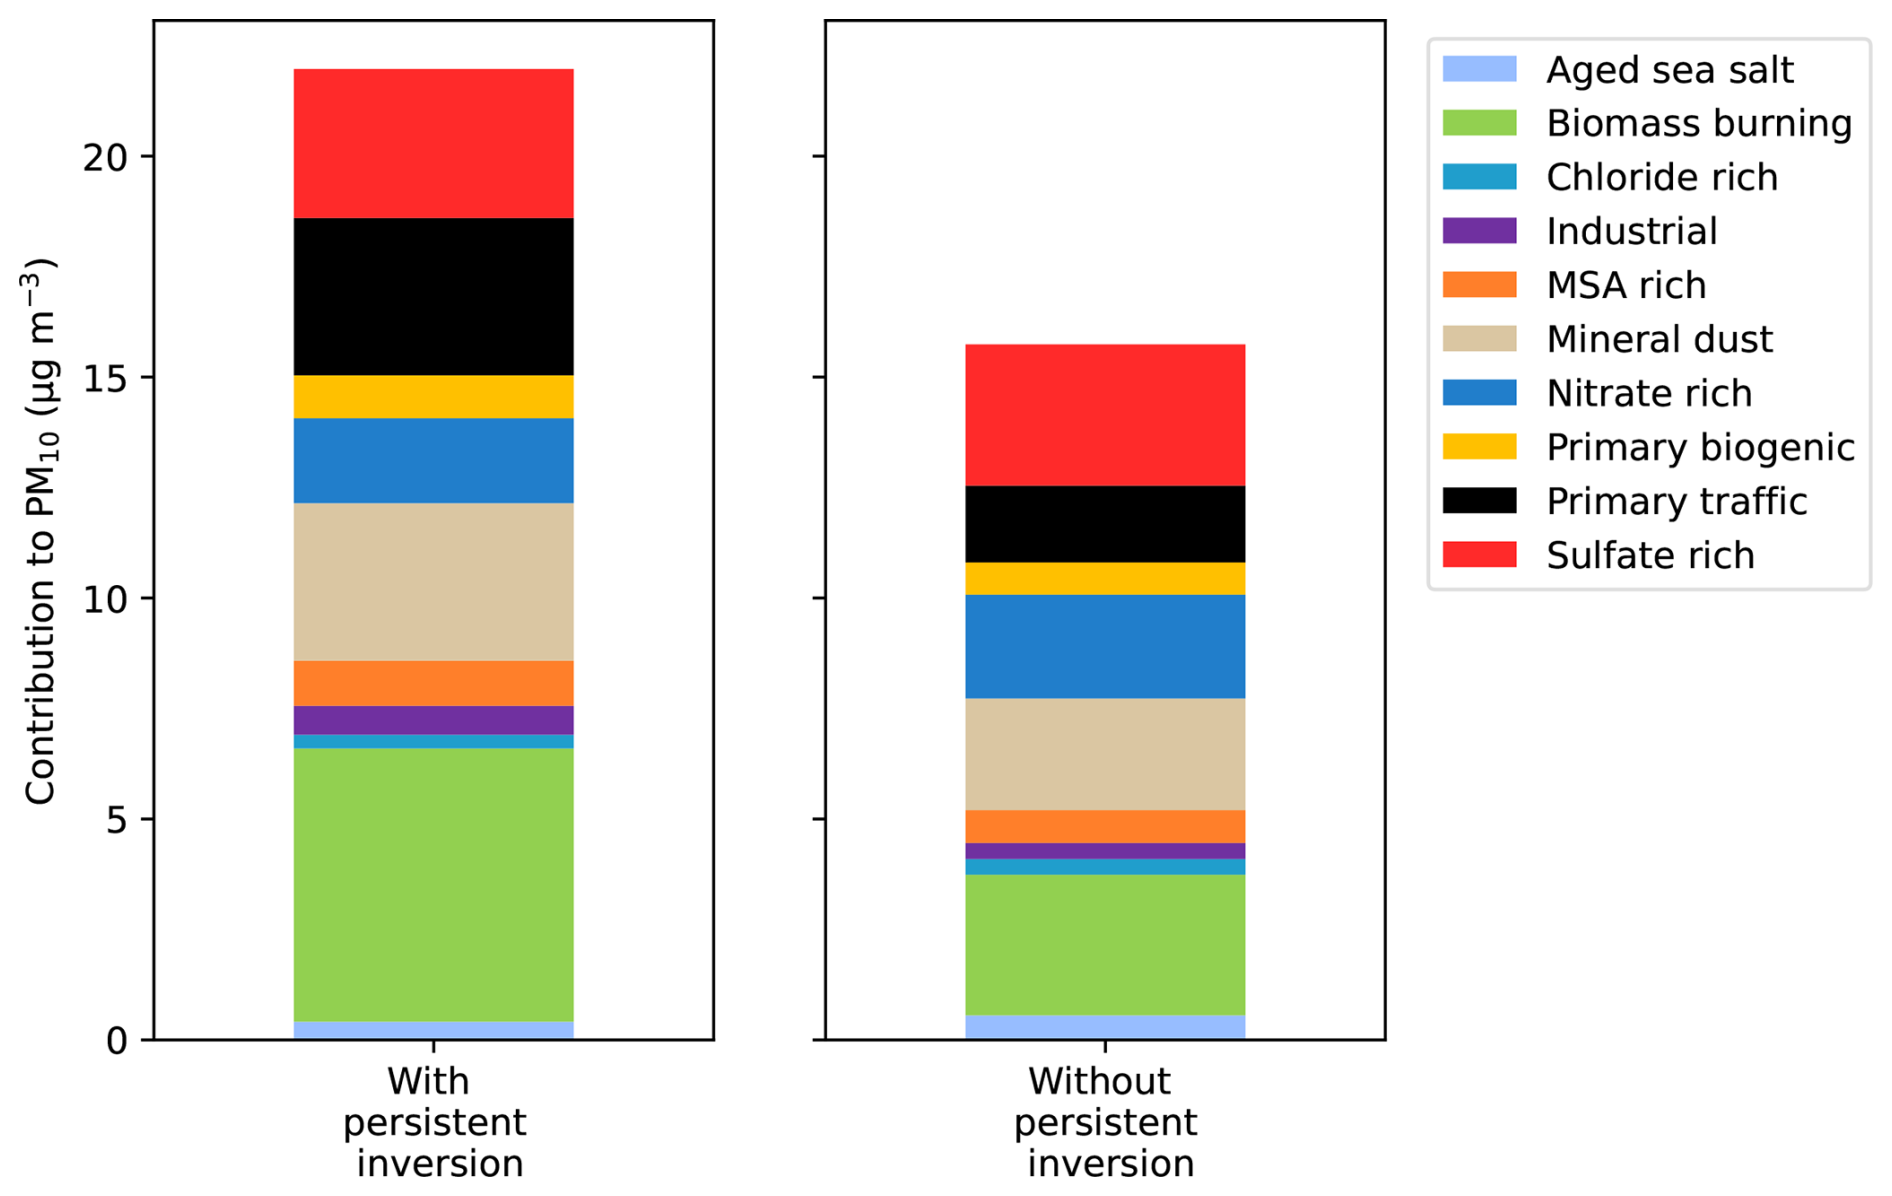
Figure 6Contribution of the different sources to the PM10 composition for days with persistent inversion vs. non-inversion days of the winters 2017–2023.
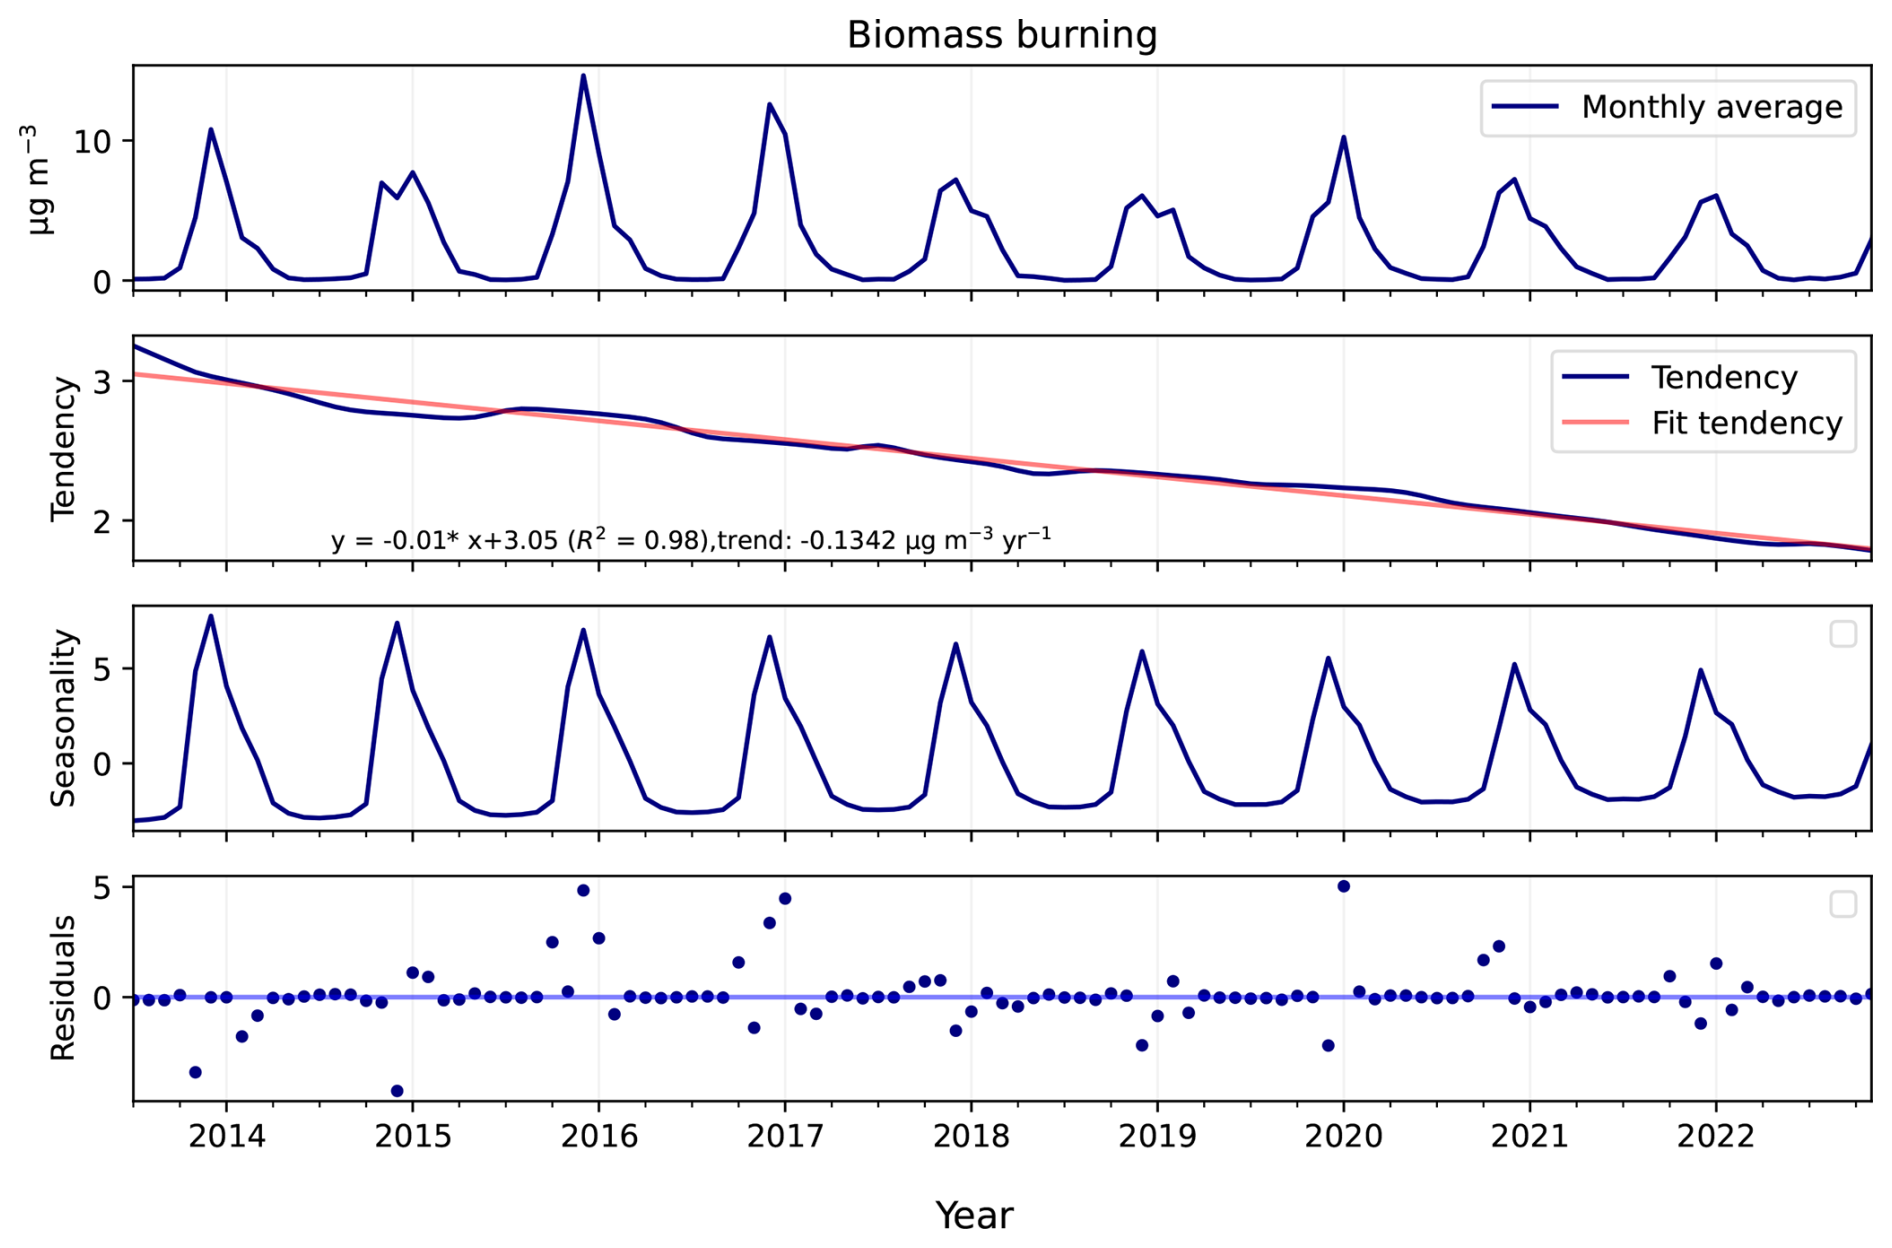
3.3.3 Trend in biomass burning contributions
The trend of the domestic biomass burning PM10 concentrations is investigated via an STL decomposition analysis on this PMF-derived source (Fig. 7), indicating a statistically significant decreasing trend from 2013 to 2023 (p values ≪0.01). The seasonal estimate shows the highest values in the winter season (November, December, January), with a visual trend to a smoothing of the peak concentrations; conversely, from Mar to Sept, the seasonal variations showed constantly lowest values. Extreme residual values were detected in the winter months of 2016, 2017, and 2021, explained by high-concentration episodes of PM10, where the concentration exceeded the European standard for PM10 concentration in 24 h (PM10 concentration varied from 50 to 78 µg m−3). The linear fit line of the trend is highly significant with R2=0.97, with a reduction of 134 ng m−3 yr−1 (−5.5 % yr−1).
This reduction of biomass burning concentrations in Grenoble is 4 times higher than the results from a long-term study (2012 to 2020) in a French rural site – (Observatoire Pérenne de l'Environnement, OPE) (Borlaza et al., 2022) – estimated at 33 ng m−3 yr−1 over the same period. Besides the study of Borlaza et al. (2022), there are no previous PMF studies describing any trend of biomass burning factors. Nevertheless, similar trends were found for concentrations of biomass burning tracers. In particular, Font et al. (2022) presented a downward trend of PM10 concentration from wood burning (a reduction from 1.5 % yr−1 to 3.8 % yr−1) in urban sites in the United Kingdom from 2010 to 2021, by calculating the emission of wood burning from aethalometer measurement. Similarly, from 2002 to 2018 in Norway, a downward trend of 2.8 % yr−1 was also detected for levoglucosan (Yttri et al., 2021). Additionally, Colette et al. (2020) modeled the trend of the emissions from different activities in Europe, showing that the trend of PM10 heating emissions was decreasing in the period 2000–2017, with mean rate values varying from 0.8 % yr−1 to 3.3 % yr−1 for 30 European countries (EMEP monitoring sites). Even though the chemicals and the period of these studies differ, a decreasing trend is generally observed among European cities, including the one investigated here. Interestingly, the biomass burning source in Grenoble shows the strongest decreasing trend, with a reduction of 5.5 % yr−1.
Since the biomass burning sources in Grenoble are related to residential heating, the observed reduction of the concentrations from this source could be linked to household behaviors (including appliance renovation) on top of the changes in meteorological conditions, lowering the overall heating demand. The average annual biomass burning sources PMF-derived is compared to the local PM10 emission inventory for residential heating (tonnes) in the Grenoble metropolis, estimated by the regional air quality monitoring agency (Atmo AuRA), to confirm the trend of biomass burning (Fig. 8). This emission inventory has been available until 2022.
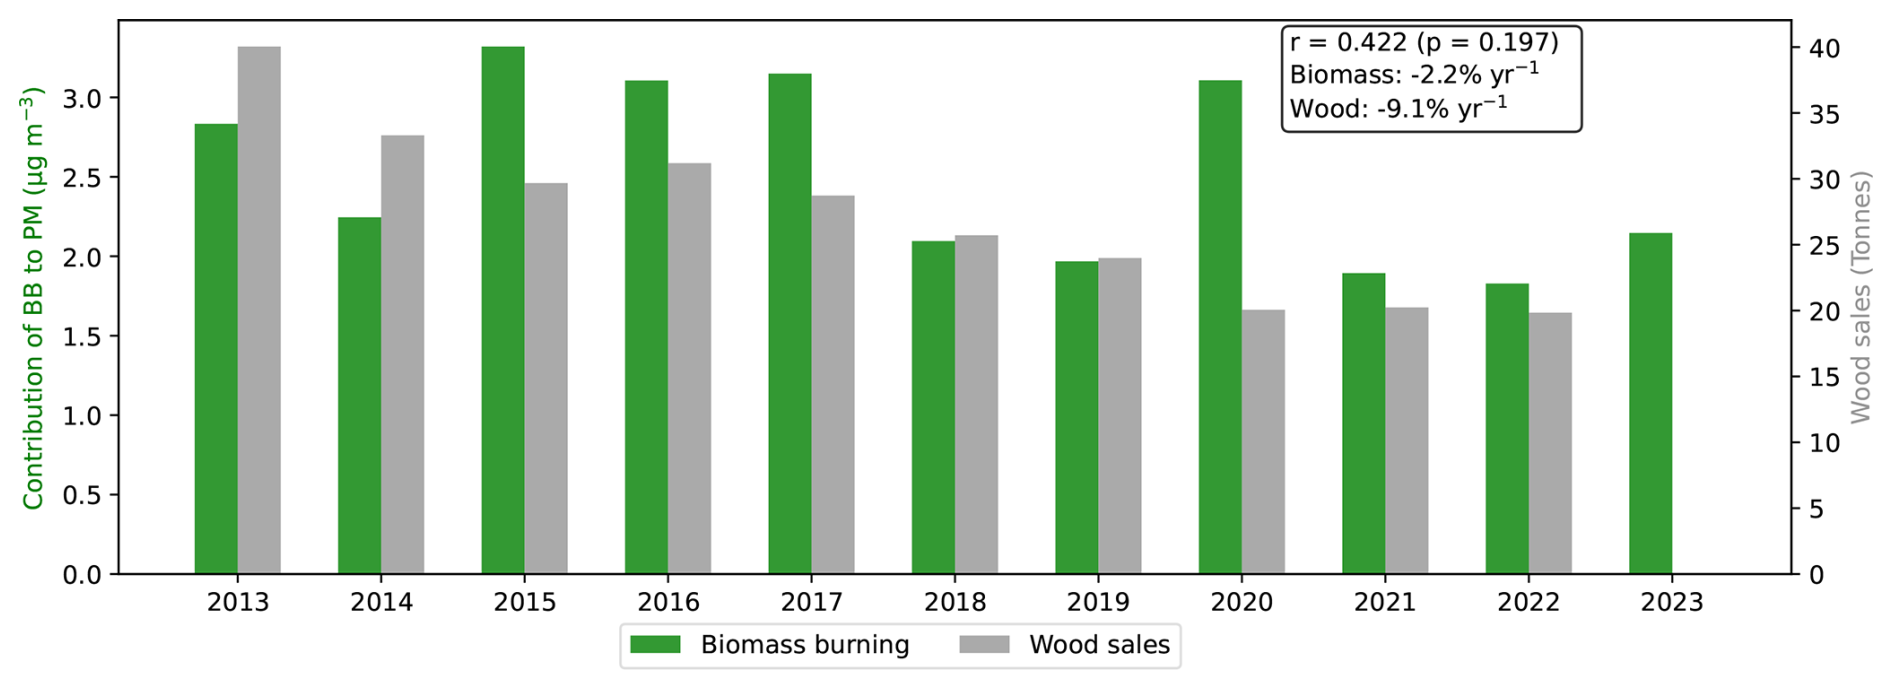
Figure 8Comparison between annual average PM10 emission inventory based on the quantity of wood sales (in grey) in the Grenoble metropolis and the yearly average PM10 concentrations from the PMF biomass burning factor (in green).
Except for the year 2020, the annual average of biomass burning agreed with the emission inventory, demonstrating the consistency between the sources observed by the PMF model and the local inventory emission data. Since 2015, the Grenoble metropolis has set up an air-wood bonus to encourage households to renew their individual wood-burning appliance (fireplace or stove). It aims to replace all open fireplaces with closed appliances in October 2024. The downward trend of biomass burning concentration could then be considered as partly due to the implementation of dedicated action plans at the regional scale.
3.3.4 Trends in traffic exhaust emissions
Similar to the time series of biomass burning concentrations, the traffic contribution was subjected to specific STL analysis (Fig. 9). A significant downward trend of the concentrations of PM from traffic emission is detected with a reduction of 374 ng m−3 yr−1 (12.9 % yr−1) (p value ≪0.01). This reduction is almost 3 times larger than that of the biomass burning concentrations. Traffic concentration before 2017 also showed a clear seasonality with maxima in winter, which nearly disappeared from 2018 onward. It is striking that the same behaviors (strong downward trend and smoothing) are also observed for NOx concentration, another indicator of traffic exhaust emission, which is also observed for NOx seasonal patterns (see Sect. S6 and Fig. S7). Residuals show extreme values in the same month as biomass burning in 2016 and 2017, matching the PM10 episode. The traffic trend closely follows a linear regression fit line, with R2=0.94.
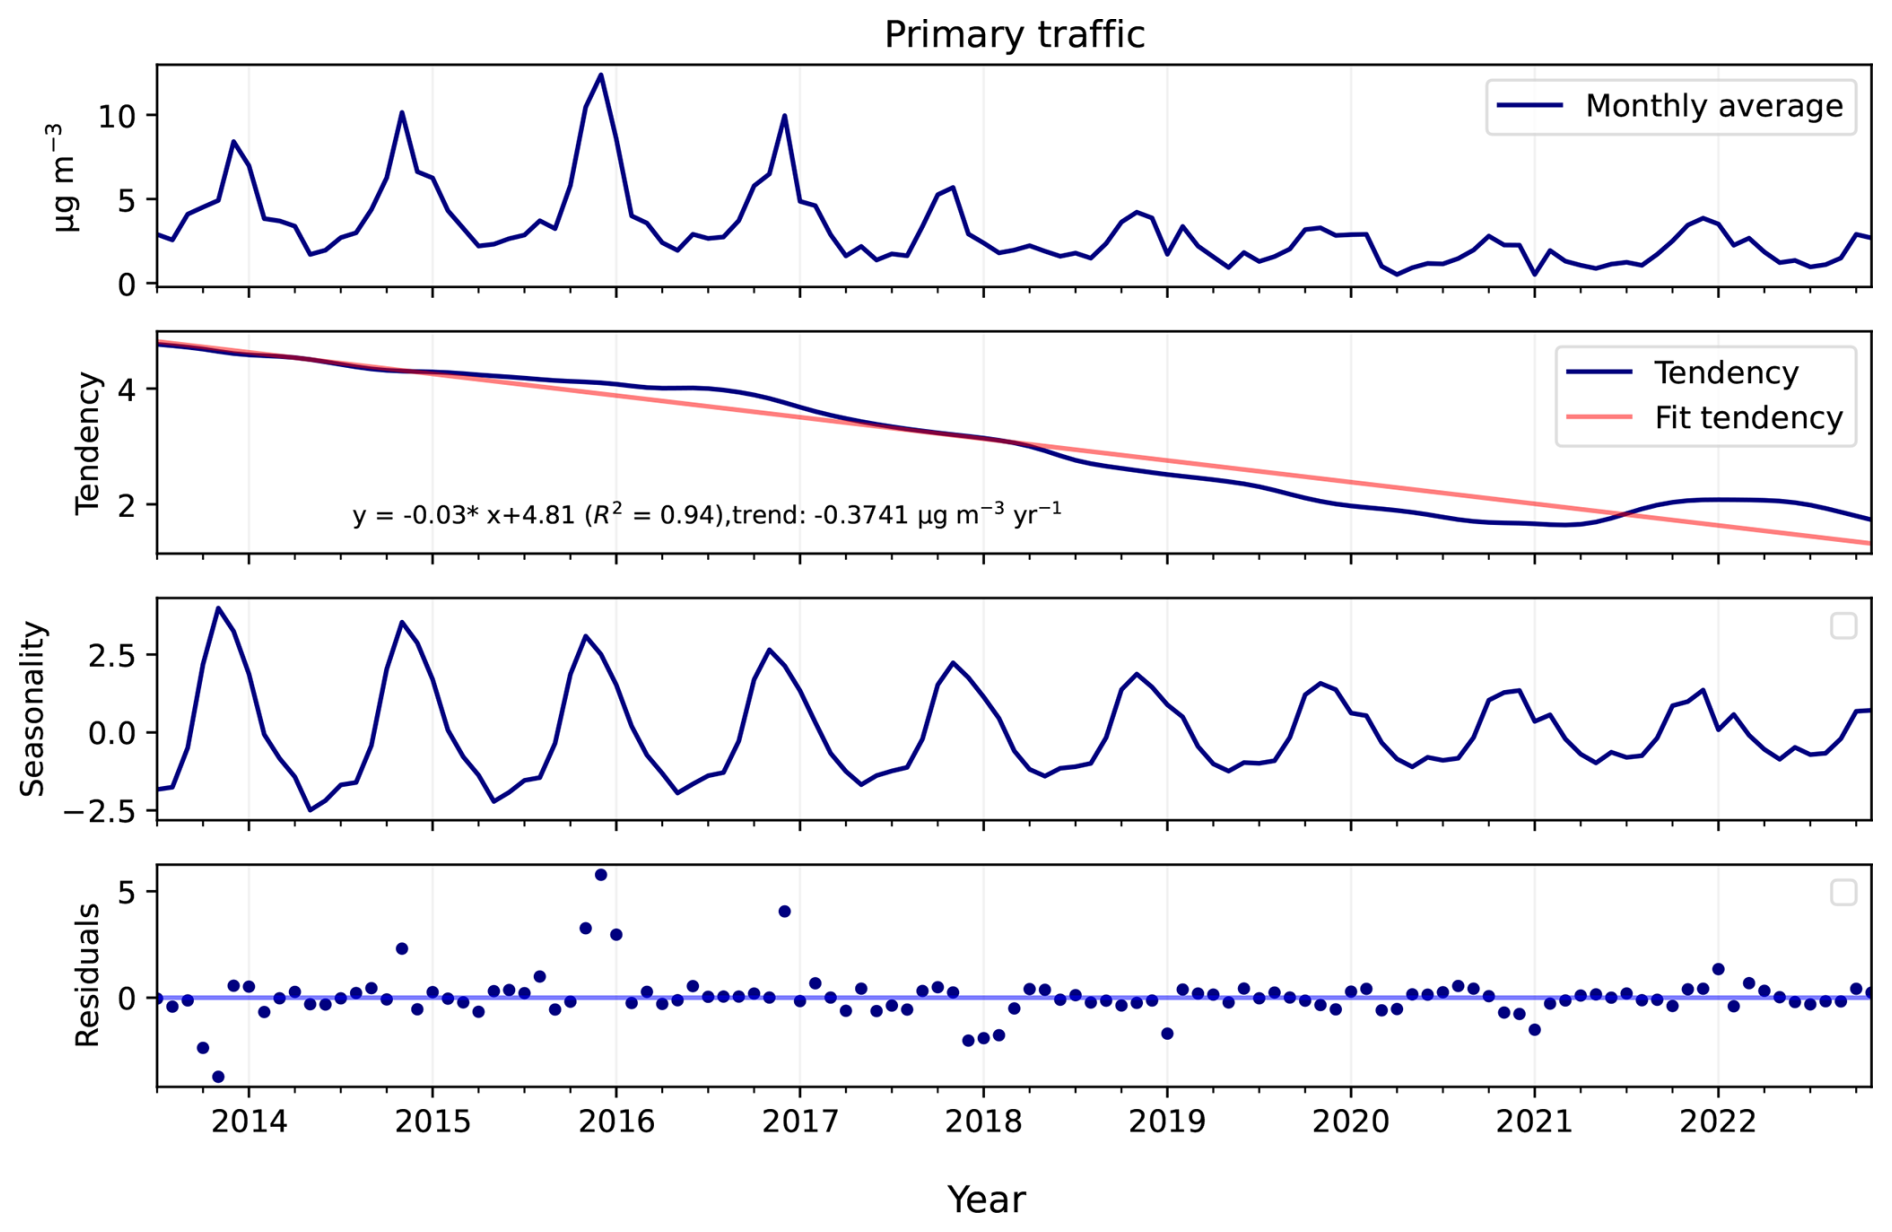
The downward traffic trend observed in this study is consistent with another long-term study (2012–2020) of a rural site in France, which showed a traffic trend of −6.5 % yr−1 (58 % total reduction) (Borlaza et al., 2022). This is aligned with other results of fossil fuel black carbon in several rural sites in France (Font et al., 2025), or EC over many rural sites in Europe (Aas et al., 2024). Additionally, our result also agrees with other studies, like that by Pandolfi et al. (2016), which indicated a downward trend of traffic sources in an urban site in Spain, with a reduction of 5.6 % yr−1 (56 % total reduction), which is lower than that of this study. Finally, the trend of traffic emission to PM10 in 30 European countries was modeled as reported by Colette et al. (2020), showing a downward trend with a reduction from 2.3 % yr−1 to 3.5 % yr−1 from 2000 to 2017. As for biomass burning, the Grenoble supersite seems then experiencing faster reductions in primary traffic PM loadings than most of others European cities.
Furthermore, the PMF-derived traffic factor was compared to the local PM10 traffic emission inventory by fuel type (provided by Atmo AuRA), revealing very similar trends (Fig. 10). In addition, this source is also compared to the PM10 emission by the transport sector (kilotonnes) over France, which was assessed from the emission inventory data of CITEPA (Fig. S11), also confirming the concomitant reductions of traffic emissions and contributions to PM10 in ambient air.
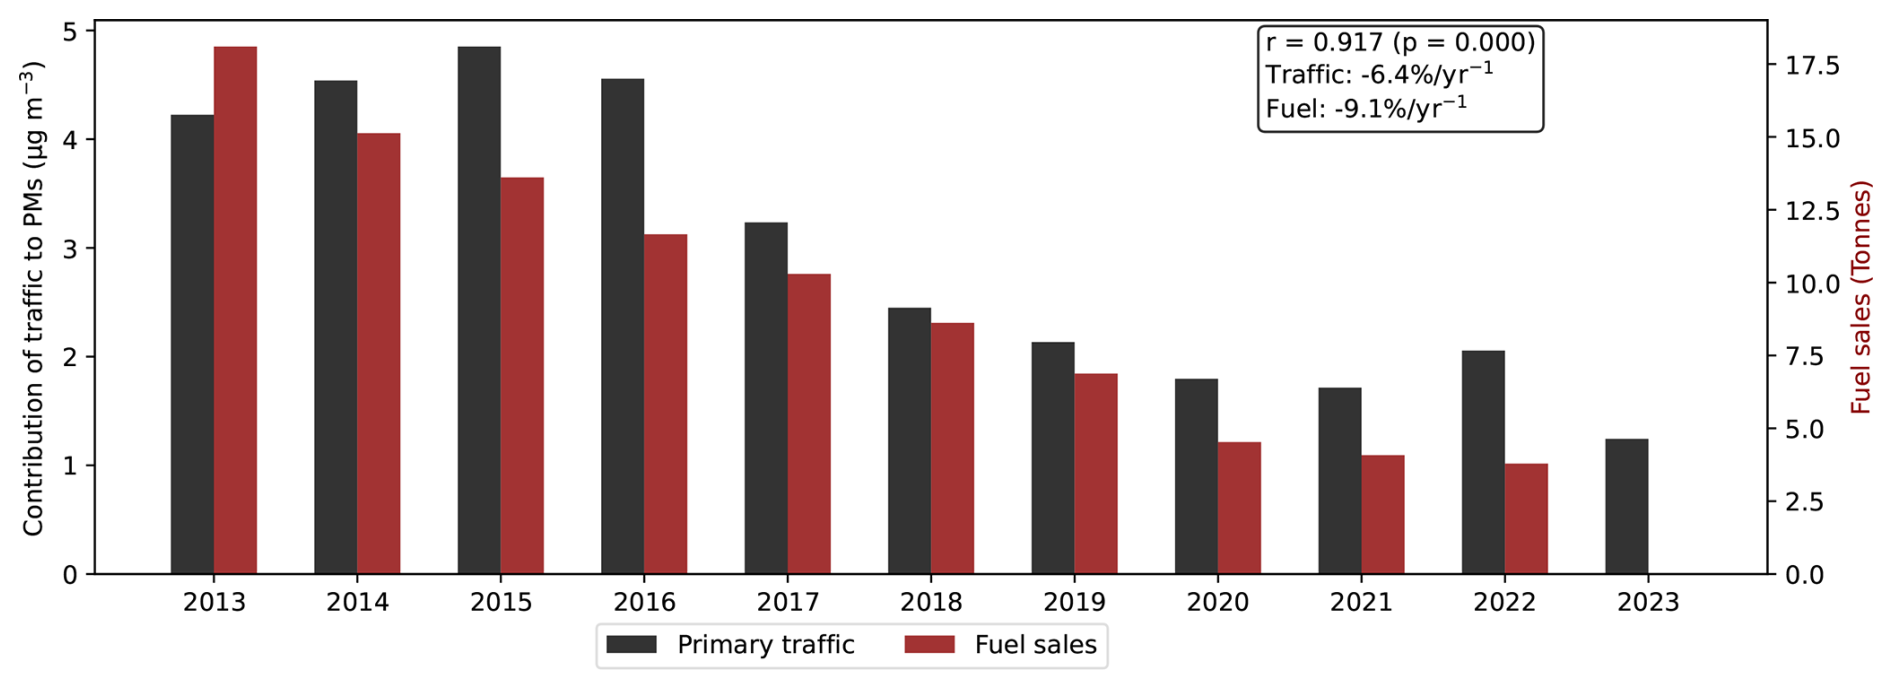
Figure 10Comparison between annual average PM10 emission inventory based on the quantity of fuel sale (red bar) in the Grenoble metropolis and the yearly average PM10 concentrations from the PMF-derived traffic source contributions (black bar).
This traffic trend may be separated into three parts. Between 2014 and 2016 with a slow decrease trend of −3 % yr−1; from 2016 to 2021, with an average reduction of 10 % yr−1, and a mild increasing trend of approximately 3 % yr−1 in the last three years of the study. The beginning of this increase coincides with the post-lockdown period, when transportation activities were back to normal, resulting in a fairly similar contribution of traffic sources compared to that in the pre-lockdown period.
Besides the implementation of the two versions of the Euro 6 emission standards (introduced in 2015 and 2018, respectively), local emission abatement strategies decided by Grenoble municipality from 2016 onwards might be the main drivers for the observed decreasing trends (City's low emission zone https://zfe.grenoblealpesmetropole.fr/, last assess: 21 May 2025).
3.4 Trends in PM10 OP sources
In this section, the sources of OP are assessed using regression techniques, which are presented in Sect. 2.6. The most appropriate model is selected based on characteristics of PMF-derived sources and OPv, as shown in Sect. 3.4.1. Intrinsic OP derived from the best regression model, indicating the highest redox-active PM sources, is presented in Sect. 3.4.2. Finally, Sect. 3.4.3 provides the trend of OP sources, highlighting which sources are the drivers of OP trends.
3.4.1 Selection of the most appropriate model
Following the methodology exposed in Ngoc Thuy et al. (2024), the characteristics of the dataset, including collinearity and heteroscedasticity, are tested in order to select a satisfactory inversion model for OPDTT source apportionment (SA) and OPAA SA (Table S8). The OP SA can be applied for the 11-year PMF solution since the source profiles have been demonstrated to be homogenous over the years. Consequently, the OPm should be substantially homogenous over the years (Ngoc Thuy et al., 2024), and it is unnecessary to perform the OP SA for each year separately. The characteristic tests indicate that the weighted positive least squares (wPLS) and weighted least squares (WLS) could be suitable models for both OPAA and OPDTT SA. The average accuracy metrics of the testing dataset in 500 iteration runs (including R2, RMSE, MAE) of wPLS and WLS were compared to select the most appropriate model (Table S9). Finally, WLS was chosen due to the highest R2 and lowest error for both OPAA and OPDTT prediction. The comparison between observed and predicted OPAA and OPDTT showed a good correlation between measured OP and WLS predicted OP, with R2=0.80 and 0.70 for OPAA and OPDTT, respectively (Figs. S12 and S13), with n=1570 for OPAA and OPDTT.
In addition, the study revealed good performance of Mutiple Layer Perceptron (MLP) and Random Forest (RF) for the training and testing datasets (Table S10). These neural network models were overfitting the results of OP SA for the 6 French sites tested in Ngoc Thuy et al. (2024) since the number of samples was lower than 200 for individual sites. The present study confirmed the conclusion of Ngoc Thuy et al. (2024), demonstrating that a higher number of samples improved the performance of the neural network model. However, such non-linear models do not provide values for the intrinsic OP, which is basically the regression slope of the regression. Since the objectives of MLP and RF are not to define a “slope” but to better predict OP, therefore, the “slopes” of such models actually constantly vary with the input data to ensure the best performance of the model. Since the OP intrinsic is not defined, these models cannot be selected for the final results at this stage.
3.4.2 Intrinsic OP of PMF-derived sources
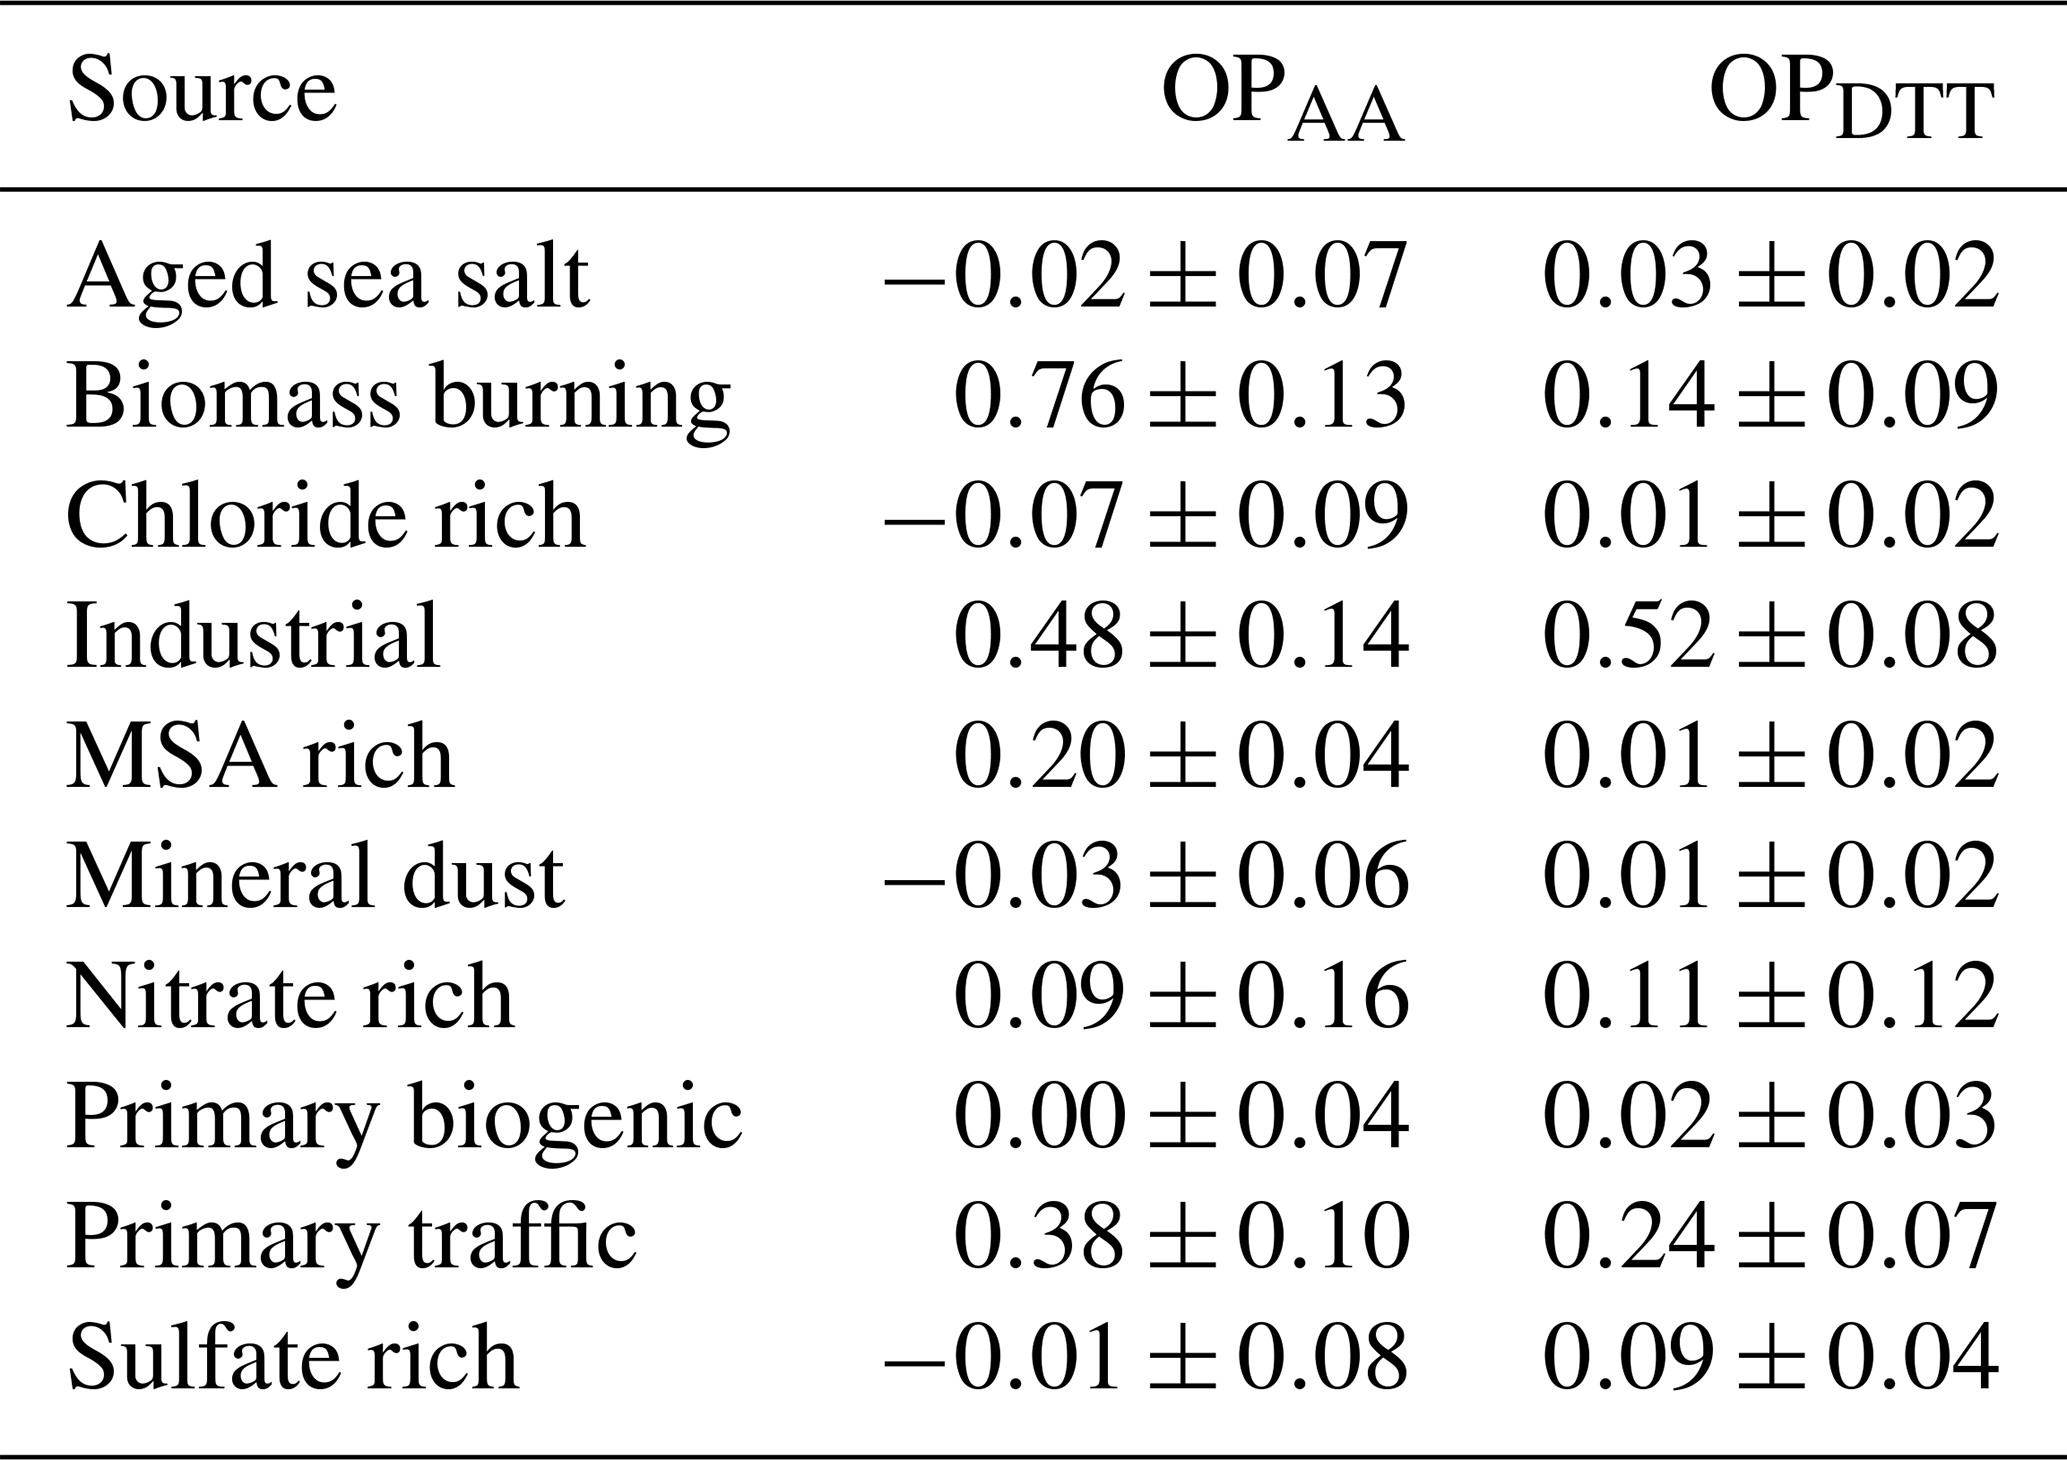
The intrinsic OP of 1 µg PM10 source (OPm ) is investigated thanks to the WLS technique, resulting in 500 values of OPm for each source (Tables 2 and S11). The anthropogenic sources, including biomass burning, industrial, and traffic, have the dominant intrinsic OPDTT and OPAA, which is consistent with the study in 2017–2018 in Grenoble (Borlaza et al., 2021b) and results obtained at other French sites (Ngoc Thuy et al., 2024; Weber et al., 2021) and EU sites (Fadel et al., 2023; Veld et al., 2023). The different ranking of the intrinsic OP of the sources according to the two assays is also aligned with previous results (Weber et al., 2021). While intrinsic OPAA of biomass burning is highest (0.76 ), followed by industrial (0.48 ) and traffic (0.38 ), the order of intrinsic OPDTT is industrial (0.52 ), traffic (0.38 ) and biomass burning (0.14 ). The intrinsic OPDTT of biomass burning is also lower than that of OPAA, as reported by Borlaza et al. (2021b), suggesting the synergistic and antagonistic effects between some elements, quinones, or bioaerosols, decreasing the overall intrinsic OPDTT of this source (Pietrogrande et al., 2022; Samake et al., 2017; Xiong et al., 2017).
The other anthropogenic sources, including nitrate-rich and sulfate-rich, have lower intrinsic OP than anthropogenic sources associated with combustion (traffic and biomass burning), as reported by Daellenbach et al. (2020). The natural sources have a negligible intrinsic OP (lower than 0.03 for OPDTT and 0.2 for OPAA). These findings highlight the high impact of the anthropogenic sources, verified for the overall period 2013–2023.
Table 2Intrinsic OPAA and OPDTT () of PM10 sources (mean ± std of 500 iterations).
3.4.3 Trends in OP
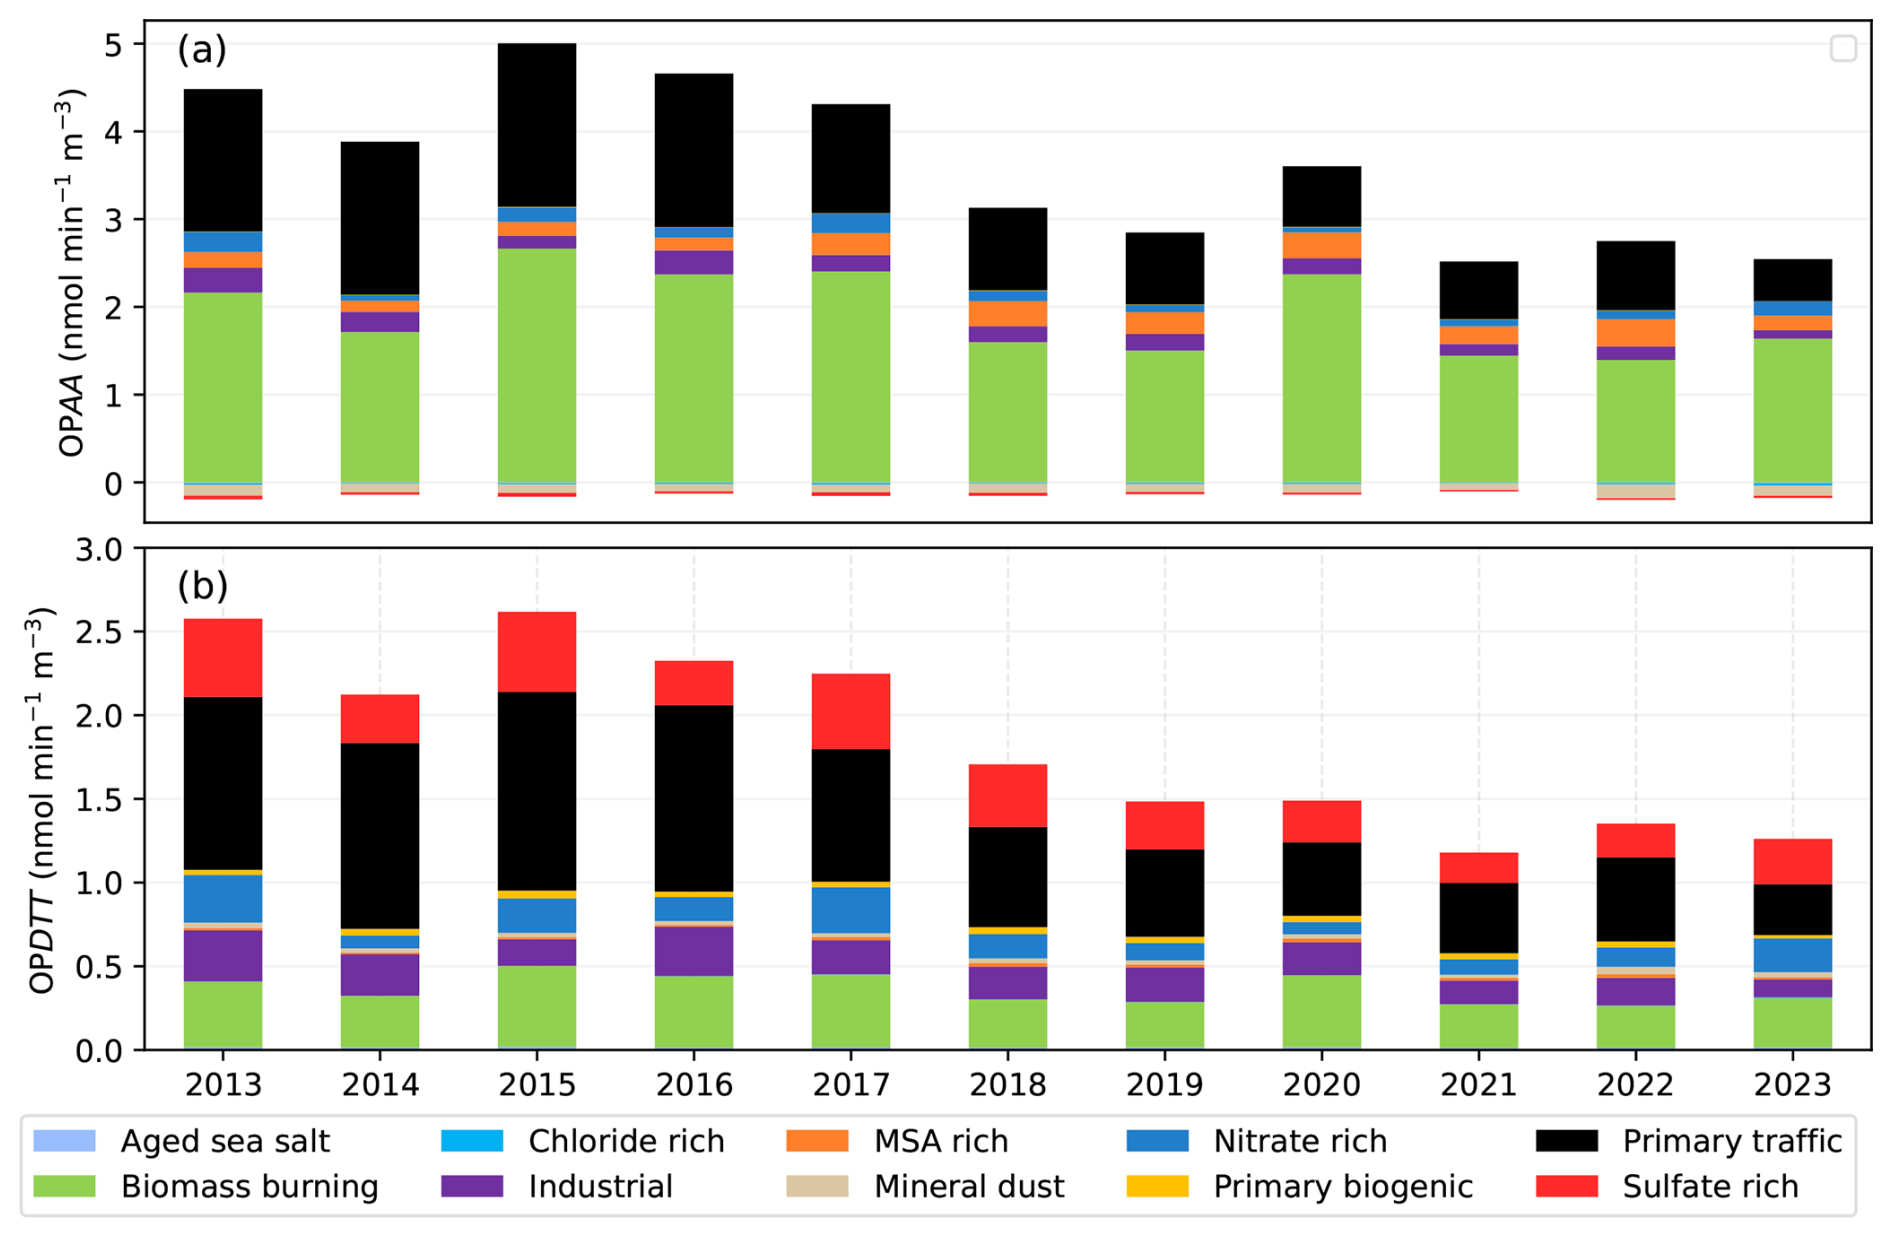
The trend of OP is first presented by the yearly average contribution of sources to OPAA and OPDTT (Fig. 4), indicating a reduction of OP values over the years. Overall, the yearly average of the OP and OP is decreasing and reached its lowest values in 2021 (2.41 and 1.17 for OPAA and OPDTT, respectively). From 2018 onward, both assays consistently exhibited lower OPv values than in preceding years. Although OPv is calculated using PM10 concentration, implying that a decrease in PM10 concentration generally reduces OPv, the contribution of sources to OP is different from that of PM10. While dust and sulfate-rich are dominantly contribute to PM10, biomass burning is the most important contributor to OPAA (1.87±2.7 nmol min−1 m−3), and primary traffic is commonly assessed as the largest contributor to OPDTT (0.71±0.70 nmol min−1 m−3). The industrial mass contribution is 10 times lower than that of the sulfate-rich. However, industrial emissions appear to contribute much more to OPAA and equally to OPDTT than the sulfate-rich factor. This finding was also observed in 2017–2018 at the same site in Grenoble (Borlaza et al., 2021b). This significant contribution of traffic and biomass burning over the years is more evident when considering relative contribution (Fig. S15). These results again emphasize the importance of considering not only the mass concentration but also its redox activity in evaluating the potential adverse health effects of a source of PM.
In addition, the temporal evolution of OPAA and OPDTT did not exactly follow PM10 trends, especially for the period of 2016–2017 and 2019–2020. Regarding the period between 2016 and 2017, a dramatic increase in PM10 concentration is observed, principally due to the higher contribution of nitrate and sulfate-rich. On the other hand, OPAA and OPDTT values remained fairly unchanged between 2016 and 2017. Focus on 2019 and 2020, the PM concentration and OPv values are identical (less than 0.001 µg m−3 and of difference, respectively), while OP presents a remarkable difference (Δ=0.8 ). Indeed, the discrepancy between 2019 and 2020 in OP is principally attributable to a higher contribution to biomass burning, which is the dominant driver of OP. Overall, the downward trend of OPAA and OPDTT is different from PM10, since the driven sources of OP and PM are different.
The yearly average may not be properly representative of the trends of OP; therefore, a STL deconvolution was performed for OP and OP (Figs. S16, S17, respectively) to investigate the trend of OPm over the 11 years of the study. Indeed, considering the trend of the intrinsic OPm confirms that the downward trend of some sources leads to a change in the trend of OP and OP.
An insignificant linear trend is observed for OP (fit line: R2=0.4, p values ≪0.01), yet its average intrinsic activity still exhibits a decreasing value, with the annual mean falling by approximately 0.002 (2.5 %) across the study period. Interestingly, the seasonality of OP exactly matches the seasonality of biomass-burning concentrations, pointing out that the high values of OP in winter align with biomass-burning activities. The trend line of OP did not match the trend of biomass burning nor that of the traffic or industrial emissions, suggesting the synergistic effect between sources, as well as the influence of the other sources outside of the winter season, such as MSA-rich and primary biogenic, which get a high ranking of OP (Table 2).
Conversely, the OP showed a significant downward trend (R2=0.6, p value ≪0.01), with a reduction of 0.005 (6.5 %) across 11 years. The seasonality of OPDTT is different from that of biomass burning and OP, since biomass burning is not the main driver of OPDTT (only ranked third), indicating a lower influence of this source on OP compared to OP. Interestingly, a slight increase in OP from 2021 onward is also observed, which is associated with PM10 and traffic, suggesting that traffic emission could be the main driver for increasing PM10 concentration and OP from 2021. Overall, the relative decrease of OP exceeds that of OP could be explained by the 4th most important contributor to these OPs. All four leading contributors to OP show significant reductions, whereas MSA-rich factor, one of the top four contributors to OP, has an increasing trend. These findings again underscore that trends in OPm are governed by the evolution of the sources most active in each assay. Thus, the decrease in the magnitude of the OPm depends on how its dominant redox-active sources evolve over time.
Considering the volume-based metrics (OPv), a downward trend is detected for OPAA and OPDTT. PM10 decreased by 3.9 % over the decade, which is consistently comparable to OP (4.9 %) and OP (5.3 %). This good agreement partially reflects the influence of the PM mass concentration since these OPv values are calculated using PM10 concentration. However, the slight difference in the relative downward trend could be related to the most driven sources of OP and PM, as discussed above.
Finally, the impact of persistent inversion days on the OPv is also investigated to assess the association between the redox activity of PM sources and thermal inversion. A comparison of the source's contribution to OPv (for both AA and DTT) between the period with and without persistent inversions is carried out and shown in Fig. S14. The comparison confirms the larger increases in average OPAA (85.1 %) and OPDTT (63.8 %) compared to that of PM10 (39.6 %) for the persistent inversion periods. The higher values of OPAA and OPDTT are related to the larger increases in the contribution of local anthropogenic sources, with BB impacting most the OPAA values while traffic significantly influences OPDTT. This result again highlights the potential effect of persistent inversion on the PM10 source's contribution, but all the more of their redox-active properties, which could be associated with the health-relevant metrics (Tassel et al., 2025).
Over the decade, anthropogenic sources have driven OP, with biomass burning impacting OPAA and traffic/industrial sources dominating OPDTT. Frequent thermal inversion in Alpine valley strongly amplifies OP, which is more significant than the mass of PM10 itself. Finally, OPv and intrinsic OP trends over the decade do not align with that of PM10 mass, emphasizing the need to prioritize redox-active components over the bulk PM concentration in air quality policy.
Thanks to long-term PM10 observations with a detailed set of chemical markers, a comprehensive source apportionment was performed to identify the evolution of PM10 sources in Grenoble (France). This is one of the very few studies in Europe that could assess over 11 years of PM10 sources and the only study so far investigating trends in PM10-related OP. The trend of PM10 sources, especially anthropogenic sources such as biomass burning and primary traffic, was evaluated and linked to the meteorology and emission reduction policies. In addition, the trend of OPm, OPv, and sources of OP revealed that the trend of OP depends on the source that drives OP. The analysis of these trends confirms the improvement of the air quality at the Grenoble supersite from 2013 to 2023, and objectivates the main sources that are involved in their concentration' decrease.
Nevertheless, the following methodological limitations in this long-term study shall be kept in mind:
-
Daily concentrations of metal elements were only analyzed for some periods (2013, 2017–2018, 2020–2021), while the remaining data were derived from weekly sampling. An imputation technique was implemented to impute daily concentrations. The PMF result demonstrated the stability of most chemical profiles at Grenoble from 2013 to 2023, compared to those previously published (Borlaza et al., 2021a), despite these uncertainties in the imputed metal concentrations.
-
The process of implementing such a PMF analysis strategy is not straightforward. A combined PMF approach could be used for datasets with different time resolution (Via et al., 2023). This approach would allow combining the 7 d and daily filter samples into a PMF without performing imputation.
-
The lack of a secondary biogenic organic aerosol tracer in long-term observations prevents the identification of the BSOA source, which could make up about 10 % of the total mass of PM10 on a yearly average, as observed in previous work at the site (Borlaza et al., 2021a), which used 3-MBTCA and picnic acid for the yearly period of observation.
Thanks to long-term PM10 observations with a detailed set of chemical markers, a comprehensive source apportionment was performed to identify the evolution of PM10 sources in Grenoble (France). This is one of the very few studies in Europe that could assess over 11 years of PM10 sources and the only study so far investigating trends in PM10-related OP. The trend of PM10 sources, especially anthropogenic sources such as biomass burning and primary traffic, was evaluated and linked to the meteorology and emission reduction policies. In addition, the trend of OPm, OPv, and sources of OP revealed that the trend of OP depends on the source that drives OP. The analysis of these trends confirms the improvement of the air quality at the Grenoble supersite from 2013 to 2023, and objectivates the main sources that are involved in their concentration' decrease.
Overall, a total of ten sources were identified, including aged sea salt, biomass burning, chloride-rich mineral dust, MSA-rich, nitrate-rich, industrial, primary biogenic, and primary traffic. The source chemical profiles are consistent with those presented in 2017–2018 (Borlaza et al., 2021a), demonstrating that the sources of PM10 in Grenoble were relatively stable during this study period. The trend of PM10 sources was investigated using STL decomposition, which reveals a downward trend for all the PM10 sources over 11 years, especially for the anthropogenic sources. Extending PMF outputs to oxidative potential apportionment showed that biomass burning, traffic, and industrial emissions dominate redox activity in both the ascorbic acid (AA) and dithiothreitol (DTT) assays. Trend analysis of volume- and mass-normalized OP metrics indicates that biomass burning governs the long-term behavior of OPAA. In contrast, traffic is the principal driver of OPDTT assay, underscoring source-specific control of PM10 OP in the Grenoble atmosphere.
Both of these anthropogenic sources, as well as their influences on PM10 OP, showed significant decreasing trends concomitantly to the implementation of emission reduction strategies (both at the national and regional levels) that should be reinforced to reach the goals of the European zero pollution action plan and the recently revised Directive on ambient air quality (22024/2881/EU). The continuation of these measurements will take place in the coming years, with this site being selected as one of the supersites for the new EU Air Quality directive.
The datasets could be made available upon request by contacting the corresponding authors.
The supplement related to this article is available online at https://doi.org/10.5194/acp-26-247-2026-supplement.
VDNT performed the source apportionment and the trend of sources, and the result visualisation. GU, JLJ mentoring, supervision, validation of the methodology and results. RE, SD, CV, and AN contributed to data acquisition (analytical investigation on samples) and data curation. OF, JLJ, and GU acquired funding for the original PM sampling and analysis. VDNT wrote the original draft. All authors reviewed and edited the manuscript.
The contact author has declared that none of the authors has any competing interests.
Publisher's note: Copernicus Publications remains neutral with regard to jurisdictional claims made in the text, published maps, institutional affiliations, or any other geographical representation in this paper. While Copernicus Publications makes every effort to include appropriate place names, the final responsibility lies with the authors. Views expressed in the text are those of the authors and do not necessarily reflect the views of the publisher.
The authors would like to express their sincere gratitude to many people of the Air-O-Sol analytical platform at IGE for sample management and chemical analyses. We gratefully acknowledge the personnel at Atmo AuRA (C. Bret, C. Chabanis) for their support in conducting the dedicated sample collection and providing weekly metals data.
This study was partially funded by the French Ministry of Environment through its contributions to the CARA program. Part of the project was also funded by Atmo AuRA ensuring filter sampling and costs related to the analyses of the elemental concentrations in the weekly samples. IGE contributed financially to the analyses of ions. The extended analyses for the daily trace elements were funded by the QAMECS program from Ademe (grant no. 1662C0029).
This paper was edited by Chiara Giorio and reviewed by Xiao-San Luo and two anonymous referees.
Aas, W., Fagerli, H., Alastuey, A., Cavalli, F., Degorska, A., Feigenspan, S., Brenna, H., Gliß, J., Heinesen, D., Hueglin, C., Holubová, A., Jaffrezo, J.-L., Mortier, A., Murovec, M., Putaud, J.-P., Rüdiger, J., Simpson, D., Solberg, S., Tsyro, S., Tørseth, K., and Yttri, K. E.: Trends in Air Pollution in Europe, 2000–2019, Aerosol and Air Quality Research, 24, 230237, https://doi.org/10.4209/aaqr.230237, 2024.
Allard, J., Chevrier, F., Laurent, J.-P., Coulaud, C., Paci, A., Jezek, I., Mocnik, G., Brulfert, G., Besombes, J.-L., and Jaffrezo, J.-L.: Un système de mesure de température pour suivre l'influence de la stabilité atmosphérique sur la qualité de l'air dans la vallée de l'Arve, Météorologie, 39, https://doi.org/10.4267/2042/70368, 2019.
Ayres, J. G., Borm, P., Cassee, F. R., Castranova, V., Donaldson, K., Ghio, A., Harrison, R. M., Hider, R., Kelly, F., Kooter, I. M., Marano, F., Maynard, R. L., Mudway, I., Nel, A., Sioutas, C., Smith, S., Baeza-Squiban, A., Cho, A., Duggan, S., and Froines, J.: Evaluating the toxicity of airborne particulate matter and nanoparticles by measuring oxidative stress potential – A workshop report and consensus statement, Inhalation Toxicology, 20, 75–99, https://doi.org/10.1080/08958370701665517, 2008.
Azur, M. J., Stuart, E. A., Frangakis, C., and Leaf, P. J.: Multiple imputation by chained equations: what is it and how does it work?, International journal of methods in psychiatric research, 20, 40–49, https://doi.org/10.1002/mpr.329, 2011.
Baduel, C., Voisin, D., and Jaffrezo, J.-L.: Seasonal variations of concentrations and optical properties of water soluble HULIS collected in urban environments, Atmos. Chem. Phys., 10, 4085–4095, https://doi.org/10.5194/acp-10-4085-2010, 2010.
Baduel, C., Nozière, B., and Jaffrezo, J. L.: Summer/winter variability of the surfactants in aerosols from Grenoble, France, Atmospheric Environment, 47, 413–420, https://doi.org/10.1016/j.atmosenv.2011.10.040, 2012.
Bates, J. T., Weber, R. J., Verma, V., Fang, T., Ivey, C., Liu, C., Sarnat, S. E., Chang, H. H., Mulholland, J. A., and Russell, A.: Source impact modeling of spatiotemporal trends in PM2.5 oxidative potential across the eastern United States, Atmospheric Environment, 193, 158–167, https://doi.org/10.1016/j.atmosenv.2018.08.055, 2018.
Belis, C. A., Favez, O., Harrison, R. M., Larsen, B. R., Amato, F., El Haddad, I., Hopke, P. K., Nava, S., Paatero, P., Prévôt, A., Quass, U., Vecchi, R., Viana, M., and European Commission (Eds.): European guide on air pollution source apportionment with receptor models, Publications Office, Luxembourg, 1 pp., https://doi.org/10.2788/9332, 2014.
Belis, C. A., Karagulian, F., Amato, F., Almeida, M., Artaxo, P., Beddows, D. C. S., Bernardoni, V., Bove, M. C., Carbone, S., Cesari, D., Contini, D., Cuccia, E., Diapouli, E., Eleftheriadis, K., Favez, O., El Haddad, I., Harrison, R. M., Hellebust, S., Hovorka, J., Jang, E., Jorquera, H., Kammermeier, T., Karl, M., Lucarelli, F., Mooibroek, D., Nava, S., Nøjgaard, J. K., Paatero, P., Pandolfi, M., Perrone, M. G., Petit, J. E., Pietrodangelo, A., Pokorná, P., Prati, P., Prevot, A. S. H., Quass, U., Querol, X., Saraga, D., Sciare, J., Sfetsos, A., Valli, G., Vecchi, R., Vestenius, M., Yubero, E., and Hopke, P. K.: A new methodology to assess the performance and uncertainty of source apportionment models II: The results of two European intercomparison exercises, Atmospheric Environment, 123, 240–250, https://doi.org/10.1016/j.atmosenv.2015.10.068, 2015.
Borlaza, L. J. S., Weber, S., Jaffrezo, J.-L., Houdier, S., Slama, R., Rieux, C., Albinet, A., Micallef, S., Trébluchon, C., and Uzu, G.: Disparities in particulate matter (PM10) origins and oxidative potential at a city scale (Grenoble, France) – Part 2: Sources of PM10 oxidative potential using multiple linear regression analysis and the predictive applicability of multilayer perceptron neural network analysis, Atmos. Chem. Phys., 21, 9719–9739, https://doi.org/10.5194/acp-21-9719-2021, 2021a.
Borlaza, L. J. S., Weber, S., Uzu, G., Jacob, V., Cañete, T., Micallef, S., Trébuchon, C., Slama, R., Favez, O., and Jaffrezo, J.-L.: Disparities in particulate matter (PM10) origins and oxidative potential at a city scale (Grenoble, France) – Part 1: Source apportionment at three neighbouring sites, Atmos. Chem. Phys., 21, 5415–5437, https://doi.org/10.5194/acp-21-5415-2021, 2021b.
Borlaza, L. J., Weber, S., Marsal, A., Uzu, G., Jacob, V., Besombes, J.-L., Chatain, M., Conil, S., and Jaffrezo, J.-L.: Nine-year trends of PM10 sources and oxidative potential in a rural background site in France, Atmos. Chem. Phys., 22, 8701–8723, https://doi.org/10.5194/acp-22-8701-2022, 2022.
Borlaza-Lacoste, L., Mardoñez, V., Marsal, A., Hough, I., Dinh, N. T. V., Dominutti, P., Jaffrezo, J.-L., Alastuey, A., Besombes, J.-L., Moènik, G., Moreno, I., Velarde, F., Gardon, J., Cornejo, A., Andrade, M., Laj, P., and Uzu, G.: Oxidative potential of particulate matter and its association to respiratory health endpoints in high-altitude cities in Bolivia, Environmental Research, 255, 119179, https://doi.org/10.1016/j.envres.2024.119179, 2024.
Brighty, A., Jacob, V., Uzu, G., Borlaza, L., Conil, S., Hueglin, C., Grange, S. K., Favez, O., Trébuchon, C., and Jaffrezo, J.-L.: Cellulose in atmospheric particulate matter at rural and urban sites across France and Switzerland, Atmos. Chem. Phys., 22, 6021–6043, https://doi.org/10.5194/acp-22-6021-2022, 2022.
Calas, A., Uzu, G., Martins, J. M. F., Voisin, Di., Spadini, L., Lacroix, T., and Jaffrezo, J. L.: The importance of simulated lung fluid (SLF) extractions for a more relevant evaluation of the oxidative potential of particulate matter, Scientific Reports, 7, 1–12, https://doi.org/10.1038/s41598-017-11979-3, 2017.
Calas, A., Uzu, G., Kelly, F. J., Houdier, S., Martins, J. M. F., Thomas, F., Molton, F., Charron, A., Dunster, C., Oliete, A., Jacob, V., Besombes, J.-L., Chevrier, F., and Jaffrezo, J.-L.: Comparison between five acellular oxidative potential measurement assays performed with detailed chemistry on PM10 samples from the city of Chamonix (France), Atmos. Chem. Phys., 18, 7863–7875, https://doi.org/10.5194/acp-18-7863-2018, 2018.
Caporale, G. M., Gil-Alana, L. A., and Carmona-González, N.: Particulate matter 10 (PM10): persistence and trends in eight European capitals, Air Quality, Atmosphere and Health, 14, 1097–1102, https://doi.org/10.1007/s11869-021-01002-0, 2021.
Carbone, C., Decesari, S., Mircea, M., Giulianelli, L., Finessi, E., Rinaldi, M., Fuzzi, S., Marinoni, A., Duchi, R., Perrino, C., Sargolini, T., Vardè, M., Sprovieri, F., Gobbi, G. P., Angelini, F., and Facchini, M. C.: Size-resolved aerosol chemical composition over the Italian Peninsula during typical summer and winter conditions, Atmospheric Environment, 44, 5269–5278, https://doi.org/10.1016/j.atmosenv.2010.08.008, 2010.
Cleveland, R. B., Cleveland, W. S., McRae, J. E., and Terpenning, I.: STL: A Seasonal-Trend decomposition, J. off. Stat., 6, 3–73, 1990.
Colette, A., Solberg, S., Aas, W., and Walker, S.-E.: Understanding Air Quality Trends in Europe. Focus on the relative contribution of changes in emission of activity sectors, natural fraction and meteorological variability, European Topic Centre on Air pollution, transport, noise and industrial pollution, Kjeller, Norway, EIONET Report–ETC/ATNI, 8, 2020.
Craney, T. A. and Surles, J. G.: Model-dependent variance inflation factor cutoff values, Quality Engineering, 14, 391–403, https://doi.org/10.1081/QEN-120001878, 2002.
Daellenbach, K. R., Uzu, G., Jiang, J., Cassagnes, L.-E., Leni, Z., Vlachou, A., Stefenelli, G., Canonaco, F., Weber, S., Segers, A., Kuenen, J. J. P., Schaap, M., Favez, O., Albinet, A., Aksoyoglu, S., Dommen, J.,Baltensperger, U., Geiser, M., El Haddad, I., Jaffrezo, J.-L., and Prévôt, A. S. H.: Sources of particulate-matter air pollution and its oxidative potential in Europe of particulate-matter air pollution and its oxidative potential in Europe, Nature, 587, 414–419, https://doi.org/10.1038/s41586-020-2902-8, 2020.
Diapouli, E., Manousakas, M., Vratolis, S., Vasilatou, V., Maggos, T., Saraga, D., Grigoratos, T., Argyropoulos, G., Voutsa, D., Samara, C., and Eleftheriadis, K.: Evolution of air pollution source contributions over one decade, derived by PM10 and PM2.5 source apportionment in two metropolitan urban areas in Greece, Atmospheric Environment, Volume 164, 416–430, ISSN 1352-2310, https://doi.org/10.1016/j.atmosenv.2017.06.016, 2017.
Dominutti, P. A., Borlaza, L., Sauvain, J. J., Thuy, V. D. N., Houdier, S., Suarez, G., Jaffrezo, J. L., Tobin, S., Trébuchon, C., Socquet, S., Moussu, E., Mary, G., and Uzu, G.: Source apportionment of oxidative potential depends on the choice of the assay: insights into 5 protocols comparison and implications for mitigation measures, Environmental Science: Atmospheres, https://doi.org/10.1039/d3ea00007a, 2023.
Ducret-stich, R. E. and Tsai, M.: RESEARCH ARTICLE PM 10 source apportionment in a Swiss Alpine valley impacted by highway traffic, Environ. Sci. Pollut. Res., 20, 6496–6508, https://doi.org/10.1007/s11356-013-1682-1, 2013.
European committee for standardization: Ambient air – Determination of the concentration of levoglucosan – Chromatographic method, CEN-CENELEC Management Centre, CEN/TS 18044:2024 Ambient air – Determination of the concentration of levoglucosan – Chromatographic method, ISBN: 9780539268379, BSI, 2024.
Fadel, M., Courcot, D., Delmaire, G., Roussel, G., Afif, C., and Ledoux, F.: Source apportionment of PM2.5 oxidative potential in an East Mediterranean site, Science of the Total Environment, 900, https://doi.org/10.1016/j.scitotenv.2023.165843, 2023.
Favez, O., El Haddad, I., Piot, C., Boréave, A., Abidi, E., Marchand, N., Jaffrezo, J.-L., Besombes, J.-L., Personnaz, M.-B., Sciare, J., Wortham, H., George, C., and D'Anna, B.: Inter-comparison of source apportionment models for the estimation of wood burning aerosols during wintertime in an Alpine city (Grenoble, France), Atmos. Chem. Phys., 10, 5295–5314, https://doi.org/10.5194/acp-10-5295-2010, 2010.
Favez, O., Weber, S., Petit, J. E., Alleman, L. Y., Albinet, A., Riffault, V., Chazeau, B., Amodeo, T., Salameh, D., Zhang, Y., Srivastava, D., Samaké, A., Aujay-Plouzeau, R., Papin, A., Bonnaire, N., Boullanger, C., Chatain, M., Chevrier, F., Detournay, A., Dominik-Sègue, M., Falhun, R., Garbin, C., Ghersi, V., Grignion, G., Levigoureux, G., Pontet, S., Rangognio, J., Zhang, S., Besombes, J. L., Conil, S., Uzu, G., Savarino, J., Marchand, N., Gros, V., Marchand, C., Jaffrezo, J. L., and Leoz-Garziandia, E.: Overview of the French operational network for in situ observation of PM chemical composition and sources in urban environments (CARA program), Atmosphere, 12, https://doi.org/10.3390/atmos12020207, 2021.
Font, A., Ciupek, K., Butterfield, D., and Fuller, G. W.: Long-term trends in particulate matter from wood burning in the United Kingdom: Dependence on weather and social factors, Environmental Pollution, 314, 120105, https://doi.org/10.1016/j.envpol.2022.120105, 2022.
Font, A., F. de Brito, J., Riffault, V., Conil, S., Jaffrezo, J.-L., and Bourin, A.: Do rural background sites capture changes in primary PM2.5 emissions at the national scale? Recent trends in PM2.5 and its main components in metropolitan France., EGU General Assembly 2025, Vienna, Austria, 27 April–2 May 2025, EGU25-10935, https://doi.org/10.5194/egusphere-egu25-10935, 2025.
Fuzzi, S., Baltensperger, U., Carslaw, K., Decesari, S., Denier van der Gon, H., Facchini, M. C., Fowler, D., Koren, I., Langford, B., Lohmann, U., Nemitz, E., Pandis, S., Riipinen, I., Rudich, Y., Schaap, M., Slowik, J. G., Spracklen, D. V., Vignati, E., Wild, M., Williams, M., and Gilardoni, S.: Particulate matter, air quality and climate: lessons learned and future needs, Atmos. Chem. Phys., 15, 8217–8299, https://doi.org/10.5194/acp-15-8217-2015, 2015.
Gama, C., Monteiro, A., Pio, C., Miranda, A. I., Baldasano, J. M., and Tchepel, O.: Temporal patterns and trends of particulate matter over Portugal: a long-term analysis of background concentrations, Air Quality, Atmosphere and Health, 11, 397–407, https://doi.org/10.1007/s11869-018-0546-8, 2018.
Gianini, M. F. D., Fischer, A., Gehrig, R., Ulrich, A., Wichser, A., Piot, C., Besombes, J. L., and Hueglin, C.: Comparative source apportionment of PM10 in Switzerland for 2008/2009 and 1998/1999 by Positive Matrix Factorisation, Atmospheric Environment, 54, 149–158, https://doi.org/10.1016/j.atmosenv.2012.02.036, 2012.
Glojek, K., Močnik, G., Alas, H. D. C., Cuesta-Mosquera, A., Drinovec, L., Gregorič, A., Ogrin, M., Weinhold, K., Ježek, I., Müller, T., Rigler, M., Remškar, M., van Pinxteren, D., Herrmann, H., Ristorini, M., Merkel, M., Markelj, M., and Wiedensohler, A.: The impact of temperature inversions on black carbon and particle mass concentrations in a mountainous area, Atmos. Chem. Phys., 22, 5577–5601, https://doi.org/10.5194/acp-22-5577-2022, 2022.
Glojek, K., Thuy, V. D. N., Weber, S., Uzu, G., Manousakas, M., Elazzouzi, R., Džepina, K., Darfeuil, S., Ginot, P., Jaffrezo, J. L., Žabkar, R., Turšiè, J., Podkoritnik, A., and Moènik, G.: Annual variation of source contributions to PM10 and oxidative potential in a mountainous area with traffic, biomass burning, cement-plant and biogenic influences, Environment International, 189, 108787, https://doi.org/10.1016/j.envint.2024.108787, 2024.
Goldfeld, S. M. and Quandt, R. E.: Some Tests for Homoscedasticity, Journal of the American Statistical Association, 60, 539–547, 1965.
Grantz, D. A., Garner, J. H. B., and Johnson, D. W.: Ecological effects of particulate matter, Environment International, 29, 213–239, https://doi.org/10.1016/S0160-4120(02)00181-2, 2003.
Hopke, P. K.: Review of receptor modeling methods for source apportionment, Journal of the Air and Waste Management Association, 66, 237–259, https://doi.org/10.1080/10962247.2016.1140693, 2016.
Hopke, P. K., Dai, Q., Li, L., and Feng, Y.: Global review of recent source apportionments for airborne particulate matter, Science of The Total Environment, 740, 140091, https://doi.org/10.1016/j.scitotenv.2020.140091, 2020.
Largeron, Y. and Staquet, C.: Persistent inversion dynamics and wintertime PM10 air pollution in Alpine valleys, Atmospheric Environment, 135, 92–108, https://doi.org/10.1016/j.atmosenv.2016.03.045, 2016.
Li, J., Chen, B., de la Campa, A. M. S., Alastuey, A., Querol, X., and de la Rosa, J. D.: 2005–2014 trends of PM10 source contributions in an industrialized area of southern Spain, Environmental Pollution, 236, 570–579, https://doi.org/10.1016/j.envpol.2018.01.101, 2018.
Li, N., Xia, T., and Nel, A. E.: The role of oxidative stress in ambient particulate matter-induced lung diseases and its implications in the toxicity of engineered nanoparticles, Free Radical Biology and Medicine, 44, 1689–1699, https://doi.org/10.1016/j.freeradbiomed.2008.01.028, 2008.
Lodovici, M. and Bigagli, E.: Oxidative stress and air pollution exposure, Journal of Toxicology, 2011, https://doi.org/10.1155/2011/487074, 2011.
Mudway, I. S., Kelly, F. J., and Holgate, S. T.: Oxidative stress in air pollution research, Free Radical Biology and Medicine, 151, 2–6, https://doi.org/10.1016/j.freeradbiomed.2020.04.031, 2020.
Nelin, T. D., Joseph, A. M., Gorr, M. W., and Wold, L. E.: Direct and indirect effects of particulate matter on the cardiovascular system, Toxicology Letters, 208, 293–299, https://doi.org/10.1016/j.toxlet.2011.11.008, 2012.
Ngoc Thuy, V. D., Jaffrezo, J.-L., Hough, I., Dominutti, P. A., Salque Moreton, G., Gille, G., Francony, F., Patron-Anquez, A., Favez, O., and Uzu, G.: Unveiling the optimal regression model for source apportionment of the oxidative potential of PM10, Atmos. Chem. Phys., 24, 7261–7282, https://doi.org/10.5194/acp-24-7261-2024, 2024.
Norris, G., Duvall, R., Brown, S., and Bai, S.: EPA Positive Matrix Factorization (PMF) 5.0 Fundamentals and User Guide, prepared for the, U.S. Environmental Protection Agency Office of Research and Development, Washington, DC (EPA/600/R-14/108; STI910511-5594-UG, April), 2014.
O'Brien, R. M.: A caution regarding rules of thumb for variance inflation factors, Quality and Quantity, 41, 673–690, https://doi.org/10.1007/s11135-006-9018-6, 2007.
Paatero, P. and Tappert, U.: Positive matrix factorization: A non-negative factor model with optimal utilization of error estimates of data values, Environmetrics, 5, 111–126, https://doi.org/10.1002/env.3170050203, 1994.
Pandolfi, M., Alastuey, A., Pérez, N., Reche, C., Castro, I., Shatalov, V., and Querol, X.: Trends analysis of PM source contributions and chemical tracers in NE Spain during 2004–2014: a multi-exponential approach, Atmos. Chem. Phys., 16, 11787–11805, https://doi.org/10.5194/acp-16-11787-2016, 2016.
Pietrodangelo, A., Bove, M. C., Forello, A. C., Crova, F., Bigi, A., Brattich, E., Riccio, A., Becagli, S., Bertinetti, S., Calzolai, G., Canepari, S., Cappelletti, D., Catrambone, M., Cesari, D., Colombi, C., Contini, D., Cuccia, E., De Gennaro, G., Genga, A., Ielpo, P., Lucarelli, F., Malandrino, M., Masiol, M., Massabò, D., Perrino, C., Prati, P., Siciliano, T., Tositti, L., Venturini, E., and Vecchi, R.: A PM10 chemically characterized nation-wide dataset for Italy. Geographical influence on urban air pollution and source apportionment, Science of The Total Environment, 908, 167891, https://doi.org/10.1016/j.scitotenv.2023.167891, 2024.
Pietrogrande, M. C., Romanato, L., and Russo, M.: Synergistic and Antagonistic Effects of Aerosol Components on Its Oxidative Potential as Predictor of Particle Toxicity, Toxics, 10, https://doi.org/10.3390/toxics10040196, 2022.
Pope, C. A. and Dockery, D. W.: Health effects of fine particulate air pollution: Lines that connect, Journal of the Air and Waste Management Association, 56, 709–742, https://doi.org/10.1080/10473289.2006.10464485, 2006.
Rao, X., Zhong, J., Brook, R. D., and Rajagopalan, S.: Effect of Particulate Matter Air Pollution on Cardiovascular Oxidative Stress Pathways, Antioxidants and Redox Signaling, 28, 797–818, https://doi.org/10.1089/ars.2017.7394, 2018.
Rosenblad, A.: The Concise Encyclopedia of Statistics, Journal of Applied Statistics, 38, 867–868, https://doi.org/10.1080/02664760903075614, 2011.
Samake, A., Uzu, G., Martins, J. M. F., Calas, A., Vince, E., Parat, S., and Jaffrezo, J. L.: The unexpected role of bioaerosols in the Oxidative Potential of PM, Scientific Reports, 7, https://doi.org/10.1038/s41598-017-11178-0, 2017.
Samaké, A., Jaffrezo, J.-L., Favez, O., Weber, S., Jacob, V., Albinet, A., Riffault, V., Perdrix, E., Waked, A., Golly, B., Salameh, D., Chevrier, F., Oliveira, D. M., Bonnaire, N., Besombes, J.-L., Martins, J. M. F., Conil, S., Guillaud, G., Mesbah, B., Rocq, B., Robic, P.-Y., Hulin, A., Le Meur, S., Descheemaecker, M., Chretien, E., Marchand, N., and Uzu, G.: Polyols and glucose particulate species as tracers of primary biogenic organic aerosols at 28 French sites, Atmos. Chem. Phys., 19, 3357–3374, https://doi.org/10.5194/acp-19-3357-2019, 2019a.
Samaké, A., Jaffrezo, J.-L., Favez, O., Weber, S., Jacob, V., Canete, T., Albinet, A., Charron, A., Riffault, V., Perdrix, E., Waked, A., Golly, B., Salameh, D., Chevrier, F., Oliveira, D. M., Besombes, J.-L., Martins, J. M. F., Bonnaire, N., Conil, S., Guillaud, G., Mesbah, B., Rocq, B., Robic, P.-Y., Hulin, A., Le Meur, S., Descheemaecker, M., Chretien, E., Marchand, N., and Uzu, G.: Arabitol, mannitol, and glucose as tracers of primary biogenic organic aerosol: the influence of environmental factors on ambient air concentrations and spatial distribution over France, Atmos. Chem. Phys., 19, 11013–11030, https://doi.org/10.5194/acp-19-11013-2019, 2019b.
Seabold, S. and Perktold, J.: Statsmodels: Econometric and statistical modeling with python, in: 9th Python in Science Conference, Austin, 28 June–3 July 2010, 57–61, https://doi.org/10.25080/Majora-92bf1922-011, 2010.
Srivastava, D., Tomaz, S., Favez, O., Lanzafame, G. M., Golly, B., Besombes, J. L., Alleman, L. Y., Jaffrezo, J. L., Jacob, V., Perraudin, E., Villenave, E., and Albinet, A.: Speciation of organic fraction does matter for source apportionment. Part 1: A one-year campaign in Grenoble (France), Science of the Total Environment, 624, 1598–1611, https://doi.org/10.1016/j.scitotenv.2017.12.135, 2018.
Tassel, C., Jaffrezo, J.-L., Dominutti, P., Daellenbach, K. R., Darfeuil, S., Elazzouzi, R., Laj, P., Marsal, A., Mhadhbi, T., Dinh, V. N. T., Voiron, C., Houdier, S., Durif, M., Chatain, M., Francony, F., Cozic, J., Salque Moreton, G., Le Quilleuc, M., Ghersi, V., Gille, G., Mesbah, B., Stratigou, E., Zublena, M., Diémoz, H., Alastuey, A., D’Anna, B., Marchand, N., Conil, S., Gros, V., van Os, M. F., Salma, I., Mihalopoulos, N., Močnik, G., Džepina, K., Styszko, K., Hüglin, C., Querol, X., Prévôt, A. S. H., Favez, O., Siroux, V., and Uzu, G.: Oxidative Potential of Atmospheric Particles in Europe and Exposure Scenarios, Nature, 647, 109–114, https://doi.org/10.1038/s41586-025-09666-9, 2025.
Tomaz, S., Shahpoury, P., Jaffrezo, J. L., Lammel, G., Perraudin, E., Villenave, E., and Albinet, A.: One-year study of polycyclic aromatic compounds at an urban site in Grenoble (France): Seasonal variations, gas/particle partitioning and cancer risk estimation, Science of the Total Environment, 565, 1071–1083, https://doi.org/10.1016/j.scitotenv.2016.05.137, 2016.
Tomaz, S., Jaffrezo, J. L., Favez, O., Perraudin, E., Villenave, E., and Albinet, A.: Sources and atmospheric chemistry of oxy- and nitro-PAHs in the ambient air of Grenoble (France), Atmospheric Environment, 161, 144–154, https://doi.org/10.1016/j.atmosenv.2017.04.042, 2017.
Veld, M. in 't, Pandolfi, M., Amato, F., Pérez, N., Reche, C., Dominutti, P., Jaffrezo, J., Alastuey, A., Querol, X., and Uzu, G.: Discovering oxidative potential (OP) drivers of atmospheric PM10, PM2.5, and PM1 simultaneously in North-Eastern Spain, Science of the Total Environment, 857, https://doi.org/10.1016/j.scitotenv.2022.159386, 2023.
Via, M., Yus-Díez, J., Canonaco, F., Petit, J. E., Hopke, P., Reche, C., Pandolfi, M., Ivanèiè, M., Rigler, M., Prevôt, A. S. H., Querol, X., Alastuey, A., and Minguillón, M. C.: Towards a better understanding of fine PM sources: Online and offline datasets combination in a single PMF, Environment International, 177, https://doi.org/10.1016/j.envint.2023.108006, 2023.
Viana, M., Kuhlbusch, T. A. J., Querol, X., Alastuey, A., Harrison, R. M., Hopke, P. K., Winiwarter, W., Vallius, M., Szidat, S., Prévôt, A. S. H., Hueglin, C., Bloemen, H., Wåhlin, P., Vecchi, R., Miranda, A. I., Kasper-Giebl, A., Maenhaut, W., and Hitzenberger, R.: Source apportionment of particulate matter in Europe: A review of methods and results, Journal of Aerosol Science, 39, 827–849, https://doi.org/10.1016/j.jaerosci.2008.05.007, 2008.
Vida, M., Foret, G., Siour, G., Jaffrezo, J.-L., Favez, O., Cholakian, A., Cozic, J., Dupont, H., Gille, G., Oppo, S., Zhang, S., Francony, F., Pallares, C., Conil, S., Uzu, G., and Beekmann, M.: Modelling oxidative potential of atmospheric particle: A 2-year study over France, Science of The Total Environment, Volume 967, 178813, ISSN 0048-9697, https://doi.org/10.1016/j.scitotenv.2025.178813, 2025.
Waked, A., Favez, O., Alleman, L. Y., Piot, C., Petit, J.-E., Delaunay, T., Verlinden, E., Golly, B., Besombes, J.-L., Jaffrezo, J.-L., and Leoz-Garziandia, E.: Source apportionment of PM10 in a north-western Europe regional urban background site (Lens, France) using positive matrix factorization and including primary biogenic emissions, Atmos. Chem. Phys., 14, 3325–3346, https://doi.org/10.5194/acp-14-3325-2014, 2014.
Weber, S., Uzu, G., Calas, A., Chevrier, F., Besombes, J.-L., Charron, A., Salameh, D., Ježek, I., Močnik, G., and Jaffrezo, J.-L.: An apportionment method for the oxidative potential of atmospheric particulate matter sources: application to a one-year study in Chamonix, France, Atmos. Chem. Phys., 18, 9617–9629, https://doi.org/10.5194/acp-18-9617-2018, 2018.
Weber, S., Salameh, D., Albinet, A., Alleman, L. Y., Waked, A., Besombes, J.-L., Jacob, V., Guillaud, G., Meshbah, B., Rocq, B., Hulin, A., Dominik-Sègue, M., Chrétien, E., Jaffrezo, J.-L., and Favez, O.: Comparison of PM10 Sources Profiles at 15 French Sites Using a Harmonized Constrained Positive Matrix Factorization Approach, Atmosphere, 10, 310, https://doi.org/10.3390/atmos10060310, 2019.
Weber, S., Uzu, G., Favez, O., Borlaza, L. J. S., Calas, A., Salameh, D., Chevrier, F., Allard, J., Besombes, J.-L., Albinet, A., Pontet, S., Mesbah, B., Gille, G., Zhang, S., Pallares, C., Leoz-Garziandia, E., and Jaffrezo, J.-L.: Source apportionment of atmospheric PM10 oxidative potential: synthesis of 15 year-round urban datasets in France, Atmos. Chem. Phys., 21, 11353–11378, https://doi.org/10.5194/acp-21-11353-2021, 2021.
Xiong, Q., Yu, H., Wang, R., Wei, J., and Verma, V.: Rethinking Dithiothreitol-Based Particulate Matter Oxidative Potential: Measuring Dithiothreitol Consumption versus Reactive Oxygen Species Generation, Environmental Science and Technology, 51, 6507–6514, https://doi.org/10.1021/acs.est.7b01272, 2017.
Yttri, K. E., Canonaco, F., Eckhardt, S., Evangeliou, N., Fiebig, M., Gundersen, H., Hjellbrekke, A.-G., Lund Myhre, C., Platt, S. M., Prévôt, A. S. H., Simpson, D., Solberg, S., Surratt, J., Tørseth, K., Uggerud, H., Vadset, M., Wan, X., and Aas, W.: Trends, composition, and sources of carbonaceous aerosol at the Birkenes Observatory, northern Europe, 2001–2018, Atmos. Chem. Phys., 21, 7149–7170, https://doi.org/10.5194/acp-21-7149-2021, 2021.