the Creative Commons Attribution 4.0 License.
the Creative Commons Attribution 4.0 License.
 | 17 Feb 2026
Decadal transition of summertime PM2.5–O3 coupling and secondary organic aerosol dominance in northwest China
Liu Yang
Siqi Zeng
Yunping Kan
Lirong Yang
Weihong Zhang
Weijie Wang
Zijun Zhang
Yan Li
Weiqi Xu
Yucheng Gu
Yaozong Wang
Zhengyan Zuo
Jie Li
Zifa Wang
The Yinchuan metropolitan area in northwest China, situated between the Tengger and Ulan Buh Deserts, is influenced by both natural dust and anthropogenic emissions. However, the evolution of fine particulate matter (PM2.5) and its interaction with ozone (O3) under the region's arid climate remain poorly understood. This study integrates decadal observations (2015–2025) with in-situ measurements using an Aerosol Chemical Speciation Monitor and a Vocus Proton Transfer Reaction Mass Spectrometry during summer 2025 to elucidate the changing PM2.5–O3 relationship and sources of organic aerosols. A pronounced shift was identified: Phase I (2015–2018) featured a rapid decline in PM2.5 accompanied by a sharp O3 increase, while Phase II (2019–2025) exhibited stabilized PM2.5 and plateaued O3, indicating reduced O3 sensitivity to particulate controls. The average non-refractory PM2.5 concentration (16.8 µg m−3) was significantly lower than in eastern Chinese megacities, with organics accounting for ∼ 60 %. Positive matrix factorization resolved three organic aerosol factors, revealing dominant secondary organic aerosols (SOA, ∼ 74 %) derived from prolonged photochemical aging. Volatile organic compound analysis showed that anthropogenic and biogenic precursors, including urban terpenes and aromatic oxidation products jointly contributed to SOA formation. Back-trajectory and potential source analyses indicated that Yinchuan's summer air masses were mainly locally recirculated, with limited influence from long-range transport. These results demonstrate a regional transition toward SOA-dominated fine particles and decoupled PM2.5–O3 dynamics under cleaner conditions, highlighting the need for integrated VOC and oxidant controls to mitigate co-occurring O3 and PM2.5 pollution in arid northwest China.
- Article
(7147 KB) - Full-text XML
-
Supplement
(1805 KB) - BibTeX
- EndNote


Fine particulate matter (PM2.5) has a significant influence on human health, the environment and climate (Nault et al., 2021), which has been included in the Chinese air quality standards for the first time in 2012 (Zhang et al., 2012). Since then, concerns about PM2.5 has been increasingly growing across various sectors of society and researchers. Over the past decade, numerous initiatives aimed at declining particulate pollution in China have been implemented nationwide, resulting in substantial decreases in particulate concentrations, from hundreds to dozens of µg m−3 in the past decade (Zhang et al., 2019a; Geng et al., 2024). Despite this, sporadic pollution events still occurred in China, particularly in underdeveloped areas with heavy industrial emissions (An et al., 2019). In addition to improvements in air quality, advancements in mass spectrometry have greatly enhanced our understanding of the compositions of aerosols (Zhou et al., 2020; Sun et al., 2025), particularly regarding the formation mechanisms of organic aerosols (OA). For example, anthropogenic secondary OA mainly originated from the oxidation of aromatic volatile organic compounds (VOCs) in urban areas, while the photochemical oxidation of biogenic isoprene during the daytime and the oxidation of monoterpenes and sesquiterpenes by nighttime NO3 radicals are the primary pathways for the production of biogenic secondary OA (Mehra et al., 2021).
Extensive studies have been conducted on the aerosol compositions and sources of PM2.5 across China. These studies have demonstrated that organic aerosols are the most important component of atmospheric aerosols, with their contribution ranging from 30 %–40 % in urban areas to as high as 80 %–90 % in rural and suburban regions (Zhang et al., 2007; Zhou et al., 2020). This indicates that OA has become a major factor in the formation of severe pollution, particularly in underdeveloped regions. As emission control measures continue to be implemented across China, gaseous precursors such as SO2 and NOx have experienced sharp declines, resulting in a significant decrease in the inorganic components of PM2.5, e.g., sulfate. In contrast, the contribution of organic aerosols, particularly secondary organic aerosols, has been increasing (Chen et al., 2024), although achieving a persistent decrease in organic aerosols mass concentrations remain a challenge. Specifically, different types of organic aerosols showed varied responses to long-term influences from anthropogenic emission and regional climate change (Zhang et al., 2025). For instance, primary OA, isoprene-derived SOA and monoterpene SOA exhibited distinct variations as corresponding to changes in NOx and sulfate levels. These results suggest the complex sources of organic aerosols in the context of relatively lower pollution levels in China. A very recent study highlighted the pollution characteristics over China, revealing the complex interactions among various atmospheric environmental factors contribute to the unique formation mechanisms of SOA. This underscores the importance of interaction among multiple pollutants, for example, multiphase reactions, and multi-generation chemical transformation process (Huang et al., 2025).
Previous field campaigns on atmospheric organic aerosols in China have primarily focused on three metropolitan regions, e.g., the North China Plain (NCP), Yangtze River Delta (YRD), and Pearl River Delta (PRD) (Zhou et al., 2020). More recently, several measurements have expanded to the Fenwei Plain in the Yellow River Basin, including Yuncheng, Shanxi province (Li et al., 2022; Wang et al., 2024a) and Baoji, Shaanxi province (Li et al., 2025)as well as the Chengdu-Chongqing Basin in southwest China (Bao et al., 2023). These studies reveal significant spatial heterogeneity in OA sources and compositions, driven by variations in precursor emissions meteorology, topography and local industries. For instance, high humidity in southwest China promotes the formation of SOA, which contrasts sharply with the arid conditions in northwest China. Among current online analytical techniques, aerosol mass spectrometry (AMS) has become the method of choice in field campaign, owing to its ability to provide real-time, high time-resolution measurements of aerosol compositions and detailed organic mass spectra information. These capabilities greatly enhance the accuracy and robustness of source apportionment. Despite growing observational efforts, research in northwestern China remains scarce. Xu et al. (2014) conducted the first AMS-based measurements in Lanzhou, a major city in northwest China, finding that local traffic and coal combustion dominated summertime OA, while the non-fossil sources (biomass burning and cooking activities) contributed ∼ 55 % in winter (Xu et al., 2016a). However, Lanzhou is situated in a narrow valley between two mountain ranges, and its unique topography limits its representativenss for the broader northwestern region, leaving OA characteristics across most of this vast area poorly understood.
With China's implementation of the “go west” policy, understanding PM2.5 levels and their sources in the northwest China has become a critical factor in policymaking for region development. The Yinchuan metropolitan area severs as one of the major city clusters in northwest China, located adjacent to the Tengger Desert and Ulan Buh Desert. This area is characterized by heavy industry and mining as its dominant sectors, resulting in a complex air pollution landscape derived from both natural and anthropogenic sources. The unique geographical features and proximity to dust source regions may lead to significantly different characteristics of PM2.5 pollution compared to other areas in China. However, the long-term pollution characteristics of PM2.5 and the increasing concerns regarding O3 have been less thoroughly investigated. In this study, comprehensive measurements of PM2.5 compositions and VOCs are conducted during the summer in Yinchuan, the capital city of Yinchuan metropolitan area. The research focused on the coupling relationships between PM2.5 and O3 over the past decade, examining the chemical compositions of PM2.5 and their responses to changes in meteorological conditions. The source apportionment of organic aerosols and typical emissions of VOCs in Yinchuan are researched.
2.1 Sampling sites and measurements
The summertime campaign was conducted at the Yinchuan Atmospheric Environmental Super Monitoring Station (38°28′24′′ N, 106°10′57′′ E; ALS: 1500 m), from 6 June to 10 July 2025. This station is located on the rooftop of Yinchuan No. 6 Middle School, approximately 10 m above the ground level. The surrounding area mainly consists of residential neighborhoods and traffic roads, making it a typical urban site. Yinchuan, the capital of the Ningxia Hui Autonomous Region, is geographically situated in an arid and semi-arid climate zone. As shown in Fig. 1, Yinchuan is bordered by desert and sandy terrain to the west (Tengger Desert), north (Ulan Buh Desert) and east (Mu Us Sand Land), which contributes to the city's susceptibility to dust storms, particularly during the spring and early summer seasons. Note that the Helan mountains (3556 m) are located to the west of Yinchuan city, approximately 30 km to our sampling site, which could partially mitigate the erosion of sand storms to some extent. In addition, the Yellow River flows from the southwest to the northeast across the Ningxia Autonomous Region, supplying abundant irrigation water and fostering relatively lush vegetation in Yinchuan.
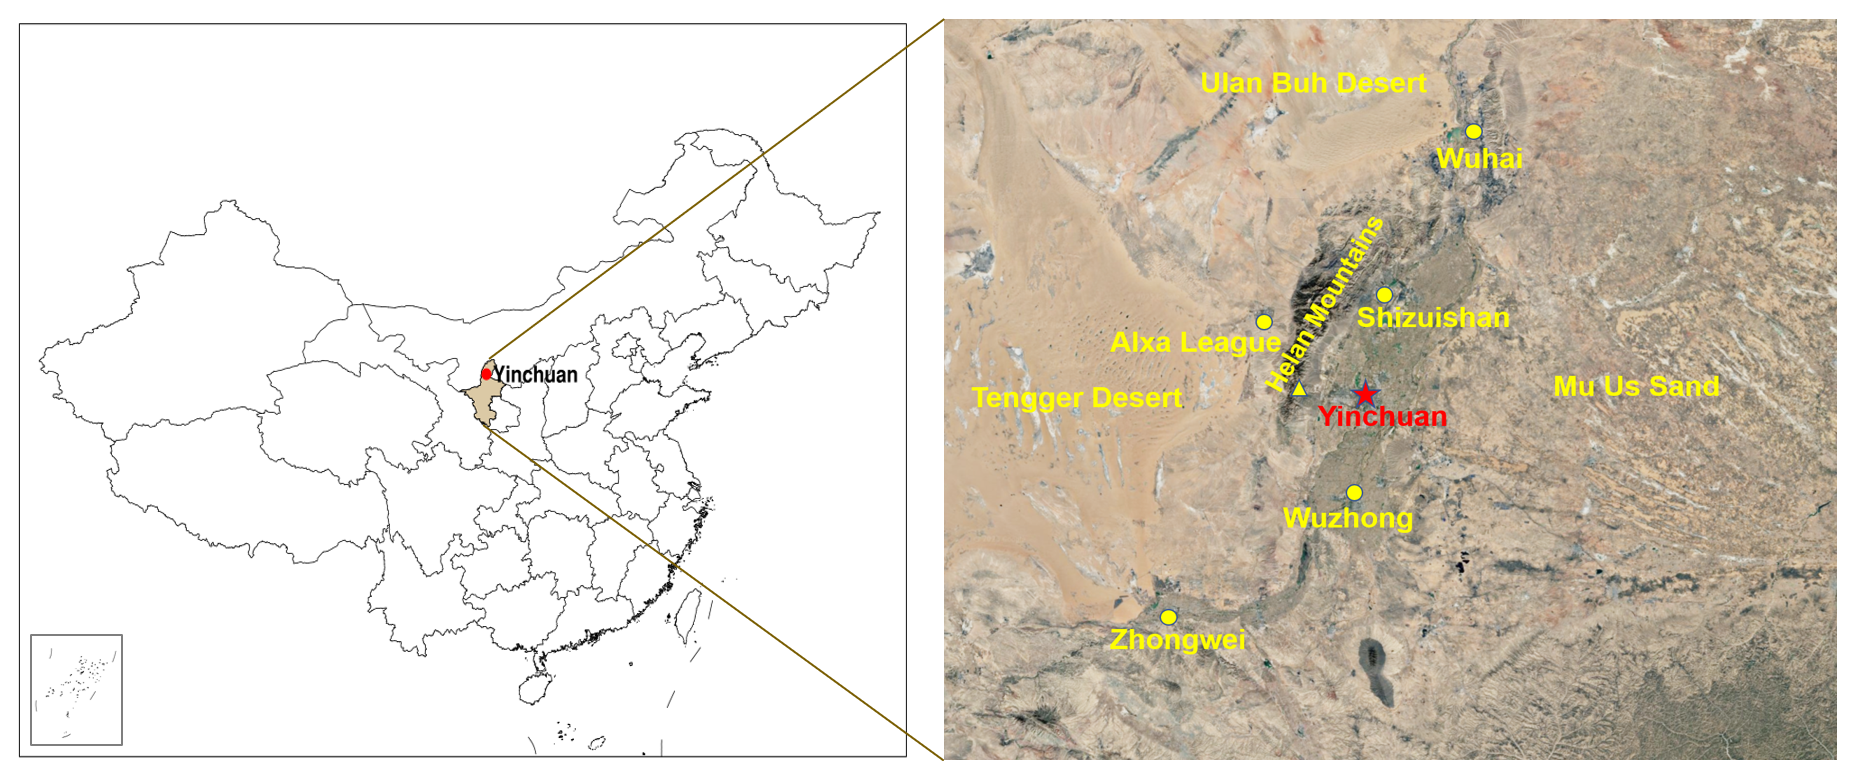
Figure 1Location of the sampling site and surrounding cities (Map data © 2025 Google).
A Time-of-Flight Aerosol Chemical Speciation Monitor (hereafter ToF-ACSM, Aerodyne Research Inc.) was deployed for the real-time online measurement of non-refractory PM2.5 (NR-PM2.5) during this campaign, including organics (Org), sulfate (SO4), nitrate (NO3), ammonium (NH4), and chloride (Chl), with a time resolution of 2 min (Fröhlich et al., 2015). A PM2.5 cyclone was installed at the front of the sampling line to remove coarse particles larger than 2.5 µm, operating at a total sampling flow rate of 5 L min−1. The sampled air was passed through a 1.2 m Nafion dryer for drying, with a dried subflow of 0.1 L min−1 directed into the ToF-ACSM for detection. Details of the ToF-ACSM and instrument setups has been given by Zhou et al. (2022). Note that, due to evaporation temperature limitations, refractory components such as black carbon and dust cannot be detected by the ToF-ACSM, which typically accounted for a non-negligible fraction in northwest China (Xu et al., 2014). In addition to the ToF-ACSM, collocated measurements at the supersite station included elemental carbon (EC) determined from a Sunset OC EC analyzer, and 27 crustal elementals measured using X-ray fluorescence spectrometry (XRF), which together served as the refractory components of PM2.5. The NR-PM2.5 measured by the ToF-ACSM, along with EC and the crustal elements, collectively contributed to the mass closure of total PM2.5. The Al, Si, Ca, Ti and Fe were calculated as soil, while the remaining elementals were classified as metals within the total PM2.5 (Xu et al., 2021).
Simultaneously, VOCs were measured at the same site using a Vocus Scott Proton transfer reaction time-of-flight mass spectrometry (hereafter Vocus PTR-MS; Tofwerk, Switzerland), with a mass resolution of ∼ 4000 and a time resolution of ∼ 1 s. Detailed information about the Vocus PTR-MS can be found in Zhang et al. (2024). The instrument was daily calibrated for 25 VOCs using customized standard gas mixtures, including benzene, toluene, isoprene etc. For species not directly calibrated, their sensitivities were estimated based on a linear fitting relationship between the sensitivities of calibrated species and their proton transfer reaction rate constants (Cappellin et al., 2012). Additionally, hourly meteorological parameters (wind speed, wind direction, relative humidity and temperature), as well as gaseous precursors (NOx, CO and O3) were also obtained from the super monitoring station. All data in this study are reported in local time.
2.2 Data analysis
The ToF-ACSM data were processed using the standard software Tofware (v2.5.13) to obtain the mass concentrations of NR-PM2.5 species and organic aerosol mass spectra. A unity collection efficiency was employed for quantification due to the application of capture vaporizer in the ToF-ACSM (Xu et al., 2016b). Similarly, the Vocus PTR-MS data were also processed with Tofware v4.0.1 to obtain VOCs signals, and the corresponding sensitivities were applied to convert these signals into mixing ratios of VOCs. To resolve the sources of OA, positive matrix factorization (PMF) was performed on the OA mass spectra. A three-factor solution was finally chosen in this study, comprising a primary OA (POA) factor and two secondary OA (SOA) factors.
The 72 h back trajectories of air masses arriving in Yinchuan were calculated hourly using the Hybrid Single Particle Lagrangian Integrated Trajectory (HYSPLIT, NOAA) model (Draxler and Hess, 1997) at a release height of 1500 m. The potential source regions for five NR-PM2.5 species and three OA factor were determined using Potential Source Contribution Function (PSCF) analysis (Polissar et al., 1999), based on the 72 h back trajectory data outputted from HYSPLIT. The 75th percentiles in gridded cells were set as threshold for calculating the PSCF, while applying a weighting function to diminish the impact of low trajectory values.
3.1 Co-existence of PM2.5 and O3 pollution in Yinchuan
Figure 2 illustrates the monthly and annual summertime average concentrations of PM2.5 and O3 in Yinchuan over the past decade. The annual average mass concentration of PM2.5 decreased from 53.6 µg m−3 in 2015 to 38.9 µg m−3 in 2024, marking a reduction of 27 % at an average rate of 1.96 µg m−3 yr−1. This trend aligns with the consistent decline in PM2.5 levels across China, as a result of the implementation of emissions control measures (Zhang et al., 2019a), which also coincided with a concurrent sharp decrease in SO2. These results demonstrate effective nationwide PM2.5 control measures, not only in the well-documented regions such as NCP, PRD and YRD, but also in northwestern China, including Yinchuan. However, while the most significant decline occurred in winter, Yinchuan continued to experience frequent heavy pollution incidents, with PM2.5 levels peak above 200 µg m−3. This highlight persistent challenges related to wintertime particulate pollution in the region, primarily associated with the enhanced coal combustion in heating seasons in northern China. It is noted that, despite the overall downward trend in annual PM2.5 in Yinchuan, a noteworthy rebound occurred after 2019. Specifically, from 2019 to 2024, the annual average PM2.5 increased by 18 %. In fact, since 2018, achieving further reductions in emissions has become increasingly difficult, complicating effects to control PM2.5 levels despite ongoing reductions in precursor emissions (Lei et al., 2021). This struggle is not unique to Yinchuan; the NCP has also encountered challenges in achieving significant reductions during the second phase of pollution measures from 2018 to 2020. Consistently, the observed prevalence of SOA in fine particle matter in Yinchuan confirmed that simply reducing primary emissions is inadequate for mitigating PM2.5 pollution in this region.
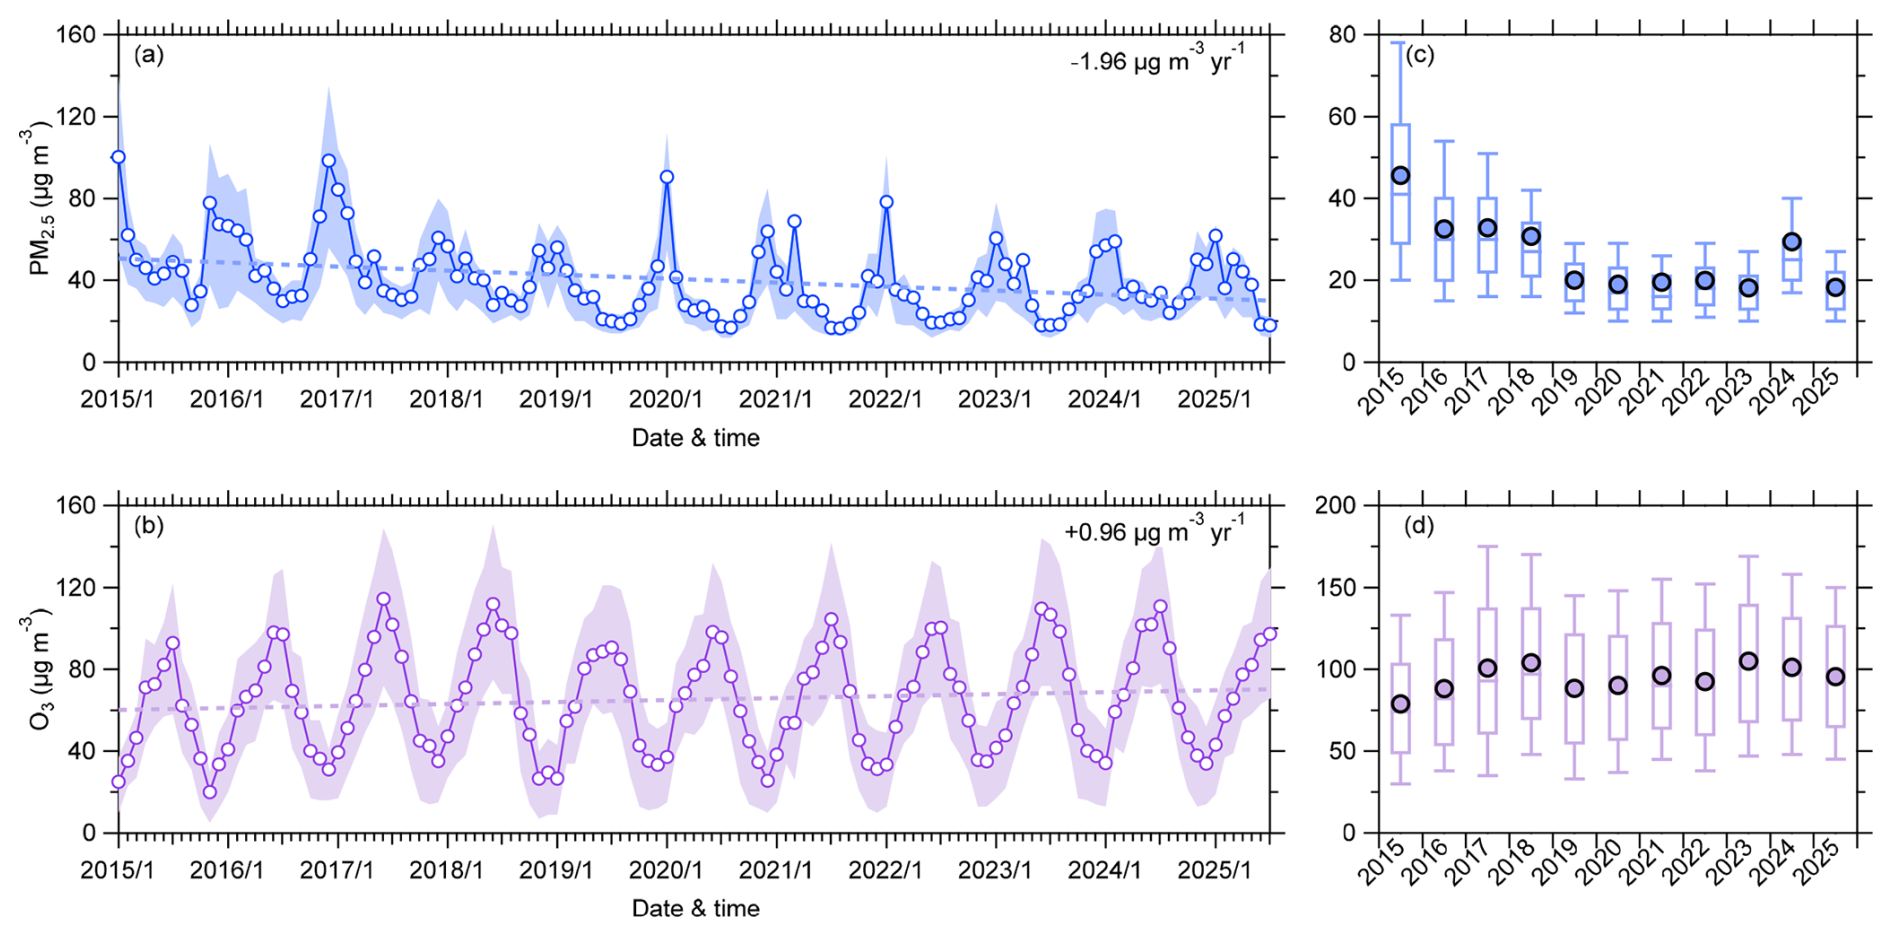
Figure 2(a–b) Monthly variations of PM2.5 and O3 in Yinchuan from 2015 to 2025, with shaded areas representing the 25th and 75th percentiles. Also shown are the linear interannual changes rate of PM2.5 and O3. (c–d) Box plots of average summertime PM2.5 and O3 concentrations. The circles, horizontal lines, lower and upper box edges, lower and upper whiskers refer to mean, median, 25th and 75th percentiles, 10th and 90th percentiles in the box, respectively.
From a seasonal perspective, average summertime PM2.5 concentrations saw a sharp decline, dropping from 45.7 µg m−3 in 2015 to 20 µg m−3 in 2019. Interestingly, between 2019 and 2025, the average PM2.5 levels remained relatively stable, fluctuating within a narrow range of 18–20 µg m−3, except for the notable rebound in 2024, when concentrations reached 29.5 µg m−3. The cause of this abrupt increase remains unclear, particularly given that the levels of gaseous precursors have remained consistent with previous years. Meteorological factors may offer the most plausible explanation. On one hand, the sustained PM2.5 concentrations below 20 µg m−3 after 2018 reflect the successful implementation of air pollution control measures in Ningxia, particularly in Yinchuan city, at least during the summer months, although PM2.5 pollution continues to be a concern during the winter. On the other hand, in contrast to cities such as Beijing, where summertime PM2.5 concentrations continued to decline annually after 2018 (by 50 % between 2018 and 2022) (Li et al., 2023a), Yinchuan exhibited minimal variation in PM2.5 levels over the last seven years. Overall, our findings highlight the success of particulate pollution controlling during summer in Yinchuan for the past decade, more importantly, emphasize the greater difficulties in further PM2.5 reductions compared to other regions.
Contrary to the significant decrease in PM2.5 concentrations between 2015 and 2025, the annual average O3 concentrations increased at a rate of 0.96 µg m−3 yr−1 in Yinchuan. This is consistent with the overwhelming growing O3 levels during the past decade from other regions, such as YRD and PRD, both in summer and winter seasons(Li et al., 2019b, 2021a; Zhou et al., 2021). Specifically, the summertime O3 in Yinchuan gradually rose from 80 µg m−3 in 2015 to roughly stabilize at 105 µg m−3 over the past three years. Indeed, it is important to that the relatively constant O3 levels likely suggest that ozone pollution has been largely controlled in recent years in Yinchuan. Overall, our results reveal the uniformly increasing merging O3 pollution issues in Yinchuan, coinciding with decreasing PM2.5 levels. This trend is consistent with Wang et al. (2020) reporting the contrasting trends between PM2.5 and O3 in China during 2013–2017. In fact, recent studies have shown that, due to the scavenging effects of particulate matter on HO2 radicals and NOx, O3 concentrations have risen despite reductions in PM2.5 (Li et al., 2019a). Seasonally, this increase was more pronounced during summer and autumn, with an average annual rise of 2 µg m−3 per year, while the increase in winter was modest at only 0.5 µg m−3 yr−1. However, Li et al. (2021a) found the ozone pollution in NCP could spread into the late-winter haze season, much different from those in Yinchuan. Further analysis is needed regarding the coupling mechanism between PM2.5 and O3 production across different seasons, as well as the long-term changes in their sensitivities to precursor emissions, e.g., VOCs.
Notably, the rate of increase in O3 in Yinchuan began to slow down after 2018 compared to preceding years, with only an 8 % increase during the post-2018 period, in contrast to a 41 % increase before that year. These findings highlight that although the second-phase pollution control measures implemented after 2018 may not have successfully mitigated PM2.5 pollution in Yinchuan, they appear to have had some effectiveness in controlling O3 production. In summary, there has been a significant shift in the relationship between summertime PM2.5 and O3 in Yinchuan over the past decade. Phase I, from 2015 to 2018, was characterized by a sharp decline in PM2.5 levels accompanied by a concurrent significant rise in O3, primarily driven by substantial reductions in gaseous precursors. In contrast, Phase II, spanning from 2019 to 2025, was marked by a gradual increase in O3 levels while PM2.5 concentrations remained stagnant, correlating with much slower reductions in precursor emissions, e.g., VOCs, NH3 and NOx. The different trajectories of O3 in response to changes in PM2.5 between Phase I and Phase II were associated with complex factors, including the influence of precursors and OH radicals. A very recent study has also revealed similar trend of O3 levels in Beijing as a response to national-wide emission controls during 2005–2020, characterized by an initial rapid increase followed by a gradual decrease, attributed to changes in the atmospheric oxidation capacity (Wang et al., 2024b). This is consistent with Geng et al. (2024) showing that the “Ten Measures for Air Pollution Prevention and Control” achieved significant emission reductions in PM2.5 in China during 2013–2017, however, the potential for further reduction after 2017 has become limited based on emission inventories and model simulations. These studies supported the plausibility and robustness of the observed two-phase PM2.5–O3 relationship in Yinchuan within the context of national trend. Therefore, the timing of controlling VOCs and NOx is crucial keys for the coordinated reductions of both O3 and PM2.5 levels in Yinchuan, and even the synergistic tripe controls of O3, PM2.5 and CO2 in the future (Liu et al., 2025).
We further explored the complex non-linear relationships between summertime PM2.5 and O3 in Yinchuan using exponential fitting methods similar to those proposed by Zhang et al. (2022). As shown in Fig. 3, our findings revealed that from 2015 to 2018, changes in the MDA8 O3 exhibited a notable parabolic distribution trend correlated with PM2.5, with a peak occurring at 45 µg m−3. During this period, as PM2.5 concentrations fell on the right side of the curve, they corresponded perfectly to the sharp reductions in PM2.5 levels seen during Phase I, leading to significant increases in MDA8 O3 levels when summertime PM2.5 exceeded 45 µg m−3. However, from 2019 to 2025, variations of MDA8 O3 were minimal in response to changes in PM2.5, indicating that the continued decline in PM2.5 did not significantly affect O3 concentrations in this context. These findings suggest a substantial transition from Phase I to Phase II regarding the PM2.5–O3 relationships, with O3 becoming less sensitive to controls on PM2.5 (Liu et al., 2025). Overall, our results underscore significant differences in the complex interactions between PM2.5 and O3 during the two phases of summer in Yinchuan, primarily due to varying reduction percentages of gaseous precursors over the past decade. It is important to note that while the exponential fitting curve during Phase II was considerably flatter compared to Phase I, the timing of the inflection point advanced to correspond with lower PM2.5 concentrations in Phase II. This suggests that efforts to control PM2.5 are expected to more effectively manage O3 levels over time. When comparing our results with those from other regions, the PRD and YRD exhibited monotonic variations between O3 and PM2.5, demonstrating the effectiveness of PM2.5 controlling on O3 in these areas (Zhang et al., 2022). In contrast, Beijing displayed a similar pattern to Phase I, initially showing an increasing trend followed by a decrease in summer (Zeng et al., 2024). These differences in the unique characteristics of PM2.5–O3 relationships in Yinchuan in recent years, likely attributable to the relatively low PM2.5 concentrations in Yinchuan compared to other metropolitan clusters. The measurements of aerosol compositions and VOCs components will aid in further investigating the causes of the double high PM2.5 and O3 pollution in Yinchuan.
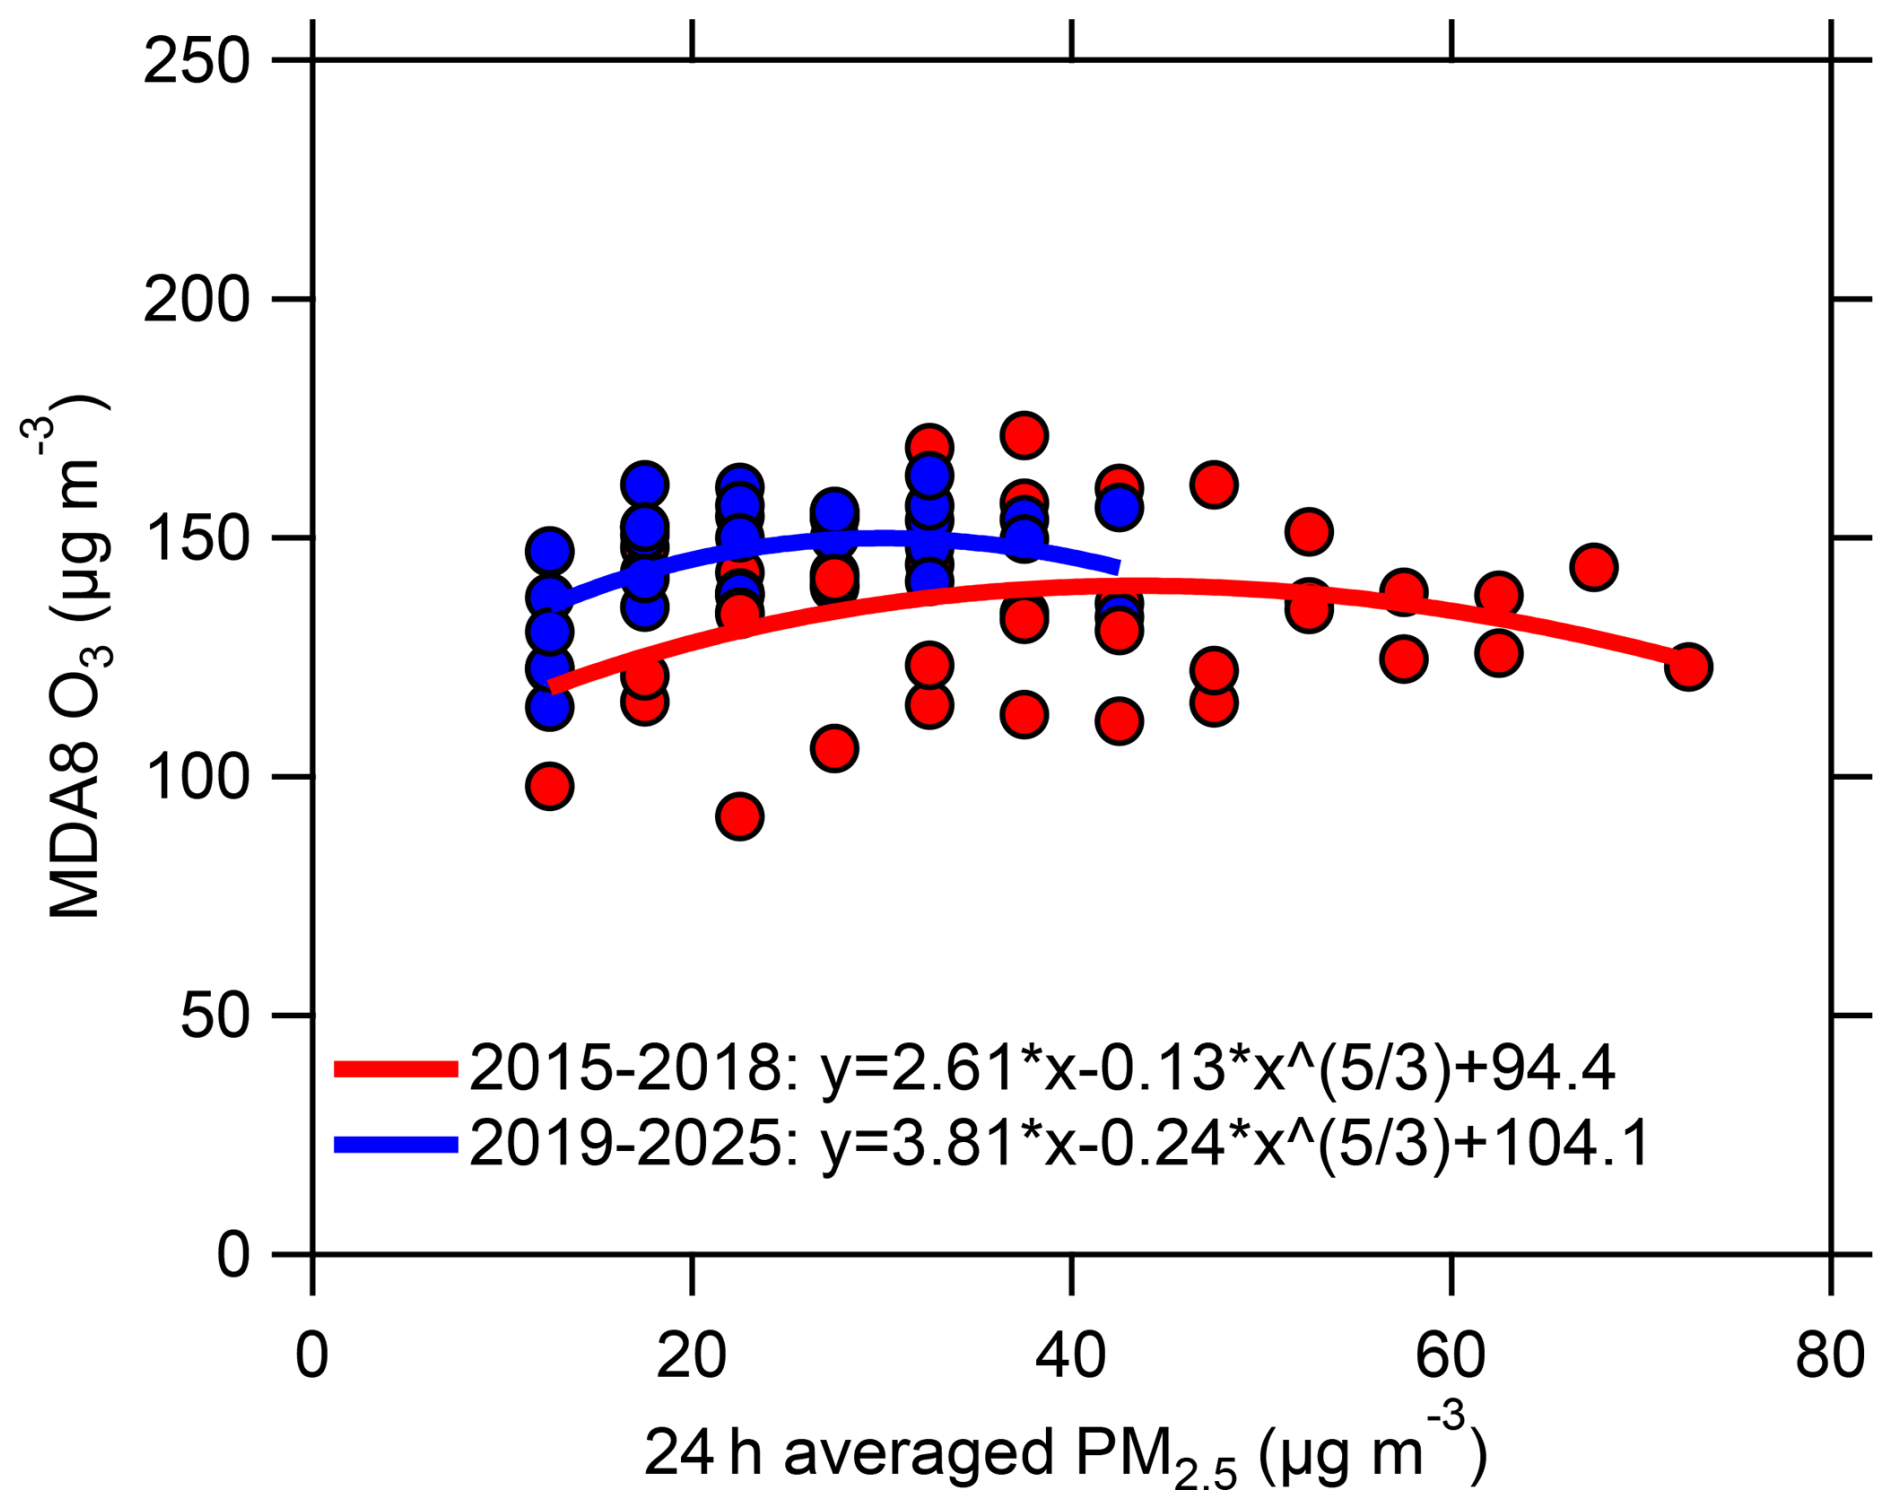
Figure 3Relationship between 24 h averaged PM2.5 and MDA8 O3 fitted using an exponential equation for the summertime months during 2015–2025.
3.2 Chemical compositions of fine particles in Yinchuan
Figure 4 displays the meteorological parameters, gaseous precursors, and NR-PM2.5 species measured during the campaign. In Yinchuan, summertime temperatures were generally below 35 °C, with an average of 26.4 ± 4.5 °C. Surface winds were mild, predominantly coming from the north and northeast, with wind speeds ranging from 0 to 3 m s−1. With regards to meteorological influences, relatively higher NR-PM2.5 mass loadings were often associated with northerly wind. This correlation is likely due to the transport of pollutants from the northern part of the Ningxia Hui Autonomous Region, particularly from Shizuishan City, which is known for its significant industrial emissions. Although Yinchuan is located in an arid and semi-arid region, RH varied widely from 9 % to 98 %, averaged by 44 ± 20 %. The observed moderate RH levels were primarily influenced by frequent rain events during the sampling period, particularly in the latter phase of the campaign after 22 June. For example, significant precipitation events occurred on June 27 and 29, which may have contributed to the scavenging of particulate matter to some extent.
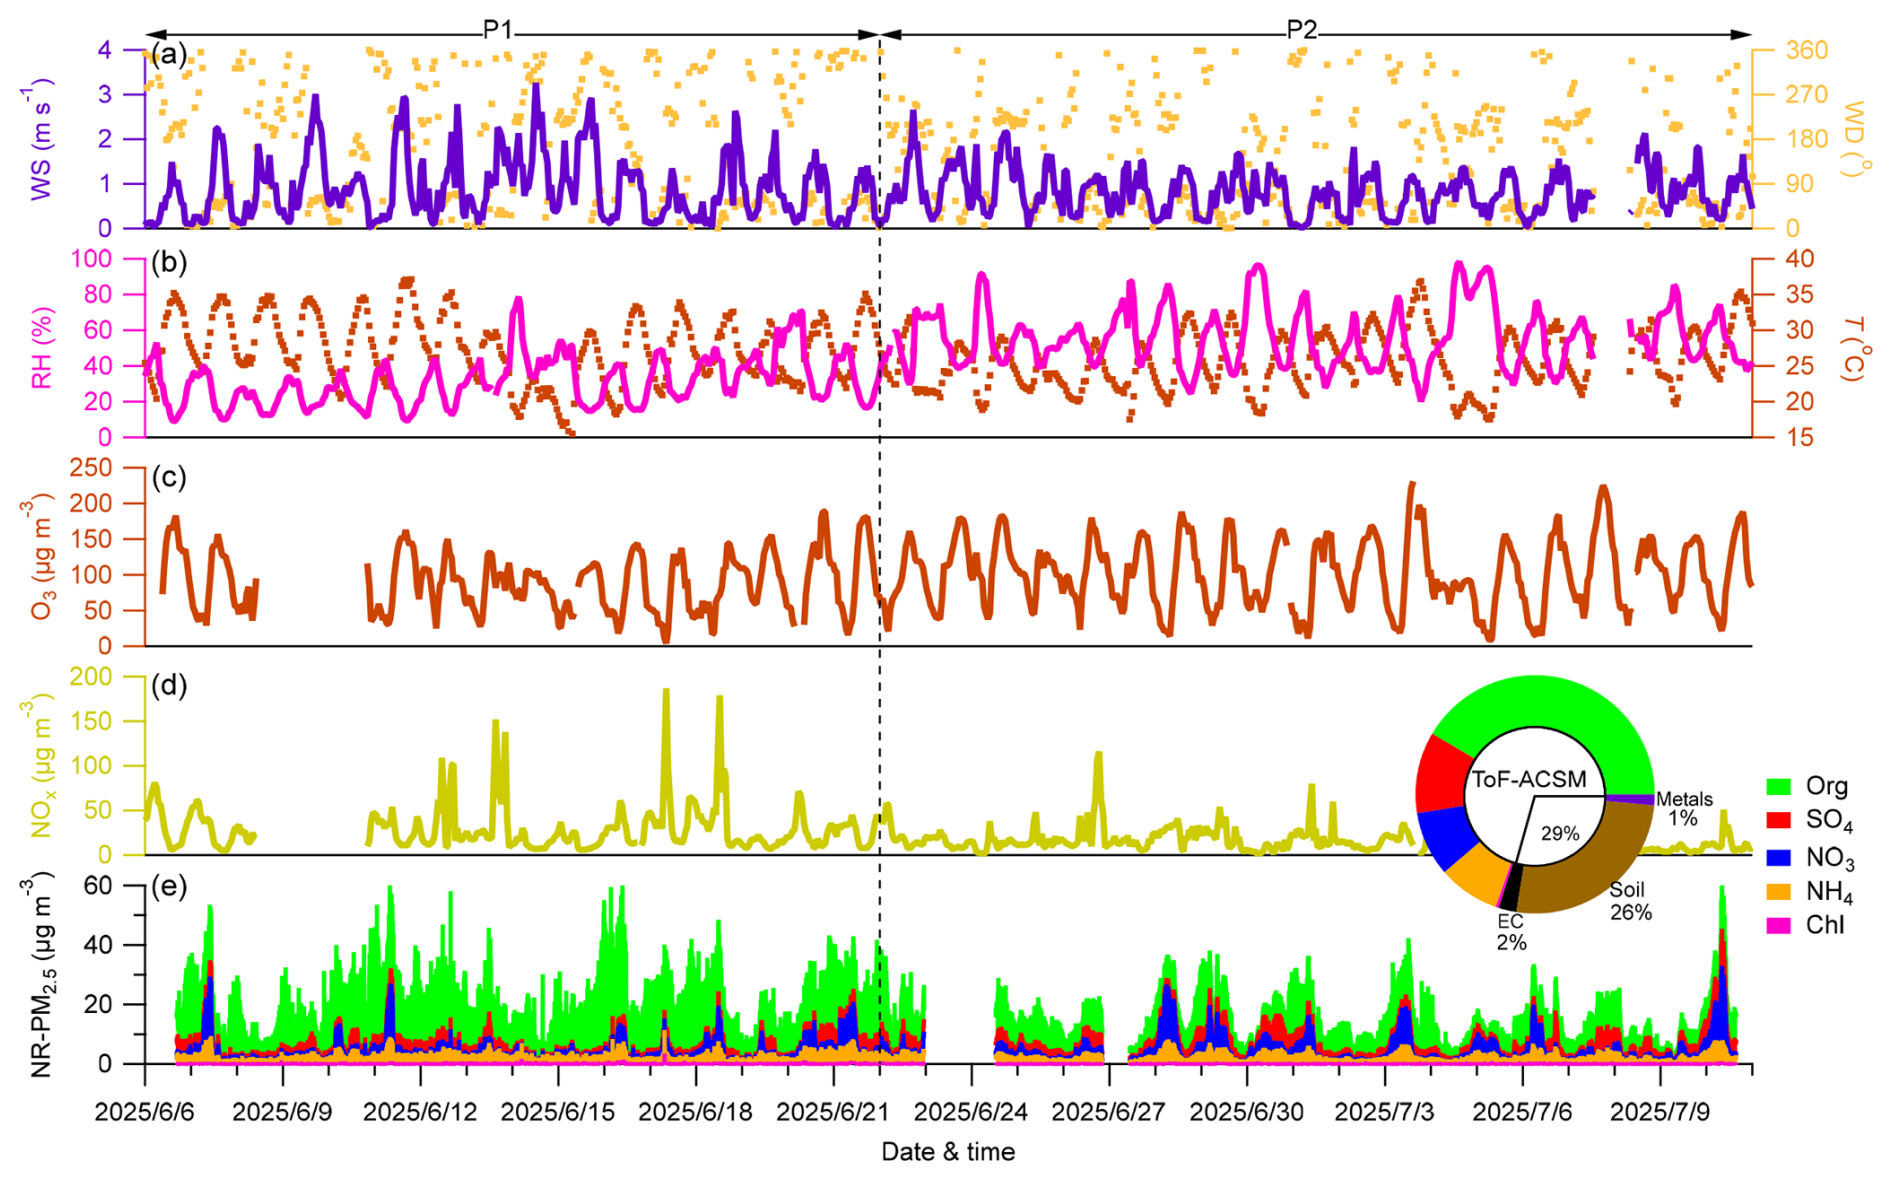
Figure 4Time series of (a–b) meteorological variables (WS, WD, RH and T), (c–d) gaseous species (O3 and NOx), (e) chemical species for ToF-ACSM. The pie chart shows the average compositions of particles including organics, sulfate, nitrate, ammonium, chloride, elemental carbon, soil and metals for the entire campaign.
The concentrations of NR-PM2.5 varied dynamically, with total mass ranging from 1.3 to 68 µg m−3 and an average of 16.8 ± 9.2 µg m−3. Throughout the campaign, only 4 % of the time of when hourly NR-PM2.5 mass concentrations exceeded 35 µg m−3, further suggesting that air quality in Yinchuan generally meets the National Air Quality Grade I Standard. In comparison to other summertime measurements insight from ToF-ACSM or AMS studies in China (Fig. S1 in the Supplement), the averaged NR-PM2.5 in Yinchuan was significantly lower than those reported in cities within the North China Plain (NCP) and Pearl River Delta (PRD), e.g., Xingtai (Zhang et al., 2018), Handan (Li et al., 2018a), Nanjing and Hangzhou (Li et al., 2018b). Note that, it was also lower than that reported for Beijing (18.1 µg m−3) during the summer of 2022 by Zeng et al. (2024). Although these comparative observations were conducted prior to 2025, specifically mostly between 2013 and 2020, it is possible that our comparisons may exaggerate pollution levels in other cities, given the ongoing improvements in nationwide air quality in recent years. However, aside from a minor rebound in the summer of 2024, fine particulate concentrations in Yinchuan have remained largely constant since 2019. Therefore, the observations from 2025 are representative of overall PM2.5 conditions in Yinchuan from 2019 to 2025, reinforcing the validity of the comparative analysis. These results indicate relatively better air quality in Yinchuan during summer period than major metropolitan cluster cities, even though it is still approximately double that of background locations (Zhang et al., 2019b). Most importantly, NR-PM2.5 levels in Yinchuan were lower than those in nearby northwestern cities such as Lanzhou (Xu et al., 2014). This difference can likely be owing to the fewer industrial facilities in Yinchuan, as well as its more favorable atmospheric dispersion conditions, given that Lanzhou is situated in a valley surrounded by high mountains.
On average, the NR-PM2.5 concentrations measured by the ToF-ACSM accounted for 71 % of the total PM2.5 mass (= NR-PM2.5 + EC + Soil + Metals), indicating that the ToF-ACSM effectively captured the majority of fine particulate matter components in Yinchuan. Among the refractory species, soil constituted 26 % of PM2.5, while metals contributed 1 %, primarily due to calcium originating from suspended dust and construction activities. In comparison to dust-free cities, the proportion of NR-PM2.5 within total PM2.5 was lower in this study, e.g., Fenhe Plain (Li et al., 2022) and central China Plain (Li et al., 2021b). However, this finding is consistent with the regional context, as northwestern China is prone to dust events. Although summertime is generally less susceptible to dust storms, nearby sand sources still contribute to elevated levels of suspended dust in Yinchuan, resulting in much higher presence of refractory species in this study than previous studies.
The organics dominated NR-PM2.5 by 59 %, comparable to that observed in nearby Lanzhou (56 %), however generally higher than the 36 %–57 % reported in NCP (shown in Fig. S1). This suggests a consistently greater contribution of organic aerosols in northwestern cities. The elevated fraction of organics may be due to the relatively low RH in arid and semi-arid regions, which limits the formation of SIA, as well as stronger and more prolonged solar radiation that facilitates organic aerosol formation. Together, these factors explained the high proportion of organics in northwestern cities. The latter explanation is further supported by the predominance of SOA in Yinchuan, as discussed in Sect. 2.3. Sulfate constituted 16 % of NR-PM2.5, making it the largest component within SIA, followed by nitrate at 13 %. The relatively low proportion of summertime nitrate is anticipated due to the strong evaporation of ammonium nitrate under high temperatures. However, we found that when NR-PM2.5 exceeded 25 µg m−3, nitrate surpassed sulfate to become the dominant SIA species, and its contribution increased with rising pollution levels. This trend highlights the growing significance of nitrate in particulate pollution, even though in summer Yinchuan, consistent with observations conducted in Beijing during fall and winter (Zhou et al., 2019).
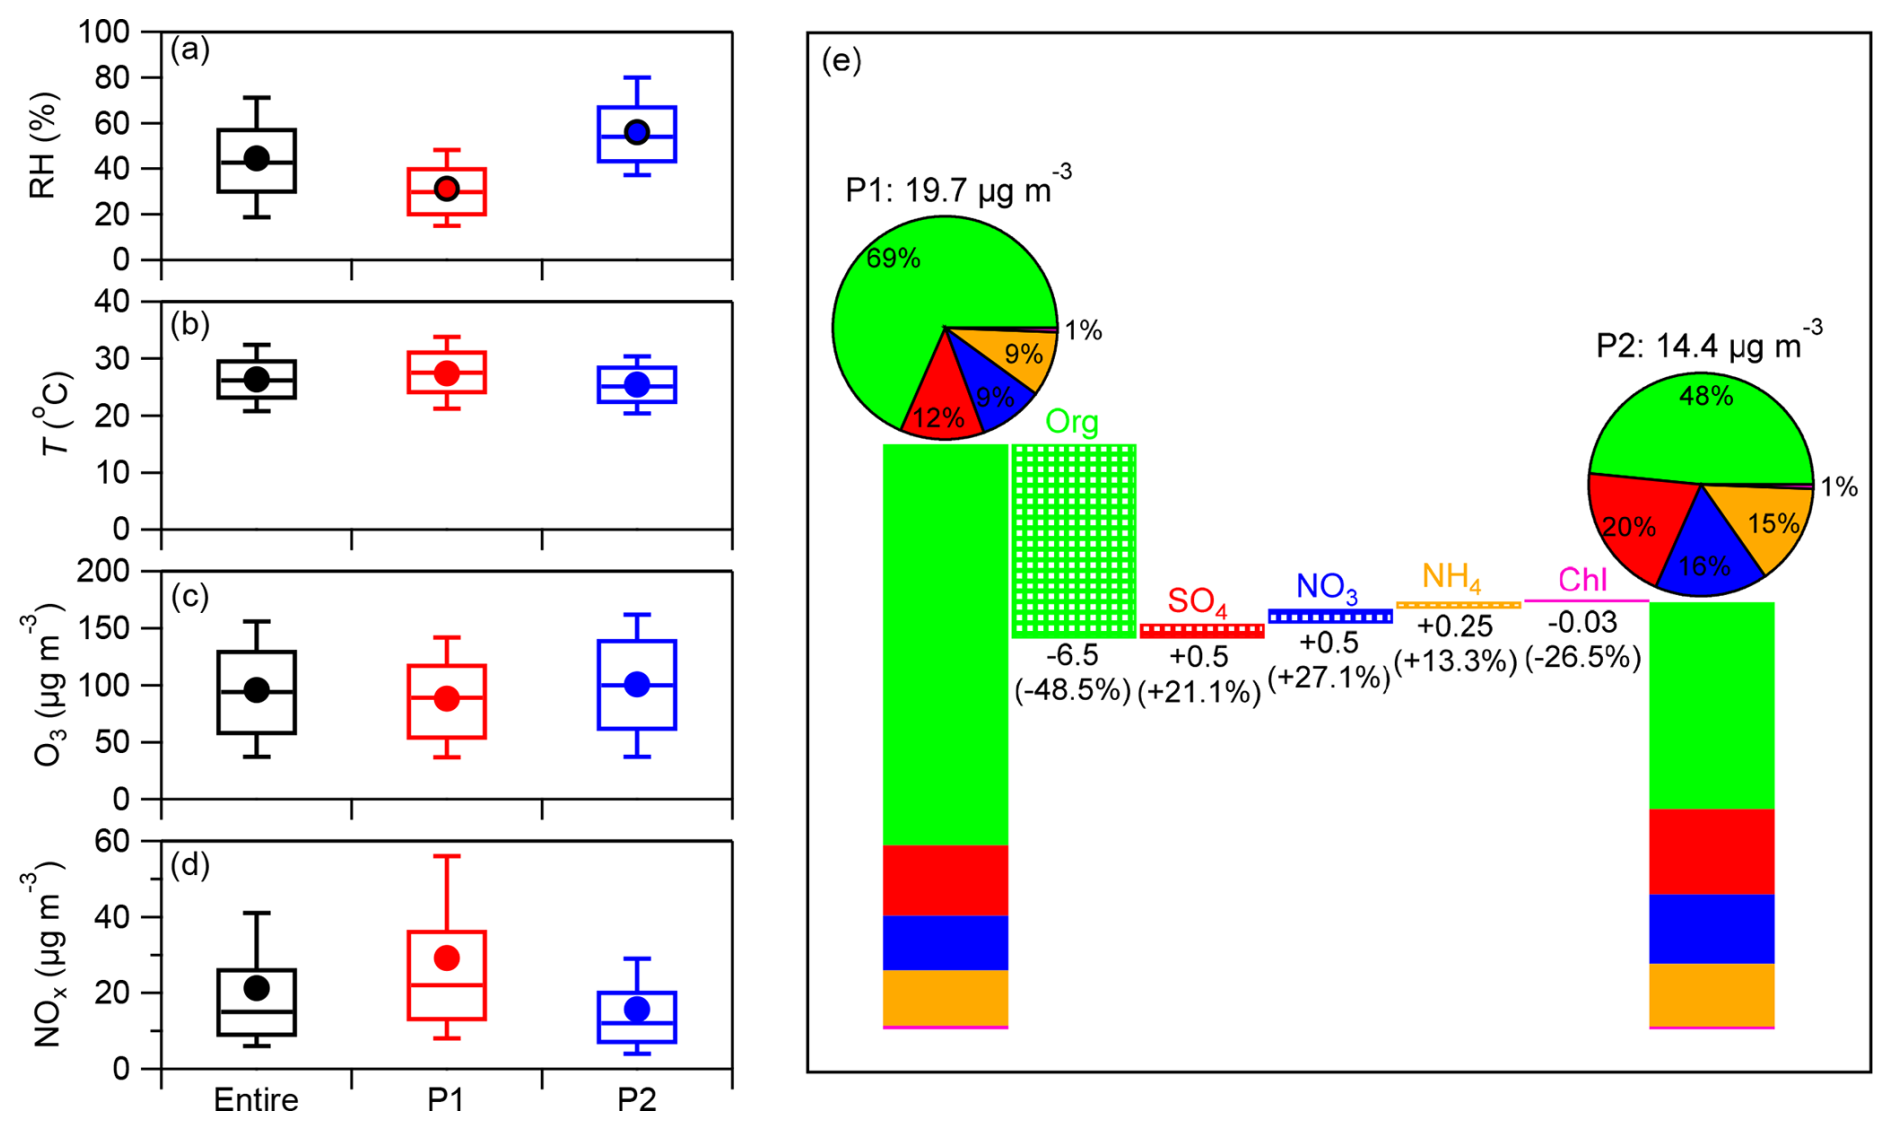
Figure 5(a–d) Box plots of average meteorological variables (RH, T) and gaseous precursors (O3, NOx) during the entire campaign, P1 and P2. The circles, horizontal lines, lower and upper box edges, lower and upper whiskers refer to mean, median, 25th and 75th percentiles, 10th and 90th percentiles in the box, respectively. (e) Average mass concentrations and changes of NR-PM2.5 components from P1 to P2, along with average compositions during P1 and P2 shown in pie charts.
The entire campaign was divided into two phases according to meteorological conditions. As shown in Fig. 5, Period 1 (P1, 6–21 June) was characterized by relatively low RH (31 ± 14 %) and strong solar radiation, while Period 2 (P2, 22 June–10 July) was marked by higher RH (56 ± 17 %) due to frequent rainfall. Concurrently, the concentration of NOx decreased by 46 %, from 29.1 µg m−3 in P1 to 15.7 µg m−3 in P2, indicating substantial changes in primary emissions between the two phases. In response, the mass concentrations of organics exhibited the most pronounced decline, decreasing by 48.5 % from P1 to P2, with mass fractions dropping from 69 % to 48 %. A similar reduction of 26.5 % was observed for chloride, following the trend of organics as a response to decreased primary emissions, particularly from coal combustion. In contrast, the concentrations of SIA species showed unexpectedly 13.3 %–27.2 % increases during P2 compared to P1, with nitrate showing the most significant rise. Overall, the total NR-PM2.5 mass decreased by 5.3 µg m−3 from P1 to P2, with the contribution of SIA increasing from 30 % to 41 %, accompanied by decreases in organics and chloride. These results underscore the considerable influence of meteorology on rapid changes in aerosol compositions, highlighting contrasting effects on primary and secondary components associated with their distinct sources and formation mechanisms, e.g. aqueous-phase processing, heterogeneous reactions or enhanced gas-particle partitioning (Sun et al., 2014). While high RH during P2 promotes the formation of secondary species, it also enhances wet scavenging. The effects of aqueous-phase processing can offset the losses associated with wet removal, ultimately contributing to an increase in secondary species. Although previous studies have revealed the dominant role of light rain in the accumulated wet removal of aerosols (Wang et al., 2021), the frequent rainfall in this study facilitated the production of secondary species. However, the decreases in primary species can be attributed to the combined effects of wet removal and a decline in primary emissions. These results differ significantly from those reported by Li et al. (2023b), which indicated an increased contribution of semi-volatile species such as nitrate and chloride, due to enhanced gas-particle partitioning, along with a decreased contribution of sulfate and organics based on long-term statistical analysis in summer Beijing.
In addition to the total mass concentrations, aerosol species correspondingly exhibited significant differences in their diurnal variation patterns between the two phases (Fig. S2). For instance, sulfate began to rise in the early morning and peaked around 12:00 during P1; whereas during P2, it continued to increase after noon, reaching a maximum at 17:00. This change might be due to enhanced aqueous-phase processing of sulfate during P2. It is noted that traffic-related NOx emissions led to a peak in nitrate between 09:00 and 10:00, highlighting the considerable role of traffic emissions in Yinchuan. Furthermore, despite lower NOx levels resulting from reduced primary emissions, nitrate concentrations in P2 were 50 %–100 % higher than in P1, particularly at 00:00–05:00. This nocturnal enhancement was possibly due to the heterogeneous hydrolysis of N2O5 under high RH conditions (Yan et al., 2023), which could also account for the overall elevated nitrate levels observed in P2.
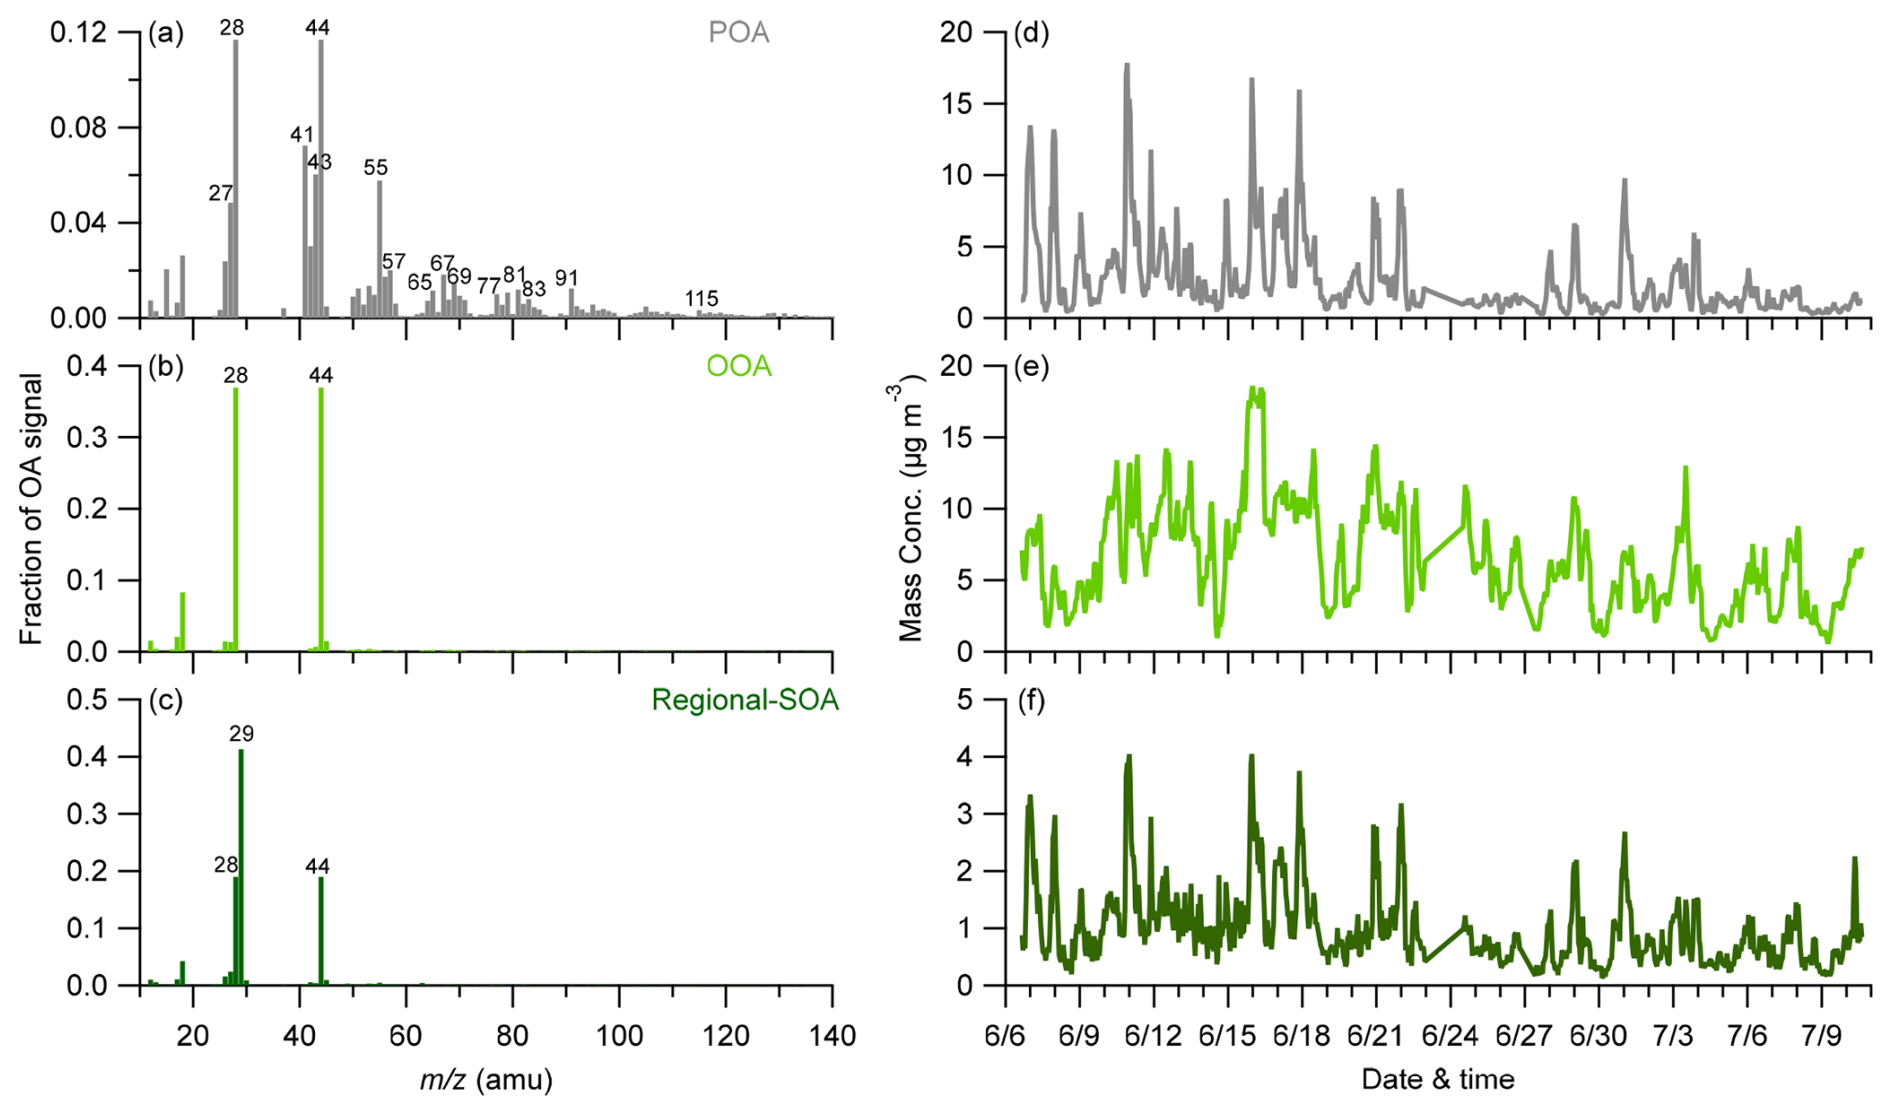
Figure 6(a–c) Average mass spectral profiles and (d–f) time series of OA factors (POA, OOA, Regional-SOA) during the entire campaign.
3.3 Sources of organic aerosols
The PMF analysis was applied to the OA matrix measured by the ToF-ACSM, resulting in the identification of one POA and two SOA factors through spectral profile characterization and analysis with precursor species (Fig. 6). The POA was characterized by typical hydrocarbon ions, including the CnH and CnH categories (e.g., 27, 41, 43, 55, 57), which primarily originate from primary emission sources such as coal combustion, vehicle exhaust, and cooking activities (Zhang et al., 2007). Distinct peaks at 91 and 115, indicative of polycyclic aromatic hydrocarbons (PAHs) (Xu et al., 2020), were observed in this study, suggesting the significant influence of coal combustion in Yinchuan, even during the summertime. This finding contrasts with conditions in summer NCP, where coal combustion is typically considered to be negligible in non-heating seasons due to a strict ban on coal burning. Although the POA exhibited a high ratio, which is often regarded as an indicator of cooking emissions (He et al., 2010; Zhang et al., 2021), there were no pronounced cooking-related peaks during meal times (e.g., 12:00 and 20:00, Fig. 7). A possible explanation for this discrepancy is that the sparse population in Yinchuan results in lower emissions from the dining sector. Instead, two prominent POA peaks occurred at 08:00–09:00 and 22:00–23:00. The small morning peak corresponded to traffic rush hour, consistent with the diurnal variation of NOx, which also peaked in the morning. This interpretation is further supported by the concurrent morning peaks of benzene and toluene, which commonly serve as tracers for vehicle emissions. We observed pronounced contrast in the diurnal variations of POA between P1 and P2. During P1, POA displayed significant morning peaks, which was considerably weaker or absent in P2. This difference may be attributed to lower primary emissions during P2, as indicated by the concurrently decreased NOx levels. On the contrary, a much higher late-evening peak likely corresponded to industrial emissions from nighttime operations. This elevation in concentration was further amplified by the shallower nocturnal boundary layer during the night. Despite this, it should be noted that, due to the limited mass resolution of ToF-ACSM, specific sources could not be unambiguously distinguished. The resolved POA factor often represented a mixture from multiple sources. In this study, the mixed POA was interpreted as encompassing emissions from traffic, coal combustion and industrial activities. Overall, POA comprised an average of 26 % of the total OA, with a higher contribution in P1 than P2 (29 % vs. 21 %) in response to enhanced primary emissions during P1. Note that the contribution of POA could increase to 40 % at nighttime, particularly during P1, indicating the significant influence of industrial activities on organic aerosol compositions in Yinchuan.
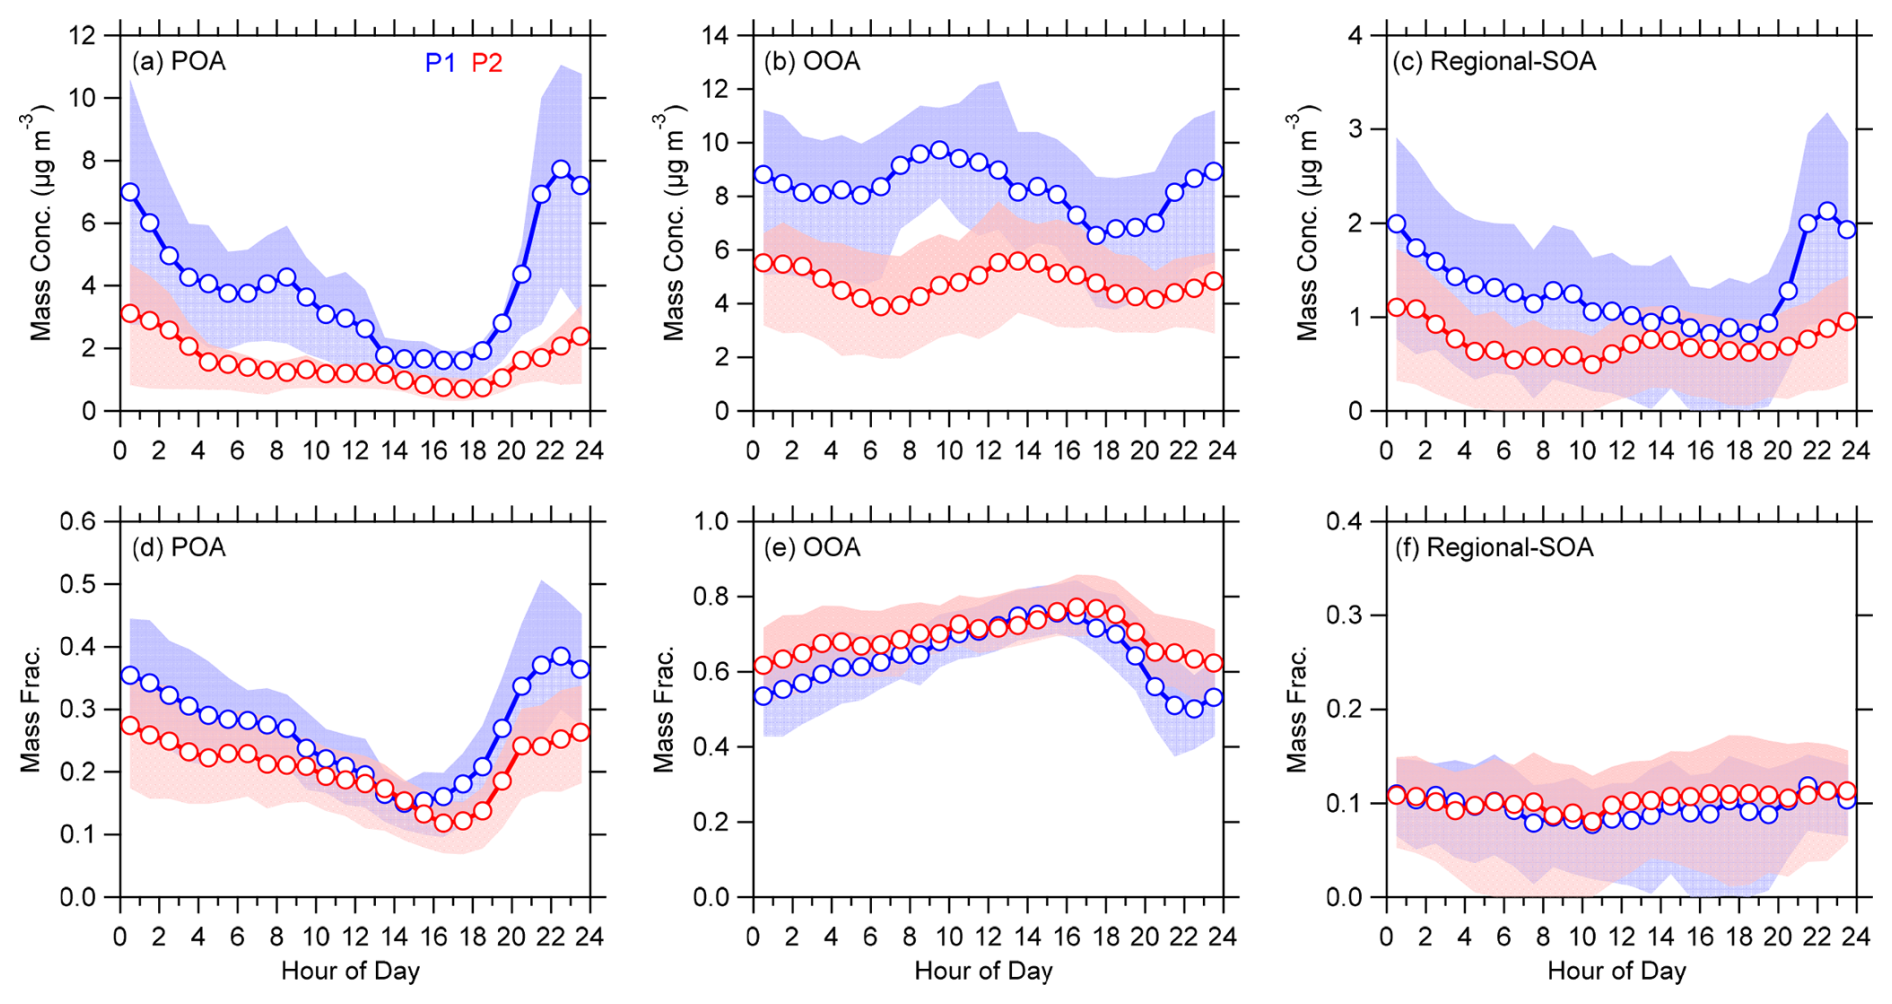
Figure 7Diurnal variations of OA factors (POA, OOA and Regional-SOA) during P1 and P2, respectively. The circles indicate mean values, and the shaded areas represent the 75th and 25th percentiles.
The two secondary factors were marked by prominent peaks at 28 and 44, which are representative of CO. The oxygenated organic aerosol (OOA) showed a distinct daytime increase after 07:00, indicative of photochemical production (Xu et al., 2017). The afternoon decline of OOA concentrations was primarily attributed to dilution effects associated with the rising planetary boundary layer. This reasoning is supported by the continuous increases in the mass fractions of OOA from early morning to late afternoon. In contrast, the other SOA factor displayed a relatively flat concentration profiles throughout the day, suggesting a regional background source. Thus, it was classified as regional-related SOA, corresponding to its mass fractions remaining nearly constant at 10 %. We found significantly different mass spectral and diurnal patterns between two SOA factors, resulting from their distinct sources and formation mechanisms. Compared to regional-related SOA, OOA exhibited a higher oxidation degree, as reflected by its higher f44. Instead, the mass spectral profile of regional-related SOA was characterized by a high f29, indicating that it may come from similar source as POA. For example, the regional-related SOA also showed a small morning peak similar to that of POA. Consistently, a strong correlation was observed between regional-related SOA and POA, with a correlation coefficient (r) of 0.82. These findings suggest that the regional-related SOA in this study likely originates from regional-scale oxidized primary emissions. It is important to note that when comparing the proportion of f44, SOA in Yinchuan is highly more oxidized than those at other sites in the NCP, possibly due to prolonged sunlight exposure during the summertime.
On average, SOA (= OOA + regional-related SOA) accounted for 74 % of total organic aerosols, underscoring the predominance of SOA in summer Yinchuan. This finding aligns with Li et al. (2023a) reporting that SOA represented 85 %–90 % of OA in Beijing during the five summers from 2018 to 2022. This dominance is not surprising, given that POA primarily originates from vehicle emissions and cooking, with minimal contributions from coal combustion and biomass burning during the summer months. In comparison to Beijing, Yinchuan exhibited nearly double the contribution of POA, ascribing to the significant impact of industrial activities in the region. These results indicate a greater contribution of primary-related emissions in northwestern China than Beijing. While meteorological conditions had a substantial influence on SIA species, leading to increased mass concentrations of SIA species under elevated RH conditions, all organic aerosol components showed consistent decreases from P1 to P2. Among the OA categories, POA experienced the largest decline of 61 %, and the two SOA factors displayed comparable decreases of 41 %–44 %. As a result, the mass fraction of SOA increased to some extent from 71 % at P1 to 78 % in P2. Note that the more substantial reduction in POA than SOA can be resulted from additional decreases in primary emissions during P2, alongside the influence of meteorological factors. Interestingly, the composition of SOA remained relatively stable between P1 and P2, with OOA consistently dominating at 86 %–87 %, indicating a similar meteorological influence on different SOA sources in this study. Our results demonstrate the differing behaviors of inorganic and organic aerosols in response to meteorological conditions, potentially due to their distinct formation mechanisms. For instance, SIA was primarily generated through aqueous-phase processing in this study, and thus elevated RH during the transition from P1 to P2 promoted their formation. In contrast, SOA was mainly produced from photochemical processes, and reduced sunlight during P2 hindered their formation.
3.4 Variations of predominant VOCs precursors
We identified a total of 1118 chemical formulas for VOCs in this study. The CH category, which includes traditional GC-MS measurements of alkanes, alkenes, aromatics and terpenes, represented 24 % of the total VOCs mass concentrations (Fig. S3). Instead, the CHO category comprised 74 % of the VOCs, with a predominant contribution from species containing 1–2 oxygen atoms, attributed to the Vocus PTR-MS's capability to detect low oxygen-containing species. Notably, as the contribution of SOA increased from P1 to P2, the proportion of CHO species with 3–5 oxygen atoms also rose from 10 % to 16 %. In fact, despite a sharp decrease in the mass concentrations of the CH category from 11.2 to 8.3 ppb between P1 and P2, along with reductions in organic aerosols responsible from primary emissions, the total amount of CHO only declined by 0.5 ppb, with CHO species containing 3–5 oxygen atoms actually increasing. This trend might help explain the rising levels of SOA during P2 under conditions of elevated RH, ascribing to favorable conditions for the formation of highly oxidized oxygenated compounds (Zheng et al., 2021).
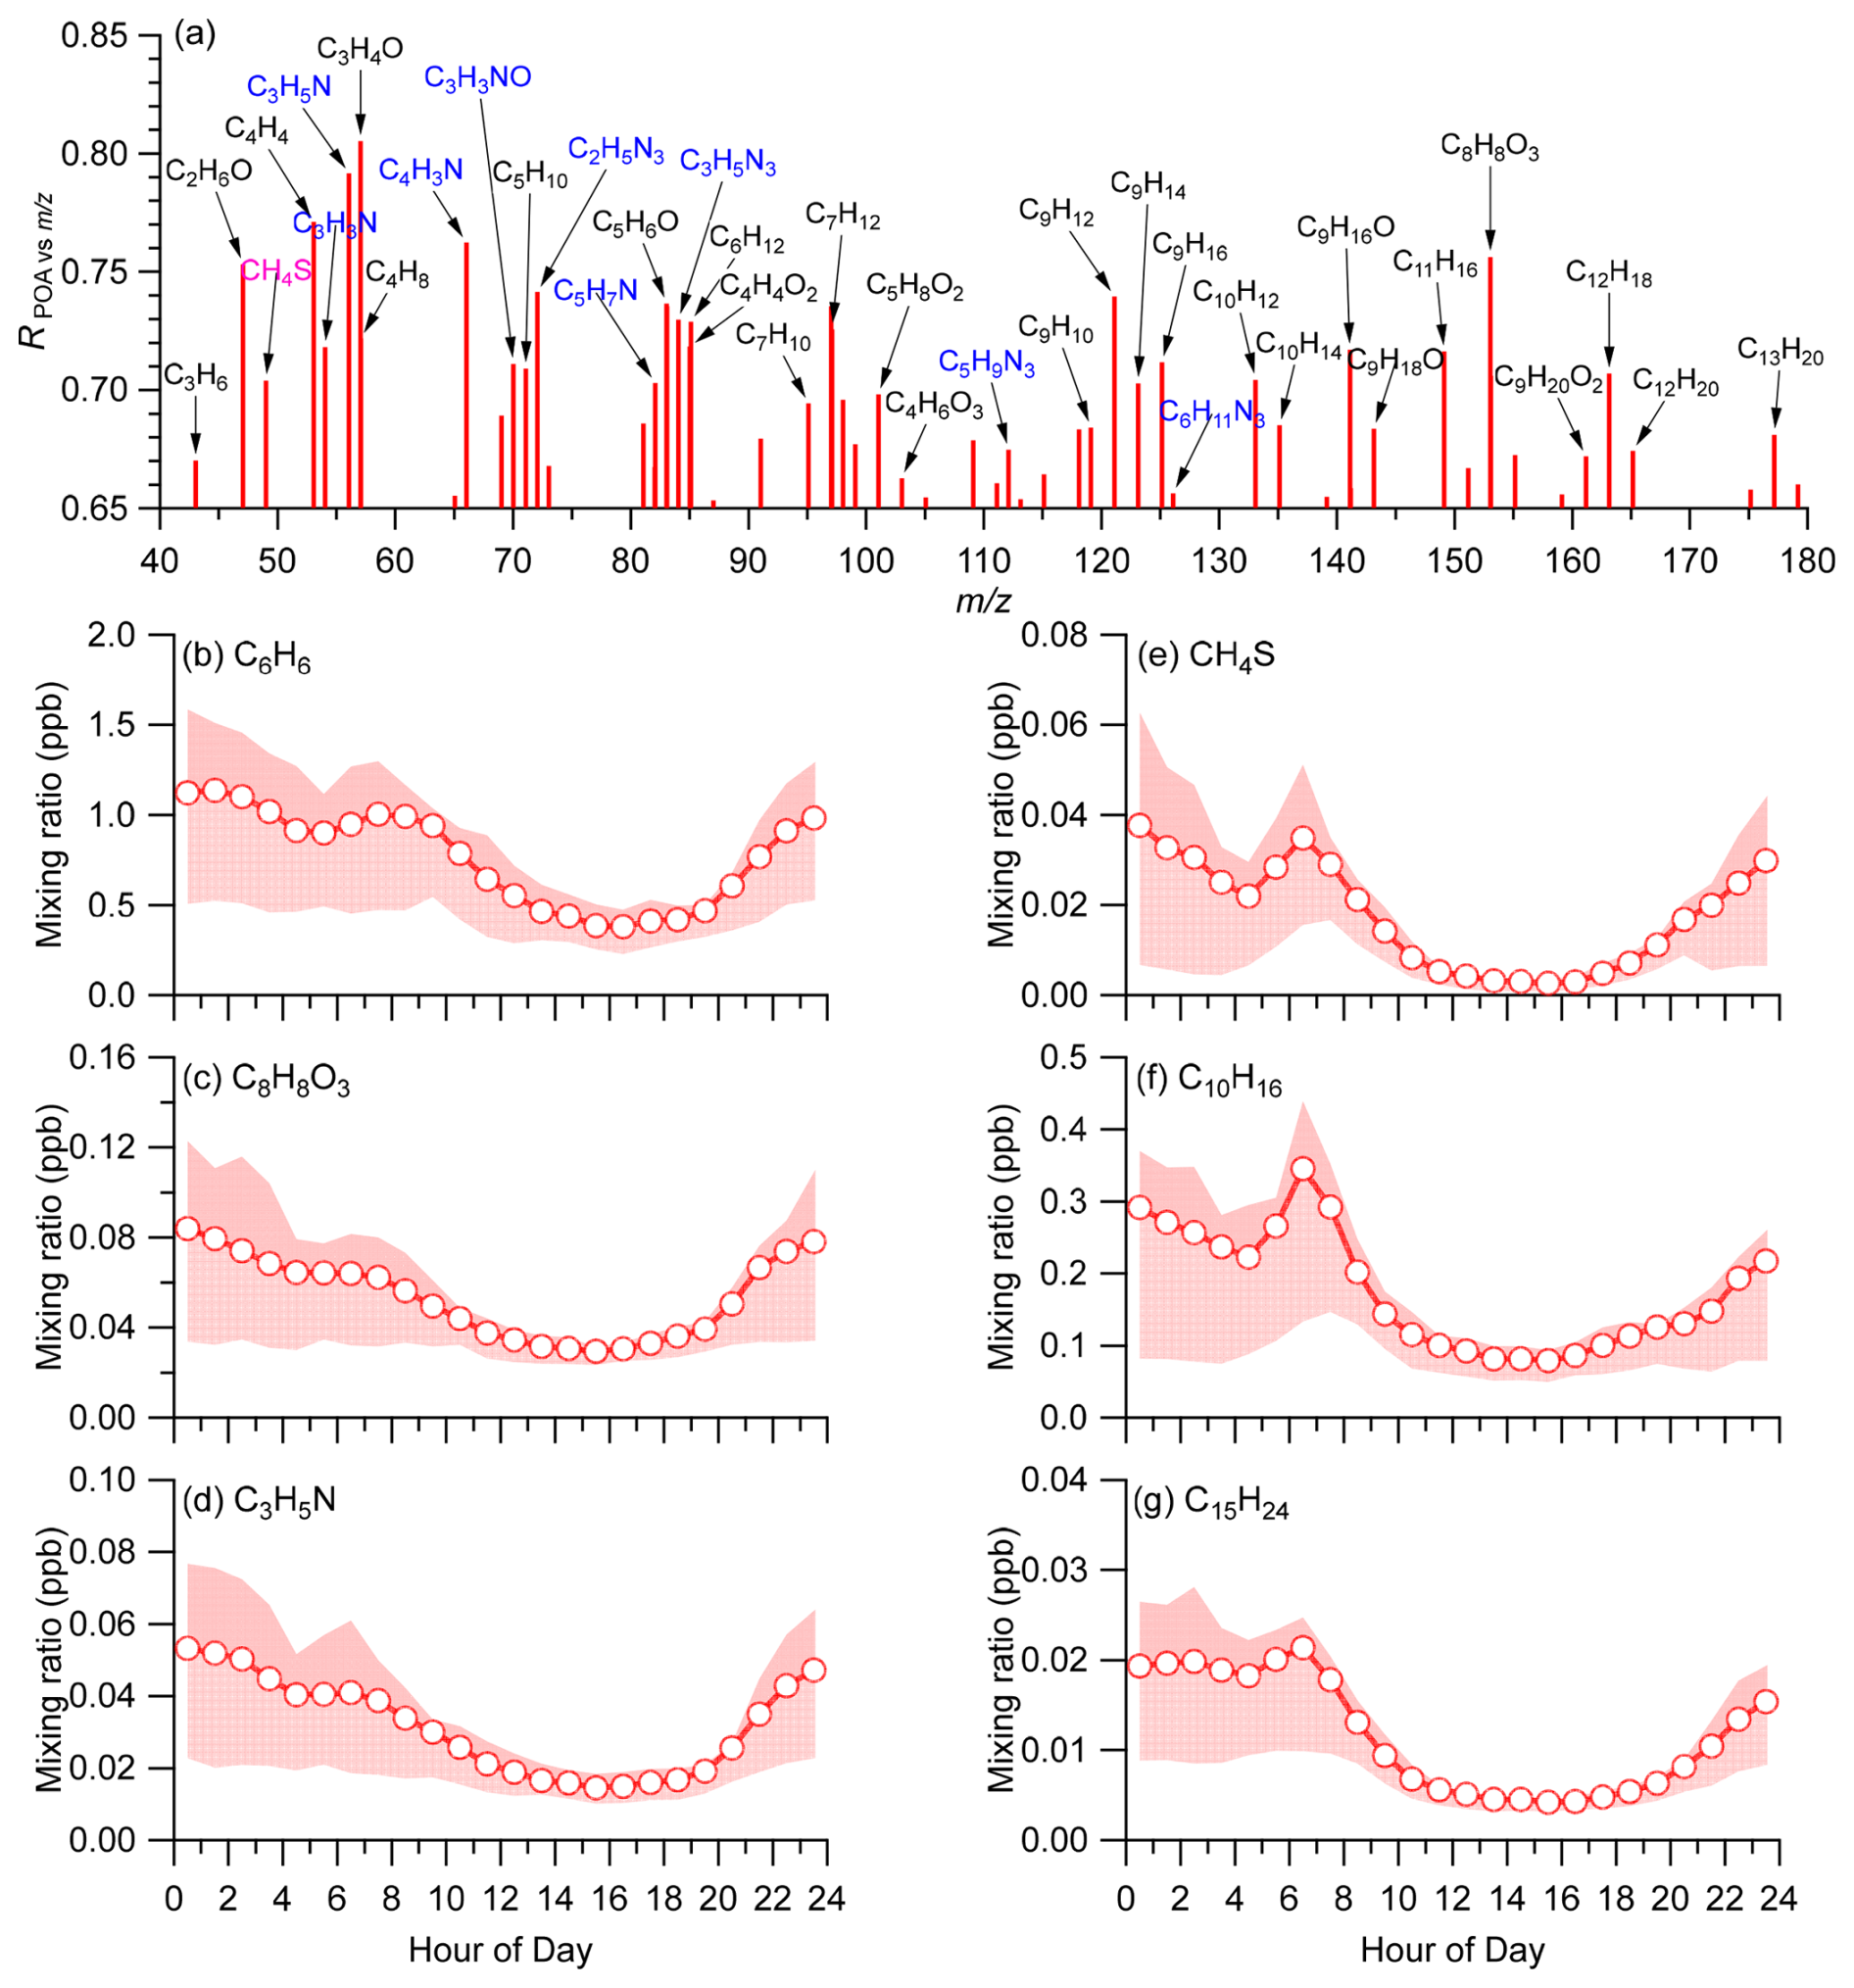
Figure 8(a) Correlations between POA and VOCs, and diurnal patterns of partial POA-related VOCs, including (b) C6H6, (c) C8H8O3, (d) C3H5N, (e) CH4S, (f) C10H16, (g) C15H24. The circles indicate mean values, and the shaded areas represent the 75th and 25th percentiles.
We further explored some VOCs precursors to examine the potential link between variations in OA compositions and VOCs. Figure 8a suggests a strong correlation between the CH category and POA, featuring commonly recognized compounds such as benzene, toluene, xylene from vehicle exhaust. Additionally, propene, butene, pentene also exhibited strong correlations with POA (r = 0.67–0.72), as they are similarly emitted from buses. Correspondingly, these species showed prominent peaks during morning traffic hours. Different from isoprene, which reaches maximum concentrations during the daytime, we observed that monoterpenes and sesquiterpenes displayed higher concentration at night, peaking between 06:00 and 07:00. This suggests that terpenes have significant anthropogenic sources in urban areas, e.g., industry and traffic, in addition to direct emissions from vegetations in forests (Li et al., 2020). Not surprising, the diurnal patterns of terpenes closely resembled those of methyl mercaptan, an important sulfur-containing component from vehicle exhaust. Note that typical oxidation products of monoterpenes such as C9H14O and C10H16O, resulting from ozonolysis and reactions with OH•, also showed significant morning peaks. This highlights the considerable contribution of photochemical productions even during early morning hours when oxidant levels are low. We also found a range of nitrogen-containing species, including amines and urea, that were highly correlated with POA. Specifically, the contributions of the total CHN and CHON categories increased to 5 % in the morning, compared to only 3 % during the day. These results indicate that, aside from NOx, traffic emissions contribute a non-negligible amount of organic nitrogen species, which are strongly associated with the formation of primary organic aerosol, particularly during morning traffic hours.
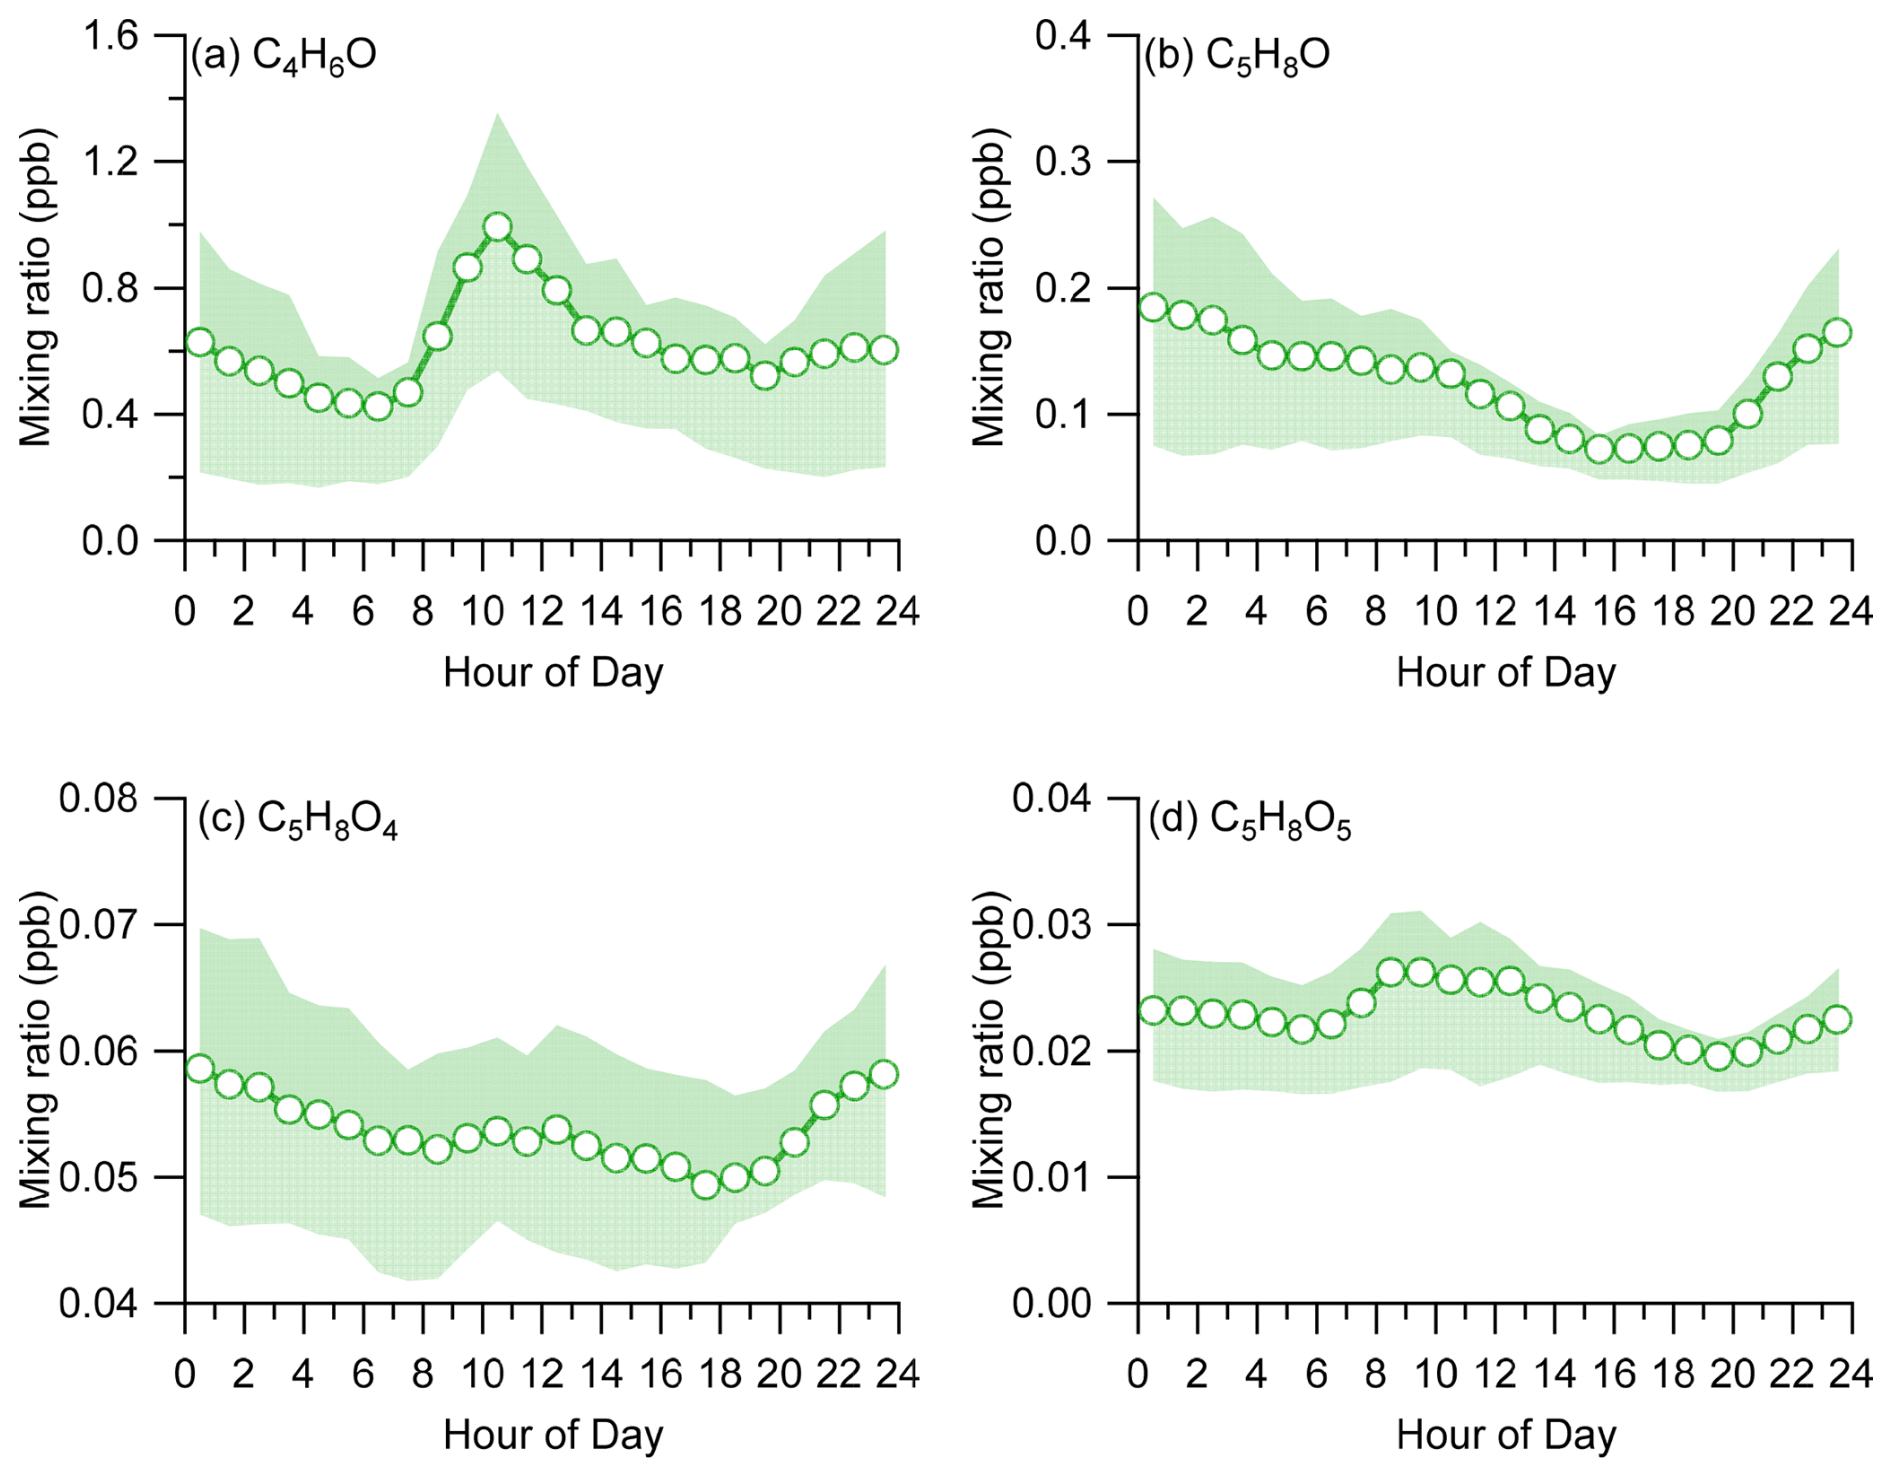
Figure 9Diurnal patterns of isoprene oxidation products, including (a) C4H6O, (b) C5H8O, (c) C5H8O4, (d) C5H8O5. The circles indicate mean values, and the shaded areas represent the 75th and 25th percentiles.
In addition, vanillin (C8H8O3), a type of guaiacol derivatives typically linked to emissions from combustion process (Zhou et al., 2024), showed significant diurnal variations, with higher concentrations observed at night and in the early morning. This finding further supports the combined effects of nocturnal burning sources and traffic emissions on POA. In comparison to POA, two SOA factors showed moderate correlations with a series of oxidation products of isoprene (Fig. 9), e.g., C4H6O, C5H8O, C5H8O4 and C5H8O5, with r of 0.4–0.5. These species displayed pronounced increases during daytime, particularly after 08:00, peaking at early noon, which were responsible for the overall elevation of SOA throughout the day. This indicates the substantial role of isoprene-related products in daytime organic aerosols during summertime in Yinchuan, attributable to significant biogenic isoprene emissions in summer. Beyond biogenic sources of SOA, we noticed substantial daytime enhancements in aromatic oxidation products, such as benzaldehyde and hydroxyisophthalic acid (C8H6O5), likely suggesting that primary traffic-related emissions undergo further atmospheric oxidation to contribute to SOA formation. This is consistent with the oxidation of aromatics accounted for nearly half of the SOA formation potential during this campaign. Except for the traditional precursors including aromatics, alkenes and alkanes, OVOCs were found to contributed more than 30 % to both ozone and SOA formation in Yinchuan, consistent with a recent study showing the critical role of OVOCs in atmospheric photochemistry (Hui et al., 2025). Given this findings, future work should prioritize elucidating the specific chemical pathways linking OVOCs to SOA and O3 formation in Yinchuan, which beyond the scope of present study but are essential.
3.5 Potential source regions of particulate pollution
The HYSPLIT model was utilized to calculate the 72 h back-trajectories of air masses, resulting in the identification of four distinct source region clusters. Throughout the observation period, 26 % of the arriving air masses originated from the southeast (cluster C1, Fig. 10). This cluster was traced back to central Shaanxi province, passing through northeastern Gansu province before reaching Yinchuan. It was characterized by warm, humid air masses, which significantly contributed to the presence of SIA components, accounting for 42 % of the total NR-PM2.5 mass. The predominant source region identified during this campaign was the northwest (C3), which represented 41 % of the air masses observed. Interestingly, the three clusters (C1, C2, C3) originating from the southeast, northeast and northwest source regions, displayed overall similar aerosol compositions, with average NR-PM2.5 concentrations ranging from 15.1 to 18.4 µg m−3. Notably, the organics dominated NR-PM2.5 by 57 %–60 %, followed by sulfate (15 %–17 %) and nitrate (12 %–14 %). These findings indicate a consistent nature of aerosol components on a regional scale surrounding Yinchuan city, emphasizing the pronounced regional characteristics of air pollution within the Yinchuan metropolitan area.
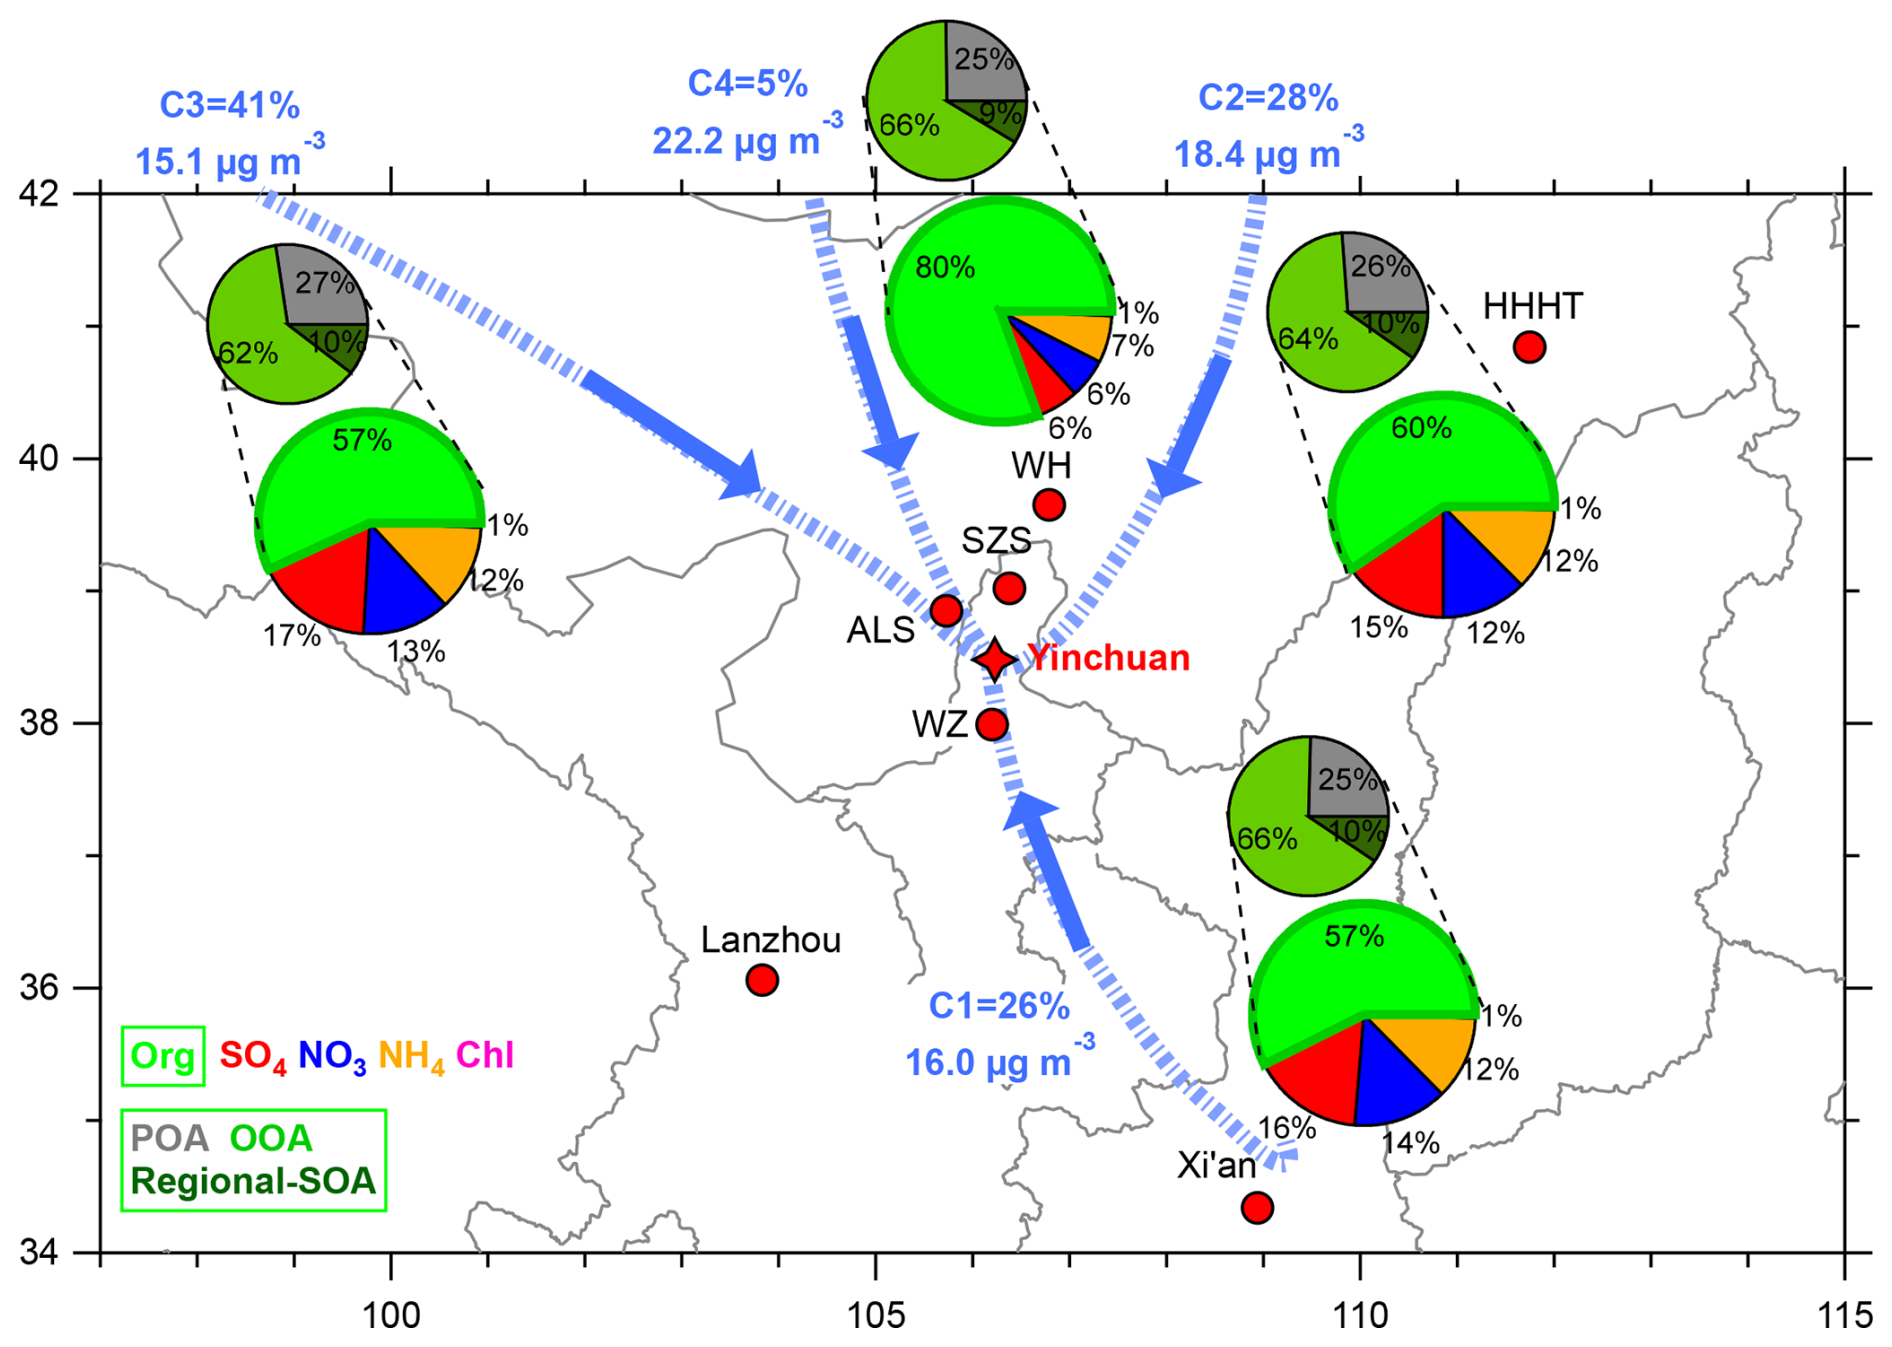
Figure 10Back trajectories of air mass arriving at Yinchuan during the campaign. The pie charts show the average NR-PM2.5 and OA composition for each cluster. Also shown are the percentages of the total trajectories, and corresponding average mass concentration of NR-PM2.5 for each cluster.
In contrast, Cluster C4, originating from Inner Mongolia and the northern part of Ningxia Hui Autonomous Region, was characterized by long-range transport and exhibited a markedly different aerosol composition compared to the other clusters. The proportion of SIA components sharply decreased to 18 %, while the share of organic aerosols experienced a dramatic increase to 80 %. This shift can be attributed to the relatively dry air from the north, which hindered the formation of SIA. However, organic aerosols underwent further oxidation and aging during the process of transport, consequently leading to their increased mass concentrations. The different responses of SIA and organic aerosols to long-range transport demonstrate their distinct formation mechanisms. For instance, SIA might undergo vaporization losses during transit, whereas organic aerosols continued to oxidize persistently, which likely contributed to the observed relatively higher proportion of SOA in Yinchuan to some degree.
In addition, it is noteworthy that the long-distance Cluster C4 passed through Shizuishan city, a typical heavy industrial city in northern Yinchuan, indicating the non-negligible influence of localized primary emissions on air quality of urban Yinchuan. As a result, the average NR-PM2.5 concentrations during C4 reached a peak of 22.2 µg m−3, slightly higher than the levels observed during Cluster C1 to C3. This finding highlights the relatively significant role of long-distance transport in contributing to particulate pollution in Yinchuan compared to nearby cities during the summer months, despite the common perception that long-distance transport is more prevalent in winter. Consistently, during this campaign, the contribution of Cluster C4 accounted for only 5 % of the time. Upon further examination of the air masses, we found that cluster C4 primarily occurred on 16–17 June, coinciding perfectly with wind directions originating from the north. In conclusion, our results reveal that during the summertime, Yinchuan is predominantly influenced by homogeneous nearby air masses for the majority of the time, with only a minor contribution from long-distance transport, even though the latter is associated with more polluted air masses.
We also calculated the potential source contribution functions for aerosol compositions and OA factors (Fig. S4). Our analysis revealed significant differences in the potential source regions for SIA and organic aerosols. The potential source regions for SIA were primarily concentrated in a narrow vicinity around Yinchuan, specifically including Wuhai city, Alxa League, and the Mu Us Sandy Land, all located approximately 300 km from Yinchuan. In comparison, organics were sourced from greater distances, encompassing locations such as Lanzhou to the southwest and Ordos to the southeast. These differing sources regions partially explain the varied responses of aerosol species to meteorological changes observed from P1 to P2. For example, while SIA demonstrated a more pronounced sensitivity to local atmospheric conditions, organic aerosols exhibited a greater influence from more distant sources. Overall, during this campaign, we identified three primary transport pathways for pollution affecting Yinchuan, that is, nearby cities surrounding Yinchuan as the main contributor, along with a southwestern pathway from Lanzhou and a southeastern pathway from Ordos and southern Ningxia. This understanding of transport pathways is crucial for developing effective air quality management strategies in the region. By identifying the spatial distribution of aerosol sources, we can better address the challenges of air pollution in Yinchuan and its surrounding areas.
This study provides new understanding of the evolving summertime PM2.5–O3 relationship and aerosol chemistry in Yinchuan, northwest China. Over the past decade, PM2.5 levels declined substantially before 2019 and then stabilized, while O3 rose and later plateaued, reflecting a transition from rapid emission-driven improvement to a regime dominated by photochemical processes. The weakening correlation between PM2.5 and O3 indicates that further particulate reduction alone is insufficient to mitigate ozone formation under the enhanced oxidative environment of cleaner air. Real-time ToF-ACSM and PTR-MS measurements showed that fine particles were mainly composed of organics, accounting for roughly 60 % of the non-refractory PM2.5 mass. SOA contributed nearly three-quarters of total organics, revealing that aged, photochemically processed material dominates Yinchuan's summer aerosol burden. In contrast, POA was largely linked to traffic and industrial activities, with additional input from sulfur- and nitrogen-containing compounds. VOC observations identified both anthropogenic and biogenic precursors, including aromatics, terpenes, and isoprene oxidation products, as key drivers of SOA formation. Air-mass analyses confirmed that local recirculation governs most summertime pollution events, with minor influence from long-range transport. Overall, our results highlight a regional shift toward SOA-dominated fine particles and decoupled PM2.5–O3 dynamics, underscoring the importance of coordinated control of VOCs, NOx, and oxidants to achieve sustained air-quality improvement in northwestern China.
The data are available upon request from the corresponding author Wei Zhou (zhouwei215@mails.ucas.ac.cn).
The supplement related to this article is available online at https://doi.org/10.5194/acp-26-2425-2026-supplement.
WZ, JL and YS designed the research. WZ, LY, SZ conducted the measurements. WZ, LY, SZ, YK, LY, WZ, WW, ZZ, YL, WX and YS analyzed the data. YG, YW, ZZ, JL, ZW and YS reviewed and commented on the paper. WZ, JL and YS wrote the paper.
The contact author has declared that none of the authors has any competing interests.
Publisher's note: Copernicus Publications remains neutral with regard to jurisdictional claims made in the text, published maps, institutional affiliations, or any other geographical representation in this paper. The authors bear the ultimate responsibility for providing appropriate place names. Views expressed in the text are those of the authors and do not necessarily reflect the views of the publisher.
This research has been supported by the Key Research and Development Program of Ningxia (grant no. 2024BEG01002).
This paper was edited by Ivan Kourtchev and reviewed by two anonymous referees.
An, Z., Huang, R.-J., Zhang, R., Tie, X., Li, G., Cao, J., Zhou, W., Shi, Z., Han, Y., Gu, Z., and Ji, Y.: Severe haze in northern China: A synergy of anthropogenic emissions and atmospheric processes, Proc. Natl. Acad. Sci. USA, 116, 8657, https://doi.org/10.1073/pnas.1900125116, 2019.
Bao, Z., Zhang, X., Li, Q., Zhou, J., Shi, G., Zhou, L., Yang, F., Xie, S., Zhang, D., Zhai, C., Li, Z., Peng, C., and Chen, Y.: Measurement report: Intensive biomass burning emissions and rapid nitrate formation drive severe haze formation in the Sichuan Basin, China – insights from aerosol mass spectrometry, Atmos. Chem. Phys., 23, 1147–1167, https://doi.org/10.5194/acp-23-1147-2023, 2023.
Cappellin, L., Karl, T., Probst, M., Ismailova, O., Winkler, P. M., Soukoulis, C., Aprea, E., Märk, T. D., Gasperi, F., and Biasioli, F.: On Quantitative Determination of Volatile Organic Compound Concentrations Using Proton Transfer Reaction Time-of-Flight Mass Spectrometry, Environ. Sci. Technol., 46, 2283–2290, https://doi.org/10.1021/es203985t, 2012.
Chen, Q., Miao, R., Geng, G., Shrivastava, M., Dao, X., Xu, B., Sun, J., Zhang, X., Liu, M., Tang, G., Tang, Q., Hu, H., Huang, R.-J., Wang, H., Zheng, Y., Qin, Y., Guo, S., Hu, M., and Zhu, T.: Widespread 2013-2020 decreases and reduction challenges of organic aerosol in China, Nat. Commun., 15, 4465, https://doi.org/10.1038/s41467-024-48902-0, 2024.
Draxler, R. R. and Hess, G.: Description of the HYSPLIT4 modeling system, Air Resources Laboratory, Silver Spring, Maryland, 1997.
Fröhlich, R., Crenn, V., Setyan, A., Belis, C. A., Canonaco, F., Favez, O., Riffault, V., Slowik, J. G., Aas, W., Aijälä, M., Alastuey, A., Artiñano, B., Bonnaire, N., Bozzetti, C., Bressi, M., Carbone, C., Coz, E., Croteau, P. L., Cubison, M. J., Esser-Gietl, J. K., Green, D. C., Gros, V., Heikkinen, L., Herrmann, H., Jayne, J. T., Lunder, C. R., Minguillón, M. C., Močnik, G., O'Dowd, C. D., Ovadnevaite, J., Petralia, E., Poulain, L., Priestman, M., Ripoll, A., Sarda-Estève, R., Wiedensohler, A., Baltensperger, U., Sciare, J., and Prévôt, A. S. H.: ACTRIS ACSM intercomparison – Part 2: Intercomparison of ME-2 organic source apportionment results from 15 individual, co-located aerosol mass spectrometers, Atmos. Meas. Tech., 8, 2555–2576, https://doi.org/10.5194/amt-8-2555-2015, 2015.
Geng, G., Liu, Y., Liu, Y., Liu, S., Cheng, J., Yan, L., Wu, N., Hu, H., Tong, D., Zheng, B., Yin, Z., He, K., and Zhang, Q.: Efficacy of China's clean air actions to tackle PM2.5 pollution between 2013 and 2020, Nat. Geosci., 17, 987–994, https://doi.org/10.1038/s41561-024-01540-z, 2024.
He, L.-Y., Lin, Y., Huang, X.-F., Guo, S., Xue, L., Su, Q., Hu, M., Luan, S.-J., and Zhang, Y.-H.: Characterization of high-resolution aerosol mass spectra of primary organic aerosol emissions from Chinese cooking and biomass burning, Atmos. Chem. Phys., 10, 11535–11543, https://doi.org/10.5194/acp-10-11535-2010, 2010.
Huang, R.-J., Li, Y. J., Chen, Q., Zhang, Y., Lin, C., Chan, C. K., Yu, J. Z., de Gouw, J., Tong, S., Jiang, J., Wang, W., Ding, X., Wang, X., Ge, M., Zhou, W., Worsnop, D., Boy, M., Bilde, M., Dusek, U., Carlton, A. G., Hoffmann, T., McNeill, V. F., and Glasius, M.: Secondary organic aerosol in urban China: A distinct chemical regime for air pollution studies, Science, 389, eadq2840, https://doi.org/10.1126/science.adq2840, 2025.
Hui, L., Chen, Y., Feng, X., Sun, H., Guo, J., Xu, Y., Chen, Y., Zheng, P., Gu, D., and Wang, Z.: The critical role of oxygenated volatile organic compounds (OVOCs) in shaping photochemical O3 chemistry and control strategy in a subtropical coastal environment, Atmos. Chem. Phys., 25, 18355–18371, https://doi.org/10.5194/acp-25-18355-2025, 2025.
Lei, L., Zhou, W., Chen, C., He, Y., Li, Z., Sun, J., Tang, X., Fu, P., Wang, Z., and Sun, Y.: Long-term characterization of aerosol chemistry in cold season from 2013 to 2020 in Beijing, China, Environ. Pollut., 268, 115952, https://doi.org/10.1016/j.envpol.2020.115952, 2021.
Li, H., Zhang, Q., Zheng, B., Chen, C., Wu, N., Guo, H., Zhang, Y., Zheng, Y., Li, X., and He, K.: Nitrate-driven urban haze pollution during summertime over the North China Plain, Atmos. Chem. Phys., 18, 5293–5306, https://doi.org/10.5194/acp-18-5293-2018, 2018a.
Li, H., Riva, M., Rantala, P., Heikkinen, L., Daellenbach, K., Krechmer, J. E., Flaud, P.-M., Worsnop, D., Kulmala, M., Villenave, E., Perraudin, E., Ehn, M., and Bianchi, F.: Terpenes and their oxidation products in the French Landes forest: insights from Vocus PTR-TOF measurements, Atmos. Chem. Phys., 20, 1941–1959, https://doi.org/10.5194/acp-20-1941-2020, 2020.
Li, H., Zhang, T., Su, H., Liu, S. X., Shi, Y. Q., Wang, L. Y., Xu, D. D., Zhou, J. M., Zhao, Z. Z., Wang, Q. Y., Ho, S. S. H., Qu, Y., and Cao, J. J.: Factors affecting the different growth rates of PM2.5: Evidence from composition variation, formation mechanisms, and importance analysis of water-soluble inorganic ions with case study in northern China, Atmos. Environ., 340, 120913, https://doi.org/10.1016/j.atmosenv.2024.120913, 2025.
Li, K., Chen, L., White, S. J., Zheng, X., Lv, B., Lin, C., Bao, Z., Wu, X., Gao, X., Ying, F., Shen, J., Azzi, M., and Cen, K.: Chemical characteristics and sources of PM1 during the 2016 summer in Hangzhou, Environ. Pollut., 232, 42–54, https://doi.org/10.1016/j.envpol.2017.09.016, 2018b.
Li, K., Jacob, D. J., Liao, H., Shen, L., Zhang, Q., and Bates, K. H.: Anthropogenic drivers of 2013–2017 trends in summer surface ozone in China, Proc. Natl. Acad. Sci. USA, 116, 422, https://doi.org/10.1073/pnas.1812168116, 2019a.
Li, K., Jacob, D. J., Liao, H., Zhu, J., Shah, V., Shen, L., Bates, K. H., Zhang, Q., and Zhai, S.: A two-pollutant strategy for improving ozone and particulate air quality in China, Nat. Geosci., 12, 906–910, https://doi.org/10.1038/s41561-019-0464-x, 2019b.
Li, K., Jacob, D. J., Liao, H., Qiu, Y., Shen, L., Zhai, S., Bates, K. H., Sulprizio, M. P., Song, S., Lu, X., Zhang, Q., Zheng, B., Zhang, Y., Zhang, J., Lee, H. C., and Kuk, S. K.: Ozone pollution in the North China Plain spreading into the late-winter haze season, Proc. Natl. Acad. Sci. USA, 118, e2015797118, https://doi.org/10.1073/pnas.2015797118, 2021a.
Li, Y., Du, A., Li, Z., Li, J., Chen, C., Sun, J., Qiu, Y., Zhang, Z., Wang, Q., Xu, W., Liu, X., Ji, D., Zhang, W., and Sun, Y.: Investigation of sources and formation mechanisms of fine particles and organic aerosols in cold season in Fenhe Plain, China, Atmos. Res., 268, 106018, https://doi.org/10.1016/j.atmosres.2022.106018, 2022.
Li, Y., Lei, L., Sun, J., Gao, Y., Wang, P., Wang, S., Zhang, Z., Du, A., Li, Z., Wang, Z., Kim, J. Y., Kim, H., Zhang, H., and Sun, Y.: Significant Reductions in Secondary Aerosols after the Three-Year Action Plan in Beijing Summer, Environ. Sci. Technol., 57, 15945-15955, https://doi.org/10.1021/acs.est.3c02417, 2023a.
Li, Y., Sun, J., Bi, Y., Wang, Q., Zhao, X., Lei, L., Du, A., Li, Z., Wang, Z., Pan, X., Han, C., and Sun, Y.: New Insights Into Scavenging Effect of Aerosol Species During Summer Rainfall Process in Beijing, J. Geophys. Res.-Atmos., 128, e2023JD038642, https://doi.org/10.1029/2023JD038642, 2023b.
Li, Z., Lei, L., Li, Y., Chen, C., Wang, Q., Zhou, W., Sun, J., Xie, C., and Sun, Y.: Aerosol characterization in a city in central China plain and implications for emission control, J. Environ. Sci., 104, 242–252, https://doi.org/10.1016/j.jes.2020.11.015, 2021b.
Liu, Y., Zheng, Y., Geng, G., Cheng, J., Liu, Y., Tong, D., He, K., and Zhang, Q.: Strategy for coordinating near-term PM2.5, ozone, and CO2 mitigation in China, Proc. Natl. Acad. Sci. USA, 122, e2513194122, https://doi.org/10.1073/pnas.2513194122, 2025.
Mehra, A., Canagaratna, M., Bannan, T. J., Worrall, S. D., Bacak, A., Priestley, M., Liu, D., Zhao, J., Xu, W., Sun, Y., Hamilton, J. F., Squires, F. A., Lee, J., Bryant, D. J., Hopkins, J. R., Elzein, A., Budisulistiorini, S. H., Cheng, X., Chen, Q., Wang, Y., Wang, L., Stark, H., Krechmer, J. E., Brean, J., Slater, E., Whalley, L., Heard, D., Ouyang, B., Acton, W. J. F., Hewitt, C. N., Wang, X., Fu, P., Jayne, J., Worsnop, D., Allan, J., Percival, C., and Coe, H.: Using highly time-resolved online mass spectrometry to examine biogenic and anthropogenic contributions to organic aerosol in Beijing, Faraday Discuss., 226, 382–408, https://doi.org/10.1039/D0FD00080A, 2021.
Nault, B. A., Jo, D. S., McDonald, B. C., Campuzano-Jost, P., Day, D. A., Hu, W., Schroder, J. C., Allan, J., Blake, D. R., Canagaratna, M. R., Coe, H., Coggon, M. M., DeCarlo, P. F., Diskin, G. S., Dunmore, R., Flocke, F., Fried, A., Gilman, J. B., Gkatzelis, G., Hamilton, J. F., Hanisco, T. F., Hayes, P. L., Henze, D. K., Hodzic, A., Hopkins, J., Hu, M., Huey, L. G., Jobson, B. T., Kuster, W. C., Lewis, A., Li, M., Liao, J., Nawaz, M. O., Pollack, I. B., Peischl, J., Rappenglück, B., Reeves, C. E., Richter, D., Roberts, J. M., Ryerson, T. B., Shao, M., Sommers, J. M., Walega, J., Warneke, C., Weibring, P., Wolfe, G. M., Young, D. E., Yuan, B., Zhang, Q., de Gouw, J. A., and Jimenez, J. L.: Secondary organic aerosols from anthropogenic volatile organic compounds contribute substantially to air pollution mortality, Atmos. Chem. Phys., 21, 11201–11224, https://doi.org/10.5194/acp-21-11201-2021, 2021.
Polissar, A. V., Hopke, P. K., Paatero, P., Kaufmann, Y. J., Hall, D. K., Bodhaine, B. A., Dutton, E. G., and Harris, J. M.: The aerosol at Barrow, Alaska: long-term trends and source locations, Atmos. Environ., 33, 2441–2458, https://doi.org/10.1016/S1352-2310(98)00423-3, 1999.
Sun, Y., Jiang, Q., Wang, Z., Fu, P., Li, J., Yang, T., and Yin, Y.: Investigation of the sources and evolution processes of severe haze pollution in Beijing in January 2013, J. Geophys. Res.-Atmos., 119, 4380–4398, https://doi.org/10.1002/2014jd021641, 2014.
Sun, Y., Luo, H., Li, Y., Zhou, W., Xu, W., Fu, P., and Zhao, D.: Atmospheric organic aerosols: online molecular characterization and environmental impacts, npj Clim. Atmos. Sci., 8, 305, https://doi.org/10.1038/s41612-025-01199-2, 2025.
Wang, W., Cui, Y., Zhang, R., He, Q., Gao, J., Fan, J., Guo, L., Wang, J., and Wang, X.: Characteristics of the chemical processes of organic aerosols by time-of-flight aerosol chemical speciation monitor (TOF-ACSM) in winter in a site of Fenhe Valley, northern China, Atmos. Pollut. Res., 15, 102132, https://doi.org/10.1016/j.apr.2024.102132, 2024a.
Wang, W., Li, X., Cheng, Y., Parrish, D. D., Ni, R., Tan, Z., Liu, Y., Lu, S., Wu, Y., Chen, S., Lu, K., Hu, M., Zeng, L., Shao, M., Huang, C., Tian, X., Leung, K. M., Chen, L., Fan, M., Zhang, Q., Rohrer, F., Wahner, A., Pöschl, U., Su, H., and Zhang, Y.: Ozone pollution mitigation strategy informed by long-term trends of atmospheric oxidation capacity, Nat. Geosci., 17, 20–25, https://doi.org/10.1038/s41561-023-01334-9, 2024b.
Wang, Y., Gao, W., Wang, S., Song, T., Gong, Z., Ji, D., Wang, L., Liu, Z., Tang, G., Huo, Y., Tian, S., Li, J., Li, M., Yang, Y., Chu, B., Petäjä, T., Kerminen, V.-M., He, H., Hao, J., Kulmala, M., Wang, Y., and Zhang, Y.: Contrasting trends of PM2.5 and surface-ozone concentrations in China from 2013 to 2017, Natl. Sci. Rev., 1–9, https://doi.org/10.1093/nsr/nwaa032, 2020.
Wang, Y., Xia, W., Liu, X., Xie, S., Lin, W., Tang, Q., Ma, H.-Y., Jiang, Y., Wang, B., and Zhang, G. J.: Disproportionate control on aerosol burden by light rain, Nat. Geosci., 14, 72–76, https://doi.org/10.1038/s41561-020-00675-z, 2021.
Xu, J., Zhang, Q., Chen, M., Ge, X., Ren, J., and Qin, D.: Chemical composition, sources, and processes of urban aerosols during summertime in northwest China: insights from high-resolution aerosol mass spectrometry, Atmos. Chem. Phys., 14, 12593–12611, https://doi.org/10.5194/acp-14-12593-2014, 2014.
Xu, J., Shi, J., Zhang, Q., Ge, X., Canonaco, F., Prévôt, A. S. H., Vonwiller, M., Szidat, S., Ge, J., Ma, J., An, Y., Kang, S., and Qin, D.: Wintertime organic and inorganic aerosols in Lanzhou, China: sources, processes, and comparison with the results during summer, Atmos. Chem. Phys., 16, 14937–14957, https://doi.org/10.5194/acp-16-14937-2016, 2016a.
Xu, J., Liu, D., Wu, X., Vu, T. V., Zhang, Y., Fu, P., Sun, Y., Xu, W., Zheng, B., Harrison, R. M., and Shi, Z.: Source apportionment of fine organic carbon at an urban site of Beijing using a chemical mass balance model, Atmos. Chem. Phys., 21, 7321–7341, https://doi.org/10.5194/acp-21-7321-2021, 2021.
Xu, W., Croteau, P., Williams, L., Canagaratna, M., Onasch, T., Cross, E., Zhang, X., Robinson, W., Worsnop, D., and Jayne, J.: Laboratory characterization of an aerosol chemical speciation monitor with PM2.5 measurement capability, Aerosol Sci. Technol., 51, 69–83, https://doi.org/10.1080/02786826.2016.1241859, 2016b.
Xu, W., Han, T., Du, W., Wang, Q., Chen, C., Zhao, J., Zhang, Y., Li, J., Fu, P., Wang, Z., Worsnop, D. R., and Sun, Y.: Effects of Aqueous-Phase and Photochemical Processing on Secondary Organic Aerosol Formation and Evolution in Beijing, China, Environ. Sci. Technol., 51, 762–770, https://doi.org/10.1021/acs.est.6b04498, 2017.
Xu, W., He, Y., Qiu, Y., Chen, C., Xie, C., Lei, L., Li, Z., Sun, J., Li, J., Fu, P., Wang, Z., Worsnop, D. R., and Sun, Y.: Mass spectral characterization of primary emissions and implications in source apportionment of organic aerosol, Atmos. Meas. Tech., 13, 3205–3219, https://doi.org/10.5194/amt-13-3205-2020, 2020.
Yan, C., Tham, Y. J., Nie, W., Xia, M., Wang, H., Guo, Y., Ma, W., Zhan, J., Hua, C., Li, Y., Deng, C., Li, Y., Zheng, F., Chen, X., Li, Q., Zhang, G., Mahajan, A. S., Cuevas, C. A., Huang, D. D., Wang, Z., Sun, Y., Saiz-Lopez, A., Bianchi, F., Kerminen, V.-M., Worsnop, D. R., Donahue, N. M., Jiang, J., Liu, Y., Ding, A., and Kulmala, M.: Increasing contribution of nighttime nitrogen chemistry to wintertime haze formation in Beijing observed during COVID-19 lockdowns, Nat. Geosci., 16, 975–981, https://doi.org/10.1038/s41561-023-01285-1, 2023.
Zeng, S., Zhou, W., Li, Y., Zhang, Z., Zhang, Y., Wang, Y., Kim, K. H., Ji, D., Hu, B., Kim, J. Y., Wang, Z., and Sun, Y.: Decadal changes in summer aerosol composition and secondary aerosol formation mechanisms in Beijing, Environ. Res. Commun., 6, 125002, https://doi.org/10.1088/2515-7620/ad9711, 2024.
Zhang, J., Wang, J., Sun, Y., Li, J., Ninneman, M., Ye, J., Li, K., Crandall, B., Mao, J., Xu, W., Schwab, M. J., Li, W., Ge, X., Chen, M., Ying, Q., Zhang, Q., and Schwab, J. J.: Insights from ozone and particulate matter pollution control in New York City applied to Beijing, npj Clim. Atmos. Sci., 5, 85, https://doi.org/10.1038/s41612-022-00309-8, 2022.
Zhang, Q., Jimenez, J. L., Canagaratna, M. R., Allan, J. D., Coe, H., Ulbrich, I., Alfarra, M. R., Takami, A., Middlebrook, A. M., Sun, Y. L., Dzepina, K., Dunlea, E., Docherty, K., DeCarlo, P. F., Salcedo, D., Onasch, T., Jayne, J. T., Miyoshi, T., Shimono, A., Hatakeyama, S., Takegawa, N., Kondo, Y., Schneider, J., Drewnick, F., Borrmann, S., Weimer, S., Demerjian, K., Williams, P., Bower, K., Bahreini, R., Cottrell, L., Griffin, R. J., Rautiainen, J., Sun, J. Y., Zhang, Y. M., and Worsnop, D. R.: Ubiquity and dominance of oxygenated species in organic aerosols in anthropogenically-influenced Northern Hemisphere midlatitudes, Geophys. Res. Lett., 34, L13801, https://doi.org/10.1029/2007gl029979, 2007.
Zhang, Q., He, K., and Huo, H.: Cleaning China's air, Nature, 484, 161, https://doi.org/10.1038/484161a, 2012.
Zhang, Q., Zheng, Y., Tong, D., Shao, M., Wang, S., Zhang, Y., Xu, X., Wang, J., He, H., Liu, W., Ding, Y., Lei, Y., Li, J., Wang, Z., Zhang, X., Wang, Y., Cheng, J., Liu, Y., Shi, Q., Yan, L., Geng, G., Hong, C., Li, M., Liu, F., Zheng, B., Cao, J., Ding, A., Gao, J., Fu, Q., Huo, J., Liu, B., Liu, Z., Yang, F., He, K., and Hao, J.: Drivers of improved PM2.5 air quality in China from 2013 to 2017, Proc. Natl. Acad. Sci. USA, 116, 24463–24469, https://doi.org/10.1073/pnas.1907956116, 2019a.
Zhang, W., Liu, Y., Yue, M., Dong, X., Huang, K., and Wang, M.: Understanding the long-term trend of organic aerosol and the influences from anthropogenic emission and regional climate change in China, Atmos. Chem. Phys., 25, 3857–3872, https://doi.org/10.5194/acp-25-3857-2025, 2025.
Zhang, X., Xu, J., Kang, S., Zhang, Q., and Sun, J.: Chemical characterization and sources of submicron aerosols in the northeastern Qinghai–Tibet Plateau: insights from high-resolution mass spectrometry, Atmos. Chem. Phys., 19, 7897–7911, https://doi.org/10.5194/acp-19-7897-2019, 2019b.
Zhang, Y., Du, W., Wang, Y., Wang, Q., Wang, H., Zheng, H., Zhang, F., Shi, H., Bian, Y., Han, Y., Fu, P., Canonaco, F., Prévôt, A. S. H., Zhu, T., Wang, P., Li, Z., and Sun, Y.: Aerosol chemistry and particle growth events at an urban downwind site in North China Plain, Atmos. Chem. Phys., 18, 14637–14651, https://doi.org/10.5194/acp-18-14637-2018, 2018.
Zhang, Z., Zhu, W., Hu, M., Wang, H., Chen, Z., Shen, R., Yu, Y., Tan, R., and Guo, S.: Secondary Organic Aerosol from Typical Chinese Domestic Cooking Emissions, Environ. Sci. Technol. Lett., 8, 24–31, https://doi.org/10.1021/acs.estlett.0c00754, 2021.
Zhang, Z., Xu, W., Zeng, S., Liu, Y., Liu, T., Zhang, Y., Du, A., Li, Y., Zhang, N., Wang, J., Aruffo, E., Han, P., Li, J., Wang, Z., and Sun, Y.: Secondary Organic Aerosol Formation from Ambient Air in Summer in Urban Beijing: Contribution of S/IVOCs and Impacts of Heat Waves, Environ. Sci. Technol. Lett., 11, 738–745, https://doi.org/10.1021/acs.estlett.4c00415, 2024.
Zheng, Y., Chen, Q., Cheng, X., Mohr, C., Cai, J., Huang, W., Shrivastava, M., Ye, P., Fu, P., Shi, X., Ge, Y., Liao, K., Miao, R., Qiu, X., Koenig, T. K., and Chen, S.: Precursors and Pathways Leading to Enhanced Secondary Organic Aerosol Formation during Severe Haze Episodes, Environ. Sci. Technol., 55, 15680–15693, https://doi.org/10.1021/acs.est.1c04255, 2021.
Zhou, W., Gao, M., He, Y., Wang, Q., Xie, C., Xu, W., Zhao, J., Du, W., Qiu, Y., Lei, L., Fu, P., Wang, Z., Worsnop, D. R., Zhang, Q., and Sun, Y.: Response of aerosol chemistry to clean air action in Beijing, China: Insights from two-year ACSM measurements and model simulations, Environ. Pollut., 255, 113345, https://doi.org/10.1016/j.envpol.2019.113345, 2019.
Zhou, W., Xu, W., Kim, H., Zhang, Q., Fu, P., Worsnop, D. R., and Sun, Y.: A review of aerosol chemistry in Asia: insights from aerosol mass spectrometer measurements, Environ. Sci.-Proc. Imp., 22, 1616–1653, https://doi.org/10.1039/D0EM00212G, 2020.
Zhou, W., Chen, C., Lei, L., Fu, P., and Sun, Y.: Temporal variations and spatial distributions of gaseous and particulate air pollutants and their health risks during 2015–2019 in China, Environ. Pollut., 272, 116031, https://doi.org/10.1016/j.envpol.2020.116031, 2021.
Zhou, W., Lei, L., Du, A., Zhang, Z., Li, Y., Yang, Y., Tang, G., Chen, C., Xu, W., Sun, J., Li, Z., Fu, P., Wang, Z., and Sun, Y.: Unexpected Increases of Severe Haze Pollution During the Post COVID-19 Period: Effects of Emissions, Meteorology, and Secondary Production, J. Geophys. Res.-Atmos., 127, e2021JD035710, https://doi.org/10.1029/2021JD035710, 2022.
Zhou, W., Xu, W., Li, Z., Lei, L., Li, Y., Sun, J., Du, A., Zhang, Z., Li, Y., Fu, P., Ge, X., and Sun, Y.: Molecular Characterization of Gaseous Organic Acids and Nitrogen-Containing Compounds From Crop Straw and Wood Burning, J. Geophys. Res.-Atmos., 129, e2023JD040568, https://doi.org/10.1029/2023JD040568, 2024.