the Creative Commons Attribution 4.0 License.
the Creative Commons Attribution 4.0 License.
 | 16 Feb 2026
Observed multiscale dynamical processes responsible for an extreme gust event in Beijing
Xiaoran Guo
Ning Li
Zhen Zhang
Tianmeng Chen
Pengzhan Yao
Shuairu Jiang
Lei Zhao
Fei Hu
Extreme wind gusts pose substantial threats to human safety and infrastructure, yet inadequate pre-onset observational constraints result in large uncertainties and inaccuracies in nowcasting and forecast. To address this gap, we conduct an in-depth investigation of a record-breaking surface gust event (wind speed > 35 m s−1) that occurred in Beijing during the early afternoon of 30 May 2024. We analyze the event's dynamical characteristics utilizing a high-resolution meteorological mesonet, which includes seven radar wind profilers (RWPs), a meteorological tower, automated weather stations, radar and satellite data. Multi-source observational analyses reveal that multicellular storm developed ahead of a convergence line, where northeasterly cold outflows collided with environmental southerly winds during their downhill propagation. Evaporative cooling drove the generation of extreme winds, reinforced by downward momentum transport and pressure gradient forcing. After reaching the plain, two convective segments subsequently merged into a well-organized squall system embedded with a midlevel mesovortex with intense rear-inflow jet. Low-level frontogenesis and shearing deformation provided favorable conditions for sustaining mesoscale convection, which in turn fueled small-scale turbulent energy processes. Turbulent inverse energy cascades – energy transfer from small to large eddies – intensified markedly as wind speeds increased. This study offers valuable insights into the multiscale dynamical processes governing convective evolution – captured by the RWP mesonet – that would otherwise remain inaccessible via other ways. Importantly, these findings support the validation of numerical simulation outputs, refinement of boundary-layer parameterization schemes in numerical weather prediction (NWP) models, and ultimately the enhancement of forecast skill for convection-associated extreme gust events.
- Article
(7460 KB) - Full-text XML
- BibTeX
- EndNote


Extreme intense winds rank among the most destructive meteorological hazards globally, causing cascading disasters such as infrastructure collapse, wildfire escalation, and aviation accidents (Goyette et al., 2003; Pryor and Barthelmie, 2010, 2011; Peterson et al., 2014). However, large uncertainties in the wind speed estimations still exist in weather forecast models and reanalysis products (Azorin-Molina et al., 2016; Torralba et al., 2017; Kahl, 2020; Hirt and Craig, 2021; Pryor et al., 2012; Pryor and Barthelmie, 2021; Wu et al., 2024), especially for those associated with convection-induced extreme wind gusts, due partly to limitations in spatial resolution and parameterization schemes (Fovell, 2002; Fiori et al., 2011; Adams-Selin et al., 2013; Burghardt et al., 2014; Wandishin et al., 2010).
Wind gusts – short-lived extreme events – arise when air with high momentum is transported to the surface (Harris and Kahl, 2017). They occur alongside both convective and non-convective processes and are affected by a range of physical factors, including wind speed, turbulence in the planetary boundary layer (PBL), topographic flows, and surface roughness (Letson et al., 2018). In previous convection-induced wind gust research, the role of a complex interplay of factors has been well recognized. Specifically, mesoscale dynamics and thermodynamics interaction drives the generation of downdrafts to form the initial “engine” of the gust (Johns and Hirt 1987; Vose et al., 2014; Abulikemu et al., 2019; Taszarek et al., 2019). Microphysics processes governs latent cooling rates, which directly control the buoyancy and strength of downdraft (Mahoney and Lackmann 2011; Adams-Selin et al. 2013; Zhou et al. 2020). Then, the turbulence-convection interaction modulates these downdrafts and outflows by turbulent mixing near the surface and determines how efficiently momentum is transferred to the surface, thereby sharpening or dissipating the gust front (Tucker et al., 2009; Tang et al., 2015; Shao et al., 2023a, b).
Among others, quasi-linear convective systems (QLCSs) such as squall lines can produce a straight-line swath of extreme winds (Fujita 1978; Johns and Hirt 1987; Coniglio et al., 2011; Meng et al. 2012; Xu et al., 2024). Given their damaging potential, many efforts have been made in the past few decades to explore the mechanisms of extreme wind gusts generated by QLCSs in observational and numerical studies (e.g., Lafore and Moncrieff 1989; Bentley and Mote, 1998; Atkins et al., 2005; Meng et al. 2012). It was consistently found that the intensity of cold outflows is one of the main contributors of extreme wind gusts (Houze, 2014; Haerter et al., 2019; Chen et al., 2024). The formation of mesoscale vortices (Wheatley and Trapp 2008; Atkins and Laurent, 2009; Evans et al., 2014; Xu et al., 2015b; Zhang et al., 2021) and the merger of convective cells (French and Parker; 2012; 2014; Liu et al., 2023; Yang and Du, 2026) have a close connection with the evolution of QLCSs and the initiation of extreme wind gusts. The midlevel rear-inflow jet (RIJ) in the stratiform region of QLCSs plays an important role in strengthening the extreme winds at the surface via the downward transport of momentum (Zhang and Gao 1989; Weisman, 1992; Grim et al., 2009; Browning et al., 2010; Xu et al., 2015a).
Although the above-mentioned studies have made significant progress in quantifying the characteristics of QLCSs, reliable QLCS-induced gust forecasting remains challenging to achieve. This is mainly because the energy-carrying turbulent eddies that harbor gusts are typically far too small to be resolved by observational networks and mesoscale numerical models (Fovell and Cao, 2014). To the best of our knowledge, most of previous studies, nevertheless, relied on the model simulation or reanalyses. This leads to large knowledge gaps in the vertical structure of lower troposphere and its evolution in the presence of QLCS, especially for highly localized and transient storms (Luchetti et al., 2020; Romanic et al., 2020).
To confront this challenge, high-resolution vertical wind observations from wind towers have been widely applied to elucidate the atmospheric dynamic structure and evolving convective morphology leading to damaging winds (e.g., Bélair et al., 2025). Nevertheless, the wind tower cannot capture the winds near clouds, resulting in large vertical wind observations gaps especially, which can be overcome by the radar wind profiler (RWP, Liu et al., 2024). A high-density RWP network has been setup in China (Guo et al., 2021a) since 2008a, especially in Beijing and the Yangtze River Delta (YRD). The continuous vertical measurements from RWP, along with meteorological towers, afford us a valuable perspective to shed light on these complex phenomena. For instance, Chen et al. (2024) examined a record-breaking surface gust wind that occurred in eastern China on 30 April 2021 by using the measurements from the RWP mesonet in the YRD region.
Here we examine an extreme wind gust event associated with a QLCS that occurred in Beijing on 30 May 2024, where the climate and terrain are quite different from YRD. The instantaneous surface wind speeds at 250 sites in this event exceeded 17.2 m s−1 with the maximum wind speed reaching 37.2 m s−1. This high-wind-producing convective system caused widespread fallen trees and power lines, damaging many vehicles and buildings. This intense wind gust event is comprehensively analyzed by using a high-resolution meteorological mesonet consisting of seven RWPs and one meteorological tower in an attempt to gain insight into the vertical structural evolution within the PBL and elucidate the complex multi-scale dynamical processes during the event. The next section describes the data and methodology used in this work. Section 3 presents an overview of the QLCS and associated extreme wind gust event. In Sect. 4, the utility of the RWPs and meteorological tower mesonet in capturing the evolving vertical structure of the high-wind event is examined. Key findings are concluded in the final section.
2.1 Vertical profile measurements
Figure 1a presents the spatial distribution of RWP mesonet deployed in Beijing, which is composed of seven stations. These RWPs are Ce Feng Leida-6 (CFL-6) Tropospheric Wind Profilers, which are produced by the 23rd Institute of China Aerospace Science and Industry Corporation (Liu et al., 2020). They provide measurements of horizontal and vertical winds, and refractive index structure parameter at 6 min intervals. The vertical resolution is 120 m from 0.15 to 4.11 km above the ground level () in low-operating mode, and 240 m from 4.11 to 10.11 in high-operating mode. After testing the data quality of the RWPs in our previous study (Guo et al., 2023), horizontal wind speed, direction and vertical velocity derived from RWPs in the heights of 0.51–4.95 were found to be reliable. Linear interpolation in time is adopted to fill missing values for the continuity of data.
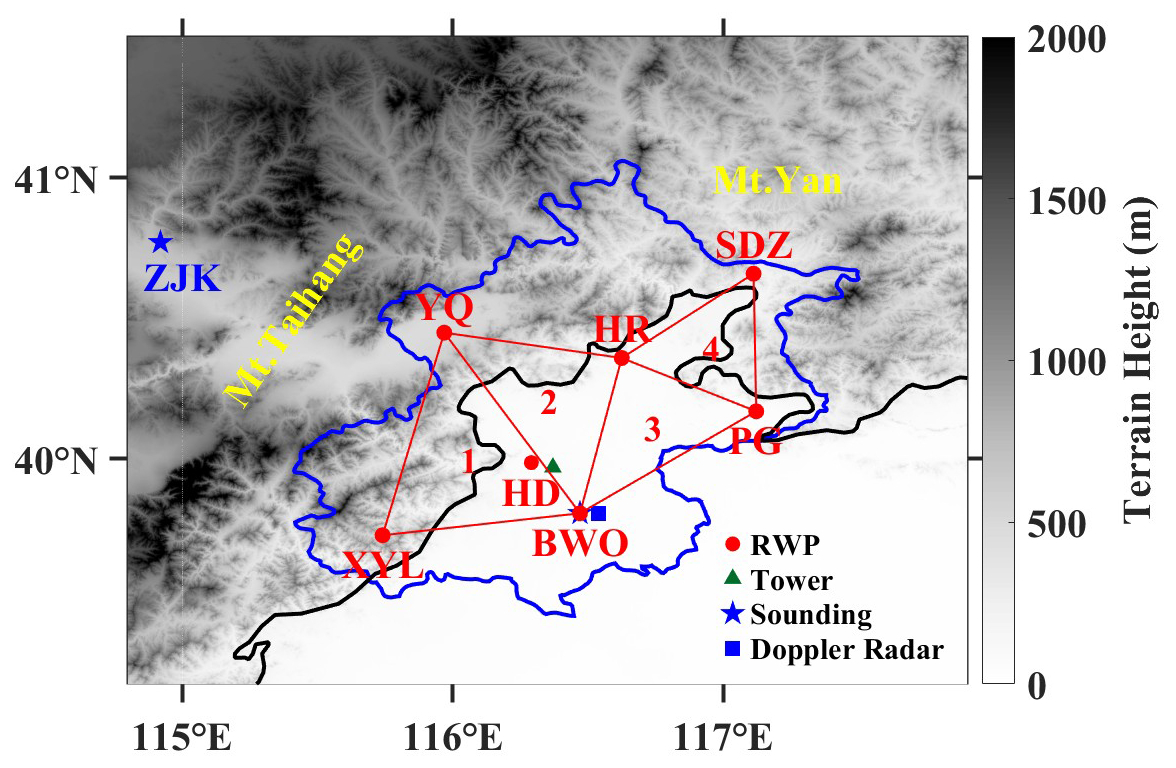
Figure 1Spatial distribution of the terrain height over Beijing and surrounding areas with the black and blue line denoting the plain line at 200 m terrain elevation and the provincial boundary, respectively. Seven RWPs (red dots) deployed at Xiayunling (XYL; 39.73° N, 115.74° E), Shangdianzi (SDZ; 40.66° N, 117.11° E), Huairou (HR; 40.36° N, 116.63° E), Yanqing (YQ; 40.45° N, 115.97° E), Haidian (HD; 39.98° N, 116.28° E), Pinggu (PG; 40.17° N, 117.12° E), and the Beijing Weather Observatory (BWO; 39.79° N, 116.47° E). Four red triangles with number denote the regions used to calculate the dynamic parameters with the triangle method. Blue five-pointed stars denote the L-band sounding at BWO and Zhangjiakou (ZJK; 40.77° N, 114.92° E) station. A S-band Doppler weather radar (blue square) is also deployed at BWO. Green small triangle represents the location of meteorological tower (39.97° N, 116.37° E).
Upper-air sounding balloons launched at the Zhangjiakou (ZJK) and Beijing Weather Observatory (BWO) sites at 08:00 and 20:00 LST (local standard time) on 30 May 2024 are used to provide the vertical profiles of thermodynamic features, including temperature, pressure, relative humidity, and horizontal winds with a vertical resolution of 5–8 m (Guo et al., 2021b).
The meteorological tower with 325 m high is located on 49 m above mean sea level (). Seven sets of three-dimensional ultrasonic anemometers are installed at seven different heights of the tower: 8, 15, 47, 80, 140, 200 and 280 m, which are used to measure horizontal wind speed, direction, and vertical velocity with a sampling frequency of 10 Hz. These measurements have undergone strict data quality check, and please refer to Shi and Hu (2020) and Shi et al. (2020) for more details.
2.2 Radar reflectivity and surface meteorological observations
Identification and tracking of the mesoscale convective system (MCS) are conducted using composite radar reflectivity data derived from the China Meteorological Administration (CMA) Doppler radar network. This dataset features a spatial resolution of ∼ 0.01° × 0.01° (latitude × longitude) and integrates the maximum reflectivity measurements across different vertical levels for each horizontal grid pixel, ensuring comprehensive capture of the MCS's vertical echo structure.
For context, the operational CMA Doppler radars employed here have a complete volume scan interval of approximately 6 min, which suffices to track the dynamic evolution of the MCS and its associated gust front. To better characterize gust front propagation, radial velocity data from the S-band Doppler radar in BWO are also used.
Ground-based meteorological variables are also used in the analysis over the study area, including 2 m air temperature (T2 m), relative humidity, and pressure measured at 5 min intervals, as well as instantaneous 10 m wind speed (WS10 m), wind direction, and precipitation measured at 1 min intervals from automated weather stations (AWSs).
2.3 Reanalysis and satellite datasets
ERA5 is the fifth-generation atmospheric reanalysis of ECMWF (European Centre for Medium-Range Weather Forecasts), which benefits from advancements in data assimilation, model physics and dynamics (Hersbach et al., 2023). The ERA5 dataset can provide meteorological parameters on 37 pressure level with a spatial resolution of 0.25° × 0.25° at hourly intervals. The geopotential height, temperature, relative humidity, and horizontal wind fields at 500 and 850 hPa are used to analyze the large-scale conditions prior to the severe wind gust event in Beijing.
Himawari-8/9 is one of the next-generation geostationary satellites operated by the Japan Meteorological Agency, which was launched on 7 October 2014 and located at 0° N, 140.7° E (Da, 2015). It has provided real-time observations to the public since 7 July 2015 (ftp://ftp.ptree.jaxa.jp/jma, last access: 7 June 2024) with diverse central wavelength (from 0.47 to 13.3 µm). Brightness temperature from the 10.8 µm-channel high-resolution geostationary satellite Himawari-8/9 L1 gridded data with a spatial resolution of 0.25° × 0.25° (Bessho et al., 2016; Chen et al., 2019) is used in this study to identify and track the MCS at 10 min intervals.
2.4 Calculation of divergence, vorticity, stretching and shearing deformation
Divergence, vorticity, stretching and shearing are four fundamental air motion diagnostics (Yanai and Nitta, 1967; Brandes and Ziegler, 1993, Shapiro et al., 2009). The horizontal divergence Dand vertical vorticity ζ, respectively reflect the area change and rotation of the air parcel (Lenschow et al., 2007; Beck and Weiss, 2013; Bony and Stevens, 2019). Stretching and shearing deformations, denoted S1 and S2 here, result in elongation parallel to the axis of dilatation and contraction orthogonal to it. Stretching deformation can flatten and lengthen the air parcel, while shearing deformation can twist the air parcel in two perpendicular directions.
Generally, these four different motions above can be represented by pairs of partial derivatives of velocity , , and . The triangle method, as proposed by Bellamy (1949), computes the divergence based on the rate of change in a fluid triangle initially coincident with the network composed by any three points A, B, and C. The triangle-area averaged horizontal divergence D and vertical vorticity ζ can be computed by the triangle method as follows
Here, (xi,yi) () are the location of three vortex points, are the zonal and meridional component of horizontal wind, respectively.
Analogously, the stretching and shearing deformation can be derived using the following equations:
The uncertainties associated with the errors of horizontal wind retrievals, the spatial scales and the shape of triangles in the calculation of RWP-derived parameters have been discussed by Guo et al. (2023). To ensure the stability of results, obtuse angles of more than 140° and areas of less than 500 km2 should be avoided for constructing a reasonable triangle. Here, four triangles from west to east are constructed based on the positions of six RWPs deployed at YQ, XYL, HR, BWO, PG and SDZ to meet the consistency in shape and area. It is noteworthy that the value of four dynamic parameters is still inversely proportional to the area of triangle as the denominator. This coincides with the fact that the gradient of velocity between two points will increase when the distance is shortened. Considering the six RWPs located at different terrain elevations, the horizontal and vertical velocities measured by each RWP are interpolated to the same altitude that starts upwards from 0.51 to 4.95 with a vertical resolution of 120 m.
2.5 Calculation of frontogenesis function
As mentioned above, four air motion types may cause some parts of the air parcel to move away from each other and some parts of the air parcel to move towards each other, resulting in frontolysis and frontogenesis, respectively (Miller, 1948). Previous studies have used the frontogenesis function F to infer the evolution of horizontal temperature gradient (Bluestein, 1986), which contains the following four terms:
where ∇h is the horizontal Hamilton operator, θe is equivalent potential temperature, Q is diabatic heating, w is vertical velocity. The four terms characterize the effects of horizontal divergence, horizontal deformation, diabatic heating and vertical motion on frontogenesis. Frontogenesis occurs if F is larger than zero. Since the variability of vertical velocity along the horizontal direction is quite small, F4 is not included in the calculation (Han et al., 2021). D, S1 and S2 in the preceding subsection from the RWP mesonet are then applied to these equations in order to calculate the vertical profile of F.
Limited by the lack of vertical profiles of thermal parameters in real-time, the gradients of θe are obtained from surface observations from AWSs in Beijing. Indeed, the core drivers of frontogenesis are dynamic processes, while the gradient of θe mainly acts as a scaling coefficient that modulates the efficiency of these dynamic contributions. This simplification of assuming this “efficiency coefficient” remains relatively homogeneous in the lower layer is available to capture regions of dynamically dominated frontogenesis. However, it must be acknowledged that surface observations may not adequately represent baroclinic structures aloft, especially in the presence of temperature inversion or strong vertical shear. Consequently, the diagnostic results are most applicable to near-surface environments and shallow frontogenesis. Future improvements would benefit from incorporating vertically resolved thermal variables obtained from operational high-frequency detection (e.g., microwave radiometers) for a more comprehensive assessment.
2.6 Identification of inverse energy cascade
The direction of the turbulent energy cascade is determined by the sign of the energy flux ε, which is calculated based on the third moment of the velocity difference (Shao et al., 2022):
where r is the distance along any direction, ur is the velocity parallel to r, and the angular bracket denotes the ensemble mean. Based on Taylor's hypothesis (Taylor, 1938; Powell and Elderkin, 1974), the pattern of turbulence can be considered to be “frozen” as it advects past a sensor. This allows the conversion of spatial measurements into temporal observations at a fixed point. When applying Eq. (10) in the zonal direction, it can be rewritten as:
where u(t) is the zonal component of horizontal wind speed derived from the three-dimensional ultrasonic anemometer at any time t, Δt denotes the time interval between two consecutive observations. Positive and negative ε indicate direct and inverse energy cascade (IEC), respectively. IEC is generally identified when ε < −0.002 m2 s−3 to minimize the impact of observational errors on the results (Zhou et al., 2025).
In the afternoon of 30 May 2024, an extreme wind event occurred as a MCS propagated eastward and entered the plain. Figure 2 shows the Himawari-8 10.8 µm brightness temperature, superimposed with mosaic composite radar reflectivity during the different stage. During the evolution of the MCS, a number of high winds (instantaneous 10 m wind speed ≥ 17.2 m s−1) were observed by automatic weather stations in Beijing after 13:30 LST (Fig. 3a). What we focus on is that high winds became more widespread in the western mountainous areas of Beijing from 14:00 to 14:29 LST (Fig. 3b) during the downhill progress of the developing MCS (Fig. 2b–d), with the maximum instantaneous 10 m wind speed of 37.2 m s−1 detected at the Qianling Mountain site. After 14:30 LST, both rainfall and the number of stations recording high winds increased remarkably (Fig. 3c) associated with the merger of two convective segments and formation of the squall line at around 14:36–14:48 LST (Fig. 2e and f). The squall line further consolidated and reached its mature stage after 15:00 LST, defined by the fully coherent, organized linear structure (Fig. 2g and h). The wind gust coincided with the intensification of deep convection with the peak rainfall exceeding 9 mm during 15:00–15:29 LST along the leading line (Fig. 3d), after which the squall line moved eastward away from the major urban area of Beijing.
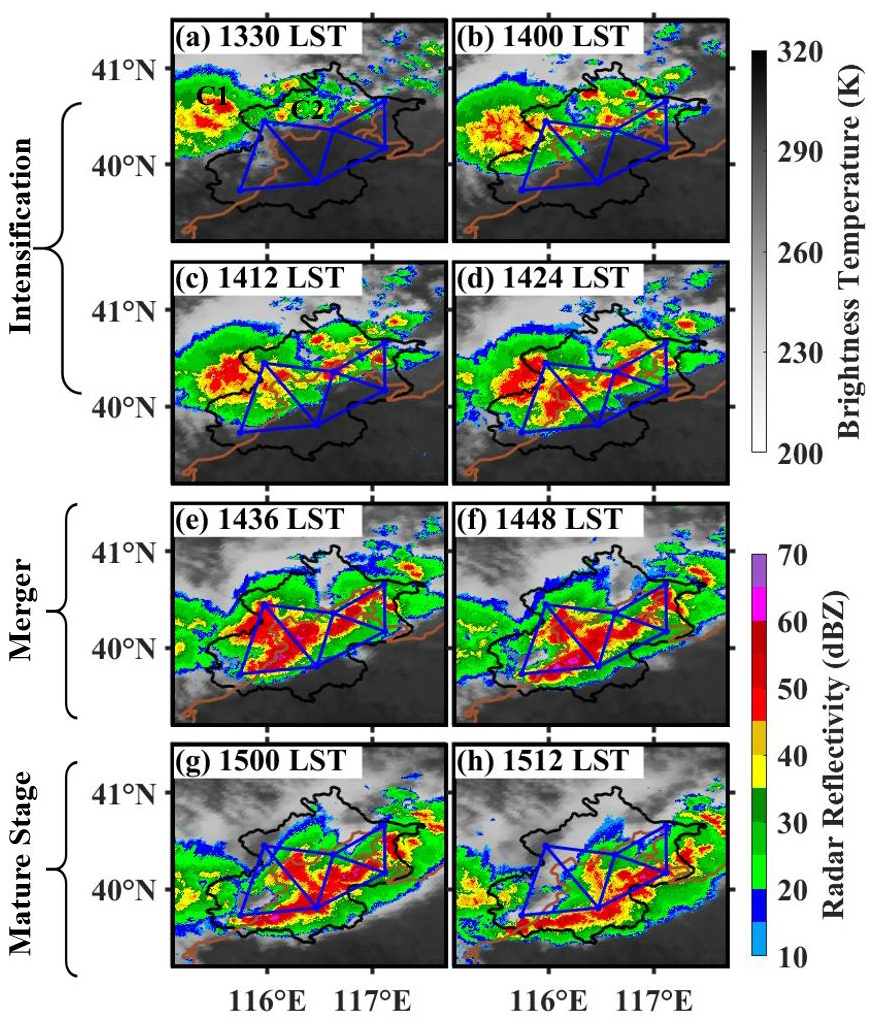
Figure 2Brightness temperature from 10.8 µm channel of Himawari-8 geostationary satellite (gray shadings; K), superimposed with composite radar reflectivity (color-shaded; dBZ) at (a) 13:30, (b) 14:00, (c) 14:12, (d) 14:24, (e) 14:36, (f) 14:48, (g) 15:00, and (h) 15:12 LST on 30 May 2024. The four blue triangles and brown line denote the RWP mesonet and the 200 m terrain elevation line, respectively.
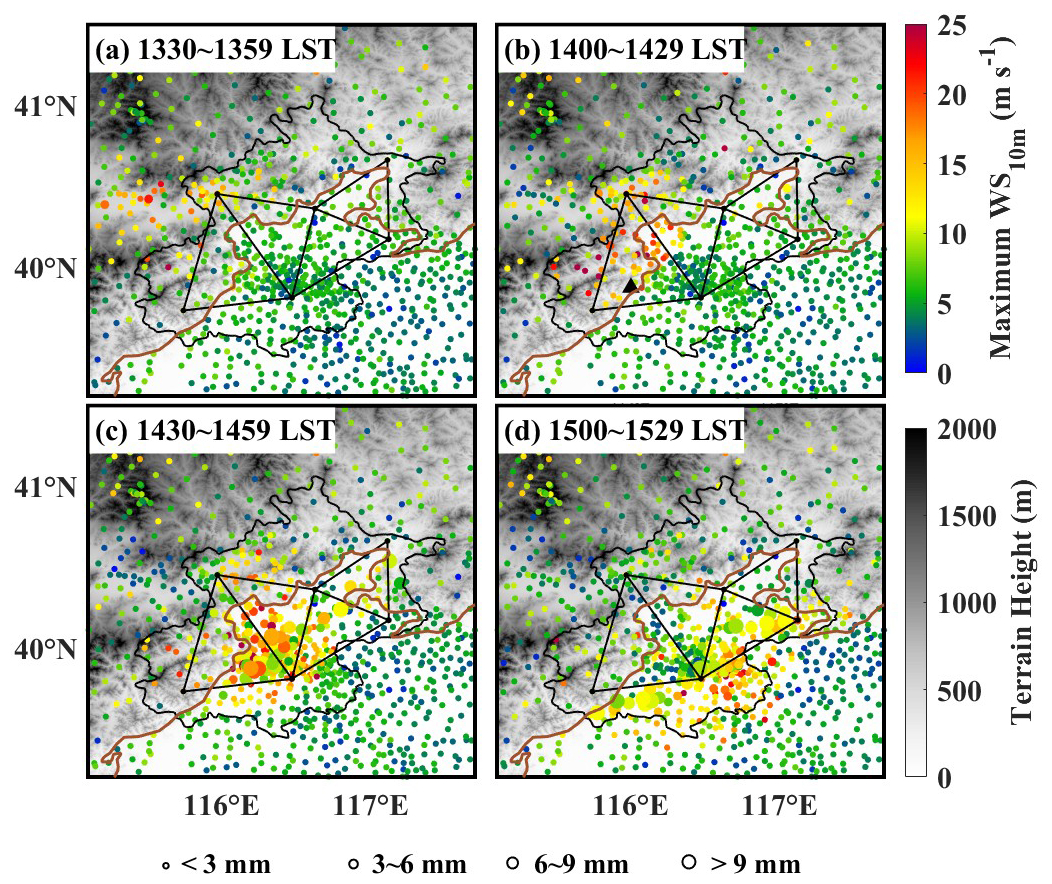
Figure 3Terrain height (gray shadings; m) over Beijing and surrounding areas superimposed with the maximum 10 m wind speed (shading of dots, m s−1) observed during (a) 13:30–13:59 LST, (b) 14:00–14:29 LST, (c) 14:30–14:59 LST, and (d) 15:00–15:29 LST. The size of dots denoted the accumulated rainfall in 30 min. Black small triangle in (b) represents the location of the Qianling Mountain site (39.87° N, 116.07° E).
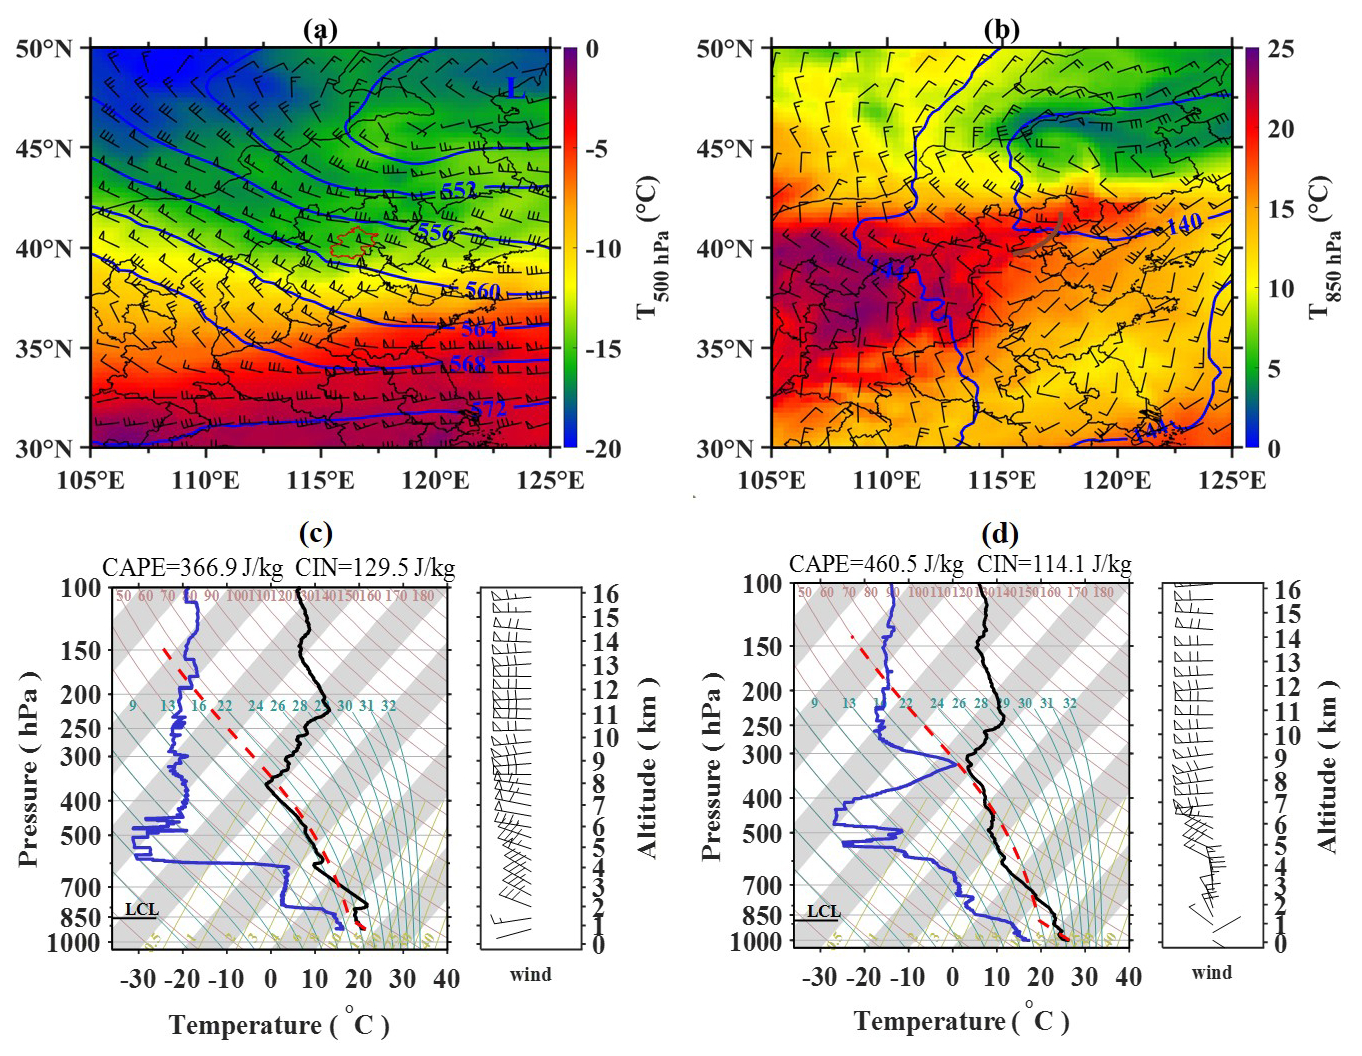
Figure 4Horizontal distribution of temperature (color-shaded; °C), geopotential height (solid blue lines; 10 gpm) and wind barbs (a full barb is 4 m s−1 with a flag denoting 20 m s−1) at (a) 500 hPa and (b) 850 hPa from the ERA5 hourly reanalysis data at 14:00 LST on 30 May 2024. Note that black lines represent provincial administrative boundaries of China. The administrative boundary of Beijing is highlighted as red curve. The letter L denotes the center of a low-pressure system, and the skew T−logP diagrams derived from the upper-air sounding at the ZJK (c) and BWO (d) site at 08:00 LST on 30 May 2024.
3.1 Synoptic background
Figure 4a and b shows the large-scale conditions at 13:00 BJT prior to the extreme wind gust event. Significant cold advection with the northwesterly jet exceeding 20 m s−1 was found over Beijing that was associated with a deep northeast cold vortex at 500 hPa. Meanwhile, Beijing was situated in the warm sector with temperature exceeding 15 °C at 850 hPa (Fig. 4b). The steep midlevel lapse rate of temperature provides a favorable environment for deepening organization of convection and releasing unstable energy. A short-wave trough at 850 hPa, located to the west of Beijing (Fig. 4b), likely contributed to synoptic-scale lifting ahead of the trough axis. The associated ambient wind shear offered a key dynamic ingredient for the subsequent deepening organization of convection.
Unfortunately, no sounding was available to elucidate the temporal evolution of thermal stratification during the gusty wind event. We can only indicate the pre-storm environment by the soundings at 08:00 LST from the radiosonde at the ZJK and BWO sites shown in Fig. 4c and d, respectively. Consistent with the ERA5 reanalysis data, the sounding at the ZJK revealed upstream conditions in which thunderstorms were likely to develop (Fig. 4c). These conditions consist of a strong northwesterly wind oriented perpendicular to the Mt. Taihang range at middle level, accelerating the downhill process of storm (Wilson et al., 2010; Chen et al., 2012; 2014; Li et al., 2017; Xiao et al., 2017; 2019; Guo et al., 2024). The potential for terrain-triggered gravity waves in the leeside that can modulate localized uplift and cloud organization (Neiman et al., 1988; Lombardo and Kumjian, 2022; Rocque and Rasmussen, 2022).
The veering of the northerly wind to a westerly wind from 850 hPa to above 400 hPa also indicated the presence of cold advection at the BWO. The Skew T−logP diagram at the BWO shows moderate convective available potential energy (CAPE) of 460.5 J kg−1 and convective inhibition (CIN) of 114.4 kg−1. A deep dry layer was seen from the surface to about 350 hPa with low-level humidity less than 60 %. This dry column provided a favorable environment for the evaporation of precipitation particles from the moving storm. The evaporative cooling might have enhanced cold downdraft air, potentially contributing to the generation of the wind gust event. After the passage of the MCS, a surface-based temperature inversion layer below 880 hPa with larger CIN was captured by the sounding at 20:00 LST (not shown) as a result of the rapid decrease in surface temperature.
3.2 Evolution of the QLCS
At the same time, the evolution of 30 min perturbations of T2 m (ΔT2 m), superimposed with 30 min perturbations of pressure (ΔP), is displayed in Fig. 5. It is evident from Fig. 2a that relatively dry conditions and few clouds covered much of the plain in the early afternoon of 30 May. Furthermore, the plain was dominated by a surface south-to-southwesterly flow (Fig. 5a). A circular-shaped cloud cluster with more intense convective activity, denoted as C1, propagated eastward and then the front of convection approached the western section of the RWP mesonet until 14:00 LST (Fig. 2b). One can see rising pressure at the rate of more than 4 hPa in 30 min with a strengthening cold pool at the center with a cooling rate of more than 10 °C per 30 min−1 associated with the main area of the MCS (Fig. 5b). The dry subcloud air (Fig. 4c and d) was one of the factors that facilitated cold pool consolidation and rapid organization of convection.
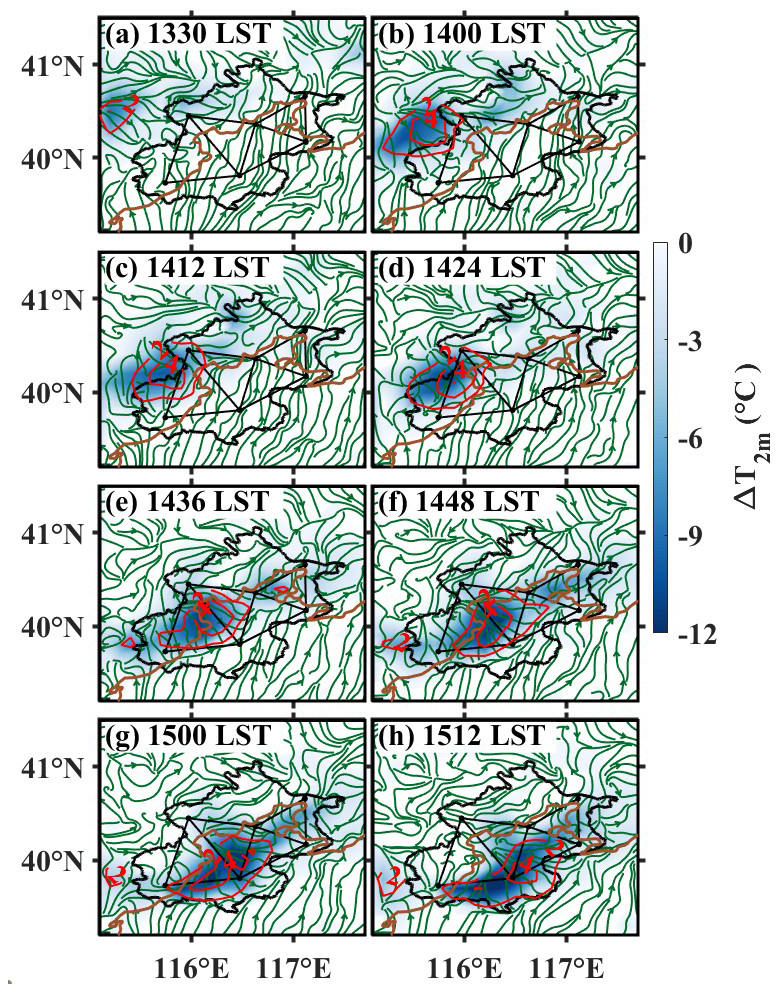
Figure 5Evolution of T2 m change (color-shaded; °C) and pressure change (solid red lines at 2 hPa intervals) in 30 min, superimposed with 10 m streamlines derived from AWSs from (a) 13:00 to (h) 15:12 LST on 30 May 2024.
It's clearly shown in Figs. 2c and 5c that stronger thunderstorms persisted at 14:12 LST with convectively generated cold air. Of particular relevance to this study is the emergence of a convective line near 39.7° N, 115.6° E at the leading edge of the cold outflows (Fig. 5c). This convective line formed from the low-level convergence as the north-to-northeasterly cold outflows met westerly winds to the south, which appeared to help initiate convection cells to the west of the plain line. Shortly after, explosive convection emerged (Fig. 2d) along the convective line (Fig. 5d) as the outflow boundary entered the plain at 14:24 LST, indicating the potential for heavy precipitation aloft. However, it is noteworthy that only light precipitation appeared to reach the ground prior to 14:30 LST with rainfall rate less than 3 mm per 30 min−1 (Fig. 3b). The weak measured rainfall was consistent with low reflectivity at the elevation angle of 0.5° from the S-band Doppler weather radar at BWO (not shown). This further confirmed that a pronounced dry layer in the low level caused significant sublimation, melting, and evaporation of precipitation particles. The evaporative cooling effect of precipitation particles likely fostered the development of evaporatively cooled air that expanded rapidly over the western mountain region, as mentioned before.
Furthermore, the distinct local wind maximum was attributed partly to the venturi effect by canyon in accelerating the instantaneous wind speed. Many long and narrow valleys exist at the junction of the southern foothill of Mt. Yan and the eastern foothill of Mt. Taihang, which can be seen in Fig. 1. Northwest cold air rapidly accelerated and swept across downstream areas after being funneled through canyons and mountain passes (Smith, 1979; Grubišić et al., 2008). It is well known that Santa Ana winds with gusts exceeding 100 km h−1 is closely connected with the channels over the Sierra Nevada and Transverse Ranges (Guzman-Morales et al., 2016; Prein et al., 2022), destroy crops and greatly create the spread of wildfires for centuries (Kelley et al., 2025). In addition, lower surface roughness in the mountainous areas also results in higher 10 m wind speeds (Barthelmie, 2001; Luu et al., 2023), especially when the dry environment is unfavorable for vegetation growth, while urban buildings increase frictional drag and surface roughness length z0 values over a city (Oke, 1987).
At 13:30 LST, a leading stratiform region consisting of several dispersed convective cells, denoted as C2, was located to the north of the mesonet (cf. Fig. 2a). The convection cell near HR maintained and developed rapidly in coverage and intensity from 14:00 to 14:24 LST (Fig. 2b and d) due to the persistent convergence of low-level southerly flows at the foot of Mt. Yan (cf., Fig. 5b–d). This coincided with a surface cold pool with T2 m drops as large as 6 °C in 30 min. After 14:36 LST, it gradually merged with the southern convective segment as mentioned above and strengthened to an intense and well-organized squall line that had a nearly contiguous reflectivity region of 35 dBZ at least 150 km in length (Fig. 2e and f). The southern convective line significantly extended after intersecting with the preexisting convergence zone at the foothills of Mt. Yan (Fig. 5e and f). Apparently, the appearance of secondary maximum 10 m wind speed area in Fig. 3c coincided with the intensification of the gust front, as evidenced by its increased width and echo intensity. The continuous increasing of rainfall (cf. Fig. 3c) in triangle 1 and 2 resulted in a distinct cold center at the cooling rate of more than 12 °C.
The squall line subsequently developed a larger-scale bow echo (Fujita 1978) and accelerated to the east-southeast as the system became oriented more perpendicular to the mean northwest wind in the middle troposphere (Fig. 2g and h). The QLCS subsequently moved eastward with the leading convective line and a trailing stratiform region during the mature stage (Fig. 2g and h), which are similar to the asymmetric archetype of a squall line found by Johnson and Hamilton (1988) and Zhang and Ghao (1989). The midlevel rear-inflow jet (RIJ) that feeds into the stratiform region of QLCSs plays an important role in producing the high winds at the surface (Weisman and Davis, 1998; Xu et al.,2024), which has also occurred in the present case, as shown in the next subsection.
4.1 Horizontal divergence and vertical vorticity analyses
In the preceding section, the synoptic-scale weather system was shown to be favorable for stronger convection with evidently identifiable boundaries of the 30 May 2024. Here, the localized environmental conditions are analyzed for forcing mechanisms supporting the advancing regeneration of convection along the leading line and associated winds. To gain insight into the fine-scale structures of this extreme wind gust event, we calculated the height-time cross sections of horizontal winds and vertical motion from the RWPs during 13:00–15:30 LST on 30 May 2024. Figure 6 presents the vertical distribution of vertical vorticity (ζ) and horizontal divergence (D) within triangular regions calculated from Eqs. (1) and (2), together with the evolution of the 95th percentile of the 10 m wind speed. The 95th percentile was selected rather than the maximum value to provide a more robust representation of the overall distribution.
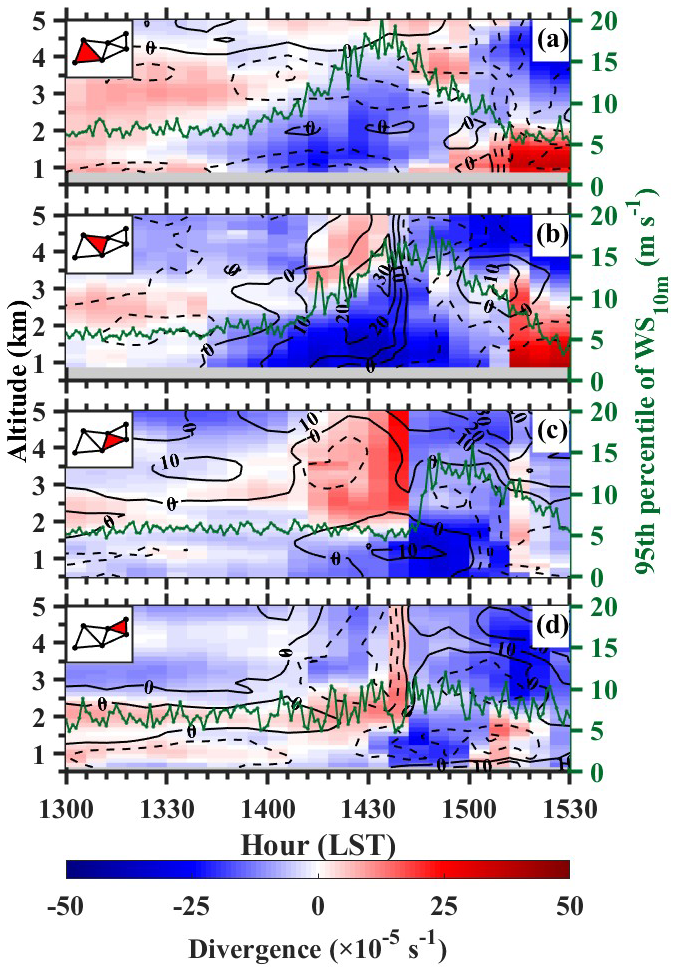
Figure 6The vertical profiles of horizontal divergence (D, color shaded; s−1) and vertical vorticity (ζ, dashed/solid contours for negative/positive values; s−1) in (a) triangle 1, (b) triangle 2, (c) triangle 3, (d) triangle 4 derived from the RWP mesonet (see their locations as the red patches on the small maps in the upper left corners) from 13:00 to 15:30 LST on 30 May 2024. Green dotted lines show the 95th percentile of 10 m wind speed for all stations in the triangle area at 1 min intervals.
Before the MCS reached Beijing, sustained low-level south-to-southwesterly wind was observed in the lowest 1.5 km layer in the early afternoon of 30 May 2024 from seven RWP stations (not shown), accompanied by weak near-surface convergence in the main plain area (Fig. 6b–d). Especially, more noticeable convergence in the lower to mid-troposphere was detected locally over triangle 3 after 13:00 LST (Fig. 6c) by the uplifting along the foothills of Mt. Yan. Divergence below 4 in triangle 1 could to a certain extent be influenced by the valley flows at the foot of the Taihang mountains (Fig. 6a). As the main convective element C1 propagated eastward, an evident increase was observed in horizontal convergence in the lowest 2 layer along the leading line of the strengthening cold pool after 13:42 LST (Fig. 6a and b). The convergence and associated updraft increased in amplitude and deepened rapidly, which resulted in the generation of clouds and convective cells along the downshear side of the cold pool that expanded south and east after 14:00 LST (cf. Fig. 2b–d). The presence of divergence aloft above near-surface convergence layer confirmed the development of this deep, organized convection that played an important role of generating the potential precipitation. It created favorable conditions for the evaporative cooling to accelerate the enhancement of the cool pool. The intense cold pool, in turn, was the primary driver for high winds through the downward momentum transport and pressure gradient forcing (Houze, 2014; Haerter et al., 2019; Hadavi and Romanic, 2024), which will be further examined in Sect. 4.2.
Of importance to note is the rapid growth of surface-based positive vorticity over triangle 2 coupled with intense convergence across the gust-frontal zone during the passage of the main convective element. A deep layer of cyclonic vorticity was detected in the lower half of the troposphere over triangle 2 with the maximum value of −2.8 × 10⁻⁴ s−1 centering near 3 at 14:36 LST. The strongest surface wind speed at the 95th percentile appeared nearly in phase after the peak of cyclonic vorticity, as also shown in Fig. 6b. These structures are similar to those shown by Zhang (1992), suggesting that the moderate positive ζ was generated through upward vortex stretching ahead of convection, whereas the large negative ζ, likely located behind, resulted from the downward stretching of moderate negative (absolute) ζ. Weisman and Trapp (2003) found that mesoscale vortices may be responsible for the production of damaging straight-line winds by notably modifying the local outflow and determining the location of the wind speed maximum.
The northeastern dispersed convective cores with radar reflectivity more than 35 dBZ were completely separated from the major convective segment to the south and remained closely related to the convergence of southwesterly flows over triangle 3 (Fig. 5c), like the counterpart of surface streamline shown in Fig. 2 The surface-based convergence strengthened over triangle 3 and 4 after 14:00 LST, with divergence above (Fig. 6c and d) in the absence of significant local evaporative cooling. After merging with the main area convection which moved across the plain line in the urban region after 14:36 LST, a deep layer of convergence and intense upward motion above 5 over triangle 3 and 4 tended to enhance the squall line (Fig. 6c and d), leading to heavy rainfall (Fig. 3c). We may speculate that the low-level cyclonic vorticity of 1.8 × 10⁻⁴ s−1 (i.e., centered at 1 km altitude) after 14:36 LST coincided with the development of the area-averaged convergence during the periods, similar to that captured by triangles 2. Moreover, the intersection of two segments formed a pivot point in triangle 3 (Fig. 2f) for the change in line orientation and marked the area of mesovortices under study. Both the area and intensity of the observed high winds increased remarkably during this hour (Fig. 6c), with the most severe winds over 30 m s−1 and significant property damage occurring in the merger region (Fig. 3c). The development of a large, intense MCS resulted from a complex series of processes and mergers of several convective lines and clusters over a relatively short time period, which is also common for warm season MCSs (French and Parker, 2012).
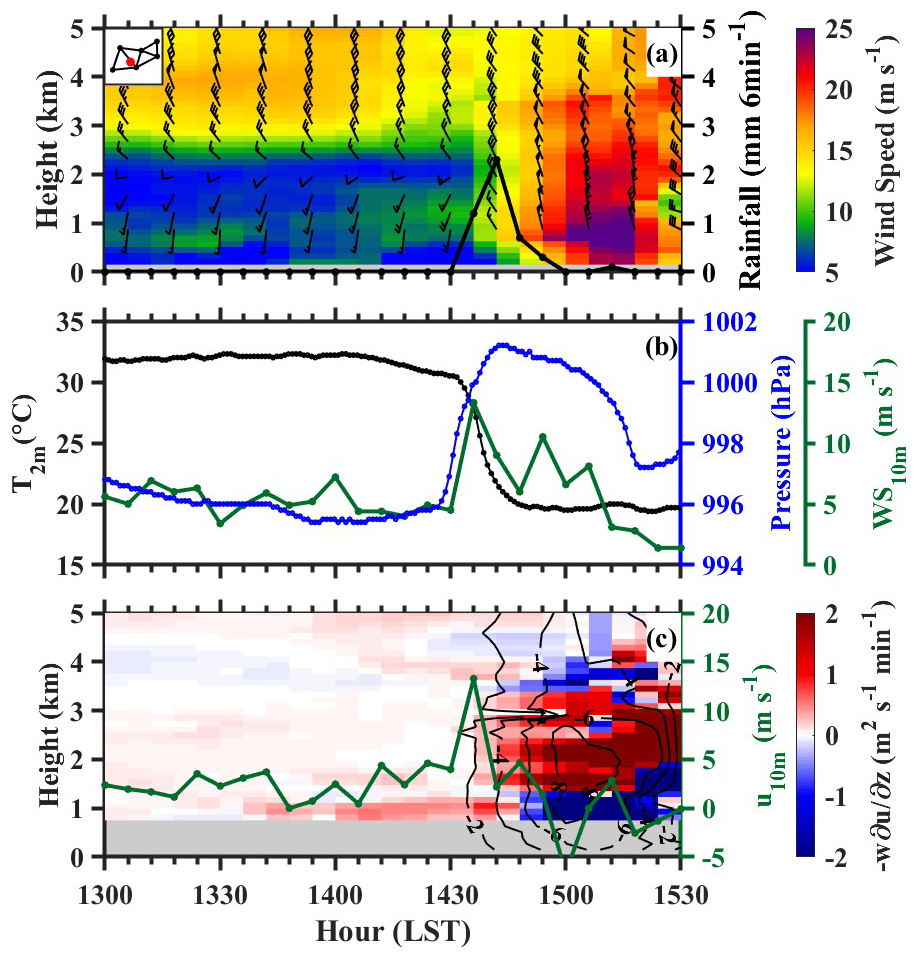
Figure 7(a) Vertical profiles of horizontal wind barbs between 0 and 5 km height, superimposed with horizontal wind speed (shadings; m s−1) at HD (see its location as red dots on the small maps in the upper-left corners) during the period of 13:00–15:30 LST on 30 May 2024. The black solid line shows 6 min accumulated precipitation (mm 6 min−1). (b) Time series of 2 m temperature (°C) in black, instantaneous 10 m wind speed (m s−1) in green, and pressure (hPa) in blue at HD; (c) Vertical advection of u component of horizontal wind, (shading, ) superimposed with vertical velocity (contours, m s−1) at HD. The green solid line shows u component of instantaneous 10 m wind (m s−1).
Note a deep layer of strengthening cyclonic vorticity above 4 dominated triangle 3 and 4 after the merger (Fig. 6c and d) and gradually extended downward to the altitude of 3 km with the center value exceeding 2.8 × 10⁻⁴ s−1. It suggested that the midlevel rotation of the frontal vortex played an important role in enhancing the elevated RIJ, similar to the enhancement of near-surface high winds by the low-level rotation. The strongest winds tended to occur on the southwestern side of the mesoscale vortices where the ambient translational northwesterly flow and the mesoscale vortices' rotational flow were in the same direction (e.g., Wakimoto et al., 2006; Xu et al., 2015b). The intensification of the RIJ were possibly attributed to the locally enhanced cold pool with the increased rainfall in the merger area (cf. Fig. 3).
Simultaneously, the lower-tropospheric convergence in triangle 1 and 2 started showing a decreasing trend, followed by large negative ζ in descending rear inflows. In addition, the surface wind speed diminished dramatically with significant divergence in the lowest 2 km layer shortly (i.e., between 15:00 and 15:30 LST) after the passage of the gust front. The changeover to divergence was likely driven by evaporative cooling of raindrops, as evidenced by the emergence of outflows behind the leading convective line, which could also to a certain extent be influenced by downslope flows over the western mountains. One may note the presence of elevated, much weaker convergence centered at 3 km. This could be attributed to the approach of trailing stratiform precipitation, as indicated by Houze et al. (1989) and Zhang and Gao (1989) in their respective observational and modeling studies of squall lines.
4.2 Vertical momentum transport
Apparently, the passage of the wind gust resulted in significant alterations to the vertical profiles and intensity of the above fields. Specifically, weaker southwest-to-westerly flows with wind speed less than 8 m s−1 up to 1.5 were detected by the RWP at HD prior to the arrival of the gust front (Fig. 7a) from the height-time cross section of horizontal winds. Meanwhile, the northwesterly jet exceeding 15 m s−1 controlled the higher altitude above 3 . Evidently, such an intense gust front was related to the critical influence that substantial vertical wind shear exerts on convection. Then, sharp wind directional shifts to northwesterly happened with increasing 10 m wind speeds from less than 5 m s−1 to more than 10 m s−1 in the lowest 1 km layer at 14:36 LST. The intense northwest-to-northerly winds with strong descending motion coincided with the occurrences of light rainfall with the total accumulation of about 5 mm (Fig. 7a), pronounced surface temperature drops and pressure rising (Fig. 7b). The effect of light precipitation on the radar measurement was neglected because the fluctuating component of the horizontal velocity was much larger in magnitude. The precipitation was just concentrated near 14:42 LST and decreased rapidly to less than 1 mm per 6 min shortly thereafter. Given that the weak precipitation ended by 15:00 LST, the vertical velocity associated with the squall line (i.e., −8 m s−1 shown in Fig. 7c) represented the intensity of evaporatively induced downdrafts rather than the falling speed of the raindrops.
Previous studies have used the horizontal momentum budget equation to diagnose the contribution of each term in momentum transport within MCSs, mostly in modeling studies (Mahoney et al., 2009; Mahoney and Lackmann, 2011). To investigate the roles of internal circulations of the MCS in producing the present wind gust event, the vertical momentum transport of zonal wind, was estimated. Figure 8c shows enhanced near-surface positive tendencies of the vertical advection at HD below 1 ahead the gust front. In response to the forcing of the QLCS, the elevated RIJ occurring in the western portion of the mesovortex after 14:36 LST corresponded well to the vertical structure observed by the RWP mesonet in Sect. 4.1. The RIJ was also amplified by developing downdrafts behind the gust front with the maximum value more than −8 m s−1 near 15:00 LST. The accelerated downward transport of high momentum associated with the RIJ produced intensified high winds of over 25 m s−1 below 1 (Fig. 7a) at 15:12 LST. Thus, we may state that the above evidence is further indicative of the important roles of downward momentum transport with the descending rear inflows in generating the damaging wind event under study.
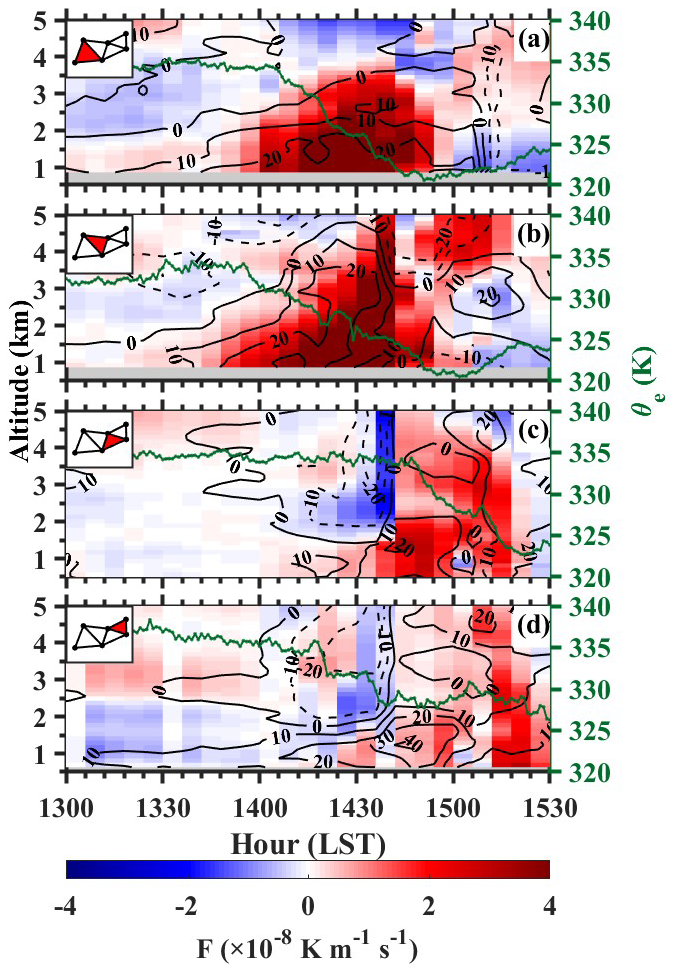
Figure 8Same as Figure 6, except for frontogenesis function (F, color shaded; ) and shearing deformation (S; contours, s−1). Green dotted lines show the area-averaged equivalent potential temperature θe (K) for all stations in the triangle area at 5 min intervals.
4.3 Deformation and frontogenesis analysis
To the forecaster, the most significant aspects of a frontal zone are the cloudiness and convection that are usually associated with it. Horizontal convergence and deformation fields are two key mechanisms that drive frontogenesis by concentrating temperature gradients and enhancing frontal sharpness. Figure 8a shows the evolution of the frontogenesis function and shearing deformation as described in Sect. 2.4 and appeared to depict this frontogenesis event in the low-level layer. Both stretching and shearing deformation cause some parts of the air parcel moving towards each other and result in weather fronts. Shearing deformation was positive associated with the air parcel stretching in the southwest/northeast direction and contracting in the southeast/northwest direction. Convection developed along this feature as it moved north and east. Likely aiding the convective development was the strong horizontal convergence and low-level deformation frontogenesis. This conclusion is supported by the fact that the squall line aligned with the long axis of the frontogenesis (Fig. 2e–h).
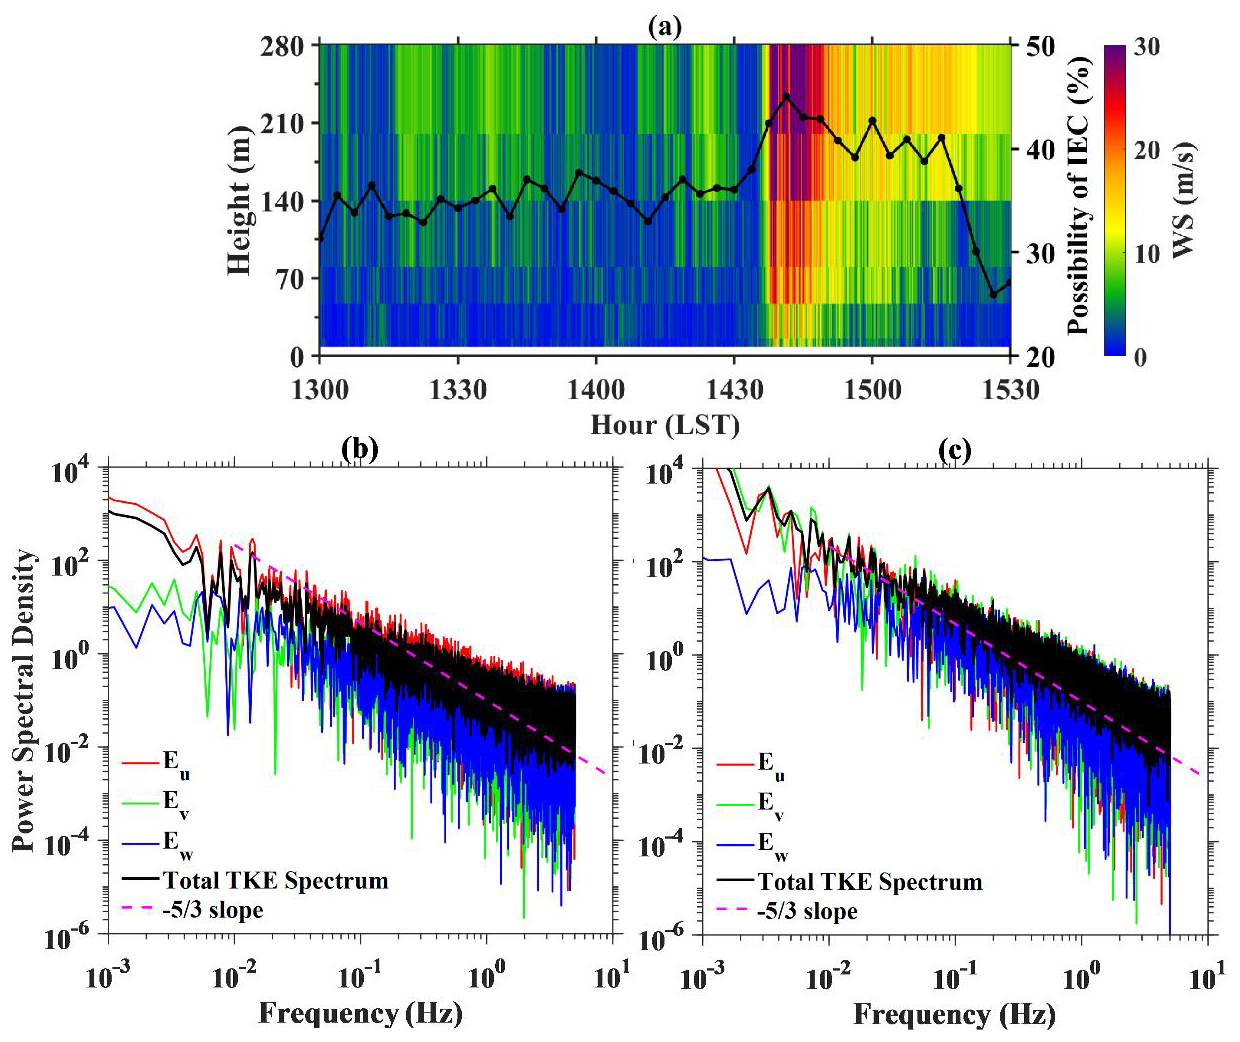
Figure 9(a) Vertical profiles of horizontal wind speed (shadings; m s−1) at the height of 8, 15, 47, 80, 140, 200 and 280 m during the period of 13:00–15:30 LST on 30 May 2024, which is directly measured from the meteorological tower (see its location in Figure 1) built and operated by the Institute of Atmospheric Physics, Chinese Academy Sciences. The black solid line shows the possibility of inverse energy cascades (IEC) at all heights. Energy spectra at the height of 280 m for components in different directions (u, v, w) during (b) 14:06–14:36 LST and (c) 14:36–15:06 LST, respectively. Dashed magenta line represents the theoretical Kolmogorov's inertial range slope in frequency domain.
Triangle 1 and 2 experienced weak frontogeneses in the lowest 1.5 km layer before the arrival of the southeast segment (cf. Fig. 8a and b). As the horizontal convergence increased, frontogenesis was strengthened after 13:30 LST up to the middle altitude of 3 km with a peak value of 4.8 × 10⁻⁸ near 1.5 at 14:24 LST over triangle 1. The convergence contributed to the compression of the temperature gradient and promoted the strong concentrated sloping updraft occurring on the warm side of the region of maximum geostrophic compression of the isotherms. This mesoscale circulation closely resembles the flow in a mesoscale precipitation band analyzed by Emanuel (1985), Bosart and Sanders (1981). Cold outflows associated with evaporatively driven moist downdrafts were evident, with the continuous cooling rate of about 15 K h−1 by 15:00 LST in triangle 1 and 2 (Fig. 8a and b). By contrast, a sharp drop of area-averaged θe in triangle 3 was generated by significant rainfall which took place in the merger stage (Fig. 8c). The warming pattern was observed in triangle 2 with rising θe, which was possibly attributed to the dry subsidence warming associated with the descending RIJ at the back edge of the precipitation region.
4.4 Turbulent kinetic energy transfer
As the well-sustained mesoscale convection created a favorable dynamic environment for the evolution of small-scale turbulent processes, the interaction between the organized squall system (and its embedded mesovortex and rear-inflow jet) and the ambient flow laid the foundation for the subsequent intensification of turbulent energy transfer, which is essential for the evolution of severe convective gust and related convective activities (Adler and Kalthoff, 2014; Dai et al., 2014; Dodson and Griswold, 2021; Su et al., 2023). Understanding mechanisms of the turbulent kinetic energy (TKE) transferring in the PBL between the surface and atmosphere is crucial for turbulence parameterization in numerical models, especially for extreme wind events (Powell et al., 2003; Monahan et al., 2015; Lyu et al., 2023).
In contrast to the Monin-Obukhov similarity theory that TKE transfers from larger to smaller eddies until it is dissipated at the smallest scales (Kolmogorov, 1941; Monin and Obukhov, 1954), many studies discovered the phenomenon of inverse energy cascades (IEC) in a totally different way (Kraichnan, 1967; Byrne and Zhang, 2013; Tang et al., 2015). Despite these advances in theoretical and numerical studies, observational support for IEC in the atmosphere remains insufficient (Shao et al., 2023a, b). This study further examined the direction of the energy cascade associated with wind gusts using three-dimensional ultrasonic anemometers at seven heights, denoted as z1 to z7, on the meteorological tower in Beijing. According to Eq. (11), we can detect the occurrence of IEC at each height in every moment with a time resolution of 0.1 s.
The frequency of IEC during a period was evaluated as the ratio of the number of time-height grids identified as IEC to the total number of samples. In this way, we got height-resolved occurrence frequency of IEC for the study period in Fig. 9a. It is shown that IEC is a more prevalent phenomenon within the near-surface wind field. Notably, the frequency and intensity of IEC at all heights increased significantly when near-surface wind speeds exceeded 10 m s−1. The frequency of IEC reaches up to 45 % after 14:36 LST, indicating that strong winds are contributed to IEC. The result in Fig. 9b and c revealed that the power spectral density (PSD) was higher after 14:36 LST in the lower-frequency area, especially for the u and v directions, which confirmed the activity of turbulent kinetic energy from smaller to larger eddies.
The observed surge in the frequency of IEC during the passage of convective outbreak suggests a temporary reorganization of turbulent energy transferring. These features are similar to those proposed by the observational analyses in two-dimensional turbulence (Shao et al., 2022; Zhou et al., 2025), which revealed that the formation of rapid rotation is a crucial driver of IEC (Marino et al., 2015). Strong horizontal shear generated by the gust front likely imposes a quasi-two-dimensional constraint on the flow, suppressing the three-dimensional vortex-stretching mechanism that normally drives a forward cascade. In this regime, enstrophy (the square of vorticity) may become partially conserved. Just as vigorously stirring the water in a very shallow pond causes small swirls to merge into a single, large vortex, a massive storm can be seen as the end product of an inverse cascade, where energy from small-scale convection organizes into a giant, coherent vortex. Another possible explanation is that the rapid increase in wind speed abruptly shifts the Reynolds number, possibly triggering transient instabilities that further promoted the generation of quasi-two-dimensional vortex (Browand and Winant, 1973). The amplification of large-scale eddies transfer momentum downstream more efficiently and enhance wind gusts as a form of positive feedback. In addition, the reduction of surface drag coefficient under robust weather systems impedes the dissipation of energy throughout the boundary layer, prolonging the duration of high winds (Raupach, 1994; Mahrt et al., 2003; Powell et al., 2003).
This event illustrates how synoptic-scale disturbances can locally override the classical theory of energy dissipation, leading to a measurable, height-dependent signature of IEC in the PBL. In turn, this shear-driven IEC likely played a catalytic role in consolidating the storm's low-level circulation, demonstrating how microscale turbulent processes can feedback on the mesoscale storm organization. These findings provided favorable evidence for the unique features of 2D turbulence in high wind conditions. These findings have implications for turbulence parameterizations in numerical weather prediction and climate models. Future research should further investigate the mechanisms driving the formation of IEC in more detail and explore the potential link between IEC and different meteorological phenomena.
The complex evolution of convective systems crossing mountainous terrain, and associated damaging surface winds, represent a substantial forecasting challenge. In this study, a convectively generated gust wind event by a QLCS that occurred in Beijing during the early afternoon of 30 May 2024 is examined. Beijing's intricate topography introduces inherent complexity to convective organization during the downhill thunderstorm propagation, facilitating the development of extreme wind gusts. To document the complexity of the convective event's development and evolution, the dynamical characteristics of multiscale processes are explored by utilizing a high-resolution mesonet comprising seven RWPs, a meteorological tower, automated surface stations, radar and satellite data. A conceptual model illustrating the observed dynamical structures and multi-scale processes responsible for this Beijing extreme gust event is presented in Fig. 10.
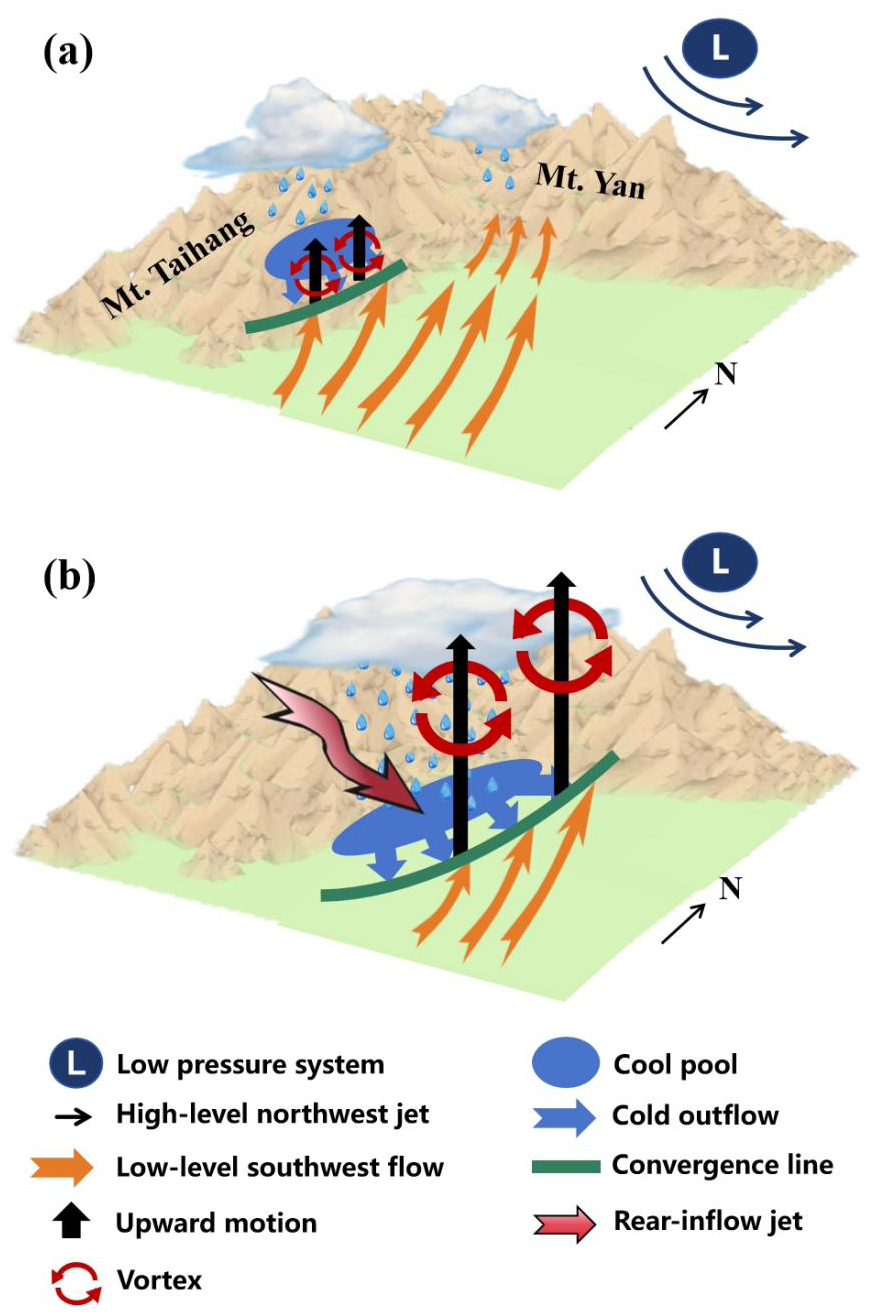
Figure 10Conceptual model for the generation and evolution of near-surface high winds (a) before and (b) after merger of the quasi-linear convective system (QLCS) for the extreme wind event in Beijing occurring 30 May 2024.
Before the merger of the QLCS (Fig. 10a), the northern convection portion maintained and developed rapidly due to the convergence of southerly winds along the southern slopes of Mt. Yan. Meanwhile, a convergence line formed at the boundary of convectively generated cold outflows, mostly associated with the southern portion. During the downhill process, the environmental southerly winds in the near-surface layer facilitated efficient storm-relative inflow of highly unstable air, supporting the continued regeneration of strong convection along the advancing cold pool, where a very large area of nearly contiguous radar reflectivity echoes greater than 45 dBZ was concentrated over the foot of western mountains. The presence of pronounced convergence from the PBL in updrafts led to the rapid intensification of surface-based cyclonic vorticity through vertical stretching during the early stages. Evaporative cooling enhanced the generation of the extreme winds via downward momentum transport and pressure gradient forcing. As shown in Fig. 10b, the two convective segments merged into a well-organized squall system, moving perpendicular to the mean deep-layer wind/shear and developing a larger-scale bow-echo structure after reaching the plain. In the merger stage, a midlevel layer of intense cyclonic vorticity favored the development of RIJ behind the precipitation area, driven by the superposition of ambient flow and the rotational flow on the west side of the mesovortex. The calculation of the zonal momentum budget further confirmed the importance of horizontal momentum downward transport in accelerating lower-level flows within the descending RIJ.
Large-scale analyses show that the deep, well-mixed PBL with very steep lower-tropospheric lapse rates and conditional instability provided a favorable background for consolidating the dispersed multicell thunderstorm. The emergence of pronounced low-level frontogenesis, coupled with significant shearing deformation, created a highly favorable synoptic-scale environment for sustained convection. These processes supplied persistent forcing for ascent and low-level convergence, continuously transporting moisture and instability to promote the organization and maintenance of the circulation. By further examining the property of turbulent kinetic energy transfer derived from three-dimensional ultrasonic anemometers on the meteorological tower, we found that the frequency and intensity of inverse energy cascades increased significantly during this near-surface high wind event. These findings bridge the gap between meso- and small-scale physical processes in the lower troposphere and large-scale weather system, which potentially consolidate our understanding of the dynamics and their roles in the evolution of convection.
Based on the above results, this case shares commonality with other QLCS cases in previous studies while exhibiting terrain-modulated uniqueness. Similar to QLCS events documented over plains (e.g., the US Central Plains), the storm exhibited a well-defined cold pool, a descending RIJ, and strong low-level convergence leading to bow-echo development (Bentley and Mote, 1998; Bentley and Sparks, 2003; Wakimoto et al., 2006; Evans et al., 2014). However, its evolution was markedly influenced by complex topography (Houze, 2012). The initial convection was anchored and intensified by orographic lifting along the southern slopes of Mt. Yan, and the downhill propagation of the system resulted in an unusually concentrated zone of high reflectivity near the foot of Mt. Taihang. These findings underscore that while the overall dynamical framework of QLCS remains consistent, local topography can fundamentally alter the initiation, sustenance, and peak intensity of severe winds by modifying convergence patterns, cold-pool propagation, and vortex dynamics. Future nowcasting and high-resolution modeling for complex terrain regions should therefore explicitly incorporate such terrain–convection interactions.
The novelty of this study lies in the utilization of high-resolution vertical observation derived from a rarely fine mesonet. These high-density multi-source observations enables us to explore the multiscale processes governing the generation of extreme gusty wind events. The mechanisms of convective evolution and its interactions with complex terrain in different stages have been elaborated, facilitating the characterization of such extreme wind events. More importantly, these findings underscore the value of RWP mesonet observations for advancing our understanding of extreme wind events and improving future nowcasting and prediction efforts. However, it should be mentioned that the RWPs have limited capability in detecting near-surface wind fields and thermal parameters. Applying wind lidars and microwave radiometers would help fill these observational gaps and explore thermodynamic drivers of extreme winds.
We are grateful to ECMWF for providing ERA5 hourly data by Copernicus Climate Change Service (C3S) Climate Data Store (CDS), which are available at https://doi.org/10.24381/cds.bd0915c6 (Hersbach et al., 2023). The meteorological measurements of automatic weather stations are obtained from the National Meteorological Information Center of China Meteorological Administration (https://data.cma.cn, last access: 6 June 2024) via registration.
JG designed the research framework and conceptualized this study; XG and JG conducted the experiment and drafted the initial manuscript; YS and FH helped the data collection from the meteorological tower and carried out data quality control; NL, ZZ, PY, SJ, LZ and TC participated in result interpretation and discussions. All authors contributed to the revision of the manuscript.
The contact author has declared that none of the authors has any competing interests.
Publisher's note: Copernicus Publications remains neutral with regard to jurisdictional claims made in the text, published maps, institutional affiliations, or any other geographical representation in this paper. The authors bear the ultimate responsibility for providing appropriate place names. Views expressed in the text are those of the authors and do not necessarily reflect the views of the publisher.
We appreciate tremendously the insightful comments and suggestions provided by the editor and two anonymous reviewers that significantly improved this manuscript.
This manuscript was supported by the National Natural Science Foundation of China under grant 42325501 and 42505015, Key Laboratory of South China Sea Meteorological Disaster Prevention and Mitigation of Hainan Province under grant SCSF202409, and the National Key Research and Development Program by the Ministry of Science and Technology in China under grant 2024YFC3013001 and Chinese Academy of Meteorological Sciences under grant 2023KJ032.
This paper was edited by Geraint Vaughan and reviewed by two anonymous referees.
Abulikemu, A., Wang, Y., Gao, R., Wang, Y., and Xu, X.: A numerical study of convection initiation associated with a gust front in Bohai Bay Region, North China, Journal of Geophysical Research: Atmospheres, 124, 13843–13860, https://doi.org/10.1029/2019JD030883, 2019.
Adams-Selin, R. D., van den Heever, S. C., and Johnson, R. H.: Impact of Graupel parameterization schemes on idealized bow echo simulations, Monthly Weather Review, 141, 1241–1262, https://doi.org/10.1175/MWR-D-12-00064.1, 2013.
Adler, B. and Kalthoff, N.: Multi-scale transport processes observed in the boundary layer over a mountainous island, Bound.-Lay. Meteorol., 153, 515–537, https://doi.org/10.1007/s10546-014-9957-8, 2014.
Atkins, N. T. and Laurent, M. St.: Bow echo mesovortices. Part I: Processes that influence their damaging potential, Monthly Weather Review, 137, 1497–1513, https://doi.org/10.1175/2008MWR2649.1, 2009.
Atkins, N. T., Bouchard, C. S., Przybylinski, R. W., Trapp, R. J., and Schmocker, G.: Damaging surface wind mechanisms within the 10 June 2003 Saint Louis bow echo during BAMEX, Monthly Weather Review, 133, 2275–2296, https://doi.org/10.1175/MWR2973.1, 2005).
Azorin-Molina, C., Guijarro, J.-A., Mcvicar, T. R., Vicente-Serrano, S. M., Chen, D., Jerez, S., and Espírito-Santo, F.: Trends of daily peak wind gusts in Spain and Portugal, 1961–2014, Journal of Geophysical Research: Atmospheres, 121, 1059–1078, https://doi.org/10.1002/2015JD024485, 2016.
Barthelmie, R. J.: Evaluating the impact of wind induced roughness change and tidal range on extrapolation of offshore vertical wind speed profiles, Wind Energ., 4: 99-105, https://doi.org/10.1002/we.45, 2001.
Beck, J. and Weiss, C.: An Assessment of Low-Level Baroclinity and Vorticity within a Simulated Supercell, Monthly Weather Review, 141, 649–669, https://doi.org/10.1175/MWR-D-11-00115.1, 2013.
Bélair, F., Dyer-Hawes, Q., and Romanic, D.: The Dynamics of the Urban Boundary Layer Before and During a Severe Thunderstorm Outflow Over Downtown Montreal, Bound.-Lay. Meteorol., 191, 6, https://doi.org/10.1007/s10546-024-00896-4, 2025.
Bellamy, J. C.: Objective calculations of divergence, vertical velocity and vorticity, Bulletin of the American Meteorological Society, 30, 45–49, https://doi.org/10.1175/1520-0477-30.2.45, 1949.
Bentley, M. L. and Mote, T. L.: A Climatology of Derecho-Producing Mesoscale Convective Systems in the Central and Eastern United States, 1986–95. Part I: Temporal and Spatial Distribution, Bulletin of the American Meteorological Society, 79, 2527–2540, https://doi.org/10.1175/1520-0477(1998)079<2527:ACODPM>2.0.CO;2, 1998.
Bentley, M. L. and Sparks, J. M.: A 15 yr climatology of derecho-producing mesoscale convective systems over the central and eastern United States, Climate Res., 24, 129–139, 2003.
Bessho, K., Date, K., Hayashi, M., Ikeda, A., Imai, T., Inoue, H., Kumagai, Y., Miyakawa, T., Murata, H., Ohno, T., Okuyama, A., Oyama, R., Sasaki, Y., Shimazu, Y., Shimoji, K., Sumida, Y., Suzuki, M., Taniguchi, H., Tsuchiyama, H., Uesawa, D., Yokota, H., and Yoshida, R.: An introduction to Himawari-8/9 – Japan's new-generation geostationary meteorological satellites, Journal of the Meteorological Society of Japan Series II, 94, 151–183, https://doi.org/10.2151/jmsj.2016-009, 2016.
Bluestein, H. B.: Fronts and Jet Streaks: A Theoretical Perspective, in: Mesoscale meteorology and forecastingm edited by: Ray, P. S., American Meteorological Society, pp. 173–215, https://doi.org/10.1007/978-1-935704-20-1_9, 1986.
Bony, S. and Stevens, B.: Measuring area-averaged vertical motions with dropsondes, Journal of the Atmospheric Sciences, 76, 767–783, https://doi.org/10.1175/JAS-D-18-0141.1, 2019.
Bosart, L. R. and Sanders, F.: The Johnstown flood of July 1977: A long-lived convective system, Journal of the Atmospheric Sciences, 38, 1616–1642, https://doi.org/10.1175/1520-0469(1981)038<1616:TJFOJA>2.0.CO;2, 1981.
Burghardt, B. J., Evans, C., and Roebber, P. J.: Assessing the predictability of convection initiation in the high plains using an object-based approach, Weather and Forecasting, 29, 403–418, https://doi.org/10.1175/WAF-D-13-00089.1, 2014.
Brandes, E. A. and Ziegler, C. L.: Mesoscale downdraft influences on vertical vorticity in a mature mesoscale convective system, Monthly Weather Review, 121, 1337–1353, https://doi.org/10.1175/1520-0493(1993)121<1337:MDIOVV>2.0.CO;2, 1993.
Browand, F. K. and Winant, C. D.: Laboratory observations of shear-layer instability in a stratified fluid, Bound.-Lay. Meteorol., 5: 67-77, https://doi.org/10.1007/BF02188312, 1973.
Browning, K. A., Marsham, J. H., Nicol, J. C., Perry, F. M., White, B. A., Blyth, A. M., and Mobbs, S. D.: Observations of dual slantwise circulations above a cool undercurrent in a mesoscale convective system, Q. J. R. Meteorol. Soc., 136: 354-373, https://doi.org/10.1002/qj.582, 2010.
Byrne, D. and Zhang, J. A.: Height-dependent transition from 3-D to 2-D turbulence in the hurricane boundary layer, Geophysical Research Letters, 40, 1439–1442, https://doi.org/10.1002/grl.50335, 2013.
Chen, D., Guo, J., Yao, D., Lin, Y., Zhao, C., Min, M., Xu, H., Liu, L., Huang, X., Chen, T., and Zhai, P.: Mesoscale convective systems in the Asian monsoon region from Advanced Himawari Imager: Algorithms and preliminary results, Journal of Geophysical Research: Atmospheres, 124, 2210–2234, https://doi.org/10.1029/2018JD029707, 2019.
Chen, M., Wang, Y., Gao, F., and Xiao, X.: Diurnal variations in convective storm activity over contiguous North China during the warm season based on radar mosaic climatology, Journal of Geophysical Research: Atmospheres, 117, D20115, https://doi.org/10.1029/2012JD018158, 2012.
Chen, M., Wang, Y., Gao, F., and Xiao, X.: Diurnal evolution and distribution of warm – season convective storms in different prevailing wind regimes over contiguous North China, Journal of Geophysical Research: Atmospheres, 119, 2742–2763, 2014.
Chen, T., Guo, J., Guo, X., Zhang, Y., Xu, H., and Zhang, D.-L.: On the multiscale processes leading to an extreme gust wind event in East China: Insights from radar wind profiler mesonet observations, Journal of Geophysical Research: Atmospheres, 129, e2024JD041484, https://doi.org/10.1029/2024JD041484, 2024.
Coniglio, M. C., Corfidi, S. F., and Kain, J. S.: Environment and early evolution of the 8 May 2009 derecho-producing convective system, Monthly Weather Review, 139, 1083–1102, https://doi.org/10.1175/2010MWR3413.1, 2011.
Da, C.: Preliminary assessment of the Advanced Himawari Imager (AHI) measurement onboard Himawari-8 geostationary satellite, Remote Sensing Letters, 6, 637–646, https://doi.org/10.1080/2150704x.2015.1066522, 2015.
Dai, C., Wang, Q., Kalogiros, J. A., Lenschow, D. H., Gao, Z., and Zhou, M.: Determining boundary-layer height from aircraft measurements, Bound.-Lay. Meteorol., 152, 277–302, https://doi.org/10.1007/s10546-014-9929-z, 2014.
Dodson, D. S. and Small Griswold, J. D.: Turbulent and boundary layer characteristics during VOCALS-REx, Atmos. Chem. Phys., 21, 1937–1961, https://doi.org/10.5194/acp-21-1937-2021, 2021.
Emanuel, K. A.: Frontal Circulations in the Presence of Small Moist Symmetric Stability, Journal of the Atmospheric Sciences, 42, 1062–1071, https://doi.org/10.1175/1520-0469(1985)042<1062:FCITPO>2.0.CO;2, 1985.
Evans, C., Weisman, M. L., and Bosart, L. F.: Development of an intense, warm-core mesoscale vortex associated with the 8 May 2009 “super derecho” convective event, Journal of the Atmospheric Sciences, 71, 1218–1240, https://doi.org/10.1175/JAS-D-13-0167.1, 2014.
Fiori, E., Parodi, A., and Siccardi, F.: Uncertainty in prediction of deep moist convective processes: Turbulence parameterizations, microphysics and grid-scale effects, Atmospheric Research, 100, 447–456, https://doi.org/10.1016/j.atmosres.2010.10.003, 2011.
Fovell, R. G.: Upstream influence of numerically simulated squall-line storms, Q. J. R. Meteorol. Soc., 128, 893–912, https://doi.org/10.1256/0035900021643737, 2002.
Fovell, R. G. and Cao, Y.: Wind and gust forecasting in complex terrain, in: 15th WRF Users' Workshop, Boulder, CO, NCAR, 5A.2, http://www2.mmm.ucar.edu/wrf/users/workshops/WS2014/ppts/5A.2.pdf (last access: 10 December 2025), 2014.
French, A. J. and Parker, M. D.: Observations of mergers between squall lines and isolated supercell thunderstorms, Weather and Forecasting, 27, 255–278, https://doi.org/10.1175/WAF-D-11-00058.1, 2012.
French, A. J. and Parker, M. D.: Numerical simulations of bow echo formation following a squall line–supercell merger, Monthly Weather Review, 142, 4791–4822, https://doi.org/10.1175/MWR-D-13-00356.1, 2014.
Fujita, T. T.: Manual of downburst identification for Project NIMROD, Satellite and Mesometeorology Research Paper 156, 111 pp., https://ntrs.nasa.gov/citations/19780022828 (last access: 12 December 2025), 1978.
Goyette, S., Brasseur, O., and Beniston, M.: Application of a new wind gust parameterization: Multiscale case studies performed with the Canadian regional climate model, Journal of Geophysical Research: Atmospheres, 108, 4374, https://doi.org/10.1029/2002JD002646, D13, 2003.
Guo, J., Liu, B., Gong, W., Shi, L., Zhang, Y., Ma, Y., Zhang, J., Chen, T., Bai, K., Stoffelen, A., de Leeuw, G., and Xu, X.: Technical note: First comparison of wind observations from ESA's satellite mission Aeolus and ground-based radar wind profiler network of China, Atmos. Chem. Phys., 21, 2945–2958, https://doi.org/10.5194/acp-21-2945-2021, 2021a.
Guo, J., Zhang, J., Yang, K., Liao, H., Zhang, S., Huang, K., Lv, Y., Shao, J., Yu, T., Tong, B., Li, J., Su, T., Yim, S. H. L., Stoffelen, A., Zhai, P., and Xu, X.: Investigation of near-global daytime boundary layer height using high-resolution radiosondes: first results and comparison with ERA5, MERRA-2, JRA-55, and NCEP-2 reanalyses, Atmos. Chem. Phys., 21, 17079–17097, https://doi.org/10.5194/acp-21-17079-2021, 2021b.
Guo, X., Guo, J., Zhang, D-L., and Yun, Y.: Vertical divergence profiles as detected by two wind profiler mesonets over East China: implications for nowcasting convective storms, Q. J. R. Meteorol. Soc., 149, 1629–1649, https://doi.org/10.1002/qj.4474, 2023.
Guo, X., Guo, J., Chen, T., Li, N., Zhang, F., and Sun, Y.: Revisiting the evolution of downhill thunderstorms over Beijing: a new perspective from a radar wind profiler mesonet, Atmos. Chem. Phys., 24, 8067–8083, https://doi.org/10.5194/acp-24-8067-2024, 2024.
Guzman-Morales, J., Gershunov, A., Theiss, J., Li, H., and Cayan, D.: Santa Ana Winds of Southern California: Their climatology, extremes, and behavior spanning six and a half decades, Geophysical Research Letters, 43, 2827–2834, https://doi.org/10.1002/2016GL067887, 2016.
Grim, J. A., Rauber, R. M., McFarquhar, G. M., Jewett, B. F., and Jorgensen, D. P.: Development and forcing of the rear inflow jet in a rapidly developing and decaying squall line during BAMEX, Monthly Weather Review, 137, 1206–1229, https://doi.org/10.1175/2008mwr2503.1, 2009.
Grubišić, V., Doyle, J. D., Kuettner, J., Mobbs, S., Smith, R. B., Whiteman, C. D., Dirks, R., Czyzyk, S., Cohn, S. A., Vosper, S., Weissmann, M., Haimov, S., De Wekker, S. F. J., Pan, L. L., and Chow, F. K.: The terrain-induced rotor experiment: A field campaign overview including observational highlights, Bulletin of the American Meteorological Society, 89, 1513–1534, https://doi.org/10.1175/2008BAMS2487.1, 2008.
Hadavi, M. and Romanic, D.: Atmospheric conditions conducive to thunderstorms with downbursts in Canada and a downburst precursor parameter, Atmospheric Research, 305, 428, https://doi.org/10.1016/j.atmosres.2024.107428, 2024.
Han, B., Du, Y., Wu, C., and Liu, X.: Microphysical characteristics of the coexisting frontal and warm-sector heavy rainfall in South China, Journal of Geophysical Research: Atmospheres, 126, e2021JD035446, https://doi.org/10.1029/2021JD035446, 2021.
Haerter, J. O., Böing, S. J., Henneberg, O., and Nissen, S. B.: Circling in on convective organization, Geophysical Research Letters, 46, 7024–7034, https://doi.org/10.1029/2019GL082092, 2019.
Harris, A. R. and Kahl, J. D. W.: Gust factors: Meteorologically stratified climatology, data artifacts, and utility in forecasting peak gusts, Journal of Applied Meteorology and Climatology, 56, 3151–3166, https://doi.org/10.1175/jamc-d-17-0133.1, 2017.
Hersbach, H., Bell, B., Berrisford, P., Biavati, G., Horányi, A., Muñoz Sabater, J., Nicolas, J., Peubey, C., Radu, R., Rozum, I., Schepers, D., Simmons, A., Soci, C., Dee, D., and Thépaut, J.-N.: ERA5 hourly data on pressure levels from 1940 to present, Copernicus Climate Change Service (C3S) Climate Data Store (CDS) [data set], https://doi.org/10.24381/cds.bd0915c6, 2023.
Hirt, M. and Craig, G. C.: A cold pool perturbation scheme to improve convective initiation in convection-permitting models, Q. J. R. Meteorol. Soc., 147, 2429–2447, https://doi.org/10.1002/qj.4032, 2021.
Houze Jr., R. A.: Orographic effects on precipitating clouds, Rev. Geophys., 50, RG1001, https://doi.org/10.1029/2011RG000365, 2012.
Houze Jr., R. A. (Ed.): Chapter 9 – Mesoscale convective systems, in: International geophysics, Academic Press, pp. 237–286, https://doi.org/10.1016/B978-0-12-374266-7.00009-3, 2014.
Houze, R. A., Rutledge, S. A., Biggerstaff, M. I., and Smull, B. F.: Interpretation of Doppler Weather Radar Displays of Midlatitude Mesoscale Convective Systems, Bulletin of the American Meteorological Society, 70, 608–619, https://doi.org/10.1175/1520-0477(1989)070<0608:IODWRD>2.0.CO;2, 1989.
Johns, R. H. and Hirt, W. D.: Derechos: Widespread convectively induced windstorms, Weather and Forecasting, 2, 32–49, https://doi.org/10.1175/1520-0434(1987)002<0032:DWCIW>2.0.CO;2, 1987.
Johnson, R. H. and Hamilton, P. J.: The Relationship of Surface Pressure Features to the Precipitation and Airflow Structure of an Intense Midlatitude Squall Line. Monthly Weather Review, 116, 1444–1473, https://doi.org/10.1175/1520-0493(1988)116<1444:TROSPF>2.0.CO;2, 1988.
Kahl, J. D. W.: Forecasting peak wind gusts using meteorologically stratified gust factors and MOS guidance, Weather and Forecasting, 35, 1129–1143, https://doi.org/10.1175/waf-d-20-0045.1, 2020.
Kelley, D. I., Burton, C., Di Giuseppe, F., Jones, M. W., Barbosa, M. L. F., Brambleby, E., McNorton, J. R., Liu, Z., Bradley, A. S. I., Blackford, K., Burke, E., Ciavarella, A., Di Tomaso, E., Eden, J., Ferreira, I. J. M., Fiedler, L., Hartley, A. J., Keeping, T. R., Lampe, S., Lombardi, A., Mataveli, G., Qu, Y., Silva, P. S., Spuler, F. R., Steinmann, C. B., Torres-Vázquez, M. Á., Veiga, R., van Wees, D., Wessel, J. B., Wright, E., Bilbao, B., Bourbonnais, M., Gao, C., Di Bella, C. M., Dintwe, K., Donovan, V. M., Harris, S., Kukavskaya, E. A., N'Dri, A. B., Santín, C., Selaya, G., Sjöström, J., Abatzoglou, J. T., Andela, N., Carmenta, R., Chuvieco, E., Giglio, L., Hamilton, D. S., Hantson, S., Meier, S., Parrington, M., Sadegh, M., San-Miguel-Ayanz, J., Sedano, F., Turco, M., van der Werf, G. R., Veraverbeke, S., Anderson, L. O., Clarke, H., Fernandes, P. M., and Kolden, C. A.: State of Wildfires 2024–2025, Earth Syst. Sci. Data, 17, 5377–5488, https://doi.org/10.5194/essd-17-5377-2025, 2025.
Kolmogorov, A. N.: The local structure of turbulence in incompressible viscous fluid for very large Reynolds numbers, Doklady Akademii Nauk SSSR, 30, 299–303, 1941.
Kraichnan, R. H.: Inertial ranges in two-dimensional turbulence, The Physics of Fluids, 10, 1417–1423, https://doi.org/10.1063/1.1762301, 1967.
Lafore, J. and Moncrieff, M. W.: A numerical investigation of the organization and interaction of the convective and stratiform regions of tropical squall lines, Journal of the Atmospheric Sciences, 46, 521–544, https://doi.org/10.1175/1520-0469(1989)046<0521:ANIOTO>2.0.CO;2, 1989.
Lenschow, D. H., Savic-Jovcic, V., and Stevens, B.: Divergence and vorticity from aircraft air motion measurements, J. Atmos. Oceanic Technol., 24, 2062–2072, https://doi.org/10.1175/2007JTECHA940.1, 2007.
Letson, F., Pryor, S. C., Barthelmie, R. J., and Hu, W.: Observed gust wind speeds in the coterminous United States, and their relationship to local and regional drivers, J. Wind Eng. Ind. Aerodyn., 173, 199–209, https://doi.org/10.1016/j.jweia.2017.12.008, 2018.
Li, H., Cui, X., and Zhang, D. L.: On the initiation of an isolated heavy-rain-producing storm near the central urban area of Beijing metropolitan region, Monthly Weather Review, 145, 181–197, https://doi.org/10.1175/MWR-D-16-0115.1, 2017.
Liu, B., Guo, J., Gong, W., Shi, L., Zhang, Y., and Ma, Y.: Characteristics and performance of wind profiles as observed by the radar wind profiler network of China, Atmos. Meas. Tech., 13, 4589–4600, https://doi.org/10.5194/amt-13-4589-2020, 2020.
Liu, B., Ma, X., Guo, J., Wen, R., Li, H., Jin, S., Ma, Y., Guo, X., and Gong, W.: Extending the wind profile beyond the surface layer by combining physical and machine learning approaches, Atmos. Chem. Phys., 24, 4047–4063, https://doi.org/10.5194/acp-24-4047-2024, 2024.
Liu, Q., Xu, X., Zhao, K., and Zhou, A.: A merger-formation bow echo caused by low-level mesovortex in South China, Journal of Geophysical Research: Atmospheres, 128, e2022JD037954, https://doi.org/10.1029/2022JD037954, 2023.
Lombardo, K. and Kumjian, M. R.: Observations of the Discrete Propagation of a Mesoscale Convective System during RELAMPAGO–CACTI, Monthly Weather Review, 150, 2111–2138, https://doi.org/10.1175/MWR-D-21-0265.1, 2022.
Luchetti, N. T., Friedrich, K., Rodell, C. E., and Lundquist, J. K.: Characterizing thunderstorm gust fronts near complex terrain, Monthly Weather Review, 148, 3267–3286, https://doi.org/10.1175/mwr-d-19-0316.1, 2020.
Luu, L. N., van Meijgaard, E., Philip, S. Y., Kew, S. F., de Baar, J. H. S., and Stepek, A.: Impact of surface roughness changes on surface wind speed over western Europe: A study with the regional climate model RACMO, Journal of Geophysical Research: Atmospheres, 128, e2022JD038426, https://doi.org/10.1029/2022JD038426, 2023.
Lyu, M., Potter, H., Collins, C. O., Yang, X., and Wang, X.: The impacts of gustiness on the evolution of surface gravity waves, Geophysical Research Letters, 50, https://doi.org/10.1029/2023gl104085, 2023.
Mahoney, K. M. and Lackmann, G. M.: The sensitivity of momentum transport and severe surface winds to environmental moisture in idealized simulations of a mesoscale convective system, Monthly Weather Review, 139, 1352–1369, https://doi.org/10.1175/2010mwr3468.1, 2011.
Mahoney, K. M., Lackmann, G. M., and Parker, M. D.: The role of momentum transport in the motion of a quasi-idealized mesoscale convective system, Monthly Weather Review, 137, 3316–3338, https://doi.org/10.1175/2009mwr2895.1, 2009.
Mahrt, L., Vickers, D., Frederickson, P., Davidson, K., and Smedman, A.-S.: Sea-surface aerodynamic roughness, Journal of Geophysical Research, 108, 3171, https://doi.org/10.1029/2002JC001383, C6, 2003.
Marino, R., Pouquet, A., and Rosenberg, D.: Resolving the paradox of oceanic large-scale balance and small-scale mixing, Physical Review Letters, 114, 114504, https://doi.org/10.1103/physrevlett.114.114504, 2015.
Meng, Z., Zhang, F., Markowski, P., Wu, D., and Zhao, K.: A modeling study on the development of a bowing structure and associated rear inflow within a squall line over South China, Journal of the Atmospheric Sciences, 69, 1182–1207, https://doi.org/10.1175/JAS-D-11-0121.1, 2012.
Miller, J. E.: ON THE CONCEPT OF FRONTOGENESIS, Journal of the Atmospheric Sciences, 5, 169–171, https://doi.org/10.1175/1520-0469(1948)005<0169:OTCOF>2.0.CO;2, 1948.
Monahan, A. H., Rees, T., He, Y., and McFarlane, N.: Multiple regimes of wind, stratification, and turbulence in the stable boundary layer, Journal of the Atmospheric Sciences, 72, 3178–3198, https://doi.org/10.1175/jas-d-14-0311.1, 2015.
Monin, A. S. and Obukhov, A. M.: Basic laws of turbulent mixing in the surface layer of the atmosphere, Tr. Akad. Nauk SSSR Geophiz. Inst., 24, 163, 1954.
Neiman, P. J., Hardesty, R. M., Shapiro, M. A., and Cupp, R. E.: Doppler Lidar Observations of a Downslope Windstorm, Monthly Weather Review, 116, 2265–2275, https://doi.org/10.1175/1520-0493(1988)116<2265:DLOOAD>2.0.CO;2, 1988.
Oke, T.: Boundary Layer Climates, 2nd Edn., Routledge, London, UK, ISBN 9780415043199, 1987.
Peterson, T. C., Karl, T. R., Kossin, J. P., Kunkel, K. E., Lawrimore, J. H., Mcmahon, J. R., Vose, R. S., and Yin, X.: Changes in weather and climate extremes: State of knowledge relevant to air and water quality in the United States, Journal of the Air and Waste Management Association, 64, 184–197, https://doi.org/10.1080/10962247.2013.851044, 2014.
Powell, D. C. and Elderkin, C. E.: An investigation of the application of Taylor's hypothesis to atmospheric boundary layer turbulence, Journal of the Atmospheric Sciences, 31, 990–1002, https://doi.org/10.1175/1520-0469(1974)031<0990:AIOTAO>2.0.CO;2, 1974.
Powell, M. D., Vickery, P. J., and Reinhold, T. A.: Reduced drag coefficient for high wind speeds in tropical cyclones, Nature, 422, 279–283, https://doi.org/10.1038/nature01481, 2003.
Prein, A. F., Coen, J., and Jaye, A.: The character and changing frequency of extreme California fire weather, Journal of Geophysical Research: Atmospheres, 127, e2021JD035350, https://doi.org/10.1029/2021JD035350, 2022.
Pryor, S. C. and Barthelmie, R. J.: Climate change impacts on wind energy: A review, Renewable and Sustainable Energy Reviews, 14, 430–437, https://doi.org/10.1016/j.rser.2009.07.028, 2010.
Pryor, S. C. and Barthelmie, R. J.: Assessing climate change impacts on the near-term stability of the wind energy resource over the USA, Climate Dynamics, 108, 8167–8171, https://doi.org/10.1007/s00382-010-0955-3, 2011.
Pryor, S. C. and Barthelmie, R. J.: A global assessment of extreme wind speeds for wind energy applications, Nature Energy, 6, 268–276, https://doi.org/10.1038/s41560-020-00773-7, 2021.
Pryor, S. C., Barthelmie, R. J., and Schoof, J. T.: Past and future wind climates over the contiguous USA based on the North American Regional Climate Change Assessment Program model suite, Journal of Geophysical Research, 117, D19119, https://doi.org/10.1029/2012JD017449, 2012.
Raupach, M. R.: Simplified expressions for vegetation roughness length and zero-plane displacement as functions of canopy height and area index, Bound.-Lay. Meteorol., 71, 211–216, https://doi.org/10.1007/BF00709229, 1994.
Rocque, M. N. and Rasmussen, K. L.: The Impact of Topography on the Environment and Life Cycle of Weakly and Strongly Forced MCSs during RELAMPAGO, Monthly Weather Review, 150, 2317–2338, https://doi.org/10.1175/MWR-D-22-0049.1, 2022.
Romanic, D., Chowdhury, J., Chowdhury, J., and Hangan, H.: Investigation of the transient nature of thunderstorm winds from Europe, the united states, and Australia using a new method for detection of changepoints in wind speed records, Monthly Weather Review, 148, 3747–3771, https://doi.org/10.1175/MWR-D-19-0312.1, 2020.
Shao, X., Zhang, N., Peng, Z., Zhao, K., Luo, Y., and Song, X.: Observed surface drag coefficient under high wind speed conditions and the relationship with coherent structures, Journal of Geophysical Research: Atmospheres, 127, https://doi.org/10.1029/2021jd035301, 2022.
Shao, X., Zhang, N., and Tang, J.: A physical model for the observed inverse energy cascade in typhoon boundary layers, Geophysical Research Letters, 50, https://doi.org/10.1029/2023gl105546, 2023a.
Shao, X., Zhang, N., and Tang, J.: The impact of observed drag reduction over land on typhoon forecasting, Journal of Geophysical Research: Atmospheres, 128, https://doi.org/10.1029/2022jd038278, 2023b.
Shapiro, A., Potvin, C. K., and Jidong, G.: Use of a vertical vorticity equation in variational dual-Doppler wind analysis, J. Atmos. Oceanic Technol., 26, 2089–2106, 2009.
Shi, Y. and Hu, F.: Ramp-like PM2.5 accumulation process and Z-less similarity in the stable boundary layer, Geophysical Research Letters, 47, e2019GL086530, https://doi.org/10.1029/2019gl086530, 2020.
Shi, Y., Hu, F., Xiao, Z. S., Fan, G. Q., and Zhang, Z.: Comparison of four different types of planetary boundary layer heights during a haze episode in Beijing, Science of the Total Environment, 711, 134928, https://doi.org/10.1016/j.scitotenv.2019.134928, 2020.
Smith, R. B.: The influence of mountains on the atmosphere, Advances in Geophysics, 21, 87–230, https://doi.org/10.1016/S0065-2687(08)60262-9, 1979.
Su, T. N., Li, Z. Q., and Zheng, Y. T.: Cloud-Surface Coupling Alters the Morning Transition from Stable to Unstable Boundary Layer, Journal of Geophysical Research, 50, e2022GL102256, https://doi.org/10.1029/2022gl102256, 2023.
Tang, J., Byrne, D., Zhang, J. A., Wang, Y., Lei, X.-T., Wu, D., Fang, P., and Zhao, B.: Horizontal transition of turbulent cascade in the near-surface layer of tropical cyclones, Journal of the Atmospheric Sciences, 72, 4915–4925, https://doi.org/10.1175/jas-d-14-0373.1, 2015.
Taszarek, M., Pilguj, N., Orlikowski, J., Surowiecki, A., Walczakiewicz, S., Pilorz, W., Piasecki, K., Pajurek, Ł., and Półrolniczak, M.: Derecho evolving from a mesocyclone – A study of 11 August 2017 severe weather outbreak in Poland: Event analysis and high-resolution simulation, Monthly Weather Review, 147, 2283–2306, https://doi.org/10.1175/MWR-D-18-0330.1, 2019.
Taylor, G. I.: The spectrum of turbulence, Proc. R. Soc. London, A164, 476–490, 1938.
Torralba, V., Doblas-Reyes, F. J., and Gonzalez-Reviriego, N.: Uncertainty in recent near-surface wind speed trends: A global reanalysis intercomparison, Environmental Research Letters, 12, 114019, https://doi.org/10.1088/1748-9326/aa8a58, 2017.
Tucker, S. C., Senff, C. J., Weickmann, A. M., Brewer, W. A., Banta, R. M., Sandberg, S. P., Law, D. C., and Hardesty, R. M.: Doppler lidar estimation of mixing height using turbulence, shear, and aerosol profiles, J. Atmos. Oceanic Technol., 26, 673–688, https://doi.org/10.1175/2008JTECHA1157.1, 2009.
Vose, R. S., Applequist, S., Bourassa, M. A., Pryor, S. C., Barthelmie, R. J., Blanton, B., Bromirski, P. D., Brooks, H. E., DeGaetano, A. T., Dole, R. M., Easterling, D. R., Jensen, R. E., Karl, T. R., Katz, R. W., Klink, K., Kruk, M. C., Kunkel, K. E., MacCracken, M. C., Peterson, T. C., Shein, K., Thomas, B. R., Walsh, J. E., Wang, X. L., Wehner, M. F., Wuebbles, D. J., and Young, R. S.: Monitoring and understanding changes in extremes: Extratropical storms, winds, and waves, Bulletin of the American Meteorological Society, 95, 377–386, https://doi.org/10.1175/BAMS-D-12-00162.1, 2014.
Wakimoto, R. M., Murphey, H. V., Davis, C. A., and Atkins, N. T.: High winds generated by bow echoes. Part II: The relationship between the mesovortices and damaging straight-line winds, Monthly Weather Review, 134, 2813–2829, https://doi.org/10.1175/MWR3216.1, 2006.
Wandishin, M. S., Stensrud, D. J., Mullen, S. L., and Wicker, L. J.: On the predictability of mesoscale convective systems: Three-dimensional simulations, Monthly Weather Review, 138, 863–885, https://doi.org/10.1175/2009MWR2961.1, 2010.
Weisman, M. L.: The role of convectively generated rear-inflow jets in the evolution of long-lived mesoconvective systems, Journal of the Atmospheric Sciences, 49, 1826–1847, https://doi.org/10.1175/1520-0469(1992)049<1826:TROCGR>2.0.CO;2, 1992.
Weisman, M. L. and Davis, C. A.: Mechanisms for the generation of mesoscale vortices within quasi-linear convective systems, Journal of the Atmospheric Sciences, 55, 2603–2622, https://doi.org/10.1175/1520-0469(1998)055<2603:MFTGOM>2.0.CO;2, 1998.
Weisman, M. L. and Trapp, R. J.: Low-level mesovortices within squall lines and bow echoes. Part I: Overview and dependence on environmental shear, Monthly Weather Review, 131, 2779–2803, https://doi.org/10.1175/1520-0493(2003)131<2779:LMWSLA>2.0.CO;2, 2003.
Wilson, J. W., Feng, Y., Chen, M., and Roberts, R. D.: Nowcasting challenges during the Beijing Olympics: Successes, failures, and implications for future nowcasting systems, Weather and Forecasting, 25, 1691–1714, https://doi.org/10.1175/2010WAF2222417.1, 2010.
Wheatley, D. M. and Trapp, R. J.: The effect of mesoscale heterogeneity on the Genesis and structure of mesovortices within quasi-linear convective systems, Monthly Weather Review, 136, 4220–4241, https://doi.org/10.1175/2008MWR2294.1, 2008.
Wu, L., Su, H., Zeng, X., Posselt, D. J., Wong, S., Chen, S., and Stoffelen, A.: Uncertainty of Atmospheric Winds in Three Widely Used Global Reanalysis Datasets, Journal of Applied Meteorology and Climatology, 63, 165–180, https://doi.org/10.1175/JAMC-D-22-0198.1, 2024.
Xiao, X, Sun, J., Chen, M. X., Qie, X., Wang, Y., and Ying, Z. M.: The characteristics of weakly forced mountain-to-plain precipitation systems based on radar observations and high-resolution reanalysis, Journal of Geophysical Research: Atmospheres, 122, 3193–3213, 2017.
Xiao, X, Sun, J., Chen, M. X., Qie, X., Ying, Z. M., Wang, Y., and Ji, L.: Comparison of environmental and mesoscale characteristics of two types of mountain-to-plain precipitation systems in the Beijing region, China, Journal of Geophysical Research: Atmospheres, 124, 6856–6872, 2019.
Xu, X., Xue, M., and Wang, Y.: The genesis of mesovortices within a real-data simulation of a bow echo system, Journal of the Atmospheric Sciences, 72, 1963–1986. https://doi.org/10.1175/JAS-D-14-0209.1, 2015a.
Xu, X., Xue, M., and Wang, Y.: Mesovortices within the 8 May 2009 bow echo over the central United States: Analyses of the characteristics and evolution based on Doppler radar observations and a high-resolution model simulation, Monthly Weather Review, 143, 2266–2290, https://doi.org/10.1175/MWR-D-14-00234.1, 2015b.
Xu, X., Ju, Y., Liu, Q., Zhao, K., Xue, M., Zhang, S., Zhou, A., Wang, Y., and Tang, Y.: Dynamics of Two Episodes of High Winds Produced by an Unusually Long-Lived Quasi-Linear Convective System in South China, Journal of the Atmospheric Sciences, 81, 1449–1473, https://doi.org/10.1175/JAS-D-23-0047.1, 2024.
Yanai, M. and Nitta, T.: Computation of vertical motion and vorticity budget in a Caribbean easterly wave, J. Meteor. Soc. Japan, 45, 444–466, 1967.
Yang, H. and Du, Y.: Distinct Convection Initiation Near and Far ahead of an Idealized Squall Line, Journal of the Atmospheric Sciences, 83, 151–168, https://doi.org/10.1175/JAS-D-25-0073.1, 2026.
Zhang, D.-L.: The Formation of a cooling-induced mesovortex in the trailing stratiform region of a midlatitude squall line, Monthly Weather Review, 120, 2763–2785, https://doi.org/10.1175/1520-0493(1992)120<2763:TFOACI>2.0.CO;2, 1992.
Zhang, D.-L., and Gao, K.: Numerical simulation of an intense squall line during 10–11 June 1985 PRE-STORM. Part II: Rear inflow, surface pressure perturbations and stratiform precipitation, Monthly Weather Review, 117, 2067–2094, 1989.
Zhang, L., Sun, J., Ying, Z., and Xiao, X.: Initiation and development of a squall line crossing Hangzhou Bay, Journal of Geophysical Research: Atmospheres, 126, https://doi.org/10.1029/2020JD032504, 2021.
Zhou, A., Zhao, K., Lee, W.-C., Huang, H., Hu, D., and Fu, P.: VDRAS and polarimetric radar investigation of a bow echo formation after a squall line merged with a preline convective cell, Journal of Geophysical Research: Atmospheres, 125, e2019JD031719. https://doi.org/10.1029/2019JD031719, 2020.
Zhou, X., Zhang, C., Xiao, Z., Li, Y., and Lu, G.: Inverse Energy Cascades in the Boundary Layer During Strong Winds Based on Doppler Lidar, Geophysical Research Letters, 52, https://doi.org/10.1029/2024GL113273, 2025.