the Creative Commons Attribution 4.0 License.
the Creative Commons Attribution 4.0 License.
 | 12 Feb 2026
Quantitative assessment of supercooled liquid water sensitivity to different aerosol field inputs over the Sichuan Basin
Min Yuan
Di Wang
Weijia Wang
Lei Yin
Xiaobo Dong
Delong Zhao
Fan Ping
Aerosol-cloud interactions profoundly influence the formation and evolution of supercooled liquid water, a key factor in in-flight icing. However, accurately quantifying aerosol emission inventories and their spatiotemporal distributions, as well as simulating supercooled liquid water and predicting in-flight icing, remains a major challenge, particularly in high-aerosol environments such as the Sichuan Basin in China. In this study, the Thompson–Eidhammer aerosol-aware microphysics scheme is applied to a high-aerosol icing event to quantitatively assess the sensitivity of supercooled liquid water properties to different aerosol inputs. Three aerosol configurations are examined: the scheme's default settings representing clean conditions; climatological aerosol values representing polluted conditions; and aerosol fields from the Copernicus Atmosphere Monitoring Service (CAMS), representing near-real-time polluted conditions. The CAMS aerosol mass concentrations are converted to number concentrations using typical densities and size parameters of major East Asian aerosol species. All simulations reproduce the synoptic-scale supercooled liquid water and temperature distribution when compared with ERA5. Relative to clean conditions, polluted-environment simulations produce higher supercooled liquid water content, larger cloud droplet number concentrations, smaller median volume diameters, and longer cloud lifetimes. The experiments also reveal that stronger auto-conversion in clean conditions suppresses supercooled liquid water formation, whereas enhanced riming in polluted environments promotes supercooled liquid water depletion. In situ aircraft observations further indicate that the CAMS-driven experiment performs best in capturing the high supercooled liquid water content and large median volume diameters. These findings underscore the importance of near-real-time aerosol inputs for improving simulations of aerosol-cloud interactions and predicting aircraft-icing environments.
- Article
(4249 KB) - Full-text XML
- BibTeX
- EndNote


In-flight icing is recognized as one of the most hazardous weather phenomena in aviation and continues to pose a significant threat (Cole and Sand, 1991; Petty and Floyd, 2004; Liu et al., 2024). It occurs when an aircraft encounters clouds or precipitation containing supercooled liquid water (SLW), leading to the rapid freezing of droplets upon contact with the aircraft's surfaces (Potapczuk, 2013; Bromfield et al., 2023). Over the past few decades, extensive in situ aircraft measurements of SLW have been conducted worldwide to support natural icing flight certification, weather modification, and cloud precipitation physics research (Cober and Isaac, 2012; Feng and Zhang, 2014; Dong et al., 2021; Bernstein et al., 2019; Schima et al., 2022; Faber et al., 2024). These observations have been crucial for advancing the understanding of cloud microphysical processes, validating numerical models, and improving in-flight icing forecasts and anti-icing strategies (Lave et al., 2021; Rugg et al., 2023; Zhao et al., 2023).
Aerosol-cloud interaction (ACI), also referred to as the aerosol indirect effect (Twomey, 1977; Rosenfeld et al., 2014; Fan et al., 2016; Yu et al., 2024), plays a critical role in the formation, persistence, and depletion of SLW. On one hand, solid, insoluble aerosol particles act as ice nuclei (IN, Belosi et al., 2017), initiating ice crystal formation, depleting SLW through riming and the Wegener-Bergeron-Findeisen (WBF) process (Omanovic et al., 2024), commonly referred to as the glaciation effect (Lohmann, 2002). On the other hand, hygroscopic aerosols particles act as cloud condensation nuclei (CCN), and higher CCN concentrations promote the formation of more numerous but smaller cloud droplets. These smaller droplets are less likely to grow into precipitation through the collision-coalescence process (Rosenfeld, 2000) and are more readily transported to subfreezing altitudes, where they can persist in a supercooled state, thereby enhancing the abundance and lifetime of SLW (Albrecht, 1989). However, when IN concentrations are sufficiently high, even these small supercooled droplets can be efficiently scavenged by ice crystals, further accelerating SLW depletion. In recent decades, with continued industrialization and urbanization, the atmospheric abundance and diversity of aerosol particles have increased (Charlson et al., 1992), rendering the mechanisms of ACI influence on SLW increasingly complex.
An important approach to understanding SLW involves simulating ACI using numerical models coupled with an atmospheric chemistry module (Grell et al., 2005). This coupling dynamically represents key aerosol processes, including emission, transport, turbulent diffusion, chemical transformation (such as the formation of secondary aerosols), as well as wet scavenging and dry deposition. Through real-time treatment of these processes, the models can predict the spatial and temporal evolution of various aerosol species, such as sulfate, nitrate, black carbon, organic carbon, sea salt, and dust, along with their size distributions. Representative implementations of this approach include the MOSAIC aerosol module coupled with WRF-Chem (Zaveri et al., 2008; Chapman et al., 2009) and the Goddard Chemistry Aerosol Radiation and Transport (GOCART) aerosol module (Chin et al., 2000; Ukhov et al., 2020; Collow et al., 2024). However, this methodology comes with the additional limitation of large computational costs and the laborious task of preparing detailed emission inventories for aerosols and gaseous pollutants.
In recent years, numerical models have integrated several double-moment microphysics schemes to simulate ACI, yielding promising advancements in the representation of cloud microphysics (Glotfelty et al., 2019). These schemes typically rely on fixed, prescribed, or simple parameterized aerosol inputs, such as aerosol number concentration, size distribution, and chemical composition, to estimate the number of particles activated as CCN, which subsequently form SLW. Because these schemes do not require complex emission inventories or detailed chemical boundary conditions, they are well suited for proof-of-concept simulations and sensitivity experiments investigating the effects of aerosol perturbations on cloud microphysics. A representative example is the Thompson–Eidhammer aerosol-aware scheme. Thompson and Eidhammer (2014) first implemented this scheme and assessed precipitation in a large winter cyclone using empirical climatological aerosol emission data. The scheme is then applied to simulate in-flight icing, assessing key characteristics such as liquid water content, cloud droplet median volume diameter (MVD), cloud droplet number concentrations (CDNC), and temperature in aircraft icing environments (Thompson et al., 2017). Weston et al. (2022) apply the scheme to evaluate the influence of different initial CCN number concentrations during two fog events in Namibia. Thomas et al. (2021) use the scheme to successfully capture the spatial and temporal evolution of an extreme rainfall event in southwestern India. Subsequent studies aim to enhance simulation performance by incorporating more realistic aerosol emissions.
Previous studies have shown that the chemical composition of aerosols has a much smaller influence on ACI than their concentration and particle size (Dusek et al., 2006; Ward et al., 2010). Therefore, continuously improving the representation of aerosol particle size and number concentration distributions in models is crucial. Li et al. (2024) incorporated aerosol fields from the Common Community Physics Package (a library of physical parameterizations and suites that are used operationally in the NOAA's Unified Forecast System Atmosphere) to improve precipitation simulations over Europe and North America. He et al. (2025) converted CAMS aerosol mass mixing ratios into particle number concentrations under different aerosol concentration background using a lognormal distribution assumption, and further investigated how variations in microphysical processes within the Southwest Vortex over China influence precipitation patterns. Wu et al. (2024) improved the simulation of SLW by incorporating aerosol concentrations for different particle size bins derived from the Community Multiscale Air Quality model.
Several studies have examined the role of aerosols in SLW formation and icing; however, few have explicitly evaluated the performance of aerosol-aware microphysics schemes in simulating SLW characteristics under high-aerosol conditions. Building on our previous analysis of in-flight icing events over the Sichuan Basin (Yuan et al., 2025), which revealed higher aerosol concentrations, greater CDNC, and smaller cloud droplet sizes compared with typical icing environments, this study aims to systematically assess the performance of an aerosol-aware microphysics scheme in simulating SLW properties under such conditions, thereby addressing this research gap. We employ the Thompson–Eidhammer aerosol-aware microphysics scheme and design three aerosol input configurations to evaluate its performance and sensitivity: (1) the scheme's default aerosol settings as a baseline; (2) climatological aerosol values representing typical background conditions; and (3) near-real-time aerosol data from the Copernicus Atmosphere Monitoring Service (CAMS). This configuration strategy allows the experiments to span a realistic range of aerosol environments and enables a quantitative assessment of how aerosol variability influences SLW. In particular, the use of CAMS data provides physically consistent aerosol loading fields, thereby enhancing the realism of the simulations and enabling diagnosis of limitations in the default settings under high-aerosol conditions.
This paper is organized as follows: Sect. 2 introduces the climatological characteristics of the study area, in situ aircraft observations, aerosol datasets, model configurations, experimental design, and the method used to calculate MVD of SLW, and also provides an overview of the Thompson-Eidhammer aerosol-aware scheme. Section 3 presents the simulated SLW microphysical characteristics and processes from different experiments, as well as comparisons with observations in the icing region. Section 4 summarizes the main findings of the study.
2.1 Study area
The Sichuan Basin, situated in southwestern China, is a large sedimentary basin bordered by the Tibetan Plateau to the west, the Qinling Mountains to the north, and the Yunnan-Guizhou Plateau to the southeast. Enclosed by high mountains, the basin floor lies between 200 and 750 m above sea level, while surrounding peaks exceed 4500 m, creating sharp topographic gradients. Annual precipitation ranges from 800 to 1200 mm, primarily concentrated in the summer monsoon season. The basin's enclosed terrain exerts a pronounced influence on its winter climate: weak winds, limited solar radiation, and high humidity favor the development and persistence of extensive stratiform clouds cover (Jin et al., 2013). Additionally, topographic confinement facilitates aerosol accumulation during winter pollution episodes, further enhancing persistent cloudiness through ACI (Lu et al., 2024). This distinctive winter cloud regime not only alters the regional radiative balance and thermal structure but also increases the risk of in-flight icing due to the sustained presence of widespread cloud systems.
2.2 In Situ Aircraft Measurements
On 13 December 2015, a Y-12 aircraft conducted a cloud seeding operation for weather modification and in situ cloud observations over the Sichuan Basin. Between 12:00 and 12:30 UTC, the aircraft encountered moderate to severe in-flight icing at an altitude of approximately 3650 m (Yuan et al., 2025). Subsequent analyses of the distributions of SLW, temperature, and aerosol concentrations, together with the synoptic patterns and cloud-system features identified in previous studies (Yuan et al., 2025, Fig. 4), indicate that this case is representative of typical wintertime cloudy and highly polluted meteorological conditions in the Sichuan Basin.
In situ cloud measurements were performed using the Droplet Measurement Technologies (DMT) particle detection system onboard the Y-12 aircraft. The system includes the following instruments: the 20 Hz Airborne Integrated Meteorological Measurement System (AIMMS-20), which provides high-frequency measurements of temperature, humidity, and pressure; the Passive Cavity Aerosol Spectrometer Probe (PCASP), which measures the size and concentration of aerosol particles, typically in the range of 0.1–3 µm; the Cloud Droplet Probe (CDP), which detects cloud droplets with diameters ranging from 2–50 µm, covering the majority of typical cloud droplet sizes; the Cloud Imaging Probe (CIP), which captures images of large cloud particles with diameters from 25–1600 µm; the Precipitation Imaging Probe (PIP), which measures precipitation particles in the 100–6000 µm range; and the hot-wire liquid water content sensor (LWC-300), which provides estimates of bulk liquid water, although its data are not consistently available and often lack baseline adjustments.
For this study, The CDP served as the primary instrument for analysing SLW properties, ensuring consistency across the study. Uncertainty in cloud droplet measurements derived from the CDP is estimated at ± 10%, primarily due to particle sizing errors and the assumption of spherical droplets (Lance et al., 2010; D'Alessandro et al., 2021). In saturated environments, the PCASP's heated inlet may not fully evaporate cloud droplets, potentially leading to the detection of oversized pseudo-particles (Kleinman et al., 2012). Furthermore, some aerosol particles can act as CCN and grow into cloud droplets, increasing measurement uncertainty for aerosols inside clouds compared to those measured outside (Yu et al., 2022). Consequently, only aerosol data collected outside clouds are used in this study.
2.3 Aerosol datasets
Two aerosol datasets are used in this study. The first dataset is derived from the three-dimensional monthly averaged aerosol climatology file provided by the Weather Research Forecasting (WRF) Preprocessing System (WPS). It is based on simulations from the GOCART model for the period 2001–2007, with a horizontal resolution of 0.5°×1.25° (Ginoux et al., 2001; Colarco et al., 2010). This dataset includes both water-friendly aerosol (WFA) and ice-friendly aerosol (IFA) types.
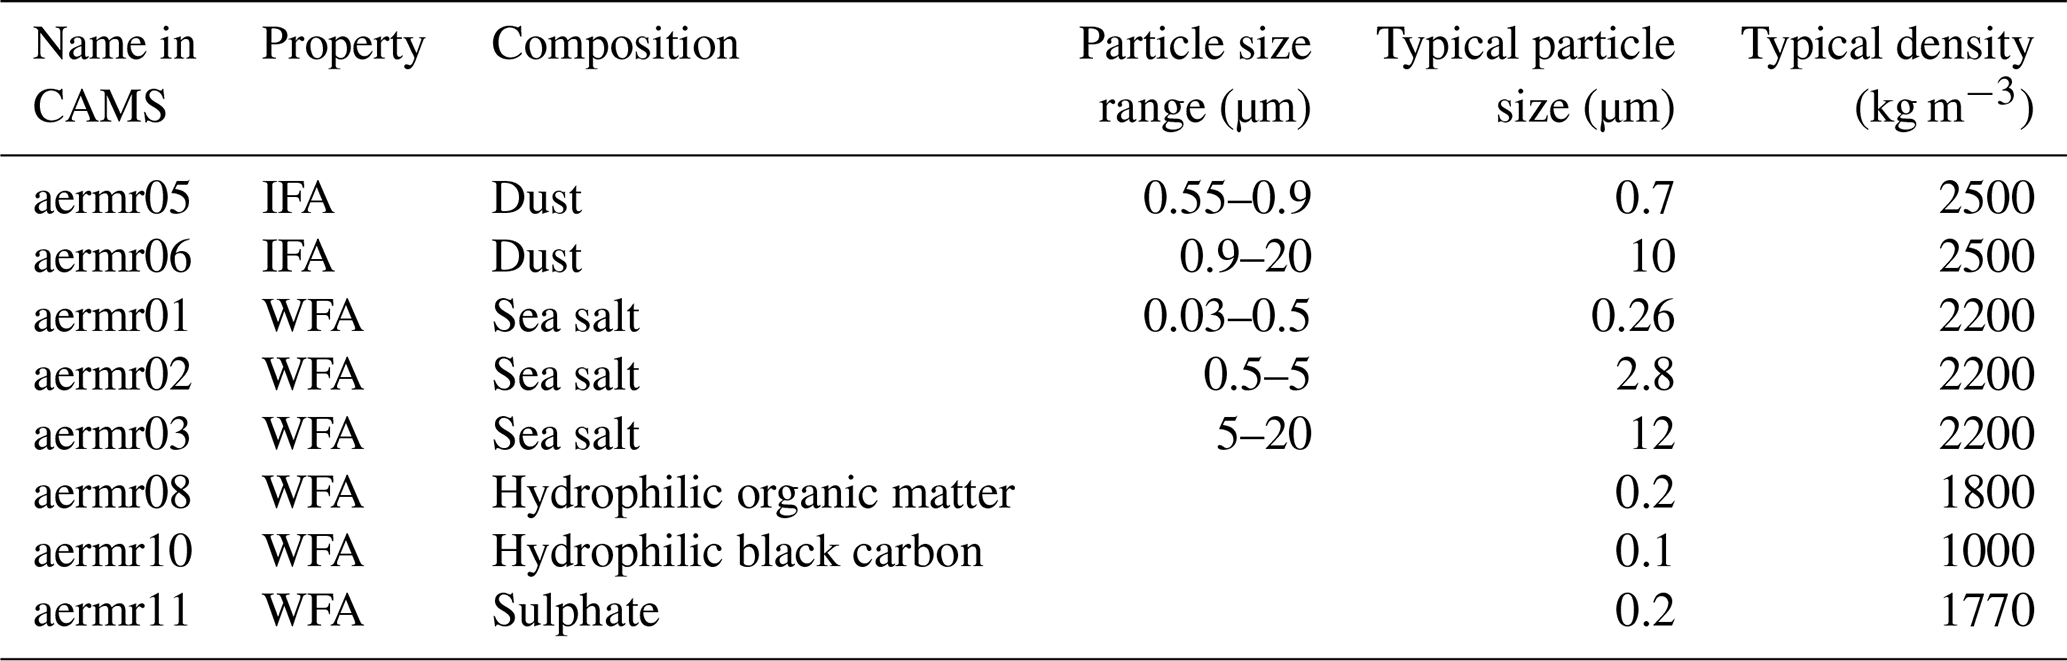
The second dataset is derived from CAMS global reanalysis of atmospheric composition, which provides near-real-time aerosol data with a horizontal resolution of 0.75°×0.75° and a temporal resolution of 3 h (Morcrette et al., 2009; Benedetti et al., 2009; Inness et al., 2019). In the Thompson-Eidhammer aerosol-aware microphysics scheme, dust aerosols with particle sizes greater than 0.5 µm are treated as hydrophobic aerosols and can act as IN. In contrast, hydrophilic organic matter aerosols, hydrophilic black carbon aerosols, sea salt aerosols, and sulfate aerosols are considered CCN. Accordingly, in the CAMS dataset, dust aerosols represented by the variables aermr05 (0.55–0.9 µm) and aermr06 (0.9–20 µm) are classified as IN. Sea salt aerosols, represented by aermr01 (0.03–0.5 µm), aermr02 (0.5–5 µm), and aermr03 (5–20 µm), along with hydrophilic organic matter (aermr08), hydrophilic black carbon (aermr10), and sulfate aerosols (aermr11), are classified as CCN (see Table 1). Compared to climatological datasets, CAMS offers improved temporal resolution and more accurate regional aerosol distributions, making it particularly suitable for studies requiring high-resolution, time-varying aerosol inputs.
Since the aerosol concentrations provided by CAMS are expressed in mass mixing ratios (kg kg−1), whereas the Thompson-Eidhammer aerosol-aware microphysics scheme requires aerosol number concentrations (kg−1), a conversion is performed in this study. For aerosol species without specified particle size ranges, namely, hydrophilic organic matter, hydrophilic black carbon, and sulfate, aerosol number concentrations are derived using typical particle sizes and densities representative of East Asian conditions (Chin et al., 2002; Li et al., 2020). For dust and sea salt aerosols with defined particle size intervals, the median diameter of each size range is used as the representative particle size for the conversion (see Table 1).
Table 1Types of aerosol represented in CAMS and their typical particle sizes and densities.
2.4 ERA5 data
In this study, European Centre for Medium-Range Weather Forecasts Reanalysis 5 (ERA5) data from the European Centre for Medium-Range Weather Forecasts (ECMWF) are employed as an independent reference to evaluate the WRF simulations. ERA5 is produced with a coupled data assimilation and forecasting system that combines multiple observational datasets with a global numerical weather prediction model, and can therefore be regarded as a reanalysis that closely approximates the observed atmospheric state. ERA5 provides globally complete atmospheric fields with hourly temporal resolution and a horizontal grid spacing of 0.25° (Hersbach et al., 2020). The ERA5 variables used in this work include three-dimensional temperature, cloud liquid water content, and geopotential height, SLW path is derived by vertically integrating the cloud liquid water content, enabling comparison with the model output.
2.5 Model configuration
The WRF model is employed to simulate the in-flight icing event. A two-way nesting approach is used, comprising three nested domains. All domains are initialized simultaneously and integrated for 24 h, from 00:00 UTC on 13 December to 00:00 UTC on 14 December. The model configuration includes 48 vertical levels, with the model top located above 50 hPa and 17 levels below 5 km altitude. Initial and lateral boundary conditions are provided by the NCEP/FNL reanalysis dataset, with a horizontal resolution of 1.0°×1.0°. As shown in Fig. 1, the horizontal resolutions of the outermost to innermost domains are 9, 3, and 1 km, respectively, with corresponding time steps of 30, 10, and 3.3 s. The outermost domain covers most of China and is used to analyse the synoptic-scale patterns and spatial distribution of SLW, while the innermost domain focuses on the southern Sichuan Basin and is used to investigate the microphysical characteristics of SLW.
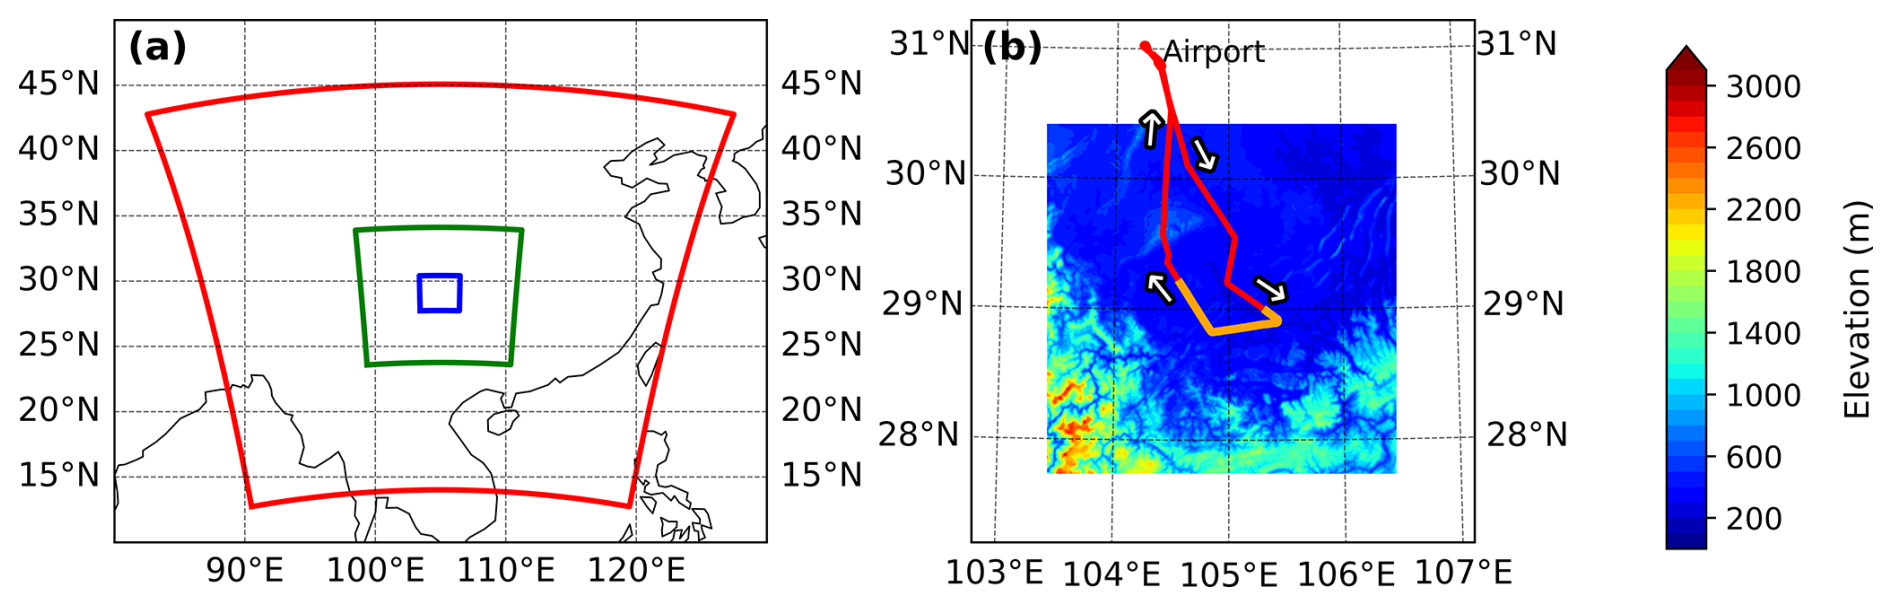
Figure 1(a) Configuration of nested domains used in the WRF simulations (D01: outermost domain, D02: second domain, D03: innermost domain), (b) topography of innermost domain and flight paths (red), orange represents the location of in-flight icing, white arrow represents the direction of flight.
In addition to the Thompson-Eidhammer aerosol-aware microphysics scheme (Thompson and Eidhammer, 2014), shortwave and longwave radiation are controlled by the Dudhia scheme (Dudhia, 1989) and the Rapid Radiative Transfer Model (RRTM) scheme (Mlawer et al., 1997), respectively. The Noah Land Surface Model (Chen and Dudhia, 2001) is employed to simulate land surface processes, while the Yonsei University scheme is used for planetary boundary layer parameterization (Hong et al., 2006). The Kain-Fritsch convection parameterization scheme (Kain, 2004) is activated in the outermost domain but deactivated in the middle and innermost domains, as the higher spatial resolution in these regions allows for an explicit representation of convective processes (Yu and Lee, 2010).
The Thompson-Eidhammer aerosol-aware microphysics scheme is an advanced and widely adopted double-moment bulk cloud microphysics scheme implemented in the WRF model. The core of this scheme lies in its ability to explicitly incorporate the influence of aerosols into the initial formation processes of cloud droplets and ice crystals. The aerosol-aware capability is achieved through the explicit handling of two key aerosol variables: WFA and IFA number concentration. WFA refers to hygroscopic aerosol particles that readily activate into cloud droplets. The scheme calculates the number concentration of activated cloud droplets as a function of WFA number concentration, atmospheric supersaturation, and temperature, based on a built-in CCN activation parameterization. IFA, on the other hand, represents aerosol particles capable of acting as IN under supercooled conditions. The number concentration of ice crystals is diagnosed using an IN activation scheme that depends on the IFA number concentration, temperature, and relative humidity. The WFA and IFA number concentrations can be specified through several approaches: fixed background values, offline input from observational or reanalysis datasets, or online coupling with chemical transport models. In this study, we adopt fixed background values and reanalysis datasets inputs. When reanalysis datasets are used as inputs for the initial aerosol concentrations, a simplified treatment is adopted in which a constant-in-time surface aerosol emission is calculated based on the mean surface wind and the initial near-surface number concentration of WFA, and is implemented as a variable lower boundary condition. As demonstrated by Thompson and Eidhammer (2014), this approach maintains aerosol number concentrations close to climatological conditions over most regions, indicating that it is preferable to keeping the initial aerosol concentrations fixed throughout the simulation.
2.6 Numerical experiments
To examine the impact of initial aerosol conditions on the simulation of SLW, three numerical experiments are designed with different initial aerosol configurations: (a) The default vertical aerosol profile of the Thompson-Eidhammer aerosol-aware microphysics scheme (Default), in which the CCN concentration decreases exponentially from 3×102 cm−3 near the surface to 50 cm−3 at higher altitudes, and the IN concentration decreases exponentially from 1.5 cm−3 near the surface to 0.5 cm−3 at higher altitudes, without accounting for the spatiotemporal variability; (b) the three-dimensional monthly averaged aerosol climatology dataset provided by the WPS (Climatology); (c) real-time aerosol number concentration data from CAMS on December 13, obtained after converting the original mass mixing ratios to number concentrations. All experiments employ identical dynamical and physical parameterizations, differing only in their initial aerosol fields. The initial and boundary conditions are derived from the NCEP/FNL reanalysis, ensuring consistency in the large-scale environmental background.
To compare the initial CCN and IN number concentrations across different numerical experiments, Fig. 2 presents their vertical profiles within the in-flight icing region (indicated by the orange path in Fig. 1b) and compares them with in situ aerosol observations obtained from PCASP. It is important to note that PCASP records total aerosol particle concentrations, without distinguishing between aerosol types. Near the surface (Fig. 2a), the default experiment shows a CCN concentration of approximately 2×102 cm−3, which is about two orders of magnitude lower than that of the Climatology and CAMS experiments (2×104 cm−3 and 104 cm−3, respectively). This discrepancy reflects the idealized, relatively clean environment represented by the Default experiment. In contrast, the Climatology and CAMS experiments represent more polluted background conditions. Notably, the CAMS experiment aligns more closely with the PCASP observations and more accurately reproduces the vertical distribution of aerosols. For IN (Fig. 2b), the CAMS experiment exhibits a concentration on the order of 10−3 cm−3, which is approximately three orders of magnitude lower than the values in the Climatology and Default experiments, indicating a much lower IN environment.
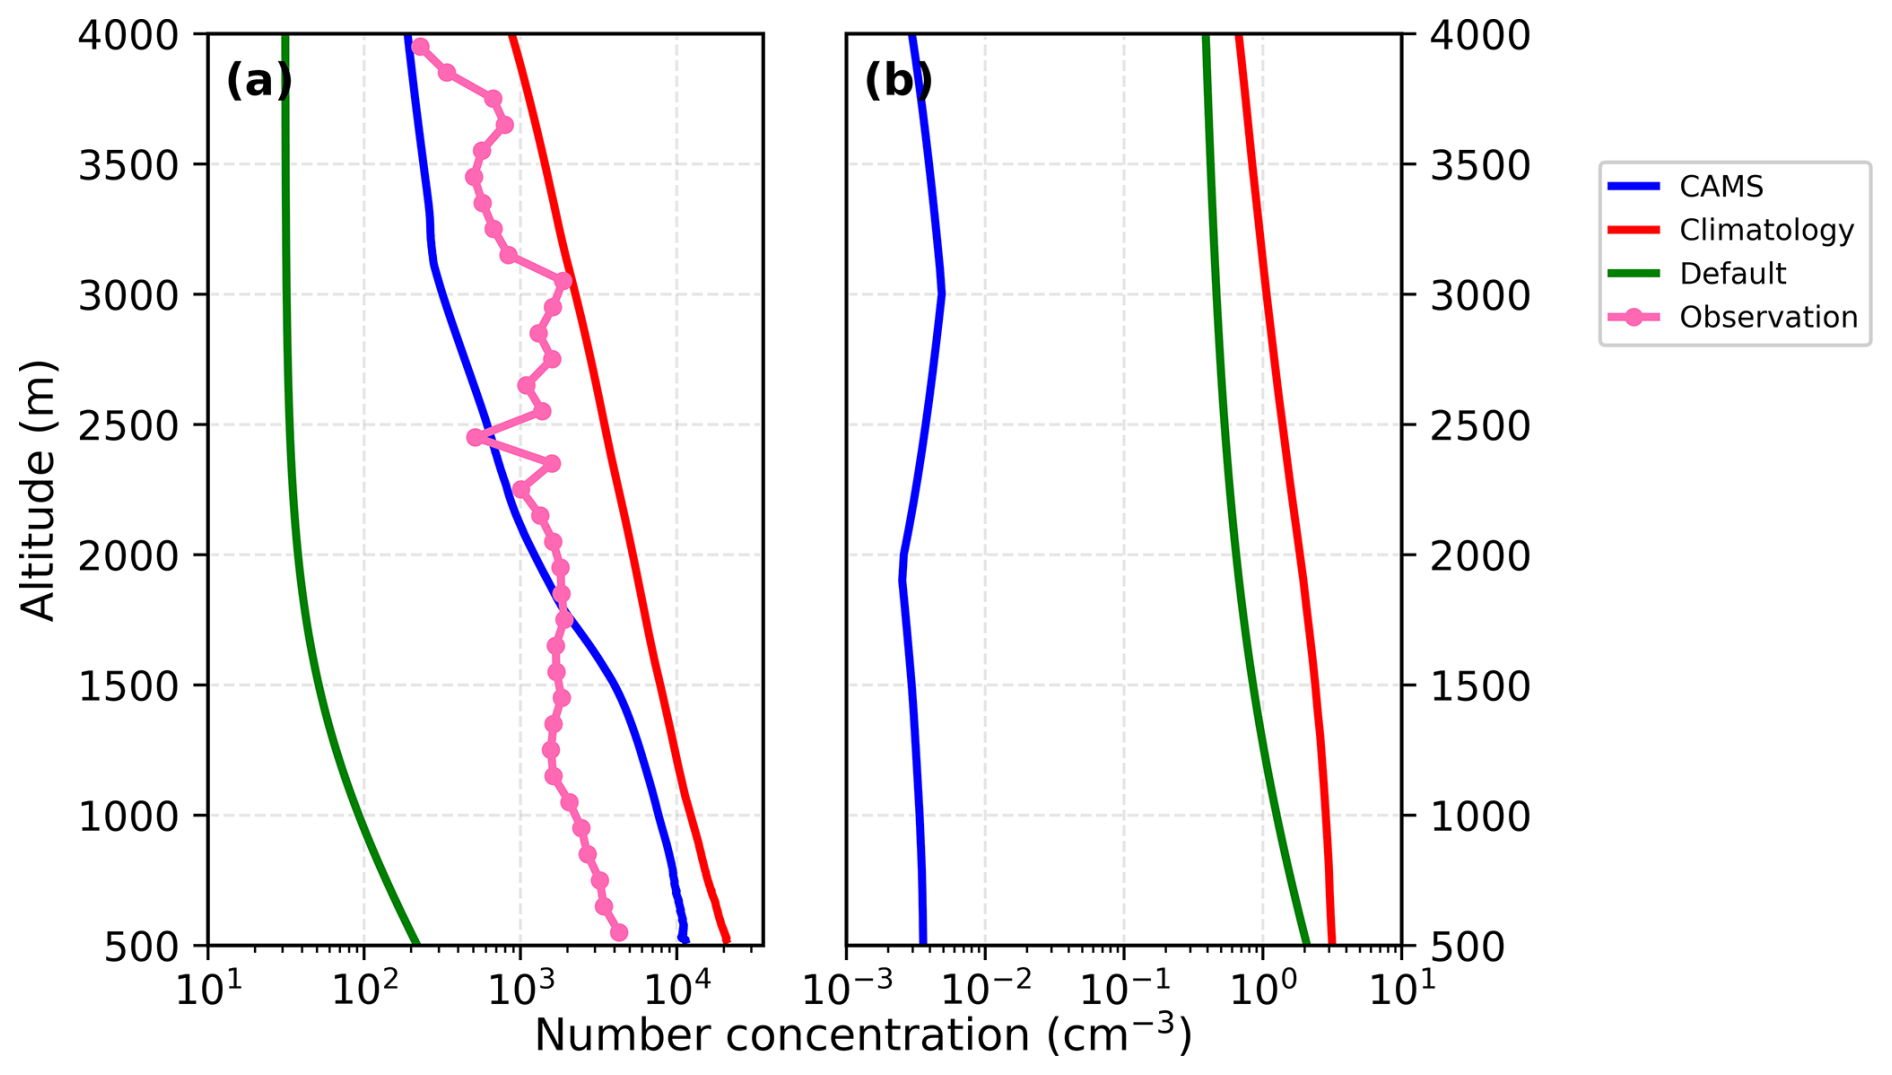
Figure 2Vertical profiles of initial CCN (left) and IN (right) number concentrations for Default (green), Climatology (red), CAMS (blue) experiments, along with the aerosol number concentration from PCASP (pink).
2.7 Prediction of MVD
The Thompson-Eidhammer aerosol-aware double-moment microphysics scheme predicts both the mass mixing ratio and number concentration of cloud water, enabling the diagnosis of characteristic droplet sizes such as the MVD. The scheme represents the cloud droplet size distribution using a generalized gamma distribution (Thompson et al., 2008):
where N(D) represents the number of droplets per unit volume, N0 is the intercept parameter, and μ is the shape parameter of the size distribution, given by:
where Nc represents the CDNC in units of droplets per cubic centimeter. The slope parameter λ in Eq. (1) is defined as:
where ρw is the density of water, LWC is the liquid water content. Based on the above equations and descriptions, the MVD can be diagnosed using the relationship derived by Eq. (4):
3.1 Spatiotemporal distribution of SLW
Figure 3 compares the simulated synoptic-scale distributions of the 700 hPa temperature field and SLW path at 12:00 UTC on 13 December 2015 with the ERA5 reanalysis. Although the aerosol concentrations differ substantially among the three experiments, their simulated spatial distributions of temperature and SLW are generally consistent, except for a notable difference in SLW magnitude (Fig. 3a–c). Specifically, a warm temperature ridge is present between 105 and 110° E, north of 30° N, with a temperature of approximately −4 °C at the in-flight icing location. The obstruction of airflow by the surrounding topography, as described in Sect. 2.1, promotes the formation of stratiform cloud systems within the basin during winter and is evident in the distribution of SLW. SLW is primarily concentrated in the Sichuan Basin and its eastern surroundings, situated east of the Tibetan Plateau and north of the Yunnan-Guizhou Plateau. The maximum SLW values occur along the southwest margin of the basin, near the in-flight icing location. The Climatology and CAMS experiments simulate significantly higher SLW values than the Default experiment.
The synoptic-scale distributions of temperature and SLW path in ERA5 (Fig. 3d) are generally consistent with those in the three numerical experiments, but the locations of the SLW maxima differ. The simulations place the peak SLW west of the in-flight icing region along the mountainous margins of the basin, whereas ERA5 does not capture these maxima. This discrepancy is primarily attributable to the relatively coarse spatial resolution of ERA5 (approximately 30 km), which is insufficient to resolve the physical processes and atmospheric dynamics associated with topographically induced local ascent over complex terrain. As a result, orographic uplift and the accompanying cloud structures are smoothed or displaced, leading to biases in the SLW path. In addition, the scarcity of observational data in mountainous regions poses challenges for the assimilation process, further reducing the reliability of the cloud water fields (Jiao et al., 2021; Wang et al., 2025; Hellmuth et al., 2025).

Figure 3Spatial distribution of SLW path (shaded, unit: kg m−2) and 700 hPa temperature fields (colour lines, unit: °C) for (a) default, (b) climatology, (c) CAMS, and (d) ERA5 reanalysis. Red triangles denote the observed icing locations.
Figure 4 presents the time-altitude evolution of hydrometeor properties averaged over the in-flight icing region (An area centered at 29° N, 105° E, extending 50 km in all directions, encompasses the orange path shown in Fig. 1b). In the default experiment, both the SLW content and number concentration are relatively small due to the low aerosol concentrations. In contrast, the Climatology and CAMS experiments, which feature higher aerosol concentrations, simulate greater SLW content and number concentration. This enhancement is attributed to the activation of a greater number of CCN into cloud droplets under elevated aerosol conditions, thereby promoting SLW formation, a manifestation of the first aerosol indirect effect (Twomey, 1977). Since SLW is primarily generated during night-time hours (12:00–20:00 UTC), the increased CDNC does not affect cloud albedo or the radiative cooling of the cloud system. This is reflected in the similar heights of the isotherms across all three experiments. In the cleaner environment (Default), SLW is more efficiently depleted through collision-coalescence processes, leading to a reduction in SLW between 3000 and 4000 m beginning around 14:00 UTC and a shortened cloud lifetime. In contrast, in the more polluted environments (Climatology and CAMS), reduced rain formation via collision-coalescence delays the depletion of SLW until approximately 17:00 UTC, thereby extending the cloud lifetime. This behavior aligns with the second aerosol indirect effect, which associates higher CDNC with suppressed precipitation and prolonged cloud duration (Albrecht, 1989).
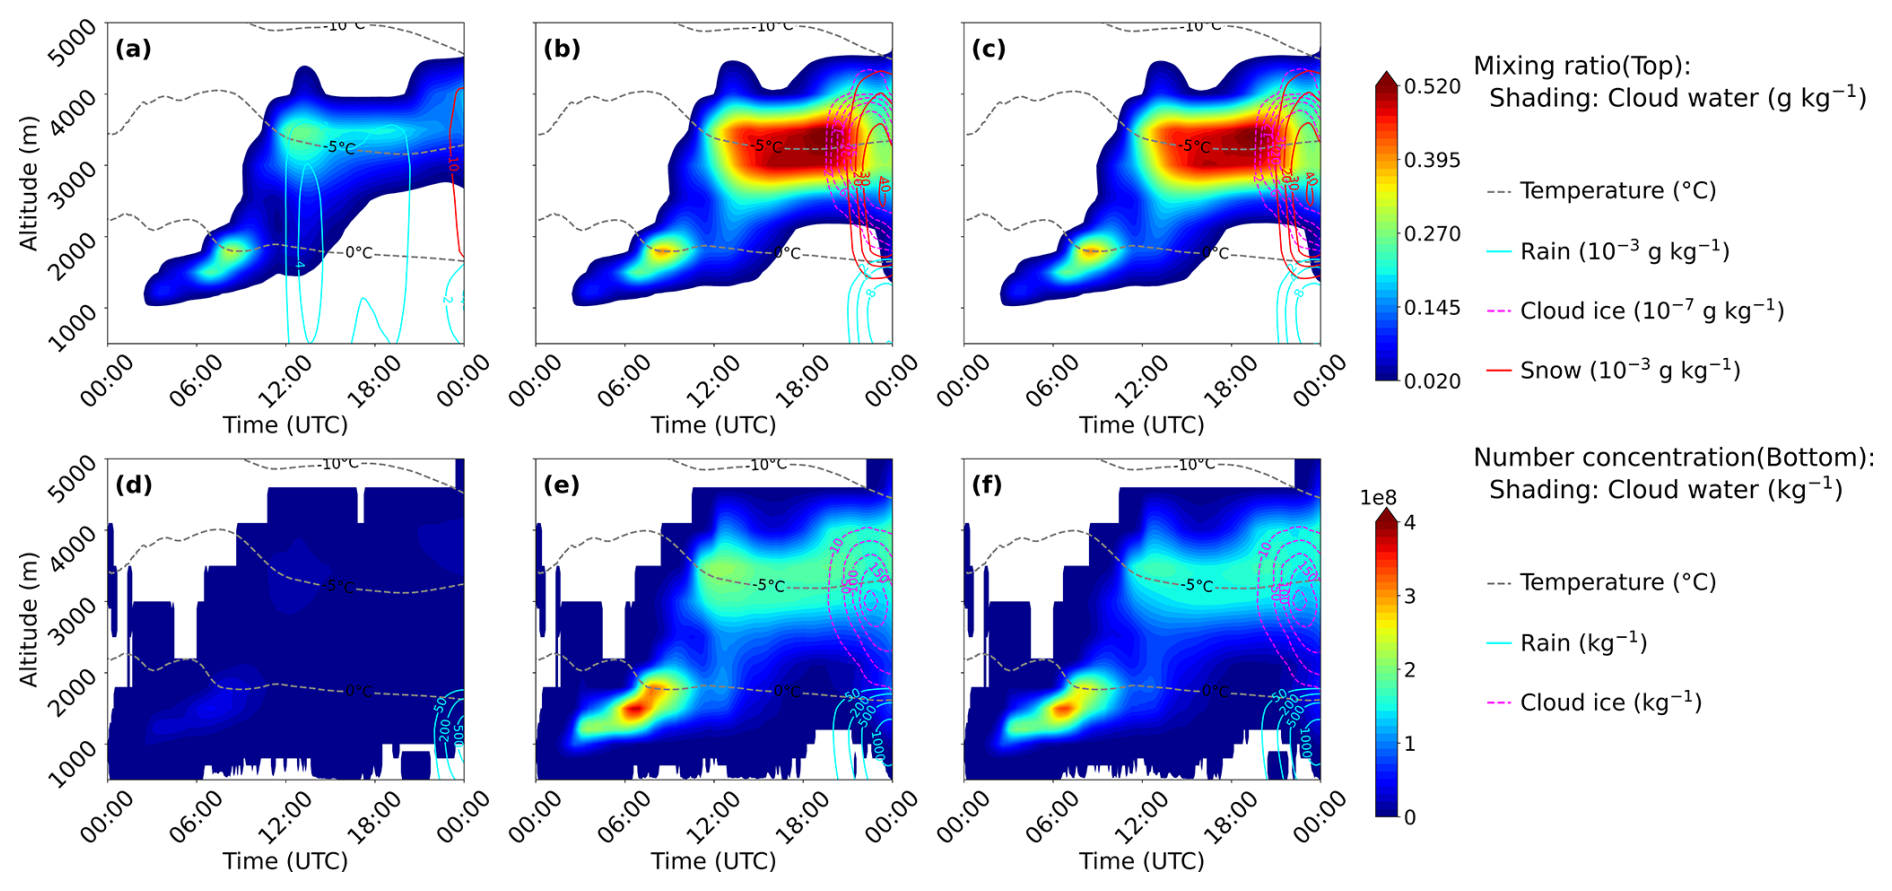
Figure 4Domain-average time-altitude cross section of hydrometeor mass mixing ratio (top) and number concentration (bottom) averaged over the in-flight icing region (orange path in Fig. 1b) for the three experiments: Default (left), Climatology (middle) and CAMS (right).
3.2 SLW microphysics
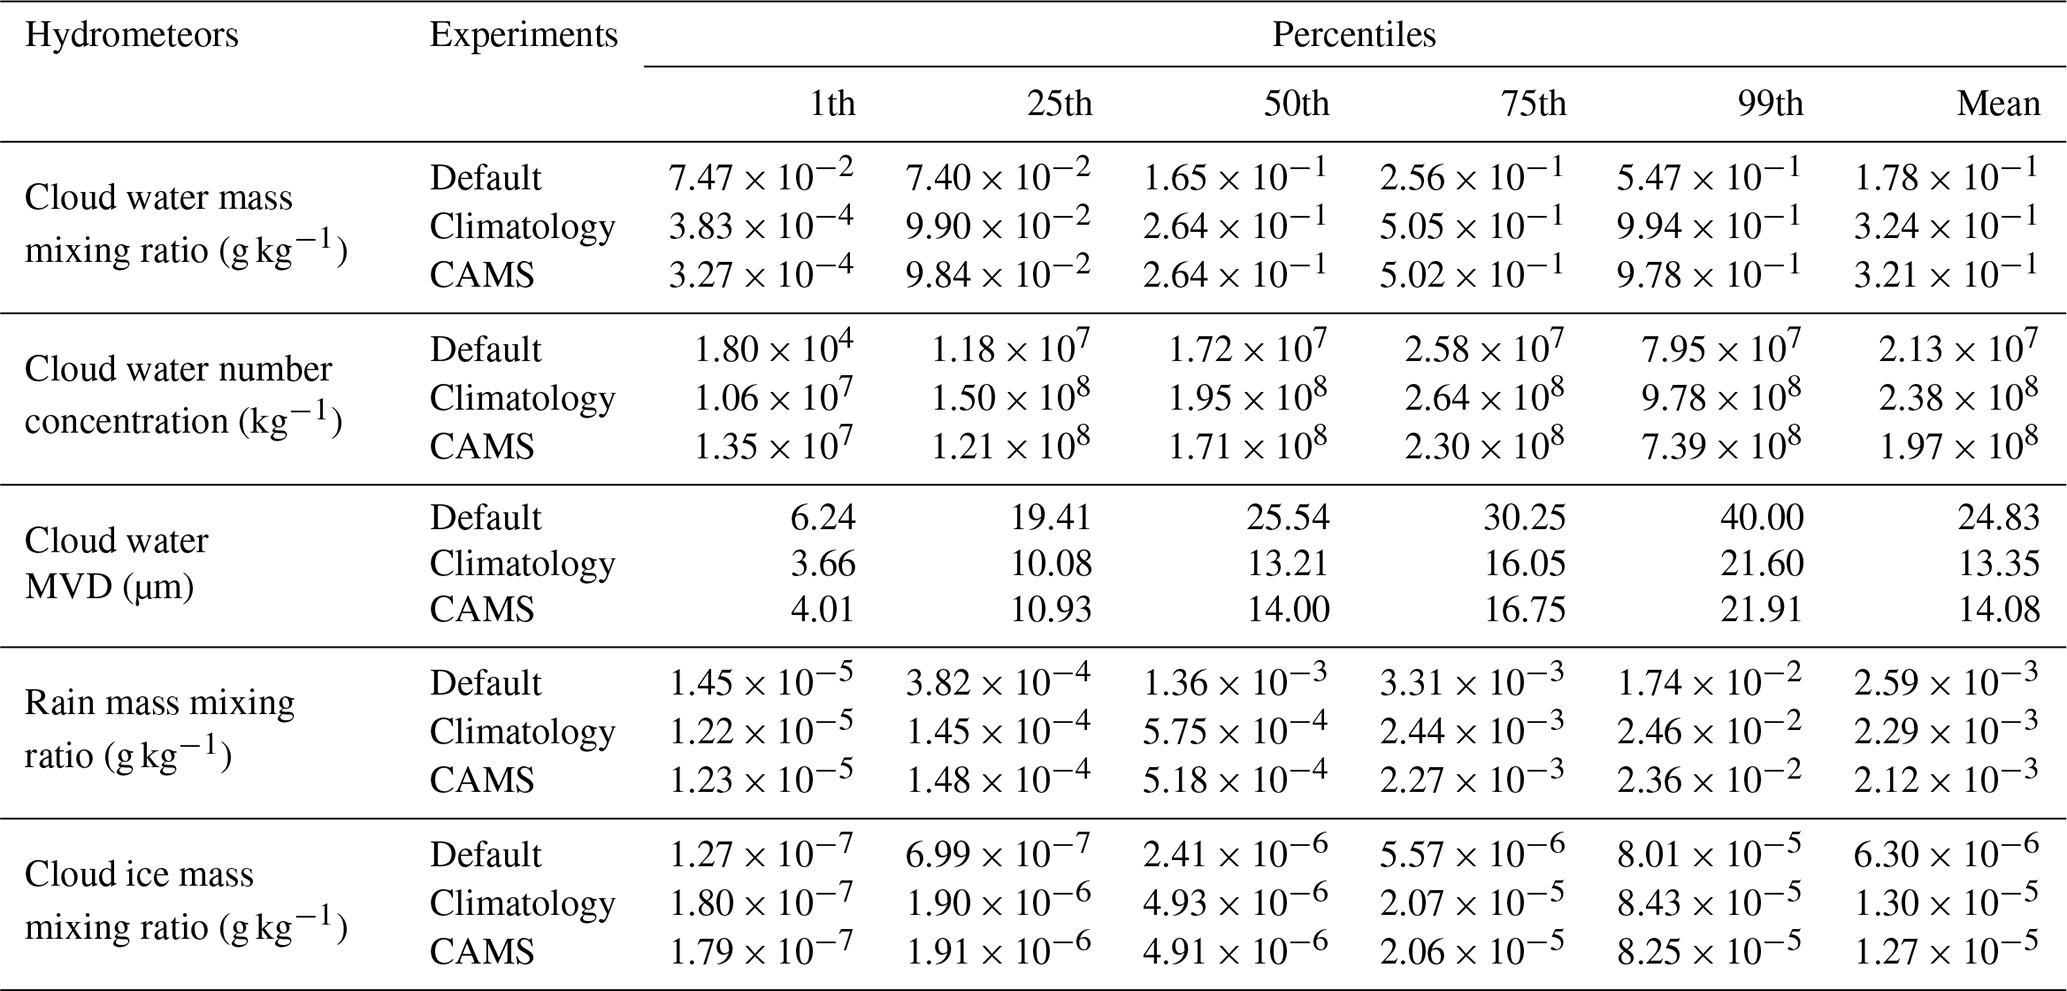
To quantitatively evaluate the simulated hydrometeor properties in the in-flight icing region, Table 2 summarizes the properties of hydrometeors over all simulated times and spatial domains for the three experiments. Compared with the average cloud water mass mixing ratio of 0.178 g kg−1 in the Default experiment, both the Climatology and CAMS experiments exhibit higher values. However, the difference between Climatology and CAMS is relatively small (see Fig. 4b–c), with both exhibiting a median value of 0.264 g kg−1 and mean values of 0.324 and 0.321 g kg−1, respectively. In contrast, the number concentrations of cloud water differ more significantly between the two polluted experiments (Fig. 4e–f), with median values of 1.95×10⁸ kg−3 for Climatology and 1.71×10⁸ kg−3 for CAMS. This is attributed to the higher aerosol concentrations in the Climatology experiment.
Based on the simulated cloud water mass mixing ratio and number concentration, the MVD can be diagnosed using the method described by Eq. (4). In the cleaner environment (Default), the lower CDNC results in a larger MVD, with an average of 24.8 µm, significantly greater than those in the Climatology (13.4 µm) and CAMS (14.1 µm) experiments. The larger droplet size enhances the efficiency of collision-coalescence processes, leading to greater rain formation (Hoffmann and Feingold, 2023). This is reflected in the higher median rain mass mixing ratio in the Default experiment ( g kg−1), which is approximately an order of magnitude greater than those simulated under the more polluted conditions.
Table 2The percentiles of the mass mixing ratios, number concentrations, and MVD of hydrometeors for the Default, Climatology, and CAMS experiments.
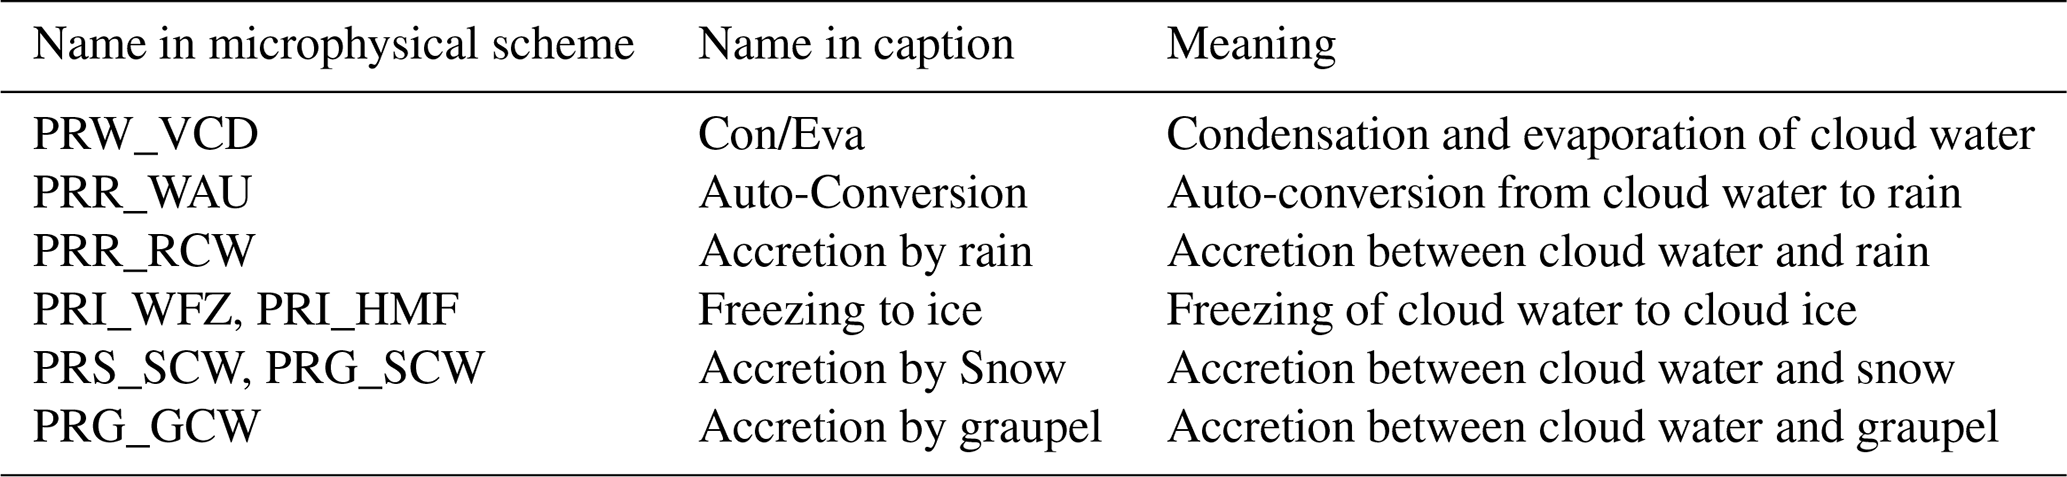
The above speculation regarding the influence of droplet size on the efficiency of the collision-coalescence process is further supported by analysing the source and sink terms of cloud water. Figure 5 shows the vertical profiles of cloud water mass tendency in the in-flight icing region between 12:00 and 14:00 UTC. This period is chosen because it corresponds to the gradual increase in rain in the Default experiment (Fig. 4a). The specific source and sink terms related to cloud water mass tendency are listed in Table 3. As shown in Fig. 5a, the primary sink term for SLW is the auto-conversion from cloud water to rain, which is driven mainly by collision-coalescence processes. Accretion between cloud water and rain is a secondary sink term. The largest contributor to cloud water mass tendency is the water vapor condensation term. As a result, despite the effects of the two sink terms, the cloud water mass tendency remains positive, leading to a gradual increase in SLW. In contrast, for the Climatology and CAMS experiments (Fig. 5b, c), the smaller MVD results in less efficient collision-coalescence processes. Consequently, the auto-conversion from cloud water to rain and the accretion between cloud water and rain are negligible, resulting in a rapid increase in SLW.
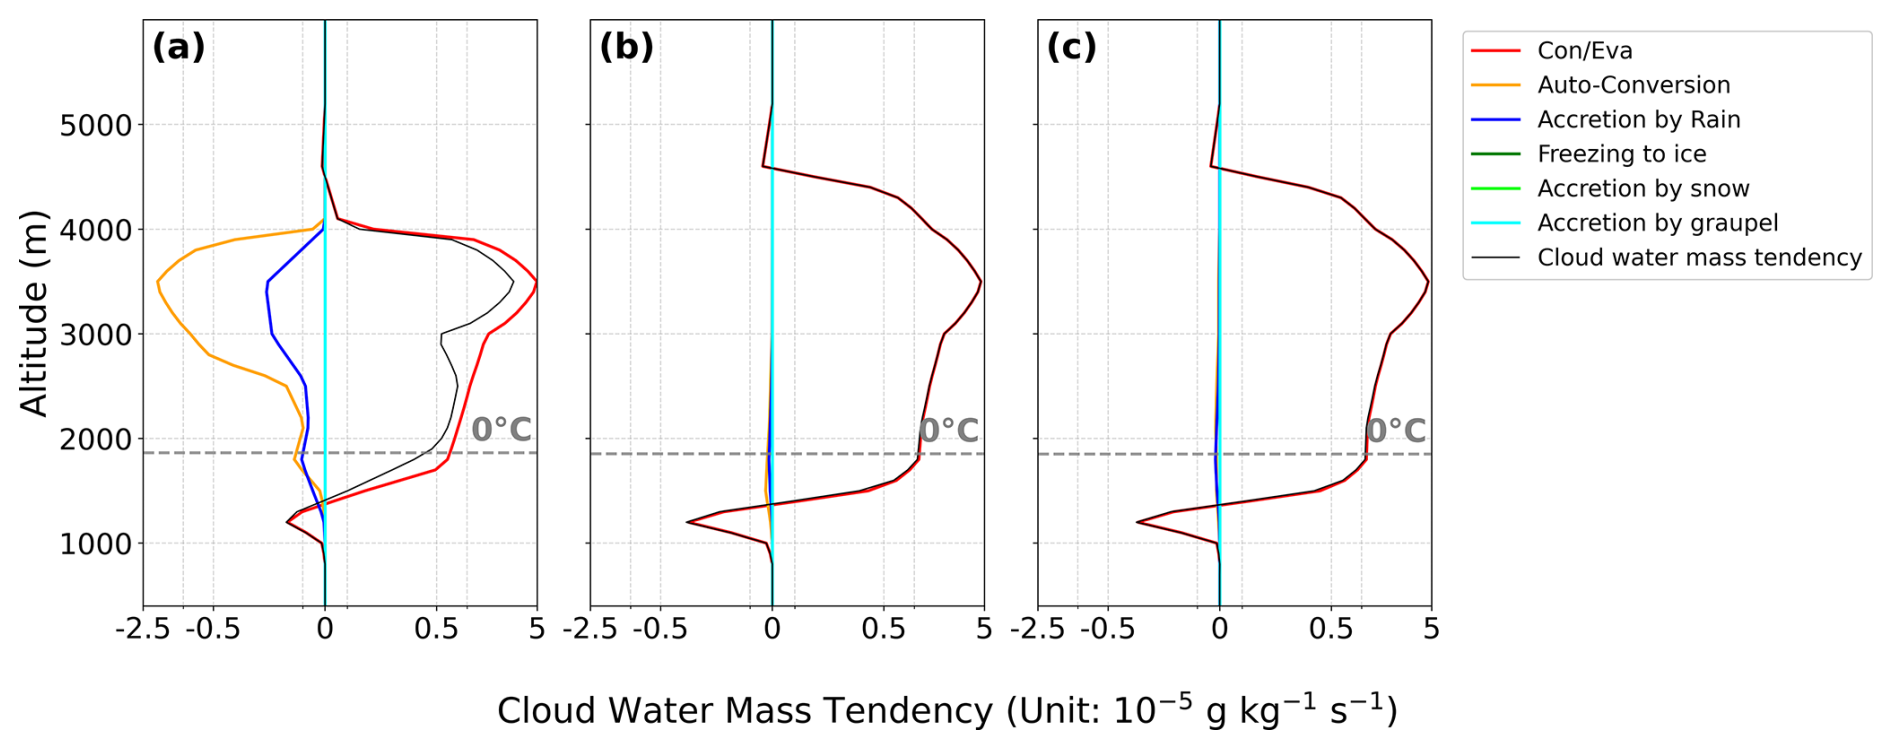
Figure 5Time-domain-average vertical profiles of cloud water mass tendency for Default (left), Climatology (middle) and CAMS (right) from 12:00 to 14:00 UTC.
Table 3List of source and sink terms and their definitions related to cloud water mass tendency.
In addition, the smaller size of SLW in the Climatology and CAMS experiments may also contribute to the pronounced increase in cloud ice in the upper levels and rain in the lower levels after 18:00 UTC, accompanied by a corresponding reduction in SLW (Fig. 4b–c). As noted by Pruppacher et al. (1998), small supercooled droplets are more efficiently collected by ice crystals or snow, thereby accelerating the depletion of SLW. Moreover, their larger surface-area-to-volume ratio makes them more prone to evaporation, supplying more water vapor to the surrounding environment and serving as primary contributors to the Wegener-Bergeron-Findeisen process. The cloud water source and sink terms shown in Fig. 6 further support this conclusion. Compared with the Default experiment, the Climatological and CAMS experiments exhibit substantially larger accretion terms between cloud water and snow – i.e., stronger riming processes (Fig. 6b–c). Together with enhanced cloud water evaporation, these processes contribute to the depletion of SLW below 3500 m.
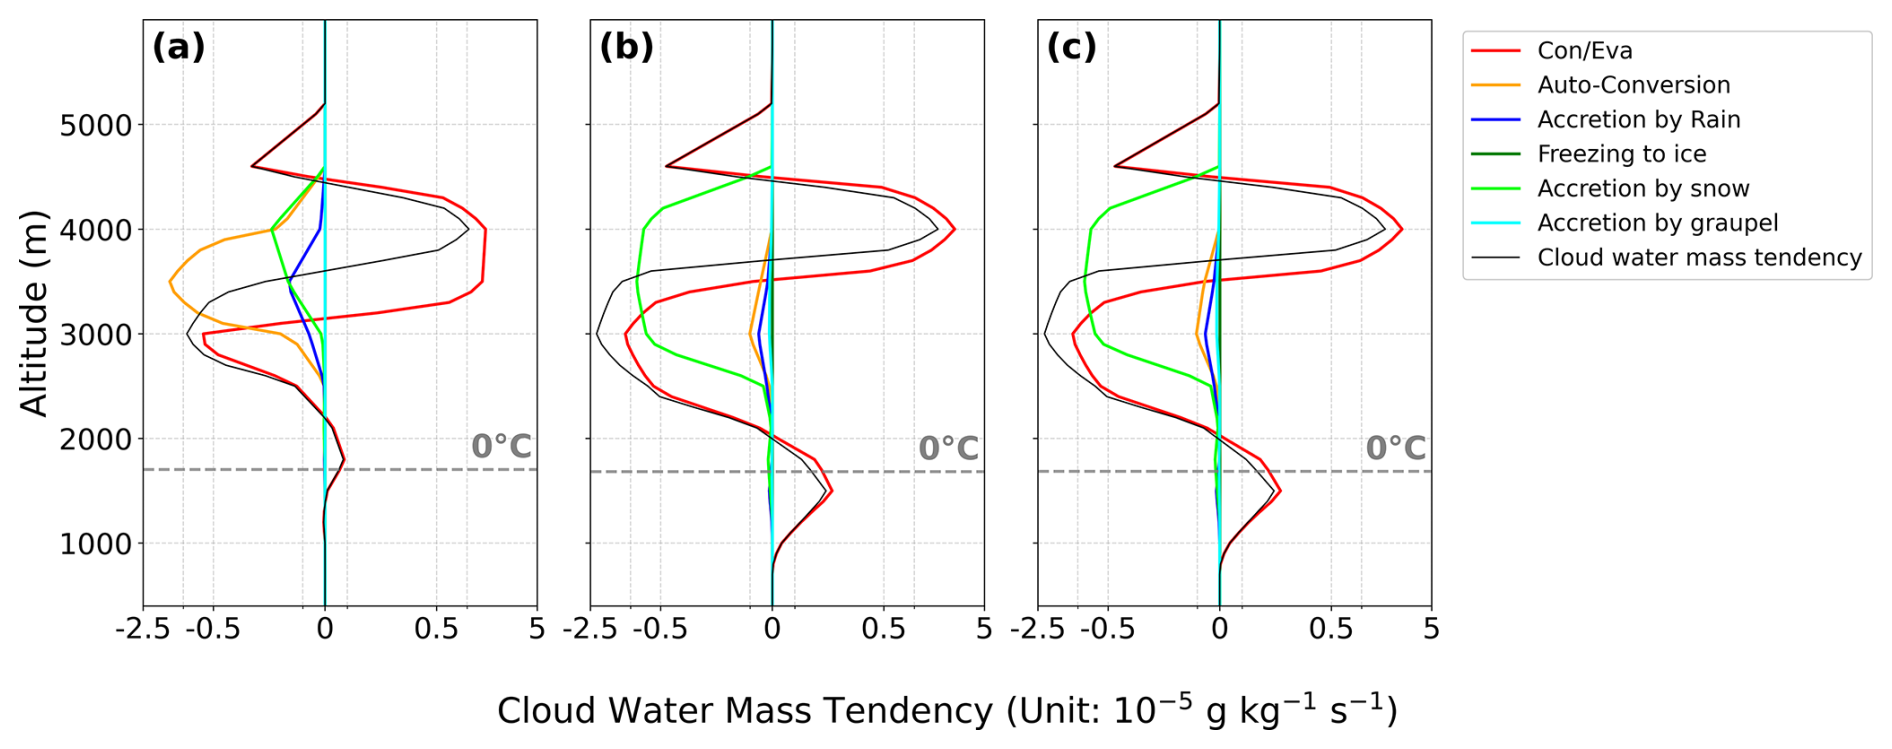
Figure 7 quantifies the distribution of SLW at different temperatures. In the Default experiment, the majority (99th percentile) of SLW values are below 0.8 g kg−1, and the 50th percentile of simulated SLW remains around 0.15 g kg−1 regardless of temperature. When the temperature is below 0 °C, the 99th percentile of SLW decreases markedly as the temperature decreases, and only a small proportion of SLW is present at temperatures below −10 °C. This phenomenon was also reported by Thompson et al. (2017, Fig. 2), who explained that once ice forms at lower temperatures, cloud glaciation accelerates, thereby reducing the amount of SLW.
When the temperature is above 0 °C, the cloud water mass mixing ratio increases rapidly with decreasing temperature and reaches its maximum near the 0 °C isotherm, as water vapor preferentially condenses in this thermal transition zone. Although aerosol concentrations are typically highest near the surface (Fig. 2a), CCN can only be activated into cloud droplets after being lifted to altitudes corresponding to the 0 °C level, where they encounter supersaturated conditions.
In the Climatology and CAMS experiments (Fig. 7b–c), all percentiles of SLW are higher than those in the Default experiment, with the 99th percentile of simulated SLW reaching approximately 0.9 g kg−1. Unlike the Default experiment, the Climatology and CAMS experiments show that when the temperature is above −7 °C, SLW values below the 75th percentile increase with decreasing temperature, but decline sharply below −7 °C. This suggests that above −7 °C, the enhancement of SLW due to the first aerosol indirect effect is sufficient to offset the depletion of SLW caused by cloud glaciation. Additionally, when the temperature is around −9 °C, SLW in the Climatology and CAMS experiments exhibits a secondary peak. This is attributed to the first aerosol indirect effect not only increasing SLW but also deepening the cloud system (see Fig. 4b–c), thereby producing a second SLW peak at a higher altitude corresponding to −9 °C.
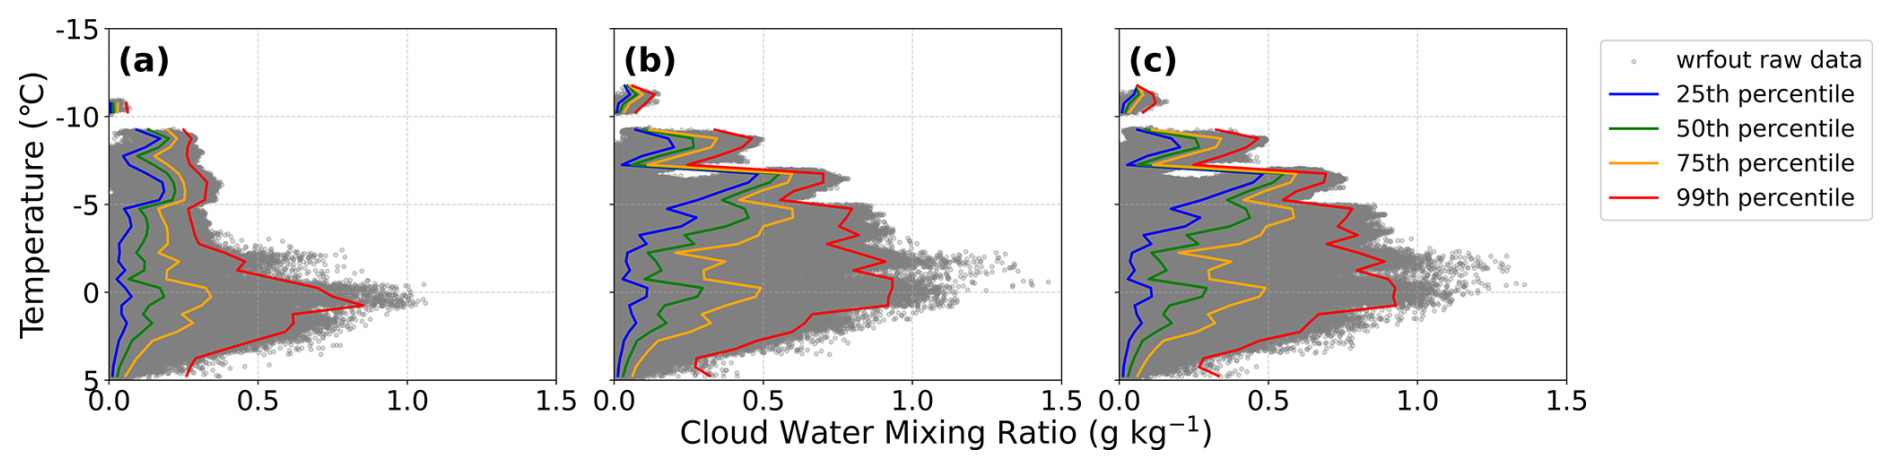
Figure 7Scatterplot of temperature (° C) and cloud water mass mixing ratio (g kg−1) with the 25th, 50th, 75th, and 99th percentiles for each degree Celsius for the three experiments: Default (left), Climatology (middle) and CAMS (right).
Figure 8 offers an alternative perspective on the distribution of SLW across different temperature ranges. All three experiments exhibit a rapid decrease in the relative frequency of SLW with every 5 °C drop in temperature. In the clean environment (Fig. 8a), SLW displays a narrow distribution, with the vast majority of values below 0.5 g kg−1. In contrast, in polluted environments (Fig. 8b–c), the frequency of higher SLW values (greater than 0.5 g kg−1) is greater than that in the clean environment, while the frequency around 0.25 g kg−1 is notably lower.
Another notable feature under polluted conditions is the bimodal distribution of SLW within the temperature range of −5 to −10 °C. The peak at 0.25 g kg−1 in the 0 to −5 °C range is accompanied by opposing valleys, with two distinct peaks, one at approximately 0.3 g kg−1 and the other near 0 g kg−1, indicating a relatively higher frequency of low SLW values. In the −10 to −15 °C range, SLW remains consistently low across all three experiments, suggesting that cloud development does not extend SLW to higher altitudes. Moreover, the relative frequency of cloud water in the 0 to 5 °C range peaks near 0 g kg−1, indicating a scarcity of cloud water at these temperatures. This frequency is generally lower than that observed in the 0 to −5 °C range, further supporting the conclusion in Fig. 7, that CCN must be fully lifted to altitudes near the 0 °C level and reach supersaturation to be activated into cloud droplets and subsequently enhance SLW.
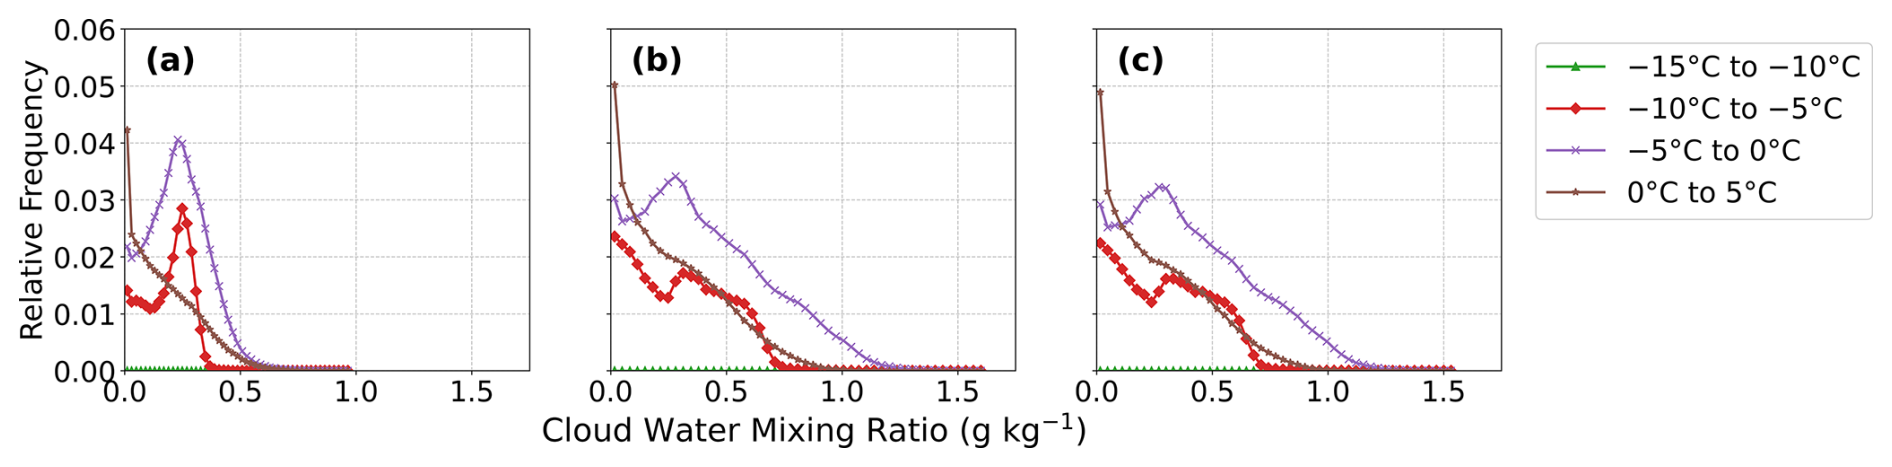
Figure 8Relative frequency of occurrence of specific ranges of cloud water mass mixing ratio (g kg−1) in 5 °C intervals of temperature for the three experiments: Default (left), Climatology (middle) and CAMS (right).
3.3 Comparative assessment of simulated and observed SLW
We first focus on the intriguing phenomena highlighted by the violin and box plots of aerosol and cloud MVD based on PCASP and CDP data (Fig. 9). Below 3000 m, the distributions of the MVD for both aerosols and cloud droplets exhibit a unimodal pattern, with aerosol MVD peaking around 0.3 µm and cloud droplet MVD peaking around 4 µm. This indicates that cloud droplets are primarily in the initial stage of activation and condensational growth (Twomey, 1959). During this stage, the abundant aerosol particles in the lower layers, particularly those around 0.3 µm, competes for limited water vapor, resulting in slower droplet growth, a relatively uniform droplet size spectrum, and cloud droplet sizes primarily concentrated below 5 µm. Above 3000 m, the MVD distributions of both aerosols and cloud droplets exhibit a clear bimodal pattern. The first peak corresponds to the peak observed below 3000 m. The second peak appears at approximately 2 µm for aerosols and around 15–18 µm for cloud droplets, indicating the presence of larger droplets. This suggests that as the cloud develops and droplets ascend, they continue to grow through collision-coalescence processes, leading to a broadening of the droplet size spectrum (Beard and Ochs, 1993; Seifert and Beheng, 2006; Hoffmann and Feingold, 2023). Additionally, the larger cloud droplets at the second peak may also be formed by the activation of CCN from aerosols at the second peak (Pruppacher et al., 1998).
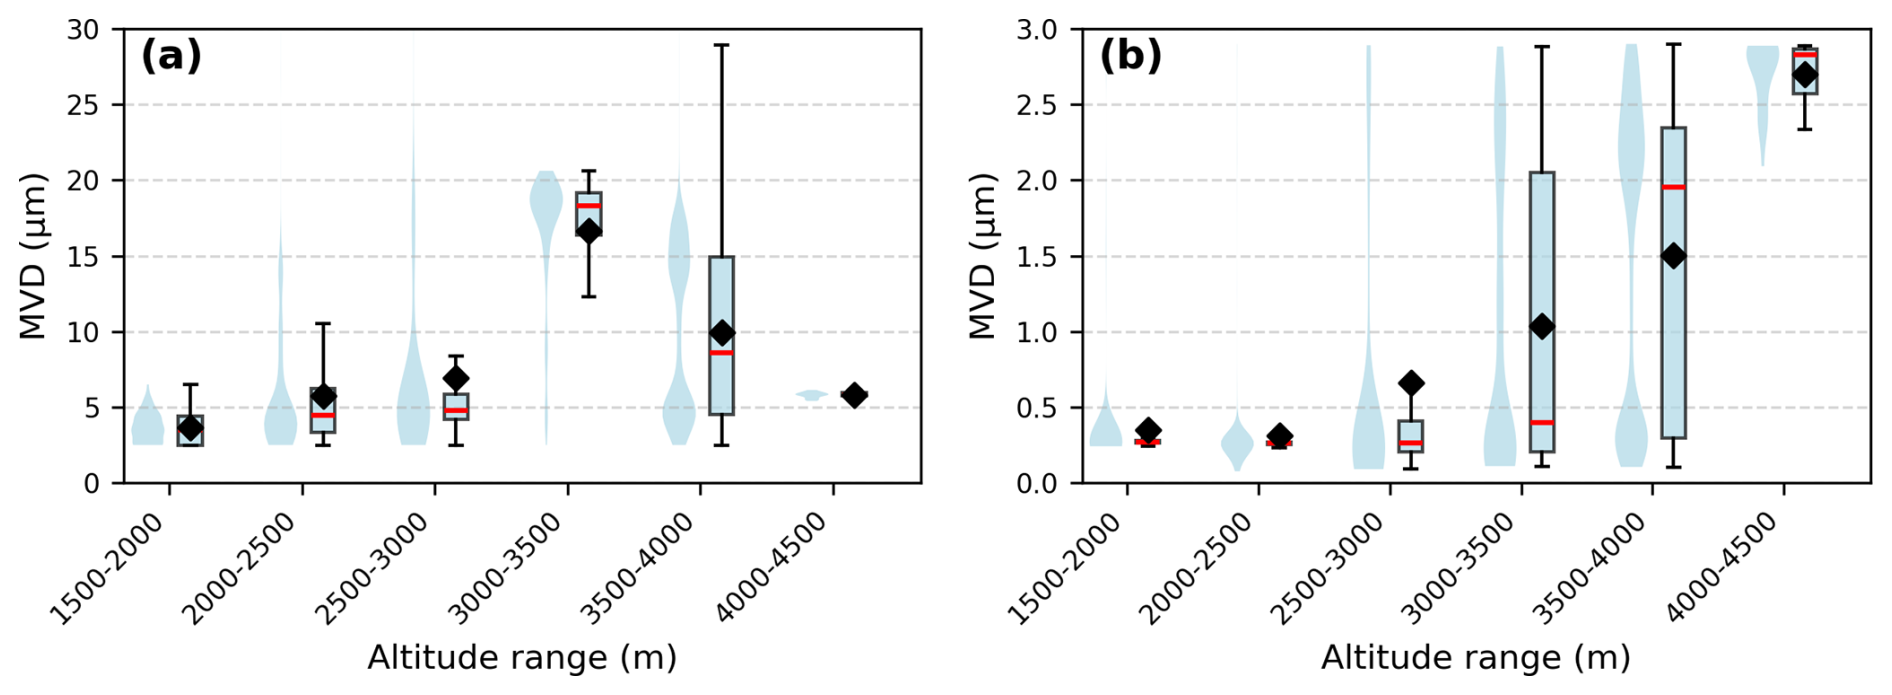
Figure 9Altitude-resolved violin and box plots of MVD for cloud droplets (left) and aerosols (right), in 500 m bins, derived from CDP and PCASP data (The diamonds indicate the mean values, and the red lines denote the medians).
To evaluate the accuracy of simulated SLW properties across different numerical experiments, the simulated SLW within the flight icing region is compared with CDP observations. A time window from 12:00 to 12:30 and an altitude range of 3500–3700 m are selected to match observational and model conditions. In addition, in-cloud criteria consistent with the aircraft in situ measurements (CDNC > 10 cm−3 and LWC > 10−3 g m−3; Zhang et al., 2011) are applied, and simulated data not satisfying these thresholds are excluded. This procedure ensures that the model-observation comparison is restricted to in-cloud conditions only. Figure 10 presents scatter plots of SLW content and MVD derived from CDP measurements (3257 data points) and the three numerical experiments. The CDP observations (black dots) clearly show the bimodal MVD distribution identified in Fig. 9a, with distinct peaks at approximately 4 µm and 15–18 µm. Relative to the CDP data, the scatter from the Default experiment is evidently shifted to the right (Fig. 10a), with a maximum MVD approaching 40 µm, far exceeding the second observed peak, indicating that the Default experiment significantly overestimates MVD. In contrast, the Climatology experiment produces MVD values slightly left of the CDP's second peak (Fig. 10b), implying an underestimation due to excessive aerosol concentrations that suppress droplet growth. The CAMS experiment, while slightly overestimating SLW content, aligns closely with the second MVD peak (Fig. 10c), suggesting improved representation of cloud droplet size. However, all three experiments fail to reproduce the bimodal distribution of MVD or the first peak near 4 µm, highlighting a common limitation in representing small droplet populations.
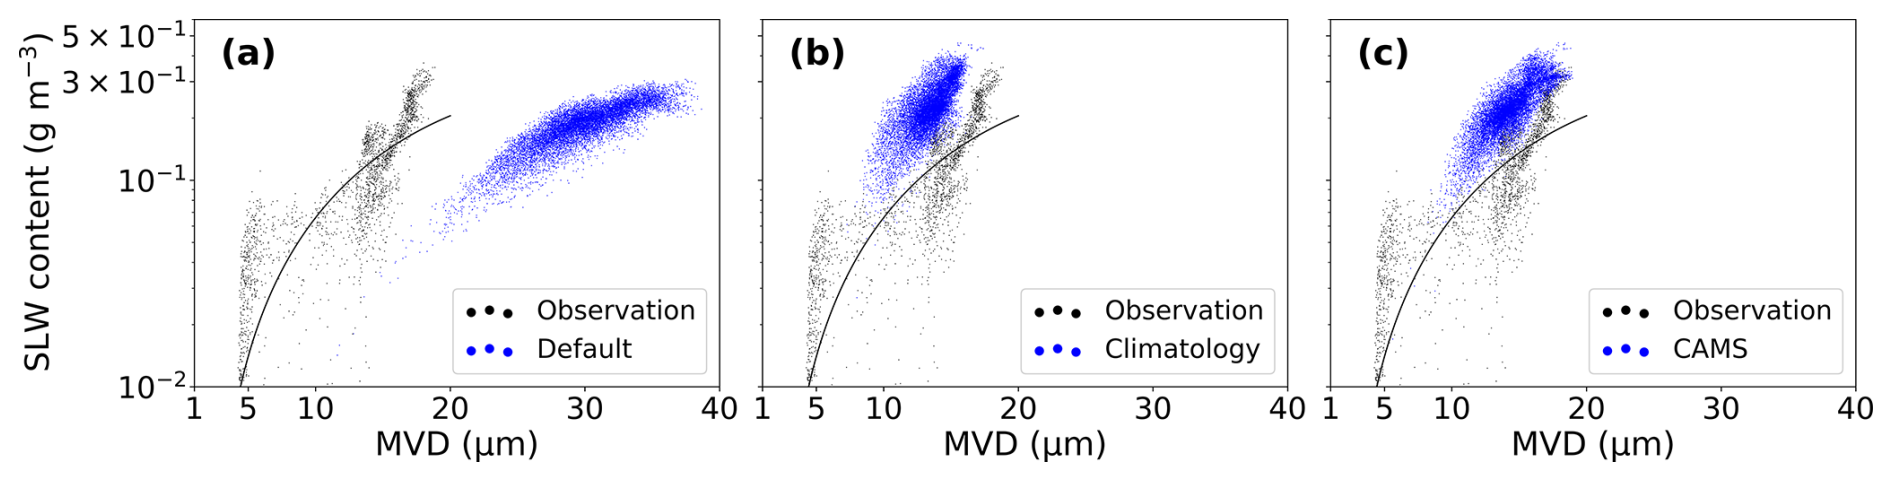
Figure 10Scatter plots of observed (black points) and simulated (blue points) SLW content versus MVD for the three experiments: Default (left), Climatology (middle), and CAMS (right). The black line represents the cubic curve fitted to the observed data points.
Table 4The percentiles of the content, number concentration, and MVD of SLW for the Default, Climatology, CAMS experiments, and CDP observation.
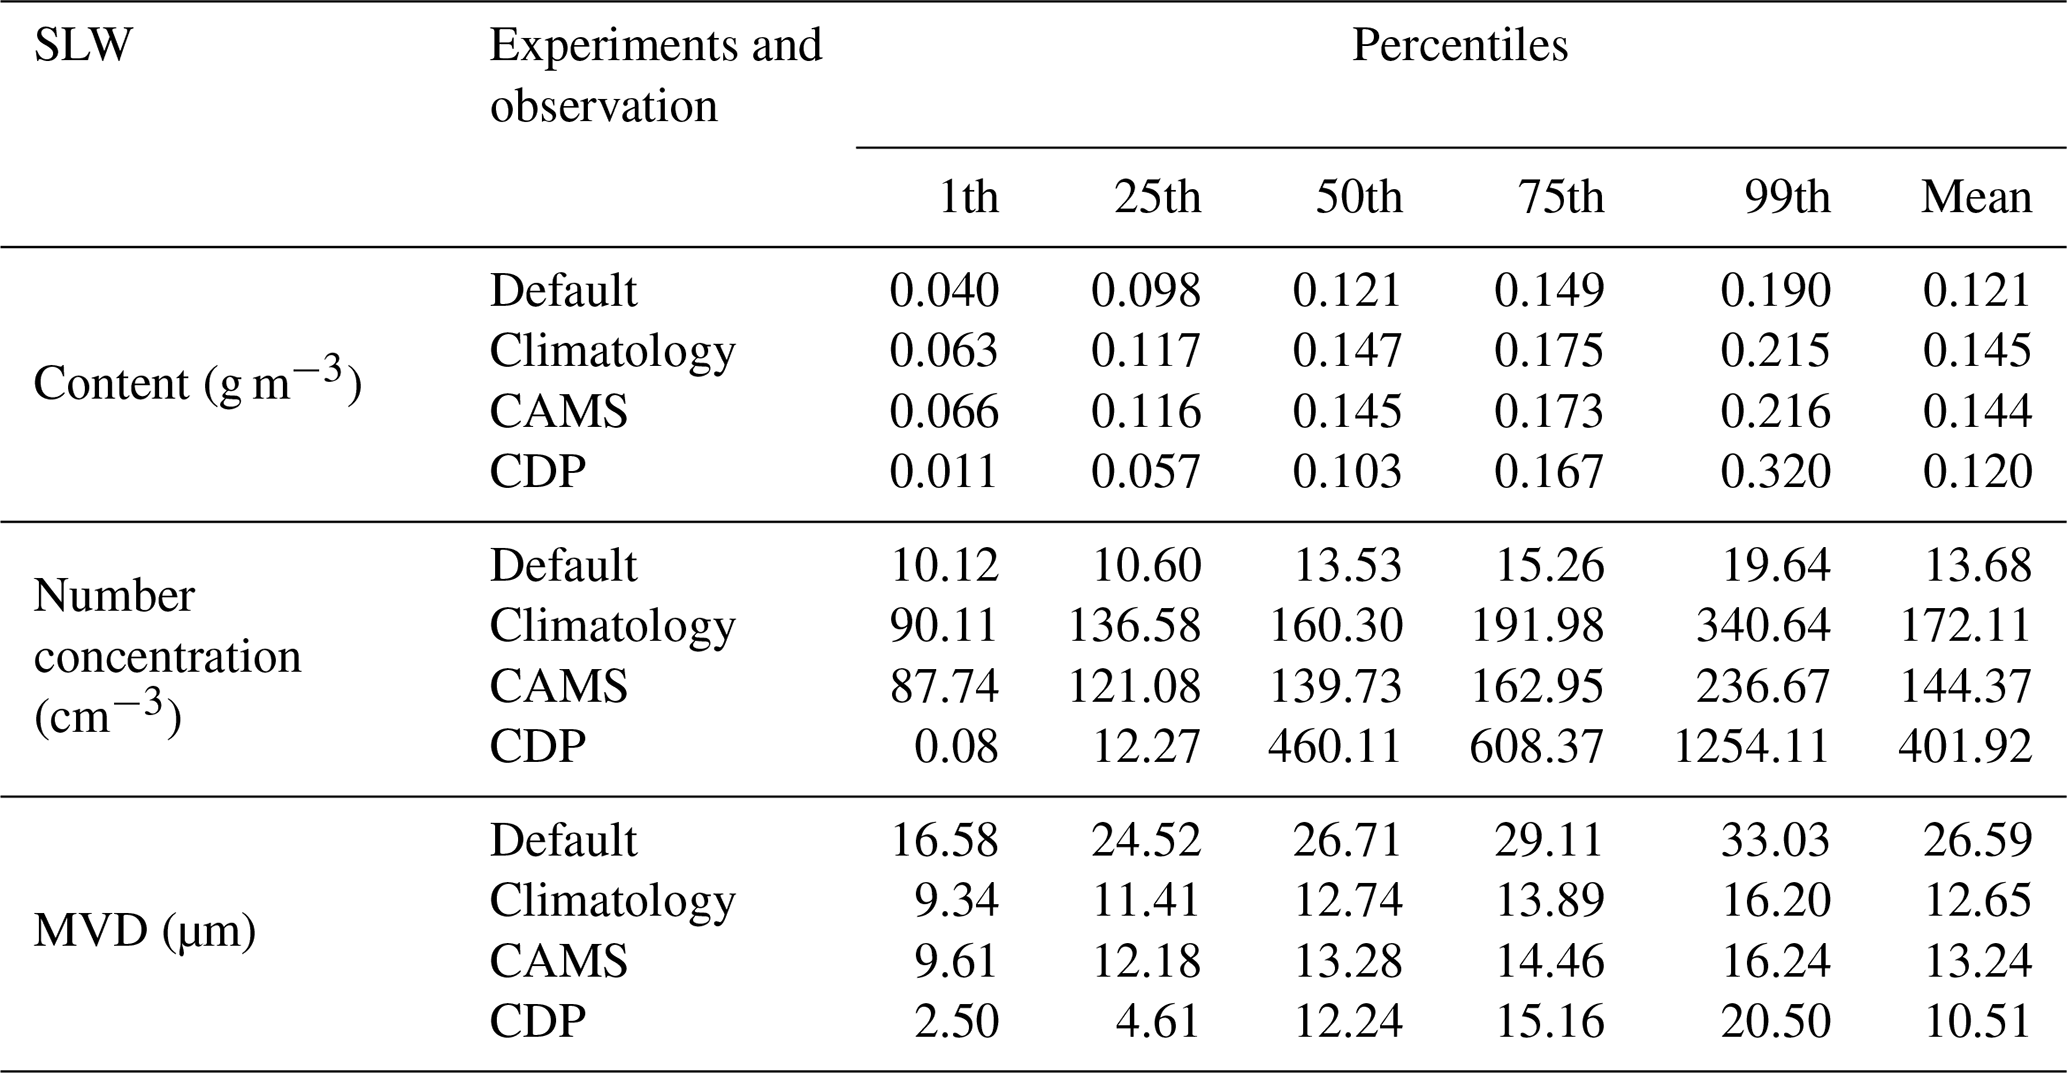
The comparison of percentiles of SLW characteristics simulated by the three experiments further emphasizes the differences in the simulation of SLW properties (Table 4). Although the mean and median SLW values simulated by the Default experiment are closer to the observations (with the CDP mean at 0.12 g m−3 and corresponding means of 0.121, 0.145, and 0.144 g m−3 in the Default, Climatology, and CAMS experiments, respectively), this apparent agreement is primarily a result of compensating errors commonly seen in numerical simulations (Paukert et al., 2019; Zhao et al., 2022). Specifically, while the Default experiment reproduces a seemingly accurate SLW content, it significantly overestimates the MVD of cloud droplets (26.59 µm compared to the observed 10.51 µm). This overestimation compensates for the severe underestimation of number concentration (13.68 cm−3 compared to the observed 401.92 cm−3), thereby masking the deficiencies in the simulation of microphysical properties. Additionally, the Default experiment is less effective than the Climatology and CAMS experiments in simulating the SLW peak. Specifically, the 75th and 99th percentile of SLW in the Climatology and CAMS experiments is closer to the observed value, indicating that these experiments capture the higher extremes of SLW content more effectively.
In terms of number concentration, the simulated values in the polluted environment are significantly greater than those in the clean environment. Although the initial aerosol concentrations in the lower layers of the Climatology and CAMS experiments are higher than the PCASP observations (Fig. 2), the simulated SLW number concentrations above the 25th percentile are much lower than the observed values. This discrepancy is a common issue in numerical models and is referred to as the CDNC bias (Sotiropoulou et al., 2006). This issue is further explored in the Sect. 4.
In terms of MVD, the simulated values in the polluted environment are closer to the observed ones, with the 25th and 99th percentiles at 11.4 and 16.2 µm, respectively. This aligns with the findings from the FAA icing database and Sand et al. (1984), which report that 75 % of MVD values fall within the range of 10–20 µm. The median and mean values simulated by the Climatology experiment are more consistent with the observations, while the 75th and 99th percentiles simulated by the CAMS experiment are closer to the observed values. This suggests that CAMS provides a better simulation for larger droplets, as indicated by the cluster of blue dots in Fig. 10c, which coincide with the observed second peak of MVD. However, all experiments fail to simulate the peak of MVD at 5 µm. This is due to the Thompson-Eidhammer aerosol-aware microphysics scheme, a bulk microphysics scheme, which assumes that the droplet size distribution of cloud water follows a generalized gamma distribution. This assumption cannot accurately capture the multi-peak droplet size distribution that may be observed in reality.
In a comprehensive comparison, although the CAMS experiment slightly overestimates the mean SLW content and exhibits a larger deviation in SLW number concentration compared to the Climatology experiment, it demonstrates superior capability in capturing high SLW values and larger MVDs. Elevated SLW content and the presence of large supercooled droplets are critical factors contributing to severe in-flight icing, highlighting the importance of accurately representing these features in numerical simulations.
This study investigates the impact of ACI on the properties of SLW during in-flight icing events in the high-aerosol-concentration environment of the Sichuan Basin. Using the Thompson-Eidhammer aerosol-aware microphysics scheme, three numerical experiments are designed with different initial aerosol number concentrations. The results show that all three experiments reproduce the synoptic-scale spatial distribution of SLW. Compared with simulations in a clean environment, those in a polluted environment simulate higher SLW mass mixing ratios, more number concentrations, smaller droplet sizes, and longer cloud system lifetimes. The experiments also reveal that in clean environments, a stronger auto-conversion process suppresses SLW formation, whereas in polluted environments, enhanced accretion process accelerates SLW depletion. Furthermore, the experiments demonstrate that the enhanced first aerosol indirect effect in polluted conditions can partially offset the depletion of SLW caused by glaciation. Observational data further reveal distinct cloud droplet growth mechanisms at different altitudes, with condensational growth dominating in the lower layers and collision–coalescence growth prevailing in the upper layers.
The study highlights the widespread occurrence of CDNC bias between numerical experiments and observations (Hoose et al., 2009; Morales Betancourt and Nenus, 2014). One key reason for this bias could be the limitations of the CCN activation parameters in the model (Weston et al., 2022). In the Thompson-Eidhammer aerosol-aware microphysics scheme, CCN activation is based on a lookup table or a parameterized formula that considers factors such as vertical velocity, activation threshold, and aerosol particle size. If the model underestimates the updraft at the cloud base or within the cloud, it will not activate enough cloud droplets, even when there are sufficient CCN available. Furthermore, an overestimated auto-conversion processes in the model, resulting in excessive depletion of supercooled droplets, together with scale mismatches between observations and model resolution, can also contribute to CDNC bias. These findings suggest that future research should explore these issues from multiple perspectives to improve the representation of CDNC in numerical models. Another noteworthy phenomenon is that, despite higher IN concentrations in the Climatology experiment and lower IN concentrations in the CMAS experiment compared to the Default experiment, neither experiment simulates ice-phase particles during the SLW increase phase (12:00–20:00 UTC), which contradicts the observations. In our previous study (Yuan et al., 2025, Fig. 7), CIP imagery shows the presence of ice-phase particles during this stage, with the ice water content at an altitude of 3500 m being on the order of 10−3 g m−3 (not shown). This discrepancy may be related to the temperature at this altitude being higher than −5 °C. In the Thompson–Eidhammer aerosol-aware microphysics scheme, ice nucleation is based on the Cooper (1986) parameterization, which permits ice crystal formation only under saturated conditions and at temperatures below −5 °C, potentially limiting ice nucleation at warmer temperatures. Future research will focus on improving the parameterization of cloud droplet nucleation and ice nucleation, or evaluating the performance of other microphysics schemes. Additionally, the polluted environment produces more ice and snow than the clean environment during the SLW reduction stage (after 20:00 UTC). This may be due to the decrease in temperature, as the altitude of the −10 °C isotherm in Fig. 4 drops significantly after 18:00 UTC. However, there is a lack of observational verification for this stage.
Due to the limitations of the bulk microphysics scheme, none of the three numerical experiments accurately reproduce the observed bimodal droplet size distribution. While the CAMS experiment demonstrates a better ability to capture high SLW values and larger MVD, it fails to represent cases with low SLW content and small droplet sizes. In future studies, bin microphysics schemes will be employed to better capture the characteristics of the bimodal droplet size distribution of SLW.
Notably, our three numerical experiments show an apparently monotonic SLW increase with CCN concentration. However, extensive research on convective clouds indicates that cloud water often responds non-monotonic to aerosols, with an optimal cloud development occurring at intermediate CCN levels (Dagan et al., 2017; Deng et al., 2024; Jeon et al., 2018). When CCN concentrations are below this optimal range, increasing CCN enhances condensation and cloud water, whereas excessive CCN leads to numerous small droplets, enlarged total droplet surface area, and strengthened evaporation, ultimately reducing cloud water. Similarly, although our simulations indicate stronger riming under polluted conditions, previous studies have shown that riming efficiency depends on a balance among hydrometeor size, cloud droplet concentration, and collision kernel (Cui et al., 2011). Riming may be suppressed under both extremely clean conditions, where droplet concentrations are insufficient, and extremely polluted conditions, where droplets are too small for effective collection (Barthlott et al., 2022; Cheng et al., 2010; Cui et al., 2011). Because this study only contrasts two aerosol states (clean and polluted), it cannot capture the full aerosol spectrum or the potential peak responses of riming that would emerge under intermediate aerosol conditions.
Finally, while this case study is representative of the region, it remains subject to limitations inherent to single-case analyses. Furthermore, although this study utilizes near-real-time aerosol data from CAMS, the method used to calculate aerosol number concentration still carries considerable uncertainties and lacks validation against observational evidence. Accurately characterizing aerosol emission inventories and quantifying their spatiotemporal distribution in the atmosphere remain significant challenges. These issues are critical for advancing our understanding of ACI and improving the representation of SLW in numerical models.
The CAMS reanalysis datasets are obtained from https://ads.atmosphere.copernicus.eu/datasets/cams-global-atmospheric-composition-forecasts?tab=download (last access: 10 February 2026), the three-dimensional monthly averaged aerosol climatology file provided by WPS are obtained from https://www2.mmm.ucar.edu/wrf/users/physics/mp28_updated.html (last access: 10 February 2026).
MY contributed to conceptualization, formal analysis, funding acquisition, creation of models, computing resources, programming, and writing. DW contributed to formal analysis, programming, visualization, and original draft writing. WW and DZ contributed to aircraft measurements data collection. LY contributed to creation of models and designing computer programmes. XD contributed to data curation. FP contributed to critical review of writing.
The contact author has declared that none of the authors has any competing interests.
Publisher's note: Copernicus Publications remains neutral with regard to jurisdictional claims made in the text, published maps, institutional affiliations, or any other geographical representation in this paper. The authors bear the ultimate responsibility for providing appropriate place names. Views expressed in the text are those of the authors and do not necessarily reflect the views of the publisher.
The in situ aircraft measurements data used in this study were obtained from China Meteorological Administration Weather Modification Centre and Weather Modification Office of Sichuan Province.
This research has been supported by the Science and Technology Fundamental Resources Investigation Program (grant no. 2025FY101502), the Fundamental Research Funds for the Central Universities (grant no. 24CAFUC01003), the Open Foundation of China Meteorological Administration Key Laboratory for Aviation Meteorology (grant no. HKQXM-2025009), the China Meteorological Administration (CMA) Innovation Development Special Program (grant no. CXFZ2025J038), and the Capacity Building for Weather Modification in Southwest China Research and Experiment Project on Detection of Stratocumulus-Cumulus Mixed Clouds and Convective Clouds in Complex Terrain and Artificial Catalysis Technology (grant no. SCIT-ZG(Z)-2024100001).
This paper was edited by Luisa Ickes and reviewed by Mónica Zamora Zapata and one anonymous referee.
Albrecht, B. A.: Aerosols, Cloud Microphysics, and Fractional Cloudiness, Science, 245, 1227–1230, https://doi.org/10.1126/science.245.4923.1227, 1989.
Barthlott, C., Zarboo, A., Matsunobu, T., and Keil, C.: Importance of aerosols and shape of the cloud droplet size distribution for convective clouds and precipitation, Atmos. Chem. Phys., 22, 2153–2172, https://doi.org/10.5194/acp-22-2153-2022, 2022.
Beard, K. V. and Ochs, H. T.: Warm-Rain Initiation: An Overview of Microphysical Mechanisms, J. Appl. Meteorol., 32, 608–625, https://doi.org/10.1175/1520-0450(1993)032<0608:WRIAOO>2.0.CO;2, 1993.
Belosi, F., Rinaldi, M., DeCesari, S., Tarozzi, A., Nicosia, A., and Santachiara, G.: Ground Level Ice Nuclei Particle Measurements Including Saharan Dust Events at a Po Valley Rural Site (San Pietro Capofiume, Italy), Atmos. Res., 186, 116–126, https://doi.org/10.1016/j.atmosres.2016.11.012, 2017.
Benedetti, A., Morcrette, J. -J., Boucher, O., Dethof, A., Engelen, R. J., Fisher, M., Flentje, H., Huneeus, N., Jones, L., Kaiser, J. W., Kinne, S., Mangold, A., Razinger, M., Simmons, A. J., and Suttie, M.: Aerosol analysis and forecast in the European Centre for Medium-Range Weather Forecasts Integrated Forecast System: 2. Data assimilation, J. Geophys. Res.-Atmos., 114, 2008JD011115, https://doi.org/10.1029/2008JD011115, 2009.
Bernstein, B. C., Rasmussen, R. M., McDonough, F., and Wolff, C.: Keys to differentiating between small-and large-drop icing conditions in continental clouds, J. Appl. Meteorol. Climatol., 58, 1931–1953, https://doi.org/10.1175/JAMC-D-18-0038.1, 2019.
Bromfield, M. A., Horri, N., Halvorsen, K., and Lande, K.: Loss of control in flight accident case study: icing-related tailplane stall, Aeronaut. J., 127, 1554–1573, https://doi.org/10.1017/aer.2023.18, 2023.
Chapman, E. G., Gustafson, W. I., Easter, R. C., Barnard, J. C., Ghan, S. J., Pekour, M. S., and Fast, J. D.: Coupling aerosol-cloud-radiative processes in the WRF-Chem model: Investigating the radiative impact of elevated point sources, Atmos. Chem. Phys., 9, 945–964, https://doi.org/10.5194/acp-9-945-2009, 2009.
Charlson, R. J., Schwartz, S. E., Hales, J. M., Cess, R. D., Coakley, J. A., Hansen, J. E., and Hofmann, D. J.: Climate Forcing by Anthropogenic Aerosols, Science, 255, 423–430, https://doi.org/10.1126/science.255.5043.423, 1992.
Chen, F. and Dudhia, J.: Coupling an advanced land surface–hydrology model with the Penn State–NCAR MM5 modeling system, Part I: Model implementation and sensitivity, Mon. Weather Rev., 129, 569-585, https://doi.org/10.1175/1520-0493(2001)129<0569:CAALSH>2.0.CO;2, 2001.
Cheng, C. T., Wang, W. C., and Chen, J. P.: Simulation of the effects of increasing cloud condensation nuclei on mixed-phase clouds and precipitation of a front system, Atmos. Res., 96, 461–476, https://doi.org/10.1016/j.atmosres.2010.02.005, 2010.
Chin, M., Rood, R. B., Lin, S., Müller, J., and Thompson, A. M.: Atmospheric sulfur cycle simulated in the global model GOCART: Model description and global properties, J. Geophys. Res.-Atmos., 105, 24671–24687, https://doi.org/10.1029/2000JD900384, 2000.
Chin, M., Ginoux, P., Kinne, S., Torres, O., Holben, B. N., Duncan, B. N., Martin, R. V., Logan, J. A., Higurashi, A., and Nakajima, T.: Tropospheric Aerosol Optical Thickness from the GOCART Model and Comparisons with Satellite and Sun Photometer Measurements, J. Atmos. Sci., 59, 461–483, https://doi.org/10.1175/1520-0469(2002)059<0461:TAOTFT>2.0.CO;2, 2002.
Cober, S. G. and Isaac, G. A.: Characterization of Aircraft Icing Environments with Supercooled Large Drops for Application to Commercial Aircraft Certification, J. Appl. Meteorol. Climatol., 51, 265–284, https://doi.org/10.1175/JAMC-D-11-022.1, 2012.
Colarco, P., Da Silva, A., Chin, M., and Diehl, T.: Online simulations of global aerosol distributions in the NASA GEOS-4 model and comparisons to satellite and ground-based aerosol optical depth, J. Geophys. Res.-Atmos., 115, 2009JD012820, https://doi.org/10.1029/2009JD012820, 2010.
Cole, J. and Sand, W.: Statistical study of aircraft icing accidents, in: 29th Aerospace Sciences Meeting, 29th Aerospace Sciences Meeting, Reno, NV, USA, American Institute of Aeronautics and Astronautics, https://doi.org/10.2514/6.1991-558, 1991.
Collow, A. B., Colarco, P. R., Da Silva, A. M., Buchard, V., Bian, H., Chin, M., Das, S., Govindaraju, R., Kim, D., and Aquila, V.: Benchmarking GOCART-2G in the Goddard Earth Observing System (GEOS), Geosci. Model Dev., 17, 1443–1468, https://doi.org/10.5194/gmd-17-1443-2024, 2024.
Cooper, W. A.: Ice Initiation in Natural Clouds, Meteor. Monogr., 21, 29–32, https://doi.org/10.1175/0065-9401-21.43.29, 1986.
Cui, Z., Davies, S., Carslaw, K. S., and Blyth, A. M.: The response of precipitation to aerosol through riming and melting in deep convective clouds, Atmos. Chem. Phys., 11, 3495–3510, https://doi.org/10.5194/acp-11-3495-2011, 2011.
Dagan, G., Koren, I., Altaratz, O., and Heiblum, R. H.: Time-dependent, non-monotonic response of warm convective cloud fields to changes in aerosol loading, Atmos. Chem. Phys., 17, 7435–7444, https://doi.org/10.5194/acp-17-7435-2017, 2017.
D'Alessandro, J. J., McFarquhar, G. M., Wu, W., Stith, J. L., Jensen, J. B., and Rauber, R. M.: Characterizing the Occurrence and Spatial Heterogeneity of Liquid, Ice, and Mixed Phase Low-Level Clouds Over the Southern Ocean Using in Situ Observations Acquired During SOCRATES, J. Geophys. Res.-Atmos., 126, e2020JD034482, https://doi.org/10.1029/2020JD034482, 2021.
Deng, X., Fu, S., and Xue, H.: The Non-Monotonic Response of Cumulus Congestus to the Concentration of Cloud Condensation Nuclei, Atmosphere, 15, 1225, https://doi.org/10.3390/atmos15101225, 2024.
Dong, X., Zhao, C., Huang, Z., Mai, R., Lv, F., Xue, X., Zhang, X., Hou, S., Yang, Y., Yang, Y., and Sun, Y.: Increase of precipitation by cloud seeding observed from a case study in November 2020 over Shijiazhuang, China, Atmos. Res., 262, 105766, https://doi.org/10.1016/j.atmosres.2021.105766, 2021.
Dudhia, J.: Numerical study of convection observed during the winter monsoon experiment using a mesoscale two-dimensional model, J. Atmos. Sci., 46, 3077–3107, https://doi.org/10.1175/1520-0469(1989)046<3077:NSOCOD>2.0.CO;2, 1989.
Dusek, U., Frank, G. P., Hildebrandt, L., Curtius, J., Schneider, J., Walter, S., Chand, D., Drewnick, F., Hings, S., Jung, D., Borrmann, S., and Andreae, M. O.: Size matters more than chemistry for cloud-nucleating ability of aerosol particles, Science, 312, 1375–1378, https://doi.org/10.1126/science.1125261, 2006.
Faber, S., Bernstein, B., Landolt, S., Jacobson, D., DiVito, S., Wolde, M., Korolev, A., Heckman, I., Nichman, L., and Nguyen, C.: Airborne Observations of Highly Variable and Complex Freezing Drizzle and Mixed-Phase Environments, J. Appl. Meteorol. Climatol., 63, 1343–1361, https://doi.org/10.1175/JAMC-D-24-0056.1, 2024.
Fan, J., Wang, Y., Rosenfeld, D., and Liu, X.: Review of Aerosol–Cloud Interactions: Mechanisms, Significance, and Challenges, J. Atmos. Sci., 73, 4221–4252, https://doi.org/10.1175/JAS-D-16-0037.1, 2016.
Feng, K. and Zhang, X.: Maintenance and Support Management for Type Certification Flight Test of Large Civil Aircraft, in: Proceedings of the First Symposium on Aviation Maintenance and Management, Volume II, 535–545, Springer Berlin Heidelberg, https://doi.org/10.1007/978-3-642-54233-6_59, 2014.
Ginoux, P., Chin, M., Tegen, I., Prospero, J. M., Holben, B., Dubovik, O., and Lin, S.: Sources and distributions of dust aerosols simulated with the GOCART model, J. Geophys. Res.-Atmos., 106, 20255–20273, https://doi.org/10.1029/2000JD000053, 2001.
Glotfelty, T., Alapaty, K., He, J., Hawbecker, P., Song, X., and Zhang, G.: The Weather Research and Forecasting Model with Aerosol–Cloud Interactions (WRF-ACI): Development, Evaluation, and Initial Application, Mon. Weather Rev., 147, 1491–1511, https://doi.org/10.1175/MWR-D-18-0267.1, 2019.
Grell, G. A., Peckham, S. E., Schmitz, R., McKeen, S. A., Frost, G., Skamarock, W. C., and Eder, B.: Fully coupled “online” chemistry within the WRF model, Atmos. Environ., 39, 6957–6975, https://doi.org/10.1016/j.atmosenv.2005.04.027, 2005.
He, Y., Zhao, P., Xiao, H., and Zhao, C.: Structural difference on the response of microphysical and precipitation processes to aerosol perturbation in a quasi-stationary Southwest Vortex system, J. Geophys. Res.-Atmos., 130, e2024JD041767, https://doi.org/10.1029/2024JD041767, 2025.
Hellmuth, F., Carlsen, T., Daloz, A. S., David, R. O., Che, H., and Storelvmo, T.: Evaluation of biases in mid-to-high-latitude surface snowfall and cloud phase in ERA5 and CMIP6 using satellite observations, Atmos. Chem. Phys., 25, 1353–1383, https://doi.org/10.5194/acp-25-1353-2025, 2025.
Hersbach, H., Bell, B., Berrisford, P., Hirahara, S., Horányi, A., Muñoz-Sabater, J., Nicolas, J., Peubey, C., Radu, R., Schepers, D., Simmons, A., Soci, C., Abdalla, S., Abellan, X., Balsamo, G., Bechtold, P., Biavati, G., Bidlot, J., Bonavita, M., De Chiara, G., Dahlgren, P., Dee, D., Diamantakis, M., Dragani, R., Flemming, J., Forbes, R., Fuentes, M., Geer, A., Haimberger, L., Healy, S., Hogan, R. J., Hólm, E., Janisková, M., Keeley, S., Laloyaux, P., Lopez, P., Lupu, C., Radnoti, G., de Rosnay, P., Rozum, I., Vamborg, F., Villaume, S., and Thépaut, J. N.: The ERA5 global reanalysis, Q. J. R. Meteorol. Soc., 146, 1999–2049, https://doi.org/10.1002/qj.3803, 2020.
Hoffmann, F. and Feingold, G.: A Note on Aerosol Processing by Droplet Collision-Coalescence, Geophys. Res. Lett., 50, e2023GL103716, https://doi.org/10.1029/2023GL103716, 2023.
Hong, S. Y., Noh, Y., and Dudhia, J.: A new vertical diffusion package with an explicit treatment of entrainment processes, Mon. Weather Rev., 134, 2318–2341, https://doi.org/10.1175/MWR3199.1, 2006.
Hoose, C., Kristjánsson, J. E., Iversen, T., Kirkevåg, A., Seland, Ø., and Gettelman, A.: Constraining cloud droplet number concentration in GCMs suppresses the aerosol indirect effect, Geophys. Res. Lett., 36, https://doi.org/10.1029/2009GL038568, 2009.
Inness, A., Ades, M., Agustí-Panareda, A., Barré, J., Benedictow, A., Blechschmidt, A.-M., Dominguez, J. J., Engelen, R., Eskes, H., Flemming, J., Huijnen, V., Jones, L., Kipling, Z., Massart, S., Parrington, M., Peuch, V.-H., Razinger, M., Remy, S., Schulz, M., and Suttie, M.: The CAMS reanalysis of atmospheric composition, Atmos. Chem. Phys., 19, 3515–3556, https://doi.org/10.5194/acp-19-3515-2019, 2019.
Jeon, Y. L., Moon, S., Lee, H., Baik, J. J., and Lkhamjav, J.: Non-monotonic dependencies of cloud microphysics and precipitation on aerosol loading in deep convective clouds: A case study using the WRF model with bin microphysics, Atmosphere, 9, 434, https://doi.org/10.3390/atmos9110434, 2018.
Jiao, D., Xu, N., Yang, F., and Xu, K.: Evaluation of spatial-temporal variation performance of ERA5 precipitation data in China, Sci. Rep., 11, 17956, https://doi.org/10.1038/s41598-021-97432-y, 2021.
Jin, X., Wu, T., and Li, L.: The quasi-stationary feature of nocturnal precipitation in the Sichuan Basin and the role of the Tibetan Plateau, Clim. Dyn., 41, 977–994, https://doi.org/10.1007/s00382-012-1521-y, 2013.
Kain, J. S.: The Kain-Fritsch convective parameterization: an update, J. Appl. Meteorol., 43, 170–181, https://doi.org/10.1175/1520-0450(2004)043<0170:TKCPAU>2.0.CO;2, 2004.
Kleinman, L. I., Daum, P. H., Lee, Y.-N., Lewis, E. R., Sedlacek III, A. J., Senum, G. I., Springston, S. R., Wang, J., Hubbe, J., Jayne, J., Min, Q., Yum, S. S., and Allen, G.: Aerosol concentration and size distribution measured below, in, and above cloud from the DOE G-1 during VOCALS-REx, Atmos. Chem. Phys., 12, 207–223, https://doi.org/10.5194/acp-12-207-2012, 2012.
Lance, S., Brock, C. A., Rogers, D., and Gordon, J. A.: Water droplet calibration of the Cloud Droplet Probe (CDP) and in-flight performance in liquid, ice and mixed-phase clouds during ARCPAC, Atmos. Meas. Tech., 3, 1683–1706, https://doi.org/10.5194/amt-3-1683-2010, 2010.
Lave, J., Landolt, S. D., DiVito, S., Korolev, A., and Wolde, M.: Improving Terminal Area Supercooled Large Drop Detection Utilizing Raw Ceilometer Backscatter Profiles Obtained during the ICICLE Flight Campaign, in: American Meteorological Society Meeting Abstracts, January 2021, Vol. 101, 2021.
Li, H., Grell, G. A., Ahmadov, R., Zhang, L., Sun, S., Schnell, J., and Wang, N.: A simple and realistic aerosol emission approach for use in the Thompson–Eidhammer microphysics scheme in the NOAA UFS Weather Model (version GSL global-24 Feb 2022), Geosci. Model Dev., 17, 607–619, https://doi.org/10.5194/gmd-17-607-2024, 2024.
Li, J., Han, Z., Wu, Y., Xiong, Z., Xia, X., Li, J., Liang, L., and Zhang, R.: Aerosol radiative effects and feedbacks on boundary layer meteorology and PM 2.5 chemical components during winter haze events over the Beijing-Tianjin-Hebei region, Atmos. Chem. Phys., 20, 8659–8690, https://doi.org/10.5194/acp-20-8659-2020, 2020.
Liu, H., Peng, S., Fang, R., Li, Y., Duan, L., Wang, T., Mao, C., and Lin, Z.: Analysis of the Meteorological Conditions and Atmospheric Numerical Simulation of an Aircraft Icing Accident, Atmosphere, 15, 1222, https://doi.org/10.3390/atmos15101222, 2024.
Lohmann, U.: A glaciation indirect aerosol effect caused by soot aerosols, Geophys. Res. Lett., 29, 1052, https://doi.org/10.1029/2001GL014357, 2002.
Lu, H., Xie, M., Zhuang, B., Ma, D., Liu, B., Zhan, Y., Wang, T., Li, S., Li, M., and Zhu, K.: Impacts of atmospheric circulation patterns and cloud inhibition on aerosol radiative effect and boundary layer structure during winter air pollution in Sichuan Basin, China, Atmos. Chem. Phys., 24, 8963–8982, https://doi.org/10.5194/acp-24-8963-2024, 2024.
Mlawer, E. J., Taubman, S. J., Brown, P. D., Iacono, M. J., and Clough, S. A.: Radiative transfer for inhomogeneous atmospheres: RRTM, a validated correlated model for the longwave, J. Geophys. Res.-Atmos., 102, 16663–16682, https://doi.org/10.1029/97JD00237, 1997.
Morales Betancourt, R. and Nenes, A.: Understanding the contributions of aerosol properties and parameterization discrepancies to droplet number variability in a global climate model, Atmos. Chem. Phys., 14, 4809–4826, https://doi.org/10.5194/acp-14-4809-2014, 2014.
Morcrette, J. J., Boucher, O., Jones, L., Salmond, D., Bechtold, P., Beljaars, A., Benedetti, A., Bonet, A., Kaiser, J. W., Razinger, M., Schulz, M., Serrar, S., Simmons, A. J., Sofiev, M., Suttie, M., Tompkins, A. M., and Untch, A.: Aerosol analysis and forecast in the European Centre for medium-range weather forecasts integrated forecast system: Forward modelling, J. Geophys. Res.-Atmos., 114, https://doi.org/10.1029/2008JD011235, 2009.
Omanovic, N., Ferrachat, S., Fuchs, C., Henneberger, J., Miller, A. J., Ohneiser, K., Ramelli, F., Seifert, P., Spirig, R., Zhang, H., and Lohmann, U.: Evaluating the Wegener–Bergeron–Findeisen process in ICON in large-eddy mode with in situ observations from the CLOUDLAB project, Atmos. Chem. Phys., 24, 6825–6844, https://doi.org/10.5194/acp-24-6825-2024, 2024.
Paukert, M., Fan, J., Rasch, P. J., Morrison, H., Milbrandt, J. A., Shpund, J., and Khain, A.: Three-moment representation of rain in a bulk microphysics model, J. Adv. Model. Earth Syst., 11, 257–277, https://doi.org/10.1029/2018MS001512, 2019.
Petty, K. R. and Floyd, C. D.: A statistical review of aviation airframe icing accidents in the US, in: Proceedings of the 11th Conference on Aviation, Range, and Aerospace Hyannis, American Meteorological Society, https://ams.confex.com/ams/11aram22sls/techprogram/paper_81425.htm (last access: 11 February 2026), 2004.
Potapczuk, M. G.: Aircraft Icing Research at NASA Glenn Research Center, J. Aerosp. Eng., 26, 260–276, https://doi.org/10.1061/(ASCE)AS.1943-5525.0000322, 2013.
Pruppacher, H. R., Klett, J. D., and Wang, P. K.: Microphysics of Clouds and Precipitation, Aerosol Sci. Technol., 28, 381–382, https://doi.org/10.1080/02786829808965531, 1998.
Rosenfeld, D., Andreae, M. O., Asmi, A., Chin, M., de Leeuw, G., Donovan, D. P., Kahn, R., Kinne, S., Kivekäs, N., Kulmala, M., Lau, W., Schmidt, K. S., Suni, T., Wagner, T., Wild, M., and Quaas, J.: Global observations of aerosol-cloud-precipitation-climate interactions, Rev. Geophys., 52, 750–808, https://doi.org/10.1002/2013RG000441, 2014.
Rosenfeld, D.: Suppression of Rain and Snow by Urban and Industrial Air Pollution, Science, 287, 1793–1796, https://doi.org/10.1126/science.287.5459.1793, 2000.
Rugg, A., Haggerty, J., Adriaansen, D., Serke, D., and Ellis, S.: Significant Updates for the Current Icing Product (CIP) and Forecast Icing Product (FIP) Following the 2019 In-Cloud Icing and Large-Drop Experiment (ICICLE), SAE International Journal of Advances and Current Practices in Mobility, 6, 1363–1372, https://doi.org/10.4271/2023-01-1487, 2023.
Sand, W. R., Cooper, W. A., Politovich, M. K., and Veal, D. L.: Icing conditions encountered by a research aircraft, J. Appl. Meteorol. Climatol., 23, 1427–1440, https://doi.org/10.1175/0733-3021-23.10.1427, 1984.
Schima, J., McFarquhar, G., Romatschke, U., Vivekanandan, J., D'Alessandro, J., Haggerty, J., Wolff, C., Schaefer, E., Järvinen, E., and Schnaiter, M.: Characterization of Southern Ocean Boundary Layer Clouds Using Airborne Radar, Lidar, and In Situ Cloud Data: Results From SOCRATES, J. Geophys. Res.-Atmos., 127, e2022JD037277, https://doi.org/10.1029/2022JD037277, 2022.
Seifert, A. and Beheng, K. D.: A two-moment cloud microphysics parameterization for mixed-phase clouds, Part 1: Model description, Meteorol. Atmos. Phys., 92, 45–66, https://doi.org/10.1007/s00703-005-0112-4, 2006.
Sotiropoulou, R. E. P., Medina, J., and Nenes, A.: CCN predictions: Is theory sufficient for assessments of the indirect effect?, Geophys. Res. Lett., 33, https://doi.org/10.1029/2005GL025148, 2006.
Thomas, B., Viswanadhapalli, Y., Srinivas, C. V., Dasari, H. P., Attada, R., and Langodan, S.: Cloud resolving simulation of extremely heavy rainfall event over Kerala in August 2018 – Sensitivity to microphysics and aerosol feedback, Atmos. Res., 258, 105613, https://doi.org/10.1016/j.atmosres.2021.105613, 2021.
Thompson, G. and Eidhammer, T.: A Study of Aerosol Impacts on Clouds and Precipitation Development in a Large Winter Cyclone, J. Atmos. Sci., 71, 3636–3658, https://doi.org/10.1175/JAS-D-13-0305.1, 2014.
Thompson, G., Field, P. R., Rasmussen, R. M., and Hall, W. D.: Explicit Forecasts of Winter Precipitation Using an Improved Bulk Microphysics Scheme, Part II: Implementation of a New Snow Parameterization, Mon. Weather Rev., 136, 5095–5115, https://doi.org/10.1175/2008MWR2387.1, 2008.
Thompson, G., Politovich, M. K., and Rasmussen, R. M.: A Numerical Weather Model's Ability to Predict Characteristics of Aircraft Icing Environments, Weather Forecast., 32, 207–221, https://doi.org/10.1175/WAF-D-16-0125.1, 2017.
Twomey, S.: The nuclei of natural cloud formation part II: The supersaturation in natural clouds and the variation of cloud droplet concentration, Geofis. Pura E Appl., 43, 243–249, https://doi.org/10.1007/BF01993560, 1959.
Twomey, S.: The Influence of Pollution on the Shortwave Albedo of Clouds, J. Atmos. Sci., 34, 1149–1152, https://doi.org/10.1175/1520-0469(1977)034<1149:TIOPOT>2.0.CO;2, 1977.
Ukhov, A., Ahmadov, R., Grell, G., and Stenchikov, G.: Improving dust simulations in WRF-Chem v4.1.3 coupled with the GOCART aerosol module, Geosci. Model Dev., 14, 473–493, https://doi.org/10.5194/gmd-14-473-2021, 2020.
Wang, J., Li, Z., Liang, Y., and Ke, J.: An Assessment of the Applicability of ERA5 Reanalysis Boundary Layer Data Against Remote Sensing Observations in Mountainous Central China, Atmosphere, 16, 1152, https://doi.org/10.3390/atmos16101152, 2025.
Ward, D. S., Eidhammer, T., Cotton, W. R., and Kreidenweis, S. M.: The role of the particle size distribution in assessing aerosol composition effects on simulated droplet activation, Atmos. Chem. Phys., 10, 5435–5447, https://doi.org/10.5194/acp-10-5435-2010, 2010.
Weston, M. J., Piketh, S. J., Burnet, F., Broccardo, S., Denjean, C., Bourrianne, T., and Formenti, P.: Sensitivity analysis of an aerosol-aware microphysics scheme in Weather Research and Forecasting (WRF) during case studies of fog in Namibia, Atmos. Chem. Phys., 22, 10221–10245, https://doi.org/10.5194/acp-22-10221-2022, 2022.
Wu, W., Huang, W., Li, B., Xie, Y., Yang, Y., Wang, P., Niu, Z., and Deng, L.: Improving Supercooled Water Forecast Through Real-Time Aerosol Input: A Case Study, J. Geophys. Res.-Atmos., 129, e2023JD039671, https://doi.org/10.1029/2023JD039671, 2024.
Yu, L., Zhang, M., Wang, L., Li, H., and Li, J.: Characteristics of Aerosols and Clouds and Their Role in Earth's Energy Budget, J. Clim., 37, 995–1014, https://doi.org/10.1175/JCLI-D-23-0414.1, 2024.
Yu, X. and Lee, T. Y.: Role of convective parameterization in simulations of a convection band at grey-zone resolutions, Tellus A: Dyn. Meteorol. Oceanogr., 62, 617–632, https://doi.org/10.1111/j.1600-0870.2010.00470.x, 2010.
Yu, Y., Zhu, Q., He, Q., Gao, Y., Zhou, X., Zhang, R., and Cheng, T.: Variations of aerosol and cloud vertical characteristics based on aircraft measurements in upstream of Shanghai during the 2020 China international import expo, Front. Environ. Sci., 10, 1098611, https://doi.org/10.3389/fenvs.2022.1098611, 2022.
Yuan, M., Lv, A., Wang, W., Dong, X., and Ping, F.: The microphysical properties and processes in in-flight icing: A case study, Atmos. Res., 326, 108326, https://doi.org/10.1016/j.atmosres.2025.108326, 2025.
Zaveri, R. A., Easter, R. C., Fast, J. D., and Peters, L. K.: Model for simulating aerosol interactions and chemistry (MOSAIC), J. Geophys. Res.-Atmos., 113, https://doi.org/10.1029/2007JD008782, 2008.
Zhang, Q., Quan, J., Tie, X., Huang, M., and Ma, X.: Impact of aerosol particles on cloud formation: Aircraft measurements in China, Atmos. Environ., 45, 665–672, https://doi.org/10.1016/j.atmosenv.2010.10.025, 2011.
Zhao, L., Wang, Y., Zhao, C., Dong, X., and Yung, Y. L.: Compensating errors in cloud radiative and physical properties over the Southern Ocean in the CMIP6 climate models, Adv. Atmos. Sci., 39, 2156–2171, https://doi.org/10.1007/s00376-022-2036-z, 2022.
Zhao, X., Liu, X., Burrows, S., DeMott, P. J., Diao, M., McFarquhar, G. M., Patade, S., Phillips, V., Roberts, G. C., Sanchez, K. J., Shi, Y., and Zhang, M.: Important Ice Processes Are Missed by the Community Earth System Model in Southern Ocean Mixed-Phase Clouds: Bridging SOCRATES Observations to Model Developments, J. Geophys. Res.-Atmos., 128, e2022JD037513, https://doi.org/10.1029/2022JD037513, 2023.