the Creative Commons Attribution 4.0 License.
the Creative Commons Attribution 4.0 License.
 | 12 Feb 2026
Response of marine post-frontal clouds to Gulf Stream variability
Jingyi Chen
Hongyu Liu
David Painemal
Armin Sorooshian
Sheng-Lun Tai
Christiane Voigt
Understanding how Gulf Stream variation influences cloud morphology is critical for evaluating cloud feedback in the western North Atlantic Ocean and beyond, where mesoscale air-sea interactions dominate. This study investigates the impact of altered mean sea surface temperature (SST) and SST gradients on post-frontal cloud characteristics during cold-air outbreaks, using the Weather Research and Forecasting (WRF) model. Three sensitivity experiments are conducted: a control simulation (default SST), Plus4 (uniform SST increase of 4 K), and Gradplus (SST gradient enhanced by 25 %, centered around mean SST). Results reveal distinctly different responses in boundary layer dynamics and cloud macro-physics. In Plus4, a warmer and moister boundary layer reduces total cloud cover but promotes larger cloud sizes and elongated cloud streets, with diminished liquid water and enhanced ice-phase hydrometeors. Conversely, Gradplus amplifies impacts in the upwind colder SST regions, yielding a drier, colder boundary layer, weaker energy transport, and higher liquid water path but reduced ice water content and cloud lines. Tracer analysis highlights that SST modifications alter airmass sources near cloud tops due to the entrainment of ambient air, with Plus4 amplifying boundary layer contributions to cloud-top regions. These findings underscore the spatially varying effects of SST gradients and mean SST on cloud organization and microphysics, emphasizing the need to resolve ocean-atmosphere coupling in global models to improve the prediction of marine cloud feedback under warming scenarios.
- Article
(4214 KB) - Full-text XML
- BibTeX
- EndNote


The Gulf Stream (GS), a warm ocean current flowing northeastward off the North American coast in the Western North Atlantic Ocean (WNAO), plays a crucial role in modulating regional and global climate by transporting vast amounts of heat from the tropics to higher latitudes (Sweet et al., 1981; Kelly et al., 2010; Painemal et al., 2023). The strong sea surface temperature (SST) gradients associated with the GS drive mesoscale air-sea interactions that significantly influence atmospheric boundary layer dynamics and cloud formation (Minobe et al., 2008; Sorooshian et al., 2020). Recent studies have highlighted that variations in GS intensity and position, driven by anthropogenic warming and natural climate variability, can alter SST gradients and subsequently modify marine low-level cloud regimes (Joyce et al., 2009; Marshall et al., 2009; Smeed et al., 2018). These clouds, particularly post-frontal clouds (PFCs) formed during cold-air outbreaks (CAOs), are critical regulators of Earth's radiative balance, yet their response to changing GS characteristics remains inadequately understood (Tornow et al., 2021; Lamraoui et al., 2019; Li et al., 2022; Papritz et al., 2015; Naud et al., 2018).
Over the past decade, advances in high-resolution modeling and observations have improved our understanding of ocean-atmosphere coupling in the WNAO (Crosbie et al., 2024; Dadashazar et al., 2021; Dmitrovic et al., 2024; Li et al., 2022; Painemal et al., 2021; Sorooshian et al., 2020). Previous studies have demonstrated that warm fronts associated with the GS enhance turbulent heat fluxes, triggering secondary circulations that promote cloud organization (Lee et al., 2018; Liu et al., 2004; Liu et al., 2014; O'Neill et al., 2017; Sullivan et al., 2021). Minobe et al. (2008) found a rain band over the GS in both satellite and general circulation model (GCM) outputs; however, this band would disappear when the input SST field is smoothed in the simulations, likely associated with a reduced SST gradient over the GS region in the model. Li et al. (2004) observed a cloud line over the GS region, which is formed by mesoscale solenoidal circulation induced by large surface thermal gradients. Also, Painemal et al. (2021) observed a convergence zone following the meandering path of GS and the area with the strongest SST gradients. However, most prior studies focused on the immediate cloud response to SST gradients, with limited attention to how long-term GS modifications – comprising both SST warming and gradient weakening – can affect cloud macro- and microphysical properties.
The challenges in exploring the impact of long-term GS variations on clouds are partly due to uncertainties arising from the coarse resolution of climate models and inadequate satellite data resulting from shorter coverage period. Lee et al. (2018) examined several mechanisms through which SST bias in a spatially small region influences global model results. They found that, by imposing an SST bias between +6 and +6.75 K from the atmosphere-ocean coupled model into the atmosphere-only model, the SST bias correction enhances the atmospheric updraft persistently even though the bias correction is only imposed in a small region. This suggests that exploring the impacts from decadal variations or climate changes of SST on tropospheric clouds in climate models is challenging, given the general bound of the SST variations is up to about 4 K, smaller than the coupled climate model bias (Pastor, 2022; Smeed et al., 2018). Chellappan et al. (2021) found that reanalysis data are representative for boundary layer height and surface fluxes but have inherited biases due to the too-wide GS in reanalysis data. Their findings also support that reanalysis data are good to initialize large-eddy simulations that can be used to reveal mechanisms linking the GS changes to PFC morphology, which are still unclear. High-resolution Weather Research and Forecasting (WRF) simulations, such as those conducted by Chen et al. (2022), are able to capture GS-induced SST anomalies that shape the morphology of cloud streets via BL instabilities, but the use of static SST conditions neglects realistic perturbations at decadal or shorter timescales of climate change.
Another often explored factor that affects clouds over the WNAO is the aerosol type, serving as cloud condensation nuclei, which are critical to cloud nucleation and properties (Petters and Kreidenweis, 2007). The WNAO region, located downwind of major coastal cities such as New York, has many different aerosol sources leading to distinct aerosol types dependent on season and atmospheric circulation patterns (Corral et al., 2021; Liu et al., 2025; Seckar-Martinez et al., 2025; Sorooshian et al., 2019). For instance, the wintertime has more offshore flow from the U.S. East Coast leading to urban emissions influence over the WNAO (Dadashazar et al., 2022), whereas spring and summer months are characterized by more influence from biomass burning emissions (Edwards et al., 2021; Mardi et al., 2021) and dust including from Africa (Ajayi et al., 2024; Aldhaif et al., 2020). Liu et al. (2025) showed simulated aerosols over the WNAO and evaluated the simulation results against Aerosol Cloud meTeorology Interactions oVer the western ATlantic Experiment (ACTIVATE) field campaign measurements in 2020. They found that sea salt dominates BL aerosol mass concentration and optical depth, peaking in summer, followed by organics (for mass) and sulfate (for optical depth). Also, adjusting wildfire smoke injection heights to the mid-troposphere (as opposed to the BL top) improves model agreement with observations of western U.S. wildfire smoke aerosols transported to the WNAO in summer. Given that predominant aerosol types are highly related to airmass origin, it is critical to characterize the nature of airmasses over the WNAO for PFC studies. Previous studies mentioned that SST variations may alter boundary layer turbulence (e.g., Chen et al., 2022), but it remains unclear whether the representation of the SST field in those models leads to considerable changes of airmass sources impacting simulated PFCs.
In the above context, this study focuses on three scientific questions: (1) How does an increase in mean SST (e.g., +4 K, global warming) and an enhanced SST gradient (i.e., induced by enhanced GS strength) individually modify the PFC liquid water path (LWP), cloud fraction, and phase partitioning over the GS? (2) What are the dominant mechanisms – boundary layer turbulence, large-scale ascent, or microphysical feedbacks – mediating these PFC responses? and (3) Do airmass sources shift under the altered GS conditions?
To answer these questions, this study employs high-resolution WRF (v4.2) simulations with tailored SST perturbations (+4 K mean warming and 25 % SST anomalies increase relative to the control experiment) to systematically evaluate PFC responses. Building on Chen et al. (2022), we introduce two key methodological innovations: (1) Isentropic analysis of SST impact zones to isolate regional energy transport, and (2) Lagrangian tracer analysis for quantifying airmass source changes near cloud-top heights. Our approach aims to provide mechanistic implications into how GS changes may alter PFCs under future warming scenarios.
2.1 Case Overview
This study focuses on a CAO event over WNAO observed on 1 March 2020 during the Aerosol Cloud meTeorology Interactions oVer the western ATlantic Experiment (ACTIVATE) field campaign (Sorooshian et al., 2019). The CAO event was preceded by two cold front passages on 27 February (primary) and 29 February (secondary), with northerly winds advecting dry, cold air over the warm GS water. This triggered intense surface heat fluxes (> 300 W m−2) over the GS and mesoscale solenoidal circulation. Post-frontal clouds developed after the frontal passage, emerged at 08:00 Eastern Standard Time (EST) on 1 March 2020, and persisted for several hours. Chen et al. (2022) validated their WRF simulations against GOES-16 satellite retrievals and ACTIVATE dropsonde measurements (09:45–10:45 EST), demonstrating consistency in cloud morphology (e.g., cloud street alignment) and boundary layer thermodynamics (e.g., inversion height and moisture profiles), despite a slight cold bias in the simulated near-surface temperatures that were attributed to the ERA5 reanalysis inputs.
This study builds on the same CAO case analyzed by Chen et al. (2022), leveraging its robust validation with both satellite and in situ observational datasets. The well-documented cloud evolution over the GS, characterized by cloud structures influenced by SST structure, for this case provides an ideal framework for investigating SST-driven impacts on PFC morphology.
2.2 WRF Setups
The Weather Research and Forecasting (WRF v4.2) model was configured with two nested domains. The outer domain covers a 1650 km × 1650 km region of the WNAO, with simulations conducted at 3 km horizontal resolution. The inner domain corresponds to a 450 km × 450 km at 1 km horizontal resolution, and specifically intended for studying the cloud street dynamics. The simulations are conducted at 150 vertical levels (up to 100 hPa), with finer resolution in the lower troposphere (∼ 46 m layer thickness up to 6 km) versus above. The model simulations were performed for the period of 06:00 UTC 1 March–00:00 UTC 2 March. Key physics schemes include the Morrison two-moment cloud microphysics scheme (Morrison et al., 2005), the Yonsei University PBL scheme (Hong and Lim, 2006), and the Rapid Radiative Transfer Model for GCMs (RRTMG) longwave and shortwave radiation schemes (Iacono et al., 2008). Subgrid convection parameterization is disabled in the simulations to better resolve mesoscale processes at gray-zone resolutions (Field et al., 2017). Initial and boundary conditions are derived from ERA5 reanalysis. This configuration aligns with the control simulation in Chen et al. (2022), which demonstrated strong consistency with satellite and dropsonde observations, thereby validating the model's ability to capture PFC evolution. The other details of the simulation setups have been described in Chen et al. (2022).
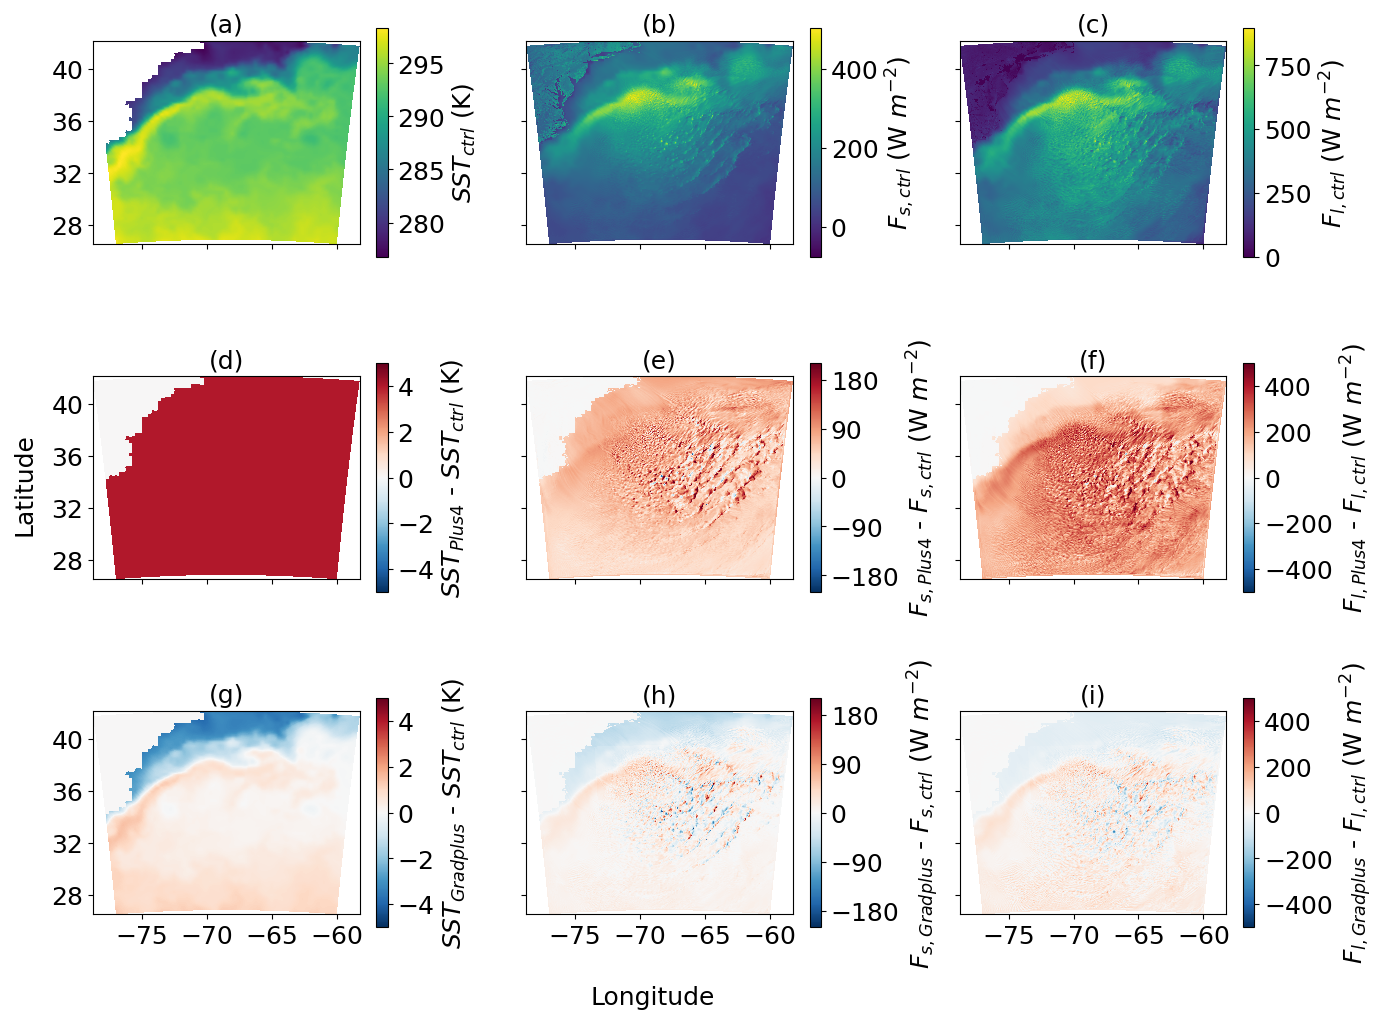
Figure 1(a) SST, (b) surface sensible heat flux, and (c) surface latent heat flux from the control simulation of out domain at 09:00 EST. Differences of (d) SST, (e) surface sensible heat flux, and (f) surface latent heat flux between the Plus4 and Ctrl simulations. Differences of (g) SST, (h) sensible heat flux, and (i) latent heat flux between the Gradplus and Ctrl simulations at 09:00 EST on 1 March 2020.
Figure 1a–c shows the spatial distribution of SST and surface fluxes from the outer domain. The SST enhancement associated with the GS leads to a large SST gradient at the north edge of the GS. There is a strong surface flux band along the GS, and strong gradients are present in both surface sensible heat flux (Fs) and latent heat flux (Fl). Hereafter, the simulation with this SST setup is referred to as “Ctrl”.
2.3 Sensitivity Experiments
Two sensitivity experiments are conducted to isolate the individual aspects of SST changes and their impacts on PFCs:
-
Mean temperature experiment: SST is uniformly increased by 4 K across the domain, including the GS core region, to mimic extreme warming scenarios (the scenario with intensive fossil fuel burning and rapid economic growth), which is expected to enhance boundary layer moisture and reduce stability (hereafter referred to as “Plus4”).
-
Temperature gradient experiment: The magnitude of positive and negative SST anomalies, relative to the domain mean, is increased by 25 % while the domain-mean SST is unchanged, intensifying thermal contrasts to evaluate the potential impact on circulation induced by SST gradients (hereafter referred to as “Gradplus”).
Figure 1d–f and g–i shows the differences in SST and surface fluxes between the control simulation and the Plus4 and Gradplus simulations, respectively, at 09:00 EST. The Plus4 simulation has a uniform SST increase. The values of Fs and Fl are highly enhanced by the SST increase of 4 K. The spatial variations in Fs arise from the cloud structure, which induces variations in near-surface horizontal winds, vertical velocity, and air temperature, thereby impacting the surface sensible heat flux. The spatial variations in Fl also show the structure influenced by clouds but the gradient at the north edge of the GS is larger than Fs, indicating a larger effect on Fl from the warm water transported by the GS. The Gradplus simulation aims to increase the gradient of SSTs through their anomalies relative to the domain mean values. Thus, the warm region gets warmer and cold region gets colder, as reflected in Fig. 1g. The spatial distributions of Fs and Fl driven by the changes in SST anomalies have some small-scale variations related to the turbulence above the ocean surface. In Sect. 3, we explore the responses of boundary layer and clouds to these two aspects of SST variations.
2.4 FLEXPART Back Trajectory Tracking
We also use the FLEXPART-WRF model (version 3.3.2) to track the backward trajectory of airmass reaching the model domain (Brioude et al., 2013). FLEXPART-WRF is a Lagrangian particle dispersion model coupled with WRF enabling high-resolution simulations of atmospheric transport and dispersion. By using WRF's output – including wind fields, temperature, humidity, and turbulence parameters – FLEXPART-WRF tracks the trajectories of numerous air parcels (treated as particles) to model particle transport and to ultimately give insight into source-receptor relationships. For backward trajectory analysis, the model reverses the temporal integration of wind fields using the WRF output in the time frequency of 15 min, allowing particles to move backward in time from a receptor location (e.g., ACTIVATE aircraft sampling location) to identify potential emission sources. We use the turbulence option (TURB_OPTION=1 and CBL_SCHEME=1) that internally calculates boundary layer turbulent mixing using the Hanna turbulence scheme (Hanna, 1982) and allow the skewed turbulence (Brioude et al., 2013).
3.1 Response of Cloud Morphology to SST Variations
The cloud structure behind the frontal system exhibits diverse horizontal spatial patterns. Based on the classification criteria consistent with Chen et al. (2022), six zones are classified in each of the three experiments (Fig. 2) according to thresholds of smoothed liquid water path. The cloud water path is smoothed by a uniform filter of 30 grids, which removes the high-frequency variations in the complex cloud structure. Then we separate out the clear coastal and zones 3–6 with the values of smoothed water path of < 40, 40–200, 200–500, and > 500 g m−2, respectively. Zone 1 corresponds to the eastern coastal landmass of the United States. Zone 2 represents a cloud-free region over the ocean. Zones 3–5 correspond to regions with PFCs, whereas zone 6 identifies the frontal system, which is dominated by extensive cloud cover.
PFCs west of the frontal zone (Zones 3–5) display distinct cloud morphologies. Between the clear-sky region (Zone 2) and the distinct cloud streets (Zone 4), Zone 3 serves as a transition zone where cloud streets appear from the upwind clear skies. Zone 4 features well-defined, continuous cloud street structures aligned with prevailing winds by a small angle (Chen et al., 2022). Near the frontal boundary (Zone 5), cloud streets transition into fragmented patches, manifested as open-cellular convection.
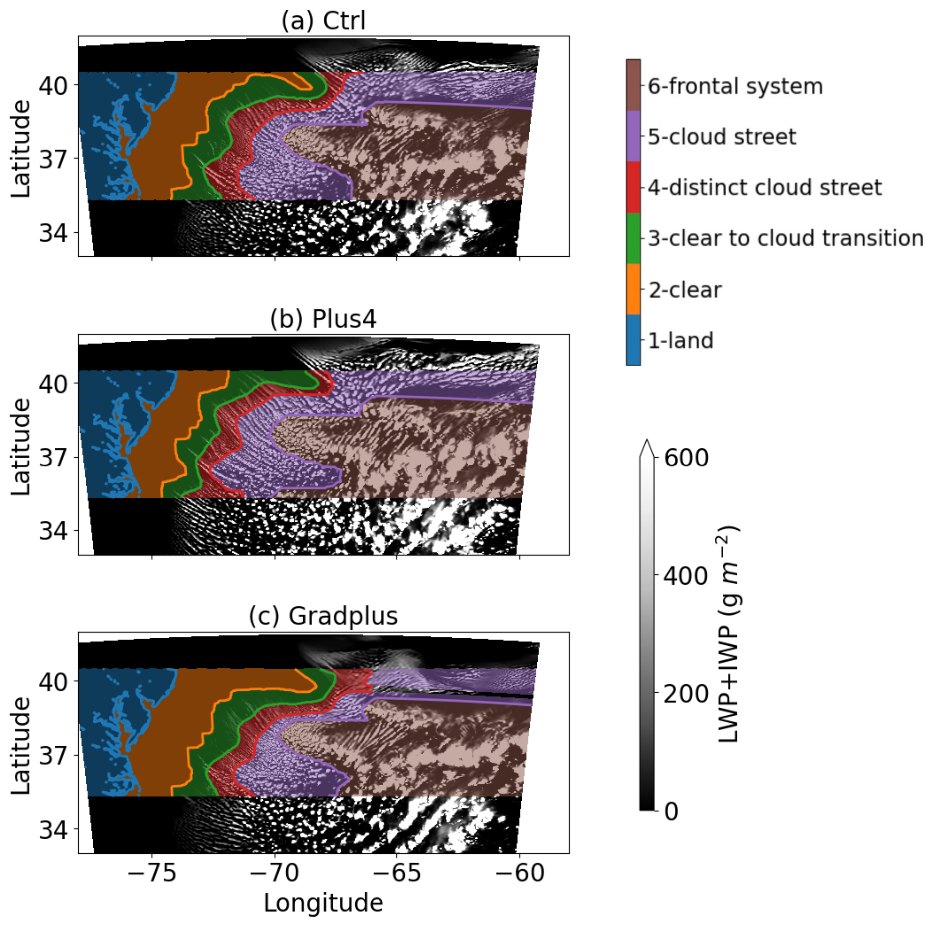
Figure 2Spatial distribution of liquid water path (LWP) and ice water path (IWP) from (a) Ctrl, (b) Plus4, and (c) Gradplus experiments (white shading) at 09:00 EST on 1 March 2020. Overlaid color shading indicates the zone classification also used by Chen et al. (2022).
We test the hypothesis that variations in SST patterns influence coverage of each zone (Fig. 2b, c) by comparing the different experiments. Relative to the Ctrl experiment, the Plus4 simulation shows a 20.8 % reduction in spatial area of Zone 2, a 16.3 % reduction in Zone 3, a 12.7 % reduction in Zone 4, a 2.6 % expansion in Zone 5, and a 14.3 % expansion in Zone 6 (Fig. 3a). Also, the total area of PFCs (Zones 3–5) remains largely unchanged overall (only a 4.5 % reduction), despite a spatial shift of clouds toward the coastline. These changes suggest a significant enhancement in frontal cloud development (Zone 6) and a contraction of clear-sky areas (Zone 2). This cloud redistribution is likely driven by warmer SSTs and elevated boundary layer moisture, which promote convective cloud formation and frontal zone intensification.
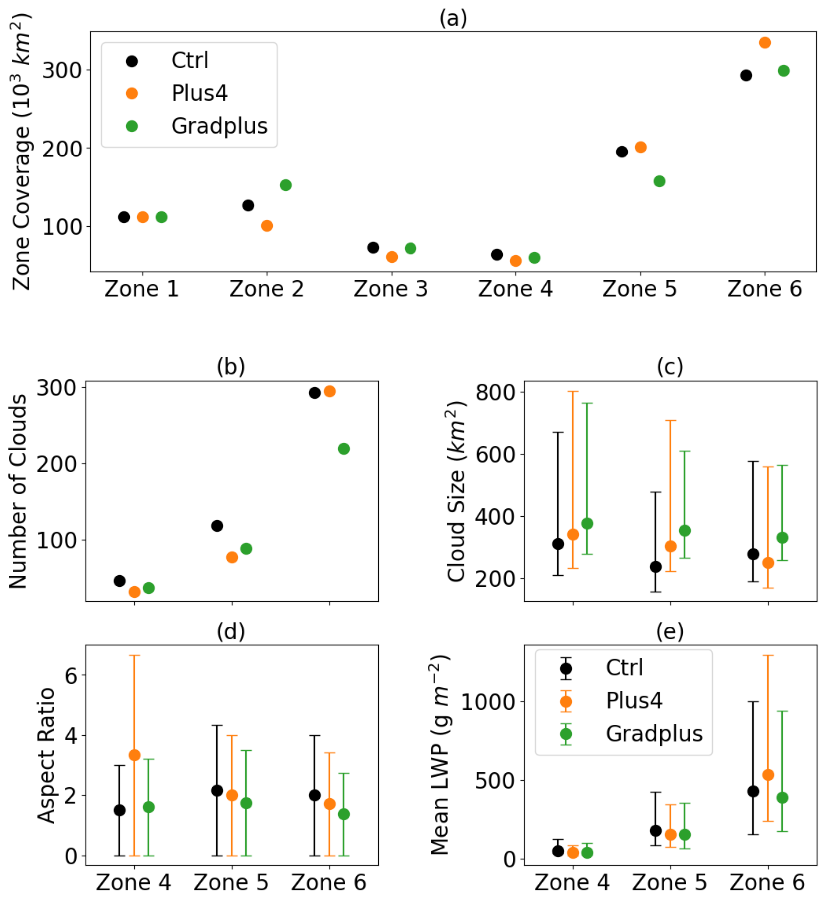
Figure 3(a) Areal coverage of PFC zones 1–6 from the control and two sensitivity simulations. (b) number of cloud objects of PFC zones 4–6, (c) averaged cloud size of PFC zones 4–6, (d) averaged aspect ratio of cloud horizontal mask of PFC zones 4–6, and (e) mean LWP of each cloud object averaged in corresponding PFC zone at 09:00 EST on 1 March 2020.
In the Gradplus experiment, the areal coverage of Zone 5 (cloud street zone) decreases by 19.3 %, while Zone 2 (clear zone) expands by 20.2 %, reflecting a decline in organized PFC structures and an increase in coastal clear-sky coverage. Zones 3, 4, and 6 show small changes (1.5 % reduction, 6.4 % reduction, and 2.1 % expansion, respectively), compared to the Ctrl simulation. These results indicate that intensified SST gradients suppress cloud organization within PFCs, favoring localized clear-sky expansion at the expense of coherent cloud structures.
Figure 3b–e illustrates changes in cloud object size under the altered SST patterns. Cloud objects are defined here as regions where the ratio of LWP to smoothed LWP exceeds 0.8 (Chen et al., 2022). In the Plus4 experiment, PFCs exhibit a reduced number of cloud objects but a larger cloud size, while frontal clouds show minimal changes of cloud number despite a reduced cloud size. The aspect ratio in Fig. 3d, which quantifies cloud street elongation, increases by 122.2 % in Zone 4 (distinct cloud streets) indicating enhanced longitudinal organization of cloud streets in Zone 4. Mean LWP decreases by 26.0 % in Zone 4 and 15.5 % in Zone 5 but rises sharply by 24.4 % in Zone 6, reflecting more vigorous frontal clouds. These results suggest that warmer SSTs promote fewer but larger PFCs with elongated cloud streets in Zone 4, while frontal clouds become vertically deeper (evidenced by LWP increases) despite reduced horizontal extents.
In the Gradplus experiment, both PFCs and frontal clouds exhibit larger individual cloudy areas but a smaller number of clouds compared to the Ctrl simulation. The aspect ratio shows an overall reduction, except in Zone 4 where it demonstrates a slight increase. Mean LWP values remain consistently lower than those in the Ctrl simulation. The meteorological phenomena in Zones 5 and 6 may be attributed to their position within positive SST anomaly regions, where the primary SST gradients associated with the GS are displaced farther northwestward.
3.2 Response of energy transport to SST variations
This section explores the mass and energy transport in frontal systems and PFCs. Previous studies have relied on isentropic analysis of moist convection to identify energy transport through diabatic processes, such as convection (Chen et al., 2023; Pauluis and Mrowiec, 2013). This method involves averaging the mass flux and other examined variables at the isopleths of equivalent potential temperature (θe) to isolate upward and downward motions that contribute to energy transport through their net effects. In other words, adiabatic vertical motions with oscillations (such as gravity waves) are filtered out by this averaging to derive irreversible energy/mass fluxes. Here, we apply the same method to Zones 4–6 in Fig. 4a–c to illustrate energy transport in these regions. We also show the mass flux at the isopleths of qv (Fig. 4d–f) and θ (Fig. 4g–i) to describe the properties of the air parcels.
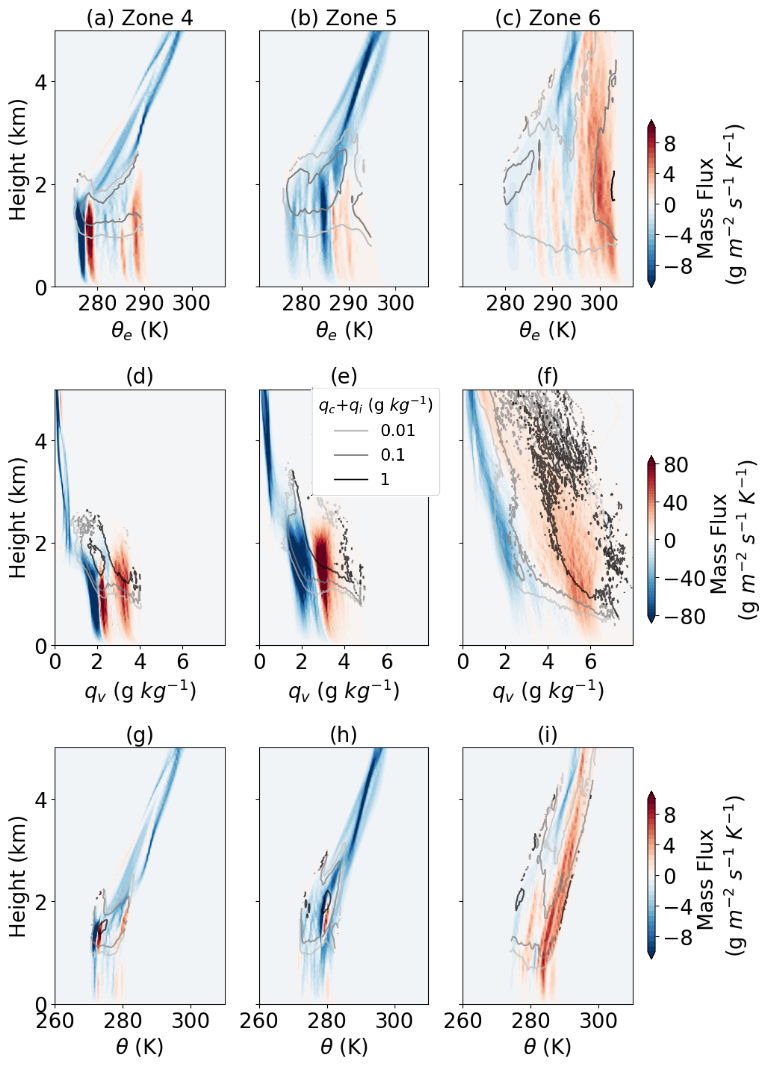
Figure 4Isentropic analysis of mass flux in (a) Zone 4, (b) Zone 5 and (c) Zone 6. (d–f) Mass flux over isopleths of qv in (d) Zone 4, (e) Zone 5, and (f) Zone 6. Mass flux over isopleths of θ in (g) Zone 4, (h) Zone 5, and (i) Zone 6. All results are from the Ctrl simulation at 09:00 EST on 1 March 2020.
Zones 5–6 exhibit a primary upward band at high θe and a downward band at low θe, consistent with previous studies on moist convection (Chen et al., 2023; Pauluis and Mrowiec, 2013). As parcels with high θe ascend and those with low θe descend, the net energy transport is upward. However, in Zone 4, two distinct upward bands are observed at different θe values: one at ∼ 287.75 K (similar to the upward band in Zone 5) and another at 278.25 K, which is notably lower. We speculate these two bands relate to different processes, which will be discussed below. Additionally, in Zones 4 and 5, a downward mass flux band is present above the clouds, terminating at lower altitudes near the cloud top. This may be attributed to large-scale downward motion within PFCs.
Since θe comprises two components, potential temperature (θ) and water vapor mixing ratio (qv), we also display the mass flux at isopleths of these variables in the second and third rows of Fig. 4, respectively. When using qv isopleths, the mass flux magnitude is significantly larger than with isentropic coordinates or θ isopleths, suggesting a stronger transport of qv by mass flux than θ, because upward and downward transports compensate on isopleths, and the mass fluxes defined on isopleths represent the fluxes that effectively transport the corresponding quantities. Cloud cores (black contours) appear directly above the upward bands in the qv analysis, implying that these clouds draw their moisture from the boundary-layer upward motion. In Zone 4, two separate cloud cores align with the two upward bands. When mass flux is averaged over θ isopleths, it is large within and above the clouds, indicating that thermal energy transport occurs primarily at the altitudes of clouds.
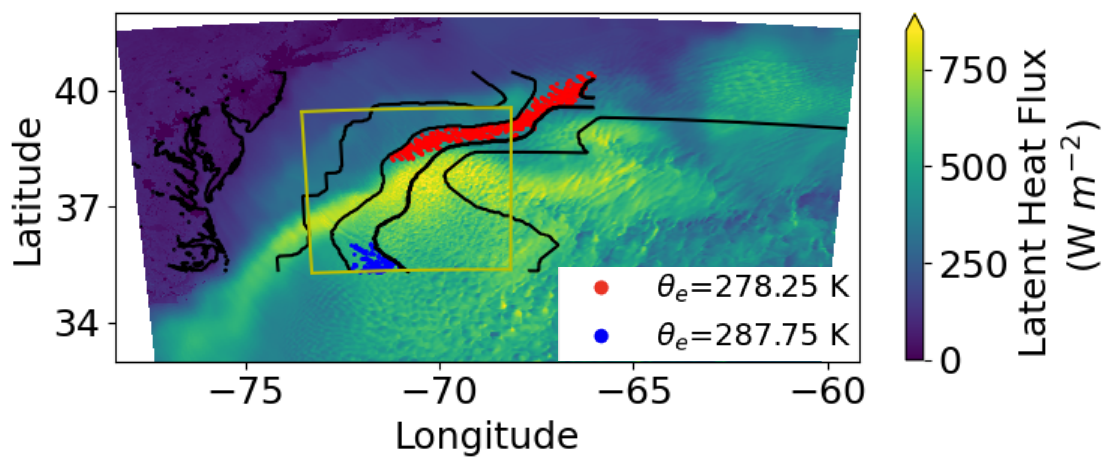
Figure 5Spatial distribution of latent heat flux. Black contour denotes the zone classification in Fig. 2. Yellow box denotes the inner domain. Red and blue dots mark the location of the two θe peaks in Fig. 4a at 09:00 EST on 1 March 2020.
The two separate upward mass flux bands in Fig. 4a, d, and g suggest that Zone 4 involves distinct convection processes. We locate the two θe values associated with large mass fluxes on the spatial distribution of surface latent heat fluxes in Fig. 5. The higher θe band is located south of the GS region, at a distance from the GS itself, while the lower θe band is positioned at the northern GS edge. Because the higher θe value (287.75 K) in the southern upward band is comparable to the θe values in the upward bands of Zones 5 and 6, we speculate that the southern upward energy transport band may represent an extension of the frontal system, indicative of large-scale frontal influences. The low θe upward mass flux band at the northern GS edge is likely linked to local SST gradients, where mesoscale circulations may develop and influence the broader region, potentially triggering new convective upward energy transport. We further explore the secondary circulation associated with the SST gradients in Sect. 3.3.
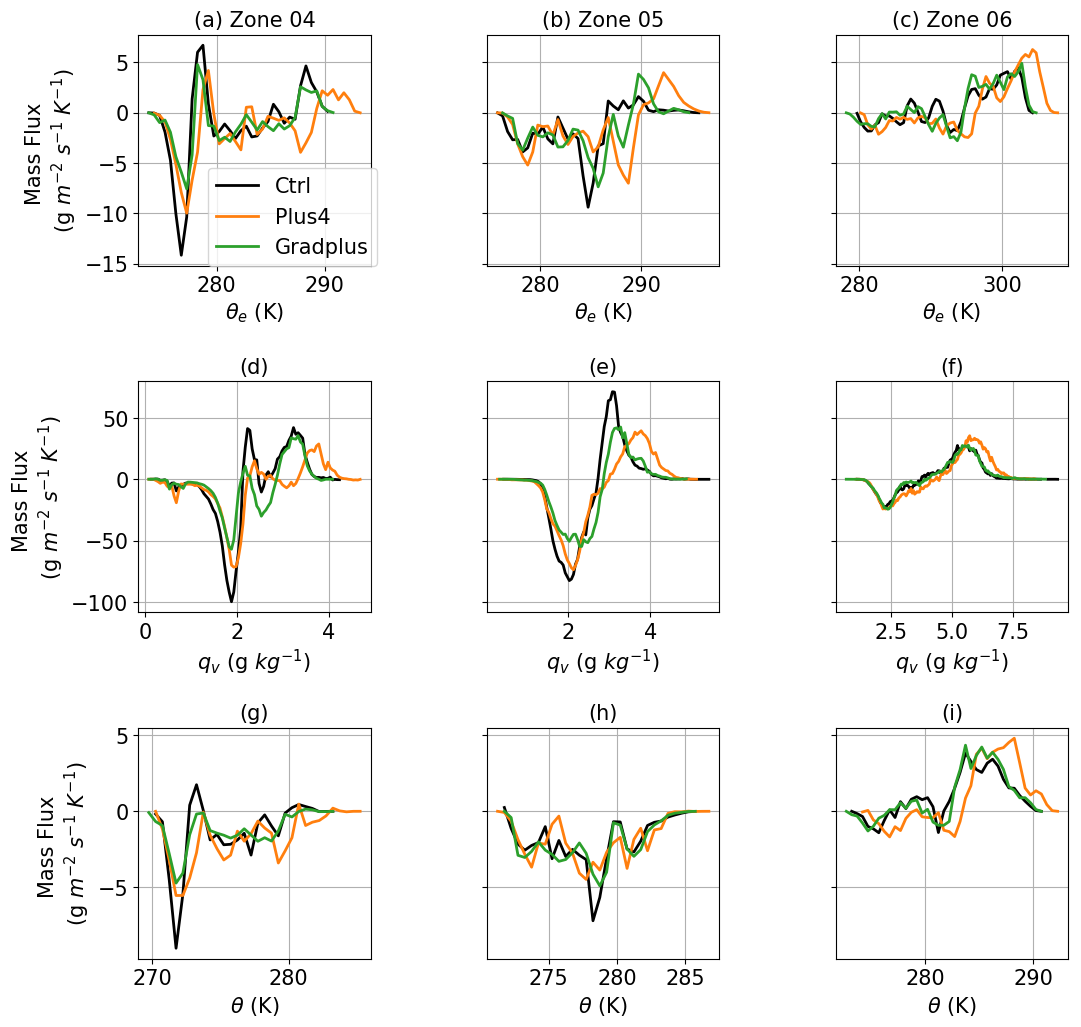
Figure 6Averaged mass flux below 2 km at (a–c) isentropic coordinates, (d–f) isopleths of qv, and (g–i) isopleths of θ for (a, d, g) Zone 4, (b, e, h) Zone 5, and (c, f, i) Zone 6 at 09:00 EST on 1 March 2020.
In Fig. 6, we explore the impacts of SST variations on energy transport in Zones 4–6, with mass flux averaged below 2 km. In the Plus4 experiments, energy transport bands shift to higher isopleth values of θe, qv and θ across all zones. This suggests that warmer SST scenarios drive convective energy transport to higher energy levels, accelerating the process. The energy transport magnitudes in the Gradplus experiments are similar to those in the Ctrl experiments, but mass flux peaks are reduced in the lower θe band in Zone 4, indicating a weakened transport efficiency under the stronger SST gradients. The underlying mechanisms are discussed in Sect. 3.3. Zones 5 and 6 exhibit no significant differences between Ctrl and Gradplus experiments, likely because these zones lie outside the GS-influenced region.
In summary, the analysis of mass fluxes on isentropic coordinates indicates two distinct influences on the development of the cloud street zone: one influenced by the frontal system and the other by the SST gradient. The upward mass-flux band at the northern edge of the Gulf Stream illustrates the role of the SST gradient in affecting the post-frontal cloud system.
3.3 Response of Boundary Layer Properties to SST Variations
In this section, we focus on the inner domain where a contrast in SST anomalies is present. Figure 7 shows the vertical profiles of boundary layer properties in the negative-anomaly region (north of the GS) and the positive-anomaly region (south of the GS) at 09:00 EST. The Plus4 experiment results in higher boundary layer qv, θ, hydrometeor mixing ratio, and wind speed in both regions (Fig. 7a, b, c, and e). Additionally, the fraction of liquid-phase hydrometeors is reduced, indicating that clouds are elevated with more ice-phase hydrometeors in both regions (Fig. 7d). Wind direction shifts clockwise with the increased SST (Fig. 7f), likely due to a strengthened Coriolis effect by the enhanced wind speed.
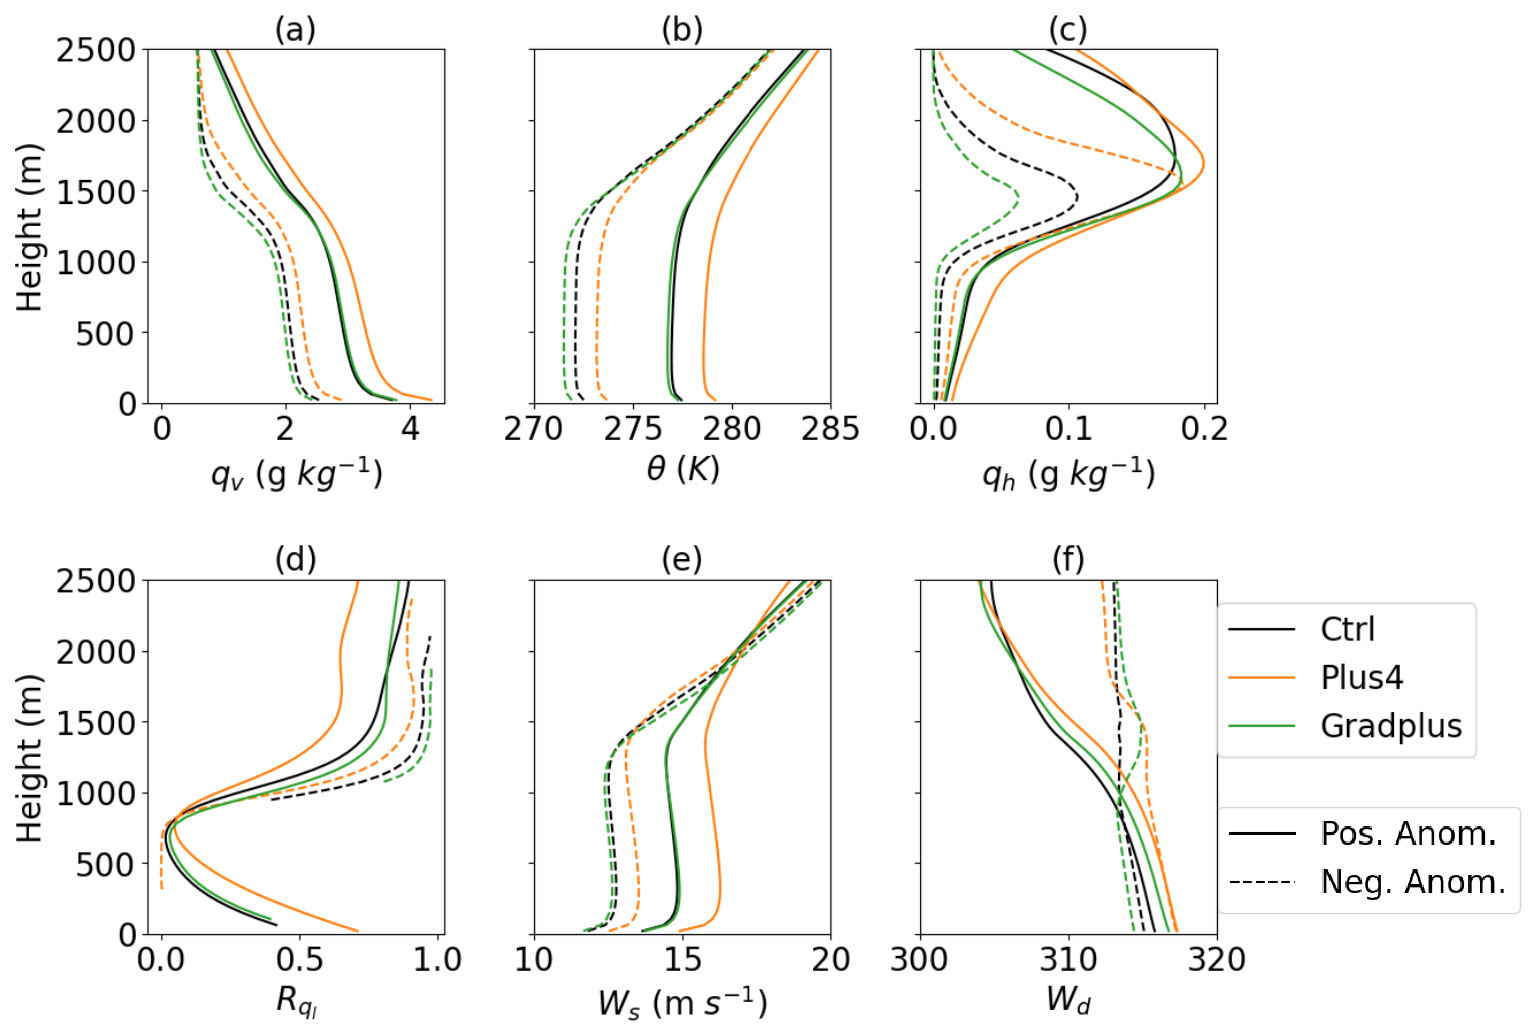
Figure 7Vertical profile of (a) water vapor mixing ratio (qv), (b) potential temperature (θ), (c) hydrometeor mixing ratio (qh), (d) the ratio of ice-phase hydrometeor to liquid-phase hydrometeor (Rql), (e) wind speed (Ws), and (f) wind direction (Wd) at 09:00 EST.
Figure 8 displays the time series of differences between the Plus4 experiment and the Control simulation. The elevated boundary layer qv, θ, cloud liquid and ice water mixing ratio, and wind speed persist from sunrise to sunset. In the early morning before sunrise, liquid-phase cloud content is slightly higher in the Plus4 experiment, but the differences diminish after sunrise. The all-ice-phase hydrometeor content in Plus4 is significantly larger than in the Control experiment, suggesting that the higher SST promotes deeper cloud development.
Figure 7 demonstrates that SST anomaly impacts in the Gradplus experiment are notably weaker than in Plus4 at 09:00 EST. The temporal variations in Gradplus are less straightforward, as shown in Figs. 9–11, with the magnitude of the differences being much smaller than in the Plus4 experiment and the sign being less consistent. The GS region (“middle” in Figs. 9–11) corresponds to latitudes with maximum SST per longitude, with areas north and south of it labeled accordingly.
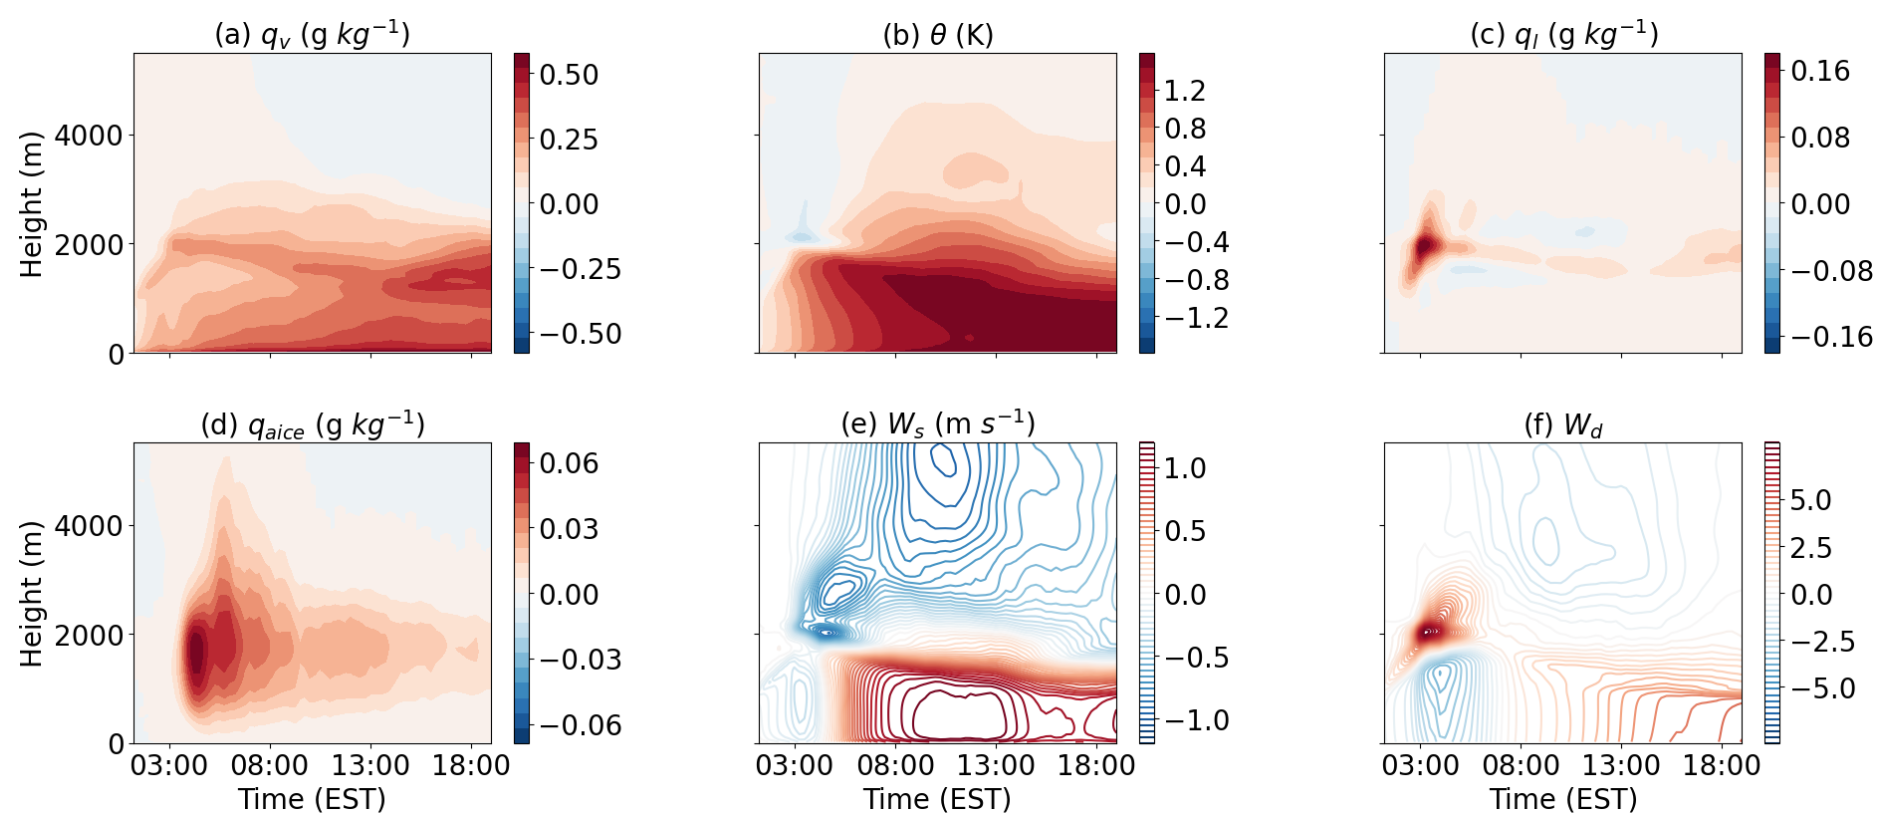
Figure 8Time series of the differences between the Plus4 and Ctrl experiments. Color shading indicates (a) qv, (b) θ, (c) liquid water mixing ratio (ql), (d) mixing ratio of all ice (qaice), (e) wind speed (Ws), and (f) wind direction (Wd).
In Fig. 9, moving from north to south, the intensified SST gradient shifts their effects from negative to positive in the values of qv and θ within the boundary layer, indicating suppression of temperature and moisture in the north (due to a 25 % SST reduction) and enhancement in the south (due to an SST increase). At the top of the boundary layer, strong negative effects on qv are observed in the southern and middle regions, with altitude decreasing over time, consistent with declining boundary layer heights (Chen et al., 2022). Coupled with positive effects from Gradplus on wind speeds at these altitudes (Fig. 10a–c), we speculate that drier air advection from the north causes the negative qv anomaly at higher altitudes. Additionally, strong divergence at the top of the boundary layer in Fig. 10g–i provides evidence of drier air transport by intensified northerly winds.
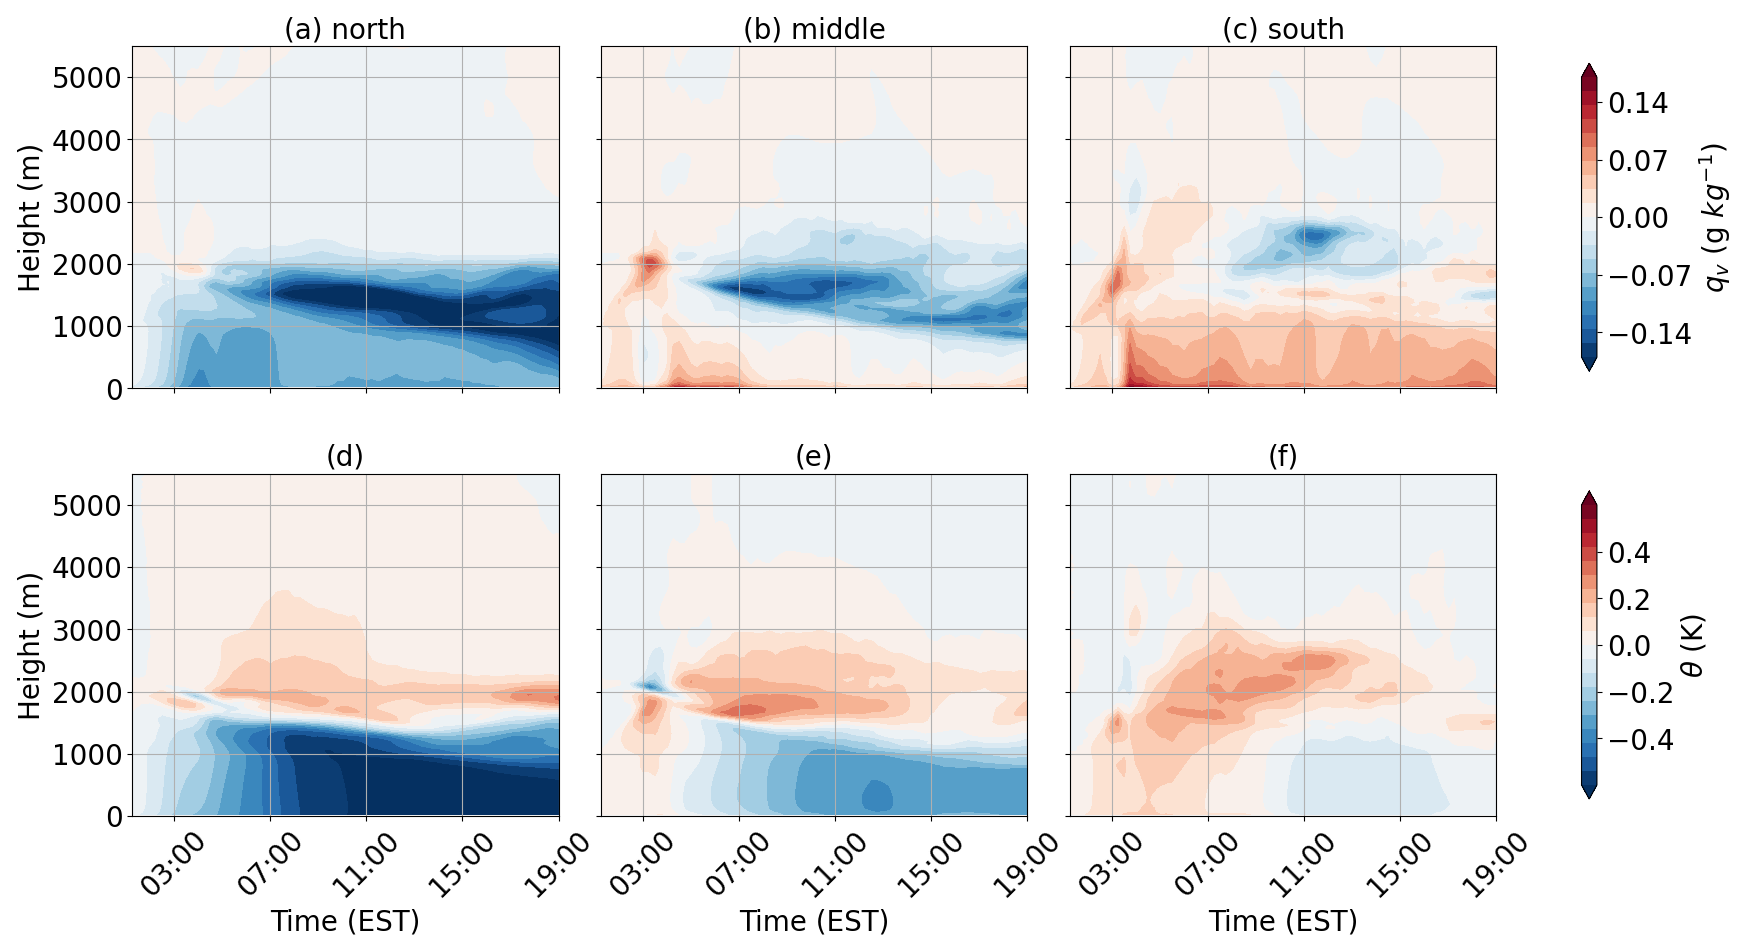
Figure 9Time series of the differences of (a–c) qv and (d–f) θ, between Gradplus and Ctrl experiments in the three regions: (a, d) north of the GS, (b, e) at the latitudes of GS, and (c, f) south of the GS.
However, despite stronger advection observed above the boundary layer, vertical transport of colder air is largely confined to the boundary layer in the northern region (Fig. 9d), leaving positive anomalies at higher altitudes. Meanwhile, stronger convection lifts warm air from the surface to above the boundary layer between 04:00 and 08:00 EST in the southern region (Fig. 10e–f). Stronger convergence observed during 04:00–08:00 EST in the southern region aligns with the enhanced vertical velocity (Fig. 10g–i). This suggests that transport of thermal energy is from south to north, opposite to the direction of moisture transport.
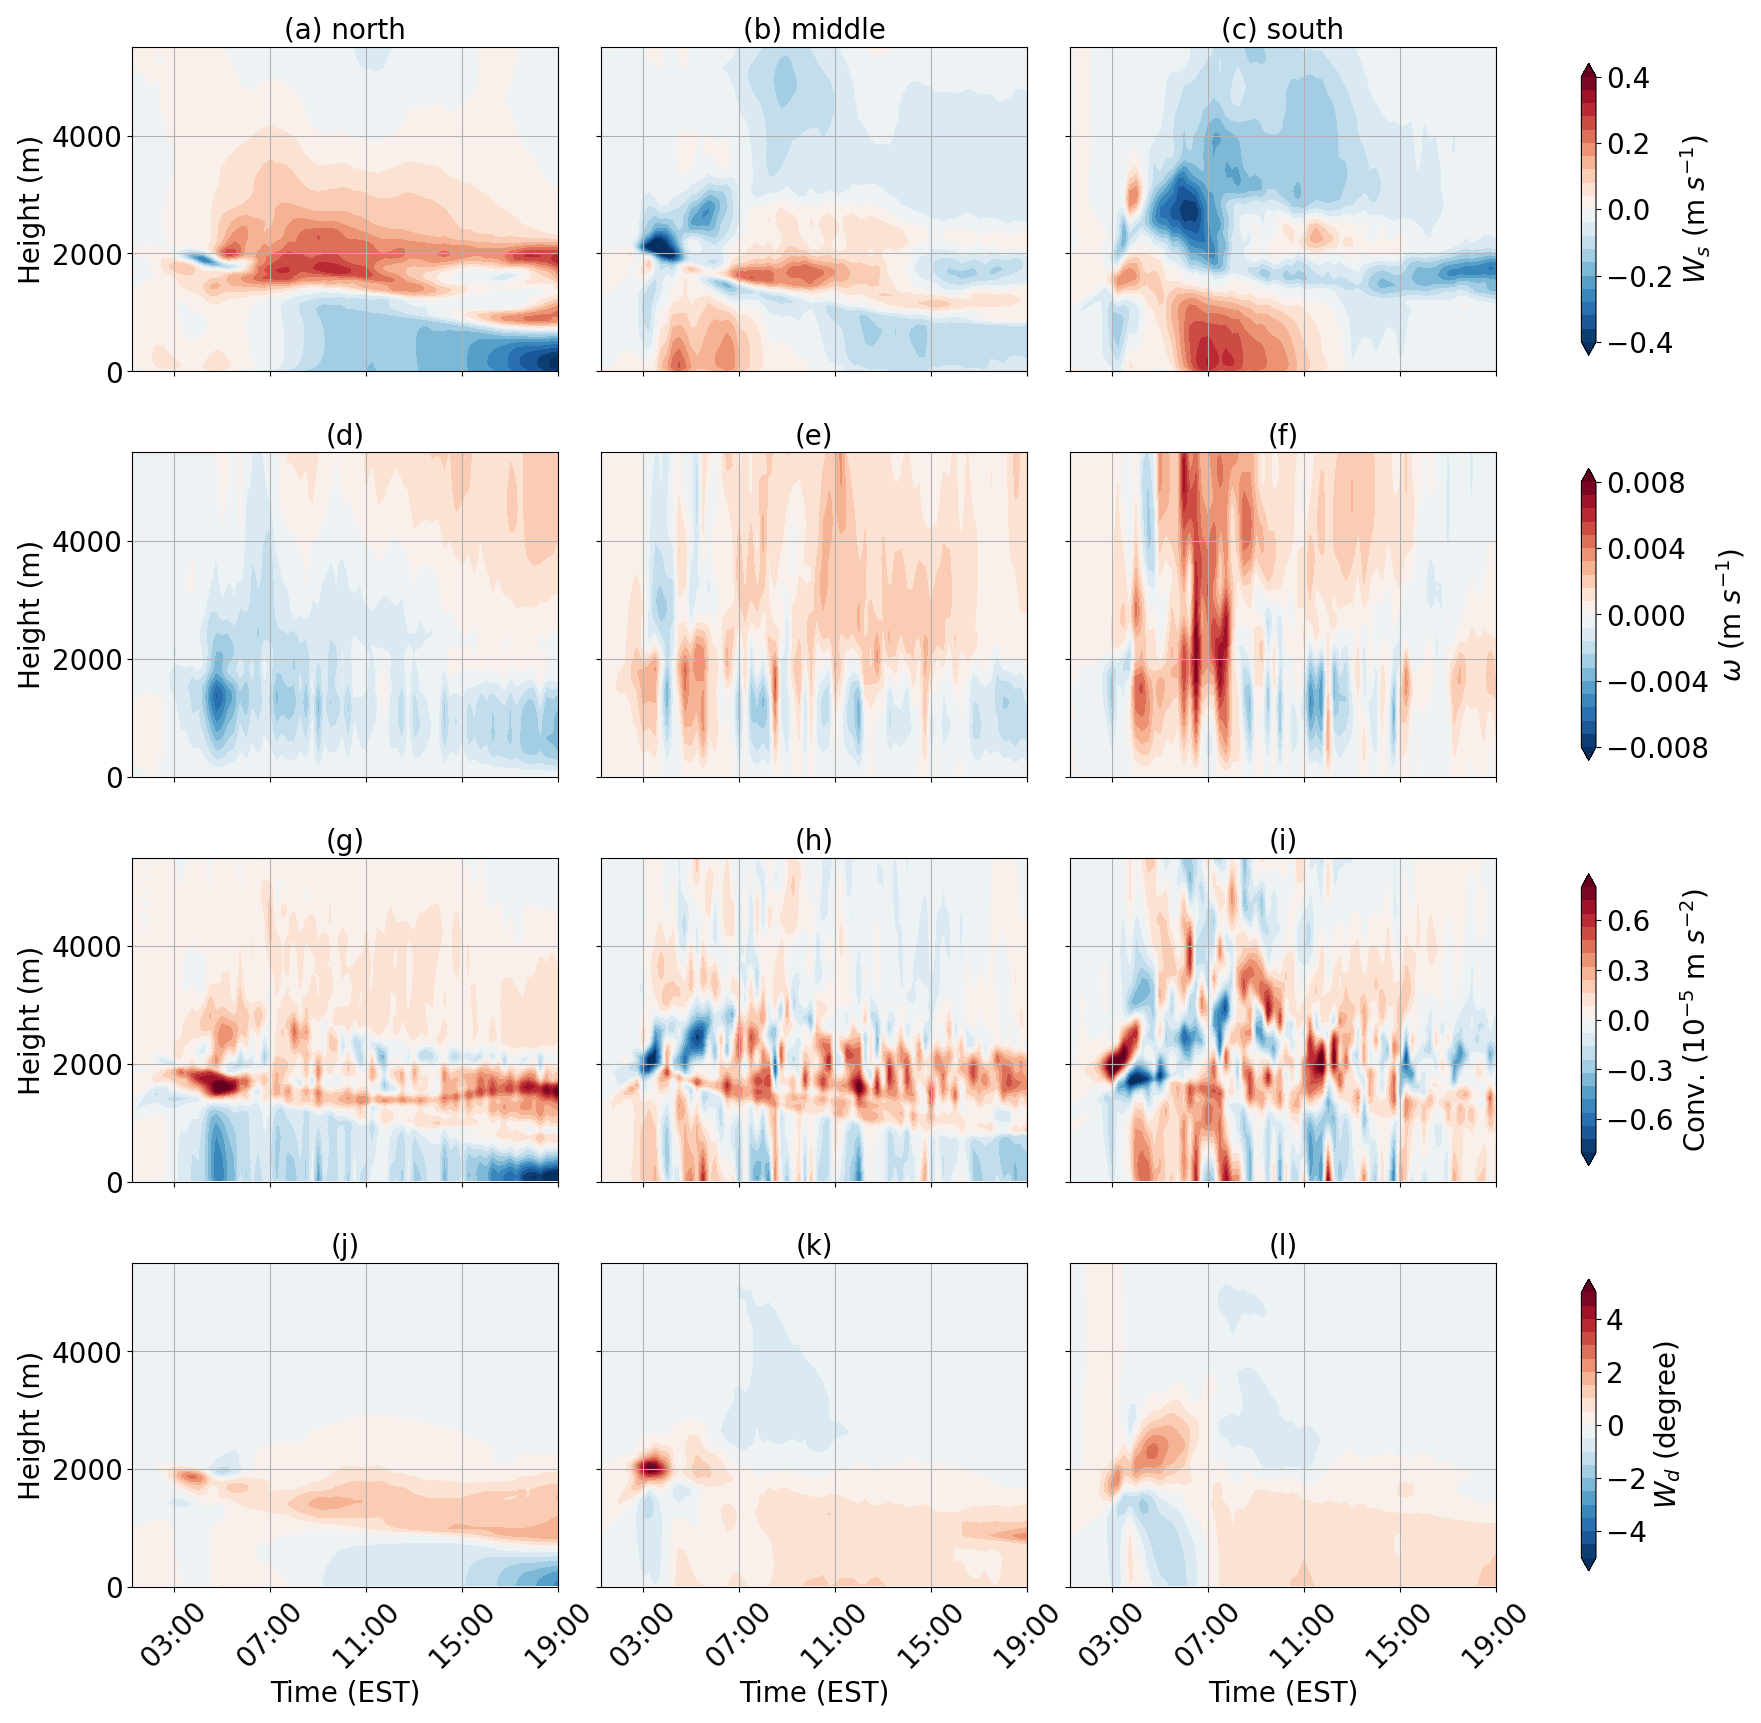
Figure 10Time series of the differences of (a–c) wind speed, (d–f) vertical velocity, (g–i) convergence, and (j–l) wind direction between Gradplus and Ctrl experiments in the three regions: (a, d, g, j) north of the GS, (b, e, h, k) at the latitudes of GS, and (c, f, i, l) south of the GS.
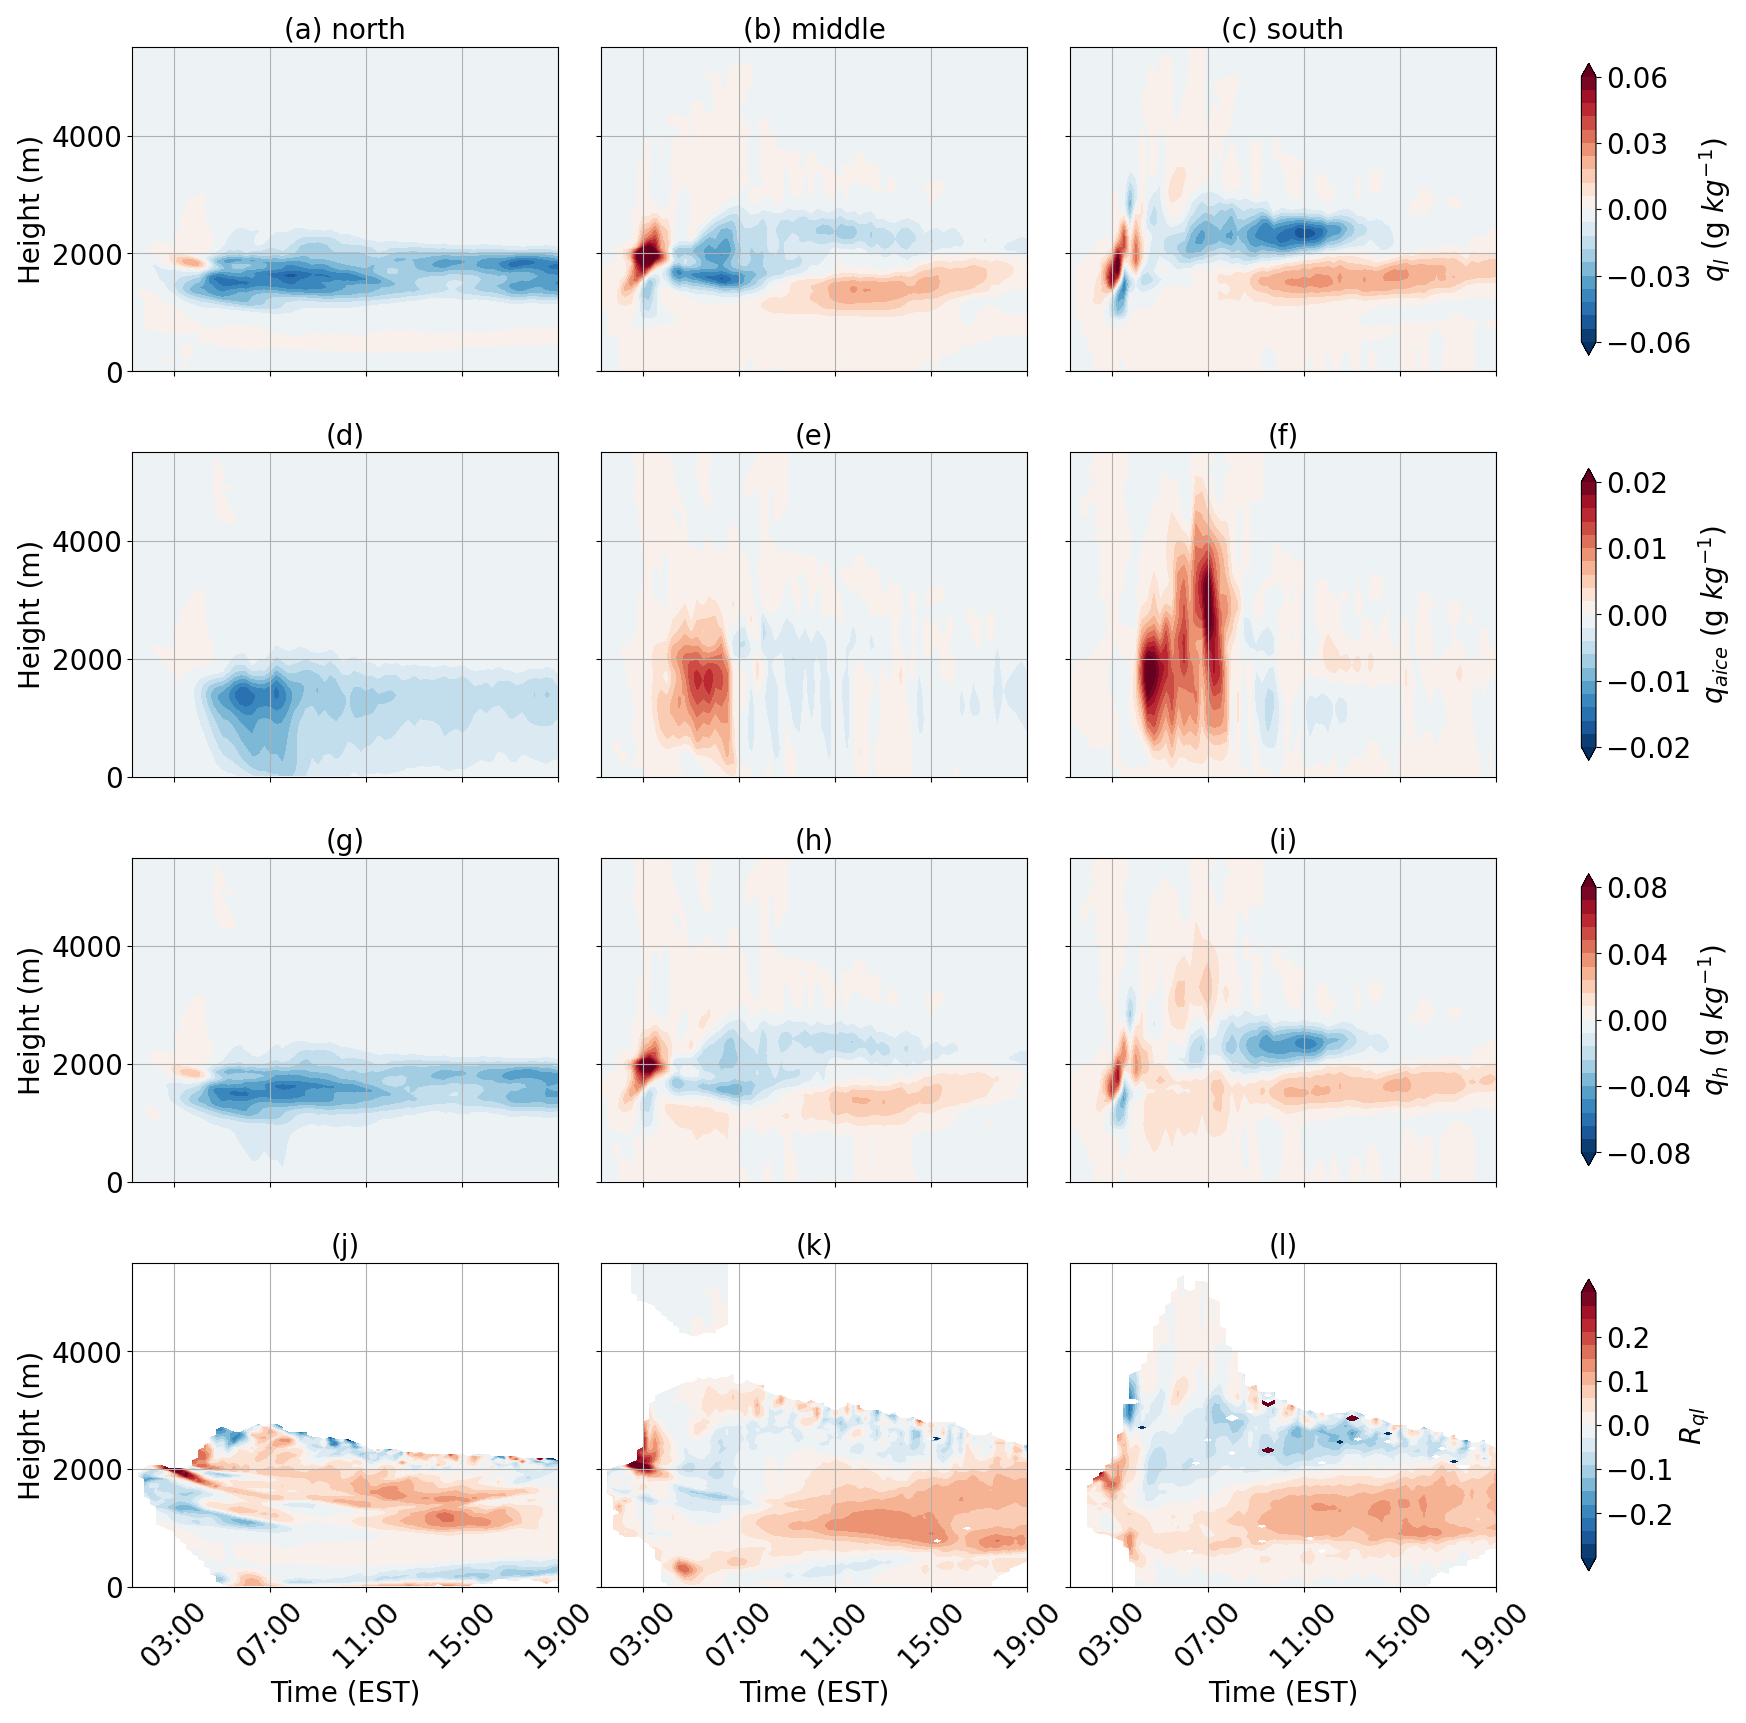
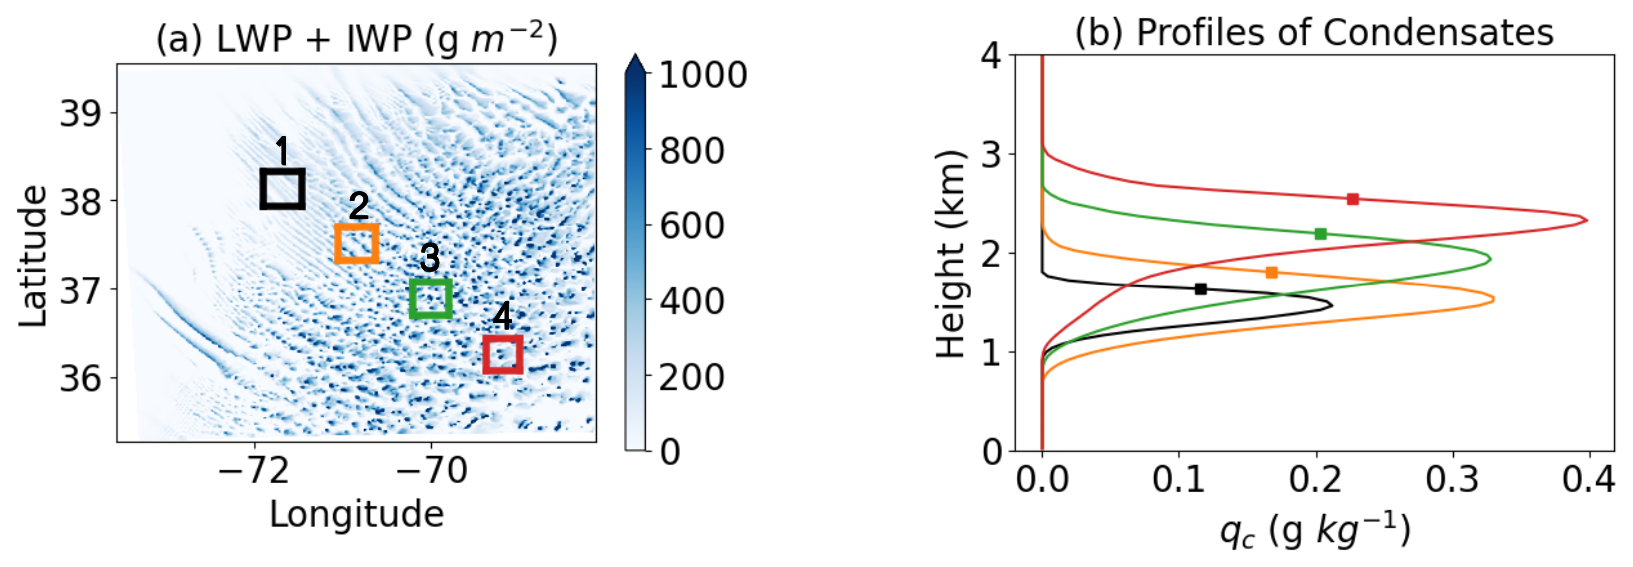
Figure 12(a) Total (liquid and ice) water path at 09:00 EST on 1 March 2020. Black, orange, green, and red boxes are the four locations where tracers are released. (b) Averaged profiles of cloud condensate mixing ratio (qc) within the four boxes in panel (a). Squares denote the heights where tracers are released in Fig. 13.
Two processes govern interactions between air above the negative SST anomaly region in the north and the positive SST anomaly region in the south: (1) North-to-south advection of smaller θ and qv, and (2) south-to-north diffusion of both θ and qv driven by their gradients (i.e., larger values in the south). The net effects observed in Fig. 9 result from these opposing processes. In Sect. 3.2, we show that the one of the upward mass flux bands with cloud formation is at the northern edge of GS, suggesting cloud processes interfere with the interactions of θ and qv between regions north and south of the GS. We hypothesize that higher qv lifted from surface to above the boundary layer in the southern region by convection is consumed via stronger phase changes with the intensified SST gradient, weakening the south-to-north diffusion of qv. Consequently, the north-to-south advection of drier air dominates (Fig. 9a–c). We hypothesize that stronger phase changes associated with the intensified SST gradient from water vapor to hydrometeors release more latent heat, warming the air and intensifying south-to-north heat diffusion (Fig. 9d–f).
We examine the hypothesis of cloud interference described above in Fig. 11, which shows that a stronger low-level convergence (below ∼ 2 km) and larger vertical velocities before 08:00 EST in Gradplus (Fig. 10f and i) closely associate with larger ice-phase hydrometeor mixing ratios during the same period. An increase of liquid-phase hydrometeors in Gradplus dominates within the boundary layer of the middle and southern regions (Fig. 11k and l). These results suggest that, in the Gradplus experiment (vs. Ctrl), enhanced latent heating from the increased ice-phase hydrometeors is key to modulating θ and qv interactions across GS regions above the boundary layer. This implies that microphysical processes – specifically, transitions from warm clouds to mixed-phase/ice-phase clouds – critically influence θ and qv values above the boundary layer.
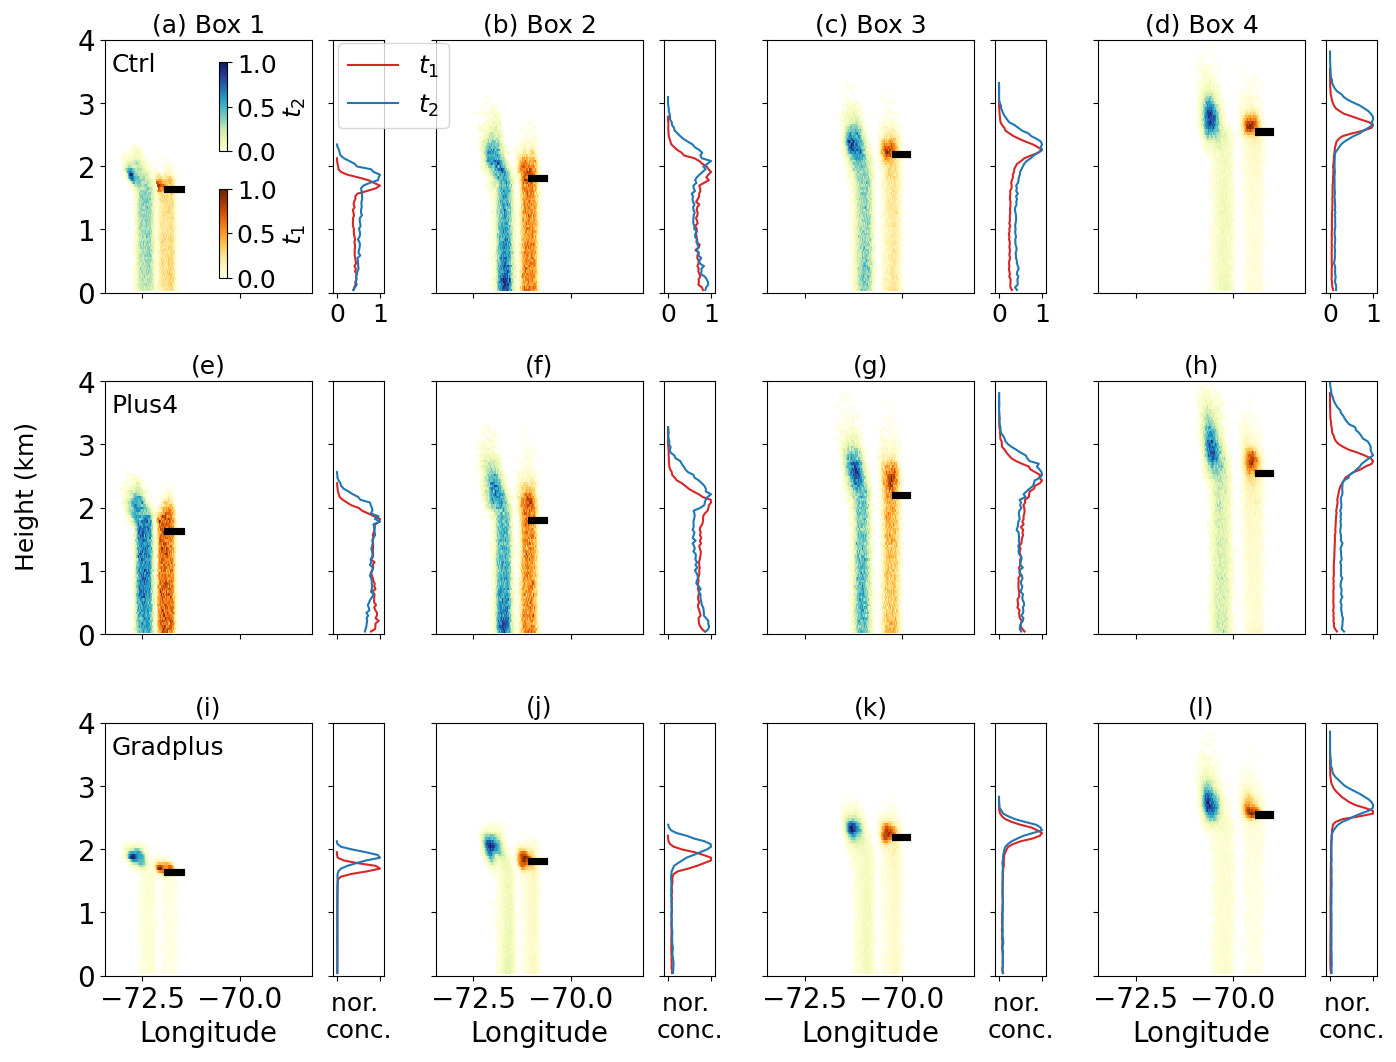
Figure 13Profiles of normalized tracer concentration by the total number of each trajectory run averaged at each longitude (left side of each panel (a)–(l)) and over the entire domain (right side of each panel (a)–(l)) for tracers released midway between the maximum qc and cloud top. The horizontal black bar denotes the tracer release location. In each row, panels from left to right correspond to release locations in Boxes 1–4 (see Fig. 12a). Rows from top to bottom represent results from the Ctrl, Plus4, and Gradplus experiments. The warm color (red) represents 30 min prior to the release time (t1) and the cold color (blue) represents 2 h prior to the release time (t2).
3.4 Response of the Sources of Airmass to SST Variations
Section 3.1–3.3 demonstrate that the Plus4 and Gradplus experiments introduce variations in local mesoscale circulation around the GS region. Beyond influencing thermal and moisture fields, we hypothesize that SST variations also modify airmass sources, which determine the type of aerosols (continental vs. marine) transported over the WNAO. To test this hypothesis, we use Lagrangian tracers to track backward trajectories of airmasses ending up within clouds. This approach aims to determine whether changes occur in the origin of airmasses that ultimately affect clouds.
We release tracers at four locations (Fig. 12a) and seven altitudes. The locations align with wind directions corresponding to cloud lines. The selected altitudes reflect their vertical position relative to cloud layers: (1) ocean surface, (2) 500 m above sea level and within the boundary layer, (3) cloud base, (4) midpoint between cloud base and the height of maximum qc, (5) height of maximum qc, (6) midpoint between the height of maximum qc and cloud top, and (7) cloud top. We calculate tracer concentrations for all 28 configurations of tracer release in the Ctrl, Plus4, and Gradplus experiments. Results show that, for six out of seven altitudes, tracer concentrations are similar at 30 min and 2 h prior to release time between sensitivity and control simulations (not shown). The exception occurs for the altitude between the height of maximum qc and cloud top (Squares in Fig. 12b).
In the Ctrl experiment, the primary air source originates from west of the tracer release location, as tracer positions at 2 h prior to release (cold color in Fig. 13) are situated farther west compared to their positions at 30 min before release (warm color in Fig. 13). When tracers are released within Box 2, two distinct airmass sources are observed: one from the cloud top and the other from the ocean surface. From Box 2 to Box 4, the cloud top airmass becomes increasingly dominant, suggesting that secondary circulation, associated with cloud streets that enhance tracer transport from the ocean surface, weakens progressively from Box 2 to Box 4.
In the Plus4 experiment, the airmass fraction originating from the ocean surface increases, likely due to the higher SSTs that drive a stronger turbulent transport within the boundary layer. In contrast, the contribution of airmass from the cloud top across all four boxes is enhanced in the Gradplus experiment, likely because stronger northwesterly winds above the boundary layer accelerate transport (Fig. 10a–c).
Aerosols linked to clouds in the examined regions are influenced by a mix of continental and marine sources. Our results regarding the air parcel origins implicitly suggest that SST variations associated with the GS trigger distinct shifts in aerosol composition. Specifically, marine aerosols influence Boxes 2–4 in Ctrl experiments and all four boxes in Plus4 experiments via air parcels originated from sea surface, while continental aerosols influence the other boxes through air parcels originated from continents. This subsequently alters aerosol-cloud interactions over the WNAO region.
This study investigates the impacts of altered Gulf Stream (GS) mean sea surface temperature (SST) and gradients on post-frontal cloud (PFC) characteristics during cold-air outbreaks (CAOs) over the western North Atlantic Ocean (WNAO). Using high-resolution WRF simulations of an ACTIVATE winter CAO event on 1 March 2020, combined with Lagrangian tracer analysis, we conduct two targeted sensitivity experiments: (1) a uniform +4K SST increase (Plus4; representing IPCC's A1F1 extreme warming scenario) to isolate mean warming effects, and (2) a 25 % SST gradient enhancement (Gradplus; representing the strengthening of GS) with unchanged mean SST to examine gradient impacts. Three key findings emerge:
-
Mean SST warming (+4 K) leads to a warmer, moister boundary layer, promoting larger cloud sizes. Enhanced ice-phase hydrometeors and elongated cloud streets are observed, with diminished liquid water path (LWP) in PFCs. Warmer SSTs amplify BL contributions of heat and moisture to cloud-top regions, altering airmass trajectories and favoring deeper, vertically extended clouds.
-
Enhanced SST gradients (+25 %) around the GS suppress cloud organization and increase clear-sky areal coverage. Stronger gradients intensify energy transport contrasts, leading to drier, colder BL conditions upwind of negative SST anomalies and enhanced liquid-phase hydrometeors in localized regions. Microphysical feedback, particularly ice-phase transitions, modulate thermal and moisture interactions across the GS, especially in the downwind positive SST anomaly region.
-
Airmass source shifts under the SST perturbations are identified via Lagrangian tracers. Mean SST warming increases contributions of marine BL air to clouds, while enhanced GS gradients favor drier air entrainment from cloud-top regions. These shifts suggest potential alterations in aerosol-cloud interactions.
This study introduces two novel approaches: (1) isentropic analysis to isolate energy transport and (2) Lagrangian tracer tracking to quantify airmass sources. These methods reveal nonlinear PFC responses to SST variations. The findings highlight that the mean SST of the GS and SST gradients exert distinct controls on cloud macro- and microphysics, with implications for marine cloud feedback under global warming. Nevertheless, as this study examines a single case, extending these findings to long-term Gulf Stream variability requires further investigation.
The WRF community model was made available from the National Center for Atmospheric Research (NCAR) at http://www2.mmm.ucar.edu/wrf/users/ (last access: 9 February 2026). The post-processing code of FLEXPART-WRF was retrieved at https://git.nilu.no/flexpart/flexpart-wrf/ (last access: 9 February 2026). A subset of analyzed data and post-processing python code are also available from Zenodo (https://doi.org/10.5281/zenodo.15833225, Chen, 2025).
ACTIVATE data are publicly available at https://doi.org/10.5067/SUBORBITAL/ACTIVATE/DATA001 (NASA Atmospheric Science Data Center, 2026). WRF model output (4 Tb) in this study is saved on PNNL's long-term storage system, Aurora (rc-support@pnnl.gov). A subset of analyzed data and post-processing python code are also available from Zenodo (https://doi.org/10.5281/zenodo.15833225, Chen, 2025).
Conceptualization: JC, HW. Data curation: JC, HW, AS. Formal analysis: JC, HW. Funding acquisition: HW, AS. Investigation: JC, HW. Methodology: JC, HW, BZ, HL. Project administration: HW, AS. Resources: BZ, HL, AS, ST. Software: BZ, HL, HW. Supervision: HW, AS. Validation: JC, HW, BZ, HL, DP, AS, ST, CV. Visualization: JC. Writing (original draft preparation): JC. Writing (review and editing): HW, BZ, HL, DP, AS, ST, CV.
At least one of the (co-)authors is a member of the editorial board of Atmospheric Chemistry and Physics. The peer-review process was guided by an independent editor, and the authors also have no other competing interests to declare.
Publisher's note: Copernicus Publications remains neutral with regard to jurisdictional claims made in the text, published maps, institutional affiliations, or any other geographical representation in this paper. The authors bear the ultimate responsibility for providing appropriate place names. Views expressed in the text are those of the authors and do not necessarily reflect the views of the publisher.
We acknowledge Research Computing at PNNL and the High-Performance Computing Center of Nanjing University of Information Science and Technology for their support of this work.
This research is supported by the National Natural Science Foundation of China (grant no. 42405076) and the Startup Foundation for Introducing Talent of NUIST. This work was also supported through the ACTIVATE Earth Venture Suborbital-3 (EVS-3) investigation, funded by NASA’s Earth Science Division (project nos. NNL19OB08I, NNL24OB07A) and managed through the Earth System Science Pathfinder Program Office. The Pacific Northwest National Laboratory (PNNL) is operated for the U.S. Department of Energy by Battelle Memorial Institute (contract no. DE-AC05-76RLO1830). AS acknowledges support from NASA (grant no. 80NSSC19K0442). BZ and HL acknowledge support from NASA (grant no. 80NSSC19K0389), and CV from DFG SPP HALO 1294 (grant no. 522359172).
This paper was edited by Yuan Wang and reviewed by two anonymous referees.
Ajayi, T., Choi, Y., Crosbie, E. C., DiGangi, J. P., Diskin, G. S., Fenn, M. A., Ferrare, R. A., Hair, J. W., Hilario, M. R. A., Hostetler, C. A., Kirschler, S., Moore, R. H., Shingler, T. J., Shook, M. A., Soloff, C., Thornhill, K. L., Voigt, C., Winstead, E. L., Ziemba, L. D., and Sorooshian, A.: Vertical variability of aerosol properties and trace gases over a remote marine region: a case study over Bermuda, Atmospheric Chemistry and Physics, 24, 9197–9218, https://doi.org/10.5194/acp-24-9197-2024, 2024.
Aldhaif, A. M., Lopez, D. H., Dadashazar, H., and Sorooshian: A. Sources, frequency, and chemical nature of dust events impacting the United States East Coast, Atmospheric Environment, 231, https://doi.org/10.1016/j.atmosenv.2020.117456, 2020.
Brioude, J., Arnold, D., Stohl, A., Cassiani, M., Morton, D., Seibert, P., Angevine, W., Evan, S., Dingwell, A., Fast, J. D., Easter, R. C., Pisso, I., Burkhart, J., and Wotawa, G.: The Lagrangian particle dispersion model FLEXPART-WRF version 3.1, Geoscientific Model Development, 6, 1889–1904, https://doi.org/10.5194/gmd-6-1889-2013, 2013.
Chellappan, S., Seethala, C.,Zuidema, P., Edson, J. B., Brunke, M. A., Chen, G., Li, X. Y., Painemal, D., Robinson, C. E., Shingler, T., Shook, M., Sorooshian A., Thornhill, L., Tornow, F., Wang, H., Zeng, X., and Ziemba, L. D.: On assessing ERA5 and MERRA2 representations of cold-air outbreaks across the Gulf Stream, Geophysical Research Letters, https://doi.org/10.1029/2021gl094364, 2021.
Chen, J., Wang, H., Li, X., Painemal, D., Sorooshian, A., Thornhill, K. L., Robinson, C., and Shingler, T.: Impact of Meteorological Factors on the Mesoscale Morphology of Cloud Streets during a Cold-Air Outbreak over the Western North Atlantic, Journal of the Atmospheric Sciences, 79, 2863–2879, https://doi.org/10.1175/JAS-D-22-0034.1, 2022.
Chen, J., Hagos, S., Xiao, H., Fast, J., and Feng, Z.: Multiscale Analysis of Surface Heterogeneity–Induced Convection on Isentropic Coordinates, Journal of the Atmospheric Sciences, 80, 983–1001, https://doi.org/10.1175/JAS-D-21-0198.1, 2023.
Chen, J.: Response of marine post-frontal clouds to Gulf Stream variability, Zenodo [data set and code], https://doi.org/10.5281/zenodo.15833225, 2025. Corral, A. F., Braun, R. A., Cairns, B., Gorooh, V. A., Liu, H., Ma, L., Mardi, A. H., Painemal, D., Stamnes, S., Diedenhoven, B. V., Wang, H., Yang, Y., Zhang, B., and Sorooshian, A.: An Overview of Atmospheric Features Over the Western North Atlantic Ocean and North American East Coast – Part 1: Analysis of Aerosols, Gases, and Wet Deposition Chemistry, Journal of Geophysical Research, https://doi.org/10.1029/2020jd032592, 2021.
Crosbie, E., Ziemba, L. D., Shook, M. A., Shingler, T., Hair, J. W., Sorooshian, A., Ferrare, R. A., Cairns, B., Choi, Y., DiGangi, J., Diskin, G. S., Hostetler, C., Kirschler, S., Moore, R. H., Painemal, D., Robinson, C., Seaman, S. T., Thornhill, K. L., Voigt, C., and Winstead, E.: Measurement report: Cloud and environmental properties associated with aggregated shallow marine cumulus and cumulus congestus, Atmospheric Chemistry and Physics, 24, 6123–6152, https://doi.org/10.5194/acp-24-6123-2024, 2024.
Dadashazar, H., Painemal, D., Alipanah, M., Brunke, M., Chellappan, S., Corral, A. F., Crosbie, E., Kirschler, S., Liu, H., Moore, R. H., Robinson, C., Scarino, A. J., Shook, M., Sinclair, K., Thornhill, K. L., Voigt, C., Wang, H., Winstead, E., Zeng, X., Ziemba, L., Zuidema, P., and Sorooshian, A.: Cloud drop number concentrations over the western North Atlantic Ocean: seasonal cycle, aerosol interrelationships, and other influential factors, Atmospheric Chemistry and Physics, 21, 10499–10526, https://doi.org/10.5194/acp-21-10499-2021, 2021.
Dadashazar, H., Corral, A. F., Crosbie, E., Dmitrovic, S., Kirschler, S., McCauley, K., Moore, R., Robinson, C., Schlosser, J. S., Shook, M., Thornhill, K. L., Voigt, C., Winstead, E., Ziemba, L., and Sorooshian, A.: Organic enrichment in droplet residual particles relative to out of cloud over the northwestern Atlantic: analysis of airborne ACTIVATE data, Atmospheric Chemistry and Physics, 22, 13897–13913, https://doi.org/10.5194/acp-22-13897-2022, 2022.
Dmitrovic, S., Hair, J. W., Collister, B. L., Crosbie, E., Fenn, M. A., Ferrare, R. A., Harper, D. B., Hostetler, C. A., Hu, Y., Reagan, J. A., Robinson, C. E., Seaman, S. T., Shingler, T. J., Thornhill, K. L., Vömel, H., Zeng, X., and Sorooshian, A.: High Spectral Resolution Lidar – generation 2 (HSRL-2) retrievals of ocean surface wind speed: methodology and evaluation, Atmospheric Measurement Techniques, 17, 3515–3532, https://doi.org/10.5194/amt-17-3515-2024, 2024.
Edwards, E. L., Corral, A. F., Dadashazar, H., Barkley, A. E., Gaston, C. J., Zuidema, P., and Sorooshian, A.: Impact of various air mass types on cloud condensation nuclei concentrations along coastal southeast Florida. Atmospheric Environment, 254, https://doi.org/10.1016/j.atmosenv.2021.118371, 2021.
Field, P. R., Broková, R., Chen, M., Dudhia, J., Lac, C., Hara, T., Honnert, R., Olson, J., Siebesma, P., de Roode, S., Tomassini, L., Hill, A., and McTaggart-Cowan, R.: Exploring the convective grey zone with regional simulations of a cold air outbreak, Quarterly Journal of the Royal Meteorological Society, 143, 2537–2555, https://doi.org/10.1002/qj.3105, 2017.
Hanna, S. R.: Applications in Air Pollution Modeling, in: Atmospheric Turbulence and Air Pollution Modelling, edited by: Nieuwstadt, F. T. M. and van Dop, H., D. Reidel Publishing Company, 275–310, https://doi.org/10.1007/978-94-010-9112-1_7, 1984.
Hong, S.-Y. and Lim, J.-O. J.: The WRF Single-Moment 6-Class Microphysics Scheme (WSM6), Journal of the Korean Meteorological Society, 42, 129–151, 2006.
Iacono, M. J., Delamere, J. S., Mlawer, E. J., Shephard, M. W., Clough, S. A., and Collins, W. D.: Radiative forcing by long-lived greenhouse gases: Calculations with the AER radiative transfer models, Journal of Geophysical Research: Atmospheres, 113, https://doi.org/10.1029/2008JD009944, 2008.
Joyce, T. M., Kwon, Y.-O., and Yu, L.: On the Relationship between Synoptic Wintertime Atmospheric Variability and Path Shifts in the Gulf Stream and the Kuroshio Extension, Journal of Climate, 22, 3177–3192, https://doi.org/10.1175/2008JCLI2690.1, 2009.
Kelly, K. A., Small, R. J., Samelson, R. M., Qiu, B., Joyce, T. M., Kwon, Y.-O., and Cronin, M. F.: Western Boundary Currents and Frontal Air–Sea Interaction: Gulf Stream and Kuroshio Extension, Journal of Climate, https://doi.org/10.1175/2010jcli3346.1, 2010.
Lamraoui, F., Booth, J. F., Naud, C. M., Jensen, M. P., and Johnson, K. L.: The Interaction Between Boundary Layer and Convection Schemes in a WRF Simulation of Post Cold Frontal Clouds Over the ARM East North Atlantic Site, Journal of Geophysical Research: Atmospheres, 124, 4699–4721, https://doi.org/10.1029/2018JD029370, 2019.
Lee, R. W., Woollings, T. J., Hoskins, B. J., Williams, K. D., O'Reilly, C. H., and Masato, G.: Impact of Gulf Stream SST biases on the global atmospheric circulation, Climate Dynamics, 51, 3369–3387, https://doi.org/10.1007/s00382-018-4083-9, 2018.
Li, X., Zheng, W., Pichel, W. G., Zou, C. Z., Clemente-Colón, P., and Friedman, K. S.: A cloud line over the Gulf Stream, Geophysical Research Letters, 31, https://doi.org/10.1029/2004GL019892, 2004.
Li, X.-Y., Wang, H., Chen, J., Endo, S., George, G., Cairns, B., Chellappan, S., Zeng, X., Kirschler, S., Voigt, C., Sorooshian, A., Crosbie, E., Chen, G., Ferrare, R. A., Gustafson, W. I., Hair, J. W., Kleb, M. M., Liu, H., Moore, R., Shingler, T. J., Thornhill, K. L., Tornow, F., Xiao, H., and Zuidema, P.: Large-Eddy Simulations of Marine Boundary Layer Clouds Associated with Cold-Air Outbreaks during the ACTIVATE Campaign. Part I: Case Setup and Sensitivities to Large-Scale Forcings, Journal of the Atmospheric Sciences, 79, 73–100, https://doi.org/10.1175/JAS-D-21-0123.1, 2022.
Liu, A. Q., Moore, G. W. K., Tsuboki, K., and Renfrew, I. A.: A high-resolution simulation of convective roll clouds during a cold-air outbreak, Geophysical Research Letters, 31, https://doi.org/10.1029/2003GL018530, 2004.
Liu, H., Zhang, B., Moore, R. H., Ziemba, L. D., Ferrare, R. A., Choi, H., Sorooshian, A., Painemal, D., Wang, H., Shook, M. A., Scarino, A. J., Hair, J. W., Crosbie, E. C., Fenn, M. A., Shingler, T. J., Hostetler, C. A., Chen, G., Kleb, M. M., Luo, G., Yu, F., Vaughan, M. A., Hu, Y., Diskin, G. S., Nowak, J. B., DiGangi, J. P., Choi, Y., Keller, C. A., and Johnson, M. S.: Tropospheric aerosols over the western North Atlantic Ocean during the winter and summer deployments of ACTIVATE 2020: life cycle, transport, and distribution, Atmospheric Chemistry and Physics, 25, 2087–2121, https://doi.org/10.5194/acp-25-2087-2025, 2025.
Liu, J. W., Xie, S. P., Norris, J. R., and Zhang, S. P.: Low-level cloud response to the gulf stream front in winter using CALIPSO, Journal of Climate, 27, 4421–4432, https://doi.org/10.1175/JCLI-D-13-00469.1, 2014.
Mardi, A. H., Dadashazar, H., Painemal, D., Shingler, T., Seaman, S. T., Fenn, M. A., Hostetler, C. A., and Sorooshian, A.: Biomass Burning Over the United States East Coast and Western North Atlantic Ocean: Implications for Clouds and Air Quality, Journal of Geophysical Research: Atmospheres, 126, e2021JD034916, https://doi.org/10.1029/2021JD034916, 2021.
Marshall, J., Ferrari, R., Forget, G., Maze, G., Andersson, A., Bates, N., Dewar, W., Doney, S., Fratantoni, D., Joyce, T., Straneo, F., Toole, J., Weller, R., Edson, J., Gregg, M., Kelly, K., Lozier, S., Palter, J., Lumpkin, R., Samelson, R., Skyllingstad, E., Silverthorne, K., Talley, L., and Thomas, L.: The Climode Field Campaign: Observing the Cycle of Convection and Restratification over the Gulf Stream, Bulletin of the American Meteorological Society, 90, 1337–1350, https://doi.org/10.1175/2009BAMS2706.1, 2009.
Minobe, S., Kuwano-Yoshida, A., Komori, N., Xie, S.-P., and Small, R. J.: Influence of the Gulf Stream on the troposphere, Nature, 452, 206–209, https://doi.org/10.1038/nature06690, 2008.
Morrison, H., Curry, J. A., and Khvorostyanov, V. I.: A New Double-Moment Microphysics Parameterization for Application in Cloud and Climate Models. Part I: Description, Journal of the Atmospheric Sciences, 62, 1665–1677, https://doi.org/10.1175/jas3446.1, 2005.
NASA Atmospheric Science Data Center: Aerosol Cloud meTeorology Interactions oVer the western ATlantic Experiment (ACTIVATE), Atmospheric Science Data Center (ASDC), NASA Langley Research Center [data set], https://doi.org/10.5067/SUBORBITAL/ACTIVATE/DATA001, 2026.
Naud, C. M., Booth, J. F., and Lamraoui, F.: Post Cold Frontal Clouds at the ARM Eastern North Atlantic Site: An Examination of the Relationship Between Large©\Scale Environment and Low-Level Cloud Properties. Journal of Geophysical Research: Atmospheres, 123, https://doi.org/10.1029/2018JD029015, 2018.
O'Neill, L. W., Haack, T., Chelton, D. B., and Skyllingstad, E.: The gulf stream convergence zone in the time-mean winds, Journal of the Atmospheric Sciences, 74, 2383–2412, https://doi.org/10.1175/JAS-D-16-0213.1, 2017.
Painemal, D., Corral, A. F., Sorooshian, A., Brunke, M. A., Chellappan, S., Afzali Go rooh, V., Ham, S.-H., O'Neill, L., Smith Jr., W. L., Tselioudis, G., Wang, H., Zeng, X., and Zuidema, P.: An Overview of Atmospheric Features Over the Western North Atlantic Ocean and North American East Coast – Part 2: Circulation, Boundary Layer, and Clouds, Journal of Geophysical Research: Atmospheres, https://doi.org/10.1029/2020JD033423, 2021.
Painemal, D., Chellappan, S., Smith, W. L., Spangenberg, D., Park, J. M., Ackerman, A., Chen, J., Crosbie, E., Ferrare, R., Hair, J., Kirschler, S., Li, X., McComiskey, A., Moore, R. H., Sanchez, K., Sorooshian, A., Tornow, F., Voigt, C., Wang, H., Winstead, E., Zeng, X., Ziemba, L., and Zuidema, P.: Wintertime Synoptic Patterns of Midlatitude Boundary Layer Clouds Over the Western North Atlantic: Climatology and Insights From In Situ ACTIVATE Observations, Journal of Geophysical Research: Atmospheres, 128, e2022JD037725, https://doi.org/10.1029/2022JD037725, 2023.
Papritz, L., Pfahl, S., Sodemann, H., and Wernli, H.: A Climatology of Cold Air Outbreaks and Their Impact on Air–Sea Heat Fluxes in the High-Latitude South Pacific, Journal of Climate, https://doi.org/10.1175/jcli-d-14-00482.1, 2015.
Pastor, F.: Sea Surface Temperature: From Observation to Applications, Journal of Marine Science and Engineering, 9, 1284, https://doi.org/10.3390/jmse9111284, 2021.
Pauluis, O. M. and Mrowiec, A. A.: Isentropic analysis of convective motions, Journal of the Atmospheric Sciences, 70, 3673–3688, https://doi.org/10.1175/JAS-D-12-0205.1, 2013.
Petters, M. D. and Kreidenweis, S. M.: A single parameter representation of hygroscopic growth and cloud condensation nucleus activity, Atmospheric Chemistry and Physics, 7, 1961–1971, https://doi.org/10.5194/acp-7-1961-2007, 2007.
Seckar-Martinez, A., Betito, G., Parakkat, L., and Sorooshian, A.: Aerosol and precipitation composition at a coastal New England site (Acadia National Park): Implications for air quality and aerosol composition during cold air outbreaks, Environmental Science: Atmospheres, 5, 110–128, https://doi.org/10.1039/D4EA00119B, 2025.
Smeed, D. A., Josey, S. A., Beaulieu, C., Johns, W. E., Moat, B. I., Frajka-Williams, E., Rayner, D., Meinen, C. S., Baringer, M. O., Bryden, H. L., and McCarthy, G. D.: The North Atlantic Ocean Is in a State of Reduced Overturning, Geophysical Research Letters, 45, 1527–1533, https://doi.org/10.1002/2017GL076350, 2018.
Sorooshian, A., Anderson, B., Bauer, S. E., Braun, R. A., Cairns, B., Crosbie, E., Dadashazar, H., Diskin, G., Ferrare, R., Flagan, R. C., Hair, J., Hostetler, C., Jonsson, H. H., Kleb, M. M., Liu, H., Macdonald, A. B., McComiskey, A., Moore, R., Painemal, D., Russell, L., M., Seinfeld, J. H., Shook, M., Smith Jr, W. L., Thornhill, K., Tselioudis, G., Wang, H., Zeng, X., Zhang, B., Ziemba, L., and Zuidema, P.: Aerosol–cloud–meteorology interaction airborne field investigations: Using lessons learned from the U.S. West coast in the design of activate off the U.S. East Coast, Bulletin of the American Meteorological Society, 100, 1511–1528, https://doi.org/10.1175/BAMS-D-18-0100.1, 2019.
Sorooshian, A., Corral, A. F., Braun, R. A., Cairns, B., Crosbie, E., Ferrare, R., Hair, J., Kleb, M. M., Hossein Mardi, A., Maring, H., McComiskey, A., Moore, R., Painemal, D., Scarino, A. J., Schlosser, J., Shingler, T., Shook, M., Wang, H., Zeng, X., Painemal, D., Russell, L. M., Seinfeld, J. H., Shook, M., Smith Jr., W. L., Thornhill, K., Tselioudis, G., Wang, H., Zeng, X., Zhang, B., and Zuidema, P.: Atmospheric Research Over the Western North Atlantic Ocean Region and North American East Coast: A Review of Past Work and Challenges Ahead, Journal of Geophysical Research: Atmospheres, 125, e2019JD031626, https://doi.org/10.1029/2019JD031626, 2020.
Sullivan, P. P., McWilliams, J. C., Weil, J. C., Patton, E. G., and Fernando, H. J. S.: Marine boundary layers above heterogeneous SST: Along-front winds, Journal of the Atmospheric Sciences, https://doi.org/10.1175/JAS-D-21-0072.1, 2021.
Sweet, W., Fett, R., Kerling, J., and Violette, P. L.: Air-Sea Interaction Effects in the Lower Troposphere Across the North Wall of the Gulf Stream, Monthly Weather Review, 19, 1042–1052, https://doi.org/10.1175/1520-0493(1981)109<1042:ASIEIT>2.0.CO;2, 1981.
Tornow, F., Ackerman, A. S., and Fridlind, A. M.: Preconditioning of overcast-to-broken cloud transitions by riming in marine cold air outbreaks, Atmospheric Chemistry and Physics, 21, 12049–12067, https://doi.org/10.5194/acp-21-12049-2021, 2021.