the Creative Commons Attribution 4.0 License.
the Creative Commons Attribution 4.0 License.
 | 10 Feb 2026
Stratopause trends observed by satellite limb instruments
Adam Bourassa
Susann Tegtmeier
Daniel Zawada
Douglas Degenstein
The stratopause, the boundary between the stratosphere and the mesosphere, is projected to cool and drop in response to anthropogenic greenhouse gas (GHG) emissions. A lack of long-term observations with high vertical resolution at the stratopause has made it difficult to quantify trends in this region. We use observations from the Optical Spectrograph and InfraRed Imager System (OSIRIS) and the Sounding of the Atmosphere using Broadband Emission Radiometry (SABER) instrument to assess the annual and inter-annual variability and to quantify trends in the stratopause temperature and height. The SABER and OSIRIS observations at the stratopause are highly correlated, and both show that the stratopause cooled by ∼ 0.5–1 K per decade during 2005–2021. The observations also suggest that the tropical stratopause moved lower during this time period by 300–475 m per decade. The observational stratopause trends are consistent with trends from chemistry climate models simulations.
- Article
(4086 KB) - Full-text XML
- BibTeX
- EndNote


Increasing anthropogenic greenhouse gas (GHG) emissions are altering the thermal structure of the atmosphere, resulting in tropospheric warming and stratospheric and mesospheric cooling (Manabe and Wetherald, 1967; Gulev et al., 2021). Consequently, the thickness of each atmospheric layer is also changing. There is observational evidence of both tropospheric expansion (e.g., Santer et al., 2003; Seidel and Randel, 2006; Meng et al., 2021) and mesospheric contraction (e.g., Zhao et al., 2020; Mlynczak et al., 2022; Liu et al., 2024), and models project that stratospheric contraction should also occur (Pisoft et al., 2021). Multi-decadal changes, or trends, in the middle and upper stratospheric temperature are important to quantify as a fingerprint of anthropogenic climate change, providing confidence that observed changes in the atmospheric temperature are outside the range of natural variability (Santer et al., 2023).
The stratopause is the boundary between the stratosphere and the mesosphere: temperatures generally increase with height in the stratosphere due to ozone heating and decrease with height in the mesosphere, and the stratopause altitude is defined by the altitude of the local temperature maxima. The exact location of the stratopause varies with time and latitude. Outside of high latitude winter, the stratopause is approximately at the level of maximum heating due to the absorption of solar UV radiation by ozone. During winter at higher latitudes (poleward of ∼ 40°) there is less incident solar radiation and therefore ozone heating, so heating caused by mesospheric downwelling due to gravity waves is important for determining the temperature balance (Hitchman et al., 1989).
Observational studies of trends at the stratopause require long-term measurements with high vertical resolution in the stratopause region. The best option is to use temperature profiles retrieved from satellite limb-sounders, such as the Halogen Occultation Experiment (HALOE, 1991–2005; Russell et al., 1993), the Sounding of the Atmosphere Using Broadband Emission Radiometry instrument (SABER, January 2002 to the present; Russell et al., 1999; Remsberg et al., 2008; Esplin et al., 2023), and the Optical Spectrograph and InfraRed Imager System (OSIRIS, October 2001 to the present; Llewellyn et al., 2004; Zawada et al., 2024). Each of these instruments has a vertical resolution of 4 km or better near the stratopause, monthly or better latitudinal coverage outside of the polar regions, and a long enough record to calculate statistically significant trends.
Several existing studies have used satellite limb observations to determine the temperature trend at or near the stratopause. Remsberg (2019) used HALOE observations, and found that the stratosphere cooled by around 0.5 K per decade at 1 hPa (∼ 50 km) between 1991 and 2005. Dubé et al. (2024) found a similar cooling rate of 0.5–1 K per decade between 2005 and 2021 at 50 km in OSIRIS and SABER observations. Zhao et al. (2021) looked more closely at the temperature at the stratopause in SABER measurements, which can vary in altitude between 45 and 55 km depending on latitude and time of year. They found that the stratopause cooled by 0.3–1 K per decade from 2002 to 2020, with a greater cooling rate at higher latitudes, in good agreement with the results from Dubé et al. (2024) for a similar time period.
The trend in the stratopause height is also important to consider, as changes to the stratospheric thickness can affect the stratospheric circulation patterns in a way that is not explained solely by temperature changes (Eichinger and Šácha, 2020). A modeling study from Pisoft et al. (2021) found that the global mean stratopause decreased by ∼ 70 m per decade between 1960 and 1999, and projected that the stratopause will decrease at a similar rate of ∼ 60 m per decade between 2000 and 2080. These trends were largely attributed to increased GHG concentrations, with ozone depletion also playing a small role in the historical trends.
Observational evidence of a trend in the stratopause height is limited. Ramesh and Sridharan (2018) used SABER data between 10 and 15° N during 2002–2015 and found a trend in this region of ∼ 330 m per decade. Karami et al. (2023) considered observations from the Microwave Limb Sounder (MLS; Waters et al., 2006), and found a decrease in the stratopause height over 2004–2021 in most latitudes and seasons. Neither of the studies quantified the uncertainties in the stratopause height trends. The goal of our study is to use OSIRIS and SABER observations to determine the stratopause height trend as a function of latitude. This was not previously possible, as the OSIRIS temperature retrieval was only recently developed by Zawada et al. (2024). We also consider temperature trends from the two instruments, and evaluate the annual and inter-annual variability of the stratopause. Finally, the observed temperature and height trends are compared to trends from several chemistry-climate models.
2.1 OSIRIS
OSIRIS has been in orbit on the Odin satellite since October 2001 (Murtagh et al., 2002; Llewellyn et al., 2004). The optical spectrograph measures limb-scattered sunlight between 280 and 810 nm, with a spectral resolution of approximately 1 nm. We use results from version 7.3 of the OSIRIS retrieval. OSIRIS temperature profiles are retrieved using the signals at 310 and 350 nm to estimate the Rayleigh scattering background number density, which is then converted to temperature using the hydrostatic balance and the ideal gas law (Zawada et al., 2024). Temperatures are retrieved between 30 and 65 km, with a vertical resolution of 3.0–3.5 km. Only the OSIRIS descending node profiles are used as a drift in Odin's orbit has resulted in a loss of ascending node measurements over the course of the mission. The descending node observations occur near a local solar time (LST) of 06:30 am. The data are further filtered by removing scans with a solar zenith angle greater than 85°.
The OSIRIS temperature retrieval requires an external reference temperature near 65 km to initialize the hydrostatic balance integration. Two versions of the OSIRIS temperature product were developed to quantify the effect of this choice on the retrieved temperatures: one that uses a value from the Modern-Era Retrospective analysis for Research and Applications, Version 2 (MERRA-2; Gelaro et al., 2017) interpolated to the OSIRIS profile as a reference temperature at 65 km, and one that uses climatological values from the NRLMSISE-00 model (Picone et al., 2002) as the reference temperature. The reference temperature choice introduces a bias of up to 5 K at 65 km that decreases exponentially with decreasing altitude, which is the main source of uncertainty in the OSIRIS retrieval above 45 km (Zawada et al., 2024). Dubé et al. (2024) showed that this affects the temperature trends: the difference in the temperature trends from the two versions of the retrieval is 0.1–0.3 K per decade in the stratopause region, around 50 km. While this is important to remember when interpreting trends in the OSIRIS temperature product, it does not mean that there is a 0.1–0.3 K per decade error in the OSIRIS trends as the climatological reference temperature artificially forces the temperature trend to be 0 K per decade at 65 km. The MERRA-2 version of the retrieval is more physically realistic, and so it is the version that we use here.
2.2 SABER
SABER has been measuring infrared emissions from its platform on board the Thermosphere, Ionosphere, Mesosphere Energetics and Dynamics (TIMED) satellite since January 2002 (Esplin et al., 2023). Temperatures are retrieved from measurements in the CO2 band. The retrieved profiles extend from 10 to 100 km, with a vertical resolution of 2 km (Remsberg et al., 2008). Profiles from version 2.0 of the SABER retrieval are used here. The SABER viewing mode is such that continuous coverage is only available from 52° S to 52° N, with higher latitudes observed for 60–63 day periods that alternate between the hemispheres (Remsberg et al., 2008). To avoid any bias that this might introduce in the trends, we only consider SABER observations from 50° S–50° N. The local solar time of the SABER measurements also varies considerably: this is discussed further in Sect. 2.4.
2.3 Models
Chemistry-climate model results are from the 2022 Chemistry Climate Model Initiative (CCMI-2022). The simulations that are used follow the REFD1 (historical) scenario, which includes forcing from observed sea surface temperatures, greenhouse gases, ozone-depleting substances, and volcanic aerosol (Plummer et al., 2021). Eleven models are used: ACCESS‐CM2‐Chem (Dennison and Woodhouse, 2023), CCSRNIES‐MIROC3.2 (Akiyoshi et al., 2023), CESM2-WACCM (Gettelman et al., 2019), CMAM (Jonsson et al., 2004; Scinocca et al., 2008), CNRM‐MOCAGE (Josse et al., 2004; Cussac et al., 2020), EMAC (Jöckel et al., 2016), GEOSCCM (Oman et al., 2013; Liu et al., 2022), LMDz6.2‐LR‐REPROBUS (Marchand et al., 2012), NIWA-UKCA2 (Morgenstern et al., 2009), SOCOL (Sukhodolov et al., 2021), and UKESM1-StratTrop (Archibald et al., 2020; Sellar et al., 2019). Only one ensemble member is used for each model to avoid biasing the results towards models that submitted more runs. These simulations extend to the end of 2018.
2.4 Stratopause calculation
For each dataset the monthly zonal mean (MZM) temperature profiles are calculated in 10° latitude bins, centered on latitudes from 55° S to 55° N. Months when the mean latitude of the available observations is more than ±2° from the central bin latitude are removed to avoid sampling biases. For OSIRIS we further remove months with fewer than 30 measurements in a given latitude bin, which typically occur when OSIRIS resumes measuring after being in darkness (i.e. following the winter at mid and high latitudes). For each remaining MZM temperature profile a cubic spline interpolation method is used to get a smooth profile between 35.5 and 60.5 km. The stratopause is defined as the local maximum in this curve. MZM profiles with more than one maxima are excluded (∼ 1.8 % of MZM OSIRIS profiles and ∼ 0.5 % of MZM SABER profiles).
Standard MZM sampling is not necessarily the best option for SABER: the local time of the SABER measurements changes continuously, and it takes SABER approximately two months to sample the full range of local times (Huang et al., 2008). This inconsistent sampling can impact trends in variables that have a diurnal cycle, such as ozone above ∼ 40 km and temperature, with the greatest effect at higher levels in the mesosphere and thermosphere. To account for this, the SABER observations are often averaged using overlapping 60 d bins centered on the 15th of each month (Rezac et al., 2018). The effect of using 60 d bins instead of regular monthly-means on the SABER stratopause trends is assessed in Sect. 3.
For the model runs the monthly zonal mean temperature and geopotential height profiles were used to determine the stratopause location in units of geopotential height. The geopotential heights were then converted to geometric altitudes using H=9.80616 m s−2 × where H is the geometric altitude in m, z is the geopotential height in m, g is the acceleration due to gravity as a function of latitude in m s−2, and Re is the WGS84 ellipsoid radius as a function of latitude in m.
2.5 Trends
The rate of the long-term change (the trend) in the stratopause height and temperature can be calculated with a multiple linear regression (MLR) model, using proxies to account for known sources of variability. Since the stratopause location is largely determined by the location of maximum heating due to ozone absorption we use the same regression proxies that are typical for calculating ozone trends (e.g., SPARC/IO3C/GAW, 2019). The corresponding MLR equation is defined as
where each βi defines a regression coefficient. QBOa(t) and QBOb(t) are the first two principal components of the Singapore zonal winds (https://acd-ext.gsfc.nasa.gov/Data_services/met/qbo/QBO_Singapore_Uvals_GSFC.txt, last access: 24 July 2025), F10.7(t) is the solar flux at 10.7 cm (https://spdf.gsfc.nasa.gov/pub/data/omni/low_res_omni/omni2_all_years.dat, last access: 24 July 2025), ENSO(t) is the multivariate ENSO index (https://psl.noaa.gov/enso/mei/, last access: 24 July 2025), and R(t) is the residual. Trends are calculated with the Long-term Ozone Trends and Uncertainties in the Stratosphere (LOTUS) regression model, version 0.8.3. Further details on this version of the regression model the proxies are described in Damadeo et al. (2022) and SPARC/IO3C/GAW (2019).
The regression model is applied to deseasonalized height and temperature anomalies. We focus on trends for the period from January 2005–December 2021. The starting point is chosen because the OSIRIS retrieval relies on MERRA-2 reference temperatures at 65 km, which has a discontinuity when MLS temperature observations are assimilated, beginning in mid-2004 (Long et al., 2022). The end period is chosen due to a bias in the OSIRIS retrieval that is caused by issues with the aerosol retrieval following the Hunga Tonga-Hunga Ha’apai (HTHH) volcanic eruption in January 2022. To minimize sampling differences, any months when OSIRIS does not have observations are also removed from SABER.
3.1 Stratopause Variability
We first consider the annual and inter-annual variability in the stratopause height and temperature observations from OSIRIS and SABER. Figure 1 shows the mean seasonal cycle in stratopause temperature and height from each dataset. In general, the mean OSIRIS and SABER seasonal cycles are in good agreement. In the tropics and at higher latitudes (45° N and 45° S) the stratopause heights and temperatures are anti-correlated in all months. In the tropics the main source of variability is the semi-annual oscillation (SAO) in the zonal winds (Hirota, 1980; Garcia et al., 1997). Outside of the tropics the stratopause is highest and the temperature is coldest in the winter months, when there is less solar radiation. The stratopause is also affected by mesospheric downwelling, which is strongest over the winter pole, and leads to a higher stratopause (Hitchman et al., 1989; Plumb, 2002). This effect is greater in the Southern Hemisphere (SH) winter, compared to the Norther Hemisphere (NH) winter. In the NH the mean winter stratopause height is at most 50 km, while in the SH the mean winter stratopause height reaches ∼ 55 km. This is consistent with Hitchman et al. (1989), who first observed that the downwelling is stronger and more persistent in the SH. At mid-latitudes, between 20 and 40° in each hemisphere, the stratopause temperature and height are anti-correlated during the winter, but correlated in the summer. These seasonal patterns are consistent with earlier results from MLS (France et al., 2012).

Figure 1Mean seasonal cycle in stratopause temperature (red) and altitude (blue) for OSIRIS (solid lines) and SABER (dashed lines) from 2005–2021 in 10° latitude bins.
The mean seasonal cycles in stratopause temperature and height are subtracted from the observations for each year to get the deseasonalized anomalies. The deseasonalized MZM stratopause height time series for six 10° latitude bands is shown in Fig. 2 for each of OSIRIS and SABER. The variability in the observations from the two instruments is similar at all latitudes, and particularly in the tropics where the correlation is at least 0.6. The gaps in the OSIRIS observations in the tropics are largely due to the data filtering, but at higher latitudes they mainly occur in the winter, when there is no scattered sunlight for OSIRIS to observe at the measurement time. The deseasonalized SABER observations have a large height anomaly each austral winter (June–July) in the latitude bin centered on 45° S, as the magnitude of the winter stratopause height increase is not consistent from year to year. The corresponding deseasonalized stratopause temperature observations are provided in Appendix Fig. A1. The SABER and OSIRIS stratopause temperatures are correlated at all latitudes, with correlations of at least 0.8 in the tropics.
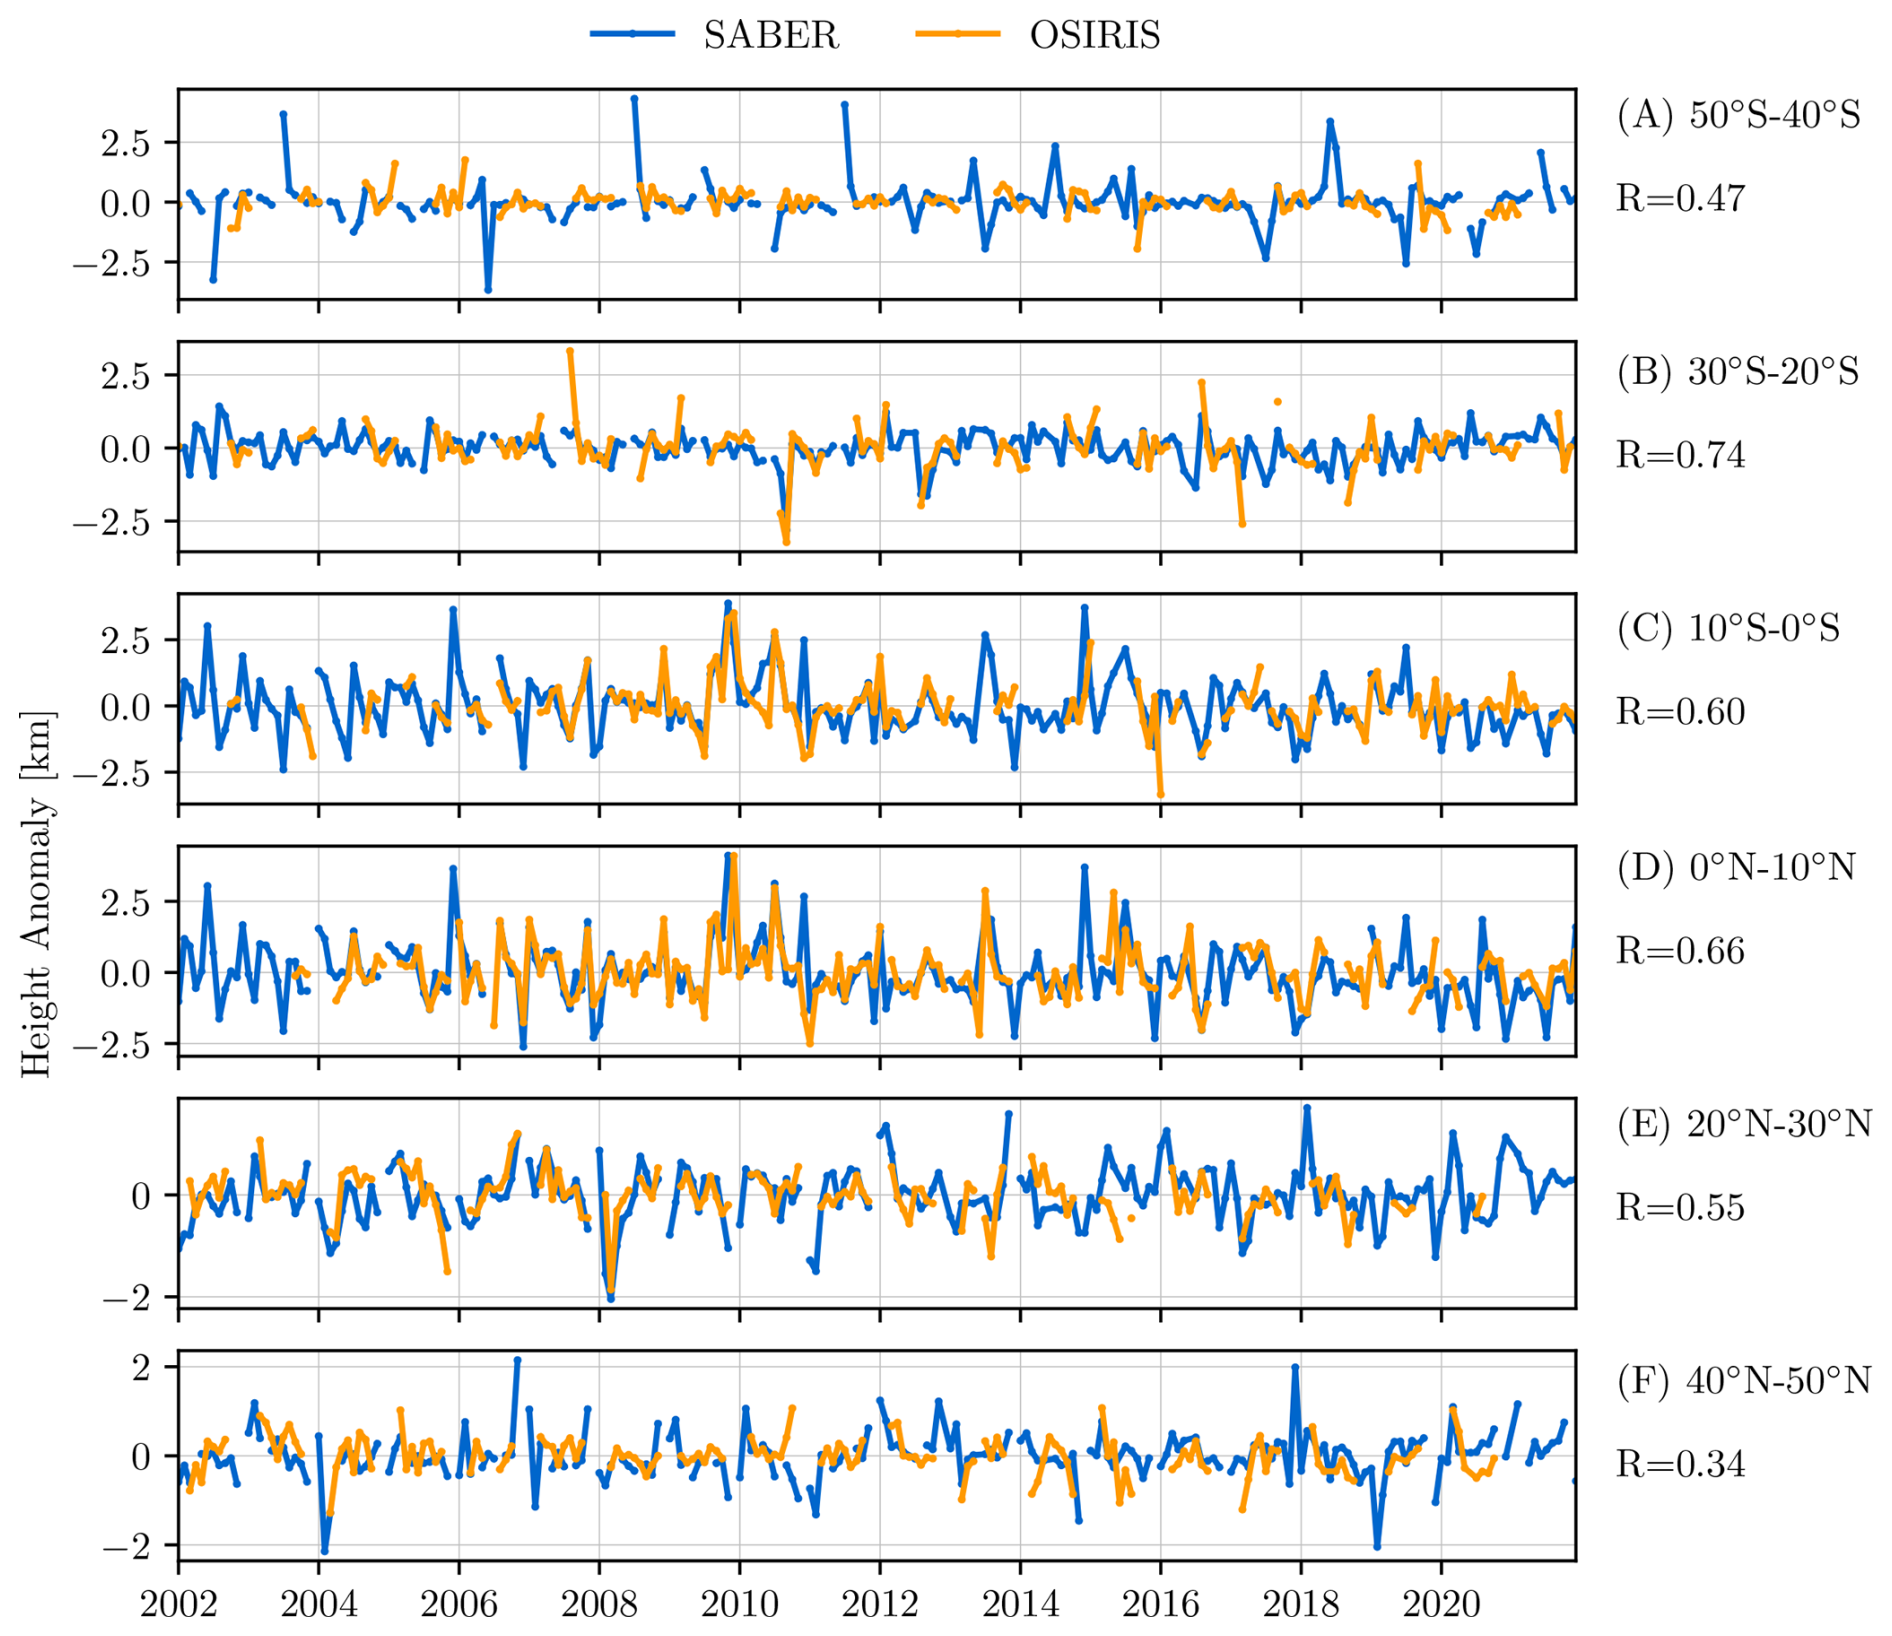
Figure 2Deseasonalized stratopause height anomaly time series for OSIRIS and SABER in six 10° latitude bins.
3.2 Observational Trends
Long-term trends in the stratopause temperature and height are shown in Fig. 3, as a function of latitude. Both OSIRIS and SABER observations show that the stratopause temperature decreased during 2005–2021, but the exact magnitude of the decrease varies with latitude. The cooling trends are around −0.5 to −1 K per decade. In general the cooling trend is greater in OSIRIS observations than in SABER observations, but the trends agree within the regression uncertainties at all latitudes, consistent with the findings of Dubé et al. (2024) for temperatures around 50 km.

Figure 3Trends in the stratopause temperature and height observed by OSIRIS and SABER from 2005–2021 in 10° latitude bins. Error bars are the 2σ uncertainty in the trends.
The trends from both OSIRIS and SABER suggest that the stratopause is moving lower at some latitudes (Fig. 3B). The greatest decrease in the stratopause is at 5°S, where SABER observed a trend of m per decade and OSIRIS observed a trend of m per decade. While the SABER trends are greatest in the tropics, and closer to zero at higher latitudes, OSIRIS observed a more consistent change in the stratopause height at all latitudes.
The OSIRIS temperature observations are more limited than those from SABER, both with regards to the latitudinal sampling pattern and the time period that has useful observations for trend studies. Because of this, SABER is used to determine (1) how the OSIRIS sampling pattern, and particularly the lack of measurements at mid/high latitudes during the winter, affects the trends, and (2) how the choice of time period used for the trend calculation impacts the trends. The trends in SABER, excluding months when OSIRIS does not have observations, are compared to the trends in SABER when all available months with SABER observations included (Fig. 4). It is clear that the OSIRIS sampling pattern has some effect on the SABER height trends, with the most obvious case being the significantly positive stratopause height trend at 45° N. The trend at this latitude is closer to zero when the months without OSIRIS observations are included. However, height trends in the tropics and SH mid-latitudes are only minimally impacted by the OSIRIS sampling pattern. The greatest effect on the temperature trends is at 45 and 35° S, where the OSIRIS sampling results in smaller cooling trends. The largest difference is at higher latitudes because the coverage of OSIRIS depends on the amount of sunlight, and the higher latitudes have the fewest number of days during which OSIRIS can take measurements.

Figure 4Trends in the stratopause temperature and height observed by SABER in 10° latitude bins. Blue: 2005–2021, months when OSIRIS did not have observations are removed (same as blue line in Fig. 3). Green: 2005–2021, months when OSIRIS did not have observations are included. Magenta: 2002–2024, months when OSIRIS did not have observations are included. In all cases error bars are the 2σ uncertainty in the trends.
Figure 4 also compares the SABER trends for 2005–2021 with the SABER trends for 2002–2024. The choice of time period has a larger effect on the temperature trends than the height trends: the cooling observed by SABER is greater at all latitudes over the longer 2002–2024 period, with a rate of about −0.7 K per decade. The height trends only change noticeably in the tropics, where they decrease by about 50 %, from −500 to −250 m per decade, but the uncertainties are also smaller. The smaller tropical stratopause height trend during 2002–2024 compared to 2005–2021 is mostly due to the addition of 3 years at the end of the time period, rather than at the beginning of the time period, however the greater cooling rate is mainly due to the additional years at the start of the period. The positive height trend at 45° N also becomes closer to zero when more years are included in the analysis, suggesting that the unexpected sign is a features of the interannual variability.
The effect of diurnal variations on the SABER trends was evaluated by comparing the MZM trends to the trends from observations sampled in overlapping 60 d bins centered on the 15th of each month (Appendix, Fig. A2). The impact on the trend values is small, but using the 60 d sampling does affect the results slightly, mainly in the tropics. Thus the SABER sampling pattern can explain some of the difference with the OSIRIS trends at these latitudes.
3.3 Model Trends
It is important to be able to accurately model changes in the stratopause for projecting the impacts of future climate change on the middle atmosphere, so trends in results from a set of chemistry-climate models are compared to the observational stratopause trends (Fig. 5). The comparison is limited to 2005–2018 due to the length of the available model runs. The median model trends fall within the uncertainty of the observational trends at all latitudes for both the stratopause temperature and height. The greatest difference between the modeled and observed trends occurs in the tropics, where the observations have less cooling, but a greater height decrease. This could be at least partly due to the limited time period as there are large interannual variations that can impact the trends more or less, depending on the length of the time period. It should also be noted that since only one ensemble member is used for each model, the large spread in the model trends is due to both internal variability and structural difference between the models themselves.

Figure 5Boxes: Distribution of trends in the stratopause temperature and height from eleven CCMI-2022 models. The whiskers cover the full range of trend values. The red lines denote the median model trends. Coloured points: Trends in the stratopause temperature and height observed by OSIRIS and SABER. Error bars for OSIRIS and SABER are the 2σ uncertainty in the trends. All trends are for 2005–2018 and in 10° latitude bins.
The model trends from 1980–2018 are also assessed in Fig. 6. Note that ACCESS-CM2‐Chem trends are not included because the geopotential height has a significant low bias before 1990. For this much longer period there is a cooling trend of 1 K per decade at all latitudes. The stratopause height also decreases at all latitudes, with the greatest decrease, of ∼ 80 m per decade, concurring in the tropics. This is consistent with the observations, which also suggest that the height decrease is greatest in the tropics for the shorter time period considered here. It is therefore likely that this pattern will emerge more clearly in the observational record as more years of data become available. The trends from the CCMI-2022 models are comparable to the global trends from Pisoft et al. (2021), who found a global decrease in the stratopause height of ∼ 60 m per decade between 1960 and 2080 in the older CCMI-1 models.

Figure 6Distribution of trends in the stratopause temperature and height from ten CCMI-2022 models in 10° latitude bins for 1980–2018. The whiskers cover the full range of trend values. The red lines denote the median model trends.
The stratopause is projected to respond to increases in atmospheric GHG concentrations by cooling and moving to a lower altitude, however observational evidence is lacking due to a deficit of observations with high vertical resolution at the stratopause. We present an analysis of stratopause height trends between 60° S and 60° N using observations from two satellite instruments, OSIRIS and SABER. This is the first comparison of the inter-annual variability in the stratopause height and stratopause temperature and of the latitudinally-resolved stratopause trends from these two instruments.
The stratopause temperature and height observations from OSIRIS and SABER are very consistent: the deseasonalized temperature anomalies have a correlation greater than 0.5 at all latitudes, and the deseasonalized heights anomalies have a correlation greater than 0.5 from 40° S–40° N. The lower correlations at higher latitudes are likely because OSIRIS does not measure in the winter, when the stratopause height shows the most variability.
Both OSIRIS and SABER observed cooling at the stratopause during 2005–2021. The cooling rate varies with latitude, but is on the order of 0.5 K per decade. The stratopause cooling trend observed by OSIRIS is greater than the trend in SABER, but the trends from both instruments agree within the regression uncertainties at all latitudes. For the longer time-period of 2002–2024 SABER observed greater cooling, closer to 0.7 K per decade. The SABER results are consistent with earlier findings from Zhao et al. (2021), who found a cooling trend in SABER observations of 0.3–1 K per decade from 2002 to 2020. The OSIRIS and SABER stratopause height trends also agree within the regression uncertainties between 40° S–40° N, but the trends at most latitudes are small. OSIRIS shows signs that the stratopause is moving downwards at all latitudes, but SABER observations most clearly show that the stratopause height has decreased in the tropics. SABER observations show that the tropical stratopause decreased at a rate of ∼ 500 m per decade between 2005 and 2021, and ∼ 250 m per decade between 2002 and 2024. For each variable, the trend values and uncertainties are impacted by both the OSIRIS and SABER sampling patterns, and the chosen time period. However, none of these effects are large enough to prevent us from concluding that so far in the 21st century the stratopause cooled at most latitudes between 40° S and 40° N and the tropical stratopause moved downwards. These findings are consistent with the expected response of the stratosphere to rising atmospheric CO2 concentrations, and in agreement with chemistry-climate model simulations.

Figure A1Deseasonalized stratopause temperature anomaly time series for OSIRIS and SABER in six 10° latitude bins.
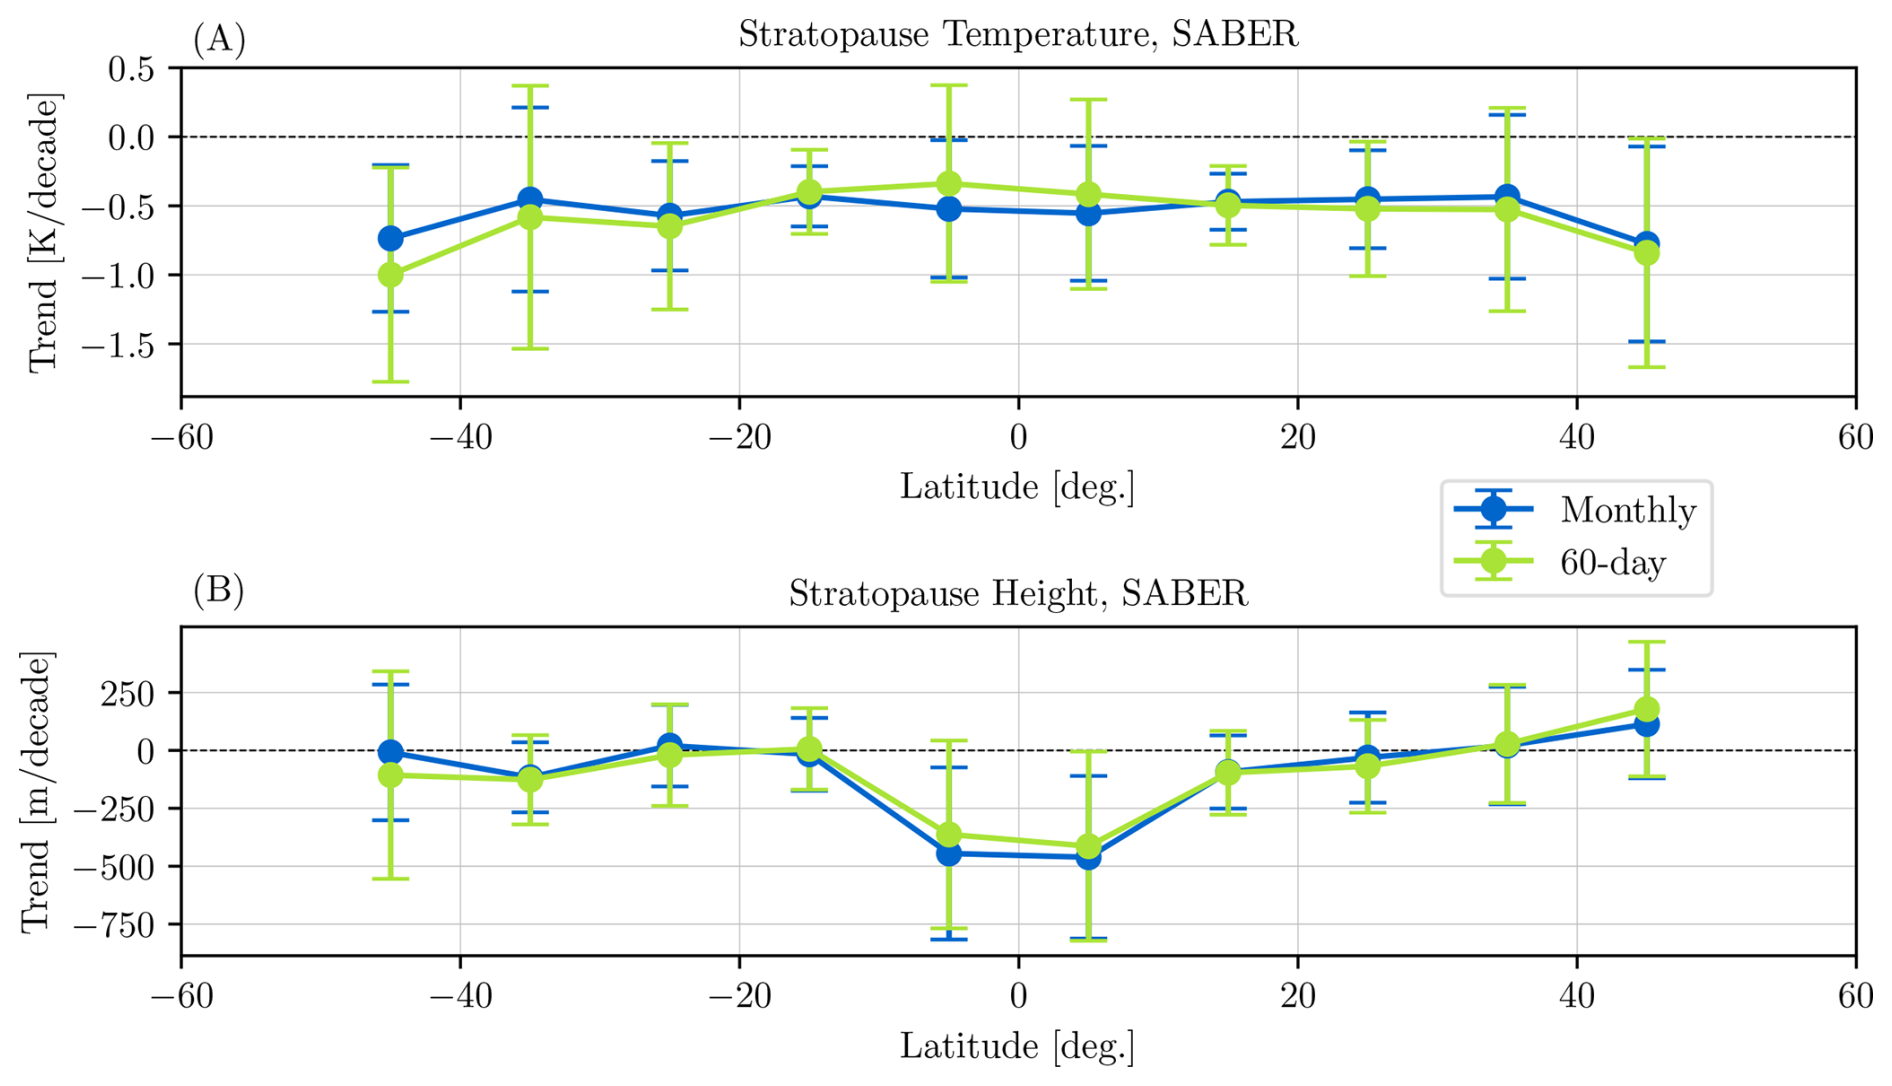
Figure A2Trends in the stratopause temperature, height, and ozone from 2005–2021 observed by SABER for two binning methods in 10° latitude bins. Error bars are the 2σ uncertainty in the trends.
-
OSIRIS v7.3 temperature profiles are available from https://doi.org/10.5281/zenodo.8271140 (Zawada et al., 2023).
-
SABER v2 temperature profiles are available at https://data.gats-inc.com/saber/custom/Temp_O3_H2O/v2.0/ (last access: 17 January 2025)
-
CCMI-2022 REFD1 simulations are available by registration from the CEDA archive, https://catalogue.ceda.ac.uk/uuid/92dddf542adc44b5898f535be4179705/ (last access: 24 July 2025)
-
The LOTUS regression code and documentation are available at https://github.com/usask-arg/lotus-regression (Damadeo et al., 2022). Version 0.8.3 of the model was used.
KD performed the analysis and prepared the manuscript. AB and ST supervised the project. DZ developed the OSIRIS temperature retrieval. All authors provided significant feedback on the manuscript.
The contact author has declared that none of the authors has any competing interests.
Publisher's note: Copernicus Publications remains neutral with regard to jurisdictional claims made in the text, published maps, institutional affiliations, or any other geographical representation in this paper. The authors bear the ultimate responsibility for providing appropriate place names. Views expressed in the text are those of the authors and do not necessarily reflect the views of the publisher.
The authors thank the Swedish National Space Agency and the Canadian Space Agency for the continued operation and support of Odin and OSIRIS.
This paper was edited by John Plane and reviewed by two anonymous referees.
Akiyoshi, H., Kadowaki, M., Yamashita, Y., and Nagatomo, T.: Dependence of column ozone on future ODSs and GHGs in the variability of 500-ensemble members, Scientific Reports, 13, 320, https://doi.org/10.1038/s41598-023-27635-y, 2023. a
Archibald, A. T., O'Connor, F. M., Abraham, N. L., Archer-Nicholls, S., Chipperfield, M. P., Dalvi, M., Folberth, G. A., Dennison, F., Dhomse, S. S., Griffiths, P. T., Hardacre, C., Hewitt, A. J., Hill, R. S., Johnson, C. E., Keeble, J., Köhler, M. O., Morgenstern, O., Mulcahy, J. P., Ordóñez, C., Pope, R. J., Rumbold, S. T., Russo, M. R., Savage, N. H., Sellar, A., Stringer, M., Turnock, S. T., Wild, O., and Zeng, G.: Description and evaluation of the UKCA stratosphere–troposphere chemistry scheme (StratTrop vn 1.0) implemented in UKESM1, Geoscientific Model Development, 13, 1223–1266, https://doi.org/10.5194/gmd-13-1223-2020, 2020. a
Cussac, M., Marécal, V., Thouret, V., Josse, B., and Sauvage, B.: The impact of biomass burning on upper tropospheric carbon monoxide: a study using MOCAGE global model and IAGOS airborne data, Atmospheric Chemistry and Physics, 20, 9393–9417, https://doi.org/10.5194/acp-20-9393-2020, 2020. a
Damadeo, R., Hassler, B., Zawada, D., Frith, S., Ball, W., Chang, K., Degenstein, D., Hubert, D., Misois, S., Petropavlovskikh, I., Roth, C., Sofieva, V., Steinbrecht, W., Tourpali, K., Zerefos, C., Alsing, J., Balis, D., Coldewey-Egbers, M., Eleftheratos, K., Godin-Beekmann, S., Gruzdev, A., Kapsomenakis, J., Laeng, A., Laine, M., Maillard Barras, E., Taylor, M., von Clarmann, T., Weber, M., and Wild, J.: LOTUS Regression Code, SPARC LOTUS Activity, GitHub [code], https://github.com/usask-arg/lotus-regression (last access: 24 October 2023), 2022. a, b
Dennison, F. and Woodhouse, M. T.: ACCESS-CM2-Chem: evaluation of southern hemisphere ozone and its effect on the Southern Annular Mode, Journal of Southern Hemisphere Earth Systems Science, 73, 17–29, https://doi.org/10.1071/ES22015, 2023. a
Dubé, K., Tegtmeier, S., Bourassa, A., Zawada, D., Degenstein, D., Randel, W., Davis, S., Schwartz, M., Livesey, N., and Smith, A.: Upper-stratospheric temperature trends: new results from the Optical Spectrograph and InfraRed Imager System (OSIRIS), Atmospheric Chemistry and Physics, 24, 12925–12941, https://doi.org/10.5194/acp-24-12925-2024, 2024. a, b, c, d
Eichinger, R. and Šácha, P.: Overestimated acceleration of the advective Brewer–Dobson circulation due to stratospheric cooling, Quarterly Journal of the Royal Meteorological Society, 146, 3850–3864, https://doi.org/10.1002/qj.3876, 2020. a
Esplin, R., Mlynczak, M. G., Russell, J., Gordley, L., and Team, T. S.: Sounding of the Atmosphere Using Broadband Emission Radiometry (SABER): Instrument and Science Measurement Description, Earth and Space Science, 10, e2023EA002999, https://doi.org/10.1029/2023EA002999, 2023. a, b
France, J. A., Harvey, V. L., Randall, C. E., Hitchman, M. H., and Schwartz, M. J.: A climatology of stratopause temperature and height in the polar vortex and anticyclones, Journal of Geophysical Research: Atmospheres, 117, https://doi.org/10.1029/2011JD016893, 2012. a
Garcia, R. R., Dunkerton, T. J., Lieberman, R. S., and Vincent, R. A.: Climatology of the semiannual oscillation of the tropical middle atmosphere, Journal of Geophysical Research: Atmospheres, 102, 26019–26032, https://doi.org/10.1029/97JD00207, 1997. a
Gelaro, R., McCarty, W., Suárez, M. J., Todling, R., Molod, A., Takacs, L., Randles, C. A., Darmenov, A., Bosilovich, M. G., Reichle, R., Wargan, K., Coy, L., Cullather, R., Draper, C., Akella, S., Buchard, V., Conaty, A., da Silva, A. M., Gu, W., Kim, G.-K., Koster, R., Lucchesi, R., Merkova, D., Nielsen, J. E., Partyka, G., Pawson, S., Putman, W., Rienecker, M., Schubert, S. D., Sienkiewicz, M., and Zhao, B.: The Modern-Era Retrospective Analysis for Research and Applications, Version 2 (MERRA-2), Journal of Climate, 30, 5419–5454, https://doi.org/10.1175/JCLI-D-16-0758.1, 2017. a
Gettelman, A., Mills, M. J., Kinnison, D. E., Garcia, R. R., Smith, A. K., Marsh, D. R., Tilmes, S., Vitt, F., Bardeen, C. G., McInerny, J., Liu, H.-L., Solomon, S. C., Polvani, L. M., Emmons, L. K., Lamarque, J.-F., Richter, J. H., Glanville, A. S., Bacmeister, J. T., Phillips, A. S., Neale, R. B., Simpson, I. R., DuVivier, A. K., Hodzic, A., and Randel, W. J.: The Whole Atmosphere Community Climate Model Version 6 (WACCM6), Journal of Geophysical Research: Atmospheres, 124, 12380–12403, https://doi.org/10.1029/2019JD030943, 2019. a
Gulev, S., Thorne, P. W., Ahn, J., Dentener, F., Domingues, C., Gerland, S., Gong, D., Kaufman, D., Nnamchi, H., Quaas, J., Rivera, J., Sathyendranath, S., Smith, S., Trewin, B., von Schuckmann, K., and Vose, R.: Changing State of the Climate System, in: Climate Change 2021: The Physical Science Basis. Contribution of Working Group I to the Sixth Assessment Report of the Intergovernmental Panel on Climate Change, edited by: Masson-Delmotte, V., Zhai, P., Pirani, A., Connors, S. L., Péan, C., Berger, S., N. Caud, Y. C., Goldfarb, L., Gomis, M. I., Huang, M., Leitzell, K., Lonnoy, E., Matthews, J. B. R., Maycock, T. K., Waterfield, T., Yelekçi, O., Yu, R., and Zhou, B., Chap. 2, 287–422, Cambridge University Press, https://doi.org/10.1017/9781009157896.004, 2021. a
Hirota, I.: Observational evidence of the semiannual oscillation in the tropical middle atmosphere – A review, Pure and Applied Geophysics, 118, 217–238, 1980. a
Hitchman, M. H., Gille, J. C., Rodgers, C. D., and Brasseur, G.: The separated polar winter stratopause: A gravity wave driven climatological feature, Journal of the Atmospheric Sciences, 46, 410–422, 1989. a, b, c
Huang, F. T., Mayr, H. G., Russell III, J. M., Mlynczak, M. G., and Reber, C. A.: Ozone diurnal variations and mean profiles in the mesosphere, lower thermosphere, and stratosphere, based on measurements from SABER on TIMED, Journal of Geophysical Research: Space Physics, 113, https://doi.org/10.1029/2007JA012739, 2008. a
Jöckel, P., Tost, H., Pozzer, A., Kunze, M., Kirner, O., Brenninkmeijer, C. A. M., Brinkop, S., Cai, D. S., Dyroff, C., Eckstein, J., Frank, F., Garny, H., Gottschaldt, K.-D., Graf, P., Grewe, V., Kerkweg, A., Kern, B., Matthes, S., Mertens, M., Meul, S., Neumaier, M., Nützel, M., Oberländer-Hayn, S., Ruhnke, R., Runde, T., Sander, R., Scharffe, D., and Zahn, A.: Earth System Chemistry integrated Modelling (ESCiMo) with the Modular Earth Submodel System (MESSy) version 2.51, Geoscientific Model Development, 9, 1153–1200, https://doi.org/10.5194/gmd-9-1153-2016, 2016. a
Jonsson, A. I., de Grandpré, J., Fomichev, V. I., McConnell, J. C., and Beagley, S. R.: Doubled CO2-induced cooling in the middle atmosphere: Photochemical analysis of the ozone radiative feedback, Journal of Geophysical Research: Atmospheres, 109, https://doi.org/10.1029/2004JD005093, 2004. a
Josse, B., Simon, P., and Peuch, V.-H.: Radon global simulations with the multiscale chemistry and transport model MOCAGE, Tellus B: Chemical and Physical Meteorology, 56, 339–356, https://doi.org/10.3402/tellusb.v56i4.16448, 2004. a
Karami, K., Borchert, S., Eichinger, R., Jacobi, C., Kuchar, A., Mehrdad, S., Pisoft, P., and Sacha, P.: The Climatology of Elevated Stratopause Events in the UA-ICON Model and the Contribution of Gravity Waves, Journal of Geophysical Research: Atmospheres, 128, e2022JD037907, https://doi.org/10.1029/2022JD037907, 2023. a
Liu, J., Strode, S. A., Liang, Q., Oman, L. D., Colarco, P. R., Fleming, E. L., Manyin, M. E., Douglass, A. R., Ziemke, J. R., Lamsal, L. N., and Li, C.: Change in Tropospheric Ozone in the Recent Decades and Its Contribution to Global Total Ozone, Journal of Geophysical Research: Atmospheres, 127, e2022JD037170, https://doi.org/10.1029/2022JD037170, 2022. a
Liu, X., Xu, J., Yue, J., Liu, Y., and Andrioli, V. F.: Trends in the high-latitude mesosphere temperature and mesopause revealed by SABER, Atmospheric Chemistry and Physics, 24, 10143–10157, https://doi.org/10.5194/acp-24-10143-2024, 2024. a
Llewellyn, E. J., Lloyd, N. D., Degenstein, D. A., Gattinger, R. L., Petelina, S. V., Bourassa, A. E., Wiensz, J. T., Ivanov, E. V., McDade, I. C., Solheim, B. H., McConnell, J. C., Haley, C. S., von Savigny, C., Sioris, C. E., McLinden, C. A., Griffioen, E., Kaminski, J., Evans, W. F., Puckrin, E., Strong, K., Wehrle, V., Hum, R. H., Kendall, D. J., Matsushita, J., Murtagh, D. P., Brohede, S., Stegman, J., Witt, G., Barnes, G., Payne, W. F., Piché, L., Smith, K., Warshaw, G., Deslauniers, D. L., Marchand, P., Richardson, E. H., King, R. A., Wevers, I., McCreath, W., Kyrölä, E., Oikarinen, L., Leppelmeier, G. W., Auvinen, H., Mégie, G., Hauchecorne, A., Lefèvre, F., de La Noe, J., Ricaud, P., Frisk, U., Sjoberg, F., von Schéele, F., and Nordh, L.: The OSIRIS instrument on the Odin spacecraft, Canadian Journal of Physics, 82, 411–422, https://doi.org/10.1139/p04-005, 2004. a, b
Long, C., Fujiwara, M., Davis, S., Mitchell, D., and Wright, C.: Overview of Temperature and Winds, in: SPARC Reanalysis Intercomparison Project (S-RIP) Final Report, edited by: Fujiwara, M., Manney, G. L., Gray, L. J., and Wright, J. S., Chap. 3, SPARC Report No. 10, WCRP-6/2021, https://doi.org/10.17874/800dee57d13, 2022. a
Manabe, S. and Wetherald, R. T.: Thermal Equilibrium of the Atmosphere with a Given Distribution of Relative Humidity, Journal of Atmospheric Sciences, 24, 241–259, 1967. a
Marchand, M., Keckhut, P., Lefebvre, S., Claud, C., Cugnet, D., Hauchecorne, A., Lefèvre, F., Lefebvre, M.-P., Jumelet, J., Lott, F., Hourdin, F., Thuillier, G., Poulain, V., Bossay, S., Lemennais, P., David, C., and Bekki, S.: Dynamical amplification of the stratospheric solar response simulated with the Chemistry-Climate Model LMDz-Reprobus, Journal of Atmospheric and Solar-Terrestrial Physics, 75-76, 147–160, https://doi.org/10.1016/j.jastp.2011.11.008, 2012. a
Meng, L., Liu, J., Tarasick, D. W., Randel, W. J., Steiner, A. K., Wilhelmsen, H., Wang, L., and Haimberger, L.: Continuous rise of the tropopause in the Northern Hemisphere over 1980–2020, Science Advances, 7, eabi8065, https://doi.org/10.1126/sciadv.abi8065, 2021. a
Mlynczak, M. G., Hunt, L. A., Garcia, R. R., Harvey, V. L., Marshall, B. T., Yue, J., Mertens, C. J., and Russell III, J. M.: Cooling and Contraction of the Mesosphere and Lower Thermosphere From 2002 to 2021, Journal of Geophysical Research: Atmospheres, 127, e2022JD036767, https://doi.org/10.1029/2022JD036767, 2022. a
Morgenstern, O., Braesicke, P., O'Connor, F. M., Bushell, A. C., Johnson, C. E., Osprey, S. M., and Pyle, J. A.: Evaluation of the new UKCA climate-composition model – Part 1: The stratosphere, Geoscientific Model Development, 2, 43–57, https://doi.org/10.5194/gmd-2-43-2009, 2009. a
Murtagh, D., Frisk, U., Merino, F., Ridal, M., Jonsson, A., Stegman, J., Witt, G., Eriksson, P., Jiménez, C., Megie, G., de la Noë, J., Ricaud, P., Baron, P., Pardo, J. R., Hauchcorne, A., Llewellyn, E. J., Degenstein, D. A., Gattinger, R. L., Lloyd, N. D., Evans, W. F. J., McDade, I. C., Haley, C. S., Sioris, C., von Savigny, C., Solheim, B. H., McConnell, J. C., Strong, K., Richardson, E. H., Leppelmeier, G. W., Kyrölä, E., Auvinen, H., and Oikarine, L.: An overview of the Odin atmospheric mission, Canadian Journal of Physics, 80, 309–319, https://doi.org/10.1139/p01-157, 2002. a
Oman, L. D., Douglass, A. R., Ziemke, J. R., Rodriguez, J. M., Waugh, D. W., and Nielsen, J. E.: The ozone response to ENSO in Aura satellite measurements and a chemistry-climate simulation, Journal of Geophysical Research: Atmospheres, 118, 965–976, https://doi.org/10.1029/2012JD018546, 2013. a
Picone, J. M., Hedin, A. E., Drob, D. P., and Aikin, A. C.: NRLMSISE-00 empirical model of the atmosphere: Statistical comparisons and scientific issues, Journal of Geophysical Research: Space Physics, 107, SIA 15-1–SIA 15-16, https://doi.org/10.1029/2002JA009430, 2002. a
Pisoft, P., Sacha, P., Polvani, L. M., Añel, J. A., de la Torre, L., Eichinger, R., Foelsche, U., Huszar, P., Jacobi, C., Karlicky, J., Kuchar, A., Miksovsky, J., Zak, M., and Riede, H. E.: Stratospheric contraction caused by increasing greenhouse gases, Environmental Research Letters, 16, 064038, https://doi.org/10.1088/1748-9326/abfe2b, 2021. a, b, c
Plumb, R. A.: Stratospheric transport, Journal of the Meteorological Society of Japan. Ser. II, 80, 793–809, https://doi.org/10.2151/jmsj.80.793, 2002. a
Plummer, D., Nagashima, T., Tilmes, S. Archibald, A., Chiodo, G., Fadnavis, S., Garny, H., Josse, B., Kim, J., Lamarque, J.-F., Morgenstern, O., Murray, L., Orbe, C., Tai, A., Chipperfield, M., Funke, B., Juckes, M., Kinnison, D., Kunze, M., Luo, B., Matthes, K., Newman, P. A., Pascoe, C., and Peter, T.: CCMI-2022: A new set of Chemistry-Climate Model Initiative (CCMI) Community Simulations to Update the Assessment of Models and Support Upcoming Ozone Assessment Activities, SPARC Newsletter No. 57, https://aparc-climate.org/wp-content/uploads/2025/10/SPARCnewsletter_Jul2021_web.pdf (last access: 6 February 2026), 2021. a
Ramesh, K. and Sridharan, S.: Long-Term Trends in Tropical (10° N–15° N) Middle Atmosphere (40–110 km) CO2 Cooling, Journal of Geophysical Research: Space Physics, 123, 5661–5673, https://doi.org/10.1029/2017JA025060, 2018. a
Remsberg, E.: Observation and Attribution of Temperature Trends Near the Stratopause From HALOE, Journal of Geophysical Research: Atmospheres, 124, 6600–6611, https://doi.org/10.1029/2019JD030455, 2019. a
Remsberg, E. E., Marshall, B. T., Garcia-Comas, M., Krueger, D., Lingenfelser, G. S., Martin-Torres, J., Mlynczak, M. G., Russell III, J. M., Smith, A. K., Zhao, Y., Brown, C., Gordley, L. L., Lopez-Gonzalez, M. J., Lopez-Puertas, M., She, C.-Y., Taylor, M. J., and Thompson, R. E.: Assessment of the quality of the Version 1.07 temperature-versus-pressure profiles of the middle atmosphere from TIMED/SABER, Journal of Geophysical Research: Atmospheres, 113, https://doi.org/10.1029/2008JD010013, 2008. a, b, c
Rezac, L., Yue, J., Yongxiao, J., Russell III, J. M., Garcia, R., López-Puertas, M., and Mlynczak, M. G.: On Long-Term SABER CO2 Trends and Effects Due to Nonuniform Space and Time Sampling, Journal of Geophysical Research: Space Physics, 123, 7958–7967, https://doi.org/10.1029/2018JA025892, 2018. a
Russell, J. M., Mlynczak, M. G., Gordley, L. L., Jr., J. J. T., and Esplin, R. W.: Overview of the SABER experiment and preliminary calibration results, in: Optical Spectroscopic Techniques and Instrumentation for Atmospheric and Space Research III, edited by: Larar, A. M., vol. 3756, 277–288, International Society for Optics and Photonics, SPIE, https://doi.org/10.1117/12.366382, 1999. a
Russell III, J. M., Gordley, L. L., Park, J. H., Drayson, S. R., Hesketh, W. D., Cicerone, R. J., Tuck, A. F., Frederick, J. E., Harries, J. E., and Crutzen, P. J.: The Halogen Occultation Experiment, Journal of Geophysical Research: Atmospheres, 98, 10777–10797, https://doi.org/10.1029/93JD00799, 1993. a
Santer, B. D., Wehner, M. F., Wigley, T. M. L., Sausen, R., Meehl, G. A., Taylor, K. E., Ammann, C., Arblaster, J., Washington, W. M., Boyle, J. S., and Brüggemann, W.: Contributions of Anthropogenic and Natural Forcing to Recent Tropopause Height Changes, Science, 301, 479–483, https://doi.org/10.1126/science.1084123, 2003. a
Santer, B. D., Po-Chedley, S., Zhao, L., Zou, C.-Z., Fu, Q., Solomon, S., Thompson, D. W. J., Mears, C., and Taylor, K. E.: Exceptional stratospheric contribution to human fingerprints on atmospheric temperature, Proceedings of the National Academy of Sciences, 120, e2300758120, https://doi.org/10.1073/pnas.2300758120, 2023. a
Scinocca, J. F., McFarlane, N. A., Lazare, M., Li, J., and Plummer, D.: Technical Note: The CCCma third generation AGCM and its extension into the middle atmosphere, Atmospheric Chemistry and Physics, 8, 7055–7074, https://doi.org/10.5194/acp-8-7055-2008, 2008. a
Seidel, D. J. and Randel, W. J.: Variability and trends in the global tropopause estimated from radiosonde data, Journal of Geophysical Research: Atmospheres, 111, https://doi.org/10.1029/2006JD007363, 2006. a
Sellar, A. A., Jones, C. G., Mulcahy, J. P., Tang, Y., Yool, A., Wiltshire, A., O'Connor, F. M., Stringer, M., Hill, R., Palmieri, J., Woodward, S., de Mora, L., Kuhlbrodt, T., Rumbold, S. T., Kelley, D. I., Ellis, R., Johnson, C. E., Walton, J., Abraham, N. L., Andrews, M. B., Andrews, T., Archibald, A. T., Berthou, S., Burke, E., Blockley, E., Carslaw, K., Dalvi, M., Edwards, J., Folberth, G. A., Gedney, N., Griffiths, P. T., Harper, A. B., Hendry, M. A., Hewitt, A. J., Johnson, B., Jones, A., Jones, C. D., Keeble, J., Liddicoat, S., Morgenstern, O., Parker, R. J., Predoi, V., Robertson, E., Siahaan, A., Smith, R. S., Swaminathan, R., Woodhouse, M. T., Zeng, G., and Zerroukat, M.: UKESM1: Description and Evaluation of the U.K. Earth System Model, Journal of Advances in Modeling Earth Systems, 11, 4513–4558, https://doi.org/10.1029/2019MS001739, 2019. a
SPARC/IO3C/GAW: SPARC/IO3C/GAW Report on Long-term Ozone Trends and Uncertainties in the Stratosphere, in: SPARC Report No. 9 (2019) of The SPARC LOTUS Activity, edited by: Petropavlovskikh, I., Godin-Beekmann, S., Hubert, D., Damadeo, R., Hassler, B., and Sofieva, V., SPARC Report No. 9, GAW Report No. 241, WCRP-17/2018, https://doi.org/10.17874/f899e57a20b, 2019. a, b
Sukhodolov, T., Egorova, T., Stenke, A., Ball, W. T., Brodowsky, C., Chiodo, G., Feinberg, A., Friedel, M., Karagodin-Doyennel, A., Peter, T., Sedlacek, J., Vattioni, S., and Rozanov, E.: Atmosphere–ocean–aerosol–chemistry–climate model SOCOLv4.0: description and evaluation, Geoscientific Model Development, 14, 5525–5560, https://doi.org/10.5194/gmd-14-5525-2021, 2021. a
Waters, J., Froidevaux, L., Harwood, R., Jarnot, R., Pickett, H., Read, W., Siegel, P., Cofield, R., Filipiak, M., Flower, D., Holden, J., Lau, G., Livesey, N., Manney, G., Pumphrey, H., Santee, M., Wu, D., Cuddy, D., Lay, R., Loo, M., Perun, V., Schwartz, M., Stek, P., Thurstans, R., Boyles, M., Chandra, K., Chavez, M., Chen, G.-S., Chudasama, B., Dodge, R., Fuller, R., Girard, M., Jiang, J., Jiang, Y., Knosp, B., LaBelle, R., Lam, J., Lee, K., Miller, D., Oswald, J., Patel, N., Pukala, D., Quintero, O., Scaff, D., Van Snyder, W., Tope, M., Wagner, P., and Walch, M.: The Earth Observing System Microwave Limb Sounder (EOS MLS) on the Aura Satellite, IEEE Transactions on Geoscience and Remote Sensing, 44, 1075–1092, https://doi.org/10.1109/TGRS.2006.873771, 2006. a
Zawada, D., Dubé, K., Warnock, T., Bourassa, A., Tegtmeier, S., and Degenstein, D.: OSIRIS stratospheric temperature v7.3, Zenodo [data set], https://doi.org/10.5281/zenodo.8271140, 2023. a
Zawada, D., Dubé, K., Warnock, T., Bourassa, A., Tegtmeier, S., and Degenstein, D.: A multi-decadal time series of upper stratospheric temperature profiles from Odin-OSIRIS limb-scattered spectra, Atmospheric Measurement Techniques, 17, 1995–2010, https://doi.org/10.5194/amt-17-1995-2024, 2024. a, b, c, d
Zhao, X. R., Sheng, Z., Shi, H. Q., Weng, L. B., and Liao, Q. X.: Long-Term Trends and Solar Responses of the Mesopause Temperatures Observed by SABER During the 2002–2019 Period, Journal of Geophysical Research: Atmospheres, 125, e2020JD032418, https://doi.org/10.1029/2020JD032418, 2020. a
Zhao, X. R., Sheng, Z., Shi, H. Q., Weng, L. B., and He, Y.: Middle Atmosphere Temperature Changes Derived from SABER Observations during 2002–20, Journal of Climate, 34, 7995–8012, https://doi.org/10.1175/JCLI-D-20-1010.1, 2021. a, b