the Creative Commons Attribution 4.0 License.
the Creative Commons Attribution 4.0 License.
 | 10 Feb 2026
Factors controlling the concentration of water-soluble pyrogenic carbon in aerosols in Hokkaido, Japan
Yuzo Miyazaki
Tomohisa Irino
Youhei Yamashita
Pyrogenic carbon (PyC) is a continuum of compounds generated during the incomplete combustion of biomass or fossil fuels. Water-soluble PyC (WSPyC), a PyC smaller than 0.7 µm, is transported to the ocean via rivers or atmospheric deposition and is considered a key component in the long-term regulation of the global carbon cycle. Compared to the riverine input flux, the atmospheric deposition flux of WSPyC may have large uncertainties due to limited observations. This study examines the factors influencing WSPyC concentration in atmospheric aerosols in Sapporo, Hokkaido, based on a year-round observation. The WSPyC concentration in the aerosols, determined with the benzene polycarboxylic acid method, ranged from 1.41 to 46.5 ng C m−3, with an average value of 13.7±10.6 ng C m−3. The average concentration was lower than previously observed near combustion sources. Positive Matrix Factorization (PMF) analysis revealed that 60 % of the WSPyC concentration was attributed to a K+-dominated combustion, which included the burning of biomass and biofuels. Meanwhile, 40 % of WSPyC was associated with factors related to the atmospheric aging of aerosols derived from fossil fuel combustion. The global WSPyC deposition flux to the ocean has previously been estimated based on the concentration ratio of WSPyC to elemental carbon (EC) or water-soluble organic carbon (WSOC). The results of this study suggested that these ratios vary due to the atmospheric aging processes, including photochemical production of WSPyC from soot, indicating the need for a reassessment of the global WSPyC deposition flux.
- Article
(5029 KB) - Full-text XML
-
Supplement
(2471 KB) - BibTeX
- EndNote


Pyrogenic carbon (PyC) is a continuum of compounds produced by the incomplete combustion of biomass and fossil fuels (Hedges et al., 2000; Masiello, 2024; Wagner et al., 2021). Most PyC consists of polycyclic aromatic compounds that are resistant to microbial degradation and have long residence times in natural environments (Goldberg, 1985). Due to its long residence time in the environment, the formation of PyC is considered a carbon sequestration process in the global carbon cycle (Santín et al., 2016). Recent climate change, namely increases in temperature and drought, is causing intensive wildfires and CO2 emissions (Jones et al., 2024; Wang et al., 2025). The production of PyC can reduce the positive feedback loop between wildfires and climate change caused by CO2 emissions by 10 %–20 % (Jones et al., 2019); however, due to the limited understanding of PyC dynamics, such as storage, transfer, and fate, it is not currently included in Earth system models (Coppola et al., 2022).
Globally, landscape fires produce 196–340 Tg of PyC annually (Jones et al., 2019), most of which remain at the surface, namely in the soil, as charcoal or ash. On the other hand, landscape fires emit soot, a fraction of PyC, to the atmosphere, with a global flux estimated at 2–11 Tg yr−1 (Bond et al., 2013). Soot is also produced by fossil fuel combustion, with a global flux of 5–13 Tg yr−1 (Bond et al., 2013). A part of the larger-sized PyC particles (particulate PyC, PPyC: diameter greater than 0.7 µm, Fang et al., 2018) in soils is eroded and transported to the ocean via rivers (Wagner et al., 2015; Coppola et al., 2018). A fraction of PPyC in soils is also subject to partial oxidation, resulting in its solubilization (defined as water-soluble PyC, WSPyC, or dissolved PyC: diameter less than 0.7 µm, Fang et al., 2018) and transport to terrestrial aquatic systems such as rivers, groundwater, lakes, and finally to the ocean (Dittmar et al., 2012; Wagner et al., 2015; Yamashita et al., 2021). Most of the PPyC that is transported to the ocean is considered to be buried in coastal sediments, which likely leads to its long-term preservation (Coppola et al., 2014; Fang et al., 2021). In contrast, WSPyC is ubiquitous in the ocean from the coastal to the open ocean (Nakane et al., 2017; Yamashita et al., 2022; Bao et al., 2023; Coppola et al., 2024), constituting about 2 % of dissolved organic carbon (DOC) in the open ocean (Dittmar and Paeng, 2009).
The primary sources of oceanic WSPyC are riverine transport and atmospheric deposition, although the seafloor and submarine groundwater are also considered sources (Wagner et al., 2018; Zhao et al., 2025). The annual input flux of WSPyC by riverine transport and atmospheric deposition is estimated to be 18±4 Tg yr−1 (Coppola et al., 2018; Jones et al., 2020) and 1.8±0.83 Tg yr−1 to 4.5±1.8 Tg yr−1 (Bao et al., 2017; Geng et al., 2021), respectively. The hydrothermal vent has recently been identified as a source of WSPyC with a global flux of 1.6–9.7 Tg yr−1 (Yamashita et al., 2023). The identified removal processes of WSPyC from the ocean are photodegradation and adsorption onto sinking particles, and these fluxes are estimated to be 20–490 Tg yr−1 (Stubbins et al., 2012) and 16–85 Tg yr−1 (Coppola et al., 2014; Yamashita et al., 2022), respectively. The sum of removal fluxes is higher than the sum of input fluxes, and the unbalanced budget of WSPyC in the ocean is a puzzle that should be solved for a better understanding of the global PyC cycle (Coppola et al., 2022). Although the input flux of atmospheric deposition is one order of magnitude smaller than that of the riverine transport, the stable carbon isotope composition of WSPyC in the ocean was far different from that of riverine WSPyC, but similar to marine organisms (Wagner et al., 2019). Recently, the stable carbon isotope compositions of aerosol PyC collected in the South China Sea and the northeast Indian Ocean were reported to cover the range of oceanic WSPyC (Geng et al., 2023), indicating that atmospheric deposition is an essential but potentially underestimated source of oceanic WSPyC.
To the best of our knowledge, studies on atmospheric WSPyC observations are limited, with only two focusing on rainwater (Wagner et al., 2019; Bao et al., 2022) and three on aerosols (Bao et al., 2017; Geng et al., 2021; Zhang et al., 2023a). Estimates of the global WSPyC deposition flux to the ocean are based on a linear relationship between WSPyC and water-soluble OC (WSOC) concentrations in aerosols collected over the Chinese coastal seas and the western North Pacific Ocean in spring, when outflows from northern China (Bao et al., 2017) to these oceanic areas are frequent. The flux has also been estimated based on a linear relationship between WSPyC and elemental carbon (EC) concentrations in aerosols measured year-round in Bachok, Malaysia (Geng et al., 2021). However, the relationships between WSPyC and WSOC, as well as between WSPyC and C, have been reported to vary significantly, which depends on combustion sources and atmospheric aging processes during transport (Geng et al., 2021; Zhang et al., 2023a). The formation of WSPyC from soot through photochemical reaction is probably the most critical process in atmospheric ageing (Fierce et al., 2015; Li et al., 2018, 2019, 2022), which could significantly alter the ratio of WSPyC to WSOC and EC in aerosols during transport. However, the influence of atmospheric aging on WSPyC concentrations in aerosols has not been well assessed because previous studies were conducted relatively close to the emission sources of combustion-derived aerosols.
In this study, ambient aerosol samples were collected in Sapporo, Hokkaido, Japan, to provide insights for improving the estimates of the atmospheric deposition flux of WSPyC to the ocean. Sapporo is a city located in the western part of Hokkaido, northern Japan, facing the western North Pacific. The tertiary industry is dominant in Sapporo, and the number of manufacturers is lower than the national average, suggesting that industrial emissions are relatively limited (Pavuluri et al., 2013). Because of the influence of the East Asian monsoon, the origin of aerosols in this region varies greatly with the season, making it an ideal location for observing air masses transported over long distances from China, Siberia, and the surrounding seas (Yamamoto et al., 2011; Pavuluri et al., 2013, 2015). WSPyC concentrations were measured together with WSOC and EC concentrations, light absorption parameters, and inorganic ions in the aerosols. Positive matrix factorization (PMF) and backward trajectory analyses were used to determine the sources of WSPyC observed in Sapporo.
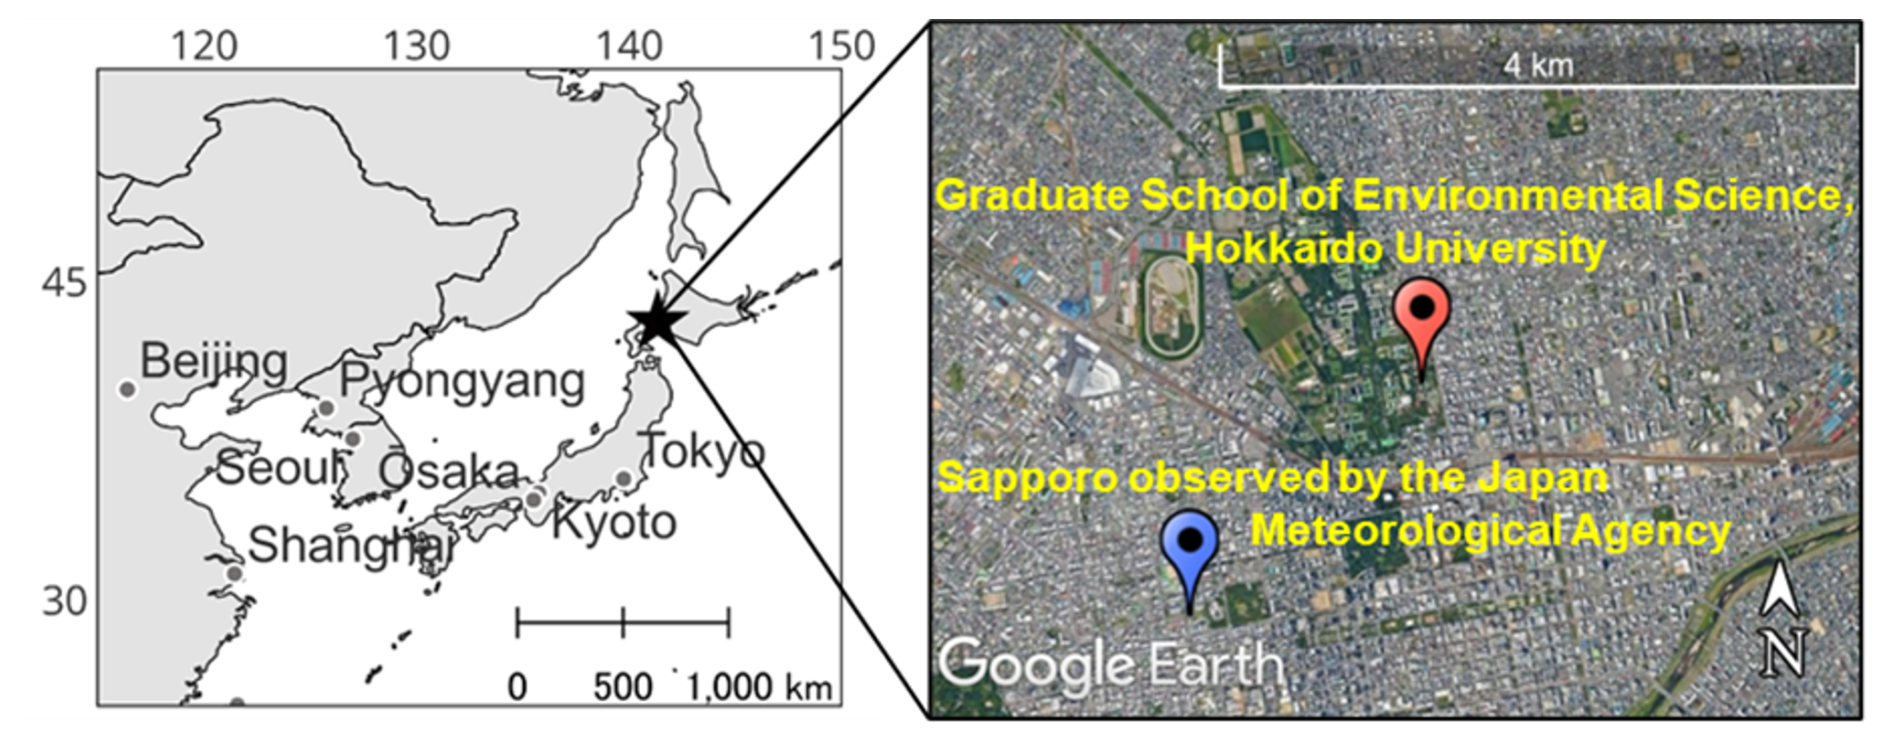
Figure 1Locations of the aerosol sampling site (Graduate School of Environmental Science, Hokkaido University) and Sapporo site by the Japan Meteorological Agency. Imagery © 2025 Airbus, Map data SIO, NOAA, US Navy, NGA, GEBCO in the right panel.
2.1 Sample collection
Fifty-three aerosol samples were collected at the rooftop of the Graduate School of Environmental Science, Hokkaido University (43.073° N, 141.346° E, 30 m a.g.l. – above ground level, Fig. 1) from 19 September 2022, to 28 September 2023. The samples include an Asian dust sample. Asian dust, consisting of soil particles originating from the Asian deserts, is frequently transported across the East China Sea and the Yellow Sea to Japan during spring (Iwasaka et al., 1983). The total suspended particle (TSP) samples were collected on a quartz fiber filter (Pall), which was pre-combusted at 450 °C for 6 h, with a high-volume air sampler (Model 120SL, Kimoto Electric). The aerosol sample was collected on the filter at a flow rate of 1000 L min−1 with a sampling duration of approximately 7 d for standard samples and 31 h (from 09:00 LT on 12 April, to 16:00 T on 13 April 2023) for the Asian dust sample (Table S1 in the Supplement). After the sample collection, the filter was folded with the collection side inward, placed into a pre-combusted (450 °C, 6 h) glass jar with an acid-washed (soaked overnight in 1 M HCl and rinsed thoroughly with Milli-Q water) Teflon-lined screw cap, and stored at −20° until analysis. During the storage, Teflon tape was wrapped between the lid and the container to prevent contamination.
Hourly wind direction and wind speed data at Sapporo observed by the Japan Meteorological Agency (43.06° N, 141.328° E, Fig. 1) were obtained from the Japan Meteorological Agency website (https://www.data.jma.go.jp/stats/etrn/index.php, last access: 8 February 2026). The wind rose plots were produced using R with the “Climatol” package. Monthly precipitation data in Sapporo were also obtained from the Japan Meteorological Agency's website.
2.2 Sample pretreatment
2.2.1 Extraction of aerosol samples with water
Water-soluble fractions of aerosol samples are defined as extracts from the filter with Milli-Q water, followed by filtration (Miyazaki et al., 2018). Two punches (50 mm diameter) of the filter samples were extracted with 40 mL of Milli-Q water using an ultrasonic bath (VS-100III, AS ONE) at 28 Hz for 15 min. Ice packs were added to the ultrasonic bath to prevent the water temperature from rising during the extraction. The extracts were filtered using a 0.22 µm polyvinylidene fluoride (PVDF) filter (Durapore, Merck Millipore) with an acid-washed plastic filter holder. This process was repeated three times. Approximately 40 mL of the water-soluble fraction was used for water-soluble organic carbon (WSOC) concentration measurement and UV-Vis absorption analysis, and about 80 mL was used for solid-phase extraction for WSPyC analysis.
For inorganic ions and methanesulfonic acid (MSA) analyses, a punch (25 mm diameter) of the filter sample was extracted with 10 mL of Milli-Q water ultrasonically for 15 min. The extract was filtered using a 0.22 µm PVDF syringe filter.
2.2.2 Solid-phase extraction
Solid-phase extraction was performed according to the method reported by Dittmar (2008) and Nakane et al. (2017). The detailed procedure is described in Barton and Wagner (2022). Approximately 80 mL of the water-soluble fraction was acidified to pH 2 by adding concentrated HCl. The acidified fraction was passed through a solid-phase extraction cartridge (Bond Elut-PPL, Agilent, 1 g, 6 mL) prewashed with two column volumes (approximately 12 mL) of methanol and one column volume of 0.01 M HCl, allowing WSPyC in the fraction to adsorb onto the resin. After the passage of the acidified filtrate, the cartridge was rinsed with two column volumes of 0.01 M HCl. The resin was then dried with nitrogen gas. Finally, two column volumes of methanol were passed through the cartridge to elute the organic matter, including WSPyC, which was collected into a pre-combusted glass bottle with an acid-washed Teflon-lined screw cap and stored frozen until analysis.
2.3 Analysis
2.3.1 Concentration of water-soluble pyrogenic carbon (WSPyC)
WSPyC analysis was performed using the benzene polycarboxylic acid (BPCA) method, as reported by Dittmar (2008) and modified by Nakane et al. (2017) and Yamashita et al. (2021). The BPCA method involves oxidizing polycyclic aromatic structures in WSPyC using nitric acid, converting them into BPCAs with one benzene ring and multiple carboxylic groups on their side chain. BPCAs having 3–6 carboxylic groups are then quantified with a high-performance liquid chromatograph (HPLC). The method provides information on the concentration and condensation degree of WSPyC.
The methanol eluate from solid phase extraction was dried using a centrifugal evaporator (CVE-3000, EYELA) at 50 °C. The residue was dissolved in 5 mL of methanol, which was collected with an acid-washed glass measuring pipette. Two millilitres of the methanol solution were transferred to 2 mL glass ampoules, dried again using a centrifugal evaporator at 50 °C, and 0.5 mL of concentrated nitric acid was added. The ampoules were sealed and heated at 170 °C for 6 h to oxidize the WSPyC into BPCAs. Nitric acid was then removed by drying the samples in the centrifugal evaporator at 50 °C. The dried residue was dissolved in 200 µL of eluent A (4 mM tetrabutylammonium, 50 mM sodium acetate, 10 % methanol) and transferred to an HPLC vial for analysis using an HPLC equipped with a diode array detector (1260 Infinity, Agilent).
The HPLC analytical settings followed those of Dittmar (2008) and Nakane et al. (2017). BPCA identification was based on retention time and absorption spectra (220–380 nm) reported by Dittmar (2008). Calibration curves were constructed using BPCA standard mixtures, which were prepared by mixing individual BPCA standards. BPCAs with 3 to 6 carboxyl groups (i.e., B3CA, B4CA, B5CA, B6CA) were used to quantify WSPyC. The calculation of WSPyC concentration was based on Eq. (1) proposed by Dittmar (2008),
where Ae is the filter area used for the water extraction (2.52π×2 cm2), Ac represents the effective collection area of the filter during the aerosol sampling (405.3 cm2), Ve means the volume of water passed through the SPE cartridge, Va means the volume (m3) of air drawn during the sampling.
2.3.2 Concentrations of elemental carbon (EC) and organic carbon (OC)
EC and OC concentrations in aerosol samples were quantified with a thermal-optical transmittance method using an EC OC analyser (Sunset Laboratory) (Miyazaki et al., 2007). A 14 mm diameter filter punch was placed in a quartz tube with a slit. The analyser combusted the sample under a helium atmosphere (100 % He), followed by a helium-oxygen mixture atmosphere (98 % He, 2 % O2) at varying temperatures. The temperature protocol used in this study is shown in Fig. S1 in the Supplmenet. In the helium atmosphere, partial combustion of OC produces EC, potentially leading to overestimation. The EC generated during the analysis was corrected using simultaneous laser transmittance measurements, according to Lu et al. (2018).
CO2 generated from the oxidation of OC and EC was detected with a non-dispersive infrared (NDIR) detector. To correct the variations in the NDIR detector's sensitivity, CH4 was injected between 761 and 900 s. The calibration curve was obtained by analysing a pre-combusted blank filter with sucrose solution.
2.3.3 Concentration of water-soluble organic carbon (WSOC)
WSOC concentration was measured using a total organic carbon analyser (TOC-L, Shimadzu) based on the non-purgeable organic carbon (NPOC) method with high-temperature catalytic oxidation. Carrier gas (pure air) was supplied at 150 mL min−1. 2 M HCl was added to the water-soluble fraction to reduce the pH to below 2, and dissolved inorganic carbon was removed by purging with pure air. A 100 µL aliquot of the sample was injected into the combustion tube filled with a standard catalyst maintained at 680 °C, where organic carbon was oxidized to CO2, which was then detected by an NDIR detector. The peak areas obtained by 5–7 injections of the fractions were averaged to estimate the WSOC concentration. Standard solutions of potassium hydrogen phthalate, prepared and analysed on the same day as the sample measurements, were used for the calibration curve.
2.3.4 UV-Vis absorption analysis
Absorbance spectra between 200 and 800 nm of the water-soluble fraction were measured with a UV-Vis spectrophotometer (UV-1900i, Shimadzu). A 1 cm path-length quartz cell was used, and baseline correction was performed with Milli-Q water before analysis, according to Yamashita et al. (2013). Absorption coefficient (Absλ) at a wavelength (λ) was calculated with Eq. (2), following Wu et al. (2019),
where Aλ is the absorbance at wavelength (λ), and A700 is the average absorbance value between 695 and 705 nm and is used to reduce the errors caused by baseline drift. Vw (ml) is the volume of extraction, Va (m3) refers to the volume of air sampled through the filter during the sampling, and L (m) is the optical length (0.01 m). In this study, a wavelength of 365 nm, which has minimal absorption by inorganic substances in the water extract, was used as a quantitative parameter of light-absorbing organic aerosols (Hecobian et al., 2010).
2.3.5 Concentration of inorganic ions and methanesulfonic acid
The concentrations of inorganic ions (i.e., Cl−, NO, SO, Na+, NH, K+, Mg2+, Ca2+) and MSA in the water-soluble fraction of the aerosol samples were determined by using an ion chromatograph (IC) (761 Compact IC, Metrohm) (Miyazaki et al., 2016). Anions were measured using an IC column (A Supp 5-150/4.0, Metrohm) equipped with a suppressor using an eluent (3.2 mM Na2CO3, 1.0 mM NaHCO3). An IC column (Metrosep C 4-250/4.0, Metrohm) with an eluent (1.7 mM HNO3, 0.7 mM 2,6-pyridinedicarboxylic acid) was used for cation analysis. Calibration curves were constructed using standard solutions of the target ions and MSA.
Sodium is assumed to originate entirely from sea salt, and the non-sea-salt (nss) ion concentrations (ng m−3) are determined using Eq. (3) based on the average seawater composition (Frank et al., 2008).
Here, the (SO/Na+)seawater is 0.252, the (Ca2+/Na+)seawater is 0.038, and the (K+/Na+)seawater is 0.037.
2.4 Statistical analysis
The Pearson correlation coefficient was used to assess the correlations between parameters. For seasonal comparisons, the non-parametric Kruskal–Wallis rank test and Dunn's test were used. All statistical tests were conducted at a 5 % significance level. All analyses were performed using the R platform (R Core Team, 2023).
2.5 Positive matrix factorization
The Positive Matrix Factorization (PMF) 5.0 model of the United States Environmental Protection Agency (EPA) was used to identify the source of WSPyC in aerosols collected in this study. PMF is a method for decomposing multiple sets of observational data into several factors, simultaneously deriving statistical information known as factor contributions and factor profiles (Paatero and Tapper, 1994). The PMF model was carried out according to the manual (Norris et al., 2014). The model was run multiple times with varying numbers of factors until stable solutions were obtained. The uncertainty was increased threefold for MSA, which showed low reproducibility in the model.
2.6 Air mass back trajectories
The 3 d HYSPLIT backward trajectories of air masses arriving in Sapporo at an altitude of 50 m at the time of sample collection and every 24 h prior were calculated and downloaded from the National Oceanic and Atmospheric Administration (NOAA) website (https://www.ready.noaa.gov/HYSPLIT_traj.php, last access: 8 February 2026). The meteorological data were obtained from the GDAS 1° archive provided by the Air Resources Laboratory (ARL) (https://www.ready.noaa.gov/archives.php, last access: 8 February 2026). All the results are shown in Fig. S2. To simplify the results of the backward trajectory analysis, the trajectories generated for each season were grouped using the clustering function in the HYSPLIT model and represented by a limited number of mean trajectories (clustered trajectories) calculated by the model. The number of mean trajectories was determined at the point just before the standard change in total spatial variance (TSV) increased sharply.
3.1 Carbonaceous parameters
WSPyC concentration was 1.41–46.5 ng C m−3 (mean: 13.7±10.6 ng C m−3), with the peak measured in autumn. The mean WSPyC concentration in summer (4.26±2.31 ng C m−3) was significantly lower (p<0.05) than those in other seasons (spring mean: 16.5±10.5 ng C m−3, autumn mean: 14.3±12.4 ng C m−3, winter mean: 18.0±7.5 ng C m−3) (Figs. 2a and S3a). OC concentrations varied between 0.53 and 4.57 µg C m−3, except for the extremely high level observed during the Asian dust event (9.78 µg C m−3). The mean value, including the dust sample, was 2.35±1.36 µg C m−3, with the highest mean value observed in spring. The mean concentration of OC in spring (3.04±0.89 µg C m−3) was approximately three times higher than that in winter (1.09±0.31 µg C m−3), which was the lowest mean concentration. OC concentration in winter was relatively low compared to other seasons (p<0.05) (Figs. 2b and S3b). WSOC concentrations varied between 0.40 and 3.48 µg C m−3 (mean: 1.15±0.55 µg C m−3), with the highest concentrations observed in the Asian dust sample. The mean concentration of WSOC in spring (mean: 1.56±0.48 µg C m−3) was significantly higher (p<0.05) than in autumn (mean: 1.03±0.35 µg C m−3) and winter (mean: 0.78±0.25 µg C m−3), but not in summer (mean: 1.08±0.30 µg C m−3) (Figs. 2c and S3c). EC concentration was 0.079–1.01 µg C m−3 (mean: 0.40±0.22 µg C m−3) during the observation period, with the highest concentration occurring in winter. The mean concentration of EC in summer (0.20±0.06 µg C m−3) was significantly lower (p<0.05) compared to the other seasons (spring mean: 0.44±0.16 µg C m−3, autumn mean: 0.53±0.24 µg C m−3, winter mean: 0.43±0.23 µg C m−3). The EC concentration in the Asian dust sample (0.63 µg C m−3) was not different from the other samples in spring (Figs. 2d and S3d). Abs365 was 0.14–2.71 Mm−1 (mean: 0.51±0.40 Mm−1) during the observation period, and the highest value was observed during the Asian dust event. The mean value of Abs365 in spring (0.70±0.30 Mm−1) was significantly higher (p<0.05) than in summer (mean: 0.29±0.09 Mm−1) and autumn (mean: 0.40±0.26 Mm−1), but not in winter (mean: 0.51±0.15 Mm−1) (Figs. 2e and S3e).
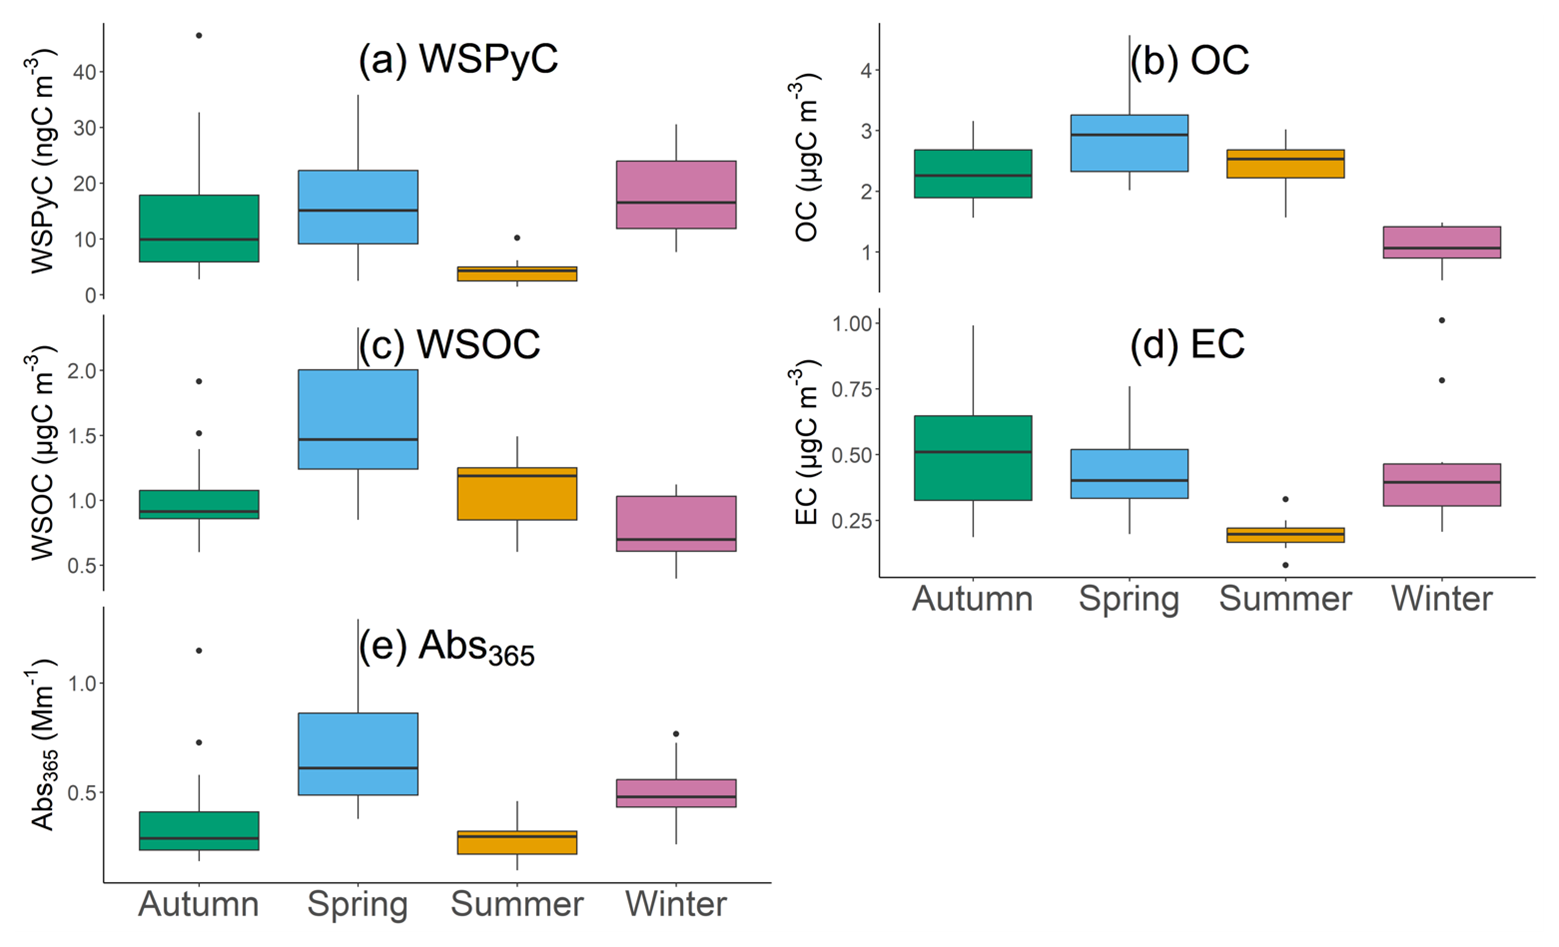
Figure 2Box-and-whisker plots of the concentration of (a) WSPyC, (b) OC, (c) WSOC, (d) EC, and (e) Abs365 for each season (excluding dust sample from spring).
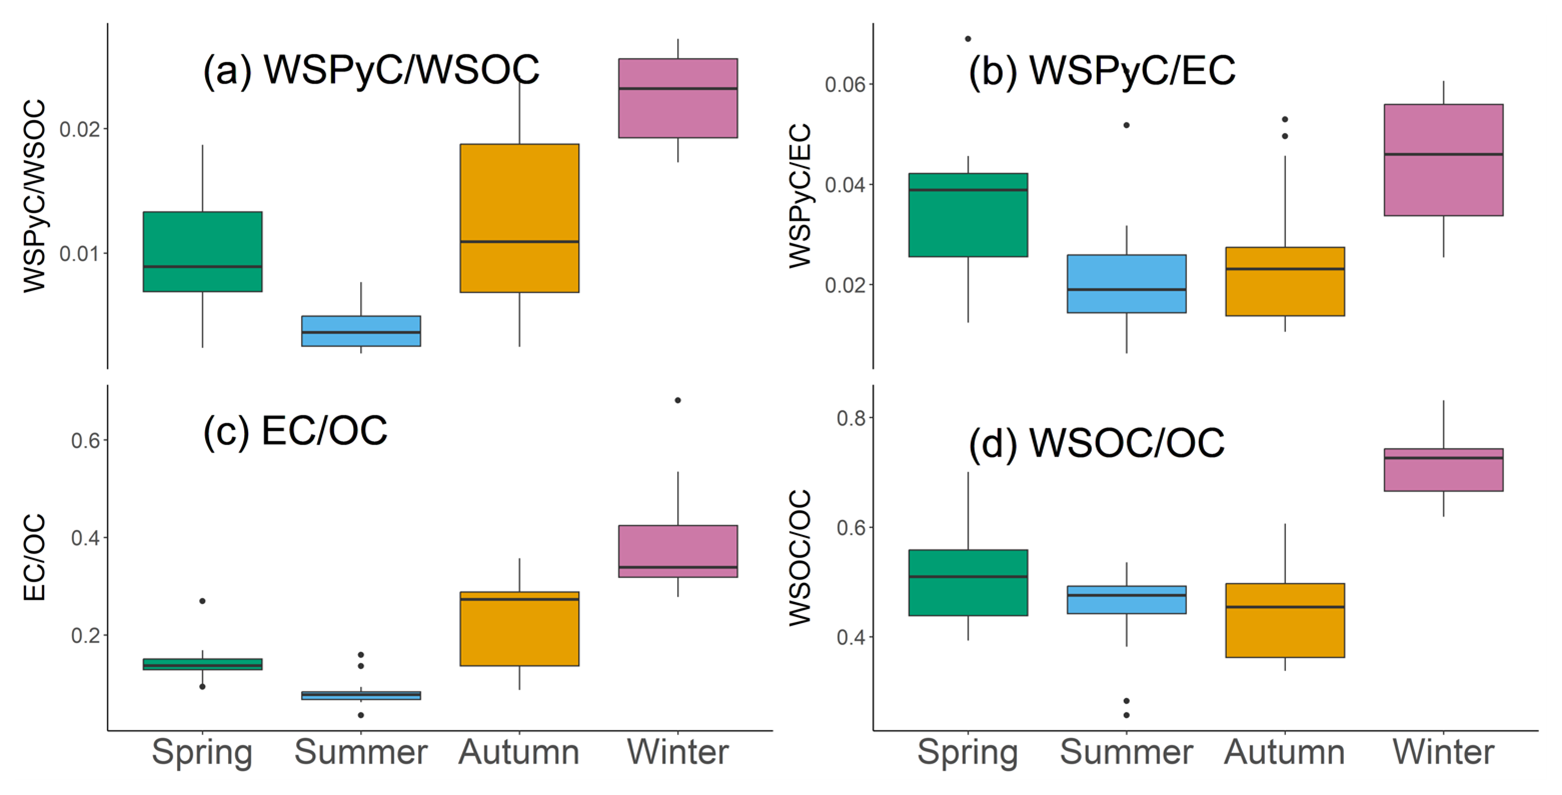
Figure 3Box-and-whisker plots of the ratio of (a) WSPyC WSOC, (b) WSPyC EC, (c) EC OC, and (d) WSOC OC for each season (excluding dust sample from spring).
WSPyC WSOC and WSPyC EC ratios have been reported to increase under the influence of biomass burning, because biomass burning occurs at relatively low temperatures, it tends to promote the formation of less-condensed aromatic structures, such as WSPyC, compared to EC (Geng et al., 2021). WSPyC WSOC ratio was 0.002–0.027 (mean: 0.012±0.01). The mean value of WSPyC WSOC in winter was 0.023±0.003 and was significantly higher (p<0.05) than in autumn (0.013±0.007), spring (0.010±0.005), and summer (0.004±0.003), in that order (Figs. 3a and S4a). WSPyC EC ratio was observed with a range from 0.0063 to 0.069 (mean: 0.033±0.017). The seasonal mean in winter (mean: 0.044±0.013) was significantly higher (p<0.05) than in autumn (mean: 0.026±0.014) and summer (mean: 0.024±0.016), and roughly twice the summer value (Figs. 3b and S4b).
The EC OC ratio is commonly used as an indicator of urban air quality, with higher values suggesting a more substantial influence from fossil fuel combustion (Chen and Xie, 2014). The EC OC ratio varied between 0.036 and 0.68 (mean: 0.21±0.14). The seasonal mean of the ratio in winter (0.42±0.14) was significantly higher (p<0.05) than in spring (0.16±0.05), summer (0.09±0.03), and autumn (0.27±0.13). The winter mean was approximately five times higher than the summer mean (Figs. 3c and S4c). The WSOC OC ratio is used as an indicator of secondary organic aerosols (SOA) (Miyazaki et al., 2006; Kondo et al., 2007). WSOC OC ratio was 0.26–0.83 (mean: 0.52±0.14) during the observational period. The seasonal mean value was highest in winter (0.77±0.06) (p<0.05). There were no significant differences in the mean values among the other seasons (spring: 0.58±0.10, summer: 0.48±0.09, fall: 0.52±0.20) (Figs. 3d and S4d).
3.2 Inorganic ions and methanesulfonic acid concentrations
Inorganic ions and MSA concentrations are used to assess the source of aerosols. Figure 4 shows the seasonal trends of inorganic ions and MSA concentrations observed in Sapporo as box-and-whisker plots. Figure S5 presents temporal variations. In spring, the highest concentrations were observed for total ions, MSA, NO, nss-SO, nss-Ca2+, and nss-K+, and their seasonal mean concentrations were also the highest (excluding the dust sample). During the dust event, the highest concentrations were observed for Cl−, MSA, Na+, nss-K+, nss-Ca2+, and Mg2+ (Fig. S5). In summer, the mean concentrations of total ions and many individual ion species (Cl−, NO, nss-K+) were at their lowest. In contrast, mean concentrations of MSA and nss-SO in summer were higher than in autumn and winter. In autumn, no ion species showed particularly high concentrations. In winter, mean concentrations of total ions and NO were higher than in summer and autumn and were similar to those in spring. Furthermore, NH in winter showed the highest mean concentration. The mean concentration of nss-Ca2+ in winter was significantly lower than in other seasons.
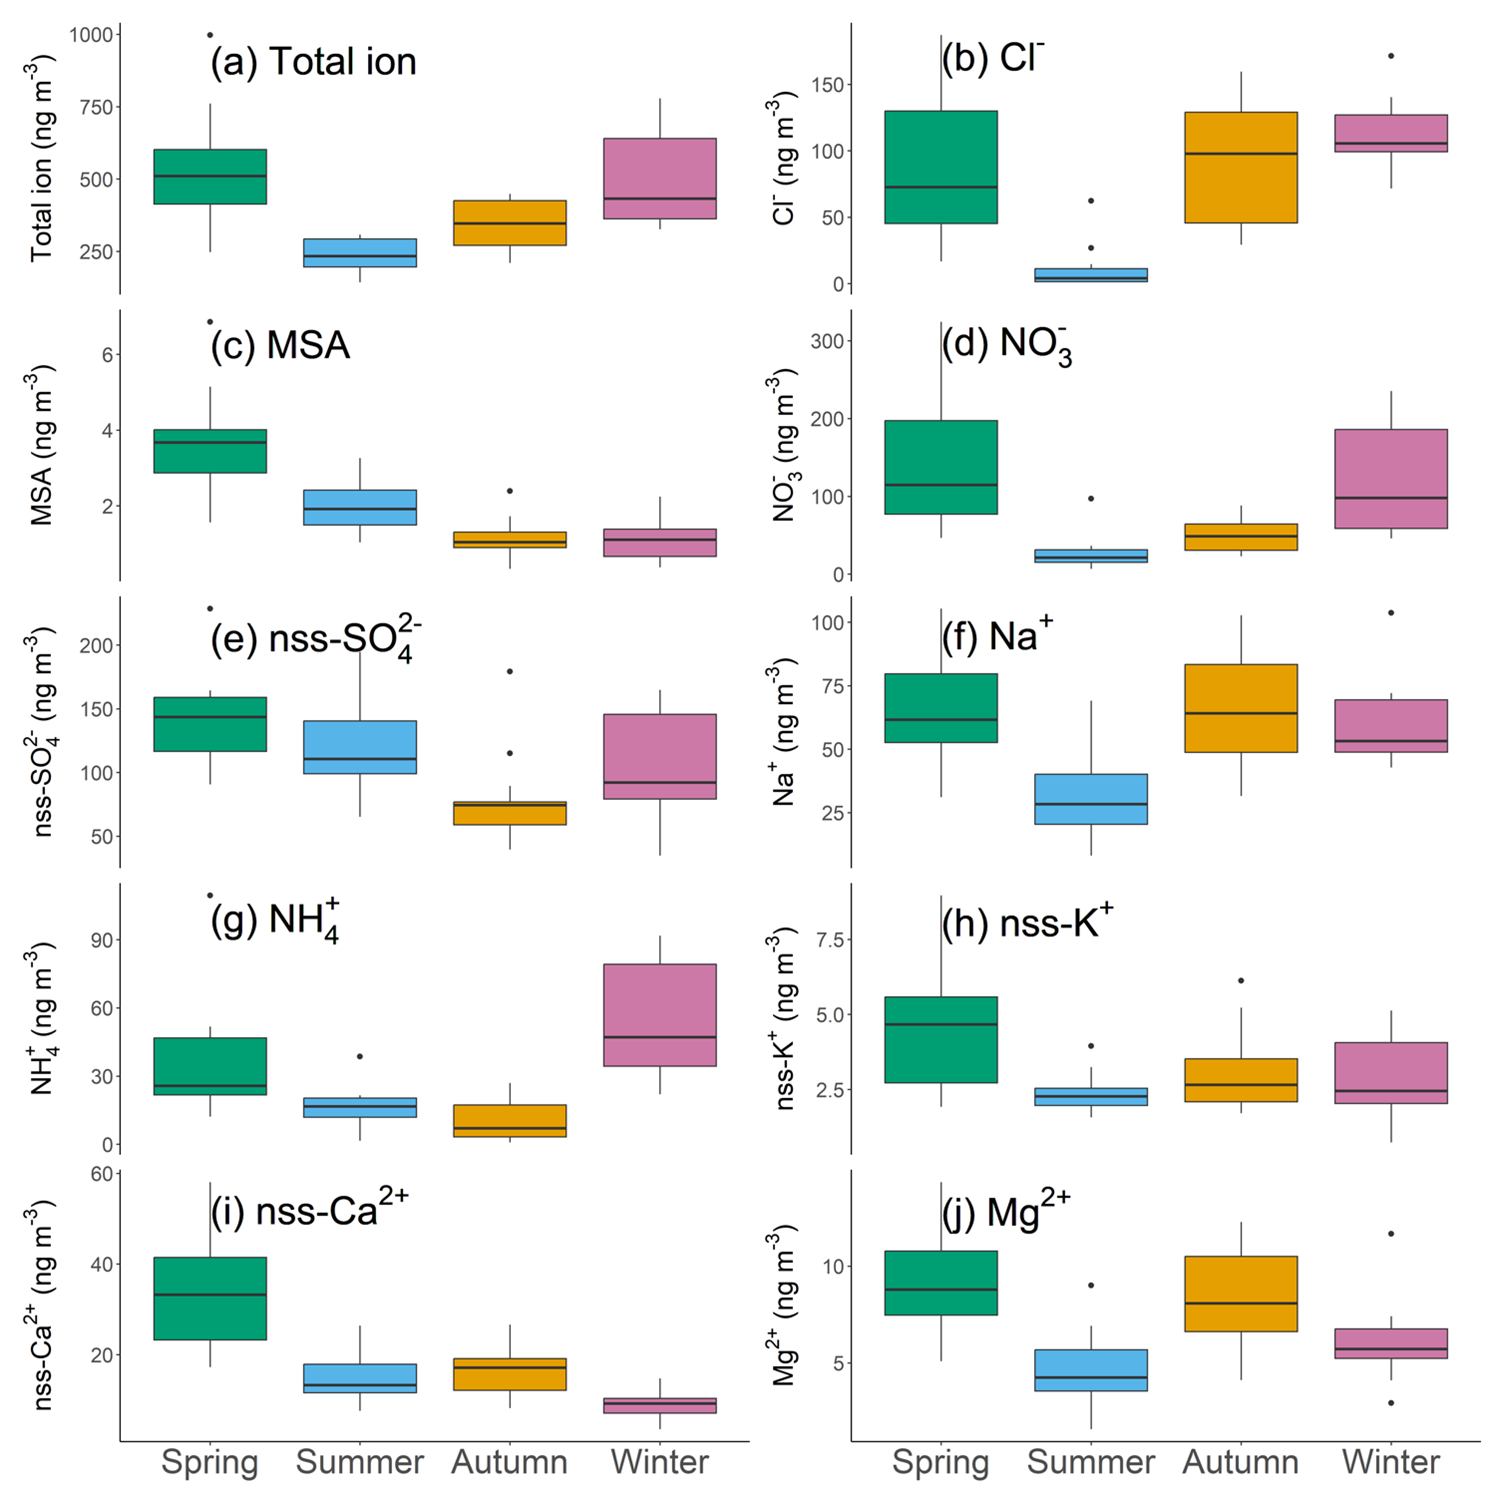
Figure 4Box-and-whisker plots of the concentration of (a) total ion, (b) Cl−, (c) MSA, (d) NO, (e) nss-SO, (f) Na+, (g) NH, (h) nss-K+, (i) nss-Ca2+, and (j) Mg2+ for each season (excluding dust sample).
3.3 Wind direction, speed, and air mass back trajectories
Wind direction, wind speed, and backward trajectories can help estimate the potential origin of the aerosols. Northwesterly and southeasterly winds were dominant in Sapporo throughout the observation period. In spring, the observed frequency of northwesterly and southeasterly winds was similar, while the northwesterly winds tended to have higher speeds than those of southeasterly winds (Fig. S6a). The air mass back trajectories showed that about half of the air masses came to Sapporo from the west (continental side) in spring (Fig. 5a). The Asian dust (yellow dust) event was observed during 12–13 April 2023 (Fig. 5b). In summer, southeasterly winds were dominant (Fig. S6c), and the back trajectories showed that air masses were often transported from the adjacent seas (Fig. 5c). The southeast winds were also dominant in autumn (Fig. S6d). The back trajectories showed that 66 % of the air masses in autumn were transported from the Eurasian continent (Fig. 5d). In winter, northwesterly winds with speeds exceeding 4 m s−1 were dominant (Fig. S6e), and the back trajectory also showed that most of the air masses came from the continent (Fig. 5e).
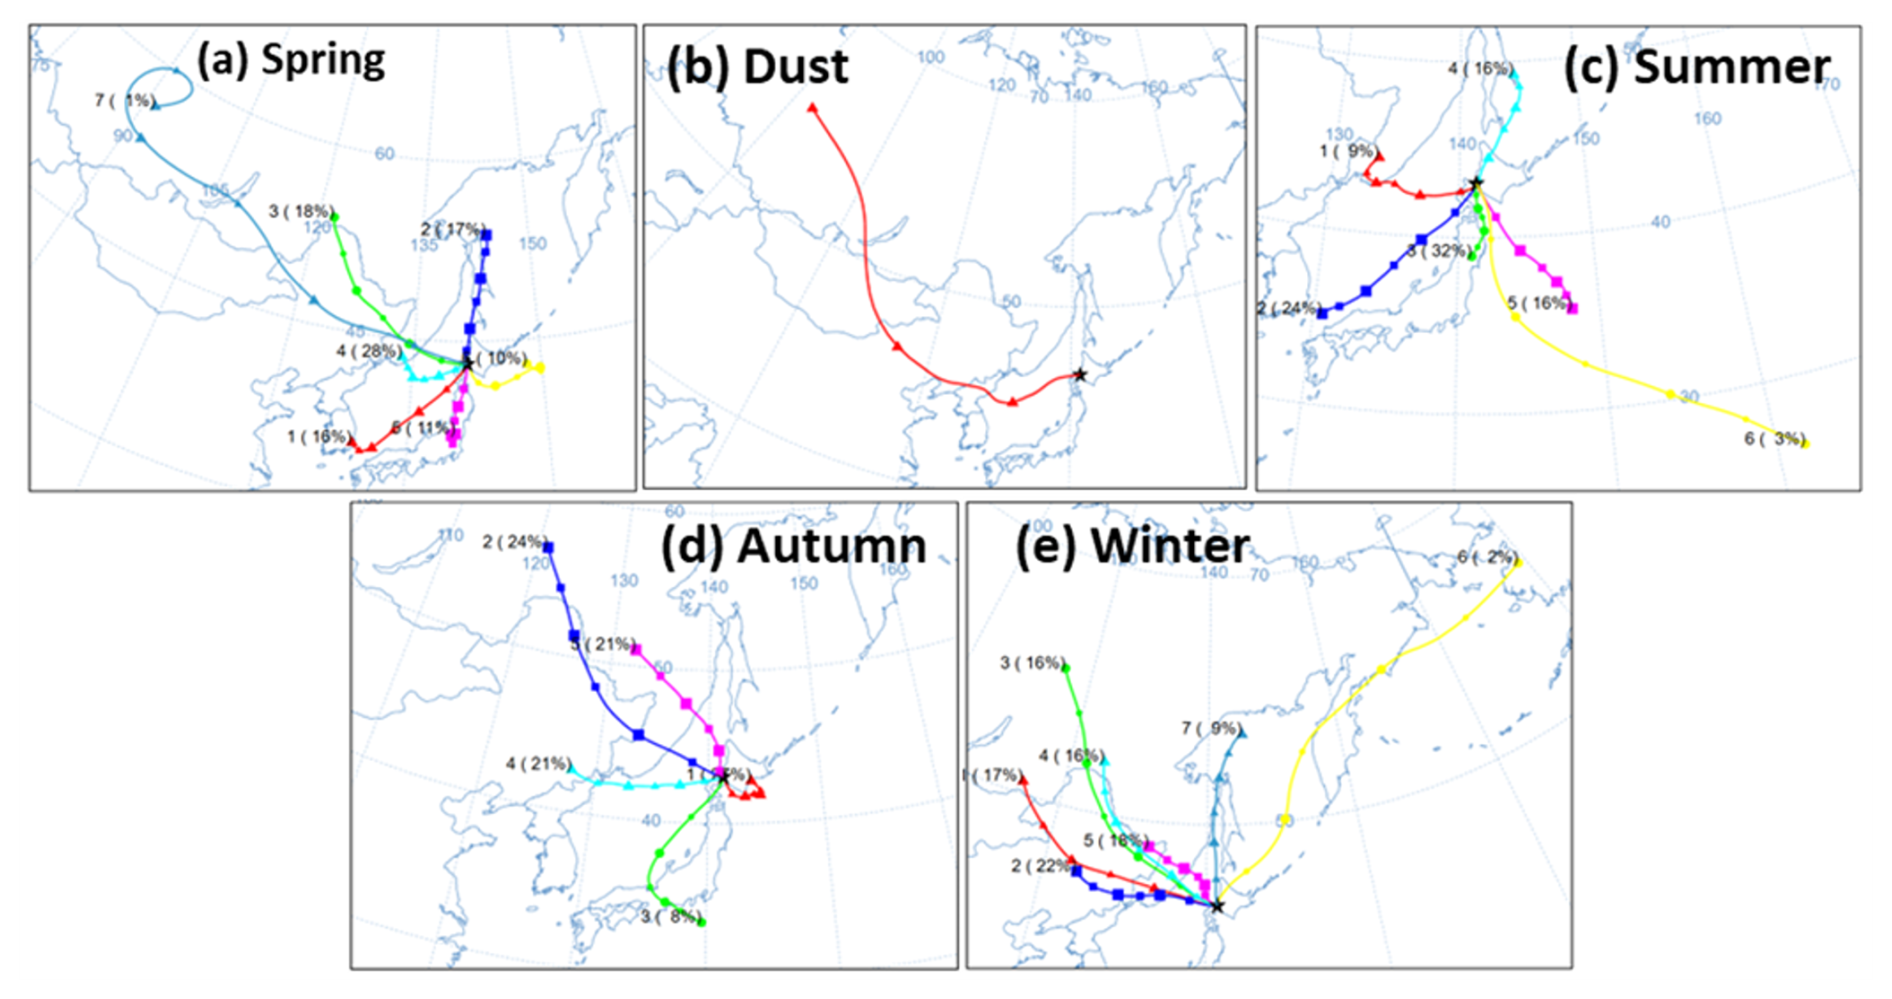
Figure 5The clustered 3 d back trajectories of air masses arriving in Sapporo, Hokkaido in (a) spring, (b) dust (12–13 April 2023), (c) summer, (d) autumn, (e) winter.
3.4 Correlation between WSPyC concentration and other parameters
Table 1 presents the Pearson correlation coefficients (R values) and p values, showing the relationship between WSPyC concentration and the levels of other parameters, such as carbonaceous components, inorganic ions, and MSA. These values are provided for each season and the entire observation period, including and excluding the Asian dust sample. Regardless of the inclusion of the Asian dust sample, there was a strong positive correlation (R>0.7, p<0.05) between WSPyC and nss-K+, EC, and Abs365 throughout the period. In spring, a strong positive correlation was observed between WSPyC and NO, nss-K+, Ca2+, OC, EC, WSOC, and Abs365. In summer, WSPyC was not highly correlated with any of the parameters. In autumn, WSPyC was strongly positively correlated with nss-K+, WSOC, and Abs365. In winter, there was a strong positive correlation of the WSPyC with NO, nss-SO, NH, nss-K+, OC, EC, and WSOC.
Table 1Pearson correlation coefficients (R values) between WSPyC concentration and each parameter.
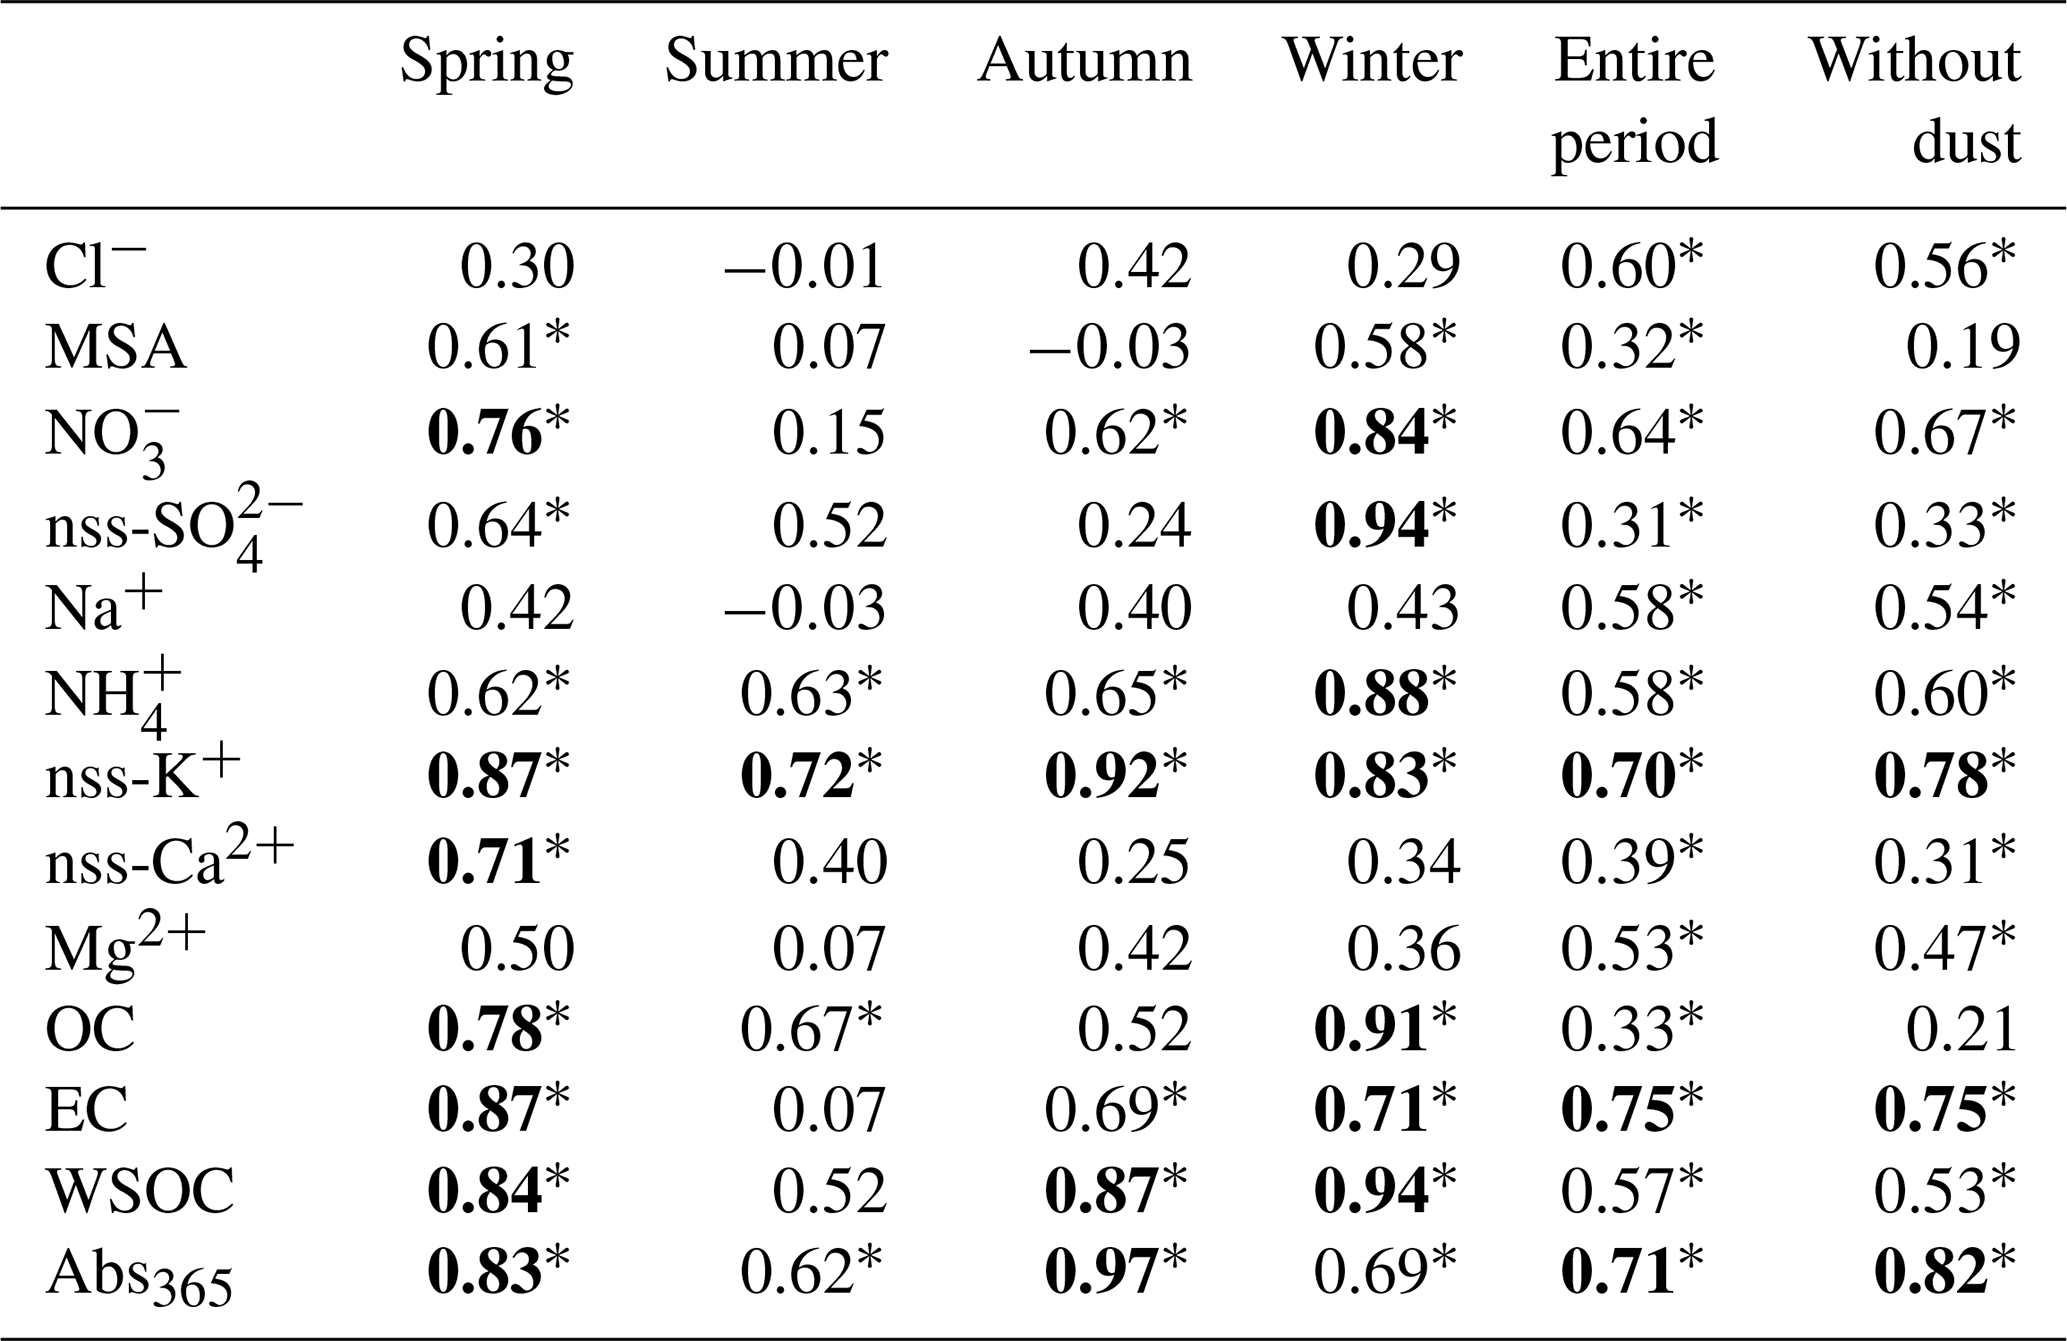
Bold indicates R>0.7, and * represents p<0.05.
4.1 Seasonal variations in WSPyC concentrations and their controlling factors
4.1.1 WSPyC concentration in aerosol collected in Sapporo
The concentrations of WSPyC in atmospheric aerosol observed in Sapporo varied seasonally, with lower concentrations in summer and no significant differences in other seasons (Fig. 2a). The concentrations of WSPyC observed in this study were similar to those observed in the open ocean of the western North Pacific Ocean (Bao et al., 2017). On the other hand, the observed concentrations were lower than those observed in Bachok, Malaysia (Geng et al., 2021), Xiamen, China (Zhang et al., 2023a), the China coastal seas (Bao et al., 2017), and the Asian dust samples collected in the western North Pacific Ocean (Bao et al., 2017). The concentration of WSPyC in the dust sample collected in this study was approximately at the first quartile of the Asian dust samples collected in the western North Pacific Ocean (Bao et al., 2017) (Fig. 6). The comparison with previous studies suggests that the local emission of WSPyC around the study region (Sapporo, Japan) was relatively low compared to the earlier studies in China and Malaysia.
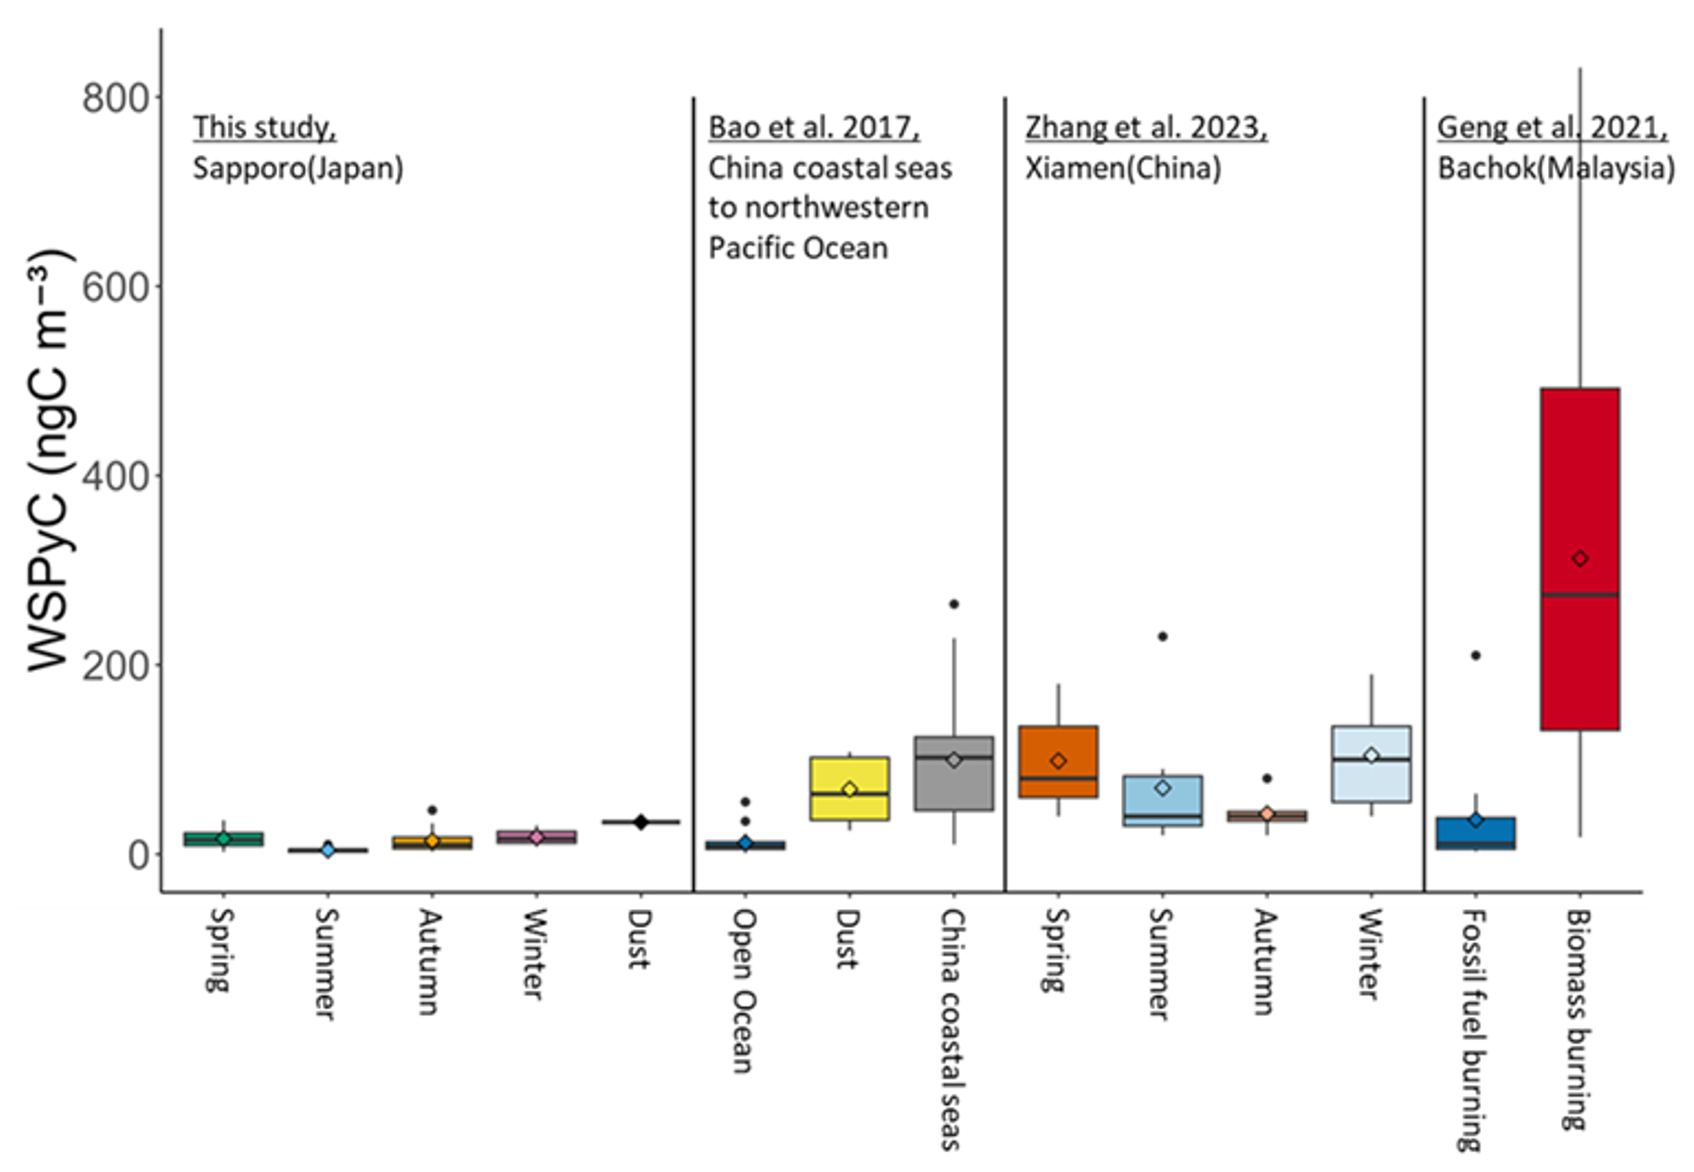
Figure 6Comparison of the WSPyC concentrations in aerosols collected in Sapporo with those of previous studies.
The WSPyC WSOC and WSPyC EC observed in Sapporo fell within the range previously reported for aerosols influenced by fossil fuel combustion which were lower than those influenced by biomass burning (Figs. 7 and 8). WSPyC WSOC of the Asian dust sample was one-third of that observed in the Asian dust samples collected in the western North Pacific Ocean (Bao et al., 2017). Variations in the WSPyC concentrations, WSPyC WSOC, and WSPyC EC have also been reported to be controlled not only by their sources but also by atmospheric aging processes and meteorological conditions (e.g., precipitation frequency and air temperature) (Zhang et al., 2023a). For example, the susceptibility to wet deposition varies depending on particle size and hydrophobicity, with EC being relatively less prone to removal (Sonwani and Kulshrestha, 2019; Petters et al., 2006; Weingartner et al., 1997). The atmospheric aging processes include the production of WSPyC from soot via photodegradation (Li et al., 2019, 2022; Roebuck et al., 2017; Decesari et al., 2002). The photodegradation of WSPyC, and the formation of water-soluble secondary organic aerosols (SOA) through the photochemical oxidation of water-insoluble organic carbon (WIOC) and volatile organic compounds (VOCs) (Lim et al., 2019; Grieshop et al., 2009; Zhang et al., 2023b; Dzepina et al., 2011). Thus, the WSPyC WSOC and WSPyC EC ratios observed in Sapporo are also likely influenced by the atmospheric aging processes of continental origin during long-range transport.
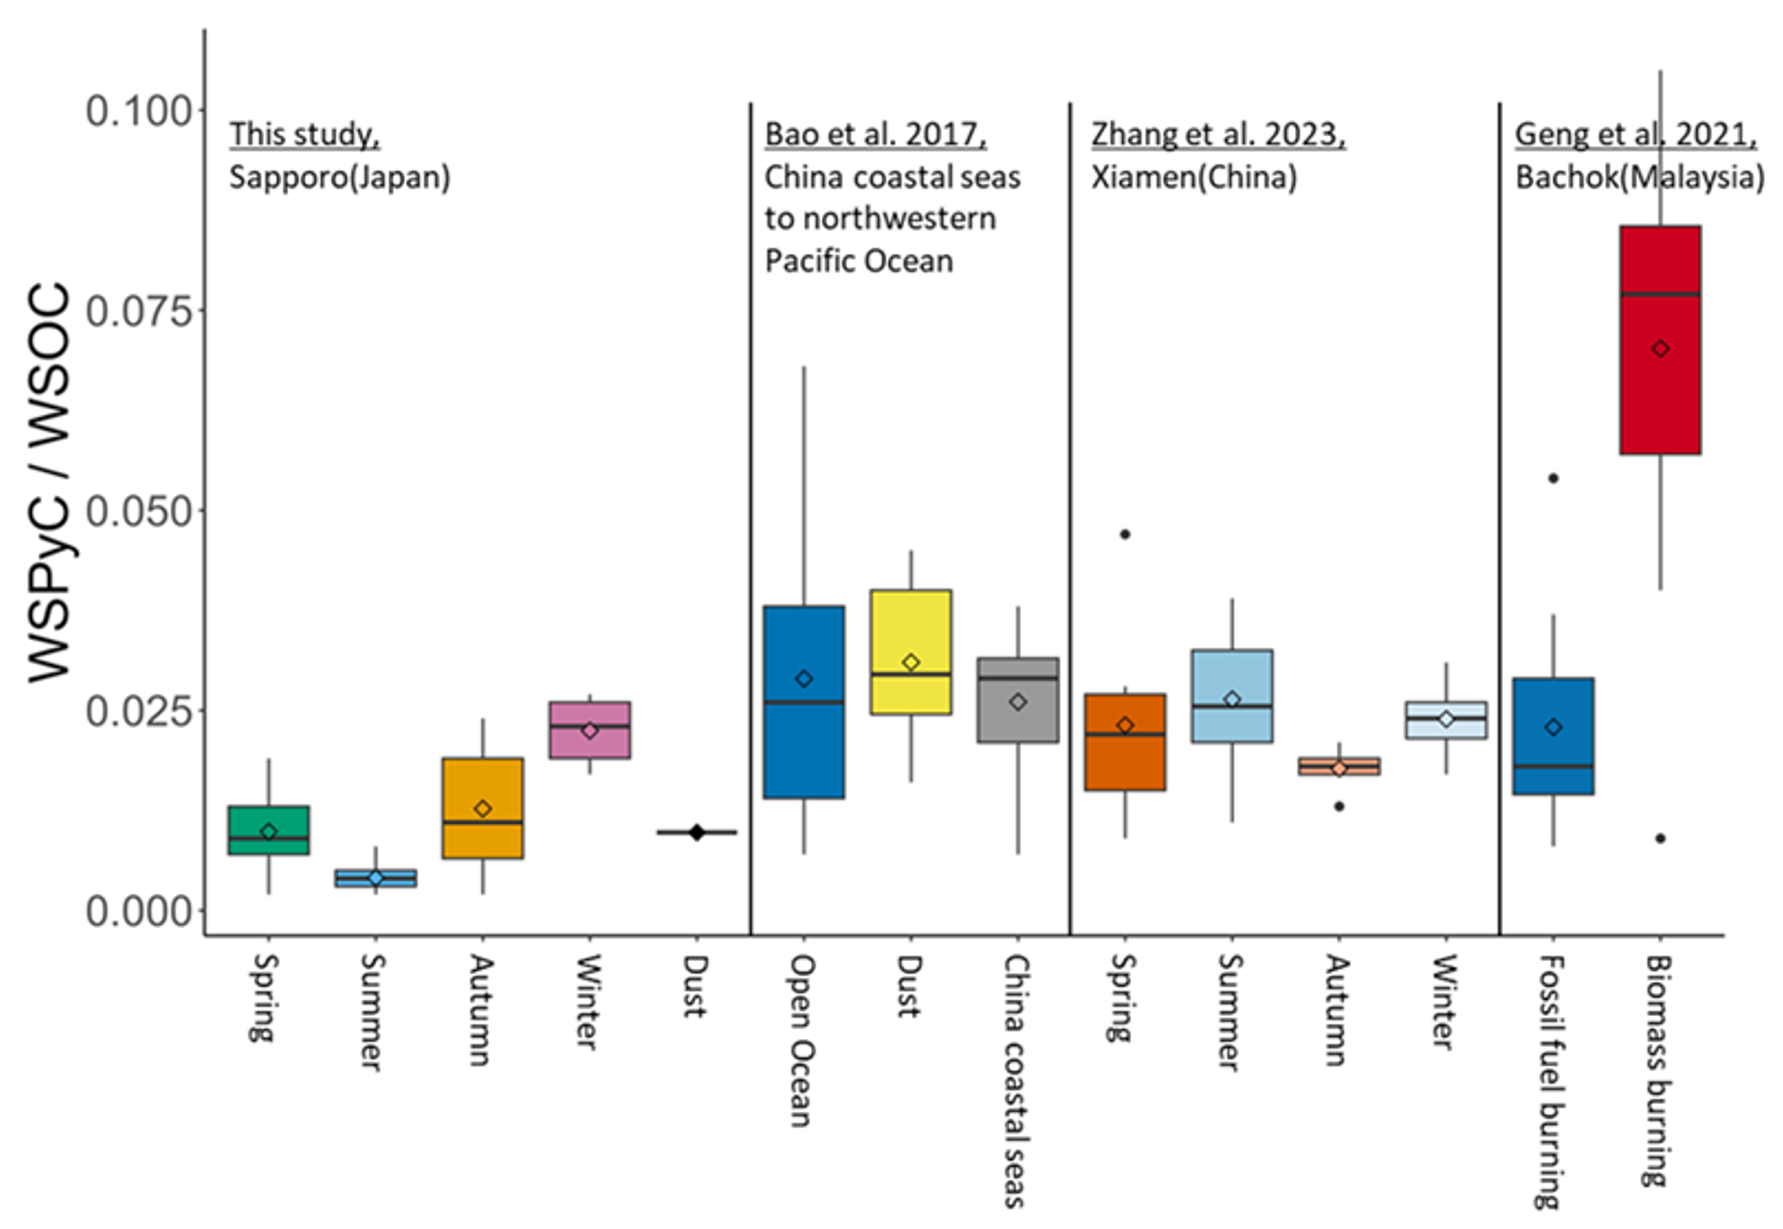
Figure 7Comparison of the WSPyC WSOC ratio of aerosols collected in Sapporo with that of previous studies.
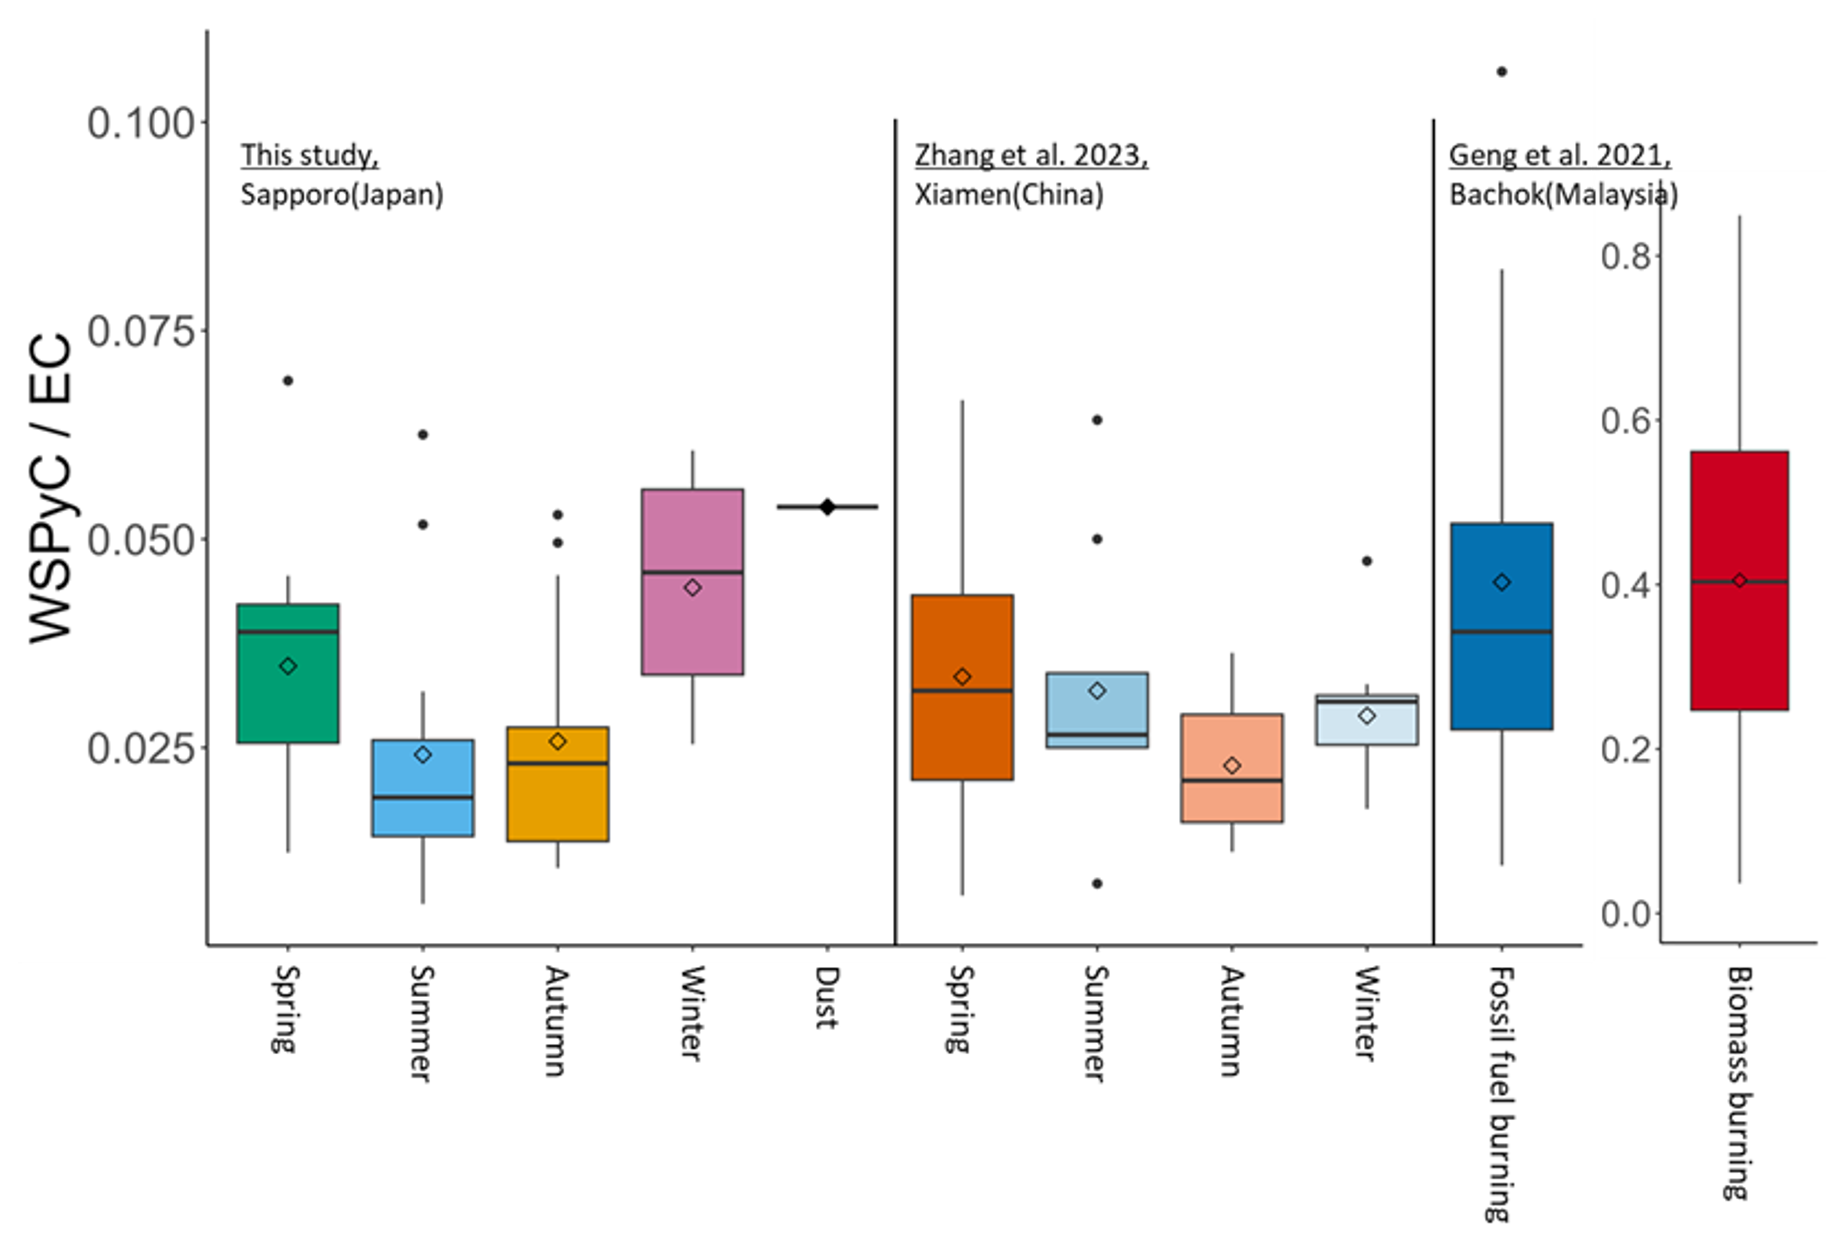
Figure 8Comparison of the WSPyC EC ratio of aerosols collected in Sapporo with that of previous studies. The y axis scale for biomass burning (Bachok, Malaysia) differed from the others.
The WSPyC concentrations observed in this study showed strong correlations with nss-K+, EC, and Abs365 levels throughout the year (Table 1). The nss-K+ is widely used as a tracer of biomass burning, including landscape fire and biofuel combustion (Chow et al., 2004; Pant and Harrison, 2012). EC is emitted from various combustion activities. In urban areas of the US and Europe, EC is primarily (>70 %) derived from transportation-related emissions such as the use of diesel and gasoline (Briggs and Long, 2016). However, biomass (e.g., wood) burning contributes more than 50 % of EC emissions in winter in rural and background areas of Europe (Briggs and Long, 2016). Similarly, in Hebei, northern China, 38 % of annual EC emissions were reported to originate from transportation, 30 % from biomass burning, and 25 % from coal combustion (Hou et al., 2022). Although the source of EC in Sapporo has not been well documented, it is also likely to originate from both fossil fuel combustion and biomass (including biofuels) burning in both local and remote regions (Aggarwal and Kawamura, 2008; Ohta and Okita, 1990). Abs365, an indicator of water-soluble brown carbon (WS-BrC), was also reported to be emitted from both biomass burning and fossil fuel combustion, with higher levels of aerosols from biomass burning than fossil fuel combustion (Wu et al., 2019). Considering strong correlations of WSPyC with these tracers of combustion activities throughout the year (Table 1), WSPyC observed at Sapporo was most likely a mixture of combustion-derived aerosols from both biomass burning and fossil fuel combustion. The correlation coefficients between concentrations of WSPyC and levels of nss-K+, EC, and Abs365 varied by season, possibly due to seasonal differences in major factors controlling the WSPyC concentration (Table 1).
4.1.2 Spring
In spring, wind and backward trajectory analyses indicated the influence of continental air masses (Figs. 5a and S6b). The seasonal mean concentration was the highest for several ionic species and carbonaceous parameters. WSPyC concentration in spring was significantly correlated to NO, nss-K+, OC, WSOC, EC, and Abs365, and well correlated with nss-SO, and NH (Table 1). As mentioned above, nss-K+ and Abs365 are mainly derived from biomass burning, whereas EC is likely to be derived from both biomass burning and fossil fuel combustion. It has been reported that the EC OC ratio of aerosols from biomass burning is relatively low compared to fossil fuel combustion. For example, 0.09–0.1 for wheat and corn residue burning (Li et al., 2009) and 0.12–0.2 for aerosols mainly from biomass burning in China (Chen and Xie, 2014; Tao et al., 2013). The mean EC OC ratio of spring in this study was 0.15±0.04, suggesting that biomass burning is likely one of the major sources of WSPyC in spring in Sapporo.
Sulfate (SO), NO, and NH (collectively SNA) are secondary inorganic aerosols, and their concentrations depend on the concentrations of precursor gases and transformation rates in the atmosphere (Xu et al., 2017). NOx, the precursor gas of NO, is primarily emitted from vehicle exhaust, while SO2, the precursor gas of SO, is mainly emitted from coal combustion (Zhang et al., 2012). Globally, approximately 60 % of ammonia emissions originate from livestock and fertilizers (Bouwman et al., 1997). Still, in urban areas of China, it is suggested that non-agricultural sources, such as vehicle exhaust, contribute significantly to emissions of ammonia (Chen et al., 2022). SNA primarily occur as ammonium sulfate and ammonium nitrate. Because ammonium nitrate volatilizes at high temperatures, its formation is enhanced under low-temperature conditions (<15 °C) (US EPA, 1999). Sulfate formation occurs through gas-phase oxidation via photochemical reactions and aqueous-phase oxidation, which is influenced by factors such as relative humidity (Seinfeld and Pandis, 2016). The spring conditions (i.e., relatively low temperature and high solar radiation) are favourable for the formation of SNA from precursor gases emitted from the fossil fuel combustion. Therefore, in addition to the origin of biomass burning, the correlations with WSPyC and SNA in spring imply that the WSPyC is produced by atmospheric aging processes, specifically the photochemical oxidation of soot (Han et al., 2012; Li et al., 2018), emitted from fossil fuel combustion.
The WSPyC concentration in spring also showed a strong correlation with nss-Ca2+. The nss-Ca2+ is widely used as a tracer of soil particles (Nakamura et al., 2020), and nss-Ca2+ in the Asian dust sample was remarkably highest among the samples in this study (Fig. S5i). The strong correlation between WSPyC and nss-Ca2+ in spring suggests that the prevailing westerly winds likely transport soil particles and combustion-derived WSPyC from the continent. Bao et al. (2017) measured WSPyC concentrations in aerosol samples collected in the open ocean of the western North Pacific and reported that the concentrations were higher in aerosols affected by Asian dust storms, the result of which is similar to that in the current study.
4.1.3 Summer
In summer, backward trajectories indicated the majority of air masses derived from the ocean but not the continent (Fig. 5c). The mean concentrations of combustion-related tracers, i.e., nss-K+, EC, Abs365, and WSPyC, were lower in summer than in other seasons. Meanwhile, mean OC and WSOC concentrations in summer were the second highest after spring. It was reported that aerosols collected in Sapporo had higher concentrations of OC, WSOC, and biogenic SOA, including isoprene oxidation products, in summer compared to other seasons (Pavuluri et al., 2013; Budhavant et al., 2019). The relatively high OC and WSOC concentrations in summer aerosols observed in this study most likely reflect increased emissions of biogenic volatile organic compounds (BVOCs) and primary biological aerosol particles (i.e., WIOC) and their subsequent oxidation to WSOC. Therefore, the lower WSPyC WSOC ratio observed in summer compared to other seasons (Fig. 3a) suggests an increased contribution of non-combustion-derived (biogenic) aerosols. This greater contribution may obscure the relationships between WSPyC and other combustion tracers (nss-K+, EC, Abs365) (Table 1).
4.1.4 Autumn
In autumn, while the dominant wind direction was southeast, backward trajectories showed the influence of continental air masses (Figs. 5d and S6d). Such local wind data and air mass origin implied that both local and continental sources likely contributed to autumn aerosols. Mean EC concentrations were higher in autumn than in other seasons (Fig. 2d), and mean nss-K+ concentrations were the second highest after spring (Fig. 4h). The WSPyC concentrations in autumn were strongly correlated with nss-K+, Abs365, and WSOC (Table 1), suggesting that WSPyC is likely to originate mainly from biomass burning. However, the mean EC OC ratio in autumn (0.23±0.09) was higher than in spring (Fig. 3c). An increase in the EC OC ratio has been reported to be not only influenced by primary emission sources but also the formation of secondary organic carbon (SOC) (Pio et al., 2011; Plaza et al., 2011) and scavenging by precipitation (Huo et al., 2016). EC in aerosols is less susceptible to removal by rainfall than OC (Huo et al., 2016). The relatively high EC OC, an indication of the origin of fossil fuel combustion in autumn, may therefore be due to the selective scavenging of OC by precipitation. Although the meteorological conditions in autumn and spring were relatively similar in Sapporo, the total precipitation was higher in autumn (250 mm from September to November 2022) than in spring (118 mm from March to May 2023).
4.1.5 Winter
In winter, both local wind data and backward trajectories suggested that the air masses were strongly influenced by the continental source (Figs. 5e and S6e). The high WSPyC concentrations observed in winter are considered to reflect intensified combustion activities associated with heating use in continental and nearby regions. The highest WSOC OC ratio is typically observed in summer when photochemical activity is vigorous (Miyazaki et al., 2006; Kondo et al., 2007); however, in this study, it was observed in winter (Fig. 3d). This may be attributed not only to the contribution of primary combustion-derived WSOC but also to enhanced SOA formation driven by long-range transport from the continent and the accumulation of aerosols under stable atmospheric conditions. Similarly, the formation of WSPyC through the oxidation of soot may have occurred and contributed to the high WSPyC concentrations observed in winter. The WSPyC concentrations were strongly correlated with NO, nss-SO, NH, and EC in winter (Table 1), confirming that a major factor controlling the WSPyC concentration in winter in Sapporo was the atmospheric aging processes of aerosols originating from fossil fuel combustion. The WSPyC was also strongly correlated with nss-K+ and well correlated with Abs365 (Table 1), suggesting that winter WSPyC in Sapporo is likely derived from biomass burning in addition to fossil fuel combustion.
4.2 Source apportionment of WSPyC by PMF
A PMF analysis resolved six interpretable factors contributing to the observed WSPyC concentration (Fig. 9). F1 was characterized by substantial contributions of Cl−, Na+, and Mg2+ (>48 %), indicating a marine primary origin and defined as “marine PA”. F2 was dominated by MSA, nss-SO, OC, and WSOC (>27 %), which was defined as “marine secondary organic aerosols (SOA)”. F3, with a large contribution of nss-Ca2+ (70 %), was defined as “soil and mineral dust”. F4 was attributable to WSOC, Abs365, nss-K+, and EC (21 %–44 %). Because nss-K+ is known to originate from biomass and biofuel burning (Chow et al., 2004; Pant and Harrison, 2012), F4 is defined as “potassium-dominated combustion” sources primarily influenced by biomass and biofuel burning. F5 showed the largest contribution of NO (62 %), followed by NH (46 %), and defined as “nitrate-dominated combustion” source. F6 was dominated by nss-SO and NH (>40 %) with minor contributions of WSOC and Abs365 (15 %–21 %), which is defined as “sulfate-dominated combustion” source. NOx is precursor gas species of NO, which is emitted from various anthropogenic combustion activities, such as mobile sources (e.g., traffic and ships) being particularly prominent (Geng et al., 2024; Ni et al., 2024). SO2 is precursor gas species of SO, which primarily originates from coal combustion in factories and power plants (Lin et al., 2022). Therefore, F5 and F6 indicate the aerosols associated with combustion sources that had undergone atmospheric ageing processes.
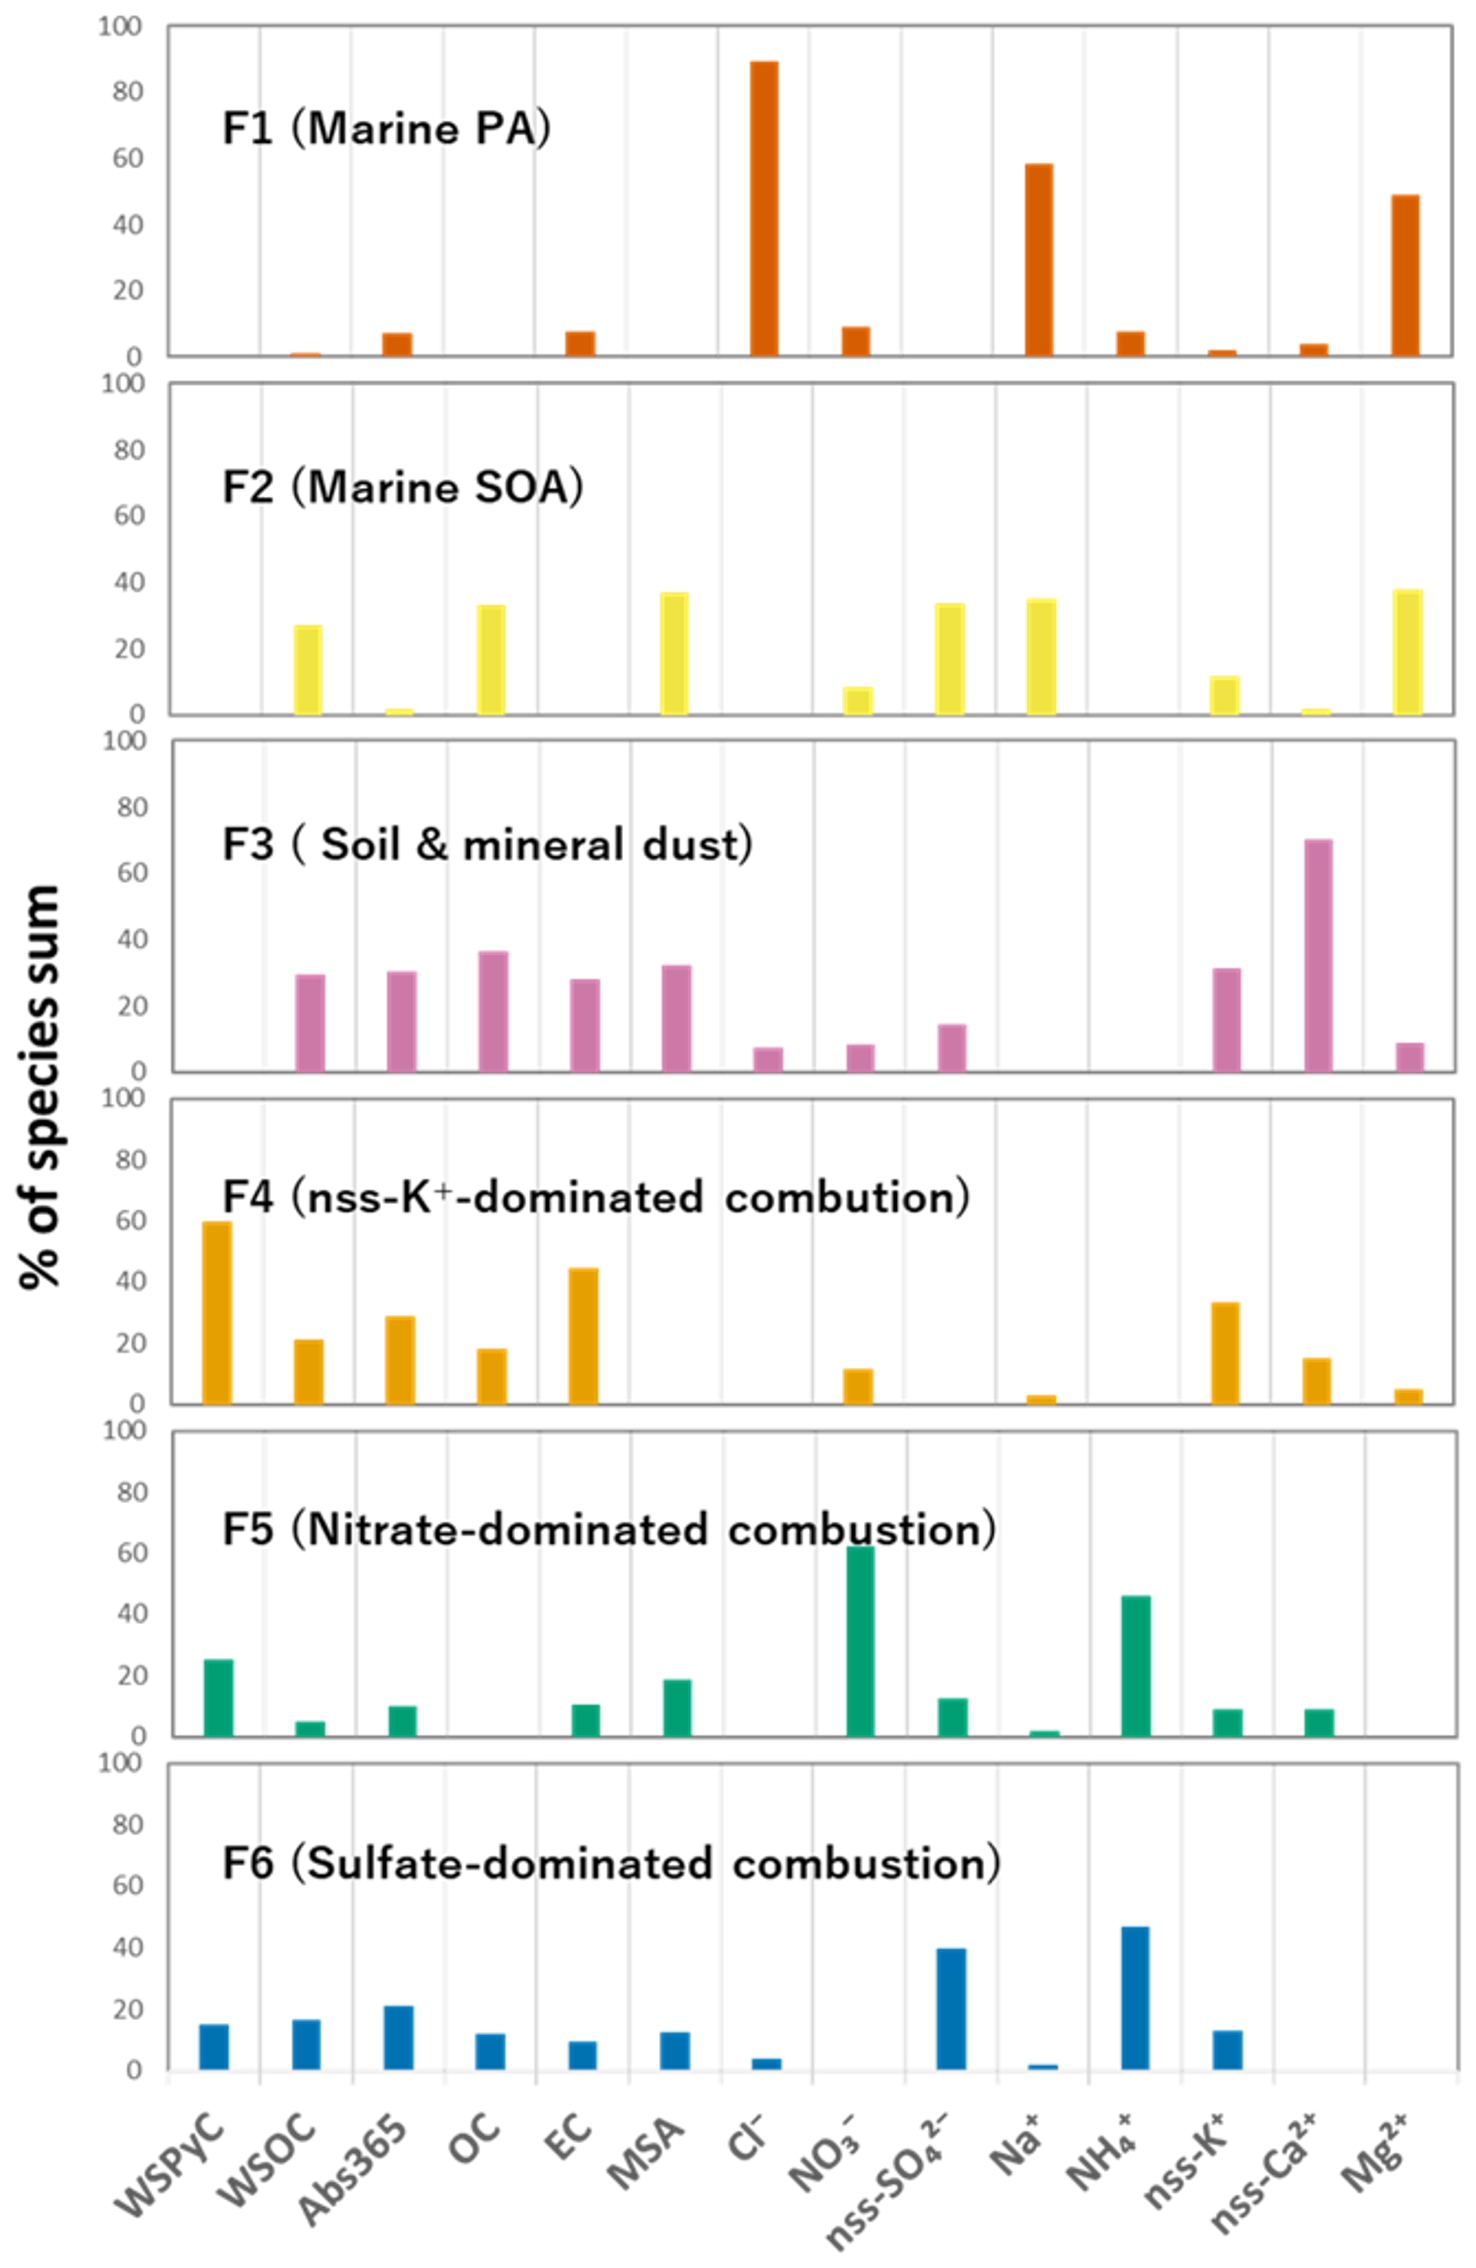
Figure 9Six factors (F1–F6) obtained from the PMF analysis. The boxes represent the contribution of each factor to the components.
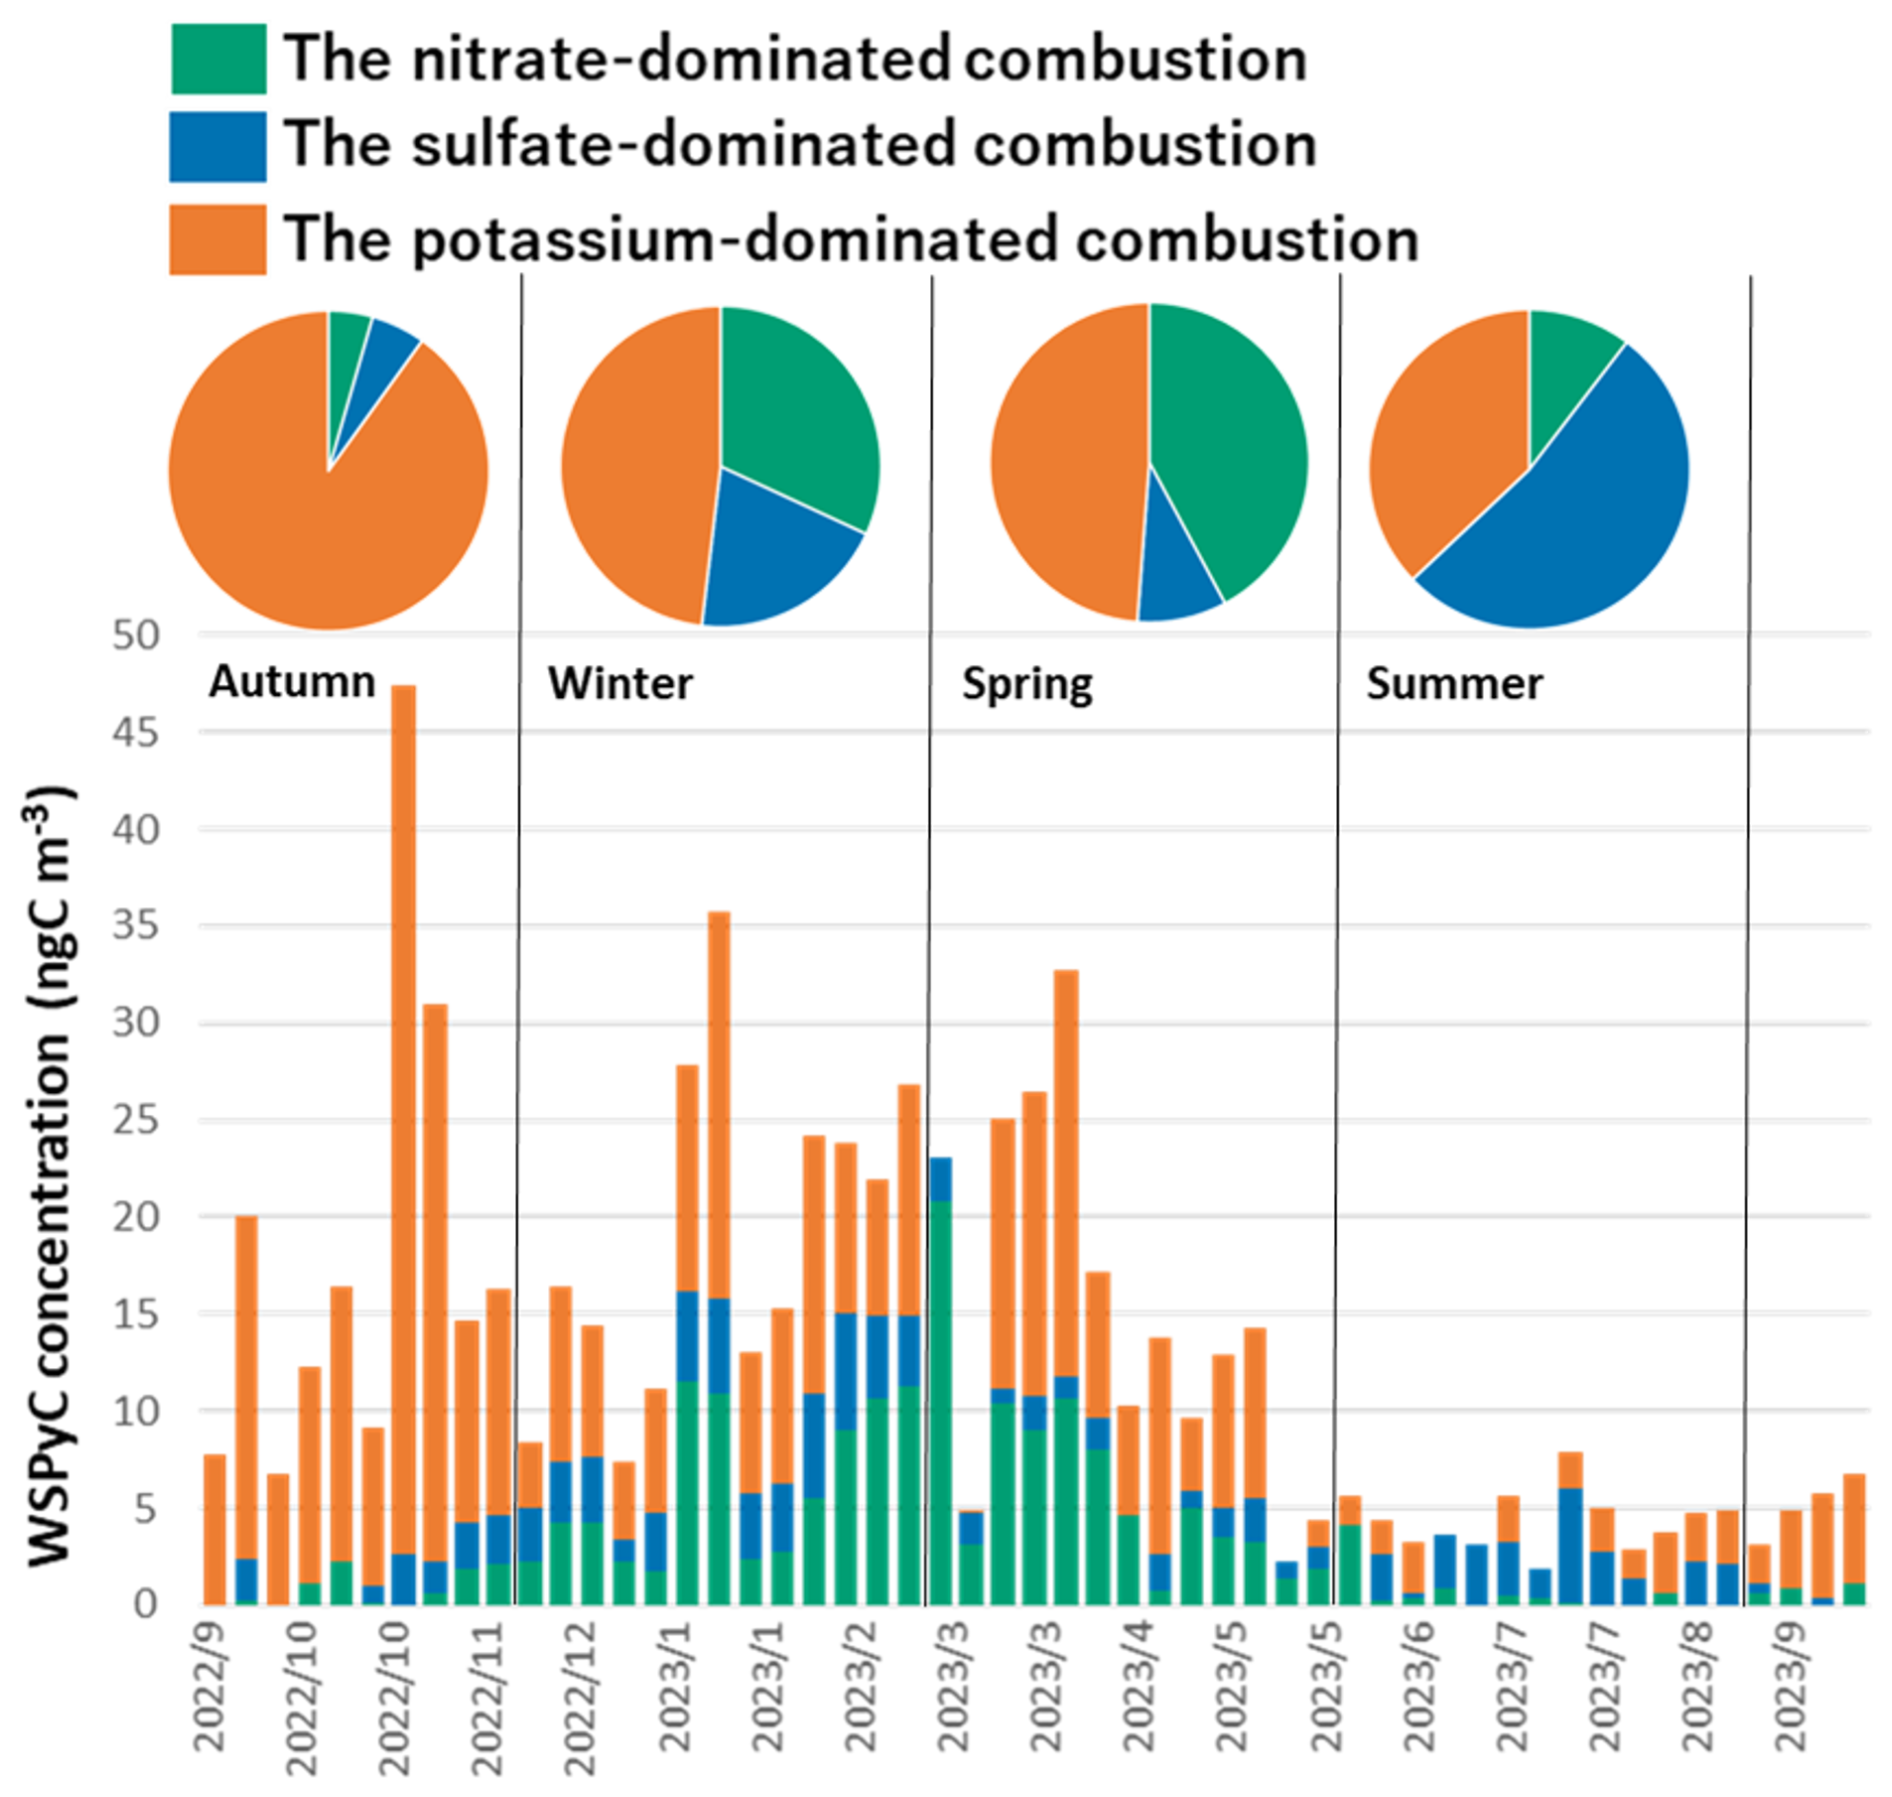
Figure 10Temporal variation of WSPyC concentration divided by each PMF factor. The pie charts show the average seasonal contribution of each PMF factor to WSPyC concentration.
It should be noted that the observed WSPyC concentrations were controlled by only three factors (i.e., F4, F5, and F6), all attributed to combustion-related factors, confirming the combustion origin of the WSPyC. The observed WSPyC in Sapporo was 60 % from potassium-dominated combustion sources (F4), 25 % from nitrate-dominated combustion (F5), and 15 % from sulfate-dominated combustion (F6), demonstrating that biomass burning and secondary aerosols from fossil fuel combustion are the primary sources of WSPyC in Sapporo. Figure 10 illustrates how the contribution of each factor to the WSPyC concentration varies over time, as well as showing the seasonal mean. The potassium-dominated combustion sources were the dominant factor controlling the WSPyC concentration in autumn in Sapporo. The highest concentration of WSPyC observed in this study was in autumn. It was associated with the highest concentration of WSPyC with the potassium-dominated combustion sources (Fig. 10). Back trajectory analysis of the sample with the highest WSPyC concentration (8 November 2022, in Fig. S2) revealed a strong influence of the continental air masses. The combined contribution of the nitrate- and sulfate-dominated combustion sources was about half of the WSPyC concentration in spring and winter, indicating a greater contribution of WSPyC derived from aged fossil fuel combustion aerosols compared to autumn. The larger contribution of sulfate-dominated combustion sources in winter compared to spring may be influenced by coal use for heating in Northeast China because it has been reported that the leading cause of winter smog in Northeast China is the use of coal for residential heating (Zhang et al., 2020). The back trajectories in winter show a strong continental origin (Fig. 5e), suggesting that they may more closely reflect combustion activities on the continent.
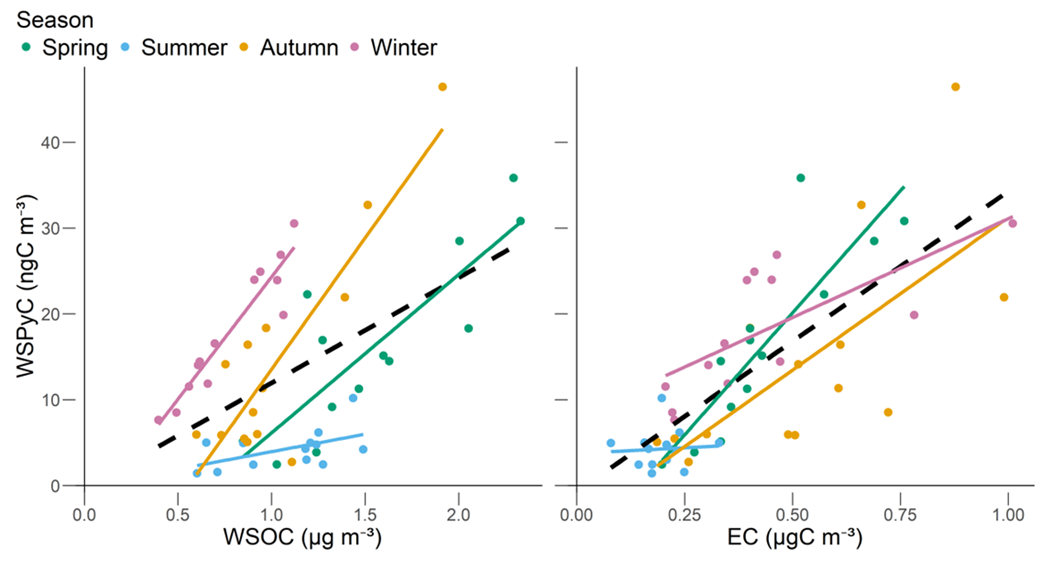
Figure 11Linear regression analyses between concentrations of WSPyC and WSOC, EC. The black dashed line represents the linear regression for all samples, excluding the dust samples. The colored lines represent the linear regression for each season.
Table 2The linear relationship between WSPyC and WSOC, as well as between WSPyC and EC.
Bold indicates p<0.05.
4.3 Possible factors controlling WSPyC in relation to WSOC and EC
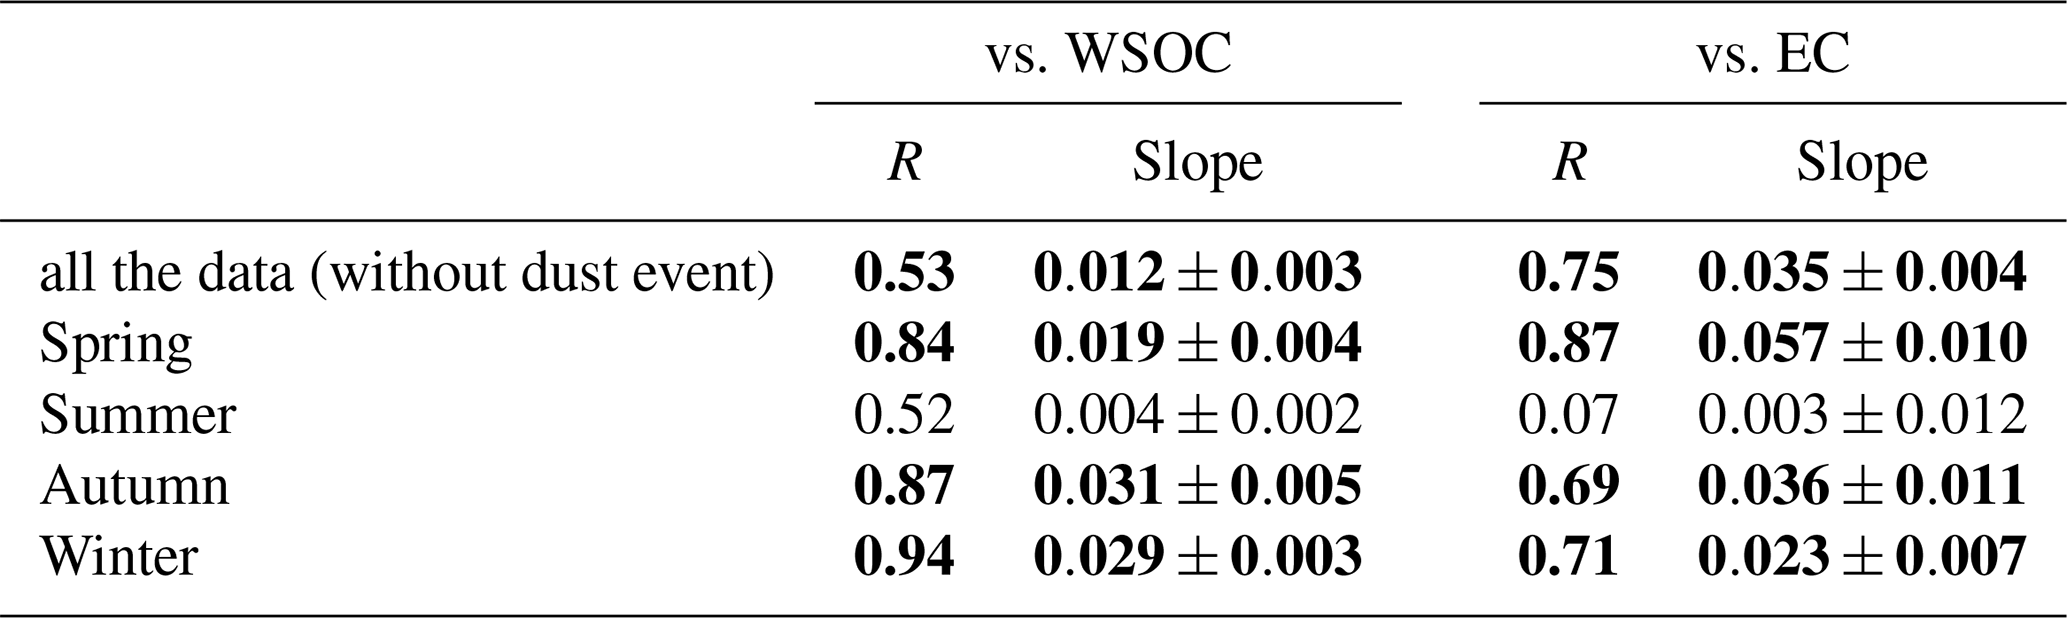
A relatively weak but significant linear relationship between WSPyC and WSOC was also observed in Sapporo for the entire observation period (Table 1). The correlation coefficients of the linear relationships for each season were better than those for the entire observation period, except for summer. The slopes of the linear relationships also varied seasonally from 0.019 in spring to 0.031 in autumn (Fig. 11, Table 2). The slopes observed in spring in Sapporo were two-thirds smaller than that reported in spring aerosol collected from the China coastal seas to the western North Pacific (Bao et al., 2017), although the slopes in winter and autumn in Sapporo were similar to Bao's observation. Such differences in the slope, as well as correlation coefficient, are most likely due to differences in the contribution of the factors controlling the WSPyC concentration, namely sources and atmospheric aging processes. WSPyC concentrations were comparable to those in winter and autumn (Fig. 2a), indicating that the smaller slope is probably attributed to the higher WSOC concentrations. The increase in WSOC concentrations due to high biological activities has been observed in Sapporo in spring (Pavuluri et al., 2013). Therefore, the contribution of non-combustion-derived WSOC makes the slope between WSPyC and WSOC smaller.
The linear relationship between WSPyC and EC was also observed for the entire observation period in Sapporo (Table 1). On the one hand, the slope (0.035, Fig. 11 and Table 2) was about 30 % and 6 % of those observed for aerosols affected by fossil fuel combustion (slope = 0.100) and biomass burning (slope = 0.563) in Bachok, Malaysia (Geng et al., 2021). A significant linear relationship between WSPyC and EC was also observed in each season except summer, with the slopes ranging from 0.023 in winter to 0.057 in spring (Fig. 11, Table 2), all of which were smaller than the values for the aerosols affected by fossil fuel combustion in Bachok, Malaysia (Geng et al., 2021). Geng et al. (2021) reported that some of the observed aerosols in Bachok were derived from fossil fuel combustion, which contained high levels of anhydrosugars, markers of biomass burning. They suggested that fossil fuel combustion-derived aerosols in Bachok may be influenced by biomass burning with a higher WSPyC EC ratio. On the other hand, the slopes observed in Sapporo were similar to those observed in summer (0.048) and in winter (0.025) in Xiamen, China (Zhang et al., 2023a). Interestingly, the observations in Sapporo and Xiamen (Zhang et al., 2023a) showed that the slope in spring/summer was approximately twice as high as that in winter (Fig. 11, Table 2). Odd oxygen (Ox), as an indicator of photochemical reactions (Zhan et al., 2021; Herndon et al., 2008), tends to show high concentrations from spring to summer in Japan (NIES, 2010). Similarly, in Taiwan, photochemical losses of VOCs were greater in spring and summer compared to winter (Mishram et al., 2024), suggesting a more substantial influence of photochemical reactions during these seasons. It has been reported that organic compounds similar to WSPyC are produced by oxidizing highly condensed aromatic hydrocarbons adsorbed on EC via photochemical reactions (Li et al., 2018, 2019, 2022). These results indicate not only differences in the source but also the possible transformation of soot to WSPyC through photochemical reactions in the atmosphere, altering the ratio of WSPyC to EC.
The slopes between WSPyC and WSOC, as well as between WSPyC and EC, observed near the combustion sources have been used to estimate the global flux of atmospheric deposition of WSPyC to the ocean (Bao et al. 2017; Geng et al., 2021). The slopes were reported to differ between combustion sources (Zhang et al., 2023a). This study also showed that the slopes changed with the addition of biogenic WSOC as well as atmospheric aging processes such as photooxidation of soot and subsequent production of WSPyC. Therefore, the global flux of atmospheric deposition of WSPyC to the ocean is likely to be highly uncertain, as it is based on a limited number of observations near combustion sources. To reduce uncertainty in the global flux of atmospheric WSPyC deposition to the ocean, WSPyC, WSOC, EC, and other aerosol parameters in the open ocean, far from combustion sources, are needed. Furthermore, it is necessary to determine changes in WSPyC, WSOC, and EC concentrations during atmospheric aging.
In a year-round observation in Sapporo, Hokkaido, the average WSPyC concentration was 13.7±10.6 ng C m−3, which was comparable to that previously collected in the open ocean of the western North Pacific but was lower than that collected near the combustion sources. WSPyC concentrations showed strong correlations with EC, WSOC, Abs365, nss-K+, nss-SO, and NO. The correlations varied by season, probably due to differences in the primary combustion source and atmospheric aging processes (e.g., photochemical oxidation and secondary formation). Considering that Sapporo was substantially affected by continental air masses except in summer, when WSPyC levels were low, it is suggested that combustion activities on the continent likely influenced the WSPyC concentrations in Sapporo.
Source apportionment by PMF analysis showed that WSPyC contributed to only three factors, all of which were most likely related to combustion activity. The WSPyC concentration was strongly influenced by a factor related to potassium-dominated combustion sources throughout the year, especially in autumn, suggesting that the WSPyC in Sapporo is influenced by primary organic aerosols originating from biomass and biofuel burning. The contributions of factors associated with nitrate- and sulfate-dominated combustion sources to the WSPyC concentration became larger in winter and spring, indicating that the atmospheric aging of aerosols originating from fossil fuel combustion more strongly influences WSPyC in Sapporo in winter and spring.
The linear relationships between WSPyC and both WSOC and EC were significant for each season except summer, when levels of combustion-derived EC and WSPyC were lowest. However, the slopes of the linear relationships, corresponding to the WSPyC WSOC and WSPyC EC ratios, varied by season. These variations are likely due to differences in the contributions of biogenic WSOC and atmospheric aging processes, including the secondary formation of WSPyC through the photooxidation of soot, as well as variations in primary combustion sources. The former two effects are likely to become more pronounced as aerosols are transported over long distances from land to the open ocean. Therefore, to precisely estimate the global WSPyC deposition flux to the ocean, it is essential to experimentally elucidate the solubilization processes of WSPyC from soot in both the atmosphere and the ocean surface, in addition to aerosol observations in open ocean regions, far from combustion sources.
All data are available at https://doi.org/10.5281/zenodo.15510865 (Miyase, 2025).
Information on sample collection (Table S1); temperature protocol and atmosphere during EC OC analysis (Fig. S1); the 3 d back trajectories for all samples (Fig. S2); temporal variations in concentration of carbonaceous aerosols (Fig. S3); temporal variations in ratio of carbonaceous aerosols (Fig. S4); temporal variations in concentration of ion (Fig. S5). Wind rose plots for the each season (Fig. S6). The supplement related to this article is available online at https://doi.org/10.5194/acp-26-2141-2026-supplement.
RM and YY designed the study. RM collected samples with the help of TI and YY. RM performed the measurements and data analyses with the help of YM, TI, and YY. RM prepared the manuscript with inputs from YM and YY.
The contact author has declared that none of the authors has any competing interests.
Publisher's note: Copernicus Publications remains neutral with regard to jurisdictional claims made in the text, published maps, institutional affiliations, or any other geographical representation in this paper. The authors bear the ultimate responsibility for providing appropriate place names. Views expressed in the text are those of the authors and do not necessarily reflect the views of the publisher.
We would like to thank all the collaborators and laboratory members for their helpful discussions and support throughout this study. E. Tachibana is acknowledged for her assistance in analysing the inorganic ions.
This work was funded by grants from the Japan Society for the Promotion of Science KAKENHI (grant nos. JP22H03714, JP23K24969, and JP25H01176). Riku Miyase was supported by JST SPRING (grant no. JPMJSP2119).
This paper was edited by Allison C. Aiken and reviewed by two anonymous referees.
Aggarwal, S. G. and Kawamura, K.: Molecular distributions and stable carbon isotopic compositions of dicarboxylic acids and related compounds in aerosols from Sapporo, Japan: Implications for photochemical aging during long-range atmospheric transport, J. Geophys. Res., 113, https://doi.org/10.1029/2007jd009365, 2008.
Bao, H., Niggemann, J., Luo, L., Dittmar, T., and Kao, S.: Aerosols as a source of dissolved black carbon to the ocean, Nat. Commun., 8, 510, https://doi.org/10.1038/s41467-017-00437-3, 2017.
Bao, H., Qiao, J., Zhang, R., Huang, D., Wang, B., Lin, X., and Kao, S.-J.: Multiproxy probing of anthropogenic influences on the different components of dissolved organic matter in coastal rainwater, Sci. Total Environ., 824, 153846, https://doi.org/10.1016/j.scitotenv.2022.153846, 2022.
Bao, H., Niggemann, J., Du, M., Zhao, W., Huang, D., Yi, Y., Yang, J. Y. T., Dittmar, T., and Kao, S. J.: Deciphering sources and processing of dissolved black carbon in coastal seas, Limnol. Oceanogr., 68, 2562–2575, https://doi.org/10.1002/lno.12442, 2023.
Barton, R. and Wagner, S.: Measuring dissolved black carbon in water via aqueous, inorganic, high-performance liquid chromatography of benzene polycarboxylic acid (BPCA) molecular markers, PLoS ONE, 17, e0268059, https://doi.org/10.1371/journal.pone.0268059, 2022.
Bond, T. C., Doherty, S. J., Fahey, D. W., Forster, P. M., Berntsen, T., Deangelo, B. J., Flanner, M. G., Ghan, S., Kärcher, B., Koch, D., Kinne, S., Kondo, Y., Quinn, P. K., Sarofim, M. C., Schultz, M. G., Schulz, M., Venkataraman, C., Zhang, H., Zhang, S., Bellouin, N., Guttikunda, S. K., Hopke, P. K., Jacobson, M. Z., Kaiser, J. W., Klimont, Z., Lohmann, U., Schwarz, J. P., Shindell, D., Storelvmo, T., Warren, S. G., and Zender, C. S.: Bounding the role of black carbon in the climate system: A scientific assessment, J. Geophys. Res.-Atmos., 118, 5380–5552, https://doi.org/10.1002/jgrd.50171, 2013.
Bouwman, A. F., Lee, D. S., Asman, W. A. H., Dentener, F. J., Van Der Hoek, K. W., and Olivier, J. G. J.: A global high-resolution emission inventory for ammonia, Global Biogeochem. Cy., 11, 561–587, https://doi.org/10.1029/97GB02266, 1997.
Briggs, N. L. and Long, C. M.: Critical review of black carbon and elemental carbon source apportionment in Europe and the United States, Atmos. Environ., 144, 409–427, https://doi.org/10.1016/j.atmosenv.2016.09.002, 2016.
Budhavant, K., Andersson, A., Holmstrand, H., Bikkina, P., Bikkina, S., Satheesh, S. K., and Gustafsson, Ö.: Enhanced Light-Absorption of Black Carbon in Rainwater Compared with Aerosols Over the Northern Indian Ocean, J. Geophys. Res., 125, e2019JD031246, https://doi.org/10.1029/2019JD031246, 2019.
Chen, Y. and Xie, S.: Characteristics and formation mechanism of a heavy air pollution episode caused by biomass burning in Chengdu, Southwest China, Sci. Total. Environ., 473–474, 507–517, https://doi.org/10.1016/j.scitotenv.2013.12.069, 2014.
Chen, Z. X., Pei, C. L., Liu, J. W., Zhang, X. Y., Ding, P., Dang, L., Zong, Z., Jiang, F., Wu, L. L., Sun, X., Zhou, S. Z., Zhang, Y. L., Zhang, Z. S., Zeng, J. Y., Tian, C. G., Li, J., and Zhang, G.: Non-agricultural source dominates the ammonium aerosol in the largest city of South China based on the vertical δ15N measurements, Sci. Total Environ., 848, 157750, https://doi.org/10.1016/j.scitotenv.2022.157750, 2022.
Chow, J. C., Watson, J. G., Kuhns, H., Etyemezian, V., Lowenthal, D. H., Crow, D., Kohl, S. D., Engelbrecht, J. P., and Green, M. C.: Source profiles for industrial, mobile, and area sources in the Big Bend Regional Aerosol Visibility and Observational study, Chemosphere, 54, 185–208, https://doi.org/10.1016/j.chemosphere.2003.07.004, 2004.
Coppola, A. I., Ziolkowski, L. A., Masiello, C. A., and Druffel, E. R. M.: Aged black carbon in marine sediments and sinking particles, Geophys. Res. Lett., 41, 2427–2433, https://doi.org/10.1002/2013GL059068, 2014.
Coppola, A. I., Wiedemeier, D. B., Galy, V., Haghipour, N., Hanke, U. M., Nascimento, G. S., Usman, M., Blattmann, T. M., Reisser, M., Freymond, C. V., Zhao, M., Voss, B., Wacker, L., Schefuß, E., Peucker-Ehrenbrink, B., Abiven, S., Schmidt, M. W. I., and Eglinton, T. I.: Global-scale evidence for the refractory nature of riverine black carbon, Nat. Geosci., 11, 584–588, https://doi.org/10.1038/s41561-018-0159-8, 2018.
Coppola, A. I., Wagner, S., Lennartz, S. T., Seidel, M., Ward, N. D., Dittmar, T., Santín, C., and Jones, M. W.: The black carbon cycle and its role in the Earth system, Nat. Rev. Earth Environ., 3, 516–532, https://doi.org/10.1038/s43017-022-00316-6, 2022.
Coppola, A. I., Druffel, E. R. M., Broek, T. A., Haghipour, N., Eglinton, T. I., McCarthy, M., and Walker, B. D.: Variable aging and storage of dissolved black carbon in the ocean, P. Natl. Acad. Sci. USA, 121, e2305030121, https://doi.org/10.1073/pnas.2305030121, 2024.
Decesari, S., Facchini, M. C., Matta, E., Mircea, M., Fuzzi, S., Chughtai, A. R., and Smith, D. M.: Water soluble organic compounds formed by oxidation of soot, Atmos. Environ., 36, 1827–1832, https://doi.org/10.1016/S1352-2310(02)00141-3, 2002.
Dittmar, T.: The molecular level determination of black carbon in marine dissolved organic matter, Org. Geochem., 39, 396–407, https://doi.org/10.1016/j.orggeochem.2008.01.015, 2008.
Dittmar, T. and Paeng, J.: A heat-induced molecular signature in marine dissolved organic matter, Nat. Geosci., 2, 175–179, https://doi.org/10.1038/ngeo440, 2009.
Dittmar, T., de Rezende, C., Manecki, M., Niggemann, J., Coelho Ovalle, A. R., Stubbins, A., and Bernardes, M. C.: Continuous flux of dissolved black carbon from a vanished tropical forest biome, Nat. Geosci., 5, 618–622, https://doi.org/10.1038/ngeo1541, 2012.
Dzepina, K., Cappa, C. D., Volkamer, R. M., Madronich, S., DeCarlo, P. F., Zaveri, R. A., and Jimenez, J. L.: Modeling the Multiday Evolution and Aging of Secondary Organic Aerosol During MILAGRO 2006, Environ. Sci. Technol., 45, 3496–3503, https://doi.org/10.1021/es103186f, 2011.
Fang, Y., Chen, Y., Tian, C., Wang, X., Lin, T., Hu, L., Li. J., Zhang, G., and Luo, Y.: Cycling and budgets of organic and black carbon in coastal Bohai Sea, China: Impacts of natural and anthropogenic perturbations, Global Biogeochem. Cy., 32, 971–986, https://doi.org/10.1029/2017GB005863, 2018.
Fang, Y., Chen, Y., Huang, G., Hu, L., Tian, C., Xie, J., Lin, J., and Lin, T.: Particulate and Dissolved Black Carbon in Coastal China Seas: Spatiotemporal Variations, Dynamics, and Potential Implications, Environ. Sci. Technol., 55, 788–796, https://doi.org/10.1021/acs.est.0c06386, 2021.
Fierce, L., Riemer, N., and Bond, T. C.: Explaining variance in black carbon's aging timescale, Atmos. Chem. Phys., 15, 3173–3191, https://doi.org/10.5194/acp-15-3173-2015, 2015.
Frank, J. M., Rainer, F., Daniel, G. W., and Trevor, J. M.: The composition of Standard Seawater and the definition of the Reference-Composition Salinity Scale, Deep-Sea Res. Pt. I, 55, 50–72, https://doi.org/10.1016/j.dsr.2007.10.001, 2008.
Geng, G., Liu, Y., Liu, Y., Liu, S., Cheng, J., Yan, L., Wu, N., Hu, H., Tong, D., Zheng, B., Yin, Z., He, K., and Zhang, Q.: Efficacy of China's clean air actions to tackle PM2.5 pollution between 2013 and 2020, Nat. Geosci., 17, 987–994, https://doi.org/10.1038/s41561-024-01540-z, 2024.
Geng, X., Zhong, G., Liu, J., Sun, Y., Yi, X., Bong, C. W., Zakaria, M. P., Gustafsson, Ö., Ouyang, Y., and Zhang, G.: Year-round measurements of dissolved black carbon in coastal Southeast Asia aerosols: Rethinking its atmospheric deposition in the ocean, J. Geophys. Res.-Atmos., 126, e2021JD034590, https://doi.org/10.1029/2021JD034590, 2021.
Geng, X., Haig, J., Lin, B., Tian, C., Zhu, S., Cheng, Z., Yuan, Y., Zhang, Y., Liu, J., Zheng, M., Li, J., Zhong, G., Zhao, S., Bird, M. I., and Zhang, G.: Provenance of aerosol black carbon over northeast indian ocean and South China Sea and implications for oceanic black carbon cycling, Environ. Sci. Technol., 57, 13067–13078, https://doi.org/10.1021/acs.est.3c03481, 2023.
Goldberg, E. D.: Black Carbon in the Environment: Properties and Distribution, John Wiley, https://doi.org/10.1002/qj.49711247219, 1985.
Grieshop, A. P., Logue, J. M., Donahue, N. M., and Robinson, A. L.: Laboratory investigation of photochemical oxidation of organic aerosol from wood fires 1: Measurement and simulation of organic aerosol evolution, Atmos. Chem. Phys., 9, 1263–1277, https://doi.org/10.5194/acp-9-1263-2009, 2009.
Han, C., Liu, Y., Ma, J., and He, H.: Key role of organic carbon in the sunlight-enhanced atmospheric aging of soot by O2, P. Natl. Acad. Sci. USA, 109, 21250–21255, https://doi.org/10.1073/pnas.1212690110, 2012.
Hecobian, A., Zhang, X., Zheng, M., Frank, N., Edgerton, E. S., and Weber, R. J.: Water-Soluble Organic Aerosol material and the light absorption characteristics of aqueous extracts measured over the Southeastern United States, Atmos. Chem. Phys., 10, 5965–5977, https://doi.org/10.5194/acp-10-5965-2010, 2010.
Hedges, J. I., Eglinton, G., Hatcher, P. G., Kirchman, D. L., Arnosti, C., Derenne, S., Evershed, R. P., Kogel-Knabner, I., de Leeuw, J. W., Littke, R., Michaelis, W., and Rullkotter, J.: The molecularly-uncharacterized component of nonliving organic matter in natural environments, Org. Geochem., 31, 945–958, https://doi.org/10.1016/S0146-6380(00)00096-6, 2000.
Herndon, S. C., Onasch, T. B., Wood, E. C., Kroll, J. H., Canagaratna, M. R., Jayne, J. T., Zavala, M. A., Knighton, W. B., Mazzoleni, C., Dubey, M. K., Ulbrich, I. M., Jimenez, J. L., Seila, R., de Gouw, J. A., de Foy, B., Fast, J., Molina, L. T., Kolb, C. E., and Worsnop, D. R.: Correlation of secondary organic aerosol with odd oxygen in Mexico City, Geophys. Res. Lett., 35, 6, https://doi.org/10.1029/2008GL034058, 2008.
Hou, D., Zhang, X., Zhao, J., Qiang, J., Wang, J., Wang, P., An, Q., Wang, Y., Wang, L., Yuan, S., and Zhang, F.: Source Apportionment of Elemental Carbon in Different Seasons in Hebei, China, Front. Environ. Sci., 10, https://doi.org/10.3389/fenvs.2022.949504, 2022.
Huo, M. Q., Sato, K., Ohizumi, T., Akimoto, H., and Takahashi, K.: Characteristics of carbonaceous components in precipitation and atmospheric particle at Japanese sites, Atmos. Environ., 146, 164–173, https://doi.org/10.1016/j.atmosenv.2016.07.017, 2016.
Iwasaka, Y., Minoura, H., and Nagaya, K.: The transport and spacial scale of Asian dust-storm clouds: a case study of the dust-storm event of April 1979, Tellus B Chem. Phys. Meteorol., 35B, 189–196, https://doi.org/10.1111/j.1600-0889.1983.tb00023.x, 1983.
Jones, M. W., Santín, C., van der Werf, G. R., and Doerr, S. H.: Global fire emissions buffered by the production of pyrogenic carbon, Nat. Geosci., 12, 742–747, https://doi.org/10.1038/s41561-019-0403-x, 2019.
Jones, M. W., Coppola, A. I., Santín, C., Dittmar, T., Jaffé, R., Doerr, S. H., and Quine, T. A.: Fires prime terrestrial organic carbon for riverine export to the global oceans, Nat. Commun., 11, 2791, https://doi.org/10.1038/s41467-020-16576-z, 2020.
Jones, M. W., Veraverbeke, S., Andela, N., Doerr, S. H., Kolden, C., Mataveli, G., Pettinari, M. L., Le Quéré, C., Rosan, T. M., van der Werf, G. R., van Wees, D., and Abatzoglou, J. T.: Global rise in forest fire emissions linked to climate change in the extratropics, Science, 386, 6719, https://doi.org/10.1126/science.adl5889, 2024.
Kondo, Y., Miyazaki, Y., Takegawa, N., Miyakawa, T., Weber, R., Jimenez, J., Zhang, Q., and Worsnop, D. R.: Oxygenated and water-soluble organic aerosols in Tokyo, J. Geophys Res., 112, D1, https://doi.org/10.1029/2006JD007056, 2007.
Li, M., Bao, F., Zhang, Y., Song, W., Chen, C., and Zhao, J.: Role of elemental carbon in the photochemical aging of soot, P. Natl. Acad. Sci. USA, 115, 7717–7722, https://doi.org/10.1073/pnas.1804481115, 2018.
Li, M., Bao, F., Zhang, Y., Sheng, H., Chen, C., and Zhao, J.: Photochemical Aging of Soot in the Aqueous Phase: Release of Dissolved Black Carbon and the Formation of 1O2, Environ. Sci. Technol., 53, 12311–12319, https://doi.org/10.1021/acs.est.9b02773, 2019.
Li, M., Li, J., Zhu, Y., Chen, J., Andreae, M. O., Pöschl, U., Su, H., Kulmala, M., Chen, C., Cheng, Y., and Zhao, J.: Highly oxygenated organic molecules with high unsaturation formed upon photochemical aging of soot, Chem, 8, 2688–2699, https://doi.org/10.1016/j.chempr.2022.06.011, 2022.
Li, X., Wang, S., Duan, L., Hao, J., and Nie, Y.: Carbonaceous aerosol emissions from household biofuel combustion in China, Environ. Sci. Technol., 43, 6076–6081, https://doi.org/10.1021/es803330j, 2009.
Lim, C. Y., Hagan, D. H., Coggon, M. M., Koss, A. R., Sekimoto, K., de Gouw, J., Warneke, C., Cappa, C. D., and Kroll, J. H.: Secondary organic aerosol formation from the laboratory oxidation of biomass burning emissions, Atmos. Chem. Phys., 19, 12797–12809, https://doi.org/10.5194/acp-19-12797-2019, 2019.
Lin, Y., Yu, M., Xie, F., and Zhang, Y.: Anthropogenic Emission Sources of Sulfate Aerosols in Hangzhou, East China: Insights from Isotope Techniques with Consideration of Fractionation Effects between Gas-to-Particle Transformations, Environ. Sci. Technol., 56, 3905–3914, https://doi.org/10.1021/acs.est.1c05823, 2022.
Lu, S., Irino, T., and Igarashi, Y.: Biomass burning history in East Asia during the last 4 million years recorded in elemental carbon variability at IODP site U1423, Progr. Earth Planet. Sci., 5, 53, https://doi.org/10.1186/s40645-018-0206-5, 2018.
Masiello, C. A.: New directions in black carbon organic geochemistry, Mar. Chem., 92, 201–213, https://doi.org/10.1016/j.marchem.2004.06.043, 2024.
Mishram, M., Chen, P. H., Lin, G. Y., Nguyen, T. T. N., Le, T. C., Dejchanchaiwong, R., Tekasakul, P., Shih, S. H., Jhang, C. W., and Tsai, C. J.: Photochemical oxidation of VOCs and their source impact assessment on ozone under de-weather conditions in Western Taiwan, Environ. Pollut., 346, 123662, https://doi.org/10.1016/j.envpol.2024.123662, 2024.
Miyase, R.: Data for Factors controlling the concentration of water-soluble pyrogenic carbon in aerosols in Hokkaido, Japan, Zenodo [data set], https://doi.org/10.5281/zenodo.15510865, 2025.
Miyazaki, Y., Kondo, Y., Takegawa, N., Komazaki, Y., Fukuda, M., Kawamura, K., Mochida, M., Okuzawa, K., and Weber, R. J.: Time-resolved measurements of water-soluble organic carbon in Tokyo, J. Geophys. Res., 111, https://doi.org/10.1029/2006jd007125, 2006.
Miyazaki, Y., Kondo, Y., Han, S., Koike, M., Kodama, D., Komazaki, Y., Tanimoto, H., and Matsueda, H.: Chemical characteristics of water-soluble organic carbon in the Asian outflow, J. Geophys. Res., 112, D22S30, https://doi.org/10.1029/2007JD009116, 2007.
Miyazaki, Y., Coburn, S., Ono, K., Ho, D. T., Pierce, R. B., Kawamura, K., and Volkamer, R.: Contribution of dissolved organic matter to submicron water-soluble organic aerosols in the marine boundary layer over the eastern equatorial Pacific, Atmos. Chem. Phys., 16, 7695–7707, https://doi.org/10.5194/acp-16-7695-2016, 2016.
Miyazaki, Y., Yamashita, Y., Kawana, K. Tachibana, E., Kagami, S., Mochida, M., Suzuki, K., and Nishioka, J.: Chemical transfer of dissolved organic matter from surface seawater to sea spray water-soluble organic aerosol in the marine atmosphere, Sci. Rep., 8, 14861, https://doi.org/10.1038/s41598-018-32864-7, 2018.
Nakamura, T., Narita, Y., Kanazawa, K., and Uematsu, M.: Organic Nitrogen of Atmospheric Aerosols in the Coastal Area of Seto Inland Sea, Aerosol Air Qual. Res., 20, 1016–1025, https://doi.org/10.4209/aaqr.2019.12.0658, 2020.
Nakane, M., Ajioka, T., and Yamashita, Y.: Distribution and Sources of Dissolved Black Carbon in Surface Waters of the Chukchi Sea, Bering Sea, and the North Pacific Ocean, Front. Earth Sci., 5, https://doi.org/10.3389/feart.2017.00034, 2017.
Ni, Y., Luo, L., Liu, S., Huang, J., Li, Y., and Qi, J.: Refined source apportionment of nitrate aerosols based on isotopes and emission inventories in coastal city of northern China, Sci. Total Environ., 957, 177388, https://doi.org/10.1016/j.scitotenv.2024.177388, 2024.
NIES: Study on characteristics of photochemical oxidants and particulate matter (Final report from type C joint research of NIES and environmental research institutes of local government FY 2007–2009), Research Report from the National Institute for Environmental Studies, Japan, 203, https://www.nies.go.jp/kanko/kenkyu/pdf/r-203-2010.pdf (last access: 8 February 2026), 2010.
Norris, G., Duvall, R., Brown, S., and Bai, S.: EPA Positive Matrix Factorization (PMF) 5.0 Fundamentals and User Guide, US EPA, https://www.epa.gov/sites/default/files/2015-02/documents/pmf_5.0_user_guide.pdf (last access: 8 February 2026), 2014.
Ohta, S. and Okita, T.: A chemical characterization of atmospheric aerosol in Sapporo, Atmos. Environ., 24, 815–822, https://doi.org/10.1016/0960-1686(90)90282-r, 1990.
Paatero, P. and Tapper, U.: Positive matrix factorization: A non-negative factor model with optimal utilization of error estimates of data values, Environmetrics, 5, 111–126, https://doi.org/10.1002/env.3170050203, 1994.
Pant, P. and Harrison, R. M.: Critical review of receptor modelling for particulate matter: A case study of India, Atmos. Environ., 49, 1–12, https://doi.org/10.1016/j.atmosenv.2011.11.060, 2012.
Pavuluri, C. M., Kawamura, K., Uchida, M., Kondo, M., and Fu, P.: Enhanced modern carbon and biogenic organic tracers in Northeast Asian aerosols during spring/summer, J. Geophys. Res.-Atmos., 118, 2362–2371, https://doi.org/10.1002/jgrd.50244, 2013.
Pavuluri, C. M., Kawamura, K., Mihalopoulos, N., and Fu, P.: Characteristics, seasonality and sources of inorganic ions and trace metals in North-east Asian aerosols, Environ. Chem., 12, 338–349, https://doi.org/10.1071/EN14186, 2015.
Petters, M. D., Prenni, A. J., Kreidenweis, S. M., DeMott, P. J., Matsunaga, A., Lim, Y. B., and Ziemann, P. J.: Chemical aging and the hydrophobic-to-hydrophilic conversion of carbonaceous aerosol, Geophys. Res. Lett., 33, L24806, https://doi.org/10.1029/2006GL027249, 2006.
Pio, C., Cerqueira, M., Harrison, R. M., Nunes, T., Mirante, F., Alves, C., Oliveira, C., Sanchez de la Campa, A., Artíñano, B., and Matos, M.: OC EC ratio observations in Europe: Re-thinking the approach for apportionment between primary and secondary organic carbon, Atmos. Environ., 45, 6121–6132, https://doi.org/10.1016/j.atmosenv.2011.08.045, 2011.
Plaza, J., Artiñano, B., Salvador, P., Gómez-Moreno, F. J., Pujadas, M., and Pio, C.: Short-time SOA estimations with a modified OC EC primary ratio method at a suburban site in Madrid (Spain), Atmos. Environ., 45, 2496–2506, https://doi.org/10.1016/j.atmosenv.2011.02.037, 2011.
R Core Team: R: A Language and Environment for Statistical Computing, R Foundation for Statistical Computing, Vienna, Austria, https://www.R-project.org (last access: 8 February 2026), 2023.
Roebuck Jr., J. A., Podgorski, D. C., Wagner, S., and Jaffé, R.: Photodissolution of charcoal and fire-impacted soil as a potential source of dissolved black carbon in aquatic environments, Org. Geochem., 112, 16–21, https://doi.org/10.1016/j.orggeochem.2017.06.018, 2017.
Santín, C., Doerr, S. H., Kane, E. S., Masiello, C. A., Ohlson, M., de la Rosa, J. M., Preston, C. M., and Dittmar, T.: Towards a global assessment of pyrogenic carbon from vegetation fires, Global Change. Biol., 22, 76–91, https://doi.org/10.1111/gcb.12985, 2016.
Seinfeld, J. H. and Pandis, S. N.: Atmospheric chemistry and physics, in: 3rd Edn., Wiley-Blackwell, Hoboken, NJ, 1152 pp., ISBN 978-1-118-94740-1, 2016.
Sonwani, S. and Kulshrestha, U. C.: PM10 carbonaceous aerosols and their real-time wet scavenging during monsoon and non-monsoon seasons at Delhi, India, J. Atmos. Chem., 76, 171–200, https://doi.org/10.1007/s10874-019-09396-z, 2019.
Stubbins, A., Niggemann, J., and Dittmar, T.: Photo-lability of deep ocean dissolved black carbon, Biogeosciences, 9, 1661–1670, https://doi.org/10.5194/bg-9-1661-2012, 2012.
Tao, J., Zhang, L., Engling, G., Zhang, R., Yang, Y., Cao, J., Zhu, C., Wang, Q., and Luo, L.: Chemical composition of PM2.5 in an urban environment in Chengdu, China: importance of springtime dust storms and biomass burning, Atmos. Res., 122, 270–283, https://doi.org/10.1016/j.atmosres.2012.11.004, 2013.
US EPA: Particulate Matter (PM2.5) Speciation Guidance Document (Final Draft), https://www.epa.gov/sites/default/files/2017-01/documents/final_draft_pm2.5_speciation_guidance_1999.pdf (last access: 8 February 2026), 1999.
Wagner, S., Cawley, K. M., Rosario-Ortiz, F. L., and Jaffé, R.: In-stream sources and links between particulate and dissolved black carbon following a wildfire, Biogeochemistry, 124, 145–161, https://doi.org/10.1007/s10533-015-0088-1, 2015.
Wagner, S., Jaffé, R., and Stubbins, A.: Dissolved black carbon in aquatic ecosystems, Limnol. Oceanogr. Lett., 3, 168–185, https://doi.org/10.1002/lol2.10076, 2018.
Wagner, S., Brandes, J., Spencer, R. G. M., Ma, K., Rosengard, S. Z., Moura, J. M. S., and Stubbins, A.: Isotopic composition of oceanic dissolved black carbon reveals non-riverine source, Nat. Commun., 10, 5064, https://doi.org/10.1038/s41467-019-13111-7, 2019.
Wagner, S., Coppola, A. I., Stubbins, A., Dittmar, T., Niggemann, J., Drake, T. W., Seidel, M., Spencer, R. G. M., and Bao, H.: Questions remain about the biolability of dissolved black carbon along the combustion continuum, Nat. Commun., 12, 4281, https://doi.org/10.1038/s41467-021-24477-y, 2021.
Wang, W., Wang, X., Flannigan, M. D., Guindon, L., Swystun, T., Castellanos-Acuna, D., Wu, W., and Wang, G.: Canadian forests are more conducive to high-severity fires in recent decades, Science, 387, 6729, https://doi.org/10.1126/science.ado1006, 2025.
Weingartner, E., Burtscher, H., and Baltensperger, U.: Hygroscopic properties of carbon and diesel soot particles, Atmos. Environ., 31, 2311–2327, https://doi.org/10.1016/S1352-2310(97)00023-X, 1997.
Wu, G., Ram, K., Fu, P., Wang, W., Zhang, Y., Liu, X., Stone, E. A., Pradhan, B. B., Dangol, P. M., Panday, A. K., Wan, X., Bai, Z., Kang, S., Zhang, Q., and Cong, Z.: Water-Soluble Brown Carbon in Atmospheric Aerosols from Godavari (Nepal), a Regional Representative of South Asia, Environ. Sci. Technol., 53, 3471–3479, https://doi.org/10.1021/acs.est.9b00596, 2019.
Xu, J. S., Xu, M. X., Snape, C., He, j., Behera, S. N., Xu, H. H., Ji, D. S., Wang, C. J., Yu, H., Xiao, H., Jiang, Y. J., Qi, B., and Du, R. G.: Temporal and spatial variation in major ion chemistry and source identification of secondary inorganic aerosols in Northern Zhejiang Province, China, Chemosphere, 179, 316–330, https://doi.org/10.1016/j.chemosphere.2017.03.119, 2017.
Yamamoto, S., Kawamura, K., and Seki, O.: Long-range atmospheric transport of terrestrial biomarkers by the Asian winter monsoon: Evidence from fresh snow from Sapporo, northern Japan, Atmos. Environ., 45, 3553–3560, https://doi.org/10.1016/j.atmosenv.2011.03.071, 2011.
Yamashita, Y., Nosaka, Y., Suzuki, K., Ogawa, H., Takahashi, K., and Saito, H.: Photobleaching as a factor controlling spectral characteristics of chromophoric dissolved organic matter in open ocean, Biogeosciences, 10, 7207–7217, https://doi.org/10.5194/bg-10-7207-2013, 2013.
Yamashita, Y., Kojima, D., Yoshida, N., and Shibata, H.: Relationships between dissolved black carbon and dissolved organic matter in streams, Chemosphere, 271, 129824, https://doi.org/10.1016/j.chemosphere.2021.129824, 2021.
Yamashita, Y., Nakane, M., Mori, Y., Nishioka, J., and Ogawa, H.: Fate of dissolved black carbon in the deep Pacific Ocean, Nat. Commun., 13, 307, https://doi.org/10.1038/s41467-022-27954-0, 2022.
Yamashita, Y., Mori, Y., and Ogawa, H.: Hydrothermal-derived black carbon as a source of recalcitrant dissolved organic carbon in the ocean, Sci. Adv., 9, eade3807, https://doi.org/10.1126/sciadv.ade3807, 2023.
Zhan, B., Zhong, H., Chen, H., Chen, Y., Li, X., Wang, L., Wang, X., Mu, Y., Huang, R., George, C., and Chen, J.: The roles of aqueous-phase chemistry and photochemical oxidation in oxygenated organic aerosols formation, Atmos. Environ., 266, 118738, https://doi.org/10.1016/j.atmosenv.2021.118738, 2021.
Zhang, J., Liu, L., Xu, L., Lin, Q., Zhao, H., Wang, Z., Guo, S., Hu, M., Liu, D., Shi, Z., Huang, D., and Li, W.: Exploring wintertime regional haze in northeast China: role of coal and biomass burning, Atmos. Chem. Phys., 20, 5355–5372, https://doi.org/10.5194/acp-20-5355-2020, 2020.
Zhang, R., Qiao, J., Huang, D., Lin, X., Tian, L., Wang, B., Bao, H., and Kao, S. J.: Seasonal variations in the sources and influential factors of aerosol dissolved black carbon at a southeast coastal site in China, J. Geophys. Res.-Atmos., 128, e2023JD038515, https://doi.org/10.1029/2023JD038515, 2023a.
Zhang, X. Y., Wang, Y. Q., Niu, T., Zhang, X. C., Gong, S. L., Zhang, Y. M., and Sun, J. Y.: Atmospheric aerosol compositions in China: spatial/temporal variability, chemical signature, regional haze distribution and comparisons with global aerosols, Atmos. Chem. Phys., 12, 779–799, https://doi.org/10.5194/acp-12-779-2012, 2012.
Zhang, Y., Cheng, M., Gao, J., and Li, J.: Review of the influencing factors of secondary organic aerosol formation and aging mechanism based on photochemical smog chamber simulation methods, J. Environ. Sci., 123, 545–559, https://doi.org/10.1016/j.jes.2022.10.033, 2023b.
Zhao, W., Bao, H., Peng, L., Du, M., Li, K., Zhan, X., Li, S., Tian, L., Huang, D., Zou, W., Yang, J.-Y. T., and Kao, S.-J.: Transport of dissolved black carbon in three estuaries in China: Roles of flood‐ebb tides and submarine groundwater discharge, Global Biogeochem. Cycles, 39, https://doi.org/10.1029/2025gb008532, 2025.