
the Creative Commons Attribution 4.0 License.
the Creative Commons Attribution 4.0 License.
 | 20 Nov 2026
Environmental moisture and stability controls on raindrop size distribution within convective clouds under sheared conditions

Environmental conditions significantly influence the intensity of organised convective systems. However, variations in factors such as temperature, humidity, and vertical wind shear suggest that non-linear relationships may exist between these systems and their environments. To address gaps in these variations, it is crucial to understand the cloud microphysical processes inherent to convective systems. In this study, we conducted numerical experiments using the Weather Research and Forecasting model in idealised setups with a spectral-bin microphysical scheme that explicitly handles drop-size distributions. The initial conditions included variations in humidity, temperature lapse rate, and vertical wind shear that reflect observed relationships. The results showed that larger temperature lapse rates produced larger raindrops, resulting in stronger rainfall intensity. Increased moisture in the lower troposphere led to stronger rainfall intensity, driven by a larger concentration of smaller raindrops and increased liquid water content. The magnitude of vertical wind shear generally causes fluctuations in the drop size distribution within convective clouds. In particular, weaker vertical wind shear tends to inhibit convective cloud propagation, reduce raindrop evaporation under very humid conditions, and reduce vertical variations in the drop-size distribution within them, thereby increasing rainfall amounts at the surface. These findings provide valuable insight into the link between mesoscale environments and dominant microphysical properties and could improve both operational quantitative precipitation estimation and the microphysical schemes used in numerical weather models, especially in heavy-rain events.
- Article
(3897 KB) - Full-text XML
- BibTeX
- EndNote


The intensity of organised precipitating systems, including mesoscale convective systems, has been diagnosed using indicators such as updraughts and rainfall intensity. Differences in updraughts have been investigated to show distinct variations between the tropics and mid-latitudes, resulting from differences in buoyancy fields (e.g., Lucas et al., 1994). This point has also been examined in numerical experiments simulating squall lines (e.g., James et al., 2006; Houston and Niyogi, 2007; Takemi, 2007). Much previous research has focused on phenomena associated with strong updraught regions, such as supercells and squall lines, primarily occurring over the United States Great Plains (e.g., Morrison et al., 2012; Xue et al., 2017; Kumjian et al., 2014), where processes involving the ice phase can be significant (Morrison et al., 2015). Conversely, for extreme heavy rainfall associated with weaker updraughts, processes involving warm rain below the melting layer have been highlighted as crucial (e.g., Ding et al., 2023; Wang et al., 2023; Gupta et al., 2023). Particularly in Japan, the importance of a moist environmental field for convective clouds producing heavy rain has been investigated (e.g., Unuma and Takemi, 2016a; Kato, 2020).
Convective systems in humid environments have been found to exhibit varying development altitudes for convective clouds, primarily depending on the surrounding atmosphere's humidity (e.g., Johnson et al., 1999; Kikuchi and Takayabu, 2004). In Japan, it has been noted that such moist lower-level conditions can be favourable for the development of slow-moving convective systems (Unuma and Takemi, 2016a, b). Takemi (2015) showed that in moist environments, numerous vertical flow cores can exist with little dilution from the surrounding air. Li et al. (2017) demonstrated that lower-level moisture leads to a monotonically increasing total rainfall, followed by the formation of a cold air mass near the surface that restricts the development of subsequently emerging convective clouds. Schumacher (2015) showed that even slight variations in near-surface water vapour content can significantly influence surface rainfall. Schumacher and Peters (2017) further conducted experiments in which they applied a slight increase in water vapour content to the initial conditions. The results showed that the rainfall amount generated by the convective system increased as the water vapour perturbation grew larger; however, the change in precipitation did not vary proportionally with the magnitude of the water vapour perturbation. The fact that both the amount and location of the convective system's precipitation are highly sensitive to slight changes in low-level water vapour indicates that even minor water vapour errors in numerical weather prediction models can lead to significant errors in predicting convective system location and behaviour. From a forecasting perspective, Kato et al. (2003) conducted numerical simulations of heavy rainfall events that were forecast incorrectly during a specific observation period, indicating the importance of water vapour accumulation in the lower troposphere. These effects should be discussed, including cloud microphysical properties.
Rainfall intensity, as an integral value from the perspective of drop-size distribution (DSD), is expected to show apparent differences between the tropics and mid-latitudes in both drop size and number concentration (e.g., Bringi et al., 2003; Dolan et al., 2018; Unuma et al., 2025). Regarding DSDs, Kumjian et al. (2014) examined that parameterisations commonly used in cloud microphysical schemes may yield distributions sensitive to rainfall intensity and biased towards tropical conditions compared to mid-latitude conditions. Seifert et al. (2005) demonstrated that including the collisional breakup characteristics reduces surface rainfall intensity but enhances the convection that is subsequently generated. Morrison et al. (2012) showed that domain-averaged precipitation increases when the collisional breakup process is efficient. Diehl et al. (2025) proposed a re-parameterisation of collisional breakup characteristics based on laboratory experiments and evaluated its impact using cloud models. They showed that including collisional breakup reduces the number of maximum raindrops, delays precipitation onset, decreases total rainfall, and locally alters precipitation distribution. Such nonlinear relationships may be inherent within convective systems; however, few studies have examined these effects whilst accounting for environmental conditions in the surrounding atmosphere.
From the perspective of Quantitative Precipitation Estimation (QPE), when translating observed values at specific altitudes into areal distributions of surface rainfall, it is essential to capture variations in the vertical distribution of DSDs as accurately as possible. In QPE, adjustments are made by applying appropriate precipitation-observation relationships, correcting for horizontal advection and vertical effects, and applying adjustments based on rain gauge data. Among these, the Japan Meteorological Agency's QPE system, due to its high density of rain gauges, incorporates not only appropriate precipitation-observation relationships but also horizontal and vertical corrections through rain gauge adjustments (Nagata, 2011). On the other hand, since it is necessary to wait for rain gauge data to be received during product generation, timeliness is often compromised. Furthermore, actual physical processes can occur at scales smaller than the observational resolution. Fortunately, the deployment of polarimetric radar is progressing in many countries, making high-temporal and spatial resolution observational data increasingly available. Especially in Japan, it has become clear that vertical variations of DSDs are significant, as investigated in Unuma et al. (2023) and Unuma (2024, 2025), suggesting that vertical corrections are important for QPE. In this regard, research on vertical variations related to cloud microphysical processes has been conducted from various perspectives.
Hu and Srivastava (1995) demonstrated that incorporating raindrop evaporation effects into the rain shaft model narrows the spectral width of a DSD. Li and Srivastava (2001) found that whilst evaporation has a negligible effect on the large-diameter side of the DSD, allowing it to approximately maintain an exponential distribution, its impact on the number concentration at the small-diameter side is significant. Consequently, the mean diameter of the DSD may increase. Seifert (2008) found that evaporation fundamentally reduces both the spectral width and the mass-weighted mean diameter on the DSD. However, when the raindrop size distribution contains a large proportion of drizzle-sized droplets, the removal of droplets and their conversion to raindrops cancel each other out, keeping the spectral width and mass-weighted mean drop size nearly constant. Xie et al. (2016) showed that raindrops smaller than 1 mm in diameter tend to evaporate as they fall towards the ground when the relative humidity near the ground is relatively low (<60 %). The estimated rainfall intensity at an altitude of ∼ 2 km tends to decrease near the ground as the differential reflectivity (ZDR) value decreases. Paukert et al. (2019) demonstrated that the shape of a raindrop size distribution is primarily determined by sedimentation and evaporation. However, in heavy rain, it is significantly influenced by collisional coalescence and collisional breakup of raindrops rather than evaporation. These results suggest that, whilst raindrop size distributions are generally susceptible to evaporation, this is not necessarily the case during heavy rain.
At present, the correlations between environmental conditions and the DSD parameters are known to exist as an observational fact (Unuma, 2025): Median volume diameter tends to increase when the temperature lapse rate is high; liquid water content tends to increase when the amount of water vapour in the lower atmosphere is high; and median volume diameter tends to be large when vertical shear of horizontal wind is strong, whilst generalised intercept parameter tends to be large when vertical wind shear is weak. However, the physics linking the environmental conditions of the surrounding atmosphere to cloud microphysical processes in a convective cloud is not yet fully understood. With the use of polarimetric weather radar, whilst it is an observational fact, only a snapshot at a specific time can be captured. Conversely, numerical simulations can detail these characteristics three-dimensionally, including temporal evolution, thereby significantly advancing meteorological and physical interpretation. From this perspective, it becomes possible to elucidate not only the correlation itself but also the underlying physical processes driving it. Unlike bulk methods constrained by a DSD, this approach allows pure characterisation of cloud microphysical responses to environmental conditions across diverse scenarios.
The aim of this study is to investigate relationships between cloud microphysical processes and their response to the environmental conditions of the surrounding atmosphere, as provided by the initial profile, including the underlying physical processes. Section 2 describes the experimental design used in this study. The main results are described in Sect. 3, divided into four subsections: Sect. 3.1 gives horizontal structures of the simulated convective clouds obtained in this study, Sect. 3.2 shows the rainfall statistics, as well as in-cloud properties of the systems in Sect. 3.3, and vertical profiles of a DSD within the systems in Sect. 3.4, respectively. In Sect. 4, responses of environmental conditions to in-cloud properties, the effects of raindrop breakup and evaporation, and their implications for QPE are discussed. Finally, Sect. 5 describes a summary of the main results in this study.
2.1 Numerical setup
The cloud-resolving numerical model used was version 4.5.2 of the Advanced Research for Weather Research and Forecasting model (Skamarock et al., 2019). The computational domain was set to 80 km × 80 km horizontally and 20 km vertically. The horizontal grid spacing was set to 250 m, and the vertical grid spacing was set to achieve an average of 140 m. As a boundary condition, a Rayleigh damping layer was set at 7 km from the top to suppress reflection of gravity waves by convection. The lower boundary was set to no friction. Lateral boundary conditions were treated as open, following the approach of Klemp and Wilhelmson (1978) and Klemp and Lilly (1978). Initial conditions were based on a heavy rain-producing convective cloud case near Kumagaya in eastern Japan investigated by Unuma et al. (2023). The sounding data shown in Fig. 1 were created from a grid point near Kumagaya using the Japan Meteorological Agency's Mesoscale Model and applied horizontally homogeneously as an initial condition (CNTL experiment). The convective cloud was initialised with a warm bubble centred in the domain with a maximum temperature perturbation of 3 K.

Figure 1Skew T–log p diagrams of the initial condition for the control (CNTL) experiment in this study.
To focus on the dynamics of individual convective clouds, the physical processes were simplified to include only cloud microphysics and boundary-layer turbulence schemes, i.e., excluding cumulus, radiation, land surface, and surface layer schemes. The Coriolis force was neglected as well. For cloud microphysics, the Spectrum bin scheme developed at the Hebrew University (hereafter WRF-SBM) was used (Shpund et al., 2019). The changes in DSDs caused by collisions among raindrops, as well as between raindrops and ice particles, and among ice particles themselves, are calculated by solving stochastic collection equations (Khain and Sednev, 1995, 1996) using the low dissipation method proposed by Bott (1998). The collision efficiencies and collision kernels for raindrop-raindrop, graupel-raindrop, and hail-raindrop interactions were calculated offline using an advanced superposition method (Khain et al., 2001, 2004; Pinsky et al., 2001). The breakup of drops occurs through two mechanisms: spontaneous breakup and collisional breakup. The probabilities associated with spontaneous breakup and the resulting fragment distribution are derived from laboratory measurements (Kamra et al., 1991). Additionally, the changes in the size distribution function due to collisional breakup are calculated according to the method of Seifert et al. (2005). Diffusion rates for growth and evaporation, as well as deposition and sublimation, are calculated by solving supersaturation equations for liquid water and ice using an analytic solution. Changes in drop mass are determined through time integrals of supersaturation with microphysical time steps that are much shorter than the dynamical time step. After these processes, drop sizes often do not match points on the regular logarithmic mass grid. To resolve this, the sizes were remapped using a method that conserves three moments of the size distributions, which helps reduce artificial broadening of the droplet spectrum (Khain et al., 2008). Regarding cloud microphysical processes, whilst calculations that include all processes handled by WRF-SBM were performed, this study focuses on the warm rain process within this framework, as highlighted in Sect. 1. For the boundary-layer turbulence scheme (Deardorff, 1980), which solves the turbulence energy at 1.5th order, was used. All simulations conducted in this study were integrated for 2 h with the large time step of 2 s and the output interval was every 1 min.
2.2 Sensitivity experiments
Based on observational relationships obtained in Unuma (2025), the experiments of increasing or decreasing the relative humidity in the layer below the lifting condensation level by up to 2 % but keeping the other profile as in CNTL (RH experiment: RH-D and RH-M in Fig. 2); of changing the temperature lapse rate in the layer above the lifting condensation level by up to 2 K km−1 but keeping the other profile as in CNTL (TLR experiment: TLR-N and TLR-U in Fig. 2); and of varying the wind speed throughout the troposphere to 0.5 or 1.5 times its original value (SH experiment: SH-W and SH-S in Fig. 3) were conducted. The TLR experiment was conducted primarily because there is a positive correlation between the magnitude of the temperature lapse rate and the drop size within convective clouds (Unuma, 2025); such numerical experiments (e.g., Houston and Niyogi, 2007; Takemi, 2007; Sueki, 2024) have been conducted with similar assumptions. The RH experiment was conducted primarily because there is a positive correlation between water vapour content near the surface and rainfall (Unuma, 2025); the numerical experiments (e.g., Kato et al., 2003; Schumacher, 2015) have been performed under similar assumptions. Table 1 summarises the environmental parameters of surface-based convective available potential energy and precipitable water obtained from these initial profiles. The SH experiment was conducted primarily because there is a positive (negative) correlation between the magnitude of the vertical wind shear of the horizontal wind within the troposphere and the drop size (number concentration) (Unuma, 2025). Here, to vary the magnitude of vertical wind shear, both u- and v-component winds were changed simultaneously. Since altering the hodograph shape was found to affect the temporal evolution of the original convective cloud significantly, we decided not to change the hodograph shape this time and varied only the magnitude of the vertical wind shear. The vertical wind shear of the horizontal wind speed averaged between 0 and 3 km was used and evaluated among SH experiments as in Rasmussen and Blanchard (1998) and Unuma and Takemi (2016a).
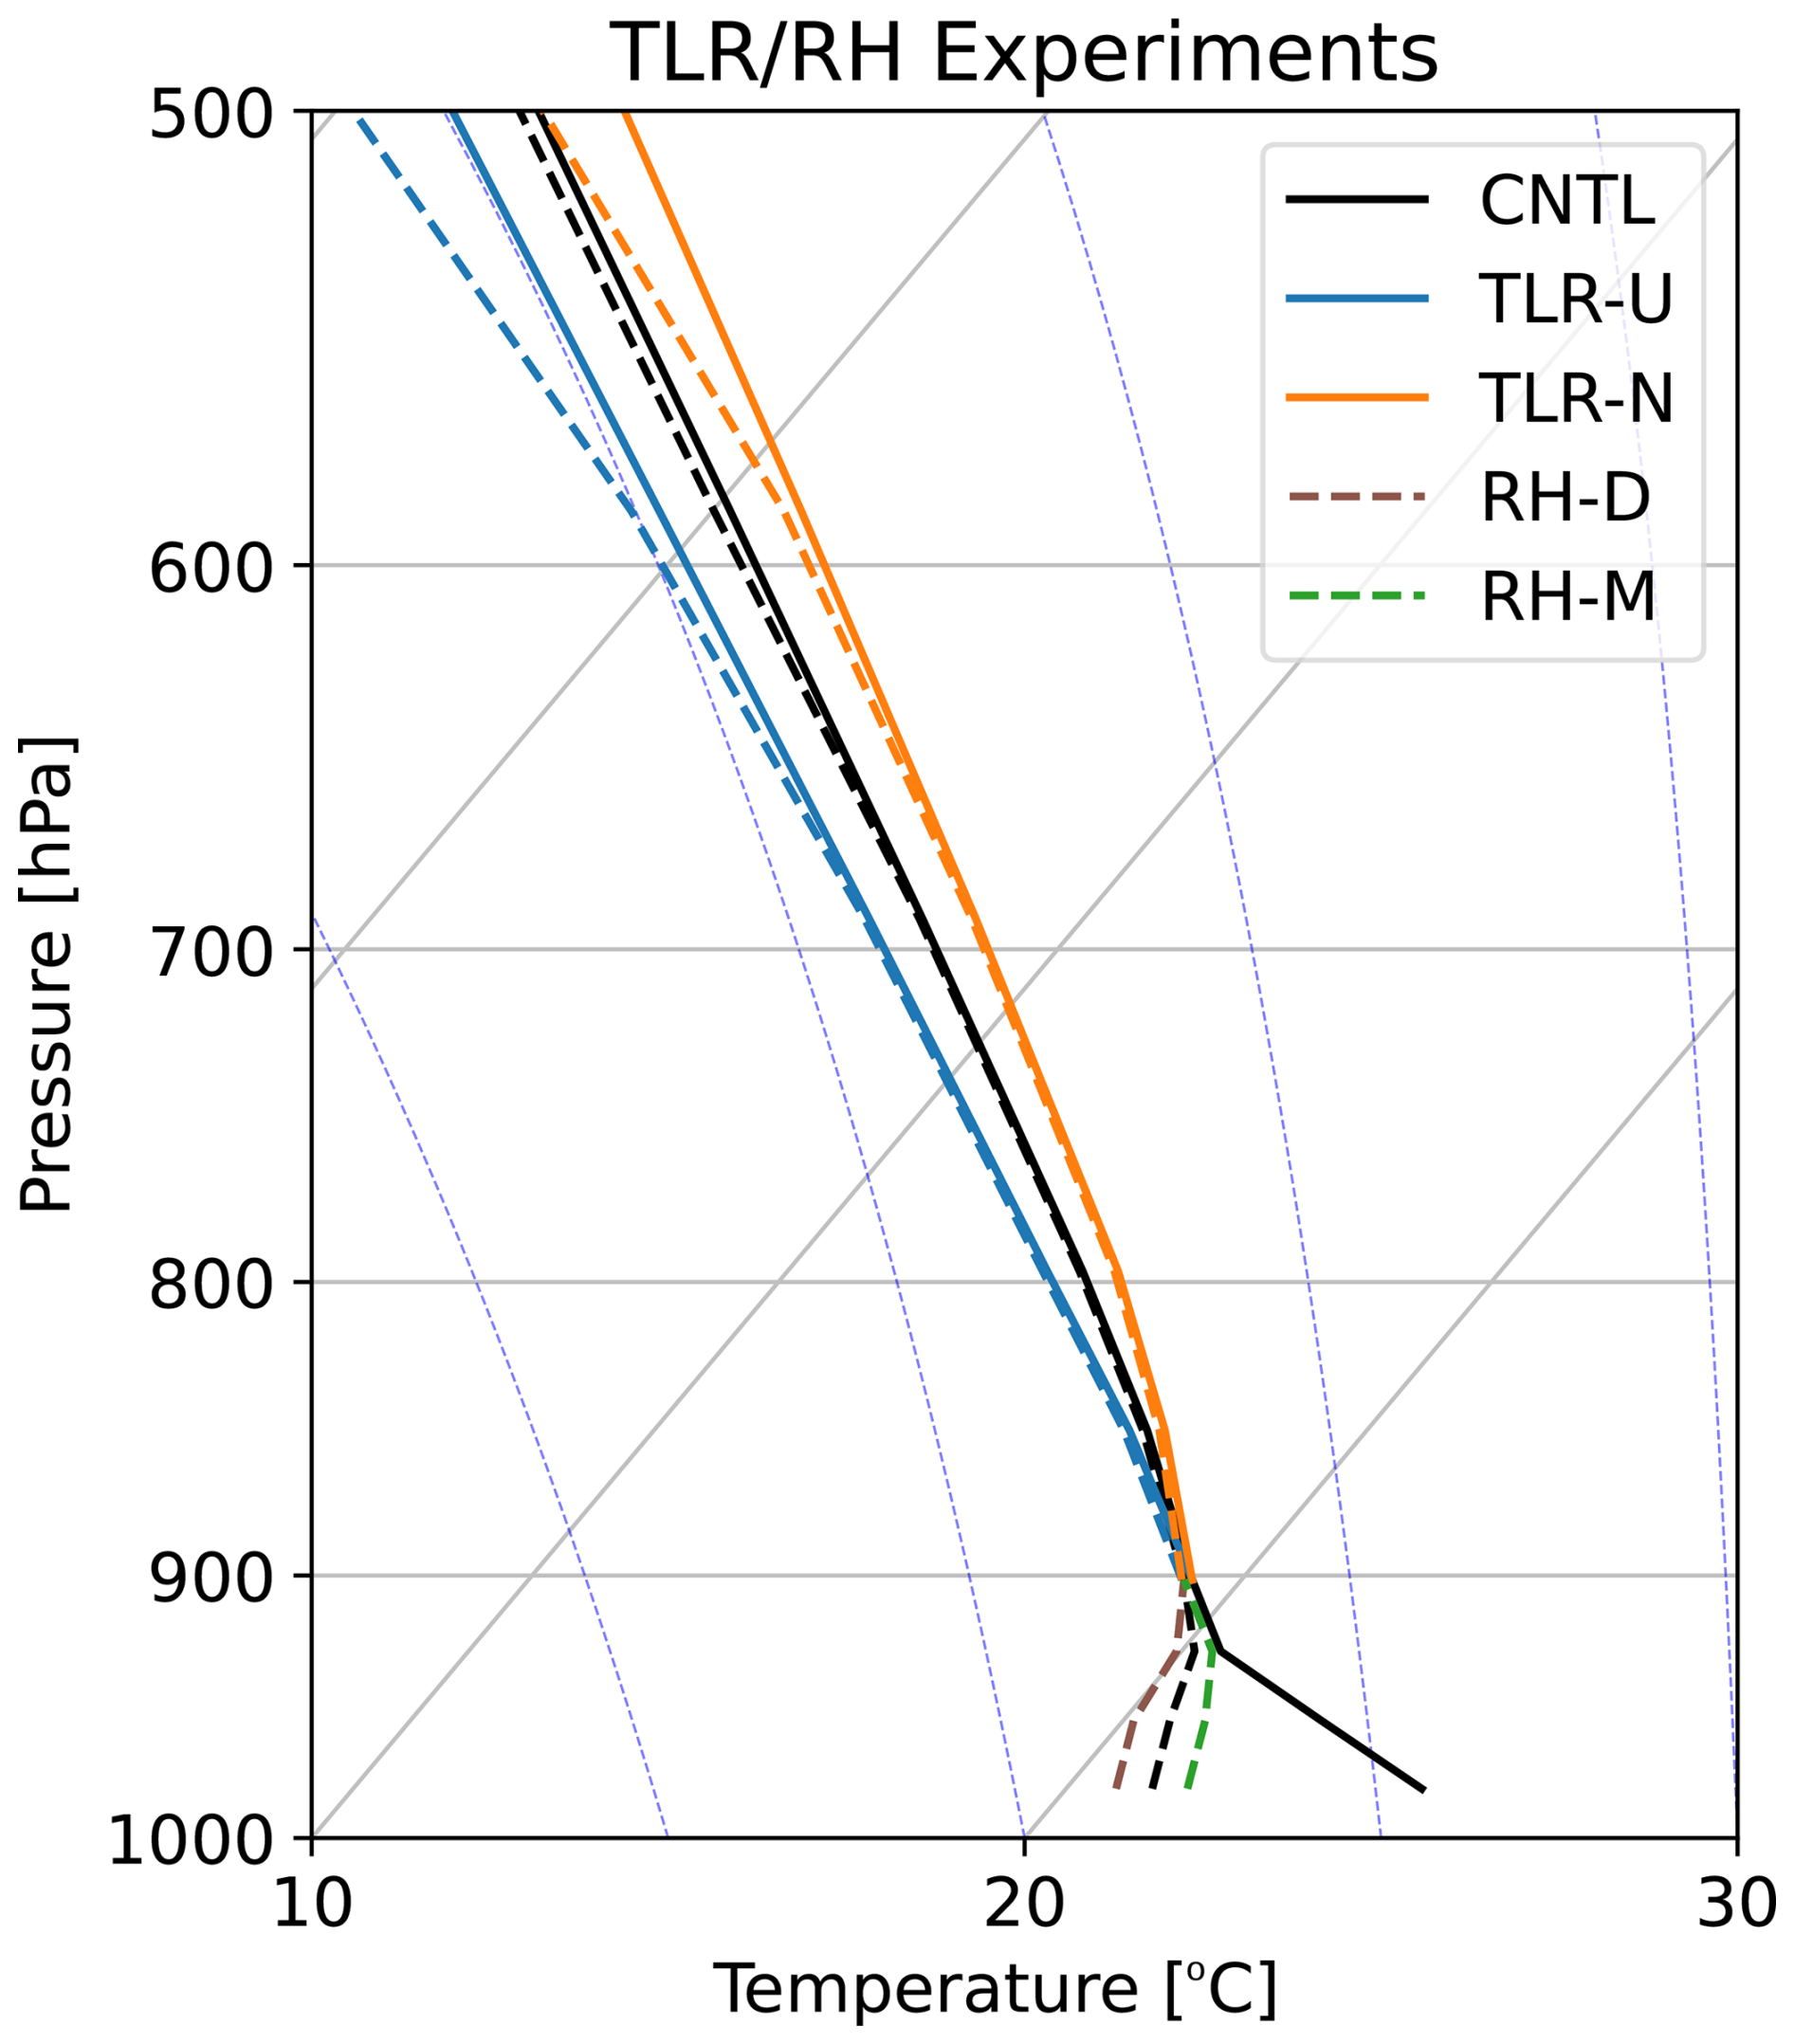
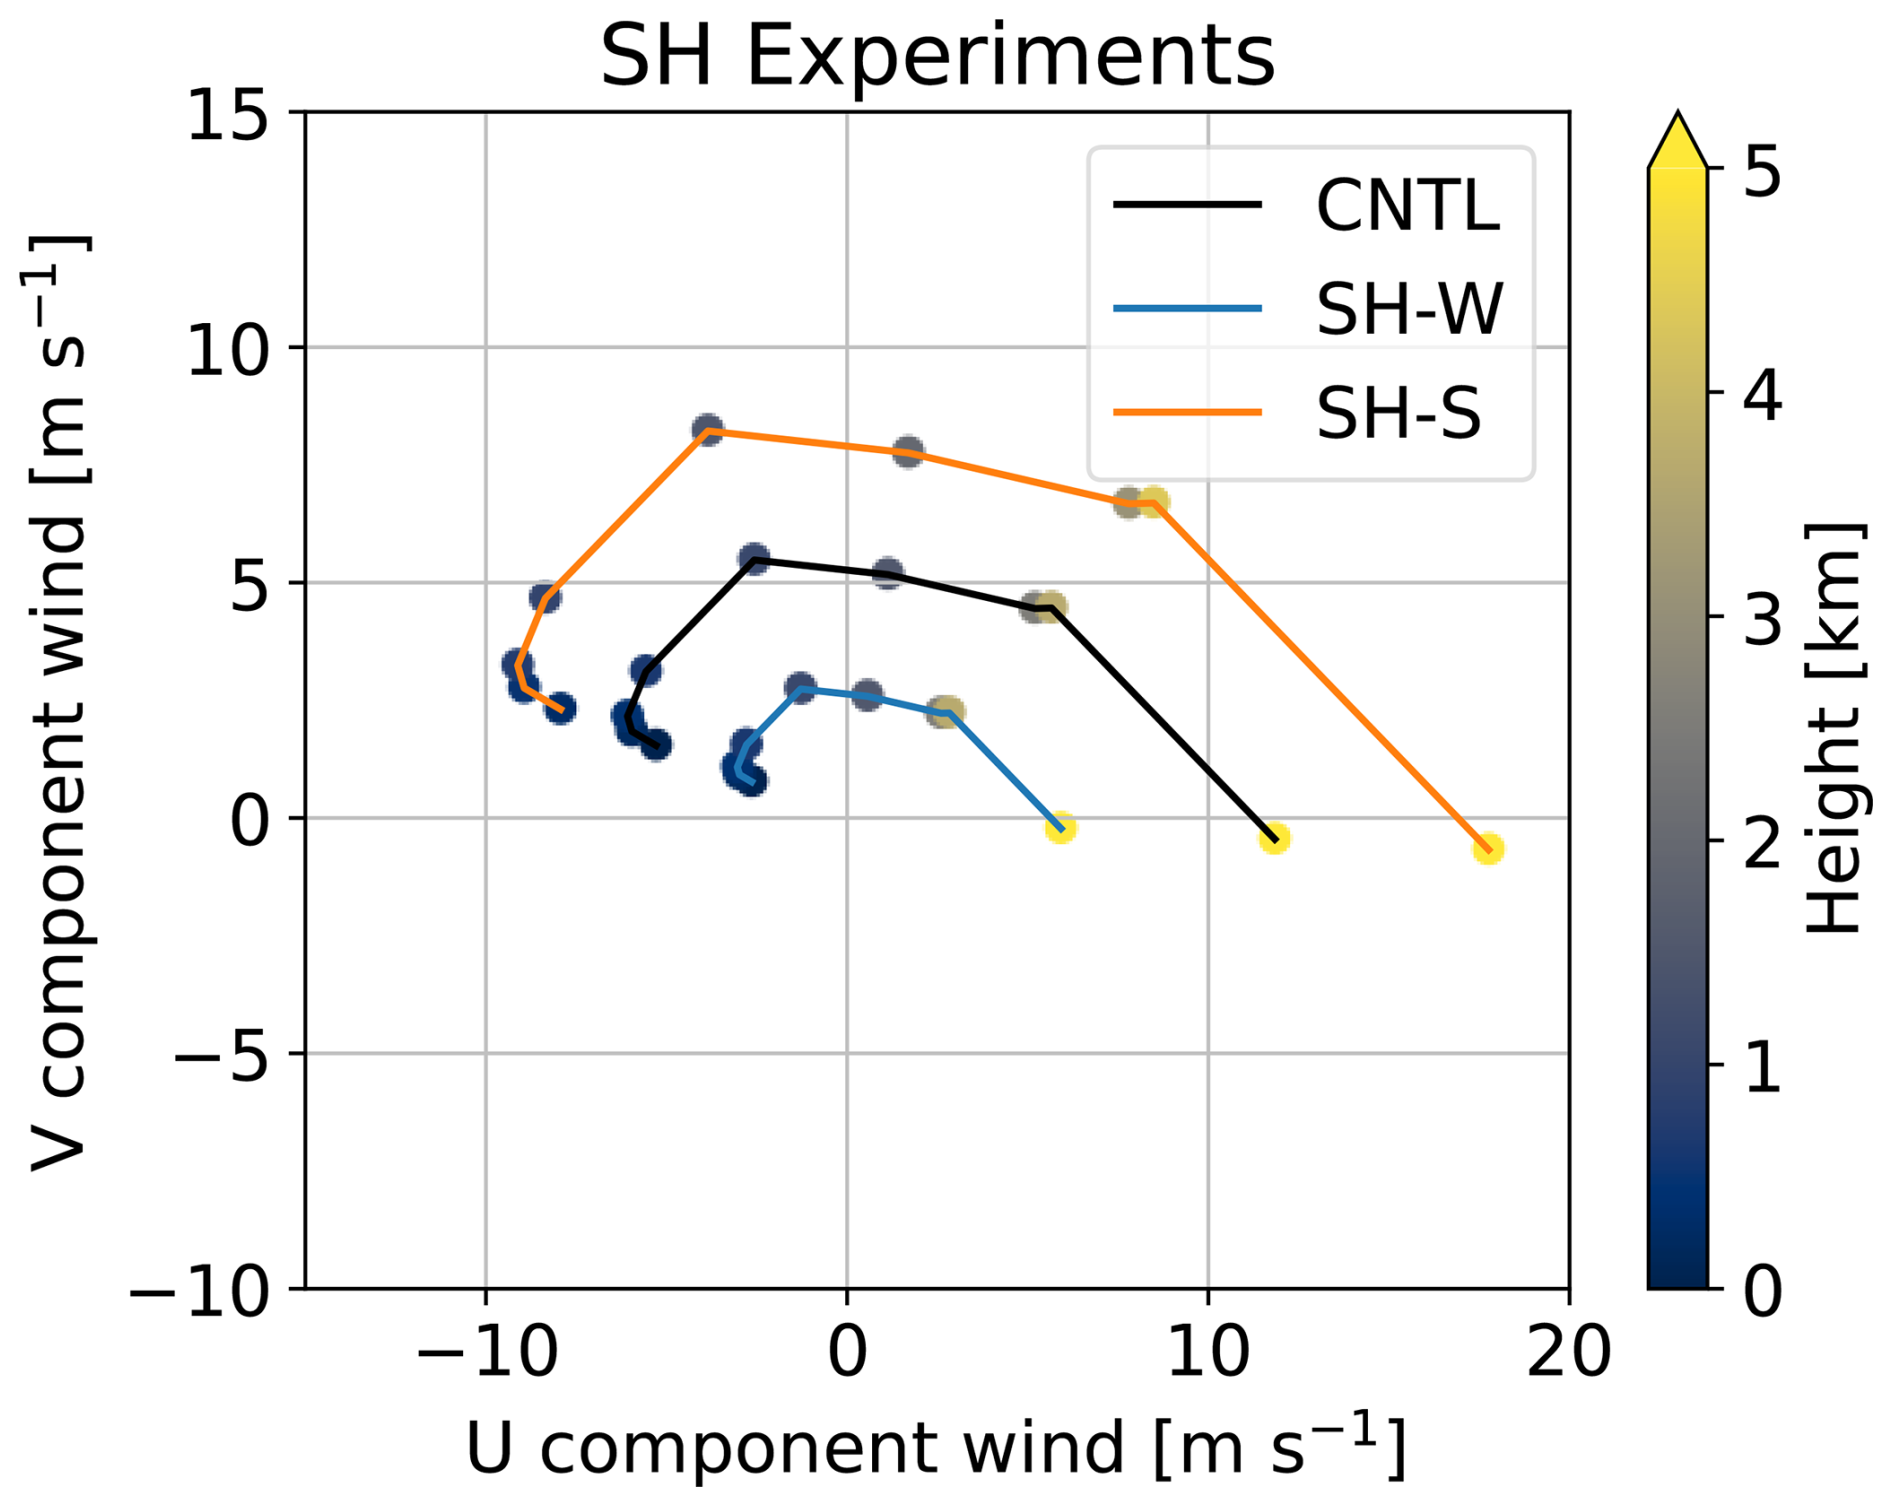
Figure 3Hodographs for CNTL, weaker vertical wind shear (SH-W), and stronger vertical wind shear (SH-S) experiments.
Table 1Environmental parameters of surface-based convective available potential energy (sbCAPE; J kg−1) and precipitable water (PW; mm) calculated from the initial profiles of the CNTL, TLR-N, TLR-U, RH-D, and RH-M experiments.

2.3 DSD parameters for raindrops
In WRF-SBM, number concentration (# kg kg−1) in each bin can be archived with the output variables of ff1inn (nn is ranging from 01 to 33), where 01–16 bins represent cloud category (i.e., actual sizes are ranging from 4 to 160 µm in diameter) and 17–33 bins represent rain category (i.e., actual sizes are ranging from 0.20 to 6.6 mm in diameter), respectively. To obtain DSD (n(D)) from the ff1inn variables, n(D) is calculated as
where 𝚏𝚏1𝚒(D) is equivalent to ff1inn but bin diameter D (mm) oriented expression, Mcloud,rain(D) is the mass of liquid drops (kg), ρcloud,rain(D) is the density of liquid drops for dry air (kg m−3), and ΔD is the drop-size spread (mm) in diameters, respectively. For the retrieval of DSD parameters on raindrops, i.e., the mass-weighted volume diameter (Dm; mm), the generalised intercept parameter (Nw; ), the shape parameter (μ; unitless), and the liquid water content (LWC; g m−3), are calculated assuming the normalised gamma distribution using a moment-based calculation (Hardin and Guy, 2017) as following procedures. This method handles a DSD as normalised moments and is widely used to analyse the size distribution of raindrops. The normalised gamma distribution (e.g., Testud et al., 2001) is expressed as follows;
where Nw and f(μ) are defined as
and
Here, μ is the shape parameter, ρw is the density of water (g m−3), and Γ is the Gamma function. μ (unitless) is formulated as
where F is defined as
according to Kozu and Nakamura (1991). LWC and Dm are obtained from the following equations;
and
The bin ranges from 17 to 33, whose sizes are ranging from 0.20 to 6.6 mm in diameter, were selected for retrieving the parameters because the parameters were envisaged to raindrops following previous studies (e.g., Seliga and Bringi, 1976; Gorgucci et al., 2000; Testud et al., 2001; Zhang et al., 2001; Thurai et al., 2008; Unuma et al., 2025). Rainfall intensity R (mm h−1) is calculated from the simulated DSD data with the following equation:
2.4 Identification and tracking of simulated convective clouds
Individual convective clouds were detected and tracked using tobac algorithm version 1.5.5 (Sokolowsky et al., 2024) as in Unuma (2025). tobac algorithm identifies peak positions in the region above or below a specified threshold value at each time step, referred to as a “feature”. The area occupied by this feature is determined through a process called “segmentation”, which utilises a water shedding algorithm (Carpenter et al., 2006; van der Walt et al., 2014) to establish boundaries both horizontally and vertically. A set of features is tracked over time using the method described by Crocker and Grier (1996). Each feature or group of features is defined as a “cell”, with the path it follows referred to as a “track”, assessed in three dimensions. In this study, cells were used to analyse the distinct characteristics of convective clouds that resulted in heavy rainfall at the model surface.
3.1 Horizontal structures of simulated convective clouds with the environmental sensitivities
Figure 4 shows the horizontal distribution of the accumulated rainfall for the calculation period. The maximum value of the accumulated rainfall increases by 38 % when the temperature lapse rate is high (TLR-U), whilst it decreases by 79 % when the temperature lapse rate is low (TLR-N). The rainfall area expands slightly northward under higher temperature lapse rates (TLR-U) but shrinks significantly under lower temperature lapse rates (TLR-N). The effect of vertical wind shear under high-temperature lapse-rate conditions was also examined. The rainfall area is larger when the vertical wind shear is strong (Fig. 4d). When vertical wind shear is weak (Fig. 4f), maximum rainfall tends to occur farther southwest than in CNTL. Notably, when the temperature lapse rate is high and vertical wind shear is weak, accumulated rainfall is the highest among the TLR experiments, and the rainfall area is narrower than in the stronger shear case.

Figure 4Horizontal distribution of 2 h accumulated rainfall (mm) for CNTL, TLR-N, TLR-U, TLR-N & SH-W, TLR-U & SH-W, TLR-N & SH-S, and TLR-U & SH-S experiments. White crosses displayed in each panel are the points where the maximum value of the accumulated rainfall is simulated.
When relative humidity in the lower troposphere is low (RH-D), the maximum value of the accumulated rainfall decreases by 23 % (Fig. 5e). By contrast, it increases by 62 % (Fig. 5b) when relative humidity is high (RH-M). The rainfall area remains largely unchanged, though it slightly decreases when lower-troposphere relative humidity (RH-M) is high. The effect of vertical wind shear is confirmed when lower-troposphere relative humidity is low. In both cases, the maximum value of the accumulated rainfall is lower than in CNTL; however, the rate of decrease is higher when vertical wind shear is strong (SH-S) and lower when it is weak (SH-W). The location where the peak value occurs is also slightly biased southwestward compared to when the vertical wind shear is weak (SH-W), and the rainfall area is significantly narrower. This trend is quite similar to TLR experiments.

3.2 Rainfall statistics
Figure 6 shows the time series of the maximum rainfall intensity within the domain. The temperature lapse rate of the surrounding atmosphere directly influences rainfall intensity. Specifically, when the temperature lapse rate is high (TLR-U), rainfall intensity tends to reach higher maximum values compared to CNTL. The strength of vertical wind shear acts in a direction that increases rainfall intensity. In contrast, when the temperature lapse rate is low and close to neutral (TLR-N), rainfall onset is generally delayed, and the intensity is weaker. Notably, the maximum rainfall intensity decreases with increasing vertical wind shear strength, unlike other trends.

Figure 6Time series of the rainfall intensity maxima (Rmax; mm h−1) within the domain for TLR and SH experiments.
Similarly, the cases of low level moisture are shown (Fig. 7). Overall, maximum rainfall intensity increases sharply around 30 min after the start of the calculation, whilst no extreme fluctuations occur after 50 min. In cases of strong shear (RH-D & SH-S and RH-M & SH-S), the rise in rainfall intensity is faster, and the maximum rainfall intensity is larger compared to CNTL. However, these intensities tend to be stronger when the lower troposphere is moist. When vertical wind shear is weak (RH-D & SH-W and RH-M & SH-W), rainfall onset is delayed, and its maximum intensity is lower than in CNTL. In this scenario, the maximum rainfall intensity decreases as the moisture content in the lower troposphere decreases.

To gain a more quantitative understanding of the horizontal distribution trends shown in the previous subsection, the maximum rainfall intensity statistics and the domain statistics of accumulated rainfall were examined. Figure 8a shows box-and-whisker plots of the maximum rainfall intensity within the computational domain, calculated using data from the latter half of the simulations, to verify the steady state characteristics shown in Figs. 6 and 7. The maximum rainfall intensity tends to increase with higher relative humidity in the lower troposphere, stronger vertical wind shear, and a higher temperature lapse rate. Conversely, when relative humidity is low and vertical wind shear is weak, the maximum rainfall intensity tends to decrease. However, this trend does not hold when the temperature lapse rate is low. In fact, the maximum rainfall intensity tends to be higher when the vertical wind shear is weak than when it is strong. Nevertheless, these values are smaller than those observed in CNTL.

Figure 8Box-and-whisker plots of the maximum value of rainfall intensity (Rmax; , upper panel) and 2 h accumulated rainfall (Rtot; mm, lower panel) in log10 scale among the experiments. The box extends to the 25th and 75th percentiles, with orange and green lines indicating the median and mean, respectively. The whiskers show the minimum and maximum values.
Figure 8b shows box-and-whisker plots of the accumulated rainfall during the 2 h simulation within the computational domain. In contrast to the maximum rainfall intensity mentioned above, the accumulated rainfall maxima tend to be higher when vertical wind shear is weak, except when the temperature lapse rate is high. When the temperature lapse rate is high, the accumulated rainfall maximum tends to be higher with strong vertical wind shear. However, as confirmed in the horizontal distribution, the maximum value is larger when the vertical wind shear is weak.
In the horizontal distributions, the horizontal spread of accumulated rainfall increases with stronger vertical wind shear (Figs. 4d, g, 5d, and g); however, the interquartile ranges tend to be narrower, and the maximum values are smaller than in the weaker vertical shear conditions (Fig. 8b), which is probably due to broader rainfall distribution. One exception is TLR-U & SH-S, whose interquartile values are slightly larger than those in TLR-U & SH-W, but whose maximum value is smaller than in TLR-U & SH-W. The response to vertical wind shear is not particularly large for the water vapour content, but it is sensitive to temperature lapse rates and vertical wind shear. How do these differences manifest within convective clouds? The case with the rainfall intensity maxima (i.e., the TLR-U & SH-S experiment) and that with the accumulated rainfall maxima (i.e., the RH-M & SH-W experiment) were compared in the following subsection.
3.3 In-cloud properties: DSD parameters
Figure 9 detects and tracks the most developed convective cloud within the computational domain, showing a time-altitude profile near its centre, limited to the period around the peak time. In TLR-U & SH-S, which produced the maximum rainfall intensity among the experiments, Dm ∼3.0 mm or larger are dominant (Fig. 9a), and areas with high Nw values correspond to regions with Dm ∼3.0 mm (Fig. 9d), which are generally similar features to those in CNTL (Fig. 9b and e). In contrast, in RH-M & SH-W, which produces the maximum accumulated rainfall among the experiments, raindrops with Dm of 2.0–3.0 mm are dominant (Fig. 9c), with a particularly high Nw value for Dm of 2.0 mm (Fig. 9f). Areas with high LWC similarly correspond primarily to these high Nw values. Shape parameter μ is also significantly affected by the changes described above. The μ value is generally large (e.g., >3.0) in TLR-U & SH-S and CNTL, whereas it is much smaller (e.g., <2.0, with some areas near zero) in RH-M & SH-W (Fig. 9j, k, and l). These results indicate that, when rainfall intensity is maximised, Dm and μ directly contribute to LWC within the convective cloud (Fig. 9g). Conversely, when accumulated rainfall is maximised, the high Nw value, with relatively smaller Dm and μ values, contributes to LWC within the convective cloud (Fig. 9i).
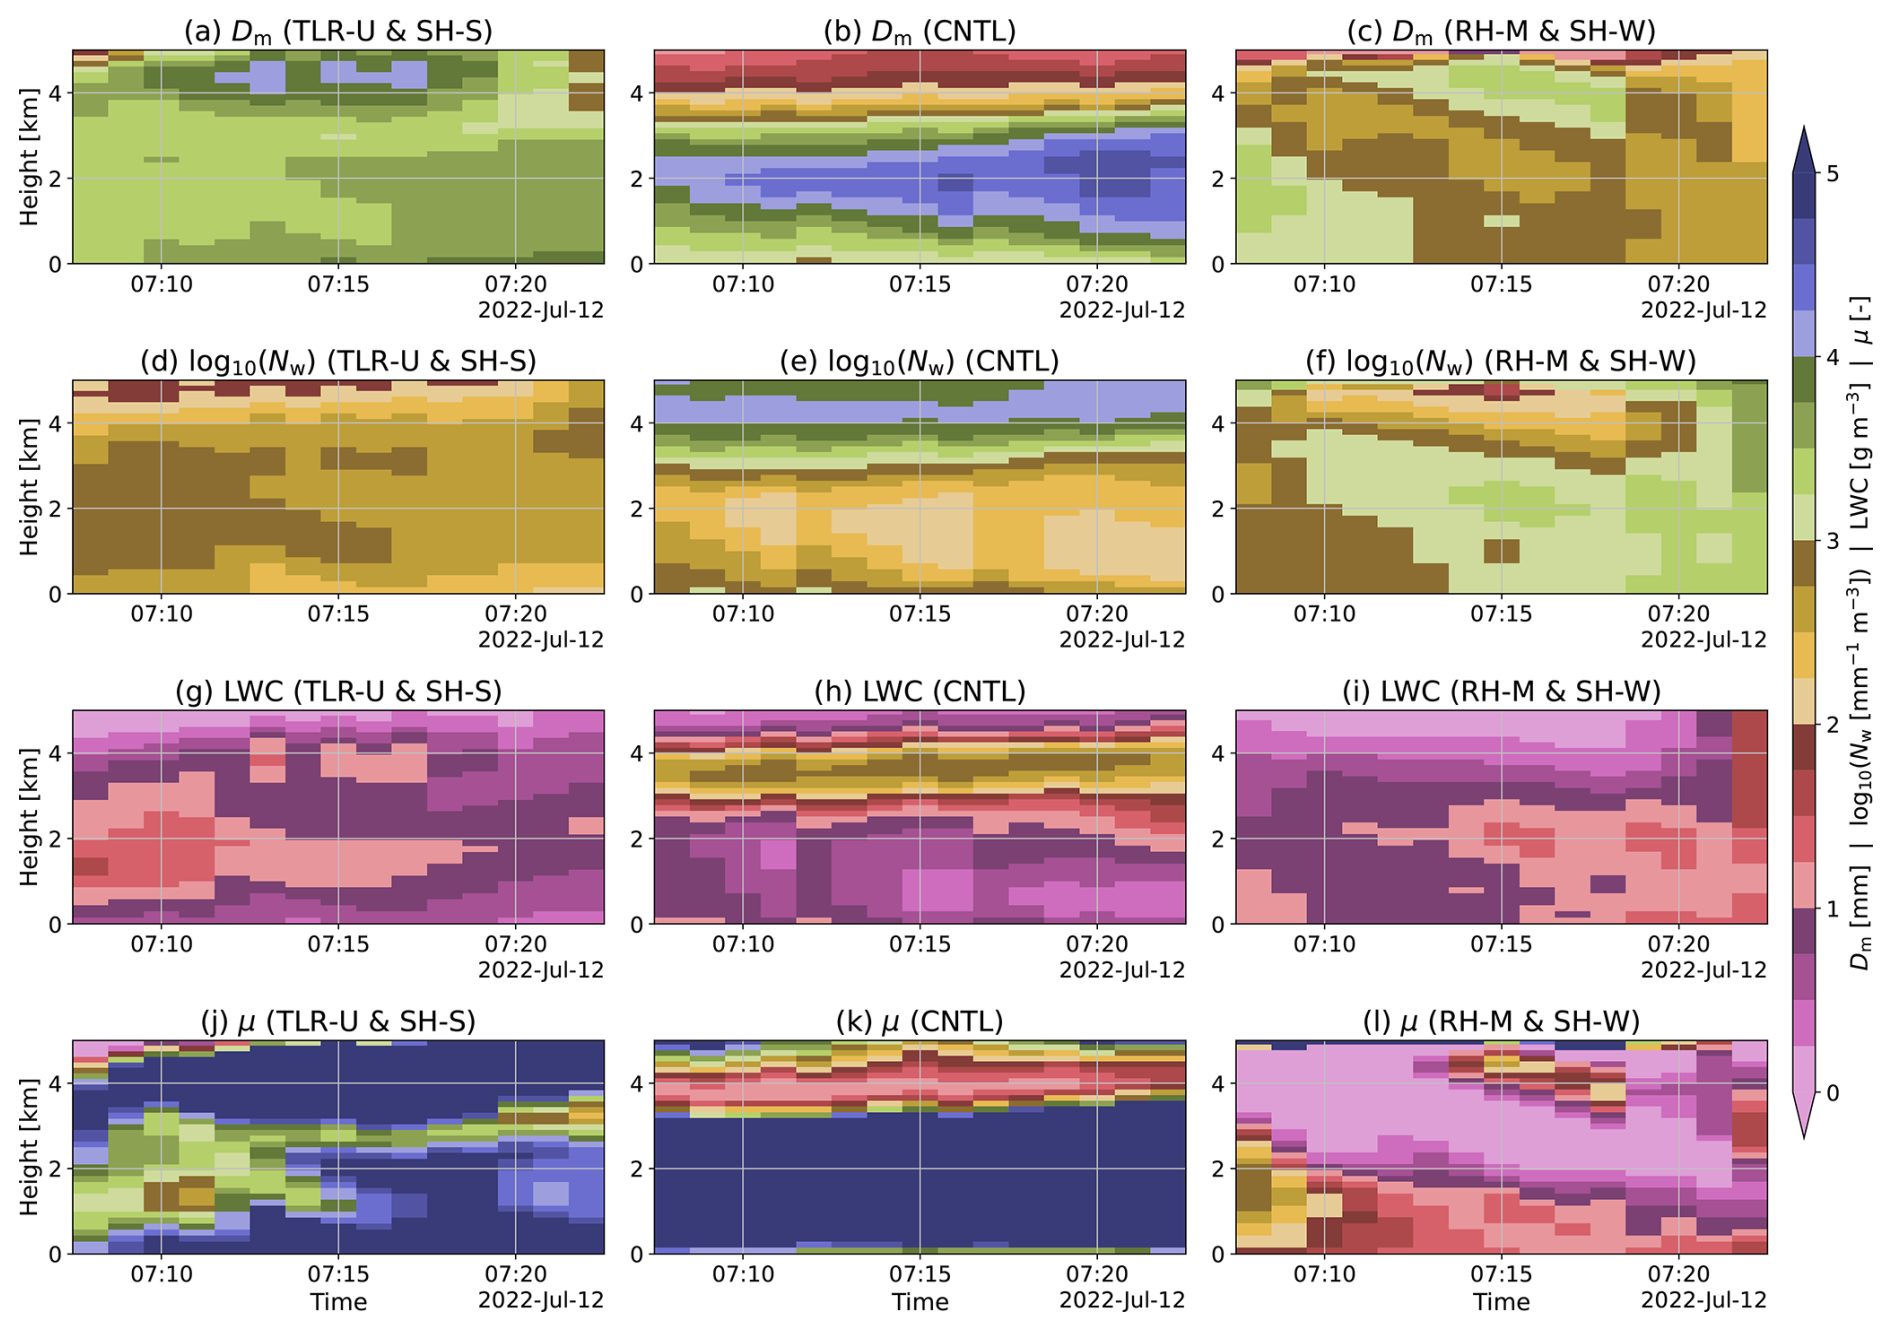
Figure 9Time-height sections of the DSD parameters near the convective cloud centre. The left column shows the TLR-U & SH-S experiment, the centre column shows the CNTL experiment, and the right column shows the RH-W & SH-W experiment. The first row shows the mass-weighted mean diameter (Dm; mm), the second row shows the generalised intercept parameter (Nw; ) on a log10 scale, the third row shows the liquid water content (LWC; g m−3), and the fourth row shows the shape parameter (μ; unitless). These DSD parameters were calculated using a moment-based method which is described in Sect. 2.3. The x-axis in these panels shows time, with the simulation start time set to 06:00 UTC on 12 July 2022.
3.4 Vertical profiles of drop-size distribution
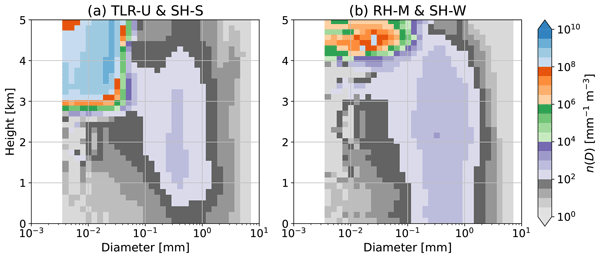
The calculation of DSD parameters is fundamentally based on raindrops (cf., Sect. 2.3) and thus does not include information on cloud droplets. The conversion process of cloud droplets to raindrops and the interactions between cloud droplets and raindrops are important; however, in situ or remote sensing observations are difficult to use to capture these processes precisely due to several instrument limitations (e.g., Unuma, 2025). Here, we aim to understand the DSDs, including cloud droplets, in situations where the spectral-bin microphysics scheme can resolve the processes. Figure 10 shows the vertical profiles of the DSD at peak time for the convective cloud detected and tracked in Fig. 9, presented as a two-dimensional histogram. For the case with maximum rainfall intensity (Fig. 10a), within the 0.2–1 mm drop size range and at altitudes below 4 km, the vertical variation in number concentration is large. Between 4 and 1 km altitude, number concentration increases towards the surface, whereas below 1 km altitude it remains low. For the CNTL experiment, the vertical variation in number concentration is large as well (Fig. 10b). In contrast, for the case with maximum accumulated rainfall (Fig. 10c), within the size range of 0.2–1 mm and below an altitude of 4 km, the vertical variation in number concentration is small, indicating high vertical uniformity.
In summary, within the range of raindrop size distribution, when accumulated rainfall is maximised, vertical variation in the raindrop size distribution is small at its peak. However, when rainfall intensity is maximised, vertical variation in the raindrop size distribution is large, and particularly near the surface, its shape differs significantly from that at higher altitudes. What about cloud droplets? When accumulated rainfall is maximised, droplet number concentration is very high above 4 km altitude, but below that level it decreases gradually towards the surface within the 0.01–0.1 mm size range. When rainfall intensity is at its maximum, cloud droplet number concentration is very high above 3 km altitude. Below this level, however, the number concentration decreases sharply towards the surface. This decrease is particularly pronounced below 1 km altitude than when accumulated rainfall is at its maximum. In contrast, in the CNTL experiment, cloud droplet number concentration is dominantly higher than in the other experiments. These results need to be discussed in light of evaporation effects, which will be described in the following section.

In this section, the effects of environmental conditions in the surrounding atmosphere on cloud microphysical processes within convective clouds were discussed (Sect. 4.1). As mentioned in Sect. 1, the effects of raindrop breakup and evaporation were evaluated (Sect. 4.2), followed by their application to QPE, which was further discussed in Sect. 4.3.
4.1 Responses from environments to in-cloud properties
First, this study's findings on the effects of changes in the temperature lapse rate, low level moisture, and vertical wind shear on the vertical structure of DSDs within convective clouds were discussed. Unuma (2025) showed that drop size tends to increase under conditions of higher temperature lapse rate and stronger vertical wind shear, whilst number concentration tends to increase under conditions of higher moisture content in the lower troposphere and weaker vertical wind shear. Whilst these results were based on observational data, they could not delve into the underlying physical processes as mentioned in Sect. 3.4. The results of this study indicate that the temperature lapse rate fundamentally controls the peak rainfall intensity (Fig. 4). At the same time, the time of peak rainfall intensity is sensitive to vertical wind shear (Fig. 6). Conversely, when the lower troposphere is highly moist, the propagation speed of convective clouds seems to be slowed down according to the peak location of the accumulated rainfall (Fig. 5). Furthermore, the strength of vertical wind shear can control both the speed of convective cloud motion and its maximum intensity (Figs. 5 and 8a). Specifically, as shown in the rainfall intensity time series for temperature lapse rate (Fig. 6) and maximum intensity (Fig. 8a), the maximum rainfall intensity tends to be larger when the temperature lapse rate is high (i.e., more unstable) and when vertical wind shear is strong. This result is also reflected in the DSD parameters, where it fundamentally increases the Dm value (Fig. 9), thereby contributing to the rainfall intensity, which is proportional to the 3.67th moment of the DSD (i.e., Eq. 9). Additionally, regarding the vertical profile of the DSD, its variation becomes larger, characterised particularly by a greater proportion of raindrop evaporation near the surface. On the other hand, the maximum rainfall intensity is not as strongly affected by lower-tropospheric humidity as by the temperature lapse rate (Fig. 7). Rather, the maximum rainfall intensity tends to be controlled by the strength of the vertical wind shear (Fig. 8a). This feature is similar to the previous study (e.g., Li and Xue, 2026). Regarding the characteristics of the DSD parameters, the magnitude of Nw generally increases with rainfall intensity (Fig. 9). Notably, the vertical profile of the DSD shows little significant change (Fig. 10). This result suggests that collisional coalescence and breakup between raindrops may dominate under less evaporative conditions (e.g., Paukert et al., 2019), potentially forming a stationary distribution (e.g., Low and List, 1982; McFarquhar, 2004; Unuma et al., 2025). These effects were not considered in the previous studies (e.g., Kato et al., 2003; Schumacher, 2015; Schumacher and Peters, 2017; Li et al., 2017). These findings emerged only after explicitly evaluating how environmental conditions influence DSDs within convective clouds. The following subsection describes how raindrop breakup and evaporation affect DSDs in convective clouds under different environmental conditions.
4.2 Raindrop breakup and evaporation effects on warm rain processes
Next, the effects of raindrop breakup and evaporation on warm rain processes were further evaluated. For raindrop breakup, the breakup processes mentioned in Sect. 2.1 were turned off and referred to as NOBR. For raindrop evaporation, the evaporation process described in Sect. 2.1 was turned off and referred to as NOEV. Regarding raindrop evaporation, additional experiments with increased low level moisture and decreased vertical wind shear conditions were also conducted.
4.2.1 Raindrop breakup
The statistical values for rainfall were examined for the no breakup (NOBR) experiment (Fig. 11), as in Fig. 8. Both the 75th and 25th percentile values of Rmax are much higher in NOBR than in CNTL. The interquartile range of accumulated rainfall is nearly identical in NOBR and CNTL, but the maximum value is slightly higher in NOBR. In terms of the vertical structure of the DSD within the convective cloud (Fig. 12), the number concentration of raindrops decreases more sharply at altitudes below 2 km in NOBR (Fig. 12a) than in CNTL (Fig. 12c). This can be interpreted as overestimating raindrop collision and coalescence, since large raindrops grow without restriction in the absence of breakup. Consequently, as shown in Fig. 11, this can easily increase rainfall intensity, which is proportional to the 3.67th moment of the DSD (Eq. 9).
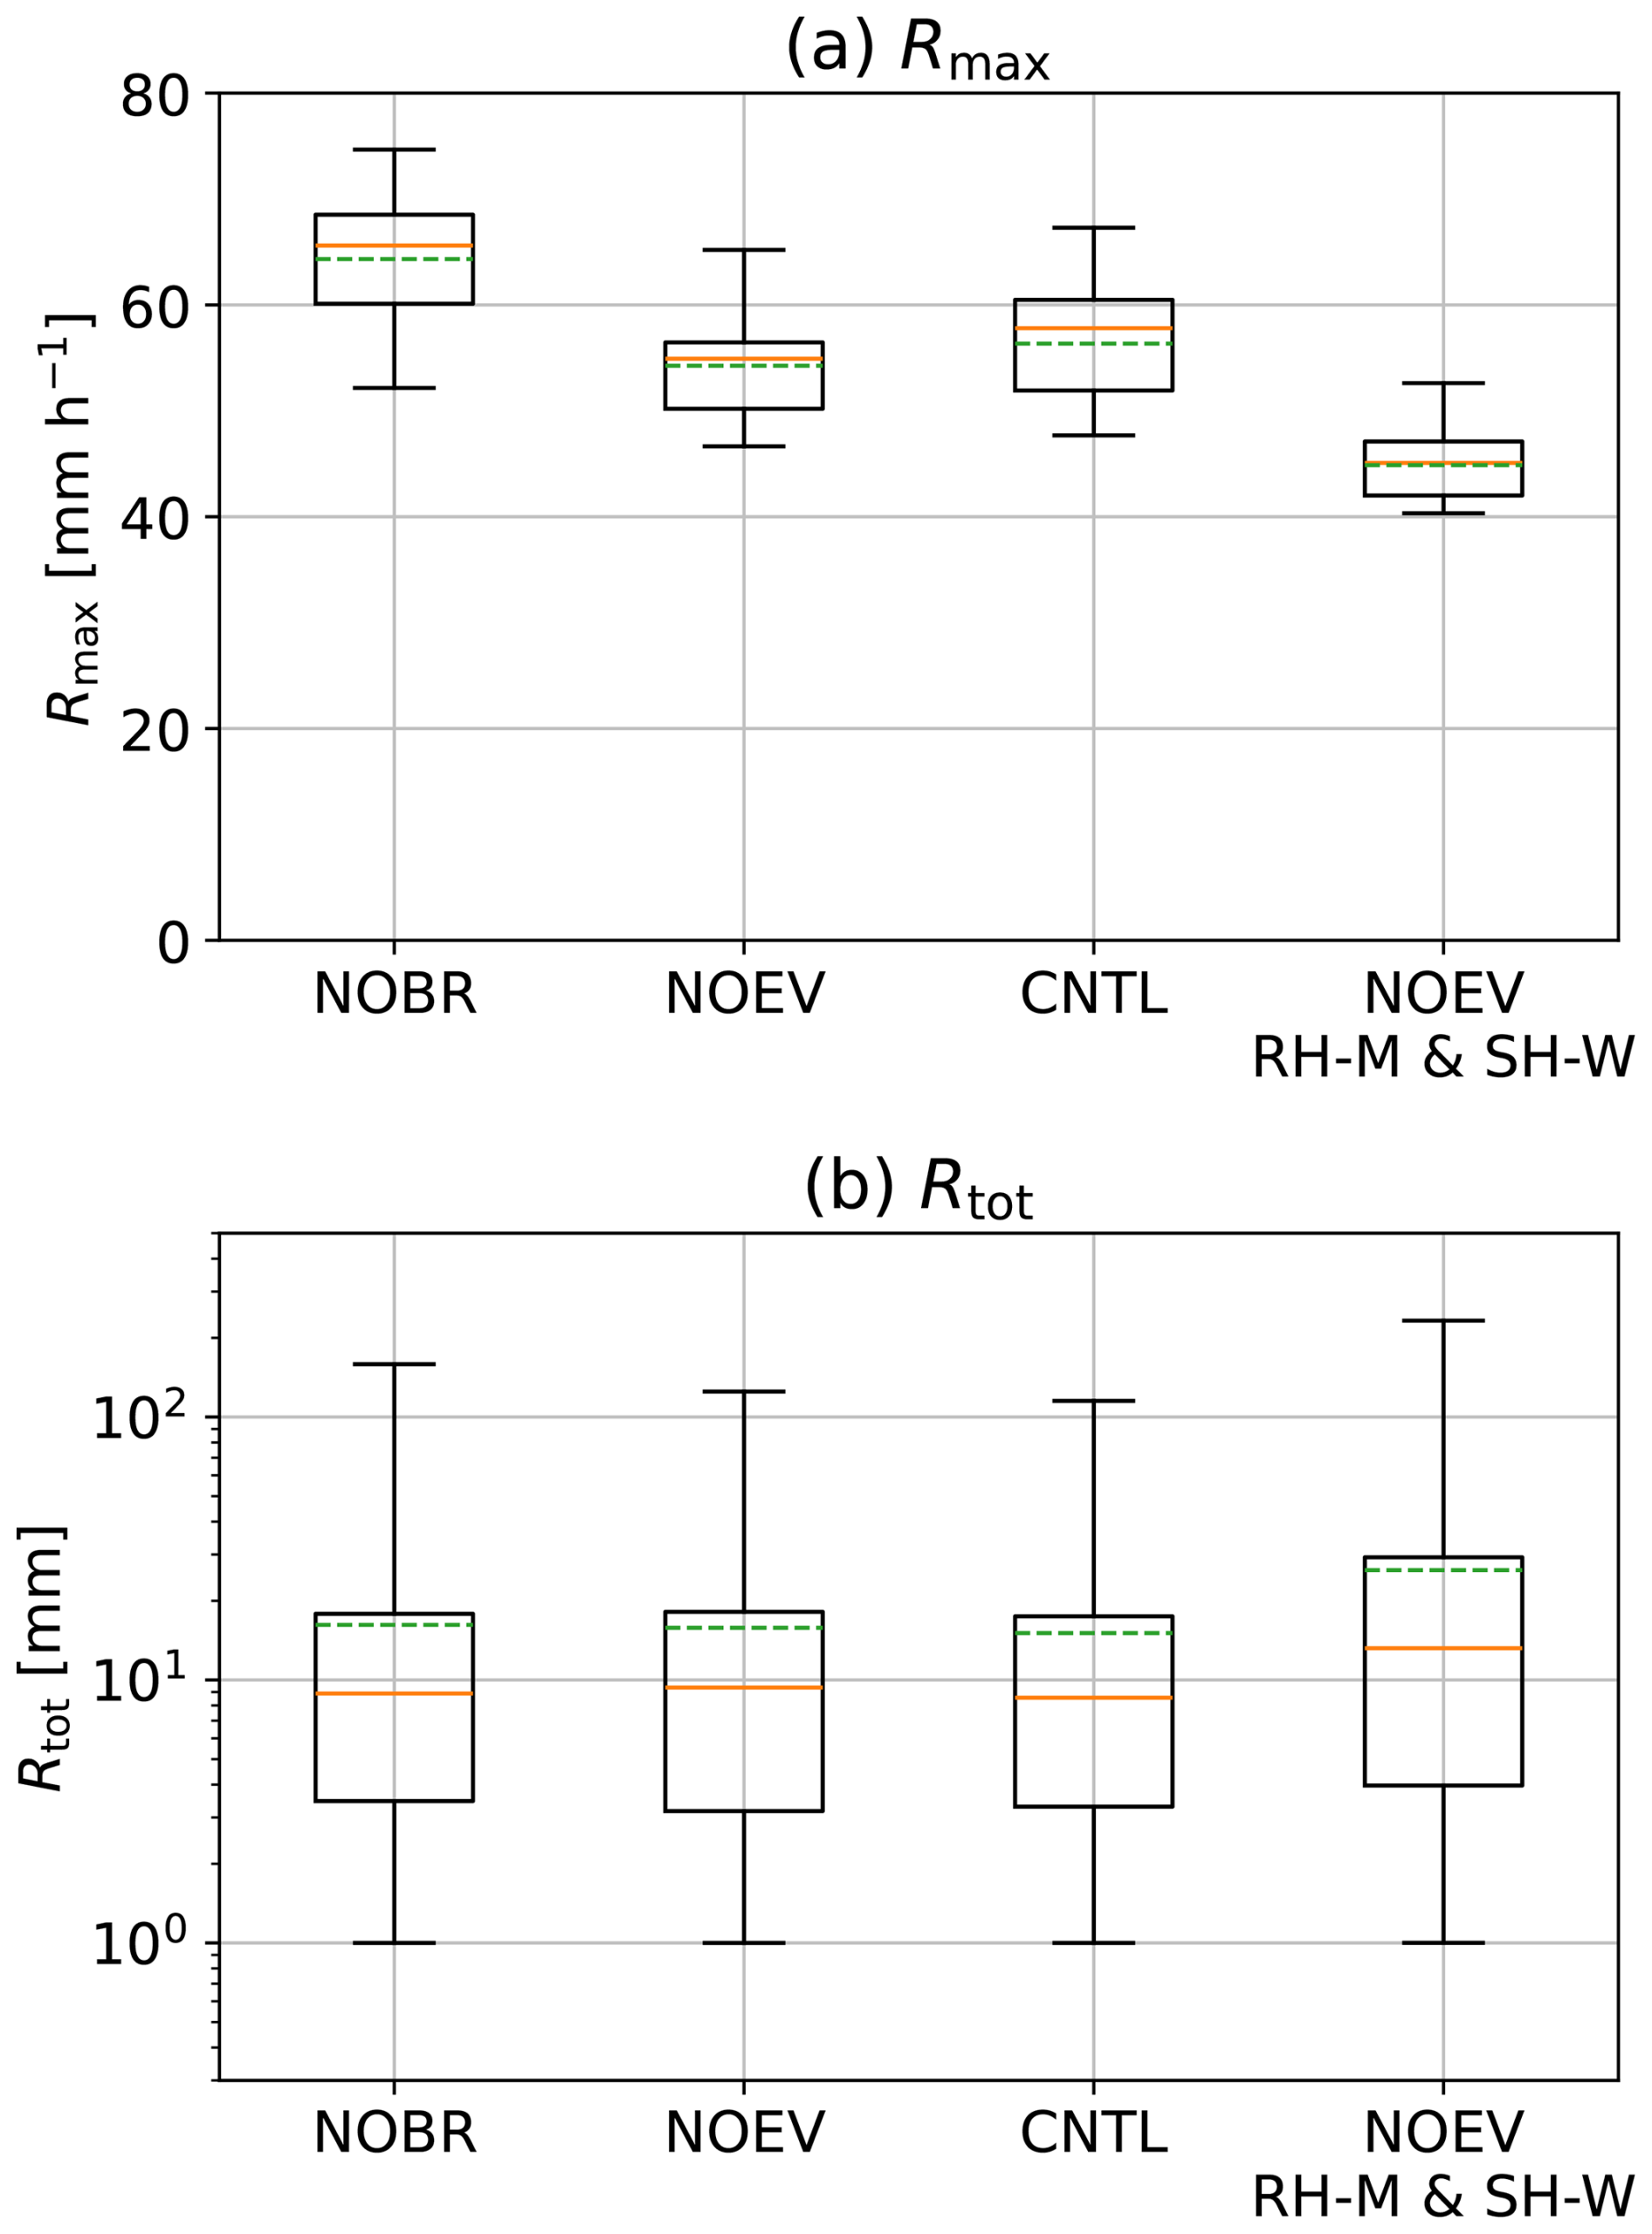
Figure 11As in Fig. 8, but for the experiments without raindrop breakup (NOBR), without evaporation of raindrops (NOEV), CNTL, and NOEV with RH-M & SH-W.
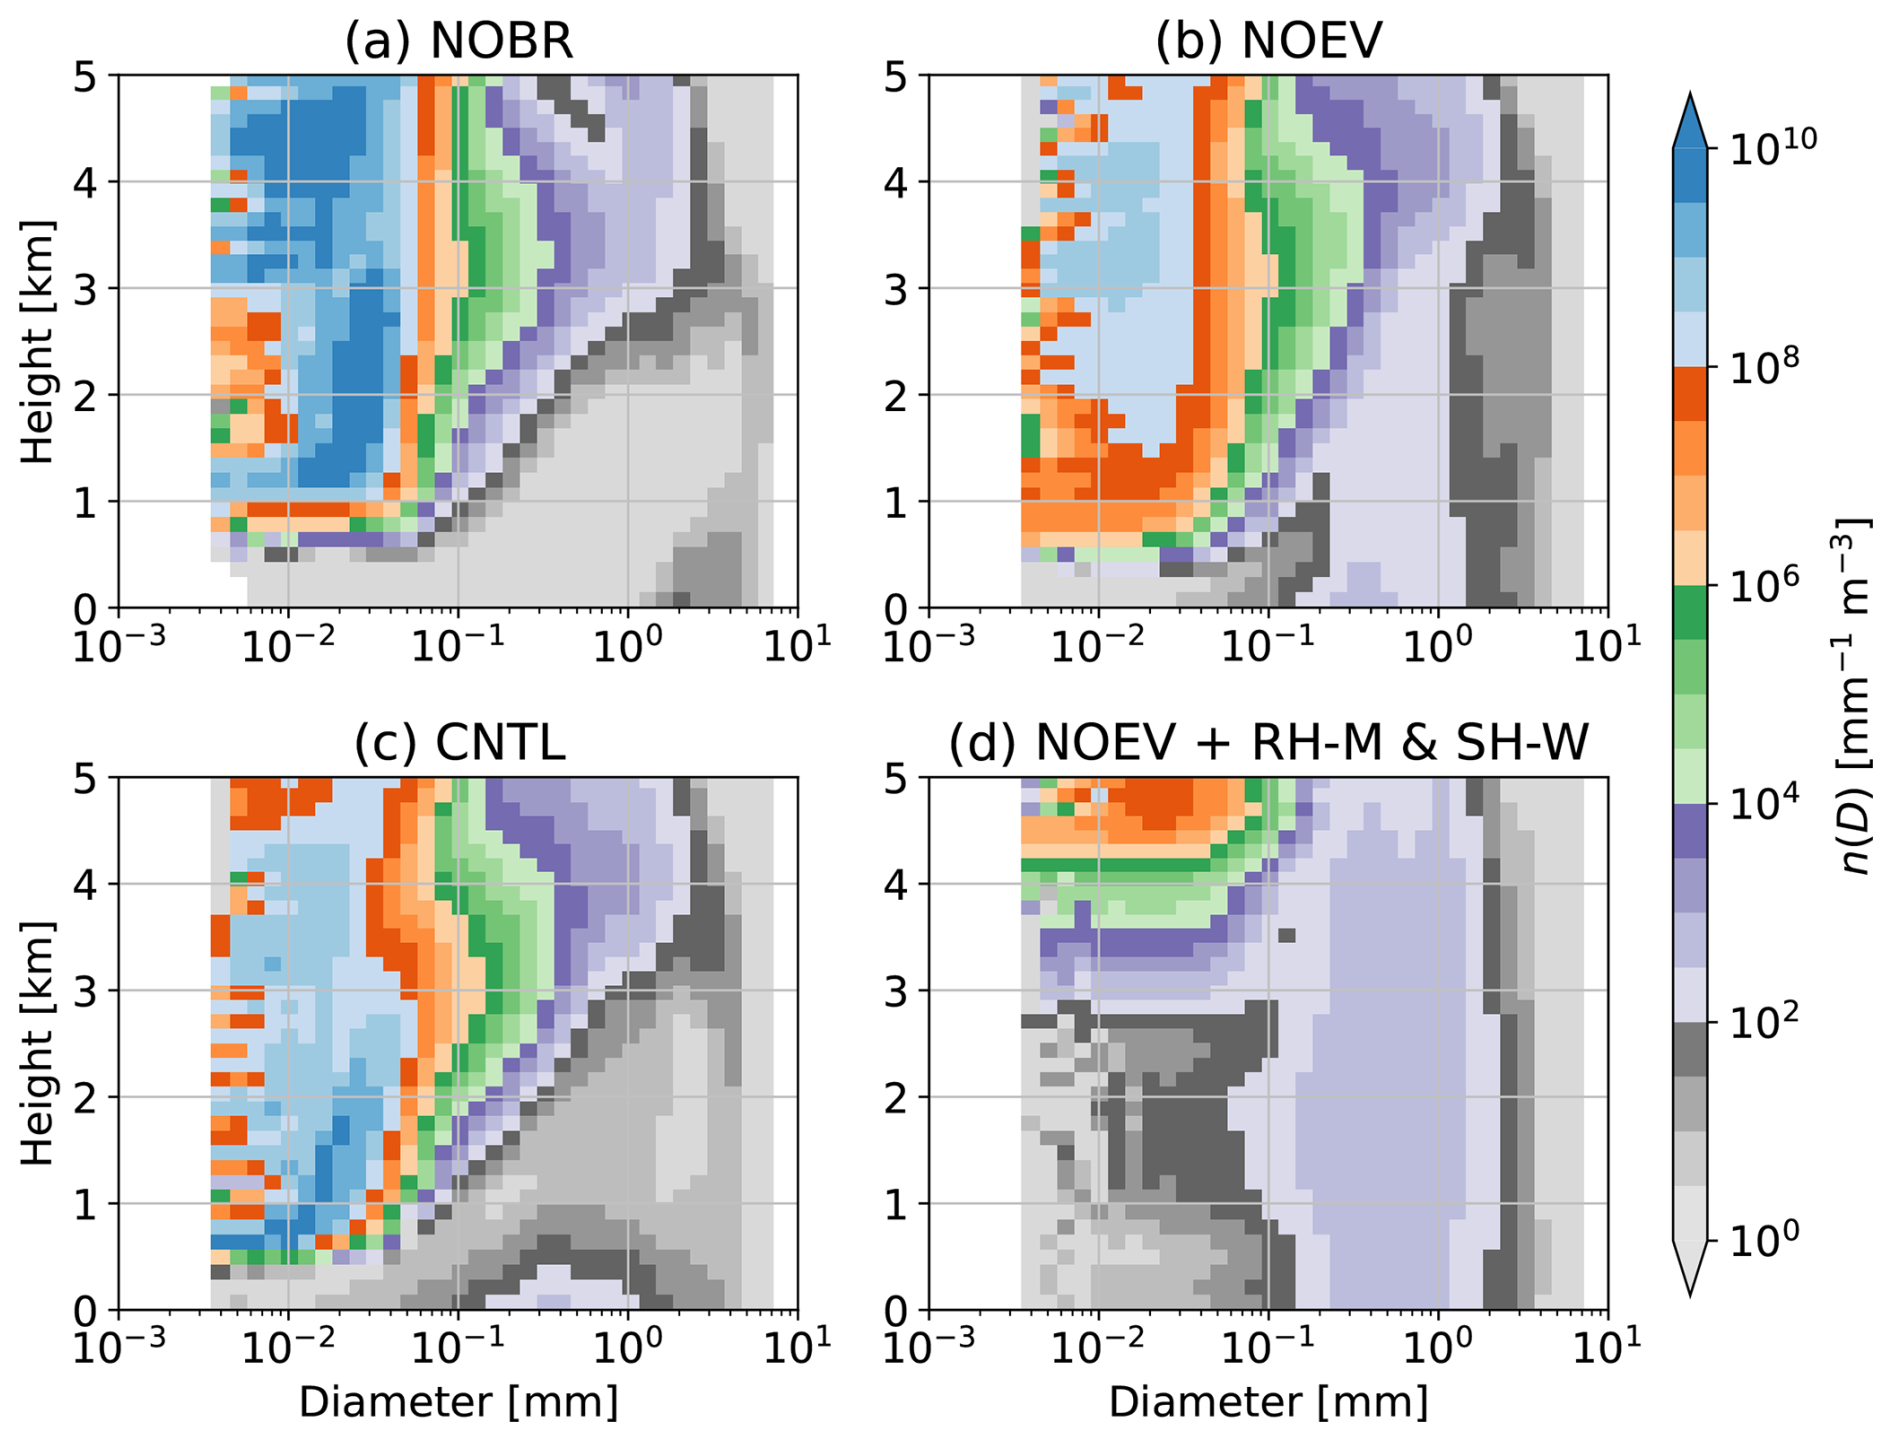
Seifert et al. (2005) found that, regarding convective dynamics, incorporating the breakup process reduces rainfall intensity and induces secondary convection. A comparison with the observed case investigated by Unuma et al. (2023) shows that the simulated values approach the observed values, suggesting that raindrop breakup suppresses the formation of excessively large raindrops, which seems important for appropriate representation in cloud microphysics schemes in numerical weather prediction. For rainfall properties, Morrison et al. (2012) found that the higher raindrop breakup efficiency tends to produce larger regional average precipitation values. In contrast, peak rainfall intensity increases as raindrop breakup efficiency decreases, because average drop diameter increases and, consequently, mass-weighted terminal velocity increases. Whilst the experimental settings were not strictly identical, the accumulated rainfall in NOBR slightly increases compared to CNTL (Fig. 11), consistent with Morrison et al. (2012). In addition, the peak rainfall intensity values obtained with NOBR, including the interquartile values, are clearly higher than those for CNTL (Fig. 11), which is also consistent with their results. This result is mainly because raindrops generated within convective clouds become relatively larger, as shown in Fig. 12a. Regarding realistic representations of cloud microphysics schemes, Diehl et al. (2025) found that when the breakup process is appropriately represented, it reduces the number of maximum precipitation particles, delays the onset of rainfall, reduces accumulated rainfall, and locally alters the rainfall distribution. The simulated DSD becomes unrealistic, as shown in Fig. 12a, if the microphysics scheme does not appropriately include raindrop breakup parameterisation. This once again underscores the importance of accurately representing raindrop breakup. Sensitivity experiments on environmental conditions also suggest that the onset of rainfall may occur earlier when the temperature lapse rate is high or vertical wind shear is strong (Figs. 6 and 7).
In summary, since the DSD changes dramatically in both the drop-size direction and the vertical direction, as shown in Fig. 12a, and is highly sensitive to both drop-size and shape parameters assuming the gamma distribution (Fig. 8), it can cause significant changes in the size distribution and thus have a major impact on the representation of rainfall intensity at the surface (Fig. 11). This effect is particularly pronounced under environmental conditions characterised by unstable and strong shear conditions.
4.2.2 Raindrop evaporation
The statistical values for rainfall were also examined for the no raindrop evaporation (NOEV) experiment. The interquartile range of Rmax is slightly narrower, and its values are smaller than in CNTL (Fig. 11). Whilst the interquartile and maximum values of the accumulated rainfall in CNTL are nearly identical to those in NOEV, they increase in RH-M & SH-W. In particular, it is noteworthy that when evaporation is absent under higher water vapour and weaker vertical wind shear conditions (NOEV + RH-M & SH-W, Fig. 11), the interquartile and maximum values remain virtually unchanged compared with experiments where raindrop evaporation occurred (RH-M & SH-W, Fig. 9). In addition, the vertical uniformity of the DSD is higher in NOEV (Fig. 12b) than in CNTL (Fig. 12c). When the water vapour content is high and vertical wind shear is weak, the degree of uniformity becomes pronounced (Fig. 12d). It can be confirmed that it is virtually indistinguishable from Fig. 10c, these results suggest that, whilst larger raindrops are not likely to generate within the simulated convective cloud, the vertical structure of the DSD formed aloft can reach the surface without significant change; under humid conditions with weak vertical wind shear, this scenario can occur under conditions nearly equivalent to those where raindrop evaporation is absent.
Compared with the previous studies, Li and Srivastava (2001) showed that whilst evaporation has a negligible effect on the larger diameter of the DSD, which generally maintains an exponential distribution, it significantly affects the number concentration at smaller sizes. Consequently, the mean DSD diameter may increase. This effect is consistent with our simulation results. The impact is particularly pronounced when water vapour content is high (i.e., relative humidity ∼ 100 %) (Figs. 10c and 12d). Seifert (2008) showed that evaporation fundamentally decreases both the spectral width and the mass-weighted mean diameter of the DSD. However, when drizzle-sized droplets account for a large proportion of the raindrop size distribution, droplet removal and their conversion into raindrops offset each other, and the spectral width and mass-weighted mean diameter remain nearly constant. The results are also consistent near the surface.
Comparing the observational evidence, observations obtained using polarimetric radar showed that, at altitudes of 2 km or lower, the median volume diameter tends to decrease and the generalised intercept parameter tends to increase towards the ground (Unuma, 2025). Since relative humidity is often not near saturation in most situations, this result is thought to include the effects of drop size changes due to evaporation. However, as shown in this study, when environmental conditions are near saturation and vertical wind shear is weak, conditions with virtually no raindrop evaporation can be reproduced (Figs. 8, 10, 11, and 12). From this perspective, accounting for environmental conditions can be crucial for understanding cloud microphysical processes, especially within heavy rain-producing convective clouds. The following subsection discusses how these findings can be applied to QPE.
To summarise, under humid conditions with weaker vertical shear, the vertical variation in the DSD becomes much smaller. This means the effect on the DSD's spectral width is also smaller than under unstable conditions with strong vertical shear. Therefore, the DSD is considered to keep the same size distribution, favouring an equilibrium size distribution. In such a situation, under a gamma distribution assumption, the intercept parameter plays a major role in increasing the value of rainfall intensity or liquid water content (e.g., Zawadzki and Antonio, 1988).
4.3 Implications for quantitative precipitation estimation
This subsection discusses how environmental conditions affect the vertical structure of the DSD within convective clouds and raindrop evaporation, and further explains how these findings apply to QPE. When the DSD does not vary vertically, evaporation may not warrant much weight. Conversely, when vertical wind shear or temperature lapse rates increase, vertical variability must be factored in, generally requiring downward adjustments. For radar QPE, at least in Japan, adjustments are sometimes made using rain gauge data, but vertical variability is not well considered yet. How much adjustment is needed depending on environmental conditions? For example, without interaction with the surrounding atmosphere, in a vertically one-dimensional context, the model depends heavily on the given humidity profile, and the spread of the DSD towards larger sizes, i.e., the spectral width of the size distribution, is readily constrained. Extending this to three dimensions, as in this study, incorporates horizontal advection in addition to vertical advection and evaporation. The effect of horizontal advection is thought to depend on the magnitude of vertical wind shear and is expected to promote collisional coalescence between raindrops. Consequently, it is expected to broaden the spectral width whilst reducing the number concentration of small raindrops. This increases Dm and decreases Nw as parameters of the raindrop size distribution under the constraint of Eq. (3). Conversely, in environments with high relative humidity and weak vertical wind shear, evaporation is less likely. However, the rate of collisional coalescence between raindrops is expected to decrease. Whilst the spectral width remains narrow, the number concentration on the small-diameter side is expected to increase. These results lead to the opposite effect from the previous case: Dm decreases, whilst Nw increases.
Compared with the previous studies, Xie et al. (2016) showed that when relative humidity near the ground is relatively low (less than 60 %), raindrops with diameters less than 1 mm tend to evaporate as they fall towards the ground. The estimated rainfall intensity at an altitude of 2 km tends to decrease near the surface as the differential reflectivity (ZDR) value decreases. When the temperature lapse rate is high and vertical wind shear is strong, raindrop evaporation appears to be very significant, consistent with previous studies. In contrast, this study finds the opposite behaviour under high relative humidity. As expected, whilst drop size decreased near the ground, the vertical variation in the DSD was smaller. Paukert et al. (2019) showed that the shape of the raindrop size distribution under stronger rainfall intensity is determined primarily by sedimentation and evaporation. By estimating the effect of evaporation based on environmental conditions in the surrounding atmosphere and then estimating rainfall intensity from the resulting size distribution shape, QPE accuracy during heavy rain events is expected to improve.
When environmental conditions are close to saturation and vertical wind shear is weak, conditions with virtually no raindrop evaporation can be reproduced (Figs. 8, 10, 11, and 12). These results suggest that conditions with weaker vertical wind shear play a major role in increasing accumulated rainfall. In other words, it is not merely the absence of raindrop evaporation, but rather the combination of higher relative humidity and weaker vertical wind shear that makes the DSD more uniform vertically. As a result, the size distribution approaches an equilibrium shape, which should increase accumulated rainfall at the surface. Whilst it has previously been demonstrated that an equilibrium shape of the raindrop size distribution is rarely observed near the surface (McFarquhar et al., 1996; D'Adderio et al., 2018; Unuma et al., 2025) except in heavy rain events (Garcia-Garcia and Gonzalez, 2000; Unuma et al., 2023), the findings obtained in this study suggest that it is more likely to occur under the conditions of higher relative humidity and weaker vertical wind shear. It should be possible to update QPE by assuming a specific size distribution, i.e., an equilibrium drop-size distribution.
Environmental conditions play a significant role in the intensity of organised convective systems. However, variations in factors such as temperature, humidity, and vertical wind shear indicate that non-linear relationships may exist between these systems and their environments. To address the gaps in understanding these variations, it is essential to examine the microphysical processes within convective systems. In this study, we conducted numerical experiments using the Weather Research and Forecasting model with idealised setups that included a spectral-bin microphysical scheme to treat drop-size distributions explicitly. The initial conditions varied in humidity, temperature lapse rate, and vertical wind shear, reflecting observed relationships between environmental conditions and DSD parameters based on Unuma (2025).
Our results showed that larger temperature lapse rates produced larger raindrops, leading to more intense rainfall. Additionally, increased moisture in the lower troposphere generated stronger rainfall intensity, driven by a higher concentration of smaller raindrops and greater liquid water content. Vertical wind shear generally drives DSD fluctuations within convective clouds. Specifically, weaker vertical wind shear tends to inhibit convective cloud propagation, decrease raindrop evaporation, and reduce vertical variations in DSD within them, ultimately increasing rainfall amounts at the surface.
In particular, we found differences in the vertical profiles of DSDs within convective clouds between cases with maximum rainfall intensity and those with maximum accumulated rainfall. When rainfall intensity is maximum, the vertical variation in the DSD is large (particularly near the surface). In contrast, when accumulated rainfall is maximum, the vertical variation in the DSD is smaller, at least below the melting layer. The former is probably due to the ease with which cloud droplets and small raindrops evaporate, consistent with previous studies (e.g., Xie et al., 2016). In contrast, the latter likely occurs when cloud droplets and small raindrops evaporate more slowly than in the former case. It has been pointed out that in convective systems producing heavy rain, processes such as collisional coalescence and breakup between raindrops become dominant under less evaporative conditions (e.g., Paukert et al., 2019), and in such cases, the DSD is likely to be interpreted as being formed in an equilibrium shape (e.g., Low and List, 1982).
Since the DSD changes dramatically in both drop-size and vertical directions under unstable conditions with strong vertical shear, and is highly sensitive to drop-size and shape parameters under the gamma distribution assumption, it can significantly alter the size distribution and thus strongly affect the representation of rainfall intensity at ground level. In contrast, under humid conditions with weak vertical shear, the vertical variation in the DSD is much smaller; thus, its effect on the DSD's spectral width is negligible compared with unstable conditions with strong vertical shear, favouring an equilibrium size distribution.
Unuma and Takemi (2016a) statistically demonstrated, using observational data in Japan, that slower-moving systems tend to have stronger rainfall intensity than faster-moving systems. However, these results may include a mix of cases with high temperature lapse rates (i.e., TLR-U) and cases with humid conditions in the lower troposphere (i.e., RH-M), as shown in this study. In this regard, the possibility of classifying cases based on convective available potential energy and moist absolute instability (Bryan and Fritsch, 2000) has recently been discussed (e.g., Naka and Takemi, 2025), and taking these differences in environmental parameters into account may allow for a clearer understanding of the response of the dominant microphysical properties within heavy rain-producing convective clouds, which should be investigated in future work.
However, whilst convective clouds that produce heavy rain are expected to interact with the surrounding atmosphere, few studies have investigated the dominant cloud microphysical processes by extending these interactions to the DSD within the convective clouds. This is simply because observational data, even when available, are merely snapshots, making it difficult to establish causal relationships (e.g., Feingold et al., 2025). In this regard, this study deciphered signals from the available observational data by analysing these relationships (Unuma, 2025) and obtained results in this study that shed light on the underlying physical processes – albeit under idealised conditions in the numerical modelling framework. It could serve as a pioneering study that bridges mesoscale and microscale processes, especially cloud microphysics, in meteorology. In this context, it could improve QPE and refine the physical processes handled in microphysics schemes within a numerical weather prediction model, especially in heavy rain-producing events.
WRF codes used in this study are available on GitHub at https://github.com/wrf-model/WRF/releases/tag/v4.5.2 (last access: 20 November 2026).
The input sounding data used in this study and the simulation results are available upon request from the corresponding author, due to our institute's data policy.
The author has declared that there are no competing interests.
Publisher's note: Copernicus Publications remains neutral with regard to jurisdictional claims made in the text, published maps, institutional affiliations, or any other geographical representation in this paper. The authors bear the ultimate responsibility for providing appropriate place names. Views expressed in the text are those of the authors and do not necessarily reflect the views of the publisher.
The author expresses maximum gratitude to the two anonymous referees for their invaluable feedback and to the editor-in-charge for his thoughtful comments provided during the review process, which significantly improved the original manuscript.
This research has been supported by the Japan Society for the Promotion of Science (grant no. JP24K17126) and Initiative on Recommendation Program for Young Researchers and Woman Researchers, Information Technology Center, The University of Tokyo.
This paper was edited by Thijs Heus and reviewed by two anonymous referees.
Bott, A.: A flux method for the numerical solution of the stochastic collection equation, J. Atmos. Sci., 55, 2284–2293, https://doi.org/10.1175/1520-0469(1998)055<2284:AFMFTN>2.0.CO;2, 1998. a
Bringi, V. N., Chandrasekar, V., Hubbert, J., Gorgucci, E., Randeu, W. L., and Schoenhuber, M.: Raindrop size distribution in different climatic regimes from disdrometer and dual-polarized radar analysis, J. Atmos. Sci., 60, 354–365, https://doi.org/10.1175/1520-0469(2003)060<0354:RSDIDC>2.0.CO;2, 2003. a
Bryan, G. H. and Fritsch, J. M.: Moist absolute instability: The sixth static stability state, B. Am. Meteorol. Soc., 81, 1207–1230, https://doi.org/10.1175/1520-0477(2000)081<1287:MAITSS>2.3.CO;2, 2000. a
Carpenter, A. E., Jones, T. R., Lamprecht, M. R., Clarke, C., Kang, I. H., Friman, O., Guertin, D. A., Chang, J. H., Lindquist, R. A., Moffat, J., Golland, P., and Sabatini, D. M.: CellProfiler: Image analysis software for identifying and quantifying cell phenotypes, Genome Biol., 7, https://doi.org/10.1186/gb-2006-7-10-r100, 2006. a
Crocker, J. C. and Grier, D. G.: Methods of digital video microscopy for colloidal studies, J. Colloid Interf. Sci., 179, 298–310, https://doi.org/10.1006/jcis.1996.0217, 1996. a
D'Adderio, L. P., Porcù, F., and Tokay, A.: Evolution of drop size distribution in natural rain, Atmos. Res., 200, 70–76, https://doi.org/10.1016/j.atmosres.2017.10.003, 2018. a
Deardorff, J. W.: Stratocumulus-capped mixed layers derived from a three-dimensional model, Bound.-Lay. Meteorol., 18, 495–527, https://doi.org/10.1007/bf00119502, 1980. a
Diehl, K., Jungbluth, T., Theis, A., Mitra, S. K., and Szakáll, M.: Wind tunnel experiments of spontaneous and collision-induced breakup of raindrops and model simulations of the impact of breakup on precipitation, Atmos. Res., 326, 108327, https://doi.org/10.1016/j.atmosres.2025.108327, 2025. a, b
Ding, J., Tian, W., Xiao, H., Cheng, B., Liu, L., Sha, X., Song, C., Sun, Y., and Shu, W.: Raindrop size distribution and microphysical features of the extremely severe rainstorm on 20 July 2021 in Zhengzhou, China, Atmos. Res., 289, 106739, https://doi.org/10.1016/j.atmosres.2023.106739, 2023. a
Dolan, B., Fuchs, B., Rutledge, S. A., Barnes, E. A., and Thompson, E. J.: Primary modes of global drop size distributions, J. Atmos. Sci., 75, 1453–1476, https://doi.org/10.1175/JAS-D-17-0242.1, 2018. a
Feingold, G., Glassmeier, F., Zhang, J., and Hoffmann, F.: Opinion: Inferring process from snapshots of cloud systems, Atmos. Chem. Phys., 25, 10869–10885, https://doi.org/10.5194/acp-25-10869-2025, 2025. a
Garcia-Garcia, F. and Gonzalez, J. E.: Raindrop spectra observations from convective showers in the valley of Mexico, Proc. 13th Int. Conf. on Clouds and Precipitation, 398–401, https://www.iamas.org/iccp/wp-content/uploads/sites/3/2021/01/13th-International-Conference-on-Clouds-and-Precipitation-Proceedings-Vol-1.pdf, (last access: 10 August 2026), 2000. a
Gorgucci, E., Scarchilli, G., Chandrasekar, V., and Bringi, V. N.: Measurement of mean raindrop shape from polarimetric radar observations, J. Atmos. Sci., 57, 3406–3413, https://doi.org/10.1175/1520-0469(2000)057<3406:MOMRSF>2.0.CO;2, 2000. a
Gupta, A. K., Deshmukh, A., Waman, D., Patade, S., Jadav, A., Phillips, V. T. J., Bansemer, A., Martins, J. A., and Gonçalves, F. L. T.: The microphysics of the warm-rain and ice crystal processes of precipitation in simulated continental convective storms, Comm. Earth Environ., 4, https://doi.org/10.1038/s43247-023-00884-5, 2023. a
Hardin, J. and Guy, N.: PyDisdrometer v1.0, Zenodo [code], https://doi.org/10.5281/zenodo.9991, 2017. a
Houston, A. L. and Niyogi, D.: The sensitivity of convective initiation to the lapse rate of the cctive cloud-bearing layer, Mon. Weather Rev., 135, 3013–3032, https://doi.org/10.1175/MWR3449.1, 2007. a, b
Hu, Z. and Srivastava, R. C.: Evolution of raindrop size distribution by coalescence, breakup, and evaporation: Theory and observations, J. Atmos. Sci., 52, 1761–1783, https://doi.org/10.1175/1520-0469(1995)052<1761:EORSDB>2.0.CO;2, 1995. a
James, R. P., Markowski, P. M., and Fritsch, J. M.: Bow echo sensitivity to ambient moisture and cold pool strength, Mon. Weather Rev., 134, 950–964, https://doi.org/10.1175/MWR3109.1, 2006. a
Johnson, R. H., Rickenbach, T. M., Rutledge, S. A., Ciesielski, P. E., and Schubert, W. H.: Trimodal characteristics of tropical convection, J. Climate, 12, 2397–2418, https://doi.org/10.1175/1520-0442(1999)012<2397:TCOTC>2.0.CO;2, 1999. a
Kamra, A. K., Bhalwankar, R. V., and Sathe, A. B.: Spontaneous breakup of charged and uncharged water drops freely suspended in a wind tunnel, J. Geophys. Res.-Atmos, 96, 17159–17168, https://doi.org/10.1029/91JD01475, 1991. a
Kato, T.: Quasi-stationary band-shaped precipitation systems, named “Senjo-Kousuitai”, causing localized heavy rainfall in Japan, J. Meteorol. Soc. Jpn., 98, 485–509, https://doi.org/10.2151/jmsj.2020-029, 2020. a
Kato, T., Yoshizaki, M., Bessho, K., Inoue, T., Sato, Y., and Observation Group, X.-B.: Reason for the failure of the simulation of heavy rainfall during X-BAIU-01 – Importance of a vertical profile of water vapor for numerical simulations, J. Meteorol. Soc. Jpn., 81, 993–1013, https://doi.org/10.2151/jmsj.81.993, 2003. a, b, c
Khain, A., Pinsky, M., Shapiro, M., and Pokrovsky, A.: Collision rate of small graupel and water drops, J. Atmos. Sci., 58, 2571–2595, https://doi.org/10.1175/1520-0469(2001)058<2571:CROSGA>2.0.CO;2, 2001. a
Khain, A., Pokrovsky, A., Pinsky, M., Seifert, A., and Phillips, V.: Simulation of effects of atmospheric aerosols on deep turbulent convective clouds using a spectral microphysics mixed-phase cumulus cloud model. Part I: Model description and possible applications, J. Atmos. Sci., 61, 2963–2982, https://doi.org/10.1175/JAS-3350.1, 2004. a
Khain, A. P. and Sednev, I.: Simulation of hydrometeor size spectra evolution by water-water, ice-water and ice-ice interactions, Atmos. Res., 36, 107–138, https://doi.org/10.1016/0169-8095(94)00030-H, 1995. a
Khain, A. P. and Sednev, I.: Simulation of precipitation formation in the Eastern Mediterranean coastal zone using a spectral microphysics cloud ensemble model, Atmos. Res., 43, 77–110, https://doi.org/10.1016/S0169-8095(96)00005-1, 1996. a
Khain, A. P., BenMoshe, N., and Pokrovsky, A.: Factors determining the impact of aerosols on surface precipitation from clouds: An attempt at classification, J. Atmos. Sci., 65, 1721–1748, https://doi.org/10.1175/2007JAS2515.1, 2008. a
Kikuchi, K. and Takayabu, Y. N.: The development of organized convection associated with the MJO during TOGA COARE IOP: Trimodal characteristics, Geophys. Res. Lett., 31, https://doi.org/10.1029/2004GL019601, 2004. a
Klemp, J. B. and Lilly, D. K.: Numerical simulation of hydrostatic mountain waves, J. Atmos. Sci., 35, 78–107, https://doi.org/10.1175/1520-0469(1978)035<0078:NSOHMW>2.0.CO;2, 1978. a
Klemp, J. B. and Wilhelmson, R. B.: The simulation of three-dimensional convective storm dynamics, J. Atmos. Sci., 35, 1070–1096, https://doi.org/10.1175/1520-0469(1978)035<1070:TSOTDC>2.0.CO;2, 1978. a
Kozu, T. and Nakamura, K.: Rainfall parameter estimation from dual-radar measurements combining reflectivity profile and path-integrated attenuation, J. Atmos. Ocean. Tech., 8, 259–270, https://doi.org/10.1175/1520-0426(1991)008<0259:RPEFDR>2.0.CO;2, 1991. a
Kumjian, M. R., Khain, A. P., Benmoshe, N., Ilotoviz, E., Ryzhkov, A. V., and Phillips, V. T. J.: The anatomy and physics of ZDR columns: Investigating a polarimetric radar signature with a spectral bin microphysical model, J. Appl. Meteorol. Clim., 53, 1820–1843, https://doi.org/10.1175/JAMC-D-13-0354.1, 2014. a, b
Li, J. and Xue, M.: Strong sensitivity of simulated supercells to low-level moisture: Effects of near-cloud-base moisture entrainment, J. Atmos. Sci., 83, 125–150, https://doi.org/10.1175/jas-d-24-0272.1, 2026. a
Li, M., Zhang, F., Zhang, Q., Harrington, J. Y., and Kumjian, M. R.: Nonlinear response of hail precipitation rate to environmental moisture content: A real case modeling study of an episodic midlatitude severe convective event, J. Geophys. Res.-Atmos, 122, 6729–6747, https://doi.org/10.1002/2016JD026373, 2017. a, b
Li, X. and Srivastava, R. C.: An analytical solution for raindrop evaporation and its application to radar rainfall measurements, J. Appl. Meteorol., 40, 1607–1616, https://doi.org/10.1175/1520-0450(2001)040<1607:AASFRE>2.0.CO;2, 2001. a, b
Low, T. B. and List, R.: Collision, coalescence and breakup of raindrops. Part I: Experimentally established coalescence efficiencies and fragment size distributions in breakup, J. Atmos. Sci., 39, 1591–1606, https://doi.org/10.1175/1520-0469(1982)039<1591:CCABOR>2.0.CO;2, 1982. a, b
Lucas, C., Zipser, E. J., and Lemone, M. A.: Vertical velocity in oceanic convection off tropical Australia, J. Atmos. Sci., 51, 3183–3193, https://doi.org/10.1175/1520-0469(1994)051<3183:VVIOCO>2.0.CO;2, 1994. a
McFarquhar, G. M.: A new representation of collision-induced breakup of raindrops and its implications for the shapes of raindrop size distributions, J. Atmos. Sci., 61, 777–794, https://doi.org/10.1175/1520-0469(2004)061<0777:ANROCB>2.0.CO;2, 2004. a
McFarquhar, G. M., List, R., Hudak, D. R., Nissen, R. P., Dobbie, J. S., Tung, N. P., and Kang, T. S.: Flux measurements of pulsating rain with a disdrometer and doppler radar during Phase II of the Joint Tropical Rain Experiment in Malaysia, J. Appl. Meteorol. Clim., 35, 859–874, https://doi.org/10.1175/1520-0450(1996)035<0859:FMOPRW>2.0.CO;2, 1996. a
Morrison, H., Tessendorf, S. A., Ikeda, K., and Thompson, G.: Sensitivity of a simulated midlatitude squall line to parameterization of raindrop breakup, Mon. Weather Rev., 140, 2437–2460, https://doi.org/10.1175/MWR-D-11-00283.1, 2012. a, b, c, d
Morrison, H., Morales, A., and Villanueva-Birriel, C.: Concurrent sensitivities of an idealized deep convective storm to parameterization of microphysics, horizontal grid resolution, and environmental static stability, Mon. Weather Rev., 143, 2082–2104, https://doi.org/10.1175/MWR-D-14-00271.1, 2015. a
Nagata, K.: Quantitative precipitation estimation and quantitative precipitation forecasting by the Japan Meteorological Agency, RSMC Tokyo-Typhoon Center Tech. Rev., 13, 37–50, https://www.jma.go.jp/jma/jma-eng/jma-center/rsmc-hp-pub-eg/techrev/text13-2.pdf, (last access: 10 August 2025), 2011. a
Naka, N. and Takemi, T.: Classifying moist unstable states for the occurrence of precipitation during the summer season in Japan, Int. J. Climatol., 45, e8890, https://doi.org/10.1002/joc.8890, 2025. a
Paukert, M., Fan, J., Rasch, P. J., Morrison, H., Milbrandt, J. A., Shpund, J., and Khain, A.: Three-moment representation of rain in a bulk microphysics model, J. Adv. Mod. Earth Sy., 11, 257–277, https://doi.org/10.1029/2018ms001512, 2019. a, b, c, d
Pinsky, M., Khain, A., and Shapiro, M.: Collision efficiency of drops in a wide range of reynolds numbers: Effects of pressure on spectrum evolution, J. Atmos. Sci., 58, 742–764, https://doi.org/10.1175/1520-0469(2001)058<0742:CEODIA>2.0.CO;2, 2001. a
Rasmussen, E. N. and Blanchard, D. O.: A baseline climatology of sounding-derived supercell and tornado forecast parameters, Weather Forecast., 13, 1148–1164, https://doi.org/10.1175/1520-0434(1998)013<1148:ABCOSD>2.0.CO;2, 1998. a
Schumacher, R. S.: Sensitivity of precipitation accumulation in elevated convective systems to small changes in low-level moisture, J. Atmos. Sci., 72, 2507–2524, https://doi.org/10.1175/JAS-D-14-0389.1, 2015. a, b, c
Schumacher, R. S. and Peters, J. M.: Near-surface thermodynamic sensitivities in simulated extreme-rain-producing mesoscale convective systems, Mon. Weather Rev., 145, 2177–2200, https://doi.org/10.1175/MWR-D-16-0255.1, 2017. a, b
Seifert, A.: On the parameterization of evaporation of raindrops as simulated by a one-dimensional rainshaft model, J. Atmos. Sci., 65, 3608–3619, https://doi.org/10.1175/2008JAS2586.1, 2008. a, b
Seifert, A., Khain, A., Blahak, U., and Beheng, K. D.: Possible effects of collisional breakup on mixed-phase deep convection simulated by a spectral (bin) cloud model, J. Atmos. Sci., 62, 1917–1931, https://doi.org/10.1175/jas3432.1, 2005. a, b, c
Seliga, T. A. and Bringi, V. N.: Potential use of radar differential reflectivity measurements at orthogonal polarizations for measuring precipitation, J. Appl. Meteorol. Clim., 15, 69–76, https://doi.org/10.1175/1520-0450(1976)015<0069:PUORDR>2.0.CO;2, 1976. a
Shpund, J., Khain, A., Lynn, B., Fan, J., Han, B., Ryzhkov, A., Snyder, J., Dudhia, J., and Gill, D.: Simulating a mesoscale convective system using WRF with a new spectral bin microphysics: 1: Hail vs graupel, J. Geophys. Res.-Atmos, 124, 14072–14101, https://doi.org/10.1029/2019JD030576, 2019. a
Skamarock, W. C., Klemp, J. B., Dudhia, J., Gill, D. O., Liu, Z., Berner, J., Wang, W., Powers, J. G., Duda, M. G., Barker, D. M., and Huang, X.-Y.: A Description of the Advanced Research WRF Model Version 4, NCAR Tech. Note NCAR/TN-556+STR, 145 pp., https://doi.org/10.5065/1dfh-6p97, 2019. a
Sokolowsky, G. A., Freeman, S. W., Jones, W. K., Kukulies, J., Senf, F., Marinescu, P. J., Heikenfeld, M., Brunner, K. N., Bruning, E. C., Collis, S. M., Jackson, R. C., Leung, G. R., Pfeifer, N., Raut, B. A., Saleeby, S. M., Stier, P., and van den Heever, S. C.: tobac v1.5: introducing fast 3D tracking, splits and mergers, and other enhancements for identifying and analysing meteorological phenomena, Geosci. Model Dev., 17, 5309–5330, https://doi.org/10.5194/gmd-17-5309-2024, 2024. a
Sueki, K.: Massive parameter sweep experiment on convective cloud environment: changes in rainfall characteristics in moisture–instability–shear space, Sci. Online Lett. Atmos., 20B, 1–9, https://doi.org/10.2151/sola.20B-001, 2024. a
Takemi, T.: A sensitivity of squall-line intensity to environmental static stability under various shear and moisture conditions, Atmos. Res., 84, 374–389, https://doi.org/10.1016/j.atmosres.2006.10.001, 2007. a, b
Takemi, T.: Relationship between cumulus activity and environmental moisture during the CINDY2011/DYNAMO field experiment as revealed from convection-resolving simulations, J. Meteorol. Soc. Jpn., 93A, 41–58, https://doi.org/10.2151/jmsj.2015-035, 2015. a
Testud, J., Oury, S., Black, R. A., Amayenc, P., and Dou, X.: The concept of “Normalized” distribution to describe raindrop spectra: A tool for cloud physics and cloud remote sensing, J. Appl. Meteorol., 40, 1118–1140, https://doi.org/10.1175/1520-0450(2001)040<1118:TCONDT>2.0.CO;2, 2001. a, b
Thurai, M., Hudak, D., and Bringi, V. N.: On the possible use of copolar correlation coefficient for improving the drop size distribution estimates at C band, J. Atmos. Ocean. Tech., 25, 1873–1880, https://doi.org/10.1175/2008JTECHA1077.1, 2008. a
Unuma, T.: Three-dimensional structure of an equilibrium drop size distribution within a convective system in Japan, Sci. Online Lett. Atmos., 20, 47–54, https://doi.org/10.2151/sola.2024-007, 2024. a
Unuma, T.: Observed relationship between drop size distribution including a breakup signature and environmental properties near Kumagaya in eastern Japan, Atmos. Chem. Phys., 25, 11109–11128, https://doi.org/10.5194/acp-25-11109-2025, 2025. a, b, c, d, e, f, g, h, i, j, k, l
Unuma, T. and Takemi, T.: Characteristics and environmental conditions of quasi-stationary convective clusters during the warm season in Japan, Q. J. Roy. Meteor. Soc., 142, 1232–1249, https://doi.org/10.1002/qj.2726, 2016a. a, b, c, d
Unuma, T. and Takemi, T.: A role of environmental shear on the organization mode of quasi-stationary convective clusters during the warm season in Japan, Sci. Online Lett. Atmos., 12, 111–115, https://doi.org/10.2151/sola.2016-025, 2016b. a
Unuma, T., Yamauchi, H., Umehara, A., and Kato, T.: An equilibrium raindrop size distribution associated with a heavy-rain-producing convective system in Japan, Sci. Online Lett. Atmos., 19, 150–156, https://doi.org/10.2151/sola.2023-020, 2023. a, b, c, d
Unuma, T., Yamauchi, H., Kato, T., Umehara, A., Hashimoto, A., Adachi, A., and Nagumo, N.: Characteristics of raindrop size distribution using 10-year disdrometer data in eastern Japan, J. Meteorol. Soc. Jpn., 103, 219–232, https://doi.org/10.2151/jmsj.2025-011, 2025. a, b, c, d
van der Walt, S., Schönberger, J. L., Nunez-Iglesias, J., Boulogne, F., Warner, J. D., Yager, N., Gouillart, E., Yu, T., and the scikit-image contributors: scikit-image: image processing in Python, PeerJ, 2, e453, https://doi.org/10.7717/peerj.453, 2014. a
Wang, H., Xue, M., Yin, J., and Deng, H.: Comparison of simulated warm-rain microphysical processes in a record-breaking rainfall event using polarimetric radar observations, J. Geophys. Res.-Atmos, 128, e2023JD038742, https://doi.org/10.1029/2023JD038742, 2023. a
Xie, X., Evaristo, R., Troemel, S., Saavedra, P., Simmer, C., and Ryzhkov, A.: Radar observation of evaporation and implications for quantitative precipitation and cooling rate estimation, J. Atmos. Ocean. Tech., 33, 1779–1792, https://doi.org/10.1175/JTECH-D-15-0244.1, 2016. a, b, c
Xue, L., Fan, J., Lebo, Z. J., Wu, W., Morrison, H., Grabowski, W. W., Chu, X., Geresdi, I., North, K., Stenz, R., Gao, Y., Lou, X., Bansemer, A., Heymsfield, A. J., McFarquhar, G. M., and Rasmussen, R. M.: Idealized simulations of a squall line from the MC3E field campaign applying three bin microphysics schemes: Dynamic and thermodynamic structure, Mon. Weather Rev., 145, 4789–4812, https://doi.org/10.1175/mwr-d-16-0385.1, 2017. a
Zawadzki, I. and Antonio, M. D. A.: Equilibrium raindrop size distributions in tropical rain, J. Atmos. Sci., 45, 3452–3459, https://doi.org/10.1175/1520-0469(1988)045<3452:ERSDIT>2.0.CO;2, 1988. a
Zhang, G., Vivekanandan, J., and Brandes, E.: A method for estimating rain rate and drop size distribution from polarimetric radar measurements, IEEE T. Geosci. Remote Sens., 39, 830–841, https://doi.org/10.1109/36.917906, 2001. a