the Creative Commons Attribution 4.0 License.
the Creative Commons Attribution 4.0 License.
 | 02 Feb 2026
Spatial influence of agricultural residue burning and aerosols on land surface temperature
Akanksha Pandey
Richa Singh
Kumari Aditi
Neha Chhillar
Tirthankar Banerjee
The biophysical effects of agricultural residue burning, driven by the excessive release of energy and carbonaceous aerosols, remain poorly quantified at the global scale. Residue-based fires have the potential to modify regional climate by altering land surface temperature (LST), highlighting the need for investigation at regional scale. Here, an observation-driven assessment of spatial variations in LST due to concurrent release of energy and aerosols has been made over northwestern India using multiple satellite and reanalysis-based datasets. Year-specific fire pixel density was used to delineate an intensive fire zone characterized by medium-to-large residue-based fire. Geospatial analysis revealed positive association among FRP (fire radiative power), LST and AOD (aerosol optical depth). Over intensive fire zone, a space-for-time approach revealed significant increase in both ΔLST (0.57 °C; 95 % CI: 0.33–0.81 °C) and ΔAOD (0.13; 95 % CI: 0.08–0.17) due to fire. Random Forest non-linear model was employed to regress potential influence of FRP and AOD on LST having several other variables as confounding factors. FRP consistently emerged as the dominant predictor of LST, followed by planetary boundary layer height and aerosols. An increase in relative feature importance of FRP was noted during days having high fire intensity and positive association with LST. Geographically weighted regression further explained spatial heterogeneity in LST modulation by FRP. Overall, this analysis provides the first empirical evidence that residue-based fire contributes to changes in land surface temperature. It further highlights that the magnitude of this perturbation is governed by interannual variations in fire intensity and influenced strongly by prevailing meteorological conditions.
- Article
(10768 KB) - Full-text XML
-
Supplement
(10931 KB) - BibTeX
- EndNote


Burning agricultural residues is a widespread practice for the rapid removal of post-harvest biomass from croplands in many regions of the world (Streets et al., 2003; Singh et al., 2018; Shyamsundar et al., 2019). While biomass burning is often associated with deforestation (Chuvieco et al., 2021), forest fires (van der Werf et al., 2017; Aditi et al., 2025), and shifting cultivation (Prasad et al., 2006), residue burning on agricultural land is primarily conducted to clear fields, fertilize soil, eradicate weeds and pests, and prepare land for the next crop cycle (Graham et al., 2002; Korontzi et al., 2006; Lan et al., 2022). This practice is observed across large agricultural regions globally, including China (Streets et al., 2003; Zhang et al., 2020), South America (Graham et al., 2002), Southeast Asia (Lasko and Vadrevu, 2018), and northwestern India (Singh et al., 2018, 2021; Sarkar et al., 2018). In northwestern India, extensive residue burning during October to November is a recurring phenomenon and has been widely examined from multiple perspectives. Previous studies report that these burning events contribute to severe air-quality degradation in downwind urban centers (Singh et al., 2018; Jethva et al., 2019), alter aerosol loading and chemistry (Mhawish et al., 2022), modify aerosol vertical stratification and radiative forcing (Hsu et al., 2003; Vinjamuri et al., 2020; Banerjee et al., 2021), induce adverse health effects (Singh et al., 2021), and may influence regional hydrological processes (Kant et al., 2023). However, limited attention has been paid to investigate its effect on urban climate, especially on modulating lower atmospheric thermal budget which has been otherwise strongly evident in case of forest fire (Liu et al., 2018, 2019).
Across the northwestern India, dual cropping pattern including rice and wheat crop is predominately practised over roughly 4.1×10⁶ ha of land (NAAS, 2017). Such a cropping pattern leads to generation of huge crop residues that are low in nutrient content and rich in silica and ash. Typically, residues from rice-wheat cropping system possess limited economic value, as they are unsuitable for use as alternative fodder, bioenergy feedstock or as raw material in pulp and paper industry (Shyamsundar et al., 2019; Lan et al., 2022). Besides, with the introduction of mechanical harvester in the 1980s and enactment of groundwater preservation act in the late 2000s, in situ burning of agricultural residues has become a recurrent practice among the local farmers. This practice serves to expedite field clearance and reduce the turnaround period between rice harvest and the subsequent sowing of the wheat crop (Balwinder-Singh et al., 2019). India produces an estimated 500×106 metric tonnes (MT) of crop residues annually, of which 20 %–25 % are disposed of through open-field burning. Crop residue burning is particularly prevalent in northwestern India, where roughly 20–25 MT of residues are set on fire each year (Balwinder-Singh et al., 2019; Lan et al., 2022). Unregulated residue burning in this region contributes approximately 300 Gg yr−1 of PM2.5 and 50 Tg of CO2 equivalent green-house gas emission (Singh et al., 2020). Notably, the frequency of fire incidences has exhibited a persistent upward trend, coinciding with concurrent increases in vegetation indices and atmospheric aerosol loading (Jethva et al., 2019). In addition to atmospheric emissions, fires exert numerous biophysical impacts on the surrounding ecosystems. Fire induces a cascade of consequential processes, including modifications to the surface energy balance, redistribution of nutrients, alterations in species composition, changes in surface albedo, and variations in evapotranspiration rate (Ward et al., 2012; Liu et al., 2019). Additionally, fire can induce certain biogeochemical and biophysical stresses on local environment by modifying atmospheric composition and surface properties (Andela et al., 2017; Aditi et al., 2025). Such transformation of the native landscape, coupled with excessive release of energy, aerosols and its precursors, may therefore have several potential implications on the environment.
Most studies on biomass-based fires have focused on identifying land–atmosphere processes responsible for fire initiation and propagation, quantifying emissions, and evaluating fire-induced land–atmosphere exchanges (Lasko and Vadrevu, 2018; Jethva et al., 2019; Chuvieco et al., 2021; Aditi et al., 2025). In contrast, there is a paucity of knowledge regarding how biomass burning contributes to climate feedbacks through modifications of Earth's surface radiative budget and land surface temperature (Bowman et al., 2009; Andela et al., 2017). Plausible explanation to this includes limited observation and associated uncertainties in estimating key biophysical parameter like surface albedo, land–atmosphere exchange of sensible heat flux and water vapor, changes in evapotranspiration before and after fire events. There are instances when global forest fire incidences and size have been linked with modifications in land surface temperature (LST; Alkama and Cescatti, 2016; Liu et al., 2018, 2019). Likewise, Liu et al. (2019) noted an enhancement in mean annual LST over burned forest area in the northern high latitudes. Similar evidence of increase in summertime surface radiometric temperature over temperate and boreal forests in the Northern Hemisphere was accounted by Zhao et al. (2024). Alkama and Cescatti (2016) reported increases in mean and maximum air temperature over arid regions following forest loss, highlighting the sensitivity of surface temperature to land-cover modification. However, fire-induced thermal forcing is strongly constrained by the fire size (Zhao et al., 2024). Small, short-lived fires, such as those associated with agricultural residue burning, often fail to produce sufficiently large changes in surface albedo or evapotranspiration, and therefore may not generate a detectable LST response. Incidence of elevated LST over different provinces in China due to agricultural residue burning has only recently reported by Zhang et al. (2020). A spatially heterogeneous increase in LST correlated strongly with fire count, with highest LST gradient noted at distances of 4–10 km from the central point of crop residue burning and persisting for 1–3 d. In contrast, the effects of post-harvest fire incidences in northwestern India on LST remain largely unexplored. This gap introduces considerable uncertainty in assessing the climate feedback of crop residue burning and highlights the need for a better understanding of the underlying mechanisms.
This study aims to explore immediate biophysical effect of agricultural residue fire on surface temperature over northwestern India. By integrating spatially and temporally consistent satellite observations and reanalysis datasets, including fire counts, fire radiative power, land surface temperature, aerosols, meteorological covariates, topography, surface property, and physical environment over intensive fire zone, we sought to quantify time-bound changes in LST in response to variations in fire intensity and aerosol loading. Several statistical methods were applied to construct the changes in LST with fire severity and aerosols. Additionally, a space-for-time framework was followed to assess the effects of recurrent FRP variations on LST and aerosol optical depth (AOD) throughout the fire season. Specifically, we addressed two key questions: (1) Does LST respond to changes in fire intensity over northwestern India? and (2) How do local meteorology and aerosol loading modulate LST variation with respect to space and time? To the best of our knowledge, this is the first systematic assessment of agricultural residue fire–driven modulations in LST over northwestern India. By integrating multiple geospatial observations, the analysis offers critical insights into the biophysical feedbacks of residue-based fire and advances understanding of LST responses to residue burning. Further, it refines estimates of fire-induced perturbations in the regional radiative budget offering valuable representation of biomass-based fire in Earth system models.
2.1 Study domain
Post-harvest biomass burning is predominantly practiced across the northwestern Indo-Gangetic Plain (IGP) of South Asia, particularly in the agrarian states of Punjab and Haryana, which together contribute nearly 60 %–70 % of India's total food grain production. The concurrent rise in rice and wheat cultivation has led to a substantial increase in crop residue generation, resulting in higher fire intensity in recent years (Jethva et al., 2019). In this study, geospatial analyses of LST, fire activity, and aerosol loading were conducted over northwestern India during October–November between 2017 and 2021. The combination of high agricultural output, extensive biomass burning, and increasing fire activity makes this region particularly suitable for investigating fire dynamics and their environmental implications. Schematic workflow indicating core datasets and adopted methodology for exploring FRP-AOD-LST association is illustrated in Fig. S1 in the Supplement. Instead of defining a fixed spatial domain a priori, year-wise fire signals were retrieved across cropland areas in northwestern India. This approach allowed the delineation of a core study region that varied annually according to year-specific fire intensity and spatial trends (as shown in Fig. S2 in the Supplement), but all eventually bound to 29.2770–32.1625° N and 73.8996–77.0718° E, as illustrated in Fig. 1b.
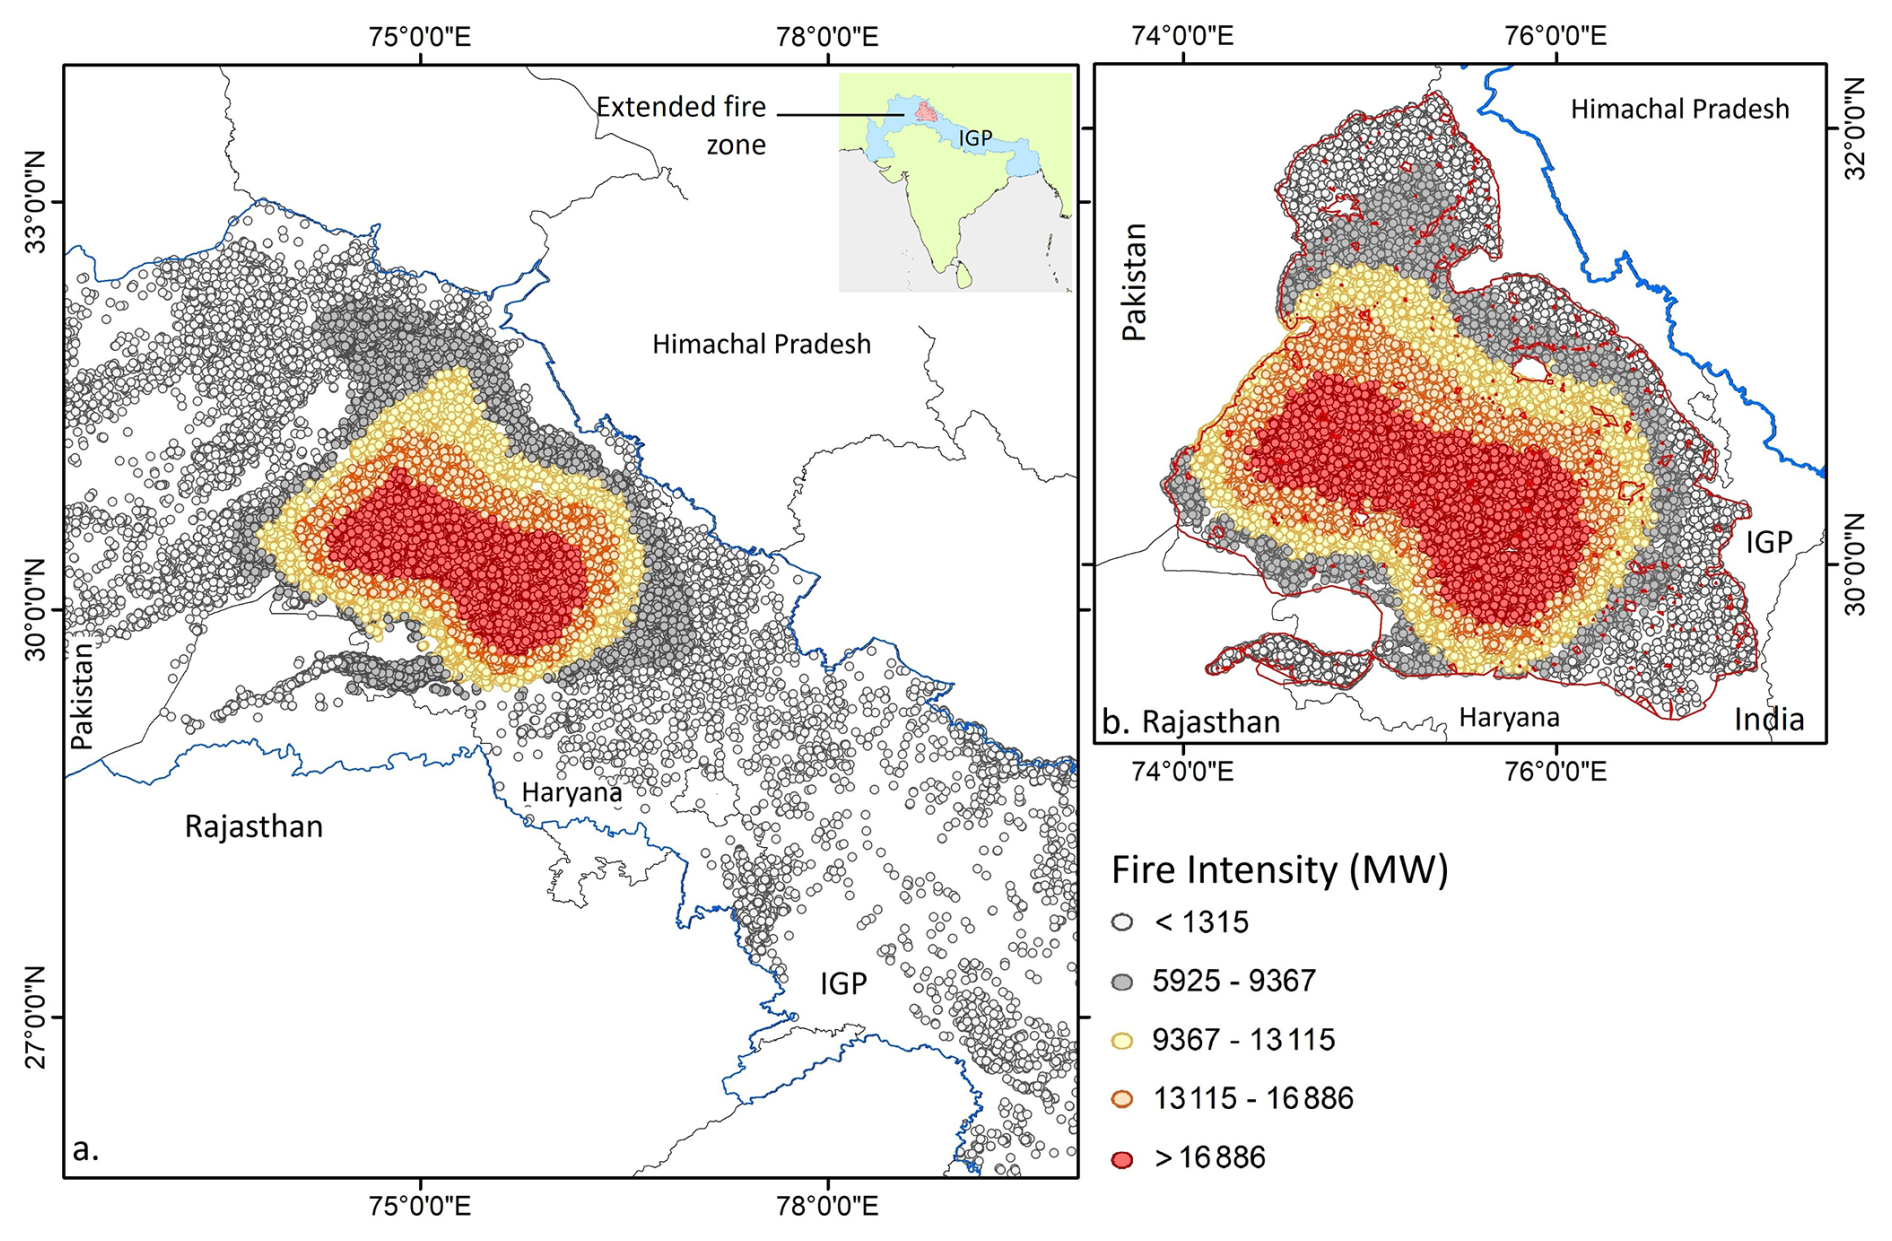
Figure 1Spatial variation in satellite-based fire radiative power across northwest India, distribution of FRP-based fire intensity (MW pixel−1) (a) and domain selected for retrieval and processing of SNPP VIIRS FRP, AOD and Aqua MODIS LST (b). The region marked with blue in Fig. 1a subset indicates the Indo-Gangetic Plain (IGP) spanning from Pakistan to Bangladesh through India. The extended fire zone selected for analysis is marked with red within the IGP and has been shown in detail in Fig. 1b with fire pixel density.
2.2 Spatial dataset
Active fire count data was retrieved from the standard fire product of Visible Infrared Imaging Radiometer Suite (VIIRS) Collection-2 (VNP14IMG) available at 6 min L2 swath at 375 m resolution. The VIIRS onboard the Suomi National Polar-orbiting Partnership (SNPP) satellite is a cross-track single-angle scanning radiometer which was launched in year 2011 under joint operation of NASA and NOAA. The VIIRS fire detection algorithm typically extends well refined and validated MODIS Fire and Thermal Anomalies product (Giglio et al., 2003). The I-band based fire detection algorithm primarily utilizes brightness temperature of Channel I4 on middle infrared spanning from 3.55–3.93 µm, centred at 3.74 µm. Additionally, to isolate the active fire spots from the fire-free background channel, a single gain I5 at thermal infrared regions (10.5–12.4 µm) is also considered. Rest of the I-band channels i.e. I1 to I3, covering visible, near and short-wave IR are used to distinguish pixels with cloud, water and sun-glint (Schroeder et al., 2014). The VIIRS fire database was considered due to its superior precision and accuracy in identifying relatively small fire, greater spatial resolution at footprint and pixel saturation temperature (Li et al., 2018; Vadrevu and Lasko, 2018; Aditi et al., 2023). For this experiment, SNPP VIIRS 375 m L2 active fire count data with nominal (fire mask class 8) and high confidence (fire mask class 9), was retrieved over northwestern India from year 2017–2021 (all inclusive).
Fire radiative power (FRP) quantifies the release of radiative energy from biomass burning integrated at all angles and wavelengths over a spatial scale. Measured in Watt, FRP retrieval quantifies the release of heat energy against time and in many instances linearly associated with the rate of fuel consumption and emission (Ichoku et al., 2008; Nguyen and Wooster, 2020). A detailed description on FRP retrieval and comparison among the sensors are available in Wooster et al. (2003, 2005) and Ichoku et al. (2008). Li et al. (2018) concluded VIIRS FRP as comparable with MODIS FRP in most of fire clusters and stable across swath. Here, FRP (MW) was processed from the SNPP VIIRS C2 Level-2 (L2) 375 m active fire product (VNP14IMG). VIIRS FRP was used as a proxy of fire intensity and potential emission strength from the biomass burning area, and considered as a direct measurement of radiative energy being released from individual fire pixel.
Land surface temperature (LST, in °C) at 1 km spatial resolution was utilized from Moderate Resolution Imaging Spectroradiometer (MODIS) version 6.1 Land Surface Temperature and Emissivity retrievals product (MYD11A1). Typically, LST indicates thermodynamic temperature of the interface atmospheric layer within soil, plant cover and lower atmosphere, and serves as an indicator of land–atmosphere interaction and exchange (Li et al., 2023). Here, MODIS MYD11A1 radiometric dataset with quality flag “00” was specifically chosen considering its broad swath and wider applicability in estimating land surface temperature. MODIS LST is validated against ground observations on diverse land covers and reported to provide realistic estimate of surface temperature (Wan, 2014) with an uncertainty of ≤0.5 K. The dataset includes daytime maximum LST (at 01:30 PM LT) and nighttime minimum LST (at 01:30 AM LT). Here, daytime LST dataset were obtained solely from the MODIS sensor onboard the Aqua satellite to closely coincide with VIIRS fire count observations at 01:30 PM LT, a period when crop residue–based fires are expected to reach at peak.
Aerosol optical depth (AOD) from Visible Infrared Imaging Radiometer Suite (VIIRS) sensor on-board SNPP satellite offers accurate estimation of columnar aerosol loading at 550 nm over land. Accuracy of VIIRS V1 DB AOD was evaluated extensively over South Asia by Aditi et al. (2023) and reported to provide stable AOD retrieval against AERONET. Sayer et al. (2019) reported an estimated error of in VIIRS Version 1 DB AOD dataset. Here, Deep Blue (DB) Version 1 AOD dataset (AERDB_L2_VIIRS_SNPP Level-2) was used to retrieve AOD with a nominal spatial resolution of 6 km at nadir. Only quality assured AOD (QA ≥2) was retrieved for the months of October to November over selected spatial domain.
Terra/Aqua MODIS land cover data was used to discriminate crop land against the rest to filter out thermal anomalies exclusively over the agriculture land. To achieve this, MODIS L3 V6.1 Global Land Cover type product (MCD12Q1) was retrieved from LAADS DAAC site for year 2017, available at 0.5 km spatial resolution. MODIS land cover types adopts International Geosphere-Biosphere Programme (IGBP) and other land type classification schemes to classify land cover. Here, land cover type 12 (cropland) was earmarked to isolate the agriculture land from its surrounding (Fig. S3 in the Supplement).
Daily composite data on surface and root-zone soil moisture (SM, m3 m−3) available at 9 km resolution was obtained from NASA's Soil Moisture Active Passive (SMAP) satellite mission having L-band radar. The Normalized Difference Vegetation Index (NDVI) at 6 km resolution was derived from the VIIRS/SNPP Deep Blue (AERDB_L2_TOA_NDVI) dataset and was utilized to quantify surface vegetation greenness dynamics. Elevation data at 30 m resolution was retrieved from Copernicus DEM – Global and European Digital Elevation Model dataset for year 2015. Surface albedo data was acquired from MCD43 suite of NASA standard product which integrates both Terra and Aqua retrievals. Here, white-sky version 6.1 shortwave albedo data (MCD43A3, Albedo_WSA_shortwave) at 500 m pixel resolution with daily-time step (quality score: 0) was used.
Lower surface meteorological data including air temperature (AT), total solar radiation flux (SR), precipitation (PR), relative humidity (RH) was procured from European Centre for Medium-Range Weather Forecasts (ECMWF) AgERA5 dataset. The AgERA5 dataset has been generated by Copernicus Climate Change Service (2020) from hourly ECMWF ERA5 dataset for specific agro-ecological based applications. The meteorological data were pre-customized with temporal aggregation aligned to local time zones and spatial enhancement to a 0.1° resolution using grid-based variable-specific regression model. Here, air temperature at 2 m above the surface, total solar radiation flux received at the surface over a 24 h time period, and relative humidity at 2 m height was selectively used over pre-identified intensive crop-based fire zone. Planetary boundary layer height (PBLH) data at 0.25°×0.25° resolution was acquired from ECMWF ERA5 for 13:00–14:00 LT corresponding with VIIRS overpass time. A description of all core datasets used in this analysis and their resolution, version, and quality flags is included in Table S1 in the Supplement.
2.3 Spatial analysis for fire-aerosols-LST association
2.3.1 Selection of intensive fire zone
Post-harvest residue burning typically begins in mid-October and reaches peak intensity by mid-November across northwestern India. Accordingly, all spatial analyses were conducted for October and November for the years 2017–2021. The VIIRS 375 m fire product successfully retrieved active fire pixels across the Indo-Gangetic Plain, capturing substantial spatial heterogeneity. To ascertain a representative region having predominance of residue-based fire, spatial comparison of fire pixel density was made using daily retrieved VIIRS FRP dataset. FRP was selected instead of fire counts because it directly quantifies the radiative energy released from active burning and therefore provides a more meaningful metric for assessing potential impact on LST. FRP density was computed on a 1.5 km×1.5 km grid to characterize spatial variations in fire intensity across northwestern India. Following Giglio et al. (2003), FRP density was estimated as the ratio of total FRP within a grid cell to the grid area.
Initially, geospatial variations in fire intensity and the associated changes in LST and AOD were evaluated. Spatial intercomparison between FRP, LST, and AOD was performed over the region delineated in Fig. 2a. This area was selected to encompass an extended geographical domain without imposing thresholds on low or high FRP density across northwestern India. The region is hereafter referred to as the “extended geographical region,” as it integrates fire activity across all years and was used exclusively to establish the spatial association between the predictor (FRP) and dependent variables (LST and AOD).
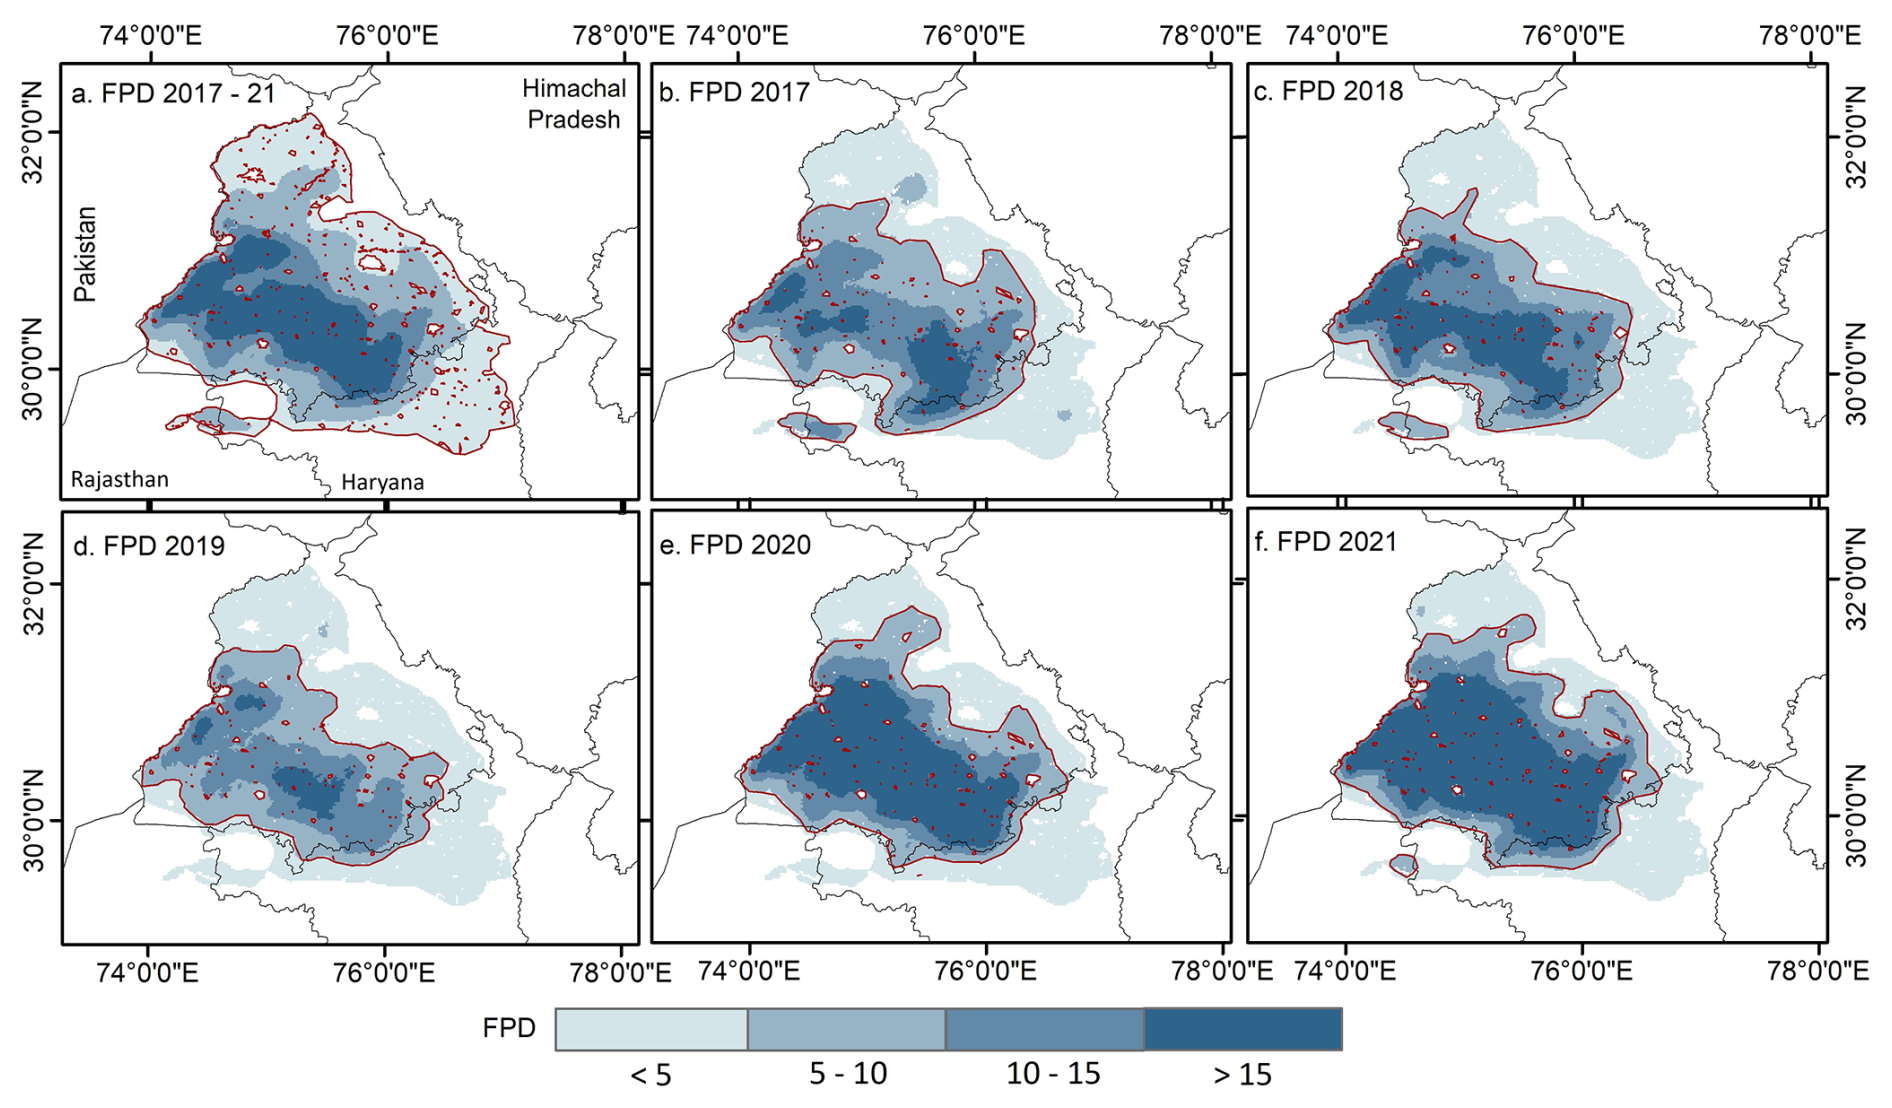
Figure 2Selection of high intensity residue-based fire zone based on fire radiative power pixel density (). (a) indicates the “extended geographical region” demarcating the entire area with varying fire intensity selected for spatial analysis. Rest of the figures (b–f) classify year-specific “intensive fire zone” based on FRP density.
In contrast, to assess the day-to-day influence of fire intensity and aerosol loading on LST, a comparatively high-intensity fire zone was delineated relative to low-intensity areas. To achieve this, the entire crop-residue burning region of northwestern India was mapped using a constraint from low FRP density (<5 MW grid−1) to high FRP density (>15 MW grid−1). Spatial variations in FRP density were evaluated for each year, and regions with FRP density >5 MW grid−1 were identified as the “intensive fire zone” (Fig. 2b–f). This threshold ensured a better representation of the effect of medium to large crop-based fire on regional LST as small-intensity fire deem to extinguish faster while being inconducive to considerably influence surface temperature (Zhao et al., 2024).
All subsequent spatial datasets used for evaluating FRP–AOD–LST relationships were retrieved exclusively within the year-specific “intensive fire zone” having FRP density >5 MW grid−1. Notably, the spatial extent of the high-FRP region remained largely consistent across all years (Fig. 2b–f), with areal estimates summarized in Table S2 in the Supplement. It is noteworthy, the region was pre-filtered based on the Terra/Aqua MODIS land cover data to deselect any FRP pixel that emerged from a non-agricultural/crop land.
2.3.2 Selection of temporal window
After isolating the region with higher fire pixel density, the next step was to identify the temporal window in which potential associations between fire intensity and other explanatory variables could be examined. The temporal selection was based on two scenarios, as illustrated in Fig. 3. Scenario 1 was designed to quantify the influence of FRP, aerosols, and other parameters on LST during the period when fire activity begins to intensify and remains persistent over the intensive fire zone. Scenario 1 defines the initiation day as the first instance in October when aggregate FRP consistently exceeds 1500 MW and shows at least a 50 % increase compared to the previous day. The scenario concludes in November when aggregate FRP decreases by at least 50 % relative to the previous day. The selected dates for Scenario 1 are listed in Table S3 in the Supplement, with two exceptions. First, in year 2018 when a >50 % criteria was not met despite having an aggregate FRP >1500 MW and second, in year 2017 when a prior decrease (>50 %) in FRP was avoided because of subsequent rise in fire intensity.
To define Scenario 2, a statistical association was examined between day-specific aggregate FRP and the spatially averaged LST. Pixel-based LST values were averaged over the intensive fire zone and compared against the area-weighted sum of FRP on a day-to-day basis. A temporal window (“Scenario 2” in Fig. 3) was selected using two criteria: (i) the end of the window had to coincide with a period of persistently high FRP, and (ii) the window had to exhibit a strong positive correlation (r≥0.5) between FRP and regional LST. Such restricted criteria were put to ensure that we only select year-specific window(s) when FRP (so the fire count) increases with time and exhibit a strong association with regional LST. Descriptive statistics of both scenarios are included in Table S4 in the Supplement. It is noteworthy that selecting multiple windows within a year having coinciding days was avoided while ensuring windows should not contain more than 5 % of missing days, irrespective of parameters.
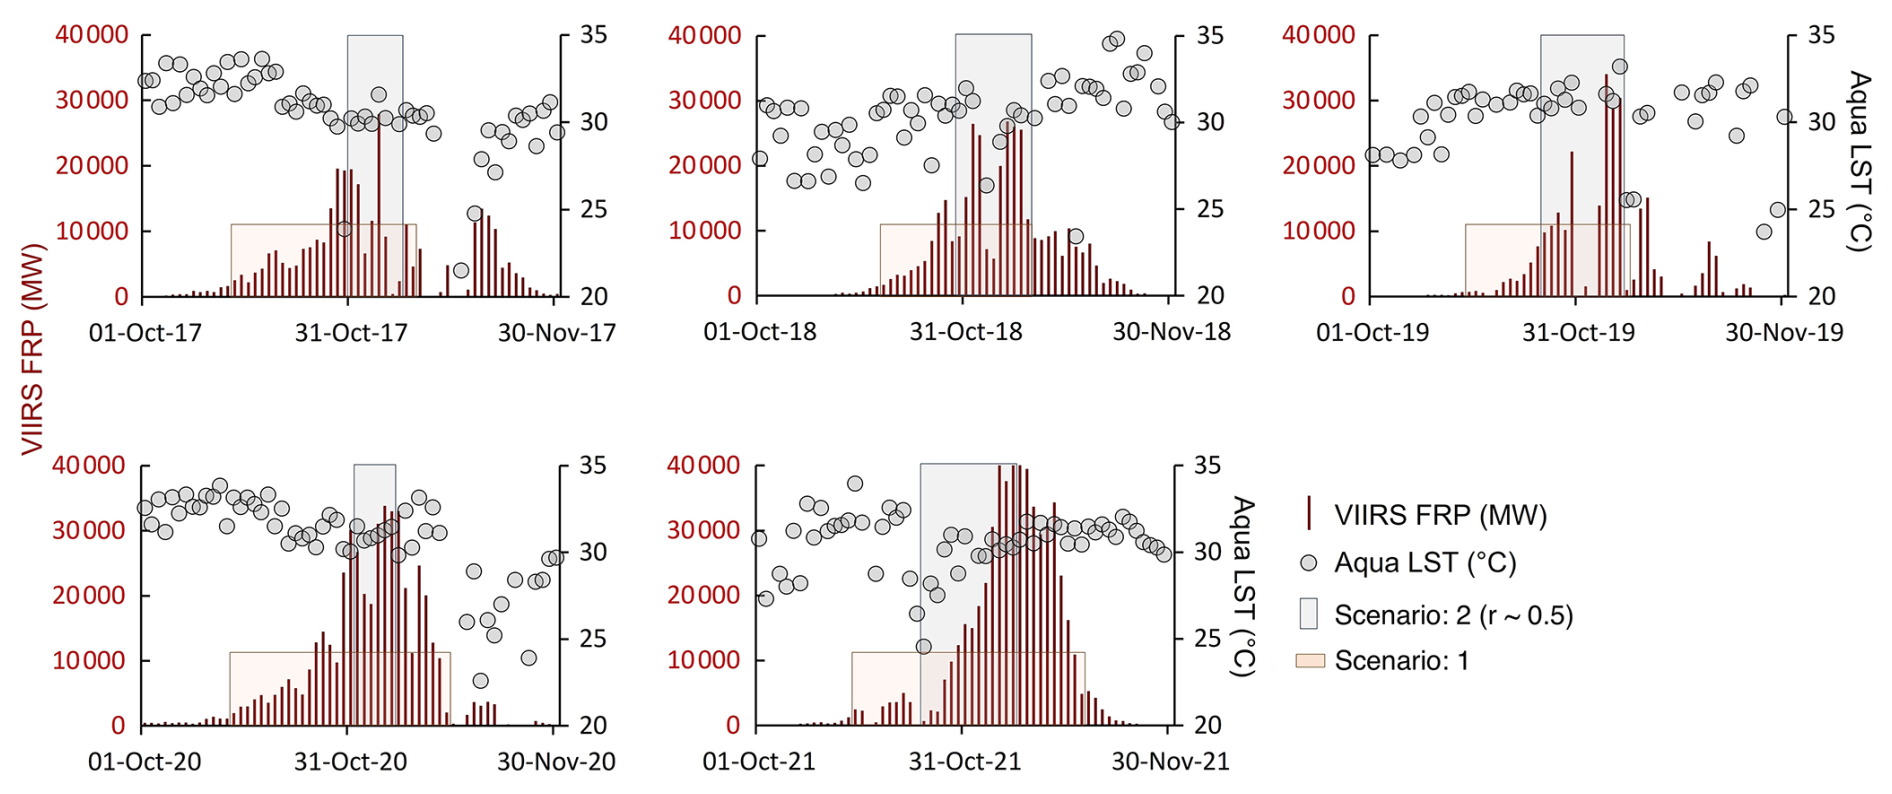
Figure 3FRP and LST time series over intensive fire zone showing the extent of scenarios used for geospatial modelling.
2.4 Spatial correlation between fire, aerosols and LST
To examine the spatial association among FRP, LST, and AOD over the residue–based fire zone, grid-based spatial correlation coefficients were computed, and their statistical significance (p<0.05) was tested across the study domain. Daily FRP (375 m) and LST (1 km) datasets were initially resampled to a 6 km×6 km resolution to match the VIIRS AOD dataset before subject to spatial correlation analyses among the predictor and dependent variables. This approach facilitated the identification of regions exhibiting strong co-variability in thermal conditions corresponding to variations in fire intensity and columnar aerosol loading.
2.5 Hurst Exponent
The Hurst exponent is a statistical measure used to characterize the properties of a time series without imposing assumptions about its underlying distribution. Originally introduced by Hurst (1951) in hydrological studies and later refined by Markonis and Koutsoyiannis (2016), it has since been widely applied across diverse scientific disciplines to analyse long-term trends and variability. In this study, the Hurst exponent was computed for FRP, AOD, and LST time series to identify long-term statistical persistence in the datasets. To estimate the Hurst exponent at the spatial scale, 6 km×6 km resampled datasets of FRP, AOD, and LST were used. Adjustment of seasonal cycle was not accounted, as the datasets were retrieved and processed exclusively for a single season across the selected years. The main calculation procedures were as follows (Granero et al., 2008):
A time series x(t) is given,
The cumulative deviation is determined using Eq. (2):
Extreme deviation sequence, is defined as:
The standard deviation sequence is calculated by Eq. (4):
By considering both extreme deviation sequence and standard deviation sequence,
The Hurst exponent ranges between 0 and 1. A value of 0.5 indicates that the time series behaves as a purely stochastic process without persistence, implying that future variations are independent of past behaviour. Values greater than 0.5 denote statistical persistence, reflecting a tendency for future changes to follow the same trend as in the past, with higher values corresponding to stronger persistence. Conversely, values below 0.5 indicate anti-persistence, suggesting a tendency for the time series to reverse its trend over time; lower values represent stronger anti-persistence (Peng et al., 2012).
2.6 Space-for-time approach
A space-for-time approach was employed to assess and compare the changes in LST and AOD with respect to FRP within the extended geographical region experiencing recurrent medium- to high-intensity fire. To ensure that changes in LST and AOD were attributable solely to fire activity, grids with similar characteristics in terms of topography, climate, and physical environment were compared (Liu et al., 2019). To achieve this, daily datasets including meteorological covariates (PBLH, AT, SR, RH and PR), physical environment (elevation), vegetation and soil characteristics (NDVI, soil moisture), climatological mean LST and AOD, and surface property (albedo) were extracted over both fire and no-fire grids at a spatial resolution of 10 km×10 km. The daily data were retrieved for each grid under Scenario 2, when FRP reached its peak and exhibited a positive association with regional LST.
After filtering out the grid cells with missing LST or AOD values, remaining grids were classified into two groups: those with zero FRP (no-fire) against the grids having , indicating presence of fire. Fire and no-fire grids with comparable spatial characteristics were grouped into a single stratum, and a stratified matching technique was applied to generate multiple strata based on combinations of the selected confounders. Grids were retained only when differences in their physical environment, vegetation and soil characteristics, climate and land cover between fire and no-fire conditions were smaller than the defined thresholds (Δelevation <50 m; ΔNDVI <0.05; Δsoil moisture <0.05; Δalbedo <0.05; ΔLST <10.0; ΔAOD <0.80). Comparisons were then made within strata containing grids of similar attributes to ensure that the observed variations in LST and AOD could be attributed solely to fire activity. The difference in LST (ΔLST) among the fire grids (LSTfire) and grids exhibiting no-fire (LSTno-fire) having similar attributes were compared to constitute effect of residue-based fire on LST. A positive (negative) ΔLST (LSTfire− LSTno-fire) indicates fire-induced warming (cooling) and was used to quantify changes in LST associated with residue burning for the selected years. A similar approach was also adopted to evaluate ΔAOD variations using grid-based retrievals.
It is noteworthy that the grids were not classified based on meteorological covariates, as only insignificant variations were noted among the grids. The entire northwestern cropland experiences a relatively uniform background climate during October–November, including comparable boundary layer heights, with PBLH standard deviations ranging from ±10 to ±33 m within a single fire season. The climatological mean LST and AOD were computed only for the pre-fire season (September, 2017–2021), during which none of the grids experienced residue-burning activity. Furthermore, grids were not differentiated by slope or aspect, given the minimal topographic variation across the Gangetic Plain.
2.7 Multicollinearity assessment
Multicollinearity, where independent variables are highly correlated, can distort regression estimates and obscure the true contribution of individual predictors (Graham, 2003). To assess this, the Variance Inflation Factor (VIF) for all covariates was calculated using the statsmodels library. A VIF of 1 indicates no correlation, values between 1 and 5 suggest moderate correlation, and values greater than 5 are generally interpreted as evidence of substantial multicollinearity (Daoud, 2017). All biophysical, land–surface, and meteorological variables met acceptable VIF thresholds, except solar radiation, which was therefore excluded from Random Forest and GWR analysis. Additionally, soil moisture data was removed from further analysis due to a high percentage of missing observations (∼30 %).
2.8 Random Forest regression
Random Forest regression was used to model the relationship between the dependent variable (LST) and predictor variables (AOD, PBLH, AT, RH, SR, PR, NDVI, elevation, albedo, and FRP) within the intensive fire zone. Daily retrievals, averaged over the year-specific intensive fire area, were incorporated into the ensemble framework to capture potential non-linear associations among variables. The selected approach ensures robustness to multicollinearity, minimizes overfitting, and effectively captures complex predictor interactions.
Random Forest is a non-linear ensemble machine learning algorithm that constructs multiple decision trees from bootstrapped samples of the training data, with a random subset of predictors evaluated at each split. Final predictions are obtained by averaging all trees, improving generalization and reducing overfitting (Breiman, 2001; Puissant et al., 2014). The algorithm was selected due to its strong predictive capability, scalability to large environmental datasets, resilience to correlated inputs, and demonstrated success in previous LST-related studies (Logan et al., 2020; Wang et al., 2022; Zhang et al., 2025). These attributes collectively support Random Forest as an appropriate and interpretable choice for assessing the complex interactions between fire intensity, aerosol loading, and LST dynamics.
Key Random Forest hyperparameters (n_estimators, max_depth, min_samples_split, min_samples_leaf, and max_features) were optimized using Bayesian optimization implemented via BayesSearchCV in scikit-optimize (Snoek et al., 2025; Shahriari et al., 2015; Frazier, 2018). This adaptive, probabilistic search strategy efficiently identifies near-optimal hyperparameter combinations while minimizing computational cost. To ensure robust model evaluation and mitigate temporal dependence, we employed temporal block cross-validation using a 3-fold GroupKFold in the scikit-learn library, where all observations from a given year were assigned to the same fold. This approach prevented temporal overlap between training and validation datasets and reduced information leakage across years. This approach also minimized temporal autocorrelation and prevented data leakage across time periods. Model performance was quantified using cross-validated coefficient of determination (R2), Root Mean Squared Error (RMSE), and Mean Absolute Error (MAE), providing a comprehensive assessment of model accuracy and prediction error.
2.9 Assessment of relative feature importance
Variable importance was derived from the trained RF model using the mean decrease in impurity method, which quantifies each predictor's relative contribution to reducing variance in model predictions. This approach provides insight into the dominant factors governing the spatial and temporal variability of LST. Feature importance values were extracted and ranked to identify the most influential predictors under different fire intensity scenarios. To enable direct comparison among predictors, the relative contribution of each feature was expressed as its importance score normalized by the sum of all feature importances. As Scikit-learn's RandomForestRegressor.feature_importances_inherently returns normalized values summing to one, the reported scores directly represent each predictor's proportional influence within the model.
2.10 Spatial heterogeneity assessment using GWR
Spatial heterogeneity in the influence of FRP, AOD, and other spatial predictors on LST within the intensive fire zone was assessed using Geographically weighted regression (GWR) at 1 km×1 km grid. GWR is a spatially explicit regression technique designed to quantify how relationships between predictors and a dependent variable vary across geographic space by estimating spatially varying coefficients (Brunsdon et al., 1996). The method applies a distance-based weighting scheme, whereby observations closer to a given location receive higher weights, allowing local parameter estimation that reflects neighbourhood-specific dynamics (Yang et al., 2020). Unlike global regression models that assume spatial stationarity, GWR produces location-specific coefficient estimates, offering a more nuanced understanding of spatially varying associations between LST and its predictors (Fotheringham et al., 2009). The GWR model is formally expressed as:
where (ui, vi) are the coordinates of observation i, βk(ui,vi) are spatially varying coefficients, xik are predictor variables, and εi denotes random error. In GWR, local parameters are estimated using weighted least squares, where each observation is assigned a weight based on its spatial proximity to the location being evaluated. These weights are determined by a spatial kernel function and a bandwidth parameter that defines the extent of spatial influence. Selecting an optimal bandwidth is therefore essential to balance the trade-off between model bias and variance. In this study, the optimal bandwidth was identified through an iterative optimization procedure that minimizes the corrected Akaike Information Criterion (AICc) (Fotheringham et al., 2009). This approach ensures robust estimation of local relationships while effectively accounting for spatial non-stationarity in the dataset. Such a framework is particularly valuable in fire-affected landscapes, where the impacts of fire intensity, aerosol loading, and surface characteristics on LST are inherently heterogeneous and vary substantially across space.
3.1 Spatial association between fire, aerosols and LST
Spatial variations in FRP, LST and AOD averaged for October to November between 2017 and 2021 over extended geographical region is shown in Fig. 4a–c. While residue-based FRP did not exhibit a distinct spatial pattern, temporal variations were prominent, with monthly mean FRP in November (310 188 MW month−1) showing nearly a 100 % increase compared to October (152 616 MW month−1; Table S5 in the Supplement). In contrast, the spatial pattern of LST exhibited considerable heterogeneity, with relatively higher temperature observed in the southern parts of the region that gradually declined northward. This north–south gradient may be partially attributed to the proximity of the Himalayan foothills, where the cooler mountainous environment likely offsets fire-induced surface warming. A gradual decline in spatially averaged monthly mean LST was also accounted in November (29.0 ± 2.4 °C) compared to October (31.0±1.6 °C). A spatially distinct pattern in columnar aerosol loading was evident across the extended geographical region, with elevated AOD (>0.65) retrieved over the central areas that gradually decreased towards its periphery (<0.30). Such spatial variability in aerosol loading is likely driven by differences in the intensity of residue-based fires and the associated emissions of aerosols and trace gas precursors. Moreover, the pronounced increase in monthly mean AOD (October: 0.59 ± 0.08; November: 0.82±0.12) likely reflects the intensification of fire during early November, compounded by concurrent meteorological influences, most notably the seasonal decline in boundary layer height (Banerjee et al., 2022).
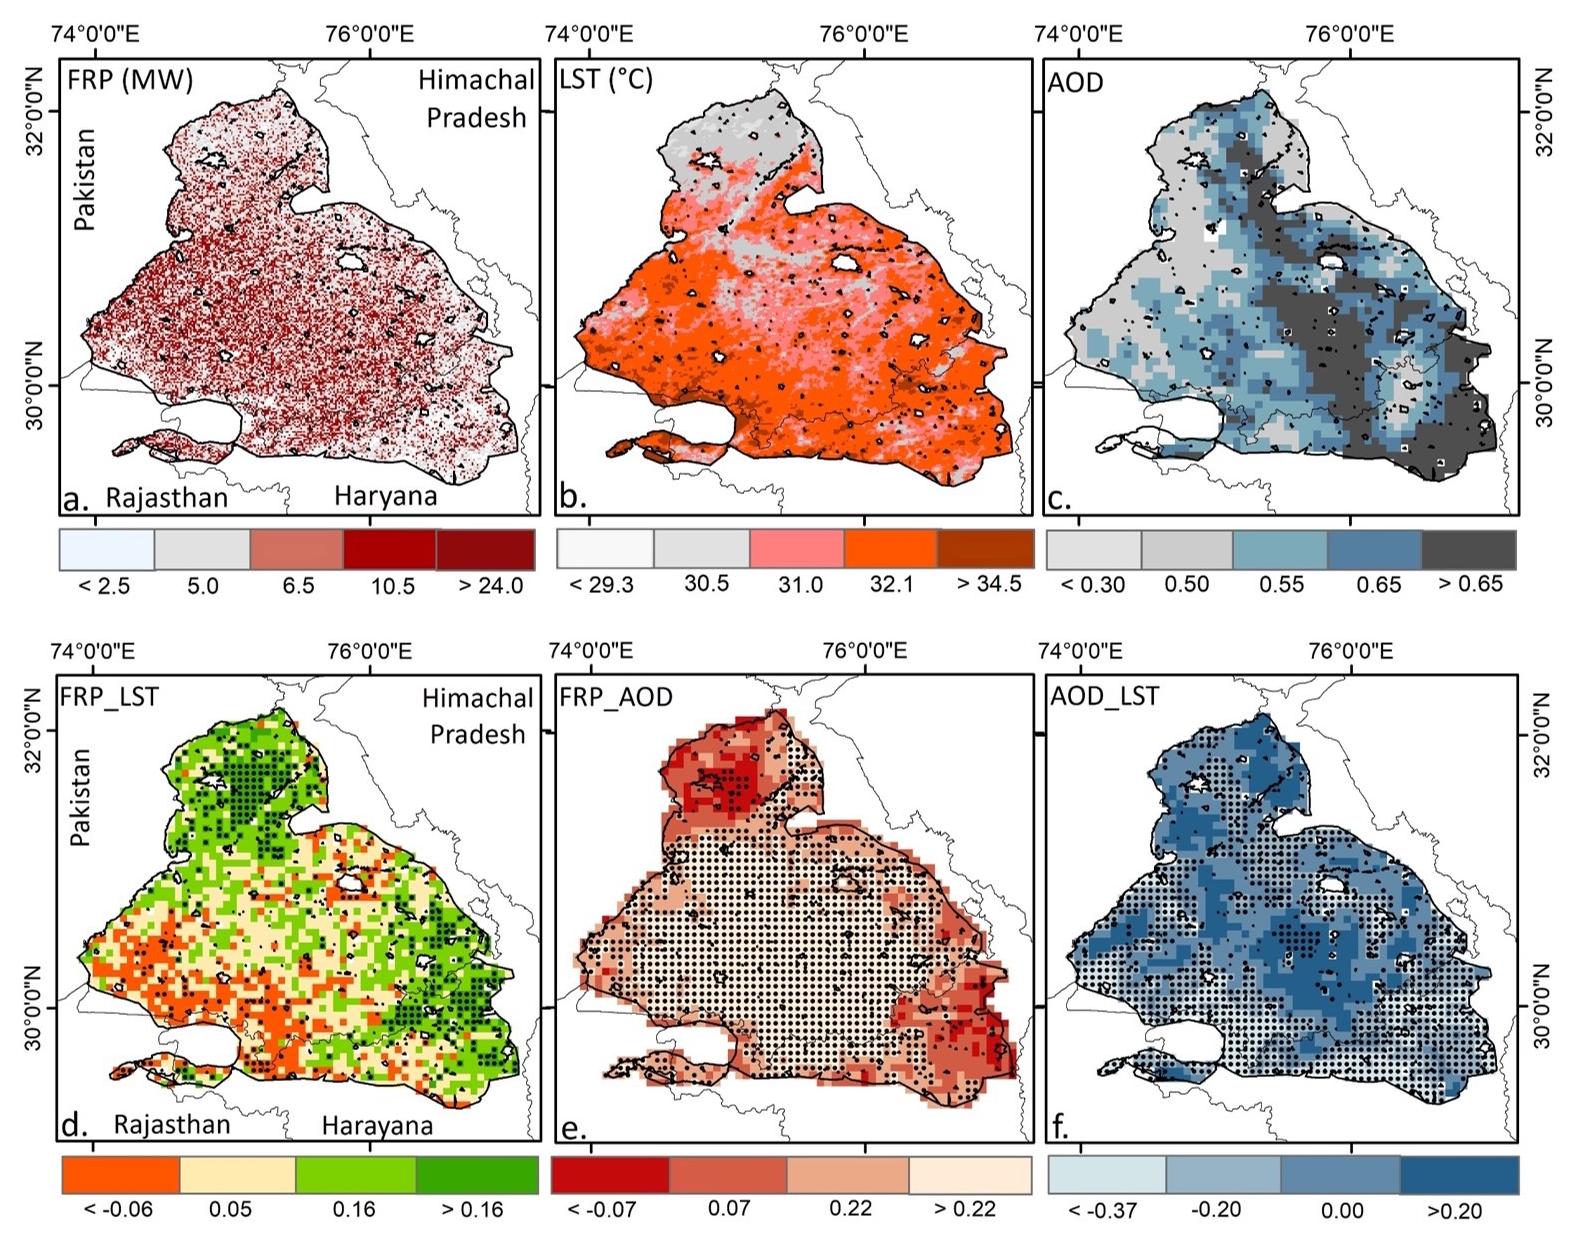
Figure 4Spatial variations of FRP, LST and AOD over extended geographical region, 5 year mean FRP (a), LST (b) and AOD (c), and spatial correlation between FRP_LST (d), FRP_AOD (e) and AOD_LST (f). To compute spatial correlation, daily retrievals of FRP, AOD and LST were converted to a common 6 km×6 km grid. Spatial correlation was computed for the entire duration and significant correlation (P<0.05) is shown with black dot.
Spatial associations among VIIRS-derived FRP, MODIS LST, and VIIRS-based AOD daily retrievals were assessed over the extended geographical region (Fig. 4d–f). Spatial correlation between pixel-based FRP against LST reveals positive but spatially heterogenous association across most parts of the study area, except in the southern region. A statistically significant relationship (P<0.05) between FRP and LST underscores the potential influence of crop residue burning on surface temperature. Similarly, a significant association between FRP and AOD was observed across the central region, where fire intensity was notably higher than in surrounding areas. This spatial covariation between fire intensity and columnar aerosol loading further reinforces the influence of biomass-burning-induced emissions of aerosols and their precursors on atmospheric aerosol abundance. Biomass-burning aerosols, predominantly composed of carbonaceous soot particles, are known to modulate the thermal budget of the lower atmosphere (Freychet et al., 2019; Xu et al., 2021). The spatial association between AOD and LST further supports the existence of a fire–aerosol–surface temperature nexus over northwestern India. A comparatively weak yet statistically significant positive correlation between AOD and LST likely reflects lower-atmospheric warming induced by smoke aerosols, consistent with the similar warming effect over western United States during 2017 California wildfire (Gomez et al., 2024).
3.2 Evaluation of Hurst exponent
The Hurst exponent was evaluated to assess the long-term persistence of fire intensity, surface temperature, and aerosol loading time series over the extended geographical region. In principle, the Hurst exponent is used to quantitatively distinguish a purely stochastic time series (H=0.50) from a persistent (H>0.50) or anti-persistent (H<0.50) time series of pixel-based FRP, LST, and AOD, following the methodology described in Markonis and Koutsoyiannis (2016) and Chen et al. (2022).
As shown in Fig. 5, nearly the entire extended geographical region of northwestern India exhibits Hurst exponent values greater than 0.50 for FRP, with relatively higher values (0.60–0.70) concentrated toward its central zone. Although variations in Hurst exponent for FRP was spatially inconsistent, primarily due to temporal and spatial fluctuations in fire intensity, the FRP time series over most of the region indicates statistical persistence. Similarly, elevated Hurst exponent values for LST (>0.50) across the region also exhibits persistence at long run. Notably, the northern portion of the study region shows slightly higher Hurst exponent values compared to the southern part. For regional aerosol loading, except few isolated patches, comparatively high Hurst exponent values (>0.75) were observed over the central region. Notably, this area also coincides with zones characterized by high AOD (>0.65) and a statistically significant FRP–AOD association. Overall, the Hurst exponent analysis indicates that the observed FRP, LST, and AOD time series across most of the residue-burning region exhibit statistical persistence.
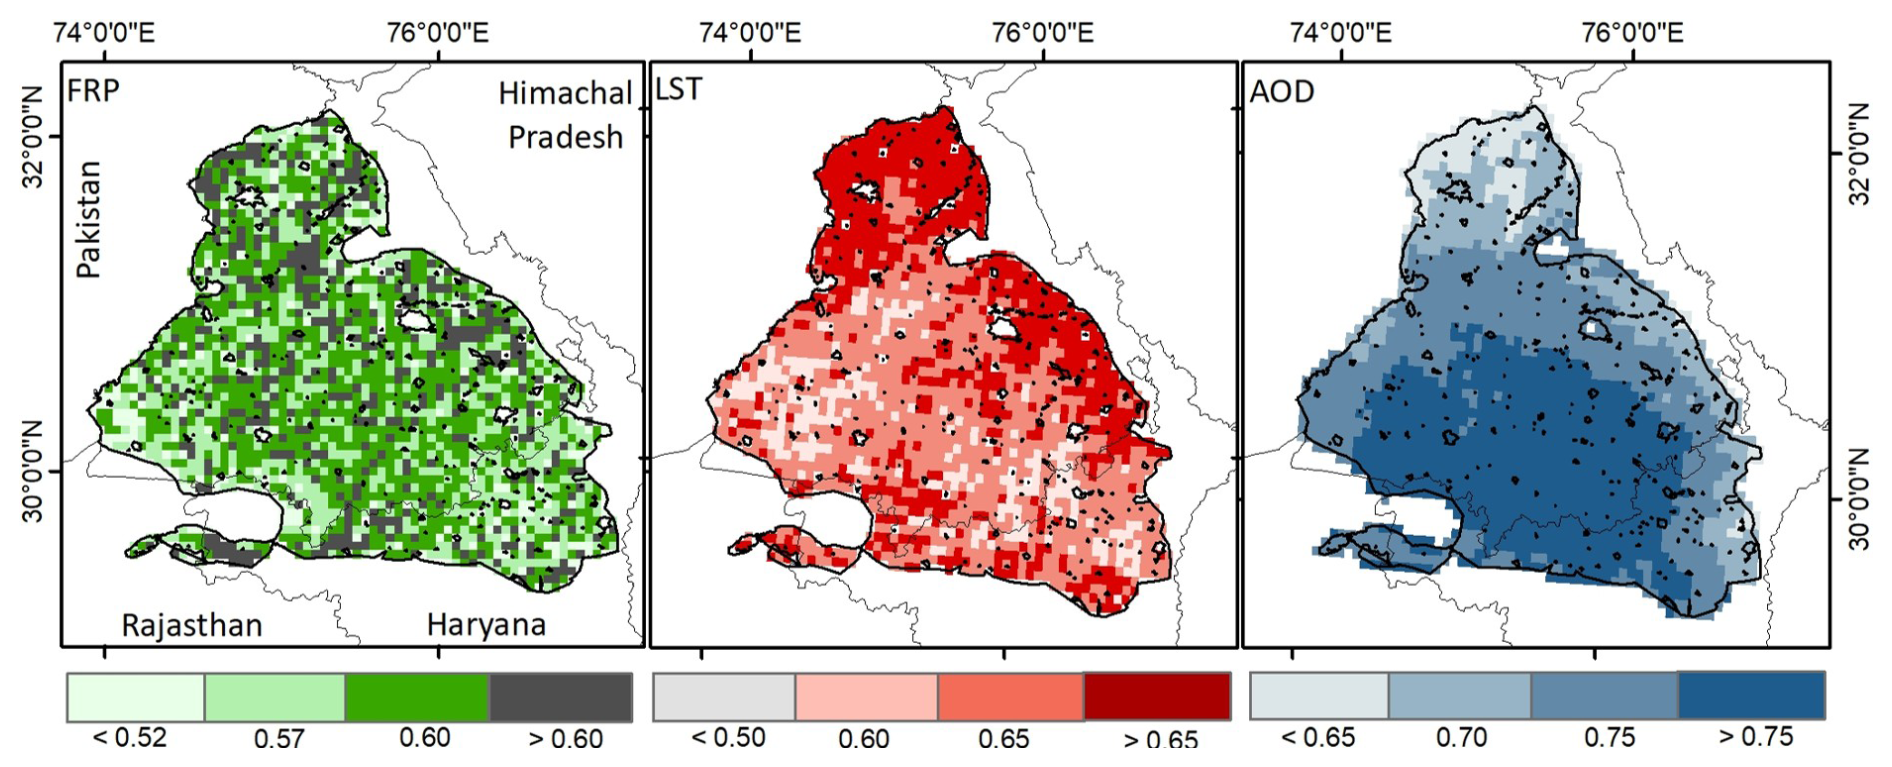
Figure 5Estimating FRP (MW), LST (°C) and AOD time-series persistence in extended geographical region.
However, interpretation of the Hurst exponent results should be approached with caution. The five-year dataset used here may not be sufficient to derive statistically robust estimates. For the same reason, trend analysis was not undertaken, as the limited dataset constrains the reliability of such estimates and falls beyond the scope of the present study. Nonetheless, several studies have documented long-term trends in fire dynamics and aerosol loading over northwestern India (e.g., Vadrevu and Lasko, 2018; Jethva et al., 2019; Singh et al., 2020).
3.3 Surface temperature and aerosols response to fire intensity
Fire intensity in terms of pixel-based FRP, aerosol loading and surface temperature were retrieved to compute corresponding daily and spatial means based on five years of satellite retrievals. It is noteworthy that to account immediate response of fire intensity and aerosol loading on surface temperature, all variables were retrieved exclusively over year-specific intensive fire zones, having cumulative FRP ≥5 MW grid−1, as illustrated in Fig. 2b–f.
A distinct temporal pattern is evident in the FRP time series (Fig. 6a), which corresponds closely with daily variations in fire counts (Fig. S4 in the Supplement). Over northwestern India, FRP starts to build-up typically in mid-October, peaks consistently during the first week of November, and declines thereafter by mid-November. In contrast, the temporal pattern of the five-year mean LST time series appears less pronounced, as daily retrievals exhibit substantial variability. Regional LST demonstrates both interannual and intra-annual fluctuations, as illustrated in Fig. S5 in the Supplement. Notably, the FRP time series aligns well with the mean columnar aerosol loading, underscoring the potential influence of aerosol and precursor emissions from widespread biomass burning. The characteristic rise in AOD during the first two weeks of November likely represents a direct response to intensified fire activity, as columnar AOD values consistently exceed 1.00 over the intensive fire zone. Interestingly, between 25 October and 20 November each year, approximately 90 % of daily AOD observations surpass the five-year mean (0.74 ± 0.28), coinciding with an 800 % increase in average FRP (13 085 ± 6825 MW) compared to the remainder of the season (1148 ± 1478 MW). During this interval, the five-year mean columnar AOD exhibits a strong association with the aggregate FRP (r=0.46) and mean LST (r=0.41), whereas these associations weaken considerably outside this period (AOD–FRP: r=0.18; AOD–LST: ).
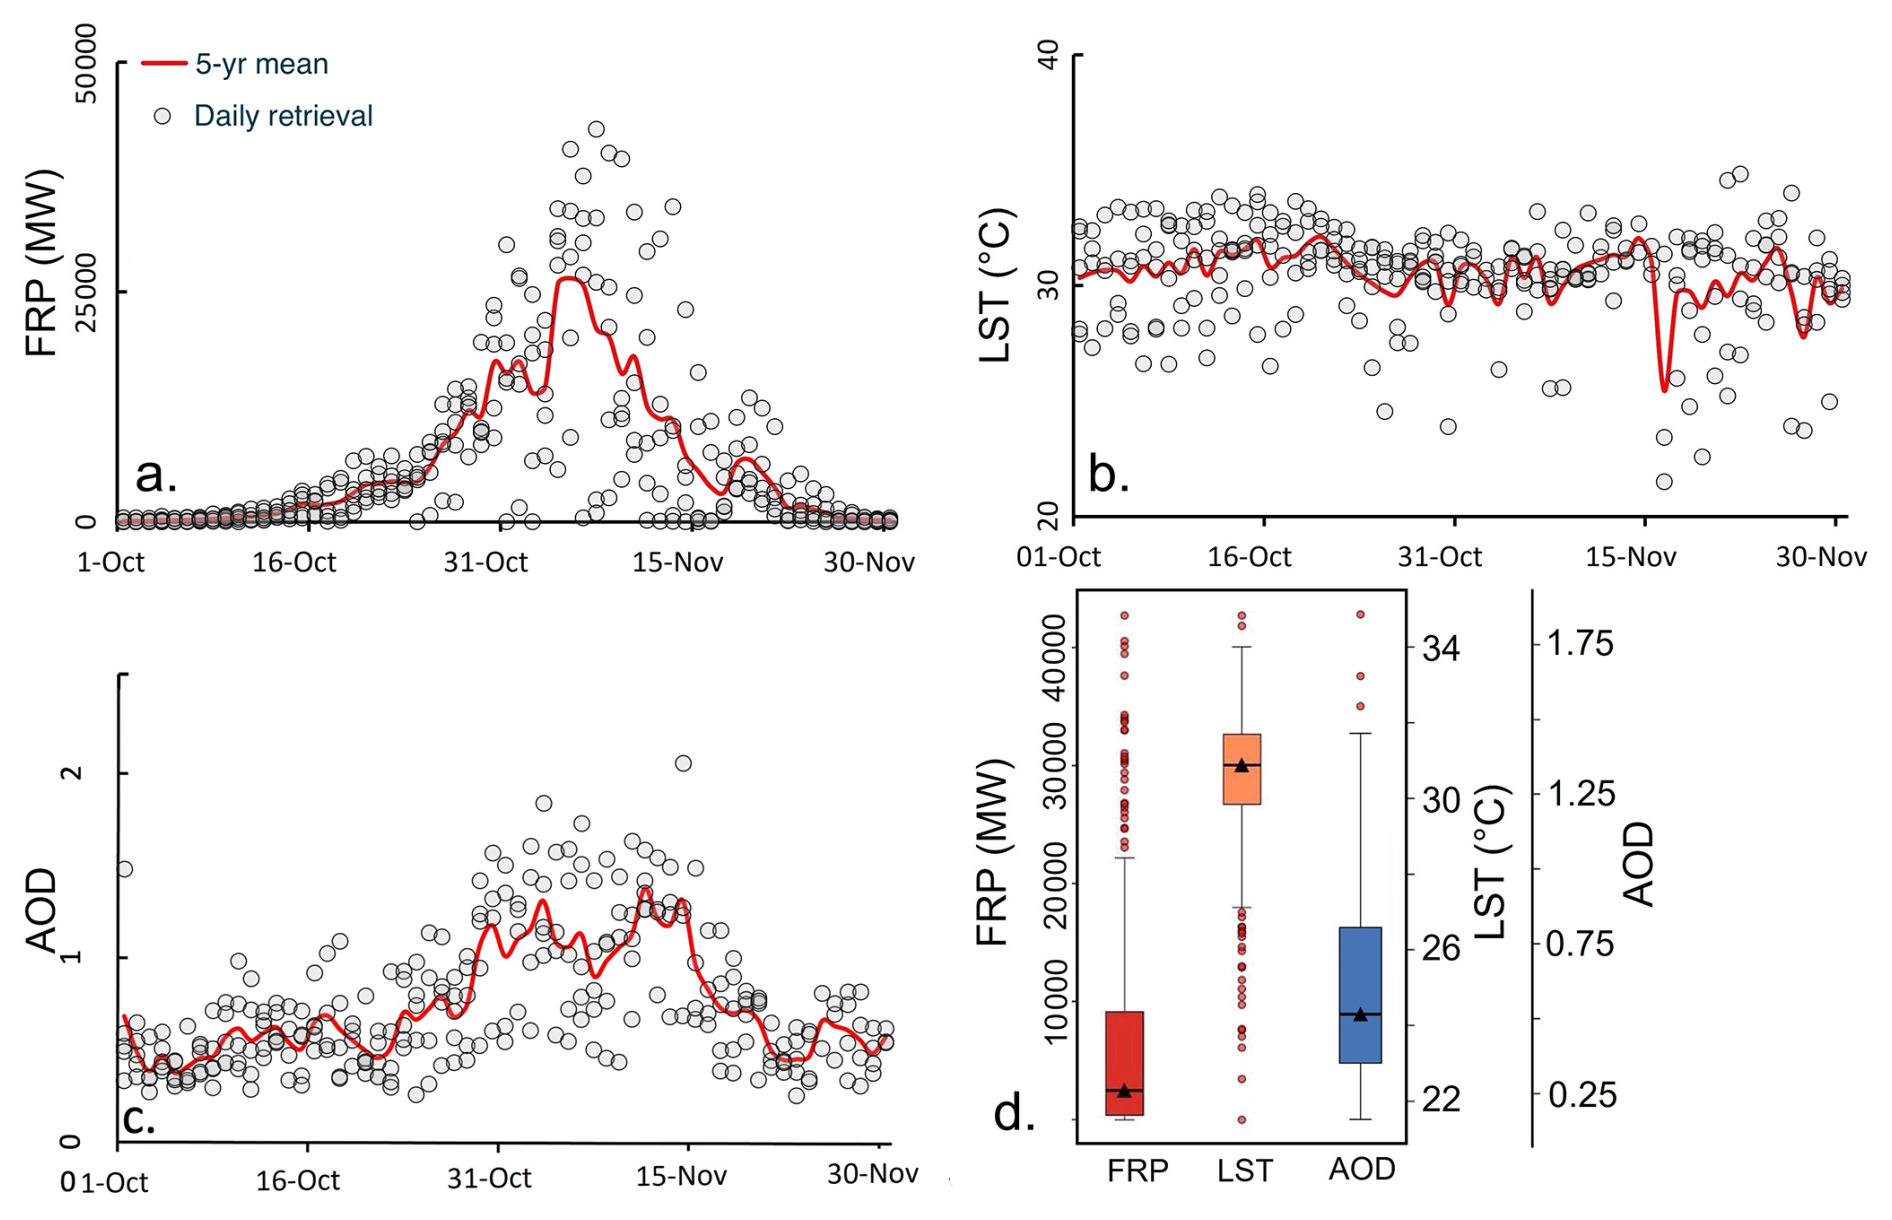
Figure 6Time series of five-year mean fire radiative power (FRP, a), land surface temperature (LST, b) and aerosol optical depth (AOD, c) against daily retrievals, (d) covariation of FRP, AOD and LST over intensive fire zone. Gray dots show daily retrievals from October to November (2017–2021), with the red line depicting the corresponding 5 year mean.
The temporal associations among FRP, AOD, and LST clearly demonstrate the immediate response of fire-induced variations in aerosol loading and surface temperature over northwestern India. Accordingly, in the subsequent section, these relationships were modelled using a geospatial tree-based regression framework that integrates concurrent temporal features (e.g., day-specific retrievals) and spatial predictors (e.g., regional meteorology, aerosol loading, and fire intensity) to quantify and characterize the FRP–AOD–LST nexus within the intensive fire zone.
3.4 Fire induced change in LST and AOD
The effect of crop residue burning on land surface temperature and aerosol loading was assessed using a space-for-time approach by overlaying grid-based VIIRS LST, FRP, and AOD datasets over the northwestern region experiencing recurrent fire. To remove potential confounding effect, fire and no-fire grids were retained for comparison only when they matched in terms of topography, meteorology, physical environment, vegetation and soil characteristics, climatological mean LST and AOD, and surface property. Comparisons were performed within defined strata containing grids with identical characteristics to ensure that the quantified changes in LST and AOD could be attributed solely to fire. A total of 7489 paired no-fire and fire grids were used between 2017 and 2021 to quantify the relative change in LST and AOD. It is noteworthy that all grids, whether exhibiting fire or not, were selected from within the extended geographical region to capture localized variations in temperature and aerosol loading.
As illustrated in Fig. 7, a consistent yet temporally dynamic increase in both LST and AOD was observed over regions affected by residue-based burning compared with no-fire zone. However, the magnitude of LST and AOD change across the fire zone was spatially heterogeneous. On average, residue-based burning induced an increase of 0.60 °C in LST during 2017–2021, with interannual variability ranging from 0.33–0.76 °C. This indicates that residue burning exerts a persistent warming influence on land surface temperature, likely driven by reduced evapotranspiration, enhanced shortwave absorption, increased sensible heat flux, and fire-induced changes in surface albedo. However, a strong spatial heterogeneity in LST and AOD modulation further indicates the potential influence of key confounding factors and intensity of fire in regulating the change. The results of this study align with Liu et al. (2019), who attributed a 0.15 °C rise in surface temperature over burned areas globally to satellite-observed forest fires, as well as Liu et al. (2018), who documented a net warming effect over the Siberian boreal forest. Additional evidence from Alkama and Cescatti (2016) and Zhao et al. (2024) also indicates a positive linkage between forest fire occurrence, fire intensity, and surface temperature. In contrast, the biophysical effects of agricultural residue burning on land surface temperature remain poorly constrained. Zhang et al. (2020) reported LST increases of 1–3 °C over three provinces in China associated with crop residue burning. However, the feedback effects of meteorological covariates and systematic land-cover differences on fire occurrence were not accounted for, leading to causal attribution of fire to LST remains tentative.
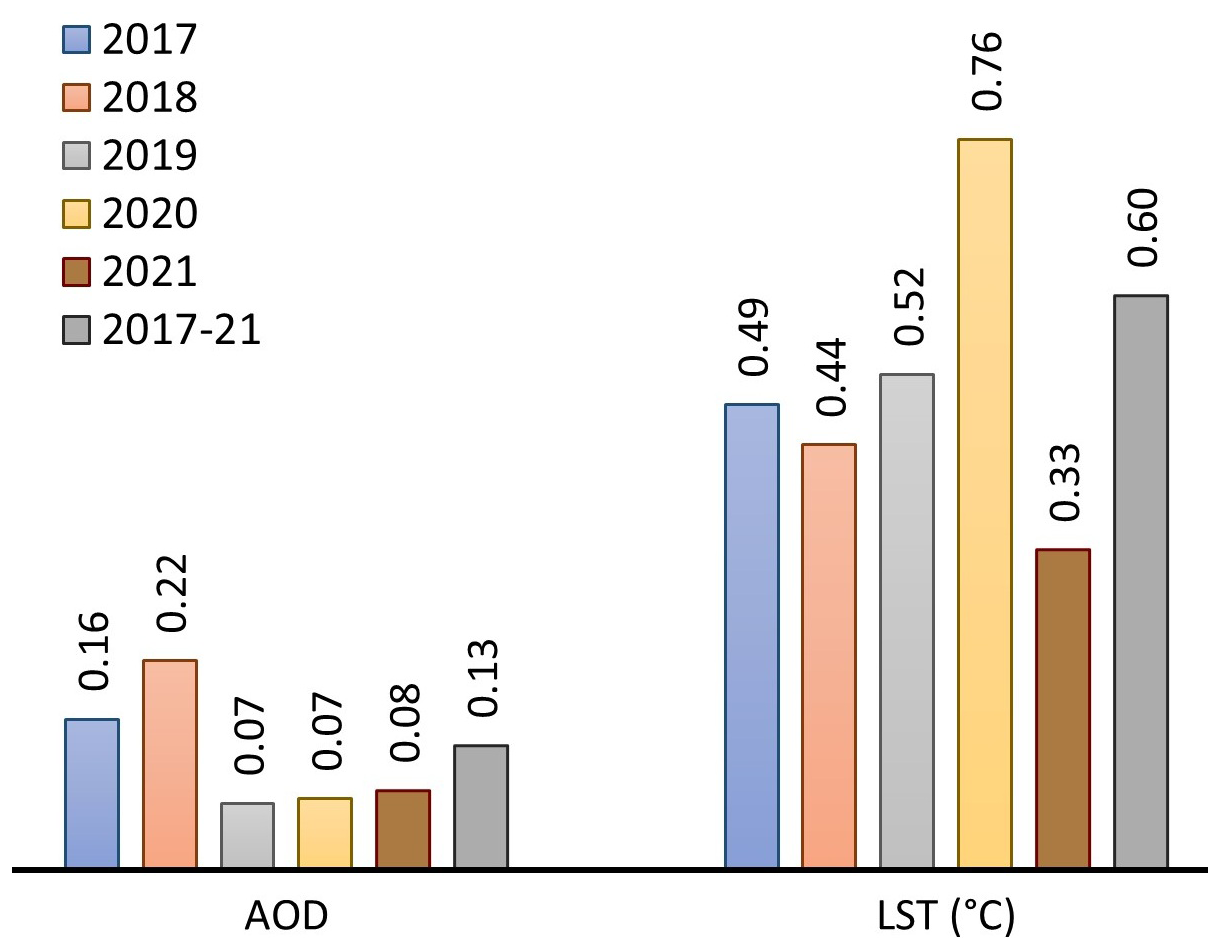
Figure 7Crop residue-based fire induced changes in land surface temperature and aerosol loading.
A consistent annual increase in aerosol loading was also observed over the fire-affected grids over northwestern India. A clear upward trend in AOD was noted across the fire zones, with a mean increase of 0.13 AOD yr−1 and a range of 0.07–0.22 AOD yr−1. The change in columnar aerosol loading, however, was spatially heterogeneous. Overall, the increase in AOD from fire-associated emissions of aerosols and their gaseous precursors reinforces the source-specific contribution of crop residue burning, a phenomenon well documented in previous studies (Vinjamuri et al., 2020; Mhawish et al., 2022).
To quantify uncertainty in the estimated differences between fire-affected and non-fire-affected grid cells, we further computed 95 % confidence intervals for ΔLST and ΔAOD using nonparametric bootstrapping. For each variable, 10 000 bootstrap samples were generated by resampling grid cells with replacement, and the mean difference was recalculated for each bootstrap replicate. The 2.5th and 97.5th percentiles of the resulting sampling distribution were taken as the bounds of the 95 % confidence interval (CI). Nonparametric bootstrapping results into significant increase in both ΔLST (0.57 °C; 95 % CI: 0.33–0.81 °C) and ΔAOD (0.13; 95 % CI: 0.08–0.17) in fire-affected regions. Because both CIs do not overlap zero, these differences are statistically robust and unlikely to be due to sampling variability.
3.5 Spatial regression of fire intensity and aerosols on LST
A machine learning algorithm was employed to establish the statistical association between the dependent variable LST and multiple predictors including fire radiative power, aerosol loading, regional meteorology (Fig. S6 in the Supplement), surface properties, and vegetation characteristics. All biophysical parameters, except SR and soil moisture, retrieved under two pre-defined scenarios, (one) days with moderate-to-high fire intensity and (two) days with sustained high fire intensity exhibiting a positive association with regional mean LST, were used to model the FRP–AOD–LST relation. Relative feature importance (RFI) of selected predictors was first evaluated for the fire season, and the marginal effects of FRP and aerosols on LST were subsequently quantified. Figure 8a presents the normalized RFI values for all predictors under both scenarios, and the Random Forest hyperparameter tuning procedure is summarized in Table S6 in the Supplement. RFI quantifies the sensitivity of regional LST to each predictor and reflects their partial contribution to surface temperature variability. Fire radiative power emerged as the dominant predictor under both scenarios, indicating the strong influence of fire-related energy release on regional radiative balance, likely through reduced evapotranspiration and fire-induced changes in surface albedo (Liu et al., 2018, 2019). Notably, the RFI was substantially higher during period of sustained high-intensity burning (Scenario 2; RFI =0.40) compared with days characterized by moderate-to-high fire activity (Scenario 1; RFI =0.22), highlighting the stronger thermal response associated with intensive burning condition.
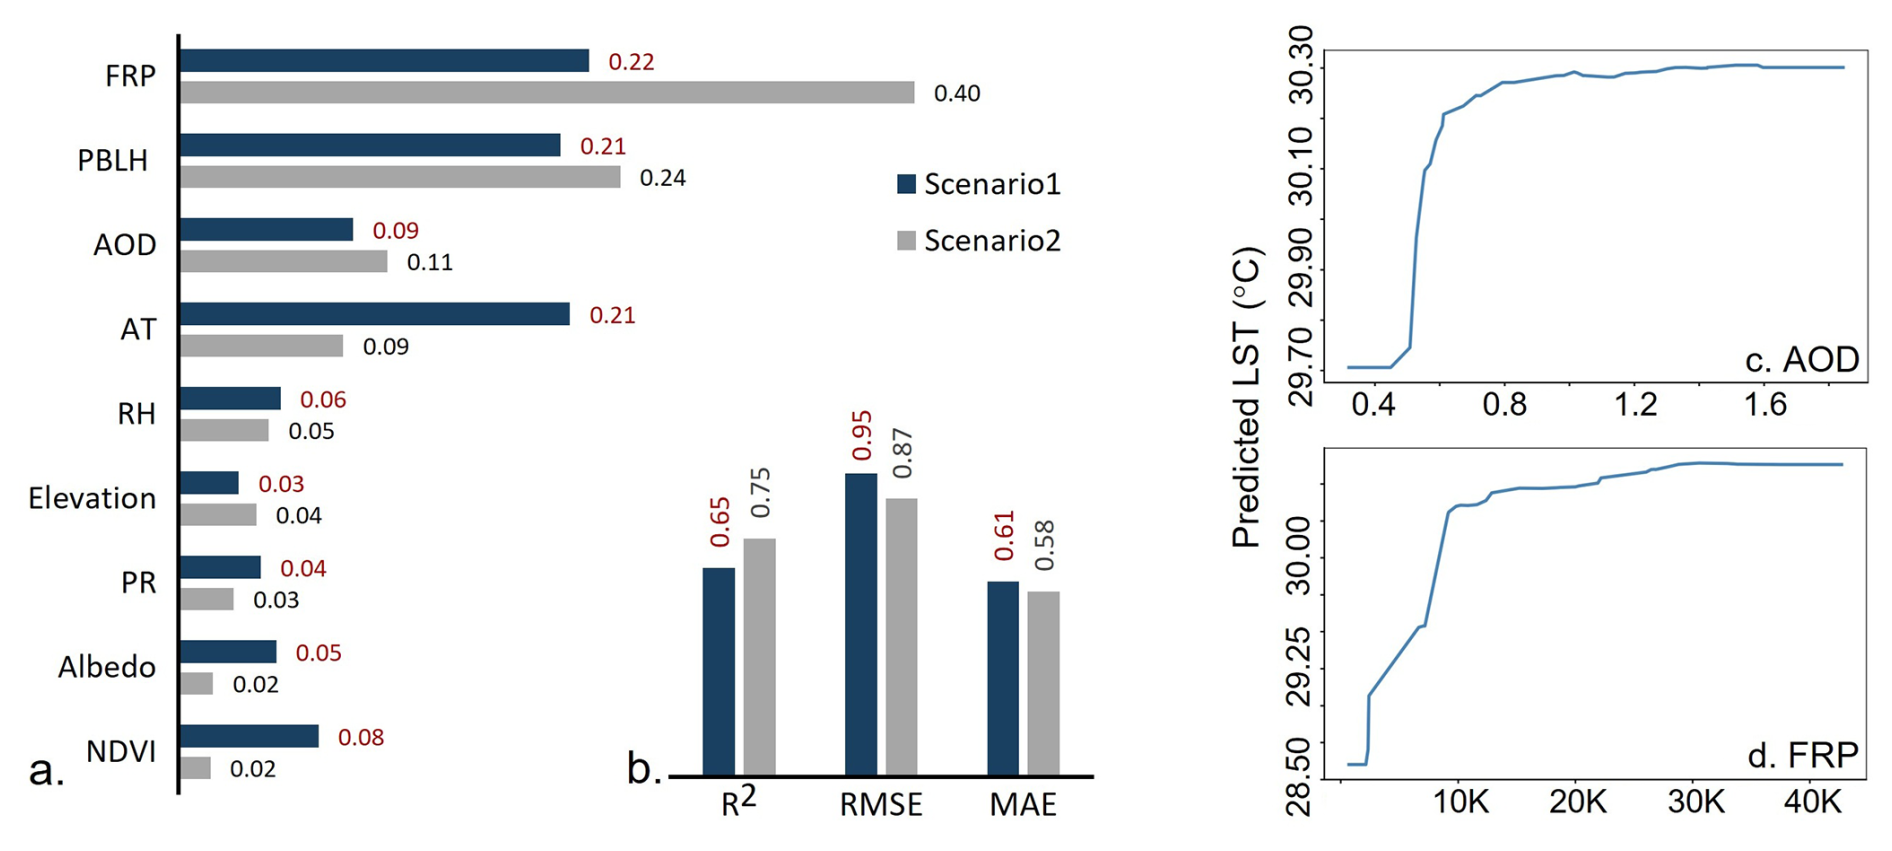
Figure 8Normalized relative feature importance of predictor variables on LST (a), cross-validated evaluation of random forest performance (b), and partial dependence plots of LST on AOD (c) and FRP (d). Here, K indicates ×1000. The PDP plots are based on scenario 2. Both RMSE and MAE have unit °C.
Next to FRP, PBLH exerted a significant influence on LST (RFI: 0.21–0.24), followed by atmospheric temperature (RFI: 0.09–0.21). The strong effect of PBLH on LST can be explained by restricted turbulent mixing during shallow boundary-layer conditions in post-monsoon season. A relatively low PBLH (mean ± SD: 71 ± 29 m) over northwestern India reduces vertical mixing and traps fire-induced heat and aerosols close to the surface (Vinjamuri et al., 2020). This enhances shortwave absorption, suppresses evaporative cooling, and limits turbulent heat dissipation, resulting in a stronger and more persistent increase in LST. Another notable finding was the modification of LST due to enhanced columnar aerosol loading during fire season. The RFI of AOD varies from 0.09–0.11, indicating its influence on regional radiative budget. Residue burning releases aerosols and their gaseous precursors, which can exert significant radiative impacts and drive rapid adjustments in both surface and atmospheric temperature (Freychet et al., 2019; Xu et al., 2021). Fire-generated aerosols influence the energy balance through scattering and absorption of radiation, alterations in cloud microphysics, and changes in surface albedo via deposition of carbonaceous particles. However, the magnitude and direction of these radiative effects remain uncertain at the global scale (Tian et al., 2022). The partial influence of all other parameters, including meteorological variables, land characteristics and elevation was less significant (RFI <0.30).
The predictive skill of the random forest model was assessed using temporal block cross-validation to minimize temporal autocorrelation and prevent data leakage. Under both scenarios model performance was found satisfactory with R2 varying from 0.65–0.75, marked with relatively low RMSE (0.87–0.95 °C) and MAE (0.58–0.61 °C). A satisfactory model performance also ensures that residue burning provide a clear LST response and the RF model was able to resolve non-linear land–atmosphere interactions, irrespective of the selected scenarios. Relatively better performance was however, achieved in scenario 2 during the fire days having better spatial association between FRP and LST. Collectively, this confirms that moderate-to-high intensity residue burning leaves a measurable and predictable thermal signature on the land surface over northwestern India.
The partial dependence plots (PDPs) in Fig. 8c and d illustrate the marginal effects of FRP and AOD on LST. These plots show the expected change in LST associated with variation in each predictor while holding all other predictors constant. The estimated effects of both FRP and AOD exhibit a non-linear, saturating response. LST increases sharply at low-to-moderate values of each predictor but the effect progressively weakens at higher magnitudes, approaching an asymptotic limit. This behaviour likely arises from the complex interplay of radiative and thermodynamic processes associated with biomass-burning emissions. Fire-originated aerosols exert both direct and indirect radiative effects whose magnitudes and signs vary with aerosol loading and composition (Freychet et al., 2019; Xu et al., 2021; Tian et al., 2022). At moderate aerosol loading, UV-absorbing black carbon aerosols may enhance atmospheric heating and can transiently increase near-surface temperature (Jacobson, 2001). Fire-induced convective plumes may initially enhance surface temperatures, whereas strong aerosol build-up can reduce solar transmittance to the ground. Aerosol–cloud interactions further contribute to non-linearity by modifying cloud microphysics, lifetime, and albedo, altering the regional radiative balance. Additionally, aerosol-driven changes in boundary-layer structure, evapotranspiration, and soil moisture introduce additional land–atmosphere feedbacks. Together, these interacting processes operate across multiple spatial and temporal scales and do not scale linearly with aerosol loading or fire intensity, producing the observed non-linear LST response. The RF model therefore provides strong evidence that both fire intensity and fire-derived aerosols exert measurable and non-linear effects on regional LST, with potentially important implications for the regional radiative budget.
3.6 Geographically weighted regression on LST
A Global Moran's I test was first applied to assess spatial autocorrelation in LST across the intensive fire zone for the cumulative five-year period. As shown in Table S6, Moran's I was 0.225, accompanied by a high positive Z-score and a statistically significant p-value (<0.001), indicating a clustered spatial pattern of LST that is highly unlikely (<1 %) to have arisen by random chance. Given this spatial dependence, GWR was employed to evaluate spatial heterogeneity in the relationships between LST, FRP, and other predictors. All variables used in the Random Forest model were incorporated into the GWR framework under both pre-defined scenarios. Model specifications and performance metrics including bandwidth and kernel details are mentioned in Table S8 in the Supplement.
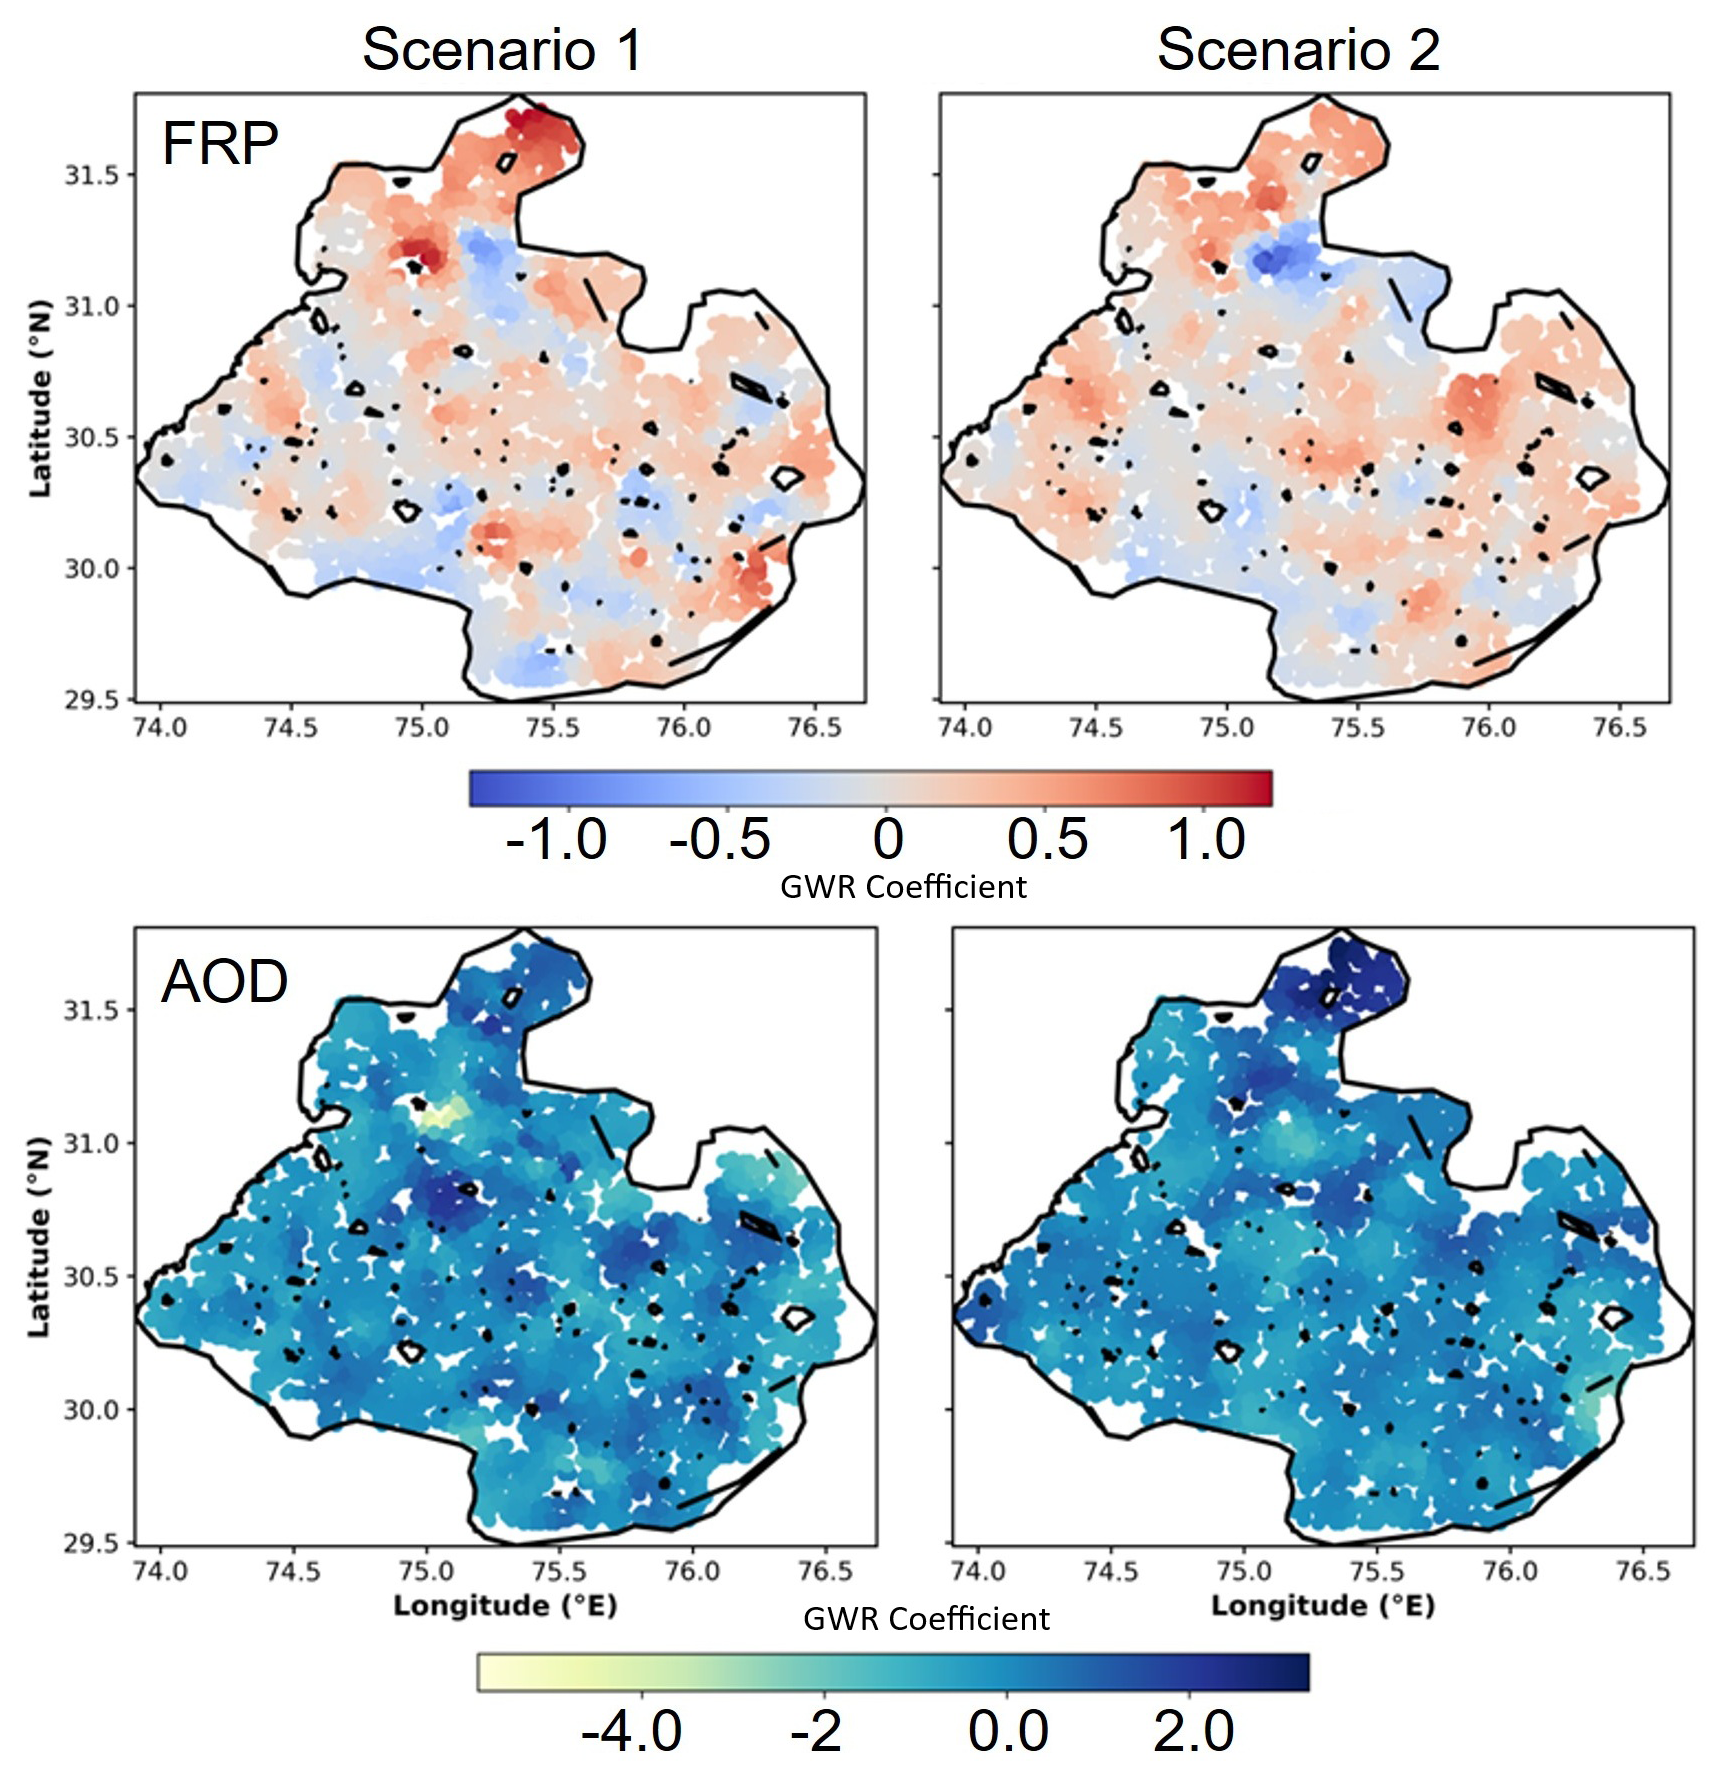
Figure 9Spatial distribution of FRP and AOD GWR coefficients across intensive fire zone.
GWR model demonstrated strong explanatory power, with global R2 values exceeding 0.74, confirming that the selected predictors effectively captured spatial variability in LST. FRP consistently showed a positive and spatially varying association with LST across both scenarios, underscoring its dominant influence in fire-affected regions. Aerosol loading demonstrated weak but spatially heterogeneous effects, reflecting localized differences in aerosol–temperature interactions. Other predictors, including NDVI, RH, AT, PBLH, elevation, and albedo (Fig. S7 in the Supplement), exhibited local coefficients ranging from −0.76 to +0.23, indicating spatial variability but comparatively weaker contributions to LST modulation across the study area.
The manuscript unfolds by identifying the geospatial variations in crop residue–based fires and their associated impacts on aerosol loading and land surface temperature across northwestern India. A brief methodology and key findings are summarized in Fig. S8 in the Supplement. Based on year-wise, pixel-level fire intensity, the geographical region with intensive fire activity was initially delineated, and all satellite-derived and reanalysis datasets were subsequently processed exclusively over the selected zone. A robust and consistent spatial correlation between FRP, AOD, and LST was observed across multiple years, indicating potential fire-induced perturbations in LST. The Hurst exponent analysis reaffirmed the long-term persistence of fire intensity, surface temperature, and aerosol loading time series. A grid-based analysis over the intensive fire zone revealed a significant increase in both LST and AOD during the peak fire season.
The article further employs the Random Forest model and Geographically weighted regression (GWR) to assess the potential influence of FRP and aerosol loading on LST, while accounting meteorological covariates, physical environment, vegetation characteristic and surface property as confounding factors within the selected zone. Two contrasting scenarios were hypothesized to examine the FRP–LST–AOD nexus. Scenario 1 considered spatially aggregated FRP from fire initiation to subsidence, whereas Scenario 2 focused on days characterized by high-intensity fires exhibiting a strong positive correlation between FRP and LST. In both the scenarios, the Random Forest regression successfully captured and mapped FRP-induced modulation of LST, though with varying magnitudes. A distinct increase in FRP-induced LST modulation was observed during high-intensity fire events. Both boundary layer height and columnar aerosol loading also contributed partially, with aerosols' influence on LST increasing during periods of intense release of fire energy. The Global Moran's I test indicated significant spatial clustering of LST while GWR results further confirmed FRP and AOD-modulated LST variations across northwestern India, highlighting strong spatial heterogeneity in FRP-AOD-LST nexus.
This analysis reveals that the biophysical effects of crop residue–based fires across northwestern India can substantially influence the regional radiative budget by altering LST. The magnitude of LST modulation, however, depends on fire intensity and feedbacks from regional meteorology. This study provides novel insights into residue-based fire induced surface temperature dynamics in a region where recurrent fires have been historically linked primarily with deteriorating air quality in Delhi and its surroundings. The observation-driven analysis offers a comprehensive understanding of LST responses to residue burning and helps reduce uncertainties in fire-induced modifications of the radiative budget. Nonetheless, uncertainties remain due to unaccounted agricultural feedbacks, limited temporal coverage, retrieval uncertainty in geospatial datasets, and the complexity in aerosol–meteorology interactions. The multifaced influence of fire aerosols and energy on regional climate through rapid atmospheric and land surface adjustments, remains complicated at the global level. Our findings underscore the need for Earth system model–based simulations to better quantify climate feedbacks from crop residue burning. Besides, assessing the underlying mechanisms of fire-energy-induced changes in evapotranspiration, the radiative effects of aerosols, fire–aerosol–meteorology feedbacks, and incorporating additional proxies could further reduce the uncertainty in estimating radiative impacts from residue burning.
All the data used in this analysis are available freely. VIIRS and MODIS data can be accessed via NASA Earthdata (https://earthdata.nasa.gov, last access: 13 November 2025), and ERA5 reanalysis data is available from ECMWF Copernicus (https://cds.climate.copernicus.eu/, last access: 13 November 2025). SMAP Soil moisture data is available at https://nsidc.org/data/spl1ctb_e (last access: 13 November 2025). Authors thank NASA for providing the MODIS, VIIRS and SMAP data, and the Copernicus Climate Change Service (C3S) for the ERA5 reanalysis data.
The supporting tables (8) and figures (8) are included in Supplement. The supplement related to this article is available online at https://doi.org/10.5194/acp-26-1647-2026-supplement.
AP: Data curation, formal analysis and interpretation; RS: Data curation, formal analysis; KA: Data curation, formal analysis; NC: Data curation, formal analysis; TB: conceptualization, methodology and interpretation, funding as well as writing and editing manuscript.
The contact author has declared that none of the authors has any competing interests.
Publisher's note: Copernicus Publications remains neutral with regard to jurisdictional claims made in the text, published maps, institutional affiliations, or any other geographical representation in this paper. The authors bear the ultimate responsibility for providing appropriate place names. Views expressed in the text are those of the authors and do not necessarily reflect the views of the publisher.
Authors acknowledge open-source software R (V4.4), Python (V3.7) and QGIS (V3.28) for extracting and plotting the data. Authors sincerely thank the editor, Jason Cohen, for his efficient handling of the manuscript and constructive suggestions.
Tirthankar Banerjee received funding from Banaras Hindu University under Institute of Eminence grant (grant no. 6031). Akanksha Pandey received funding from Department of Science and Technology under INSPIRE fellowship (grant no. IF220684).
This paper was edited by Jason Cohen and reviewed by Pravash Tiwari and two anonymous referees.
Aditi, K., Singh, A., and Banerjee, T.: Retrieval uncertainty and consistency of Suomi-NPP VIIRS Deep Blue and Dark Target aerosol products under diverse aerosol loading scenarios over South Asia, Environ. Pollut., 331, 121913, https://doi.org/10.1016/j.envpol.2023.121913, 2023.
Aditi, K., Pandey, A., and Banerjee, T.: Forest fire emission estimates over South Asia using Suomi-NPP VIIRS-based thermal anomalies and emission inventory, Environ. Pollut., 366, 125441, https://doi.org/10.1016/j.envpol.2024.125441, 2025.
Alkama, R. and Cescatti, A.: Biophysical climate impacts of recent changes in global forest cover, Science, 351, 600–604, https://doi.org/10.1126/science.aac8083, 2016.
Andela, N., Morton, D. C., Giglio, L., Chen, Y., van der Werf, G. R., Kasibhatla, P. S., DeFries, R. S., Collatz, G. J., Hantson, S., Kloster, S., Bachelet, D., Forrest, M., Lasslop, G., Li, F., Mangeon, S., Melton, J. R., Yue, C., and Randerson, J. T.: A human-driven decline in global burned area, Science, 356, 1356–1362, https://doi.org/10.1126/science.aal4108, 2017.
Balwinder-Singh, McDonald, A. J., Srivastava, A. K., Jain, M., and Lobell, D. B.: Trade-offs between groundwater conservation and air pollution from agricultural fires in northwest India, Nat. Sustain., 2, 580–583, https://doi.org/10.1038/s41893-019-0304-4, 2019.
Banerjee, T., Shitole, A. S., Mhawish, A., Anand, A., Ranjan, R., Khan, M. F., Srithawirat, T., Latif, M. T., and Mall, R. K.: Aerosol climatology over South and Southeast Asia: Aerosol types, vertical profile, and source fields, J. Geophys. Res.-Atmos., 126, e2020JD033554, https://doi.org/10.1029/2020JD033554, 2021.
Banerjee, T., Anchule, A., Sorek-Hamer, M., and Latif, M. T.: Vertical stratification of aerosols over South Asian cities, Environ. Pollut., 309, 119776, https://doi.org/10.1016/j.envpol.2022.119776, 2022.
Bowman, D. M. J. S., Balch, J. K., Artaxo, P., Bond, W. J., Carlson, J. M., Cochrane, M. A., d'Antonio, C. M., DeFries, R. S., Doyle, J. C., Harrison, S. P., Johnston, F. H., Keeley, J. E., Krawchuk, M. A., Kull, C. A., Marston, J. B., Moritz, M. A., Prentice, I. C., Roos, C. I., Scott, A. C., Swetnam, T. W., van der Werf, G. R., and Pyne, S. J.: Fire in the Earth system, Science, 324, 481–484, https://doi.org/10.1126/science.1163886, 2009.
Breiman, L.: Random forests, Mach. Learn., 45, 5–32, https://doi.org/10.1023/A:1010933404324, 2001.
Brunsdon, C., Fotheringham, A. S., and Charlton, M. E.: Geographically weighted regression: A method for exploring spatial nonstationarity, Geogr. Anal., 28, 281–298, https://doi.org/10.1111/j.1538-4632.1996.tb00936.x, 1996.
Chen, J., Shao, Z., Huang, X., Zhuang, Q., Dang, C., Cai, B., Zheng, X., and Ding, Q.: Assessing the impact of drought–land cover change on global vegetation greenness and productivity, Sci. Total Environ., 852, 158499, https://doi.org/10.1016/j.scitotenv.2022.158499, 2022.
Chuvieco, E., Pettinari, M. L., Koutsias, N., Forkel, M., Hantson, S., and Turco, M.: Human and climate drivers of global biomass burning variability, Sci. Total Environ., 779, 146361, https://doi.org/10.1016/j.scitotenv.2021.146361, 2021.
Copernicus Climate Change Service: Agrometeorological indicators from 1979 to present derived from reanalysis, Copernicus Climate Change Service (C3S) Climate Data Store (CDS), https://doi.org/10.24381/cds.6c68c9bb (last access: 25 February 2025), 2020.
Daoud, J. I.: Multicollinearity and regression analysis, J. Phys. Conf. Ser., 949, 012009, https://doi.org/10.1088/1742-6596/949/1/012009, 2017.
Fotheringham, A. S., Brunsdon, C., and Charlton, M.: Geographically weighted regression, in: The SAGE Handbook of Spatial Analysis, SAGE Publications, London, 243–254, https://doi.org/10.4135/9780857020130.n13, 2009.
Frazier, P. I.: A tutorial on Bayesian optimization, arXiv [preprint], https://doi.org/10.48550/arXiv.1807.02811, 2018.
Freychet, N., Tett, S. F. B., Bollasina, M., Wang, K. C., and Hegerl, G.: The local aerosol emission effect on surface shortwave radiation and temperatures, Journal of Advances in Modeling Earth Systems, 11, 806–817, https://doi.org/10.1029/2018MS001530, 2019.
Giglio, L., Descloitres, J., Justice, C. O., and Kaufman, Y. J.: An enhanced contextual fire detection algorithm for MODIS, Remote Sens. Environ., 87, 273–282, https://doi.org/10.1016/S0034-4257(03)00184-6, 2003.
Gomez, J. L., Allen, R. J., and Li, K.-F.: California wildfire smoke contributes to a positive atmospheric temperature anomaly over the western United States, Atmos. Chem. Phys., 24, 6937–6963, https://doi.org/10.5194/acp-24-6937-2024, 2024.
Graham, M. H.: Confronting multicollinearity in ecological multiple regression, Ecology, 84, 2809–2815, https://doi.org/10.1890/02-3114, 2003.
Graham, M. H., Haynes, R. J., and Meyer, J. H.: Soil organic matter content and quality: Effects of fertilizer applications, burning, and trash retention on a long-term sugarcane experiment in South Africa, Soil Biol. Biochem., 34, 93–102, https://doi.org/10.1016/S0038-0717(01)00160-2, 2002.
Granero, M. S., Segovia, J. T., and Pérez, J. G.: Some comments on Hurst exponent and the long memory processes on capital markets, Physica A, 387, 5543–5551, https://doi.org/10.1016/j.physa.2008.05.053, 2008.
Hsu, N. C., Herman, J. R., and Tsay, S. C.: Radiative impacts from biomass burning in the presence of clouds during boreal spring in Southeast Asia, Geophys. Res. Lett., 30, 1234, https://doi.org/10.1029/2002GL016485, 2003.
Hurst, H. E.: Long term storage capacity of reservoirs, Trans. Am. Soc. Civ. Eng., 6, 770–799, 1951.
Ichoku, C., Giglio, L., Wooster, M. J., and Remer, L. A.: Global characterization of biomass-burning patterns using satellite measurements of fire radiative energy, Remote Sens. Environ., 112, 2950–2962, https://doi.org/10.1016/j.rse.2008.02.009, 2008.
Jacobson, M. Z.: Strong radiative heating due to the mixing state of black carbon in atmospheric aerosols, Nature, 409, 695–697, https://doi.org/10.1038/35055518, 2001.
Jethva, H., Torres, O., Field, R. D., Lyapustin, A., Gautam, R., and Kayetha, V.: Connecting crop productivity, residue fires, and air quality over northern India, Sci. Rep., 9, 16594, https://doi.org/10.1038/s41598-019-52799-x, 2019.
Kant, S., Sarangi, C., and Wilcox, E. M.: Aerosol processes perturb cloud trends over Bay of Bengal: Observational evidence, NPJ Clim. Atmos. Sci., 6, 132, https://doi.org/10.1038/s41612-023-00443-x, 2023.
Korontzi, S., McCarty, J., Loboda, T., Kumar, S., and Justice, C. O.: Global distribution of agricultural fires in croplands from 3 years of Moderate Resolution Imaging Spectroradiometer (MODIS) data, Glob. Biogeochem. Cycles, 20, GB2021, https://doi.org/10.1029/2005GB002529, 2006.
Lan, R., Eastham, S. D., Liu, T., Norford, L. K., and Barrett, S. R. H.: Air quality impacts of crop residue burning in India and mitigation alternatives, Nat. Commun., 13, 6537, https://doi.org/10.1038/s41467-022-34093-z, 2022.
Lasko, K. and Vadrevu, K.: Improved rice residue burning emissions estimates: Accounting for practice-specific emission factors in air pollution assessments of Vietnam, Environ. Pollut., 236, 795–806, https://doi.org/10.1016/j.envpol.2018.01.114, 2018.
Li, F., Zhang, X., Kondragunta, S., and Csiszar, I.: Comparison of fire radiative power estimates from VIIRS and MODIS observations, J. Geophys. Res.-Atmos., 123, 4545–4563, https://doi.org/10.1029/2017JD027823, 2018.
Li, Z. L., Wu, H., Duan, S. B., Zhao, W., Ren, H., Liu, X., Leng, P., Tang, R., Ye, X., Zhu, J., and Sun, Y.: Satellite remote sensing of global land surface temperature: Definition, methods, products, and applications, Rev. Geophys., 61, e2022RG000780, https://doi.org/10.1029/2022RG000780, 2023.
Liu, Z., Ballantyne, A. P., and Cooper, L. A.: Increases in land surface temperature in response to fire in Siberian boreal forests and their attribution to biophysical processes, Geophys. Res. Lett., 45, 6485–6494, https://doi.org/10.1029/2018GL078283, 2018.
Liu, Z., Ballantyne, A. P., and Cooper, L. A.: Biophysical feedback of global forest fires on surface temperature, Nat. Commun., 10, 214, https://doi.org/10.1038/s41467-018-08237-z, 2019.
Logan, T. M., Zaitchik, B., Guikema, S., and Nisbet, A.: Night and day: The influence and relative importance of urban characteristics on remotely sensed land surface temperature, Remote Sens. Environ., 247, 111861, https://doi.org/10.1016/j.rse.2020.111861, 2020.
Markonis, Y. and Koutsoyiannis, D.: Scale-dependence of persistence in precipitation records, Nat. Clim. Change, 6, 399–401, https://doi.org/10.1038/nclimate2894, 2016.
Mhawish, A., Sarangi, C., Babu, P., Kumar, M., Bilal, M., and Qiu, Z.: Observational evidence of elevated smoke layers during crop residue burning season over Delhi: Potential implications on associated heterogeneous PM2.5 enhancements, Remote Sens. Environ., 280, 113167, https://doi.org/10.1016/j.rse.2022.113167, 2022.
NAAS (National Academy of Agricultural Sciences): Innovative viable solution to rice residue burning in rice–wheat cropping system through concurrent use of Super Straw Management System-fitted combines and Turbo Happy Seeder, National Academy of Agricultural Sciences, New Delhi, India, https://naas.org.in/Policy Briefs/Policy Brief 2 - Crop Burning.pdf (last access: 2 June 2025), 2017.
Nguyen, H. M. and Wooster, M. J.: Advances in the estimation of high spatio-temporal resolution pan-African top-down biomass burning emissions made using geostationary fire radiative power (FRP) and MAIAC aerosol optical depth (AOD) data, Remote Sens. Environ., 248, 111971, https://doi.org/10.1016/j.rse.2020.111971, 2020.
Peng, J., Liu, Z., Liu, Y., Wu, J., and Han, Y.: Trend analysis of vegetation dynamics in Qinghai–Tibet Plateau using Hurst exponent, Ecol. Indic., 14, 28–39, https://doi.org/10.1016/j.ecolind.2011.08.011, 2012.
Prasad, A. K., Singh, R. P., and Kafatos, M.: Influence of coal-based thermal power plants on aerosol optical properties in the Indo-Gangetic Basin, Geophys. Res. Lett., 33, L05805, https://doi.org/10.1029/2005GL023801, 2006.
Puissant, A., Rougier, S., and Stumpf, A.: Object-oriented mapping of urban trees using Random Forest classifiers, Int. J. Appl. Earth Obs. Geoinf., 26, 235–245, https://doi.org/10.1016/j.jag.2013.07.002, 2014.
Sarkar, S., Singh, R. P., and Chauhan, A.: Crop residue burning in northern India: Increasing threat to Greater India, J. Geophys. Res.-Atmos., 123, 6920–6934, https://doi.org/10.1029/2018JD028428, 2018.
Sayer, A. M., Hsu, N. C., Lee, J., Kim, W. V., and Dutcher, S. T.: Validation, stability, and consistency of MODIS Collection 6.1 and VIIRS Version 1 Deep Blue aerosol data over land, J. Geophys. Res. Atmos., 124, 4658–4688, https://doi.org/10.1029/2018JD029598, 2019.
Schroeder, W., Oliva, P., Giglio, L., and Csiszar, I. A.: The new VIIRS 375 m active fire detection data product: Algorithm description and initial assessment, Remote Sens. Environ., 143, 85–96, https://doi.org/10.1016/j.rse.2013.12.008, 2014.
Shahriari, B., Swersky, K., Wang, Z., Adams, R. P., and De Freitas, N.: Taking the human out of the loop: A review of Bayesian optimization, Proceedings of the IEEE, 104, 148–175, 2015.
Shyamsundar, P., Springer, N. P., Tallis, H., Polasky, S., Jat, M. L., Sidhu, H. S., Krishnapriya, P. P., Skiba, N., Ginn, W., Ahuja, V., and Cummins, J.: Fields on fire: Alternatives to crop residue burning in India, Science, 365, 536–538, https://doi.org/10.1126/science.aaw4085, 2019.
Singh, N., Banerjee, T., Raju, M. P., Deboudt, K., Sorek-Hamer, M., Singh, R. S., and Mall, R. K.: Aerosol chemistry, transport, and climatic implications during extreme biomass burning emissions over the Indo-Gangetic Plain, Atmos. Chem. Phys., 18, 14197–14215, https://doi.org/10.5194/acp-18-14197-2018, 2018.
Singh, T., Biswal, A., Mor, S., Ravindra, K., Singh, V., and Mor, S.: A high-resolution emission inventory of air pollutants from primary crop residue burning over Northern India based on VIIRS thermal anomalies, Environ. Pollut., 266, 115132, https://doi.org/10.1016/j.envpol.2020.115132, 2020.
Singh, N., Mhawish, A., Banerjee, T., Ghosh, S., Singh, R. S., and Mall, R. K.: Association of aerosols, trace gases and black carbon with mortality in an urban pollution hotspot over central Indo-Gangetic Plain, Atmos. Environ., 246, 118088, https://doi.org/10.1016/j.atmosenv.2020.118088, 2021.
Snoek, J., Larochelle, H., and Adams, R. P.: Practical bayesian optimization of machine learning algorithms. Advances in neural information processing systems, 25, 2012, https://proceedings.neurips.cc/paper/2012/file/05311655a15b75fab86956663e1819cd-Paper.pdf, last access: 2 June 2025.
Streets, D. G., Yarber, K. F., Woo, J. H., and Carmichael, G. R.: Biomass burning in Asia: annual and seasonal estimates and atmospheric emissions, Global Biogeochem. Cycles., 17, https://doi.org/10.1029/2003GB002040, 2003.
Tian, C., Yue, X., Zhu, J., Liao, H., Yang, Y., Lei, Y., Zhou, X., Zhou, H., Ma, Y., and Cao, Y.: Fire–climate interactions through the aerosol radiative effect in a global chemistry–climate–vegetation model, Atmos. Chem. Phys., 22, 12353–12366, https://doi.org/10.5194/acp-22-12353-2022, 2022.
Vadrevu, K. and Lasko, K.: Intercomparison of MODIS AQUA and VIIRS I-Band fires and emissions in an agricultural landscape – Implications for air pollution research, Remote Sens., 10, 978, https://doi.org/10.3390/rs10070978, 2018.
van der Werf, G. R., Randerson, J. T., Giglio, L., van Leeuwen, T. T., Chen, Y., Rogers, B. M., Mu, M., van Marle, M. J. E., Morton, D. C., Collatz, G. J., Yokelson, R. J., and Kasibhatla, P. S.: Global fire emissions estimates during 1997–2016, Earth Syst. Sci. Data, 9, 697–720, https://doi.org/10.5194/essd-9-697-2017, 2017.
Vinjamuri, K. S., Mhawish, A., Banerjee, T., Sorek-Hamer, M., Broday, D. M., Mall, R. K., and Latif, M. T.: Vertical distribution of smoke aerosols over upper Indo-Gangetic Plain, Environmental Pollution, 257, 113377, https://doi.org/10.1016/j.envpol.2019.113377, 2020.
Wan, Z.: New refinements and validation of the collection-6 MODIS land-surface temperature/emissivity product, Remote Sens. Environ., 140, 36–45, https://doi.org/10.1016/j.rse.2013.08.027, 2014.
Wang, Q., Wang, X., Zhou, Y., Liu, D., and Wang, H.: The dominant factors and influence of urban characteristics on land surface temperature using random forest algorithm, Sustain. Cities Soc., 79, 103722, https://doi.org/10.1016/j.scs.2022.103722, 2022.
Ward, D. S., Kloster, S., Mahowald, N. M., Rogers, B. M., Randerson, J. T., and Hess, P. G.: The changing radiative forcing of fires: global model estimates for past, present and future, Atmos. Chem. Phys., 12, 10857–10886, https://doi.org/10.5194/acp-12-10857-2012, 2012.
Wooster, M. J., Zhukov, B., and Oertel, D.: Fire radiative energy for quantitative study of biomass burning: Derivation from the BIRD experimental satellite and comparison to MODIS fire products, Remote Sens. Environ., 86, 83–107, https://doi.org/10.1016/S0034-4257(03)00070-1, 2003.
Wooster, M. J., Roberts, G., Perry, G. L. W., and Kaufman, Y. J.: Retrieval of biomass combustion rates and totals from fire radiative power observations: FRP derivation and calibration relationships between biomass consumption and fire radiative energy release, J. Geophys. Res.-Atmos., 110, D24311, https://doi.org/10.1029/2005JD006318, 2005.
Xu, L., Zhu, Q., Riley, W. J., Chen, Y., Wang, H., Ma, P.-L., and Randerson, J. T.: The Influence of Fire Aerosols on Surface Climate and Gross Primary Production in the Energy Exascale Earth System Model (E3SM), J. Climate, 34, 7219–7238, https://doi.org/10.1175/JCLI-D-21-0193.1, 2021.
Yang, Q., Yuan, Q., Yue, L., and Li, T.: Investigation of the spatially varying relationships of PM2.5 with meteorology, topography, and emissions over China in 2015 by using modified geographically weighted regression, Environ. Pollut., 262, 114257, https://doi.org/10.1016/j.envpol.2020.114257, 2020.
Zhang, W., Yu, M., He, Q., Wang, T., Lin, L., Cao, K., Huang, W., Fu, P., and Chen, J.: The spatial and temporal impact of agricultural crop residual burning on local land surface temperature in three provinces across China from 2015 to 2017, J. Clean. Prod., 275, 124057, https://doi.org/10.1016/j.jclepro.2020.124057, 2020.
Zhang, Y., Ge, J., Bai, X., and Wang, S.: Blue–green space seasonal influence on land surface temperatures across different urban functional zones: Integrating random forest and geographically weighted regression, J. Environ. Manage., 374, 123975, https://doi.org/10.1016/j.jenvman.2024.123975, 2025.
Zhao, J., Yue, C., Wang, J., Hantson, S., Wang, X., He, B., Li, G., Wang, L., Zhao, H., and Luyssaert, S.: Forest fire size amplifies postfire land surface warming, Nature, 633, 828–834, https://doi.org/10.1038/s41586-024-07918-8, 2024.