
the Creative Commons Attribution 4.0 License.
the Creative Commons Attribution 4.0 License.
 | 18 Nov 2026
Measurement report: Differences in cloud optical and microphysical properties in the Arctic and Antarctic derived using thermal infrared spectroscopy

Penny M. Rowe
Christopher J. Cox
Emily M. McCullough
Liam Kroll
Raia Ottenheimer
Matthew D. Shupe
Von P. Walden
Kimberly Strong
Climate models struggle to accurately represent polar regions, largely due to the difficulty in modeling clouds. The uncertainty budget of polar radiation is dominated by cloud and cloud-aerosol interactions, but challenges in maintaining robust field observations mean that even basic knowledge such as cloud occurrence is not well known. Measurements of the thermal emission of Earth's atmosphere can help close this knowledge gap due to the sensitivity of this spectral region to radiative properties of clouds. Measurements of the downwelling atmospheric emission (400 to 3000 cm−1) have been collected at two polar field sites using Atmospheric Emitted Radiance Interferometer (AERI) instruments, two at the Polar Environment Atmospheric Research Laboratory (PEARL) in Eureka, Canada (80° N), for which we use data from 2006 to 2022, and another at McMurdo Station (77° S) in Antarctica as part of the Atmospheric Radiation Measurement (ARM) West Antarctica Radiation Experiment (AWARE) project in 2016. We analyze these spectra, with supplementary data from other instruments and models, to compare optical and microphysical properties of moderately thick clouds at Eureka and McMurdo Station, including optical depth, thermodynamic phase, liquid droplet and ice crystal effective scattering radii, and cloud boundaries. We find that the clouds sampled at McMurdo generally feature lower temperatures, smaller liquid droplets, a more concentrated distribution of ice effective radii, less seasonal variability in optical depth, and lower optical thickness because they consist of a higher proportion of ice than those at Eureka. Additionally, both locations have high occurrence rates of supercooled liquid and mixed-phase clouds and exhibit differences between single-phase and mixed-phase microphysical properties.
- Article
(4739 KB) - Full-text XML
- BibTeX
- EndNote


Historically, some of the largest deviations between climate modeling and observations have occurred about the poles (e.g., Karlsson and Svensson, 2013; Liu et al., 2013; Bromwich et al., 2013; Wesslén et al., 2014; Rowe et al., 2025a). These regions have an outsized contribution to Earth's outgoing energy budget (Harries et al., 2008; Prince and L'Ecuyer, 2024) and are experiencing enhanced warming compared to the global mean (IPCC, 2021; Rantanen et al., 2022). The polar regions exhibit features that are challenging for models to accurately capture, resulting from significant variation in solar radiation, seasonal aerosol changes, high albedo snow/ice surfaces, and a stable boundary layer, especially during polar night. Although significant improvements have been made during the past decade on quantifying the polar energy budget, clouds and cloud-aerosol interactions still provide a large source of uncertainty in our understanding of the climate (e.g., IPCC, 2021), and basic quantities such as cloud type and fraction are continually changing (Eastman and Warren, 2010). It is well known that clouds play a large role in Arctic amplification, especially in regards to their feedback effect (e.g., Pithan and Mauritsen, 2014; Nakanishi and Michibata, 2025) and the surface energy balance (e.g., van den Broeke et al., 2017). The radiative effect of clouds is strongly dependent on their microphysical properties (i.e., radiatively significant properties such as the size, shape, and phase of cloud hydrometeors; Baker, 1997; Shupe, 2011; Vavrus, 2004; Bodas-Salcedo et al., 2016; Wall et al., 2025). However, large challenges in modeling cloud microphysical processes exist. These model uncertainties lead to large variability within even the current state-of-the-art models (Seneviratne and Hauser, 2020; Schuddeboom and McDonald, 2021) and Equilibrum Climate Sensitivty (ECS) differences between Coupled Model Intercomparison Project version 6 (CMIP6) models can largely be attributed to differences in cloud feedback strength (Bock and Lauer, 2024). Improving how these processes are represented through observational constraints is thus important for reducing error.
Cloud microphysics is influenced by numerous factors related to the total available water and aerosol load, local dynamics, and the temperature profile. Aerosols contribute a seasonally varying source of cloud condensation nuclei (CCN) and ice nucleating particles (INP), which affect cloud formation and ice content – thermodynamic phase partitioning is especially significant because radiation tends to interact more strongly with populations of cloud liquid droplets than ice crystals due to the generally smaller sizes of water droplets (e.g., Sun and Shine, 1994). In addition, differences in the type and concentrations of INP between the Arctic and Southern Ocean (e.g., Tan et al., 2014; Wilson et al., 2015; Vergara-Temprado et al., 2018; McCluskey et al., 2018; Wex et al., 2019; Filonchyk et al., 2025) mean that initial ice formation will differ between the two regions. Mixed-phase clouds (i.e., containing both supercooled liquid and ice) introduce complex additional microphysical interactions that remain poorly understood (Verlinde et al., 2007; Korolev et al., 2017). These clouds are prevalent in polar regions (e.g., Morrison et al., 2012) and have significant radiative consequences (Zhao et al., 2024), underscoring the importance of measuring and modeling mixed-phase cloud formation and persistence. Secondary ice production (SIP), referring to ice production resulting from interactions among existing ice crystals, is also prevalent and distinct in the polar regions (e.g., Zhao and Liu, 2021). SIP contributes to the observed ice number concentration, which is often much larger than expected from primary ice nucleation alone (e.g., Rangno and Hobbs, 2001), and notably affects precipitation (and by extension, cloud lifetime and extent; for example Jimenez et al., 2025). SIP processes, such as Hallet-Mossop rime splintering (Mossop and Hallett, 1974), ice-ice collision, and droplet shattering, are highly variable, and depend on the temperature, convection, and ice number density (e.g., Field et al., 2017; Pasquier et al., 2022; Waman et al., 2022; Schäfer et al., 2024), but current models do not robustly capture these processes (e.g., Zhao et al., 2023). Thus, observations are required for validating and improving model cloud representation, as well as supporting case studies and detection of trends in Arctic cloud properties with climate change.
In the Arctic, one station providing long-term measurements of the atmosphere is the Polar Environment Atmospheric Research Laboratory (PEARL; Fogal et al., 2013), which was established by the Canadian Network for the Detection of Atmospheric Change (CANDAC) at Eureka, Nunavut (80° N, 86° W) on Ellesmere Island to provide long-term observations of the atmosphere at one of the northernmost research sites in the world (Fig. 1a and b) with a large collection of ground-based atmosphere-probing instruments. This study focuses on measurements made at the Zero-Altitude PEARL Auxiliary Laboratory (0PAL) at 10 masl. Because there is significant variation within the Arctic due to varying topography, Eureka is distinct from other High Arctic sites (e.g., Shupe et al., 2011; Cox et al., 2012; Uttal et al., 2016). For example, Eureka is generally drier, and the cloud conditions are more optically thin than at other locations in the Arctic and follow a different seasonal cycle (e.g., deBoer et al., 2009; Shupe et al., 2011; Cox et al., 2012). In the Antarctic, the Atmospheric Radiation Measurement (ARM) West Antarctic Radiation Experiment (AWARE) program (Lubin et al., 2020) provided a comprehensive suite of measurements of atmospheric radiation and meteorological processes at McMurdo Station on Ross Island (77° S 166° E) in 2016 (Fig. 1c and 1d). Previous work has suggested that there are important differences between Arctic and Antarctic cloud properties, with Lubin et al. (2020) finding that clouds at McMurdo were higher, optically thinner, and typically had smaller effective radii than at some Arctic sites such as the ARM North Slope of Alaska (NSA) site.
Measurements of cloud properties at these sites are important in filling in the high-latitude data gap. These may be derived by ground-based instruments, which take advantage of the interactions between radiation and clouds. Infrared radiometry is one such tool for probing cloud microphysical properties, as this spectral region is sensitive to cloud optical depth (e.g., DeSlover et al., 1999; Turner and Eloranta, 2008; Libois et al., 2016b) and hydrometer phase (e.g., Rathke et al., 2002; Turner, 2005; Libois et al., 2016a), contains windows attuned to ice crystal size (e.g., Naud et al., 2001; Yang et al., 2013; Baran, 2005; Libois et al., 2016a; Libois and Blanchet, 2017), and bears the signature of emission from liquid water and ice crystals (e.g., Turner, 2005; Rowe et al., 2013; Cox et al., 2014; Maestri et al., 2014; Turner and Blumberg, 2019). However, these parameters can be difficult to disentangle, especially in humid environments. In the Arctic, cloud microphysical properties have been derived from measurements of downwelling longwave radiation (DLR), and other ground-based measurements such as radar and lidar systems (e.g., Shupe and Intrieri, 2004; Shupe et al., 2005; Turner, 2005; Turner and Eloranta, 2008; Bourdages et al., 2009; deBoer et al., 2009; Maestri and Holz, 2009; Blanchard et al., 2014; Cox et al., 2014; Shupe et al., 2015; Libois et al., 2016b; Blanchard et al., 2017; Richter et al., 2022) based at various Arctic sites. In Antarctica, such measurements have also been recorded during brief periods (Lubin and Harper, 1996; Lubin, 2004; Mahesh et al., 2001; Di Natale et al., 2017; Maestri et al., 2019; Lubin et al., 2020; Rowe et al., 2025b). Despite both locations experiencing similar seasonal extremes, Antarctic clouds can have unique properties and microphysical processes compared to those in the Arctic (e.g., Bromwich et al., 2012; Zhang et al., 2019; Silber et al., 2018; Atlas et al., 2022).
Multi-sensor classification schemes (e.g., Shupe et al., 2005, 2015; deBoer et al., 2009; Zhang et al., 2019) are often more sensitive to the full range of cloud conditions due to the complementary nature of some instruments. For example, a lidar is typically more sensitive to liquid in clouds due to the high cross-sectional area of numerous liquid droplets, while a radar is more sensitive to ice owing to the larger volume of ice crystals. However, this requires a suite of instruments to be operated continuously and concurrently for extended periods, which is not always possible at remote field sites, such as at PEARL. Thus, analysis of infrared-derived cloud properties is highly complementary to lidar-radar surveys of polar clouds, as well as data from sparse aircraft campaigns (e.g., Verlinde et al., 2007; Wendisch et al., 2019; Zhao et al., 2023; Xia and McFarquhar, 2024) by providing baseline knowledge on cloud properties and variability, especially if advancements in remote sensing measurements can reconcile differences between remote and in-situ sampling (Di Natale et al., 2026). Moreover, these data will be beneficial for model validation, and can be used for case studies. In addition, ongoing measurements will allow for detection of trends in Arctic cloud properties with climate change.
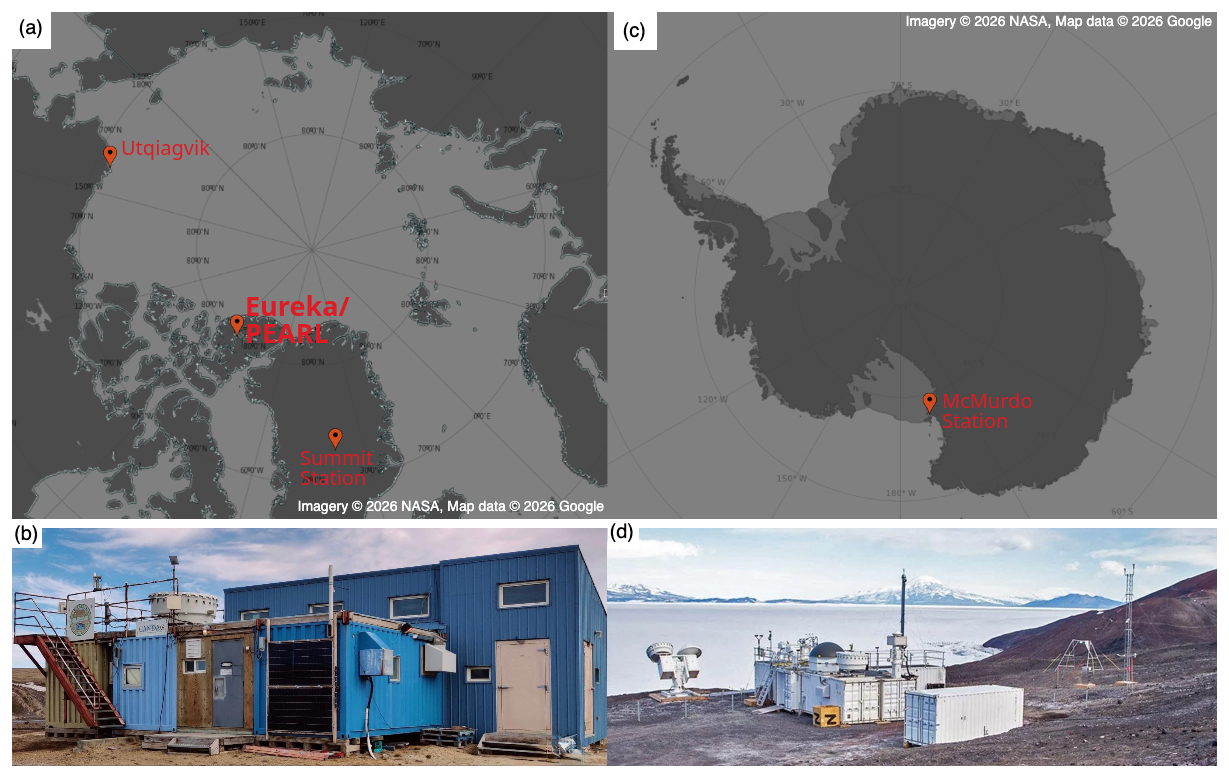
Figure 1Site locations and photos for the PEARL 0PAL at Eureka, Canada (80° N, 86° W) (a, b), and the AWARE at McMurdo Station (77° S 166° E) (c, d). We acknowledge the use of imagery from the NASA Worldview application (https://worldview.earthdata.nasa.gov, last access: 9 November 2026), part of the NASA Earth Science Data and Information System (ESDIS). Site photos are courtesy of CANDAC (https://www.pearl-candac.ca, last access: 9 November 2026) and AWARE (https://www.arm.gov/research/campaigns/amf2015aware, last access: 9 November 2026). Imagery © 2026 NASA, Map data © 2026 Google.
This study has two objectives. The first is to obtain a long-term record of cloud microphysical and optical properties, which are retrieved from downwelling thermal emission measurements collected since 2006 from AERI measurements in the Canadian High Arctic at PEARL, in Eureka, Canada. This data record extends the continuous cloud observation record at PEARL and complements previous studies of Arctic cloud microphysics based on infrared emission and lidar measurements (Turner, 2005; Cox et al., 2014) by providing a nearly 20-year observational dataset. The second objective is to compare the decadal cloud property retrievals at PEARL to similar retrievals from measurements made during the 2016 ARM AWARE program at McMurdo Station, Antarctica (Lubin et al., 2020), to investigate differences between Arctic and Antarctic cloud properties. .
This paper is organized as follows: Sect. 2 describes the instruments and data recorded at PEARL and during the AWARE campaign, along with the physical inversion scheme used to retrieve cloud properties (cloud boundaries, optical depth, ice fraction, and effective radius of liquid droplets and ice crystals) from these measurements. Section 3 presents a dataset of retrieved cloud properties from 2006 to 2022 at Eureka, and also for 2016 at McMurdo, and offers a comparison between the two polar environments. Finally, conclusions and summary are provided in Sect. 4.
2.1 Instrumentation
AERI instruments were developed by the University of Wisconsin Space Science and Engineering Center (UW-SSEC) to record the atmosphere emission between 550 and 3000 cm−1, within an accuracy of 1 % of the ambient radiance (Knuteson et al., 2004a, b). The AERI can be fitted with an extended-range detector, which extends the wavenumber range to 400 cm−1, allowing the AERI to observe more of the downwelling atmospheric emission spectrum. The AERI measurement cycle alternates between views of the sky, and two high-emissivity (∼ 0.995) blackbodies, set to 60 °C and ambient temperature to allow for absolute calibration of recorded spectra. This study analyzes measurements from AERI instruments that operated in the Arctic and Antarctic: the Polar AERI (P-AERI), deployed at Eureka (at PEARL-0PAL) between 2006 and 2009, and two Extended-range (E-AERI) instruments, one at Eureka (at PEARL-0PAL) from 2011 to present day (Mariani et al., 2012), and the other at McMurdo Station as part of the AWARE campaign, between December 2015 and January 2017 (Lubin et al., 2020). Although the extended-range region of the spectra (∼ 400–520 cm−1) contains useful information on cloud emission (e.g., Libois and Blanchet, 2017), these data were not used, in order to facilitate combining data with the P-AERI, which is a standard-range AERI. The E-AERI acquires one spectrum every 7 min, while the P-AERI operated on a 40 s sampling and were averaged to the same 7 min resolution as the E-AERI for this work. Figure 2b shows spectra (at two-hour intervals) recorded by the E-AERI at PEARL for a day with relatively low humidity and large variability in cloud coverage, demonstrating the high sensitivity of the atmosphere window (800–1200 cm−1) to variations in emission from the cloud. Microwindows in this region are thus suitable for retrieving cloud radiative properties, and are denoted in grey shaded regions.
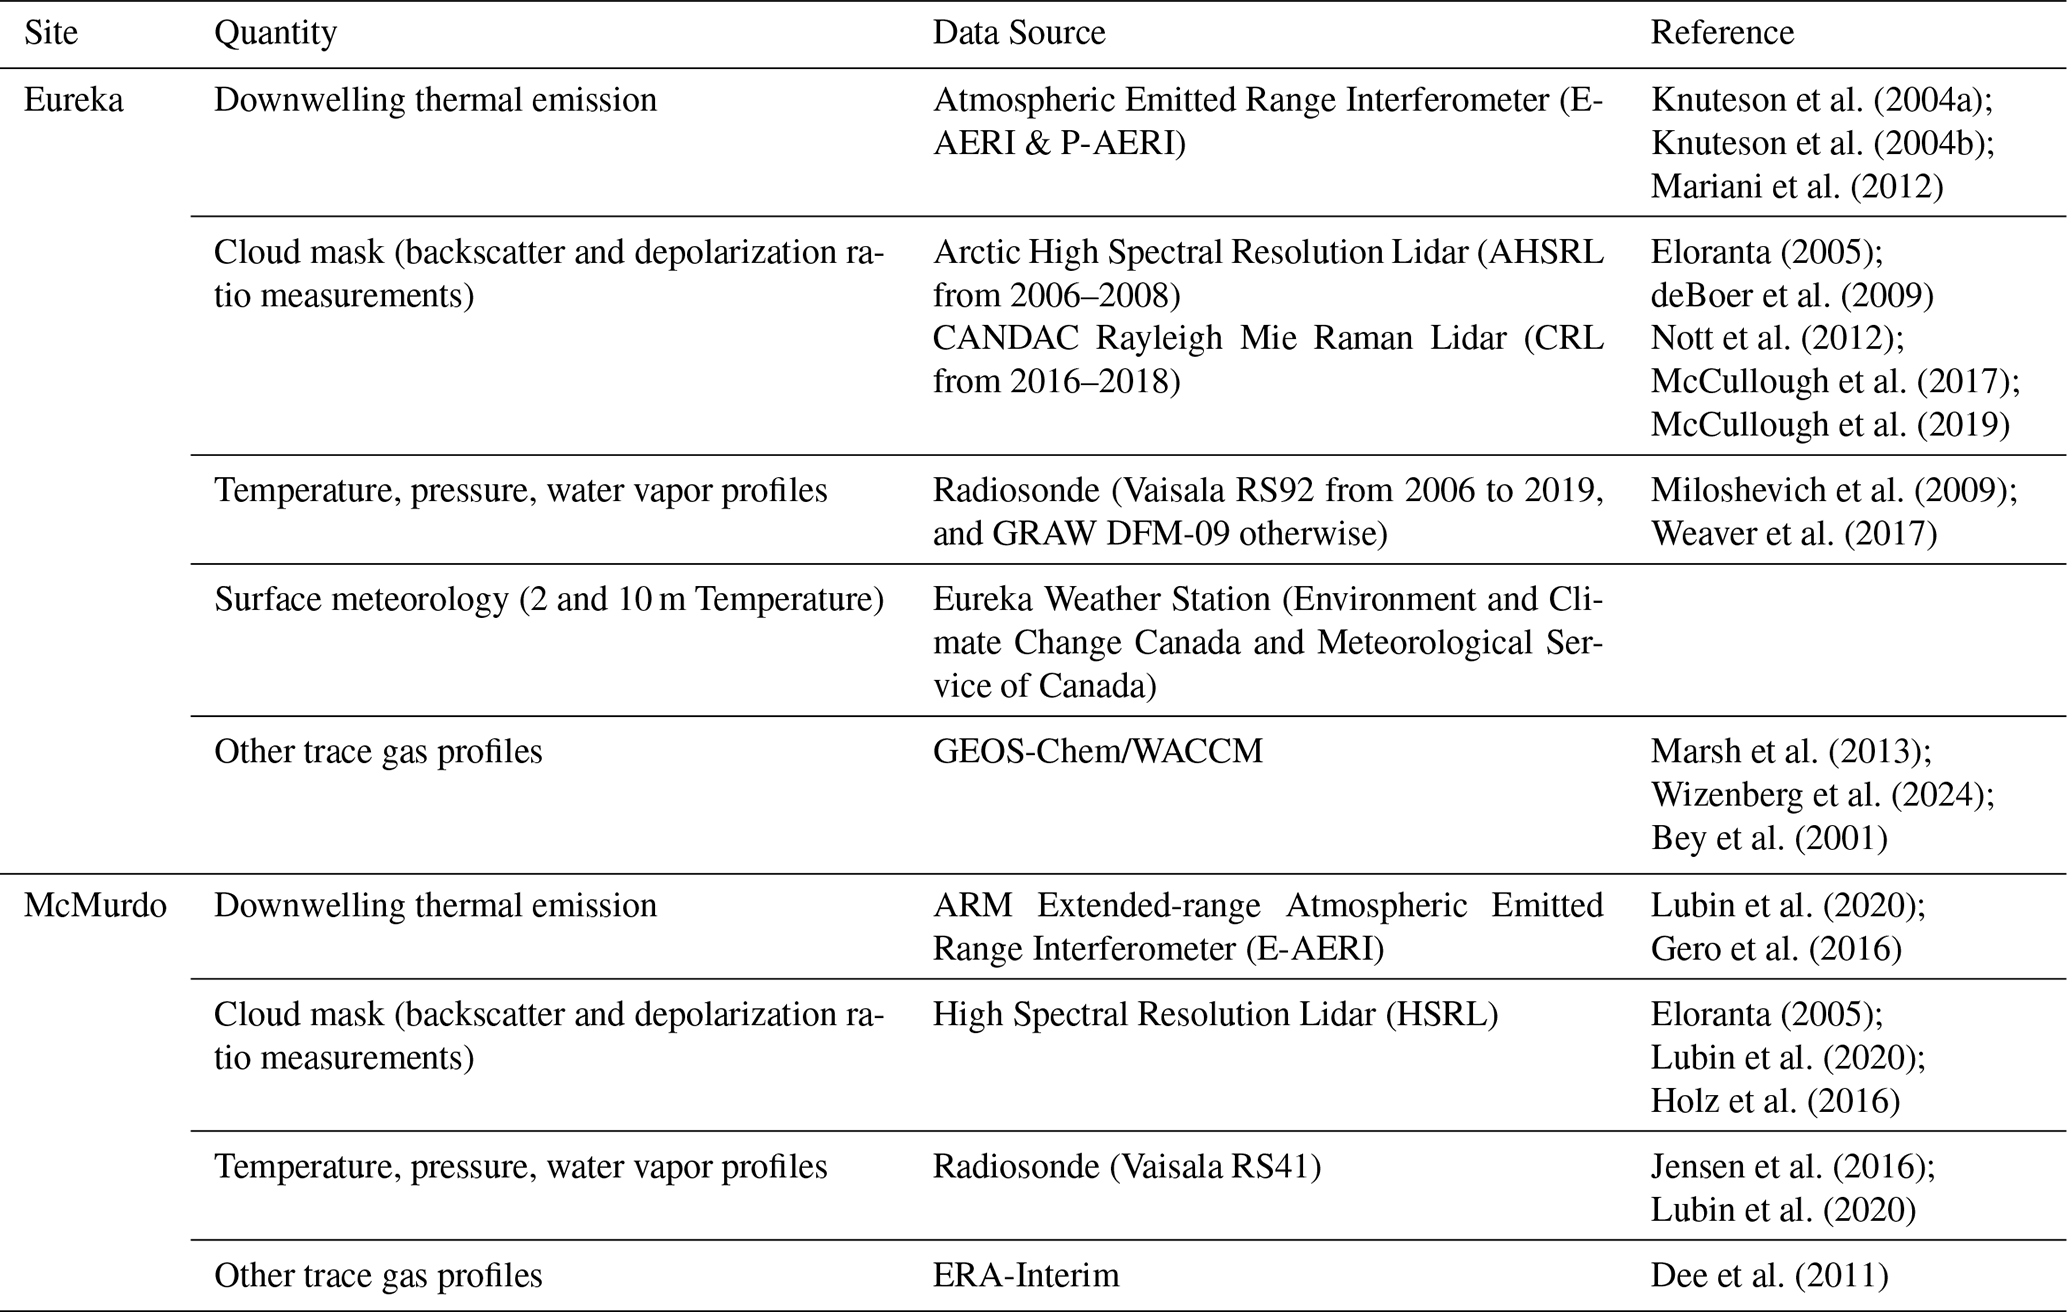
Knuteson et al. (2004a)Knuteson et al. (2004b)Mariani et al. (2012)Eloranta (2005)deBoer et al. (2009)Nott et al. (2012)McCullough et al. (2017)McCullough et al. (2019)Miloshevich et al. (2009)Weaver et al. (2017)Marsh et al. (2013)Wizenberg et al. (2024)Bey et al. (2001)Lubin et al. (2020)Gero et al. (2016)Eloranta (2005)Lubin et al. (2020)Holz et al. (2016)Jensen et al. (2016)Lubin et al. (2020)Dee et al. (2011)Table 1Data sources used to perform retrievals of cloud microphysical properties at Eureka and McMurdo.
PEARL-0PAL also hosts the CANDAC Rayleigh–Mie–Raman Lidar (CRL), which was installed in 2013, but requires on-site personnel for operations. The original configuration is described by Nott et al. (2012), with later modifications to the depolarization system by McCullough et al. (2017). The CRL nominally measures profiles of backscatter and depolarization ratio at high resolution (7.5 m) and frequency (1 min) from which information on the atmospheric water vapor, temperature, clouds, and aerosol optical depth can be derived. PEARL has also previously hosted the Arctic High Spectral Resolution Lidar (AHSRL) from 2005 to 2009, which also measures profiles of backscatter and depolarization ratio at 7.5 m and 2.5 s resolution (Eloranta, 2005). A HSRL was also deployed at McMurdo Station during the AWARE campaign (Lubin et al., 2020). Figure 2a shows example AHSRL measurements of the backscatter coefficient at PEARL, demonstrating its ability to profile the atmosphere through a variety of sky scenes, although attenuation of the signal is present for some optically thicker clouds.

Figure 2(a) Lidar backscatter profiles from the Arctic High Spectral Resolution Lidar (AHSRL), and (b) E-AERI spectra recorded on 16 April 2009. Five spectra are highlighted in panel (b), corresponding to measurement times indicated by the respective vertical lines in panel (a), which highlight the sensitivity of the thermal infrared to changes in cloud emission. Microwindows used to retrieve radiative properties of clouds are shaded in grey in panel (b).
2.2 Cloud Property Retrievals
Cloud properties are retrieved using the Cloud and Atmospheric Radiation Retrieval Algorithm (CLARRA; Rowe et al., 2016, 2019, and references within). CLARRA requires cloud boundaries, which can be prescribed or can be estimated as part of the retrieval. Given the cloud boundaries, CLARRA then performs optimal estimation (OEM; Rodgers, 2000) to infer cloud optical depth (τ) at 900 cm−1, thermodynamic phase as an ice fraction (ifrac) and effective radius of liquid droplets (reff, liq) and ice crystals (reff, ice). The ice fraction is a purely optical measure, (i.e., the ice fraction is not based on mass partitioning), with clouds labeled as purely ice if this fraction is greater than 0.9 and liquid if it is less than 0.1, as in Richter et al. (2022). The effective radius is defined as in Hansen and Travis (1974) as the ratio of the third and second moments of the particle size distribution. We additionally approximate the liquid water path (LWP) from the retrieved variables, which is calculated as LWP = , where Qliq is the volume mass density of liquid water (1000 kg m−3). The ice water path (IWP) can also be estimated from the retrieved reff, ice, τice, and the ice crystal number density and total volume. However, the estimated IWP may vary by up to a factor of 2 depending on the similarity of the assumed vs. true ice habit (Turner, 2005), and previous comparisons between AERI-derived IWP and IWP reported by CloudNet (from synergistic lidar, radar, and microwave radiometer measurements) found very little correlation between the two datasets (Richter et al., 2022). Thus, we refrain from reporting an estimated IWP to avoid potentially misleading data users. The ice effective radius is a proxy for non-spherical ice crystals in terms of radiatively equivalent spheres (i.e., such that the total volume and surface area are representative, but not necessarily the number of particles), which are calculated as described in Neshyba et al. (2003) based on the single scattering parameters of Yang et al. (2013). It is also important to note that while the retrieved reff, ice would be reflective of the size distribution for spherical ice crystals, the true ice habit is unknown. In addition, the infrared signatures of different ice crystal habits may be similar, which would make it challenging to distinguish the true ice habit without additional synergistic measurements. In practice, this means that the uncertainty of the reff, ice retrieval would be the combination of several factors, including the uncertainty associated with assumed ice habit and limitations in the sensitivity of the retrieval windows, and accounting for these will be important for interpreting the retrieved reff, ice.
CLARRA finds the optimal solution that minimizes the difference between the measured downwelling radiance and the result of a multiple-scattering radiative transfer model, in microwindows between strong atmospheric emission lines (Fig. 2b and Table 2), given a priori cloud property statistics and expected measurement uncertainties. It is conceptually similar to other physical iterative inversion schemes such as the Mixed-Phase Cloud Property Retrieval Algorithm (MIXCRA; Turner, 2005; Turner and Blumberg, 2019) and Total Cloud Water retrieval (TCWret; Richter et al., 2022). A diagram of the CLARRA retrieval flow can be seen in Fig. 3. Rowe et al. (2019) evaluated the CLARRA retrieval on simulated low- and moderate-resolution IR emission spectra, while Lubin et al. (2020) provided a demonstration using CLARRA to retrieve cloud microphysical properties for one week of AERI measurements recorded during the AWARE campaign.
The forward radiative transfer model used in CLARRA requires knowledge of the atmospheric state. A model atmosphere is therefore constructed by evaluating supplementary data from models and measurements for temperature, pressure, trace gases, and other meteorological variables. A full list of data sources is listed in Table 1. Temperature, pressure, and humidity profiles to approximately 35 km are acquired through twice-daily radiosonde launches at both the Eureka Weather Station, and McMurdo Station. The radiative transfer output includes emission from profiles of ozone (O3), carbon monoxide (CO), methane (CH4), nitrous oxide (N2O), carbon dioxide (CO2), diatomic oxygen (O2), and water vapour (H2O), which are important to consider for their emission in and around the microwindows of interest. At McMurdo, we use profiles for these gases from the ECMWF Re-Analysis (ERA-Interim; Dee et al., 2011), and at Eureka, we use a 40-year average of the Whole Atmosphere Community Climate Model (WACCM; Marsh et al., 2013) for profiles of O2, CO, and N2O, and model output from the GEOS-Chem High Performance (GCHP) chemical transport model (Bey et al., 2001; Bindle et al., 2021) to provide daily profiles for O3 and CH4 (Wizenberg et al., 2024). Thermodynamic profile information is interpolated from the two nearest radiosonde launches and is not separately retrieved. The assumption is also made for vertically homogeneous clouds, whereby a single reff, liq and reff, ice are fit, and a mixed-phase cloud is determined to exist when ice and liquid layers intersect. In the case of multi-layer clouds (i.e., if detected by a lidar), CLARRA will attempt to fit a separate optical depth for each layer.
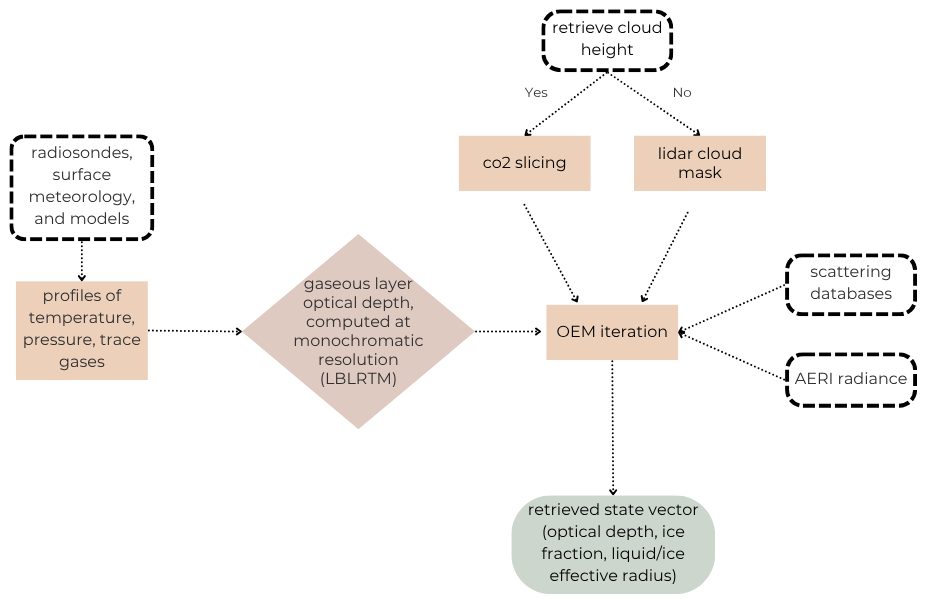
Figure 3Diagram of the CLARRA retrieval flow. The dashed boxes indicate required data input. See Appendix A for an introduction to CO2 slicing and an evaluation for using this technique in retrieving an effective cloud base height.
Table 2Spectral microwindows used for retrievals of cloud microphysical properties in CLARRA.
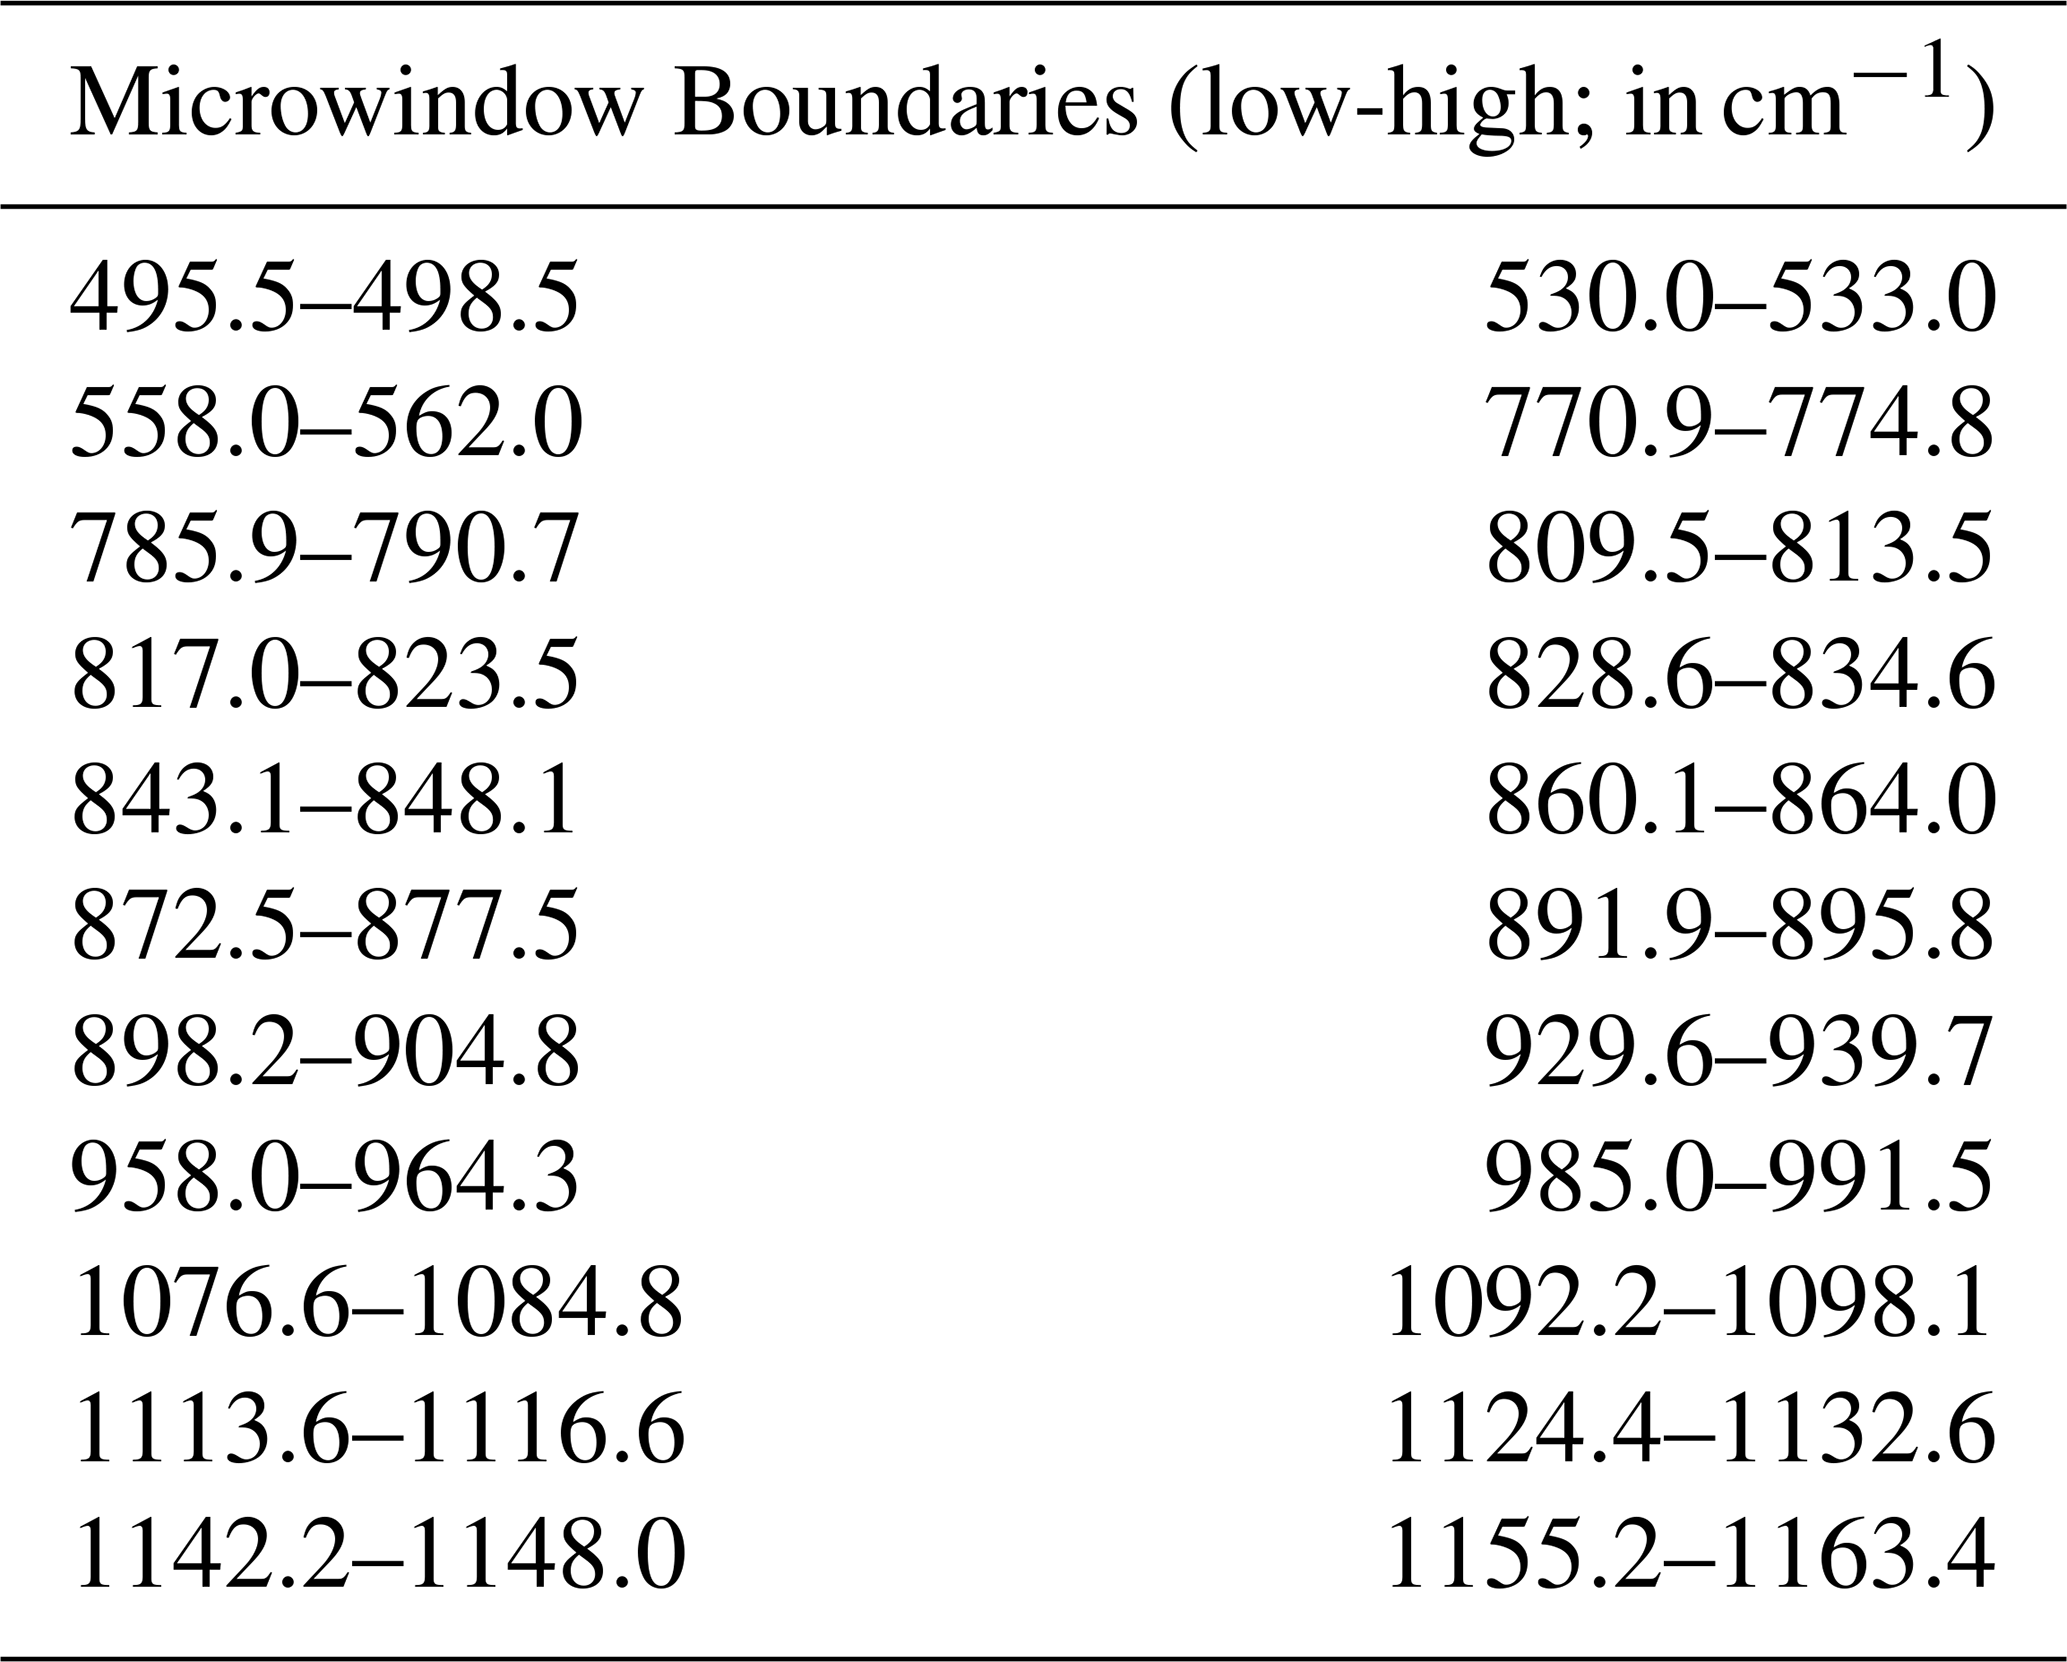
The CLARRA forward model consists of two sequential calculations for computing the radiative transfer. Firstly, layer-by-layer clear sky gaseous optical depths are pre-computed from the Line By Line Radiative Transfer Model (LBLRTM; Clough et al., 1992), with spectroscopic parameters from the HITRAN 2012 database (Rothman et al., 2013), using the temperature, pressure, and trace gas profiles described in the preceding paragraph. These gaseous optical depths are reduced to the effective spectral resolution of the AERI (see Appendix 5 of Weaver et al., 2017) and stored to reduce computational overhead. Secondly, for each retrieval iteration in CLARRA, the downwelling radiance spectrum was calculated by computing the radiative transfer, including scattering, with the DIScrete Ordinates Radiative Transfer model (DISORT; Stamnes et al., 1988), using the atmospheric temperature profile, pre-computed optical depths, and cloud-property state variables. In the starting iteration, the cloud properties were based on the a priori values, while in subsequent iterations they were based on the results of the preceding iteration. The microwindows used in this retrieval are provided in Table 2 and shaded in Fig. 2; they were selected to capture regions of the infrared spectrum relatively free of interference from strong gaseous emission lines, and therefore the measured signal is primarily from clouds. Further, because different cloud properties produce distinct spectral signatures, the windows were selected to maximize the differences in emitted radiance associated with each property of interest. The selected microwindows are based on those previously investigated by Rathke and Fischer (2000), Mahesh et al. (2001), Turner (2005), and Rowe et al. (2019).
For modeling scattering, we use temperature-dependent scattering properties of liquid water droplets by Rowe et al. (2020), based on previous work by Downing and Williams (1975), Bertie and Lan (1996), and Rowe et al. (2013, 2019). Ice crystals are modeled as surface-roughed columns (Yang et al., 2003, 2013; Rowe et al., 2019), although this assumption of homogeneous ice crystal shapes is inaccurate (e.g., Walden et al., 2003; McFarquhar et al., 2017) and with Rowe et al. (2019) showing that, based on simulated spectra, assuming spherical ice crystals when the true ice habit is non-spherical leads to significant error in CLARRA. However, the ice crystal diversity is neglected because we lack more accurate a priori information, and that the microwindows evaluated in the retrieval are generally more sensitive to the ice crystal effective size rather than their morphology (e.g., Naud et al., 2001; Maestri et al., 2019; Rowe et al., 2019).
2.2.1 Quality Control and Retrieval Characteristics
The AERI spectra are first evaluated against radiometric quality control (QC) flags, as detailed in Appendix A, to provide radiative consistency with the best-knowledge thermodynamic state and to remove spectra taken while the sky-view hatch is closed. Approximately one third of spectra are removed during this process. The remaining spectra are analyzed with CLARRA, where retrievals are most accurate for moderately thin clouds in scenes with relatively low humidity (Rowe et al., 2019), which is common in the Arctic. However, it is important to highlight the subset of clouds that are observed with passive-infrared emission measurements as these retrievals lack sensitivity to certain classes of clouds entirely. While the limitations of using passive IR measurements to infer cloud microphysical properties are unavoidable, the partitioning of sky scenes is important to take into account for comparing the retrievals presented here against those from other instruments, and for validating models.
Firstly, there is a sampling bias present as no measurements are made during precipitation to protect the instrument optics, and so the observation record excludes some of the thicker clouds and the larger precipitating particles. Moreover, at Eureka, AERI cloud-detection previously yielded lower occurrence statistics when compared to active radar and lidar sensors, possibly arising from a weak infrared signal (Shupe et al., 2011) − thus, these cases may also present a sampling bias in our timeseries. Shupe et al. (2011) find this discrepancy is most significant in the winter and spring, so it is expected we will be unable to characterize some of the presumably thin and cold clouds during those months. It is also noted that the ice effective radius is not necessarily representative of the true physical size distribution of ice crystals, and that the relationship between these quantities would depend on the ice crystal habit. For example, the infrared retrieval may consider a large dendrite as a collection of smaller particles (e.g., Turner, 2005) but plate-like and column-like crystals would appear less like a collection of smaller crystals and more like singular crystals in the infrared. Libois and Blanchet (2017) and Di Natale et al. (2026) have previously reported that the information on ice habit and reff, ice was dominated by far-infrared channels, particularly around 400 cm−1, which is beyond the AERI spectral range analyzed in this study. Libois and Blanchet (2017) report uncertainty in reff, ice below 20 % when including radiances in the ∼ 400 cm−1 band, while Richter et al. (2022) did not consider these far-infrared radiances and found uncertainties beyond 50 % of typical reff, ice values.
To maintain data quality of the retrieval, we filter retrievals to ensure the analysis is focused on the regime where the instrument provides sufficient sensitivity to the retrieved variables. Retrievals of effective radii were limited to 50 µm due to the lack of sensitivity above this threshold. Large amounts of water vapour also reduce sensitivity in the far-infrared and prevent retrieval of the thermodynamic phase, so the precipitable water vapour (PWV) is restricted to a maximum of 1 cm. The accuracy of spectral fitting is maintained by discarding spectra whose root-mean-square difference (between the observed and final-iteration simulated radiances in the spectral bands) is greater than 2 mW m−2 cm−1 sr−1. In addition, thick clouds (defined as τ ≥ 6) behave similarly to blackbodies and saturate the retrieval windows, while thin clouds (τ≤0.25), do not provide a strong signal and can be difficult to disentangle from clear skies. In both these scenarios, limited information can be gained; thus these cases are also excluded. The listed QC filters are roughly equivalent to restricting cloud scenes to those with a LWP and IWP less than 60 g m−2.
While this study has not explicitly attempted to quantify all sources of error due to computational constraints, the following discussion contextualizes uncertainties related to these retrievals. Provided that the retrievals are filtered to maximize AERI sensitivity to cloud properties, infrared measurements are particularly suitable for analyzing cloud optical depth and liquid-phase properties. Turner and Eloranta (2008) report robust agreement of AERI-derived single-phase cloud optical depth with lidar systems, with mean differences under 0.3 for liquid and 1.15 for ice optical depth when restricted to the 0.25 to 3.0 optical depth range. Richter et al. (2022) additionally calculated an error analysis for AERI cloud microphysics retrievals using simulated IR cloud emission data (Cox et al., 2016) assuming a blended ice habit, and considered error contributions from temperature, humidity, and spectral calibration. They report uncertainties of, respectively, 0.4 for τliq, 0.3 for τice, 3.3 µm for reff, liq, and 13.1 µm for reff, ice. In addition, retrievals for reff, ice showed the most variability out of all retrieved variables and poor agreement with co-incident measurements by other surface remote sensing measurements.
We have also made the assumption that clouds above 273 K are entirely liquid, and that homogeneous freezing nucleation ensures clouds below 233 K are entirely glaciated. Although the temperature at which homogeneous freezing can occur is somewhat higher than 233 K (e.g., Wood et al., 2002; Herbert et al., 2015), selecting a strictly lower bound ensures that we do not force the retrieval to a prior expectation. The effective size and optical depth limitations were filtered based on the retrieval output, while the PWV and temperature restriction were based on radiosonde data. Table 3 shows the partitioning of available spectra at McMurdo and Eureka during each respective season. The fraction of all analyzed spectra (i.e., relative to spectra that have passed the radiometric QC outlined in Appendix A) for which the retrieval converged is provided. To quantify how much data is discarded due to insufficient or saturated signal, the percentage of converged spectra that are removed due to the low and high τ limits are listed, along with the allocation to each phase classification.
Table 3Cloud Statistics for McMurdo (top pane) and Eureka (lower pane) sorted by season. The converged column refers to the percentage of analyzed spectra for which a retrieval converged. Note that clear-sky scenes are considered non-converged retrievals under this classification. The remaining columns provide the percentage of spectra, relative to the number of converged spectra, which were filtered out due to low signal τ<0.25, spectral saturation τ>6, and clouds which were determined to be ice, mixed, and liquid phase. Values may not sum to 100 % due to rounding.

3.1 Arctic: Eureka
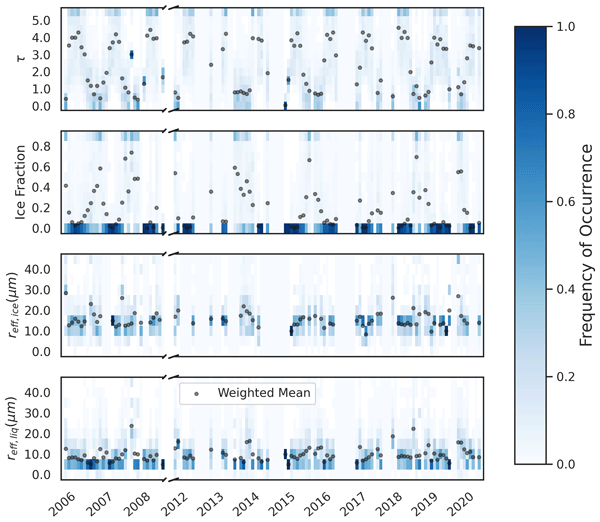
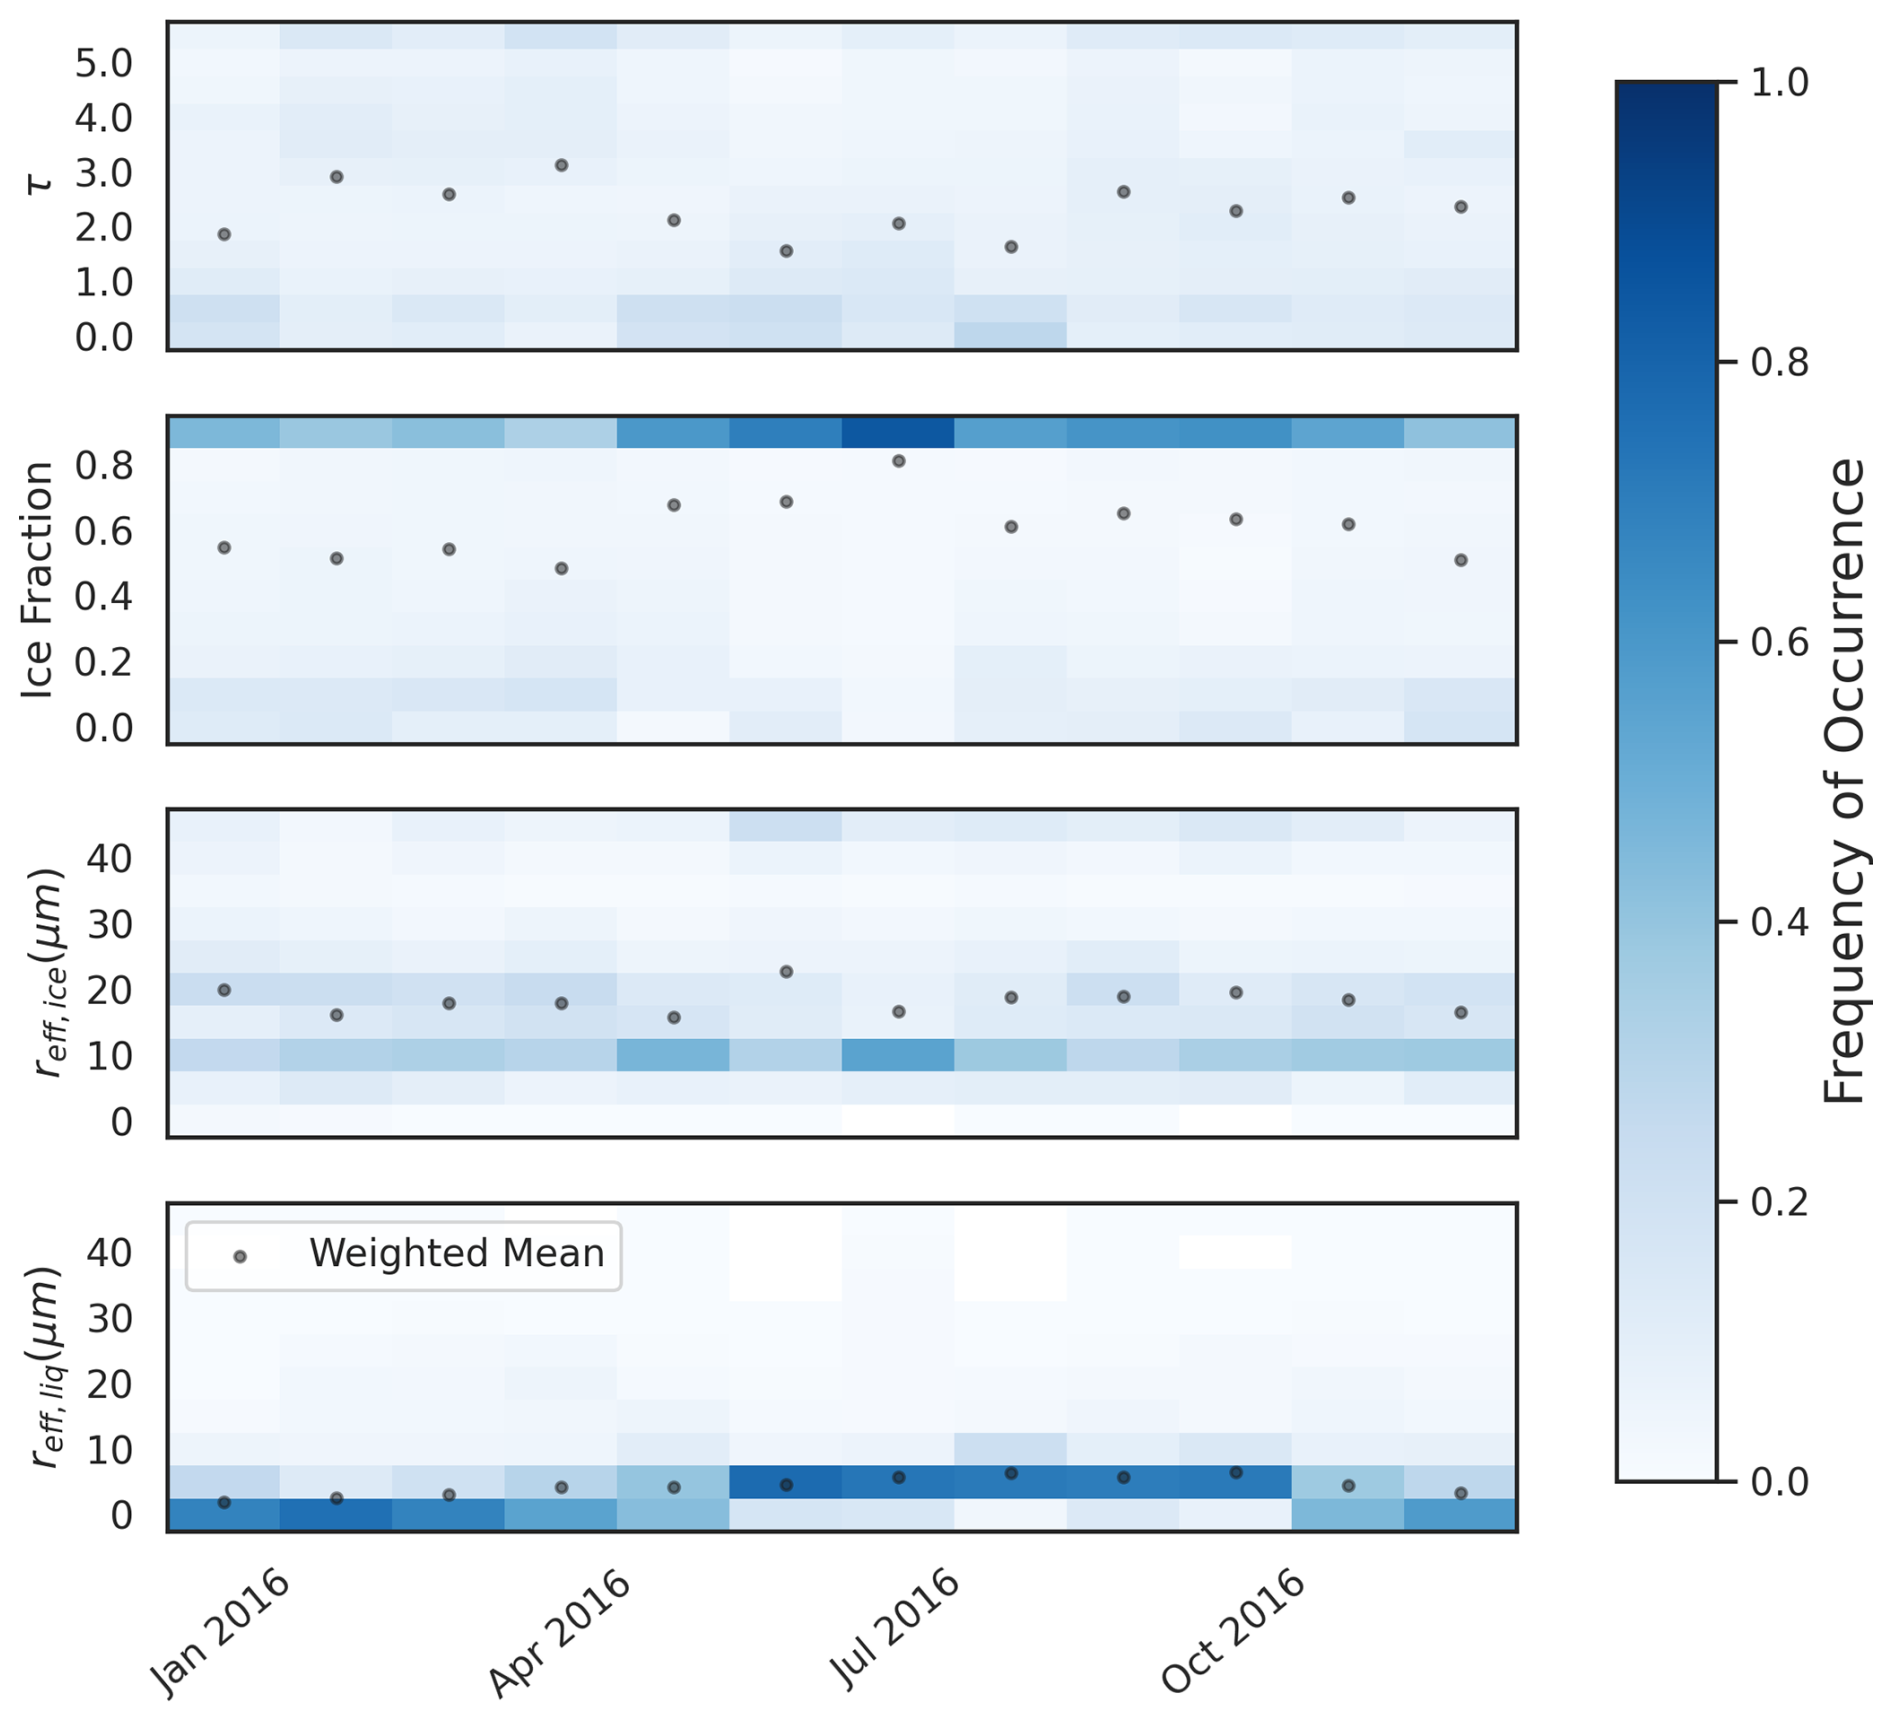
Retrievals of microphysical and optical properties of clouds at Eureka were performed using CLARRA for the period between 2006 and 2022. However, lidar data (and correspondingly, a cloud mask) were available only from 2006 to 2008 (AHSRL), and 2016 to 2018 (CRL), which means retrievals during other periods depend on E-AERI-retrieved cloud boundaries. Two datasets are presented, one utilizing retrieved cloud boundaries, and the other employing lidar-prescribed cloud boundaries. The monthly distribution of the retrieved variables (optical depth, ice fraction, liquid effective radius, and ice effective radius) is plotted in Figs. 4 and 5 for the retrievals performed using AERI-derived and lidar-derived cloud boundaries, respectively. To assess the accuracy of cloud base height retrievals, a discussion evaluating retrieved and inferred cloud base heights is provided in Sect. B. The mean lidar-derived cloud base at Eureka is 1.8 km (as derived here and as reported by Shupe et al., 2011), while the mean E-AERI-derived cloud base is 1.4 km, and this low bias may manifest in the retrievals as warmer clouds, which leads to low bias in the retrieved optical depth. However, the overall effect of this low-cloud bias is insignificant (see Appendix B). Figure B2 shows the monthly distributions of the retrieved variables when using E-AERI vs CRL-derived cloud boundaries. Among the retrieved parameters, only the effective radius retrieval exhibits a notable sensitivity to the choice of cloud boundary source, although the seasonal cycle remains broadly consistent across both methods. The discussion in this section as well as in any following comparisons between Eureka and McMurdo Station is based on the set of retrievals during which an AHSRL or CRL-based cloud mask is available. Both sets of retrievals are provided in the associated dataset.

Figure 4CLARRA-retrieved cloud microphysical and optical variables at PEARL in Eureka, from 2006 to 2020, using effective cloud boundaries inferred with CO2 slicing. Note that there was extended downtime of the E-AERI in 2020 and 2021 due to restricted site access, and so the time series is only plotted to 2020, although retrievals were performed for several months in 2022. From top to bottom, each row shows the monthly distributions (minimum 50 measurements) for, respectively, τ, ifrac, reff,ice, and reff,liq. The shading in each subplot represents the frequency of occurrence for values in the range, with each point denoting the weighted monthly mean.

Figure 5Same as Fig. 4, except using lidar-prescribed cloud boundaries, from 2006 to 2008 (AHSRL) and 2016–2018 (CRL).
As shown in the top two panels of Fig. 5, we find that at Eureka there is a significant seasonal variation in the optical depth and ice fraction. The optical depth reaches its maximum in summer and fall (mean of ∼ 4.5), coinciding with the period of the year with the largest climatological liquid water content (Weaver et al., 2017), with smaller values in the winter and spring (mean of ∼ 1), although there is a large spread within each season.
Table 3 indicates that clouds above Eureka are found to strongly feature liquid, including single-phase liquid, during the summer. The mean ice fraction varies from 0.1 in summer to 0.6 during the winter and spring, as seen in Fig. 5. Mixed-phase clouds are found throughout the year, with the highest frequency occurring from December to February (∼ 44 % of all analyzed clouds are mixed-phase), the lowest from June to August (∼ 15 %), which are comparable to those reported by Zhang et al. (2019) at Utqiagvik (71.3° N, 156.8° W). Because of the strong interaction between longwave radiation and cloud liquid content, it is assumed that the variation observed in optical depth is driven, in part, by the associated seasonal variability of cloud phase and condensed water (see Sect. 3.3). However, there are two important caveats when considering ice fraction determined from these retrievals. First, the generally-larger optical depths of liquid compared to ice, which are heavily influenced by the generally-smaller effective radii of liquid droplets, reduce the ice fraction, since it is given in terms of optical depth. Second, because of discrepancies between the sensitivity of AERIs and active radar and lidar to some winter clouds (as noted in Sect. 2.2.1 and Shupe et al., 2011), and because instrument issues meant measurements were more discontinuous over the winter months than in the summer, the proportion of ice clouds that is reported here is likely understated. Nonetheless, it can be seen that Eureka sees large seasonal variation in cloud phase, as may be expected from significant differences in temperature, heat, and moisture between seasons (Lesins et al., 2010; Shupe et al., 2011; Cox et al., 2012; Zhang et al., 2019).
The retrievals indicate a significant but relatively weak relation between ice fraction and temperature (r2=0.31), with very little correlation within each phase (i.e., ice, liquid, and mixed-phase clouds all exist at a wide range of temperatures). We find that mixed phase clouds occur throughout the year, as seen in Table 3 and Figs. 4 and 5, which is supportive of the unique persistence of some Arctic mixed-phase clouds. This is in agreement with other studies in the Arctic (e.g., Morrison et al., 2012, and references within), but in contrast to expectations from (for example) the Wegener–Bergeron–Findeisen (WBF) process, whereby lower equilibrium vapour pressure of ice compared to liquid water suggests that ice crystals will grow by vapour deposition at the expense of liquid water, resulting in a relatively short-lived mixed-phase state with large ice crystals. Further, Fig. 6 shows the distribution of reff, liq and reff, ice, plotted against cloud temperature for each site, and our retrievals indicate that in mixed-phase clouds, the ice effective radius is smaller than in single-phase ice clouds. Figure 6b shows that at Eureka, the mean ice effective radius is 19 µm in mixed-phase clouds, compared to 29 µm in single-phase clouds, in keeping with previous observations by Turner (2005) and Cox et al. (2014). Contributing reasons for this counterintuitive observation may be, firstly, due to loss of the largest crystals by precipitation, and secondly, as postulated by Turner (2005) and Cox et al. (2014), that uncertainties in ice habit can lead to large, but indeterminate, errors – for example, dendrites and aggregates are common in mixed-phase clouds, and in the infrared, may be interpreted as collections of smaller crystals (e.g., Grenfell and Warren, 1999; Turner, 2005). In such cases, the retrieved smaller effective radius may more accurately reflect the sizes of individual dendrite branches rather than the dendrite as a whole. Furthermore, this also means that ice effective radius retrieved from infrared spectra are not directly comparable with in-situ measurements, because the retrieved values are not necessarily representative of the physical dimension.
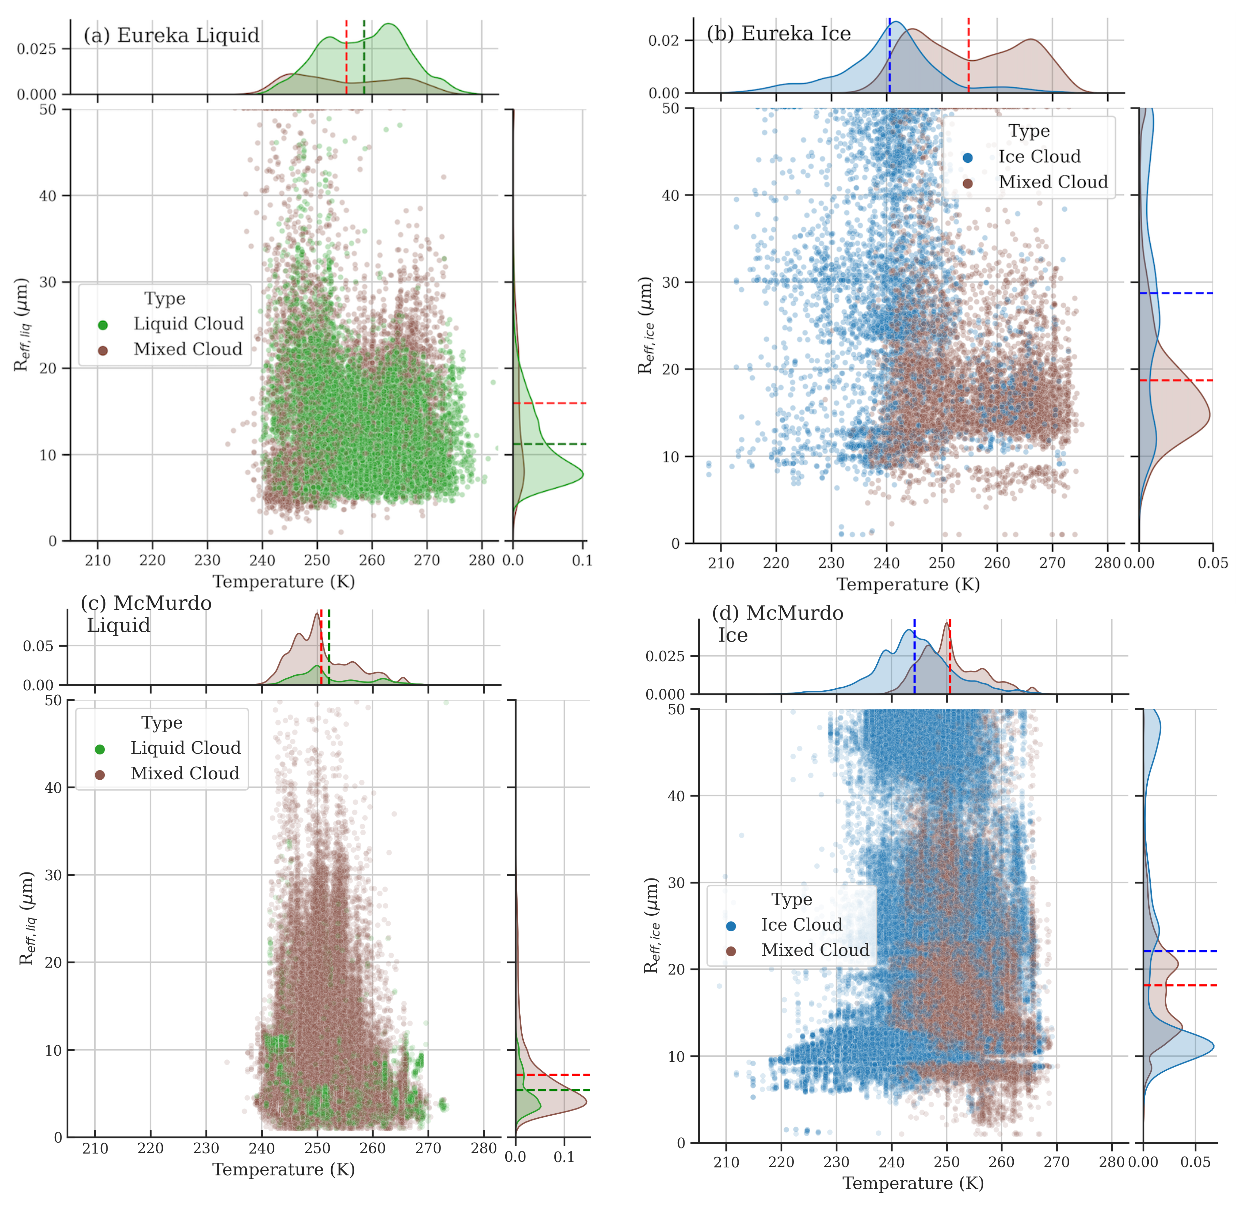
Figure 6Distributions of (a) reff, liq and (b) reff, ice vs. cloud temperature derived from P-AERI (2006–2008) and E-AERI (2016–2018) measurements at Eureka, and (c) reff, liq and (d) reff, ice vs. cloud temperature derived from the ARM AERI (2016) measurements at McMurdo Station. Each observation is coloured based on the respective phase classification, as ice (blue), mixed (red), or liquid (green). The normalized marginal distributions for each variable are shown on the respective axis, with the mean of each distribution plotted with the respective colored dashed line.
3.2 Antarctic: McMurdo Station
Cloud properties were also inferred from ARM AERI spectra recorded during the AWARE campaign, between December 2015 to January 2017, using cloud boundaries prescribed from a HSRL. Figure 7 shows the time series of retrieved cloud properties, analogous to Figs. 4 and 5, with key statistics summarized in Table 3. Immediately, it can be noted that among the sampled clouds, very few liquid clouds occur above McMurdo, and thus most clouds contain at least some ice throughout the year. This may be because of the generally cooler environment or more efficient initial ice nucleation. Liquid-only clouds were also almost always supercooled. This may be significant as clouds consisting of smaller, supercooled, liquid droplets will generally have larger albedo (at shortwave wavelengths). Note that references to seasons at McMurdo are offset by 6 months against seasons at Eureka, and are referred to hereafter as austral seasons. Similar to Eureka, the effective radius distributions shown in the Figs. 6c, d and 7 are generally log-normal, with the mean being larger than the median value, signifying a long tail of large outliers. Although the mean optical depth follows a clear seasonal cycle (maximum in the austral summer and minimum in the austral winter), within each month, there is a large range of values. Single-phase ice clouds feature strongly during the winter, with observations indicating that the wintertime distribution is shifted towards slightly thinner clouds consisting of larger ice crystals as compared to the summer. Mixed-phase clouds are common throughout the year, especially during the summer and autumn, where more than 45 % of all analyzed clouds are observed to be mixed-phase, reaching a maximum of 60 % in September.
The mean cloud temperature is 252 K for liquid, and 251 K for mixed-phase clouds (and 244 K for ice clouds), with this prevalence of supercooled liquid having cascading impacts on related cloud interactions such as cloud albedo, precipitation efficiency, and radiative forcing (e.g., Bodas-Salcedo et al., 2016). The similarity in temperature between liquid and mixed-phase clouds also implies that a sizable portion of ice formation is occurring at low temperature, which is possible through either primary formation through INPs or some SIP processes that are active at colder temperatures (e.g., Field et al., 2017). However, the influence of any SIP process is highly uncertain and would be influenced additionally by external variables such as aerosol load and type, vertical motion/turbulence, and the humidity and cloud persistence. The low-tail end of the mixed and liquid cloud temperature being near the temperature at which homogeneous freezing may begin to occur (e.g., Herbert et al., 2015) also indicates that it is common for some supercooled liquid in clouds to persist until temperatures approach the lower threshold for liquid water. To reiterate, for our retrieval, liquid is only forced to ice at 233 K, so this transition is a signal from the data, and lends confidence to the quality of the infrared optical phase classification.
Although only one complete seasonal cycle was observed in Fig. 7, the effective radius retrievals reflect a lack of seasonality at McMurdo, and are strongly clustered around the monthly means. However, the small seasonal differences are consistent with variation in atmospheric conditions, and are likely related to the atmospheric aerosol load whereby higher aerosol loads provide additional CCN, serving to reduce the liquid effective radius by distributing the total available water between more droplets (commonly referred to as the Twomey effect). Our observations indicate that the maximum liquid effective radii occur during the austral winter, coinciding with the yearly minimum aerosol concentration at some Antarctic sites (e.g., Liu et al., 2018; Hong et al., 2020; Lubin et al., 2020; Filonchyk et al., 2025). As the Antarctic coast of the Southern Ocean is a biologically productive region, evaluating the efficacy of biogenic INP and resultant cloud properties may be an interesting avenue for future work (e.g., Wilson et al., 2015).
3.3 Polar comparisons
Given the large differences between the Arctic and Antarctic environments, it can be expected that the varied cloud nucleation and microphysical processes at the two locations will result in differing cloud properties. Thus, baseline datasets of key cloud parameters are important for understanding differences in cloud processes between the two polar regions, although it is important to note that the extent to which infrared-derived cloud properties are sensitive to ice-phase microphysics and secondary ice production is unclear. For example, infrared signatures for distinct ice crystal habits may be similar and thus an infrared instrument alone may not be able to fully distinguish between changes in particle size and changes in ice habit. The availability of moisture in summer also differs between Eureka and McMurdo, with radiosonde measurements indicating monthly mean PWV of 5 mm at McMurdo and 8 mm at Eureka in January and July, respectively, and the mean during winter months is similar at both locations (around 1 mm). This means that the limit on PWV (1 cm) results in some measurements during the warmer and more humid summer being filtered out, particularly at Eureka, which would introduce some bias against warmer liquid and mixed-phase clouds.
At McMurdo, liquid effective radii are clustered around the mean value of ∼ 5 µm (Fig. 6c), while at Eureka, liquid droplets are generally larger, with the mean being ∼ 11 µm (Fig. 6a). The seasonal cycle reaches a minimum during the winter at Eureka, which is significantly different than McMurdo, where the minimum occurs during the summer (Fig. 7). These differences may be indicative of fundamental differences in liquid-containing cloud processes and/or aerosols between the two locations, under the caveat that the 2016 McMurdo conditions may not be representative of typical climatological norms.
Ice crystal effective radii at McMurdo are also clustered around ∼ 12 µm with a long tail of larger values (Fig. 6d), while ice crystal effective radii at Eureka are highly variable (Fig. 6b). This is consistent with comparisons between McMurdo and other Arctic sites, and is likely due to a combination of factors, including the atmospheric water content, local meteorological conditions, and availability of CCN/INP (e.g., Silber et al., 2018; Lubin et al., 2020; Zhang et al., 2019). Because of the short time series, and that the 25−75th percentile (Fig. 9) overlaps between both locations for all months, no clear conclusions can be drawn about seasonality of the McMurdo dataset. However, as discussed in Sect. 3.1 and 3.2, both Eureka and McMurdo have a wide spread of effective radii at most temperatures, with very little correlation between reff and temperature (r2<0.1 in all cases), although this may be otherwise expected, for example, because cloud parameterization often includes a temperature dependence (e.g., Joseph and Wang, 1999). So, although temperature is an important factor in cloud formation, it is not strongly correlated with the hydrometeor effective radius at either location. This being said, it is possible that the ice crystal habit may result in site-specific errors. For example as seen in Fig. 6, a much larger fraction of the mixed-phase clouds at Eureka exist within the dendritic growth regime (approximately 253–263 K; e.g., Takahashi, 2014) compared to at McMurdo, which, as previously discussed, may influence the retrieved ice effective radius. This may contribute to the mixed-phase reff, ice distributions seen in Fig. 6b, d, which are concentrated at Eureka around a single peak at ∼ 16 µm but which is bimodal at McMurdo.

Figure 8Optical depth vs. temperature for (a) Eureka and (b) McMurdo. The marginal plots for each axes show the proportion of measurements which are classified as each respective phase.
The variability of cloud optical depth is highly site specific. Figure 8 illustrates this by plotting optical depth against temperature at Eureka and McMurdo. At Eureka, temperature has some explanatory power on the variability of optical depth for all clouds (r2=0.38 for the data in Fig. 8a). However if we examine only cold clouds, this correlation disappears (r2<0.05 for clouds with T<240 K), due to the prevalence of thin ice clouds. Conversely, if we exclude these cases, temperature becomes a more powerful driver for optical depth, particularly for mixed phase clouds (r2=0.40 for mixed phase clouds when T>240 K). Because the phase classification is directly a ratio of τice/τtotal, the observed relation between τ and temperature is consistent with optical depth being influenced by microphysical processes within supercooled liquid clouds and phase changes, which have previously been shown to be significant in the mid-latitudes by Tan et al. (2019) and at the ARM NSA site by Coulbury et al. (2026). On the other hand, at McMurdo there is essentially no temperature dependence (r2=0.13), owing to the fact that the temperature distribution is much more tightly clustered compared to Eureka (e.g., 53 % of clouds have temperature between 240 and 250 K). Thin and cold ice clouds are also commonly observed, with 16 % of all clouds being ice clouds having T<245 K and τ<1. The mean temperature of clouds is similar at McMurdo and Eureka for mixed-phase clouds (251 K at McMurdo vs. 254 K at Eureka) and ice clouds (244 K at McMurdo vs. 241 K at Eureka), and significantly cooler at McMurdo for liquid clouds (252 K at McMurdo vs. 259 K at Eureka). This final point, along with the observation that the temperature distribution of liquid clouds at McMurdo is heavily skewed towards the low end of the range, suggests that either ice formation generally occurs at a lower temperature at McMurdo, or that ice forms more readily at higher temperature at McMurdo.
Overall, Eureka has a higher proportion of liquid clouds in the summer than McMurdo, while McMurdo has a higher proportion of ice clouds in the winter than Eureka, but at both locations, there are significant numbers of mixed-phase clouds throughout the year. Given the general short lifetime of mixed-phase clouds at lower latitudes, the prevalence of polar mixed-phase clouds implies that there are processes that extend their lifespan at high latitudes. Morrison et al. (2012) summarize that Arctic mixed-phase clouds may be sustained by feedback between a number of local processes (cloud hydrometeor growth, cloud-top radiative cooling, turbulence, and surface fluxes of heat and moisture), along with the ice sink being too weak to efficiently remove moisture. Mixed-phase clouds might also be sustained by topography induced updrafts (Lohmann et al., 2016). However, the extent to which these effects are pertinent at each location is not well known.
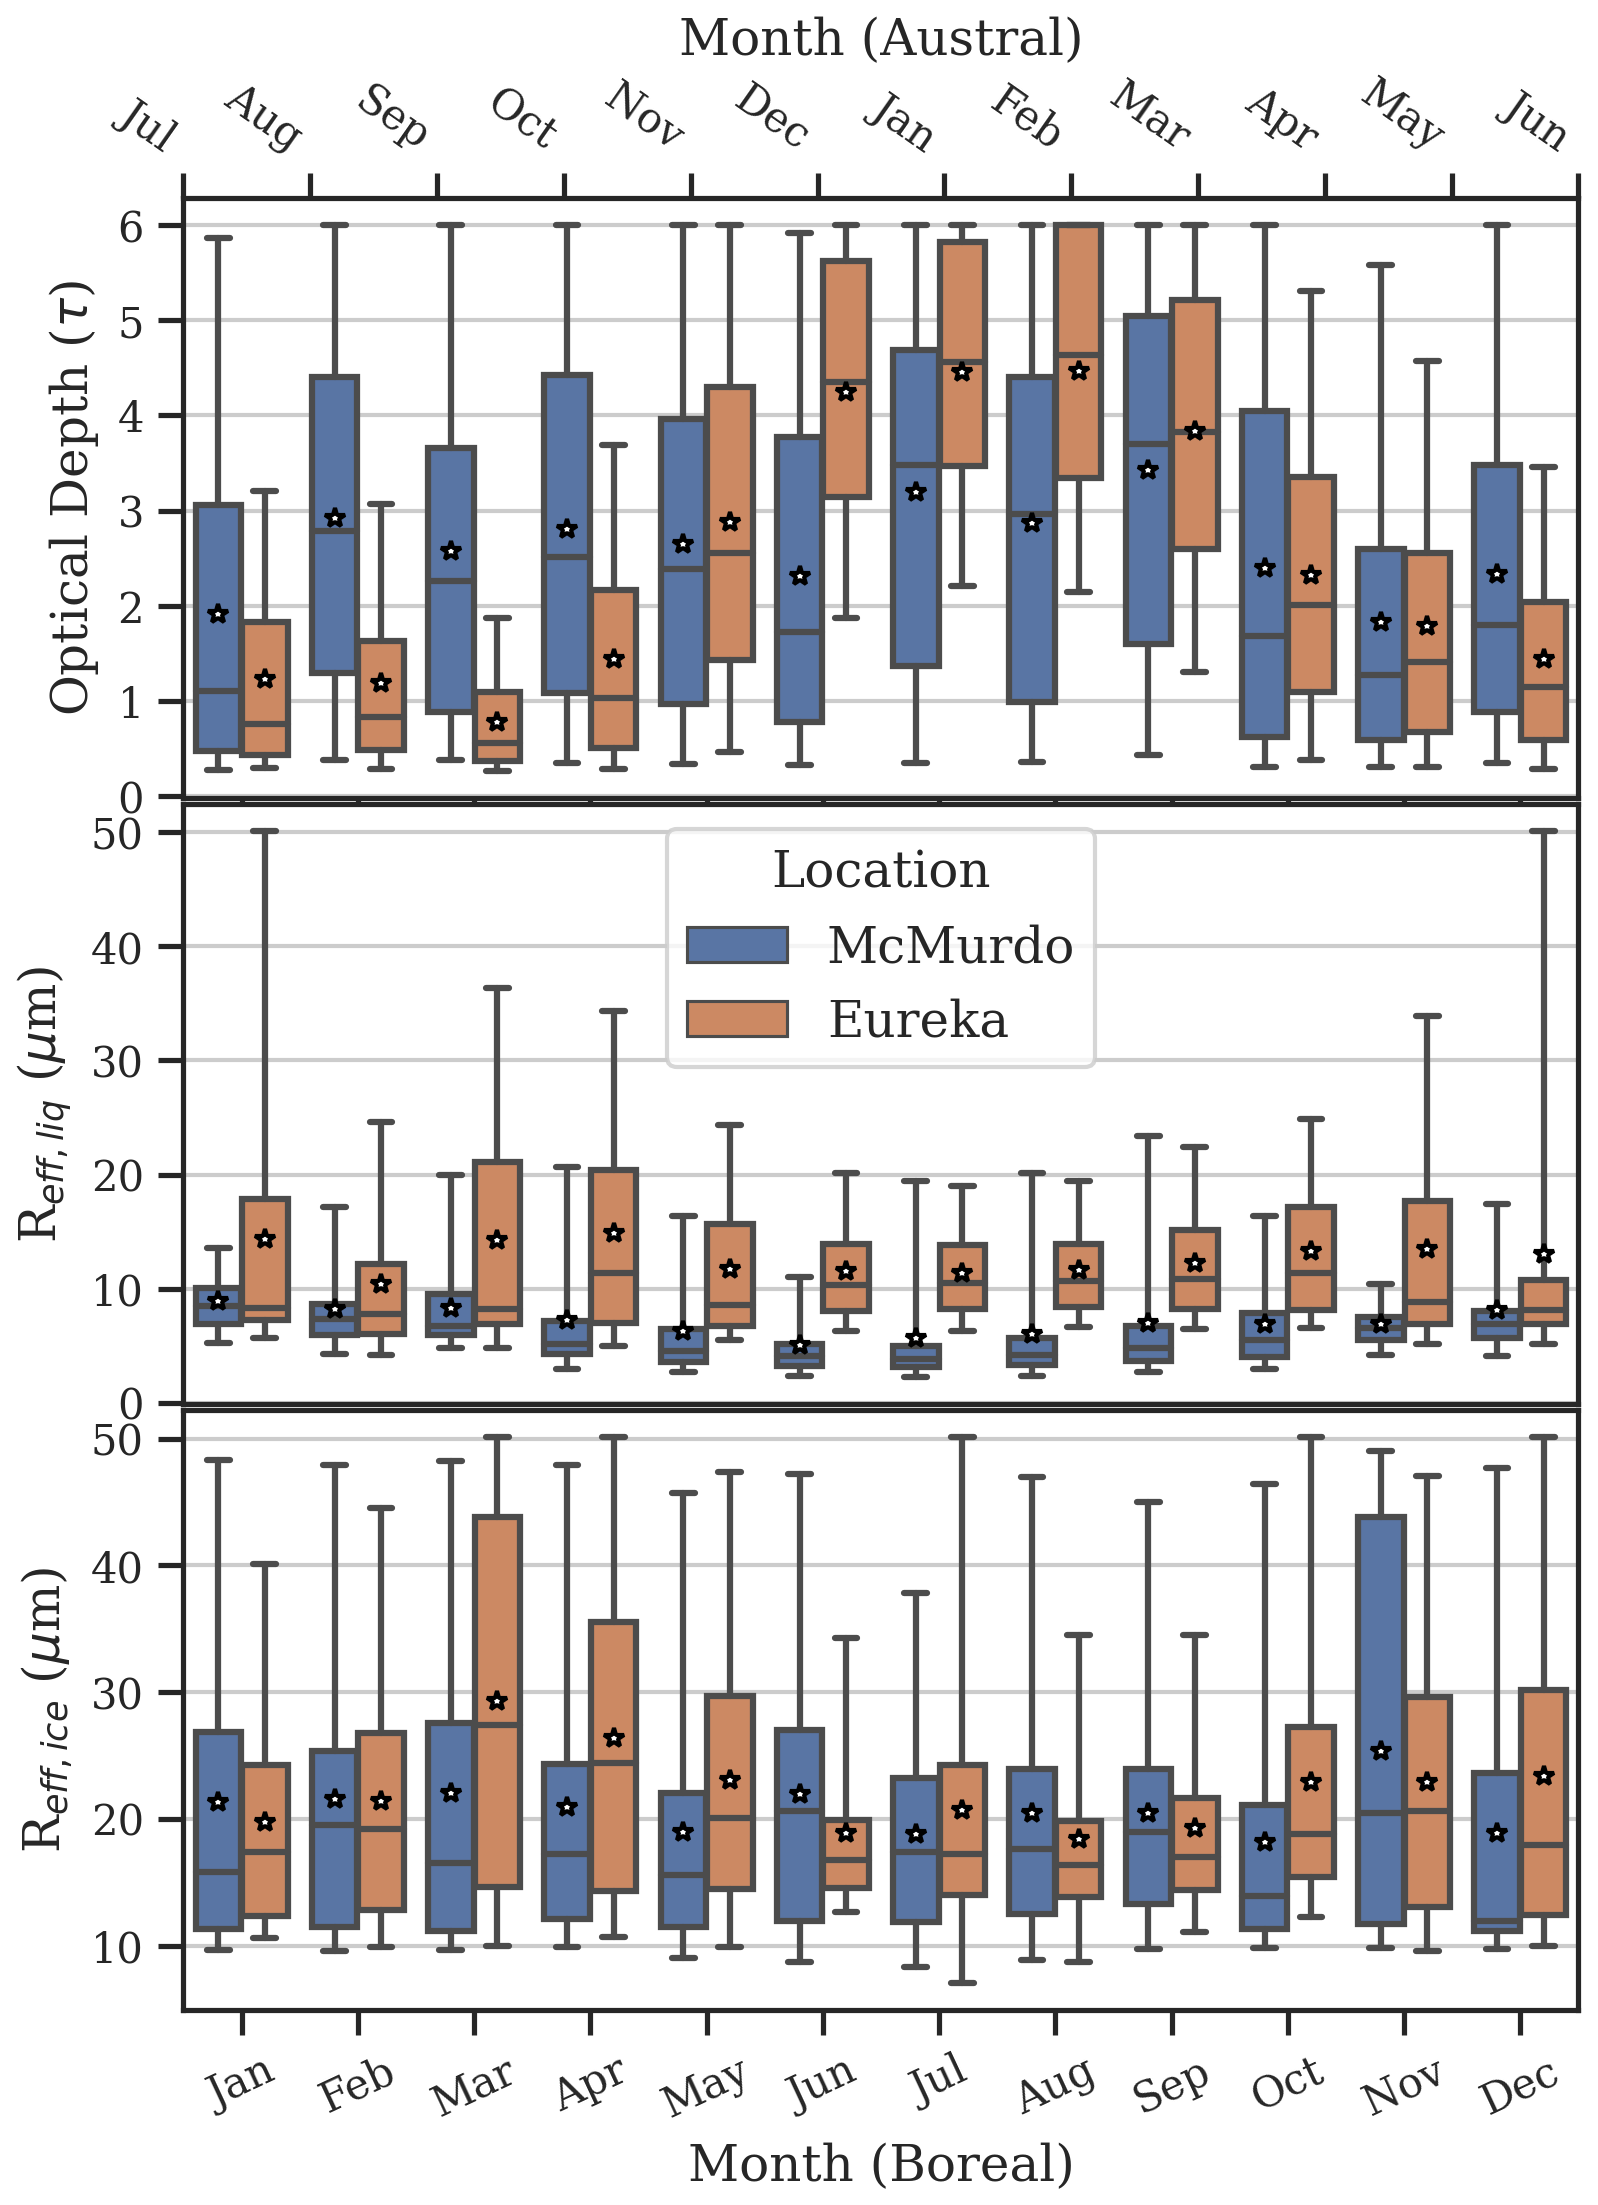
Figure 9Monthly distributions as box-and-whisker plots showing the 5th, 25th, 50th, 75th, and 95th percentiles of the retrieved cloud optical depth, liquid reff, and ice reff at McMurdo (blue) and Eureka (orange). Stars overlaid on each bar indicate the respective monthly means. The McMurdo data have been offset by 6 months to align the boreal and austral seasons, with the top axis denoting the original McMurdo time series. For Eureka, only retrievals which have co-incident lidar cloud mask are shown (i.e., 2006 to 2008, and 2016 to 2018 data).
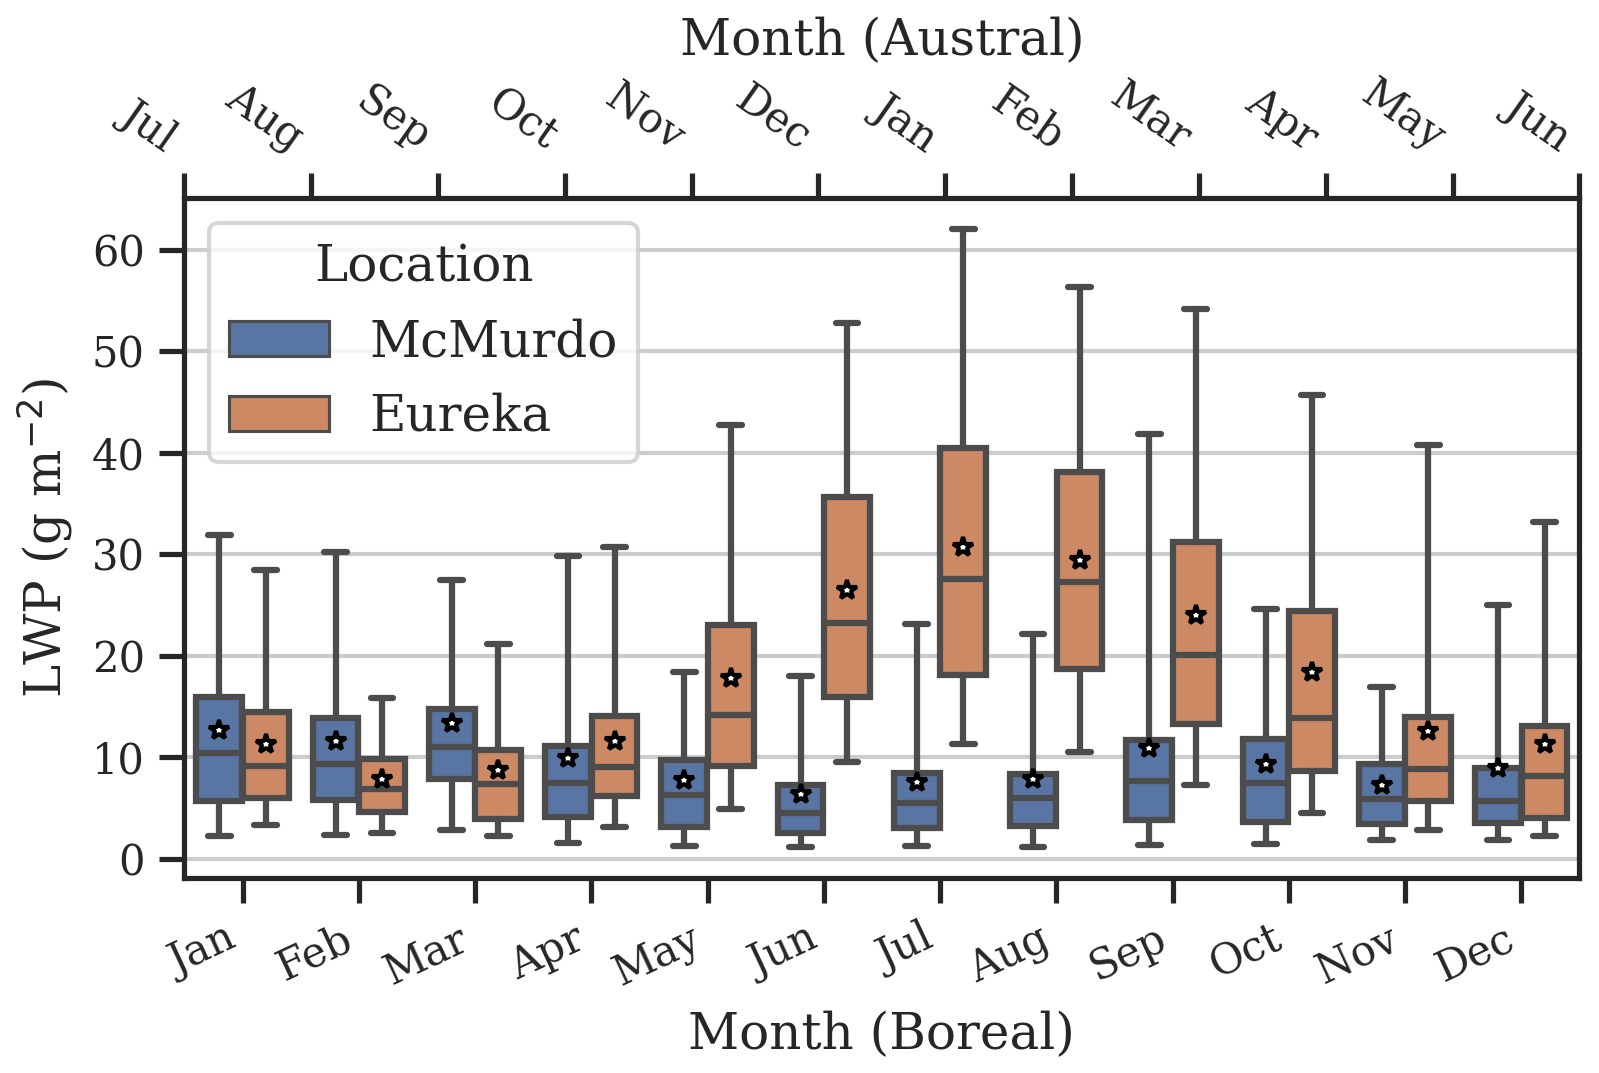
The seasonal cycles of optical depth, liquid effective radius, and ice effective radius are shown in Fig. 9, and of the liquid water path in Fig. 10. The seasonal variability of optical depth is similar at both locations, where the sampled clouds are generally thinner during the respective cold months (consistent with the expectation that the ice fraction is higher during these periods), but with large intra-month variance throughout the entire year, although the yearly range is larger at Eureka than McMurdo. Furthermore, the LWP exhibits significant variability that is reflective of differences in the optical depth and liquid effective radius. At McMurdo, the LWP features little seasonal variability because the largest optical depths coincide with the smallest liquid effective radius (and vice-versa). Whereas at Eureka a clear maximum occurs during the late summer and autumn, which is a similar cycle to that observed at Utqiagvik by Shupe et al. (2015) and Zhang et al. (2019) using a combination of infrared and microwave radiometer, radar, and lidar measurements.
The liquid effective radius at McMurdo has a very well defined seasonal pattern, reducing steadily from the (austral) winter and early spring (∼ 8 µm) to summer (∼ 5 µm), and increasing thereafter. This differs compared to the annual cycle reported by Zhang et al. (2019), who find a peak of ∼ 10 µm in the summer with a large intra-month variability throughout the year. The most likely cause for this discrepancy is a combination of the restriction to stratiform mixed-phase clouds in that study, along with limitations inherent to the respective instrument sensitivities between lidar, radar, and infrared radiometry (e.g., see Sect. 2.2.1). On the contrary, at Eureka the liquid effective radius is highly variable, especially during the shoulder seasons (MAM, SON). We see a maximum in April and somewhat larger monthly means throughout the summer compared to the winter, although the intra-month variability is large. This annual cycle is broadly consistent with observations from other Arctic sites and the large spread of values in March and April especially may be related to the more variable aerosol loading during the Arctic spring (Shupe et al., 2005, 2015; deBoer et al., 2009; Cox et al., 2014; Lee et al., 2024). Analysis of mixed-phase stratiform clouds by deBoer et al. (2009) reveal distributions of liquid effective radius centered around 10 µm at Eureka, while Shupe et al. (2015) considered all clouds and also found an annual cycle centered around 10 µm with a minimum around the winter-spring transition at NSA. Cox et al. (2014) also report a mean liquid effective radius of 9 µm in liquid clouds and 7 µm in mixed-phase clouds at Eureka from 2006 to 2009. Our observations yield mean liquid effective radius of 11 µm and 16 µm for liquid-phase and mixed-phase clouds, respectively. Compared to Cox et al. (2014), the larger liquid effective radii in mixed-phase clouds may be because of the extended time series, mis-classification of ice as liquid by the retrieval, and that some configurations of cloud inhomogeneity (such as commonly-seen liquid-topped clouds) result in some bias for CLARRA retrievals (Rowe et al., 2019).
The ice effective radius has relatively little seasonal variation at both locations, and similarly to the liquid effective radius, the shoulder seasons have the widest spread of values. At Eureka, the maximum values are recorded during the late spring months, March through April (∼ 26 µm), which is similar to Cox et al. (2014) but is less than those reported by deBoer et al. (2009) and Shupe et al. (2015). However, our retrievals necessarily under-report ice crystal size because we do not record (presumably large) precipitating ice crystals, which may be captured by other instruments. The large disparity of effective radius between the sites during the shoulder seasons may be because of the dramatic changes in the local environment that occurs in the Arctic at that time (i.e., seasonal aerosol cycles, moisture availability, and sea ice coverage). On the other hand, at McMurdo, there is no clear seasonal cycle and most months have similar intra-month variability. Extended measurements of Antarctic cloud characteristics are thus necessary to determine whether this lack of seasonality is representative of the typical Antarctic climatology. It should also be noted that the mean of the retrieved reff distributions is often much larger than the median (e.g., Fig. 9) for both liquid and ice effective radius at both Eureka and McMurdo, which is representative of a significant number of large outliers.
In this paper, we present retrievals of cloud optical depth (τ), thermodynamic phase (ifrac), and effective radius of liquid droplets (reff,liq) and ice crystals (reff,ice) over a multi-year period at Eureka, Canada (2006 to 2022), and for a full year at McMurdo Station (2016). Cloud properties were retrieved from measurements of downwelling thermal emission using AERI instruments at both locations, with complementary lidar data to prescribe cloud boundaries, when available.
Our observations indicate that liquid clouds are more common at Eureka than at McMurdo, and are present during all periods of the year, including during the coldest months, which is consistent with observations from other Arctic sites. However, the unique conditions at Eureka, reflecting the climate in the Canadian Arctic Archipelago, result in cloud characteristics differing from other Arctic sites (e.g., deBoer et al., 2009; Shupe et al., 2011; Cox et al., 2012; Shupe et al., 2013; Cox et al., 2014), that motivate similar retrievals at other Arctic locations which host AERI instruments, such as at the North Slope of Alaska or Summit Station. On the other hand, McMurdo has a greater proportion of ice clouds compared to Eureka, and the majority of these ice clouds at both sites have relatively low optical depths. The temperatures at which ice- and mixed-phase clouds are found are similar between the two sites (means around ∼ 240 K for ice clouds and ∼ 250 K for mixed-phase clouds, respectively at both sites), while liquid clouds are, on average, significantly warmer at Eureka (∼ 250 K at McMurdo vs ∼ 260 K at Eureka).
Finally, effective radius is not well correlated with temperature, which may imply that many microphysical processes, especially those involving secondary ice production, occur at overlapping temperature ranges but yield clouds of similar infrared radiative properties.
Mixed-phase clouds are commonly observed throughout the year at both locations. These clouds constitute a greater percentage of all analyzed clouds at McMurdo (37 % at McMurdo, versus 25 % at Eureka), but with highest occurrence at different times of the year – December and January at Eureka (46 %) and September at McMurdo (58 %). The effective radius also differs between regions, likely owing to different aerosol, radiative, and dynamical drivers. Liquid droplets are smaller at McMurdo compared to Eureka (mean of 7 µm vs 12 µm), and have different seasonal variation: at McMurdo, the liquid effective radius is largest during winter, while for Eureka it is largest in the spring and summer. The LWP also does not vary strongly at McMurdo, while Eureka sees a very significant late-summer peak. The ice effective radii are similarly sized at both locations and do not display any strong seasonal variation, except for a small springtime enhancement at Eureka. While the ice effective radius is almost always larger than the liquid effective radius (as would be consistent with physical intuition due to, for example, the large differences in growth rates and the WBF process), the challenges in relating infrared-retrieved ice effective radius to physical ice crystal sizes mean that this comparison is limited to the habit assumption. Regardless, the ice effective radius in mixed-phase clouds is found to be smaller than in single-phase ice clouds at Eureka and McMurdo, which has implications for the cloud scattering and albedo in each region (e.g., Diedenhoven et al., 2014). This could be due to misclassification of liquid as ice by the model, to secondary ice formation, or because large ice crystals may have similar infrared radiative properties as more numerous smaller crystals, and so are indistinguishable to the AERI. Regardless, at both sites, the ubiquitous nature of mixed-phase clouds is in agreement with the persistent nature of such clouds in polar regions, and motivates their further study (e.g., Morrison et al., 2012).
Overall, we have demonstrated the ability of infrared emission measurements by AERI instruments at two field sites in both polar regions to provide year-round dataset of cloud microphysical properties, for the subset of clouds that have emission features distinguishable in the infrared. This work expands on previous analyses of cloud microphysics from ground-based and satellite measurements, provides a valuable decadal time series of key cloud microphysical and optical properties at Eureka, and highlights differences between the two polar sites based on passive infrared interferometry, which we hope will be useful in improving representation of cloud processes in climate modelling.
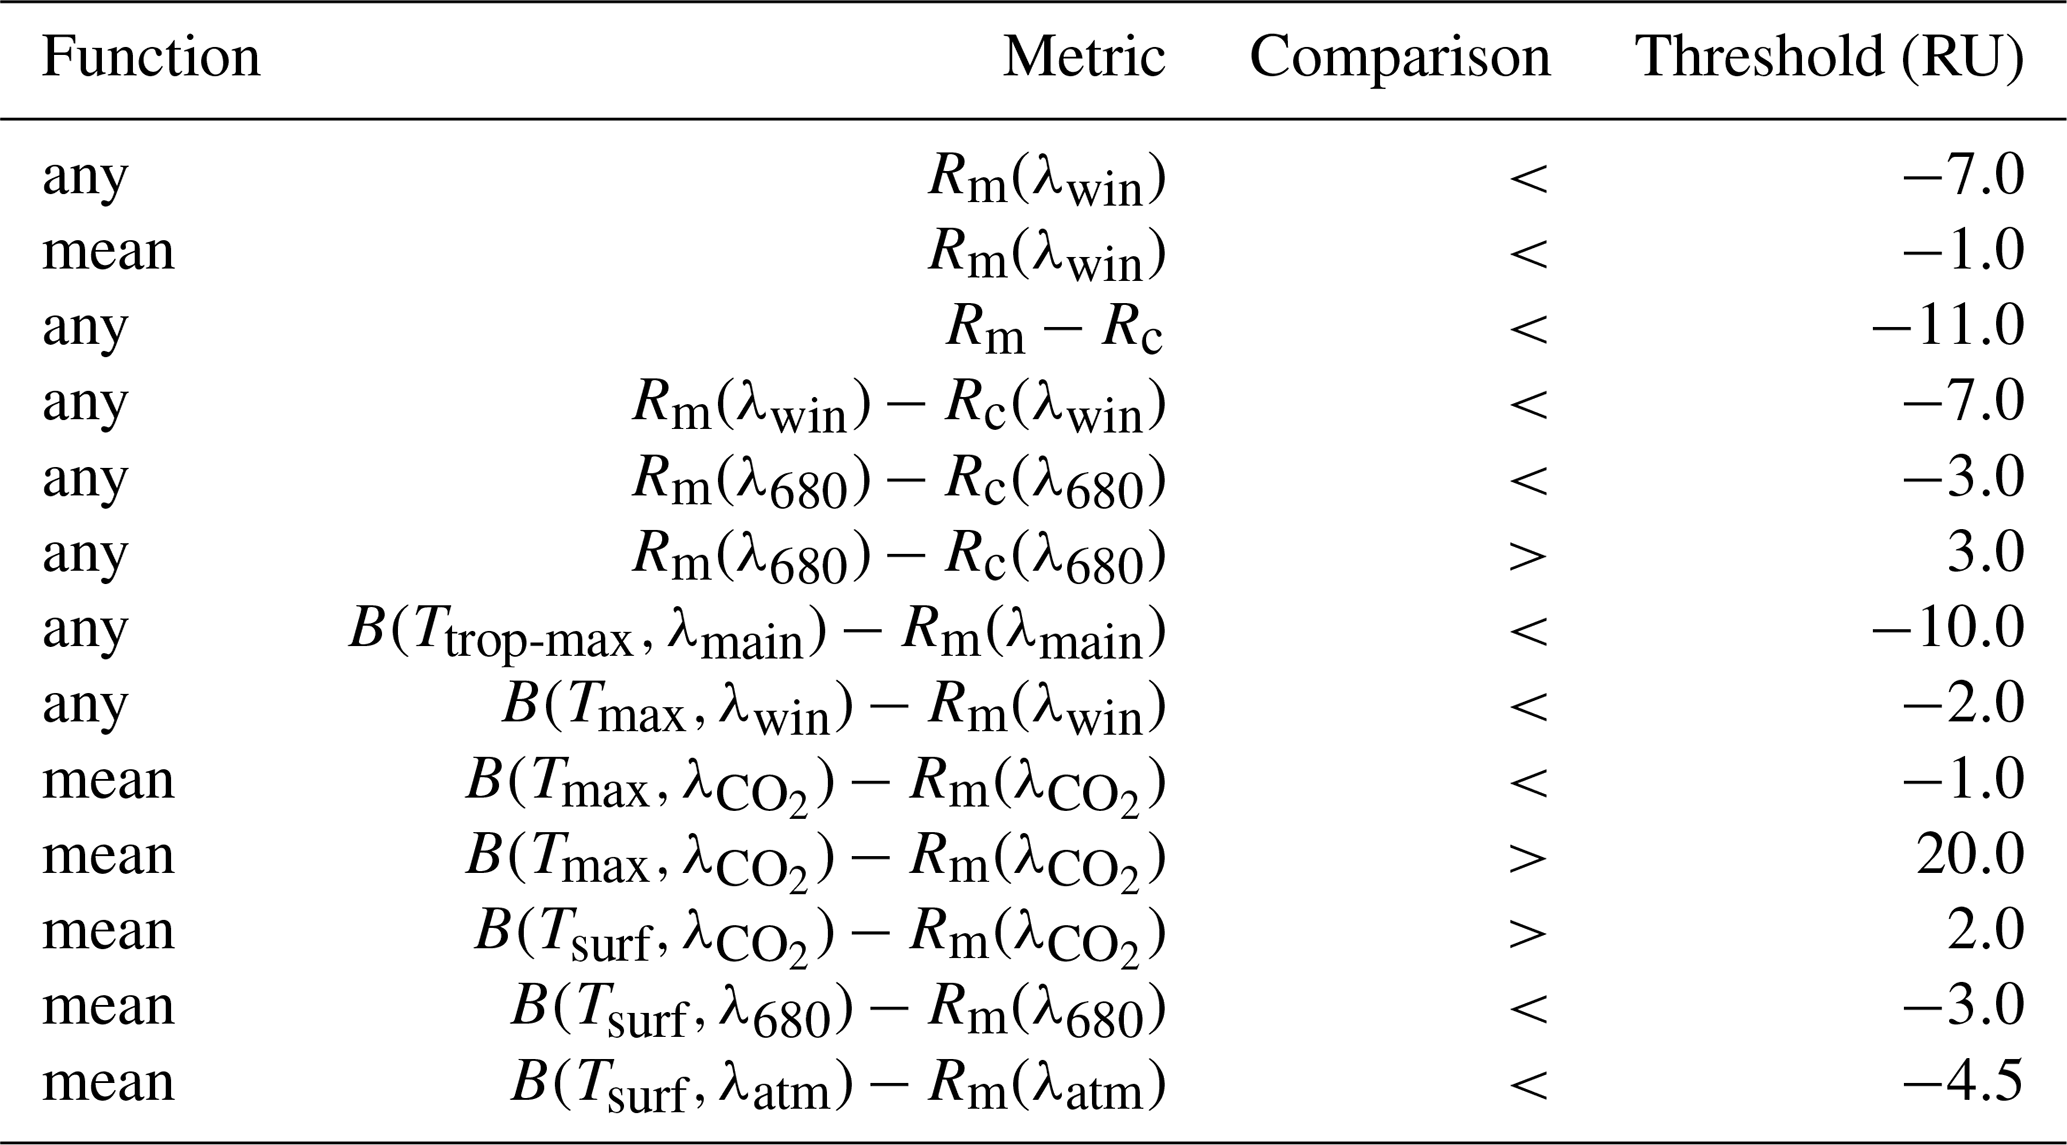
To ensure radiometric calibration of AERI measurements, each recorded spectrum is additionally verified against radiative transfer calculations using radiosonde and surface measurements as inputs. The quality control criteria are listed in Table A1, and each spectrum analyzed with CLARRA has passed all of these filters. These criteria were selected heuristically to filter spectra that are not consistent with the atmospheric thermodynamic state. To accomplish this, the selected spectral windows are defined:
With the following radiance functions:
and with Tmax denoting the maximum tropospheric temperature and Tsurf the surface temperature. The selection windows and thresholds are designed to be relatively agnostic to clouds, except for the filter on the last line of Table A1, that is designed to remove measurements taken while the front-end enclosure hatch is closed. Although this will also remove some spectra from thick cloud scenes, the AERI is insensitive to such clouds and such retrievals would be filtered out as part of the retrieval QC in any case.
Table A1Radiometric quality control thresholds. All thresholds are given in radiance units (RU) of mW (m2 sr cm−1)−1.
CO2 slicing/sorting (e.g., Menzel et al., 1983; Mahesh et al., 2001; Holz et al., 2006) is used to provide an estimate of the physical cloud boundaries from infrared spectroradiometers. These techniques have originally been developed to retrieve cloud boundaries for satellite instrumentation by taking advantage of variations of the CO2 emission in the ν2 emission band (approximately 660–750 cm−1). Rowe et al. (2016), and references within, have adapted this technique for retrieving an effective cloud height from simulated downwelling infrared emission spectra. Here, we compare the E-AERI-derived effective cloud height to the lidar-derived cloud base height (CBH), which is treated as the true CBH. Rowe et al. (2016) found that the most accurate retrievals occur when the CBH is low, and cloud signal is strongest (i.e., for moderately thick clouds when there is no temperature inversion, and a strong temperature gradient exists). However, when clouds form within or adjacent to temperature or moisture inversions, which are common in polar conditions (e.g., Silber et al., 2018), this method can fail to provide robust results due to the degeneracy introduced in such scenarios.
Here, we compare the E-AERI-derived effective CBH to the lidar-derived CBH, which is treated as the true CBH due to the greater sensitivity of the lidar. We do not compare the cloud top height due to the limited sensitivity of the E-AERI to that variable for even moderately thick clouds. Figure B1 illustrates the effectiveness of CO2 slicing for retrieving CBH at Eureka from AERI measurements by comparing to the CRL CBH from 2016 to 2018. The error (i.e., difference between E-AERI and CRL-derived CBH) is plotted as a 2D histogram as a function of the CRL-derived CBH and optical depth, which classifies the difference based on expected cloud signal regimes. The E-AERI, in general, underestimates the CBH (i.e., places the CBH at a lower level than the CRL), except near the surface where it overestimates. Low-level clouds are more accurately placed when compared to the lidar-derived values. The agreement is worse given clouds for which the spectral intensity is weak or are close to saturating the spectrum, ( or ), but estimates remain closest to those of the lidar below ∼ 3 km for intermediate optical depth clouds.
Figure B2 additionally shows the monthly distributions of the retrieved variables when using E-AERI vs CRL-derived cloud boundaries. Among the retrieved parameters, only the effective radius retrieval exhibits a notable sensitivity to the choice of cloud boundary source, although the seasonal cycle remains broadly consistent across both methods and differences between the two retrievals are inconclusive from this comparison.

Figure B1Difference in cloud base height (CBH) between the CBH derived from the CANDAC Rayleigh-Mie-Raman Lidar (CRL) and E-AERI (CRL minus E-AERI), as a function of the cloud optical depth and CRL-derived CBH. The zero contour level of the CBH difference is shown in yellow, and the white tiles indicate no data.
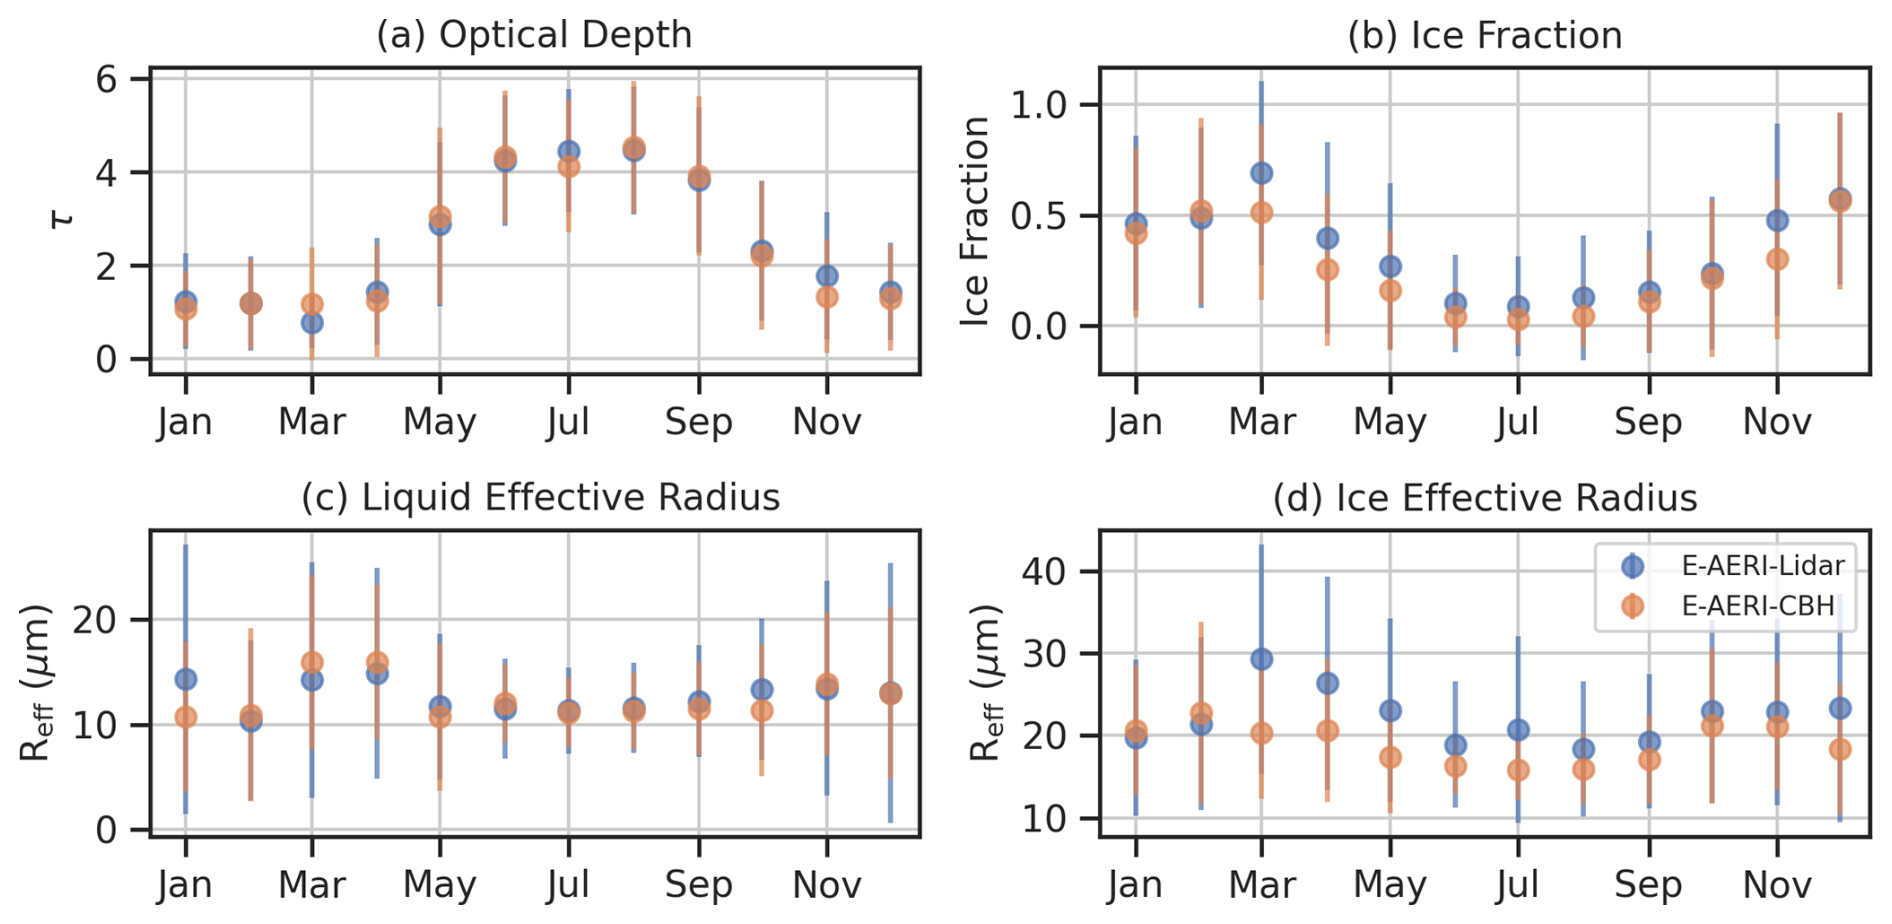
Figure B2Monthly mean (vertical bars indicate ±1σ) CLARRA-retrieved cloud microphysical properties at PEARL from E-AERI spectra between 2016 and 2018. The set of retrievals where cloud boundaries are derived from E-AERI spectra is plotted in orange, and those from adjacent lidar measurements from the CRL is shown in blue.
Retrievals of cloud microphysical and optical properties at Eureka (2006 to 2022) and McMurdo Station (2016) are made available at https://doi.org/10.5683/SP3/XSH1IJ (Hung et al., 2026).
JH, PMR, and KS conceptualized this work. The dataset was curated and processed by JH, PMR, CJC, EM, LK, RO, MDS, VPW, and KS. The investigation and methodology was designed and conducted by JH, PMR, EM, and KS. Funding was procured by PMR, CJC, MDS, VPW, and KS. KS provided supervision. JH prepared the manuscript, which was reviewed and edited with input by PMR, CJC, EM, MDS, VPW, and KS.
The contact author has declared that none of the authors has any competing interests.
Publisher's note: Copernicus Publications remains neutral with regard to jurisdictional claims made in the text, published maps, institutional affiliations, or any other geographical representation in this paper. The authors bear the ultimate responsibility for providing appropriate place names. Views expressed in the text are those of the authors and do not necessarily reflect the views of the publisher.
PEARL is operated by the Canadian Network for the Detection of Atmospheric Change (CANDAC). CANDAC/PEARL funding partners have included: the Arctic Research Infrastructure Fund, Atlantic Innovation Fund/Nova Scotia Research Innovation Trust, Canadian Foundation for Climate and Atmospheric Science, Canada Foundation for Innovation, Canadian Space Agency (CSA), Environment and Climate Change Canada (ECCC), Government of Canada International Polar Year, Natural Sciences and Engineering Research Council (NSERC), Northern Scientific Training Program (NSTP), Ontario Innovation Trust, Ontario Research Fund, Indian and Northern Affairs Canada, and the Polar Continental Shelf Program. Spring visits to PEARL were made as part of the Canadian Arctic ACE/OSIRIS Validation Campaigns, led by Kaley. A. Walker and supported by CSA, ECCC, NSERC, and NSTP. The P-AERI at Eureka was installed and maintained by the National Oceanic and Atmospheric Administration, Study of Environmental Arctic Change (NOAA-SEARCH) project, in collaboration with CANDAC. Special thanks to former PEARL PI James R. Drummond, PEARL Site Manager Pierre Fogal, PEARL Data Manager Yan Tsehtik, and CANDAC operators John Gallagher, Andrew Hall, Ashley Harrett, Alexei Khmel, Paul Loewen, Keith MacQuarrie, Mike Maurice, Peter McGovern, Oleg Mikhailov, and Matt Okraszewski, who have helped with E-AERI measurements at PEARL. Thanks also to Jonathan Gero (UW-SSEC), Stephane Lantagne (ABB), Guillaume Gamache (ABB), and Philippe Lamarche (ABB) for their help installing, troubleshooting, and maintaining the E-AERI. CRL measurements have also been supported by NSERC Discovery Grants and Northern Supplement Grants held by James R. Drummond, Robert J. Sica, and Kaley A. Walker, as well as the NSERC CREATE Training Program in Arctic Atmospheric Science. We acknowledge the CRL-related contributions of original CRL PI Thomas J. Duck; CRL operators: Graeme Nott, Chris Perro, Colin P. Thackray, Jason Hopper, Shayamila Mahagammulla Gamage, and Jon Doyle; and CANDAC support scientist Alexey Tikhomirov. And thank you to the staff at the Eureka Weather Station for their support and hospitality. We are also grateful to Steven Neshyba for computing Legendre moments from single scattering parameters, Rachel Chang for help with processing PEARL lidar data, and Edwin Eloranta and the University of Wisconsin lidar group for supporting AHSRL measurements at PEARL.
This research has been supported by the Natural Sciences and Engineering Research Council of Canada (grant no. RGPIN-2019-06979), the Canadian Space Agency (grant no. 19FATORA07), the National Science Foundation (grant no. 2127632), and the National Oceanic and Atmospheric Administration (NOAA's) Global Ocean Monitoring and Observing Program, Arctic Research Program (FundRef https://doi.org/10.13039/100018302, last access: 12 November 2026) and via NOAA Cooperative Agreement (grant no. NA22OAR4320151).
This paper was edited by Odran Sourdeval and reviewed by Quentin Libois and one anonymous referee.
Atlas, R. L., Bretherton, C. S., Khairoutdinov, M. F., and Blossey, P. N.: Hallett-Mossop Rime Splintering Dims Cumulus Clouds Over the Southern Ocean: New Insight From Nudged Global Storm-Resolving Simulations, AGU Advances, 3, e2021AV000454, https://doi.org/10.1029/2021AV000454, 2022. a
Baker, M. B.: Cloud Microphysics and Climate, Science, 276, 1072–1078, https://doi.org/10.1126/science.276.5315.1072, 1997. a
Baran, A. J.: The dependence of cirrus infrared radiative properties on ice crystal geometry and shape of the size-distribution function, Q. J. Roy. Meteor. Soc., 131, 1129–1142, https://doi.org/10.1256/qj.04.91, 2005. a
Bertie, J. E. and Lan, Z.: Infrared Intensities of Liquids XX: The Intensity of the OH Stretching Band of Liquid Water Revisited, and the Best Current Values of the Optical Constants of H2O(l) at 25 °C between 15,000 and 1 cm−1, Applied Spectroscopy, 50, 1047–1057, https://doi.org/10.1366/0003702963905385, 1996. a
Bey, I., Jacob, D. J., Yantosca, R. M., Logan, J. A., Field, B. D., Fiore, A. M., Li, Q., Liu, H. Y., Mickley, L. J., and Schultz, M. G.: Global modeling of tropospheric chemistry with assimilated meteorology: Model description and evaluation, J. Geophys. Res.-Atmos., 106, 23073–23095, https://doi.org/10.1029/2001JD000807, 2001. a, b
Bindle, L., Martin, R. V., Cooper, M. J., Lundgren, E. W., Eastham, S. D., Auer, B. M., Clune, T. L., Weng, H., Lin, J., Murray, L. T., Meng, J., Keller, C. A., Putman, W. M., Pawson, S., and Jacob, D. J.: Grid-stretching capability for the GEOS-Chem 13.0.0 atmospheric chemistry model, Geosci. Model Dev., 14, 5977–5997, https://doi.org/10.5194/gmd-14-5977-2021, 2021. a
Blanchard, Y., Pelon, J., Eloranta, E. W., Moran, K. P., Delanoë, J., and Sèze, G.: A Synergistic Analysis of Cloud Cover and Vertical Distribution from A-Train and Ground-Based Sensors over the High Arctic Station Eureka from 2006 to 2010, J. Appl. Meteorol. Clim., 53, 2553–2570, https://doi.org/10.1175/JAMC-D-14-0021.1, 2014. a
Blanchard, Y., Royer, A., O'Neill, N. T., Turner, D. D., and Eloranta, E. W.: Thin ice clouds in the Arctic: cloud optical depth and particle size retrieved from ground-based thermal infrared radiometry, Atmos. Meas. Tech., 10, 2129–2147, https://doi.org/10.5194/amt-10-2129-2017, 2017. a
Bock, L. and Lauer, A.: Cloud properties and their projected changes in CMIP models with low to high climate sensitivity, Atmos. Chem. Phys., 24, 1587–1605, https://doi.org/10.5194/acp-24-1587-2024, 2024. a
Bodas-Salcedo, A., Hill, P. G., Furtado, K., Williams, K. D., Field, P. R., Manners, J. C., Hyder, P., and Kato, S.: Large Contribution of Supercooled Liquid Clouds to the Solar Radiation Budget of the Southern Ocean, J. Climate, 29, 4213–4228, https://doi.org/10.1175/JCLI-D-15-0564.1, 2016. a, b
Bourdages, L., Duck, T. J., Lesins, G., Drummond, J. R., and Eloranta, E. W.: Physical properties of High Arctic tropospheric particles during winter, Atmos. Chem. Phys., 9, 6881–6897, https://doi.org/10.5194/acp-9-6881-2009, 2009. a
Bromwich, D. H., Nicolas, J. P., Hines, K. M., Kay, J. E., Key, E. L., Lazzara, M. A., Lubin, D., McFarquhar, G. M., Gorodetskaya, I. V., Grosvenor, D. P., Lachlan-Cope, T., and van Lipzig, N. P. M.: Tropospheric clouds in Antarctica, Rev. Geophys., 50, https://doi.org/10.1029/2011RG000363, 2012. a
Bromwich, D. H., Otieno, F. O., Hines, K. M., Manning, K. W., and Shilo, E.: Comprehensive evaluation of polar weather research and forecasting model performance in the Antarctic, J. Geophys. Res.-Atmos., 118, 274–292, https://doi.org/10.1029/2012JD018139, 2013. a
Clough, S. A., Iacono, M. J., and Moncet, J.-L.: Line-by-line calculations of atmospheric fluxes and cooling rates: Application to water vapor, J. Geophys. Res.-Atmos., 97, 15761–15785, https://doi.org/10.1029/92JD01419, 1992. a
Coulbury, C., Tan, I., Turner, D., and Zhou, C.: Insights into the low-level single-layer stratiform cloud optical depth feedback based on two decades of observations at the North Slope of Alaska, EGUsphere [preprint], https://doi.org/10.5194/egusphere-2025-6553, 2026. a
Cox, C. J., Walden, V. P., and Rowe, P. M.: A comparison of the atmospheric conditions at Eureka, Canada, and Barrow, Alaska (2006–2008), J. Geophys. Res.-Atmos., 117, https://doi.org/10.1029/2011JD017164, 2012. a, b, c, d
Cox, C. J., Turner, D. D., Rowe, P. M., Shupe, M. D., and Walden, V. P.: Cloud Microphysical Properties Retrieved from Downwelling Infrared Radiance Measurements Made at Eureka, Nunavut, Canada (2006–09), J. Appl. Meteorol. Clim., 53, 772–791, https://doi.org/10.1175/JAMC-D-13-0113.1, 2014. a, b, c, d, e, f, g, h, i, j
Cox, C. J., Rowe, P. M., Neshyba, S. P., and Walden, V. P.: A synthetic data set of high-spectral-resolution infrared spectra for the Arctic atmosphere, Earth Syst. Sci. Data, 8, 199–211, https://doi.org/10.5194/essd-8-199-2016, 2016. a
deBoer, G., Eloranta, E. W., and Shupe, M. D.: Arctic Mixed-Phase Stratiform Cloud Properties from Multiple Years of Surface-Based Measurements at Two High-Latitude Locations, J. Atmos. Sci., 66, 2874–2887, https://doi.org/10.1175/2009JAS3029.1, 2009. a, b, c, d, e, f, g, h
Dee, D. P., Uppala, S. M., Simmons, A. J., Berrisford, P., Poli, P., Kobayashi, S., Andrae, U., Balmaseda, M. A., Balsamo, G., Bauer, P., Bechtold, P., Beljaars, A. C. M., van de Berg, L., Bidlot, J., Bormann, N., Delsol, C., Dragani, R., Fuentes, M., Geer, A. J., Haimberger, L., Healy, S. B., Hersbach, H., Hólm, E. V., Isaksen, L., Kållberg, P., Köhler, M., Matricardi, M., McNally, A. P., Monge-Sanz, B. M., Morcrette, J.-J., Park, B.-K., Peubey, C., de Rosnay, P., Tavolato, C., Thépaut, J.-N., and Vitart, F.: The ERA-Interim reanalysis: configuration and performance of the data assimilation system, Q. J. Roy. Meteor. Soc., 137, 553–597, https://doi.org/10.1002/qj.828, 2011. a, b
DeSlover, D. H., Smith, W. L., Piironen, P. K., and Eloranta, E. W.: A Methodology for Measuring Cirrus Cloud Visible-to-Infrared Spectral Optical Depth Ratios, J. Atmos. Ocean. Tech., 16, 251–262, https://doi.org/10.1175/1520-0426(1999)016<0251:AMFMCC>2.0.CO;2, 1999. a
Di Natale, G., Palchetti, L., Bianchini, G., and Del Guasta, M.: Simultaneous retrieval of water vapour, temperature and cirrus clouds properties from measurements of far infrared spectral radiance over the Antarctic Plateau, Atmos. Meas. Tech., 10, 825–837, https://doi.org/10.5194/amt-10-825-2017, 2017. a
Di Natale, G., Brindley, H., Warwick, L., Panditharatne, S., Yang, P., David, R. O., Carlsen, T., Vâjâiac, S. N., Vlad, A., Ghemuleț, S., Bantges, R., Foth, A., Flügge, M., Lyngra, R., Oetjen, H., Schuettemeyer, D., Palchetti, L., and Murray, J.: Achieving consistency between in-situ and remotely sensed optical and microphysical properties of Arctic cirrus: the impact of far-infrared radiances, Atmos. Chem. Phys., 26, 1373–1394, https://doi.org/10.5194/acp-26-1373-2026, 2026. a, b
Diedenhoven, B. v., Ackerman, A. S., Cairns, B., and Fridlind, A. M.: A Flexible Parameterization for Shortwave Optical Properties of Ice Crystals, J. Atmos. Sci., 71, 1763–1782, https://doi.org/10.1175/JAS-D-13-0205.1, 2014. a
Downing, H. D. and Williams, D.: Optical constants of water in the infrared, J. Geophys. Res., 80, 1656–1661, https://doi.org/10.1029/JC080i012p01656, 1975. a
Eastman, R. and Warren, S. G.: Interannual Variations of Arctic Cloud Types in Relation to Sea Ice, J. Climate, 23, 4216–4232, https://doi.org/10.1175/2010JCLI3492.1, 2010. a
Eloranta, E. E.: High Spectral Resolution Lidar, in: Lidar: Range-Resolved Optical Remote Sensing of the Atmosphere, edited by Weitkamp, C.,Springer, New York, NY, 143–163, ISBN 978-0-387-25101-1, https://doi.org/10.1007/0-387-25101-4_5, 2005. a, b, c
Field, P. R., Lawson, R. P., Brown, P. R. A., Lloyd, G., Westbrook, C., Moisseev, D., Miltenberger, A., Nenes, A., Blyth, A., Choularton, T., Connolly, P., Buehl, J., Crosier, J., Cui, Z., Dearden, C., DeMott, P., Flossmann, A., Heymsfield, A., Huang, Y., Kalesse, H., Kanji, Z. A., Korolev, A., Kirchgaessner, A., Lasher-Trapp, S., Leisner, T., McFarquhar, G., Phillips, V., Stith, J., and Sullivan, S.: Secondary Ice Production: Current State of the Science and Recommendations for the Future, Meteor. Mon., 58, 7.1–7.20, https://doi.org/10.1175/AMSMONOGRAPHS-D-16-0014.1, 2017. a, b
Filonchyk, M., Peterson, M. P., Hurynovich, V., Zhang, L., and He, Y.: Aerosol composition and properties in Antarctica: Optical, microphysical, and radiative characteristics, Global Planet. Change, 253, 104935, https://doi.org/10.1016/j.gloplacha.2025.104935, 2025. a, b
Fogal, P. F., LeBlanc, L. M., and Drummond, J. R.: The Polar Environment Atmospheric Research Laboratory (PEARL): Sounding the Atmosphere at 80° North, ARCTIC, 66, 377–386, https://doi.org/10.14430/arctic4321, number: 3, 2013. a
Gero, J., Garcia, R., Hackel, D., Ermold, B., and Gaustad, K.: Atmospheric Emitted Radiance Interferometer (AERICH1), 2015-12-01 to 2016-12-29, ARM Mobile Facility (AWR), McMurdo Station Ross Ice Shelf, Antarctica; AMF2 (M1), Atmospheric Radiation Measurement (ARM) user facility, https://doi.org/10.5439/1989299, 2016. a
Grenfell, T. C. and Warren, S. G.: Representation of a nonspherical ice particle by a collection of independent spheres for scattering and absorption of radiation, J. Geophys. Res.-Atmos., 104, 31697–31709, https://doi.org/10.1029/1999JD900496, 1999. a
Hansen, J. E. and Travis, L. D.: Light scattering in planetary atmospheres, Space Sci. Rev., 16, 527–610, https://doi.org/10.1007/BF00168069, 1974. a
Harries, J., Carli, B., Rizzi, R., Serio, C., Mlynczak, M., Palchetti, L., Maestri, T., Brindley, H., and Masiello, G.: The Far-infrared Earth, Rev. Geophys., 46, https://doi.org/10.1029/2007RG000233, 2008. a
Herbert, R. J., Murray, B. J., Dobbie, S. J., and Koop, T.: Sensitivity of liquid clouds to homogenous freezing parameterizations, Geophys. Res. Lett., 42, 1599–1605, https://doi.org/10.1002/2014GL062729, 2015. a, b
Holz, R., Garcia, J., Schuman, E., Bambha, R., Ermold, B., Eloranta, E., and Garcia, J.: High Spectral Resolution Lidar (HSRL), 2015-11-29 to 2017-01-02, ARM Mobile Facility (AWR), McMurdo Station Ross Ice Shelf, Antarctica; AMF2 (M1), Atmospheric Radiation Measurement (ARM) user facility, https://doi.org/10.5439/1462207, 2016. a
Holz, R. E., Ackerman, S., Antonelli, P., Nagle, F., Knuteson, R. O., McGill, M., Hlavka, D. L., and Hart, W. D.: An Improvement to the High-Spectral-Resolution CO2-Slicing Cloud-Top Altitude Retrieval, J. Atmos. Ocean. Tech., 23, 653–670, https://doi.org/10.1175/JTECH1877.1, 2006. a
Hong, S.-b., Yoon, Y. J., Becagli, S., Gim, Y., Chambers, S. D., Park, K.-T., Park, S.-J., Traversi, R., Severi, M., Vitale, V., Kim, J.-H., Jang, E., Crawford, J., and Griffiths, A. D.: Seasonality of aerosol chemical composition at King Sejong Station (Antarctic Peninsula) in 2013, Atmos. Environ., 223, 117185, https://doi.org/10.1016/j.atmosenv.2019.117185, 2020. a
Hung, J., Rowe, P. M., Cox, C. J., McCullough, E. M., Kroll, L., Ottenheimer, R., Shupe, M. D., Walden, V. P., and Strong, K.: Replication Data for: Differences in cloud optical and microphysical properties in the Arctic and Antarctic derived using thermal infrared spectroscopy, Borealis [data set], https://doi.org/10.5683/SP3/XSH1IJ, 2026. a
IPCC: Climate Change 2021: The Physical Science Basis. Contribution of Working Group I to the Sixth Assessment Report of the Intergovernmental Panel on Climate Change, Cambridge University Press, Cambridge, UK and New York, NY, USA, https://www.ipcc.ch/report/ar6/wg1/downloads/report/IPCC_AR6_WGI_FullReport.pdf (last access: 10 November 2026), 2021. a, b
Jensen, M. P., Holdridge, D. J., Survo, P., Lehtinen, R., Baxter, S., Toto, T., and Johnson, K. L.: Comparison of Vaisala radiosondes RS41 and RS92 at the ARM Southern Great Plains site, Atmos. Meas. Tech., 9, 3115–3129, https://doi.org/10.5194/amt-9-3115-2016, 2016. a
Jimenez, C., Ansmann, A., Ohneiser, K., Griesche, H., Engelmann, R., Radenz, M., Hofer, J., Althausen, D., Knopf, D. A., Dahlke, S., Bühl, J., Baars, H., Seifert, P., and Wandinger, U.: MOSAiC studies of long-lasting mixed-phase cloud events and analysis of the liquid-phase properties of Arctic clouds, Atmos. Chem. Phys., 25, 12955–12981, https://doi.org/10.5194/acp-25-12955-2025, 2025. a
Joseph, E. and Wang, W.-C.: An interactive cirrus cloud radiative parameterization for global climate models, J. Geophys. Res.-Atmos., 104, 9501–9515, https://doi.org/10.1029/1999JD900026, 1999. a
Karlsson, J. and Svensson, G.: Consequences of poor representation of Arctic sea-ice albedo and cloud-radiation interactions in the CMIP5 model ensemble, Geophys. Res. Lett., 40, 4374–4379, https://doi.org/10.1002/grl.50768, 2013. a
Knuteson, R. O., Revercomb, H. E., Best, F. A., Ciganovich, N. C., Dedecker, R. G., Dirkx, T. P., Ellington, S. C., Feltz, W. F., Garcia, R. K., Howell, H. B., Smith, W. L., Short, J. F., and Tobin, D. C.: Atmospheric Emitted Radiance Interferometer. Part I: Instrument Design, J. Atmos. Ocean. Tech., 21, 1763–1776, https://doi.org/10.1175/JTECH-1662.1, 2004a. a, b
Knuteson, R. O., Revercomb, H. E., Best, F. A., Ciganovich, N. C., Dedecker, R. G., Dirkx, T. P., Ellington, S. C., Feltz, W. F., Garcia, R. K., Howell, H. B., Smith, W. L., Short, J. F., and Tobin, D. C.: Atmospheric Emitted Radiance Interferometer. Part II: Instrument Performance, J. Atmos. Ocean. Tech., 21, 1777–1789, https://doi.org/10.1175/JTECH-1663.1, 2004b. a, b
Korolev, A., McFarquhar, G., Field, P. R., Franklin, C., Lawson, P., Wang, Z., Williams, E., Abel, S. J., Axisa, D., Borrmann, S., Crosier, J., Fugal, J., Krämer, M., Lohmann, U., Schlenczek, O., Schnaiter, M., and Wendisch, M.: Mixed-Phase Clouds: Progress and Challenges, Meteorol. Mon., 58, 5.1–5.50, https://doi.org/10.1175/AMSMONOGRAPHS-D-17-0001.1, 2017. a
Lee, K.-H., Lee, K.-T., Zo, I.-S., Jee, J.-B., Kim, K., and Lee, D.: Evolving patterns of arctic aerosols and the influence of regional variations over two decades, Sci. Total Environ., 957, 177465, https://doi.org/10.1016/j.scitotenv.2024.177465, 2024. a
Lesins, G., Duck, T. J., and Drummond, J. R.: Climate trends at Eureka in the Canadian high arctic, Atmos. Ocean , 48, 59–80, https://doi.org/10.3137/AO1103.2010, 2010. a
Libois, Q. and Blanchet, J.-P.: Added value of far-infrared radiometry for remote sensing of ice clouds, J. Geophys. Res.-Atmos., 122, 6541–6564, https://doi.org/10.1002/2016JD026423, 2017. a, b, c, d
Libois, Q., Ivanescu, L., Blanchet, J.-P., Schulz, H., Bozem, H., Leaitch, W. R., Burkart, J., Abbatt, J. P. D., Herber, A. B., Aliabadi, A. A., and Girard, É.: Airborne observations of far-infrared upwelling radiance in the Arctic, Atmos. Chem. Phys., 16, 15689–15707, https://doi.org/10.5194/acp-16-15689-2016, 2016a. a, b
Libois, Q., Proulx, C., Ivanescu, L., Coursol, L., Pelletier, L. S., Bouzid, Y., Barbero, F., Girard, É., and Blanchet, J.-P.: A microbolometer-based far infrared radiometer to study thin ice clouds in the Arctic, Atmos. Meas. Tech., 9, 1817–1832, https://doi.org/10.5194/amt-9-1817-2016, 2016b. a, b
Liu, J., Song, M., Horton, R. M., and Hu, Y.: Reducing spread in climate model projections of a September ice-free Arctic, P. Natl. Acad. Sci. USA, 110, 12571–12576, https://doi.org/10.1073/pnas.1219716110, 2013. a
Liu, J., Dedrick, J., Russell, L. M., Senum, G. I., Uin, J., Kuang, C., Springston, S. R., Leaitch, W. R., Aiken, A. C., and Lubin, D.: High summertime aerosol organic functional group concentrations from marine and seabird sources at Ross Island, Antarctica, during AWARE, Atmos. Chem. Phys., 18, 8571–8587, https://doi.org/10.5194/acp-18-8571-2018, 2018. a
Lohmann, U., Henneberger, J., Henneberg, O., Fugal, J. P., Bühl, J., and Kanji, Z. A.: Persistence of orographic mixed-phase clouds, Geophys. Res. Lett., 43, 10512–10519, https://doi.org/10.1002/2016GL071036, 2016. a
Lubin, D.: Thermodynamic phase of maritime Antarctic clouds from FTIR and supplementary radiometric data, J. Geophys. Res.-Atmos., 109, https://doi.org/10.1029/2003JD003979, a, 2004. a
Lubin, D. and Harper, D. A.: Cloud Radiative Properties over the South Pole from AVHRR Infrared Data, J. Climate, 9, 3405–3418, https://doi.org/10.1175/1520-0442(1996)009<3405:CRPOTS>2.0.CO;2, 1996. a
Lubin, D., Zhang, D., Silber, I., Scott, R. C., Kalogeras, P., Battaglia, A., Bromwich, D. H., Cadeddu, M., Eloranta, E., Fridlind, A., Frossard, A., Hines, K. M., Kneifel, S., Leaitch, W. R., Lin, W., Nicolas, J., Powers, H., Quinn, P. K., Rowe, P., Russell, L. M., Sharma, S., Verlinde, J., and Vogelmann, A. M.: AWARE: The Atmospheric Radiation Measurement (ARM) West Antarctic Radiation Experiment, B. Am. Meteorol. Soc., 101, E1069–E1091, https://doi.org/10.1175/BAMS-D-18-0278.1, 2020. a, b, c, d, e, f, g, h, i, j, k, l
Maestri, T. and Holz, R. E.: Retrieval of Cloud Optical Properties From Multiple Infrared Hyperspectral Measurements: A Methodology Based on a Line-by-Line Multiple-Scattering Code, IEEE T. Geosci. Remote, 47, 2413–2426, https://doi.org/10.1109/TGRS.2009.2016105, 2009. a
Maestri, T., Rizzi, R., Tosi, E., Veglio, P., Palchetti, L., Bianchini, G., Di Girolamo, P., Masiello, G., Serio, C., and Summa, D.: Analysis of cirrus cloud spectral signatures in the far infrared, J. Quant. Spectrosc. Ra., 141, 49–64, https://doi.org/10.1016/j.jqsrt.2014.02.030, 2014. a
Maestri, T., Arosio, C., Rizzi, R., Palchetti, L., Bianchini, G., and Del Guasta, M.: Antarctic Ice Cloud Identification and Properties Using Downwelling Spectral Radiance From 100 to 1,400 cm−1, J. Geophys. Res.-Atmos., 124, 4761–4781, https://doi.org/10.1029/2018JD029205, 2019. a, b
Mahesh, A., Walden, V. P., and Warren, S. G.: Ground-Based Infrared Remote Sensing of Cloud Properties over the Antarctic Plateau. Part I: Cloud-Base Heights, J. Appl. Meteorol. Clim., 40, 1265–1278, https://doi.org/10.1175/1520-0450(2001)040<1265:GBIRSO>2.0.CO;2, 2001. a, b, c
Mariani, Z., Strong, K., Wolff, M., Rowe, P., Walden, V., Fogal, P. F., Duck, T., Lesins, G., Turner, D. S., Cox, C., Eloranta, E., Drummond, J. R., Roy, C., Turner, D. D., Hudak, D., and Lindenmaier, I. A.: Infrared measurements in the Arctic using two Atmospheric Emitted Radiance Interferometers, Atmos. Meas. Tech., 5, 329–344, https://doi.org/10.5194/amt-5-329-2012, 2012. a, b
Marsh, D. R., Mills, M. J., Kinnison, D. E., Lamarque, J.-F., Calvo, N., and Polvani, L. M.: Climate Change from 1850 to 2005 Simulated in CESM1(WACCM), J. Climate, 26, 7372–7391, https://doi.org/10.1175/JCLI-D-12-00558.1, 2013. a, b
McCluskey, C. S., Hill, T. C. J., Humphries, R. S., Rauker, A. M., Moreau, S., Strutton, P. G., Chambers, S. D., Williams, A. G., McRobert, I., Ward, J., Keywood, M. D., Harnwell, J., Ponsonby, W., Loh, Z. M., Krummel, P. B., Protat, A., Kreidenweis, S. M., and DeMott, P. J.: Observations of Ice Nucleating Particles Over Southern Ocean Waters, Geophysical Res. Lett., 45, 11989–11997, https://doi.org/10.1029/2018GL079981, 2018. a
McCullough, E. M., Sica, R. J., Drummond, J. R., Nott, G., Perro, C., Thackray, C. P., Hopper, J., Doyle, J., Duck, T. J., and Walker, K. A.: Depolarization calibration and measurements using the CANDAC Rayleigh–Mie–Raman lidar at Eureka, Canada, Atmos. Meas. Tech., 10, 4253–4277, https://doi.org/10.5194/amt-10-4253-2017, 2017. a, b
McCullough, E. M., Drummond, J. R., and Duck, T. J.: Lidar measurements of thin laminations within Arctic clouds, Atmos. Chem. Phys., 19, 4595–4614, https://doi.org/10.5194/acp-19-4595-2019, 2019. a
McFarquhar, G. M., Baumgardner, D., Bansemer, A., Abel, S. J., Crosier, J., French, J., Rosenberg, P., Korolev, A., Schwarzoenboeck, A., Leroy, D., Um, J., Wu, W., Heymsfield, A. J., Twohy, C., Detwiler, A., Field, P., Neumann, A., Cotton, R., Axisa, D., and Dong, J.: Processing of Ice Cloud In Situ Data Collected by Bulk Water, Scattering, and Imaging Probes: Fundamentals, Uncertainties, and Efforts toward Consistency, Meteor. Mon., 58, 11.1–11.33, https://doi.org/10.1175/AMSMONOGRAPHS-D-16-0007.1, 2017. a
Menzel, W. P., Smith, W. L., and Stewart, T. R.: Improved Cloud Motion Wind Vector and Altitude Assignment Using VAS, J. Appl. Meteorol. Clim., 22, 377–384, https://doi.org/10.1175/1520-0450(1983)022<0377:ICMWVA>2.0.CO;2, 1983. a
Miloshevich, L. M., Vömel, H., Whiteman, D. N., and Leblanc, T.: Accuracy assessment and correction of Vaisala RS92 radiosonde water vapor measurements, J. Geophys. Res.-Atmos., 114, https://doi.org/10.1029/2008JD011565, 2009. a
Morrison, H., de Boer, G., Feingold, G., Harrington, J., Shupe, M. D., and Sulia, K.: Resilience of persistent Arctic mixed-phase clouds, Nat. Geosci., 5, 11–17, https://doi.org/10.1038/ngeo1332, 2012. a, b, c, d
Mossop, S. C. and Hallett, J.: Ice Crystal Concentration in Cumulus Clouds: Influence of the Drop Spectrum, Science, 186, 632–634, https://doi.org/10.1126/science.186.4164.632, 1974. a
Nakanishi, M. and Michibata, T.: How Does Cloud Emissivity Feedback Affect Present and Future Arctic Warming?, Ocean-Land-Atmosphere Research, 4, 0089, https://doi.org/10.34133/olar.0089, 2025. a
Naud, C., Russell, J. E., and Harries, J. E.: Remote sensing of cirrus cloud properties in the far infrared, in: Remote Sensing of Clouds and the Atmosphere V, Proc. SPIE, 4168, 30–38, https://doi.org/10.1117/12.413868, 2001. a, b
Neshyba, S. P., Grenfell, T. C., and Warren, S. G.: Representation of a nonspherical ice particle by a collection of independent spheres for scattering and absorption of radiation: 2. Hexagonal columns and plates, J. Geophys. Res.-Atmos., 108, https://doi.org/10.1029/2002JD003302, 2003. a
Nott, G. J., Duck, T. J., Doyle, J. G., Coffin, M. E. W., Perro, C., Thackray, C. P., Drummond, J. R., Fogal, P. F., McCullough, E., and Sica, R. J.: A Remotely Operated Lidar for Aerosol, Temperature, and Water Vapor Profiling in the High Arctic, J. Atmos. Ocean. Tech., 29, 221–234, https://doi.org/10.1175/JTECH-D-11-00046.1, 2012. a, b
Pasquier, J. T., Henneberger, J., Ramelli, F., Lauber, A., David, R. O., Wieder, J., Carlsen, T., Gierens, R., Maturilli, M., and Lohmann, U.: Conditions favorable for secondary ice production in Arctic mixed-phase clouds, Atmos. Chem. Phys., 22, 15579–15601, https://doi.org/10.5194/acp-22-15579-2022, 2022. a
Pithan, F. and Mauritsen, T.: Arctic amplification dominated by temperature feedbacks in contemporary climate models, Nat. Geosci., 7, 181–184, https://doi.org/10.1038/ngeo2071, 2014. a
Prince, H. D. and L'Ecuyer, T. S.: Observed Energetic Adjustment of the Arctic and Antarctic in a Warming World, J. Climate, 37, 2611–2627, https://doi.org/10.1175/JCLI-D-23-0294.1, 2024. a
Rangno, A. L. and Hobbs, P. V.: Ice particles in stratiform clouds in the Arctic and possible mechanisms for the production of high ice concentrations, J. Geophys. Res.-Atmos., 106, 15 065–15 075, https://doi.org/10.1029/2000JD900286, 2001. a
Rantanen, M., Karpechko, A. Y., Lipponen, A., Nordling, K., Hyvärinen, O., Ruosteenoja, K., Vihma, T., and Laaksonen, A.: The Arctic has warmed nearly four times faster than the globe since 1979, Communications Earth & Environment, 3, 168, https://doi.org/10.1038/s43247-022-00498-3, 2022. a
Rathke, C. and Fischer, J.: Retrieval of Cloud Microphysical Properties from Thermal Infrared Observations by a Fast Iterative Radiance Fitting Method, J. Atmos. Ocean. Tech., 17, 1509–1524, https://doi.org/10.1175/1520-0426(2000)017<1509:ROCMPF>2.0.CO;2, 2000. a
Rathke, C., Fischer, J., Neshyba, S., and Shupe, M.: Improving IR cloud phase determination with 20 microns spectral observations, Geophys. Res. Lett., 29, 50-1–50-4, https://doi.org/10.1029/2001GL014594, 2002. a
Richter, P., Palm, M., Weinzierl, C., Griesche, H., Rowe, P. M., and Notholt, J.: A dataset of microphysical cloud parameters, retrieved from Fourier-transform infrared (FTIR) emission spectra measured in Arctic summer 2017, Earth Syst. Sci. Data, 14, 2767–2784, https://doi.org/10.5194/essd-14-2767-2022, 2022. a, b, c, d, e, f
Rodgers, C. D.: Inverse Methods for Atmospheric Sounding: Theory and Practice, World Scientific, ISBN 978-981-02-2740-1 978-981-281-371-8, https://doi.org/10.1142/3171, 2000. a
Rothman, L., Gordon, I., Babikov, Y., Barbe, A., Chris Benner, D., Bernath, P., Birk, M., Bizzocchi, L., Boudon, V., Brown, L., Campargue, A., Chance, K., Cohen, E., Coudert, L., Devi, V., Drouin, B., Fayt, A., Flaud, J.-M., Gamache, R., Harrison, J., Hartmann, J.-M., Hill, C., Hodges, J., Jacquemart, D., Jolly, A., Lamouroux, J., Le Roy, R., Li, G., Long, D., Lyulin, O., Mackie, C., Massie, S., Mikhailenko, S., Müller, H., Naumenko, O., Nikitin, A., Orphal, J., Perevalov, V., Perrin, A., Polovtseva, E., Richard, C., Smith, M., Starikova, E., Sung, K., Tashkun, S., Tennyson, J., Toon, G., Tyuterev, V., and Wagner, G.: The HITRAN2012 molecular spectroscopic database, J. Quant. Spectrosc. Ra., 130, 4–50, https://doi.org/10.1016/j.jqsrt.2013.07.002, 2013. a
Rowe, P. M., Neshyba, S., and Walden, V. P.: Radiative consequences of low-temperature infrared refractive indices for supercooled water clouds, Atmos. Chem. Phys., 13, 11925–11933, https://doi.org/10.5194/acp-13-11925-2013, 2013. a, b
Rowe, P. M., Cox, C. J., and Walden, V. P.: Toward autonomous surface-based infrared remote sensing of polar clouds: cloud-height retrievals, Atmos. Meas. Tech., 9, 3641–3659, https://doi.org/10.5194/amt-9-3641-2016, 2016. a, b, c
Rowe, P. M., Cox, C. J., Neshyba, S., and Walden, V. P.: Toward autonomous surface-based infrared remote sensing of polar clouds: retrievals of cloud optical and microphysical properties, Atmos. Meas. Tech., 12, 5071–5086, https://doi.org/10.5194/amt-12-5071-2019, 2019. a, b, c, d, e, f, g, h, i
Rowe, P. M., Fergoda, M., and Neshyba, S.: Temperature-Dependent Optical Properties of Liquid Water From 240 to 298 K, J. Geophys. Res.-Atmos., 125, e2020JD032624, https://doi.org/10.1029/2020JD032624, 2020. a
Rowe, P. M., Zou, X., Gorodetskaya, I., Stillwell, R. A., Cordero, R. R., Bromwich, D., Zhang, Z., Ralph, F. M., and Neshyba, S.: Comparison of Cloud and Radiation Measurements to Models Over the Southern Ocean at Escudero Station, King George Island, J. Geophys. Res.-Atmos., 130, e2025JD043563, https://doi.org/10.1029/2025JD043563, 2025a. a
Rowe, P. M., Zou, X., Gorodetskaya, I., Stillwell, R. A., Cordero, R. R., Sepulveda, E., Bromwich, D. H., Zhang, Z., Ralph, F. M., and Neshyba, S.: Observations of Clouds and Radiation Over King George Island and Implications for the Southern Ocean and Antarctica, J. Geophys. Res.-Atmos., 130, e2024JD042787, https://doi.org/10.1029/2024JD042787, 2025b. a
Schäfer, B., David, R. O., Georgakaki, P., Pasquier, J. T., Sotiropoulou, G., and Storelvmo, T.: Simulations of primary and secondary ice production during an Arctic mixed-phase cloud case from the Ny-Ålesund Aerosol Cloud Experiment (NASCENT) campaign, Atmos. Chem. Phys., 24, 7179–7202, https://doi.org/10.5194/acp-24-7179-2024, 2024. a
Schuddeboom, A. J. and McDonald, A. J.: The Southern Ocean Radiative Bias, Cloud Compensating Errors, and Equilibrium Climate Sensitivity in CMIP6 Models, J. Geophys. Res.-Atmos., 126, e2021JD035310, https://doi.org/10.1029/2021JD035310, 2021. a
Seneviratne, S. I. and Hauser, M.: Regional Climate Sensitivity of Climate Extremes in CMIP6 Versus CMIP5 Multimodel Ensembles, Earth's Future, 8, e2019EF001474, https://doi.org/10.1029/2019EF001474, 2020. a
Shupe, M. D.: Clouds at Arctic Atmospheric Observatories. Part II: Thermodynamic Phase Characteristics, J. Appl. Meteorol. Clim., 50, 645–661, https://doi.org/10.1175/2010JAMC2468.1, 2011. a
Shupe, M. D. and Intrieri, J. M.: Cloud Radiative Forcing of the Arctic Surface: The Influence of Cloud Properties, Surface Albedo, and Solar Zenith Angle, J. Climate, 17, 616–628, https://doi.org/10.1175/1520-0442(2004)017<0616:CRFOTA>2.0.CO;2, 2004. a
Shupe, M. D., Uttal, T., and Matrosov, S. Y.: Arctic Cloud Microphysics Retrievals from Surface-Based Remote Sensors at SHEBA, J. Appl. Meteorol. Clim., 44, 1544–1562, https://doi.org/10.1175/JAM2297.1, 2005. a, b, c
Shupe, M. D., Walden, V. P., Eloranta, E., Uttal, T., Campbell, J. R., Starkweather, S. M., and Shiobara, M.: Clouds at Arctic Atmospheric Observatories. Part I: Occurrence and Macrophysical Properties, J. Appl. Meteorol. Clim., 50, 626–644, https://doi.org/10.1175/2010JAMC2467.1, 2011. a, b, c, d, e, f, g, h
Shupe, M. D., Turner, D. D., Walden, V. P., Bennartz, R., Cadeddu, M. P., Castellani, B. B., Cox, C. J., Hudak, D. R., Kulie, M. S., Miller, N. B., Neely, R. R., Neff, W. D., and Rowe, P. M.: High and Dry: New Observations of Tropospheric and Cloud Properties above the Greenland Ice Sheet, B. Am. Meteorol. Soc., 94, 169–186, https://doi.org/10.1175/BAMS-D-11-00249.1, 2013. a
Shupe, M. D., Turner, D. D., Zwink, A., Thieman, M. M., Mlawer, E. J., and Shippert, T.: Deriving Arctic Cloud Microphysics at Barrow, Alaska: Algorithms, Results, and Radiative Closure, J. Appl. Meteorol. Clim., 54, 1675–1689, https://doi.org/10.1175/JAMC-D-15-0054.1, 2015. a, b, c, d, e, f
Silber, I., Verlinde, J., Eloranta, E. W., and Cadeddu, M.: Antarctic Cloud Macrophysical, Thermodynamic Phase, and Atmospheric Inversion Coupling Properties at McMurdo Station: I. Principal Data Processing and Climatology, J. Geophys. Res.-Atmos., 123, 6099–6121, https://doi.org/10.1029/2018JD028279, 2018. a, b, c
Stamnes, K., Tsay, S.-C., Wiscombe, W., and Jayaweera, K.: Numerically stable algorithm for discrete-ordinate-method radiative transfer in multiple scattering and emitting layered media, Appl. Optics, 27, 2502–2509, https://doi.org/10.1364/AO.27.002502, 1988. a
Sun, Z. and Shine, K. P.: Studies of the radiative properties of ice and mixed-phase clouds, Q. J. Roy. Meteor. Soc., 120, 111–137, https://doi.org/10.1002/qj.49712051508, 1994. a
Takahashi, T.: Influence of Liquid Water Content and Temperature on the Form and Growth of Branched Planar Snow Crystals in a Cloud, J. Atmos. Sci., 71, 4127–4142, https://doi.org/10.1175/JAS-D-14-0043.1, 2014. a
Tan, I., Storelvmo, T., and Choi, Y.-S.: Spaceborne lidar observations of the ice-nucleating potential of dust, polluted dust, and smoke aerosols in mixed-phase clouds, J. Geophys. Res.-Atmos., 119, 6653–6665, https://doi.org/10.1002/2013JD021333, 2014. a
Tan, I., Oreopoulos, L., and Cho, N.: The Role of Thermodynamic Phase Shifts in Cloud Optical Depth Variations With Temperature, Geophys. Res. Lett., 46, 4502–4511, https://doi.org/10.1029/2018GL081590, 2019. a
Turner, D. D.: Arctic Mixed-Phase Cloud Properties from AERI Lidar Observations: Algorithm and Results from SHEBA, J. Appl. Meteorol. Clim., 44, 427–444, https://doi.org/10.1175/JAM2208.1, 2005. a, b, c, d, e, f, g, h, i, j, k
Turner, D. D. and Blumberg, W. G.: Improvements to the AERIoe Thermodynamic Profile Retrieval Algorithm, IEEE Journal of Selected Topics in Applied Earth Observations and Remote Sensing, 12, 1339–1354, https://doi.org/10.1109/JSTARS.2018.2874968, 2019. a, b
Turner, D. D. and Eloranta, E. W.: Validating Mixed-Phase Cloud Optical Depth Retrieved From Infrared Observations With High Spectral Resolution Lidar, IEEE Geosci. Remote S., 5, 285–288, https://doi.org/10.1109/LGRS.2008.915940, 2008. a, b, c
Uttal, T., Starkweather, S., Drummond, J. R., Vihma, T., Makshtas, A. P., Darby, L. S., Burkhart, J. F., Cox, C. J., Schmeisser, L. N., Haiden, T., Maturilli, M., Shupe, M. D., Boer, G. D., Saha, A., Grachev, A. A., Crepinsek, S. M., Bruhwiler, L., Goodison, B., McArthur, B., Walden, V. P., Dlugokencky, E. J., Persson, P. O. G., Lesins, G., Laurila, T., Ogren, J. A., Stone, R., Long, C. N., Sharma, S., Massling, A., Turner, D. D., Stanitski, D. M., Asmi, E., Aurela, M., Skov, H., Eleftheriadis, K., Virkkula, A., Platt, A., Førland, E. J., Iijima, Y., Nielsen, I. E., Bergin, M. H., Candlish, L., Zimov, N. S., Zimov, S. A., O'Neill, N. T., Fogal, P. F., Kivi, R., Konopleva-Akish, E. A., Verlinde, J., Kustov, V. Y., Vasel, B., Ivakhov, V. M., Viisanen, Y., and Intrieri, J. M.: International Arctic Systems for Observing the Atmosphere: An International Polar Year Legacy Consortium, B. Am. Meteorol. Soc., 97, 1033–1056, https://doi.org/10.1175/BAMS-D-14-00145.1, 2016. a
van den Broeke, M., Box, J., Fettweis, X., Hanna, E., Noël, B., Tedesco, M., van As, D., van de Berg, W. J., and van Kampenhout, L.: Greenland Ice Sheet Surface Mass Loss: Recent Developments in Observation and Modeling, Current Climate Change Reports, 3, 345–356, https://doi.org/10.1007/s40641-017-0084-8, 2017. a
Vavrus, S.: The Impact of Cloud Feedbacks on Arctic Climate under Greenhouse Forcing, J. Climate, 17, 603–615, https://doi.org/10.1175/1520-0442(2004)017<0603:TIOCFO>2.0.CO;2, 2004. a
Vergara-Temprado, J., Holden, M. A., Orton, T. R., O'Sullivan, D., Umo, N. S., Browse, J., Reddington, C., Baeza-Romero, M. T., Jones, J. M., Lea-Langton, A., Williams, A., Carslaw, K. S., and Murray, B. J.: Is Black Carbon an Unimportant Ice-Nucleating Particle in Mixed-Phase Clouds?, J. Geophys. Res.-Atmos., 123, 4273–4283, https://doi.org/10.1002/2017JD027831, 2018. a
Verlinde, J., Harrington, J. Y., McFarquhar, G. M., Yannuzzi, V. T., Avramov, A., Greenberg, S., Johnson, N., Zhang, G., Poellot, M. R., Mather, J. H., Turner, D. D., Eloranta, E. W., Zak, B. D., Prenni, A. J., Daniel, J. S., Kok, G. L., Tobin, D. C., Holz, R., Sassen, K., Spangenberg, D., Minnis, P., Tooman, T. P., Ivey, M. D., Richardson, S. J., Bahrmann, C. P., Shupe, M., DeMott, P. J., Heymsfield, A. J., and Schofield, R.: The Mixed-Phase Arctic Cloud Experiment, B. Am. Meteorol. Soc., 88, 205–222, https://doi.org/10.1175/BAMS-88-2-205, 2007. a, b
Walden, V. P., Warren, S. G., and Tuttle, E.: Atmospheric Ice Crystals over the Antarctic Plateau in Winter, J. Appl. Meteorol. Clim., 42, 1391–1405, https://doi.org/10.1175/1520-0450(2003)042<1391:AICOTA>2.0.CO;2, 2003. a
Wall, C. J., Paynter, D., Qin, Y., Debolskiy, M., Duffy, M. L., Michibata, T., Duran, B. M., Lutsko, N. J., Ma, P.-L., Medeiros, B., Storelvmo, T., and Zhao, M.: Decomposing Cloud Radiative Feedbacks by Cloud-Top Phase, J. Climate, 38, 4023–4043, https://doi.org/10.1175/JCLI-D-24-0538.1, 2025. a
Waman, D., Patade, S., Jadav, A., Deshmukh, A., Gupta, A. K., Phillips, V. T. J., Bansemer, A., and DeMott, P. J.: Dependencies of Four Mechanisms of Secondary Ice Production on Cloud-Top Temperature in a Continental Convective Storm, J. Atmos. Sci., 79, 3375–3404, https://doi.org/10.1175/JAS-D-21-0278.1, 2022. a
Weaver, D., Strong, K., Schneider, M., Rowe, P. M., Sioris, C., Walker, K. A., Mariani, Z., Uttal, T., McElroy, C. T., Vömel, H., Spassiani, A., and Drummond, J. R.: Intercomparison of atmospheric water vapour measurements at a Canadian High Arctic site, Atmos. Meas. Tech., 10, 2851–2880, https://doi.org/10.5194/amt-10-2851-2017, 2017. a, b, c
Wendisch, M., Macke, A., Ehrlich, A., Lüpkes, C., Mech, M., Chechin, D., Dethloff, K., Velasco, C. B., Bozem, H., Brückner, M., Clemen, H.-C., Crewell, S., Donth, T., Dupuy, R., Ebell, K., Egerer, U., Engelmann, R., Engler, C., Eppers, O., Gehrmann, M., Gong, X., Gottschalk, M., Gourbeyre, C., Griesche, H., Hartmann, J., Hartmann, M., Heinold, B., Herber, A., Herrmann, H., Heygster, G., Hoor, P., Jafariserajehlou, S., Jäkel, E., Järvinen, E., Jourdan, O., Kästner, U., Kecorius, S., Knudsen, E. M., Köllner, F., Kretzschmar, J., Lelli, L., Leroy, D., Maturilli, M., Mei, L., Mertes, S., Mioche, G., Neuber, R., Nicolaus, M., Nomokonova, T., Notholt, J., Palm, M., Pinxteren, M. v., Quaas, J., Richter, P., Ruiz-Donoso, E., Schäfer, M., Schmieder, K., Schnaiter, M., Schneider, J., Schwarzenböck, A., Seifert, P., Shupe, M. D., Siebert, H., Spreen, G., Stapf, J., Stratmann, F., Vogl, T., Welti, A., Wex, H., Wiedensohler, A., Zanatta, M., and Zeppenfeld, S.: The Arctic Cloud Puzzle: Using ACLOUD/PASCAL Multiplatform Observations to Unravel the Role of Clouds and Aerosol Particles in Arctic Amplification, B. Am. Meteorol. Soc., 100, 841–871, https://doi.org/10.1175/BAMS-D-18-0072.1, 2019. a
Wesslén, C., Tjernström, M., Bromwich, D. H., de Boer, G., Ekman, A. M. L., Bai, L.-S., and Wang, S.-H.: The Arctic summer atmosphere: an evaluation of reanalyses using ASCOS data, Atmos. Chem. Phys., 14, 2605–2624, https://doi.org/10.5194/acp-14-2605-2014, 2014. a
Wex, H., Huang, L., Zhang, W., Hung, H., Traversi, R., Becagli, S., Sheesley, R. J., Moffett, C. E., Barrett, T. E., Bossi, R., Skov, H., Hünerbein, A., Lubitz, J., Löffler, M., Linke, O., Hartmann, M., Herenz, P., and Stratmann, F.: Annual variability of ice-nucleating particle concentrations at different Arctic locations, Atmos. Chem. Phys., 19, 5293–5311, https://doi.org/10.5194/acp-19-5293-2019, 2019. a
Wilson, T. W., Ladino, L. A., Alpert, P. A., Breckels, M. N., Brooks, I. M., Browse, J., Burrows, S. M., Carslaw, K. S., Huffman, J. A., Judd, C., Kilthau, W. P., Mason, R. H., McFiggans, G., Miller, L. A., Nájera, J. J., Polishchuk, E., Rae, S., Schiller, C. L., Si, M., Temprado, J. V., Whale, T. F., Wong, J. P. S., Wurl, O., Yakobi-Hancock, J. D., Abbatt, J. P. D., Aller, J. Y., Bertram, A. K., Knopf, D. A., and Murray, B. J.: A marine biogenic source of atmospheric ice-nucleating particles, Nature, 525, 234–238, https://doi.org/10.1038/nature14986, 2015. a, b
Wizenberg, T., Strong, K., Jones, D. B. A., Hannigan, J. W., Ortega, I., and Mahieu, E.: Measured and Modeled Trends of Seven Tropospheric Pollutants in the High Arctic From 1999 to 2022, J. Geophys. Res.-Atmos., 129, e2023JD040544, https://doi.org/10.1029/2023JD040544, 2024. a, b
Wood, S. E., Baker, M. B., and Swanson, B. D.: Instrument for studies of homogeneous and heterogeneous ice nucleation in free-falling supercooled water droplets, Rev. Sci. Instrum., 73, 3988–3996, https://doi.org/10.1063/1.1511796, 2002. a
Xia, Z. and McFarquhar, G. M.: Dependence of Cloud Macrophysical Properties and Phase Distributions on Environmental Conditions Over the North Atlantic and Southern Ocean: Results From COMBLE and MARCUS, J. Geophys. Res.-Atmos., 129, e2023JD039 869, https://doi.org/10.1029/2023JD039869, 2024. a
Yang, P., Mlynczak, M. G., Wei, H., Kratz, D. P., Baum, B. A., Hu, Y. X., Wiscombe, W. J., Heidinger, A., and Mishchenko, M. I.: Spectral signature of ice clouds in the far-infrared region: Single-scattering calculations and radiative sensitivity study, J. Geophys. Res.-Atmos., 108, https://doi.org/10.1029/2002JD003291, 2003. a
Yang, P., Bi, L., Baum, B. A., Liou, K.-N., Kattawar, G. W., Mishchenko, M. I., and Cole, B.: Spectrally Consistent Scattering, Absorption, and Polarization Properties of Atmospheric Ice Crystals at Wavelengths from 0.2 to 100 µm, J. Atmos. Sci., 70, 330–347, https://doi.org/10.1175/JAS-D-12-039.1, 2013. a, b, c
Zhang, D., Vogelmann, A., Kollias, P., Luke, E., Yang, F., Lubin, D., and Wang, Z.: Comparison of Antarctic and Arctic Single-Layer Stratiform Mixed-Phase Cloud Properties Using Ground-Based Remote Sensing Measurements, J. Geophys. Res.-Atmos., 124, 10 186–10 204, https://doi.org/10.1029/2019JD030673, 2019. a, b, c, d, e, f, g
Zhao, X. and Liu, X.: Global Importance of Secondary Ice Production, Geophys. Res. Lett., 48, e2021GL092581, https://doi.org/10.1029/2021GL092581, 2021. a
Zhao, X., Liu, X., Burrows, S., DeMott, P. J., Diao, M., McFarquhar, G. M., Patade, S., Phillips, V., Roberts, G. C., Sanchez, K. J., Shi, Y., and Zhang, M.: Important Ice Processes Are Missed by the Community Earth System Model in Southern Ocean Mixed-Phase Clouds: Bridging SOCRATES Observations to Model Developments, J. Geophys. Res.-Atmos., 128, e2022JD037513, https://doi.org/10.1029/2022JD037513, 2023. a, b
Zhao, X., Liu, X., Lin, L., Qin, Y., Zelinka, M. D., Klein, S. A., Zhang, M., Zhang, K., Ma, P.-L., Zhu, J., Lu, Z., and Saravanan, R.: Larger Cloud Liquid Water Enhances Both Aerosol Indirect Forcing and Cloud Radiative Feedback in Two Earth System Models, Geophys. Res. Lett., 51, e2023GL105529, https://doi.org/10.1029/2023GL105529, 2024. a
- Abstract
- Introduction
- Data and Methods
- Results and Discussion
- Summary and Conclusions
- Appendix A: AERI radiometric quality control
- Appendix B: The effect of cloud height retrieval on retrieved properties
- Code and data availability
- Author contributions
- Competing interests
- Disclaimer
- Acknowledgements
- Financial support
- Review statement
- References
- Abstract
- Introduction
- Data and Methods
- Results and Discussion
- Summary and Conclusions
- Appendix A: AERI radiometric quality control
- Appendix B: The effect of cloud height retrieval on retrieved properties
- Code and data availability
- Author contributions
- Competing interests
- Disclaimer
- Acknowledgements
- Financial support
- Review statement
- References