
the Creative Commons Attribution 4.0 License.
the Creative Commons Attribution 4.0 License.
 | 16 Nov 2026
Mineral dust concentration controlling convective cirrus structure and persistence: a large-eddy simulation study with observational constraints
Kasper Juurikkala

Tomi Raatikainen
Martina Krämer
Christina J. Williamson
Ari Laaksonen
Dusty cirrus clouds are optically thick, convectively organized ice clouds that occur during intense mineral dust outbreaks. Previous modeling studies have found a link between mineral dust and convectively generated cirrus, but have been unable to explicitly resolve the associated convective dynamics due to limited spatial resolution. Here, we investigate the evolution and persistence of dusty cirrus using large-eddy simulations constrained by in-situ aircraft observations from the ML-CIRRUS 2014 campaign and complementary remote sensing data.
The simulations indicate that sustained convective cirrus requires mineral dust concentrations exceeding climatological values by approximately one to two orders of magnitude, corresponding to number concentrations on the order of ND∼1 cm−3. Under these conditions, heterogeneous freezing on mineral dust dominates ice formation and maintains sufficiently high ice crystal number concentrations to sustain strong longwave cooling at cloud top and preserve convective overturning under shortwave radiative warming. In contrast, homogeneous freezing remains largely suppressed across a wide range of simulated conditions. The direct radiative effect of mineral dust is comparatively weak relative to cloud radiative feedbacks and does not significantly influence cirrus evolution.
The simulated cirrus is also highly sensitive to the choice of deposition ice nucleation parameterization, highlighting a major source of uncertainty in representing dust–ice interactions. Overall, the results identify mineral dust availability as the primary control on dusty cirrus persistence and emphasize the need for improved representation of heterogeneous ice nucleation in atmospheric models.
- Article
(9071 KB) - Full-text XML
-
Supplement
(4650 KB) - BibTeX
- EndNote


Dusty cirrus clouds, commonly observed in the vicinity of major dust sources worldwide, with common examples in strong Saharan (Kollath, 2010; Weger et al., 2018; Seifert et al., 2023) or East Asian dust (Zeng et al., 2023) outbreaks, present a unique and complex phenomenon. These cirrus clouds have a particularly defined convectional cell structures covering large areas. Nagy (2009) reported that the convective cell structures are almost exclusively associated with presence of dust high in the troposphere. These systems are associated with dust-infused baroclinic storms (DIBS; Fromm et al., 2016) that transport vast amounts of dust into the upper troposphere. Dusty cirrus clouds are typically associated with significant optical thickness and can substantially modify the radiative balance, especially over Europe and Central Asia, where these events are often observed. The dust influence has been reported to extend cirrus cloud lifetimes via heterogeneous freezing (Ansmann et al., 2019) even though heterogeneous freezing has usually been associated with decreased lifetimes of cirrus (e.g. Storelvmo et al., 2014; Gruber et al., 2019).
Current numerical weather prediction (NWP) models struggle to simulate dusty cirrus events accurately due to their limited ability to predict real-time mineral dust distributions and lacking cloud-aerosol interaction schemes. There are current efforts on building frameworks that would allow the dust-ice interaction to be implemented in NWP models such as European Centre for Medium-Range Weather Forecasts (ECMWF) Integrated Forecasting System (IFS) model. Seifert et al. (2023) proposed a dust-aware sub-grid parameterization scheme developed for ICOsahedral Nonhydrostatic model with Aerosol and Reactive Trace gases (ICON-ART) where they were able to simulate the formation of dusty cirrus for selected Saharan dust events and were thus able to substantially improve estimation of short- (SW) and longwave (LW) radiation fluxes that were observed with satellites. Regardless of the current understanding that the elevated dust levels is related to the presence of extensive cirrus layers, there is a need for more detailed investigations and improved parameterizations to enhance our understanding and predictive capabilities regarding these cloud systems.
In this study we use the UCLALES-SALSA (Calderón et al., 2025; Tonttila et al., 2017) model to simulate dusty cirrus clouds that were measured with in-situ instrumentation on the ML-CIRRUS 2014 campaign conducted with HALO aircraft on the 4 April. We focus on understanding governing factors controlling the evolution of dusty cirrus and exploring ways to improve large-scale model representation of these systems. UCLALES-SALSA enables simulations of microphysical processes at high resolution, especially convection that even regional models with kilometer-scale resolution (Rieger et al., 2017; Weger et al., 2018; Seifert et al., 2023) are not able to directly simulate and thus is a perfect tool for simulations of convectively driven dusty cirrus clouds.
We conduct a series of sensitivity simulations varying the mineral dust number concentrations (ND) from in-situ measured reference values to observe the conditions that allow the continuous extended lifetime of these dusty cirrus clouds. Additionally, the effects of radiative fluxes both of LW and SW radiation at the top of the cirrus clouds are explored in connection to the convective structures. We use remote sensing observations from cloud radar and satellite retrieval data to complement the in-situ observations.
2.1 UCLALES-SALSA
UCLALES-SALSA (v2.1) (Tonttila et al., 2017; Calderón et al., 2025) is a large-eddy simulation (LES) model combined with a sectional aerosol microphysics model SALSA (Sectional Aerosol module for Large-Scale Applications) (Kokkola et al., 2008, 2018) extended for liquid and ice clouds (Tonttila et al., 2017; Ahola et al., 2020). UCLALES is an atmospheric LES model based on the work of Stevens et al. (1999, 2005) that works as Eulerian large-eddy simulation where SALSA microphysics is applied locally within each model grid cell. The model domain thermodynamic state is initialized using a one-dimensional atmospheric sounding profile. A random perturbation is then subsequently applied to the temperature field, which initializes turbulent motions. Model boundaries are periodic in horizontal directions, which applies to both wind and scalar fields. Model top contains a sponge layer with adjustable number of Newton relaxation points.
The aerosols and hydrometeors including cloud droplets, drizzle/rain and ice in SALSA are described with a sectional bin treatment, a computationally heavy but accurate approach to simulate the aerosol-cloud interactions. The computation of particle growth by condensation and deposition is based on theoretical descriptions without needing to rely on parametrized processes. SALSA has undergone several iterations after its implementation in the UCLALES model and now includes atmospheric processes from cloud droplet formation to ice nucleation and several secondary ice production processes including rime splintering, ice-ice collisional break up and droplet shattering (Calderón et al., 2025). Previously, the model has been used to explore ice nucleation processes in high altitude cirrus clouds (Juurikkala et al., 2025).
Aerosols and cloud droplets are represented using a dry-bin approach with two parallel bin structures, in which particle number and chemical composition are tracked according to dry particle size. The parallel binning allows two internally mixed aerosol populations to be tracked simultaneously, enabling the separate treatment of soluble and insoluble aerosol species. Aerosols are activated to cloud droplets when their wet diameter – which is calculated based on water condensed on dry particles – reaches the activation size, as determined using the κ-Köhler framework. Condensation of water vapor onto aerosol particles is governed by their water activity, which depends on the soluble material content. In the model, sulfate, organic, and nitrate aerosol components are treated as soluble, whereas dust and black carbon are treated as insoluble. When coagulation is enabled, aerosols occupying different parallel bins can undergo internal mixing, allowing the composition of the aerosol population to evolve. Ice and precipitation in SALSA are described with a single set of bins with particles assigned to each bin by their wet diameter. Turbulent mixing of particles is modeled using sub-grid scale Smagorinsky (Smagorinsky, 1963) model. Primary ice nucleation mechanisms described within the model are homogeneous freezing, immersion freezing, and deposition ice nucleation (DIN). In this study, we use the approach of Koop et al. (2000) for homogeneous freezing of aqueous solution droplets formed by water uptake onto soluble aerosol particles. This approach works as the particles participating in homogeneous freezing in SALSA are nanometer sized aqueous solution droplets. The DIN is described with deterministic schemes by Hiranuma et al. (2014) (hereafter H14), Ullrich et al. (2017) (hereafter U17), and Phillips et al. (2013) (hereafter P13). The deterministic heterogeneous freezing parameterizations (H14, U17 and P13) produce so called INAS (ice nucleation active site) densities (ns, m−2) that are temperature and relative humidity over ice (RHi) dependent. The frozen fraction of particles is then calculated for each particle size (Dp) using their corresponding surface area multiplied by INAS density as . Ice crystals are tracked in a single category bins spanning in range of 2 µm mm. An important feature of deterministic ice nucleation parameterization schemes is that the frozen fraction needs to be tracked precisely. The SALSA microphysics is therefore modified by adding the advection of frozen fraction as well as the reverse calculation of frozen fractions when sublimation of ice crystals back to the aerosol phase takes place. To simplify the tracking of frozen fractions in the model domain, we omit the sedimentation and coagulation of aerosols.
In this study, we use the updated size dependent ice-phase microphysics adopted in Juurikkala et al. (2025) where ice diameters smaller than 40 µm are treated as spherical ice and for larger sizes as 5-sided bullet rosettes. These bullet rosettes are typically the dominant type in cirrus clouds of in-situ origin (Lawson et al., 2019). For this study, we implemented the ventilation effect for ice crystals as described in Sölch and Kärcher (2010) and updated the terminal velocity calculation as Mitchell and Heymsfield (2005) described. The deposition coefficient (α) is set to α=0.2 which, according to Lamb et al. (2023), provides the best description of ice crystal growth at temperatures above 210 K and applies to the range of temperatures where the dusty cirrus formed on 4 April. The capacitance parameter is set to for ice crystals smaller than 20 µm and to for ice crystals larger than 50 µm based on Westbrook et al. (2008). The value for large ice crystals corresponds to bullet rosettes with 4-branches with aspect ratio in the order of 3–5 and with 6-branches in the order of 5–8 (Westbrook et al., 2008). In the intermediate range µm, C is set to the average between two size regimes to represent the presence of both spherical ice crystals and bullet rosettes.
For dust-ice cloud-radiation interactions, Fu and Liou (1993) based radiation solver is used where the solver calculates ice cloud interaction with radiation using model grid IWC and effective radius of ice (calculated from ICNC and IWC). For ice, the habit is not accounted in radiation interaction. Aerosol-radiation interaction on the other hand is calculated for each size bin and aerosol species.
For this study, a large-scale vertical velocity forcing scheme was utilized. It affects ice-liquid potential temperature, humidity, and scalar fields. The imposed large-scale vertical velocity produces tendency in the ice-liquid potential temperature profile representing the adiabatic cooling/warming associated with large-scale ascent/subsidence.
2.2 Observation data
Several observational datasets are used in this study to characterize the atmospheric state and the microphysical properties of the dusty cirrus cloud, each of which is subject to its own measurement uncertainties.
2.2.1 In-situ measurement data of aerosols and ice
A HALO aircraft research flight was conducted on 4 April 2014 as part of the ML-CIRRUS campaign (Voigt et al., 2017) targeting cirrus clouds over Western Europe. The HALO aircraft was equipped with multiple instruments that measured aerosols, ice properties, and meteorological conditions. This study uses aerosol measurements conducted with an optical particle counter (OPC GRIMM model 1.129). The OPC measures particles from 250 nm to 20 µm with the maximum size limited by the size of the aircraft inlet to 5 µm. The OPC measurements are used to derive the input dust size distributions (PSD) for SALSA with logarithmic fit functions. The ice crystal size distribution were measured using the combination of two instruments, NIXE-CAPS (CAS and CIP combined) (Meyer, 2012) and CCP. The CAS covers size ranges from 0.61 to 50 µm and thus measured both coarse size aerosols and smaller sizes of ice. On 4 April, the CIP instrument was not working and thus the CCP was used instead to measure size ranges from 50 to 945 µm. NIXE-CAPS measured both ice crystal number concentration (ICNC) and ice water content (IWC) based on the measured particle size distribution (PSD) which are used to evaluate the model ice nucleation. Sub-3 µm particles measure with CAS are considered aerosols, however, we do not use this aerosol information, but cover the entire relevant particle size range by using the OPC measurements. The NIXE-CAPS had an anti-shattering inlet to avoid counting of ice crystals produced by shattering (Krämer et al., 2020). For the meteorological state parameters, the Basic HALO Measurement and Sensor System (BAHAMAS, Giez et al., 2021; Krautstrunk and Giez, 2012) measurements are used. For more detailed analysis of instrumentation performance and measurement results, please refer to Weger et al. (2018).
2.2.2 Remote sensing data
Cloud radar data were obtained with the METEK MIRA-35C Doppler cloud radar deployed at the Environmental Research Station Schneefernerhaus (UFS), Germany 47.417° N, 10.977° E; 2650 m a.s.l.) (location shown in Fig. 1b). The MIRA-35C is a high-sensitivity Ka-band (35 GHz) cloud radar. It employs a pulsed magnetron transmitter with a peak power of 30 kW and supports polarimetric measurements, enabling the derivation of parameters such as radar reflectivity, Doppler velocity and linear depolarization ratio (LDR). The post-processed radar data is provided from the Cloudnet data portal, a cloud remote sensing data repository within the Aerosol, Clouds and Trace Gases Research Infrastructure (ACTRIS). The dataset used in this study is described in Ewald et al. (2026). The Cloudnet processing framework applies a synergistic retrieval approach (Illingworth et al., 2007; Tukiainen et al., 2020), combining measurements from cloud radar, lidar, and microwave radiometer with thermodynamic profiles provided by the European Centre for Medium-Range Weather Forecasts (ECMWF) model. The key microphysical product used in this study is IWC which is retrieved in Cloudnet using the so-called Z–T method described by Hogan et al. (2006). The Z–T method relates the attenuation corrected radar reflectivity factor to the model temperature through an empirical regression formula derived from in-situ aircraft measurements. The output is given at 30 s temporal resolution and at 31 m vertical resolution.
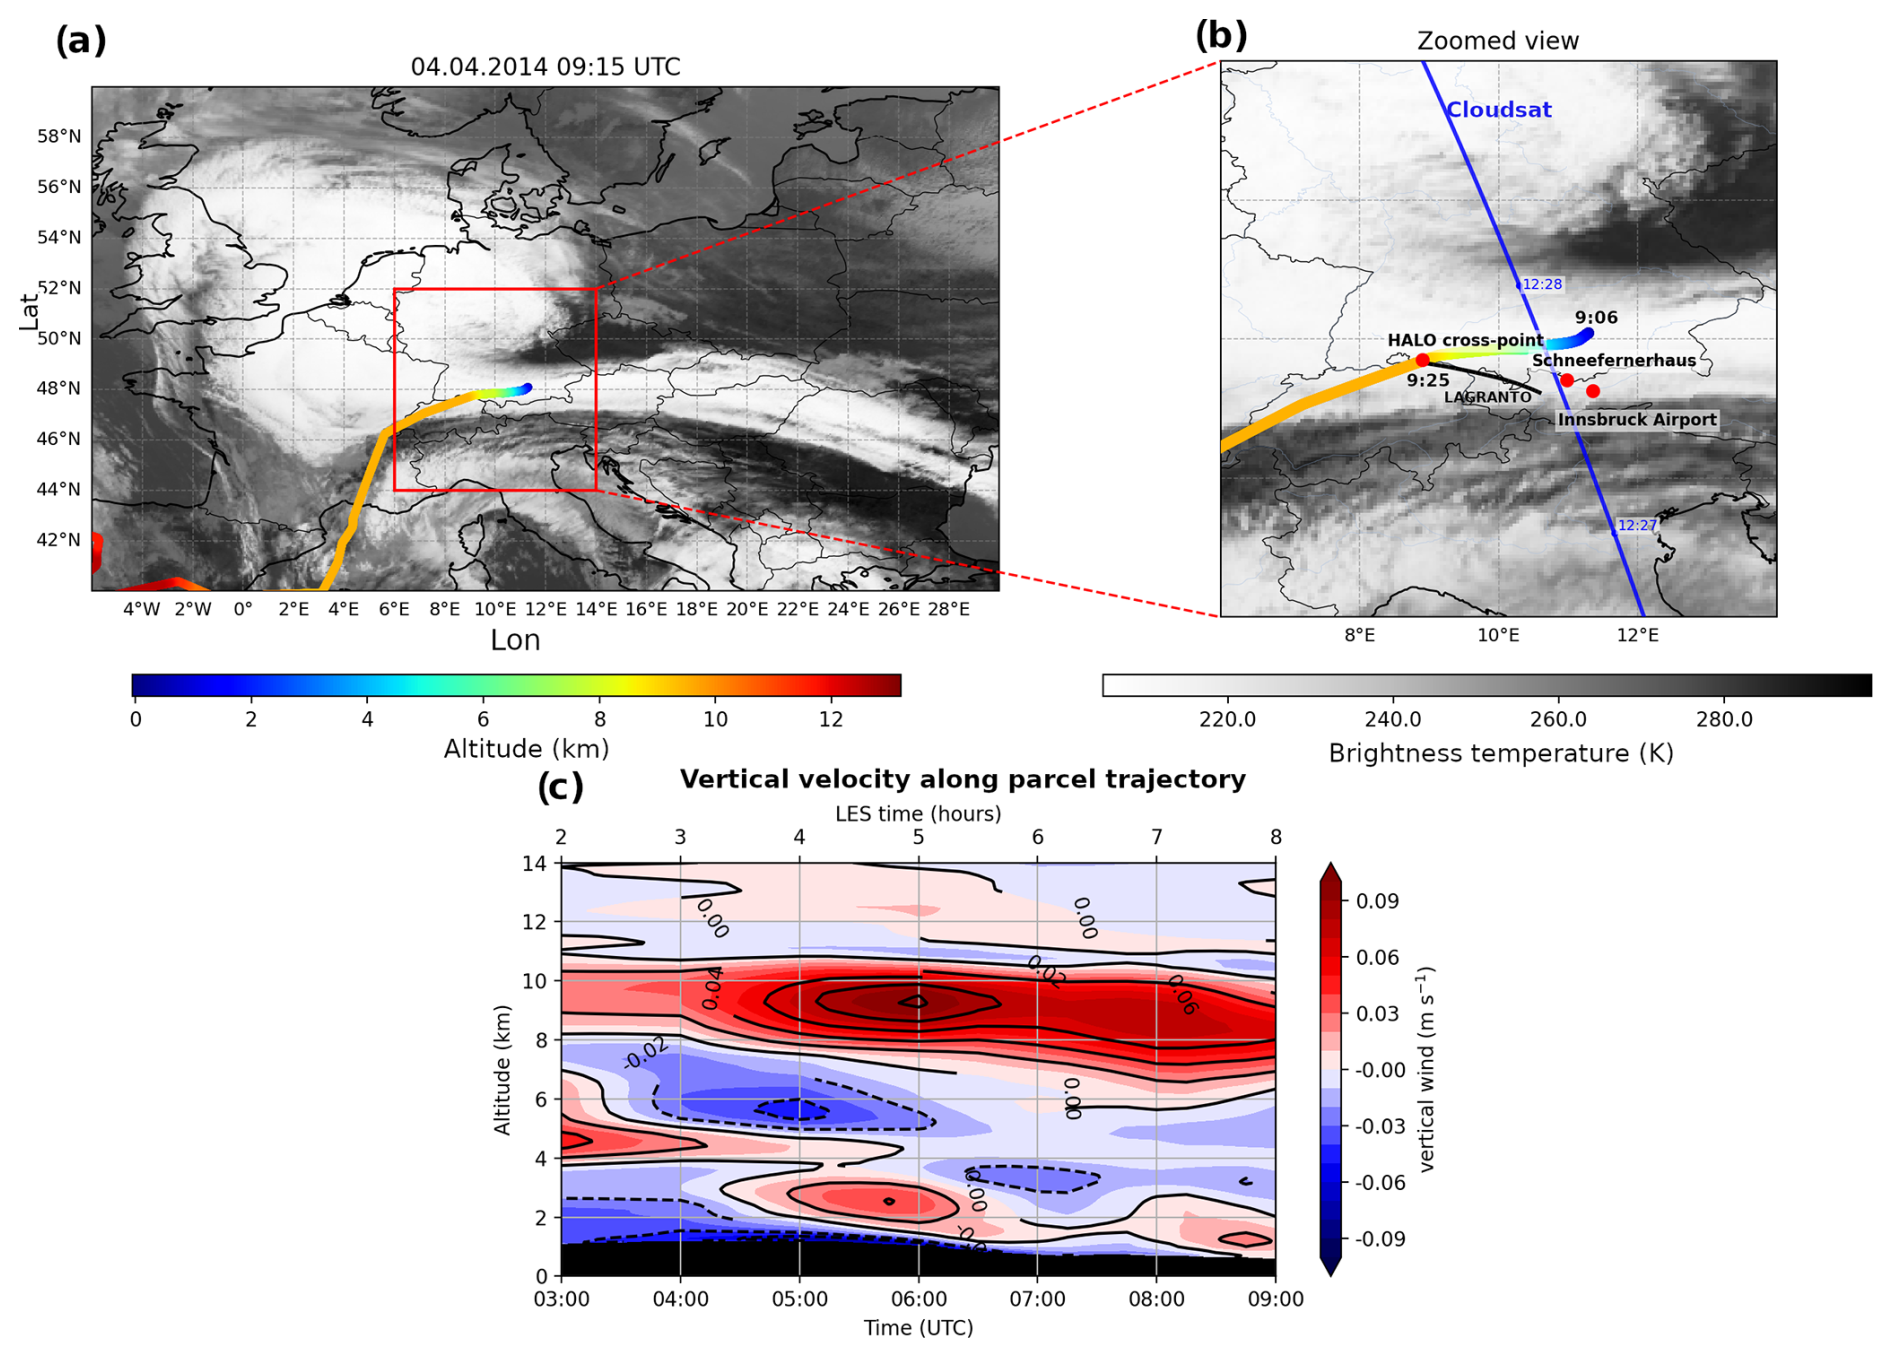
Figure 1(a) MSG IR 8.7 µm channel imagery over Europe with HALO flight track altitude marked with colored line corresponding to altitude with (b) zoomed view with LAGRANTO 6 h parcel trajectory (black solid line) and observation points marked with red dot. Panel (c) shows the vertical velocity from ERA5 along the parcel trajectory shown in (b).
DARDAR (raDAR–liDAR) provides ice-cloud property estimates (such as ICNC and IWC) (Sourdeval et al., 2018), which combines measurements from the CloudSat 94 GHz Cloud Profiling Radar (CPR) and the CALIPSO Cloud-Aerosol Lidar with Orthogonal Polarization (CALIOP). The combined product of radar and lidar observations enables improved characterization of cirrus clouds compared to single-instrument retrievals. The combination of both instruments provides constraints to particle size distribution parameters (slope parameter and volume-weighted diameter Dm) via a parameterization by Delanoë et al. (2005). From the estimated PSD, bulk microphysical properties are derived, including IWC and ICNC. The estimation of ICNC with DARDAR-Nice algorithm provides ICNC for ice sizes above 5 µm. The vertical resolution of the DARDAR product is approximately 60 m, with a horizontal sampling of 1.7 km along the satellite track. The retrieval relative uncertainty for ICNC depends strongly on which instruments were able to measure parts of clouds; when lidar-only or radar-only conditions were present, uncertainty is at 50 % and for lidar-radar conditions at 25 %. In this study, DARDAR vertical profiles of IWC and ICNC are used to characterize the observed dusty cirrus structure and to provide an independent constraint for evaluating the modeled microphysical properties.
For the large-scale analysis of cloud top temperatures, we utilize SEVIRI MSG (EUMETSAT) retrieval data for cloud brightness temperatures at 8.7 µm wavelength since it serves a good proxy for cloud top temperature for optically dense cirrus. The brightness temperatures in the analysis are restricted to values below 230 K which represent the dusty cirrus temperature regime.
2.3 Dusty cirrus of 02–05 April 2014
On 2 April 2014, a cut-off low-pressure system developed over the Iberian Peninsula and propagated eastward while intensifying. Along the eastern flank of the system, a developing and strengthening warm conveyor belt (WCB) leading a cold front produced high surface winds and resulted in high emissions of mineral dust over the northern Sahara around the Atlas Mountains and the Moroccan-Algeria border that were transported by the WCB to higher in troposphere (Weger et al., 2018). MSG Seviri IR satellite imagery (not shown) on 3 April reveals an extensive region of dusty cirrus associated with convective cells embedded within the WCB outflow and by 4 April the dust was transported over a large area over Europe which was identifiable as a large shield of cirrus. As part of the ML-CIRRUS campaign, research flights using HALO were conducted to sample these clouds. On 4 April, the aircraft intercepted and directly measured the extensive cirrus layer as shown in Fig. 1a, b.
Figure 2 shows the vertical profile of measured concentrations of aerosols and ice below 9.5 km. Above 7 km, the OPC measured elevated concentrations of aerosols for total number and filtered for sizes above 500 nm showing that the Saharan dust plume had still quite high concentrations of large dust particles. Roughly at 8 km, HALO encountered near supersaturated conditions over ice with high ICNC values that were most likely connected to the elevated presence of dust (Weger et al., 2018).
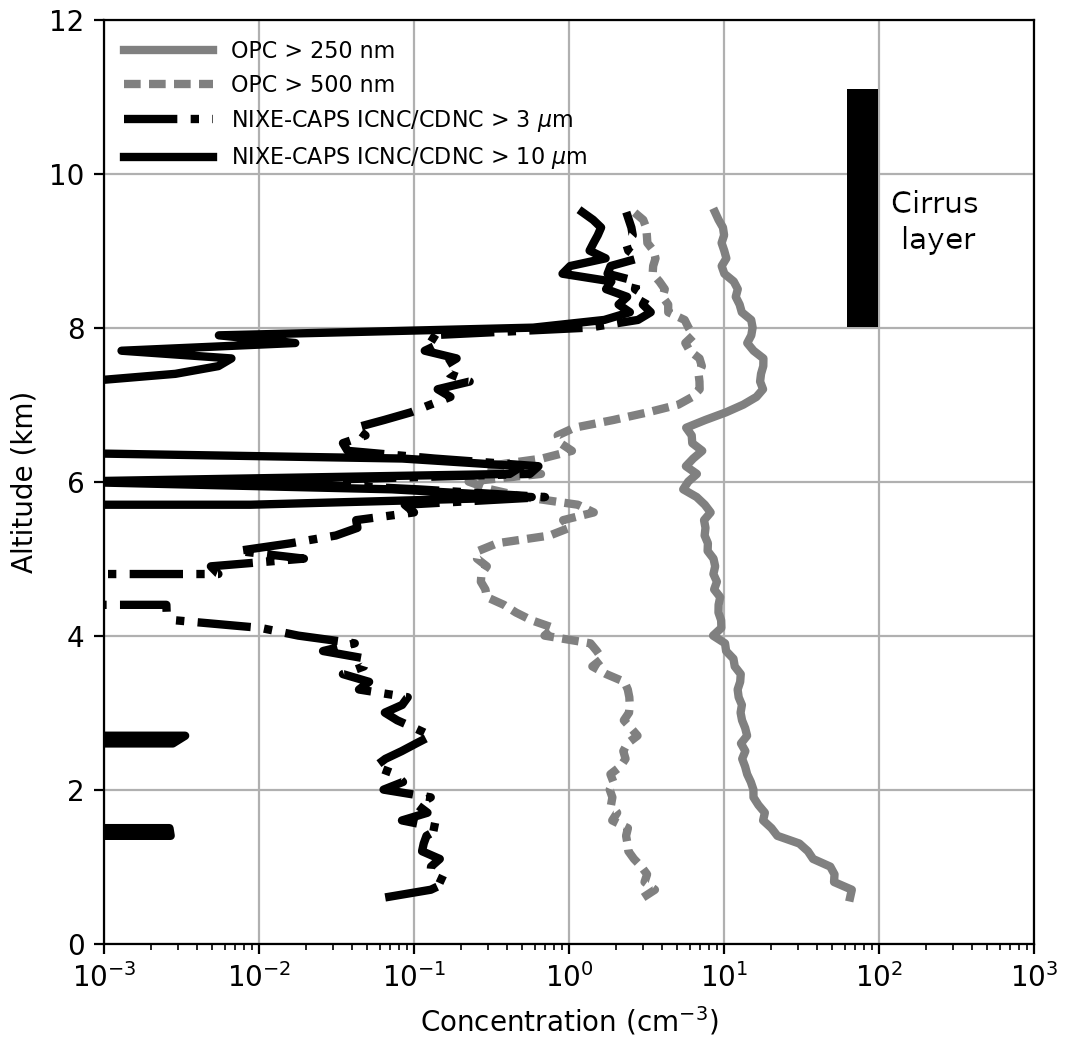
Figure 2Vertical profile of NIXE-CAPS and OPC measured concentrations of ice and aerosols respectively during the HALO vertical ascent up to 9.5 km between 09:22–09:25 UTC. Extent of cirrus layer is marked with a black vertical line between 8–11 km.
The sounding measured at Innsbruck Airport, Austria, at 03:00 UTC on 4 April (Fig. 3a, black solid line) indicates a layer of weak static stability between 9 and 11 km, where the vertical gradient of potential temperature () is small. Panel (a) shows temperature and potential temperature. Equivalent potential temperature (θe) was calculated from the sounding profile of θ using Eq. (B3), and its vertical gradient was used as a diagnostic of potential instability under large-scale forcing. Between 9 and 11 km, the calculated gradient () is negative (not shown), indicating a potentially unstable layer in which latent heating associated with ice–vapor phase changes may support the development of convective cells. The horizontal wind velocity profile shown in Fig. 3c indicates weak vertical shear within this layer, with s−1. The gradient Richardson number is well above the critical value (Ri ≫0.25), suggesting that shear-induced instability is unlikely to dominate and that the observed instability is primarily thermodynamic. Recently, Pieper et al. (2026) found that vertical wind shear is not a significant contributor whether dusty cirrus related turbulence occurs or not, thus we can rule out that vertical wind shear might influence the outcome of this study significantly. The sounding evidence for an unstable layer between 9 and 11 km is supported by the presence of organized up- and downdrafts in the MIRA-35C Doppler velocity observations at Schneefernerhaus (approx. 50 km from Innsbruck) during the early hours of 4 April (Fig. 4b). We define the convective layer as CONV as highlighted with blue dash lines in Fig. 3a and b. Figure 4a shows that high IWC is found throughout the turbulent CONV layer. Intense updrafts prevent large ice crystals from precipitating out of the cloud and allows them to continue growing even further. On the other hand, a layer between 7 and 9 km (Fig. 3a) is moderately stable and cirrus at this level is forming from the influence of large-scale vertical velocity and from ice crystals sedimenting from the CONV layer. For this reason, we refer to this layer as SEDI as shown in Fig. 3a and b.
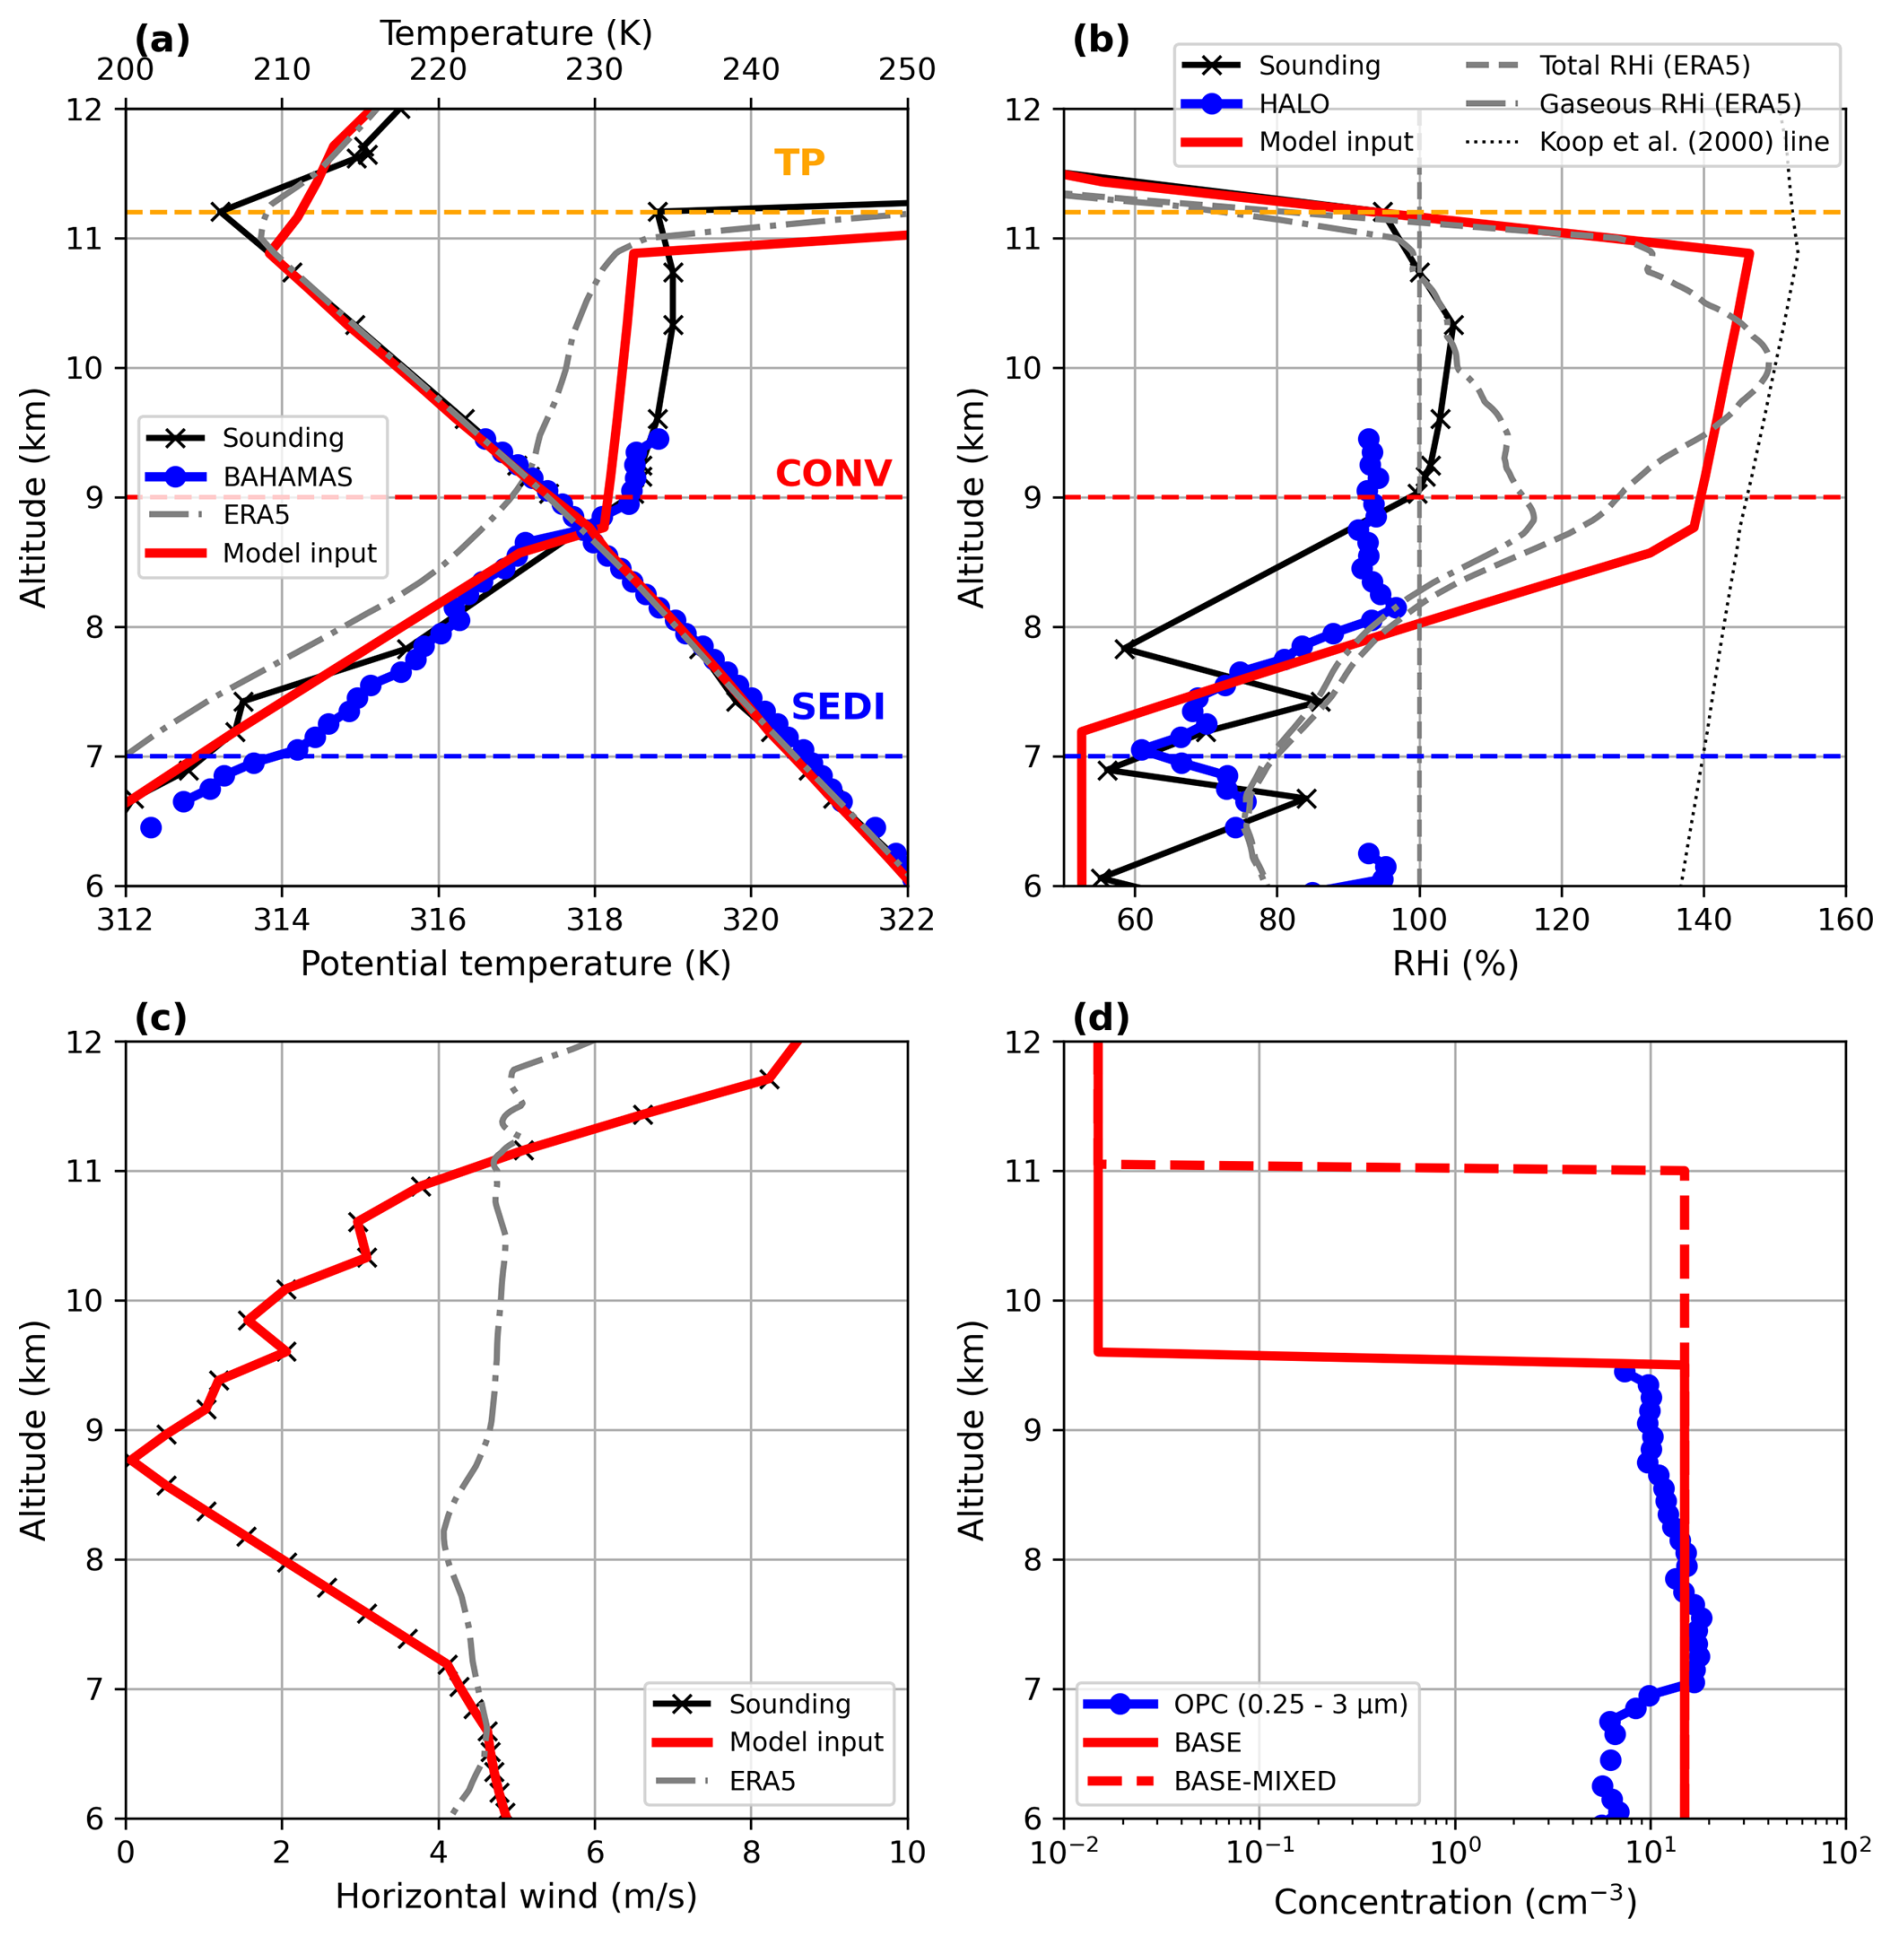
Figure 3Initial vertical profiles used in the UCLALES-SALSA simulations and corresponding observations. Panel (a) shows potential temperature (lower x-axis) and temperature (upper x-axis), panel (b) shows RHi, panel (c) shows horizontal wind speed, and panel (d) shows aerosol number concentration. In panels (a) and (b), black, blue and red lines denote the sounding, BAHAMAS measurements, and model input, respectively. Grey lines show ERA5 values at the initial point of the 6 h LAGRANTO trajectory. In panel (b), dash dot and dashed grey lines denote vapor phase and total RHi (vapor phase and ice phase water) respectively. The dotted line in panel (b) indicates the homogeneus freezing threshold corresponding to Koop et al. (2000) (equation from Ren and Mackenzie, 2005). In panel (c), red and grey lines show the prescribed wind profile and ERA5 wind, respectively. In panel (d), the blue line shows the OPC aerosol concentration for particles between 0.25 and 3 µm, while the solid and dashed red lines show the BASE and BASE-MIXED dust profiles. The CONV and SEDI layers are marked by red and blue horizontal lines, respectively, and the tropopause (TP) is indicated by an orange line.
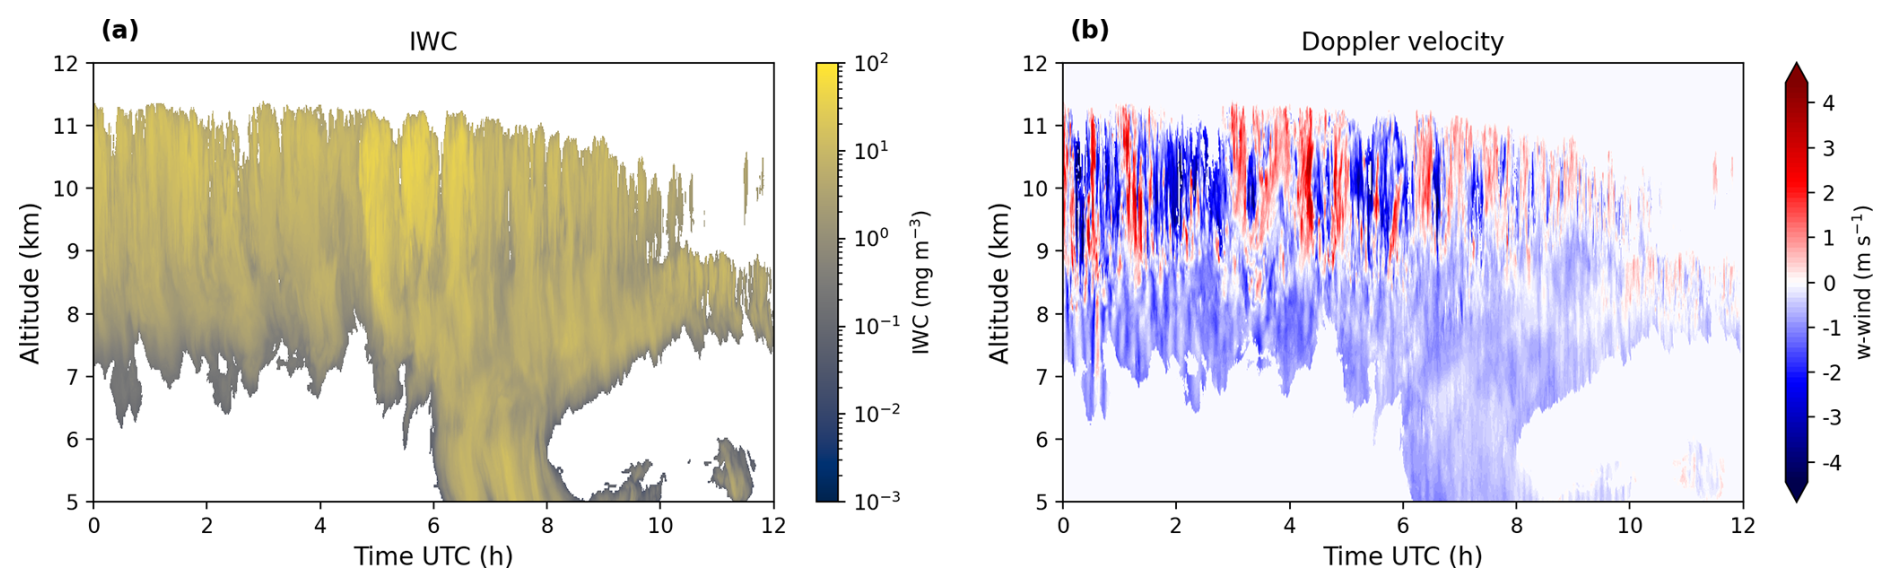
Figure 4Time-altitude profile of (a) IWC and (b) Doppler wind (vertical) observed with MIRA-35C at Schneefernerhaus site on 4 April 2014.
2.4 UCLALES-SALSA simulations of the dusty cirrus event
To investigate the microphysical mechanisms controlling the observed dusty cirrus clouds, we performed UCLALES-SALSA simulations designed to represent the evolution of the air mass sampled by the HALO aircraft at 09:00 UTC on 4 April (in Fig. 1b). The model domain is designed to follow a 6 h kinematic trajectory using Lagrangian Trajectory Tool (LAGRANTO; Sprenger and Wernli, 2015). This trajectory was set to arrive at the HALO sampling point at 47.7° N, 8.9° NE at 200 hPa altitude and the origin point in the near proximity of the sounding conducted at Innsbruck Airport (Austria) at 03:00 UTC. We use a three-dimensional model domain with horizontal extension of km with horizontal resolution m. Vertical domain extension is set in the range of km with vertical resolution of Δz=50 m. Above 12 km, the resolution is increased to Δz=300 m by 14 km. The simulation time is set with 2 h spin up period followed by 6 h simulation which represents the cloud evolution along the LAGRANTO parcel trajectory. Output is written with 5 min interval. Model time step is determined by the Courant–Friedrichs–Lewy condition but is no longer than 1 s. Additionally, the model domain follows solar diurnal cycle at latitude 47.5° and therefore experiences both nighttime conditions during the initial 2.5 h and daytime conditions for the latter half of the simulation time.
The sounding profile (as shown in Fig. 3a–c) is used as a reference for model domain input meteorology albeit with small modifications allowing proper initialization of convection. The relative humidity profile is modified to quickly initialize cirrus convection with a high relative humidity over ice (RHi) set between 8.5 and 10.8 km (as shown in Fig. 3b). The higher RHi is used because dust particles are initially dry and water vapor deposition onto ice reduces RHi close to ice saturation quickly after the onset of ice nucleation. The solid red RHi profile line in Fig. 3b is close to the Koop et al. (2000) threshold line for homogeneous freezing but does not cross it as we do not want to cause immediate burst of homogeneous freezing at the initial time step when the ice nucleation process is triggered. The initial RHi profile corresponds to total water content (vapor as measured with BAHAMAS combined with NIXE-CAPS IWC) inside the dusty cirrus. Additionally, the model input potential temperature profile between 8.8–11 km is set at a fixed gradient of K km−1 which corresponds to the lowest static stability simulations by Fusina and Spichtinger (2010) and the mean gradient in the sounding profile. The input potential temperature profile is slightly different than the sounding profile as we need to consider temperature profile change during the spin up period when intense latent heat release associated with vapor-ice phase transfer occurs. Also, we do not use the potential temperature gradient of the sounding between 8.8–11 km since the measured profile has varying temperature gradient influenced by active convection. Additionally, the measured sounding shows very high similarity in temperatures measured by BAHAMAS 6 h later in time and in spatially different locations, meaning that co-location via parcel trajectories is justified.
During the 6 h simulation following the LAGRANTO parcel trajectory on 4 April 2014 between 03:00–09:00 UTC (no forcing during spin up), we apply large-scale vertical velocity (wLS) forcing to the model domain. The spatial and temporal evolution of wLS obtained from hourly ERA5 reanalysis data (Hersbach et al., 2020) is shown in Fig. 1c. The wLS forcing from ERA5 was interpolated to a resolution of 15 min to reduce sudden changes in forcing in the model domain. We can see that the vertical velocity is initially weaker with wLS=3 cm s−1 with the strongest forcing around 9–10 km in altitude. The wLS is stronger between 05:00–09:00 UTC with maxima at wLS=10 cm s−1. The dusty cirrus thus had experienced a strong synoptic forcing right before the aircraft observed these clouds around 09:00 UTC and this is visible as higher RHi values below 9 km in altitude compared to the sounding RHi 6 h prior (Fig. 3). Satellite imagery (Fig. 1a, b) shows that the cirrus was optically thicker around the location of the aircraft observations and that the optically thick cirrus extended in the West-East direction with very similar cloud top temperatures, indicating that the cloud top altitude was at similar levels over large area and convection occurred under similar conditions. On top of large-scale vertical velocity forcing, we nudge the horizontal winds towards ERA5 winds with relaxation time of 3 h. This set up roughly follows the semi-Lagrangian style set up as used in Kazil et al. (2021), however, we omit here the influence of horizontal advection and nudging of temperature and humidity profiles since the initial state from sounding and final state from BAHAMAS observations are very similar in both temperature and humidity. Changes in RHi during 6 h indicate that ambient conditions are mostly controlled by vertical velocity forcing, simplifying our setup.
The ERA5 wLS represents synoptic-scale forcing rather than local vertical motions. Although ERA5 provides hourly data at approximately 0.25° horizontal resolution (about 31 km), the vertical velocity is a model calculated value and its amplitude, vertical structure, and timing may differ from actual regional ascent. Small-scale and high-frequency motions, including gravity wave perturbations are not fully resolved at this resolution. Uncertainty in the ERA5-derived forcing therefore represents an additional model input uncertainty, particularly for the SEDI layer, where the wLS influences RHi and the subsequent ice production, vertical transport, and sedimentation. Dusty cirrus properties in the CONV layer are on the other hand dominated by convective motions which have far greater magnitude and variability than large-scale motions, thus reducing the sensitivity to uncertainties in wLS.
Due to the lack of in-situ measurements above 9.5 km altitude inside the cloud layer (as shown in Fig. 2), we do not know the dust concentrations up to the cirrus top, however, we can estimate based on the in-situ vertical concentration profile in Fig. 2 and the assessment made by Weger et al. (2018) that dust was effectively mixed inside the convective layer and can be assumed to be roughly constant thorough the cirrus.
To construct the input dust profile for SALSA, we used OPC-derived PSD measurements obtained between 7.5 and 7.9 km altitude at aerosol concentration ND=15 cm−3 for particles in size range µm, corresponding to clear-air conditions directly below the dusty cirrus layer. The measured PSD was fitted with three lognormal modes, which were then inputted into the insoluble aerosol bins in SALSA (Fig. 5). The aerosols measured by OPC are considered to consist of mineral dust particles that are all potential INPs. As the SALSA dust bins extend up to 6 µm, we extrapolate the dust PSD based on the Mode 3 shown in Fig. 5. NIXE-CAPS measurements above 3 µm confirm the continuation of the aerosol PSD which justifies this extrapolation.
Because the simulations are initialized to represent the already established dusty cirrus observed during the measurement period, rather than its complete formation history, the vertical distribution of mineral dust within the cirrus layer is not fully constrained by observations. In particular, direct dust measurements are available only up to approximately 9.5 km, leaving the dust concentration above this altitude uncertain. We therefore consider two vertical configurations. In the BASE configuration, constant ND is applied between 6 and 9.5 km, whereas in the BASE-MIXED configuration, the same concentration is extended up to 11 km (Fig. 3b). The BASE-MIXED configuration represents a sensitivity case in which dust is distributed throughout the cirrus layer and is additionally motivated by the mixing hypothesis proposed by Seifert et al. (2023), which suggests that mineral dust can become vertically homogenized throughout the cirrus layer during its evolution. These two configurations allow us to assess the sensitivity of the simulated cirrus evolution to the uncertain dust distribution above 9.5 km.
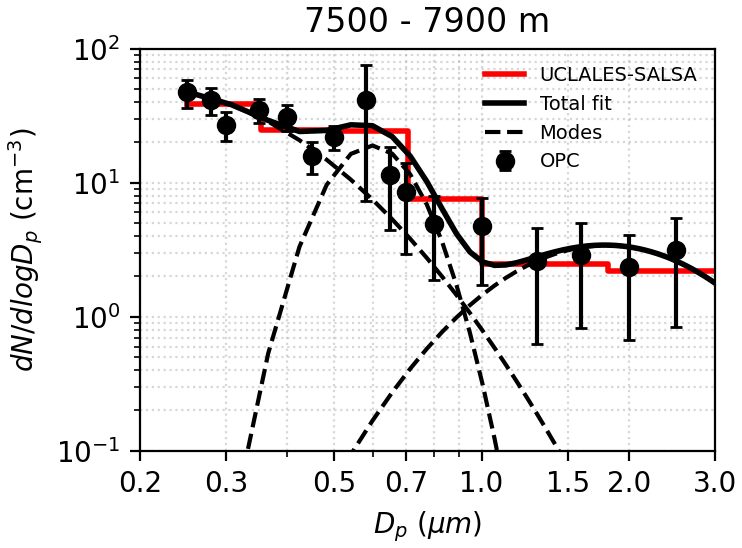
Figure 5Aerosol size distribution measured by the OPC immediately below the dusty cirrus cloud layer at altitudes between 7.5 and 7.9 km. Black markers indicate the mean measured aerosol number concentration, with vertical error bars representing the standard deviation. The measured distribution was fitted with three lognormal modes, whose sum is shown by the black solid line. The individual fitted modes are shown by the dashed black lines and were used to describe the aerosol size distribution in SALSA. The red solid line shows the dust size distribution used in the UCLALES-SALSA simulations, obtained from the fitted lognormal modes. The fitted mode parameters are: D1=0.2 µm, σ1=1.75, N1=31.4 cm−3; D2=0.6 µm, σ2=1.2, N2=3.8 cm−3; and D3=1.8 µm, σ3=1.57, N3=1.7 cm−3.
For smaller than 0.25 µm, particles are treated as soluble sulfate type particles with Na=300 cm−3, with lognormal distribution with geometric mean diameter of μD=50 nm and standard deviation σ=1.4. The parameters are based on the configuration presented in Spichtinger (2014) with typical value for upper troposphere (Minikin et al., 2003). These particles can participate in homogeneous freezing. To investigate the effect of dust number concentration on the evolution of dusty cirrus, we perform five simulations with different initial dust number concentrations, spanning approximately ND=0.01–10 cm−3. The simulations use dust profile ND varied by approximately one order of magnitude between cases. The highest-ND case (ND≈10 cm−3) corresponds to the BASE and BASE-MIXED configurations. The BASE case and all sensitivity simulations involving radiation and large-scale forcing use H14 as the default DIN parameterization. To assess the sensitivity to the choice of DIN parameterization, we additionally perform simulations using the BASE configuration with two alternative schemes, U17 and P13. The BASE-MIXED configuration is used alongside BASE in the model–observation comparison and in the ND sensitivity simulations.
SALSA output for the ice bins is given in terms of spherical-equivalent diameter, whereas NIXE-CAPS provides the maximum dimension of ice crystals. To improve comparability with observations in the results section, the SALSA ice bins are converted to maximum dimension using the cirrus parameterization of Schumann et al. (2011).
3.1 BASE simulation and comparison with observations
In this section, we present results from the BASE and BASE-MIXED simulations and compare the model results against observations. All primary analyses are conducted using the H14 scheme. The U17 and P13 schemes are used to assess the sensitivity of the simulated ice nucleation pathways, with the resulting structural uncertainty in ICNC, IWC, and radiative feedbacks discussed in Sect. 3.3. For the model–observation comparisons, NIXE-CAPS measurements provide the primary constraint on the simulated microphysical properties because the BASE simulations were designed to represent the timing and location of the HALO sampling of the dusty cirrus at approximately 09:00 UTC. Although NIXE-CAPS has limited spatial and temporal coverage, it provides direct in-situ measurements and involves fewer retrieval assumptions than the remote-sensing products. DARDAR-Nice and MIRA-35C are therefore used as complementary datasets. They are not precisely co-located with the HALO sampling region in space or time, but they provide independent information on the same dusty cirrus event (approximately similar thermodynamical conditions can be expected) and extend the observational constraint above the approximately 9.5 km limit of the NICE-CAPS sampling.
Figure 6 shows the temporal evolution of the dusty cirrus in the model domain for BASE simulation, mimicking a vertically scanning pointing cloud radar as in Fig. 4. The simulated cirrus exhibits enhanced IWC near cloud top and a vertical structure consistent with the radar observations. Elevated vertical velocities occur primarily between 9 and 11 km, corresponding to the CONV layer below the tropopause (TP) shown in Fig. 6.
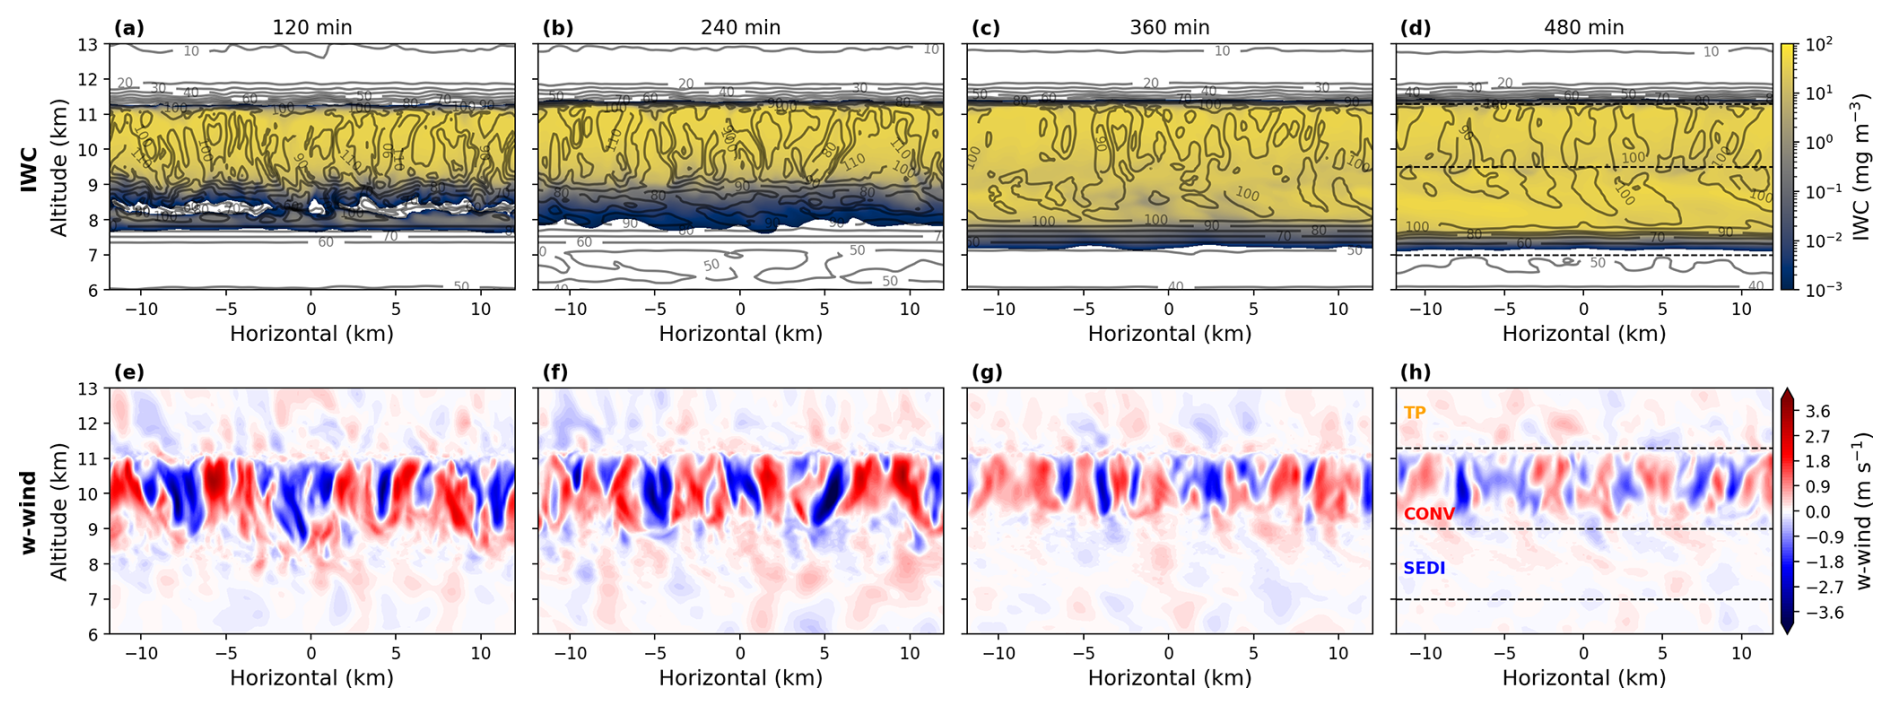
Figure 6UCLALES-SALSA simulated IWC (upper panels, a–d) and vertical velocity component of wind (lower panels, e–h) at 2 h time intervals (columns) during the BASE run. At last time step (480 min), TP, CONV and SEDI layer altitudes are marked with dashed lines. Black contours in (a–d) represent RHi at 10 % interval.
As shown in Fig. 6, updrafts and downdrafts in the CONV layer indicate organized convective overturning. Rising convective cells originate near the base of the CONV layer, where newly nucleated and ice crystals that survive sublimation in downdrafts are re-entrained into supersaturated updrafts, increasing IWC through depositional growth. The associated latent heat release warms the ascending parcels relative to their environment, reinforcing the updraft. As the air rises and cools moist adiabatically, RHi increases, promoting further ice nucleation and vapor deposition. Upon reaching the tropopause inversion, vertical flows are redirected horizontally. Local convergent flow between adjacent cells induces compensating subsidence, leading to adiabatic warming and subsaturation over ice. Downdraft regions are also microphysically important. Sublimation releases mineral dust particles that previously nucleated ice, allowing them to participate again in ice formation when re-entrained into updrafts.
Analysis of the temperature tendencies (according to Eq. B4) within the CONV layer shows that the convection was sustained by strong LW cooling at the cloud top as shown in Fig. 7, while LW heating was concentrated in the lower part of the dusty cirrus layer (Ovchinnikov et al., 2014). This mechanism was hypothesized as the main supportive mechanism for convection in dusty cirrus clouds in Weger et al. (2018) and Seifert et al. (2023). SW warming reduces the net cloud top cooling increasingly as the solar angle increases, however, not enough to result in net warming. While the SW radiation did not disrupt the convection to the point of collapse, clear slowdown is seen in Fig. 7e as a reduced turbulent mixing after 5 h. Also, the thickening of the cirrus layer and spreading out of the LW warming after 5 h, which was caused by the wLS forcing, meant that the net heating rate within the CONV layer decreased. The impact of radiation on dusty cirrus evolution is more closely discussed in Sect. 3.5.
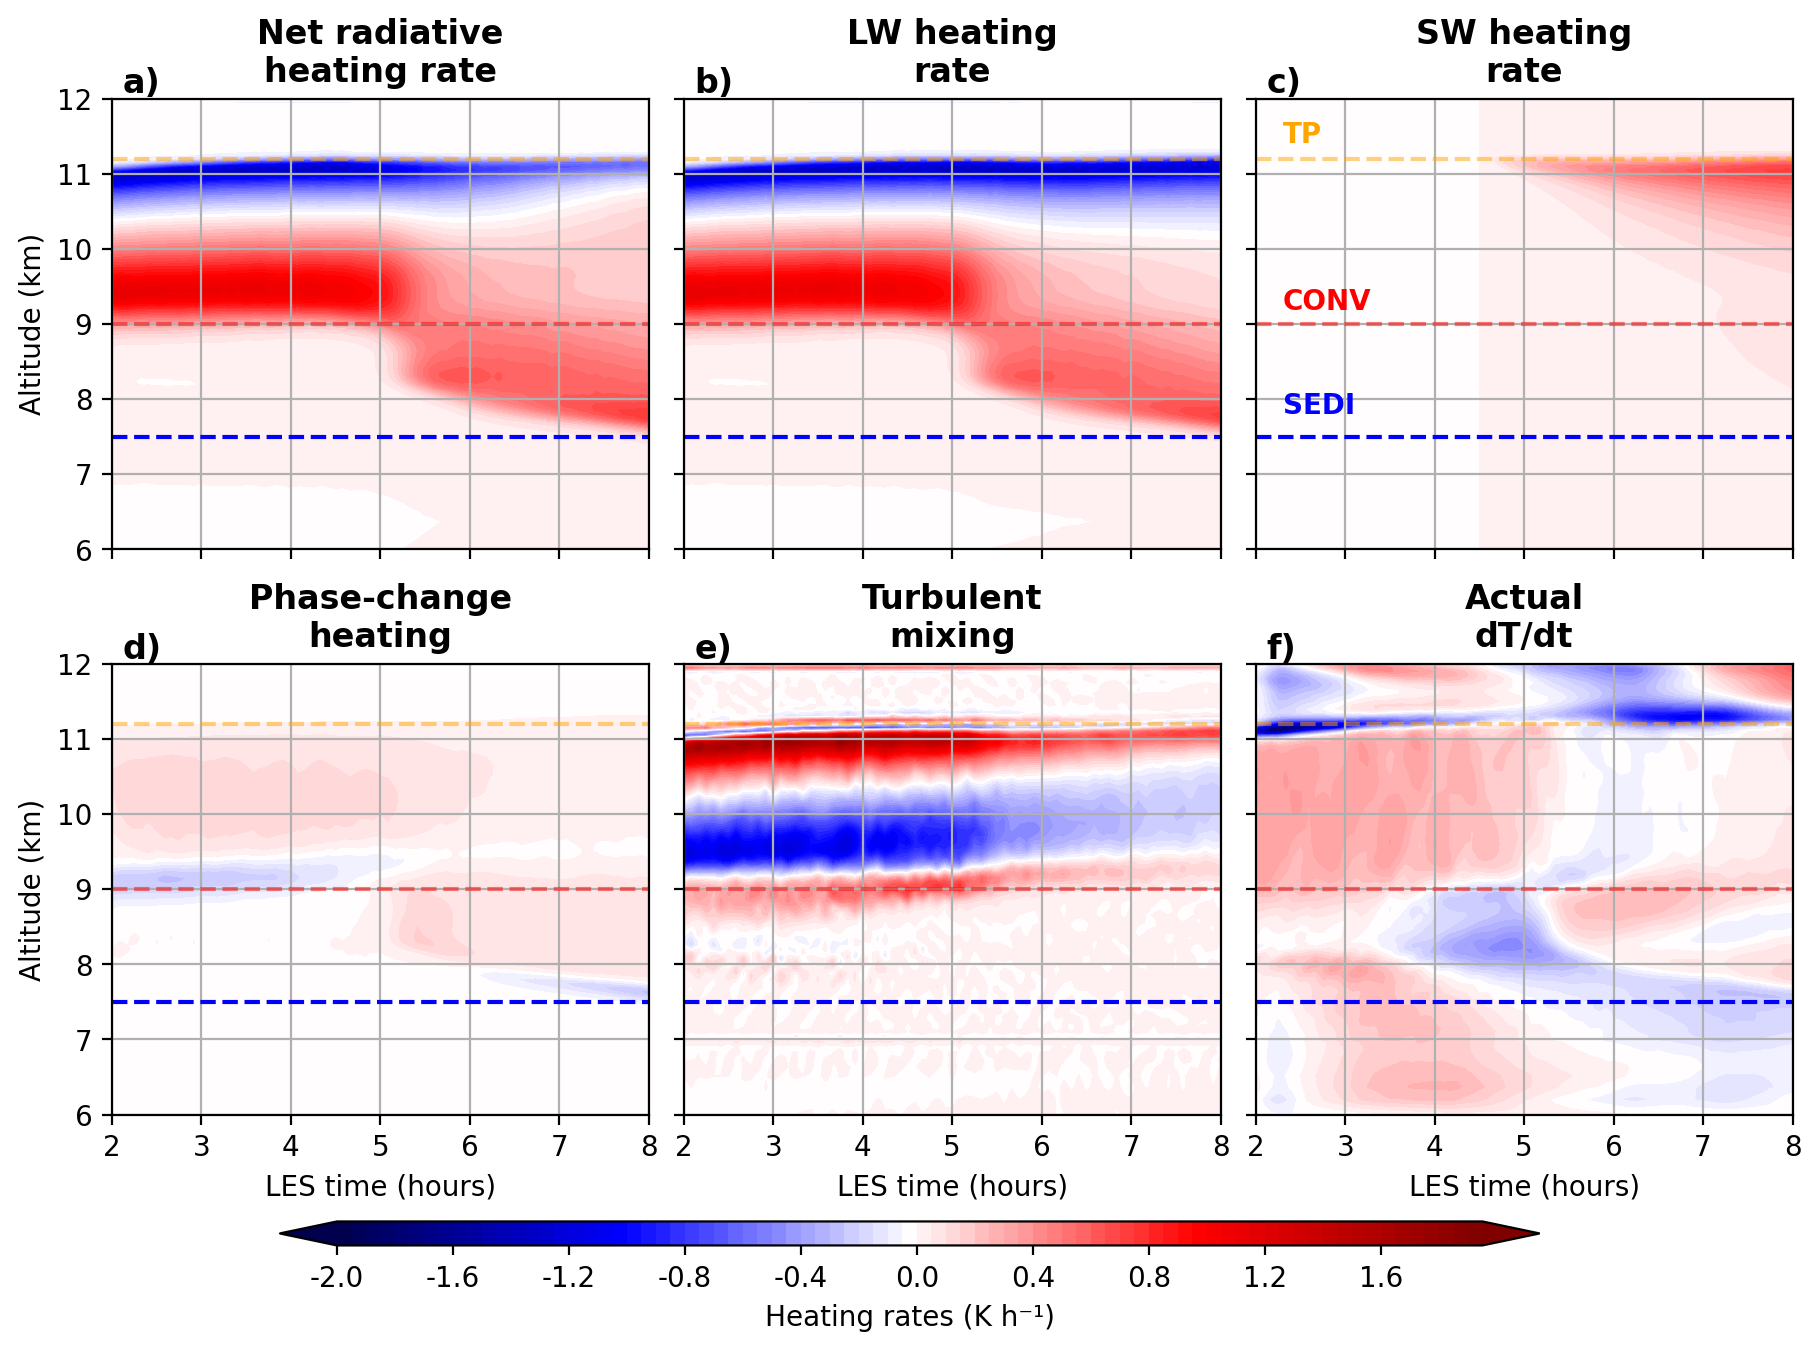
Figure 7Horizontal mean heating rates for each term presented in Eq. (B4) excluding the large-scale forcing in the BASE run (a–f). Magnitudes of heating rates are shown with shading from blue (negative rate) to red (positive rate).
In both MIRA-35C Doppler velocity observations (particle velocity not directly equivalent to true wind velocity) and model vertical wind (w) at 09:00 UTC (last time step) from last time step of BASE, the variability of w increases with altitude as shown in Fig. 8. At 10.5 km level, in the middle of the CONV layer where the w variability was also highest in the BASE run, the magnitude and distribution of w are in particularly close agreement, indicating that the model captures the essential dynamical character of the convective overturning. The simulated peak vertical velocities reach up to 2.5 m s−1, similar magnitudes as what MIRA-35C observed at this level. The skewnesses of the distribution shape is also a telltale sign of convection as the peak frequency is found around 0.5 m s−1.
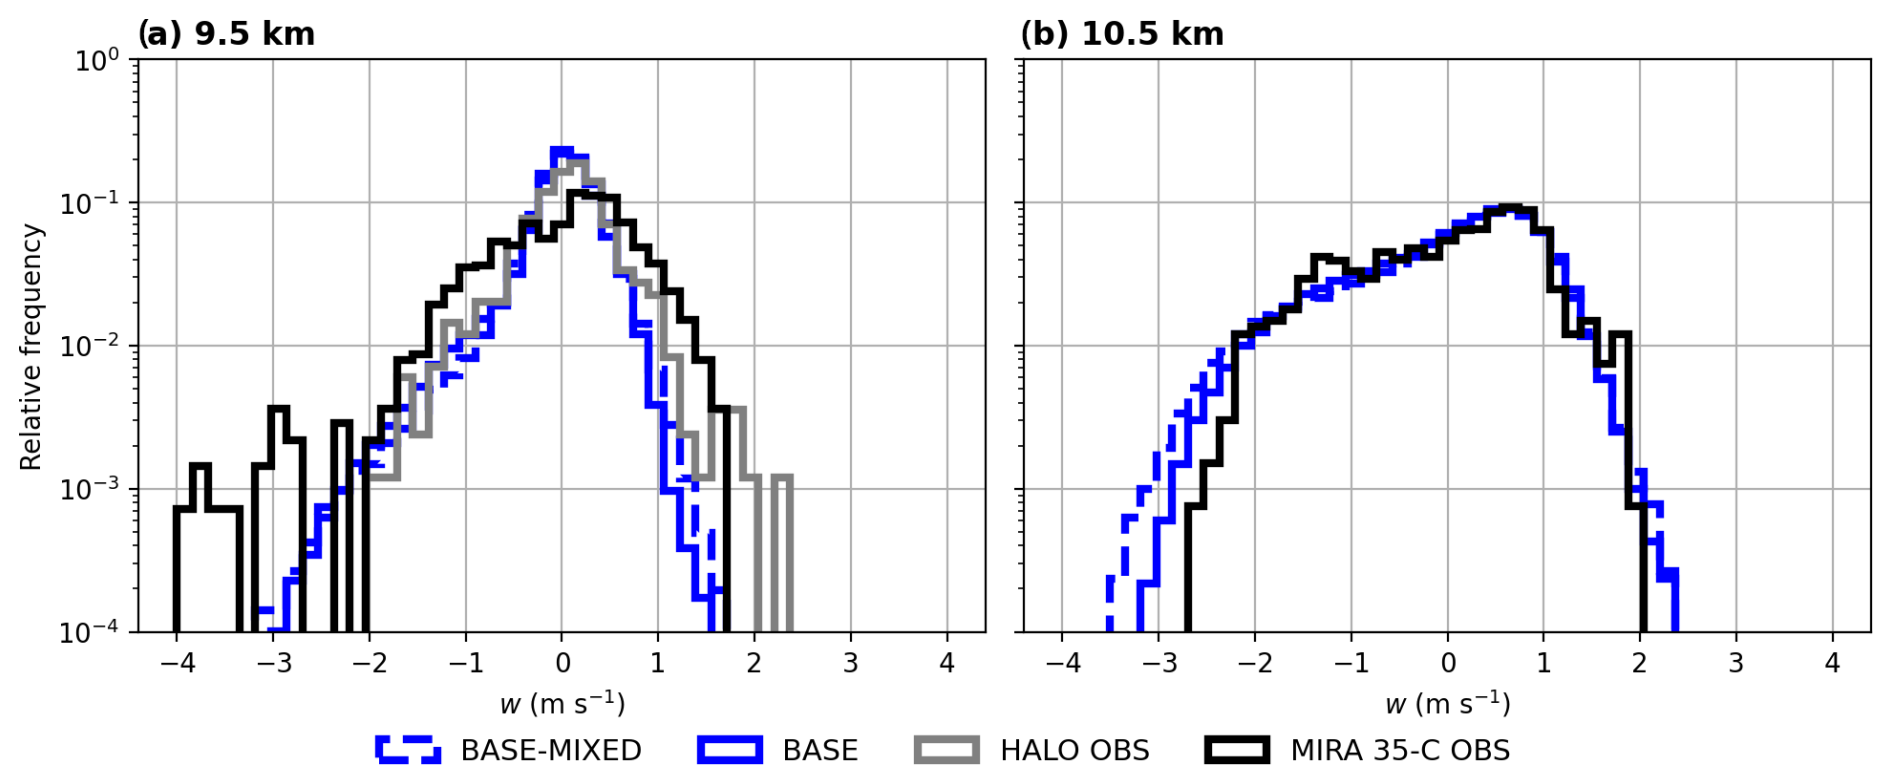
Figure 8Model vertical wind frequency distribution compared with in-situ measurements at 9.5 km and MIRA-35C Doppler velocities at 9.5 and 10.5 km. 2 h moving average was used to reduce the effects of sedimentation from Doppler velocities, reflecting closer to air velocity. The derivation of air velocity from Doppler velocities follows method for running-mean technique presented in Protat and Williams (2011).
Also at 9.5 km level, model, MIRA-35C, and BAHAMAS measurements produce a very similar shape of the distribution. The negative skewness of the velocity distributions at 9.5 km further indicate that this level is influenced by the descending branch of the convective circulation rather than active updraft cores. The overall agreement in dynamical structure provides confidence that the model is physically credible and that the coupling between dynamics and microphysics is realistically represented.
We must note that MIRA-35C observations in Fig. 8 represent w measured between 06:00–08:00 UTC and not exactly at 09:00 UTC (HALO sampling time) since the dusty cirrus layer had moved away from the Schneefernerhaus station by that time. However, because the observed w profiles varied only little during the whole observed time period covered by dusty cirrus layer, w profiles can be safely compared against the model and BAHAMAS measurements. We believe that at 9.5 km, MIRA-35C had observed slightly higher w variability since as it was shown in Fig. 6, the base of the CONV layer lifted towards the end of the run, coinciding with the reduced w variance in the model at 9.5 km.
3.2 Comparison of microphysical properties
We compare the model performance at the end of the BASE and BASE-MIXED simulations, corresponding to 09:00 UTC when HALO measured the dusty cirrus layer. Table 1 summarizes the representative values and variability shown in Fig. 9. The modeled IWC vertical profile generally agrees with the range of in-situ measurements, although the modeled mean IWC in the CONV layer (29.15±5.44 mg m−3 for BASE and 29.34±3.76 mg m−3 for BASE-MIXED) is approximately 30 % higher than the NIXE-CAPS mean (22.45±5.47 mg m−3). The difference between BASE and BASE-MIXED is only about 0.7 % in the CONV layer, indicating very similar modeled IWC values. The DARDAR-Nice profiles obtained during the noon overpass show mean IWC values of 19.22±10.85 mg m−3 and 16.77±8.40 mg m−3 in the CONV and SEDI layers, respectively. The DARDAR-Nice estimates cover a larger horizontal area and therefore sample a broader range of cirrus conditions, with IWC values varying by approximately one order of magnitude, while their mean values remain within the same order of magnitude as the modeled values. MIRA-35C IWC is lower than both NIXE-CAPS and DARDAR-Nice, with a mean value of 9.03±5.93 mg m−3 in CONV, approximately 60 % lower than NIXE-CAPS and 53 % lower than DARDAR-Nice. However, the upper range of MIRA-35C estimates approaches the modeled IWC values. MIRA-35C also observed cirrus conditions at a larger scale, similar to DARDAR-Nice, since the statistics represent a couple of hours of dusty cirrus flowing over the radar station. The common feature in the modeled and observed cirrus is the shape of the IWC profile between 9 and 11.5 km (CONV), where IWC increases towards the cloud top. While IWC was not sampled above 9.5 km with NIXE-CAPS, the IWC agrees well within the sampled altitude range.
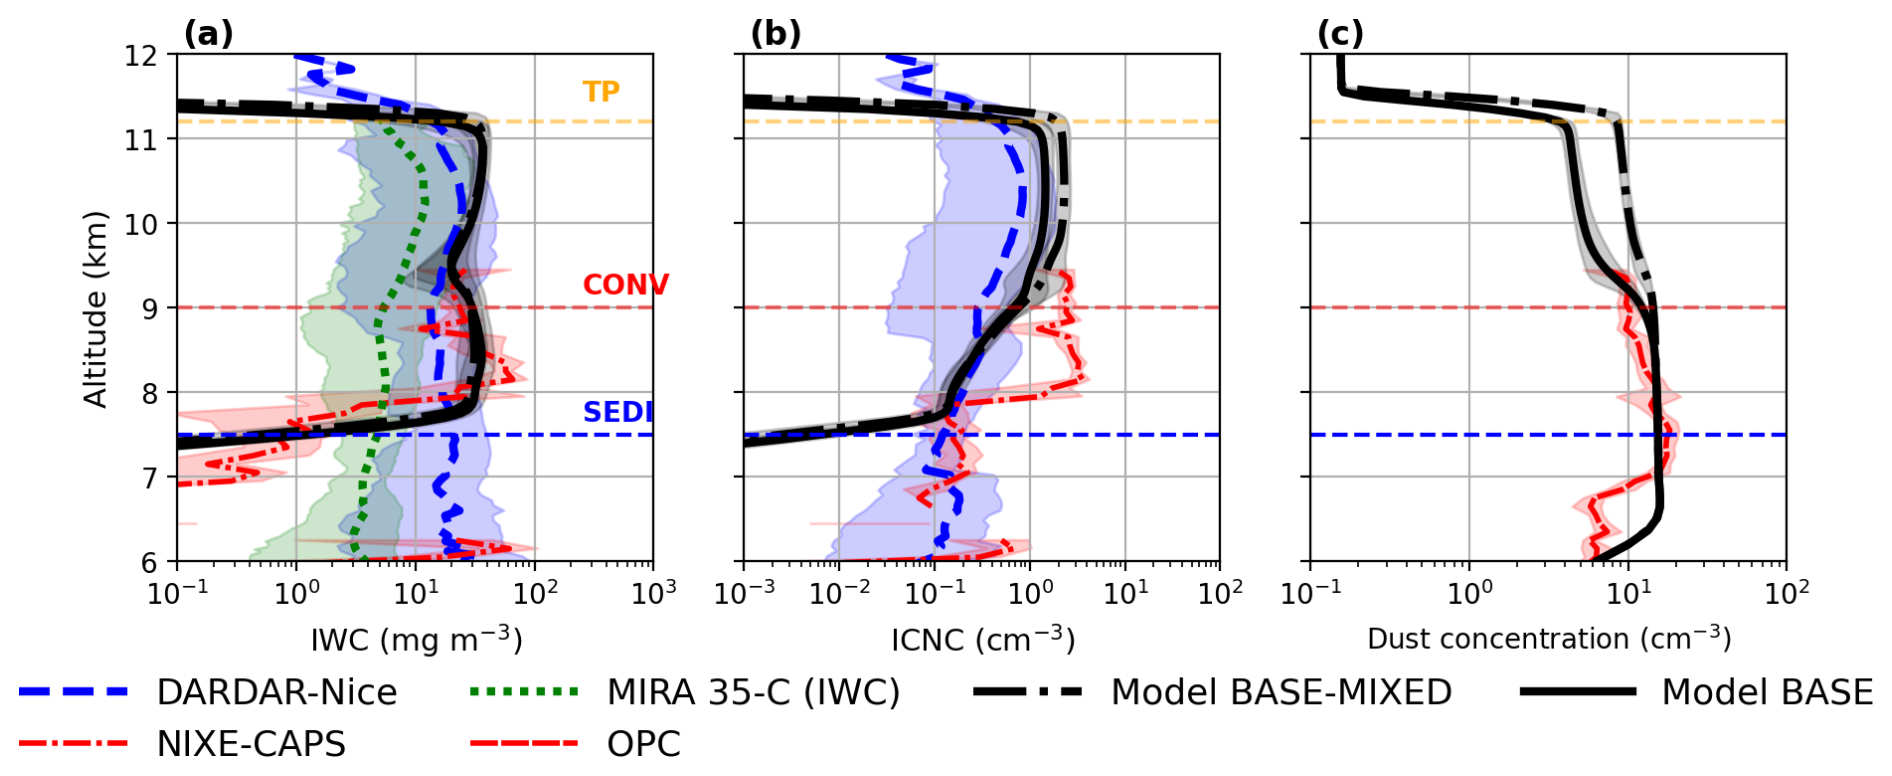
Figure 9BASE and BASE-MIXED simulation results (black solid and dash-dotted lines) compared with DARDAR retrievals (blue dashed), cloud radar MIRA-35C observations at Schneefernerhaus (green dotted), and in situ NIXE-CAPS measurements (red densely dash-dotted) of (a) IWC, (b) ICNC, and (c) dust number concentration (ND) from OPC. UCLALES-SALSA results represent the final model time step at 09:00 UTC with 150 m horizontal and 50 m vertical resolution, with model lines showing spatial means within each altitude bin. DARDAR retrievals correspond to the CloudSat overpass at 12:30 UTC over the latitude range 47–49° N. MIRA-35C IWC observations at Schneefernerhaus (47.417° N, 10.977° E) are time-averaged over 06:00–08:00 UTC at 30 s resolution, the period closest to the NIXE-CAPS measurements. The NIXE-CAPS ICNC profile represents the vertical ascent of HALO between 09:15 and 09:25 UTC with 1 Hz sampling that corresponds to approximately 190 m horizontal resolution, with measurements binned into 100 m altitude intervals. All lines represent mean values within their respective altitude bins. Shading indicates the 5th–95th percentile range for each data measured, retrieved or modeled.
Table 1Mean ± standard deviation of IWC and ICNC in the convective (CONV) and sedimentation (SEDI) layers for NIXE-CAPS, DARDAR-Nice, MIRA-35C, BASE, and BASE-MIXED. NIXE-CAPS measurements extend only to approximately 9.5 km and therefore do not cover the full CONV layer.
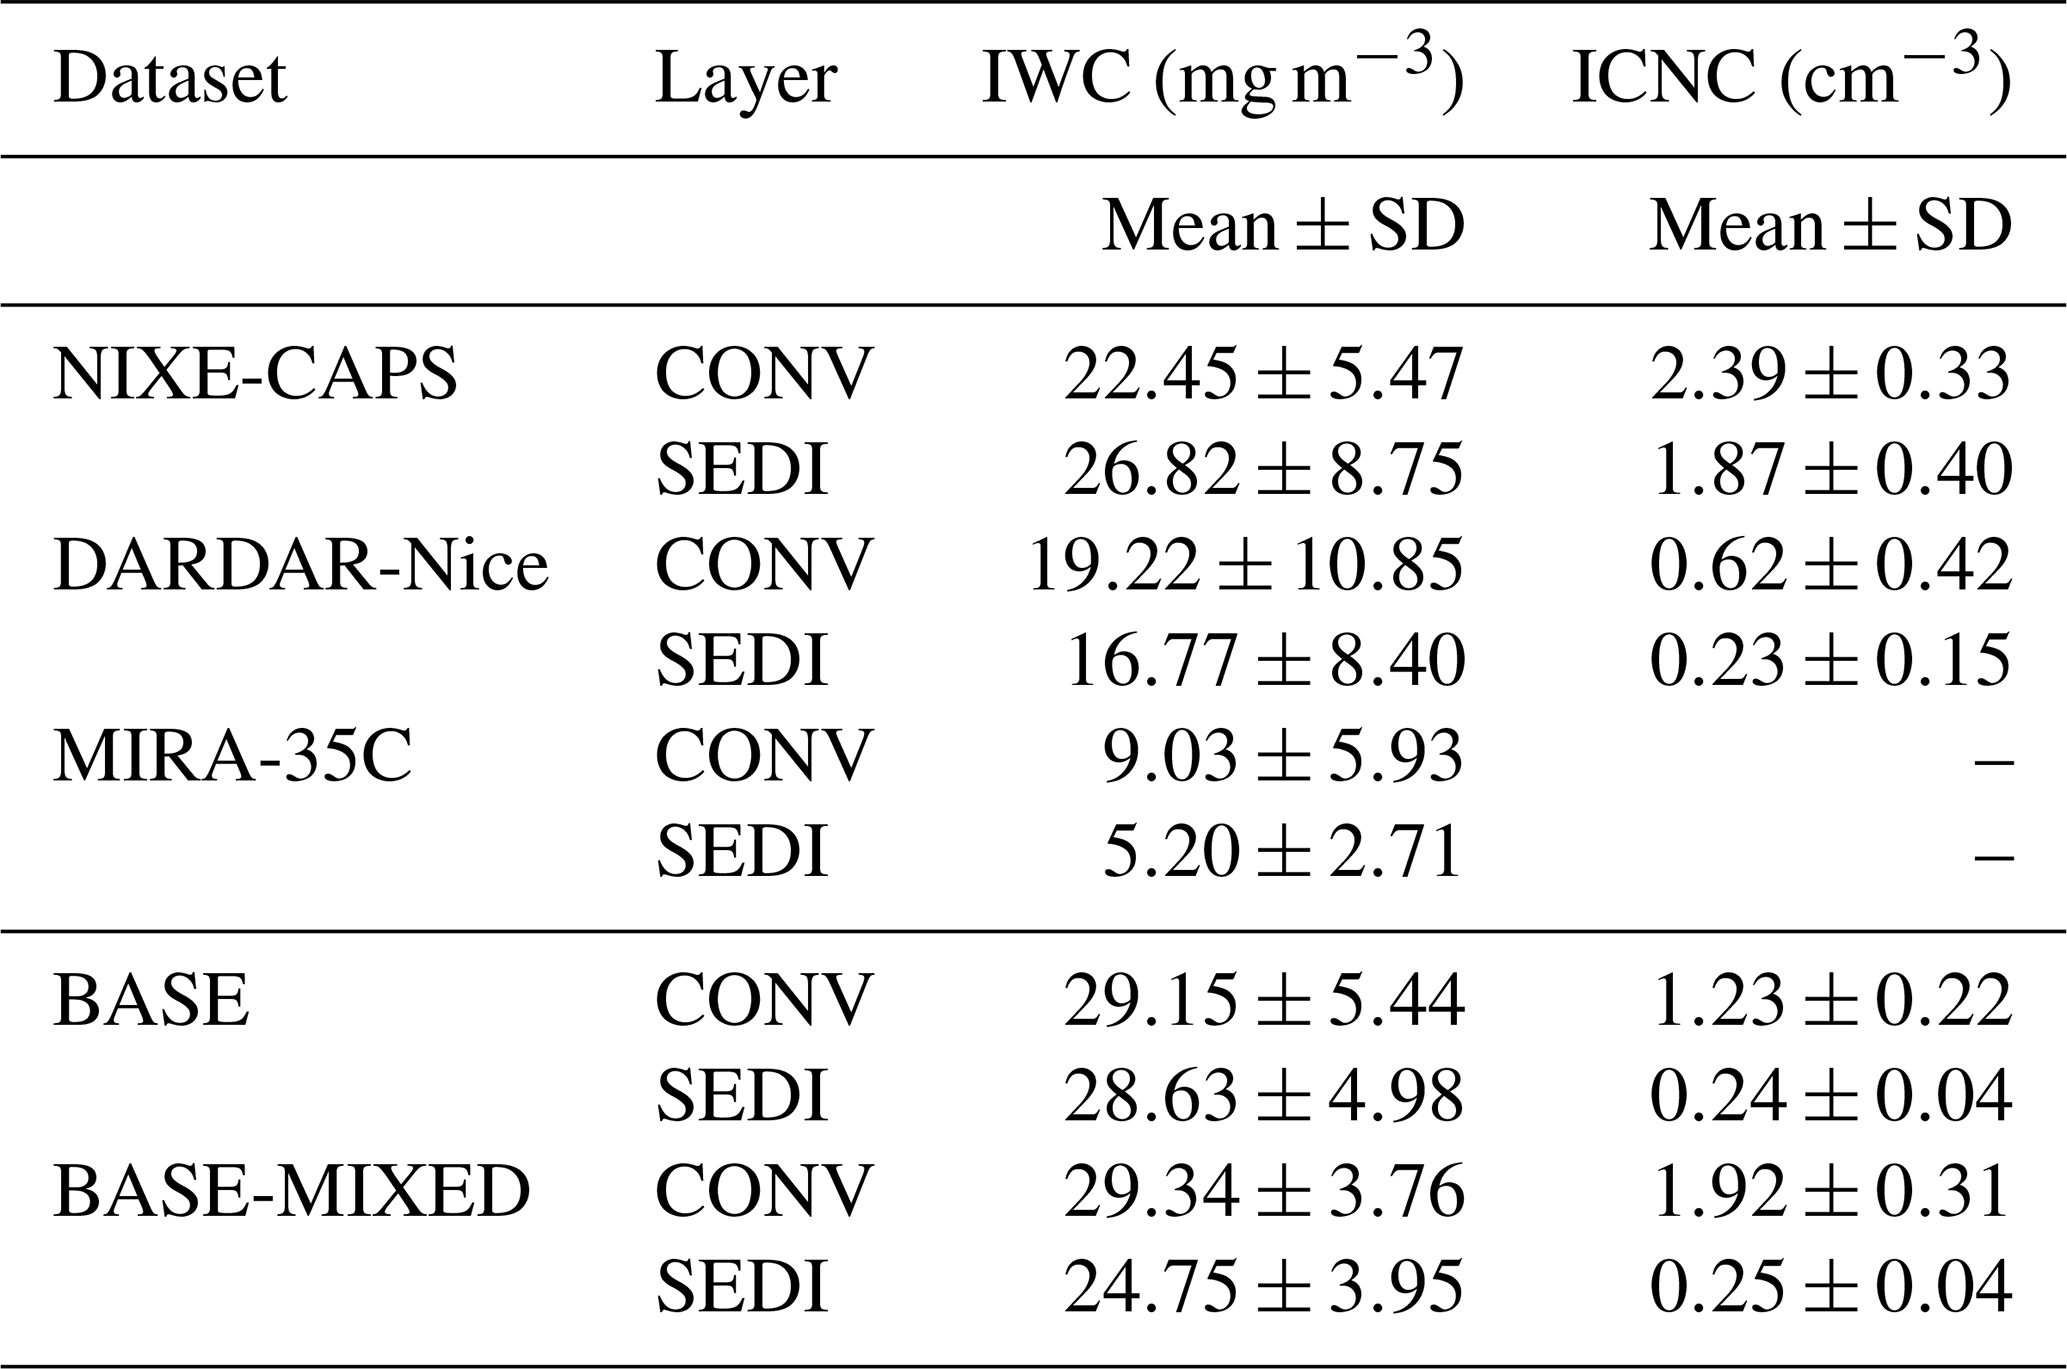
For ICNC, the vertical profile has a very similar shape to the IWC profile in the CONV layer (Fig. 9b) for both BASE and BASE-MIXED cases. The modeled ICNC varies within a range comparable to that observed by NIXE-CAPS, although the NIXE-CAPS mean ICNC is approximately 1.9× and 1.2× higher than the BASE and BASE-MIXED means, respectively. The comparison of mean ICNC between the model and NIXE-CAPS is, however, subject to sampling uncertainty because NIXE-CAPS covers only approximately 500 m of the CONV layer, while the agreement is good at the uppermost altitude sampled by the measurements. In the SEDI layer, the mean NIXE-CAPS ICNC is 1.87 cm−3, compared with 0.24 and 0.25 cm−3 for BASE and BASE-MIXED, respectively. Thus, the observed mean is approximately 7.8× and 7.5× higher than the modeled means, and the NIXE-CAPS ICNC values exceed the full range simulated within the LES domain. The HALO aircraft had a horizontal footprint of approximately 23–24 km during the ascent between 8 and 8.8 km altitude with a true air speed of roughly 190 m s−1, corresponding to approximately 190 m horizontal sampling resolution for NIXE-CAPS. This is comparable to the LES model domain horizontal extent of 24 km and its 150 m horizontal resolution, providing good scale-wise comparability. The lack of similarly high ICNC values in the model and NIXE-CAPS measurements within the SEDI layer suggests that processes in the model setup or microphysical treatment may contribute to the difference. This is discussed further in Sect. 3.3.
DARDAR-Nice estimates of ICNC for ice particles with Di>5 µm show a very similar vertical profile to the model results. In the CONV layer, however, the DARDAR-Nice mean ICNC of 0.62±0.42 cm−3 is approximately 50 % lower than the BASE mean and 68 % lower than the BASE-MIXED mean. Its variability is nevertheless substantial, with a standard deviation of 0.42 cm−3, exceeding that of BASE at 0.22 cm−3 and being comparable to that of BASE-MIXED at 0.31 cm−3. In the SEDI layer, the DARDAR-Nice mean of 0.23±0.15 cm−3 is close to the modeled means of 0.24±0.04 cm−3 for BASE and 0.25±0.04 cm−3 for BASE-MIXED. To ensure comparability between the model, NIXE-CAPS, and DARDAR-Nice, we also calculated ICNC for ice particles larger than 5 µm for both NIXE-CAPS and the model. This resulted in only marginal changes to ICNC, suggesting that the DARDAR-Nice estimates should be representative of the total ICNC. Although the DARDAR-Nice and model ICNC profiles agree reasonably well, the larger NIXE-CAPS ICNC values in the SEDI layer cannot be uniquely attributed to model processes. The model is forced along a single ERA5-derived trajectory between 03:00–09:00 UTC, while DARDAR-Nice provides observations from the 12:30 UTC CloudSat overpass. The final model state was selected to have a thermodynamic state comparable to that observed during the CloudSat overpass, providing a useful basis for comparison, but the difference in sampling time means that the observations and model do not necessarily represent the same stage of cloud evolution. The difference in ICNC measured from different observation techniques gives some indication of the level of observational uncertainty. Given the model ICNC is found within this range, it gives confidence in the model.
Additionally, although we do not have full coverage of dust measurements up to the top of the dusty cirrus layer, the model results indicate that dust mixes very efficiently throughout the dusty cirrus layer. The OPC measurements agree with the trend visible above 8 km in the model, where the dust concentration decreases, as shown in Fig. 9c. The BASE simulation shows the highest similarity to the OPC measurements, while BASE-MIXED remains within the observed variability but generally lies toward its upper range.
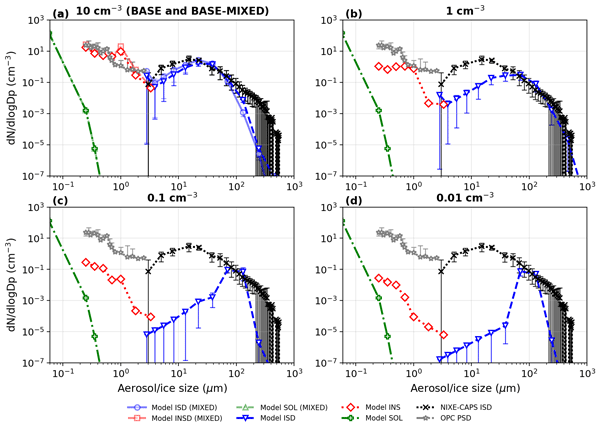
We compare the ice PSD at 9.5 km level for BASE and BASE-MIXED simulations in Fig. 10a, where the ice crystals observed with NIXE-CAPS were most likely formed in the convectively driven cirrus (CONV layer). NIXE-CAPS measurements shown in the Fig. 10 represent measurements at constant altitude leg between 09:25–09:40 UTC when HALO was flying inside cirrus with nearly constant mean ICNC conditions. The small variability of concentrations at smaller sizes show that ice PSD also did not vary significantly outside of the mean. At 9.5 km level, the modeled ice PSD agrees closely with NIXE-CAPS observations in both shape and magnitude showing that the model captures well the ice crystal growth. However, inside the SEDI layer (below 9 km), concentration of ice sizes below Di<40 µm are underestimated as DIN was not particularly active at the final model time step due to strong suppression of RHi influenced by high IWC.
The large number of ice below 30 µm in Fig. 10a, in both observations and model, indicates that the measured ice was most likely very recently formed. We think that the measurement variability in ice PSD for smaller sized ice comes partially from the influence of background aerosol PSD overlapping with the ice PSD, since the NIXE-CAPS cannot distinguish between ice and aerosol particles. NIXE-CAPS (bins above 3 µm) measurements below the cirrus layer showed that aerosol concentrations were relatively high even at 10 µm. For Fig. 10, we thus subtracted the background aerosol size distribution measured with NIXE-CAPS within the ice category bins which resulted in measured ice PSD to agree better with the modeled ice PSD.
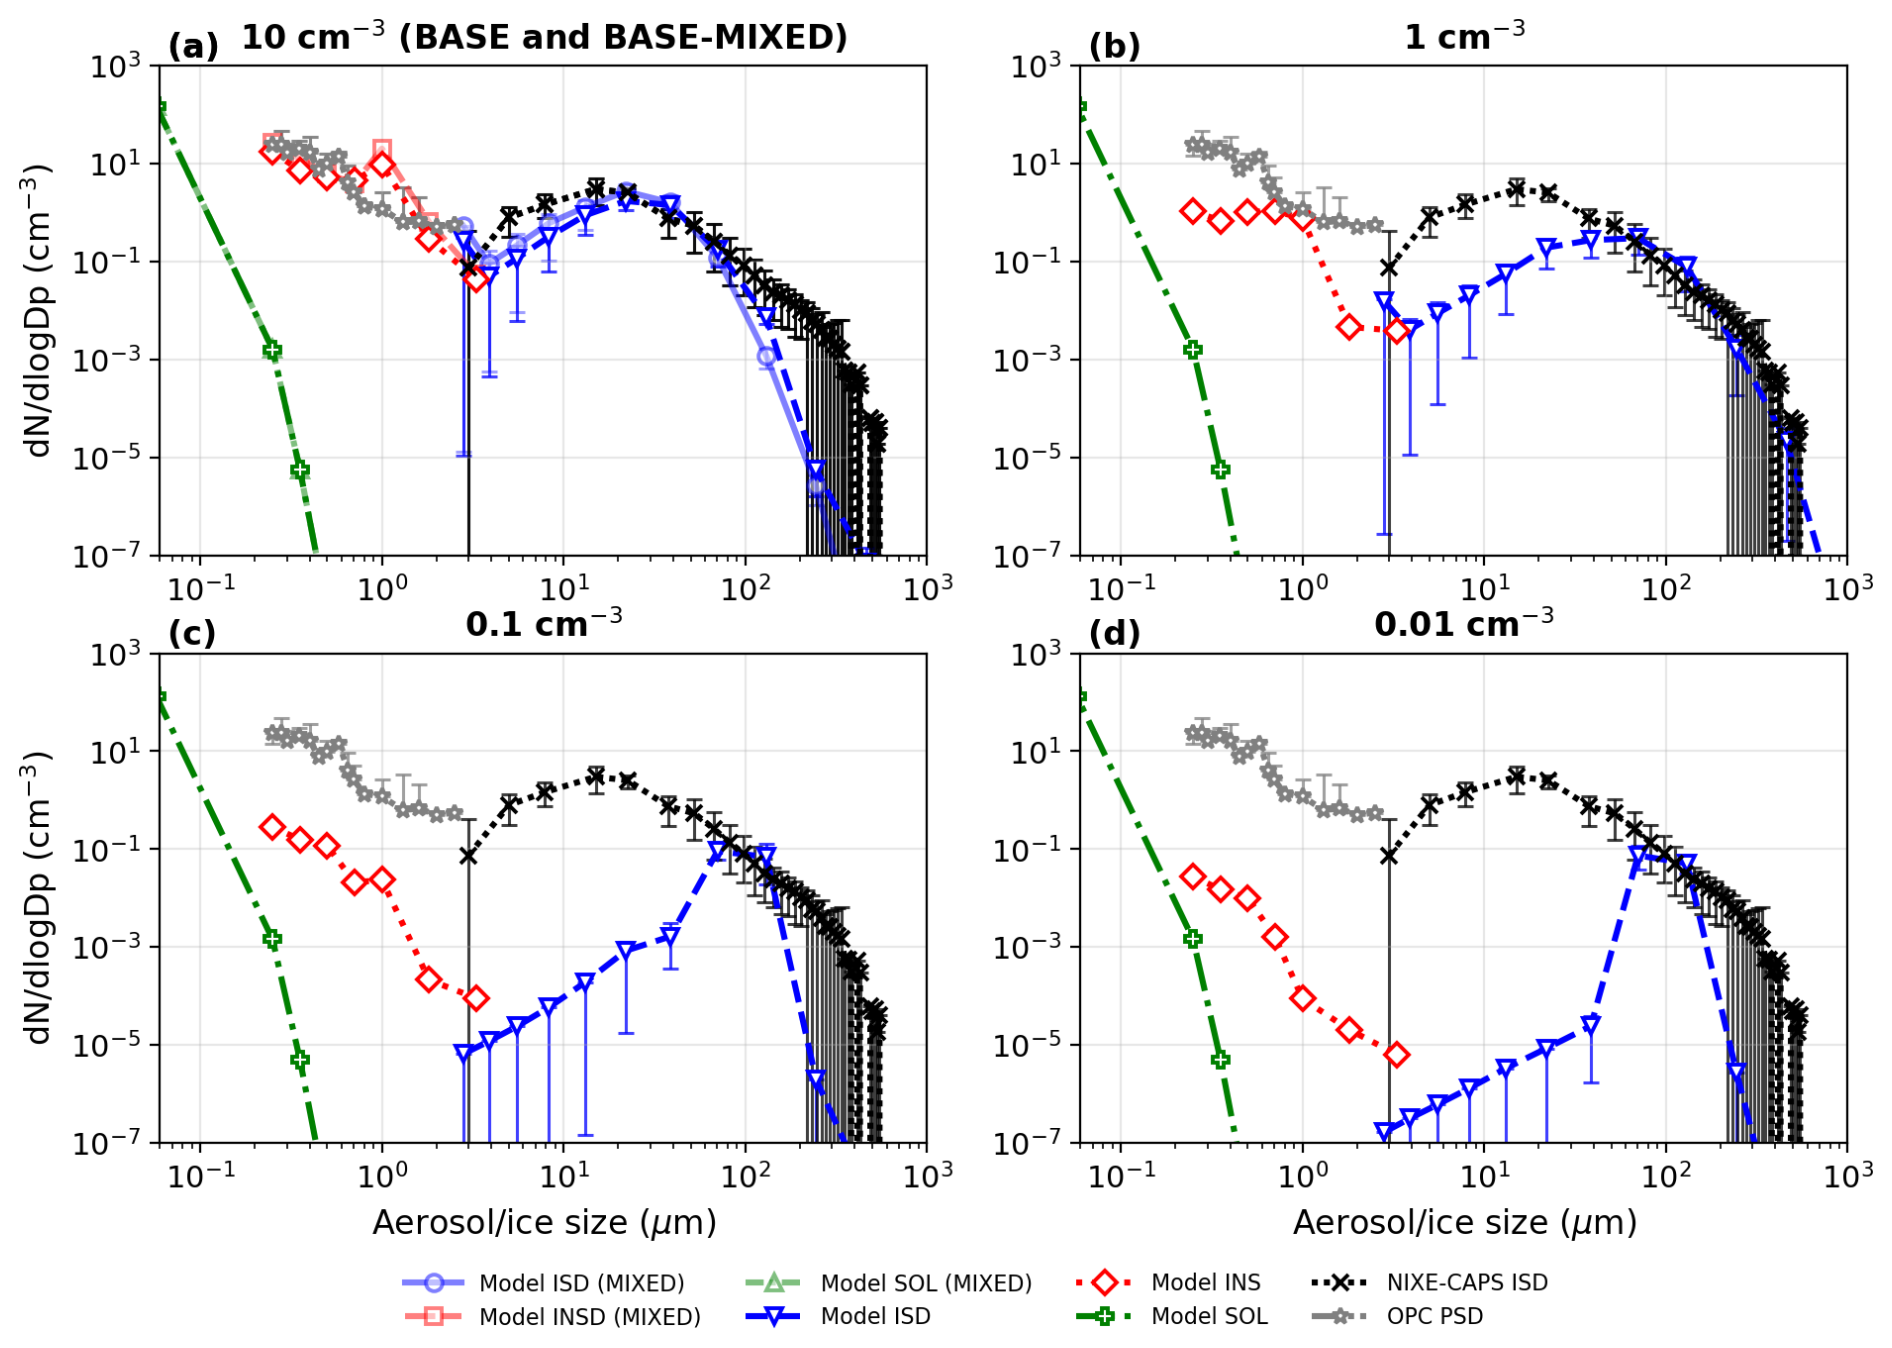
Figure 10Particle size distributions of SALSA output for varied ND (10, 1, 0.1 and 0.01 cm−3) (a–d) and NIXE-CAPS measurements. Model level for 9.5 km was used to compare with measurements at constant altitude leg between 09:25 and 09:40 UTC at 9.5 km level inside the cirrus with corresponding temperature T=223 K. The panel (a) represents the BASE and BASE-MIXED simulation PSDs. INS stands for insoluble PSD and SOL for soluble PSD. ISD stands for ice PSD. Error bars represent the 1-σ variability around the mean in each bin.
3.3 Choice of DIN scheme and sources of ICNC uncertainty
3.3.1 Comparison of DIN schemes
DIN is the primary driver of ICNC in the simulated dusty cirrus. To assess the sensitivity to the choice of parameterization, simulations using H14, U17, and P13 are compared (Fig. 11). While the overall dynamical structure of the cirrus remains similar across simulations, substantial differences arise in ICNC and its vertical distribution.
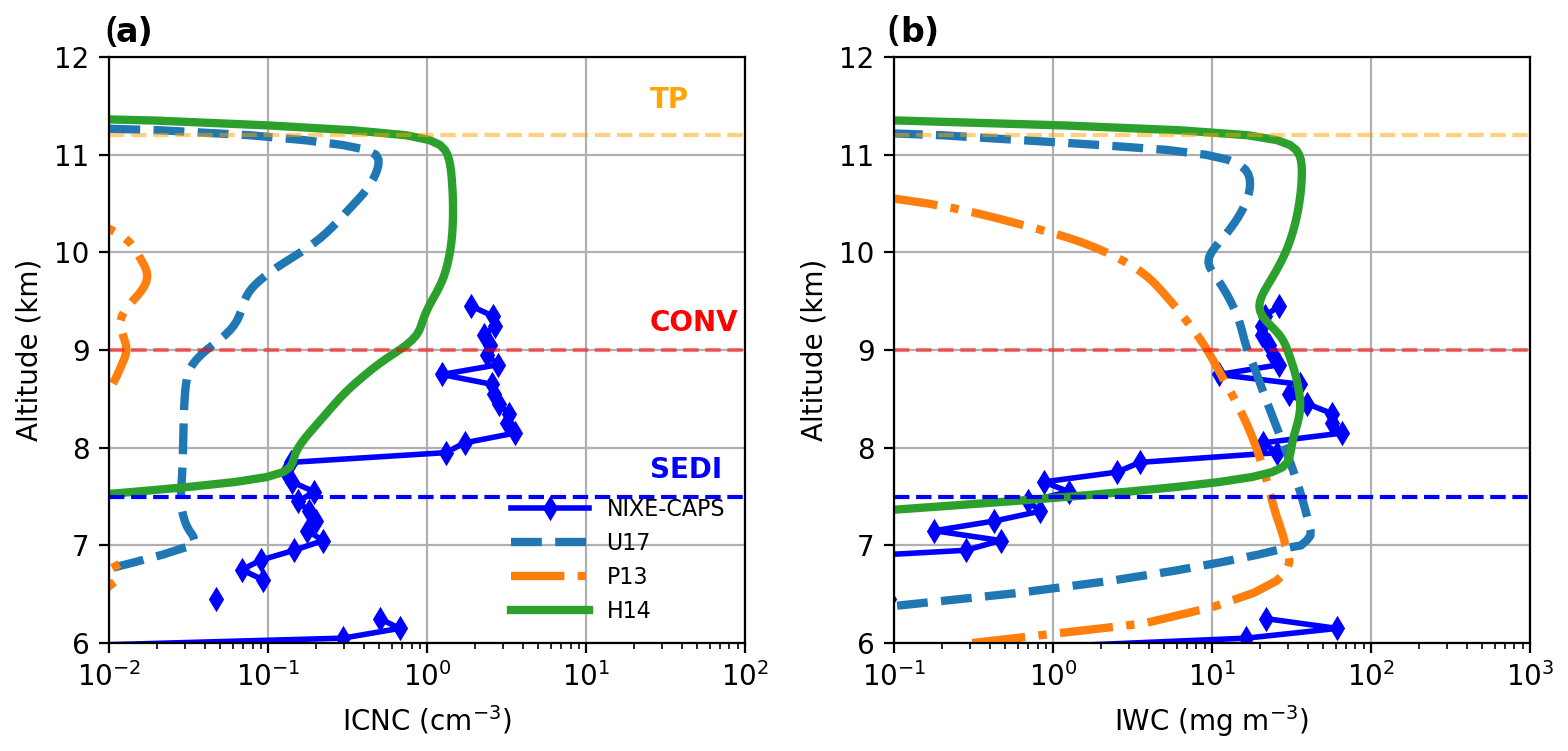
Figure 11Model domain means of (a) ICNC and (b) IWC at the last time step of simulations using complimentary parameterization schemes for DIN (U17, P13, H14) versus NIXE-CAPS measurements.
These differences originate from the distinct temperature and RHi dependencies of the parameterizations at temperatures below 230 K (as shown in Fig. C1). The H14 scheme assumes a relatively low RHi threshold and weak temperature dependence between K, corresponding to temperatures at CONV, thus resulting in vertically more homogeneous ICNC profiles. In contrast, U17 produces increasing nucleation efficiency toward colder temperatures, producing maximum ICNC near cloud top with positive vertical gradient throughout the CONV layer. The P13 scheme on the other hand produces the lowest ICNC among all simulations, with ICNC only exceeding 10−2 cm−3 with substantially weaker nucleation activity. The P13 IWC profile shows a clear lack of high IWC cloud top feature present in H14 and U17 cases. The dusty cirrus convection collapsed in the P13 case as the LW cooling was not sufficiently sustained by the low ICNC and IWC. This behavior is consistent with previous findings in Weger et al. (2018), where they reported underestimation of cirrus evolution using the Phillips et al. (2008) (formulation updated in Phillips et al. (2013)).
The earlier onset of ice nucleation in H14, due to higher DIN activity at warmer temperatures, promotes depositional growth under conditions of higher water vapor availability (e.g., Murphy and Koop, 2005), leading to enhanced IWC compared to U17. This contributes to stronger latent heating within the convective layer and supports the maintenance of its vertical extent. These results demonstrate that the choice of DIN parameterization exerts a major control on ice formation, cloud structure, and associated radiative feedbacks. Among the tested schemes, H14 provides the closest agreement with observations and is therefore used as the baseline parameterization in this study.
Despite simulations using different parameterization schemes, a clear difference of ICNC remains at lower parts (SEDI) of the dusty cirrus compared to measurements, indicating limitations in current ice nucleation parameterizations. Laboratory studies have shown that certain mineral dust types, such as clay minerals, can nucleate ice efficiently at RHi values close to ice saturation (Möhler et al., 2006; Koehler et al., 2010; Welti et al., 2009, 2014), with weaker temperature dependence than represented in H14. Furthermore, the use of INAS density formulations may underestimate nucleation efficiency for smaller particles, particularly below 230 K where particle size dependence has been found to be weak (Welti et al., 2009). None of the parameterizations used in this study fully capture this high nucleation efficiency, which likely contributes to the ICNC underestimation.
3.3.2 Possible sources of the ICNC uncertainty
The results above show the choice of DIN parameterization strongly affects the simulated ICNC. However, the remaining discrepancy between simulated and observed ICNC in the SEDI layer cannot be attributed to DIN alone. As discussed in Sect. 3.2, differences in sampling location and time, the limited vertical coverage of NIXE-CAPS, and differences in measurements and retrieval characteristics introduce observational and representativeness uncertainties into this comparison. These uncertainties prevent the discrepancy from being uniquely attributed to model deficiencies, but they do not exclude contributions from model-related processes. In this subsection, we examine additional process-level uncertainties in the representation of ice growth, sedimentation, sublimation, and homogeneous freezing. We then discuss uncertainties associated with the model inputs and experimental design, including the ERA5-derived large-scale vertical velocity and the representation of subgrid-scale turbulence.
To grasp the full picture of how the ICNC is controlled in the modeled dusty cirrus, we examine the ICNC tendencies to assess the contribution of these processes. Figure 12 shows the contributions of DIN, sedimentation, vertical transport, and sublimation to the ICNC tendency at different levels for the H14 simulation. Overall, DIN is the dominant source of ICNC within the CONV layer. Ice nucleation rates for immersion and homogeneous freezing were not included because they are both at zero. Sublimation, in contrast, provides the strongest sink of ICNC in the lower half of CONV, particularly at levels associated with the descending branches of convection, where RHi is also likely to be the lowest. Vertical transport exhibits a net negative ICNC tendency in the upper half of CONV and a positive tendency in the lower half. Interestingly, the vertical transport profile closely reflects the structure of the descending branches. When the transport is separated into ascending and descending branches, the local tendencies associated with vertical transport can be substantially larger than those of the other processes. Near the cloud top, upward vertical transport increases ICNC by lifting ice crystals towards the tropopause, while sedimentation produces an opposing tendency as the ice crystals subsequently fall back towards lower levels. Thus, the vertical transport and sedimentation tendencies exhibit opposing profiles near the cloud top. Despite the large local contributions of individual processes, their net ICNC tendencies within CONV are relatively homogeneous throughout the layer.
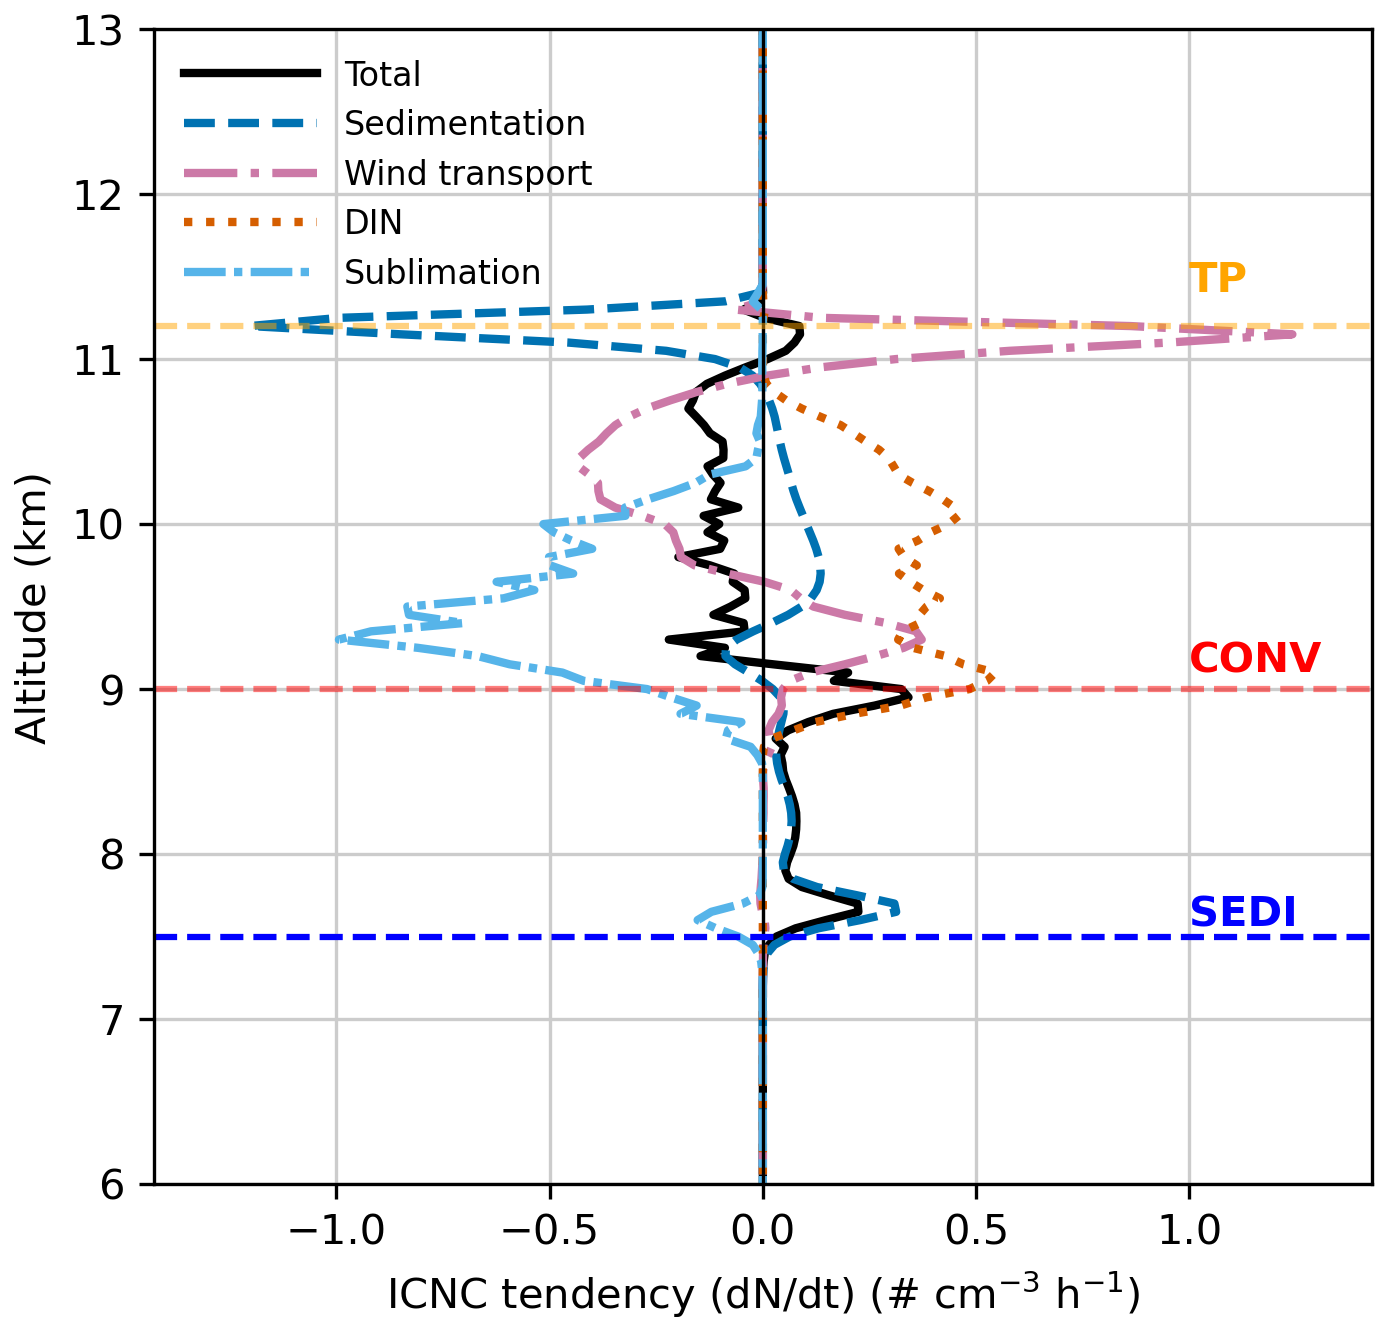
Figure 12Horizontal mean tendencies of ICNC as a vertical profile at the last time step of the BASE simulation.
On the other hand, sedimentation dominates the ICNC tendency in the SEDI layer, as expected. DIN does not contribute substantially to new ice formation because H14, U17 or P13 produces little additional ice under conditions close to ice saturation. One possible cause for the lower ICNC in the H14 simulations compared with NIXE-CAPS observations is an underestimation of sedimentation velocities. UCLALES-SALSA uses a relatively coarse representation of ice crystal habits, with only bullet rosettes considered for particles larger than 40 µm. Although large in-situ cirrus crystals are often dominated by rosette-type habits, Lawson et al. (2019) also reported substantial populations of irregular and spheroidal crystals above 40 µm. The sedimentation parameterization for bullet rosettes with a maximum diameter of 100 µm gives terminal velocities approximately four times lower than those of spherical particles of the same size (Sölch and Kärcher, 2010, Fig. A1). A larger contribution from faster-falling spherical and irregular crystals could therefore increase sedimentation flux and modify ICNC in the SEDI layer. Interestingly, NIXE-CAPS measurements show a similar ice PSD shape throughout the SEDI layer between 8 and 9.5 km (Fig. S8 in the Supplement). We estimate that ice crystals of size 20 µm have terminal velocity of only approximately 2 cm s−1, corresponding to a fall distance of about 72 m h−1. Together with the conditions near ice saturation in SEDI (Fig. 3a), this low fall speed makes persistence of the small ice crystals physically plausible, as the mean depositional growth or sublimation rate would be small. At the same time, a broad tail in ice PSD in Fig. 10a is indicative of sedimentation affecting the PSD.
Another mechanism beside DIN at cirrus conditions for ice nucleation is homogeneous freezing. At the temperatures considered, however, homogeneous nucleation would require RHi values of approximately 140 %–150 %, with the threshold increasing with decreasing temperature. In the BASE simulations, efficient DIN and sedimentation reduces RHi before this threshold is reached, effectively suppressing homogeneous freezing. As a result, homogeneous freezing did not contribute to the ICNC in the BASE simulation. For example, in the BASE simulation (Fig. 13a), large-scale ascent increases RHi up to about 110 % below 9 km (SEDI), but sedimentation from above and in-situ ice formation limit further increase in RHi, preventing the onset of homogeneous freezing. A similar sedimentation-related suppression and homogenization of RHi was reported by Kärcher et al. (2025): RHi exhibited substantially greater variability when sedimentation was omitted than when it was included. Within the CONV layer, DIN and sedimentation maintain RHi near saturation over ice due to large ice-nucleation-active dust particles.
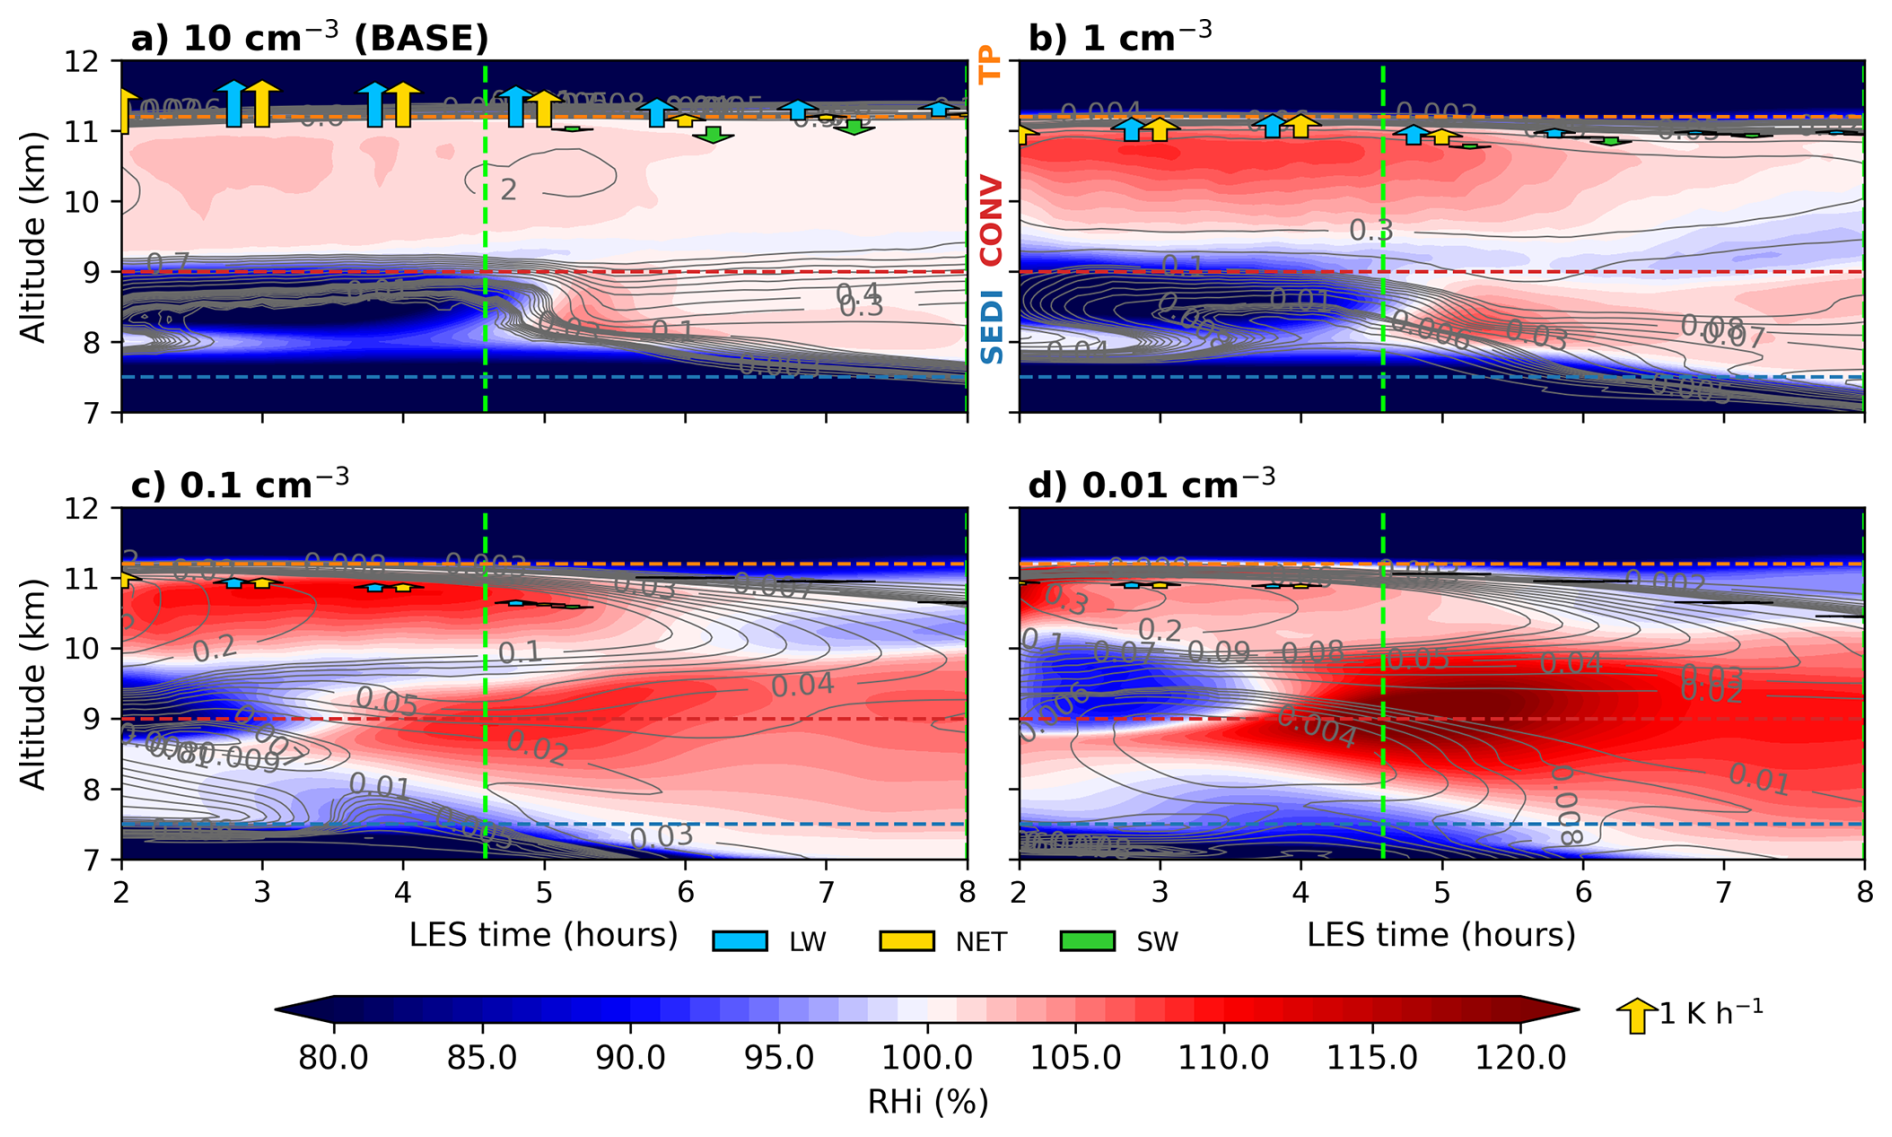
Figure 13Horizontal means of RHi (shading) and ICNC (contours, cm−3) within the cirrus for different initial ND in descending order (a–d). The green dashed vertical line indicates the onset of SW radiation. Upward yellow arrows indicate the maximum net radiative cooling at the cloud top, LW cooling in blue arrows and SW heating in downward green arrows.
In addition to these process-level uncertainties, the comparison is affected by uncertainty in the imposed ERA5-derived wLS. This uncertainty may be particularly important for ICNC in the SEDI layer, where resolved convective motions are weaker than in the CONV layer and large-scale ascent strongly influences the temperature and RHi evolution. Figure 13a shows that ICNC varies substantially in the SEDI layer during the BASE simulation, whereas it remains comparatively stable in the CONV layer, suggesting that the SEDI layer is more sensitive to the evolving large-scale forcing. The actual large-scale ascent may have differed from the ERA5 trajectory, producing periods of stronger ascent, higher RHi, and enhanced ice nucleation in the SEDI layer. A further limitation is that turbulent motions below the LES grid scale are represented through the subgrid-scale closure rather than explicitly solved. Such fluctuations could produce local pockets of RHi that are smoothed within a grid cell, potentially creating conditions favorable for DIN even when the resolved RHi remains close to ice saturation. Kärcher et al. (2025) reported that, for efficient INPs such as mineral dust, turbulent supersaturation fluctuations can promote earlier heterogeneous ice formation, thereby enhancing vapor depletion and reducing subsequent homogeneous freezing. As the LES used in this study does not explicitly resolve subgrid-scale turbulence, its effect on the microphysics cannot be quantified in this study.
3.4 Sensitivity to dust number concentration
Figure 10 shows the PSD of aerosols and ice PSD simulated using the H14 scheme compared against in-situ observations at 9.5 km altitude. Mineral dust concentrations (ND≈10 cm−3) consistent with observations produce ICNC and ice PSD in good agreement with the in-situ measurements at 9.5 km, although ICNC is underestimated below 9 km, as discussed in Sect. 3.2. Under these conditions, DIN dominates ice formation when using the H14 scheme. The continuous production of small ice crystals is sustained, maintaining elevated number concentrations below 50 µm and supporting the observed cloud structure.
As ND is reduced toward climatological mid-latitude values (Froyd et al., 2022), the ICNC decreases and the mode of the ice PSD shifts toward larger particle sizes. This reduction in ND leads to insufficient ice production to sustain the observed cloud properties. In particular, for ND≤0.1 cm−3 cases, the ICNC decreases quickly after the spin up period, indicating that the available INPs are insufficient to sustain the observed ICNC. The reduction in ice production also modifies the thermodynamic and radiative state of the dusty cirrus.
The corresponding IWC response is shown in Fig. 15b. Unlike ICNC, IWC is also constrained by the amount of water vapour available above ice saturation, and its strongest reduction occurs in the cases where the convective structure is lost.
Figure 13 shows the horizontally averaged ICNC and RHi throughout simulations in the ND within range of ND=0.01–10 cm−3. In high ND simulations, DIN remains sufficiently active to maintain ICNC throughout the simulation. As ND decreases, heterogeneous ice production weakens, causing ICNC to decline after the spin-up period. At the same time, RHi increases because less ice is available to consume water vapour through depositional growth.
In the lowest ND≤0.1 cm−3 simulation, the resulting increase in RHi eventually triggers homogeneous freezing, producing initially high ICNC. Thus, homogeneous freezing partially compensates for the reduced heterogeneous ice production, while homogeneous freezing is unable to maintain the convective structure.
Because this compensating contribution from homogeneous freezing is unsustainable, it does not restore the ICNC required to maintain radiative-dynamical feedback of the dusty cirrus. For ND≤0.1 cm−3, the decrease in ICNC weakens LW cooling at the cloud top (Fig. 13). Once SW becomes important during daytime, the weakened LW cooling is no longer sufficient to offset the SW heating. Consequently, the cloud structure transitions from well-defined convective cells to a regime dominated by shear-induced perturbations in vertical velocity, indicating loss of persistence as shown in the Fig. 14. In contrast, for ND≥1 cm−3, ice production remains sufficient to sustain convective structure until the end of the simulations. Nevertheless, the morphology of the dusty cirrus depends on ND. In the ND=10 cm−3 (BASE) simulation, the cloud covered area is relatively homogeneous, with small clear gaps in-between the cells. At ND=1 cm−3, the cells are more separated with weaker vertical velocity gradient, reflected in reduced ICNC. The organized convective structures simulated for ND=1–10 cm−3 are broadly consistent with those observed in the Moderate Resolution Imaging Spectroradiometer (MODIS) (On board TERRA, Vermote, 2015) corrected reflectance imagery in Fig. 14e over the model target region and its surroundings. The comparison should nevertheless be interpreted cautiously. The observed cells vary considerable in width and shape, whereas the limited LES domain cannot reproduce the full range of spatial orgnaization. Simulations with a larger horizontal domain would be required to investigate the larger mesoscale structures and spatial variability of dusty cirrus convection.
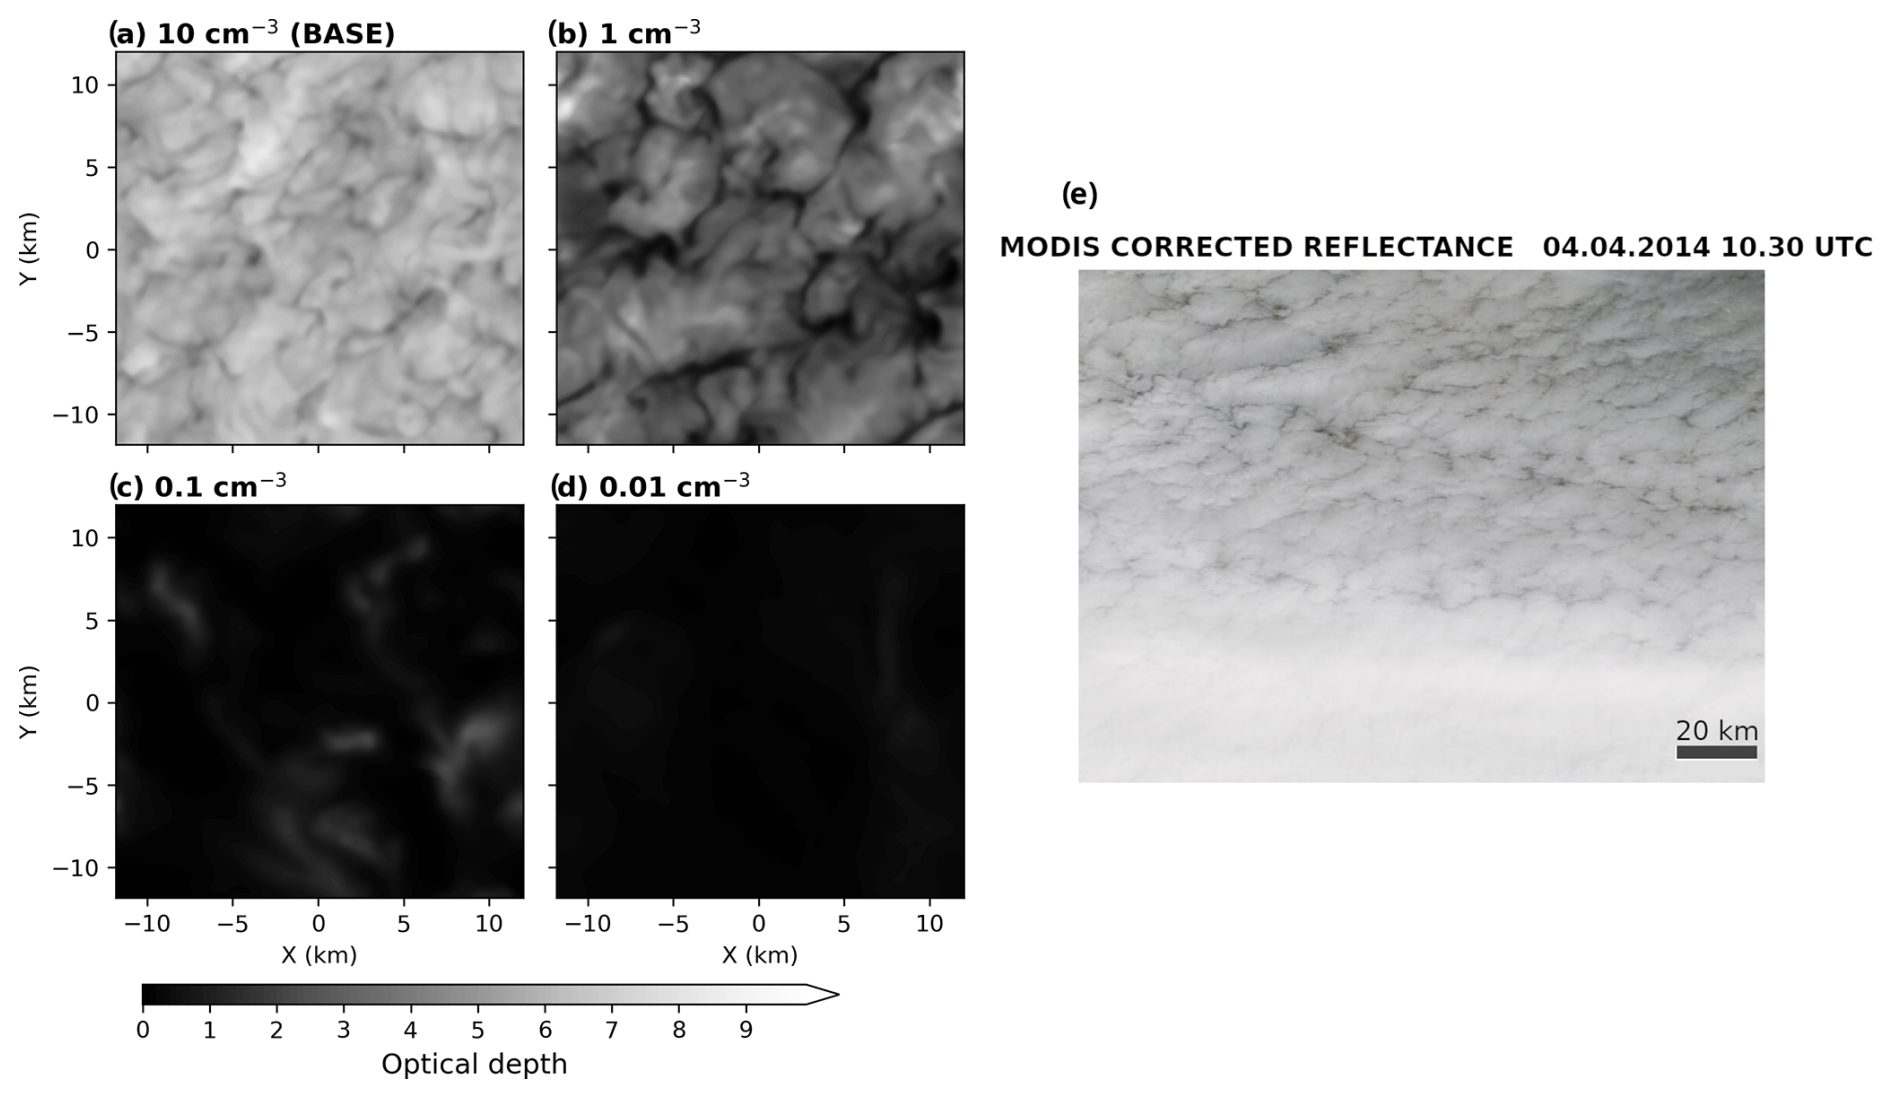
Figure 14Optical depth for cirrus for varied ND (a–d) at the last model time step corresponding to 09:00 UTC. Panel (e) shows detailed view of cirrus observed by MODIS at visible spectrum at 10:30 UTC around HALO measured area.
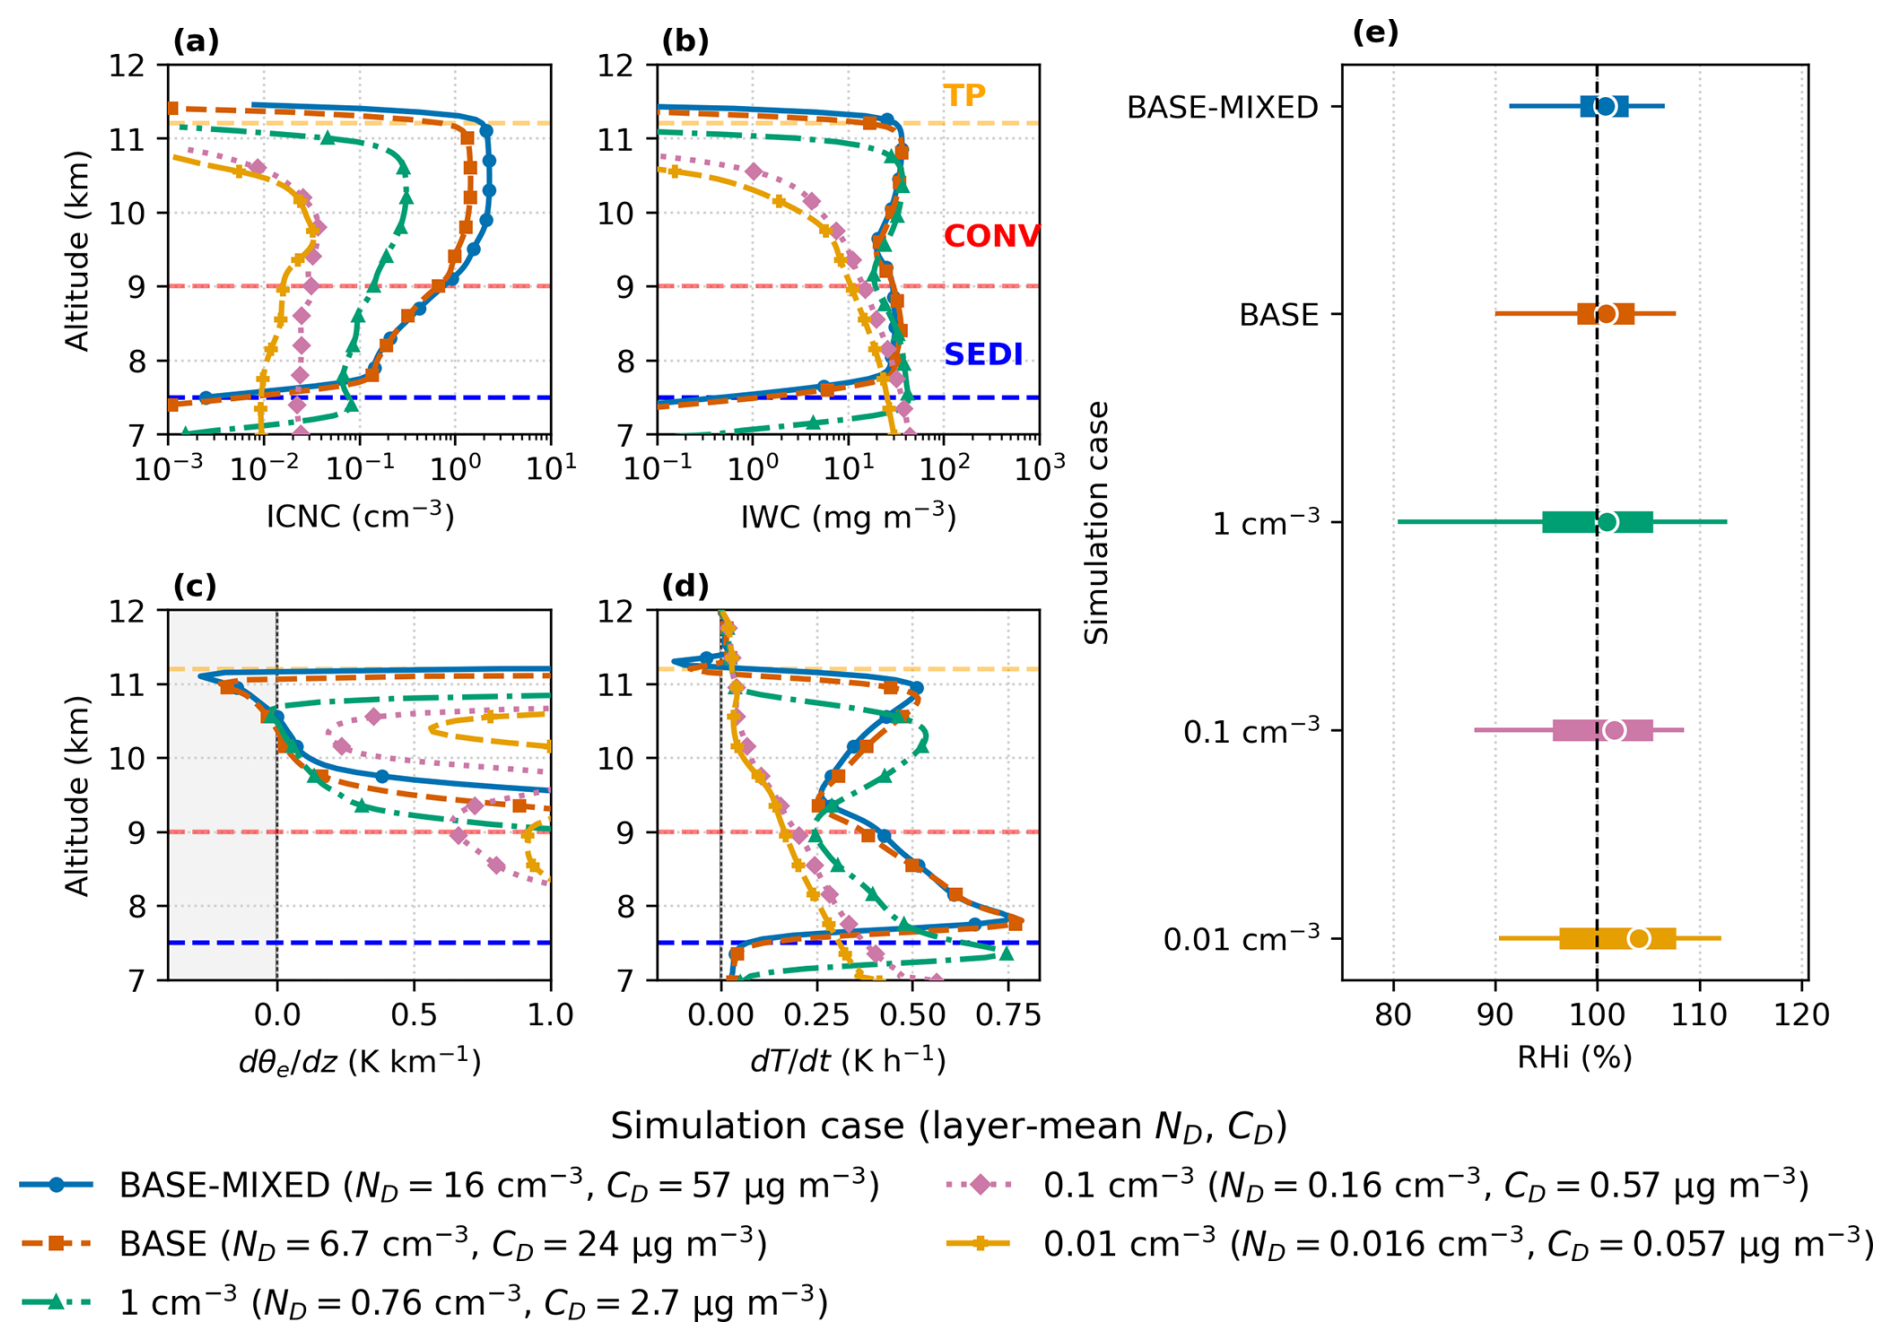
Figure 15Final-state vertical profiles for the five simulations: (a) ICNC, (b) IWC, (c) vertical gradient of equivalent potential temperature, and (d) net radiative temperature tendency diagnosed from the LW and SW cooling/heating rates. Negative values in panel (c) indicate potentially unstable layers, highlighted in grey; negative values in panel (d) denote net radiative heating/cooling. (e) Distributions of RHi at the final time in the CONV (9–11.2 km): horizontal bars span the 5th–95th percentiles, thick lines show the interquartile range, and dots mark the median. The dashed line denotes ice saturation (RHi=100 %). The ND values shown in the legend represent the initial layer-mean dust number concentration for each sensitivity simulation, averaged over the CONV-layer levels where dust-induced ice nucleation occurs. The corresponding CD values represent the initial layer-mean dust mass concentration over the same levels.
The dynamical response is also reflected in the relationship between ND and atmospheric static stability. The equivalent potential temperature gradient, , shown in Fig. 15c, provides a physically consistent diagnostic for dusty cirrus persistence because it indicates whether the dusty cirrus layer can maintain the conditional instability required for continuous generation of new convective cells and, consequently, new ice crystals. For ND≥1 cm−3, negative values of are found within the CONV layer, indicating that radiative cooling (Fig. 15d) is sufficient to generate conditional instability. For ND<1 cm−3, becomes positive, supporting the interpretation presented in Fig. 14 that the generation of new convective cells is no longer sustained. In the borderline case of ND=1 cm−3, the sufficiently large vertical gradient in temperature tendency (Fig. 15d) can sustain conditional instability despite the absence of strong cooling at the cloud top. Together, these results indicate a threshold of approximately ND≈1 cm−3 for maintaining the radiative-dynamical feedback and persistent convective structure in the simulated dusty cirrus.
The ND threshold for sustained convection can be further interpreted in terms of the dust properties that control heterogeneous ice nucleation. Since the INAS-based parameterizations used in this study determine the frozen fraction of particles based on their surface area, the contribution of dust to ice nucleation depends not only on the total number concentration but also on the particle size distribution. Larger dust particles can therefore contribute disproportionately to ICNC even when their number concentration is relatively low. This provides a physical basis for considering dust mass concentration (CD) in addition to ND when characterizing the conditions required for persistent dusty cirrus.
Figure 16 shows the predicted INP particle size distribution calculated using the Hiranuma et al. (2014) based DIN activity of mineral dust particles at 218 K for two RHi levels, 105 % and 120 %. At higher RHi, submicrometer particles dominate the INP population, whereas at lower RHi, the contributions from submicrometer and supermicron particles are more comparable. In contrast, supermicron particles appear relatively insensitive to RHi and activate at similar concentrations under both conditions. As shown in Fig. 15e, RHi values of 120 % correspond to the upper range within the model domain, while the standard deviation of RHi is only %–5 %. This indicates that conditions closer to RHi=105 % occur more frequently. Consequently, the CD also provides a useful measure of the potential INP abundance and becomes an important predictor of dusty cirrus persistence.
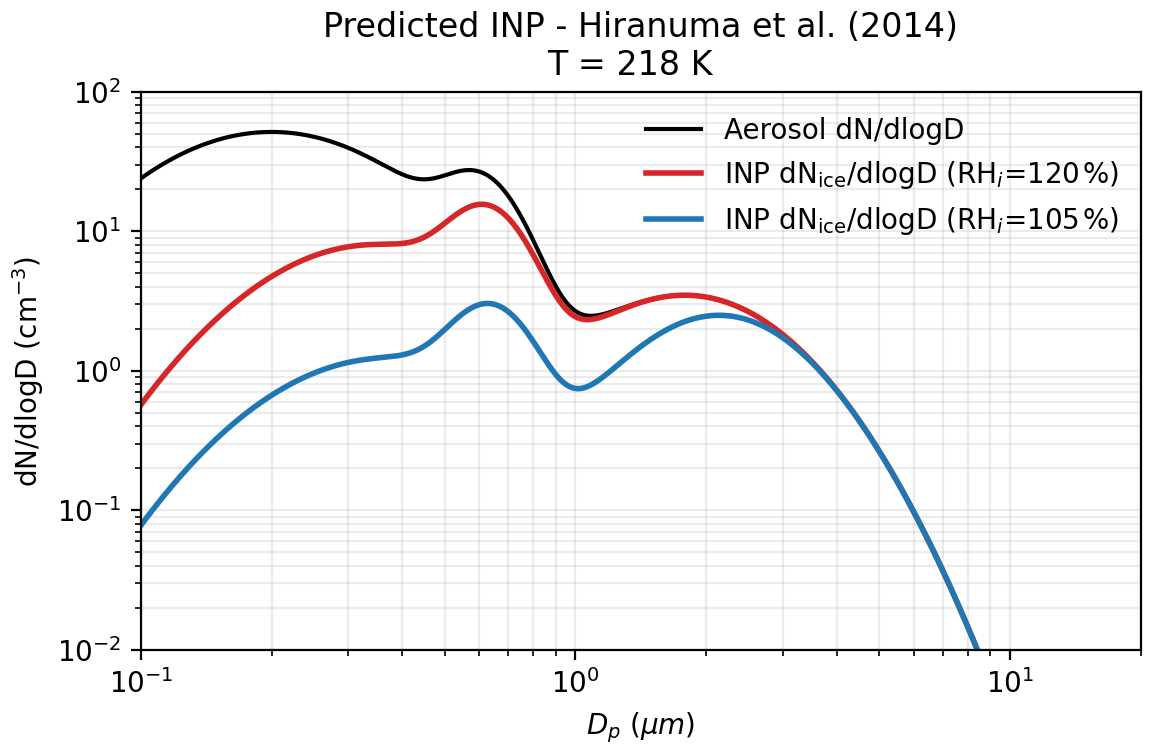
Figure 16Predicted INP PSD calculated using the Hiranuma et al. (2014) based DIN activity of mineral dust particles shown at fixed temperature and two RHi levels. Black line corresponds to the total fit to the OPC data previously shown in Fig. 5.
Figure 15 shows the corresponding CD values for each ND simulation. When the simulations are expressed in terms of dust mass concentration rather than number concentration, the transition between sustained and decaying cirrus occurs at approximately CD≈3 µg m−3, integrated over particle diameters Dp=0.25–6 µm. This threshold should be interpreted as a characteristic value for the conditions examined here rather than as a universal threshold, since the relationship between CD, ND, and INP activity depends on the dust particle size distribution and the thermodynamic state of the cloud.
3.5 Sensitivity to SW radiation and large-scale forcing
The simulated dusty cirrus represents essentially a snapshot of a mature dusty cirrus, and to extend this analysis, additional sensitivity experiments were performed to examine how solar radiation and large-scale vertical velocity modulate the life cycle of dusty cirrus. The simulations include both nighttime and daytime conditions representative of 4 April, together with idealized large-scale vertical forcing scenarios, thus covering the whole diurnal cycle behavior.
Two simulations representing nighttime and daytime are run with only radiation controlling evolution. Additionally, 4 simulations were conducted using a Gaussian vertical velocity forcing profile with peak magnitudes of ±5 cm s−1 under daytime and nighttime conditions. The forcing is strongest in the lower half of the cirrus layer and decreases toward the tropopause, consistent with the ERA5-derived structure used in the BASE case (Fig. 1). Daytime simulations were run for 16 h to capture the full daylight cycle, while nighttime simulations were run for 8 h. Horizontal wind nudging was disabled, as the objective here is not case-specific comparison but process-level understanding of cirrus persistence. Also, as temperature and humidity nudging were not used here, drifting of thermodynamic states between LES domain and actual state of atmosphere is expected. An additional experiment was performed using the aerosol radiation scheme (AERORAD) with the BASE configuration to find whether dust-radiation interaction can have influence on the static stability inside dusty cirrus clouds.
3.5.1 Influence of SW radiation
We first compare simulations without large-scale forcing. Under nighttime conditions (Fig. 17a), the dusty cirrus evolves only weakly over time. ICNC, RHi, and radiative fluxes remain nearly constant, and the cloud layer gradually ascends due to persistent LW cooling near the cloud top. In contrast, the daytime simulation (Fig. 17b) exhibits pronounced temporal evolution driven by increasing SW radiation after sunrise. During the early daytime hours, the cloud properties remain similar to the nighttime case, as SW heating is still weak. The two simulations start to diverge after approximately 4 h, when the SW heating intensifies and reduces the net radiative cooling at the cloud top. The weakened cooling at the cloud top results in weaker convection which shows as decreasing ICNC at the bottom of CONV.
Peak SW heating occurs around hour 8 (solar noon), with mean heating rates of approximately 0.8 K h−1. At this stage, LW cooling remains strong at about −1.4 K h−1, so net cooling of −0.5 K h−1 persists at cloud top. However, SW absorption progressively alters the vertical structure of the cloud. Heating extends deeper into the cirrus layer and increases temperatures especially near 10 km altitude. This warming reduces RHi, since higher vapor content is required to maintain saturation. As a result, the cirrus layer contracts from below, and the cloud base rises by nearly 1 km by the end of the simulation.
Based on the daytime simulation results in Fig. 17b, the impact of SW radiation is self-limiting. As RHi decreases, both the ice nucleation and the depositional growth of the ice crystals weaken, reducing the IWC and ICNC. By the time of peak solar irradiance, the mean ICNC within the dusty cirrus decreases from a peak of 3 cm−3 to around 1.5 cm−3 (about 50 % drop), which in turn diminishes both LW and SW radiative effects. The ICNC drop continues until the final hour of SW radiation (hour 14), with a three fold decrease from the peak ICNC.
The impacts of SW radiation found in this study are consistent with previous findings that cirrus layers tend to reduce static stability under LW cooling at night and increase static stability under SW heating during daytime (Nagy, 2009; Kollath, 2010). Despite the strong influence of SW heating, the dusty cirrus impressively manages to sustain itself and even starts to re-intensify after the SW heating ceases after sunset, as shown in Fig. 17 where the net radiative cooling intensifies between hours 14 and 16, resulting in stronger convection and higher ICNC. As shown in Fig. 9, DARDAR-Nice observations at 12:00 UTC show maintained high ICNC and IWC (corresponding to hour 10 in LES time in Fig. 17), which indicates that the dusty cirrus convection was still sustained under the peak SW radiation as the model results also show. Also, since the model results suggest that ICNC decreases under SW heating, the DARDAR-Nice perhaps would have measured higher ICNC if the overpass timing occurred earlier in the morning hours. Satellite observations from SEVIRI in Fig. 18 also show relatively cold cloud tops at this time, although warming is evident later in the afternoon, suggesting partial weakening of convection, agreeing with the model results. The SW radiation clearly affects the whole dusty cirrus covering large area over Europe in a similar manner with relatively uniform warming in mean brightness temperatures from around 210 K at night to increasing up to 220 K late in the afternoon. The influence of SW radiation seems to accelerate significantly after 12:00 UTC when the SW radiation is peaking. However, because of the cumulative effect that SW radiation has on the dusty cirrus convection based on the simulation results, this increasing trend confirms that the model represents the processes quite impressively. On top of that, the satellite observations also show the re-intensification of dusty cirrus after the sunset with increased occurrence of brightness temperatures found below 210 K. The model based cloud effective temperatures also shown in Fig. 18 indicate that at 12:00 UTC, the dusty cirrus was still sustaining its cold effective temperatures. Cloudsat overpass later in the afternoon might have measured substantially weakened dusty cirrus convective structures with lower ICNC values.
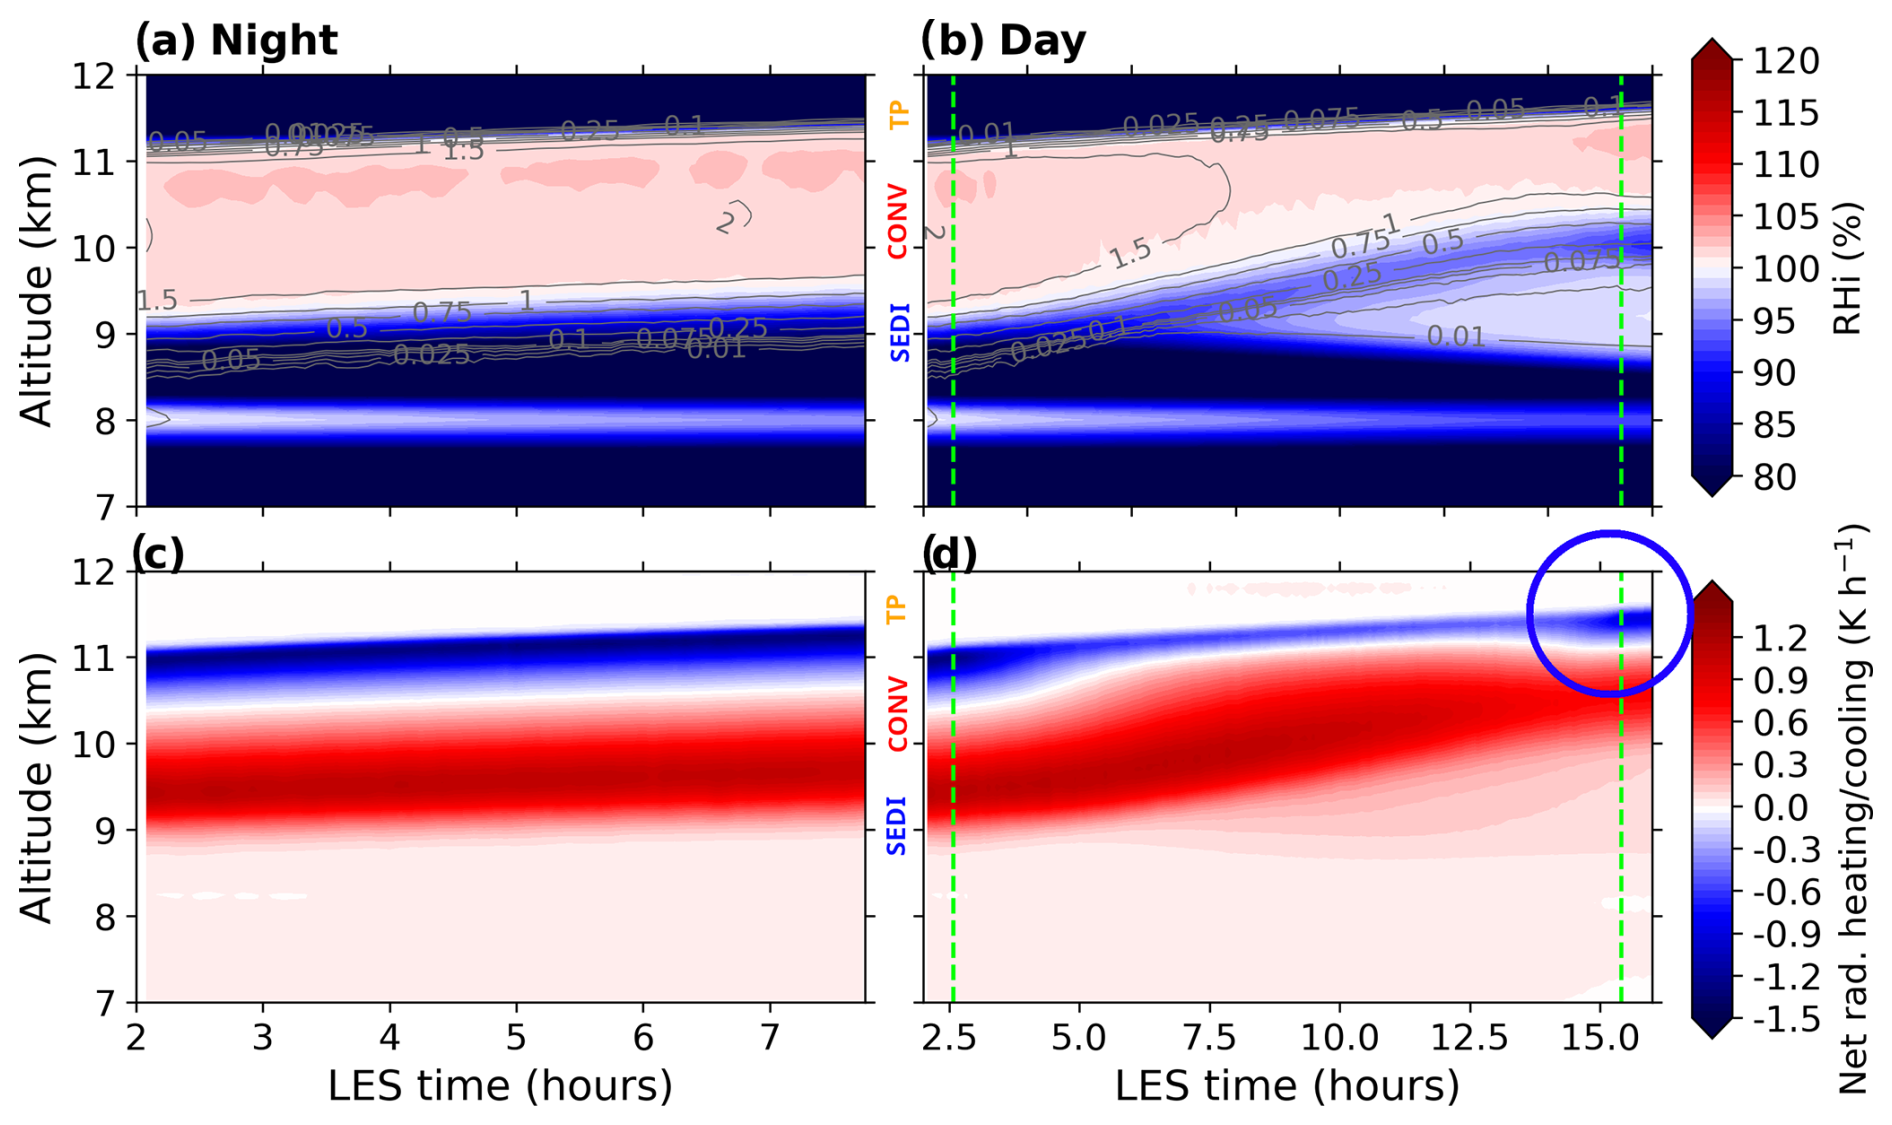
Figure 17Night (a, c) and daytime (b ,d) cases RHi in shading and ICNC (cm−3) in contours in the upper panels. The lower panels show the corresponding net radiative heating/cooling rate. The day case is run for the whole day solar cycle where the downwelling SW radiation at the beginning and at the end of the simulation is close to 0. The vertical dashed line on the left in panels (b) and (d) indicates the time at which solar radiation induces a positive SW flux at the top of the model domain and the second line indicates zero SW flux at sunset. SEDI, CONV, TP have been marked at approximate altitudes since those levels change as dusty cirrus evolves. In panel (d), radiative cooling re-intensification has been highlighted with a blue circled area.
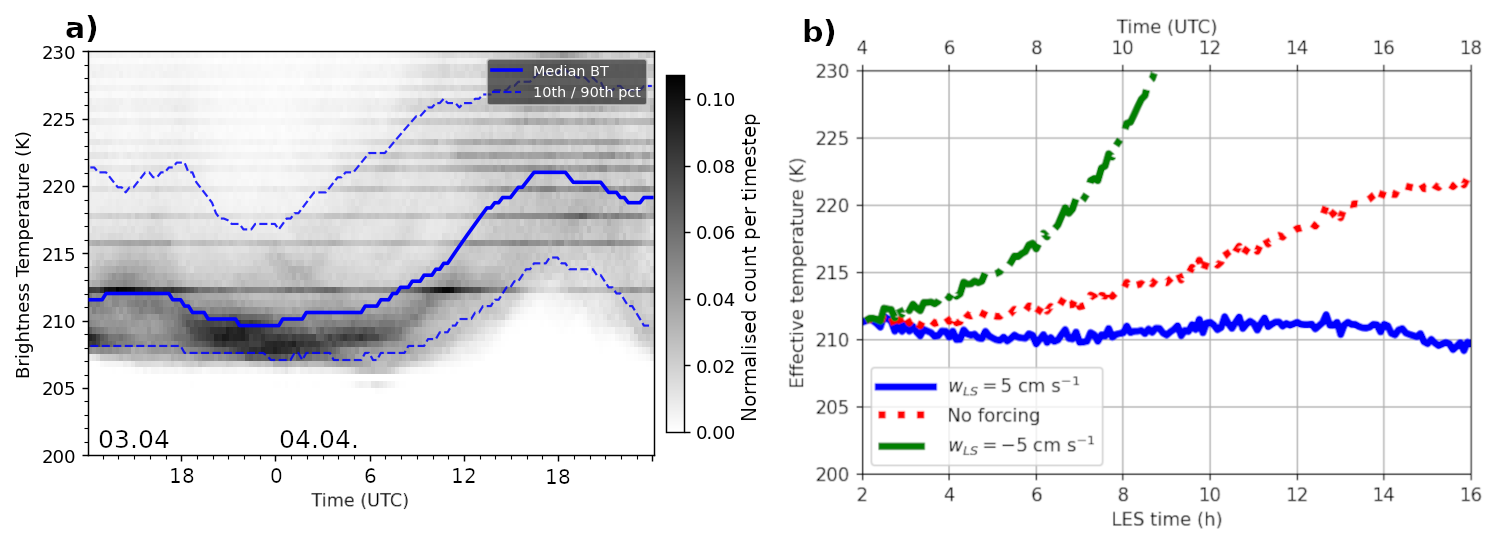
Figure 18Temporal distribution from 3 April 12:00 UTC to 5 April 00:00 UTC of estimated brightness temperatures from SEVIRI MSG for 8.7 µm retrieval (a) and model output based effective temperatures in the model domain representing the daytime model runs (b). Vertical dashed grey lines in (a) indicates LES simulation times between 04:00 and 18:00 UTC. SEVIRI MSG brightness temperatures represent the count per timestep within a box area with constrained between 46.2–49.3° N and 6.2–12.3° E, around the area of cirrus shown in the Fig. 14e.
3.5.2 Influence of large-scale vertical forcing
The role of large-scale forcing is illustrated in Fig. 19. Under upward forcing of 5 cm s−1, the dusty cirrus remains resilient to SW warming. The imposed ascent maintains supersaturation and sustains continuous ice nucleation. The resulting cirrus layer becomes vertically thicker, distributing LW heating more evenly and keeping net heating rates smaller than without forcing. These results demonstrate that the vertical extent of the cirrus layer strongly influences its radiative balance, with thicker layers favoring smaller heating rates. The influence of upward forcing is also visible in the cloud effective temperatures (CET, comparable to cloud brightness temperatures measured by SEVIRI) (Fig. 18), as the CETs increase slightly towards the late afternoon and then either plateau at 220 K or decrease back to the 210 K level. The cooling caused by the large-scale forcing seems to counterbalance the SW absorption induced warming and results in limited warming of CETs.
In contrast, subsidence forcing of cm s−1 leads to fast decay of the dusty cirrus. Convective structures persist for a few hours before collapsing. The response closely resembles the effect of strong SW heating, with decreasing RHi and reduced ice production. In this case, subsidence also lowers RHi at the cloud top, further suppressing convective activity. In contrast at nighttime conditions and with subsidence applied, the dusty cirrus similarly shrinks in cloud layer thickness, however, because the SW radiation does not influence the net radiative cooling at the cloud top, the dusty cirrus maintains its convective structure relatively intact, without the feedback loop collapsing. Subsidence experiments show that under nighttime conditions, dusty cirrus can retain its properties even under moderate subsidence lasting for multiple hours consecutively. At day, the dusty cirrus, however, is significantly more influenced by the large-scale forcing due to SW radiation.
Overall, based on the sensitivity simulation results, we find that SW radiation can suppress the ice nucleation and weaken the convective structure of dusty cirrus. Also, as was shown in Sect. 3.4, if ND is considerably lower than the OPC measured ND, the convective structure of the cirrus collapses due to the influence of SW absorption.
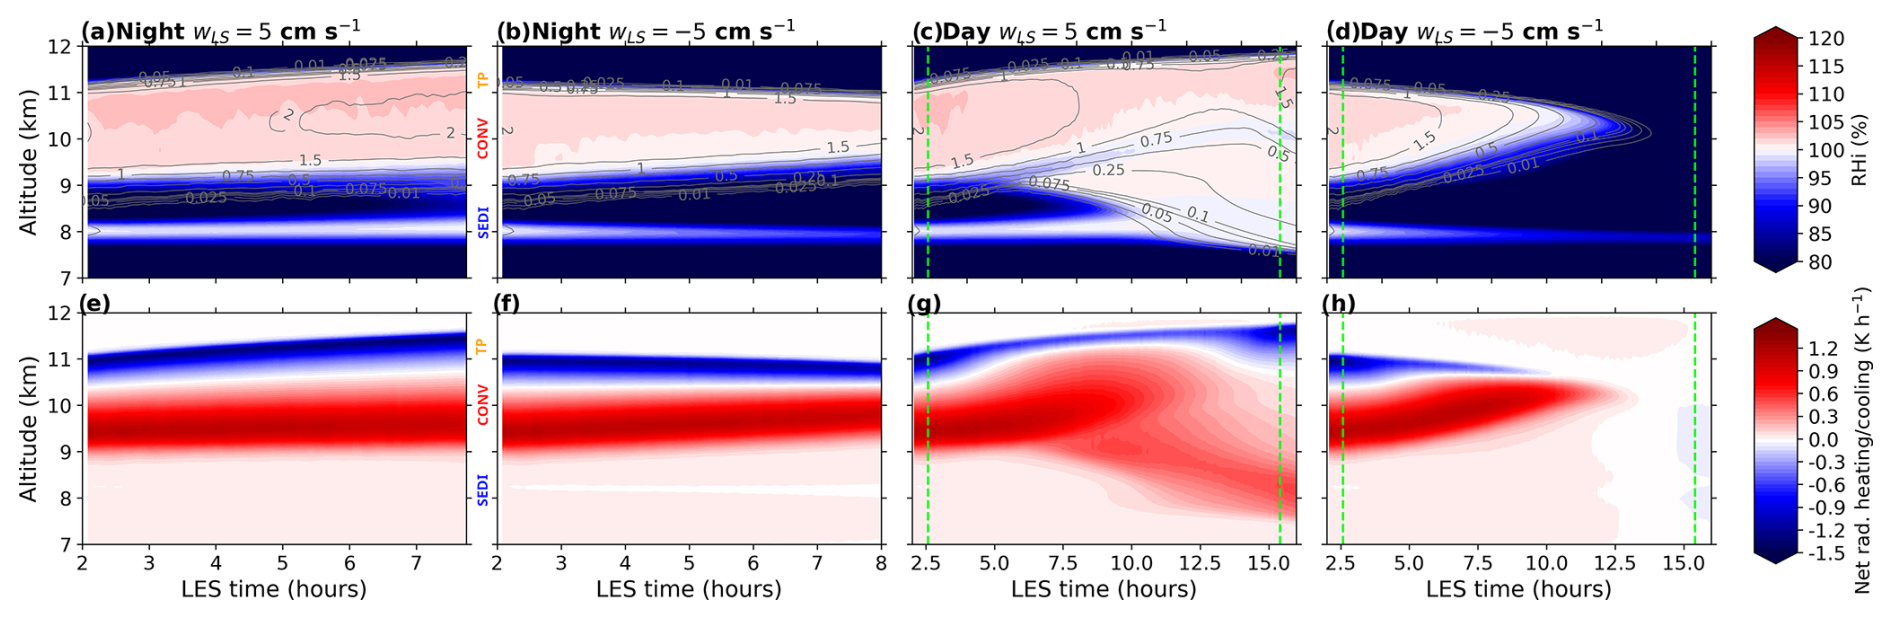
Figure 19RHi in shading and ICNC (cm−3) in contours (a–d) and net radiative heating rate in shading (e–h). Panels (a), (e) and (b), (f) represent nighttime simulations with (a, e) wLS=5 cm s−1 and (b, f) cm s−1. The same applies respectively for (c), (g) and (d), (h) in daytime simulations.
3.5.3 Aerosol direct radiation influence
The influence of aerosol–radiation interactions is shown in Fig. 20. The direct radiative effect of mineral dust within the cirrus is relatively weak. SW heating within the CONV increases by around 10 %–20 % (0.01–0.04 K h−1) when aerosol radiation is included. Larger effects are found below 9 km, where SW heating increases by up to 60 %, consistent with higher dust mass mixing ratios at lower altitudes, although the SW flux is significantly smaller, meaning that the absolute difference in heating rates is at similar level inside CONV. Within the CONV layer, a large fraction of dust is incorporated into ice crystals, limiting its direct radiative impact. As a result, aerosol absorption plays only a secondary role in modulating cirrus dynamics compared to radiative cooling and large-scale forcing.
To summarize, the simulations show that dusty cirrus is most effectively maintained under nighttime conditions and in the presence of neutral or upward large-scale forcing. Strong SW radiation and subsidence both act to suppress convection. Dusty cirrus can sustain its structure even under solar noon, although with reduced cirrus layer depth.
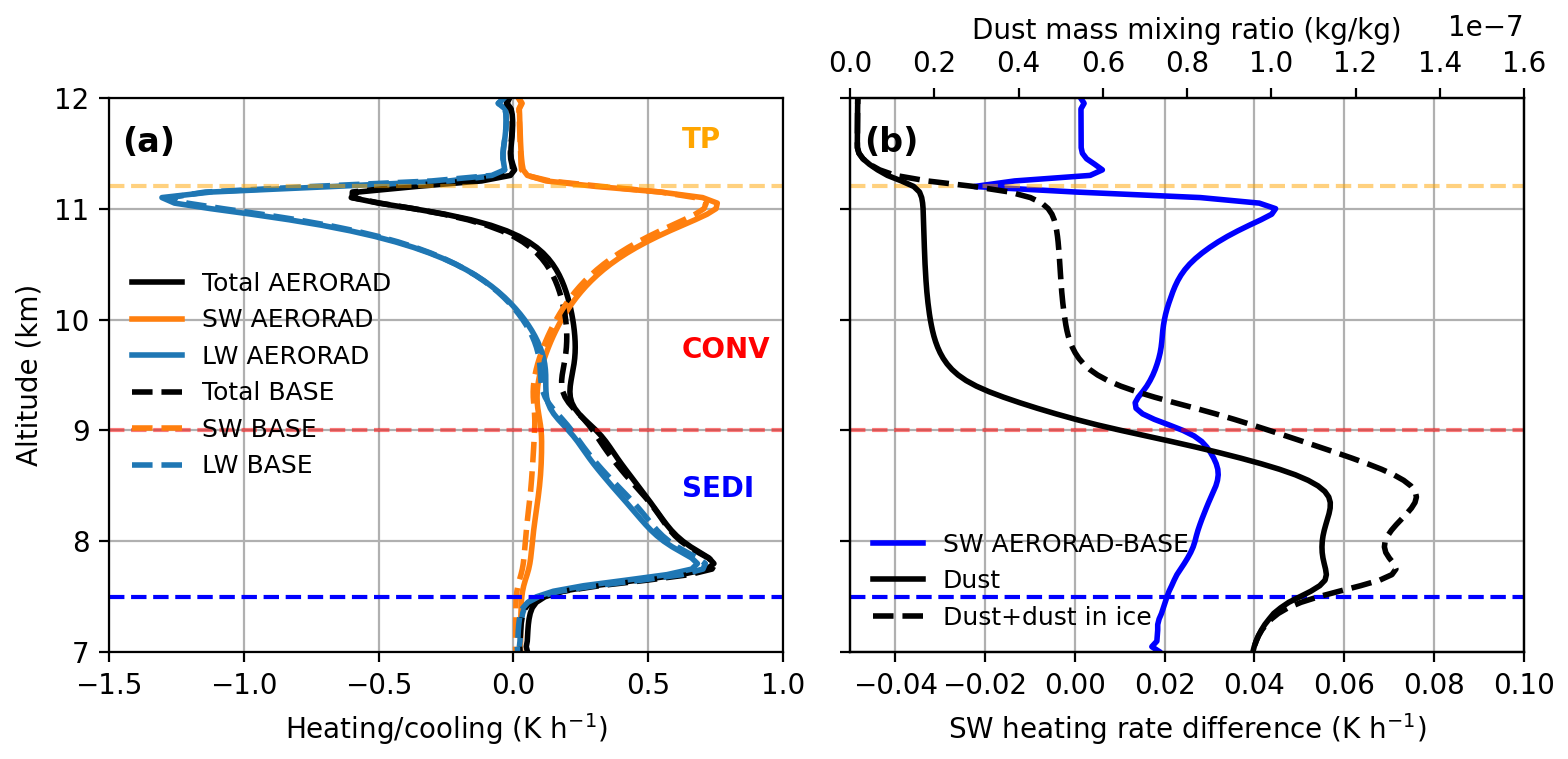
Figure 20Panel (a) shows aerosol radiation scheme (AERORAD) influence on heating term vertical profile from LW and SW heating rates compared with BASE run using H14 scheme without aerosol radiation. Panel (b) illustrates the SW heating rate absolute difference AERORAD-BASE profile with dust mixing ratio vertical profile.
In this study, the conditions governing dusty cirrus persistence were investigated with large-eddy simulation UCLALES-SALSA model using data from ML-CIRRUS campaign flight that sampled these clouds. Previous regional scale model studies have shown that the interaction between mineral dust, humidity, and radiative fluxes is central to dusty cirrus evolution and to their radiative impact, including implications for solar energy production (e.g. Weger et al., 2018; Seifert et al., 2023) while lacking the ability to explain the microphysical aspects controlling dusty cirrus due to the lack of sufficiently high resolution to simulate the convection directly. In this study, these processes were explicitly resolved, which provided a more complete representation of the dynamics and microphysical aspects of the dusty cirrus. Our major findings are given below.
First, mineral dust availability influences not only ice formation but also the dynamical organization and persistence of dusty cirrus. Sensitivity experiments varying the concentration of mineral dust showed that sustained convective cirrus development can occur when mineral dust number and mass concentrations exceed climatological values by approximately one to two orders of magnitude. Persistent cirrus convection can take place even during daytime when dust concentration exceeds a threshold of around ND∼1 cm−3 (in terms of mass at CD∼3 µg m−3). At these concentrations, heterogeneous ice nucleation can maintain a sufficiently high ICNC to sustain strong LW cooling at cloud top, consistent with the mechanisms proposed by Weger et al. (2018) and Seifert et al. (2023). When dust concentrations are lower, ice production weakens, LW radiative cooling becomes insufficient to maintain conditional instability, and the convective organization of the cloud decays.
Second, the persistence of dusty cirrus depends on the interplay between radiative heating and cooling, and large-scale vertical motions. The radiation sensitivity simulations indicate that dusty cirrus is most stable under nighttime conditions, when LW cooling dominates. During the day, the dusty cirrus can still persist under SW heating if dust concentrations remain high enough inside the cirrus. Beyond these radiative effects, large-scale vertical motions can further modulate convective persistence by altering in-cloud relative humidity through adiabatic cooling and warming during ascent and descent, respectively. Especially under strong and long lasting adiabatic warming under vertical descent, convective organization is suppressed effectively.
Third, the choice of DIN parameterization is a major source of uncertainty in simulated dusty cirrus. Hiranuma et al. (2014), Ullrich et al. (2017) and Phillips et al. (2013) schemes produced substantially different ice nucleation efficiencies and vertical distributions of ICNC, which altered the dynamical and radiative evolution of the dusty cirrus. With the Hiranuma et al. (2014) parameterization and dust concentrations comparable to those measured by the OPC, homogeneous freezing made no contribution to ice formation. Homogeneous freezing produced some contribution of ice when dust concentrations were reduced by an order of magnitude, corresponding to a case in which convective development was only weakly sustained but did not collapse under SW heating. These results highlight the importance of accurately representing heterogeneous ice nucleation on mineral dust under cirrus conditions. Dusty cirrus events may therefore provide useful test bed for evaluating DIN parameterizations against observations, although uncertainties in the observed and simulated ice properties, particularly in the SEDI layer, must also be considered.
Finally, UCLALES-SALSA reproduced key characteristics of observed dusty cirrus, although the degree of agreement varied between cloud properties and vertical layers. Satellite imagery showed similarities in horizontal cloud organization, while cloud radar observations supported the representation of vertical cloud structure and dynamics. For cloud microphysics, agreement in ICNC was strongest in the convectively driven CONV layer between the in-situ observations and model results. In contrast, the comparison in the sedimentation-dominated SEDI layer was less conclusive because of discrepancies between the in-situ and remote sensings observations, as well as the sensitivity of simulated ICNC to sedimentation, vertical transport, and the ERA5-derived large-scale vertical velocity forcing, wLS. Several limitations should be addressed in future work. Because we considered only a single input temperature profile for ice formation, the full temperature range over which dusty cirrus evolution is sustained remains unknown. A more comprehensive assessment would require simulations spanning a wider range of temperature conditions. Improved observational constraints, especially from targeted in-situ campaigns, are therefore needed to reduce uncertainty in the simulation of dusty cirrus systems and their climatic impact.
In summary, this study shows that the persistence of dusty cirrus emerges from coupled feedbacks between mineral dust availability for heterogeneous ice nucleation, radiative heating and cooling, and convective dynamics. The results emphasize that representing these processes in a coupled framework is essential for understanding dusty cirrus evolution and formation. Global climate model studies have yielded contrasting results regarding the impact of INPs on cirrus cloud properties and radiative effects (Beer et al., 2024). These contrasting findings underscore the need to accurately represent the sub-grid-scale processes governing cirrus evolution in global climate models, particularly the interactions between ice microphysics, radiation, and cloud dynamics.
| Abbreviation | Description |
| ACTRIS | Aerosol, Clouds and Trace Gases Research Infrastructure |
| AERORAD | Aerosol radiation scheme |
| BAHAMAS | The Basic HALO Measurement and Sensor System |
| BASE | Reference simulation |
| BASE-MIXED | Reference simulation including mixed aerosol conditions |
| CET | Cloud effective temperature |
| CONV | Convective layer of the dusty cirrus |
| DARDAR-Nice | Radar–lidar cloud retrieval ice product |
| DIN | Deposition ice nucleation |
| ERA5 | ECMWF Reanalysis version 5 |
| HALO | High Altitude and Long Range Research Aircraft |
| H14 | Hiranuma et al. (2014) DIN parameterization |
| ICNC | Ice crystal number concentration |
| INAS | Ice nucleation active site density |
| INP | Ice nucleating particle |
| INS | Ice nucleating particle distribution |
| IWC | Ice water content |
| LES | Large-eddy simulation |
| LW | Longwave radiation |
| ML-CIRRUS | Mid-Latitude Cirrus campaign |
| MODIS | Moderate Resolution Imaging Spectroradiometer |
| MSG | Meteosat Second Generation |
| NIXE-CAPS | NIXE Cloud and Aerosol Particle Spectrometer |
| OPC | Optical Particle Counter |
| P13 | Phillips et al. (2013) DIN parameterization |
| PSD | Particle size distribution |
| RHi | Relative humidity with respect to ice |
| SALSA | Sectional Aerosol module for large-scale Applications |
| SEDI | Sedimentation-dominated layer |
| SEVIRI | Spinning Enhanced Visible and Infrared Imager |
| SOL | Soluble aerosol distribution |
| SW | Shortwave radiation |
| TP | Tropopause |
| U17 | Ullrich et al. (2017) DIN parameterization |
| UCLALES | University of California Los Angeles Large-Eddy Simulator |
| UTC | Coordinated Universal Time |
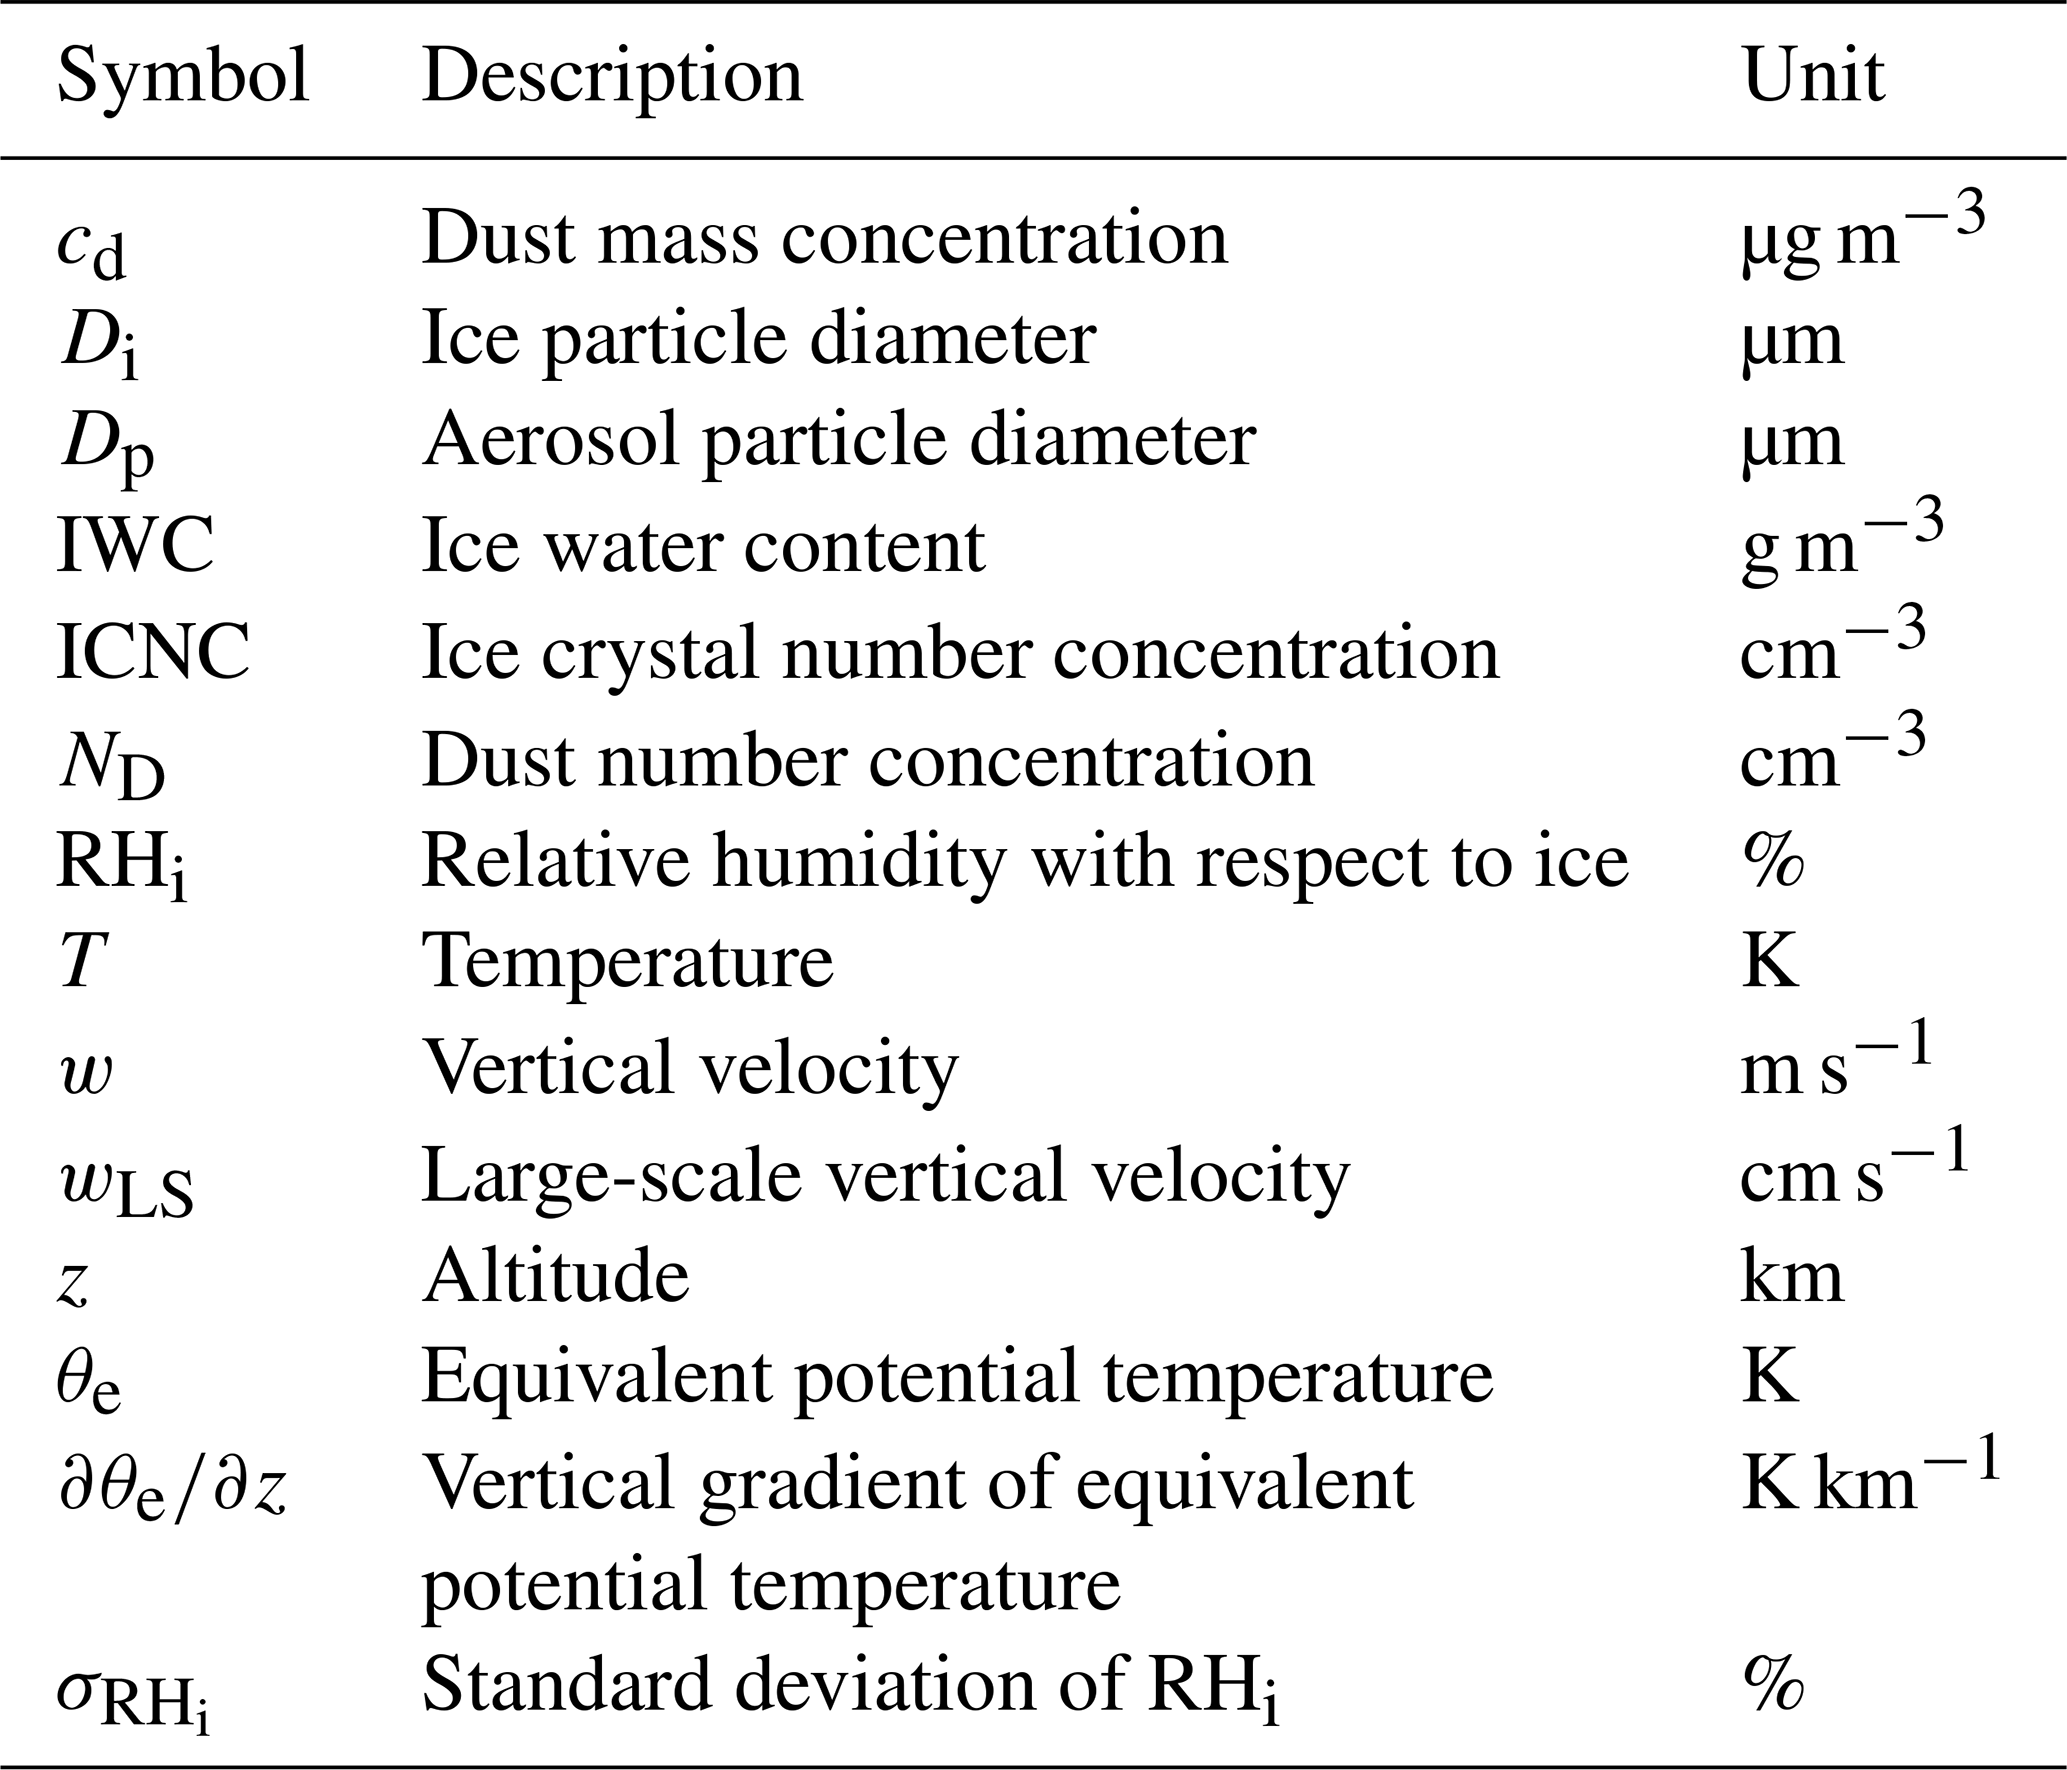
B1 Particle growth eqauations
For growth and evaporation of particles in SALSA, mass transfer is calculated for single particles in the following form in Jacobson (2005) (Eq. 16.13).
where m is the mass of particle, r is its radius, is the effective diffusivity of water vapour, pq is the ambient water-vapour partial pressure, and is the corresponding effective saturation vapour pressure at the particle surface. Le,q is the latent heat associated with water-vapour transfer, κa is the thermal conductivity of air, T is temperature, mq is the molecular mass of water, and R∗ is the universal gas constant. The primes denote effective quantities used in the particle-growth formulation. This equation is further modified to ice particles in the following form (Eq. 16.76):
where mi is the mass of ice particle, χi is the crystal electrical capacitance, is the effective diffusivity of water vapour over ice, and is the corresponding effective saturation vapor pressure at the ice surface. Ls is the latent heat of sublimation, and RVT is the gas constant of water vapor. The primes denote effective quantities used in the particle-growth formulation.
B2 Equivalent potential temperature
For diagnostics for convection within the model domain, we use the equivalent potential temperature which is conserved in phase-transition between ice and vapor and is generally acceptable to use under the conditions in this study where temperatures are below 235 K (Spichtinger, 2014). The equivalent potential temperature is described as:
where θe is the equivalent potential temperature, p0 is a reference pressure, p is pressure, R is the specific gas constant for dry air, cp is the specific heat capacity of air at constant pressure, Ls is the latent heat of sublimation, and q is the water-vapour mixing ratio.
B3 Temperature tendency equation
In this study, we focus on the thermodynamic heating rates within the simulated cloud, with the aim of identifying the processes that control the evolution of the temperature profile in the model domain. The prognostic temperature tendency can be decomposed into contributions from radiation, latent heating, turbulent mixing, and large-scale forcing as follows:
where FSW and FLW are shortwave and longwave radiative fluxes, wLS is the large-scale vertical velocity. The term denotes the turbulent potential temperature flux.
B4 Cloud effective temperature
The cloud effective temperature based on the UCLALES-SALSA output was calculated using a simple formulation:
that assumes that the cirrus emits black body radiation. σ represents the Stefan-Bolzmann constant and FLW↑ the upwelling LW radiation at the top of the model domain. We also assumed that the dusty cirrus has a high optical depth τ≫1 and thus can be assumed to leak minimal background radiation from the ground. Under the assumed conditions, the cloud effective temperature is roughly equal to the SEVIRI MSG based estimation of brightness temperatures for 8.7 µm.
C1 Hiranuma et al. (2014) ice nucleation parameterization
The heterogeneous ice nucleation parameterization of Hiranuma et al. (2014) is based on laboratory measurements conducted in the Aerosol Interaction and Dynamics in the Atmosphere (AIDA) cloud chamber, where ice formation on hematite particles was investigated under cirrus-relevant conditions. Hematite was used as a proxy for mineral dust, and experiments were performed over a wide temperature range from 237 to 195 K (−36 to −78 °C) under water-subsaturated conditions by varying temperature (T) and RHi. These measurements provide a consistent dataset for deriving ice nucleation activity under controlled thermodynamic conditions.
The parameterization follows the ice nucleation active surface site (INAS) density framework, in which the number of ice nucleation active sites per unit particle surface area, , is expressed as a function of temperature and ice supersaturation. The number concentration of activated INPs is then given by
where Naer is the aerosol number concentration and Aaer is the particle surface area.
In general form, the parameterization can be expressed as
where the coefficients are empirically fitted to the AIDA measured data. This formulation is valid within the range °C and .
C2 Ullrich et al. (2017) ice nucleation parameterization
The Ullrich et al. (2017) parameterization scheme for deposition ice nucleation is based on 11 years worth of laboratory experiments conducted in the AIDA cloud chamber. This framework was specifically developed to assess the nucleation characteristics of mineral dust and soot particles under conditions relevant to cirrus clouds (Ullrich et al., 2019). The parameterization presented below quantifies the nucleation ability of mineral dust/soot particles in terms of ice nucleation active site (INAS) density ns (e.g., Hoose and Möhler, 2012; Vali et al., 2015). The parameterization is given by:
where the parameters and corresponding values for mineral dust are given as α=285.692, β=0.017, γ=256.692, κ=0.08, λ=200.745, and the parameterization is valid in the range of 206–240 K.
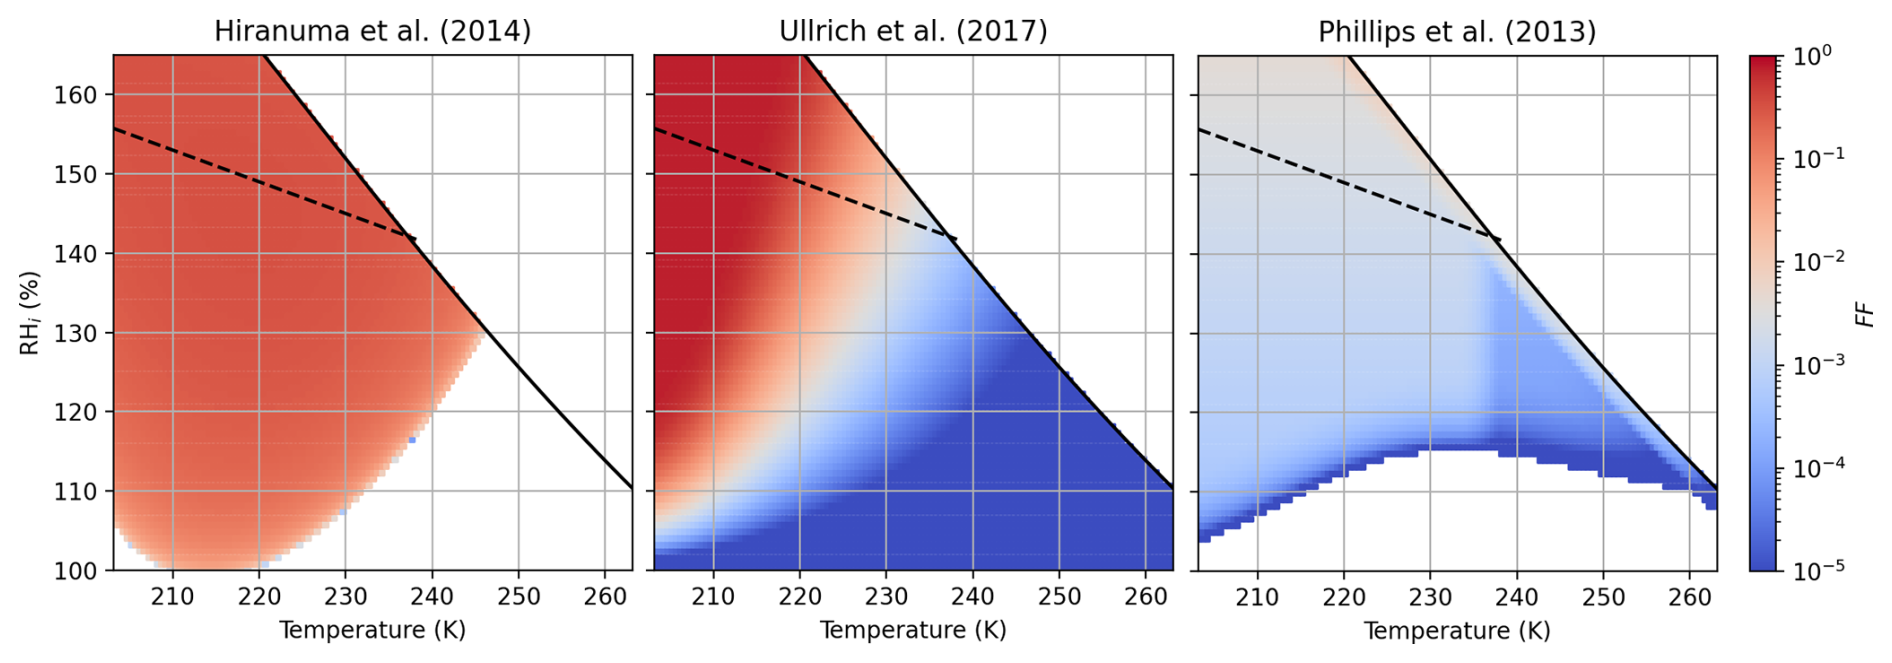
Figure C1Frozen fraction (FF) calculated based on the aerosol PSD shown in Fig. 5 with Hiranuma et al. (2014, H14), Ullrich et al. (2017, U17) and Phillips et al. (2013, P13) scheme in deposition nucleation conditions. Solid black line indicates water saturation line and the dashed black line Koop et al. (2000) threshold line for onset of homogeneous freezing of aqueous solution droplets.
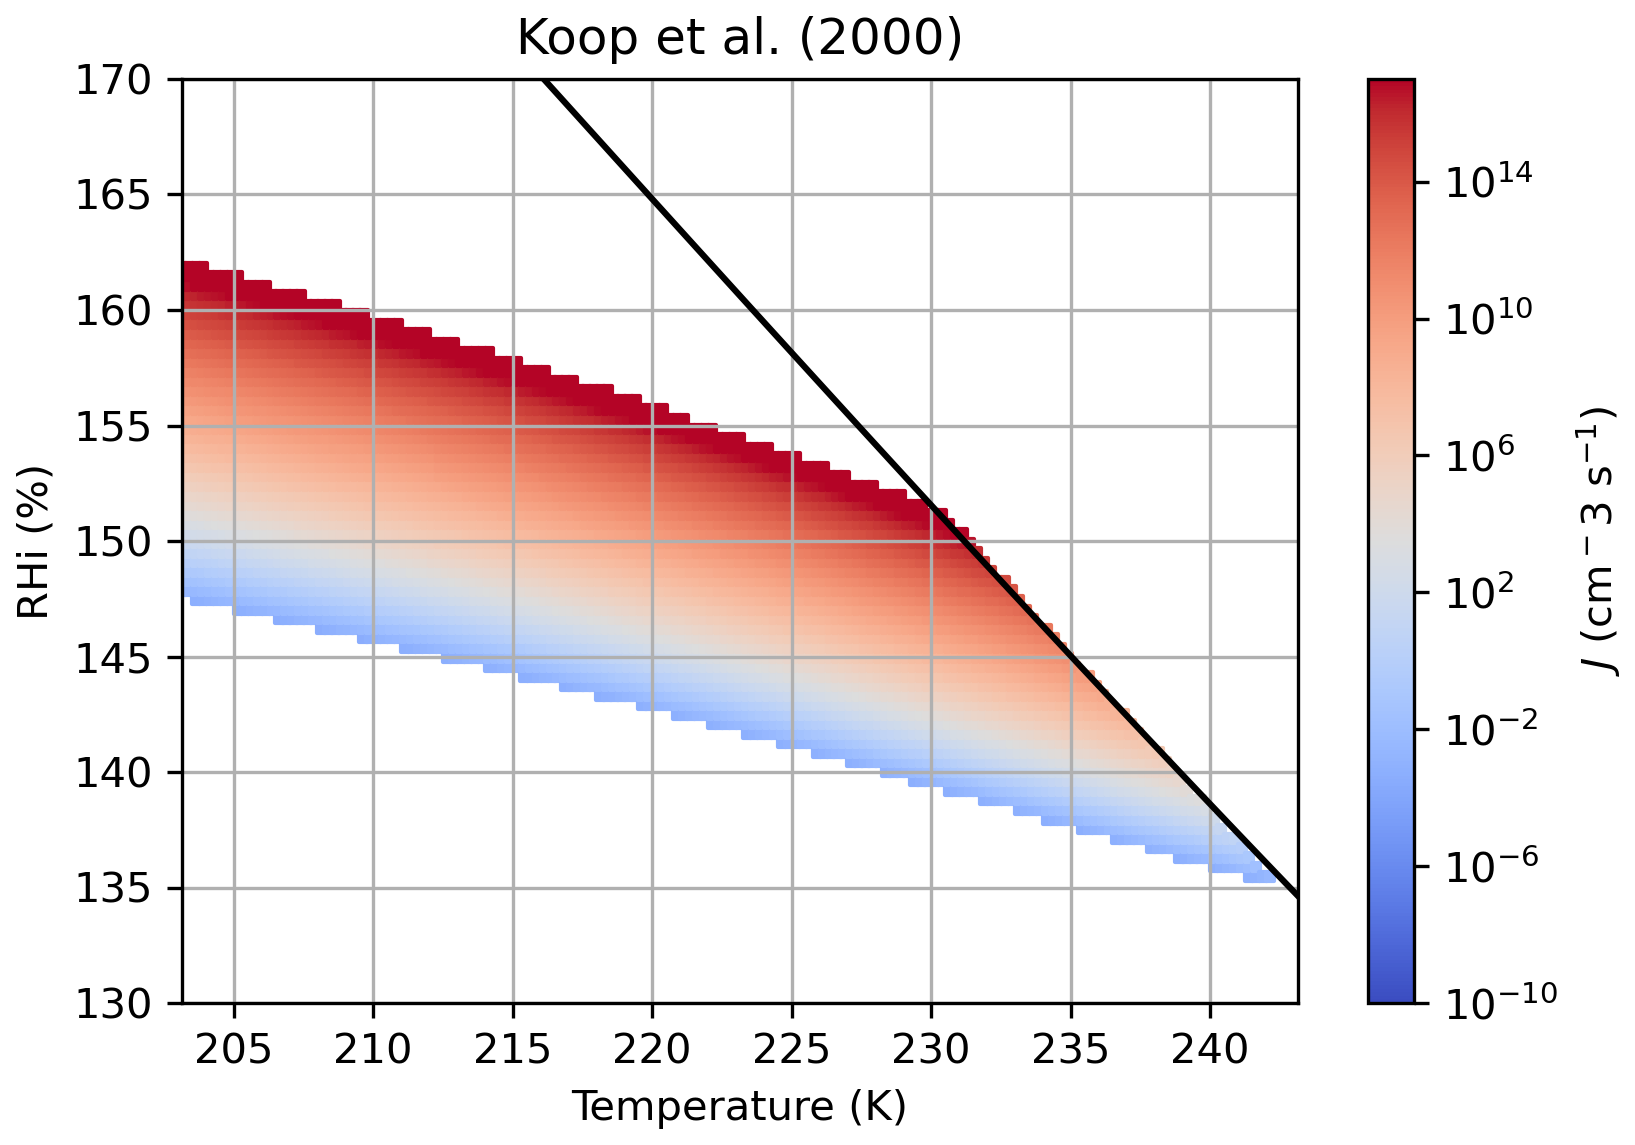
Figure C2Koop et al. (2000) freezing rate as a function of temperature and RHi (Δaw). The solid line indicates the water saturation line.
C3 Phillips et al. (2013) ice nucleation parameterization
The heterogeneous ice nucleation parameterization presented in Phillips et al. (2008), with updates described in Phillips et al. (2013), is an empirical framework based on a combination of in-situ field measurements and laboratory data of ice-nucleating particles (INPs) measured using the continuous flow diffusion chamber (CFDC) in the troposphere. The formulation links ice nucleation activity to aerosol physicochemical properties, particularly particle surface area and composition, and accounts for variability across different aerosol species (Phillips et al., 2008).
In this framework, aerosol particles are divided into distinct classes (e.g., mineral dust, black carbon, and organic or biological particles), and the total number concentration of nucleated ice crystals is obtained as the sum of contributions from each species. The parameterization assumes that ice nucleation activity scales with aerosol surface area and depends on both temperature T and RHi. For each aerosol type, the activated INP concentration is expressed as
where nINP,X is the INP number concentration and μX is the mean number of ice embryos per insoluble particle of size DX. This term encapsulates the probability of ice nucleation and depends on RHi and temperature.
The functional dependence of μX is given by
where HX(Si,T) describes the dependence on ice supersaturation and temperature, ξ(T) accounts for temperature-dependent scaling of nucleation efficiency, αX for the fractional contribution from aerosol group X to the INP concentration, and the ratio represents a reference activity of INPs in the background troposphere divided by INP total surface area between 0.1–1 µm (Phillips et al., 2008). In this study, we used simplified formulation where
which is applicable below the homogeneous freezing temperature threshold °C and . The c1=1000 m−3 and ρC=0.76 kg m−3 corresponds to the air density inside the CFDC.
The more recent version by Phillips et al. (2013) updated the existing parameterization framework with an onset temperature for freezing and baseline surface areas of aerosols observed in field campaigns, and accommodated more laboratory and field observations to its formulation. For a more detailed description of the parameterization scheme, see Phillips et al. (2008).
C4 Homogeneous freezing parameterization by Koop et al. (2000)
The parameterization for homogeneous freezing follows the formulation of Koop et al. (2000). The nucleation rate is parametrized with a shift in the melting curve of ice . In Koop (2015), a simplication for aw was presented as . From this, the equation follows:
The Koop et al. (2000) parameterizations produces the freezing rate (cm−3 s−1) as:
which results in a predicted frozen fraction FF based on the JH:
where Dd represents the soluble droplet diameter and Δt time difference.
ML-CIRRUS (NIXE-CAPS, OPC, BAHAMAS) measurements and data products are provided via the HALO database (HALO consortium, 2017). The MIRA-35C data used in this study are generated by the Aerosol, Clouds and Trace Gases Research Infrastructure (ACTRIS) and are available from the ACTRIS Data Centre using the following link: https://hdl.handle.net/21.12132/1.cd92913b0b6e4625 (last access: 23 April 2026). DARDAR-Nice data is available from data repository of University of Lille at https://www.icare.univ-lille.fr/dardar/ (last access: 23 April 2026). Simulation data used for analysis is archived at Zenodo (https://doi.org/10.5281/zenodo.19824432, Juurikkala et al., 2026a). The source code of the model UCLALES-SALSA is available from GitHub at https://github.com/UCLALES-SALSA/UCLALES-SALSA/tree/dustycirrus (last access: 11 November 2026; DOI: https://doi.org/10.5281/zenodo.24131329, Juurikkala et al., 2026b).
The supplement related to this article is available online at https://doi.org/10.5194/acp-26-16173-2026-supplement.
KJ made the simulations, analysed the simulation results and wrote major parts of the text. TR supported data analysis interpretation and editing of the text. MK provided the campaign data and helped to interpret in-situ data. CW supported with interpretation of in-situ measurements and model simulations, and text editing. AL supervised the project and provided guidance on the manuscript.
At least one of the (co-)authors is a member of the editorial board of Atmospheric Chemistry and Physics. The peer-review process was guided by an independent editor, and the authors also have no other competing interests to declare.
Publisher's note: Copernicus Publications remains neutral with regard to jurisdictional claims made in the text, published maps, institutional affiliations, or any other geographical representation in this paper. The authors bear the ultimate responsibility for providing appropriate place names. Views expressed in the text are those of the authors and do not necessarily reflect the views of the publisher.
This work was supported by grant by Emil Aaltonen foundation (grant no. 250052 K1), the Academy of Finland Flagship ACCC (grant no. 337552) and MEDICEN project (grant no. 345125), and the European Union’s Horizon Europe CleanCloud project (grant no. 101137639). We acknowledge ACTRIS for providing the data sets. We acknowledge EUMETSAT for providing MSG SEVIRI data. We also thank Daniel Sauer from DWD for providing OPC data. We give special thanks to Sami Romakkaniemi and Silvia Cadéron at FMI for supporting with model specific aspects. We thank CSC–IT Center for Science, Finland, for computational resources.
This research has been supported by the Emil Aaltosen Säätiö (grant no. 250052 K1), the Research Council of Finland (grant no. 337552), the Research Council of Finland (grant no. 345125), and the HORIZON EUROPE Climate, Energy and Mobility (grant no. 101137639).
This paper was edited by Luisa Ickes and reviewed by two anonymous referees.
Ahola, J., Korhonen, H., Tonttila, J., Romakkaniemi, S., Kokkola, H., and Raatikainen, T.: Modelling mixed-phase clouds with the large-eddy model UCLALES–SALSA, Atmos. Chem. Phys., 20, 11639–11654, https://doi.org/10.5194/acp-20-11639-2020, 2020. a
Ansmann, A., Mamouri, R.-E., Bühl, J., Seifert, P., Engelmann, R., Hofer, J., Nisantzi, A., Atkinson, J. D., Kanji, Z. A., Sierau, B., Vrekoussis, M., and Sciare, J.: Ice-nucleating particle versus ice crystal number concentrationin altocumulus and cirrus layers embedded in Saharan dust:a closure study, Atmos. Chem. Phys., 19, 15087–15115, https://doi.org/10.5194/acp-19-15087-2019, 2019. a
Beer, C. G., Hendricks, J., and Righi, M.: Impacts of ice-nucleating particles on cirrus clouds and radiation derived from global model simulations with MADE3 in EMAC, Atmos. Chem. Phys., 24, 3217–3240, https://doi.org/10.5194/acp-24-3217-2024, 2024. a
Calderón, S. M., Hyttinen, N., Kokkola, H., Raatikainen, T., Lawson, R. P., and Romakkaniemi, S.: Secondary ice formation in cumulus congestus clouds: insights from observations and aerosol-aware large-eddy simulations, Atmos. Chem. Phys., 25, 14479–14500, https://doi.org/10.5194/acp-25-14479-2025, 2025. a, b, c
Delanoë, J., Protat, A., Testud, J., Bouniol, D., Heymsfield, A. J., Bansemer, A., Brown, P. R. A., and Forbes, R. M.: Statistical properties of the normalized ice particle size distribution, J. Geophys. Res.-Atmos., 110, https://doi.org/10.1029/2004JD005405, 2005. a
Ewald, F., Mattis, I., Zinner, T., and O'Connor, E. J.: Categorize data from Schneefernerhaus on 4 April 2014, https://hdl.handle.net/21.12132/1.cd92913b0b6e4625 (last access: 24 April 2026), 2026. a
Fromm, M., Kablick III, G., and Caffrey, P.: Dust-infused baroclinic cyclone storm clouds: The evidence, meteorology, and some implications, Geophys. Res. Lett., 43, 12643–12650, https://doi.org/10.1002/2016GL071801, 2016. a
Froyd, K., Yu, P., Schill, G., Brock, C., Kupc, A., Williamson, C., Jensen, E., Ray, E., Rosenlof, K., Bian, H., Darmenov, A., Colarco, P., Diskin, G., Bui, T., and Murphy, D.: Dominant role of mineral dust in cirrus cloud formation revealed by global-scale measurements, Nat. Geosci., 15, 1–7, https://doi.org/10.1038/s41561-022-00901-w, 2022. a
Fu, Q. and Liou, K. N.: Parameterization of the Radiative Properties of Cirrus Clouds, J. Atmos. Sci., 50, 2008–2025, https://doi.org/10.1175/1520-0469(1993)050<2008:POTRPO>2.0.CO;2, 1993. a
Fusina, F. and Spichtinger, P.: Cirrus clouds triggered by radiation, a multiscale phenomenon, Atmos. Chem. Phys., 10, 5179–5190, https://doi.org/10.5194/acp-10-5179-2010, 2010. a
Giez, A., Mallaun, C., Nenakhov, V., and Zöger, M.: Calibration of a Nose Boom Mounted Airflow Sensor on an Atmospheric Research Aircraft by Inflight Maneuvers, Tech. rep., DLR-Forschungsbericht, ISSN 1434-8454, https://elib.dlr.de/145969/ (last access: 16 April 2026), 2021. a
Gruber, S., Blahak, U., Haenel, F., Kottmeier, C., Leisner, T., Muskatel, H., Storelvmo, T., and Vogel, B.: A Process Study on Thinning of Arctic Winter Cirrus Clouds With High-Resolution ICON-ART Simulations, J. Geophys. Res.-Atmos., 124, 5860–5888, https://doi.org/10.1029/2018JD029815, 2019. a
Hersbach, H., Bell, B., Berrisford, P., Hirahara, S., Horányi, A., Muñoz-Sabater, J., Nicolas, J., Peubey, C., Radu, R., Schepers, D., Simmons, A., Soci, C., Abdalla, S., Abellan, X., Balsamo, G., Bechtold, P., Biavati, G., Bidlot, J., Bonavita, M., De Chiara, G., Dahlgren, P., Dee, D., Diamantakis, M., Dragani, R., Flemming, J., Forbes, R., Fuentes, M., Geer, A., Haimberger, L., Healy, S., Hogan, R. J., Hólm, E., Janisková, M., Keeley, S., Laloyaux, P., Lopez, P., Lupu, C., Radnoti, G., de Rosnay, P., Rozum, I., Vamborg, F., Villaume, S., and Thépaut, J.-N.: The ERA5 global reanalysis, Q. J. Roy. Meteor. Soc., 146, 1999–2049, https://doi.org/10.1002/qj.3803, 2020. a
Hiranuma, N., Paukert, M., Steinke, I., Zhang, K., Kulkarni, G., Hoose, C., Schnaiter, M., Saathoff, H., and Möhler, O.: A comprehensive parameterization of heterogeneous ice nucleation of dust surrogate: laboratory study with hematite particles and its application to atmospheric models, Atmos. Chem. Phys., 14, 13145–13158, https://doi.org/10.5194/acp-14-13145-2014, 2014. a, b, c, d, e, f, g
Hogan, R. J., Mittermaier, M. P., and Illingworth, A. J.: The Retrieval of Ice Water Content from Radar Reflectivity Factor and Temperature and Its Use in Evaluating a Mesoscale Model, J. Appl. Meteorol. Clim., 45, 301–317, https://doi.org/10.1175/JAM2340.1, 2006. a
Hoose, C. and Möhler, O.: Heterogeneous ice nucleation on atmospheric aerosols: a review of results from laboratory experiments, Atmos. Chem. Phys., 12, 9817–9854, https://doi.org/10.5194/acp-12-9817-2012, 2012. a
Illingworth, A. J., Hogan, R. J., O'Connor, E., Bouniol, D., Brooks, M. E., Delanoé, J., Donovan, D. P., Eastment, J. D., Gaussiat, N., Goddard, J. W. F., Haeffelin, M., Baltink, H. K., Krasnov, O. A., Pelon, J., Piriou, J.-M., Protat, A., Russchenberg, H. W. J., Seifert, A., Tompkins, A. M., van Zadelhoff, G.-J., Vinit, F., Willén, U., Wilson, D. R., and Wrench, C. L.: Cloudnet: Continuous Evaluation of Cloud Profiles in Seven Operational Models Using Ground-Based Observations, B. Am. Meteorol. Soc., 88, 883–898, https://doi.org/10.1175/BAMS-88-6-883, 2007. a
Jacobson, M. Z.: Fundamentals of Atmospheric Modeling, Cambridge University Press, 2nd edn., https://doi.org/10.1017/CBO9781139165389, 2005. a
Juurikkala, K., Williamson, C. J., Froyd, K. D., Dean-Day, J., and Laaksonen, A.: Prior heterogeneous ice nucleation events shape homogeneous freezing during the evolution of synoptic cirrus, Atmos. Chem. Phys., 25, 13995–14013, https://doi.org/10.5194/acp-25-13995-2025, 2025. a, b
Juurikkala, K., Raatikainen, T., Williamson, C., Krämer, M., and Laaksonen, A.: Supplementary material for the ACP Manuscript, Mineral dust concentration controlling convective cirrus structure and persistence: a large-eddy simulation study with observational constraints, Zenodo [data set], https://doi.org/10.5281/zenodo.19824432, 2026a. a
Juurikkala, K., Calderón, S., Romakkaniemi, S., Kokkola, H., Raatikainen, T., and Tonttila, J.: UCLALES-SALSA dustycirrus, Zenodo [code], https://doi.org/10.5281/zenodo.24131329, 2026b. a
Kärcher, B., Hoffmann, F., Sokol, A., Gasparini, B., Corcos, M., Jensen, E., Atlas, R., Podglajen, A., Morrison, H., Hertzog, A., Plougonven, R., Chandrakar, K., and Grabowski, W. W.: Dissecting cirrus clouds: navigating effects of turbulence on homogeneous ice formation, npj Climate and Atmospheric Science, 8, https://doi.org/10.1038/s41612-025-01024-w, 2025. a, b
Kazil, J., Christensen, M. W., Abel, S. J., Yamaguchi, T., and Feingold, G.: Realism of Lagrangian Large Eddy Simulations Driven by Reanalysis Meteorology: Tracking a Pocket of Open Cells Under a Biomass Burning Aerosol Layer, J. Adv. Model. Earth Sy., 13, e2021MS002664, https://doi.org/10.1029/2021MS002664, 2021. a
Koehler, K. A., Kreidenweis, S. M., DeMott, P. J., Petters, M. D., Prenni, A. J., and Möhler, O.: Laboratory investigations of the impact of mineral dust aerosol on cold cloud formation, Atmos. Chem. Phys., 10, 11955–11968, https://doi.org/10.5194/acp-10-11955-2010, 2010. a
Kokkola, H., Korhonen, H., Lehtinen, K. E. J., Makkonen, R., Asmi, A., Järvenoja, S., Anttila, T., Partanen, A.-I., Kulmala, M., Järvinen, H., Laaksonen, A., and Kerminen, V.-M.: SALSA – a Sectional Aerosol module for Large Scale Applications, Atmos. Chem. Phys., 8, 2469–2483, https://doi.org/10.5194/acp-8-2469-2008, 2008. a
Kokkola, H., Kühn, T., Laakso, A., Bergman, T., Lehtinen, K. E. J., Mielonen, T., Arola, A., Stadtler, S., Korhonen, H., Ferrachat, S., Lohmann, U., Neubauer, D., Tegen, I., Siegenthaler-Le Drian, C., Schultz, M. G., Bey, I., Stier, P., Daskalakis, N., Heald, C. L., and Romakkaniemi, S.: SALSA2.0: The sectional aerosol module of the aerosol–chemistry–climate model ECHAM6.3.0-HAM2.3-MOZ1.0, Geosci. Model Dev., 11, 3833–3863, https://doi.org/10.5194/gmd-11-3833-2018, 2018. a
Kollath, K.: Cellular convection in cirrus clouds as a possible effect of dust aerosols, eUMETSAT, https://user.eumetsat.int/resources/case-studies/cellular-convection-in-cirrus-clouds (last access: 30 October 2022), 2010. a, b
Koop, T.: Atmospheric Water, in: Water: Fundamentals as the Basis for Understanding the Environment and Promoting Technology, edited by: Debenedetti, P. G., Ricci, A., and Bruni, F., IOS Press, Amsterdam and Bologna, 45–75, https://doi.org/10.3254/978-1-61499-507-4-45, 2015. a
Koop, T., Luo, B., Tsias, A., and Peter, T.: Water Activity as the determinant for homogeneous ice nucleation in aqueous solutions, Nature, 406, 611–614, https://doi.org/10.1038/35020537, 2000. a, b, c, d, e, f, g
Krämer, M., Rolf, C., Spelten, N., Afchine, A., Fahey, D., Jensen, E., Khaykin, S., Kuhn, T., Lawson, P., Lykov, A., Pan, L. L., Riese, M., Rollins, A., Stroh, F., Thornberry, T., Wolf, V., Woods, S., Spichtinger, P., Quaas, J., and Sourdeval, O.: A microphysics guide to cirrus – Part 2: Climatologies of clouds and humidity from observations, Atmos. Chem. Phys., 20, 12569–12608, https://doi.org/10.5194/acp-20-12569-2020, 2020. a
Krautstrunk, M. and Giez, A.: The Transition From FALCON to HALO Era Airborne Atmospheric Research, Springer Berlin Heidelberg, Berlin, Heidelberg, 609–624, ISBN 978-3-642-30183-4, https://doi.org/10.1007/978-3-642-30183-4_37, 2012. a
Lamb, K. D., Harrington, J. Y., Clouser, B. W., Moyer, E. J., Sarkozy, L., Ebert, V., Möhler, O., and Saathoff, H.: Re-evaluating cloud chamber constraints on depositional ice growth in cirrus clouds – Part 1: Model description and sensitivity tests, Atmos. Chem. Phys., 23, 6043–6064, https://doi.org/10.5194/acp-23-6043-2023, 2023. a
Lawson, R. P., Woods, S., Jensen, E., Erfani, E., Gurganus, C., Gallagher, M., Connolly, P., Whiteway, J., Baran, A. J., May, P., Heymsfield, A., Schmitt, C. G., McFarquhar, G., Um, J., Protat, A., Bailey, M., Lance, S., Muehlbauer, A., Stith, J., Korolev, A., Toon, O. B., and Krämer, M.: A Review of Ice Particle Shapes in Cirrus formed In Situ and in Anvils, J. Geophys. Res.-Atmos., 124, 10049–10090, https://doi.org/10.1029/2018JD030122, 2019. a, b
Meyer, J.: Ice Crystal Measurements with the New Particle Spectrometer NIXE-CAPS, vol. 160 of Schriften des Forschungszentrums Jülich, Reihe Energie und Umwelt/Energy and Environment, Forschungszentrum Jülich, Jülich, Germany, ISBN 9783893368402, 2012. a
Minikin, A., Petzold, A., Ström, J., Krejci, R., Seifert, M., van Velthoven, P., Schlager, H., and Schumann, U.: Aircraft observations of the upper tropospheric fine particle aerosol in the Northern and Southern Hemispheres at midlatitudes, Geophys. Res. Lett., 30, https://doi.org/10.1029/2002GL016458, 2003. a
Mitchell, D. L. and Heymsfield, A. J.: Refinements in the Treatment of Ice Particle Terminal Velocities, Highlighting Aggregates, J. Atmos. Sci., 62, 1637–1644, https://doi.org/10.1175/JAS3413.1, 2005. a
Möhler, O., Field, P. R., Connolly, P., Benz, S., Saathoff, H., Schnaiter, M., Wagner, R., Cotton, R., Krämer, M., Mangold, A., and Heymsfield, A. J.: Efficiency of the deposition mode ice nucleation on mineral dust particles, Atmos. Chem. Phys., 6, 3007–3021, https://doi.org/10.5194/acp-6-3007-2006, 2006. a
Murphy, D. M. and Koop, T.: Review of the vapour pressures of ice and supercooled water for atmospheric applications, Q. J. Roy. Meteor. Soc., 131, https://doi.org/10.1256/qj.04.94, 2005. a
Nagy, A.: Investigating weather situations which bring Saharan dust over Hungary based on MSG satellite images, Master's thesis, ELTE University, https://nimbus.elte.hu/tanszek/docs/NagyAndrea_2009.pdf (last access: 12 November 2026), 2009 (in Hungarian). a, b
Vermote, E.: MODIS/Terra Atmospherically Corrected Surface Reflectance 5-Min L2 Swath 250 m, 500 m, and 1 km (MOD09), NASA LP DAAC [data set], https://doi.org/10.5067/MODIS/MOD09.061, 2015. a
Ovchinnikov, M., Ackerman, A. S., Avramov, A., Cheng, A., Fan, J., Fridlind, A. M., Ghan, S., Harrington, J., Hoose, C., Korolev, A., McFarquhar, G. M., Morrison, H., Paukert, M., Savre, J., Shipway, B. J., Shupe, M. D., Solomon, A., and Sulia, K.: Intercomparison of large-eddy simulations of Arctic mixed-phase clouds: Importance of ice size distribution assumptions, J. Adv. Model. Earth Sy., 6, 223–248, https://doi.org/10.1002/2013MS000282, 2014. a
Phillips, V., DeMott, P., and Andronache, C.: An Empirical Parameterization of Heterogeneous Ice Nucleation for Multiple Chemical Species of Aerosol, J. Atmos. Sci., 65, 2757–2783, https://doi.org/10.1175/2007JAS2546.1, 2008. a, b, c, d, e
Phillips, V. T. J., Demott, P. J., Andronache, C., Pratt, K. A., Prather, K. A., Subramanian, R., and Twohy, C.: Improvements to an Empirical Parameterization of Heterogeneous Ice Nucleation and Its Comparison with Observations, J. Atmos. Sci., 70, 378–409, https://doi.org/10.1175/JAS-D-12-080.1, 2013. a, b, c, d, e, f
Pieper, L., Seifert, P., Griesche, H., Ansmann, A., McCosh, G., Ewald, F., and Kneifel, S.: Turbulence structure of dusty cirrus and its relation to atmospheric conditions: A characterization using cloud-radar measurements and reanalysis data, EGUsphere [preprint], https://doi.org/10.5194/egusphere-2026-3092, 2026. a
Protat, A. and Williams, C. R.: The Accuracy of Radar Estimates of Ice Terminal Fall Speed from Vertically Pointing Doppler Radar Measurements, J. Appl. Meteorol. Clim., 50, 2120–2138, https://doi.org/10.1175/JAMC-D-10-05031.1, 2011. a
Ren, C. and Mackenzie, A. R.: Cirrus parametrization and the role of ice nuclei, Q. J. Roy. Meteor. Soc., 131, 1585–1605, https://doi.org/10.1256/qj.04.126, 2005. a
Rieger, D., Steiner, A., Bachmann, V., Gasch, P., Förstner, J., Deetz, K., Vogel, B., and Vogel, H.: Impact of the 4 April 2014 Saharan dust outbreak on the photovoltaic power generation in Germany, Atmos. Chem. Phys., 17, 13391–13415, https://doi.org/10.5194/acp-17-13391-2017, 2017. a
Schumann, U., Mayer, B., Gierens, K., Unterstrasser, S., Jessberger, P., Petzold, A., Voigt, C., and Gayet, J.-F.: Effective Radius of Ice Particles in Cirrus and Contrails, J. Atmos. Sci., 68, 300–321, https://doi.org/10.1175/2010JAS3562.1, 2011. a
Seifert, A., Bachmann, V., Filipitsch, F., Förstner, J., Grams, C. M., Hoshyaripour, G. A., Quinting, J., Rohde, A., Vogel, H., Wagner, A., and Vogel, B.: Aerosol–cloud–radiation interaction during Saharan dust episodes: the dusty cirrus puzzle, Atmos. Chem. Phys., 23, 6409–6430, https://doi.org/10.5194/acp-23-6409-2023, 2023. a, b, c, d, e, f, g
Smagorinsky, J.: General Circulation Experiments with the Primitive Equations: I. The Basic Experiment, Mon. Weather Rev., 91, 99–164, https://doi.org/10.1175/1520-0493(1963)091<0099:GCEWTP>2.3.CO;2, 1963. a
Sölch, I. and Kärcher, B.: A large-eddy model for cirrus clouds with explicit aerosol and ice microphysics and Lagrangian ice particle tracking, Q. J. Roy. Meteor. Soc., 136, 2074–2093, https://doi.org/10.1002/qj.689, 2010. a, b
Sourdeval, O., Gryspeerdt, E., Krämer, M., Goren, T., Delanoë, J., Afchine, A., Hemmer, F., and Quaas, J.: Ice crystal number concentration estimates from lidar–radar satellite remote sensing – Part 1: Method and evaluation, Atmos. Chem. Phys., 18, 14327–14350, https://doi.org/10.5194/acp-18-14327-2018, 2018. a
Spichtinger, P.: Shallow cirrus convection – a source for ice supersaturation, Tellus B, https://doi.org/10.3402/tellusa.v66.19937, 2014. a, b
Sprenger, M. and Wernli, H.: The LAGRANTO Lagrangian analysis tool – version 2.0, Geosci. Model Dev., 8, 2569–2586, https://doi.org/10.5194/gmd-8-2569-2015, 2015. a
Stevens, B., Moeng, C.-H., and Sullivan, P. P.: Large-Eddy Simulations of Radiatively Driven Convection: Sensitivities to the Representation of Small Scales, J. Atmos. Sci., 56, 3963–3984, https://doi.org/10.1175/1520-0469(1999)056<3963:LESORD>2.0.CO;2, 1999. a
Stevens, B., Moeng, C.-H., Ackerman, A. S., Bretherton, C. S., Chlond, A., de Roode, S., Edwards, J., Golaz, J.-C., Jiang, H., Khairoutdinov, M., Kirkpatrick, M. P., Lewellen, D. C., Lock, A., Müller, F., Stevens, D. E., Whelan, E., and Zhu, P.: Evaluation of Large-Eddy Simulations via Observations of Nocturnal Marine Stratocumulus, Mon. Weather Rev., 133, 1443–1462, https://doi.org/10.1175/MWR2930.1, 2005. a
Storelvmo, T., Boos, W. R., and Herger, N.: Cirrus cloud seeding: a climate engineering mechanism with reduced side effects?, Philos. T. R. Soc. A, 372, 20140116, https://doi.org/10.1098/rsta.2014.0116, 2014. a
Tonttila, J., Maalick, Z., Raatikainen, T., Kokkola, H., Kühn, T., and Romakkaniemi, S.: UCLALES–SALSA v1.0: a large-eddy model with interactive sectional microphysics for aerosol, clouds and precipitation, Geosci. Model Dev., 10, 169–188, https://doi.org/10.5194/gmd-10-169-2017, 2017. a, b, c
Tukiainen, S., O'Connor, E., and Korpinen, A.: CloudnetPy: A Python package for processing cloud remote sensing data, Journal of Open Source Software, 5, 2123, https://doi.org/10.21105/joss.02123, 2020. a
Ullrich, R., Hoose, C., Möhler, O., Niemand, M., Wagner, R., Höhler, K., Hiranuma, N., Saathoff, H., and Leisner, T.: A New Ice Nucleation Active Site Parameterization for Desert Dust and Soot, J. Atmos. Sci., 74, 699–717, https://doi.org/10.1175/JAS-D-16-0074.1, 2017. a, b, c, d
Ullrich, R., Hoose, C., Cziczo, D. J., Froyd, K. D., Schwarz, J. P., Perring, A. E., Bui, T. V., Schmitt, C. G., Vogel, B., Rieger, D., Leisner, T., and Möhler, O.: Comparison of Modeled and Measured Ice Nucleating Particle Composition in a Cirrus Cloud, J. Atmos. Sci., 76, 1015–1029, https://doi.org/10.1175/JAS-D-18-0034.1, 2019. a
Vali, G., DeMott, P. J., Möhler, O., and Whale, T. F.: Technical Note: A proposal for ice nucleation terminology, Atmos. Chem. Phys., 15, 10263–10270, https://doi.org/10.5194/acp-15-10263-2015, 2015. a
Voigt, C., Schumann, U., Minikin, A., Abdelmonem, A., Afchine, A., Borrmann, S., Boettcher, M., Buchholz, B., Bugliaro, L., Costa, A., Curtius, J., Dollner, M., Dörnbrack, A., Dreiling, V., Ebert, V., Ehrlich, A., Fix, A., Forster, L., Frank, F., Fütterer, D., Giez, A., Graf, K., Grooß, J.-U., Groß, S., Heimerl, K., Heinold, B., Hüneke, T., Järvinen, E., Jurkat, T., Kaufmann, S., Kenntner, M., Klingebiel, M., Klimach, T., Kohl, R., Krämer, M., Krisna, T. C., Luebke, A., Mayer, B., Mertes, S., Molleker, S., Petzold, A., Pfeilsticker, K., Port, M., Rapp, M., Reutter, P., Rolf, C., Rose, D., Sauer, D., Schäfler, A., Schlage, R., Schnaiter, M., Schneider, J., Spelten, N., Spichtinger, P., Stock, P., Walser, A., Weigel, R., Weinzierl, B., Wendisch, M., Werner, F., Wernli, H., Wirth, M., Zahn, A., Ziereis, H., and Zöger, M.: ML-CIRRUS: The Airborne Experiment on Natural Cirrus and Contrail Cirrus with the High-Altitude Long-Range Research Aircraft HALO, B. Am. Meteorol. Soc., 98, 271–288, https://doi.org/10.1175/BAMS-D-15-00213.1, 2017. a
Weger, M., Heinold, B., Engler, C., Schumann, U., Seifert, A., Fößig, R., Voigt, C., Baars, H., Blahak, U., Borrmann, S., Hoose, C., Kaufmann, S., Krämer, M., Seifert, P., Senf, F., Schneider, J., and Tegen, I.: The impact of mineral dust on cloud formation during the Saharan dust event in April 2014 over Europe, Atmos. Chem. Phys., 18, 17545–17572, https://doi.org/10.5194/acp-18-17545-2018, 2018. a, b, c, d, e, f, g, h, i, j
Welti, A., Lüönd, F., Stetzer, O., and Lohmann, U.: Influence of particle size on the ice nucleating ability of mineral dusts, Atmos. Chem. Phys., 9, 6705–6715, https://doi.org/10.5194/acp-9-6705-2009, 2009. a, b
Welti, A., Kanji, Z. A., Lüönd, F., Stetzer, O., and Lohmann, U.: Exploring the Mechanisms of Ice Nucleation on Kaolinite: From Deposition Nucleation to Condensation Freezing, J. Atmos. Sci., 71, 16–36, https://doi.org/10.1175/JAS-D-12-0252.1, 2014. a
Westbrook, C. D., Hogan, R. J., and Illingworth, A. J.: The Capacitance of Pristine Ice Crystals and Aggregate Snowflakes, J. Atmos. Sci., 65, 206–219, https://doi.org/10.1175/2007JAS2315.1, 2008. a, b
Zeng, Y., Wang, M., Zhao, C., Zhu, Y., Rosenfeld, D., and Huang, K.-E.: Extremely High Concentrations of Ice Particles in East Asian Dust-Infused Baroclinic Storm (DIBS) Cirrus Shield: Dominant Role of Dust Ice Nucleation Effect, J. Geophys. Res.-Atmos., 128, e2022JD038034, https://doi.org/10.1029/2022JD038034, 2023. a
- Abstract
- Introduction
- Methods
- Results and discussion
- Conclusions
- Appendix A: List of abbreviations and variables
- Appendix B: Equations
- Appendix C: Ice nucleation parameterizations
- Code and data availability
- Author contributions
- Competing interests
- Disclaimer
- Acknowledgements
- Financial support
- Review statement
- References
- Supplement
- Abstract
- Introduction
- Methods
- Results and discussion
- Conclusions
- Appendix A: List of abbreviations and variables
- Appendix B: Equations
- Appendix C: Ice nucleation parameterizations
- Code and data availability
- Author contributions
- Competing interests
- Disclaimer
- Acknowledgements
- Financial support
- Review statement
- References
- Supplement