
the Creative Commons Attribution 4.0 License.
the Creative Commons Attribution 4.0 License.
 | 11 Nov 2026
Sensitivity of marine cloud brightening over the Great Barrier Reef to spatial variability in aerosol forcing: a case study using a convection-permitting model

Steven Siems
Daniel Harrison
The Great Barrier Reef (GBR) is increasingly threatened by mass thermal coral bleaching events under climate change. Marine cloud brightening (MCB) has been proposed as a potential adaptation strategy to reduce thermal stress by enhancing cloud reflectivity through aerosol injection. This study evaluates the sensitivity of cloud–aerosol interactions to aerosol emission intensity and spatial configuration over the GBR using convection-permitting Weather Research and Forecasting (WRF) model simulations.
A control simulation representing a non- to weakly-precipitating shallow trade-cumulus regime is compared with three MCB sensitivity experiments: a densely distributed (20 km apart), moderate emission flux scenario (EXP20), a sparsely distributed (100 km spacing), high emission flux scenario (EXP100), and an intermediate configuration (EXP40). Results show that enhanced aerosol emissions substantially increase near-surface aerosol concentrations, with dispersion strongly governed by source spacing and prevailing trade winds. The EXP20 configuration produces more homogeneous and widespread aerosol enhancements, whereas EXP100 generates localized peaks that are rapidly removed, resulting in smaller domain-mean increases despite identical total emissions.
Over a 24 h period, domain-averaged cloud droplet number concentration (CDNC), optical depth, and cloud albedo exhibit strong sensitivity to aerosol loading, while cloud water path (CWP) and cloud fraction show limited responses. These findings indicate a dominant Twomey effect in this cloud regime, with only weak evidence of the Albrecht effect. Nonlinear CWP responses are noted under varying conditions of mid-level humidity, wind shear, and lower-tropospheric stability. Overall, the results highlight the importance of aerosol source configuration and background atmospheric state in shaping MCB effectiveness over the GBR.
- Article
(9391 KB) - Full-text XML
-
Supplement
(3342 KB) - BibTeX
- EndNote


The Great Barrier Reef (GBR) has become increasingly vulnerable to more frequent and severe mass thermal coral bleaching events (CBEs) over the past decade (AIMS, 2026; Hughes et al., 2017). Since 1998, eight major thermal CBEs have been recorded over the GBR, six of which have occurred since 2016 (AIMS, 2026). While oceanic warming is a primary driver of bleaching, local cloud cover plays a pivotal role in modulating the surface heat budget over the reef by regulating radiative fluxes. Across the GBR, variations in local cloudiness have been identified as a key factor in controlling the intensity of incoming solar radiation and sea surface temperatures, largely independent of the effects from large-scale climate drivers (Zhao et al., 2021; Richards et al., 2024). These findings underscore that maintaining or enhancing cloud shading over the reef could help moderate extreme warming of the shallow reef waters.
Marine Cloud Brightening (MCB) has been proposed as a localized climate intervention strategy to increase cloud reflectivity and provide shading for vulnerable ecosystems like coral reefs (Latham et al., 2008, 2013; Ahlm et al., 2017; Harrison, 2024; Feingold et al., 2024). By injecting aerosol particles (such as sea-salt spray) that act as cloud condensation nuclei (CCN) into marine warm clouds, MCB aims to increase cloud droplet number concentrations, yielding clouds with smaller droplet sizes and higher optical thickness for the same liquid water content. The result is a brighter cloud that reflects more sunlight back to space, thereby reducing the net solar radiation reaching the ocean surface (Twomey, 1977). In addition, by suppressing warm-rain formation, added CCN can potentially increase cloud longevity and coverage, known as the cloud lifetime effect (Albrecht, 1989). However, aerosol-induced cloud adjustments are complex and may also act in the opposite direction: enhanced entrainment of dry air can reduce cloud liquid water and cloud fraction under certain environmental conditions. MCB was initially envisioned as a global climate intervention (Latham, 1990, 2002), but more recent efforts have considered targeted regional applications to protect sensitive areas such as the GBR (Latham et al., 2013; Harrison et al., 2025; Hernandez-Jaramillo et al., 2025). Notably, the first field trials of MCB were conducted on the GBR in 2020–2021 (Tollefson, 2021), and a dedicated research program is ongoing to assess its feasibility under the Reef Restoration and Adaptation Program (Condie et al., 2021; Harrison, 2023; Baresi et al., 2025). Early observational evidence provides initial insights: a recent airborne study over the GBR found that summertime cumulus clouds in the region were associated with differences in droplet number and size under varying aerosol conditions, with polluted air masses linked to smaller, more numerous cloud droplets and lower rainfall from warm clouds (Hernandez-Jaramillo et al., 2024; Braga et al., 2025). While these contrasts do not isolate aerosol perturbations from concurrent meteorological variability, they are consistent with the expected microphysical responses to enhanced aerosol conditions and suggest that GBR cloud systems are indeed amenable to brightening through aerosol seeding, in line with the physical basis of MCB. However, despite this growing body of observational evidence and the emergence of real-world field testing, critical questions remain regarding the efficiency, spatial extent, and persistence of MCB induced cloud responses at regional scales (Wood and Ackerman, 2013).
One key question is how effective deliberate aerosol injections would be in enhancing cloud reflectivity and reducing surface heating, given the complex, nonlinear response of cloud systems to aerosols (Ackerman et al., 2004; Rosenfeld et al., 2019; Stevens and Feingold, 2009). For instance, in humid and weakly sheared environments, additional aerosols might increase cloud water by suppressing drizzle (Twomey, 1977; Albrecht, 1989), whereas in dry, strongly subsiding environments, the same aerosol addition could reduce cloud liquid water via enhanced entrainment of dry air (Ackerman et al., 2004). The overall radiative benefit therefore depends not only on the magnitude of aerosol-induced microphysical changes but also on the interplay between meteorological variability, boundary-layer dynamics, and potential feedbacks on cloud lifetime and precipitation efficiency. Another open question is how the spatial distribution of aerosol sources influences MCB efficacy. A given total aerosol emission could be delivered by many small, closely spaced sprayers or a few large, widely spaced sprayers, it is unclear which approach yields a greater cloud brightening effect over a region. Understanding these sensitivities is crucial for designing optimal deployment strategies and planning future MCB experiments with a consideration of energy and cost saving.
To address these questions, we employ convection-permitting numerical simulations focused on a region of the GBR. High-resolution models (cloud-resolving to kilometre-scale) are suited to capture some of the detailed cloud microphysical responses to aerosol perturbations (Stevens and Feingold, 2009; Dagan et al., 2016; Zhao et al., 2024; Saffin et al., 2023) while still encompassing the mesoscale context of the reef environment. In this study, we use the Weather Research and Forecasting (WRF) model with a sophisticated aerosol-aware microphysics scheme to conduct a set of case study simulations. We assess how marine shallow cloud fields over the GBR respond to different spatial configurations of aerosol emissions. By comparing a control case with no seeding to a series of seeding configurations, we examine the sensitivity of cloud droplet population, cloud water content, cloud fraction, and cloud optical properties to aerosol injection patterns. We also explore how meteorological factors modulate the cloud responses. The aim is to provide new insight into the potential effectiveness of MCB over the GBR and to identify the environmental conditions and deployment strategies most conducive to achieving a beneficial increase in cloud reflectivity.
2.1 Model configuration
In this study, a convection-permitting numerical model is employed to simulate aerosol-cloud interactions over the GBR region. Specifically, the simulations are conducted with the Weather Research and Forecasting (WRF, version 4.2) model, where two nested domains (denoted d01 and d02) are employed with horizontal grid spacings of 5 and 1 km, respectively. The outer domain (5 km resolution) covers a large portion of the Northeast Australian coast and adjacent Coral Sea, while the inner domain (1 km resolution) is centred on the central GBR around the Cairns region (Fig. 1). Note that one-way nesting was used, with the parent domain driving the nested domain without feedback. All simulations employ a vertical grid with 65 unevenly distributed levels, with finer spacing in the boundary layer (30 levels below 3 km) to resolve cloud layers.
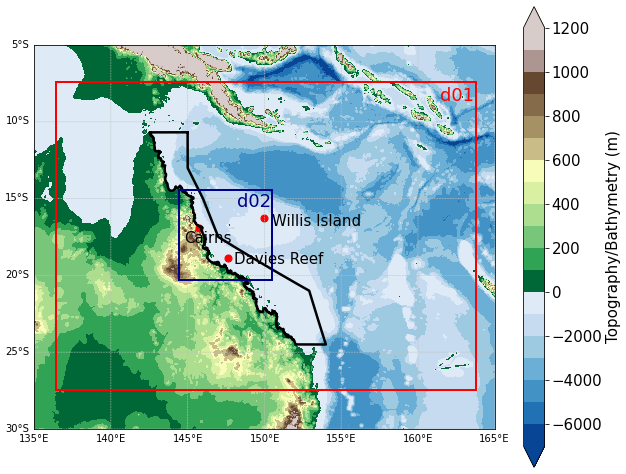
Figure 1Nested domain configuration applied in all WRF simulations in this study. Coloring represents the topography-bathymetry of the domain. Black polygon outlines the GBR region.
All simulations are initialized at 00:00 UTC on 6 February 2022 and running for 3 d, with the first 12 h used as spin-up time. The model uses the fifth-generation atmospheric reanalysis (hourly, 0.25° × 0.25° grid, 37 set pressure levels and surface level) from the European Centre for Medium Range Weather Forecast (ERA5 reanalysis, Hersbach et al., 2018, 2020) for initial and lateral boundary conditions. Following initialization, the model is allowed to run freely with no nudging applied, which enables the meteorology to fully develop throughout the simulation. Model prediction output history intervals are 3 h for d01 and 1 h for the d02. The analysis in this study focuses on the high-resolution (1 km) inner domain unless otherwise noted.
Table 1Configuration settings for numerical simulations conducted in this study.
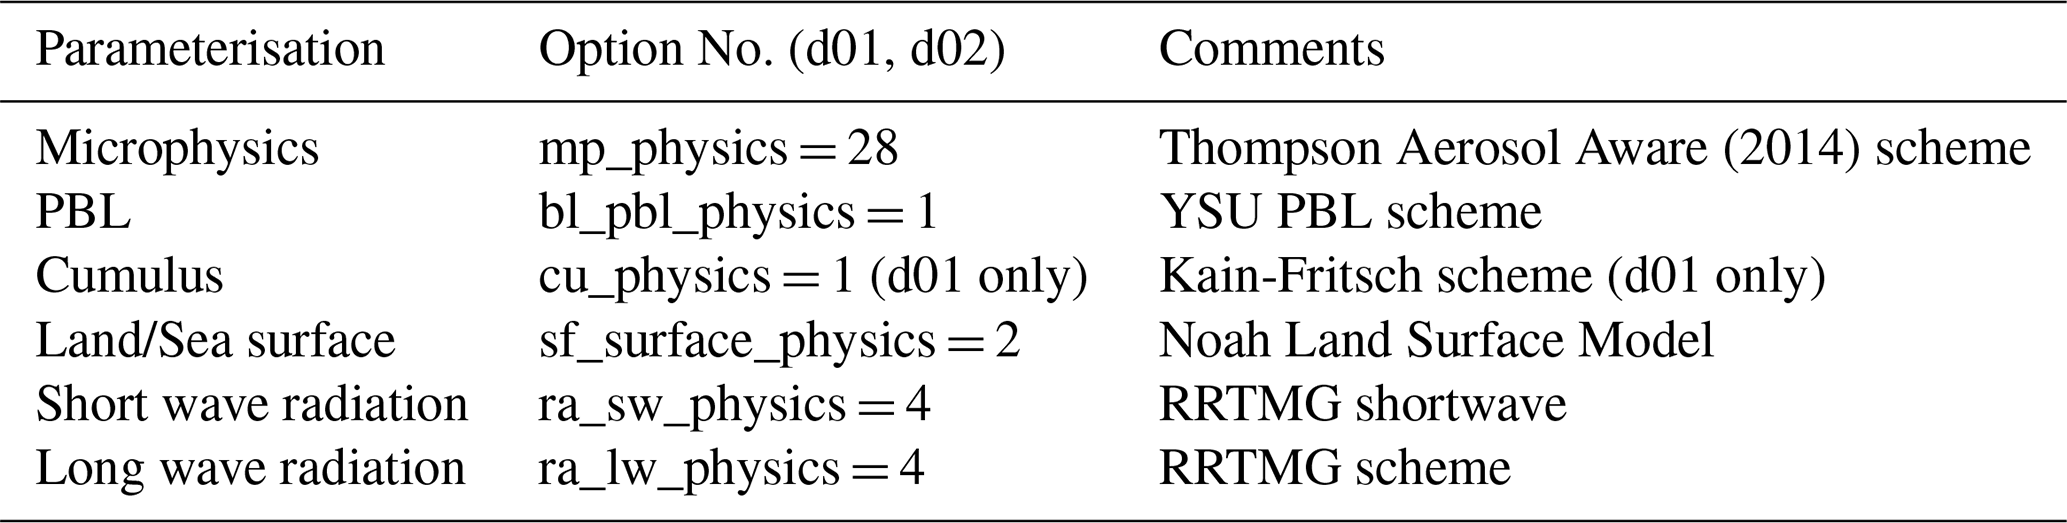
An overview of the parameterization schemes used in the CTRL simulation is shown in Table 1, with the same configuration settings being applied to all sensitivity experiments. Note that this configuration has been tested and demonstrated to exhibit high skill in predicting the marine shallow clouds over the GBR (Zhao et al., 2024). In this configuration, we use the Thompson Aerosol Aware microphysics scheme (Thompson and Eidhammer, 2014), Yonsei University planetary boundary layer scheme (YSU, Hong et al., 2006, first-order nonlocal), “Noah” land surface model (Chen and Dudhia, 2001), and the RRTMG scheme for shortwave and longwave radiation (Mlawer et al., 1997) are applied for each domain. The Kain-Fritsch cumulus parameterisation (Janjić 2000) is only used for the coarse domain (d01) to represent sub-grid convection. The Thompson Aerosol Aware microphysical parameterization uses an auxiliary aerosol climatology as the aerosol background condition placed into WRF model for every grid point, rather than assuming all model horizontal grid points have the same vertical profiles of aerosols. This aerosol climatology is derived from multiyear (2001–2007) global model simulations (Colarco et al., 2010) in which particles and their precursors are emitted by natural and anthropogenic sources. Note that, in this study, the February aerosol climatology value is scaled down by a factor of four for model initialization to represent a more pristine, trade-wind dominated scenario. The unscaled February climatology is strongly influenced by continental aerosol populations and is biased high compared to typical maritime conditions over the GBR. This adjustment is therefore grounded in in-situ observations from a recent field campaign, which reported very low background CCN concentrations (∼180 cm3 near the surface) over the GBR during prevailing trade flow conditions (Hernandez-Jaramillo et al., 2024; Braga et al., 2025). For example, the unscaled February climatology produces an aerosol number concentration of ∼750 cm−3 over the Cairns Region, substantially higher than observations; scaling by one quarter reduces this to ∼190 cm−3.
2.2 Sensitivity experiments
In this study, three sensitivity experiments are undertaken to examine the impact of aerosol source spacing and emission strength on cloud–aerosol interactions over the Cairns region of the GBR. In all three experiments, an identical total aerosol emission flux (7.5×10¹⁷ particles s−1) is introduced into the model, but the number of emission points and the per-source emission rate are varied. In all cases, additional emissions occur only at the surface (the lowest model layer), simulating spray released at the ocean surface, representing continuous operation of MCB sprayers releasing sea-salt aerosol into the marine boundary layer.

Figure 2Locations of aerosol emission source points with varying aerosol emission levels and spacing in three sensitivity experiments. Red dots indicate source points with 20 km spacing. Blue triangles are for source points with 40 km spacing over upwind of domain. Green crosses represent source points with 100 km spacing upwind domain. Red line outlines the shape of interest area, Cairns Region, of this study.
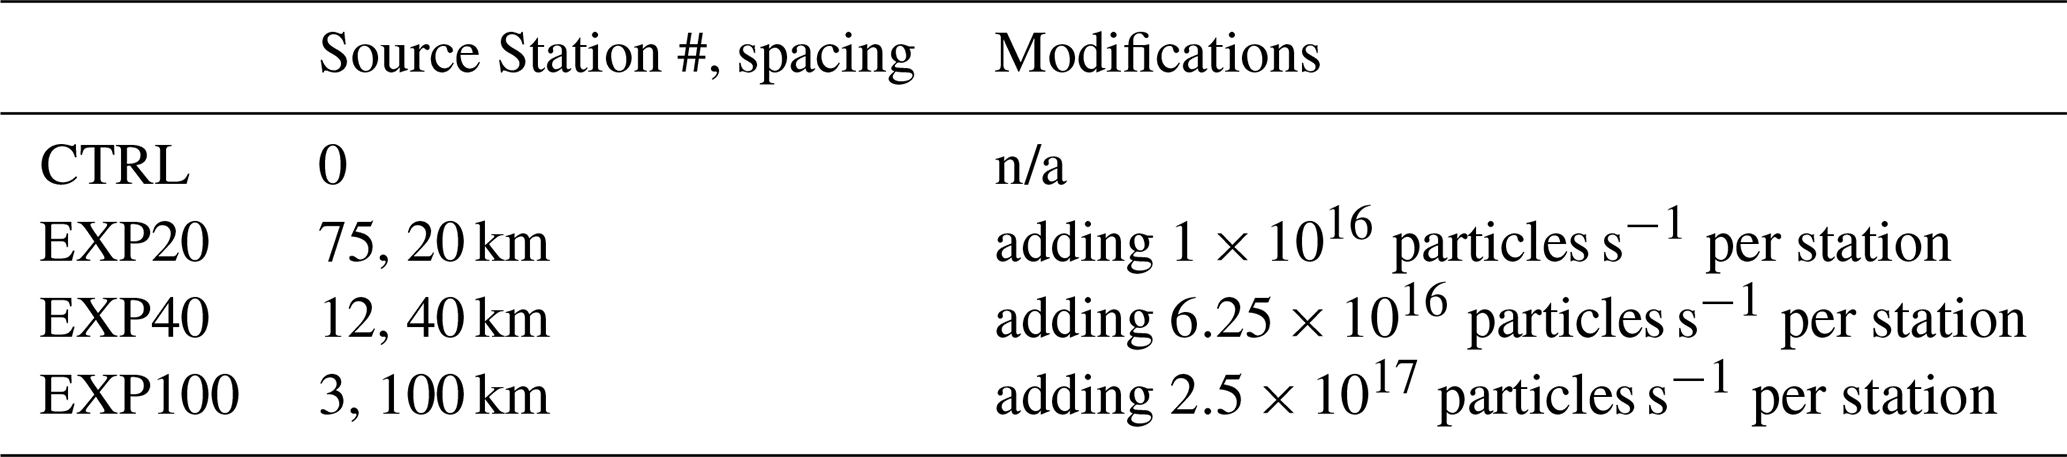
In each sensitivity experiment, the total aerosol emission flux is distributed equally among the different total number of point sources in the scenario (Fig. 2). Specifically, in the dense experiment, namely EXP20, an additional aerosol flux of the 1×10¹⁶ particles s−1 is added to climatological surface emission of water-friendly aerosols at each of 75 source points, which are distributed at a fine spatial spacing of 20 km. This setup represents a scenario with more densely distributed aerosol sources, but with relatively lower increased localized aerosol emissions. The second experiment, EXP40, uses 12 point sources spaced 40 km apart, 3 sets of 4 stations aligned along the predominant axis of wind (Fig. 2, blue triangles). Each source in this case emits 6.25×10¹⁶ particles s−1. Similarly, EXP100, the sparse experiment uses 3 point sources spaced about 100 km apart along the axis of the wind (Fig. 2, green crosses), with each source emitting 2.5×10¹⁷ particles s−1. This setup simulates a scenario with more sparsely distributed but much stronger increased localized emissions compared to the other two experiments. A summary of the detailed configuration is listed in Table 2. It is also important to note that these surface aerosol emission flux remain constant throughout the simulation, representing a continuous aerosol spraying scenario over the region.
Table 2Details information of numerical experiments conducted in this study.
n/a: not applicable
2.3 Observational Data
Several observational datasets are used to evaluate the CTRL simulation. In this study, sounding data at 00:00 UTC on 7 and 8 February 2022 are obtained from the University of Wyoming upper-air sounding database for available station, Willis Island (code: 94299, Fig. 1). Channel 13 brightness temperatures and RGB from Himawari-8 satellite dataset (Bureau of Meteorology, 2021) are obtained from the Australian Bureau of Meteorology for the time 00:00 UTC on 7 and 8 February 2022.
To evaluate the simulated cloud microphysical properties, we calculate the cloud droplet number concentration (CDNC) using Himawari-8 derived effective radius and cloud optical thickness obtained from the Australian Bureau of Meteorology (Bureau of Meteorology, 2022). Note that the cloud phase identification fails for some pixels, preventing subsequent microphysical retrievals (Fig. S1 in the Supplement). As a result, the derived CDNC exhibits reduced cloud coverage compared to infrared brightness temperature. The equation used for calculating the CDNC is:
where cot denotes the cloud optical thickness, and k is a parameter related to the dispersion of the assumed cloud droplet size distribution; a constant value of 0.8 is used in this study. The scattering efficiency, Q, is set to its geometric-optics limiting value of 2. The liquid water density, ρl, is taken as 1.0×10³ kg m−3, and cw represents the temperature-dependent condensation rate (kg m−4), prescribed as 80 % of its adiabatic value following Bennartz (2007). Although this 80 % adiabatic assumption may introduce some temperature-dependent bias, its contribution to the overall uncertainty is relatively small, as demonstrated by Huang et al. (2016). The effective radius, re, is retrieved from Himawari-8 observations using the 1.6 µm channel. It should be noted that satellite-retrieved effective radius represents conditions at a penetration depth below the cloud top that depends on the observation wavelength. Compared to the 3.7 µm channel, the 1.6 µm channel penetrates approximately two to three times deeper into the cloud, which can introduce a positive bias in the inferred CDNC and lead to uncertainties of up to ∼100 % (Bennartz and Rausch, 2017; Huang et al., 2016).
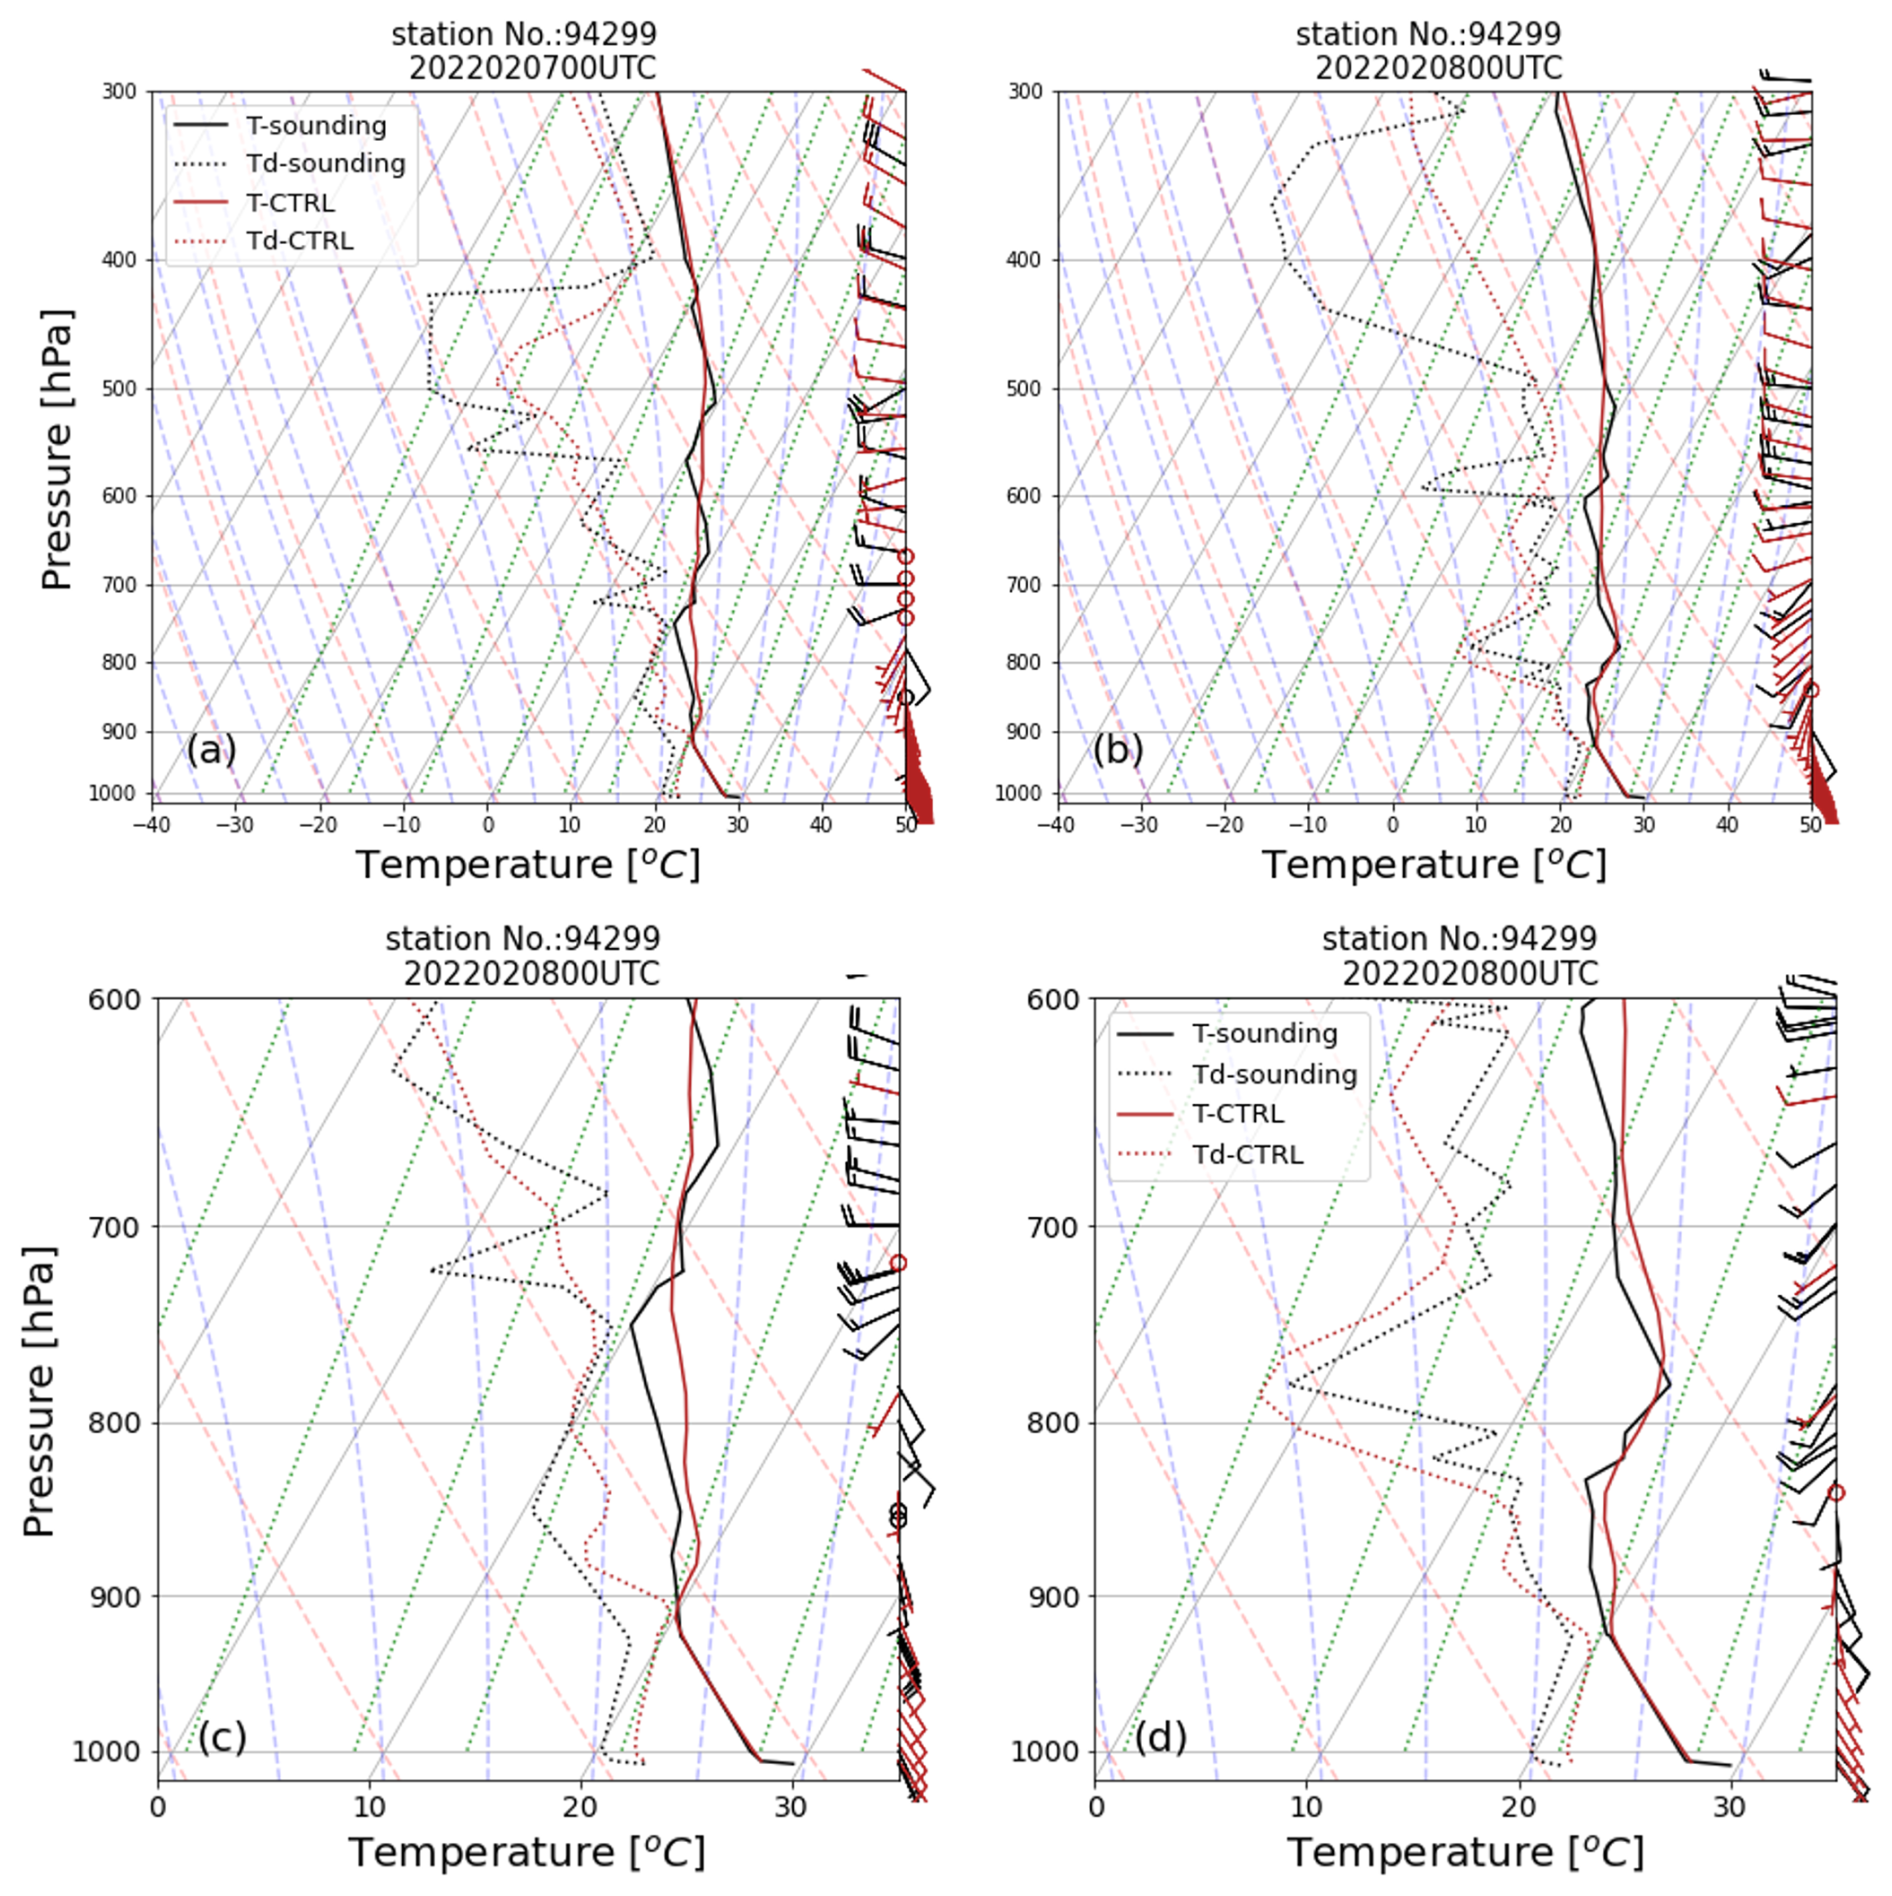
Figure 3(a) Comparison of the observed sounding profiles (black lines) from Willis Island (station No. 94299) alongside 1 km WRF atmospheric profile simulations (red lines) from the nearest grid point on 7 February 2022 at 00:00 UTC. (b) same as (a), but for 8 February 2022 at 00:00 UTC. (c)–(d) same as (a)–(b), but zoomed in to lower levels from surface to 600 hPa.
3.1 Control simulation
The simulated synoptic and the cloud conditions are first evaluated by comparing the control simulation with observations. The control simulation skillfully simulated the evolution of the synoptic-scale mean surface level pressure and surface winds (Fig. S2). Figure 3 shows the observed soundings (black) from Willis Island and the simulated atmospheric profile (red) at the nearest grid point in the 1 km domain at 00:00 UTC on 7 and 8 February. The simulated soundings at both times are in good agreement with observations, with both wind speed and direction well captured throughout the profile.
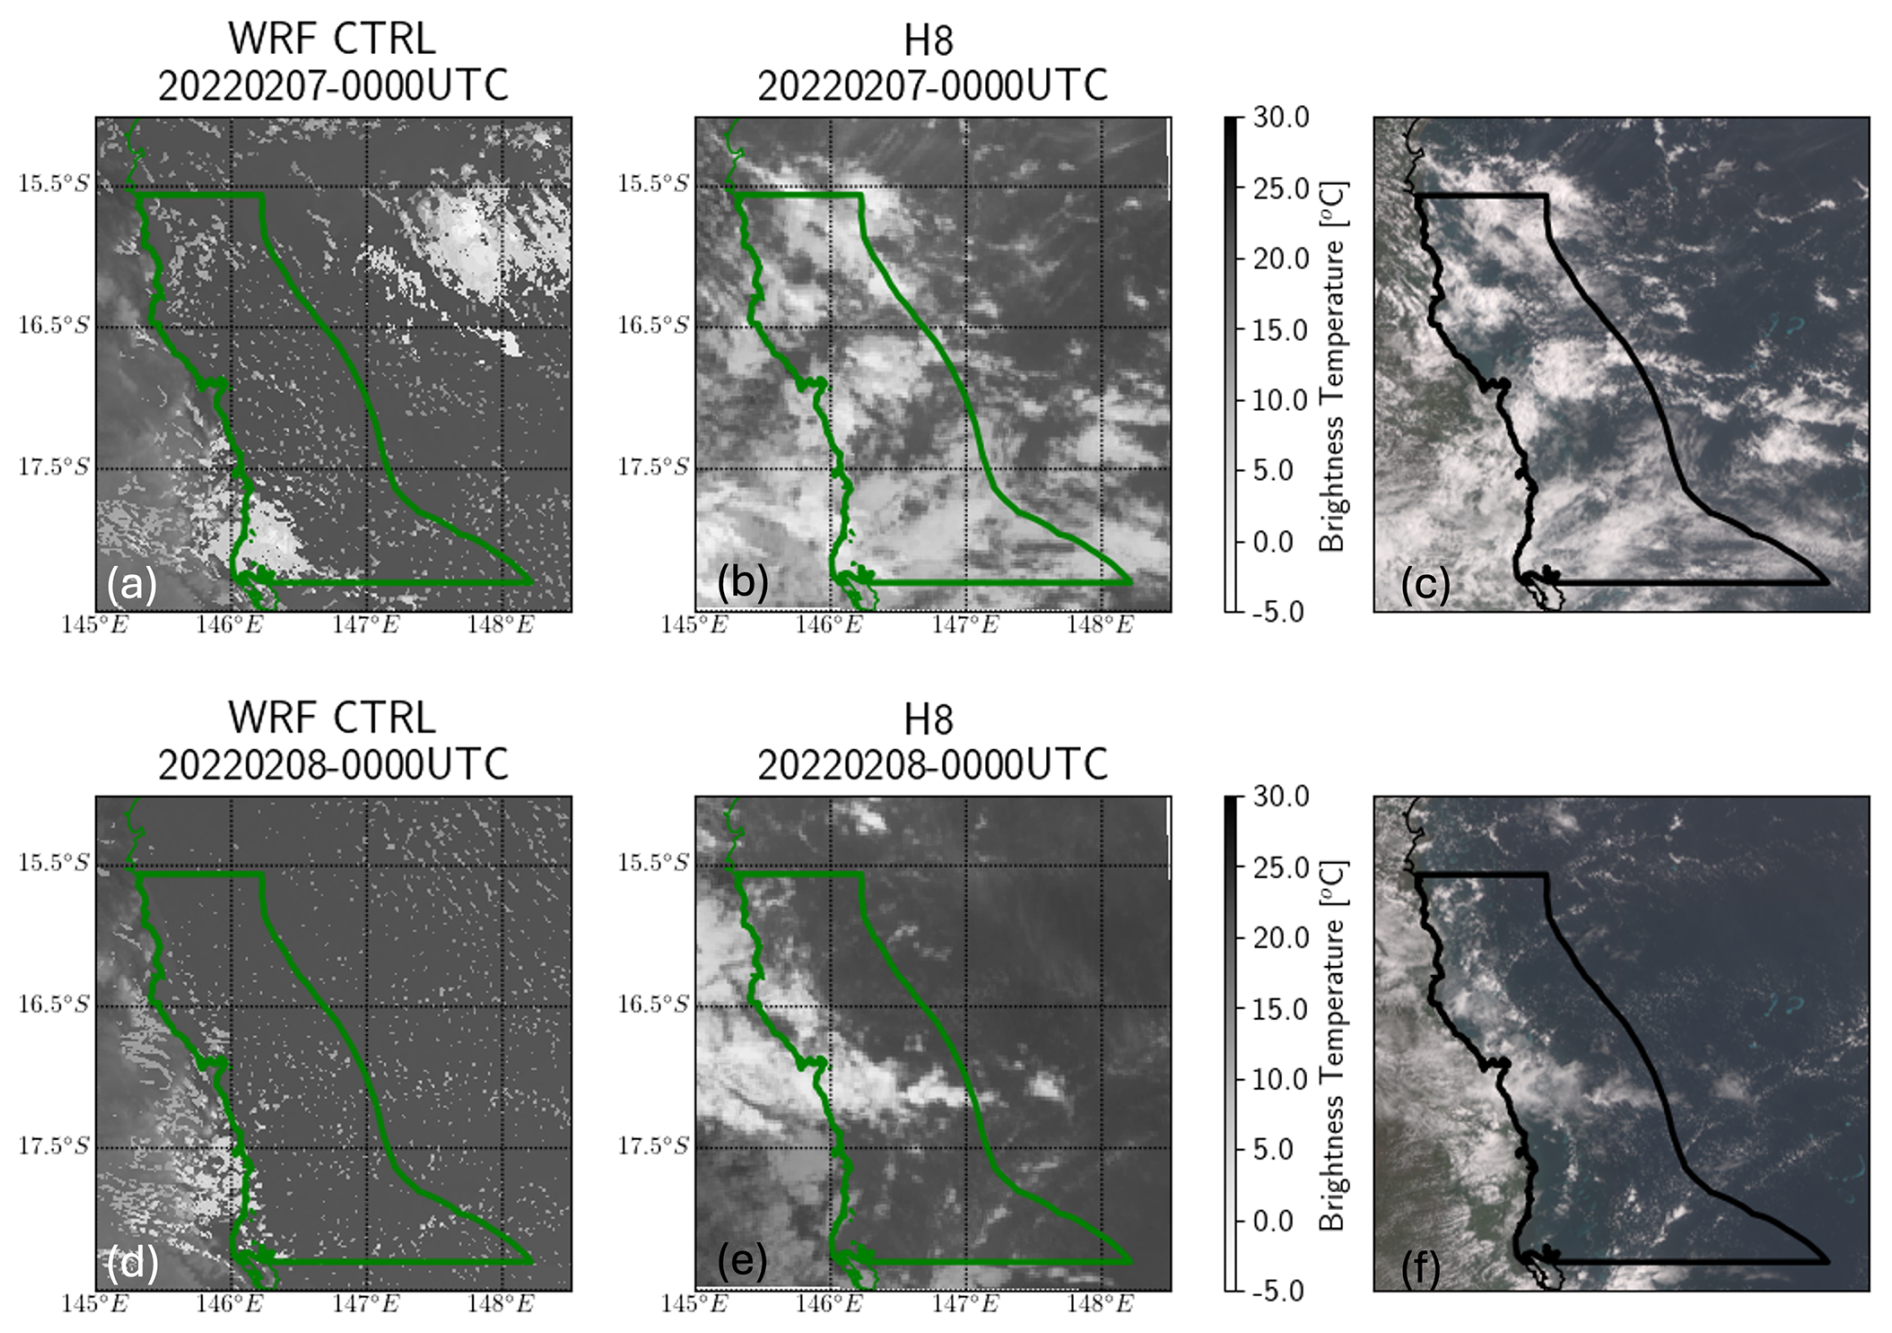
Figure 4(a) Simulated brightness temperatures from CTRL at 1 km resolution on 7 February 2022 at 00:00 UTC. (b) Brightness temperatures of band 13 (10.4 µm) derived from Himawari-8 satellite observations on 7 February 2022 at 00:00 UTC. Green lines outline the domain of Cairns region. (c) True color image from Himawari-8 satellite observations on 7 February 2022 at 00:00 UTC. Black line outlines the domain of Cairns region. Note that same color scales applied in (a) and (b). (d)–(f) same as (a)–(c), but for 8 February 2022 at 00:00 UTC.
Figure 4 compares the observed and simulated brightness temperature together with Himawari-8 true-color imagery at 00:00 UTC on 7 and 8 February 2022. The simulated brightness temperature is calculated using a simplified approach, assuming unit surface emissivity and an effective cloud optical depth of one, and is therefore intended solely for qualitative evaluation of the simulated cloud field. Overall, the model underestimates the cloud fraction and does not fully reproduce the observed spatial organization when compared with Himawari-8 observations. In particular, much of the high-level cloud cover within the domain is underestimated or missing, leading to discrepancies in the representation of fine-scale cloud structures. Such differences are expected given the inherent difficulty in reproducing the exact realization of convective cloud fields. However, the model captures the key characteristics of the maritime shallow cloud regime visible in the true-color imagery (Fig. 4c and f) and brightness temperature proxy, which is the primary focus of this study. In particular, the lower-tropospheric thermodynamic structure (Fig. 3c and d) is reasonably well represented, providing a physically consistent boundary layer environment for shallow cloud formation. Therefore, although the detailed cloud morphology is not fully reproduced, the simulation is considered suitable for investigating aerosol–cloud interaction processes under shallow cumulus conditions.
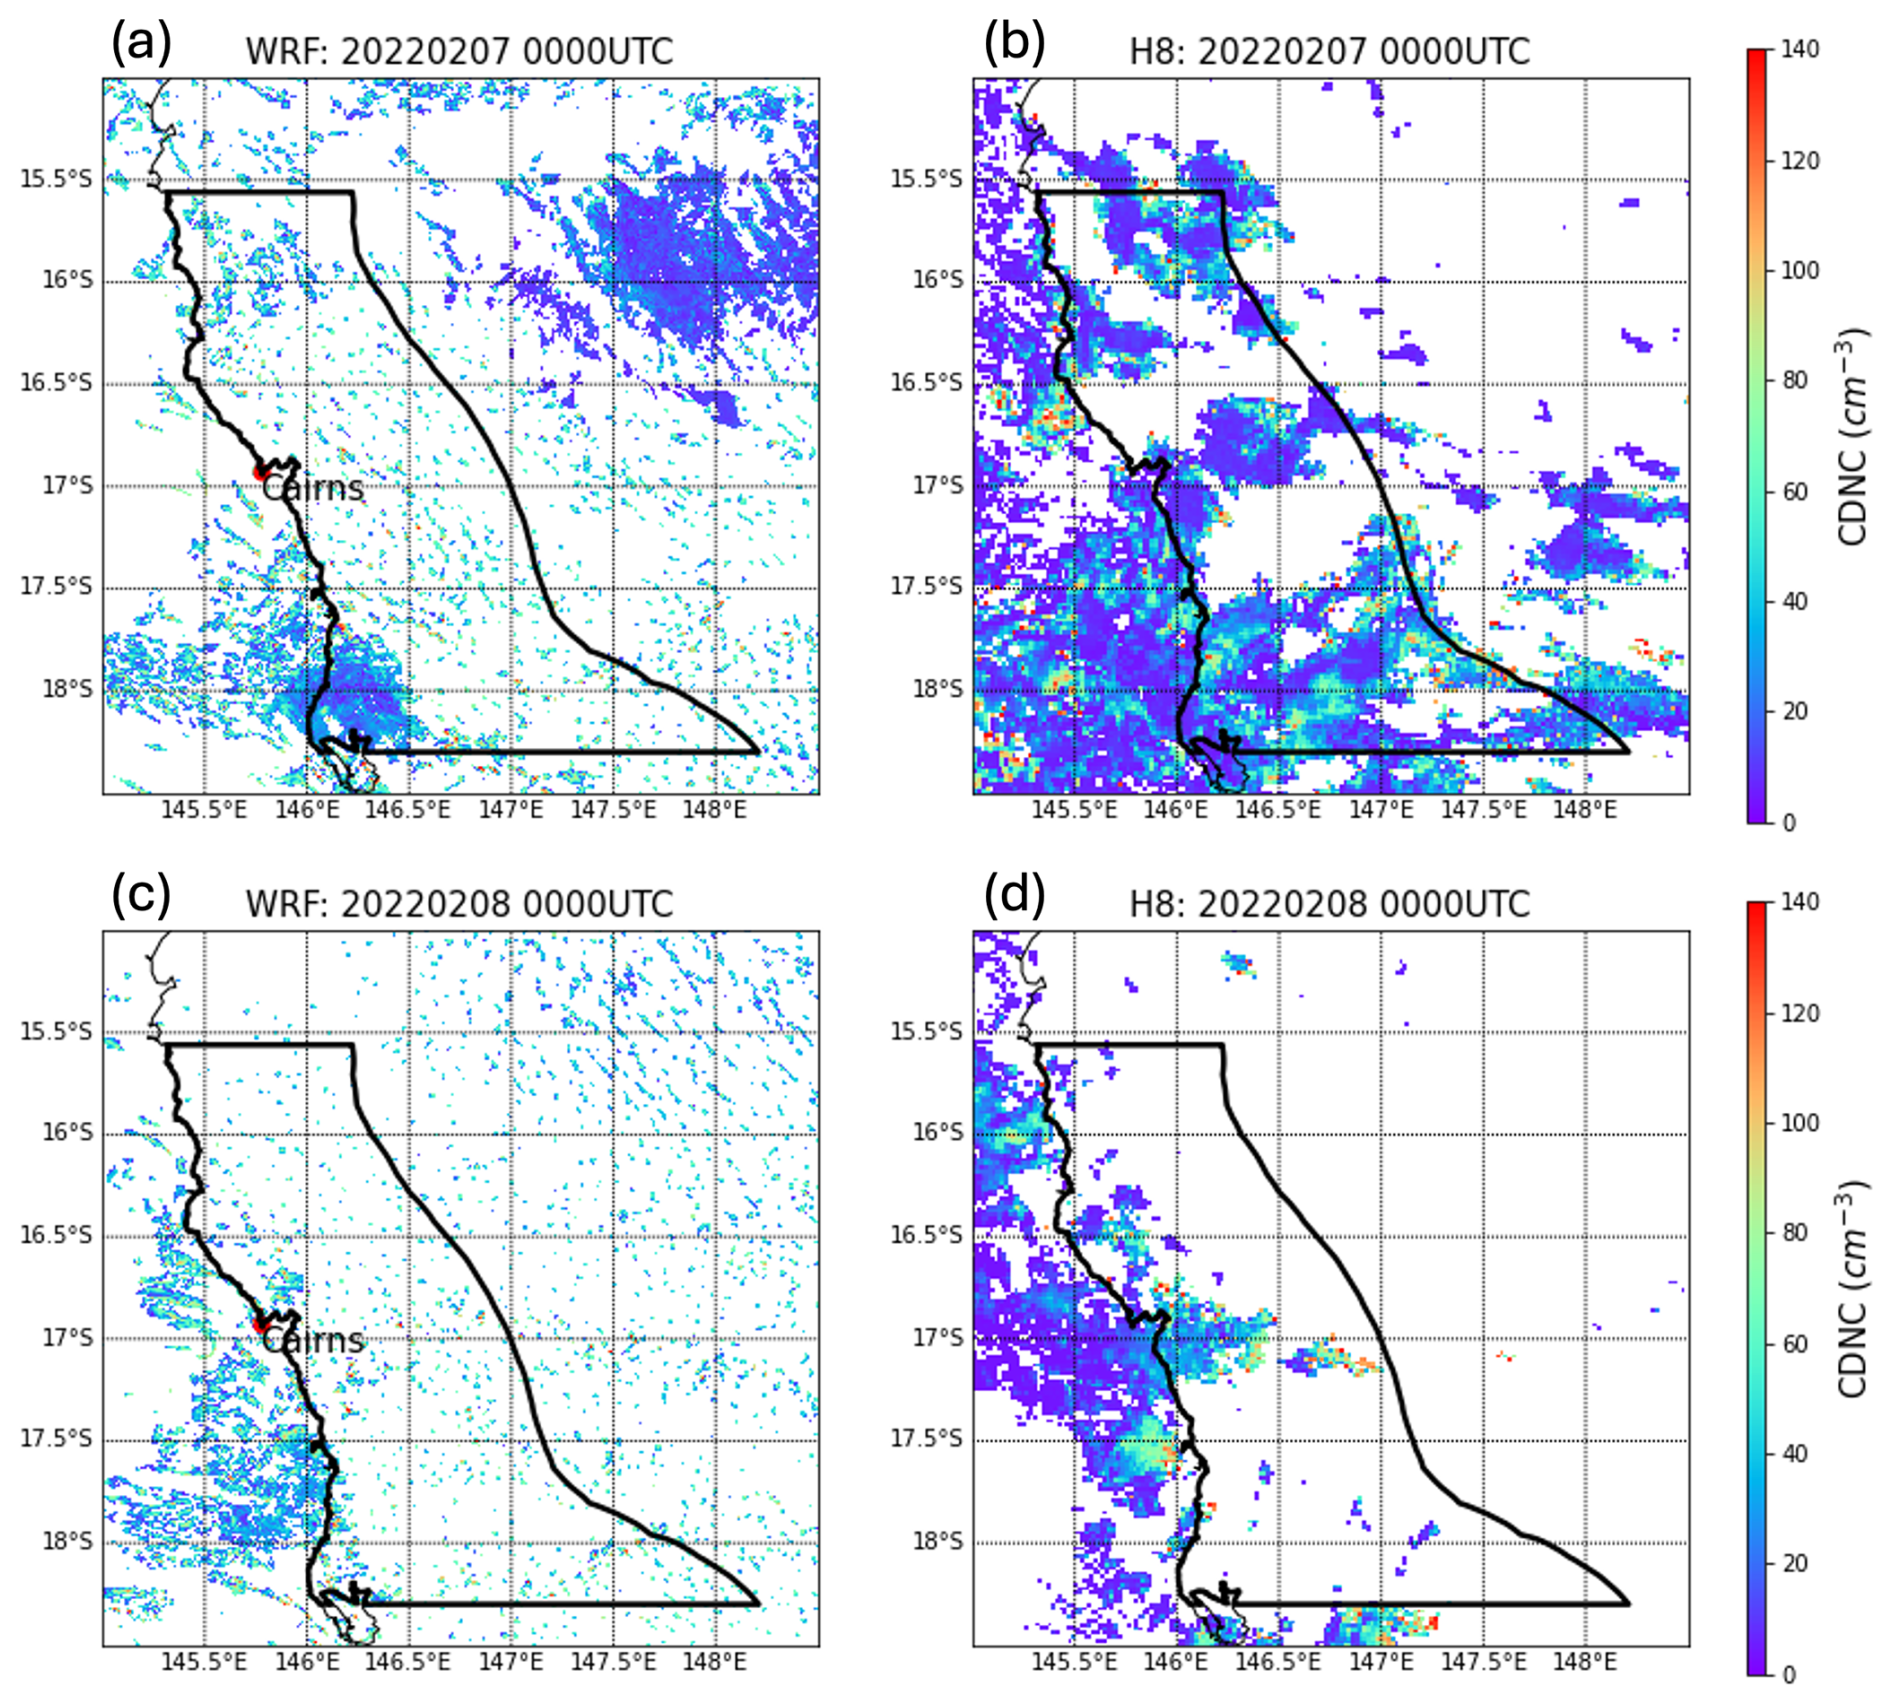
Figure 5(a) Simulated cloud droplet number concentration (CDNC) from CTRL at 1 km resolution on 7 February 2022 at 00:00 UTC. (b) Derived CDNC from Himawari-8 observations (at 1.6 µm) on 7 February 2022 at 00:00 UTC. (c)–(d) same as (a)–(b), but for 8 February 2022 at 00:00 UTC. Note that same color scales applied in all panels.
Figure 5 further compares the simulated cloud-top cloud droplet number concentration (CDNC) with Himawari-8 derived CDNC at 00:00 UTC on 7 and 8 February 2022. Overall, the simulated CDNC falls within a reasonable quantitative range relative to the satellite-derived estimates. Some discrepancies persist, most notably a modest negative bias in the CTRL simulation in localized regions and in areas affected by deeper or more heterogeneous cloud systems. Given the large uncertainties inherent in satellite CDNC retrievals as mentioned earlier, these differences are not unexpected and do not undermine the overall consistency. Despite these limitations, the overall agreement supports the conclusion that the CTRL simulation reasonably captures the microphysical characteristics of the target maritime shallow clouds, providing a strong foundation for the subsequent sensitivity analyses.
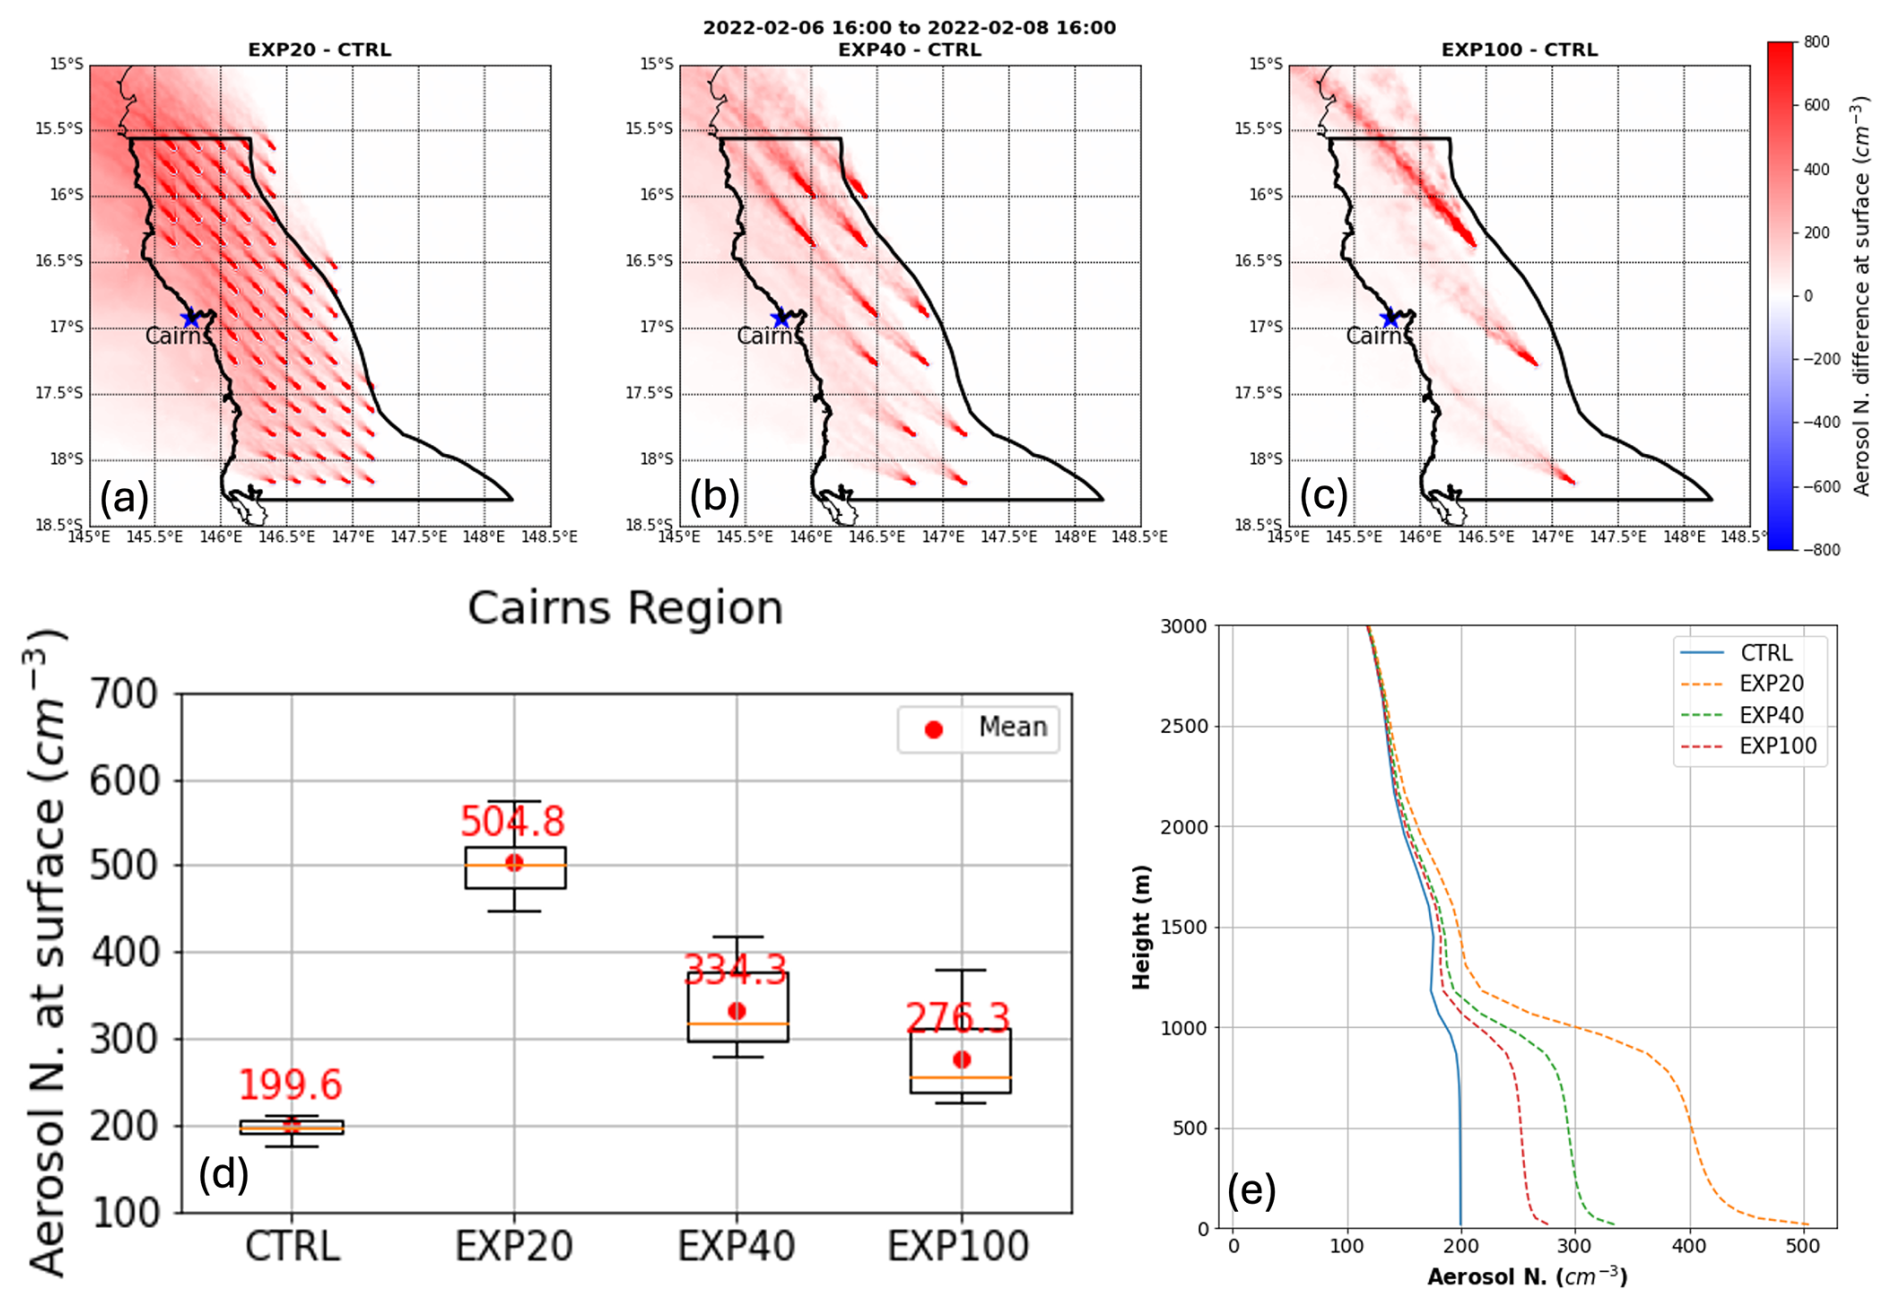
Figure 6(a) Difference in surface aerosol number concentration between EXP20 and CTRL over the time period 16:00 UTC on 6 February to 16:00 UTC on 8 February. (b)–(c) same as (a), but for difference between EXP40 and CTRL, EXP100 and CTRL. Note that same color scale is applied to both (a) to (c). (d) Boxplot of area-averaged surface aerosol number concentration over Cairns Region throughout the simulation time. Red dots represent the mean values from each experiment. (e) Vertical profiles of time-area-averaged aerosol number concentration over Cairns Region throughout the simulation time.
3.2 Aerosol distribution
Introducing continuous aerosol emissions in the three experiments leads to substantially elevated aerosol number concentrations over the Cairns region compared to the CTRL simulation. As shown in Fig. 6a–c, all seeding scenarios produce a broad plume of enhanced aerosol spanning the target area, with peak increases on the order of several hundred per cubic centimeter near the source locations, confirming the effectiveness of the emission perturbations imposed in the experimental setups. Under prevailing southeasterly trade-wind conditions, a distinct downwind transport of aerosols is evident, characterized by a noticeable plume extending to the northwest from the source points in all sensitivity experiments.
In the EXP20 experiment, where source points are closely spaced (20 km apart), the downwind aerosol enhancements are spatially diffuse but broadly distributed, indicating a widespread influence. In contrast, the EXP100 experiment, with only three source points spacing 100 km apart, produces a higher peak aerosol concentration but with limited spatial coverage. EXP40 exhibits an intermediate structure, showing distinct plumes aligned along the prevailing wind trajectory.
Looking over the Cairns region, the intensified surface aerosol emissions at the source points result in a noticeable increase in the domain-averaged surface aerosol number concentration (Fig. 6d). This increase is more pronounced in EXP20 experiment, with domain-average increasing from 199.6 to 504.8 cm−3. Smaller enhancements are obtained in EXP40 (334.3 cm−3) and EXP100 (276.3 cm−3), despite having identical total emissions. This behaviour arises from the nonlinear response of aerosol processing and removal pathways to local aerosol number concentration in the WRF Thompson aerosol-aware microphysics scheme (Wang et al., 2010; Weston et al., 2022). In the sparse-source configuration (EXP100), aerosol emissions are concentrated in fewer locations, leading to enhanced aerosol processing within these concentrated plumes. Multiple processes may contribute to this behaviour, including cloud processing, dilution, possible coagulation, and deposition. However, it should be noted that aerosol mass and process-specific tendency diagnostics were not archived in these simulations, so the relative contributions of coagulation, dry deposition, cloud processing, and transport cannot be quantitatively separated. Therefore, to investigate the aerosol number sink further despite the lack of aerosol mass output, additional diagnostics have been analysed (Figs. S3 and S4). These show that aerosol number reduction is strongest at locations with high aerosol concentration and becomes much less pronounced farther from the sources, where aerosol number concentrations are lower (Fig. S3). This concentration-dependent behaviour is consistent with an important role for coagulation, which becomes increasingly efficient as particle number concentration increases. Dry deposition may also contribute, particularly within the near-surface layer. The additional cloudy–clear-sky analysis (Fig. S4) further shows an enhanced reduction around approximately 0.75–1.0 km in cloudy columns, close to the simulated cloud-base height. This suggests that cloud-related processing provides an additional aerosol number sink once the aerosols reach the cloud layer. Although dilution, turbulent mixing, and transport can modify the local aerosol distribution, these processes redistribute aerosol and cannot, by themselves, account for a net domain-wide reduction in aerosol number. Overall, the diagnostics are consistent with concentration-dependent coagulation, potentially combined with dry deposition and cloud-related processing, while the available model output does not allow their relative contributions to be quantitatively separated. This demonstrates that source density exerts a stronger influence on the spatially averaged aerosol abundance than the emission rate at individual points. The closely spaced emitters in EXP20 generate overlapping plumes that elevate background aerosol concentrations across a wider region, producing a more uniform and sustained enhancement. In contrast, the sparse, high-flux sources in EXP100 produce localized concentration maxima that dissipate more rapidly through aerosol processing, resulting in a smaller net increase in the total aerosol population across the domain.
The enhanced surface aerosol emission also leads to an increase in the atmospheric aerosol population, extending throughout the atmospheric boundary layer up to the inversion layer at around 1.5 km (Fig. 6e). This indicates that the added aerosols successfully penetrate the cloud layer, making them available to act as CCN in the numerous shallow cumuli present (cloud base in these cases is typically ∼1 km). The sharp drop-off above ∼2 km suggests the inversion capping the boundary layer (Fig. 3) inhibits further lofting of aerosols into the free troposphere, which is expected for this shallow convective regime. The most substantial boundary-layer enhancement occurred in EXP20, consistent with its more homogeneous and spatially extensive surface plume. In contrast, EXP40 and EXP100 exhibited smaller domain-mean increases aloft, reflecting the greater spatial heterogeneity associated with their sparser emission distributions.
In summary, all aerosol-emission strategies substantially increased boundary-layer aerosol loading up the top of the boundary layer over the GBR region, but the dense-source configuration (EXP20) achieved the most uniform and extensive enhancement, while the widely spaced configuration (EXP100) produced a more heterogeneous distribution characterized by strong local maxima and weaker domain-wise enrichment.
3.3 Cloud properties responses
Given the evolution of cloud systems during the simulation period, the analysis in this study focuses on the 24 h period from 08:00 UTC, 7 February to 08:00 UTC, 8 February, when the domain was predominantly characterized by shallow cumulus cloud regimes (Fig. S5). This regime is selected as it represents the most relevant condition for assessing the potential of MCB.
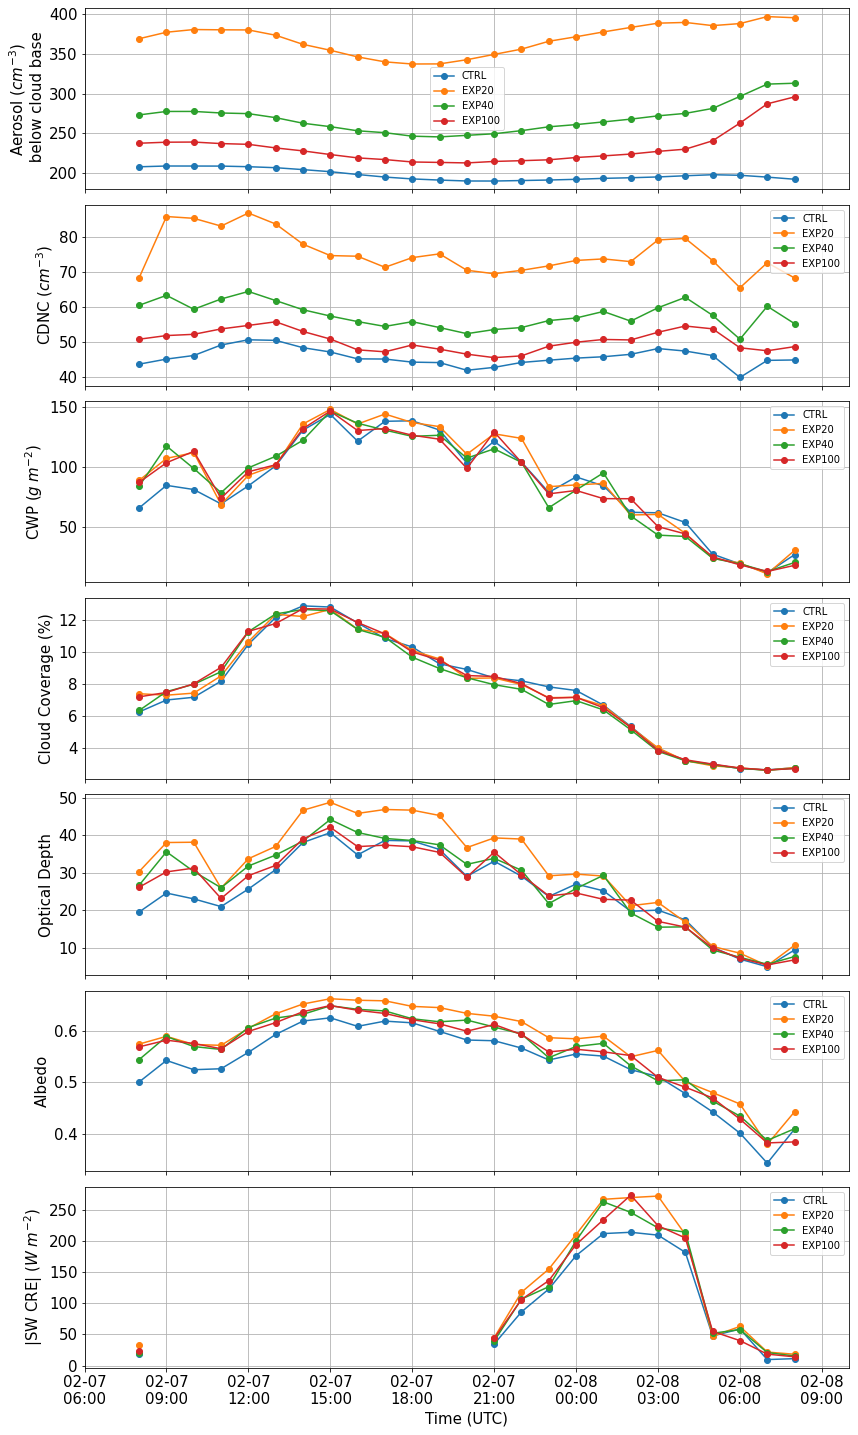
Figure 7Time series of domain-averaged (a) aerosol number concentration below cloud base, (b) CDNC, (c) cloud water path, (d) Cloud Coverage, (e) Optical depth, (f) synthetic cloud albedo, and (g) the magnitude of shortwave cloud radiative effect (|SW CRE|) over the Cairns Region. Note that all variables are averaged over cloudy grid points.
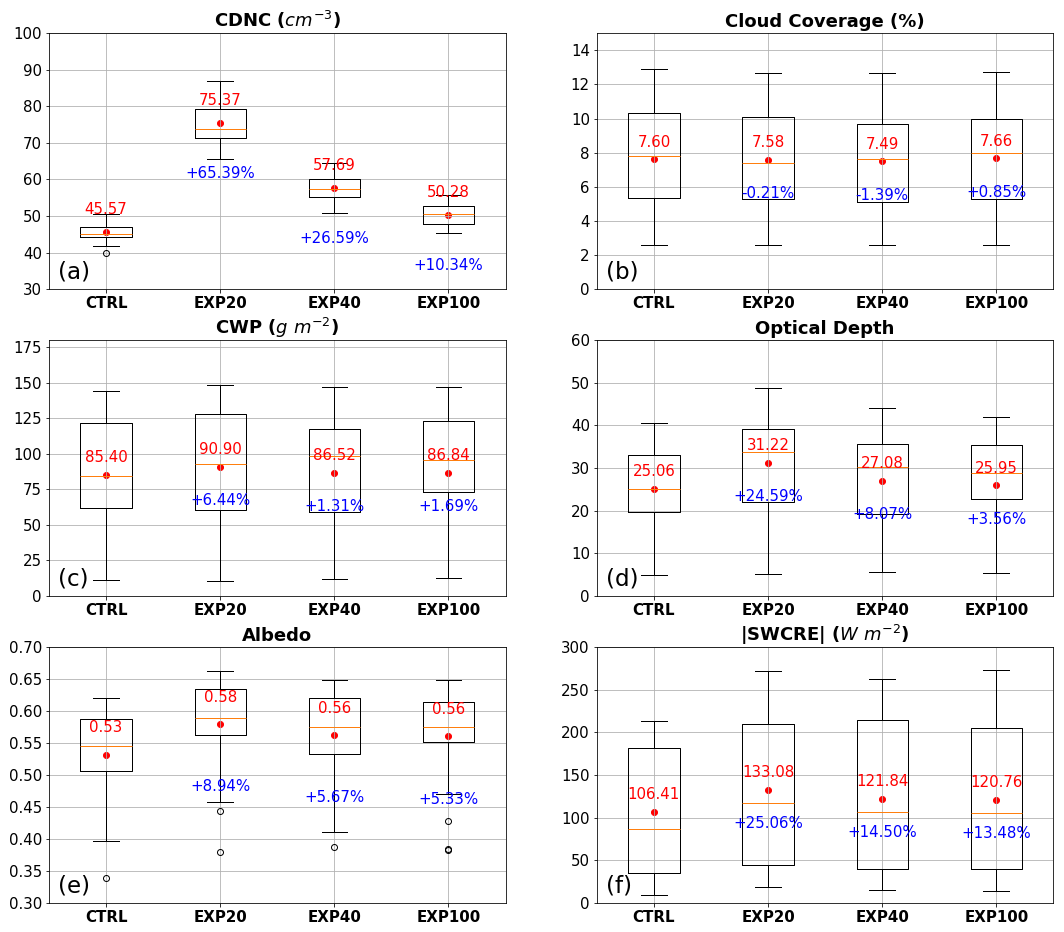
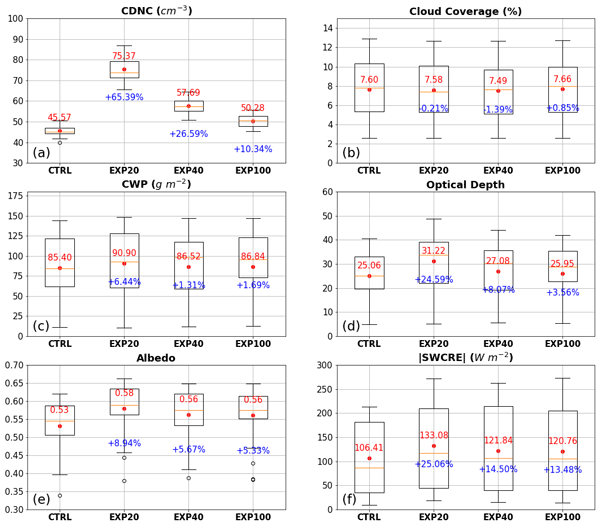
Figure 8Boxplots of cloud properties over Cairns Region from CTRL and sensitivity experiments. Statistics are calculated for the period from 08:00 UTC on 7 February to 08:00 UTC on 8 February 2022. Red numbers are mean values of each experiment, and blue numbers are differences with respect to CTRL experiment. Note that for the magnitude of shortwave cloud radiative effect, only daytime values are included in the analysis.
The imposed aerosol perturbations lead to notable modifications in cloud microphysical and, to a lesser extent, macrophysical properties over the Cairns region. As shown in Figs. 7b and 8b, cloud droplet number concentration (CDNC) exhibits the strongest and most consistent response to aerosol injections, with all sensitivity experiments showing substantial enhancements relative to the CTRL simulation. As expected, increased CCN availability resulted in clouds containing a greater number of smaller droplets. In EXP20, the domain-mean CDNC increased by approximately 65.4 % relative to CTRL, whereas EXP40 and EXP100 displayed more moderate yet significant increases of ∼26.6 % and ∼10.3 %, respectively. These responses correspond closely with the magnitude of aerosol enhancement near the cloud base achieved in each experiment (Fig. 7a), with EXP20 exhibiting the highest aerosol loading and, consequently, the largest increase in droplet number concentration.
Despite the substantial increase in CDNC, the corresponding changes in cloud water path (CWP) are comparatively modest. In EXP20, the domain-averaged CWP is approximately 6.4 % higher than in CTRL (Fig. 8c). The EXP40 and EXP100 exhibit even smaller increases of 1.3 % and 1.6 % respectively relative to CTRL. These subdued CWP responses, relative to the pronounced CDNC enhancements, indicate that increasing aerosol loading did not substantially thicken the clouds in terms of column integrated liquid water content. Moreover, the CWP response displays a pronounced nonlinear and temporally variable behaviour (Fig. 7c), with periods of enhanced CWP coinciding with elevated aerosol concentrations, interspersed with intervals where the seeded experiments show reduced CWP relative to CTRL. This variability suggests that the influence of aerosol perturbations on cloud water is strongly modulated by fluctuations in meteorological conditions and boundary-layer dynamics during the simulation period, which will be examined in the next section.
Similarly, changes in cloud coverage (CF) are minimal (Figs. 7d and 8b). Note that in this study, CF of Cairn region is defined as the proportion of total grid points in the domain that are classified as cloudy, where a cloudy grid point is defined as having a cloud optical depth (COD) greater than 1 (Heidinger and Straka, 2020). As shown in Fig. 8b, the domain-averaged CF remains nearly constant across all experiments, with mean values around 7 % and differences of less than 1.5 % relative to CTRL. These responses can be considered negligible in the context of domain-mean variability. In other words, cloud coverage responds only weakly to changes in aerosol loading as represented in this model configuration. Consequently, the lack of a discernible CF response suggests that radiative forcing induced by MCB in this case would primarily arise from modifications in cloud optical properties, rather than from changes in cloud amount.
The cloud optical depth, albedo and cloud radiative effect (CRE) are therefore further diagnosed to quantify the radiative effects of the aerosol-induced microphysical changes. Following prior studies (Zhang et al., 2005), the cloud optical depth (τ) is estimated from the simulated CWP and CDNC using an approximate relationship for warm clouds:
where CWP is in kg m−2 and Nc is cloud droplet number concentration in cm−3. This formula captures the first-order dependence of τ on both cloud water amount and droplet number (Twomey, 1977), and is reasonably accurate for shallow cloud regimes (Zhang et al., 2005). The cloud albedo (A) is then computed from τ using the approximate analytic expression (Seifert and Heus, 2013; after Twomey, 1977):
The CRE is defined as the net radiation flux (downward flux minus upward flux) under all sky conditions minus the net radiation flux under clear sky conditions and can be applied to both the surface and the top of atmosphere (Bao et al., 2020; Zhao et al., 2024). Here in this study, it focuses on the magnitude of shortwave CRE (|SW CRE|) at the surface. Note that for |SW CRE|, only daytime values at cloudy pixels are included in the analysis (e.g. Fig. 7e). The domain averaged |SW CRE| analyses are shown in Figs. S6 and S7 and exhibit a consistent result, but with a smaller magnitude, as expected when clear-sky pixels are also included in the spatial averaging.
Despite the relatively modest changes in CWP, the cloud optical depth (τ) and albedo (A) exhibit noticeable increases (Fig. 8d–e), especially in EXP20, reflecting the strong microphysical sensitivity to aerosol perturbations. In EXP20, the domain-mean τ increases by approximately 24.6 %, accompanied by a 8.9 % enhancement in cloud albedo, driven primarily by the substantial increase in CDNC. Correspondingly, the shortwave CRE in EXP20 exhibits an approximately 25.1 % increase relative to the CTRL simulation, indicating enhanced reflection of incoming solar radiation by several tens of W m−2 (Fig. 8f). The largest CRE enhancement occurs near local midday, consistent with periods of stronger incoming solar radiation associated with smaller solar zenith angles (Fig. 7g). These changes indicate brighter and more reflective clouds, thereby enhancing the potential to reduce surface shortwave radiation through the Twomey effect. Smaller but consistent albedo increases are observed in the other experiments: EXP40 yields an enhancement of roughly 8 % in τ and 5 % in A, while EXP100 shows a modest 3 %–5 % increases in optical properties relative to CTRL. Although these changes in optical properties appear moderate in absolute terms, they may still contribute to measurable perturbations in cloud radiative effects, consistent with previous studies of subtropical marine low clouds. (e.g., Wood, 2012; Seifert et al., 2015).
In summary, the microphysical effects of aerosol perturbation are clearly evident, whereas the macrophysical cloud properties (CWP and cloud fraction) show weak or no response on average in these simulations. This contrast is consistent with the potential nonlinear nature of cloud–aerosol interactions. The results suggest that changes in cloud optical properties are largely associated with increases in droplet number concentration, consistent with the Twomey effect, with little support for a strong Albrecht effect (increased cloud water or coverage via precipitation suppression) under these conditions. The magnitude and sign of these optical and radiative responses, however, are not uniform throughout the simulation period. Temporal variability in both CWP and albedo suggests that the efficiency of aerosol–cloud interactions is strongly modulated by the background meteorological state. Factors such as relative humidity, lower-tropospheric stability, and wind shear influence the extent to which aerosol-induced microphysical adjustments translate into macroscopic or radiative effects. The following section examines how variations in these environmental parameters govern the observed differences in cloud responses across the sensitivity experiments.
3.4 The impact of meteorology
Three key parameters are considered: mid-level relative humidity (RH) at 750 hPa, representing moisture conditions above cloud tops, vertical wind shear (S) at 750 hPa, defined as the magnitude of the horizontal wind vector change across the cloud layer (calculated as ), and the estimated inversion strength (EIS), which quantifies lower-tropospheric stability following the formulation of Wood and Bretherton (2006). These parameters have been shown to strongly influence cloud-top drying, entrainment, and evaporative processes in marine stratocumulus and cumulus regimes (Gryspeerdt et al., 2019; Mauger and Norris, 2010; Bretherton et al., 2007, 2019), and therefore provide a physically meaningful framework for interpreting the environmental dependence of the modelled cloud responses. It is important to note that, in this section, the analysis focuses on EXP20 and CTRL as representative cases. The other two sensitivity experiments (EXP40 and EXP100) exhibit weaker yet qualitatively consistent responses with those of EXP20, supporting the robustness of the identified relationships.
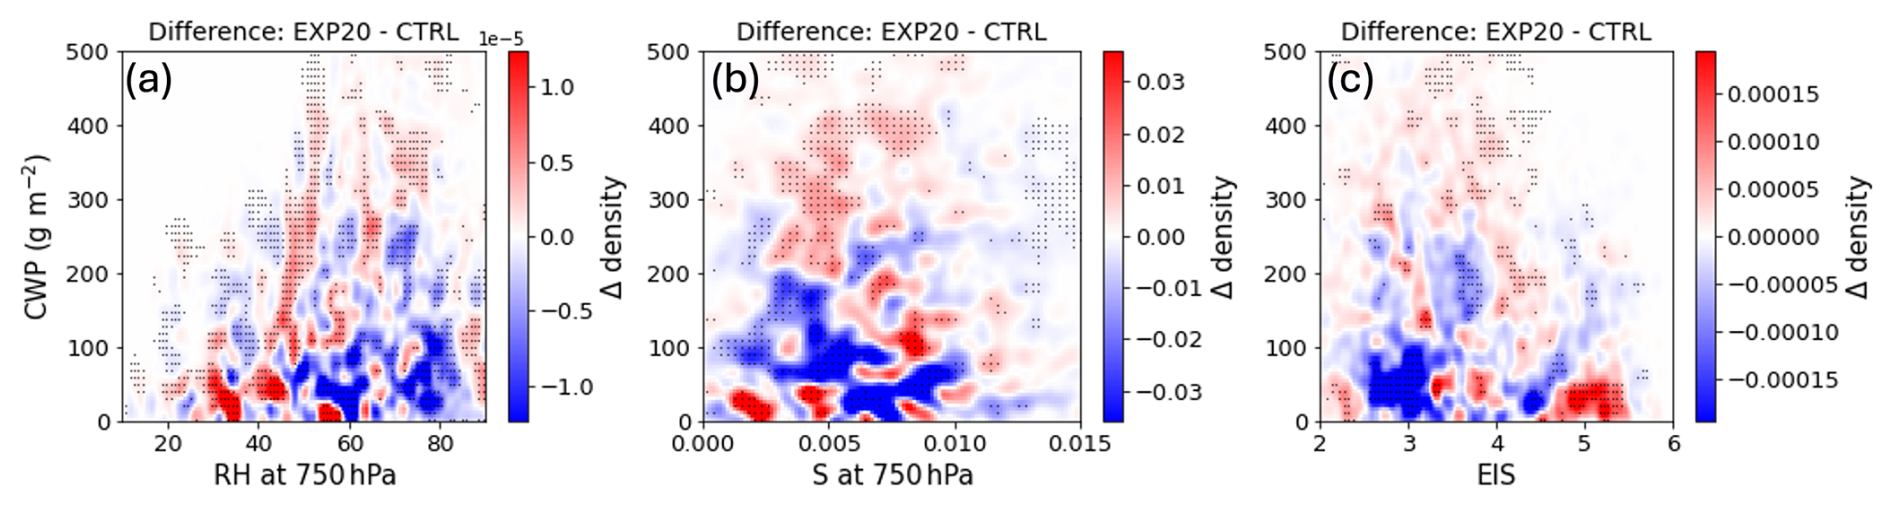
Figure 9Joint distribution analysis of cloud water response under different environmental conditions. Panels show the difference in 2D frequency (EXP20-CTRL) as colored contours. (a) Frequency of occurrence of RH at 750 hPa and CWP pairs. (b) same as (a), but for S at 750 hPa and CWP pairs. (c) same as (a), but for pairs of EIS and CWP. Note that colours with black dots indicate significant differences.
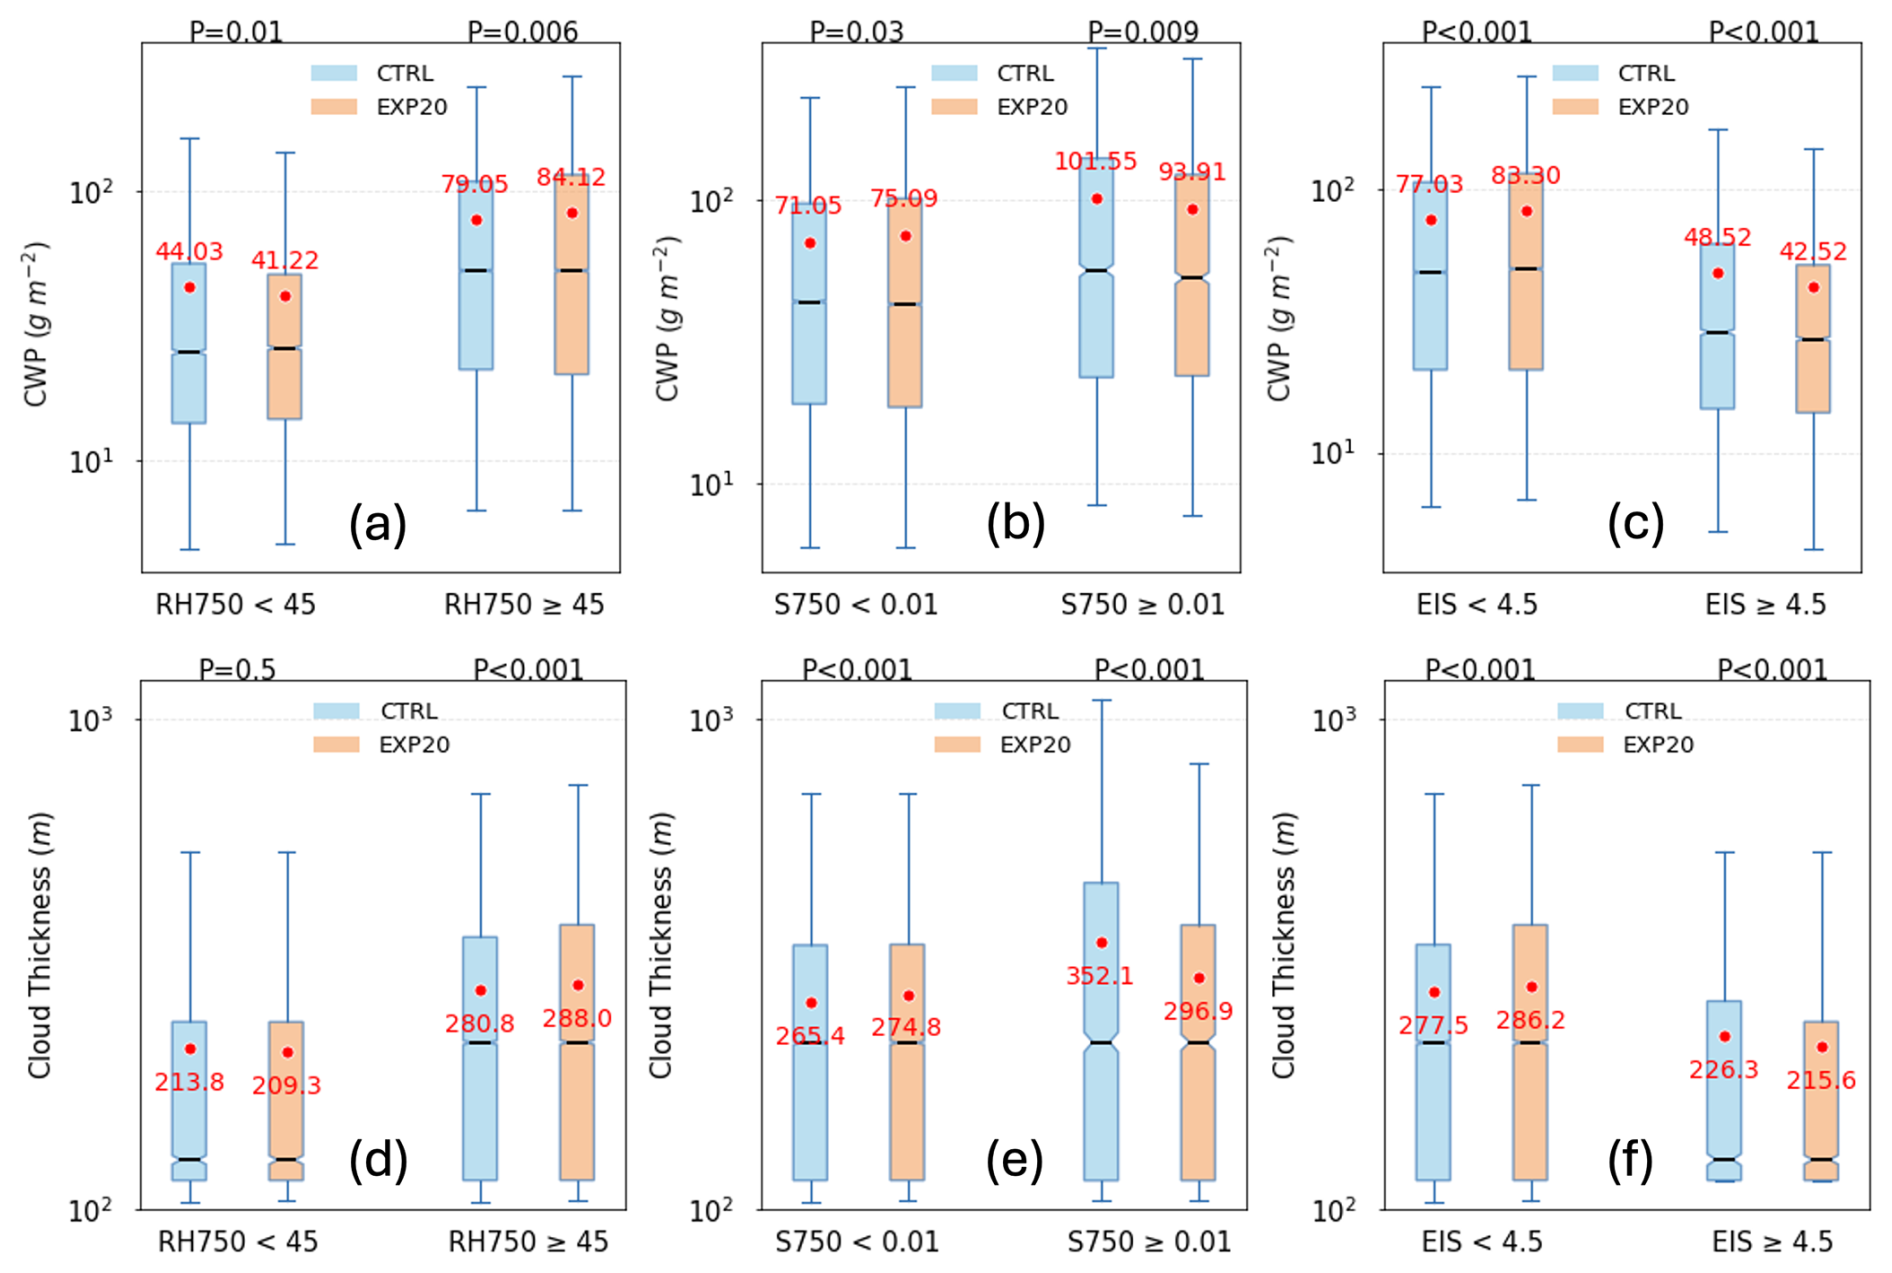
Figure 10Boxplots of cloud water path (CWP) in CTRL (blue) and EXP20 (orange), categorized by meteorological conditions. (a) CWP under two ranges of 750 hPa relative humidity: low (<45 %), and high (≥ 45 %). (b) Same as (a) but stratified by wind shear (S) at 750 hPa: weak (S<0.01 s−1), strong (≥ 0.01 s−1). (c) Stratified by inversion strength EIS: weakly capped (EIS <4.5 K), strongly capped (EIS ≥4.5 K). Red dots indicate the average values of each category. Significant test results (P values) are shown above each category. (d)–(f) same as (a)–(c), but for comparison of cloud thickness in CTRL (blue) and EXP20 (orange). Note that the thresholds used for these comparisons are based on the analysis shown in Fig. 9.
As shown in Fig. 9a, under relatively high humidity conditions (e.g. RH ≥45 %) at 750 hPa, the EXP20 experiment exhibits a greater number of grid points with higher CWP compared to CTRL, reflected, for example, by an increased frequency of grid points with CWP around 300 g m−2. Conversely, under low humidity conditions (e.g. RH750 less than 45 %), EXP20 shows reduced CWP relative to CTRL, indicating a humidity-dependent response to aerosol perturbations. This relationship is further quantified in Fig. 10a, where CWP is categorized by mid-level relative humidity, with the 45 % RH750 threshold selected based on the regime separation evident in Fig. 9a. Note that Student's t-tests are performed for each humidity category to assess the statistical significance of the differences in mean CWP between the two experiments. When RH750 exceeds approximately 45 %, mean CWP in CTRL increases from 79.05 to 84.32 g m−2 with P value of 0.006, reflecting the significant positive influence of a moister free troposphere on cloud water retention. In contrast, under the low humidity conditions (RH750<45 %), EXP20 displays a slight reduction in CWP despite elevated aerosol concentrations. These results suggest that a moist free troposphere enhances the likelihood of increased cloud water in response to aerosol loading, whereas a dry overlying layer promotes entrainment-driven drying and limits cloud thickening, leading to reduced CWP in the seeded case. This result is physically consistent with the mechanism proposed by Ackerman et al. (2004), in dry conditions, aerosol-induced suppression of drizzle can enhance cloud-top evaporation (via increased entrainment of dry air), offsetting any gain in liquid water from reduced rainfall. But in humid conditions aloft, entrained air is less drying, so the clouds can retain more water when drizzle is suppressed, thus CWP increases.
A similar analysis for S at 750 hPa (Figs. 9b and 10b) suggests a dynamical influence on the aerosol–cloud relationship. Under weak shear above cloud top (S<0.01 s−1), the seeded clouds in EXP20 exhibit higher CWP than those in CTRL, whereas under strong shear conditions (S≥0.01 s−1), EXP20 clouds show a reduction in CWP relative to CTRL. Statistically, the mean CWP in EXP20 increases from 71.05 to 75.09 g m−2 (P=0.03) under low shear environments, but becomes noticeably (P=0.009) lower than CTRL when wind shear intensifies. This behaviour suggests that strong vertical shear disrupts and tilts convective updrafts, enhances turbulent mixing, and promotes entrainment of dry air from above the cloud layer, with these being counteract the microphysical thickening effect induced by aerosol loading. In contrast, under weak shear conditions, clouds remain more vertically coherent and can deepen more effectively, allowing aerosol-induced microphysical adjustments to manifest as increased cloud water.
Finally, the dependence of CWP on lower-tropospheric stability, expressed through the estimated inversion strength (EIS), is illustrated in Figs. 9c and 10c. Under low-stability conditions (EIS <4.5 K), indicative of a weak or absent inversion capping the boundary layer, aerosol perturbation leads to an increase in CWP from 77.03 to 82.15 g m−2 significantly (P<0.001). In contrast, under high-stability conditions (EIS ≥4.5 K), where a strong inversion limits vertical development, the seeded clouds exhibit reduced CWP (43.33 g m−2) compared to 48.52 g m−2 in CTRL. A strong inversion confines cloud growth, producing thinner and more stratified layers that are highly susceptible to entrainment drying. Conversely, when the inversion is weak, clouds can deepen and become more dynamically active. In such environments, the presence of additional CCN delays precipitation onset, allowing greater liquid water retention. This interpretation is further supported by the analysis of cloud thickness stratified by meteorological conditions. As shown in Fig. 10d–f, significantly increased cloud thickness is seen under high humidity, lower wind shear at 750 hPa, and low EIS conditions. Note that the cloud thickness in the model simulation is defined using a threshold cloud water mixing ratio of 10−6 kg kg−1, consistent with similar cloud mask criteria employed in previous WRF studies (Arbizu-Barrena et al., 2015). Overall, these results indicate that a moist, weakly capped atmosphere favours positive cloud water responses to aerosol perturbations, whereas a dry, strongly capped environment suppresses them.
These analyses demonstrate that the cloud water response to aerosol perturbations is strongly conditioned by the prevailing meteorological environment. A moist, weakly sheared, and weakly capped boundary layer favours positive CWP responses to aerosol enhancement, facilitating cloud deepening and greater liquid water growth. Conversely, dry, strongly sheared, and stably stratified conditions suppress this response by promoting entrainment-driven evaporation and inhibiting vertical cloud growth. These findings suggest a regime-dependent nature of aerosol–cloud interactions, indicating that the efficacy of MCB over the GBR is highly sensitive to the large-scale thermodynamic and dynamic state of the atmosphere. Consequently, identifying and targeting favourable meteorological conditions is also critical for maximizing the radiative benefit of MCB interventions.
Using convection-permitting WRF simulations with the Thompson aerosol-aware microphysics scheme, this study examined how spatial variability in aerosol emissions influences the microphysical, macrophysical, and radiative properties of shallow marine clouds over the GBR. Three sensitivity experiments were conducted in which the total aerosol emission was held constant but the number and spacing of source points varied.
The key findings are summarized below:
-
Densely spaced emission sources (EXP20) produced more homogeneous and widespread increases in boundary-layer aerosol concentrations. In contrast, sparsely distributed sources generated localized peaks in aerosol concentration that were efficiently removed, leading to smaller domain-mean increases, despite identical total aerosol emissions.
-
Substantial increases in CDNC and cloud optical depth lead to brighter clouds and higher mean albedo under additional aerosol perturbations. Despite these pronounced microphysical changes, responses in CWP and CF were modest, consistent with a regime in which the Twomey effect dominates, while the Albrecht effect remains weak.
-
Positive CWP responses were favoured in environments characterized by high above-cloud humidity, weak wind shear, and weak lower-tropospheric stability. Conversely, dry, strongly sheared, and stably stratified conditions led to reductions in CWP despite elevated aerosol levels.
-
The potential for marine cloud brightening over the GBR depends not only on aerosol loading configurations but also on meteorological controls. Optimal outcomes occur when seeding coincides with favourable thermodynamic conditions.
The findings confirm that radiative forcing can be meaningfully enhanced under suitable conditions through spatially coherent aerosol seeding. As such, strategic deployment of MCB during favorable weather regimes holds promise as a targeted intervention to mitigate extreme heat exposure over sensitive marine ecosystems like the GBR. From a radiative forcing perspective, substantial increases in cloud reflectivity ability, as demonstrated in this study, can be achieved primarily through microphysical adjustments, even in the absence of significant changes in cloud macrophysical structure.
The dominant mechanism of radiative modulation in our simulations was the Twomey effect, whereby increased aerosol concentrations enhanced cloud droplet number and optical depth. The shallow clouds in our case produced very light precipitation (mean rain rates ≤0.01 mm h−1; see Fig. S8), thereby limiting the aerosol–precipitation interactions, such as rain suppression. This result is consistent with the findings from idealised large-eddy simulations by Seifert et al. (2015), which showed that aerosol–cloud interactions are largely governed by the Twomey effect under non- or weakly precipitating conditions.
Correspondingly, variations in liquid water path and cloud fraction remain comparatively small. In the EXP20 experiment, a ∼25 % increase in optical depth led to a ∼9 % absolute increase in synthetic cloud albedo. While modest in absolute terms, such an enhancement translates into a non-negligible reduction in surface shortwave flux, potentially on the order of several tens of W m−2 under typical daytime conditions. If sustained over multi-days to weeks timescales, this reduction could lower sea surface temperatures by a fraction of a degree Celsius, an effect that previous studies suggest may be sufficient to mitigate the severity or onset of coral bleaching events (Harrison et al., 2019). However, the lack of corresponding increases in cloud fraction indicates that this enhanced reflection is confined to the pre-existing cloud-covered portion of the sky in the conditions modeled, limiting the area extent of radiative cooling. Furthermore, the present study did not explicitly account for the direct radiative effects of aerosols due to the limitations of the bulk aerosol-aware microphysics scheme used. To more fully quantify the total radiative impact of aerosol injection scenarios, future studies should incorporate fully coupled aerosol–chemistry–radiation interactions using models such as WRF-Chem or other chemically-resolving frameworks.
The CWP responses to aerosol perturbations, as indicated in this study, showed dependence to the background meteorological states. Over the GBR, in “favorable” conditions (high moisture aloft, weak inversion and wind shear), we observed that additional aerosols lead to increases in cloud water and thickening of the cloud layer, indicating the most positive outcome for reflectivity. Whereas, in “unfavorable” conditions (dry aloft, strong inversion, high shear), adding aerosols made clouds more susceptible to evaporation and in some instances reduced the total cloud water. These results align with prior studies of stratocumulus decks which found that aerosol perturbations can either deepen clouds or thin them, contingent on above-cloud humidity (Ackerman et al., 2004). Our results are consistent with previous studies based on satellite data demonstrating aerosol-induced cloud adjustments in tropical marine cloud regimes (e.g., Chen et al., 2024). Building on this understanding, we investigate the sensitivity of these responses to the spatial variability of aerosol forcing using convection-permitting simulations, emphasizing that MCB will be most efficient when timed with supportive weather regimes. This has important implications for designing effective MCB interventions. The same aerosol seeding strategy can have markedly different outcomes depending on ambient humidity, stability, and winds. Furthermore, our results show that CDNC exhibits a consistently linear enhancement with increasing aerosol perturbations over the GBR, largely independent of the meteorological background, indicating a robust direct microphysical response. These results are broadly consistent with previous studies suggesting that aerosol–cloud radiative interactions are strongly influenced by droplet concentration changes, while macrophysical cloud adjustments, including liquid water path and cloud fraction responses, can vary substantially depending on meteorological conditions and cloud regime (Rosenfeld et al., 2019; Gryspeerdt et al., 2019; Feingold et al., 2010).
In terms of MCB efficiency, the spatial configuration of aerosol sources plays a critical role in determining the effectiveness of aerosol delivery and subsequent cloud modification. The widely distributed emission scenario (EXP20) resulted in a more homogeneous and persistent increase in atmospheric aerosol concentrations compared to the more sparsely spaced, high-flux emission case (EXP100), despite all experiments having the same total aerosol mass flux. This outcome highlights that denser spatial coverage can compensate for lower per-source emission intensity by facilitating plume overlap and minimizing gaps between seeded regions. In contrast, the concentrated high-emission sources in EXP100 experienced more localized aerosol processing, particularly near the source points, which led to more rapid aerosol removal and ultimately smaller net increases in cloud condensation nuclei (CCN) across the domain. This outcome aligns with prior modeling work (e.g., Wang et al., 2011; Possner et al., 2018) indicating that the effectiveness of MCB is strongly influenced by the balance between aerosol injection, transport, and removal processes, especially in marine environments. Moreover, our results underscore that aerosol injection efficiency does not scale linearly with emission intensity. Instead, spatial and temporal coherence in seeding appears to enhance domain-mean radiative forcing more effectively, which is consistent with earlier sensitivity studies in stratocumulus regions (e.g., Latham et al., 2008). Our work reinforces the importance of designing MCB interventions with sufficient spatial coherence to maximize aerosol utilization and domain-wide radiative impact.
While the findings presented here advance process-level understanding, several limitations should be acknowledged. The results presented in this study are derived from a limited set of simulations representing a particular meteorological period over the GBR region. Although this case was selected as representative of typical summer trade-wind conditions, it does not encompass the full diversity of weather regimes that occur across the region during the summer season (Richards et al., 2024). The cloud responses to aerosol perturbations may vary substantially under different synoptic conditions or convective environments. A broader ensemble of simulations, spanning the entire coral bleaching season (January–April; Zhao et al., 2021) and a range of meteorological regimes, would be needed to develop more robust and generalizable conclusions regarding the efficacy of MCB over the GBR. Additionally, our simulations ran for only 3 d on a relatively small domain. This setup captures the direct local effects of aerosol on clouds (the “first indirect effect” and microphysical feedbacks) but cannot account for longer-term or larger-scale feedbacks. For instance, any changes in cloud radiative forcing could eventually alter surface heat fluxes, pressure, and winds, which might feed back onto cloud formation, a process requiring a larger domain, longer simulations, and coupled ocean–atmosphere model to explore. Furthermore, the shallow clouds in our case produced very light precipitation. Consequently, aerosol–precipitation interactions, such as rain suppression, were weak in the present case. In environments characterized by more vigorous precipitation (e.g., deeper cumulus or stratocumulus-to-cumulus transition regimes or exceptionally clean aerosol regimes), aerosol seeding may exert a stronger influence through the second indirect effect (Albrecht, 1989). Future work should examine aerosol impacts under a wider range of precipitation efficiencies to determine whether the mixed CWP responses identified here persist across different cloud regimes. Nevertheless, the findings presented here provide an important first step toward understanding how the spatial distribution of aerosol emissions influences cloud microphysical and radiative responses over the GBR. By explicitly resolving cloud–aerosol interactions under convection-permitting resolution, this study highlights the nonlinear sensitivity of cloud albedo enhancement to emission spacing and local meteorological conditions. These results underscore that the efficacy of MCB is not only governed by aerosol loading but also critically dependent on source configuration and ambient atmospheric state. Such insights are essential for the design and optimization of future MCB field trials and for assessing their potential climatic benefit in mitigating thermal stress over coral reef ecosystems. Looking ahead, validation of modeled cloud responses with in-situ and remote sensing observations will be essential. Field campaigns involving aircraft-based measurements (e.g., Hernandez-Jaramillo et al., 2024) can provide valuable data on CDNC, CWP, and aerosol characteristics during seeding experiments. Integrating atmospheric simulations with ocean models would further enable quantification of downstream impacts on sea surface temperatures and coral bleaching risk. In summary, this study provides new insight into how aerosol emission geometry and meteorology jointly regulate the effectiveness of marine cloud brightening in shallow cumulus environments. Continued observational and modeling work is essential to evaluate the feasibility, risks, and climatic implications of such climate intervention approaches in practice.
All data sets used in this study are freely and publicly available online and may be accessed directly as follows. The University of Wyoming upper-air sounding is downloaded from https://weather.uwyo.edu/upperair/sounding.shtml (last access: 4 November 2026). The ERA5 reanalysis data is available at the website: https://doi.org/10.24381/cds.bd0915c6 (Hersbach et al., 2023). The Himawari-8 full disk observational products are available at NCI THREDDS Data Server: https://dapds00.nci.org.au/thredds/catalogs/ra22/satellite-products/arc/obs/himawari-ahi/fldk/fldk.html (last access: 4 November 2026). The Himawari-8 true color imagery and cloud types classification are available at JAXA Himawari Monitor supplied by P-Tree System: https://www.eorc.jaxa.jp/ptree/. WRF output data can be found in https://doi.org/10.26188/30071935 (Zhao et al., 2026a), https://doi.org/10.26188/32592879 (Zhao et al., 2026b), https://doi.org/10.26188/32593914 (Zhao et al., 2026c), https://doi.org/10.26188/32593482 (Zhao et al., 2026d).
The supplement related to this article is available online at https://doi.org/10.5194/acp-26-15895-2026-supplement.
WZ, YH, SS and DH developed the ideas and designed the study. WZ collected the data, performed the analysis and prepared the draft manuscript. YH, SS, and DH supervised and reviewed the manuscript. All authors made substantial contributions to this work and approved the final version of the manuscript.
At least one of the (co-)authors is a member of the editorial board of Atmospheric Chemistry and Physics. The peer-review process was guided by an independent editor, and the authors also have no other competing interests to declare.
Publisher's note: Copernicus Publications remains neutral with regard to jurisdictional claims made in the text, published maps, institutional affiliations, or any other geographical representation in this paper. The authors bear the ultimate responsibility for providing appropriate place names. Views expressed in the text are those of the authors and do not necessarily reflect the views of the publisher.
The Australian National Computational Infrastructure is thanked for providing the computational resources. The authors would like to acknowledge the Traditional Owners of the Great Barrier Reef, particularly the Wulgurukaba and Bindal people of the Townsville region nearby the area of our case study.
This work is supported by Reef Restoration and Adaptation Program (grant no. RRAP-CS) which is funded by the partnership between the Australia Governments Reef Trust and the Great Barrier Reef foundation.
This paper was edited by Minghuai Wang and reviewed by Michael Diamond and two anonymous referees.
Ackerman, A. S., Kirkpatrick, M. P., Stevens, D. E., and Toon, O. B.: The impact of humidity above stratiform clouds on indirect aerosol climate forcing, Nature, 432, 1014–1017, 2004.
Ahlm, L., Jones, A., Stjern, C. W., Muri, H., Kravitz, B., and Kristjánsson, J. E.: Marine cloud brightening – as effective without clouds, Atmos. Chem. Phys., 17, 13071–13087, https://doi.org/10.5194/acp-17-13071-2017, 2017.
Albrecht, B. A.: Aerosols, cloud microphysics, and fractional cloudiness, Science, 245, 1227–1230, https://doi.org/10.1126/science.245.4923.1227, 1989.
Arbizu-Barrena, C., Pozo-Vázquez, D., Ruiz-Arias, J. A., and Tovar-Pescador, J.: Macroscopic: cloud properties in the WRF NWP model: An assessment using sky camera and ceilometer data, J. Geophys. Res.-Atmos., 120, 10–297, 2015.
Australian Institute of Marine Science (AIMS): Coral Bleaching Events, https://www.aims.gov.au/research-topics/environmental-issues/coral-bleaching/coral-bleaching-events (last access: 2 February 2026), 2026.
Bao, S., Letu, H., Zhao, J., Lei, Y., Zhao, C., Li, J., Tana, G., Liu, C., Guo, E., Zhang, J., He, J., and Bao, Y.: Spatiotemporal distributions of cloud radiative forcing and response to cloud parameters over the Mongolian Plateau during 2003–2017, Int. J. Climatol., 40, 4082–4101, https://doi.org/10.1002/joc.6444, 2020.
Baresi, U., Baum, C. M., Fischer, T. B., Lockie, S., Piggott-McKellar, A., Graham, V., Bohensky, E., Fritz, L. B., Shumway, N., Harrison, D. P., Foster, R., Sovacool, B. K., Vella, K., and Ristovski, Z.: A call for strategic assessments of regional applications of solar radiation management: Exploring the challenges and opportunities from marine cloud brightening and albedo surface modification, Environ. Impact Assess., 110, 107701, https://doi.org/10.1016/j.eiar.2024.107701, 2025.
Bennartz, R.: Global assessment of marine boundary layer cloud droplet number concentration from satellite, J. Geophys. Res., 112, D02201, https://doi.org/10.1029/2006JD007547, 2007.
Bennartz, R. and Rausch, J.: Global and regional estimates of warm cloud droplet number concentration based on 13 years of AQUA-MODIS observations, Atmos. Chem. Phys., 17, 9815–9836, https://doi.org/10.5194/acp-17-9815-2017, 2017.
Braga, R. C., Rosenfeld, D., Hernandez, D., Medcraft, C., Efraim, A., Moser, M., Lucke J., Doss A., and Harrison, D.: Cloud processing dominates the vertical profiles of aerosols in marine air masses over the Great Barrier Reef, Atmos. Res., 315, 107928, https://doi.org/10.1016/j.atmosres.2025.107928, 2025.
Bretherton, C. S., Blossey, P. N., and Uchida, J.: Cloud droplet sedimentation, entrainment efficiency, and subtropical stratocumulus albedo, Geophys. Res. Lett., 34, L03813, https://doi.org/10.1029/2006GL027648, 2007.
Bretherton, C. S., McCoy, I. L., Mohrmann, J., Wood, R., Ghate, V., Gettelman, A., Bardeen, C. G., Albrecht, B. A., and Zuidema, P.: Cloud, aerosol, and boundary layer structure across the Northeast Pacific stratocumulus–cumulus transition as observed during CSET, Mon. Weather Rev., 147, 2083–2103, 2019.
Bureau of Meteorology: Bureau of Meteorology Satellite Observations (Collection), NCI Australia [data set], https://doi.org/10.25914/61A609F9E7FFA, 2021.
Bureau of Meteorology: Bureau of Meteorology Satellite Derived Products (Collection), NCI Australia [data set], https://doi.org/10.25914/5QRS-QB54, 2022.
Chen, F. and Dudhia, J.: Coupling an advanced landsurface/hydrology model with the Penn State/NCAR MM5 modeling system. Part I: Model description and implementation, Mon. Weather Rev., 129, 569–585, https://doi.org/10.1175/1520-0493(2001)129<0569:CAALSH>2.0.CO;2, 2001.
Chen, Y., Haywood, J., Wang, Y., Malavelle, F., Jordan, G., Peace, A., Partridge, D. G., Cho, N., Oreopoulos, L., Grosvenor, D., Field, P., Allan, R. P., and Lohmann, U.: Substantial cooling effect from aerosol-induced increase in tropical marine cloud cover, Nat. Geosci., 17, 404–410, https://doi.org/10.1038/s41561-024-01427-z, 2024.
Colarco, P., da Silva, A., Chin, M., and Diehl, T.: Online simulations of global aerosol distributions in the NASA GEOS-4 model and comparisons to satellite and ground-based aerosol optical depth, J. Geophys. Res., 115, D14207, https://doi.org/10.1029/2009JD012820, 2010.
Condie, S. A., Anthony, K., Babcock, R. C., Baird, M. E., Beeden, R., Fletcher, C. S., Gorton, R., Harrison, D., Hobday, A. J., Plagányi, É. E., and Westcott, D. A.: Large-scale interventions may delay decline of the Great Barrier Reef, Royal Society Open Science, 8, 201296, https://doi.org/10.1098/rsos.201296, 2021.
Dagan, G., Koren, I., Altaratz, O., and Heiblum, R. H.: Aerosol effect on the evolution of the thermodynamic properties of warm convective cloud fields, Sci. Rep., 6, 38769, https://doi.org/10.1038/srep38769, 2016.
Feingold, G., Koren, I., Wang, H., Xue, H., and Brewer, W. A.: Precipitation-generated oscillations in open cellular cloud fields, Nature, 466, 849–852, 2010.
Feingold, G., Ghate, V. P., Russell, L. M., Blossey, P., Cantrell, W., Christensen, M. W., Diamond, M. S., Gettelman, A., Glassmeier, F., Gryspeerdt, E., Haywood, J., Hoffmann, F., Kaul, C. M., Lebsock, M., McComiskey, A. C., McCoy, D. T., Ming, Y., Mülmenstädt, J., Possner, A., Prabhakaran, P., Quinn, P. K., Schmidt, K. S., Shaw, R. A., Singer, C. E., Sorooshian, A., Toll, V., Wan, J. S., Wood, R., Yang, F., Zhang, J., and Zheng, X.: Physical science research needed to evaluate the viability and risks of marine cloud brightening, Sci. Adv., 10, eadi8594, https://doi.org/10.1126/sciadv.adi8594, 2024.
Gryspeerdt, E., Goren, T., Sourdeval, O., Quaas, J., Mülmenstädt, J., Dipu, S., Unglaub, C., Gettelman, A., and Christensen, M.: Constraining the aerosol influence on cloud liquid water path, Atmos. Chem. Phys., 19, 5331–5347, https://doi.org/10.5194/acp-19-5331-2019, 2019.
Harrison, D. P.: Could “marine cloud brightening” reduce coral bleaching on the Great Barrier Reef?, The Conversation, https://theconversation.com/could-marine-cloud-brightening-reduce-coral-bleaching-on-the-great-barrier-reef-214308 (last access: 10 November 2026), 2023.
Harrison, D. P.: An overview of environmental engineering methods for reducing coral bleaching stress, Oceanographic Processes of Coral Reefs, 403–418, 2024.
Harrison, D. P., Harrison, L., Baird, M., Utembe, S., Schofield, R., Escobar Correa, R., Mongin, M., and Rizwi, F.: T14: Environmental Modelling of Large Scale Solar Radiation Management. A report provided to the Australian Government from the Reef Restoration and Adaptation Program, RRAP, https://gbrrestoration.org/resources/reports/ (last access: 4 November 2026), 2019.
Harrison, L. P., Medcraft, C., and Harrison, D.: Effervescent nozzle design to enable outdoor marine cloud brightening experimentation, Environ. Sci.: Atmospheres, 5, 1071–1080, https://doi.org/10.1039/D5EA00073D, 2025.
Heidinger, A. K. and Straka, W.: NOAA Enterprise Cloud Mask: Algorithm Theoretical Basis Document, Version 1.2, NOAA/NESDIS Center for Satellite Applications and Research, https://www.star.nesdis.noaa.gov/goesr/documents/ATBDs/Enterprise/ATBD_Enterprise_Cloud_Mask_v1.2_2020_10_01.pdf (last access: 10 November 2026), 2020.
Hernandez-Jaramillo, D. C., Medcraft, C., Braga, R. C., Butcherine, P., Doss, A., Kelaher, B., Rosenfeld, D., and Harrison, D. P.: New airborne research facility observes sensitivity of cumulus cloud microphysical properties to aerosol regime over the great barrier reef, Environ. Sci.: Atmospheres, 4, 861–871, 2024.
Hernandez-Jaramillo, D. C., Harrison, L., Gunner, G., McGrath, A., Junkermann, W., Lieff, W., Hacker, J., Rosenfeld, D., Kelaher, B., and Harrison, D. P.: First generation outdoor marine cloud brightening trial increases aerosol concentration at cloud base height, Environ. Res. Lett., 20, 054065, https://doi.org/10.1088/1748-9326/adccd7, 2025.
Hersbach, H., de Rosnay, P., Bell, B., Schepers, D., Simmons, A., Soci, C., Abdalla, S., Alonso-Balmaseda, M., Balsamo, G., Bechtold, P., and Berrisfold, P.: Operational global reanalysis: Progress, future directions and synergies with NWP, ECMWF ERA Report Series, 27, 65, https://doi.org/10.21957/tkic6g3wm, 2018.
Hersbach, H., Bell, B., Berrisford, P., Hirahara, S., Horányi, A., Muñoz-Sabater, J., Nicolas, J., Peubey, C., Radu, R., Schepers, D., and Simmons, A.: The ERA5 global reanalysis, Q. J. Roy. Meteor. Soc., 146, 1999–2049, https://doi.org/10.1002/qj.3803, 2020.
Hersbach, H., Bell, B., Berrisford, P., Biavati, G., Horányi, A., Muñoz Sabater, J., Nicolas, J., Peubey, C., Radu, R., Rozum, I., Schepers, D., Simmons, A., Soci, C., Dee, D., and Thépaut, J.-N.: ERA5 hourly data on pressure levels from 1940 to present, Copernicus Climate Change Service (C3S) Climate Data Store (CDS) [data set], https://doi.org/10.24381/cds.bd0915c6 (last access: 4 November 2026), 2023.
Hong, S.-Y., Noh, Y., and Dudhia, J.: A new vertical diffusion package with an explicit treatment of entrainment processes, Mon. Weather Rev., 134, 2318–2341, https://doi.org/10.1175/MWR3199.1, 2006.
Huang, Y., Siems, S. T., Manton, M. J., Rosenfeld, D., Marchand, R., McFarquhar, G. M., and Protat, A.: What is the Role of Sea Surface Temperature in Modulating Cloud and Precipitation Properties over the Southern Ocean?, J. Climate, 29, 7453–7476, https://doi.org/10.1175/JCLI-D-15-0768.1, 2016.
Hughes, T. P., Kerry, J. T., Álvarez-Noriega, M., Álvarez-Romero, J. G., Anderson, K. D., Baird, A. H., Babcock, R. C., Beger, M., Bellwood, D. R., Berkelmans, R., Bridge, T. C., Butler, I. R., Byrne, M., Cantin, N. E., Comeau, S., Connolly, S. R., Cumming, G. S., Dalton, S. J., Diaz-Pulido, G., Eakin, C. M., Figueira, W. F., Gilmour, J. P., Harrison, H. B., Heron, S. F., Hoey, A. S., Hobbs, J.-P. A., Hoogenboom, M. O., Kennedy, E. V., Kuo, C.-Y., Lough, J. M., Lowe, R. J., Liu, G., McCulloch, M. T., Malcolm, H. A., McWilliam, M. J., Pandolfi, J. M., Pears, R. J., Pratchett, M. S., Schoepf, V., Simpson, T., Skirving, W. J., Sommer, B., Torda, G., Wachenfeld, D. R., Willis, B. L., and Wilson, S. K.: Global warming and recurrent mass bleaching of corals, Nature, 543, 373–377, https://doi.org/10.1038/nature21707, 2017.
Janjić, Z. I.: Comments on “Development and evaluation of a convection scheme for use in climate models”, J. Atmos. Sci., 57, 3686–3686, https://doi.org/10.1175/1520-0469(2000)057<3686:CODAEO>2.0.CO;2, 2000,
Latham, J.: Control of global warming, Nature, 347, 339–340, https://doi.org/10.1038/347339b0, 1990.
Latham, J.: Amelioration of global warming by controlled enhancement of the albedo and longevity of low-level maritime clouds, Atmos. Sci. Lett., 3, 52–58, 2002.
Latham, J., Rasch, P., Chen, C.-C., Kettles, L., Gadian, A., Gettelman, A., Morrison, H., Bower, K., and Choularton, T.: Global temperature stabilization via controlled albedo enhancement of low-level maritime clouds, Philos. T. R. Soc. A, 366, 3969–3987, https://doi.org/10.1098/rsta.2008.0137, 2008.
Latham, J., Kleypas, J., Hauser, R., Parkes, B., and Gadian, A.: Can marine cloud brightening reduce coral bleaching?, Atmos. Sci. Lett., 14, 214–219, 2013.
Mauger, G. S. and Norris, J. R.: Assessing the impact of meteorological history on subtropical cloud fraction, J. Climate, 23, 2926–2940, 2010.
Mlawer, E. J., Taubman, S. J., Brown, P. D., Iacono, M. J., and Clough, S. A.: Radiative transfer for inhomogeneous atmospheres: RRTM, a validated correlated-k model for the longwave, J. Geophys. Res.-Atmos., 102, 16663, https://doi.org/10.1029/97JD00237, 1997.
Possner, A., Wang, H., Wood, R., Caldeira, K., and Ackerman, T. P.: The efficacy of aerosol–cloud radiative perturbations from near-surface emissions in deep open-cell stratocumuli, Atmos. Chem. Phys., 18, 17475–17488, https://doi.org/10.5194/acp-18-17475-2018, 2018.
Richards, L. S., Siems, S. T., Huang, Y., Zhao, W., Harrison, D. P., Manton, M. J., and Reeder, M. J.: The meteorological drivers of mass coral bleaching on the central Great Barrier Reef during the 2022 La Niña, Sci. Rep., 14, 1–17, 2024.
Rosenfeld, D., Zhu, Y., Wang, M., Zheng, Y., Goren, T., and Yu, S.: Aerosol-driven droplet concentrations dominate coverage and water of oceanic low-level clouds, Science, 363, eaav0566, https://doi.org/10.1126/science.aav0566, 2019.
Saffin, L., Lock, A., Tomassini, L., Blyth, A., Böing, S., Denby, L., and Marsham, J.: Kilometer-scale simulations of trade-wind cumulus capture processes of mesoscale organization, J. Adv. Model. Earth Sy., 15, e2022MS003295, https://doi.org/10.1029/2022MS003295, 2023.
Seifert, A. and Heus, T.: Large-eddy simulation of organized precipitating trade wind cumulus clouds, Atmos. Chem. Phys., 13, 5631–5645, https://doi.org/10.5194/acp-13-5631-2013, 2013.
Seifert, A., Heus, T., Pincus, R., and Stevens, B.: Large-eddy simulation of the transient and near-equilibrium behavior of precipitating shallow convection, J. Adv. Model. Earth Sy., 7, 1918–1937, 2015.
Stevens, B. and Feingold, G.: Untangling aerosol effects on clouds and precipitation in a buffered system, Nature, 461, 607–613, 2009.
Thompson, G. and Eidhammer, T.: A study of aerosol impacts on clouds and precipitation development in a large winter cyclone, J. Atmos. Sci., 71, 3636–3658, https://doi.org/10.1175/JAS-D-13-0305.1, 2014.
Tollefson, J.: Can artificially altered clouds save the Great Barrier Reef?, Nature, 596, 476–478, https://doi.org/10.1038/d41586-021-02290-3, 2021.
Twomey, S.: The influence of pollution on the shortwave albedo of clouds, J. Atmos. Sci., 34, 1149–1152, 1977.
Wang, H., Rasch, P. J., and Feingold, G.: Manipulating marine stratocumulus cloud amount and albedo: a process-modelling study of aerosol-cloud-precipitation interactions in response to injection of cloud condensation nuclei, Atmos. Chem. Phys., 11, 4237–4249, https://doi.org/10.5194/acp-11-4237-2011, 2011.
Wang, X., Zhang, L., and Moran, M. D.: Uncertainty assessment of current size-resolved parameterizations for below-cloud particle scavenging by rain, Atmos. Chem. Phys., 10, 5685–5705, https://doi.org/10.5194/acp-10-5685-2010, 2010.
Weston, M. J., Piketh, S. J., Burnet, F., Broccardo, S., Denjean, C., Bourrianne, T., and Formenti, P.: Sensitivity analysis of an aerosol-aware microphysics scheme in Weather Research and Forecasting (WRF) during case studies of fog in Namibia, Atmos. Chem. Phys., 22, 10221–10245, https://doi.org/10.5194/acp-22-10221-2022, 2022.
Wood, R.: Stratocumulus clouds, Mon. Weather Rev., 140, 2373–2423, 2012.
Wood, R. and Ackerman, T. P.: Defining success and limits of field experiments to test geoengineering by marine cloud brightening, Clim. Change, 121, 459–472, 2013.
Wood, R. and Bretherton, C. S.: On the relationship between stratiform low cloud cover and lower-tropospheric stability, J. Climate, 19, 6425–6432, 2006.
Zhang, Y., Stevens, B., and Ghil, M.: On the diurnal cycle and susceptibility to aerosol concentration in a stratocumulus-topped mixed layer, Q. J. Roy. Meteor. Soc., 131, 1567–1583, 2005.
Zhao, W., Huang, Y., Siems, S., and Manton, M.: The role of clouds in coral bleaching events over the Great Barrier Reef, Geophys. Res. Lett., 48, e2021GL093936, https://doi.org/10.1029/2021GL093936, 2021.
Zhao, W., Huang, Y., Siems, S., Manton, M., and Harrison, D.: Interactions between trade wind clouds and local forcings over the Great Barrier Reef: a case study using convection-permitting simulations, Atmos. Chem. Phys., 24, 5713–5736, https://doi.org/10.5194/acp-24-5713-2024, 2024.
Zhao, W., Huang, Y., Siems, S. T., and Harrison D.: WRF outputs of CTRL simulation, University of Melbourne [data set], https://doi.org/10.26188/30071935, 2026a.
Zhao, W., Huang, Y., Siems, S. T., and Harrison D.: WRF outputs of EXP20 simulation, University of Melbourne [data set], https://doi.org/10.26188/32592879, 2026b.
Zhao, W., Huang, Y., Siems, S. T., and Harrison D.: WRF outputs of EXP40 simulation, University of Melbourne [data set], https://doi.org/10.26188/32593914, 2026c.
Zhao, W., Huang, Y., Siems, S. T., and Harrison D.: WRF outputs of EXP100 simulation, University of Melbourne [data set], https://doi.org/10.26188/32593482, 2026d.