
the Creative Commons Attribution 4.0 License.
the Creative Commons Attribution 4.0 License.
 | 10 Nov 2026
Explicit numerical simulations of hailstorm seeding with a three–moment microphysics cloud–resolving model: a comparison of two operational methodologies for hail suppression

Vladan Vučković
Dragana Vujović
Increasing economic losses from hailstorms sustain the relevance of hail suppression as a weather modification technique. However, quantifying operational cloud seeding effectiveness remains challenging due to the inherent nonlinearity and complexity of convective processes. In this study, we use the 3D numerical model ARPS (Advanced Regional Prediction System), featuring a three-moment microphysical scheme, to simulate supercell seeding. The model was enhanced by implementing two-moment aerosol microphysics accounting for all known scavenging processes and parameterizations of all four ice-nucleating modes. Prognostic equations for aerosol mixing ratio and number concentration in air and each hydrometeor category were calculated. Simulations ran at high spatial resolution (500 m horizontal, 250 m vertical) over a 3 h evolution period. This approach enables detailed simulation of processes associated with cloud seeding. Two operational seeding strategies were investigated: RHSS (Republic Hydrometeorological Service of Serbia, 2023) and AB23 (Abshaev et al., 2023). Results indicate that both strategies modify surface hail characteristics by reducing kinetic energy, potentially mitigating crop damage. Total surface hail kinetic energy decreased by 27 % (RHSS) and 17.9 % (AB23). Notably, moderate-energy surface areas (KEflux>100 J m−2) decreased by 36.6 % and 38.6 %, while high-intensity areas (KEflux>300 J m−2) dropped by 66 % and 88 %, respectively. Nonparametric Wilcoxon signed-rank testing verified that both methods cause statistically significant changes (p<0.05 and p<0.01) in surface hail diameter and kinetic energy flux throughout the storm lifecycle.
- Article
(16586 KB) - Full-text XML
- BibTeX
- EndNote


Clouds are one of the key subsystems of the Earth's atmosphere, playing a significant role in redistributing heat and moisture, as well as shaping radiation and hydrological processes. Their impact extends across spatial scales from local to global and temporal scales from minutes to the climate scale, with the consequences of intense cloud systems being particularly significant for sectors such as agriculture and transport.
The complexity of cloud systems arises from the nonlinear interactions of processes at different scales, primarily synoptic and microphysical. Cloud microphysics is itself extremely complex (Morrison et al., 2020; Khain et al., 2000) and includes processes occurring on scales from approximately 10−8 m for aerosol particles (APs) to about 10−1 m for hailstones, representing a difference of seven orders of magnitude (Straka, 2009). The inclusion of synoptic processes further expands the range of relevant scales and increases the complexity of their numerical representation.
Cumulonimbus (Cb) clouds are of particular interest because of their association with intense weather events, including downdrafts, hail, electrical discharges, and strong winds. Owing to their pronounced dynamics, microphysical complexity, and significant impacts, these systems are intensively researched in atmospheric sciences. Extreme weather events linked to Cb clouds are among the main reasons for the decades–long scientific effort to improve numerical weather models and forecasting systems for such processes. Warning systems and mechanisms to reduce material damage caused by convective clouds require special attention and are increasingly discussed.
The fact that the Central Balkan region is identified as one of the regions with the most favourable conditions for the formation of Cb clouds in Europe (Brooks et al., 2003) further supports research on these phenomena. Since the pioneering works of Schaefer (1946) and Vonnegut (1947), many scientific projects (American Society of Civil Engineers, 2015; Dessens et al., 2016; Rauber et al., 2019) and operational programs (American Society of Civil Engineers, 2015; Dessens et al., 2016) have employed cloud seeding technology worldwide to either enhance precipitation or suppress hail. Silver iodide (AgI) is the most widely used glaciogenic seeding material (DeMott, 1995; Marcolli et al., 2016). However, evaluating the effectiveness of cloud seeding has proved to be a very difficult task. Several studies have provided evidence supporting hail mitigation through cloud seeding, using different delivery technologies, including ground–based generators (Dessens et al., 2016), rockets (Mesinger and Mesinger, 1992; Simeonov, 1996; Vujović et al., 2007), and aircraft (Rudolph et al., 1994; Smith et al., 1997).
The development and increasing availability of computational resources, along with recent knowledge advancements in microphysics and numerical techniques (Loftus, 2012), have made numerical models indispensable tools for understanding the chain of events of physical processes associated with cloud seeding practices (American Society of Civil Engineers, 2015; Rauber et al., 2019; Garstang et al., 2005). Numerical models have enabled detailed analysis of the influence of seeding materials on microphysical processes in clouds and allowed sensitivity studies for both idealized (Xue et al., 2013a) and realistic scenarios (Xue et al., 2013b). This approach can also be used to evaluate the effectiveness of a particular weather modification technique or a new seeding material (Lompar et al., 2018), even before physical experiments are conducted.
Hailfall characteristics are determined by the microphysical properties of the cloud and its dynamical structure. The accuracy of numerically simulated hailstorms depends largely on the microphysical scheme used. While bulk numerical models can reproduce most hailstorm features, three–moment microphysical schemes generally yield improved results compared to one- and two–moment schemes (Loftus, 2012; Milbrandt and Yau, 2005a, b, 2006a, b).
When discussing weather modification related to precipitation, a fundamental distinction must be made between strategies aimed at precipitation enhancement and those designed for precipitation suppression or hail mitigation.
Precipitation enhancement typically targets water-deficient clouds to increase rainfall or snowfall. Depending on the cloud type, this is achieved either through hygroscopic seeding, which uses large salt particles to accelerate warm-rain coalescence in liquid clouds, or through glaciogenic seeding in mixed-phase clouds to stimulate ice-phase precipitation where natural ice nuclei are scarce.
In contrast, precipitation suppression and hail mitigation strategies, such as those simulated in this work, use glaciogenic material with a different objective: inducing “beneficial competition” within the hail growth zone. The term beneficial competition refers to the hypothesis that introducing a large number of ice nuclei (IN) into a hail embryo formation zone (EFZ) will produce more numerous hailstones, which then compete for the available supercooled water and ultimately grow to smaller sizes (American Society of Civil Engineers, 2015; Abshaev et al., 2006; Papaevangelou et al., 2025). This limits the growth of individual hailstones to damaging sizes, yielding smaller hydrometeors that are more likely to melt before reaching the ground.
Thus, while both enhancement and suppression can utilize glaciogenic agents, their intended operations differ fundamentally; this study focuses exclusively on the microphysical pathways of the latter mechanism.
Vučković (2003) incorporated a seeding scheme into ARPS and conducted numerical cloud seeding experiments, varying the amount of injected material, the seeding method, and APs activity. All seeding experiments resulted in increased total rainfall. He concluded that the amount of hail decreased in some areas and increased in others due to changes in the width of the seeding zone and the amount of injected APs. The seeding influenced the dynamic processes within the cloud, as indicated by intensified vertical motions.
Previous research based on numerical simulations of dispersion and microphysical responses of convective systems using three–dimensional mesoscale numerical models has shown that the efficiency of cloud seeding is strongly dependent on the cloud's dynamics and reagent dispersion (Ćurić et al., 2006, 2007). In addition, Kovačević (2019, 2023) highlighted the importance of the physical and chemical properties of aerosols, noting that hail suppression is influenced by the characteristics of environmental cloud condensation nuclei (CCN), including their size distribution and water solubility. Research conducted by Ćurić et al. (2008, 2009) suggests that cloud seeding affects precipitation not only within the target area but also leads to significant spatial redistribution and inadvertent weather modification through the advection and diffusion of unused reagents. These findings highlight the complexity of seeding material transport beyond the intended boundaries, which can result in secondary precipitation maxima and unintended meteorological effects in downwind regions. More recent studies (Papaevangelou et al., 2025, 2026) extended this framework by applying selective seeding of naturally occurring thunderstorms and using ensemble modeling across multiple cases to examine the range of microphysical responses to seeding. Their findings, however, indicate an ambiguous impact of seeding on hail characteristics.
Furthermore, physical experiments on cloud seeding are actively being conducted as a novel approach to verify parameterizations implemented in numerical models (Omanovic et al., 2024). For an objective assessment of hail–induced crop damage, Ursu et al. (2025) introduced an innovative approach of identifying a swath with a high probability of crop damage by relating satellite–derived NDVI (Normalized Difference Vegetation Index) to hail kinetic energy flux. Their results are very useful for evaluating the effectiveness of numerical models of cloud seeding.
The approach proposed in this paper is distinguished by a detailed treatment of aerosols with ice nucleation abilities, a feature lacking in the previously mentioned research employing numerical models.
Evaluating the effects of cloud seeding has always been a significant challenge for researchers, particularly when seeding convective clouds. These types of clouds are characterised by small spatial and temporal scales and considerable variability. Additionally, hail precipitation further increases this variability, making it difficult to estimate the effects of seeding on hail suppression, which is the focus of this paper. Due to these hailstorm characteristics, it is difficult to statistically retrieve a microphysical signal of seeding.
The overall aim of this study is to evaluate and compare the physical effects of two operationally used hail-suppression seeding methodologies using a three-dimensional numerical model with detailed microphysics. The primary focus is to investigate the microphysical signatures of glaciogenic seeding and their subsequent impact on hail characteristics at the surface. Consequently, this study examines the nonlinear microphysical interactions triggered by cloud seeding that ultimately influence hailfall.
In this study, we used a numerical model to simulate the hail–producing supercell cloud in order to evaluate hail suppression practices for two different operational approaches. Current computational resources allow us to simulate the physical processes involved in cloud seeding in great detail. Therefore, using numerical models, it is possible to track the complete chain of events, from the injection of aerosol particles (APs) into the seeding zone, to AP scavenging by hydrometeors, followed by nucleation, and finally their redistribution among different hydrometeor categories and their washout by precipitation. By employing this method and comparing the control with the seeding experiment, differences in microphysical processes can be identified, as well as changes in hail characteristics within the cloud and at the ground.
In this study, the total hail kinetic energy flux (J m−2) is used as a physical proxy to assess potential crop damage, rather than actual crop damage data. This choice of parameter follows the established methodology of Ursu et al. (2025), who demonstrated a direct correlation between kinetic energy thresholds and agricultural losses.
2.1 Model Setup
For this study, we used a 3D cloud–resolving numerical model, ARPS (Advanced Regional Prediction System), version 5.3.4 (Xue et al., 2000, 2001), with three–moment microphysics. The numerical model is freely available and developed by the Center for Analysis and Prediction of Storms at the University of Oklahoma. The microphysics scheme (Milbrandt and Yau, 2005a) includes six hydrometeor categories: two liquid (cloud droplets and raindrops) and four solid (cloud ice, snow, graupel, and hail).
The domain of integration covers a volume of , with horizontal and vertical resolutions of 500 and 250 m, respectively. The integration used a large time step of 2 s and a small time step of 0.5 s, with the simulated period covering 3 h of cloud evolution. To handle acoustic wave propagation efficiently, a mode-splitting technique is applied in ARPS, where a small time step is used for acoustic modes while all other dynamic and microphysical terms are integrated at the main (large) time step. The domain had rigid wall conditions at the top and bottom and open lateral boundaries. The model employs a 1.5–order TKE closure coupled with the Moeng–Wyngaard subgrid–scale turbulence scheme (Moeng and Wyngaard, 1989). Scalar advection is handled by the multidimensional Zalesak flux–corrected transport method (Zalesak, 1979). The hailstorm is initiated with a 4 K potential temperature perturbation in the form of an ellipsoidal bubble in a horizontally homogeneous environment characterized by radio–sounding data. The sounding describes the conditions of an unstable atmosphere with strong vertical wind shear, which favours the development of organized convection. The sounding is well known in the literature (Klemp et al., 1981, Klemp and Rotunno, 1983; Brandes, 1981) and will be examined in detail in Sect. 2.2. The sounding represents a modified composite constructed from real observations taken at Fort Sill and Elmore City on 20 May 1977. This composite merges lower-level thermodynamic data from Fort Sill with upper-level data from Elmore City, combined with a smoothed composite hodograph to realistically capture the pre-storm environment. A simple storm-following configuration was employed, in which the model domain was translated at 3 m s−1 due east and 14 m s−1 due north to approximately follow the storm motion and keep the main updraft near the center of the computational domain.
Regarding the model spin-up period, we recognize that studies investigating convective boundary-layer equilibrium commonly exclude the initial 30–60 min of the simulation to allow turbulence to become fully developed (Guichard and Couvreux, 2017). However, as the present study is primarily concerned with the operational methodology of cloud seeding, particular emphasis is placed on the early stages of convective cell development.
Aerosol scheme
The model is upgraded with a two–moment aerosol scheme described in detail in Vučković et al. (2022). In this parameterisation, APs are represented by a gamma distribution with prognostic equations for the mixing ratio and total number concentration of APs in the air and in each hydrometeor category. The submicron-sized aerosols that follow the gamma distribution are injected into the seeding zone, where they are scavenged by different hydrometeor categories through the processes listed in Table 1. The injection of APs is performed instantly (within a single timestep) during each seeding cycle. More details about the seeding zone and cycles are described in Sect. 2.3.
Table 1Aerosol scavenging processes implemented in the ARPS model within the two–moment microphysics scheme.
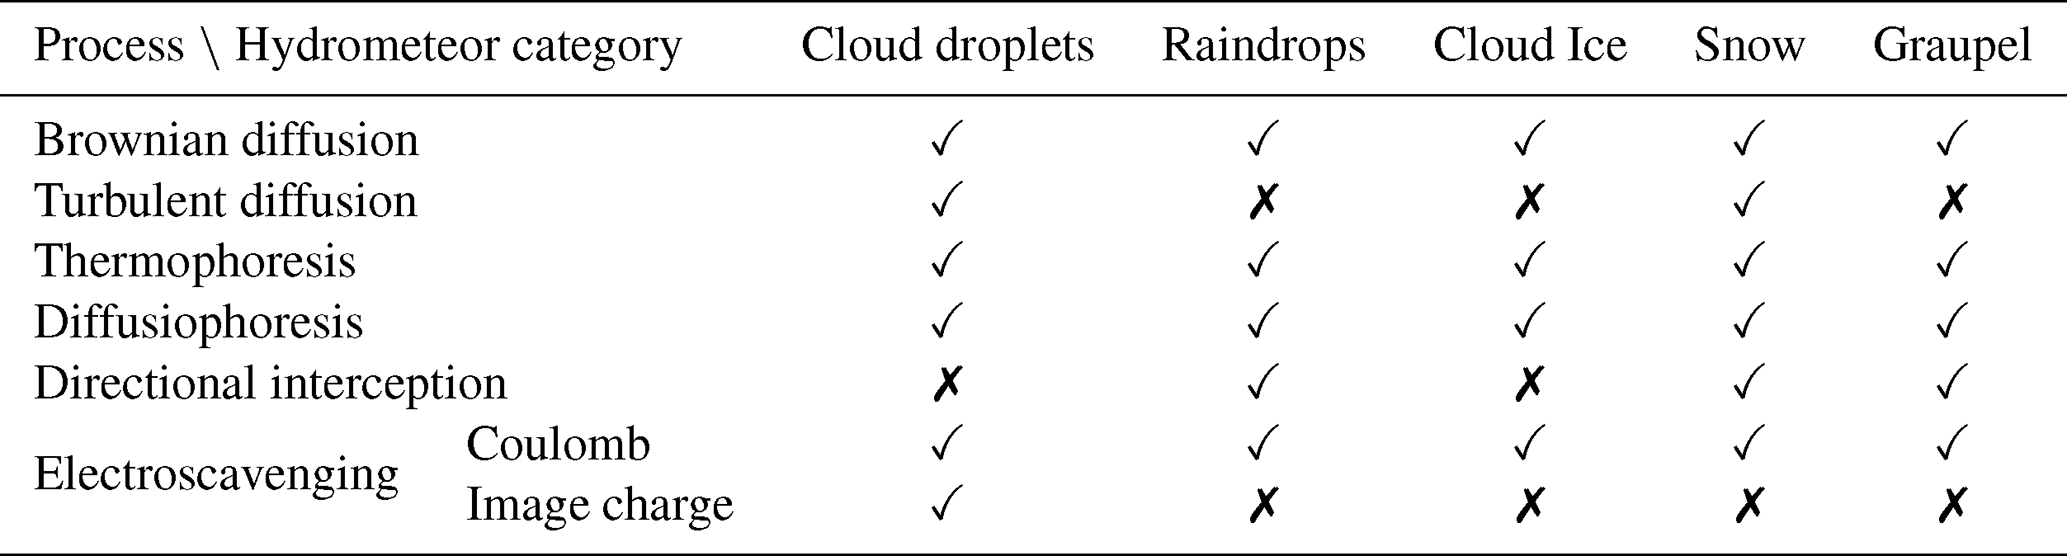
First, APs are injected into the seeding zone. They are then scavenged by different hydrometeors and, if present within liquid hydrometeors, can serve as ice nuclei to initiate freezing. When APs are scavenged by a particular hydrometeor, they are removed from the air and added to that hydrometeor category. In other words, our model calculates the mixing ratio and number concentration of APs in the air and in each hydrometeor category. APs can be transferred from one category to another via microphysical processes. Furthermore, all known aerosol scavenging processes are included in the model (Table 1). For all experiments, the intensity of cloud electrification is set to α=3 (), corresponding to a moderately charged cumulonimbus cloud. Electrostatic scavenging was parameterized assuming hydrometeor surface charge density (qx=αaD2), adopting a conservative value of α=3 for electrified conditions (Vučković et al., 2023). This mechanism plays a critical role in the scavenging of submicron APs up to 0.2 µm. The parameterization, along with the effects of scavenging processes on APs injected into the convective cloud, is discussed in detail by Vučković et al. (2023, 2025a, b).
In the model, it is assumed that APs can serve as ice nuclei; therefore, the characteristics such as activity and density of aerosols in the model match those of silver iodide (AgI), because it is used as a seeding reagent whose number size distribution and activity are described in the works by Meyers et al. (1995) and DeMott (1982, 1995), respectively. Furthermore, APs can initiate primary ice nucleation through either deposition or condensation-freezing modes. On the other hand, when scavenged by cloud droplets or raindrops, they can initiate ice phase formation through immersion or contact freezing. DeMott's (1995) parameterisation of these four nucleation modes of silver iodide is also implemented in the model. In this parameterization, the fraction of active APs is calculated as a function of temperature, supersaturation, and AP diameter.
2.2 Environmental Drivers for Hailstorm Formation
The hailstorm was initiated in the numerical model ARPS using radio–sounding data. The Skew–T diagram is shown in Fig. 1. Radio–sounding data indicate very unstable environmental conditions, with a Surface–Based Convective Available Potential Energy (SBCAPE) of 3381 J kg−1 and no Convective Inhibition (CIN). This, combined with a relatively low Lifting Condensation Level (LCL) and Level of Free Convection (LFC), both close to 730 m a.s.l., is conducive to deep convection. High surface moisture is indicated by a high surface dew point temperature of approximately 21 °C. The clockwise hodograph shows strong vertical wind shear, indicating favourable conditions for organized convection, specifically a right–moving supercell cloud. This supercell is estimated to be moving north–northeast at around 30 kn, as indicated by the arrow.
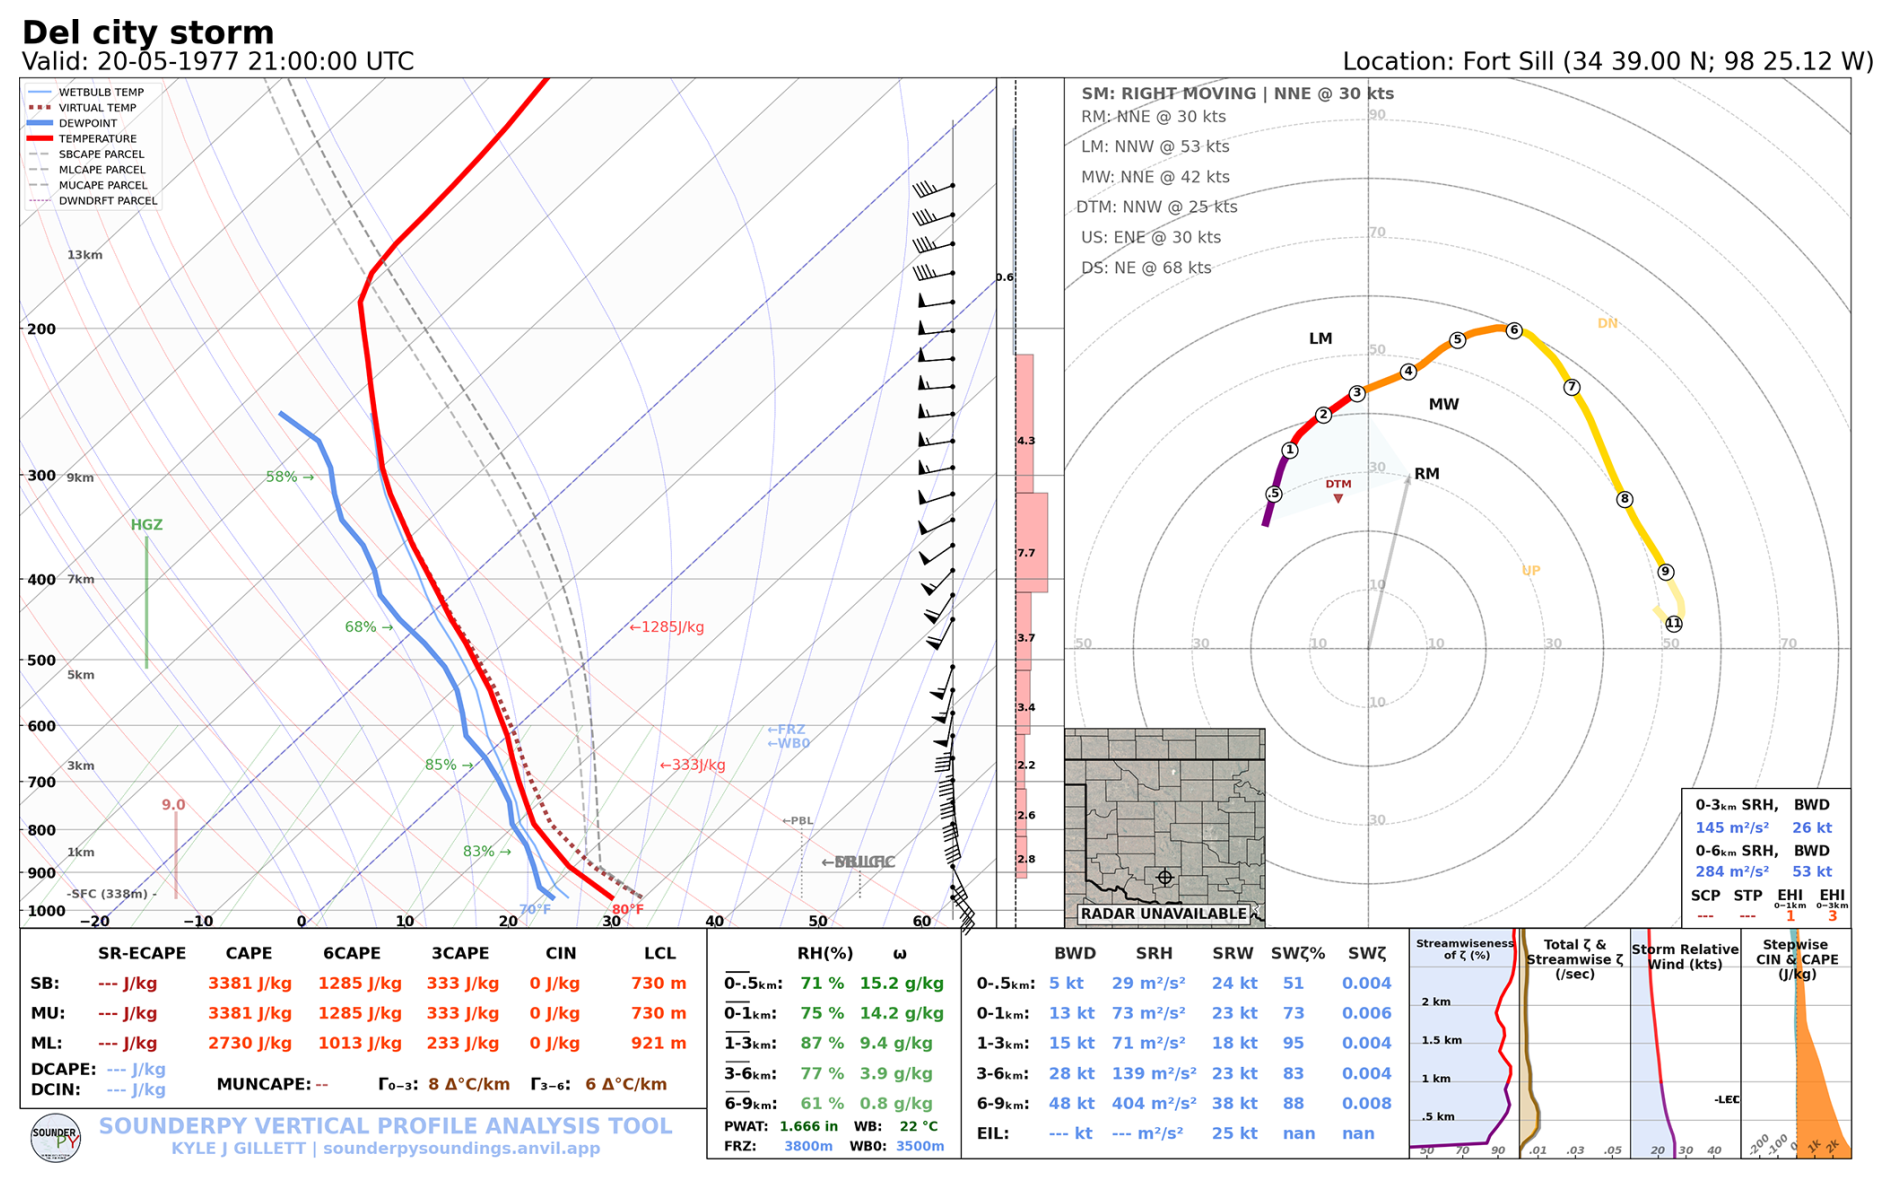
Figure 1Skew–T sounding of “Del city storm” for 20 May 1977, 21:00 UTC (16:00 LT). Python library SounderPy (Gillett, 2025) was used to make this figure. Environmental temperature (red line) and dew point temperature (blue line) are on the left panel. Hodograph with estimated velocity and direction of the right–moving cell is on the right panel. Below, various convective indices are calculated along with moisture and vorticity variables.
The sounding we used is well known and thoroughly researched in the scientific literature. This data relates to a synoptic situation in which sixteen storms (Ray et al., 1981) occurred during the afternoon and evening hours of 20 May and the early morning hours of 21 May 1977. The storm that formed and produced a tornado was named the “Del City storm.” The supercell developed rapidly, exhibiting a characteristic low–level mesocyclone and a hook radar echo prior to tornadogenesis (Brandes, 1981; Klemp and Rotunno, 1983). The observed storm features were also successfully reproduced using numerical models (Klemp et al., 1981; Noda and Niino, 2003).
2.3 Operational Cloud Seeding
According to the World Meteorological Organization statement on weather modification (WMO, 2025), more than 50 countries use some form of weather modification, usually seeding with nucleating APs, to disperse fog, enhance precipitation, or mitigate hail. Many countries have operational practices of convective cloud seeding with glaciogenic material to suppress hail–induced damage. These seeding methodologies usually rely on beneficial competition by using glaciogenic APs and in this research, we investigated two methodologies that have been in use for several decades.
2.3.1 Republic Hydrometeorological Service of Serbia Methodology
Serbia has employed cloud seeding for hail mitigation for almost 60 years (since 1967) under the supervision of the Republic Hydrometeorological Service of Serbia; this methodology will therefore be referred to as RHSS in the following text. The full procedure for hail suppression using this methodology is described in the Republic Hydrometeorological Service of Serbia (2023). The Hail Suppression Center of Serbia operates for six months each year, from 15 April to 15 October, using rocket technology to deliver the seeding material to the clouds.
The RHSS methodology is based on the detection of four variables derived from radar data, as presented in Table 2.

The height of characteristic isotherms from Table 2 is obtained from a numerical weather model or sounding data. When RHSS criteria are observed by a radar operator (except for the fourth criterion in the case of a developing cell, described below), the first phase of cloud seeding is initiated, determining the type of convective process. RHSS recognises five types of convective processes:
-
Developing cell,
-
Single cell axisymmetric stationary process,
-
Single cell nonsymmetric moving process,
-
Multicell process, and
-
Supercell process
After determining the type of convective process, the seeding zone is identified. It is located in the vicinity of the hail embryo formation zone (EFZ) and includes a part of it. In the RHSS methodology, rockets are aimed at −6 ± 3 °C, effectively covering the vertical range from 0 to −10 °C. In the model, the upper and lower boundaries are set as the −10 and 0 °C isotherms, respectively. Horizontally, these zones are confined between 45 and 15 dBZ (hatched red in Fig. 2), except for the Developing cells (type 1), which are seeded over the entire area of 15 dBZ. As previously mentioned, the seeding zone should include part of the EFZ and is located near the main updraft (Young, 1993; Abshaev et al., 2014, 2023). For Single cell axisymmetric stationary processes (type 2), the EFZ is located symmetrically around the updraft in a volume resembling a torus. In contrast, moving clouds (types 3–5) are characterized by the EFZ, which is usually located on the cloud's periphery in front of the main updraft axis. After identifying the seeding zone, the seeding mass is calculated based on the horizontal surface area of the zone using lookup tables developed by RHSS. This mass is evenly distributed within the seeding zone volume in the numerical model. If a Developing cell is identified, one seeding cycle is used. For types 2–5, the number of seeding cycles depends on the maximum radar reflectivity as follows:
-
2 seeding cycles
-
3 seeding cycles
-
at least 4 seeding cycles
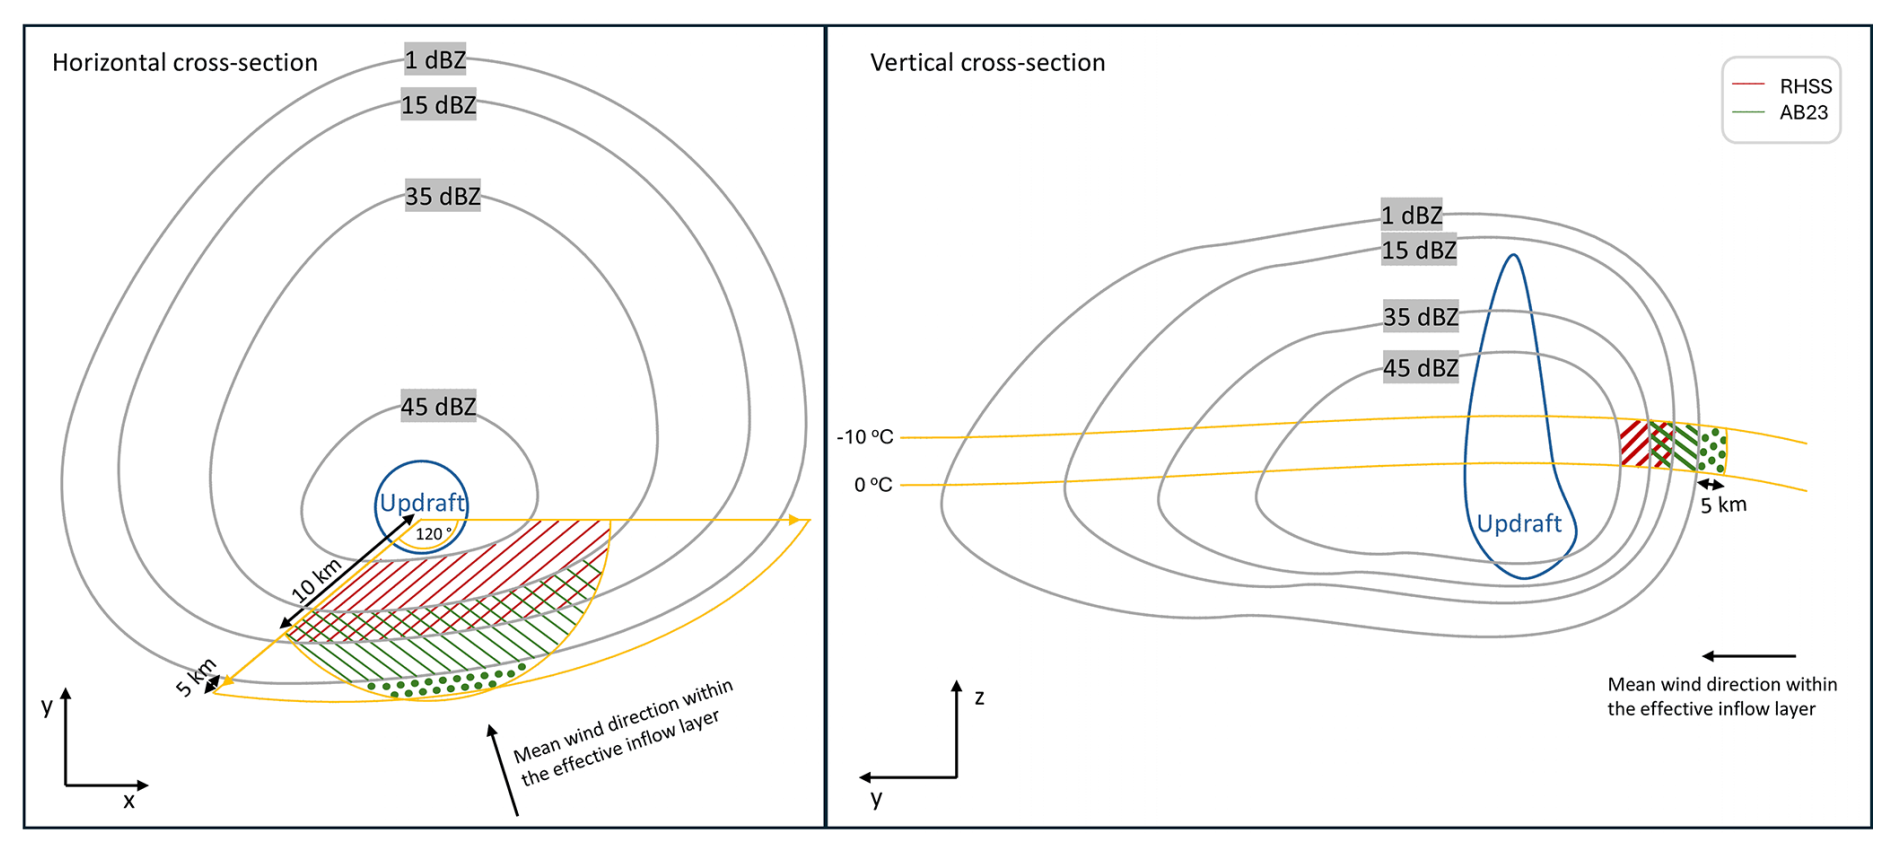
Figure 2Scheme of the seeding zone for the RHSS (red) and AB23 (green) methodologies. The left panel shows the horizontal cross–section, while the right panel shows the vertical cross–section. Note that this scheme does not apply to RHSS type 1 and 2 processes, nor to the SOI process in AB23.
Seeding cycles are separated by 5 min time intervals. If any of the criteria from Table 2 cease to be valid, seeding is terminated for the next 5 min after which criteria checking is resumed.
2.3.2 Methodology of Abshaev et al. (2023)
The seeding methodology proposed by Abshaev et al. (2014, 2023, denoted AB23) is presented in this section. The first step is to determine the type of convective process, or the “seeding object” (SO), as defined by Abshaev et al. (2023). This methodology recognises four seeding objects, from SOI, the weakest type of storm, to SOIV, the most severe. The AB23 methodology uses a significantly more complex set of criteria for SO type categorisation compared to RHSS. Table 3 lists the thresholds for the different SOs.
Table 3AB23 methodology criteria for cloud seeding.

Zmax→ radar reflectivity maximum (in dBZ). ΔHx→ height of the radar reflectivity (in km) of x dBZ measured above the 0 °C isotherm, where . Δqm→ vertically integrated water content (VIL) maximum (in kg m−2) above the 0 °C isotherm. ΔMx→ integrated water content within the x dBZ reflectivity volume (in ton) above the 0 °C isotherm, where .
As stated in Abshaev et al. (2023), seeding is usually performed at the level of −6 ± 3 °C. Therefore, in the model, seeding is carried out between 0 and −10 °C, facilitating comparison between different experiments. SOI is seeded over the entire area with 15 dBZ reflectivity. The SOII seeding zone is horizontally bounded by the 35 dBZ reflectivity and the border of the radar echo (1 dBZ in the model), which is indicated by hatched green lines in Fig. 2. The SOIII and SOIV seeding zones are also horizontally bounded by the 35 dBZ reflectivity on one side and by a line extending 5 km beyond the radar echo boundary into the cloud–free region on the other side (1 dBZ +5 km into the cloud–free region in the model). This zone is shown in Fig. 2 as green dots. Regarding the seeding cycles:
-
SOI→ 1 seeding cycle
-
SOII→ 2 seeding cycles
-
SOIII (weak and moderate) → 3 seeding cycles (every 7 min)
-
SOIII (intense) and SOIV→ 4 seeding cycles (every 3.5 min)
For practical reasons, the model was set up in a way that SOIII was seeded 3 times and SOIV 4 times, every 7 min. An important thing to mention is that, although Abshaev et al. (2023) report that the initial number concentration of the seeding material for effective hail prevention should be NTap≥1011 m−3, to have comparable total masses of APs injected in experiments of both methodologies, we used NTap=108 m−3 for AB23.
Examining the RHSS and AB23 methodologies reveals that the main differences between them are the seeding criteria, the seeding zones (Fig. 2), and the seeding cycle time intervals. Three experiments were conducted in this study: a control experiment (CTRL) without seeding, and one for each methodology described earlier (RHSS and AB23).
The simulated supercell exhibited a somewhat anomalous motion, moving due north (Sect. 2.2). In the northern hemisphere, supercells typically move eastward and have inflow located south of them (Fig. 2). In the model, the seeding zone is defined as follows. First, the domain-wide maximum radar reflectivity is identified, followed by the determination of the 0 °C level within the corresponding vertical column and the maximum updraft at the zero-isotherm level, which is typically close to the reflectivity maximum but at a different height. This location is then used as the seeding sector, from which a vector directed along the x-axis is constructed. Second, grid boxes within a specified reflectivity and temperature range are searched within a 120° sector to the right of this vector (clockwise), indicated by orange arrows in Fig. 2. To limit seeding in parts of the cloud far from the EFZ, seeding is permitted within 10 km of the location of the maximum updraft.
2.4 Statistical Evaluation
To evaluate the statistical significance of seeding-induced changes in hail metrics and precipitation, we employed the non-parametric Wilcoxon Signed-Rank (WSR) test. This approach is suited for our experimental framework, where each measurement pair consists of an unseeded control run and a seeded simulation sharing identical initial atmospheric conditions (Papaevangelou et al., 2025; Brülisauer et al., 2025; Rudolph et al., 1994). Because the WSR test analyses paired, dependent samples without requiring a normal distribution of differences, it offers a robust assessment for our non-linear model outputs. Pairwise comparisons were conducted between the CTRL experiment and each of the two seeding methodologies (RHSS and AB23). Statistical significance (p-values) was evaluated both point-by-point across the 2D field at the lowest model level and for the level-averaged median values.
For this study, we used the ARPS model to simulate 3 h of supercell cloud development. The supercell was initialized with a radio-sounding data examined in Sect. 2.2. In our numerical simulations, the storm took about 40 min to split into a left–moving cell, which quickly weakened and left the domain, and a right–moving supercell. The evolution of the storm, in the CTRL experiment, examined using radar reflectivity at 2 km height, is shown in Fig. 3. The updraft is indicated by a red isoline of vertical velocity threshold of 5 m s−1. Only the right–moving supercell was seeded.
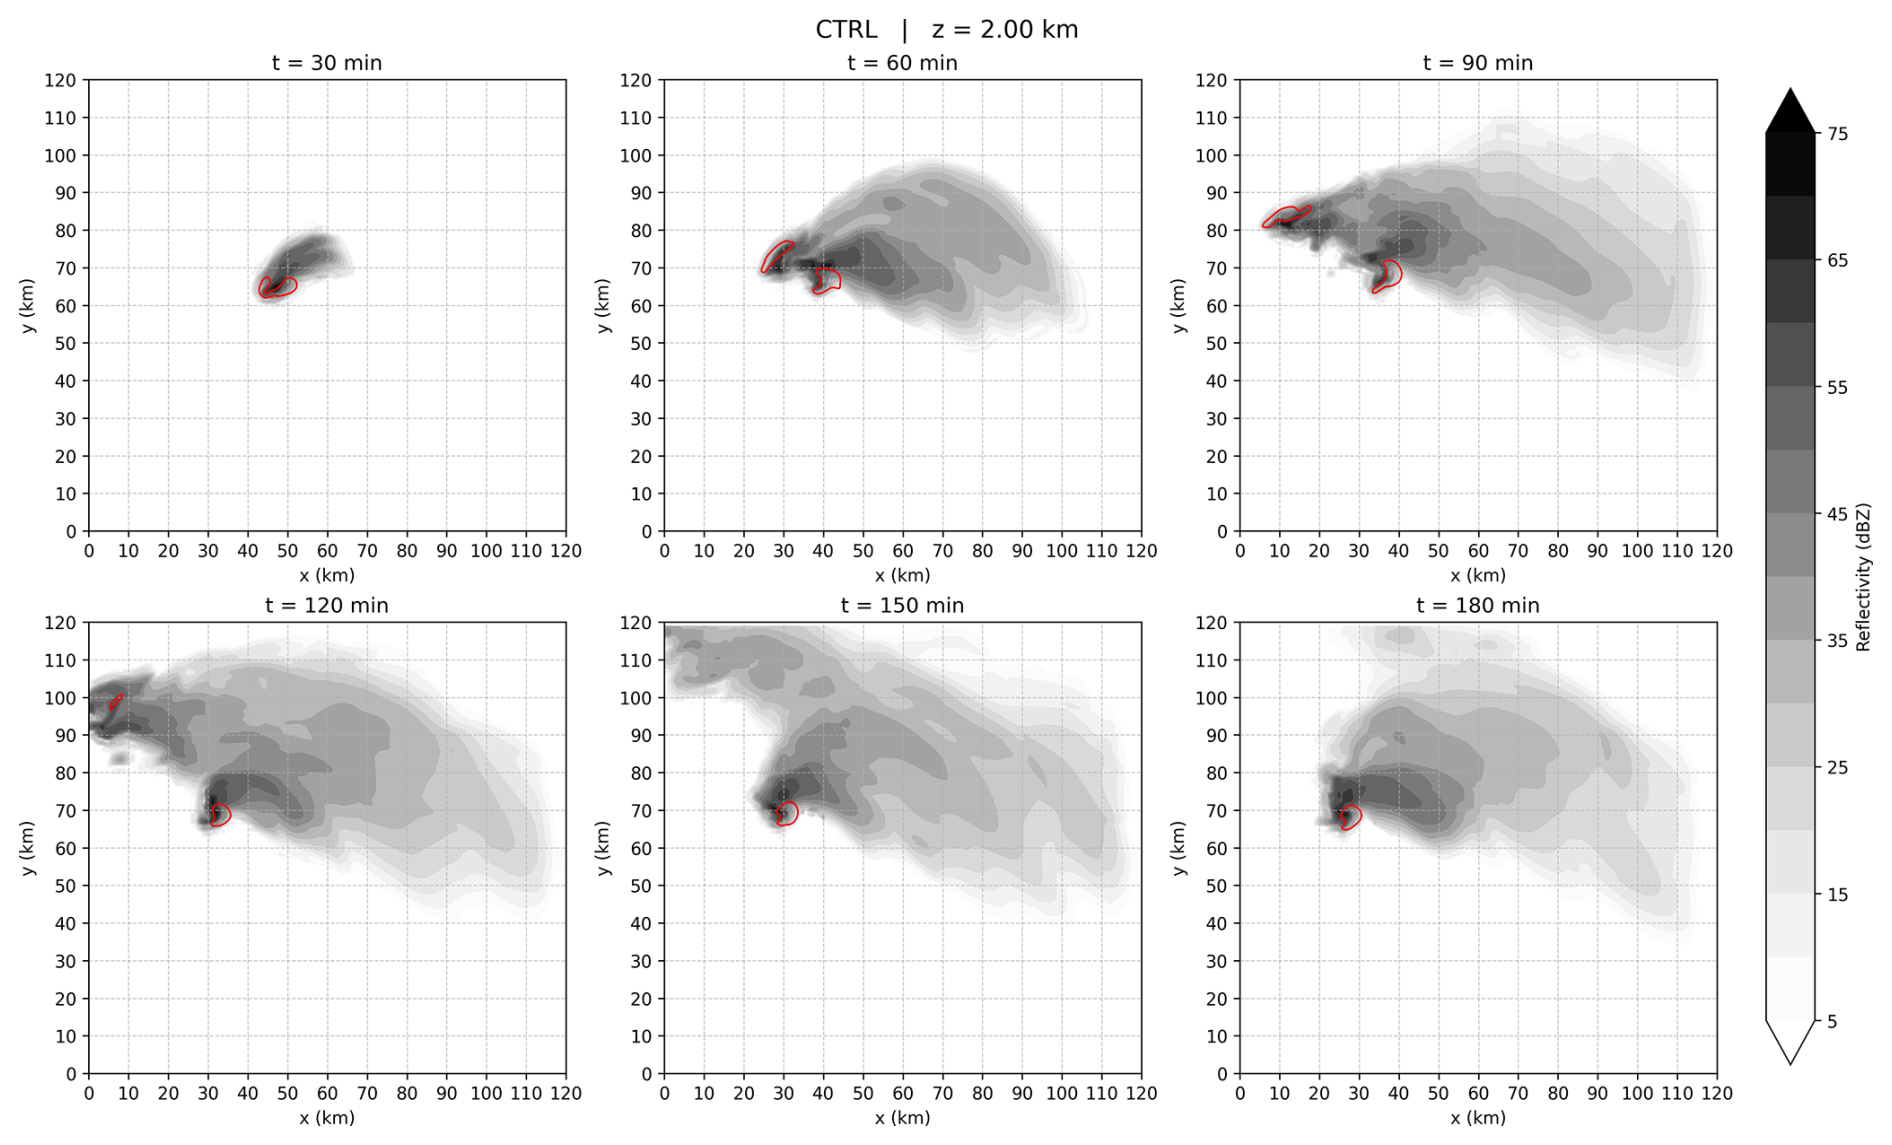
Figure 3Supercell evolution presented by the radar reflectivity (grey color) for the CTRL experiment, given every 30 min at a height of 2 km. The updraft threshold of 5 m s−1 is marked by a red isoline.
3.1 Microphysical Responses to Cloud Seeding
The approach described in Sect. 2.1 enables tracking of aerosol fate within the model. Both AP number concentration and mixing ratios have their prognostic equations for the air and for each hydrometeor category in this two–moment AP microphysics scheme. This allows investigation of all the physical processes to which the injected APs are exposed in every grid box, from the rate of their removal from the atmosphere by hydrometeors, to their activation as IN in cloud droplets and raindrops, and eventually their redistribution among different hydrometeor categories due to microphysical interactions.
The total mass of injected AP mass (cyan lines in Fig. 4a) is comparable for both methodologies throughout the entire 3 h period, although for AB23, a larger amount of seeding material is injected, about 40 % more. For AB23, the total mass is approximately 70 kg, and for RHSS, 50 kg. It should be noted that after about the 1 h mark, part of the cloud's anvil begins to leave the domain; therefore, a small fraction of cloud ice and aerosols is lost due to advection through the sides of the domain. In Fig. 4, it can be seen that the seeding criteria for AB23 are met a few minutes earlier than for RHSS.
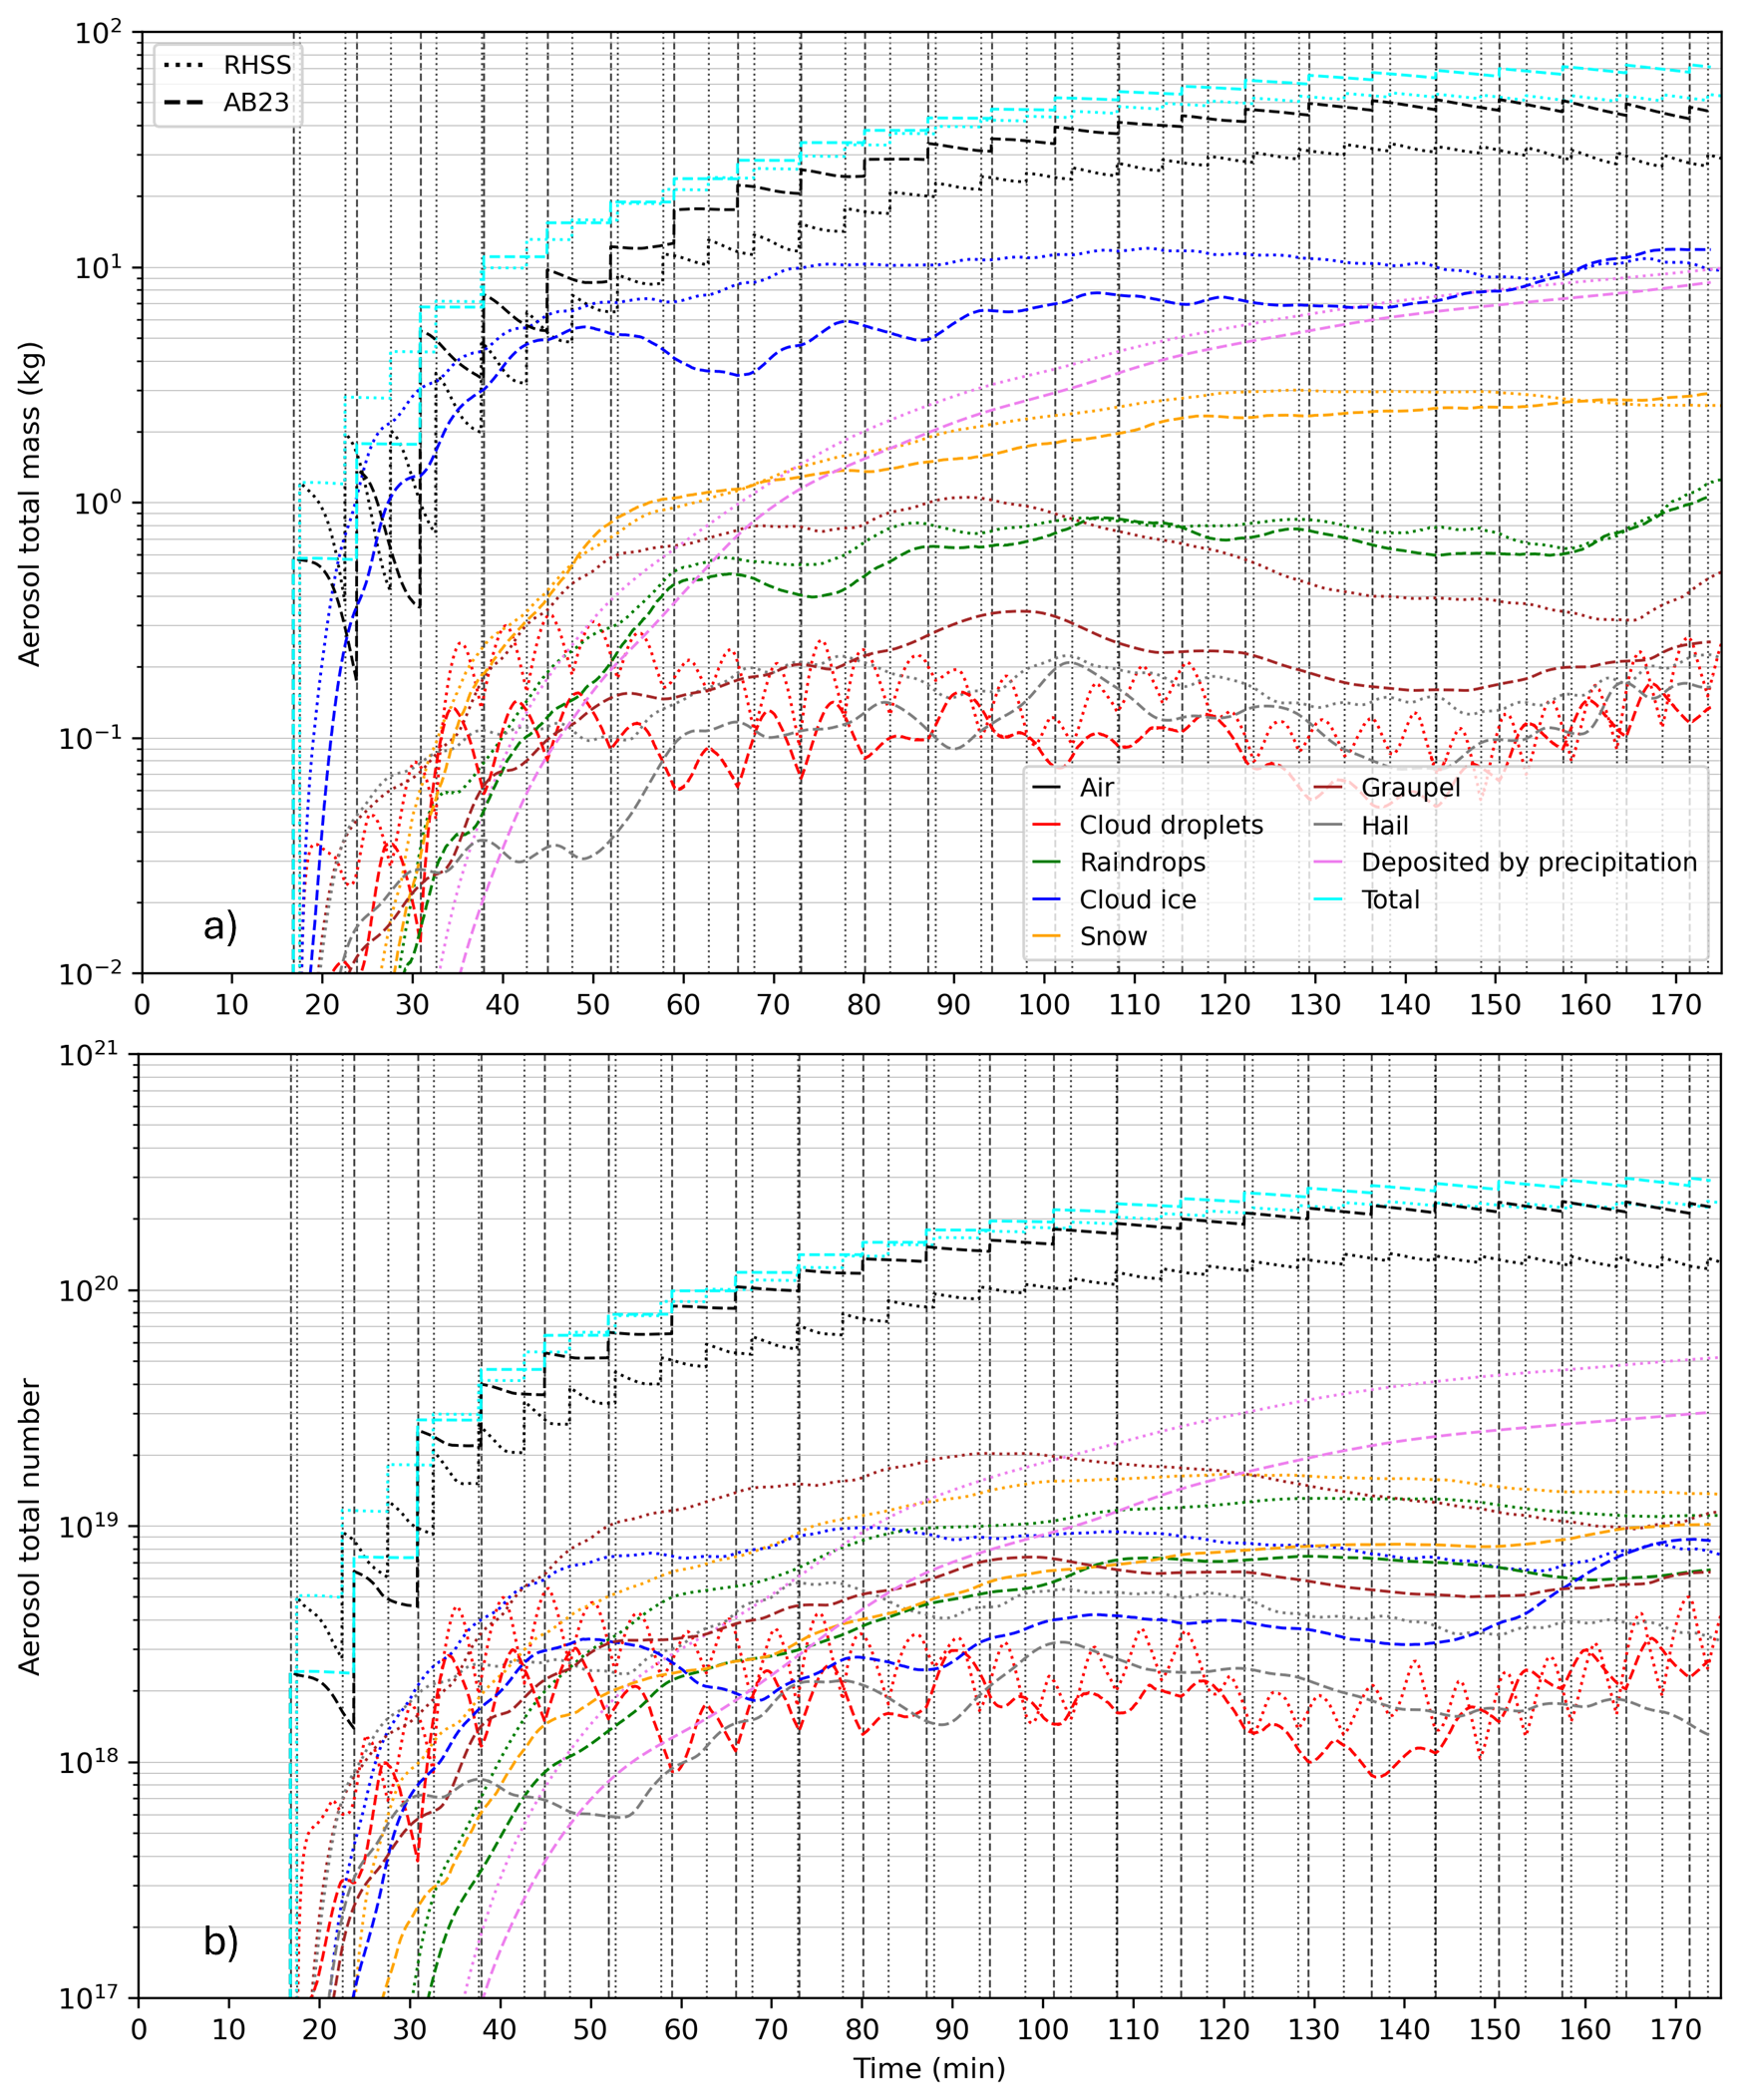
Figure 4The time series of aerosol total mass (a) and number (b) in the air and in each hydrometeor category for the entire model domain. The case of RHSS methodology is depicted with dotted lines, and for AB23 with dashed lines. Vertical lines correspond to the timings of the seeding cycles for RHSS (dotted) and AB23 (dashed).
The strongest signal as a response to cloud seeding, as expected, is observed in cloud droplets (red lines). Each individual seeding cycle is clearly visible in both methods as a sudden increase in AP mass in cloud droplets due to scavenging, followed by a decrease caused by activation as INs. It is also evident that, for RHSS, there is more AP mass in cloud droplets, especially during the first 2 h, which can be attributed to differences in the seeding zones. In the case of AB23, the seeding material is also dispersed in front of or outside the cloud; therefore, it takes some time for the seeding material to be advected into the volume containing supercooled droplets, scavenged from the air, and ultimately nucleate as ice particles.
As a result of intentionally seeding the supercooled part of the cloud, most of the AP mass ends up in cloud ice (blue lines). Although the RHSS methodology delivered less seeding material, it contains more AP mass in cloud ice for about 2.5 h of integration, after which AB23 prevails. This may also be explained by a slower and steadier supply of ice–nucleating particles to the zone of supercooled liquid.
Aerosol total mass in graupel shows the greatest difference when comparing the two methodologies, with more APs are contained in graupel in the case of RHSS throughout the integration period. Furthermore, the total mass of APs deposited on the surface by precipitation increased steadily, reaching about 10 kg at the end of the integration period, although slightly more AP mass was deposited in the case of RHSS.
Examining the total AP number (Fig. 4b), a similar conclusion is reached, with some key differences. First, there is a greater difference in the total AP number across hydrometeor categories between these two methodologies. Second, cloud ice is not the dominant AP reservoir in terms of number, compared to mass (Fig. 4a). Finally, most APs scavenged, in terms of their number, are washed out by precipitation. All these differences can be attributed to the use of a non–monodisperse aerosol distribution. According to the dependence of AP scavenging on particle diameter (Vučković et al., 2022, 2023, 2025a, b), where smaller particles are collected more efficiently by hydrometeors, the difference between the two cases is explained by the slower collection of small APs by hydrometeors in AB23, due to the seeding zone being partially outside the cloud, which affects particle number more than mass. Conversely, smaller ice–nucleating particles are less active than larger ones; that is, smaller APs, which contribute more to the number than to the mass of collected particles, are activated as IN to a lesser extent, and thus fewer of them are transferred from cloud droplets to cloud ice after nucleation.
The effects of seeding the cloud with glaciogenic material on the total mass and number of hydrometeors in the model domain are shown in Fig. 5a and b, respectively. Both seeding methodologies have almost the same effect on increasing or decreasing specific microphysical processes.
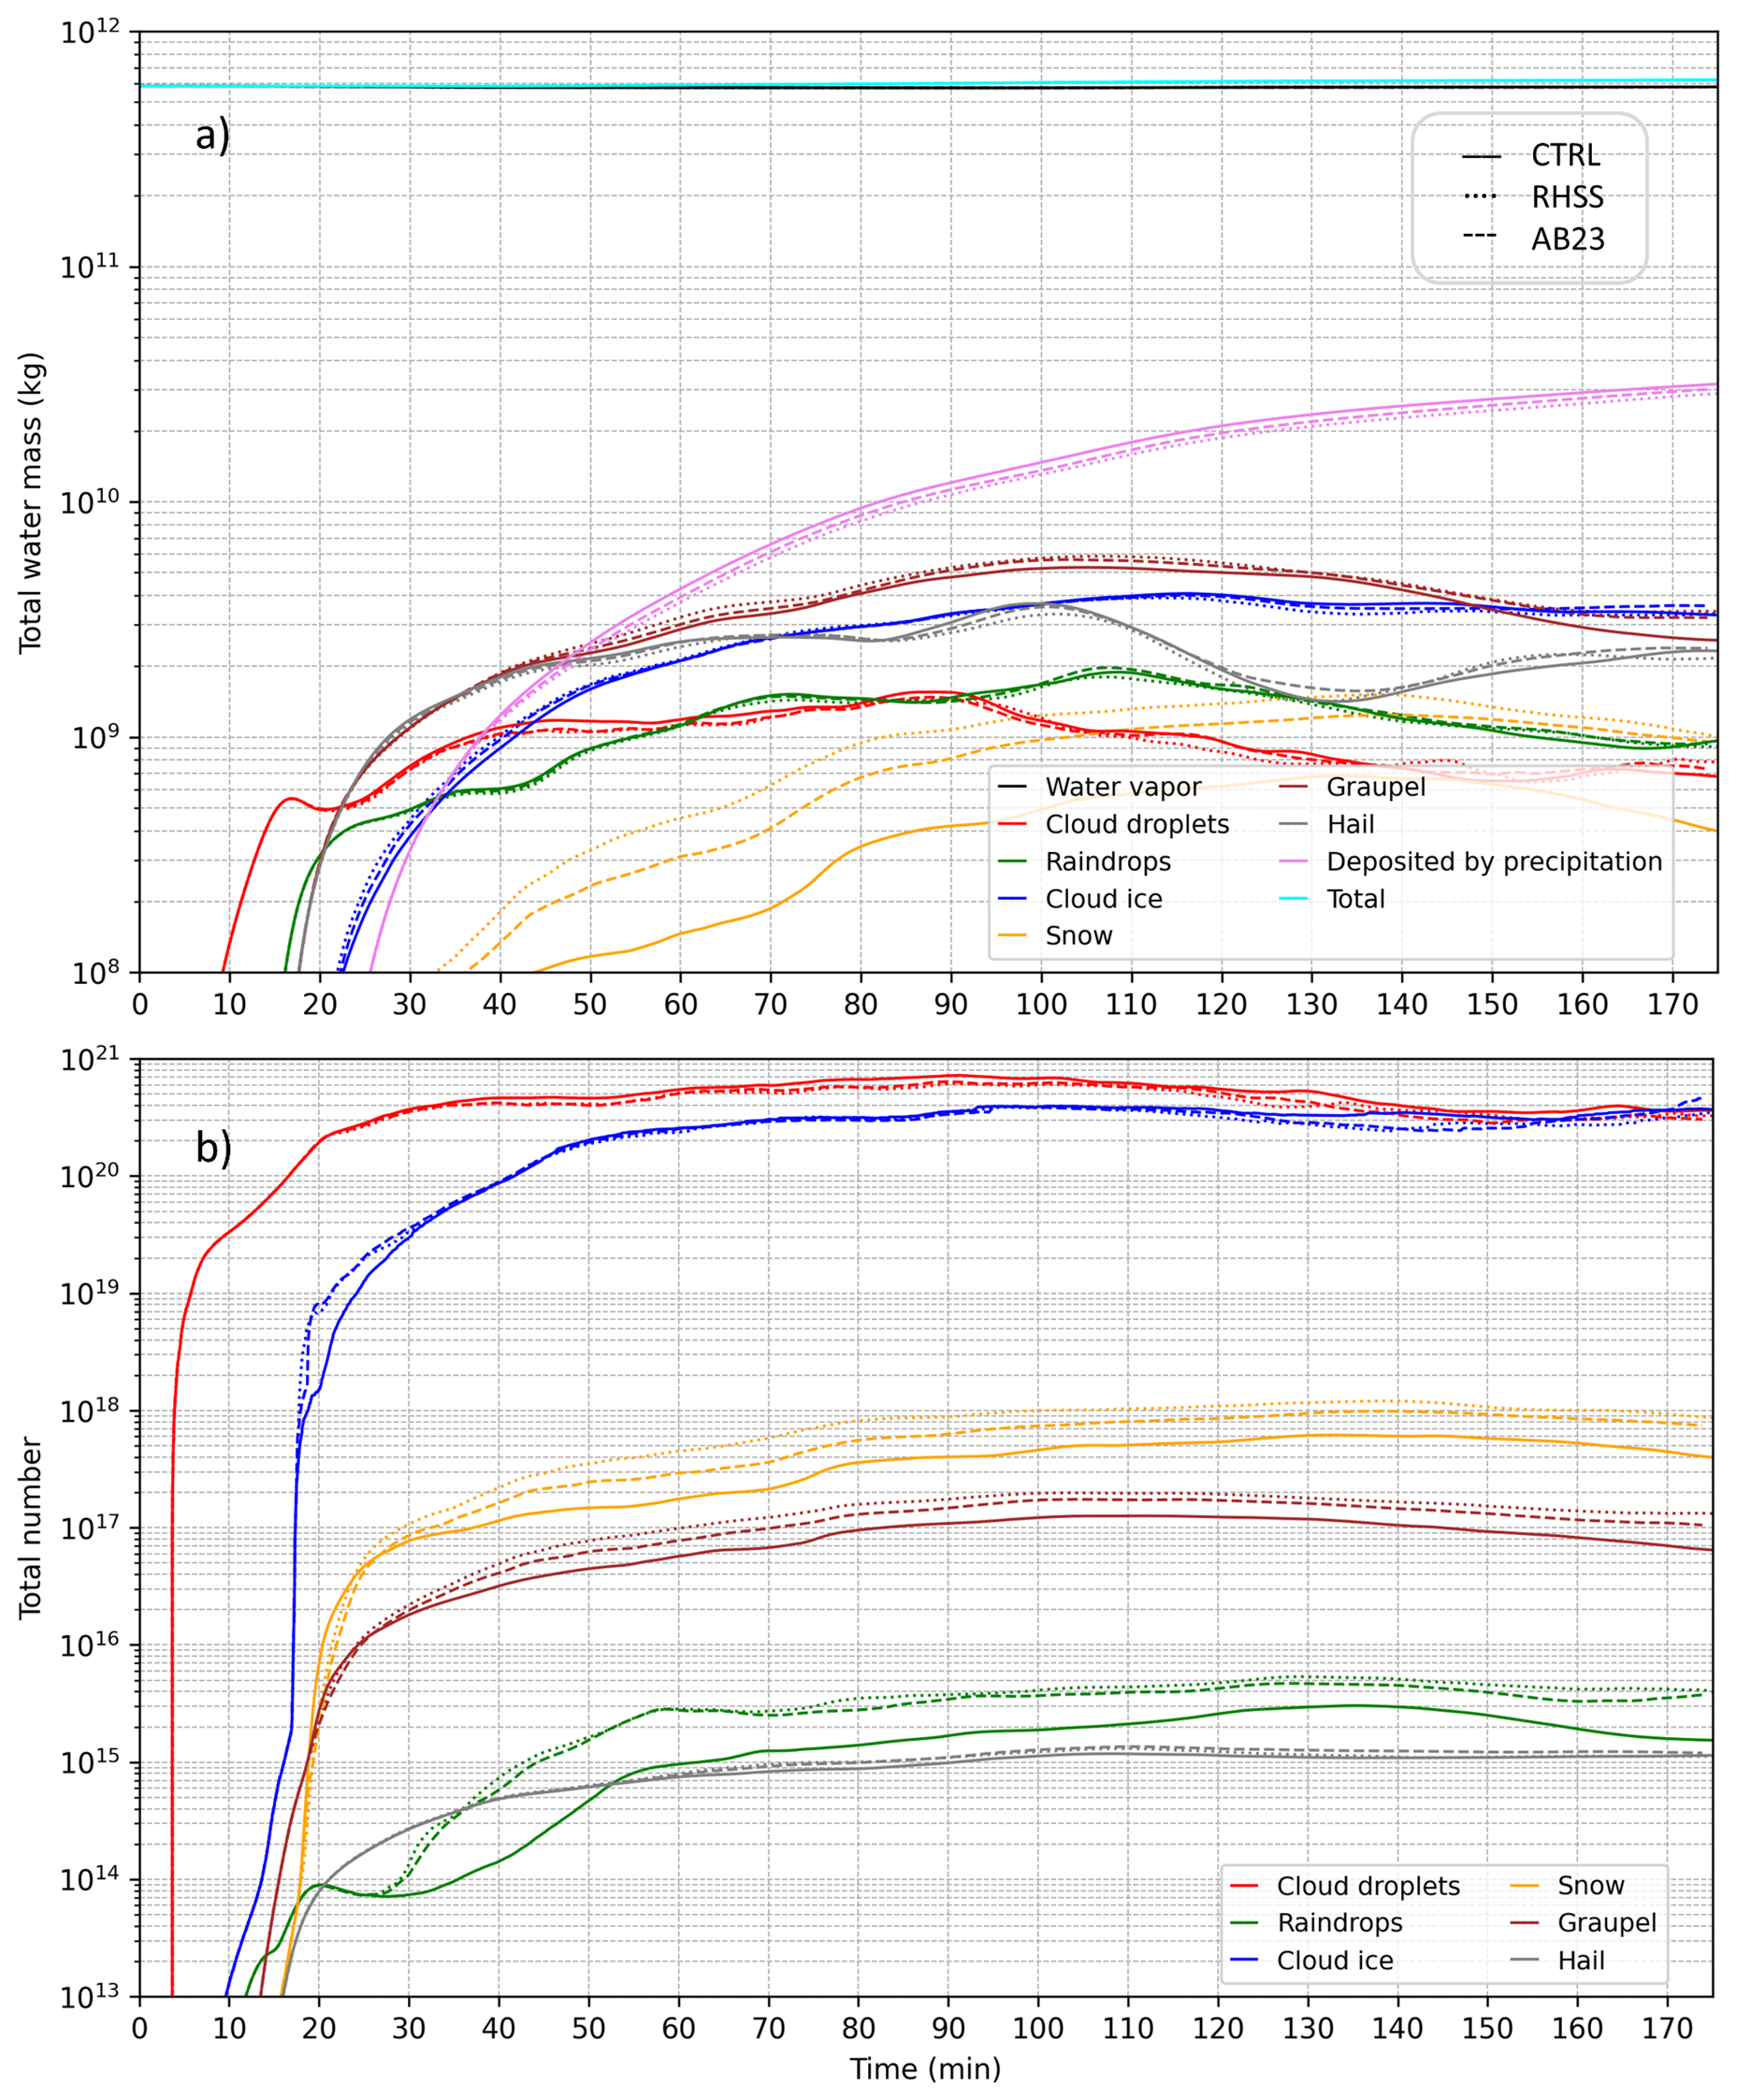
Figure 5The time series of the total mass (a) and number of hydrometeors (b) in each hydrometeor category for the entire model domain. The CTRL case is depicted with a solid line, the RHSS methodology with dotted lines, and AB23 with dashed lines.
To understand the seeding signal, it is useful to examine the individual microphysical processes within each hydrometeor category and compare the CTRL and seeding cases. This approach enables a detailed understanding of the processes involved in cloud seeding. In Sect. 3.1.1–3.1.6, we will thoroughly investigate the microphysical response to seeding for cloud droplets, raindrops, cloud ice, snow, graupel, and hail, respectively.
3.1.1 Cloud droplets response
Targeting the zone of hail embryo formation, supercooled cloud droplets are the first to respond to the injected APs. Figure 6 shows the microphysical source and sink terms for cloud droplet mass (a) and number (b) in the CTRL (solid lines), RHSS (dotted lines), and AB23 experiment (dashed lines). In the seeding cases, the most noticeable sinks are those related to contact and immersion freezing of cloud droplets on AgI particles (red and light red in Fig. 6, respectively). Both freezing processes are of the same order of magnitude in this case, although immersion freezing displays a very distinct step–like seeding cycle signal, in contrast to contact freezing, especially in the total mass. This behaviour is explained by the freezing mechanism itself. When APs are injected into the seeding zone, they are collected by the cloud droplets. As soon as they reach the nucleation temperature for immersion freezing, they activate as immersion INs; hence, the step–like trend is observed. In contrast, contact freezing, in addition to being a function of temperature, also depends on the AP collection rate (Table 1), which is why this line is flatter.
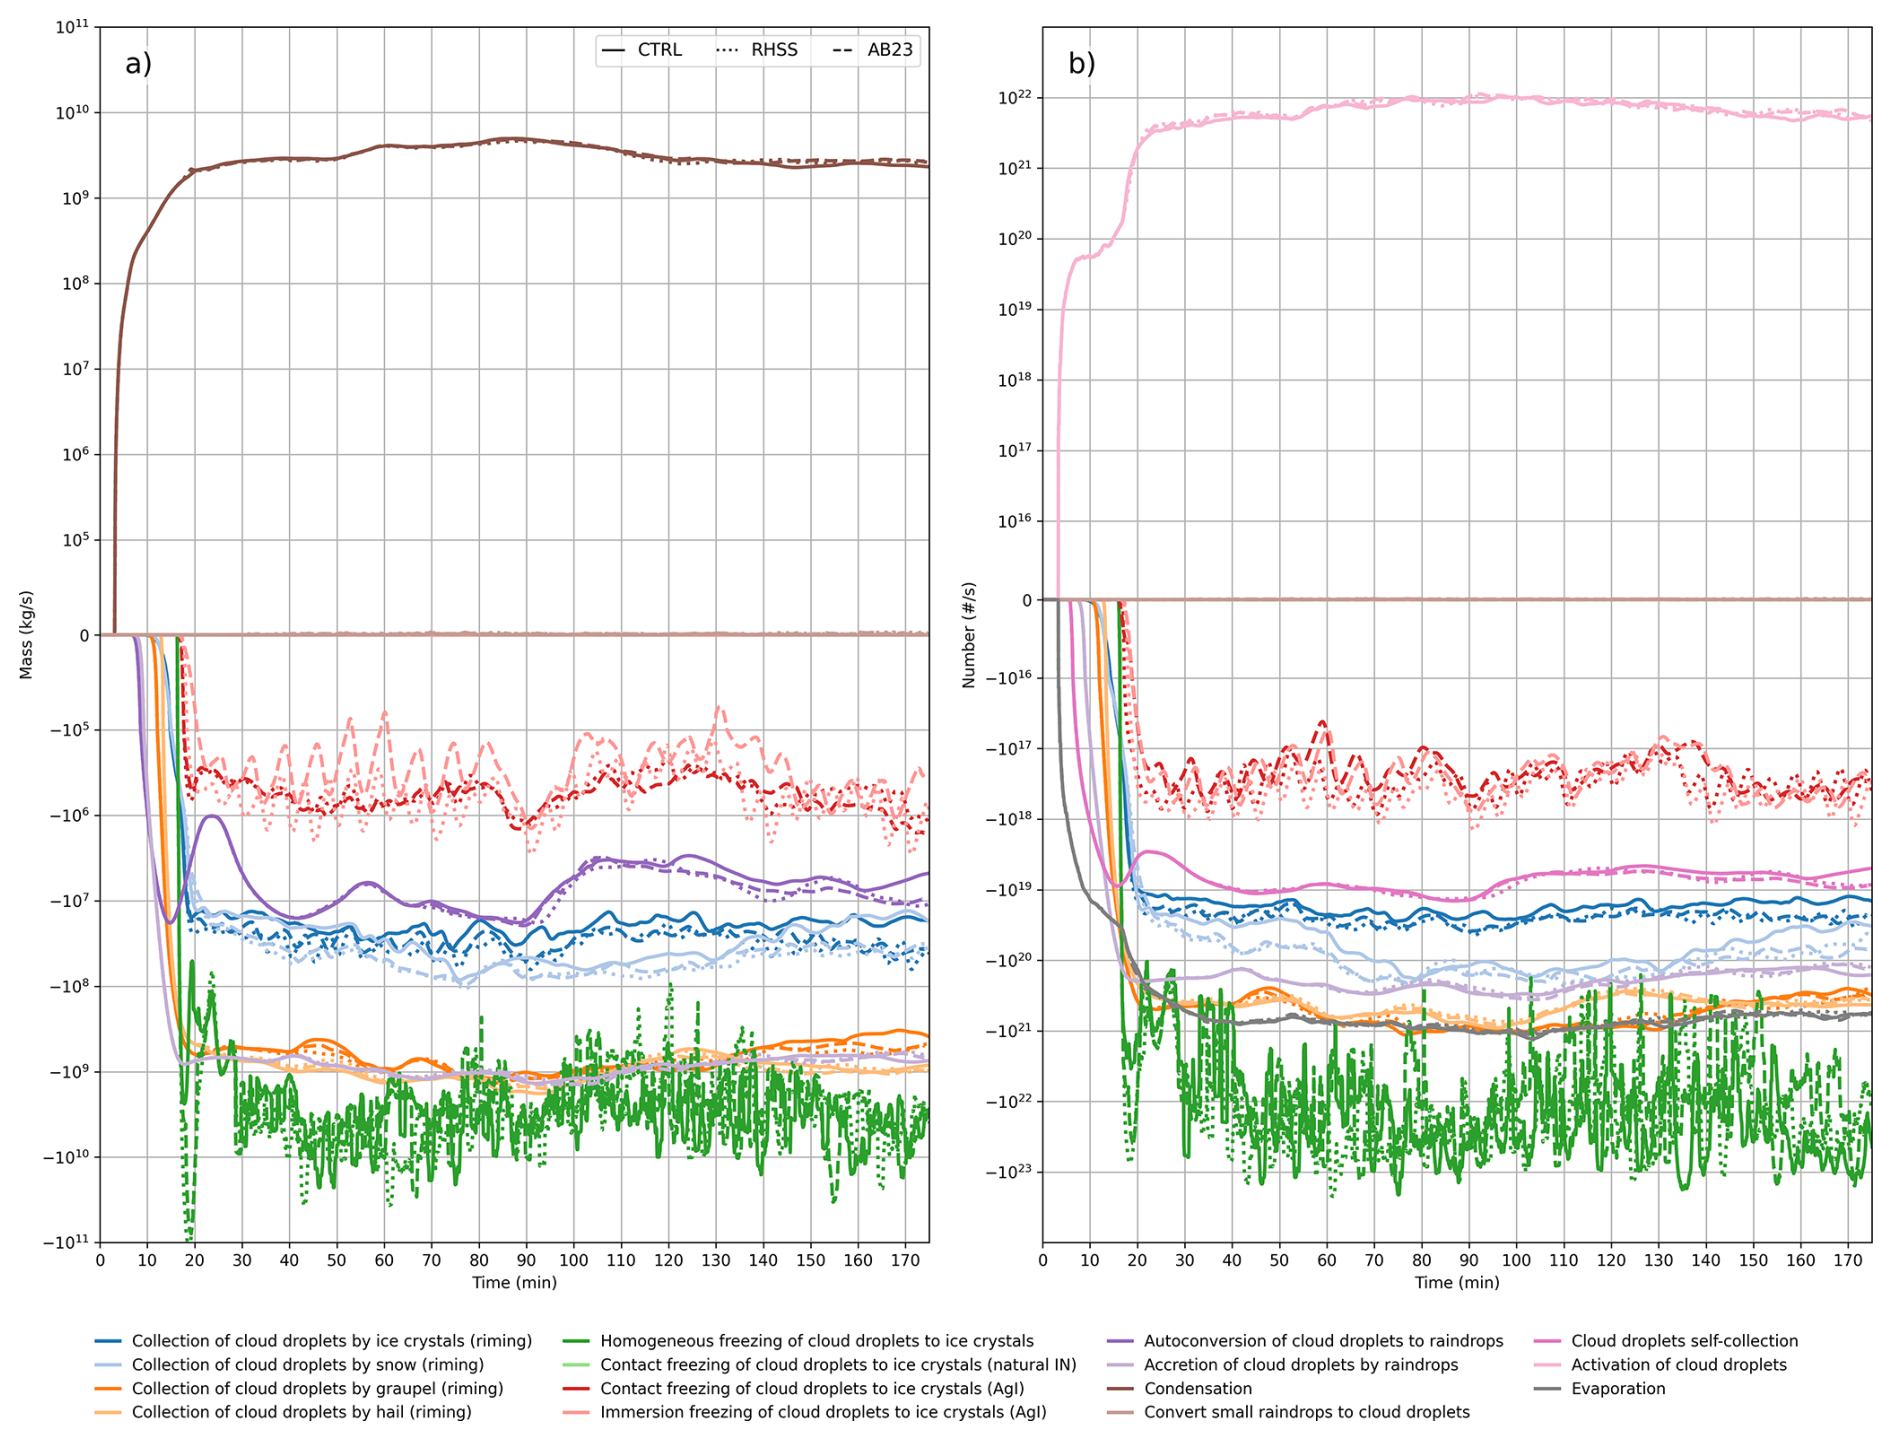
Figure 6The time series of source/sink terms for the cloud droplet total mass (a) and number (b) in the domain for CTRL (solid), RHSS (dotted) and AB23 (dashed) cases. Different microphysical processes are depicted with different colors indicated in the figure's legend at the bottom. The values of the quantities are averaged over 1 min.
Freezing of cloud droplets, which introduces more ice particles into the seeding zone, also affects accretion processes. This is evident from the increased riming of ice crystals and snow (blue and light blue lines in Fig. 6, respectively). All these effects combined result in a decrease in the total mass of cloud droplets for the first 130 min (red lines, Fig. 5a). The conversion of small raindrops to cloud droplets is also increased due to seeding, indicating a reduction in raindrop size, but this process is negligible. Conversely, the autoconversion of cloud droplets to raindrops increased as well as a result of the seeding (purple lines in Fig. 6a).
Similar conclusions can be drawn by investigating the source and sink terms for the number of cloud droplets (Fig. 6b). The most visible effect of seeding lies in contact freezing (red lines in Fig. 6b), which shows a sharper response to seeding cycles compared to the mass of cloud droplets. This can be partially explained by the fact that more numerous, small droplets collect APs more efficiently, making the number of droplets more sensitive to this mechanism. This may seem paradoxical, considering that collection is proportional to droplet size and thus contact freezing, but a large number of small drops may dominate AP collection. This also coincides with the decrease in the number of droplets in Fig. 5b (red lines).
No significant difference in the effects on the cloud droplets is observed between the two seeding methods.
3.1.2 Raindrops response
Raindrops are also present in the seeding zone, alongside droplets, and they collect APs, which can activate as INs. Raindrops have a mass comparable to that of cloud droplets (Fig. 5a) but are much less numerous (Fig. 5b). This difference is evident when we examine the source and sink terms for the mass and number of raindrops (Fig. 7). Immersion freezing of raindrops (brown lines in Fig. 7) becomes a significant mass and number sink process, showing a similar step–like trend as for the droplets, especially for RHSS. In contrast, the effect of contact freezing on the mass of raindrops is negligible (light purple in Fig. 7a) compared to its effect on the total number (light purple in Fig. 7b).
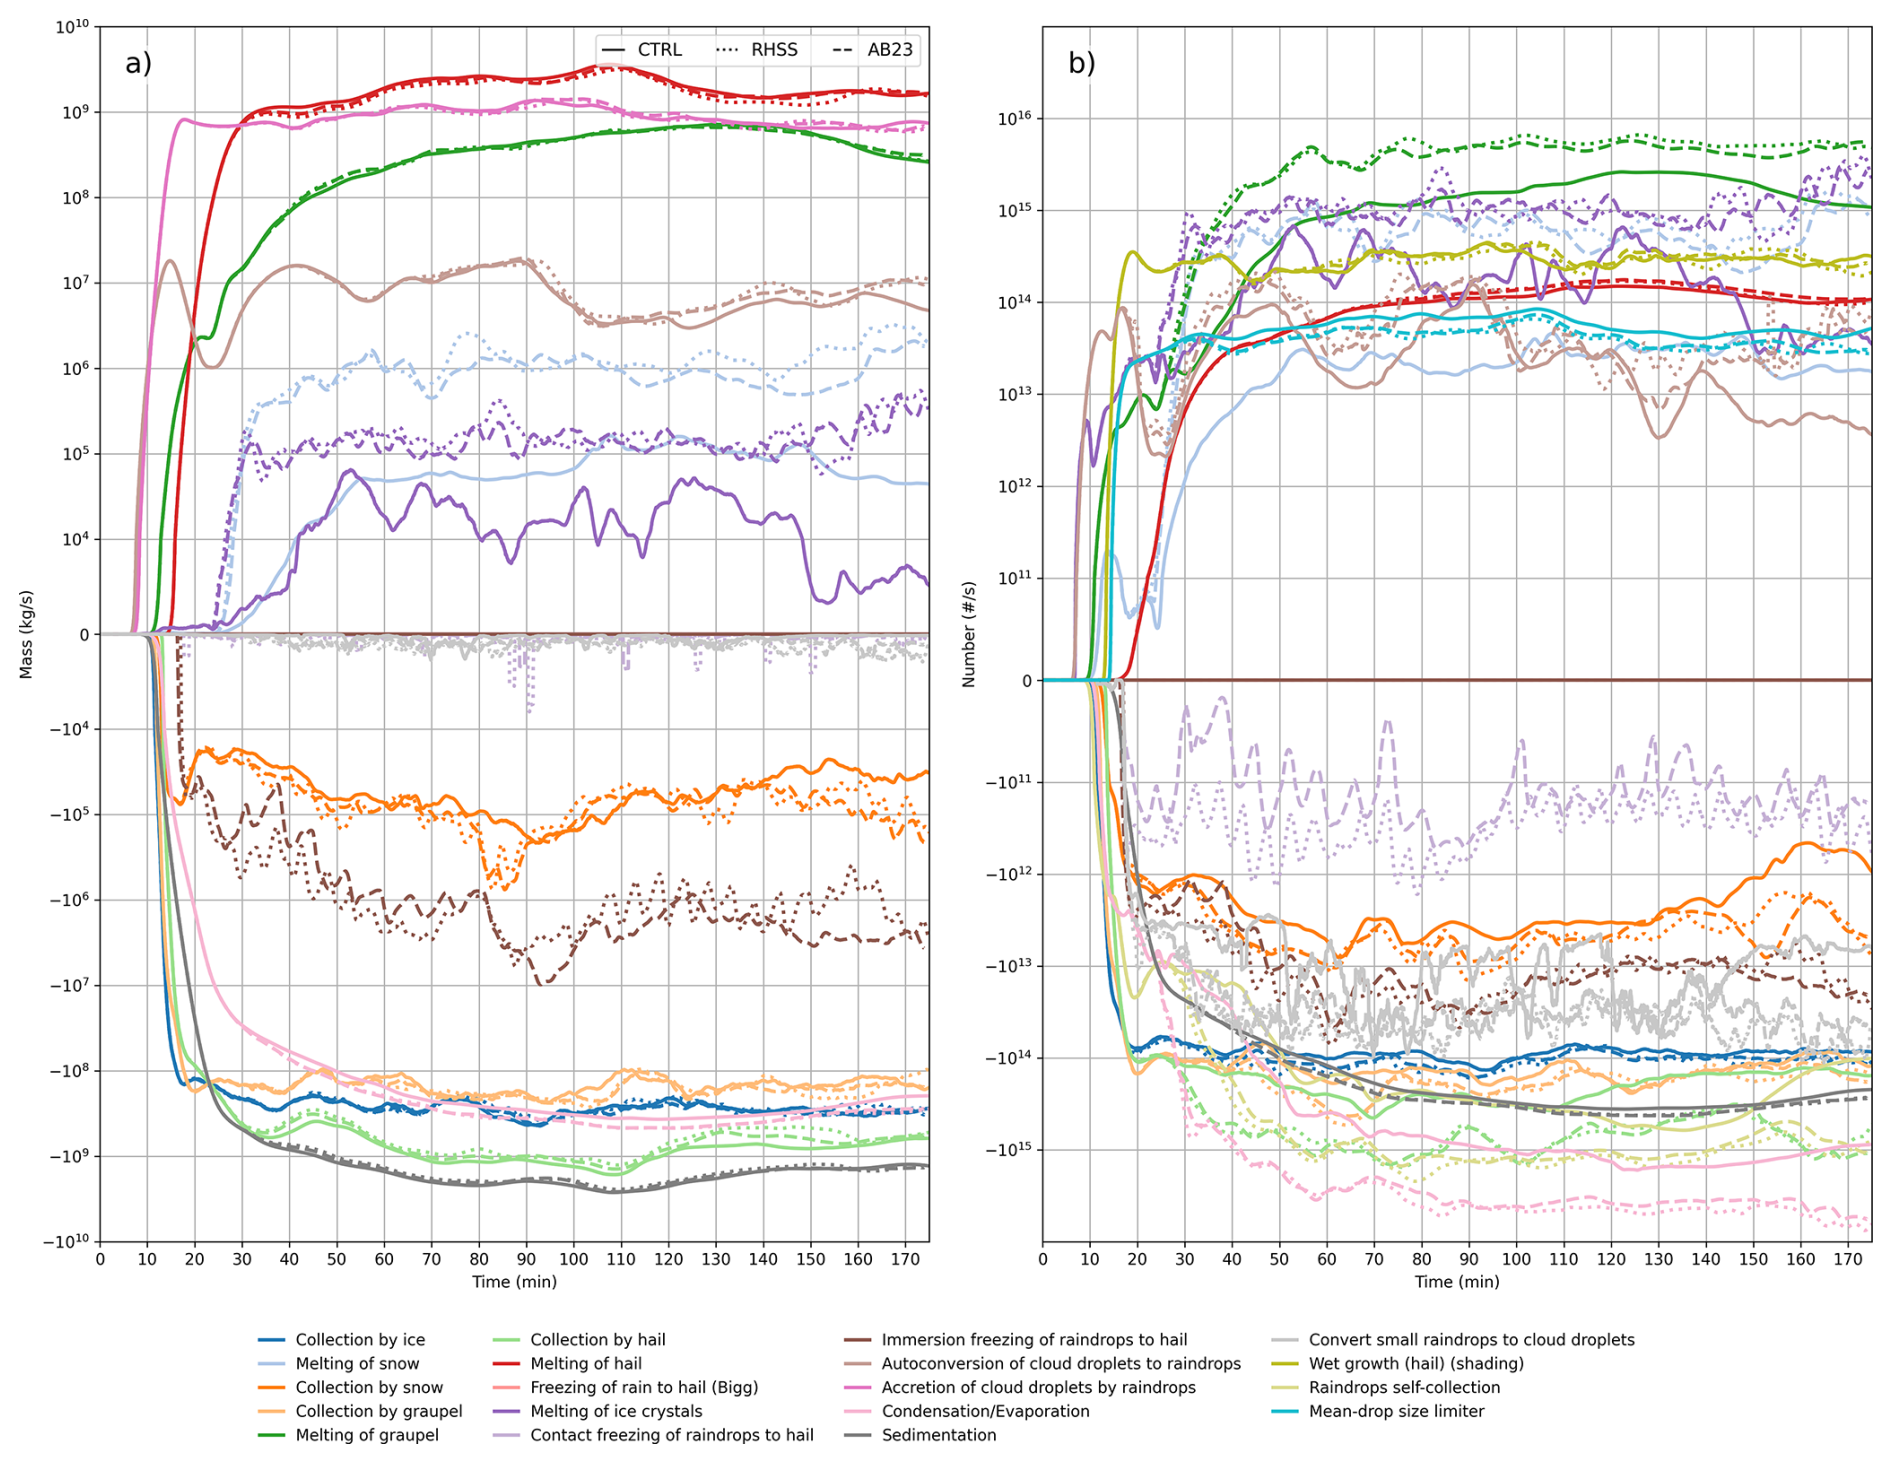
Figure 7The time series of source/sink terms for the raindrops total mass (a) and number (b) in the domain for CTRL (solid), RHSS (dotted) and AB23 (dashed) cases. Different microphysical processes are depicted with different colors indicated in the figure's legend at the bottom. The values of the quantities are averaged over 1 min.
Regarding sources, a significant increase is observed for the melting of snow and ice crystals (light blue and purple in Fig. 7, respectively) due to seeding, which is especially evident as a number source term. Furthermore, collection of raindrops by hail and melting of hail decreased (light green and red lines in Fig. 7, respectively) as a mass term but increased as a number term, especially for RHSS.
The effects of seeding are much more pronounced on the total number of raindrops (Fig. 5b) than on their mass (Fig. 5a). The increase in the total number of raindrops (Fig. 5b) can be attributed to a net increase primarily in the melting of snow (especially for RHSS) but also in graupel, ice crystals, and hail (light blue, green, purple, and red lines in Fig. 7b, respectively). Furthermore, an increase in collection processes by snow, graupel, and hail (orange, light orange and light green lines in Fig. 7b) is evident as the sink terms for raindrops number, as well as an evaporation (light pink lines in Fig. 7), especially in terms of the total number sink.
3.1.3 Cloud ice response
The presence of APs had no significant effect on the total cloud ice mass and number (Fig. 5), except for a brief period at the beginning of seeding, from 20 to 30 min, and around the 2.5 h mark. Depositional nucleation, contact freezing, and immersion freezing on AgI particles had the most pronounced effect on the total cloud ice mass and number (light blue, olive, and light olive lines in Fig. 8, respectively) and show comparable values. These processes lead to an increase in cloud ice riming (green line in Fig. 8a).
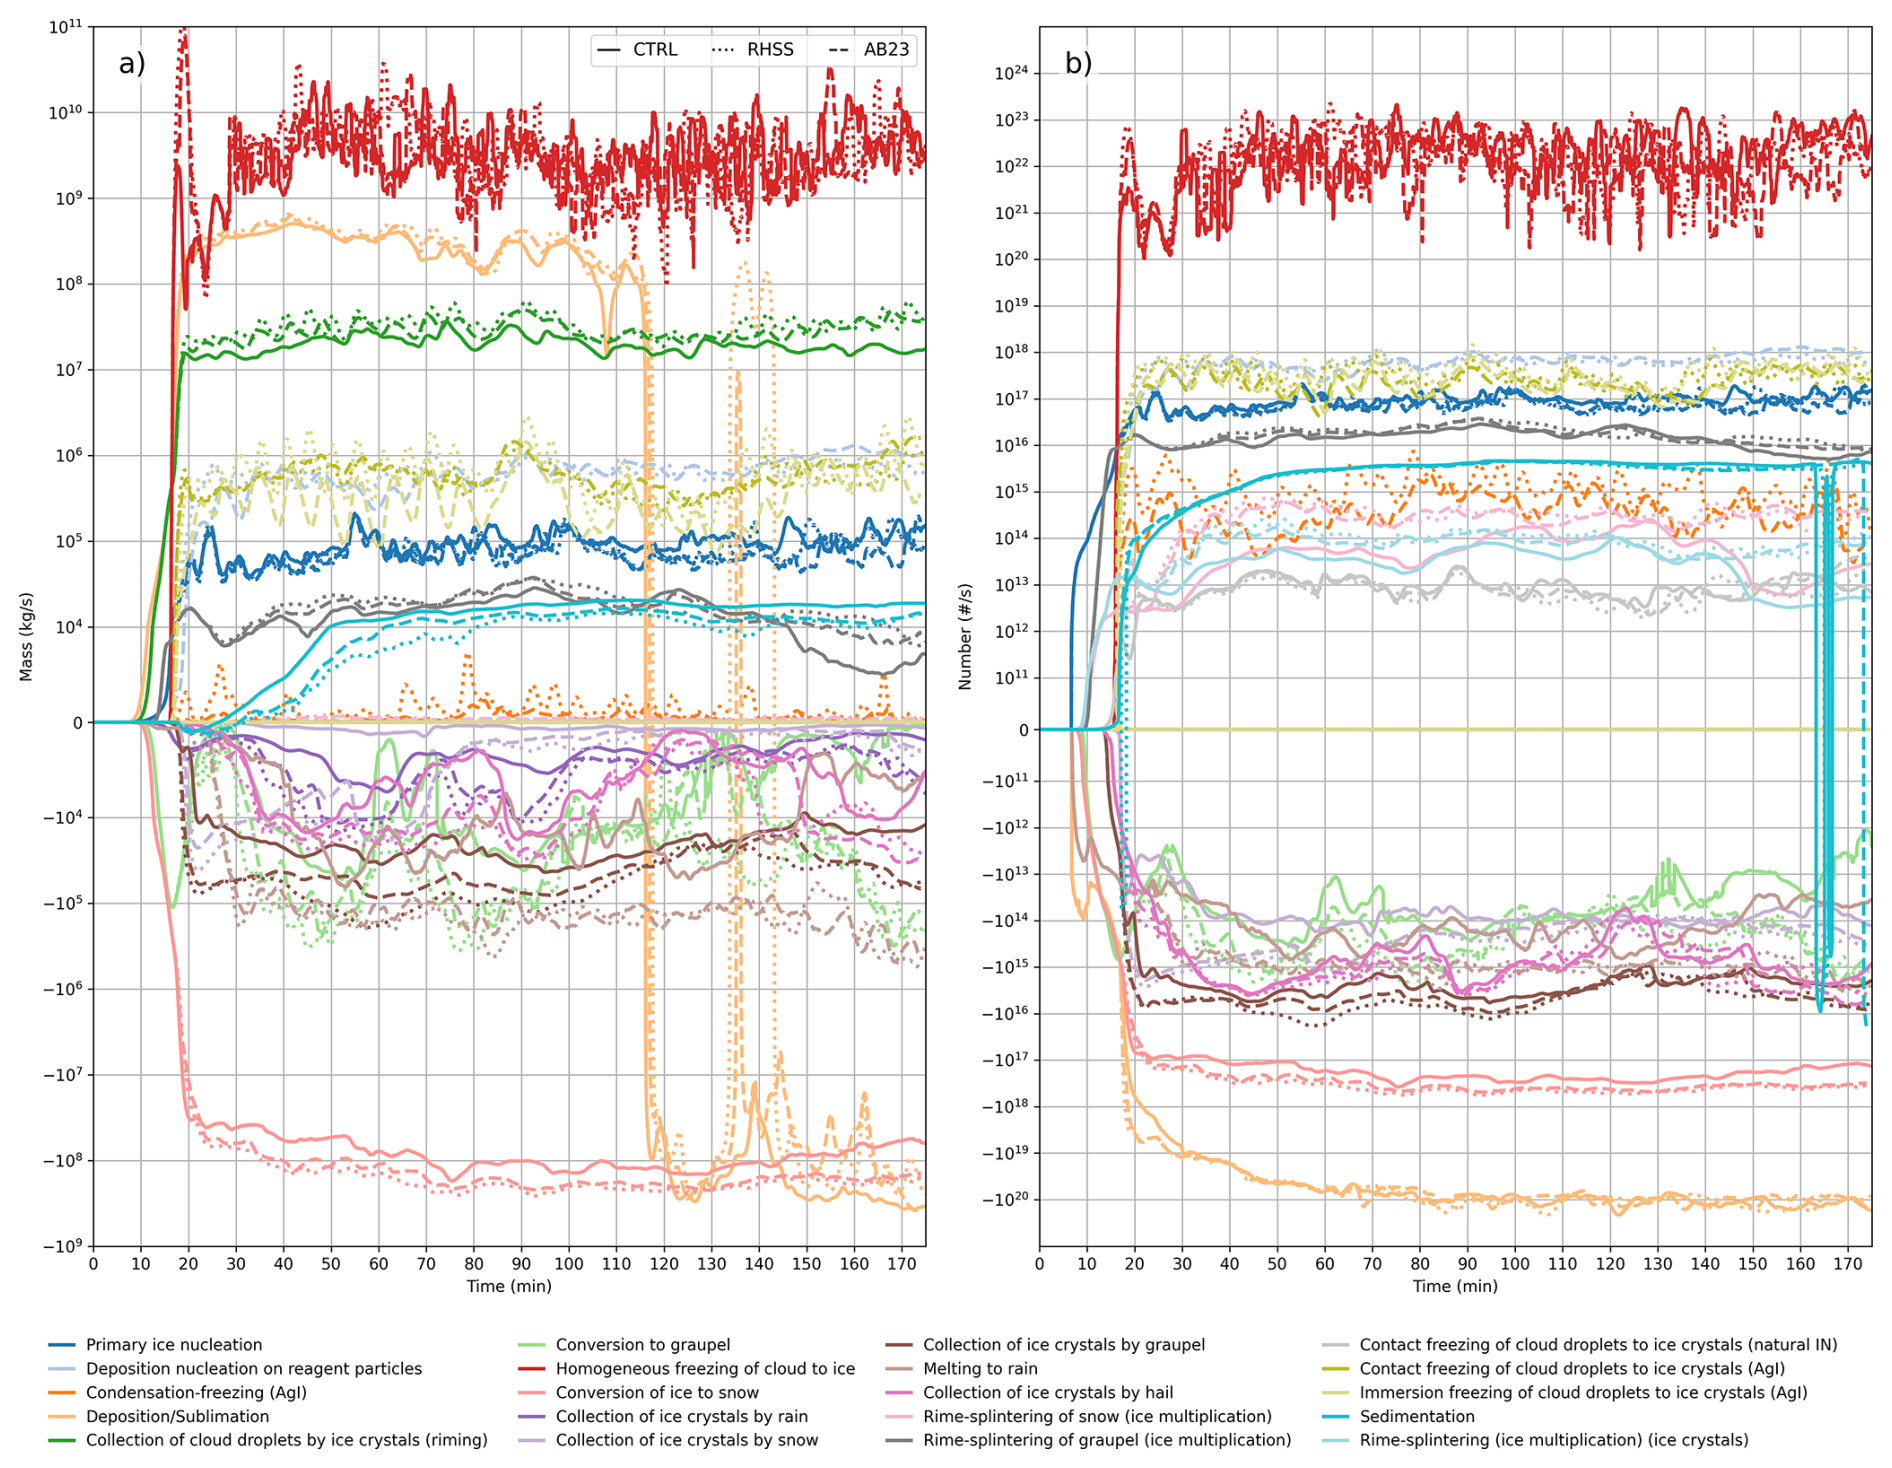
Figure 8The time series of source/sink terms for the cloud ice total mass (a) and number (b) in the domain for CTRL (solid), RHSS (dotted) and AB23 (dashed) cases. Different microphysical processes are depicted with different colors indicated in the figure's legend at the bottom. The values of the quantities are averaged over 1 min.
On the other hand, the collection of ice crystals by graupel and the conversion of ice to graupel and snow also increased significantly (brown, light green, and light red lines in Fig. 8, respectively). The increase in these processes is more pronounced for RHSS compared to AB23.
Condensation-freezing is negligible as a source of ice crystal mass but does affect ice crystal number (orange line in Fig. 8), especially for the RHSS experiment. However, it remains less significant than the other three nucleation modes. The increase in the source terms for cloud ice number appears to be balanced with the increase of sink terms such as conversion to snow, conversion to graupel, and collection by graupel (light red, light green, and brown lines in Fig. 8b) and therefore do not significantly change the total number in the domain (Fig. 5b).
3.1.4 Snow response
Snow responds most significantly to injected AgI particles in both total mass and number (Fig. 5), compared to other hydrometeors. Seeding increases the total mass and number within the domain throughout the entire integration period. Snow exhibits a more complex response with regard to seeding than hydrometeor categories previously investigated.
Three–component freezing refers to the interaction of three particle categories in cloud microphysics, where two categories combine to produce particles in a third category. The most important factor contributing to the increase in both total snow mass and number is the higher conversion of ice to snow (blue lines in Fig. 9). The second most significant snow source in terms of its number is snow riming (orange lines in Fig. 9b). Sink terms have also increased, particularly the melting of snow to rain (green lines in Fig. 9), as well as the collection of snow by rain and sedimentation (red and brown lines in Fig. 9, respectively). All of these processes are more pronounced in the case of RHSS.
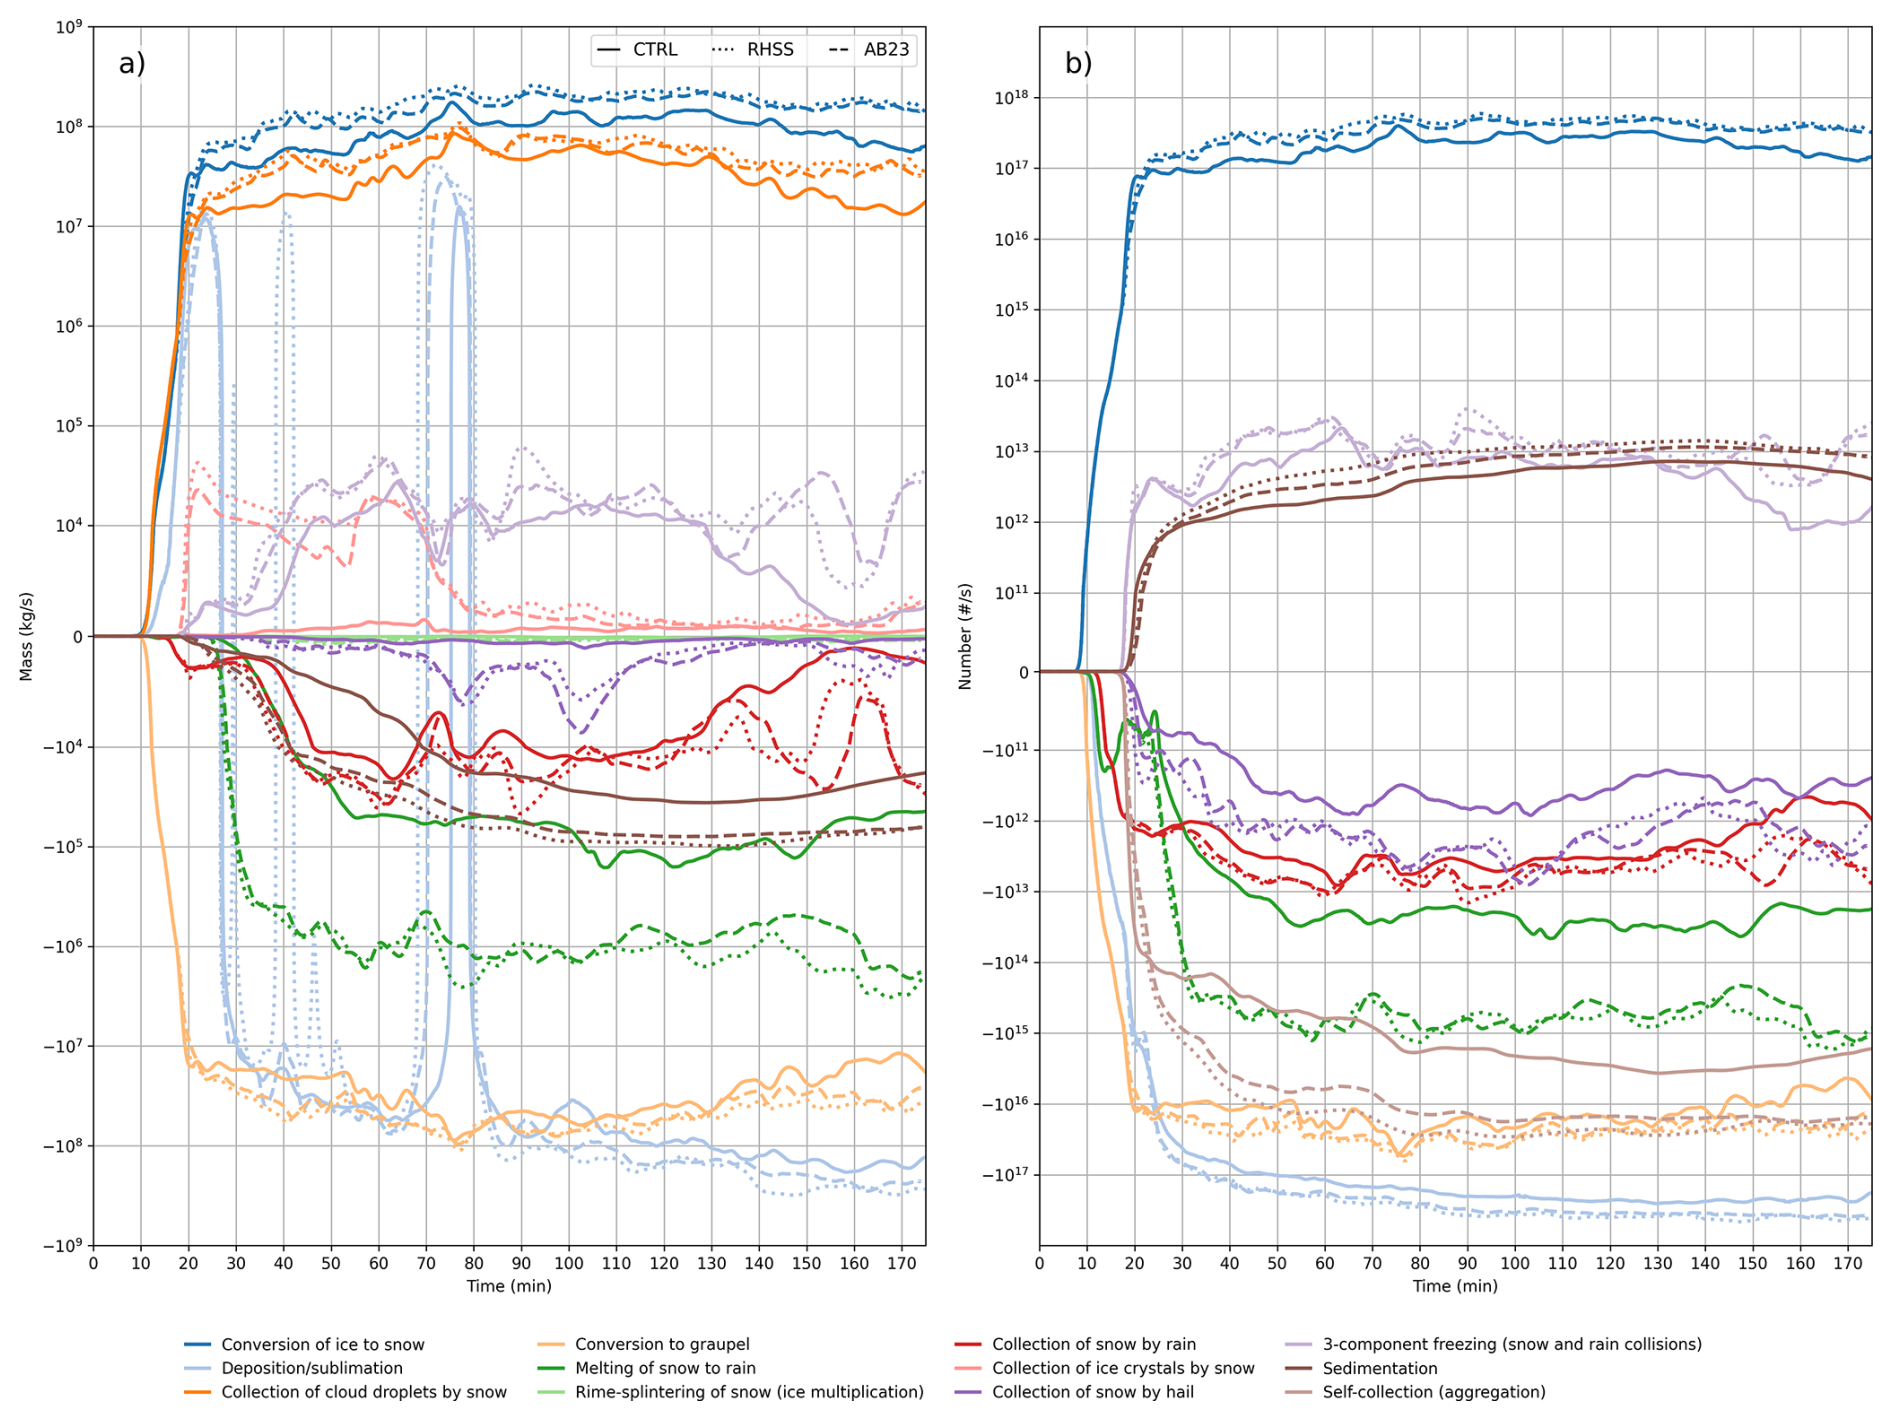
Figure 9The time series of source/sink terms for the snow total mass (a) and number (b) in the domain for CTRL (solid), RHSS (dotted) and AB23 (dashed) cases. Different microphysical processes are depicted with different colors indicated in the figure's legend at the bottom. The values of the quantities are averaged over 1 min.
As a result of a higher number of ice crystals, conversion of ice to snow increased (blue lines in Fig. 9) leads to a higher total number of snow particles (Fig. 5b). Conversely, an increased number of snow particles further enhances snow aggregation and melting of snow (light brown and green in Fig. 9).
3.1.5 Graupel response
The conversion of snow to graupel and riming (blue and orange lines in Fig. 10a, respectively) is an important mechanism for graupel mass production resulting from cloud seeding (Fig. 5a).
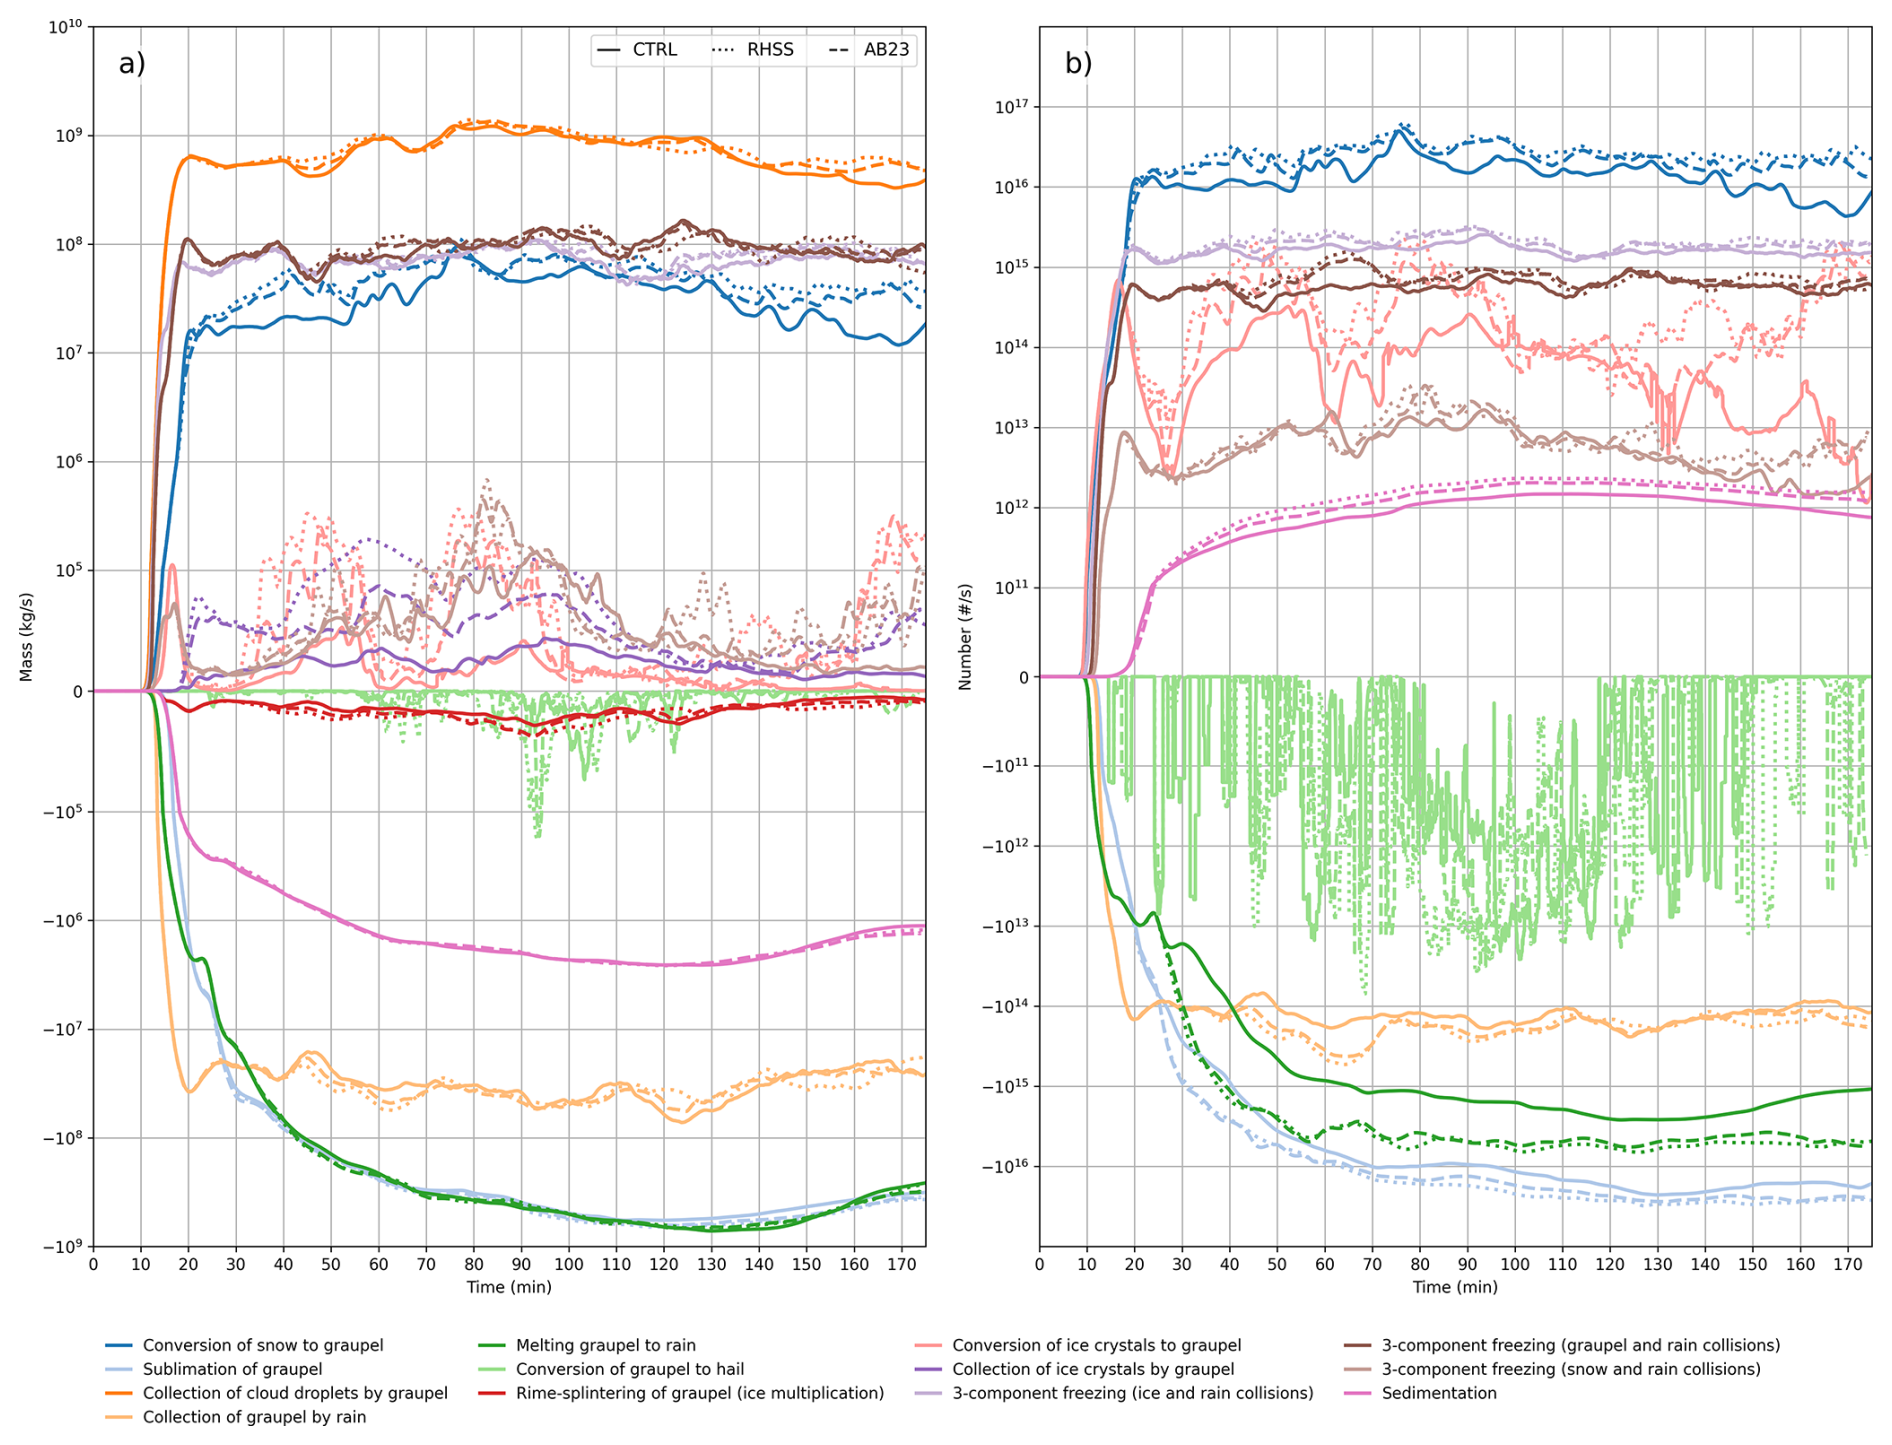
Figure 10The time series of source/sink terms for the graupel total mass (a) and number (b) in the domain for CTRL (solid), RHSS (dotted) and AB23 (dashed) cases. Different microphysical processes are depicted with different colors indicated in the figure's legend at the bottom. The values of the quantities are averaged over 1 min.
The same applies to the number of graupel particles (Figs. 10b and 5b). The largest responses were observed in the collection of ice crystals by graupel and the conversion of ice to graupel (purple and light red lines in Fig. 10a, respectively). This suggests that a relatively small change in abundant cloud ice may have a relatively large effect on other hydrometeors, particularly their number.
In the case of the total number, interaction among raindrops, cloud ice, snow, and graupel in the process of 3–component freezing also increased due to the presence of the APs (light purple, brown, and light brown lines in Fig. 10b). These processes have a greater influence on the number production of graupel compared to the mass. Furthermore, the two main sinks in graupel number, melting and sublimation (green and light blue in Fig. 10b, respectively), have also increased due to seeding.
3.1.6 Hail response
In this section, we finally examine in detail the effects of glaciogenic seeding on hail. Injected APs have produced a mixed effect on the total mass of hail (Fig. 5a) and a steady increase in the total number within the domain (Fig. 5b). The changes in microphysics due to glaciogenic seeding for hail mass and number are shown in Fig. 11a and b, respectively.
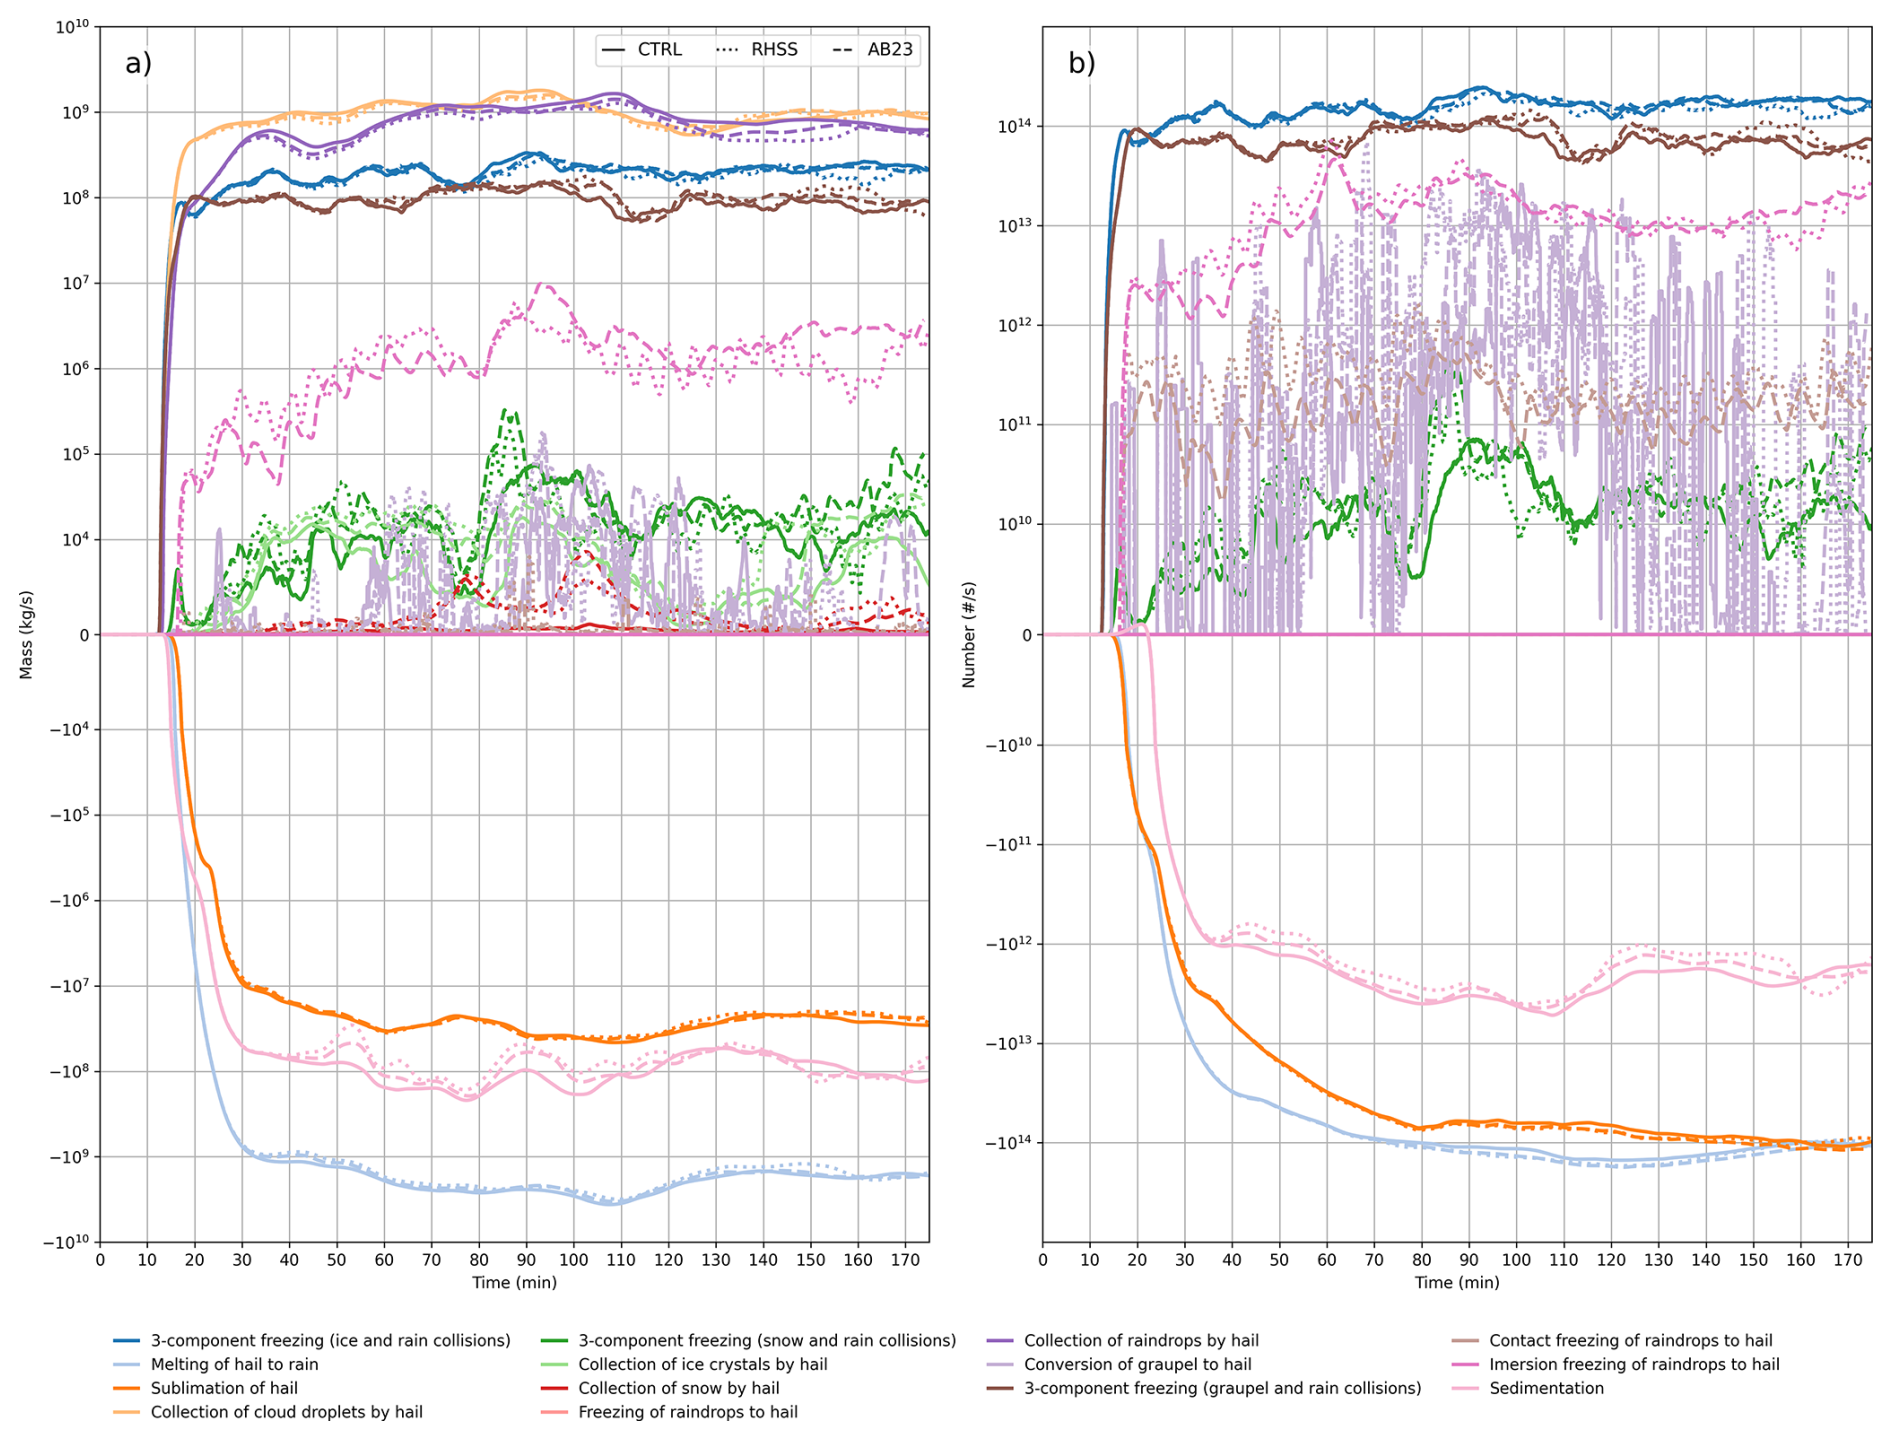
Figure 11The time series of source/sink terms for the hail total mass (a) and number (b) in the domain for CTRL (solid), RHSS (dotted) and AB23 (dashed) cases. Different microphysical processes are depicted with different colors indicated in the figure's legend at the bottom. The values of the quantities are averaged over 1 min.
If we disregard the processes with no clear response to seeding, that is, those with noise–like behaviour, we can draw several important conclusions about the effects of glaciogenic seeding:
-
Immersion freezing of raindrops is the most important process as a source of hail, especially in terms of its number. Although contact freezing is negligible as a source of hail mass, it is very important as a source of hail number. Both processes are having a similar effect in both methodologies.
-
Seeding caused a decrease in the melting of hail as a sink of hail mass and an increase in hail number, indicating a larger number of smaller hailstones. The decrease in mass is more significant in the case of RHSS.
-
Sublimation as a sink term also played a significant role by decreasing the hailstone number after seeding.
-
Due to the seeding, the collection of raindrops also undergoes a major decrease as a source term for the hail mass, especially for the RHSS.
-
Sedimentation as a sink term for both hail number and mass decreases significantly, indicating smaller hailstones. This decrease is larger for the RHSS.
-
Three-component freezing (graupel and rain collisions) increased as source terms for both mass and number of hailstones.
From a perspective of hail suppression, the change in hail mean diameter and its spatial distribution can be a valuable metric, where Qh and Nh are the hail mixing ratio [kg kg−1] and number concentration [m−3], respectively, ρa air density [kg m−3], and ρh=900 kg m−3 hail density.
The impact of glaciogenic seeding on the mean diameter of raindrops and hail, averaged over the entire domain for both RHSS and AB23 methodologies, is shown in Fig. 12 (left y-axis). Introducing AgI particles clearly affects the mean hail diameter, causing a decrease during the first 2 h for both methods. After 130 min, this effect becomes less distinct. An even larger decrease in the mean raindrop diameter is evident, especially in the first 30 min after seeding initiation. This reduction in mean raindrop diameter can be attributed to increased melting of ice, snow, and graupel, which significantly raises the number of raindrops and thus decreases the mean diameter. Note that this represents the mean hail diameter calculated in a bulk microphysical model; consequently, these values are substantially smaller than 5 mm in diameter, which is a commonly used lower threshold for defining hail (Straka, 2009; Lohmann et al., 2016).
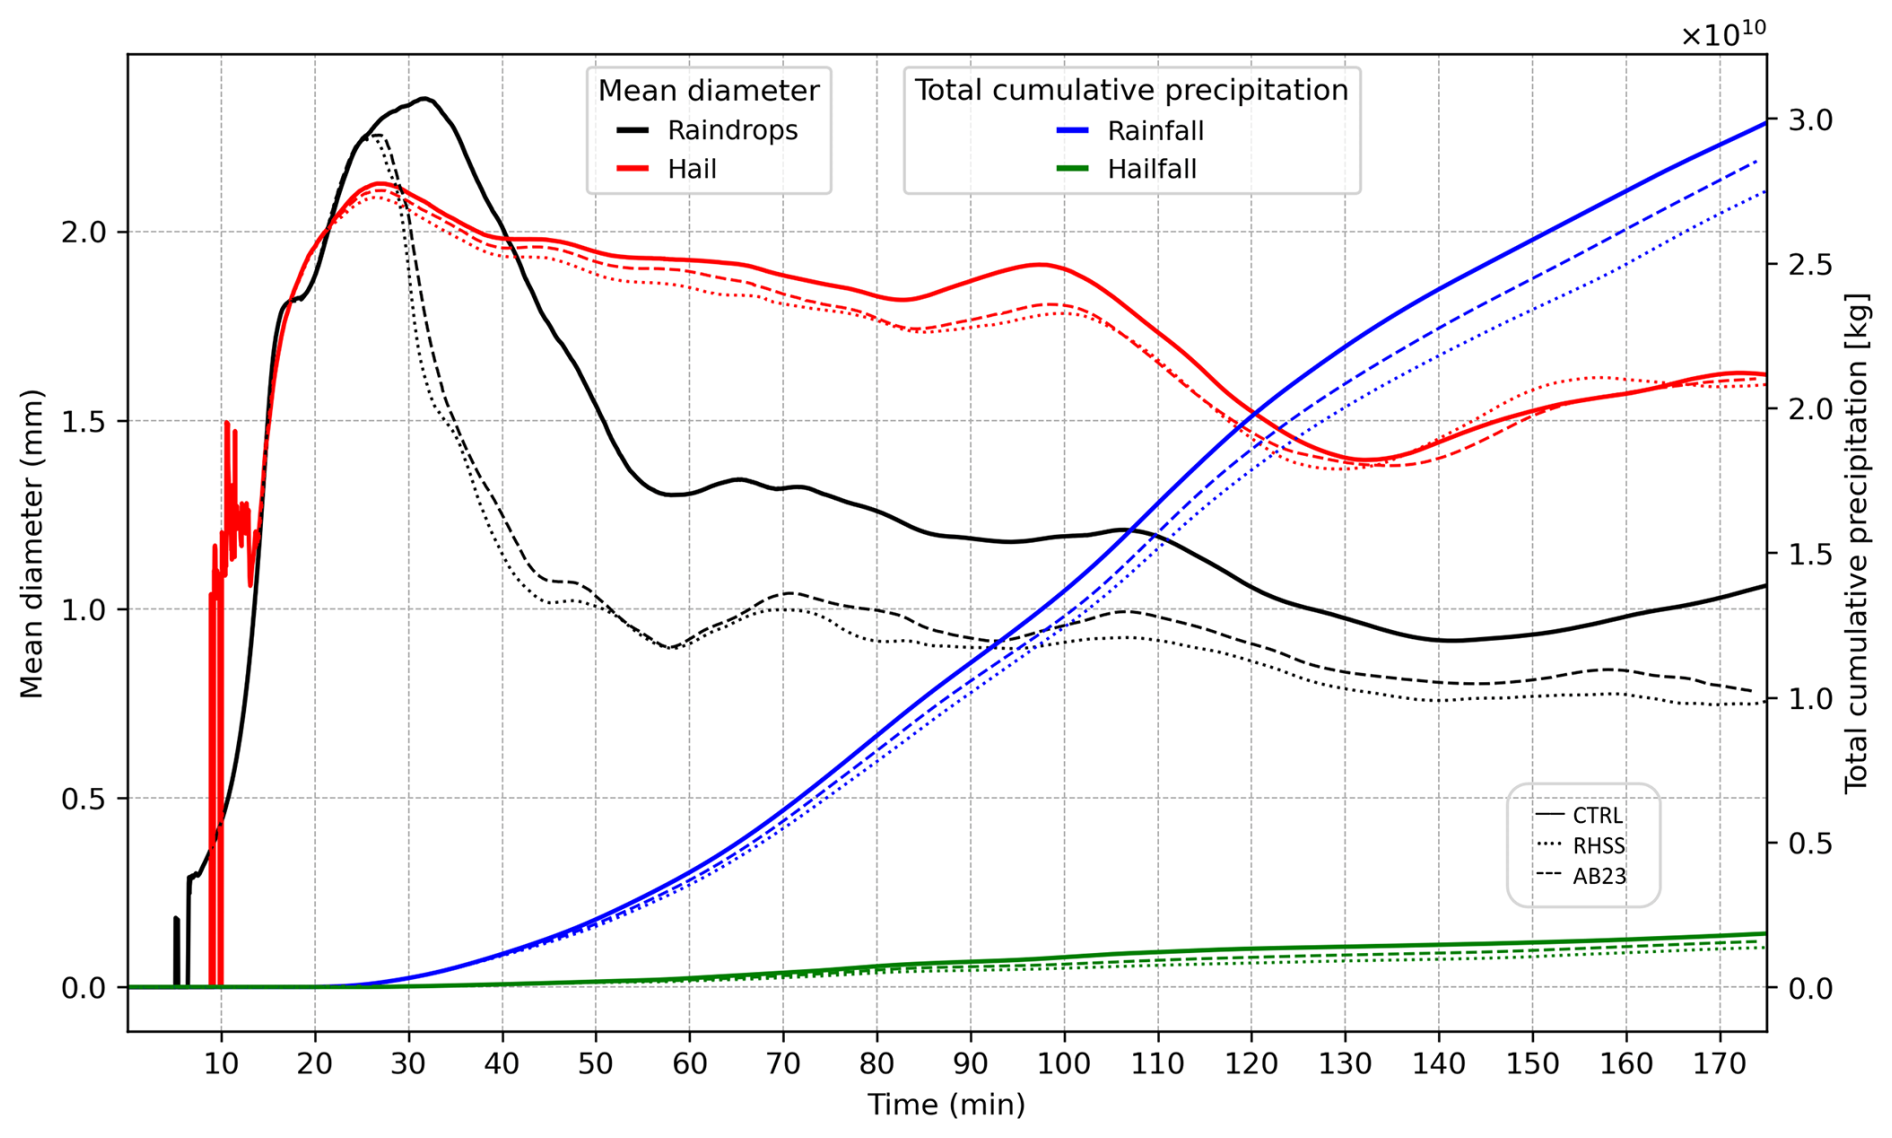
Figure 12Time series of the mean diameter (mm) of raindrops (black) and hailstones (red), averaged over the entire model domain (left y-axis), for the CTRL (solid), RHSS (dotted), and AB23 (dashed) experiments. The total cumulative precipitation (kg) for rainfall (blue) and hailfall (green) is shown on the right y-axis.
The total cumulative precipitation of rainfall (blue lines) and hailfall (green lines) are also shown in Fig. 12 for all three experiments. Rainfall decreased for both the RHSS and AB23 methodologies as a result of the reduction in raindrop diameter.
Total hailfall was reduced by 26.4 % and 14 % in the RHSS and AB23 experiments, respectively.
3.2 Ground–Level Hail Characteristics
Regarding hail–induced damage, surface hail characteristics are most important. In this section, we examine the influence of glaciogenic cloud seeding on hail characteristics at the surface.
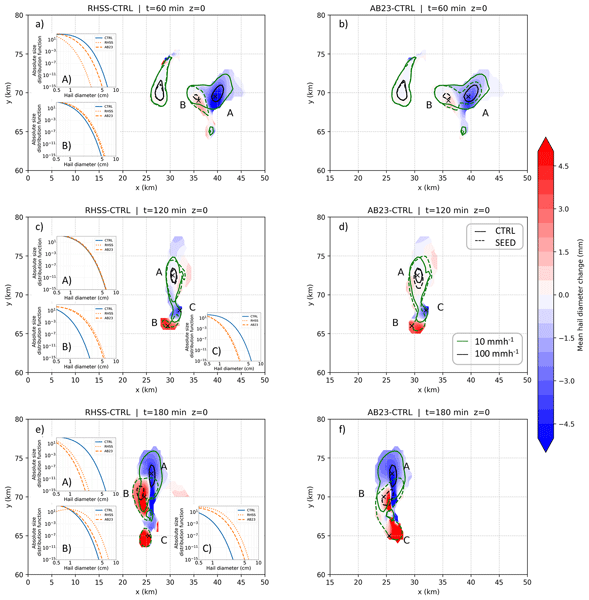
The most commonly used variable to assess the effectiveness of hail suppression is mean hail diameter (Papaevangelou et al., 2025, 2026). Figure 13 shows the change in mean hail diameter at the surface due to seeding for RHSS (a, c, and e) and AB23 (b, d, and f) at 60 min intervals. The change is shown only in grid boxes with a liquid equivalent hailfall rate greater than 1 mm h−1, to exclude irrelevant and artificial results caused by numerical reasons. Isolines of hailfall intensity of 10 and 100 mm h−1 are shown in green and black, respectively. The control experiment is plotted with a solid line, and RHSS and AB23 (SEED) with a dashed line. To provide more detail, we present the size distribution of hail for several grid boxes within characteristic regions (marked with an x and a capital letter). These grid boxes were selected to be as close as possible to the locations of the largest changes in mean diameter and the highest hailfall intensity.
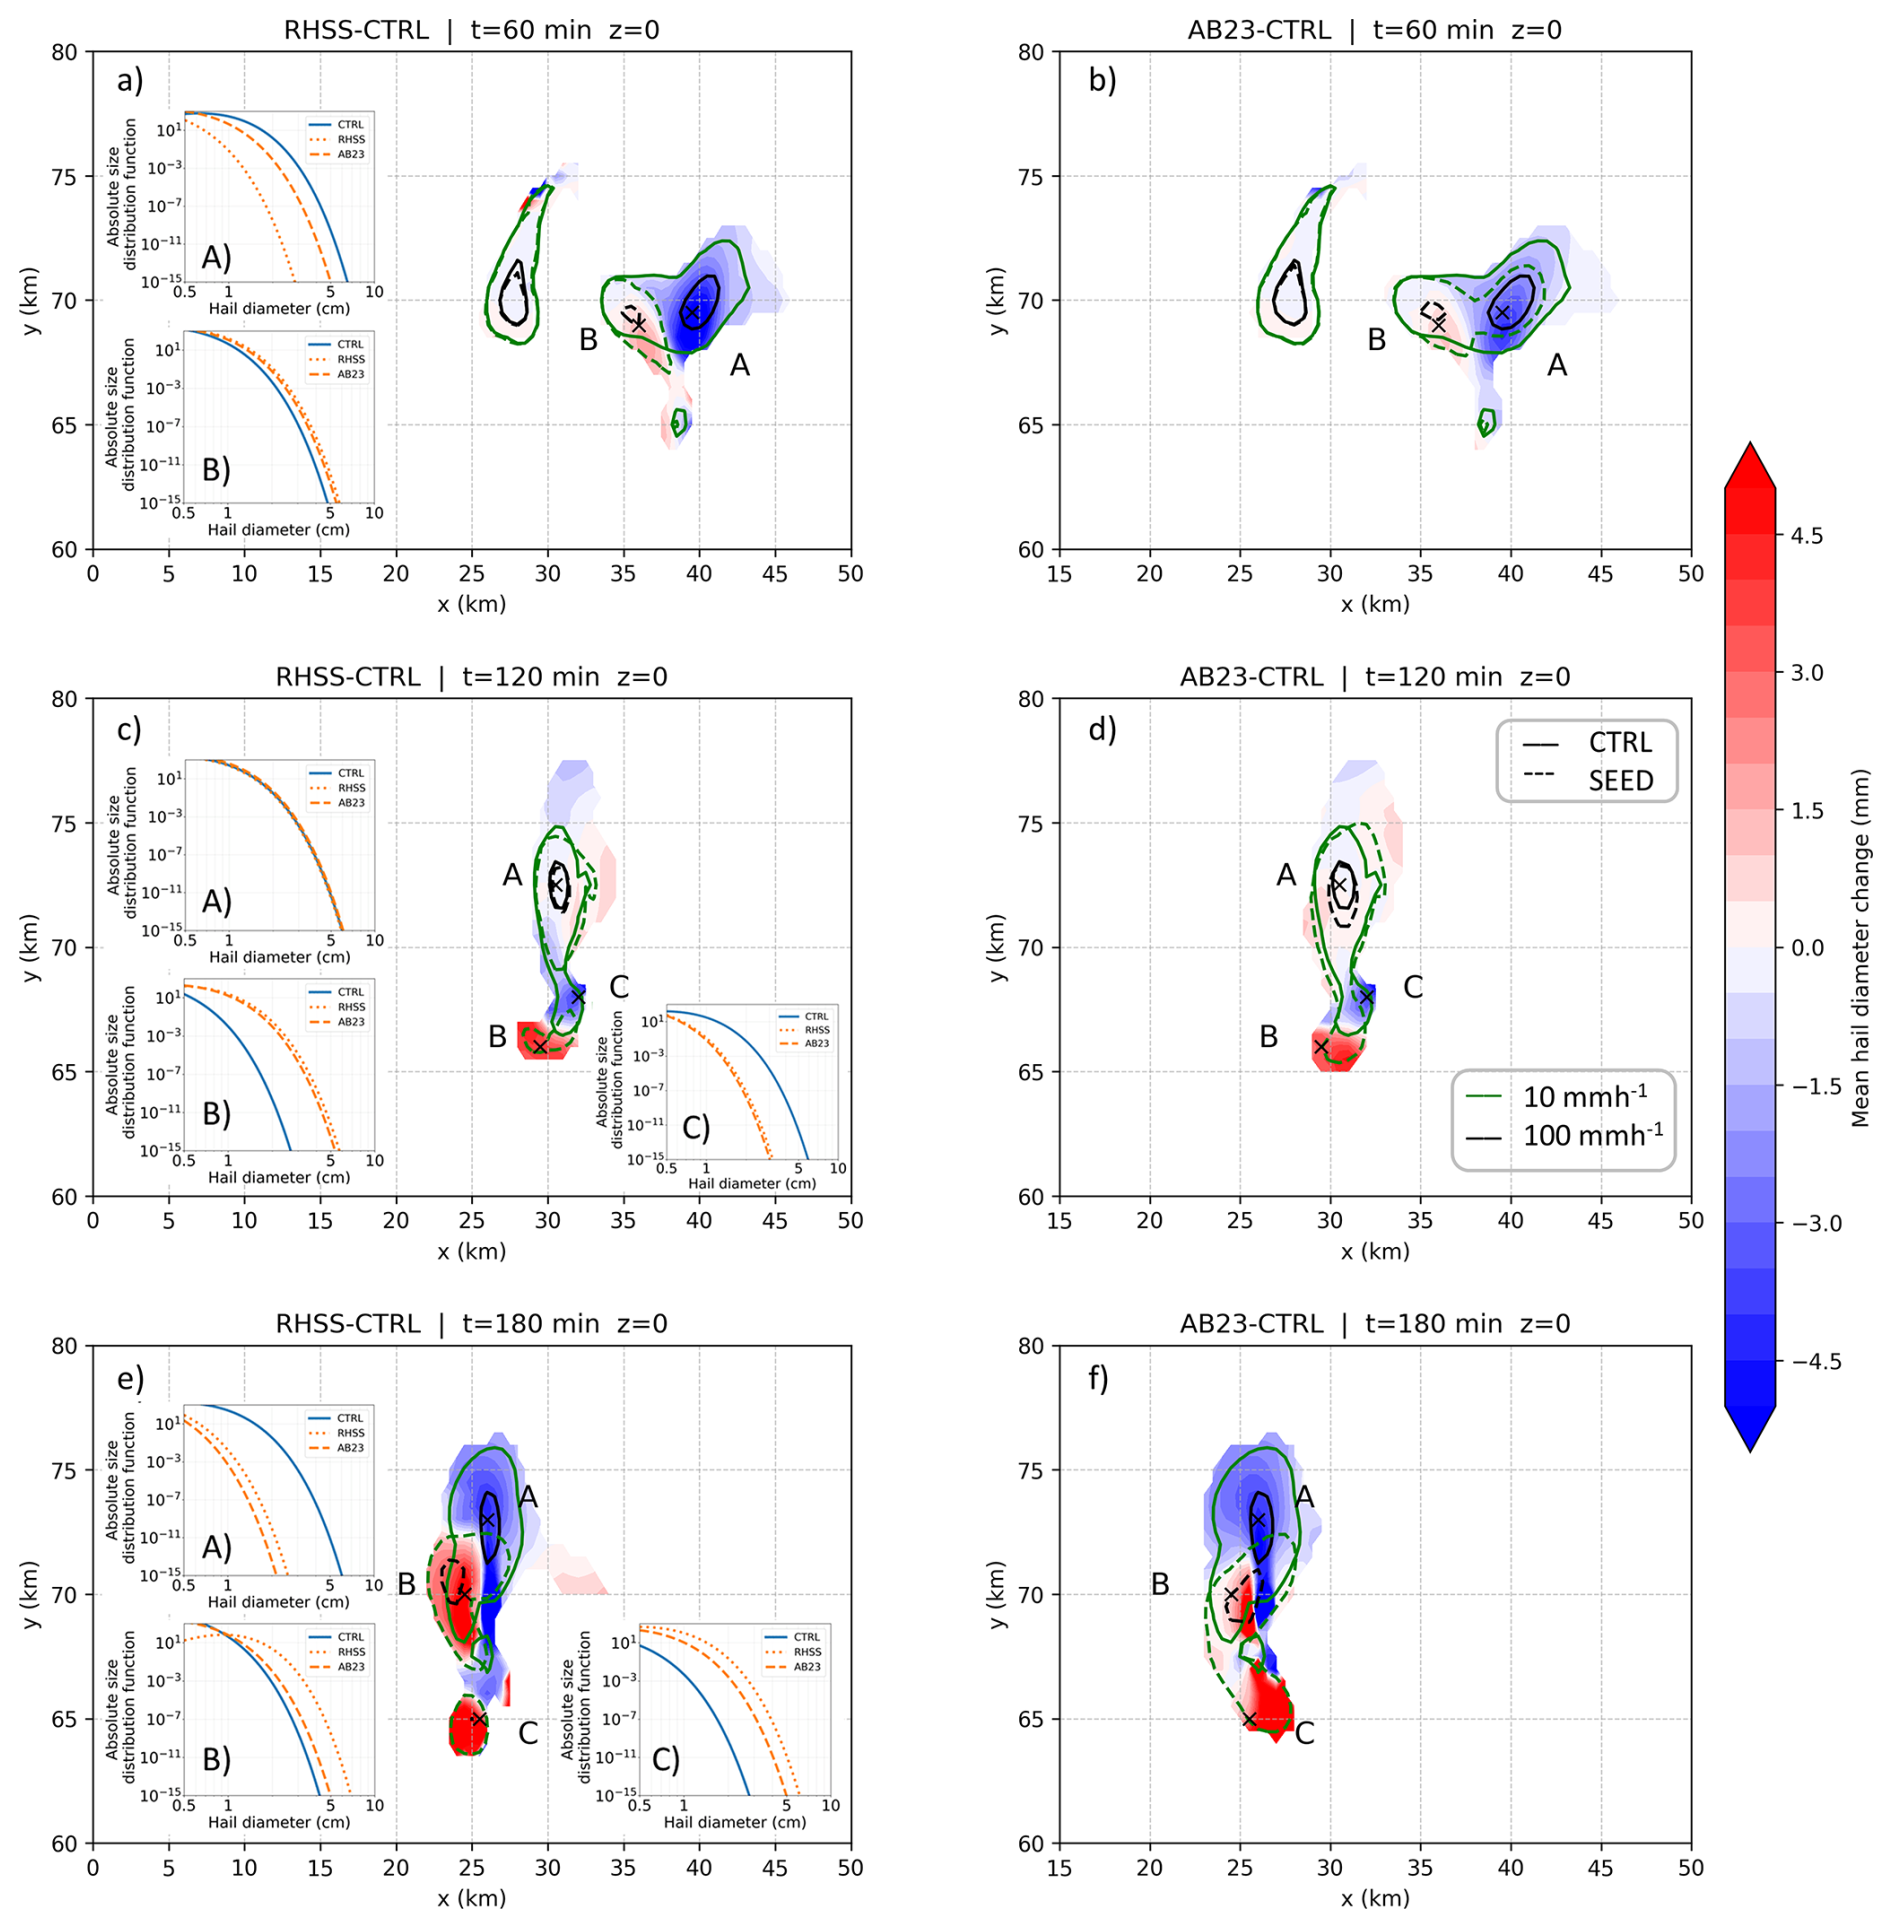
Figure 13Changes in mean hail diameter at the surface (mm) at 1 h (a, b), 2 h (c, d), and 3 h (e, f). The change is calculated by subtracting the CTRL mean hail diameter from that of each seeding methodology. RHSS is shown in the left panels (a, c, e), and AB23 in the right panels (b, d, f). Only grid boxes with liquid equivalent hailfall intensity greater than 1 mm h−1 are displayed. Isolines corresponding to hailfall intensities of 10 mm h−1 (green) and 100 mm h−1 (black) are shown as solid lines for the CTRL experiment and dashed lines for the seeded experiments (RHSS or AB23). Characteristic points of increase or decrease are marked by capital letters, for which the corresponding absolute hail size distributions [m−4] are shown in the inset panels (blue solid line for CTRL, orange dotted line for RHSS, and orange dashed line for AB23).
At 60 min (Fig. 13a and b), both methodologies show a significant decrease in the area with intense hailfall (>100 mm h−1) due to seeding. The left–moving cell, which was not seeded, experienced only a minor influence as a result of early seeding. The maxima in the decrease of hail mean diameter largely overlap with the reduction in the area of intense hailfall. Examining the size distribution of hail at point A, there is a significant decrease in the number of large hailstones (>2 cm), especially in the case of RHSS (by at least 8 orders of magnitude). Point B is characterised by an increase in large hailstones for both methodologies; however, the number of large hailstones in the seeding cases at point B remains smaller than in the CTRL case at point A. In both cases, seeding also caused the appearance of moderate hailfall (>10 mm h−1) in the south.
At 120 min (Fig. 13c and d), there is no significant change in the area of intense hailfall in the RHSS case, while a decrease is observed in AB23.
Additionally, almost the same size distribution is present at point A for all three experiments. In contrast, the most notable decrease in mean diameter around point C also coincides with a reduction in the number of large hailstones for both methodologies. The region of moderate hailfall further developed in the south due to the seeding. The seeding effect in this region is indicated by an increase in both the mean diameter of hailstones and the number of large hailstones. The size distribution of hail after seeding at point B is very similar to that of the CTRL case at point C.
At the end of the simulation (Fig. 13e and f), the most complex pattern is observed. The greatest decrease in mean hail diameter coincides with the most intense hailfall in the CTRL case. Seeding caused the disappearance of large hailstones at point A, where most large hailstones were present in the CTRL. At point A, the number of hailstones with a diameter of about 1 cm in the seeded cases is equal to the number of hailstones with a diameter of about 4 cm in the CTRL case. Conversely, it triggered an increase in large hailstones in the regions around points B and C.
This complex behavior of hail at the surface can be attributed to seeding-induced shifting, stretching, and shrinking of the hail mixing ratio and number concentration fields, resulting from a nonlinear microphysical response that alters the rates of growth and conversion processes, such as riming and accretion. These changes, in turn, modify the intensity and location of hail production regions. Continuous injection of seeding material clearly alters the hydrometeor fields, their spatial distribution, and the locations of their maxima. Thermodynamic effects also influence the storm's updraft. Changes in the updraft magnitude at a given time, as well as changes in the location and position of the updraft axis caused by seeding, can alter the hail distribution at the ground. Phenomena characterised with such a small spatial scale, such as hailfall, may be very sensitive to these changes.
Although examining the ground–level hail distribution is interesting, from the practical perspective of hail damage mitigation, it is more useful to consider integral quantities. For a given surface area covered by crops or infrastructure, in addition to hailstone size and concentration, the extent of hail damage also depends on the duration for which a given area is exposed to hailfall. As noted by Ursu et al. (2025), hail kinetic energy (KE) flux represents a suitable metric for damage assessment. It is considered that the threshold of 300 J m−2 of hail kinetic energy exposure identifies hail swaths with a high likelihood of crop damage. In Fig. 14, the hail kinetic energy flux, integrated over the entire time period (3 h), is shown in red. The thresholds of 300 and 100 J m−2 are indicated with orange and blue contours, respectively. The total KE flux exerted by this hailstorm (integrated over the entire surface) and the areas within these two thresholds are calculated and displayed in the figure titles for the cases of CTRL, RHSS and AB23 (Fig. 14a–c, respectively). Comparing these variables may provide insight into the effect that glaciogenic seeding has on hail mitigation.
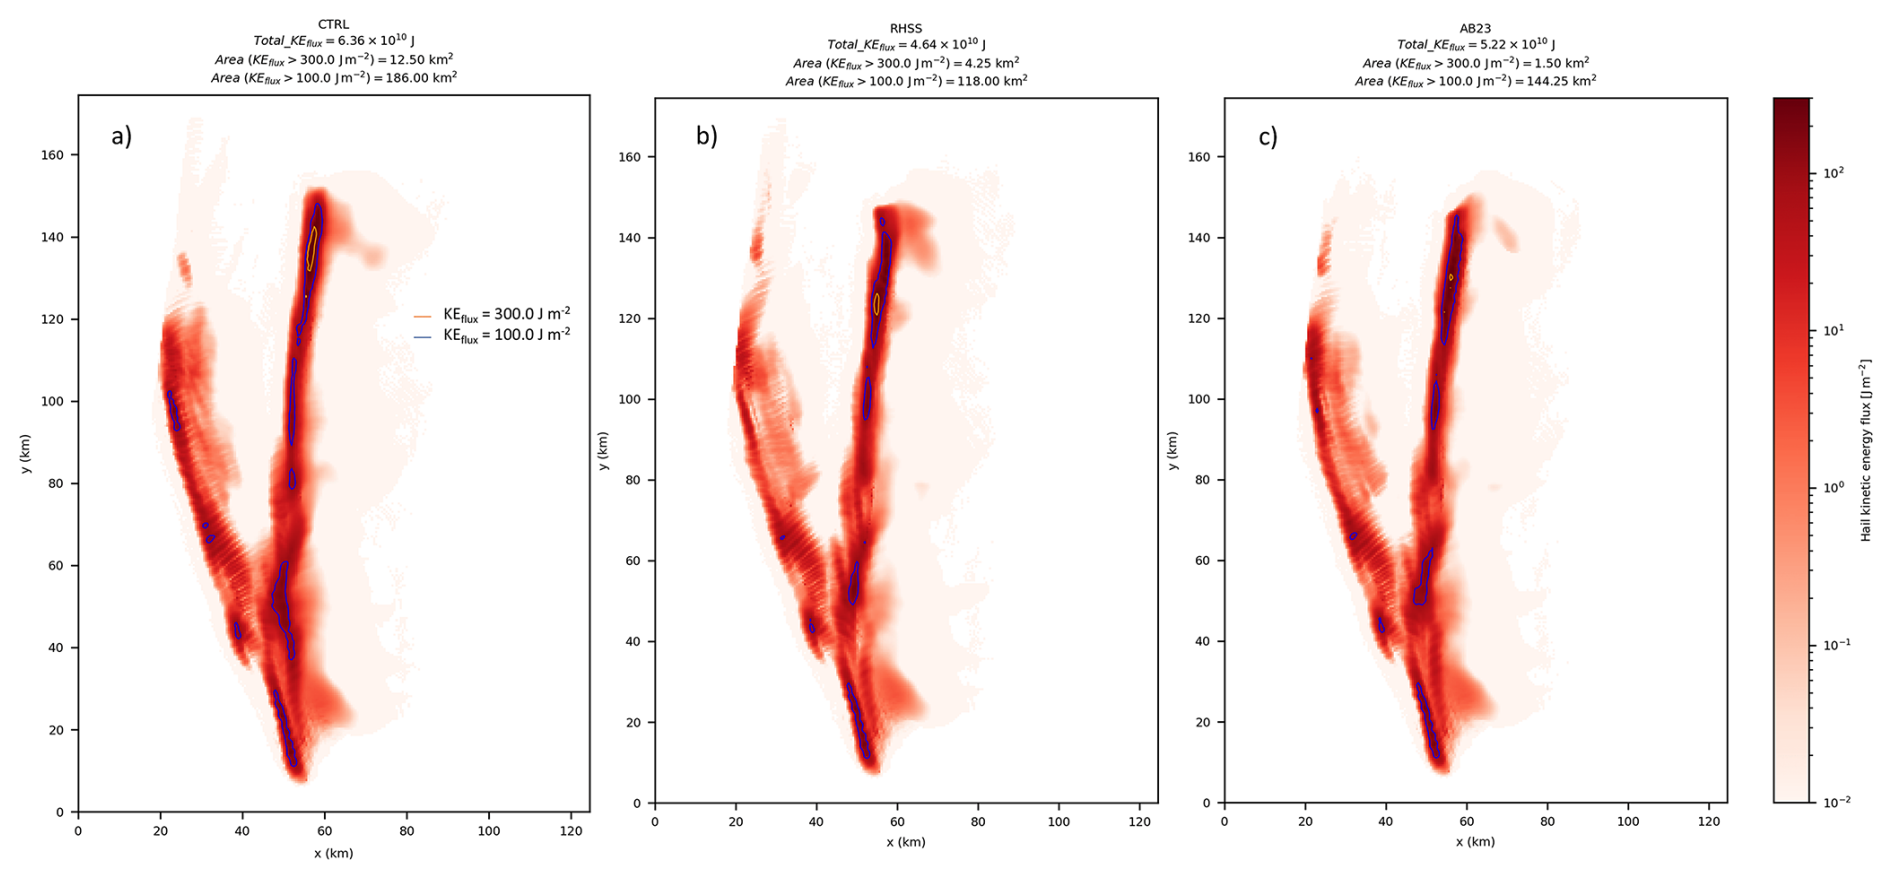
Figure 14Hail kinetic energy flux for the CTRL (a), RHSS (b), and AB23 (c) case integrated over the entire simulation period (red shading). Orange and blue contours denote values exceeding 300 and 100 J m−2, respectively. The domain–integrated total kinetic energy flux (3 h) and the areas exceeding these thresholds are reported in the figure title.
In the CTRL experiment, the hail exerted a total of 6.36×10¹⁰ J of KE during 3 h over the entire surface area. The surface area most impacted by hailfall (KEflux>300 J m−2) is 12.5 km2, and that with less potential for crop damage (KEflux>100 J m−2) is 186 km2. As can be seen from Table 4, all three quantities have decreased as a result of seeding.
Table 4Kinetic energy flux for different experiments. The changes of seeding cases compared to CTRL are given in brackets.

The total KEflux decreased by 27 % for the RHSS and 17.9 % for the AB23. The area of moderate hail kinetic energy (KEflux>100 J m−2) decreased approximately by the same amount for both methodologies, 36.6 % and 38.6 % for the RHSS and the AB23, respectively. Furthermore, the area with hailfall that has the most potential to cause damage (KEflux>300 J m−2) decreased significantly. This decrease is 66 % in the case of RHSS and 88 % for AB23. The data presented here are consistent with the beneficial competition hypothesis for hail suppression, in that glaciogenic seeding reduces its most extreme impacts but does not have such a large effect on overall hailfall.
3.3 Statistical Significance of Seeding Effects
Given the chaotic nature and pronounced variability of convective clouds, it is useful to analyse the data statistically. Figure 15 shows vertical profiles of mixing ratio (blue) and number concentration (red) for each hydrometeor category (rows) at 30 min intervals (columns). Solid lines represent the mean CTRL experiment data, while dotted and dashed lines correspond to RHSS and AB23, respectively. The ±1σ (standard deviation) range for CTRL is shown by blue and red shading. The profile values are calculated by applying the mixing ratio mask Qx>0.1 g kg−1 for each category.
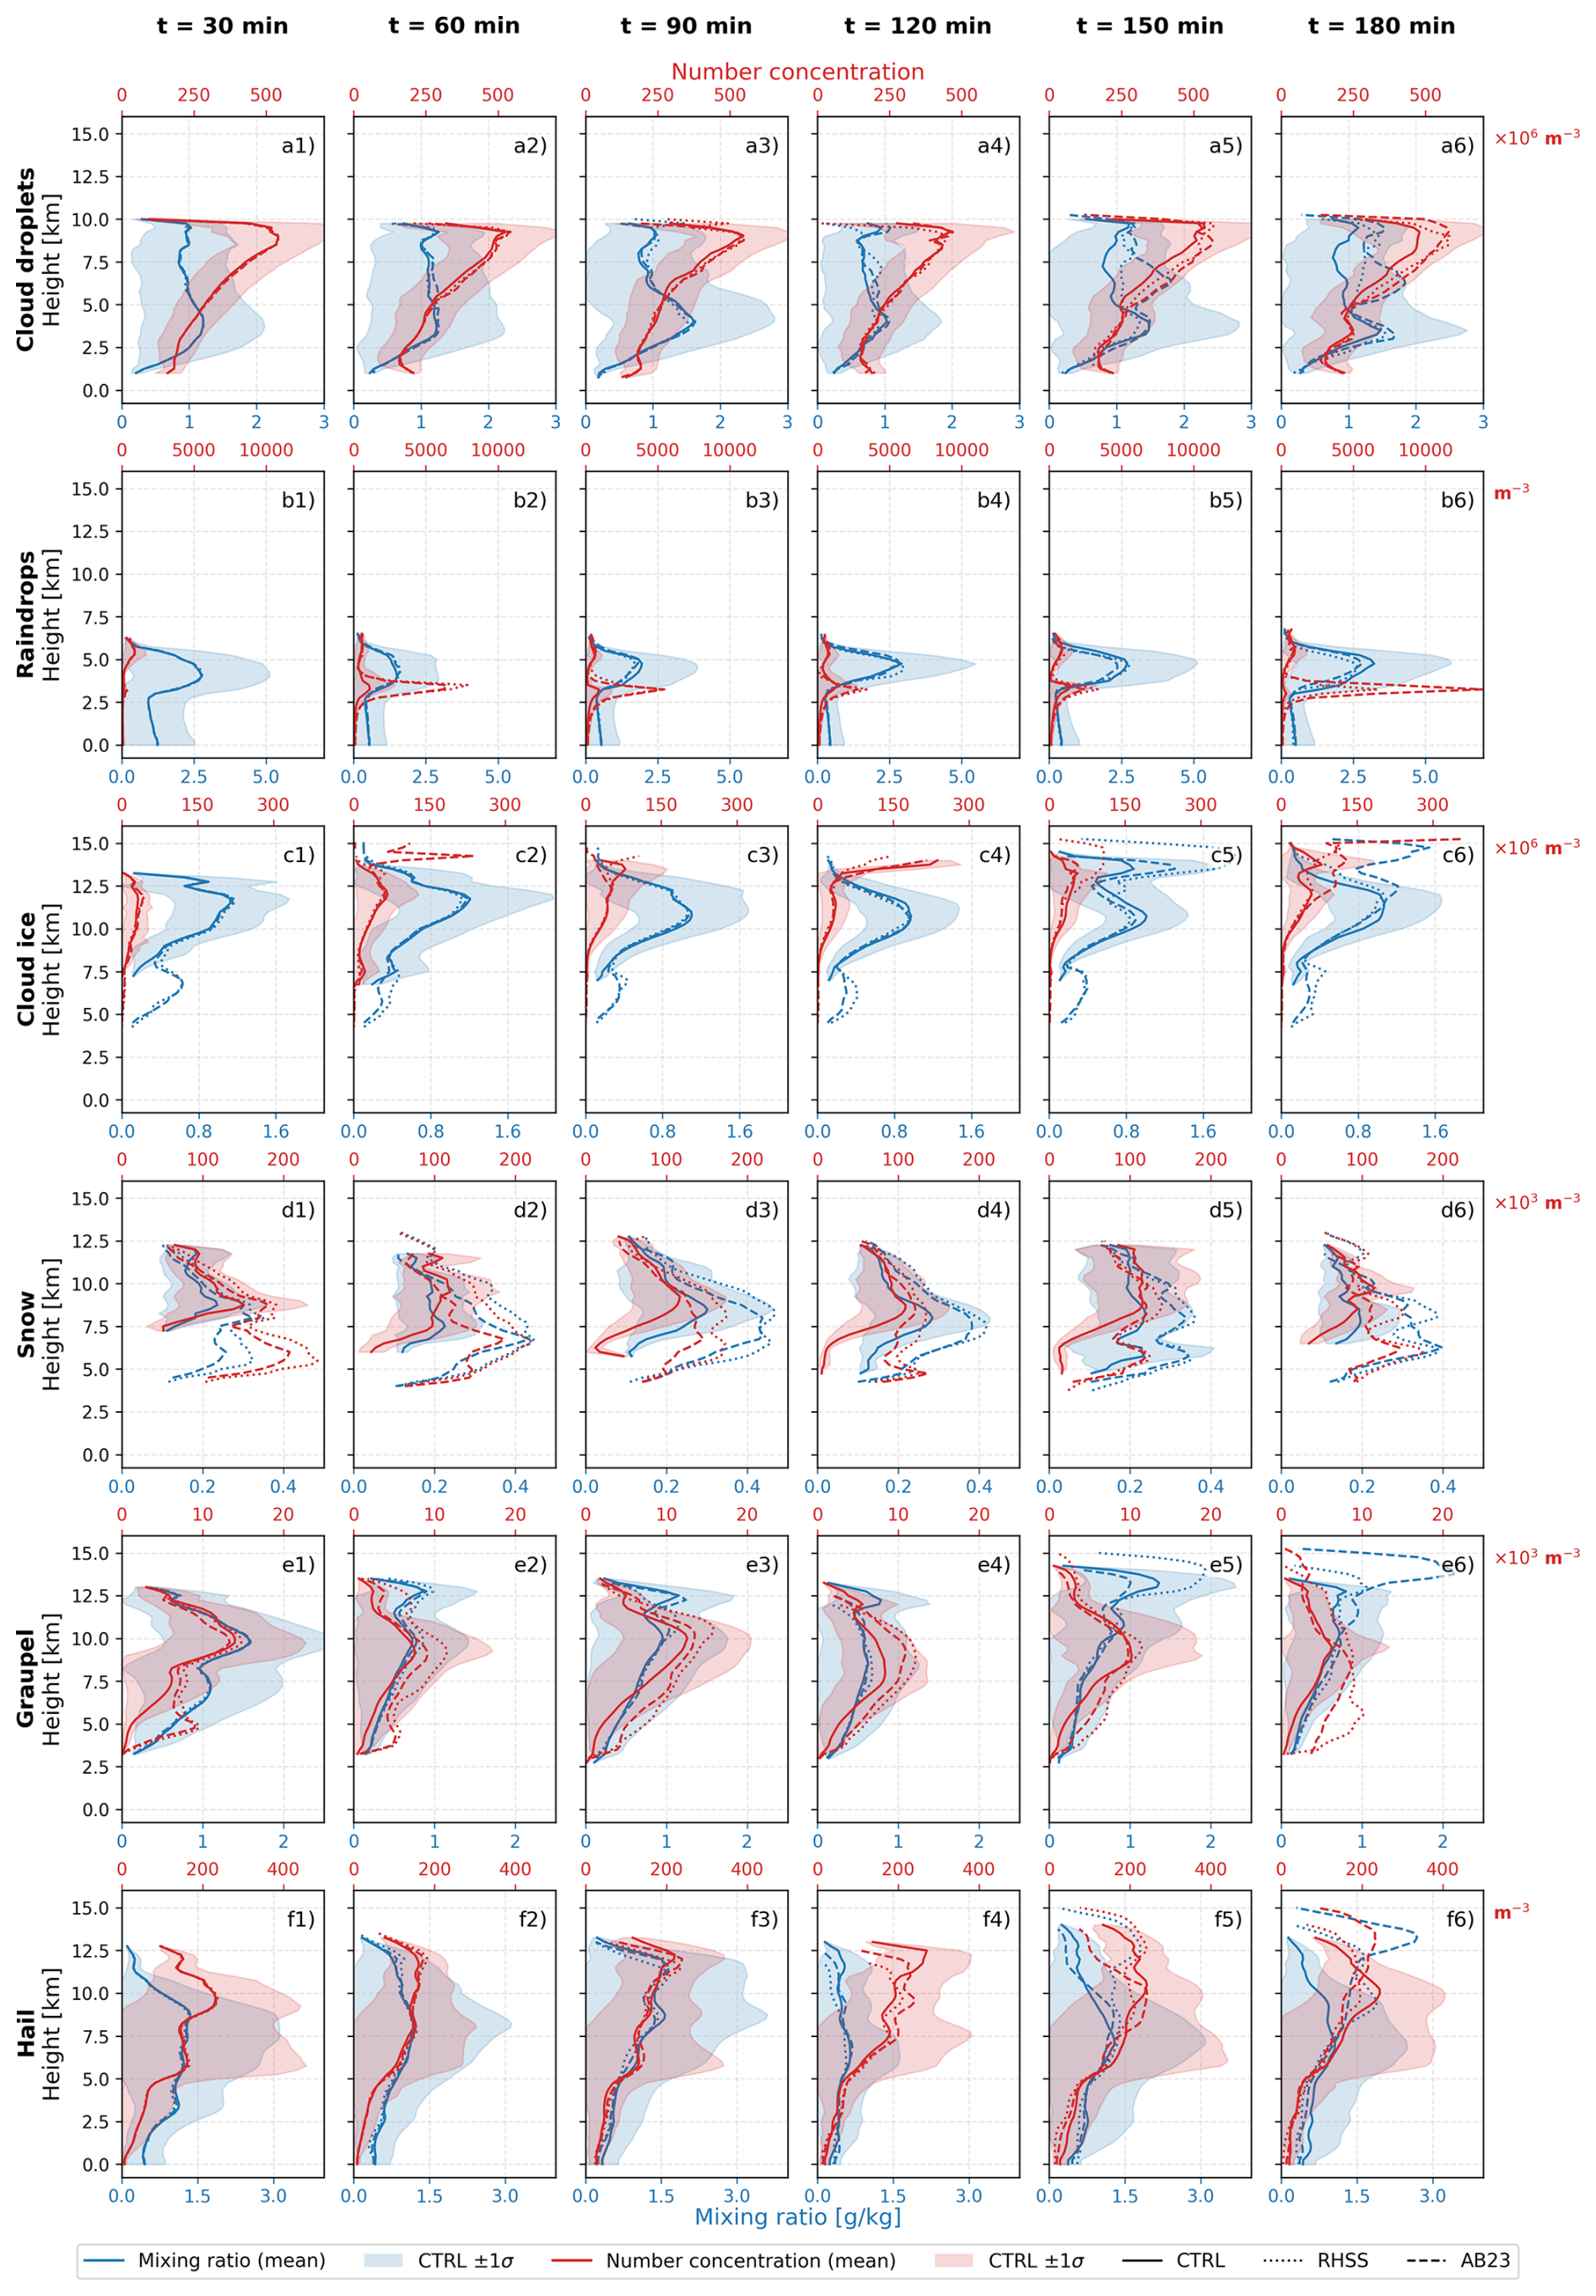
Figure 15Mixing ratio (blue) and number concentration (red) profiles for each hydrometeor category (rows) and every 30 min of the simulations (columns). Solid lines and ±1σ correspond to the CTRL experiment, while dotted and dashed lines correspond to RHSS and AB23, respectively. The data are calculated using a mixing ratio mask of Qx>0.1 g kg−1 for each category.
The most immediate effect of the seeding can be observed in the appearance of the “pocket” of cloud ice and snow (Fig. 15c1–c6 and d1–d6, respectively) at approximately the height of the seeding zone (≈5 km). This effect is most pronounced during the early stages of supercell development. In the case of cloud ice (Fig. 15c1–c6), the mixing ratio values in the seeding cases are comparable to the largest standard deviations (approximately at 11 km height), whereas the values for snow show a much stronger response and, at certain times, have mean values outside the standard deviation range. Furthermore, a statistically significant increase in the mixing ratios and number concentrations of both graupel and hail is observed at high altitudes. The mixing ratios of both categories reach maximum values that exceed the standard deviation range. This also indicates smaller graupel particles and hailstones, which are advected to higher altitudes. Lastly, there is a “spike” in the mean raindrop number concentration due to seeding, with no significant change in mixing ratio around the melting layer (≈3 km), and this feature becomes more pronounced over time. This substantial increase in raindrop number below the melting layer suggests enhanced melting of small solid hydrometeors.
Statistical significance is estimated by calculating p-values using the Wilcoxon signed-rank (WSR) test. For the spatial evaluation, localized differences in mean hail diameter and hail kinetic energy flux were calculated over 30 min intervals using a surface hail precipitation intensity mask threshold of 1 mm h−1. Local statistical significance was computed at each grid point using a paired two-tailed WSR test applied over a 3×3 grid-cell spatial neighborhood (N=9) centered on each target cell. The resulting p-values are represented on the 2D maps via stippling, where filled and open circles indicate p<0.01 and p<0.05, respectively. In Fig. 16, the statistically significant change in these values is evident as early as 30 min into the simulation (12–13 min after seeding start). The areas of the largest change in mean hail diameter and hail kinetic energy flux coincide well with the circles. Furthermore, the areas with the most extreme change usually have p-values less than 0.01, while the periphery typically has p-values less than 0.05.
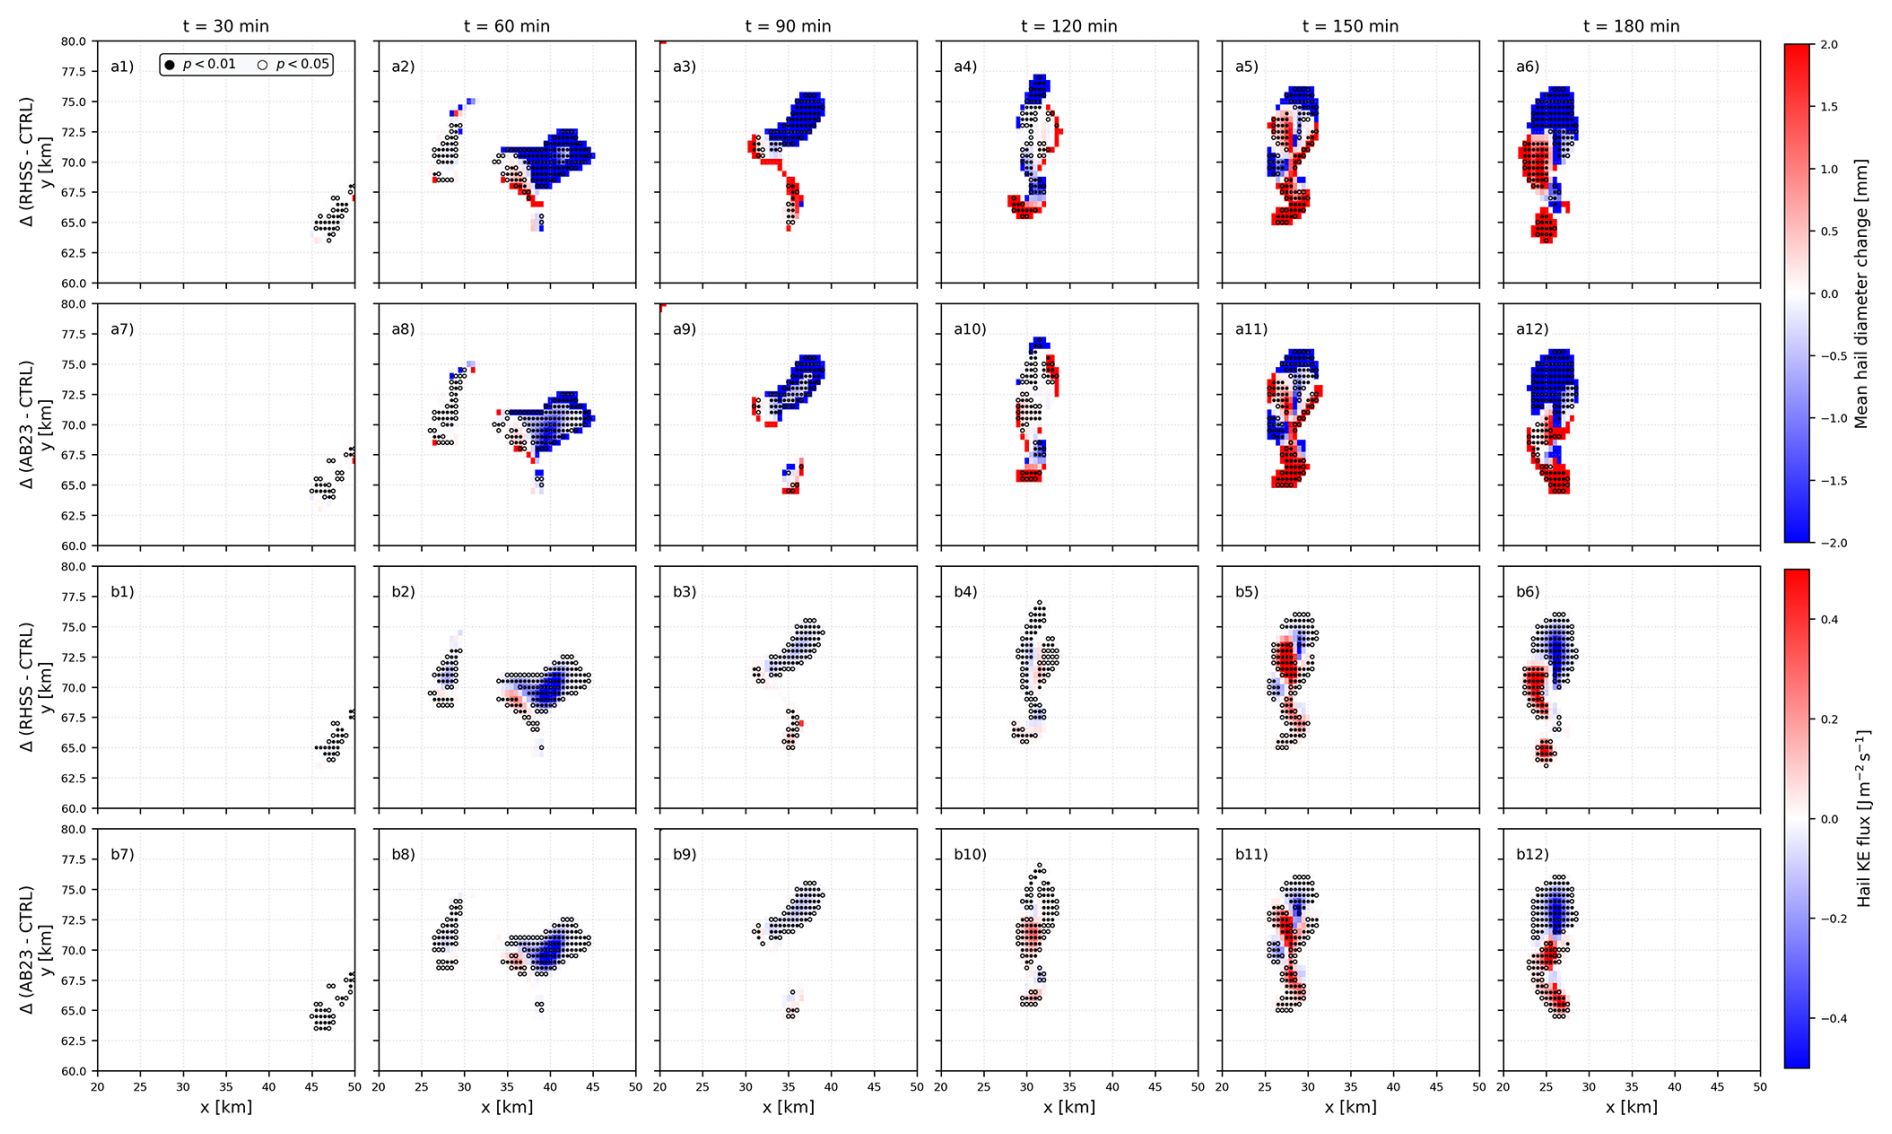
Figure 16Spatial distribution of differences in microphysical hail parameters between seeded experiments (RHSS, AB23) and CTRL from t=30 to 180 min. Panels (a1)–(a6) and (a7)–(a12) show mean hail diameter change for RHSS-CTRL and AB23-CTRL, respectively. Panels (b1)–(b6) and (b7)–(b12) show kinetic energy flux for RHSS-CTRL and AB23-CTRL. Statistical significance assessed via grid-point Wilcoxon Signed-Rank test using a 3×3 local spatial neighborhood is overlaid with circles (filled circle for p<0.01 and open circle for p<0.05). Data are masked using threshold criteria of Qx>0.1 g kg−1.
The boxplot diagram (Fig. 17) shows the domain-wide spatial distributions (median, interquartile range, and extremes) of the mean hail diameter and hail kinetic energy flux across all active grid points at the lowest model level that exceed the 1 mm h−1 hailfall intensity threshold at each 30 min time step. To assess the statistical significance of supercell modifications due to seeding, a two-tailed paired WSR test was conducted at each time step by pairing the vector of all valid grid points in each seeded simulation (RHSS and AB23) with the corresponding CTRL grid points. The resulting domain-level p-values are annotated above each experiment group, highlighting significant temporal shifts in the overall spatial distributions (filled circles indicate p<0.01 and open circles indicate p<0.05).
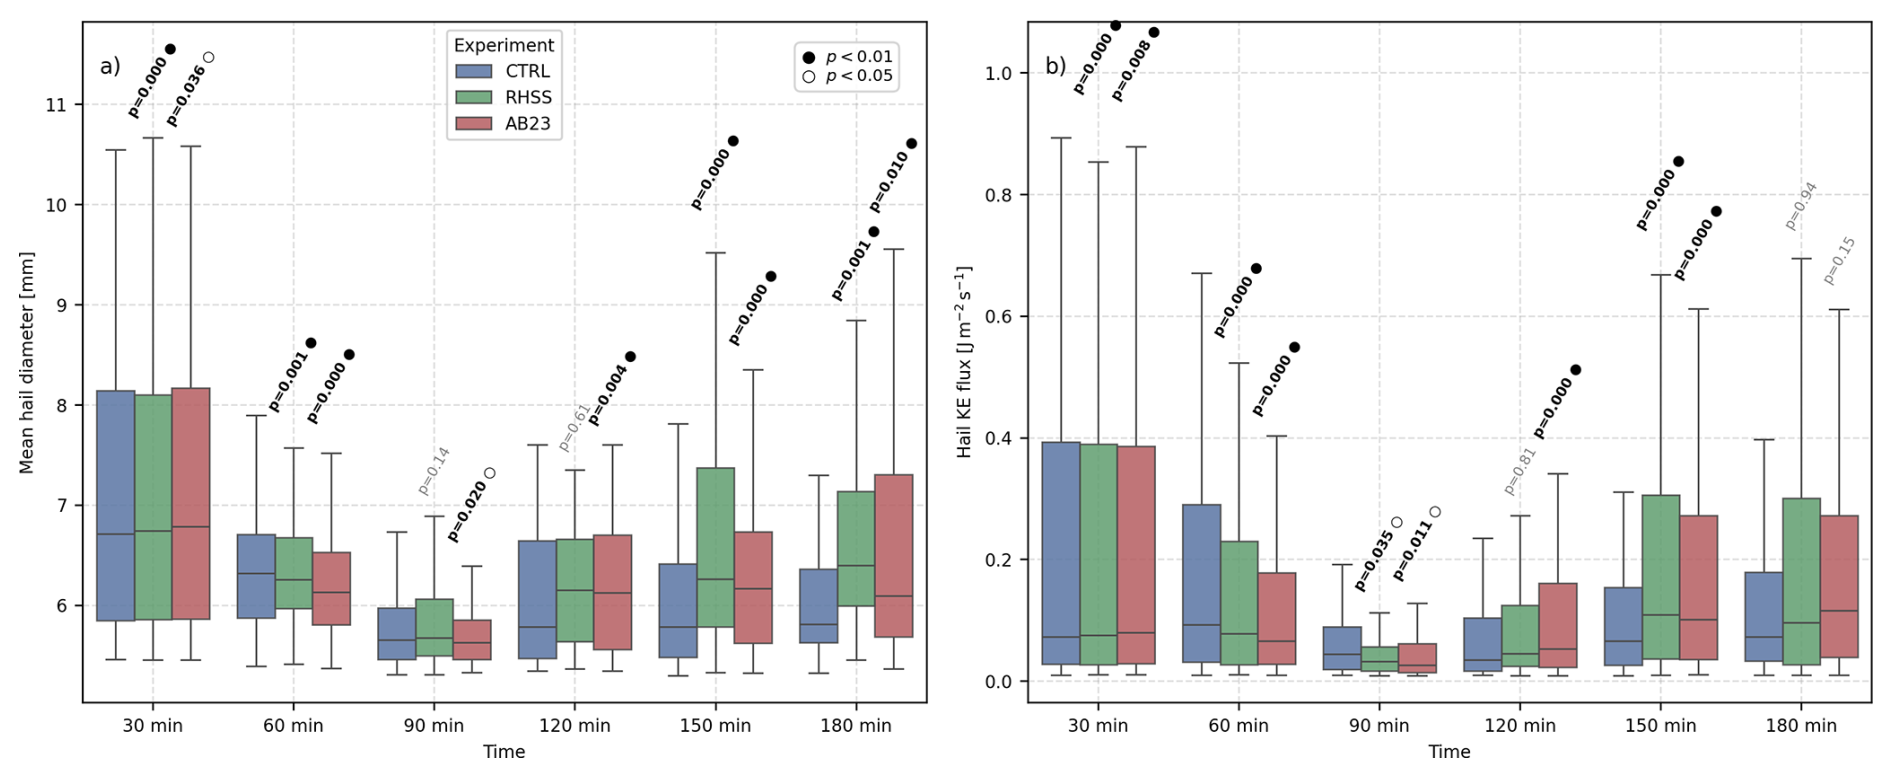
Figure 17Domain-wide spatial distributions of (a) mean hail diameter and (b) hail kinetic energy flux across different time steps for CTRL (blue), RHSS (green), and AB23 (red) experiments. Boxes represent the interquartile range (IQR) with median horizontal lines; whiskers denote minimum and maximum values within 1.5⋅IQR. Annotations above box pairs indicate two-tailed p-values calculated via the paired Wilcoxon Signed-Rank test relative to CTRL (filled circle for p<0.01, open circle for p<0.05; non-significant values in light grey text).
Initial seeding produces statistically significant changes in both parameters during the early stage (30–60 min), during which both schemes effectively reduce median kinetic energy flux and compress the upper distribution extremes. In the mid-stage (90–120 min), AB23 exhibits superior temporal stability by maintaining statistically significant deviations from CTRL, whereas the RHSS scheme temporarily loses significance and converges back to the baseline.
As the storm reaches its late phase (150–180 min), both schemes exhibit a pronounced rebound, characterized by a statistically significant upward shift in median hail diameter and interquartile ranges, reflecting a physical transition toward larger hailstones during storm decay. By 180 min, although mean hail sizes remain significantly different from CTRL, domain-wide kinetic energy flux differences decrease to non-significant levels in both schemes. Overall p-values indicate that the seeding produced statistically non-random results. Interestingly, seeding usually increases both the median and extremes of hail diameter and hail kinetic energy flux (Fig. 17), especially after 2 h. On the other hand, the data from this study suggest a decrease in hail kinetic energy and the corresponding areas.
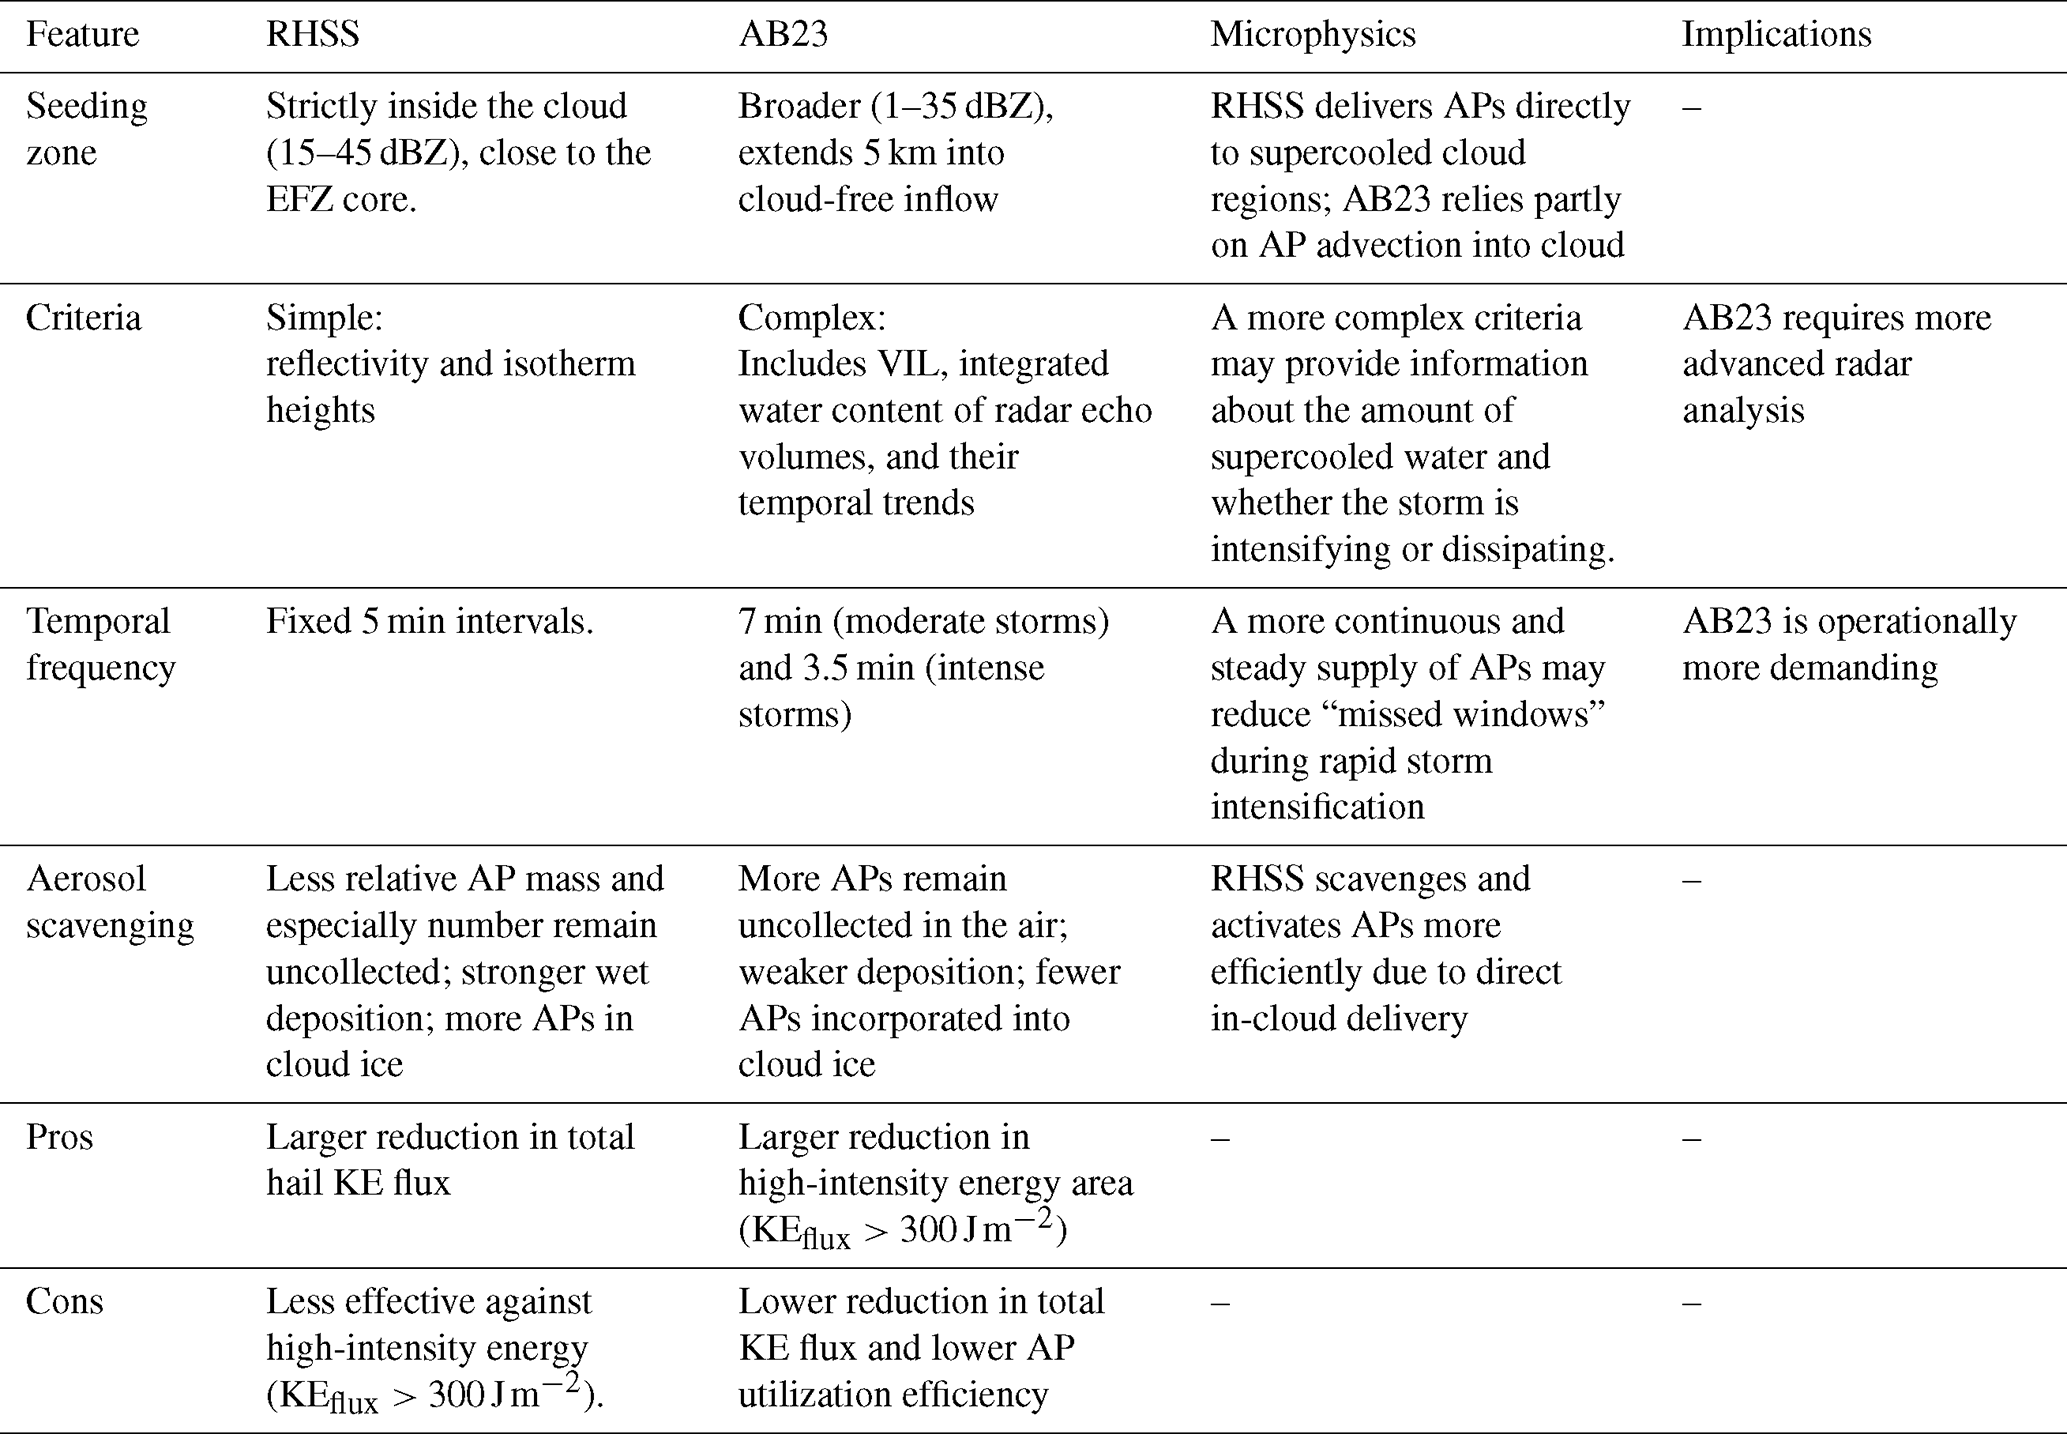
In this study, we used a three–dimensional cloud–resolving numerical model, based on three–moment microphysics, with an added two–moment aerosol parameterization, to simulate the microphysical response and evaluate the impact of glaciogenic cloud seeding on hailfall characteristics. The model setup was designed to follow two seeding methodology procedures for identifying the type of convective process, determining a seeding zone, and automatically injecting the prescribed mass of glaciogenic material. The aerosols in the model followed a gamma distribution and had the characteristics of silver iodide. All known scavenging mechanisms were included. This allowed a detailed investigation of the chain of events related to cloud seeding, from the AP injection followed by their scavenging and redistribution within each hydrometeor category, then their nucleation by one of four nucleation modes, and finally their effects on microphysics. Two different operational methodologies were employed (the RHSS and the AB23), and their effects were compared. A summary of these methodologies is provided in Table 5.
Table 5Main differences, pros, and cons of the RHSS and AB23 seeding methodologies.
The developed numerical framework demonstrated promising results in detecting the microphysical response induced by ice–nucleating particles and, consequently, their influence on broader hailfall characteristics relevant to hail damage mitigation. Here, we present the most important effects of seeding in this case:
-
An insignificant decrease in the total hail mass is observed during the first 2 h of integration, followed by a slight increase thereafter. In contrast, the total number of hailstones steadily increases during the first 2 h in the RHSS case, with negligible change afterward, whereas in the AB23 case, it continues to increase throughout the entire integration period.
-
Immersion freezing of raindrops is the dominant source of hail change, particularly governing hail number, while contact freezing contributes negligibly to hail mass but remains an important source of hail number. Seeding modifies the hail population primarily by reducing sedimentation, reducing hail mass loss by melting and increasing hail number loss. Weakening of raindrop collection as a mass source is observed, while sublimation clearly accelerated the loss in hail number due to seeding. Collectively, these changes indicate a shift toward a larger number of smaller hailstones under seeded conditions.
-
The total cumulative hailfall (in kg) has decreased by 26.4 % for RHSS and 14 % for AB23, as a result of seeding.
-
The hail size distribution on the surface showed significant complexity. An overall decrease in the number of large hailstones is present, although the appearance of large hailstones was paradoxically observed in the regions with no hail in the CTRL case. The continuous seeding with glaciogenic material caused a shift and deformation of hydrometeor and updraft fields; therefore, a point–for–point comparison may not provide an expected or easy–to–interpret result.
-
The total hail kinetic energy exerted on the surface decreased by 27 % and 17.9 % for the RHSS and the AB23, respectively.
-
The area exposed to a moderate kinetic energy flux (KEflux>100 J m−2) decreased by 36.6 % and 38.6 % for the RHSS and the AB23, respectively.
-
The area of high-intensity energy (KEflux>300 J m−2) decreased by 66 % and 88 % for the RHSS and the AB23, respectively.
The statistical robustness of these findings was confirmed through nonparametric Wilcoxon signed-rank (WSR) testing, verifying that the seeding-induced modifications across both spatial fields and temporal evolution are non-random. Spatial neighborhood analysis demonstrated statistically significant changes (p<0.05 and p<0.01) in surface hail diameter and kinetic energy flux as early as 30 min into the simulation (12–13 min after seeding initiation), with core response areas aligning directly with high significance levels. Domain-wide temporal testing further confirmed that both schemes achieve statistically significant reductions in median kinetic energy flux and upper extremes during early storm stages (30–60 min). Although AB23 maintained higher statistical stability through the mid-stage (90–120 min) relative to RHSS, both methodologies exhibited a statistically significant late-stage shift toward larger median hail diameters during storm decay.
The differences in hailfall characteristics between the two methodologies may be linked to differences in the AP supply to the EFZ and in the AP number concentration. In the case of RHSS, APs are injected directly into the EFZ, resulting in aggressive freezing of supercooled water and increased competition for the available water during hail growth. Furthermore, a larger percentage of APs are scavenged in RHSS, compared to AB23. Together, these effects produce a larger number of smaller hailstones and, consequently, a significant decrease in the total surface kinetic energy flux over the domain. In contrast, in the AB23 methodology, the extended seeding zone provides a steadier supply of APs to the EFZ, but at a lower number concentration. For this method, a smaller reduction in the total surface kinetic energy is observed, although a larger reduction is found in the area with KEflux>300 J m−2. This can be partially explained by the fact that the steadier AP supply may reduce the chance of a “missed window”, during which individual hailstones can grow to relatively large diameters between seeding cycles.
As a rule of thumb, these results suggest that AP number concentration influences the total surface kinetic energy produced by hailfall, while a steady AP supply, governed by the seeding cycle intervals and the seeding zone, may reduce the chance of a “missed window” during which hailstones can grow between seeding cycles.
This study presents a model–based approach to evaluate the effectiveness of hail suppression and examines two operational methodologies. Rather than a substantial reduction in the overall hail occurrence or cloud-domain mass, the results primarily indicate a successful modification of hailstone characteristics at the surface. This is reflected in a significant reduction of hail kinetic energy, which implies a lowered potential for crop damage for both methodologies, consistent with the damage mitigation concepts discussed by Dessens et al. (2016) and Garstang et al. (2005).
It is also important to highlight the limitations of this approach. Evaluating the effectiveness of operational cloud seeding using numerical methods can be very challenging. Many variables typically not accounted for in numerical models, such as the spatial and temporal variability of environmental cloud condensation nuclei (Kovačević, 2023), may introduce significant uncertainty and affect the effectiveness of hail mitigation techniques. Furthermore, the parameterization of AgI nucleation exhibits considerable variability (Marcolli et al., 2016; Miller et al., 2025). The activation of APs depends on the chosen parameterization, size distribution, and chemical composition, while the scavenging rate of APs also plays a crucial role in cloud seeding. Verifying these parameterizations in real clouds, particularly convective clouds, remains extremely challenging, introducing additional non–negligible uncertainty (Wang et al., 2010; Zhang et al., 2013).
Additionally, this study is limited by its idealized conditions, focusing on a single supercell over a 3 h simulation period, which does not account for potential long-term effects. Our analysis shows that approximately 54 % (RHSS) and 65 % (AB23) of the total injected AP mass remains unscavenged after 3 h. Given their submicron size and negligible terminal velocity, these particles can remain suspended in the atmosphere for an extended period in the absence of precipitation scavenging. This implies potential impacts on broader weather systems through inadvertent weather modification, which warrants further investigation.
The present study focuses on a representative case of a well-known supercell storm. Supercell clouds are intense, long–lived, quasi–stationary weather systems with significant potential to produce hailfall and consequent damage to crops and infrastructure. The response to seeding in this particular category of convective systems may differ from other convective regimes. This idealized approach requires a sensitivity study to assess the effects of deviations in operational practice as well as to evaluate potential improvements to the methodology.
To account for the wide range of hailstorm types and the various climatological factors influencing their formation, a broader scientific approach is necessary. To date, methods for evaluating the effect of cloud seeding for hail suppression have been mainly statistical. Current knowledge of cloud physics, numerical models, and computational capabilities enables in–depth investigation of the physical processes involved in cloud seeding through numerical experiments.
Conversely, the approach presented by Papaevangelou et al. (2026) has proven to be a robust method for addressing the variability of these processes. By employing ensemble modeling on several hailstorms and averaging microphysical and dynamical characteristics of the storm, detailed research on sensitivity and the range of these characteristics can be conducted. To improve generalizability, future follow-up studies will focus on implementing an ensemble modeling approach, such as that in Papaevangelou et al. (2025). Furthermore, switching from an idealized to a more realistic initialization utilizing real 3D atmospheric fields and high-resolution orography will also expand the significance of this approach.
However, the findings of this case study may not be applicable to the full range of convective cloud types and environmental conditions associated with hailstorm formation. Therefore, more generalized studies are required, along with radar, in situ, and surface measurements to verify the model results. Although such numerical results are valuable for understanding cloud response to seeding, field campaigns are necessary for comparison. Ultimately, combining these numerical results with physical experiments and observational data, such as radar observations and hailpad networks, will be essential to validate the model and firmly link physical energy proxies to real-world agricultural damage.
The model output data are archived and deposited at Harvard Dataverse and are publicly available via https://doi.org/10.7910/DVN/YP1DOH (Savić et al., 2026a) and https://doi.org/10.7910/DVN/N8EVZR (Savić et al., 2026b). The ARPS model (version 5.3.4) is publicly accessible at https://arps.caps.ou.edu/arpsdown.html (last access: 9 November 2026), along with the sounding data used in this study.
D.S.: Conceptualization, Data curation, Formal analysis, Investigation, Methodology, Software, Visualization, Writing (original draft preparation). V.V.: Investigation, Methodology, Software, Supervision D.V.: Investigation, Methodology.
The contact author has declared that none of the authors has any competing interests.
Publisher's note: Copernicus Publications remains neutral with regard to jurisdictional claims made in the text, published maps, institutional affiliations, or any other geographical representation in this paper. The authors bear the ultimate responsibility for providing appropriate place names. Views expressed in the text are those of the authors and do not necessarily reflect the views of the publisher.
This research has been supported by the Science Fund of the Republic of Serbia (grant no. 7389, project “Extreme weather events in Serbia – analysis, modelling and impacts” – EXTREMES).
This paper was edited by Luisa Ickes and reviewed by Julia Kukulies and one anonymous referee.
Abshaev, A. M., Abshaev, M. T., Malkarova, A. M., and Barekova, M. V.: Guidelines for the Organization and Conduct of Antihail Works, Printing House, Nalchik, Russia, 508 pp., ISBN 978-5-905770-54-8, 2014.
Abshaev, M. T., Abshaev, A. M., Sulakvelidze, G. K., Burtsev, I. I., Fedchenko, L. M., Kuznetsov, B. K., and Shevela, G. F.: Development of rocket and artillery technology of hail suppression, in: Book of Achievements in Weather Modification, Abu Dhabi, UAE, 109–127, ISBN 9948-03-255-x, 2006.
Abshaev, M. T., Abshaev, A. M., and Malkarova, A. M.: Results of 65-Years Project of Hail Suppression in Russian Federation, in: Physics of the Atmosphere, Climatology and Environmental Monitoring, edited by: Zakinyan, R. and Zakinyan, A., Springer Proceedings in Earth and Environmental Sciences, Springer, Cham, https://doi.org/10.1007/978-3-031-19012-4_1, 2023.
American Society of Civil Engineers: Guidelines for Operational Hail Suppression Programs, American Society of Civil Engineers, ISBN 978-0-7844-7914-8, 2015.
Brandes, E. A.: Finestructure of the Del City–Edmond tornadic mesocirculation, Mon. Weather Rev., 109, 635–647, 1981.
Brooks, H. E., Lee, J. W., and Craven, J. P.: The spatial distribution of severe thunderstorm and tornado environments from global reanalysis data, Atmos. Res., 67–68, 73–94, https://doi.org/10.1016/S0169-8095(03)00045-0, 2003.
Brülisauer, M., Papaevangelou, N., and Lohmann, U.: Simulations of selective seeding on hailstorms in northern Switzerland using the COSMO model: Effects on the Lightning Potential Index, J. Appl. Meteorol. Clim., 64, 1293–1305, https://doi.org/10.1175/JAMC-D-24-0129.1, 2025.
Ćurić, M., Janc, D., and Vučković, V.: Seeding agent dispersion within convective cloud as simulated by a 3-D numerical model, Meteorol. Atmos. Phys., 92, 205–216, https://doi.org/10.1007/s00703-005-0159-2, 2006.
Ćurić, M., Janc, D., and Vučković, V.: Cloud seeding impact on precipitation as revealed by cloud-resolving mesoscale model, Meteorol. Atmos. Phys., 95, 179–193, https://doi.org/10.1007/s00703-006-0202-y, 2007.
Ćurić, M., Janc, D., and Vučković, V.: Precipitation change from a cumulonimbus cloud downwind of a seeded target area, J. Geophys. Res., 113, D11215, https://doi.org/10.1029/2007JD009483, 2008.
Ćurić, M., Janc, D., Vučković, V., and Kovačević, N.: An inadvertent transport of the seeding material as a result of cloud modification, Meteorol. Atmos. Phys., 105, 157–165, https://doi.org/10.1007/s00703-009-0040-9, 2009.
DeMott, P. J.: A characterization of mixed silver iodide–silver chloride ice nuclei, M. S. thesis, Department of Atmospheric Science, Colorado State University, Fort Collins, CO, USA, 124 pp., https://api.mountainscholar.org/server/api/core/bitstreams/e4e157ca-8ac2-4f9a-912e-7d2ec2e69f6a/content (last access: 9 November 2026), 1982.
DeMott, P. J.: Quantitative descriptions of ice formation mechanisms of silver iodide-type aerosols, Atmos. Res., 38, 63–99, https://doi.org/10.1016/0169-8095(94)00088-U, 1995.
Dessens, J., Sánchez, J. L., Berthet, C., Hermida, L., and Merino, A.: Hail prevention by ground-based silver iodide generators: Results of historical and modern field projects, Atmos. Res., 170, 98–111, https://doi.org/10.1016/j.atmosres.2015.11.008, 2016.
Garstang, M., Bruintjes, R., Serafin, R., Orville, H., Boe, B., Cotton, W., and Warburton, J.: Weather modification: Finding common ground, B. Am. Meteorol. Soc., 86, 647–655, https://doi.org/10.1175/BAMS-86-5-647, 2005.
Gillett, K. J.: SounderPy: An atmospheric sounding visualization and analysis tool for Python, J. Open Source Softw., 10, 8087, https://doi.org/10.21105/joss.08087, 2025.
Guichard, F. and Couvreux, F.: A short review of numerical cloud-resolving models. Tellus A, 69, https://doi.org/10.1080/16000870.2017.1373578, 2017.
Khain, A., Ovtchinnikov, M., Pinsky, M., Pokrovsky, A., and Krugliak, H.: Notes on the state-of-the-art numerical modeling of cloud microphysics, Atmos. Res., 55, 159–224, https://doi.org/10.1016/S0169-8095(00)00064-8, 2000.
Klemp, J. B. and Rotunno, R.: A study of the tornadic region within a supercell thunderstorm, J. Atmos. Sci., 40, 359–377, 1983.
Klemp, J. B., Wilhelmson, R. B., and Ray, P. S.: Observed and numerically simulated structure of a mature supercell thunderstorm, J. Atmos. Sci., 38, 1558–1580, 1981.
Kovačević, N.: Hail suppression effectiveness for varying solubility of natural aerosols in water, Meteorol. Atmos. Phys., 131, 585–599, https://doi.org/10.1007/s00703-018-0587-4,2019.
Kovačević, N.: Hail suppression effectiveness for different cloud condensation nucleus (CCN) populations in continental and maritime environments, Aerosol Sci. Tech., 57, 645–664, https://doi.org/10.1080/02786826.2023.2208182, 2023.
Loftus, A. M.: A triple-moment bulk hail microphysics scheme to investigate the sensitivities of hail to aerosols, PhD thesis, Colorado State University, https://doi.org/10.25675/3.024409, 2012.
Lohmann, U., Lüönd, F., and Mahrt, F.: An Introduction to Clouds: From the Microscale to Climate, Cambridge University Press, 391 pp., ISBN 978-1-009-48567-8, 2016.
Lompar, M., Ćurić, M., Romanic, D., Zou, L., and Liang, H.: Precipitation enhancement by cloud seeding using the shell structured TiO2/NaCl aerosol as revealed by new model for cloud seeding experiments, Atmos. Res., 212, 202–212, https://doi.org/10.1016/j.atmosres.2018.05.021, 2018.
Marcolli, C., Nagare, B., Welti, A., and Lohmann, U.: Ice nucleation efficiency of AgI: review and new insights, Atmos. Chem. Phys., 16, 8915–8937, https://doi.org/10.5194/acp-16-8915-2016, 2016.
Mesinger, F. and Mesinger, N.: Has hail suppression in eastern Yugoslavia led to a reduction in the frequency of hail?, J. Appl. Meteorol., 31, 104–111, https://doi.org/10.1175/1520-0450(1992)031<0104:HHSIEY>2.0.CO;2, 1992.
Meyers, M. P., DeMott, P. J., and Cotton, W. R.: A comparison of seeded and nonseeded orographic cloud simulations with an explicit cloud model, J. Appl. Meteorol., 34, 834–846, 1995.
Milbrandt, J. A. and Yau, M. K.: A multimoment bulk microphysics parameterization. Part I: Analysis of the role of the spectral shape parameter, J. Atmos. Sci., 62, 3051–3064, https://doi.org/10.1175/JAS3534.1, 2005a.
Milbrandt, J. A. and Yau, M. K.: A multimoment bulk microphysics parameterization. Part II: A proposed three-moment closure and scheme description, J. Atmos. Sci., 62, 3065–3081, https://doi.org/10.1175/JAS3535.1, 2005b.
Milbrandt, J. A. and Yau, M. K.: A multimoment bulk microphysics parameterization. Part III: Control simulation of a hailstorm, J. Atmos. Sci., 63, 3114–3136, https://doi.org/10.1175/JAS3816.1, 2006a.
Milbrandt, J. A. and Yau, M. K.: A multimoment bulk microphysics parameterization. Part IV: Sensitivity experiments, J. Atmos. Sci., 63, 3137–3159, https://doi.org/10.1175/JAS3817.1, 2006b.
Miller, A. J., Fuchs, C., Ramelli, F., Zhang, H., Omanovic, N., Spirig, R., Marcolli, C., Kanji, Z. A., Lohmann, U., and Henneberger, J.: Quantified ice-nucleating ability of AgI-containing seeding particles in natural clouds, Atmos. Chem. Phys., 25, 5387–5407, https://doi.org/10.5194/acp-25-5387-2025, 2025.
Moeng, C.-H. and Wyngaard, J. C.: Evaluation of turbulent transport and dissipation closures in second-order modeling, J. Atmos. Sci., 46, 2311–2330, 1989.
Morrison, H., van Lier-Walqui, M., Fridlind, A. M., Grabowski, W. W., Harrington, J. Y., Hoose, C., Korolev, A., Kumjian, M. R., Milbrandt, J. A., Pawlowska, H., Posselt, D. J., Prat, O. P., Reimel, K. J., Shima, S.-I., van Diedenhoven, B., and Xue, L.: Confronting the challenge of modeling cloud and precipitation microphysics, J. Adv. Model. Earth Sy., 12, e2019MS001689, https://doi.org/10.1029/2019MS001689, 2020.
Noda, A. and Niino, H.: Critical grid size for simulating convective storms: A case study of the Del City supercell storm, Geophys. Res. Lett., 30, https://doi.org/10.1029/2003GL017498, 2003.
Omanovic, N., Ferrachat, S., Fuchs, C., Henneberger, J., Miller, A. J., Ohneiser, K., Ramelli, F., Seifert, P., Spirig, R., Zhang, H., and Lohmann, U.: Evaluating the Wegener–Bergeron–Findeisen process in ICON in large-eddy mode with in situ observations from the CLOUDLAB project, Atmos. Chem. Phys., 24, 6825–6844, https://doi.org/10.5194/acp-24-6825-2024, 2024.
Papaevangelou, N., Villanueva, D., Eirund, G. K., Chen, J., Dedekind, Z., and Lohmann, U.: Simulations of selective seeding of hailstorms – A summertime case study over Switzerland, J. Appl. Meteorol. Clim., 64, 1509–1524, 2025.
Papaevangelou, N., Villanueva, D., and Lohmann, U.: Impact of cloud seeding on simulated hailstorms and its dependence on CAPE, wind shear, and tracking thresholds, Atmos. Chem. Phys., 26, 9393–9412, https://doi.org/10.5194/acp-26-9393-2026, 2026.
Rauber, R. M., Geerts, B., Xue, L., French, J., Friedrich, K., Rasmussen, R. M., Tessendorf, S. A., Blestrud, D. R., Kunkel, M. L., and Parkinson, S.: Wintertime orographic cloud seeding: a review, J. Appl. Meteorol. Clim., 58, 2117–2140, https://doi.org/10.1175/JAMC-D-18-0341.1, 2019.
Ray, P. S., Johnson, L. R., Priegnitz, D. L., Boe, B. A., and Mielke, P. W.: The morphology of several tornadic storms on 20 May 1977, J. Atmos. Sci., 38, 1643–1663, 1981.
Republic Hydrometeorological Service of Serbia, Hail Suppression Center: Instruction 5/2023: Methods for radar identification and seeding of single-cell, multicell, and supercell hail-producing storms using the OGIS automated system, Belgrade, Serbia, 2023.
Rudolph, R., Sackiw, C., and Riely, G.: Statistical evaluation of the 1984–88 seeding experiment in northern Greece, J. Weather Modif., 26, 53–60, 1994.
Savić, D., Vučković, V., and Vujović, D.: Numerical model data for publication “Explicit Numerical Simulations of Hailstorm Seeding with a Three–Moment Microphysics Cloud–Resolving Model: A Comparison of Two Operational Methodologies for Hail Suppression” [Part 1], Harvard Dataverse [data set], V1, https://doi.org/10.7910/DVN/YP1DOH, 2026a.
Savić, D., Vučković, V., and Vujović, D.: Numerical model data for publication “Explicit Numerical Simulations of Hailstorm Seeding with a Three–Moment Microphysics Cloud–Resolving Model: A Comparison of Two Operational Methodologies for Hail Suppression” [Part 2], Harvard Dataverse [data set], V1, https://doi.org/10.7910/DVN/N8EVZR, 2026b.
Schaefer, V. J.: The production of ice crystals in a cloud of supercooled water droplets, Science, 104, 457–459, https://doi.org/10.1126/science.104.2707.457, 1946.
Simeonov, P.: An overview of crop hail damage and evaluation of hail suppression efficiency in Bulgaria, J. Appl. Meteorol., 35, 1574–1581, https://doi.org/10.1175/1520-0450(1996)035<1574:AOOCHD>2.0.CO;2, 1996.
Smith, P. L., Johnson, L. R., Priegnitz, D. L., Boe, B. A., and Mielke, P. W.: An exploratory analysis of crop hail insurance data for evidence of cloud seeding effects in North Dakota, J. Appl. Meteorol., 36, 463–473, https://doi.org/10.1175/1520-0450(1997)036<0463:AEAOCH>2.0.CO;2, 1997.
Straka, J. M.: Cloud and Precipitation Microphysics, Cambridge University Press, 407 pp., ISBN 978-0-511-58084-0, 2009.
Ursu, A., Istrate, V., Jitariu, V., and Lazăr, I. L.: Hail damage detection: Integrating Sentinel-2 images with weather radar hail kinetic energy, Remote Sens.-Basel, 17, 3850, https://doi.org/10.3390/rs17233850, 2025.
Vonnegut, B.: The nucleation of ice formation by silver iodide, J. Appl. Phys., 18, 593–595, https://doi.org/10.1063/1.1697813, 1947.
Vučković, V.: Numerical simulation of seeding of convective clouds, Ph.D. thesis, Department of Meteorology, Faculty of Physics, University of Belgrade, Belgrade, Serbia, 108 pp., https://haos.ff.bg.ac.rs/nastava/radovi/ddvladan.pdf (last access: 9 November 2026), 2003 (in Serbian).
Vučković, V., Vujović, D., and Jovanović, A.: Aerosol parameterisation in a three-moment microphysical scheme: Numerical simulation of submicron-sized aerosol scavenging, Atmos. Res., 273, 106148, https://doi.org/10.1016/j.atmosres.2022.106148, 2022.
Vučković, V., Vujović, D., and Savić, D.: Influence of electrostatic collection on scavenging of submicron-sized aerosols by cloud droplets and raindrops, Aerosol Sci. Tech., 57, 1154–1173, https://doi.org/10.1080/02786826.2023.2251551, 2023.
Vučković, V., Vujović, D., Savić, D., and Filipović, L.: Impact of electro-collection and ice nucleation on aerosol scavenging, Aerosol Sci. Tech., 59, 1006–1026, 2025a.
Vučković, V., Vujović, D., Savić, D., and Filipović, L.: The effect of electrocollection by ice hydrometeors on the scavenging of submicron-sized aerosol particles, Atmosphere-Basel, 16, 1265, https://doi.org/10.3390/atmos16111265, 2025b.
Vujović, D., Vučinić, Z., and Babić, Z.: 40 Years of Hail Suppression in Serbia, 9th WMO Scientific Conference on Weather Modification and Weather Modification Workshop, Antalya, Turkey, no. 1406, 2007.
Wang, X., Zhang, L., and Moran, M. D.: Uncertainty assessment of current size-resolved parameterizations for below-cloud particle scavenging by rain, Atmos. Chem. Phys., 10, 5685–5705, https://doi.org/10.5194/acp-10-5685-2010, 2010.
World Meteorological Organization: WMO statement on weather modification, https://wmo.int/content/wmo-statement-weather-modification (last access: 4 March 2026), 2025.
Xue, M., Droegemeier, K. K., and Wong, V.: The Advanced Regional Prediction System (ARPS) – A multiscale nonhydrostatic atmospheric simulation and prediction tool. Part I: Model dynamics and verification, Meteorol. Atmos. Phys., 75, 161–193, 2000.
Xue, M., Droegemeier, K. K., Wong, V., Shapiro, A., Brewster, K., Carr, F., Weber, D., Liu, Y., and Wang, D.: The Advanced Regional Prediction System (ARPS) – Part II: Model physics and applications, Meteorol. Atmos. Phys., 76, 143–165, 2001.
Xue, L., Hashimoto, A., Murakami, M., Rasmussen, R., Tessendorf, S. A., Breed, D., Parkinson, S., Holbrook, P., and Blestrud, D.: Implementation of a silver iodide cloud-seeding parameterization in WRF. Part I: Model description and idealized 2D sensitivity tests, J. Appl. Meteorol. Clim., 52, 1433–1457, https://doi.org/10.1175/JAMC-D-12-0148.1, 2013a.
Xue, L., Tessendorf, S. A., Nelson, E., Rasmussen, R., Breed, D., Parkinson, S., Holbrook, P., and Blestrud, D.: Implementation of a silver iodide cloud-seeding parameterization in WRF. Part II: 3D simulations of actual seeding events and sensitivity tests, J. Appl. Meteorol. Clim., 52, 1458–1476, https://doi.org/10.1175/JAMC-D-12-0149.1, 2013b.
Young, K. C.: Microphysical processes in clouds, Oxford University Press, New York, 427 pp., ISBN 0195075633, 1993.
Zalesak, S. T.: Fully multidimensional flux-corrected transport algorithms for fluids, J. Comput. Phys., 31, 335–362, 1979.
Zhang, L., Wang, X., Moran, M. D., and Feng, J.: Review and uncertainty assessment of size-resolved scavenging coefficient formulations for below-cloud snow scavenging of atmospheric aerosols, Atmos. Chem. Phys., 13, 10005–10025, https://doi.org/10.5194/acp-13-10005-2013, 2013.