
the Creative Commons Attribution 4.0 License.
the Creative Commons Attribution 4.0 License.
 | 04 Nov 2026
Sensitivities of a simulated Arctic stratocumulus to aerosol and microphysical parameters
Hannah Carolin Frostenberg

Jessie Creamean
Erik Schurch Thomson
Heather Guy
Roman Pohorsky
Camille Mavis
Ian Morley Brooks
Nicolas Fauré
Lea Haberstock
Julia Kojoj
Sonja Murto
Julia Schmale
Michael Tjernström
Paul Zieger
Low-level, mixed-phase clouds are a key component of the Arctic energy budget and can impact the extent and thickness of sea ice. These clouds are influenced by aerosols and microphysical processes that can determine the phase partitioning and thereby cloud lifetime and radiative impacts. Atmospheric models often struggle to represent phase partitioning in Arctic mixed-phase clouds correctly. Aerosol number concentration (ANC), aerosol type (Atype), ice crystal number concentration (ICNC), and ice crystal morphology (ice crystal habit; IChab) have previously been shown to impact phase partitioning in Arctic clouds. We used factorial analysis to rank these parameters according to their explained variance in simulated liquid water path (LWP), ice water path (IWP), and downward longwave radiation at the surface (DWLW) of a slightly supercooled Arctic mixed-phase cloud. Additionally, we analyzed how these parameters affect the final phase state of the simulated cloud. Using MIMICA, the MISU-MIT Cloud Aerosol large-eddy simulation code, we found that ANC was the most important parameter for LWP and DWLW, while ICNC controlled IWP. IChab ranked third for all simulated variables, yet it crucially determined the final phase state of the cloud. The impact of Atype was negligible compared to the other three parameters. Recognizing the limits of relying on a single case study and model, our results suggest that future Arctic field campaigns should prioritize observations of ANC, ICNC, and, crucially, ice habit for slightly supercooled mixed-phase clouds. Models must also represent different ice habits to accurately simulate cloud phase partitioning and its subsequent impact on the Arctic energy budget.
- Article
(3612 KB) - Full-text XML
- BibTeX
- EndNote


Low-level mixed-phase clouds are a key component of the Arctic climate system (Shupe and Intrieri, 2004). These clouds strongly modulate the surface radiation budget and thus influence the extent and thickness of Arctic sea ice (e.g., Letterly et al., 2016), ultimately driving critical feedbacks within the regional energy budget. However, models across all scales struggle to accurately represent Arctic mixed-phase clouds (AMPCs), and correctly capturing the phase partitioning between liquid droplets and ice crystals remains one of the major modeling challenges (e.g., Ovchinnikov et al., 2014; Fu et al., 2019; Taylor et al., 2019).
AMPCs are often remarkably persistent, despite the inherent thermodynamic instability of coexisting liquid droplets and ice crystals. This persistence arises from a tightly coupled interplay between radiation, turbulence, microphysics, and aerosols, and therefore perturbations to the balance can trigger rapid cloud dissipation (Morrison et al., 2012). One pathway toward cloud dissipation involves a shift in phase partitioning via the Wegener-Bergeron-Findeisen process (WBF process; Wegener, 1911; Bergeron, 1935; Findeisen, 1938). This process drives ice crystal growth at the expense of evaporating liquid droplets whenever the ambient air is supersaturated with respect to ice yet subsaturated with respect to liquid water. If the ice growth proceeds to complete glaciation – depleting liquid water while increasing ice mass – the cloud may dissipate as the remaining ice precipitates to the surface.
The cloud phase partitioning between liquid cloud droplets and ice crystals depends in part on the available aerosol populations. Aerosol particles impact AMPCs by acting as cloud condensation nuclei (CCN) to form liquid droplets and as ice-nucleating particles (INPs) to heterogeneously nucleate ice crystals. The varying aerosol concentration in the Arctic can limit cloud formation if particle concentrations fall into the tenuous cloud regime, where CCN availability restricts droplet number (Mauritsen et al., 2011). If accumulation mode particle concentrations are sufficiently low, Aitken mode aerosols can act as CCN (Bulatovic et al., 2021; Karlsson et al., 2022), highlighting the critical importance of capturing the full aerosol size distribution. While meteorology is the primary governing factor, aerosol size generally matters more for CCN activation than chemical composition (Dusek et al., 2006), which in turn determines hygroscopicity. Furthermore, aerosol hygroscopicity becomes even less important at lower aerosol concentrations. Fewer activated particles result in higher supersaturations, which allow for the activation of less hygroscopic aerosols (Bulatovic et al., 2021). However, accurately representing the dominant aerosol size effect is challenging, as the size distribution can vary vertically between the surface, where observations are easiest, and the altitudes where aerosols actually act as CCN (Igel et al., 2017; Pohorsky et al., 2026), especially in the Arctic, which is often stratified in the below-cloud environment (Creamean et al., 2021). The activated CCN and available water vapor dictate cloud droplet size distributions, which impact both the radiative effect and the lifetime of clouds (Twomey, 1974).
The abundance of INPs heavily influences the phase partitioning in AMPCs. INP concentrations are typically several orders of magnitude lower than CCN concentrations, and Arctic INP concentrations are especially low (Wex et al., 2019; Welti et al., 2020). Yet, despite this scarcity of INPs, observations in AMPCs often reveal a substantial discrepancy between INP concentrations and the resulting ice crystal number concentrations (ICNC; Prenni et al., 2009; Pasquier et al., 2022b). Previous large-eddy simulation (LES) studies demonstrated that achieving closure using solely observed INPs succeeds only under exceptional environmental conditions, such as unusually high INP concentrations (Avramov et al., 2011). To bridge the resulting gap and realistically reproduce observed ICNC, models must frequently incorporate enhancement mechanisms. Some studies address this by introducing additional sources of INPs or pre-existing ice to the simulated cloud. These approaches include INP entrainment from the free troposphere above clouds (Fu et al., 2019), or INP recycling from below following the sublimation of precipitating ice (Solomon et al., 2015; Fu et al., 2019; Possner et al., 2024), and the seeding of ice crystals from higher clouds, or from layers within the same cloud (Avramov and Harrington, 2010; Wallentin et al., 2025). Alongside these external additions, secondary ice production (SIP) serves as a primary explanation for the gap between INP and ICNC, capable of enhancing ICNC to values several orders of magnitude higher than INP concentrations. For instance, rime-splintering generates ice splinters between −8 and −3 °C as droplets freeze onto large rimed hydrometeors (Hallett and Mossop, 1974). Mechanical breakup of frozen hydrometeors following collisions (e.g., Vardiman, 1978; Phillips et al., 2017), and the freezing and fragmentation of larger droplets (e.g., Lauber et al., 2018; Phillips et al., 2018), provide additional pathways for ice crystal enhancement. Indeed, modeling studies show that incorporating SIP can enable realistic cloud phase simulations in AMPCs (Sotiropoulou et al., 2020; Possner et al., 2024; Wallentin et al., 2025). Finally, alongside the concentration of ice crystals, their morphology – or habit – impacts the phase partitioning by determining both the ice crystal fall speed and depositional growth rate (Avramov and Harrington, 2010; Pruppacher and Klett, 2010).
Beside the factors mentioned earlier, phase partitioning in AMPCs is governed by temperature, because the likelihood of an aerosol particle acting as INP increases as temperatures drop. Consequently, while secondary ice processes vary by temperature regime, they become exceptionally relevant at warmer supercooled temperatures where primary ice nucleation is limited by naturally scarce active INP concentrations. Multiple observational campaigns documented slightly supercooled mixed-phase clouds (cloud-top temperatures ≥ −10 °C as defined in Rangno and Hobbs, 2001) across the Arctic (e.g., Hobbs and Rangno, 1998; Lawson et al., 2001; Korolev and Lawson, 2026). Furthermore, multi-year observations at three Arctic observatories demonstrated that the majority of clouds warmer than −10 °C exist in a mixed-phase state (Shupe, 2011).
One such slightly supercooled AMPC was extensively observed during the 2023 ARTofMELT (Atmospheric Rivers and the onseT of sea ice MELT) ship-based expedition. Concurrent observations of Arctic aerosol, INP concentrations, and cloud properties provided the opportunity to evaluate the aerosol and microphysical controls within a specific AMPC case study. To capture the crucial link between turbulence dynamics and cloud microphysics, we used the LES code MIMICA (MISU/MIT Cloud and Aerosol; Savre et al., 2014) that incorporates a two-moment bulk microphysics scheme. However, initial simulations produced negligible ice mass, despite configuring MIMICA with observed aerosol distributions, extrapolated INP observations, and the SIP processes rime-splintering and collisional breakup. To force the formation of ice, we bypassed the interactive ice nucleation schemes entirely by prescribing ICNC, following the approach of previous LES studies (e.g., Savre et al., 2014; Loewe et al., 2017; Stevens et al., 2018; Tornow et al., 2021; Wu et al., 2025; Juliano et al., 2026).
With this model setup, we quantified the sensitivity of simulated liquid water path (LWP), ice water path (IWP), and downward longwave radiation at the surface (DWLW) in relation to four easily constrained input parameters: ICNC, aerosol number concentration, aerosol type, and ice habit. These four parameters cover critical aerosol and microphysical aspects previously shown to impact AMPC phase partitioning, while also being constrained by the ARTofMELT observations and easily modified as inputs to MIMICA. For example, a major LES intercomparison demonstrated that increasing CCN concentrations (corresponding to higher aerosol number concentrations) consistently leads to higher LWP, while the majority of models showed that higher ICNC increases IWP and decreases LWP (Stevens et al., 2018). Furthermore, the main property that differs between aerosol types is hygroscopicity; increased hygroscopicity generally increases LWP, though the IWP response is less uniform (Christiansen et al., 2020). Finally, the ice habit impacts simulated cloud phase, particularly at higher ICNC values (Avramov and Harrington, 2010). Although previous studies have investigated subsets of our four parameters, no comprehensive ranking of their relative impacts on AMPC phase partitioning has yet been conducted. To bridge this gap, we applied factorial analysis (Teller and Levin, 2008; Ickes et al., 2026) for our systematic sensitivity study. This method allowed us to systematically rank the influence of the four parameters against each other and to identify the primary drivers of phase partitioning in this slightly supercooled AMPC. Consequently, our main research question is: Which aerosol or microphysical parameter controls the phase partitioning in this slightly supercooled AMPC modeled with MIMICA? The findings illuminate what measurements can be prioritized in future Arctic field campaigns targeting the persistent challenge of phase partitioning in slightly supercooled AMPCs.
2.1 Model description
To investigate an Arctic cloud case observed during ARTofMELT, we used the large-eddy simulation code MIMICA, which has been applied extensively to AMPCs in the boundary layer (e.g., Stevens et al., 2018; Sotiropoulou et al., 2020; Frostenberg et al., 2023; Escusa dos Santos et al., 2025). A full model description is available from Savre et al. (2014), but here we provide the necessary details to contextualize this study.
Within MIMICA, a two-moment bulk microphysical scheme predicts number concentrations (NC) and mass mixing ratios (Q) for five hydrometeor types: cloud droplets, raindrops, ice crystals, snow, and graupel (Seifert and Beheng, 2006). While cloud droplets remain suspended, liquid drops of at least 40 µm in diameter are classified as raindrops and allowed to sediment. Snow originates from the collision and aggregation of ice crystals, whereas graupel forms upon the collection of liquid water by any frozen hydrometeor. Frozen hydrometeors are not assumed to be spherical, and in contrast to Seifert and Beheng (2006), MIMICA incorporates multiple ice habits whereby the size-mass and fall speed-mass relations can be altered, as well as process rates for deposition, melting, and sublimation. Hydrometeor mass distributions follow generalized gamma functions, with size and fall speeds that depend on mass via power-law relations. The represented microphysical processes include condensation/evaporation, autoconversion, accretion/aggregation, riming, melting, and evaporation/sublimation. Under supersaturated conditions, condensation onto droplets and deposition onto frozen hydrometeors are computed explicitly (Pruppacher and Klett, 2010). Primary ice formation is parameterized using different schemes; here, we present simulations using both prescribed ICNC and temperature-dependent INP concentrations. SIP is represented via rime-splintering (Hallett and Mossop, 1974), and our model version additionally incorporates collisional breakup (Phillips et al., 2017), implemented following Sotiropoulou et al. (2021).
In MIMICA, aerosol populations are defined by lognormal distributions, and characterized by their hygroscopicity parameter κ, density ρ, and molecular weight Mw. Here, we represent the aerosol size distribution via observationally derived Aitken and accumulation modes (see Sect. 2.4.2). Aerosols defined in this manner act exclusively as CCN and are entirely decoupled from ice nucleation. In our configuration, cloud droplet activation is determined by κ-Köhler theory and then follows Khvorostyanov and Curry (2006) to compute the activated fraction of the aerosol distribution. Aerosol processes other than activation into cloud droplets – such as scavenging or in-cloud chemistry – are not represented, and therefore the aerosol number size distribution remains constant throughout the simulation.
The cloud is initialized by prescribing a vertical profile for the cloud droplet mixing ratio Qc. This profile is usually based on observations, as was done in this study (see Sect. 2.4.1). From the first time step, droplets can freeze according to the selected ice nucleation parameterization, allowing the cloud to evolve into a mixed-phase state. As the cloud evolves, further aerosol activation occurs whenever local supersaturation conditions are met.
Subgrid-scale turbulence is based on the 0th order approach by Smagorinsky (1963), and surface fluxes are calculated according to Monin-Obukhov similarity theory (Stull, 1988). Radiative transfer is computed across six solar and twelve terrestrial frequency bands (Fu and Liou, 1993; Fu et al., 1997; Gu et al., 2003). While cloud ice does not affect the radiative fluxes, the cloud-driven radiative effects depend on Qc, the raindrop mixing ratio Qr, and the cloud and rain effective radii.
2.2 Supporting observations
The ARTofMELT expedition took place during May and June 2023 in the Fram strait onboard the Swedish icebreaker Oden. Tjernström and Zieger (2025) describe the observations used in this study in detail, so we only briefly summarize them here.
The modular multiplatform compatible air measurement system (MoMuCAMS) tethered balloon platform (Pohorsky et al., 2024, 2025) operated 23 times during the campaign (Pohorsky et al., 2026). The MoMuCAMS Helikite payload measured cloud droplet and aerosol number concentrations, aerosol size distributions and optical properties, and standard meteorological variables. A miniaturized scanning electrical mobility spectrometer (mSEMS model 9404, Brechtel Manufacturing Inc., USA) measured aerosol size distributions covering electrical mobility diameters between 8 and 280 nm, and a portable optical particle spectrometer (POPS, Handix Scientific, USA) covered optical diameters between 186 and 3370 nm. Mounted on the MoMuCAMS, an in-situ light optical aerosol counter (LOAC, Meteomodem, France) with a vertical inlet measured aerosol and cloud droplet size distributions from 200 nm up to 50 µm. The system also collected filter samples for offline analysis of INP concentrations (Creamean et al., 2026) and STXM/NEXAFS analysis (scanning transmission X-ray microscopy coupled with near-edge absorption fine structure spectroscopy; Santos et al., 2023) which provides information on chemical composition, mixing state, and morphology of individual aerosol particles. The MoMuCAMS sampled aerosol particles (including for the filters) through an interstitial inlet.
Onboard the Oden, instruments on the fourth deck continuously measured complementary aerosol physical and chemical properties and INP concentrations. For this study, we used INP filter sampling and immersion freezing assays to determine INP concentrations (Creamean et al., 2025). A CCN counter (CCNC, CCN-100, Droplet Measurement Technologies, USA) and a differential mobility particle sizer (DMPS, own development, see Karlsson et al., 2022), which sampled behind a whole-air inlet, were used to characterize aerosol hygroscopicity.
During the cruise, radiosondes (RS41, Vaisala, Finland; Murto et al., 2024a) were launched every 6 h to provide vertical profiles of temperature (T), relative humidity (RH), and horizontal winds (u,v). A microwave radiometer (HATPRO, Radiometer Physics GmbH, Germany; Tjernström et al., 2024), a 94 GHz Doppler cloud radar (RPG-FMCW-94-SP, Radiometer Physics GmbH, Germany; Guy et al., 2024b), and a lidar ceilometer (CL31, Vaisala, Finland; Murto et al., 2024b) operated continuously from the ship. The radiometer retrieved LWP with a typical uncertainty of 25 g m−2 (Westwater et al., 2001). To calculate liquid water content (LWC; Guy and Brooks, 2026) profiles, we identified liquid cloud layers using cloud radar and ceilometer data processed by CloudnetPy version 1.66.10 (Tukiainen et al., 2020), and subsequently distributed the LWP adiabatically across them. Full details of the specific CloudnetPy implementation and the assumptions used to generate the LWC profiles are described in Guy et al. (2025) and Guy and Brooks (2026), respectively. Ice water content (IWC) profiles were calculated by applying the default CloudnetPy method, which is based on a statistical relationship between temperature and radar reflectivity (Hogan et al., 2006). Vertical integration of the IWC profiles yielded an estimate of the ice water path (IWP). Quantifying the precise uncertainty for this derived IWP is difficult, though it likely approaches a factor of 2. Broadband radiometers (CGR4 and CMP22, Kipp and Zonen, The Netherlands; Guy et al., 2024a) deployed on the sea ice adjacent to Oden measured the upwelling and downwelling longwave and shortwave radiative fluxes with uncertainties of 3 % and 1 %, respectively.
2.3 Case description
For our case study, we selected a slightly supercooled mixed-phase stratocumulus observed west of northern Svalbard on 7 June 2023 (Pohorsky et al., 2026). During this period, Oden was moored to an ice floe at approximately 2.902° E, 79.565° N. Weak pressure gradients and a surface pressure of 1015.72 hPa measured aboard Oden characterized the synoptic conditions, as a pressure trough extended from the surface into the mid-troposphere directly over the ship (Fig. B1; Pohorsky et al., 2026). A stratocumulus layer developed around 06:00 UTC on 7 June, persisting and gradually rising for more than 48 h (Fig. 1). CloudnetPy classified the cloud as mixed-phase based on the presence of hydrometeors not meeting the criteria for classification as droplets in the ceilometer attenuated backscatter data (indicative of ice phase particles), and a positive liquid water path measured by the microwave radiometer. During three flights on 7 June 2023 (10:10–13:32, 14:31–17:35, and 19:09–22:13 UTC), the Helikite successfully conducted measurements below, within, and above the cloud layer, whereas filter sampling was restricted to within and above the cloud (Pohorsky et al., 2026). Continuous observations of ice needles on the ship deck and via the Helikite camera provided further physical evidence for an active ice phase, corroborating the mixed-phase classification derived from the remote sensing instrumentation.
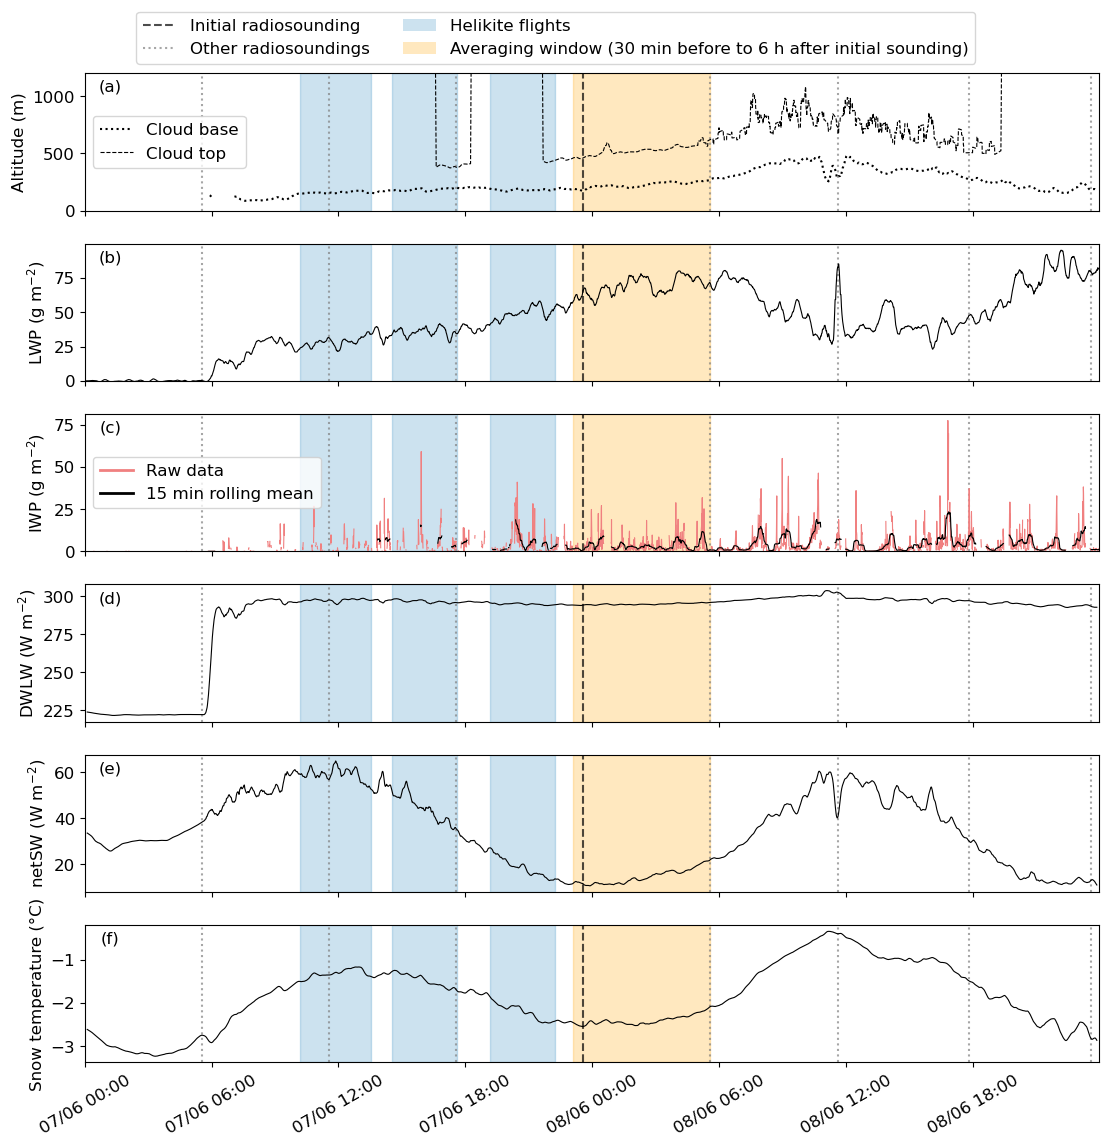
Figure 1Observations of (a) altitude of the cloud base and top (m), (b) LWP (g m−2), (c) IWP (g m−2), (d) downward longwave radiation at the surface (DWLW, W m−2), (e) net shortwave radiation at the surface (netSW, W m−2), and (f) snow temperature (°C) in 2 cm depth between 7 June 2023 00:00 UTC and 8 June 2023 23:59 UTC. All data plotted as average over a 15 min window, but for IWP (c) the raw data is added as well. Cloud base altitudes are retrieved from a ceilometer, cloud top altitudes from the cloud radar. The orange shading marks the evaluation period of the baseline simulation in Fig. 5.
2.4 Study setup
2.4.1 Common simulation setup
The LES simulations were initialized using T, RH, u, and v vertical profiles from the radiosonde launched at 23:34 UTC on 7 June 2023 (Fig. 2a–d), during a period when the cloud was relatively steady (Fig. 1) and the mimimum in-cloud temperatures were observed. By the time of the radiosounding, the cloud base was located at 125 m and the cloud top at 450 m. Temperatures ranged from approximately −5 °C at the cloud base to −7.5 °C at the top, placing the cloud well within the slightly supercooled AMPC regime defined earlier. MIMICA was further initialized with the radiometer-derived LWC profile from the same time, shifting it vertically to align with the saturated layer inferred from the radiosonde to obtain a physically consistent initial state (Fig. 2e). We assigned all initial LWC exclusively to the cloud droplet category (Qc), omitting any initial raindrops.
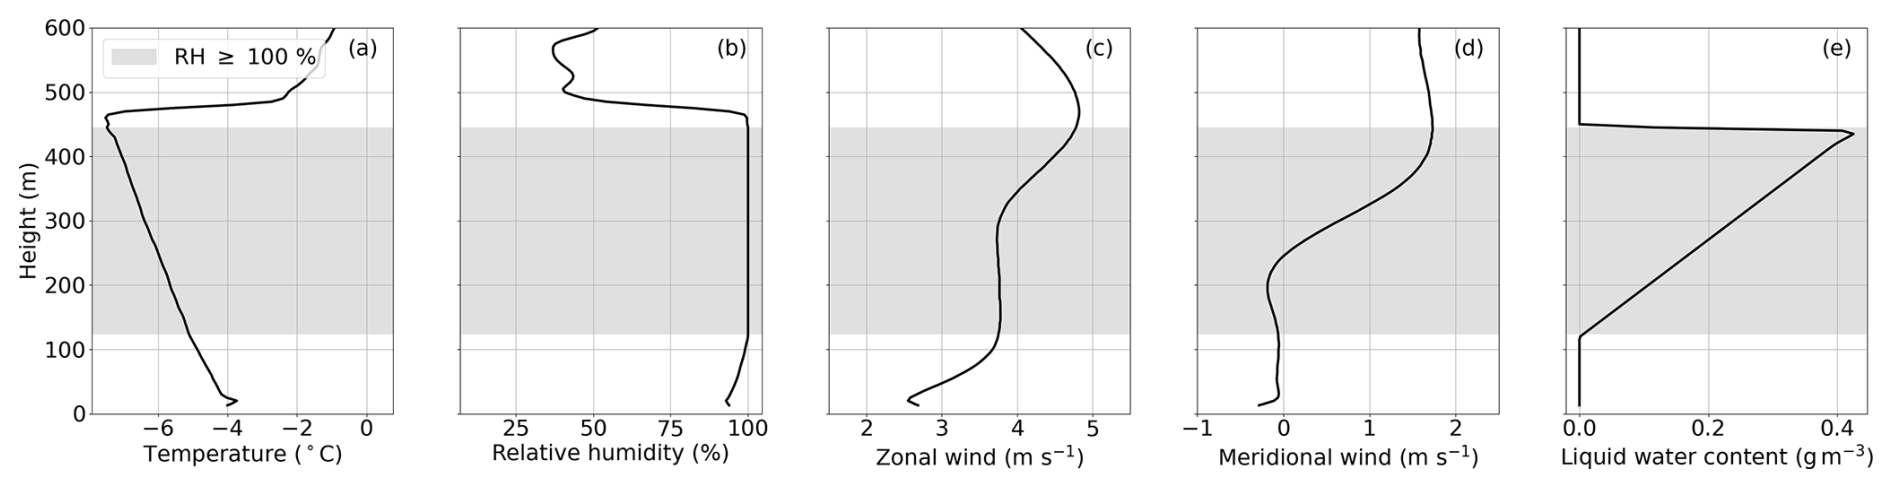
Figure 2Initial profiles of (a) temperature (T, °C), (b) relative humidity (RH, %), (c) zonal wind (u, m s−1), (d) meridional wind (v, m s−1), and (e) liquid water content (LWC, g m−3) observed on 7 June 2023 at 23:34 UTC. The gray-shaded area highlights the cloud layer, where the air is saturated with respect to water.
All simulations used a grid with a uniform horizontal spacing of m. The vertical grid spacing dz varied between 7.5 and 30 m, with the finest resolution from the surface to the entrainment layer above the cloud, and then coarsening linearly to the model top. Thus, the total domain measured 6 km × 6 km × 1.5 km, and included periodic horizontal boundary conditions. To ensure a realistic vertical placement of the simulated cloud, we imposed large-scale subsidence via a horizontal divergence of s−1. Other than this constant horizontal divergence, MIMICA was not forced with time-dependent large-scale boundary conditions; therefore the simulations are not intended to reproduce the temporal evolution of the observed cloud. We instead focused our analysis on the final 2 h of the simulations. To dampen gravity waves, the uppermost 400 m of the domain functioned as a sponge layer with a 30 min relaxation time scale. Time integration used a second-order Runge-Kutta scheme with an adaptive time step (≈ 1–4 s) to satisfy the Courant-Friedrichs-Lewy stability criterion. To accelerate the onset of turbulence, we perturbed the initial potential temperature profile with random noise of up to ±0.1 K across the lowest six model levels (i.e., up to 41.2 m). The first 3 h of simulation time are considered as spin-up period. We applied subgrid-scale turbulent diffusion to momentum and scalars, including microphysical quantities such as hydrometeor number concentrations. Supported by observations, we fixed the Prandtl number at 0.7 and set scalar diffusivities to approach 0 at an altitude of 1400 m. At the lower boundary, we fixed the surface temperature at −2.55 °C, matching the observed snow temperature at the highest depth (Fig. 1f). Imposing a constant surface temperature inhibits potential radiative cooling of the surface. Consistent with a sea ice surface, we set the surface moisture to saturation, the surface albedo to 0.85, and the surface longwave emissivity to 0.984. Based on eddy covariance observations from the foremast of the ship, we prescribed the surface roughness length scales, for momentum as m and for scalars as m. We derived the geostrophic wind components (ug=1.6783 and vg=3.1345 m s−1) from the mean wind observed by the radiosonde between 1500 and 3500 m altitude. For the collisional breakup-parameterization, we set the rimed fraction of the breaking hydrometeor to 0.4, representing the maximum value used in Sotiropoulou et al. (2021). Parameters that varied between simulations included the total aerosol number concentration, aerosol type, prescribed ICNC, and ice habit, which are detailed in the following sections.
2.4.2 Baseline simulation
We first present a baseline simulation configured to represent the observed mean conditions as closely as possible. The baseline setup incorporated the initial profiles from Sect. 2.3, the common settings from Sect. 2.4.1, and a derived aerosol number size distribution representing the total aerosol available at cloud top. Observations from 7 June indicated that the surface and below-cloud aerosol had undergone cloud processing; however, the resulting aerosol population was not sufficient to explain the cloud droplet number concentrations measured by the Helikite (Pohorsky et al., 2026). Therefore, aerosol particles entrained from the free troposphere must constitute a primary source. To estimate the actual aerosol available for cloud droplet formation, we calculated this baseline distribution by mixing the observed size distributions from below the cloud and the free troposphere (red line in Fig. 3). This distribution is bimodal, with an Aitken mode and an accumulation mode, and a total aerosol number concentration of 220.6×10⁶ m−3. We used ship-based observations of aerosol number size distributions and CCN concentrations to estimate a hygroscopicity parameter of κ≈0.58 (Pohorsky et al., 2026), a highly hygroscopic value. This high hygroscopicity aligns with the STXM/NEXAFS-analysis of Helikite filter samples, which identified ammonium sulfate as the dominant component across the aerosol particle population. Accordingly, we specified the aerosol density and molecular weight in the baseline simulation to match those of ammonium sulfate. For the ice crystal habit, we selected columns, consistent with the local thermodynamic conditions (e.g., Pruppacher and Klett, 2010) and similar to the ice needles observed aboard Oden. We represented ice formation by prescribing a fixed ice crystal number concentration (ICNC0) where °C and cloud droplets are present ( kg kg−1). The resulting change in ICNC (ΔICNC) at each model time step and grid cell is:
where ICNC and CDNC represent the current ice crystal and cloud droplet number concentrations, respectively. This means that ice formation is not coupled to aerosols. To determine the prescribed ICNC0 in the baseline simulation, we used the 25th percentile of the observed IWP distribution (Sect. 2.3), assumed a cloud depth of 310 m and ice column length 200 µm, which yielded an ICNC of approximately 900 m−3. We selected the lower IWP quartile to mitigate the risk of overestimation, given the substantial uncertainties inherent in the IWP retrieval. An ICNC of approximately 1,000 m−3 aligns with typical values observed in AMPCs (e.g., Fu et al., 2019; Sotiropoulou et al., 2020). We compared the baseline simulation against the observed distributions of LWP, IWP, and DWLW across a window spanning 30 min prior to 6 h after the radiosonde launch. This focus on the post-launch period reflects the simulation setup, which initialized from the radiosonde sounding and integrated forward in time. Throughout this period, the three quantities remained relatively stable with respective median values of 69.2 g m−2, 1.5 g m−2, and 294.6 W m−2. Additionally, we compared the simulated net surface shortwave radiation (netSW) against the corresponding observations, smoothed using a 15 min sliding average.
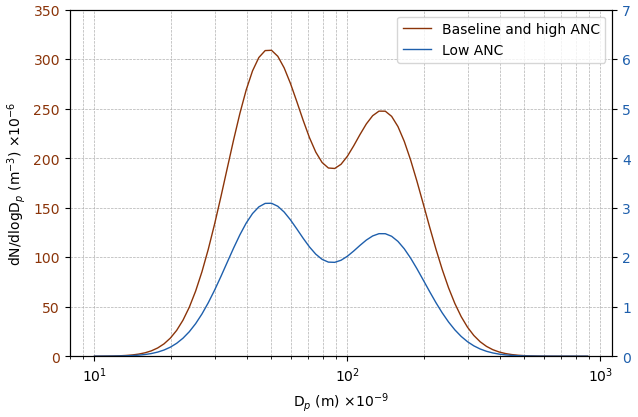
Figure 3Aerosol size distributions (, m−3) depending on aerosol diameter (Dp, m) used in the baseline simulation and for the factorial analysis. Note the different y-axes for the two distributions. The Aitken and accumulation modes of both size distributions have geometric mean diameters of 48.2 and 140 × 10−9 m, and geometric standard deviations of 1.45 and 1.44, respectively. The total number concentrations for the high ANC distribution are 123.7 × 10⁶ m−3 for the Aitken mode and 96.9 × 10⁶ m−3 for the accumulation mode, while these values are two orders of magnitude lower for the low ANC distribution. This results in total aerosol number concentrations of 220.6 × 10⁶ m−3 for high ANC, and 2.2 × 10⁶ m−3 for low ANC.
2.4.3 Observed INP concentrations
During the slightly supercooled AMPC event, instruments on both the Helikite and the ship sampled INP concentrations (Fig. 4; see Sect. 2.3). Shipboard filters sampled 20 785 and 20 480 m3 of total air during 7 and 8 June, respectively. Helikite filter samples were collected only during flight periods through an interstitial inlet, resulting in limited sampling durations and corresponding air volumes ( and m3 for in-cloud and above-cloud, respectively). Detecting warm-temperature INPs (active at °C, typically biological) requires sampling large air volumes, as they occur at very low concentrations, especially prior to melt onset due to a lack of biological activity (e.g., Wex et al., 2019; Hartmann et al., 2021; Barry et al., 2025). The low sampling volumes therefore explain why the Helikite-derived INP concentrations span only a narrow, low temperature range between approximately −31 and −22 °C (Fig. 4). The sample volume V determines the theoretical minimum detectable INP concentration: . This relation yields an INPmin of 40 and ≈ 8.3 m−3 for the in-cloud and above-cloud samples, respectively. Notably, the highest INP concentrations were observed within the cloud, exceeding those measured both above the cloud and on the ship (Fig. 4). This difference lies outside the 95 % confidence intervals of the individual INP spectra, indicating a statistically significant in-cloud enhancement. We speculate that these elevated in-cloud INP concentrations primarily originated from long-range transported aerosol entrained from the free troposphere, aligning with findings that free-tropospheric sources were an important contribution to the CCN forming the cloud droplets (Pohorsky et al., 2026) and potentially INPs on other days of the expedition. During above-cloud INP sampling, the Helikite remained within approximately 30 m of the cloud top; this shallow layer may already have undergone INP detrainment. However, the very small sampling volume characterizing the in-cloud observation could have introduced an overestimation in the resulting INP concentrations. Furthermore, below-cloud sources likely contributed a fraction of the observed in-cloud INP population. Although an interstitial aerosol inlet was used, it likely collected smaller cloud hydrometeors alongside the aerosol, increasing the measured in-cloud INP concentration. The interpretation is additionally complicated by a temporal gap of more than 4 h between the above-cloud and in-cloud filter sampling. Both spectra converge toward warmer temperatures, indicating that the small sampling volume may obscure similarities in this warmer regime. Consequently, the apparent differences between the spectra might seem disproportionately large simply because the observations are restricted to colder temperatures. A more detailed attribution of these INP observations remains beyond the scope of this study.
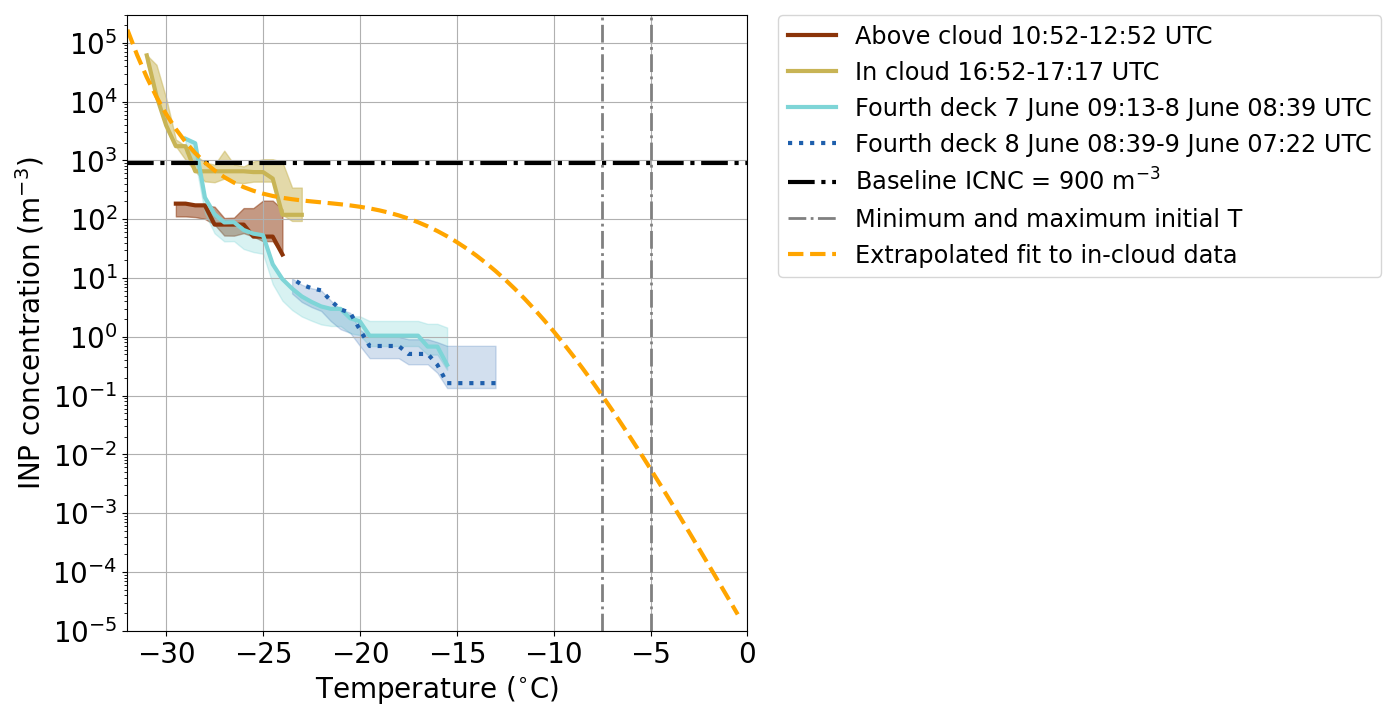
Figure 4INP concentrations (m−3) depending on temperature (°C) from filters sampled above the cloud, in the cloud, and on the fourth deck of the ship during the slightly supercooled AMPC event. The shaded areas around the INP concentration lines indicate the 95 % confidence interval of the measurements. The dashed orange line displays an extrapolated fit to the in-cloud observations and was used in a simulation. The black dash-dotted line shows the prescribed ICNC used in the baseline simulation as reference, since in the simulation using the extrapolated INP observations, one INP corresponds to one ice crystal (Eq. 2). The vertical gray dash-dotted lines indicate the minimum and maximum cloud temperature at the start of the simulations.
We applied a polynomial fit to extrapolate the in-cloud INP concentration toward higher temperatures (orange dashed line in Fig. 4). The extrapolation assumes a plateau in INP concentrations between approximately −25 and −17 °C, consistent with observations of biological aerosol (e.g., Tobo et al., 2019). This fit effectively represents an upper bound on plausible INP concentrations. We used this INP extrapolation as a temperature-dependent ice nucleation parameterization in MIMICA. At each model time step, the temperature-dependent INP(T) value is diagnosed. If the modeled ICNC falls below INP(T) and sufficient cloud droplets exist, the required number of droplets are frozen instantaneously to match INP(T):
This ice nucleation parameterization therefore remains entirely independent of the aerosol driving cloud droplet formation in MIMICA. In practice, INP(T) acts as a lower bound on the ICNC as other processes like advection and SIP can further increase the ICNC. For the simulation including observed INPs, this INP(T) approach replaced the prescribed ICNC used in the baseline setup. Within the temperature range of the observed cloud, the extrapolated INP(T) yields ICNC values at least four orders of magnitude lower than those prescribed in the baseline simulation, namely between and 10−1 m−3 (Fig. 4).
To minimize spin-up effects (the rapid initial adjustment toward a dynamically and microphysically consistent cloud state), we initialized the observed INP(T) simulation using the state of the baseline simulation at 3 h. Consequently, at the start of the INP(T) simulation, the ICNC equaled at least 900 m−3 within cloud regions where °C.
2.4.4 Factorial analysis
We applied the factorial analysis (e.g., Teller and Levin, 2008; Ickes et al., 2026) to quantify the relative importance of four aerosol and cloud parameters for the simulated LWP, IWP, and DWLW. Each parameter was assigned two values, and we performed simulations for all 24=16 combinations. The factorial analysis additionally quantifies interactions between parameters, revealing how strongly the impact of one parameter on, e.g., LWP depends on the value of another parameter. The method estimates individual parameter effects and their combined interactions by comparing the mean LWP, IWP, and DWLW between the two values of a specific parameter, averaged across all values of all remaining parameters. Finally, an analysis of variance (ANOVA) decomposition of the total sum of squares quantifies the total variance contribution of each parameter and all interactions in relative terms.
We selected the variables LWP, IWP, and DWLW for this analysis because they directly impact the surface energy balance or constitute some of its key components. An additional analysis of net shortwave radiation at the surface yielded variance contributions very similar to those of LWP and is therefore omitted here.
2.4.5 Parameter values for factorial analysis
We selected four parameters for the factorial analysis: aerosol number concentration (ANC), aerosol type (Atype), ICNC, and ice crystal habit (IChab). We restricted the choice of parameters to aerosol and cloud microphysical quantities directly adjustable within the MIMICA configuration settings and that can, in principle, be constrained by observations. For example, our MIMICA setup prognosed CDNC directly from aerosol properties (type and number size distribution); therefore, we could not prescribe CDNC independently of the aerosol population in the same way we did for ICNC. Similarly, the microphysical scheme diagnoses all hydrometeor mean sizes, meaning they cannot be prescribed individually. Vertical winds and turbulence (e.g., the choice of the subgrid-scale turbulence scheme) represent another potentially important source of uncertainty, but observationally constraining the most appropriate scheme for a specific case remains difficult. While individual turbulence-related parameters, such as surface roughness lengths or the turbulent Prandtl number, could be included in the factorial analysis, this would broaden the analysis beyond aerosol-microphysics uncertainties. This extension would shift the focus toward turbulence-closure uncertainty and require substantially more simulations, placing it beyond the scope of this study.
Table 1The parameters for the factorial analysis, their values for the baseline simulation, and the two values for the factorial analysis.
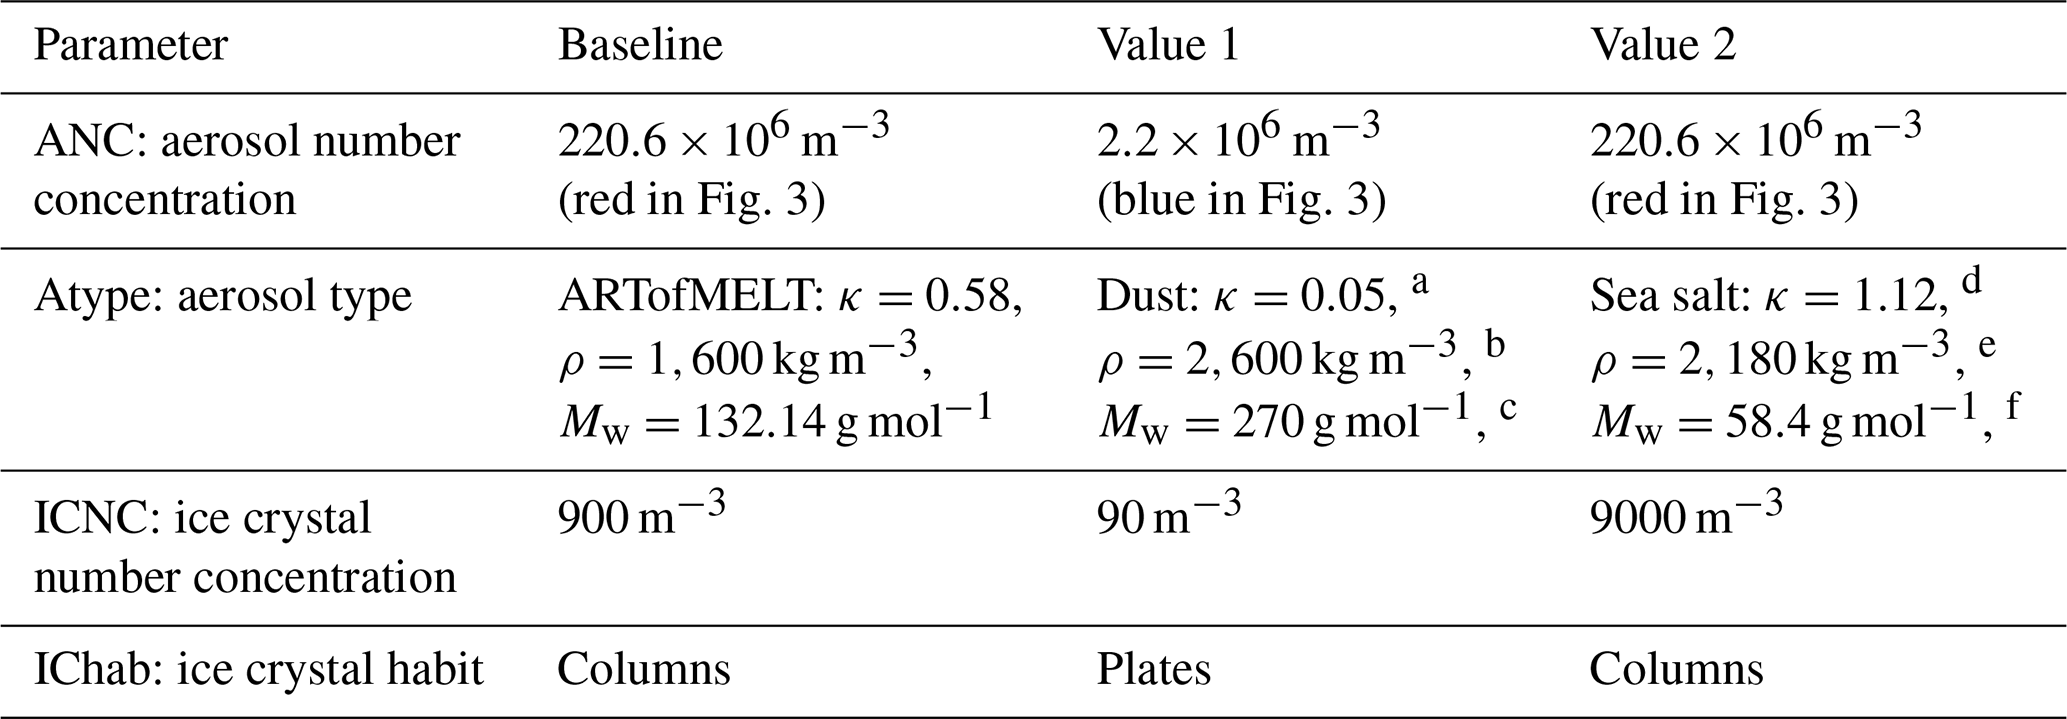
a Sullivan et al. (2009). b Hess et al. (1998). c Estimated from standard atomic weights of Feldspar (KAlSi3O8) and Kaolinite (Al4Si4O10(OH)8). d Zieger, et al. (2017). e Schwarz et al. (2024). f Lide (2004).
The factorial analysis results depend strongly on the selected parameter values, and the analysis ranks the included parameters exclusively within the tested ranges; we therefore briefly justify the values used for this sensitivity study (third and forth columns in Table 1). Section 2.4.2 describes the baseline values (second column in Table 1). For ANC, the observed total aerosol number concentration of 220.6×10⁶ m−3, covering diameters from 8 to 280 nm, represents typical Arctic conditions (e.g., Boyer et al., 2023, who measured diameters between 10 and 500 nm). Further ANC increases did not considerably affect the simulated LWP, IWP, or DWLW (magenta line in Fig. B2 for a simulation with 10× ANC). We tested decreasing ANC by one order of magnitude, which slightly affected LWP and DWLW (dashed green line in Fig. B2); however, this value of 220.6×10⁵ m−3 remains above the CCN-limited (“tenuous cloud”) regime discussed by Mauritsen et al. (2011), leading us to expect no considerable impact from this ANC value. We therefore retained the baseline value as the high ANC value and used a value two orders of magnitude lower as the low ANC value. This low ANC value of 2.2×10⁶ m−3 reaches into the tenuous cloud regime and represents possible Arctic spring conditions. For example, similarly low ANC was observed during ARTofMELT on 3 June 2023 (Pohorsky et al., 2026). All simulations employed the bimodal aerosol size distribution described in Sect. 2.4.2, with both modes decreased by two orders of magnitude for the low ANC value (blue line in Fig. 3). For Atype, two species implemented in MIMICA are plausible for the high Arctic and our aerosol size distribution: dust (Tobo et al., 2019; Herbert et al., 2026) and sea salt (e.g., Gong et al., 2023). We selected these species to represent contrasting compositions and to quantify the sensitivity to aerosol type relative to the other parameters. Lacking direct constraints, the baseline ICNC value itself constitutes an estimate (Sect. 2.4.2). For the factorial analysis, we explored values one order of magnitude lower and higher than this baseline. ICNC between 90 and 9000 m−3 are typically observed in AMPCs (e.g., McFarquhar et al., 2007; Sotiropoulou et al., 2020; Järvinen et al., 2023). Finally, the ice crystal habit columns best matched the in-cloud thermodynamic conditions (Sect. 2.4.2), but plates are a plausible ice habit under slightly colder or more humid conditions; we therefore used plates as the alternative IChab values in the factorial analysis.
2.4.6 Simulation setup for factorial analysis
The parameter ANC primarily influenced most simulated variables; therefore, we initially ran two 3 h spin-up simulations using the baseline setup configured with the respective high and low ANC values. We then initialized each factorial analysis simulation by restarting from the corresponding 3 h spin-up state, at which point we adjusted the parameters Atype, ICNC, and IChab to their respective simulation values. The simulations were continued for an additional 9 h, yielding a total simulation time of 12 h.
3.1 Baseline simulation
Using the baseline setup described in Sect. 2.4.2, the simulated LWP lies between the 75th and 90th percentiles of the observations towards the end of the simulation time (solid black line in Fig. 5a). After the 3 h spin-up period, LWP remains relatively steady before decreasing slightly toward the end of the simulation. As noted previously, we do not aim to reproduce the observed temporal evolution; we instead focus on the conditions during the final 2 h of the simulation. The simulated IWP lies slightly below the 10th percentile of the observations (Fig. 5b). The IWP retrieval is subject to substantial uncertainty (Sect. 2.2); against this background, it is encouraging that the simulation produces non-zero IWP (0.19 g m−2 averaged over the final 2 h; Table 3).
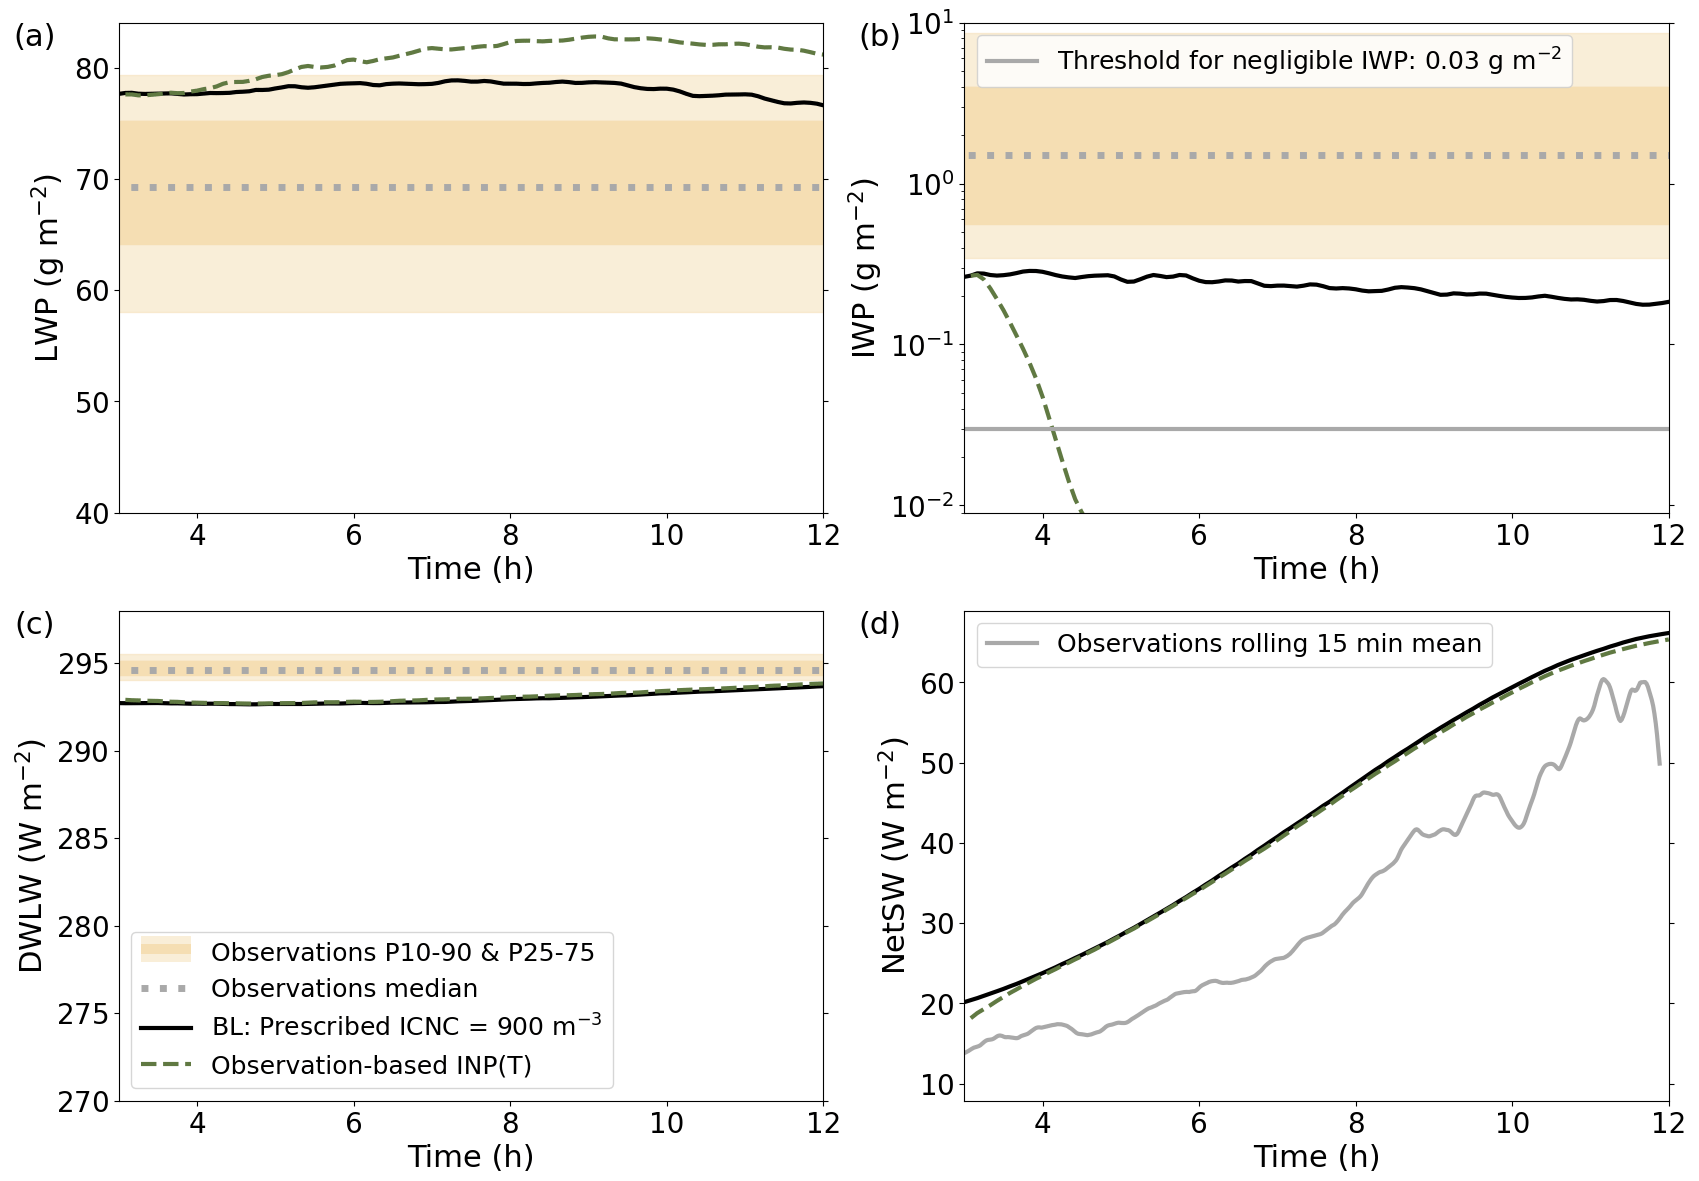
Figure 5Horizontally averaged (a) LWP (g m−2), (b) IWP (g m−2), (c) DWLW (W m−2) and (d) netSW (W m−2) for the baseline (BL) simulation with prescribed ICNC and using an observation-based INP(T) ice nucleation scheme. The 10th, 25th, 75th, and 90th percentiles of LWP, IWP, and DWLW observations are indicated by the orange bars of differing shade, and the median by the dotted gray line, while the threshold for negligible IWP and the rolling 15 min mean of the observed netSW are shown by gray lines in panels (b) and (d). Note the logarithmic axis for IWP in panel (b).
By the end of the simulation, DWLW aligns closely with the lower percentiles of the observations (Fig. 5c and Table 3). DWLW increases slightly over time because its primary contribution originates from the cloud base, where the temperature gradually rises (Fig. B3a). Consistent with increasing solar radiation, netSW increases throughout the simulation, exceeding the observations by 5 to more than 10 W m−2 (Fig. 5d).
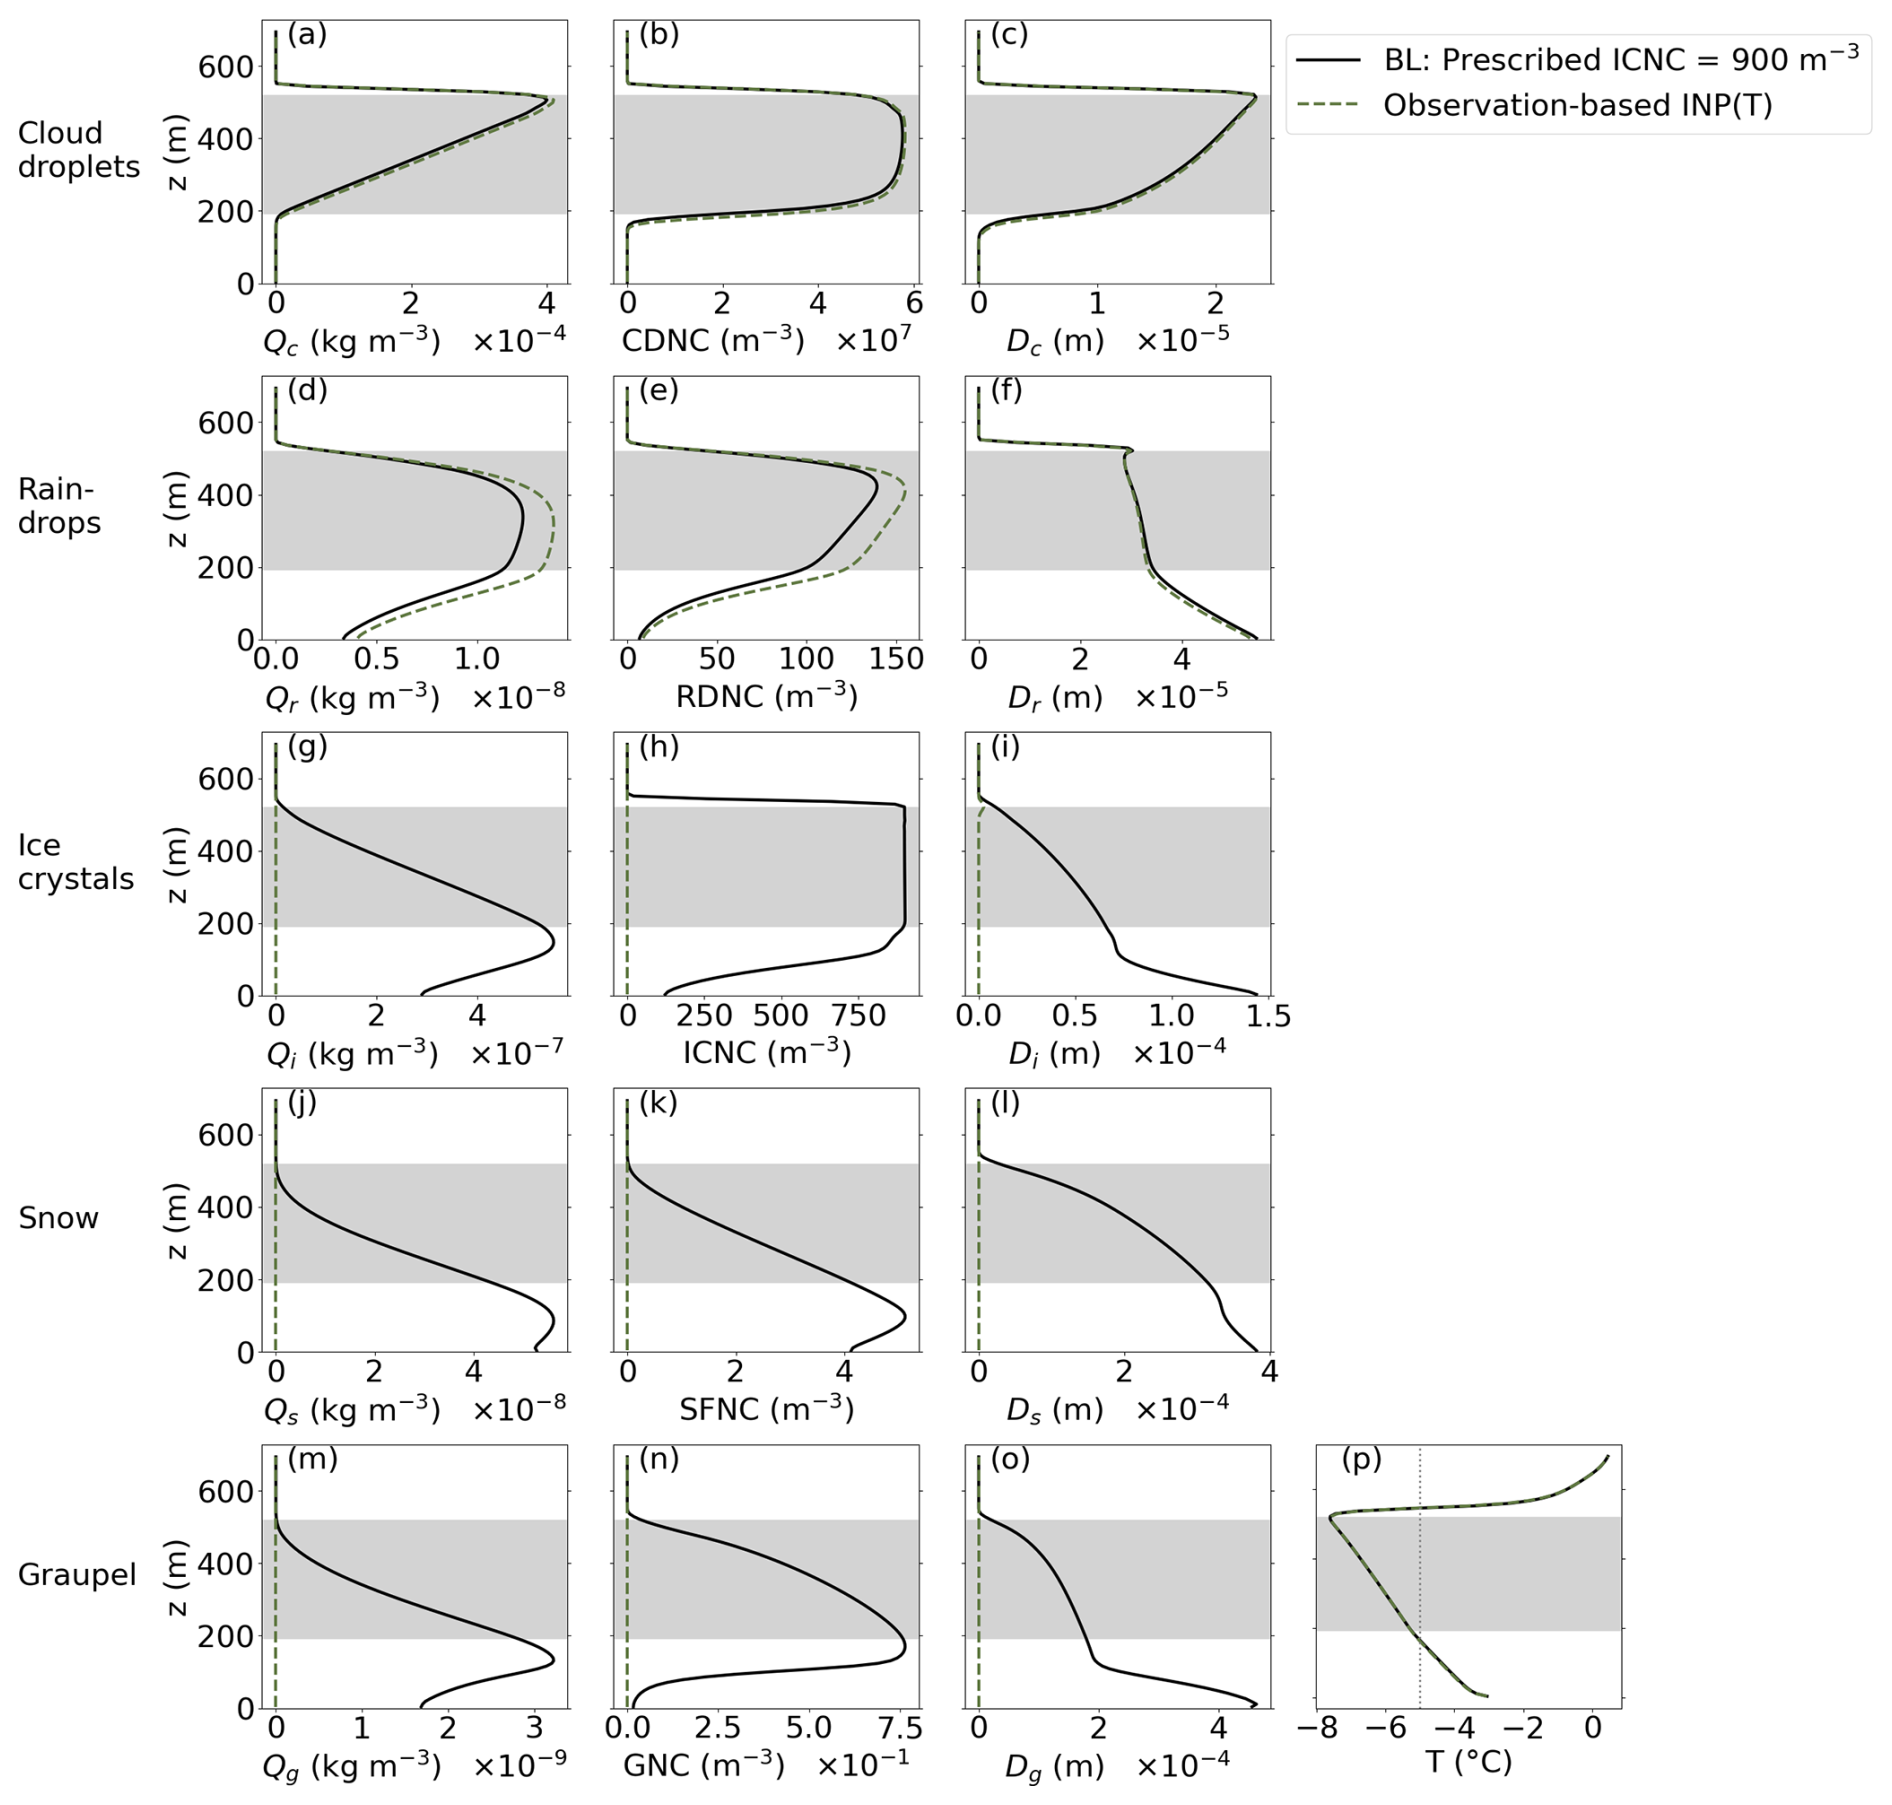
Figure 6Profiles averaged horizontally and over the final 2 h simulation time of (a, d, g, j, m) mixing ratios (Q, kg m−3), (b, e, h, k, n) number concentrations (NC, m−3), and (c, f, i, l, o) mean-mass diameters (D, m) of (a–c) cloud droplets, (d–f) raindrops, (g–i) ice crystals, (j–l) snow, and (m–o) graupel, as well as (p) T (°C) for the baseline simulation with prescribed ICNC and using an observation-based INP(T) ice nucleation scheme. Note that x-axis ranges differ between subplots within each column. The gray area indicates the mean cloud altitudes of the baseline simulation, defined by kg m−3. In panel (p), the vertical dotted gray line shows °C, the threshold value above which no cloud droplets are frozen when using prescribed ICNC (Eq. 1).
The simulated vertical structure aligns with the characteristic features of low-level AMPCs. Liquid water mass peaks near the cloud top (Qc in Fig. 6a), whereas the maximum frozen-water mass occurs near the cloud base (ice, snow, and graupel mixing ratios Qi, Qs, and Qg in Fig. 6g, j, m) – a distribution consistent with previous Arctic observations (Shupe et al., 2008). Liquid dominates the total condensate mass (Figs. 5 and 6), reflecting typical AMPC properties expected at these relatively high in-cloud temperatures. The CDNC peaks within the mid-cloud layer and decreases sharply toward the cloud top and base (Fig. 6b), reflecting the entrainment of drier air at the cloud boundaries. Raindrop number concentration (RDNC) is highest near the cloud top, decreasing toward the cloud base (Fig. 6e). Given that Qr remains relatively constant in the lower cloud (Fig. 6d), this vertical structure indicates that collision-coalescence produces fewer but larger raindrops at lower levels (mean raindrop diameter Dr in Fig. 6f). Throughout the cloud layer, ICNC remains at the prescribed value of 900 m−3 (Fig. 6h). The number concentrations of the other frozen hydrometeors (snowflake number concentration, SFNC, and graupel number concentration, GNC) remain small throughout the domain, peaking at or below the cloud base (Fig. 6k, n).
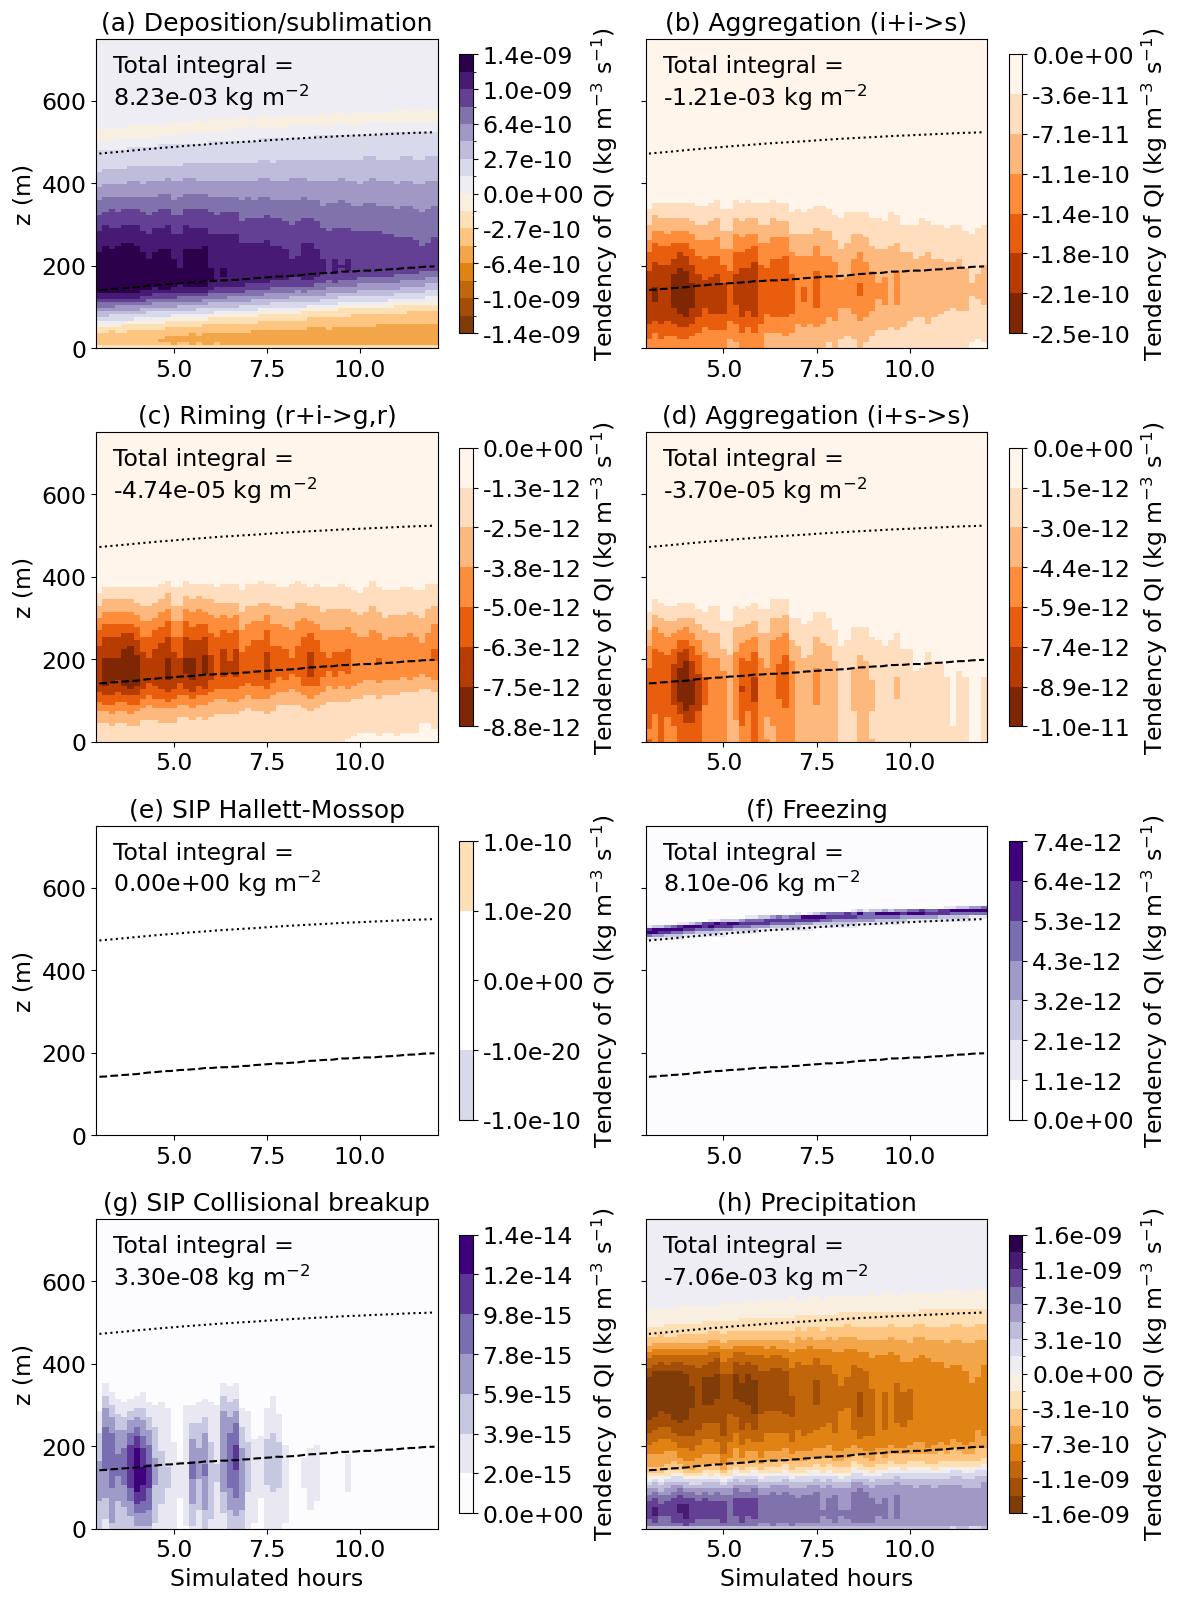
Figure 7Horizontally averaged profiles of the baseline simulation Qi process rates (kg m−3 s−1) for (a) deposition (positive)/sublimation (negative), (b) autoconversion to snow, (c) riming, (d) aggregation of ice and snow, (e) SIP rime-splintering, (f) freezing of cloud droplets, (g) SIP collisional breakup, and (h) precipitation. The integrated value over time and altitude is shown in the top of each panel, dashed lines indicate the horizontally averaged cloud base, and the dotted line marks the cloud top altitude defined where kg m−3.
Figure 7 summarizes the process rates for Qi. Deposition represents the primary source for Qi (net positive; Fig. 7a), while precipitation acts as the dominant sink (net negative; Fig. 7h). SIP processes contribute only weakly in the baseline simulation. Rime-splintering is entirely absent (Fig. 7e) – although cloud temperatures fall within the Hallett-Mossop range (−8 to −3 °C; Hallett and Mossop, 1974), the mean cloud droplet diameters Dc remain well below the 50 µm threshold required by MIMICA (Fig. 6c). The other implemented SIP process, collisional breakup, is active primarily until approximately 4.5 h and again between 5.5 and 7 h of simulation time (Fig. 7g), but its vertically and temporally integrated Qi tendency remains orders of magnitude smaller than for other Qi processes.
The ceilometer data (Fig. 1a) indicate continuous cloud cover starting from approximately 07:00 UTC on 7 June. The baseline simulation successfully captured this persistence, maintaining a fully overcast domain throughout the simulation. Furthermore, cumulative surface precipitation remained below 0.1 mm in both the observations and the simulation.
3.2 Simulation with observation-based INP(T)
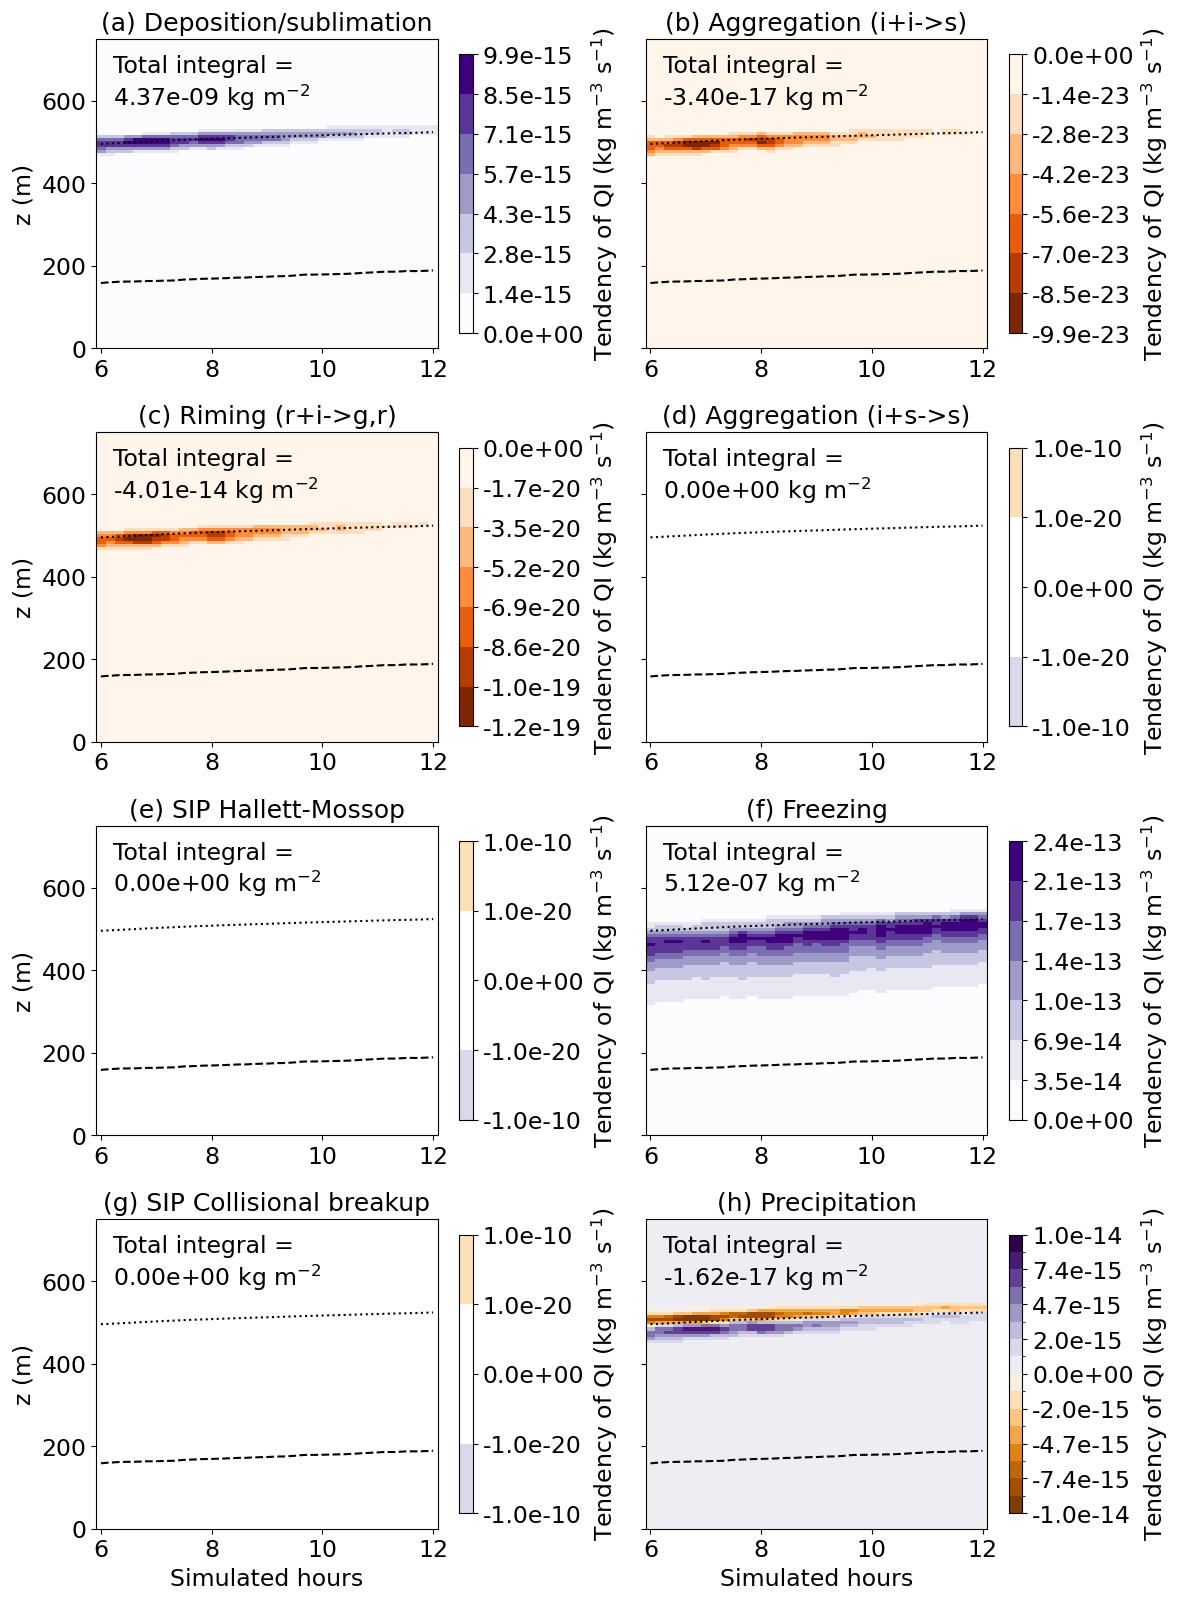
Replacing the prescribed ICNC in the baseline simulation with the temperature-dependent INP(T) parameterization (Eq. 2) results in an LWP 4.5 g m−2 higher than in the baseline simulation, exceeding the 90th percentile of the observed LWP distribution (Fig. 5a; Table 3). Simultaneously, this simulation produces zero IWP (Fig. 5b; Table 3). Horizontally averaged profiles confirm the absence of frozen hydrometeors (Fig. 6g, h, j, k, m, n). Under the specific atmospheric conditions of this case, the model is unable to produce IWP > 0 based on the observed INP concentrations. To form the IWP of 0.2 g m−2 in the baseline simulation, an ICNC of 900 m−3, was required. The INP(T)-based parameterization produces an ICNC at least four orders of magnitude lower than the baseline simulation (Fig. 4), explaining the absence of an appreciable ice mass. The Qi process rates confirm that some freezing occurs (Fig. 8f), but the tendency is almost one order of magnitude lower than in the baseline simulation (Fig. 7f). This produces too few ice crystals to support depositional growth (Fig. 8a). The few ice crystals that do form remain too small and too few to trigger any SIP processes (Fig. 8e, g), further preventing the development of an appreciable ice mass.
3.3 Factorial analysis
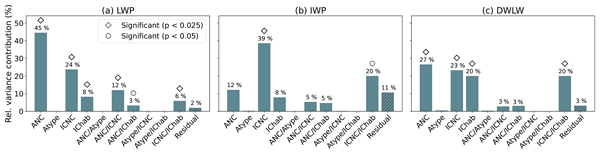
Among the four analyzed parameters (ANC, Atype, ICNC, and IChab), ANC contributes the largest relative variance share (44.5 %) to LWP and acts as the dominant parameter for DWLW, whereas it contributes considerably less to the IWP variance (Fig. 9; Table 2). The boxplots in Fig. 10 illustrate this strong influence: the blue and green ANC boxes do not overlap for LWP and DWLW, with the exception of simulations ancHI_atypeD_icncHI_ichabP and ancHI_atypeS_icncHI_ichabP (Table 3). These two specific simulations result in a glaciated cloud without LWP and exhibiting minimal DWLW, even when using the high ANC value (Table 3). Comparing two example simulations (ancLO_atypeD_icncLO_ichabP and ancHI_atypeD_icncLO_ichabP) reveals the physical mechanisms driving these differences between low and high ANC. Using the low ANC value yields a substantially smaller CDNC, as fewer aerosols are available to act as CCN (Fig. 11a).
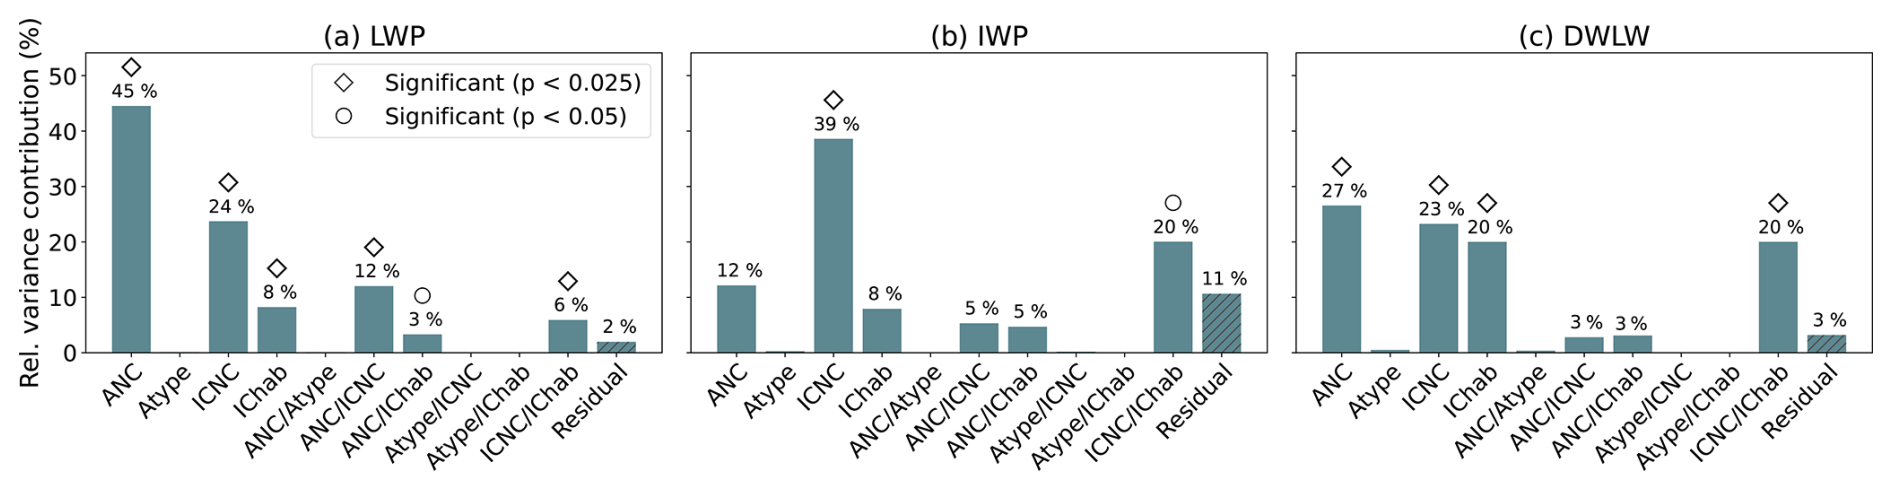
Figure 9Relative variance contribution (%) of the different parameters and their two-way interactions for (a) LWP, (b) IWP, and (c) DWLW. The last, hatched bar shows the residual of the factorial analysis, i.e., how much of the variance cannot be explained by the four parameters and their interactions. If the relative variance contribution is larger than 1 %, it is specified at the top of the bar. Diamonds indicate statistical significance at the 2.5 % level, circles at the 5 % level.
Table 2Relative variance contributions of the factorial parameters and their two-way interactions for LWP, IWP, and DWLW, as well as the residual.
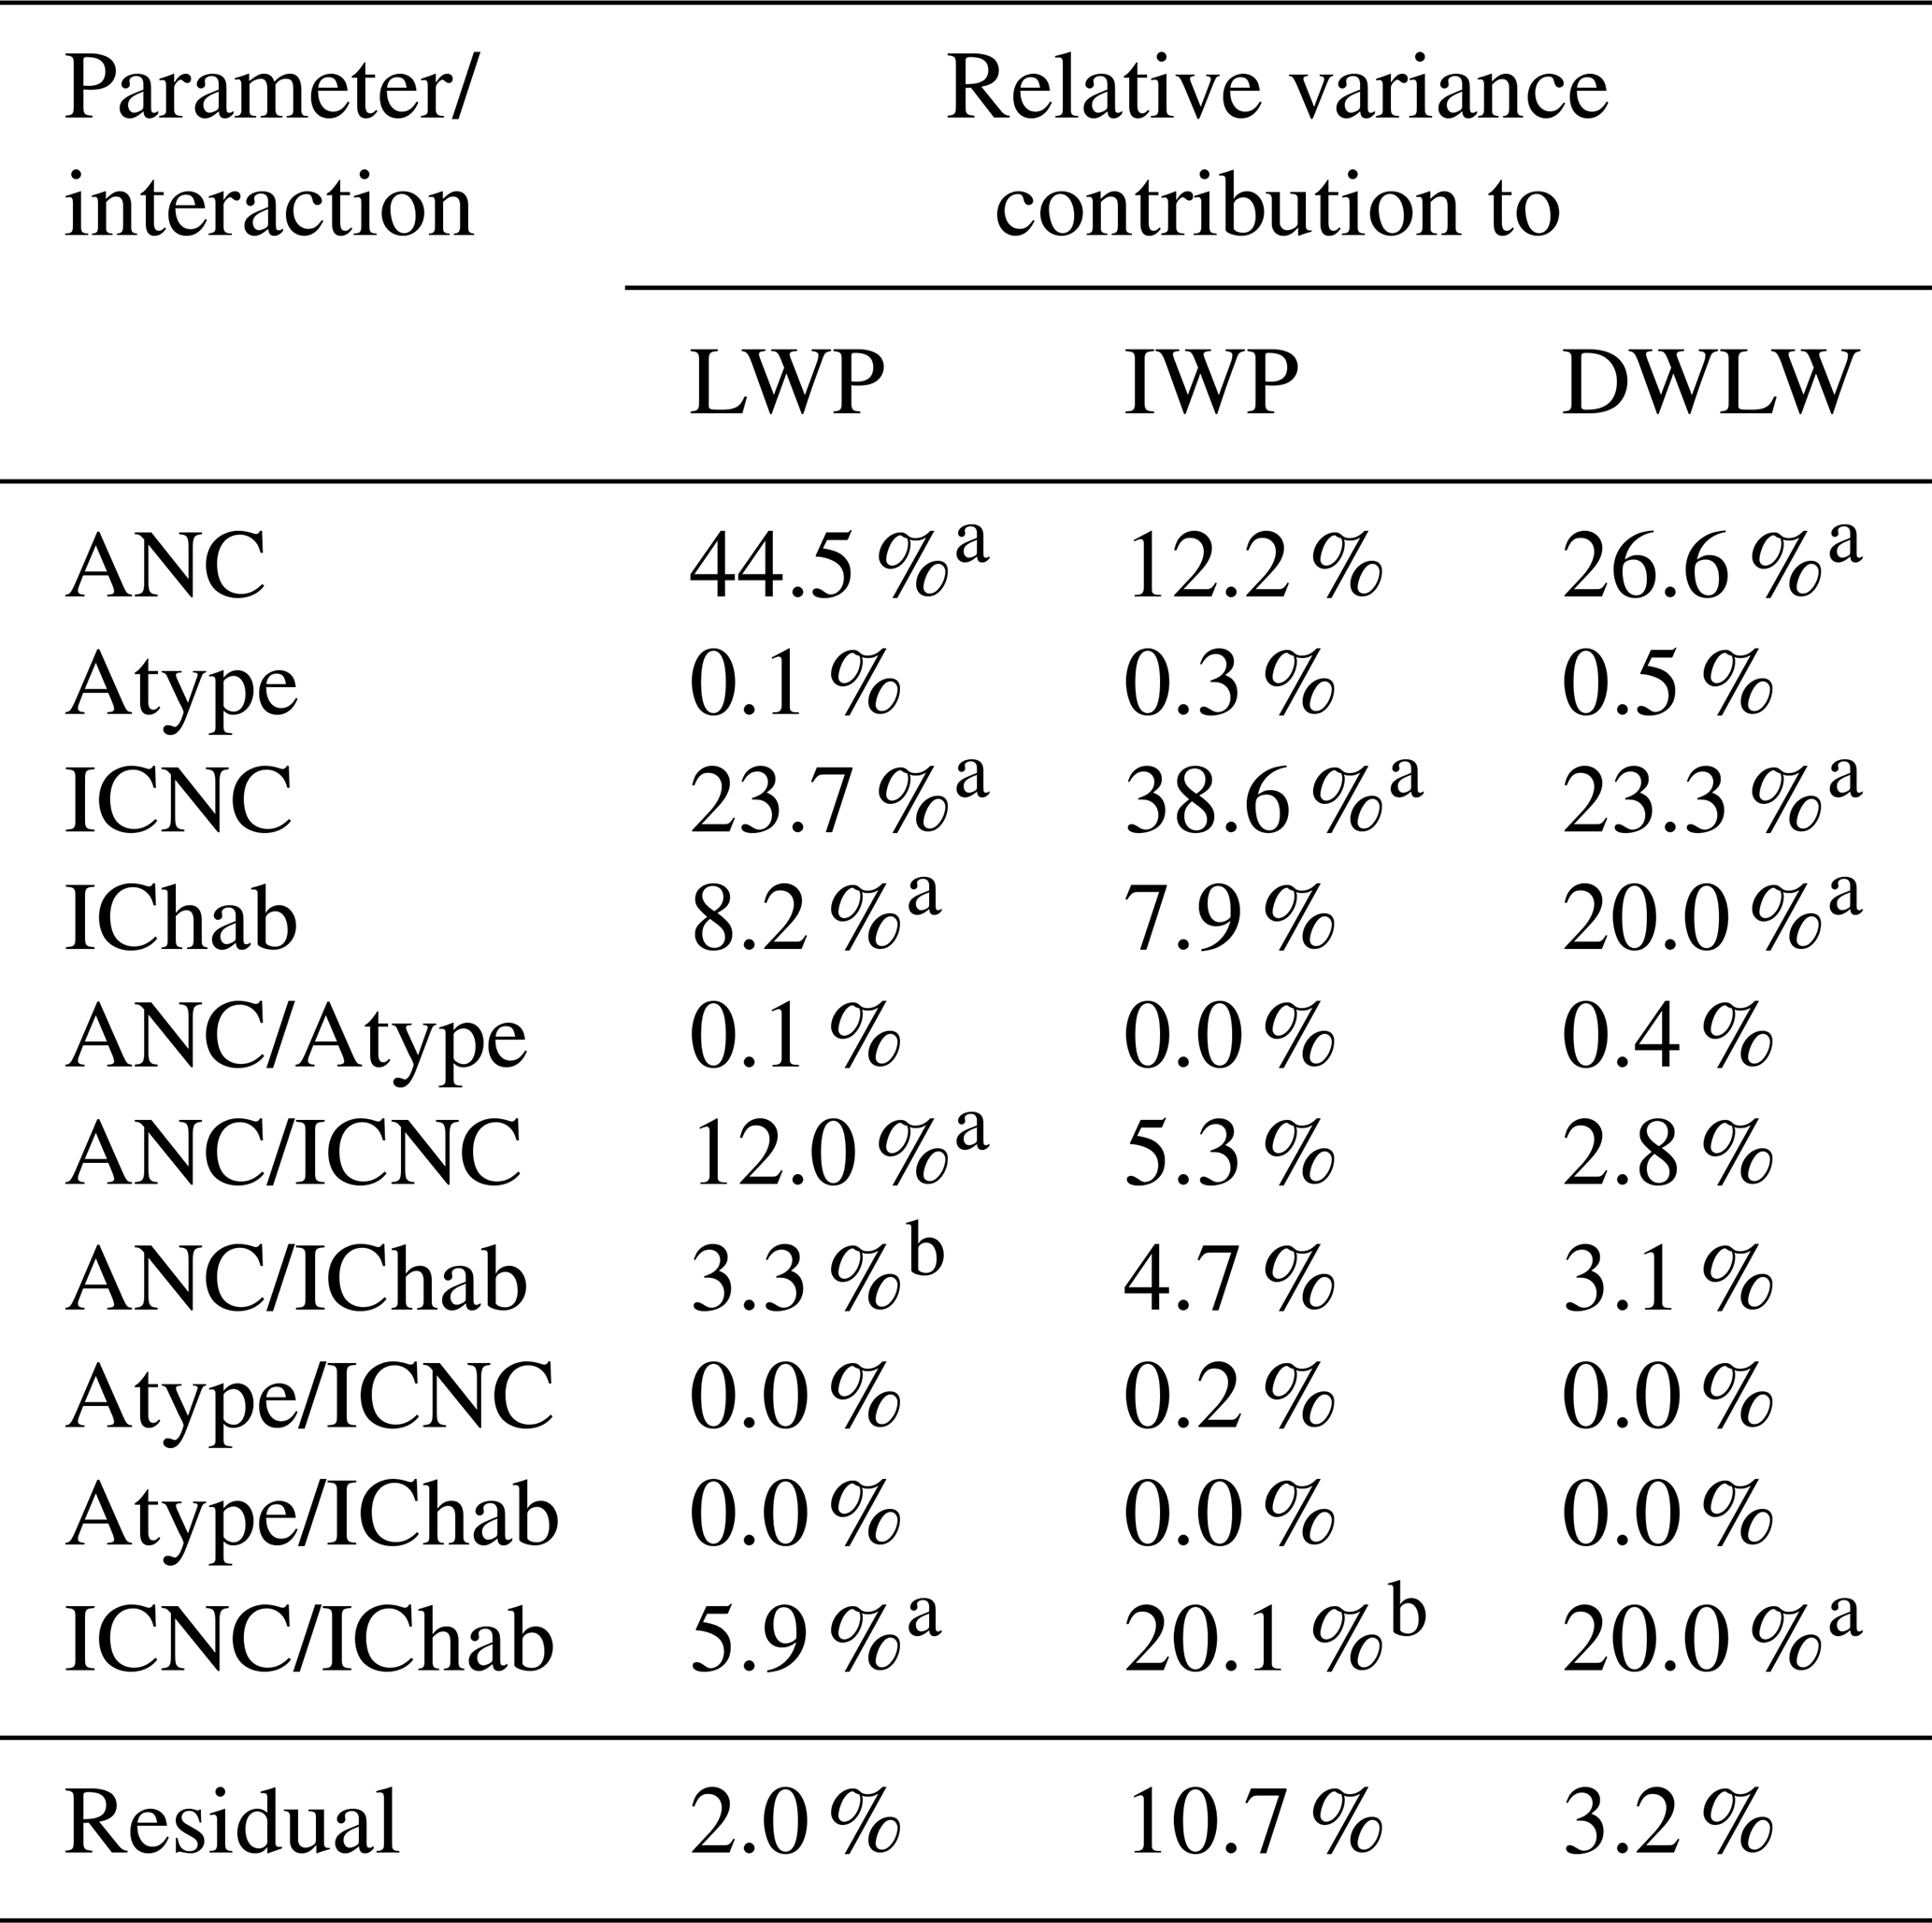
Statistical significance a at the 2.5 % level, b at the 5 % level.
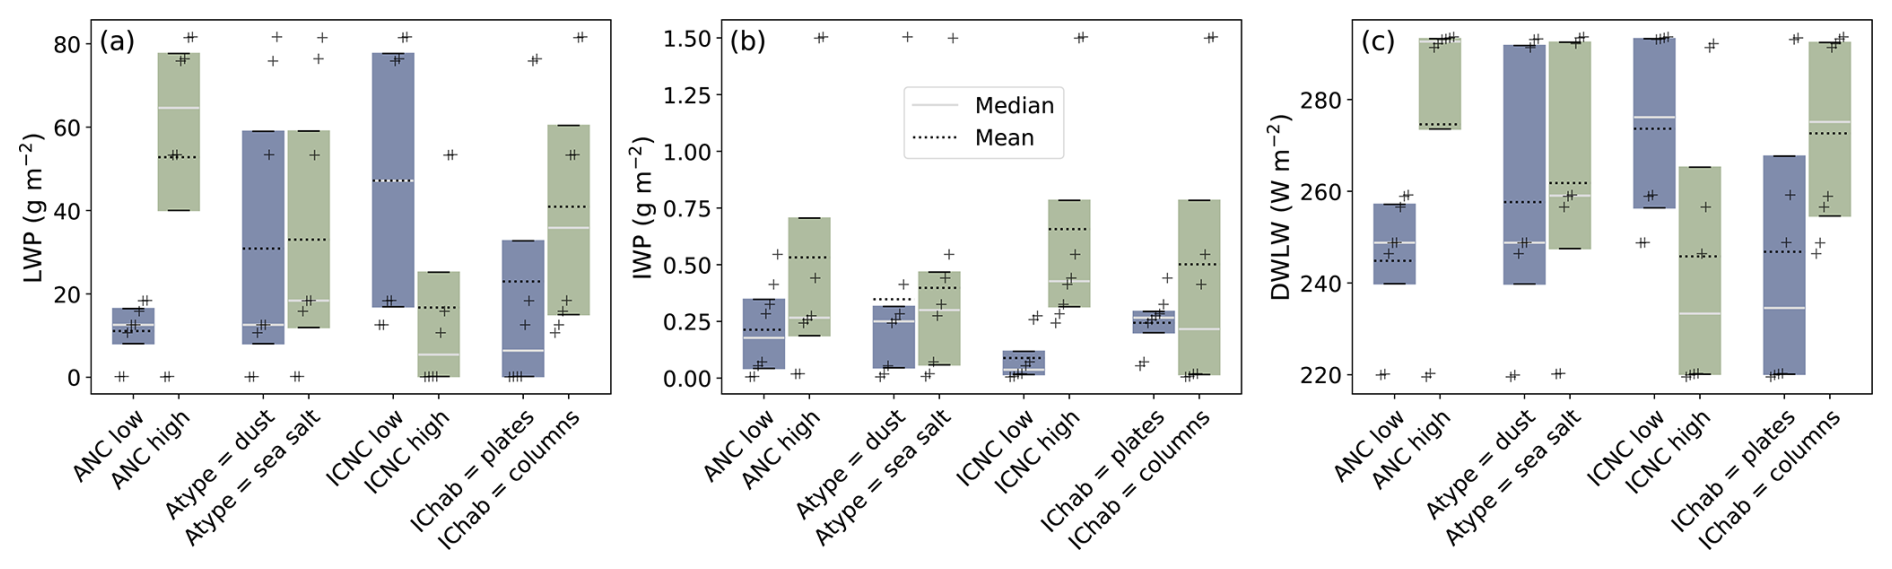
Figure 10Boxplots for all simulations with the respective value on the x-axis set to value 1 (blue boxes) and to value 2 (green boxes, cf. last two columns in Table 1) for (a) LWP (g m−2), (b) IWP (g m−2), and (c) DWLW (W m−2). The gray solid line shows the median, the black dashed line shows the mean over the simulations. Comparing the mean of the respective blue and green distributions indicates the variance explained by the respective parameter (cf. Fig. 9). Boxes illustrate the inter-quartile range (IQR), and no whiskers or flier points are shown because each distribution is based on only 8 values. Plus signs mark the values of individual simulations, arranged horizontally in ascending order.
Table 3Mean LWP, IWP, and DWLW over the final 2 h of simulation time for all simulations, as well as the final phase state of the cloud based on the mean LWP and IWP. The simulation names indicate which value the four parameters have (cf. last two columns in Table 1). The last rows of the table list the percentiles for the observations.
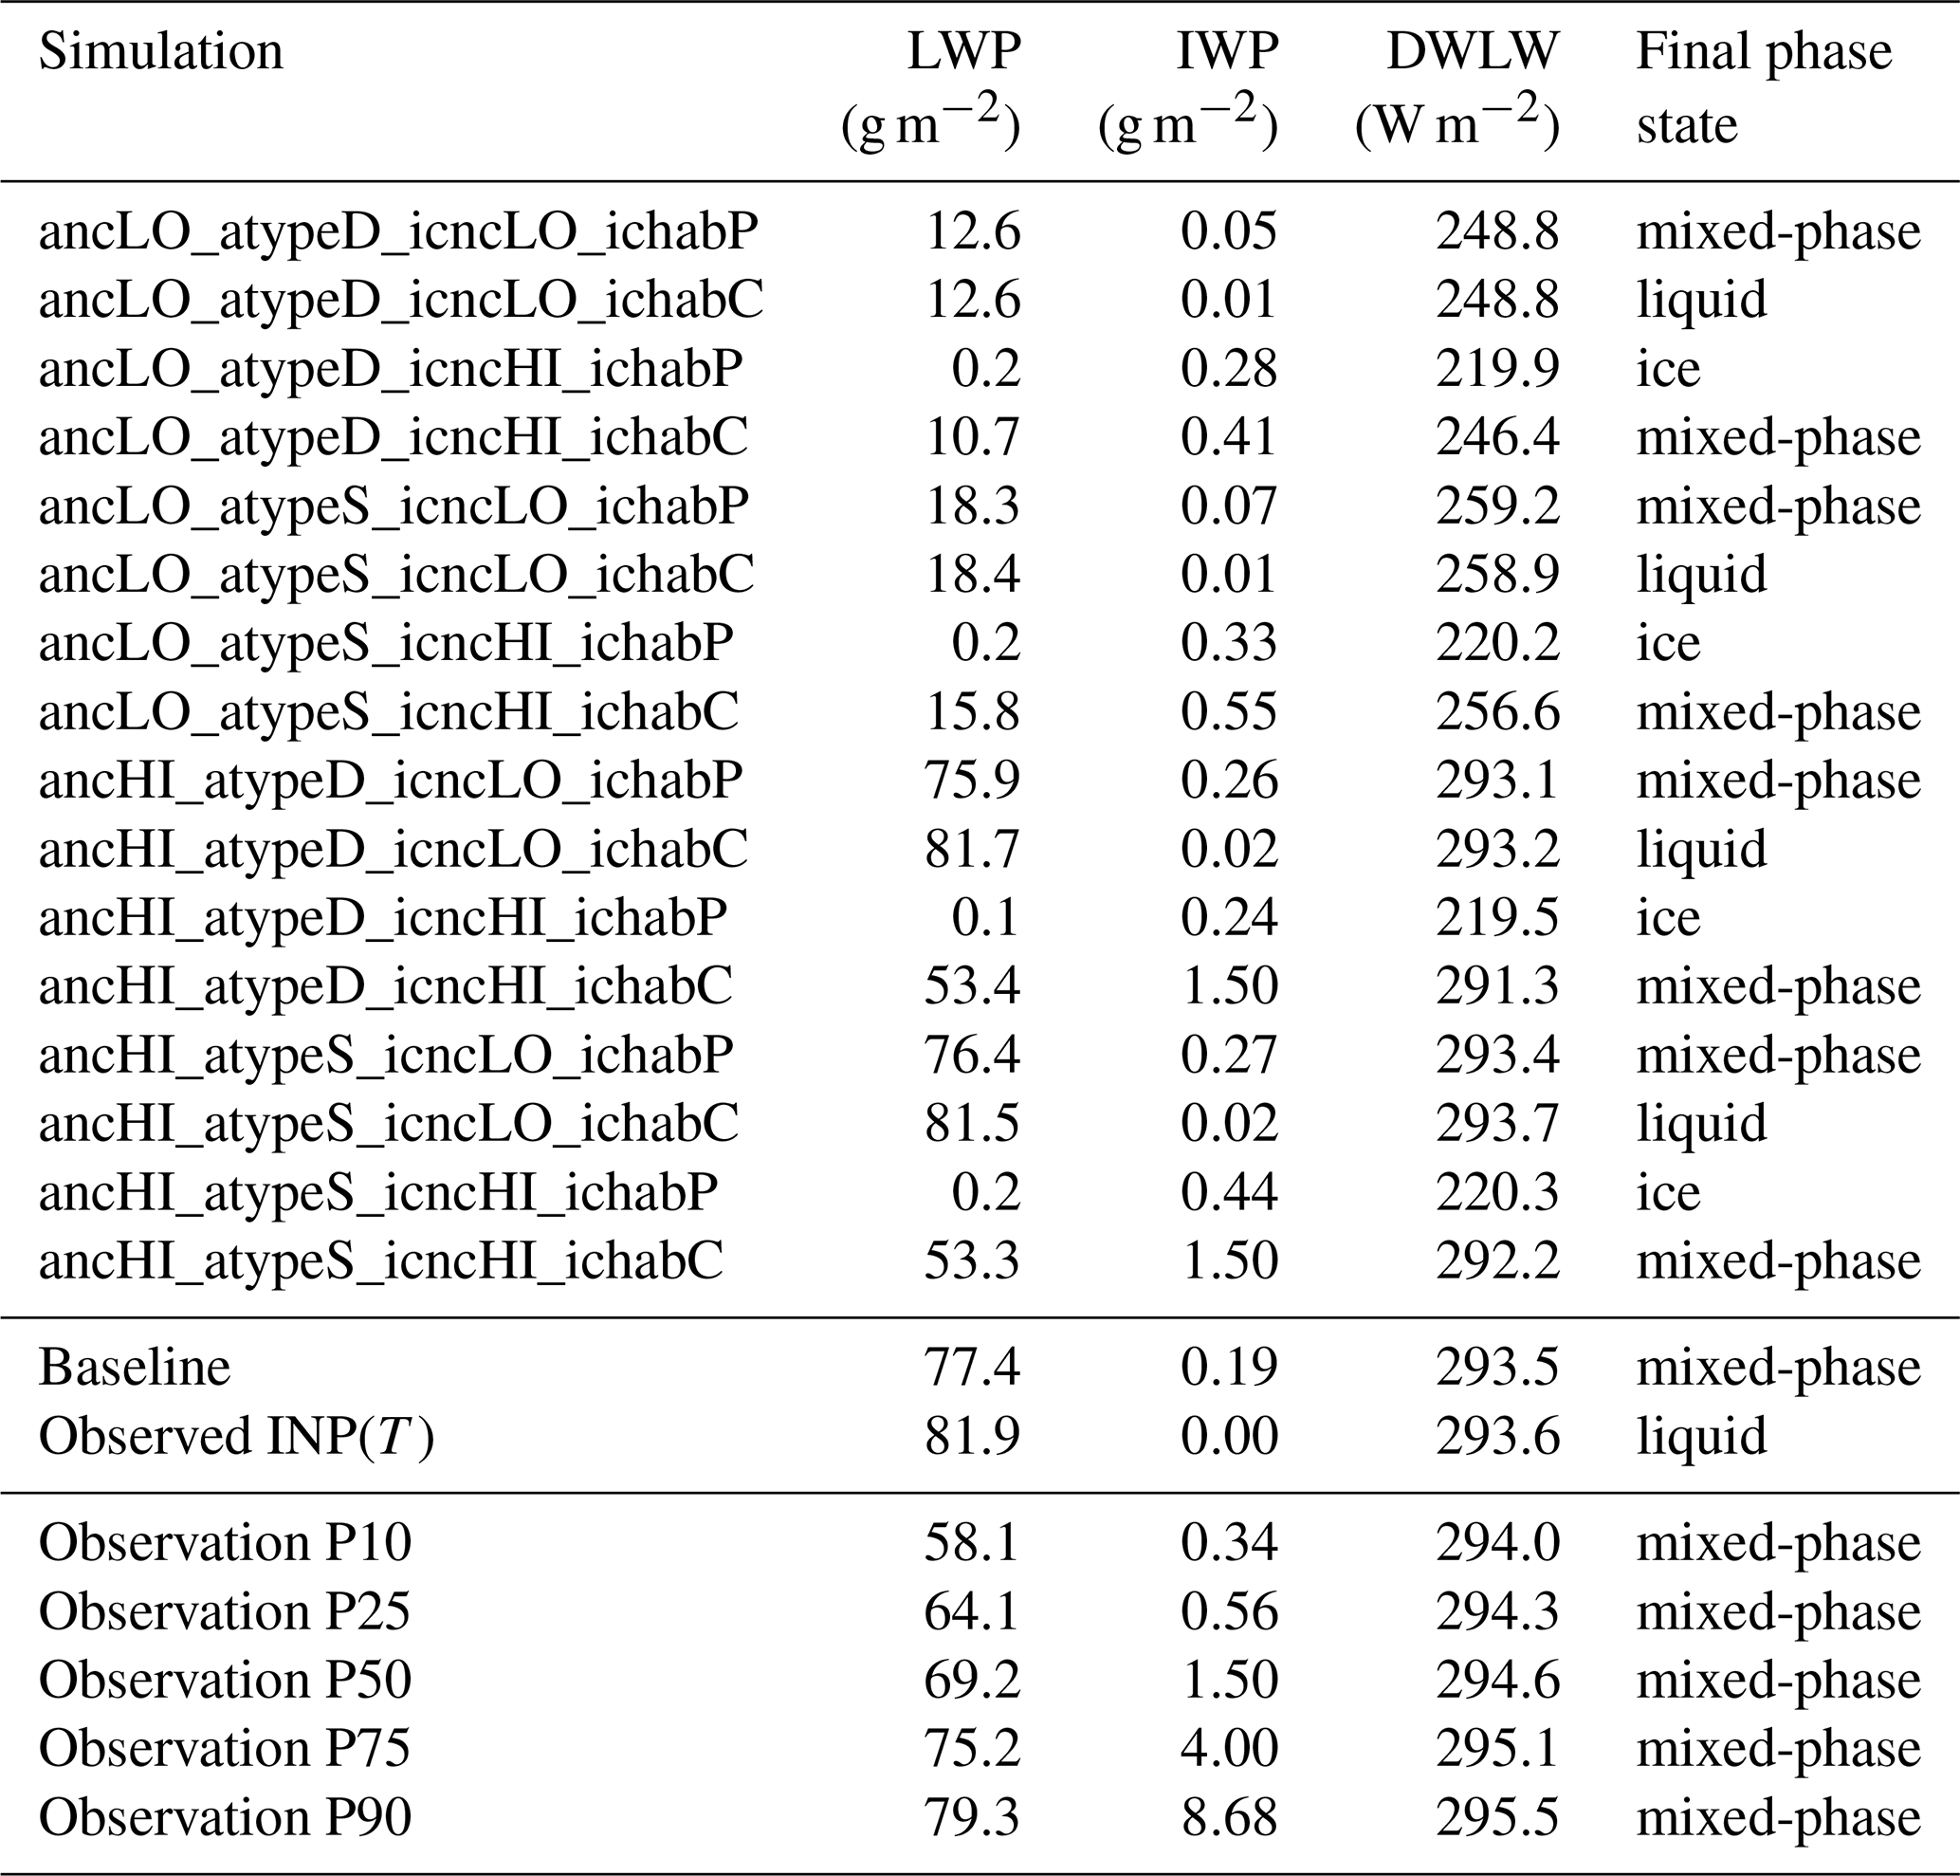
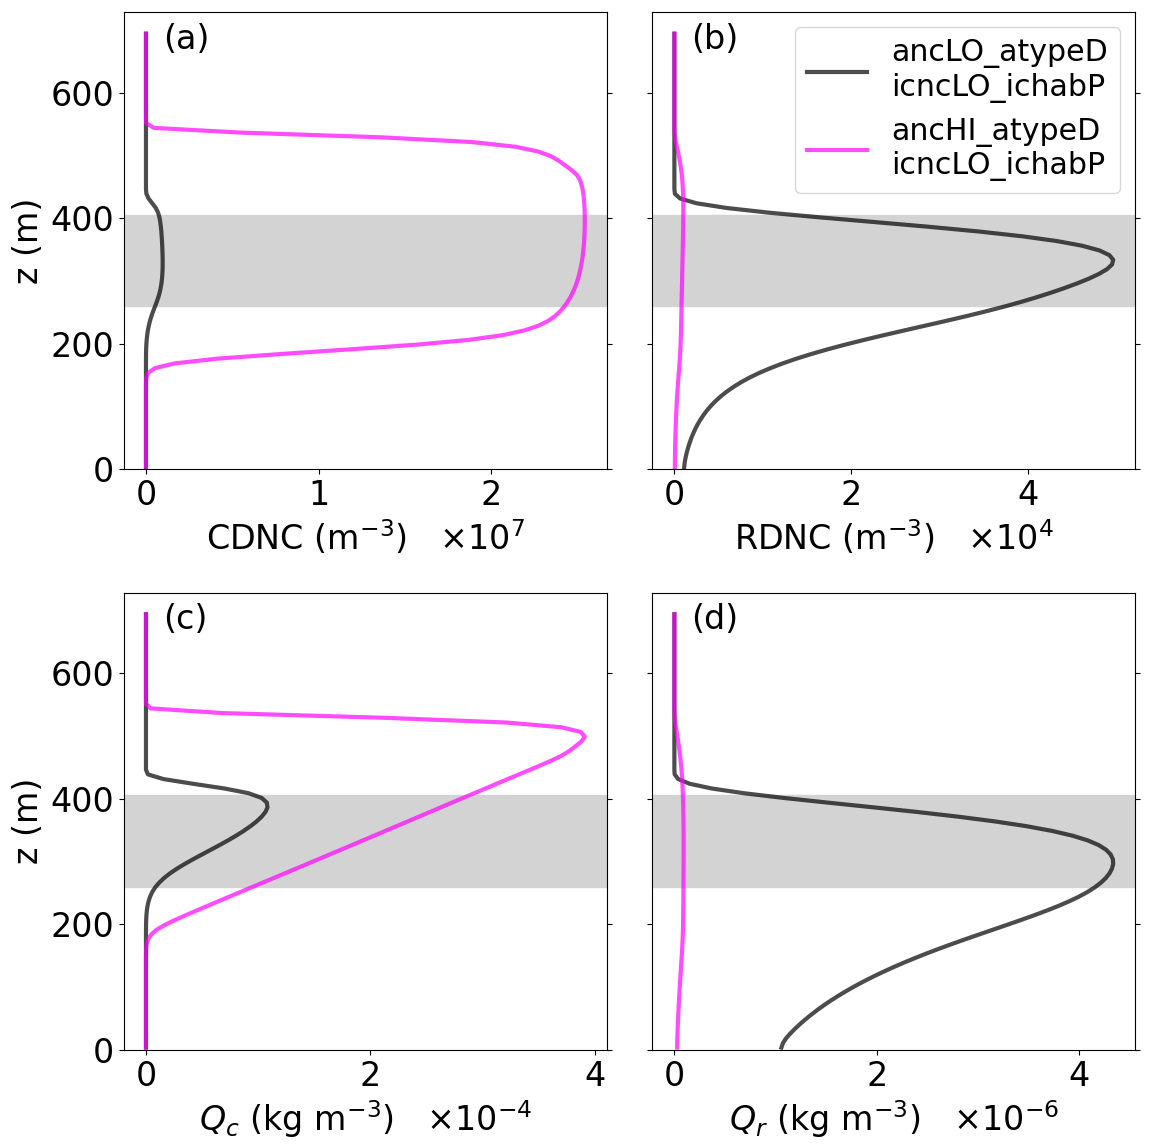
Figure 11Average vertical profiles over the final 2 h of simulation time of (a) CDNC (m−3), (b) RDNC (m−3), (c) Qc (kg m−3), and (d) Qr (kg m−3) of ancLO_atypeD_icncLO_ichabP with low ANC and ancHI_atypeD_icncLO_ichabP with high ANC. The gray area indicates the mean cloud altitudes of ancLO_atypeD_icncLO_ichabP. Note the different orders of magnitude on the x-axes for cloud droplets and raindrops.
The Qc profile responds accordingly (Fig. 11c), although the individual cloud droplets in the low-ANC simulation (ancLO_atypeD_icncLO_ichabP) are larger than those in the high-ANC simulation (ancHI_atypeD_icncLO_ichabP). These larger droplets enhance collision-coalescence efficiency, generating a larger RDNC and higher Qr under low-ANC conditions (Fig. 11b, d). Nevertheless, RDNC is several orders of magnitude smaller than CDNC (Fig. 11a–b). Furthermore, the cloud is significantly shallower for the low ANC value because the initial cloud liquid rapidly precipitates during the early stages of the spin-up simulation (Fig. B4). The combination of lower Qc and a shallower cloud depth ultimately leads to a significantly smaller LWP for the low-ANC simulation (Fig. 12a). This reduction in liquid water directly causes a significantly lower DWLW, because the longwave radiation emitted by the cloud depends strongly on LWP within the ranges of values occurring here (Fig. 12c).
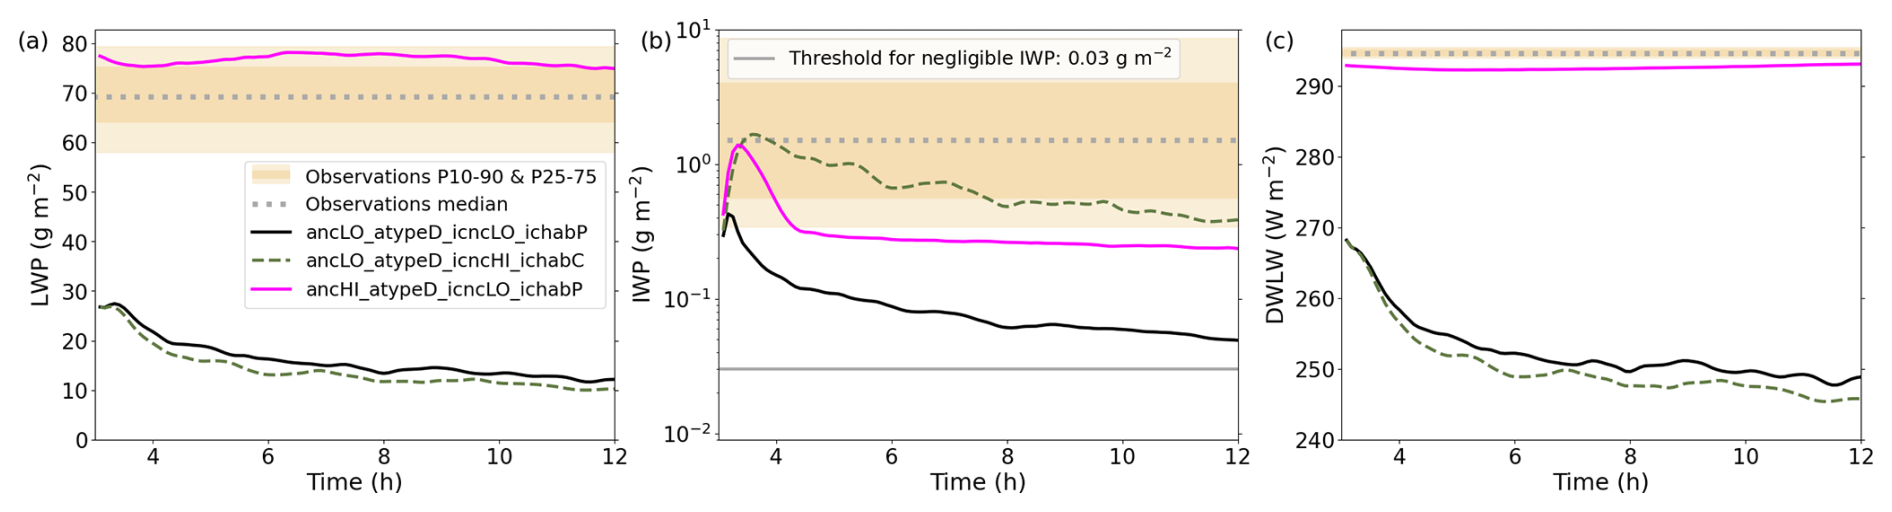
Figure 12Horizontally averaged (a) LWP (g m−2), (b) IWP (g m−2), and (c) DWLW (W m−2) of ancLO_atypeD_icncLO_ichabP, ancLO_atypeD_icncHI_ichabC, and ancHI_atypeD_icncLO_ichabP. The 10th, 25th, 75th, and 90th percentiles of the observations are indicated by the orange bars of differing shade, and the median by the dotted gray line, while the threshold for negligible IWP is shown by the gray line in panel (b). Note the logarithmic axis for IWP in panel (b).
In contrast, ANC exerts a much weaker influence on IWP, reflected by the narrower gap between the two ANC boxplots (Fig. 10b). Even for the low ANC value, specific simulations (e.g., ancLO_atypeD_icncHI_ichabC and ancLO_atypeS_icncHI_ichabC) still produce a relatively high IWP (Table 3). Comparing specific simulations highlights this behavior (Fig. 12): although LWP and DWLW are very similar between ancLO_atypeD_icncLO_ichabP and ancLO_atypeD_icncHI_ichabC (both with low ANC), the IWP for the latter is considerably higher. Even though ancLO_atypeD_icncHI_ichabC has a low LWP of 10.7 g m−2, the combination of high ICNC and IChab columns generates a higher IWP than most simulations with high ANC, e.g., ancHI_atypeD_icncLO_ichabP. This illustrates the lower relevance of ANC for IWP, compared to LWP and DWLW.
ANC shows a considerable interaction only with ICNC and for LWP (Fig. 9; Table 2). Consequently, the sensitivity of LWP to changes in ANC depends on the ICNC value. The LWP is more sensitive to ICNC for high ANC than for low ANC (Table 3). For low ANC, simulations with a high ICNC value (e.g., ancLO_atypeD_icncHI_ichabC: 10.7 g m−2) can still result in an LWP similar to those using the low ICNC (e.g., ancLO_atypeD_icncLO_ichabC: 12.6 g m−2). Conversely, for high ANC, all simulations with high ICNC produce considerably less LWP than their low-ICNC counterparts (e.g., ancHI_atypeD_icncHI_ichabC: 53.4 g m−2 vs. ancHI_atypeD_icncLO_ichabC: 81.7 g m−2). Enhanced deposition rates for high ICNC drive this pronounced difference, resulting in a stronger depletion of the liquid cloud water.
The parameter ICNC contributes the largest variance share to IWP and the second-largest variance share to LWP and DWLW (Fig. 9; Table 2). Similar to the ANC boxplots, the ICNC boxes do not overlap for IWP and overlap only slightly for LWP and DWLW (Fig. 10). Furthermore, IWP in simulations with high ICNC is not limited by low ANC; even when combining low ANC with high ICNC, IWP is at least 0.28 g m−2 (ancLO_atypeD_icncHI_ichabP; Table 3).
The simulations experiencing complete glaciation (resulting in an LWP of nearly zero and a minimum DWLW of approximately 220 W m−2, in contrast to the observed cloud that persisted as mixed-phase) all have high ICNC (ancLO_atypeD_icncHI_ichabP, ancLO_atypeS_icncHI_ichabP, ancHI_atypeD_icncHI_ichabP, and ancHI_atypeS_icncHI_ichabP; Table 3). However, whether the cloud glaciates depends additionally on IChab: only the combination of high ICNC and IChab plates leads to complete glaciation. Specifically, the IChab plates dictates depositional growth and sedimentation velocities that allow the WBF process to entirely consume the liquid cloud water. The interconnection between IChab and ICNC manifests as a strong interaction for both IWP and DWLW (Fig. 9; Table 2). For LWP, the interaction between ICNC and IChab is significant, although it is smaller than the interaction between ANC and ICNC described above. In simulations that glaciate, the depletion of liquid water removes the cloud-top radiative cooling (Fig. 13a versus c), which acts as the main source of turbulent kinetic energy (TKE) necessary to maintain the cloud. Consequently, TKE largely dissipates in these glaciated clouds (Fig. 13b versus d), eliminating the vertical winds required for aerosols to activate into cloud droplets.
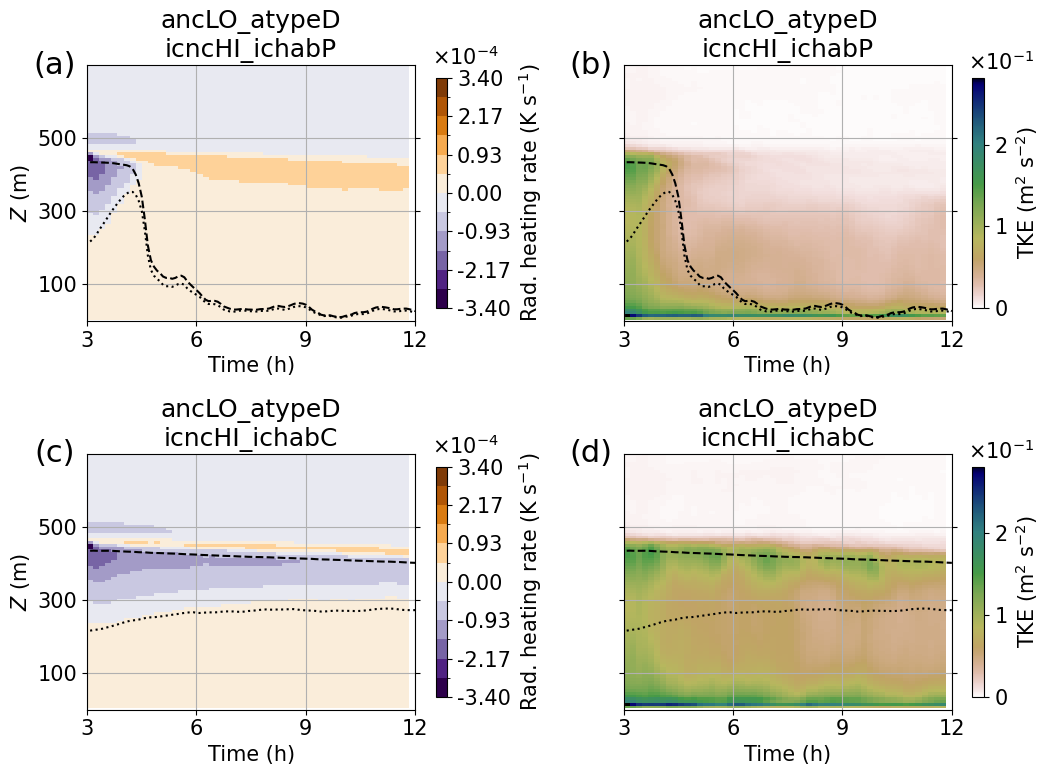
Figure 13Average horizontal profiles of (a, c) radiative heating rate (K s−1) and (b, d) resolved TKE (m2 s−2) of the glaciating simulation ancLO_atypeD_icncHI_ichabP (a, b) and the simulation ancLO_atypeD_icncHI_ichabC (c, d). Dotted lines show the cloud top, dashed lines the cloud base.
The parameter IChab acts as the third-largest variance contributor to all three variables, with its highest relative contribution for DWLW (Fig. 9; Table 2). Despite ranking third, IChab controls critical phase transitions. For simulations with high ICNC, IChab determines whether the cloud glaciates or persists as mixed-phase. Furthermore, for simulations with low ICNC, IChab dictates whether the cloud contains any ice at all. Specifically, ancLO_atypeD_icncLO_ichabC, ancLO_atypeS_icncLO_ichabC, ancHI_atypeD_icncLO_ichabC, and ancHI_atypeS_icncLO_ichabC all are liquid-only clouds due to their IChab columns (Table 3). This strong interdependence between IChab and ICNC manifests as high interaction terms across almost all variables (Fig. 9; Table 2).
Figure 10 visualizes that the variability of IWP is substantially larger for the IChab columns than for plates. For columns, IWP stretches from 0.01 to a maximum of 1.5 g m−2. For plates in contrast, IWP reaches at least 0.05 g m−2 but does not exceed 0.44 g m−2 (Table 3).
The parameter Atype contributes less than 1 % of the variance to all three variables (Fig. 9; Table 2). Pairwise comparisons of simulations differing only by Atype reveal some differences in LWP and DWLW, particularly for low ANC: For all non-glaciating simulation pairs with low ANC (ancLO_atypeD_icncLO_ichabP and ancLO_atypeS_icncLO_ichabP, ancLO_atypeD_icncLO_ichabC and ancLO_atypeS_icncLO_ichabC, ancLO_atypeD_icncHI_ichabC and ancLO_atypeS_icncHI_ichabC), changing Atype from dust to sea salt increases LWP by approximately 50 % (Table 3). Although the blue and green boxes in Fig. 10 differ slightly between the two Atype values, their mean differences are so small compared to the other parameters that Atype exerts a negligible influence within our specific study setup (Table A1).
Overall, these results demonstrate that for our model setup with prescribed ICNC, ANC is the dominant parameter, followed by ICNC. Although IChab contributes less to variable variance, it critically impacts the phase partitioning of the simulated cloud (Fig. 9; Table 2).
There is a clear need for better understanding mixed-phase clouds and their microphysics, evolution, and radiative impacts in the Arctic and beyond. Moreover, the atmospheric science community is missing abundant vertically resolved data that can help to close the knowledge gaps that persist and also permeate cloud resolving models. This study was formulated to take advantage of data and a case study, which was believed to help close some of these gaps. However, simulations using an observed INP(T) distribution produced zero ice mass, even when ice was observed in the cloud. Yet, it remains valuable to identify which parameters impact the simulated cloud most strongly.
We first examine why the simulation using the observation-based INP(T) distribution produced zero ice mass, although ice was observed in this cloud. The lack of simulated ice mass likely originates from the limits of Helikite sampling, including small volumes and the interstitial nature of the in-cloud aerosol sampling (Sect. 2.4.3). These limitations might have resulted in missed or undercounted INPs entrained from the free troposphere alongside the general aerosol population (Pohorsky et al., 2026), particularly in a location where INPs are already quite rare. Recent advancements in balloon-borne and uncrewed aerial system INP sampling offer a promising pathway to address this in the future (e.g., Porter et al., 2020; Böhmländer et al., 2025; Creamean et al., 2026). Moreover, although we aimed to derive upper-bound INP concentrations, the polynomial fit applied to the observations relies exclusively on data below −23 °C. Given the warmer in-cloud temperatures of our case, the actual INP concentrations might have been higher. Supporting this possibility, recent springtime observations during MOSAiC (Multidisciplinary drifting Observatory for the Study of Arctic Climate) demonstrated that INP concentrations at −7.5 °C frequently exceeded our extrapolated value by up to two orders of magnitude (Barry et al., 2025). Conversely, extensive observations at four Arctic sites indicated that only a few springtime INP concentrations at −7.5 °C exceeded our extrapolated value by at most one order of magnitude (Wex et al., 2019).
Higher initial INP concentrations might also produce sufficient ICNC to trigger depositional growth and SIP processes in MIMICA. A known limitation of MIMICA is the absence of SIP processes beyond rime-splintering and collisional breakup. Although droplet shattering has been suggested as a potential additional source of ice multiplication, it typically requires drops substantially larger than those simulated here. For example, Lauber et al. (2018) investigated droplets of diameters 85 and 310 µm, and Sotiropoulou et al. (2020) used a 100 µm threshold diameter for shattering droplets. In our simulations, the largest mean raindrop diameter in the cloud reached approximately 34 µm (Fig 6f), therefore, the size distribution contained very few drops exceeding the 85 µm threshold. Consequently, incorporating droplet shattering would likely not increase the cloud ice mass considerably. Another unrepresented process capable of increasing cloud ice is INP recycling, from which INPs are released below the cloud upon ice crystal sublimation and are subsequently re-entrained (e.g., Solomon et al., 2015). However, for INP recycling to exert a meaningful effect, a substantially higher INP concentration remains necessary. Additional potential ice nucleation mechanisms include the conversion of evaporating drop residuals into INPs, drop freezing during evaporation, and cloud chemical processing that alters the ice-nucleating efficiency of aerosol particles (Fridlind et al., 2007).
An alternative explanation for the discrepancy between the simulated IWP (using observed INP concentrations) and the observed IWP might arise from the IWP retrieval algorithm. As described in Sect. 2.2, the IWP retrieval has a large uncertainty and may overestimate a near-zero IWP, yet direct observations on the ship deck and from the Helikite camera confirmed the presence of ice crystals. Therefore, even if the exact quantitative estimate of the observed IWP is uncertain, an appreciable ice mass undoubtedly existed. Ultimately, the large discrepancy between observed INP concentrations and the required ICNC aligns with persistent challenges in modeling Arctic cloud microphysics, and field campaigns frequently observe ICNC exceeding available INPs by several orders of magnitude (Prenni et al., 2009; Pasquier et al., 2022b).
4.1 Factorial analysis
The ANC parameter contributed most significantly to the variance of LWP and DWLW because the lower ANC value falls within the CCN-limited regime (“tenuous cloud”), whereas the higher value is outside this regime (Mauritsen et al., 2011). Similar reductions in LWP under low CCN concentrations were shown in previous modeling studies (e.g., Birch et al., 2012; Loewe et al., 2017). Ice nucleation in our model setup was independent of aerosol concentrations, restricting the impact of ANC to indirect ice creation pathways via the liquid phase, specifically through droplet number concentrations, mixing ratios, and saturation. This lack of connection between aerosol populations and ice nucleation likely explains why ANC did not emerge as the dominant, or at least a more important, parameter for IWP.
It is not surprising that ICNC exerted a large impact on IWP, given that the high and low ICNC values span two orders of magnitude and higher ice crystal concentrations directly generate more ice mass. Furthermore, aerosol availability did not constrain the prescribed ICNC value. The low ANC value exceeds the high ICNC value by more than two orders of magnitude, ensuring that an activation fraction of merely ≲ 1 % generated sufficient cloud droplets to support the prescribed ICNC. The important role of ICNC aligns with previous modeling studies that have demonstrated that AMPC water paths have high sensitivity to ice crystal concentrations (e.g., Morrison et al., 2003; Ovchinnikov et al., 2014; Komurcu, 2016; Loewe et al., 2017). The complete glaciation observed in simulations with high ICNC was driven by the WBF process, which rapidly enhances ice mass at the expense of liquid water. This mechanism manifested clearly in the glaciating simulation ancLO_atypeD_icncHI_ichabP, wherein following the spin-up period, substantial deposition occurred (Fig. B5a) while cloud droplets evaporated (Fig. B5c). Ultimately, the liquid cloud dissolved, as illustrated by the overlapping dotted and dashed lines marking the cloud boundaries from approximately 7 h onward.
However, glaciation additionally depended on ice habit, occurring exclusively for the combination of high ICNC and IChab plates. The glaciation in some of the sensitivity simulations diverges from the actual observations and the baseline simulation, where the cloud persisted as a mixed-phase cloud for at least 12 h after the radiosounding that initialized the MIMICA simulation. Observations on the ship deck identified ice needles, and the baseline simulation accordingly assumed columns as the ice habit. The crucial role of ice habit in the simulations arises from how the morphology affects depositional growth and the sedimentation velocity in MIMICA. For a given ice mass, plates correspond to a larger characteristic size than columns, defined in the microphysics scheme as the maximum diameter for non-spherical hydrometeors (Seifert and Beheng, 2006). For example, compared to the 200 µm column assumed in the baseline simulation (Sect. 2.4.2), a plate of identical mass has a size of 676 µm. Deposition onto ice crystals in MIMICA scales directly with ice crystal size (Seifert and Beheng, 2006), driving substantially stronger simulated depositional growth for plates (e.g., ancLO_atypeD_icncHI_ichabP; Fig. B5a) than for columns (e.g., ancLO_atypeD_icncHI_ichabC; Fig. B5b). This enhanced deposition strengthened the WBF-driven transfer of water vapor toward ice, causing cloud droplets to evaporate throughout the cloud (Fig. B5c versus d) and driving complete cloud glaciation. Additional to the direct impact of habit-dependent size on the deposition rates, the sedimentation velocity depends on the ice habit. For the two ice crystals with the same mass, but different habits, the columnar crystals sediment at 0.47 m s−1, while the plates sediment at 0.19 m s−1. This means that the plates reside longer in a cloud with constant depth, accumulating water vapor for a longer time and thus driving additional cloud glaciation. Such glaciation occurred only in simulations with high ICNC and IChab plates, whereas for combinations of high ICNC with columns, and low ICNC with plates, the cloud remained mixed-phase. Conversely, for low ICNC and IChab columns, the cloud evolved into a purely liquid cloud. The importance of ice habit for modeled clouds aligns with previous findings (e.g., Avramov and Harrington, 2010; Komurcu, 2016), including findings of stronger sensitivity to ice habit at higher ICNC conditions (Avramov and Harrington, 2010).
Atype impacted LWP slightly for low ANC; overall, however, Atype was irrelevant in the factorial analysis compared to the other parameters. Hygroscopicity, rather than aerosol density or molecular weight, is the main property within Atype capable of impacting the simulated cloud. Previous MIMICA simulations of a different AMPC demonstrated that using only Aitken mode aerosol combined with a low κ of 0.2 caused the cloud to dissipate, while the impact of κ was much smaller when accumulation mode CCN were assumed (Christiansen et al., 2020). Our setup used a bimodal size distribution comprising both an Aitken and an accumulation mode. Consequently, even when applying the Atype value of dust (with a very low κ=0.05) combined with low ANC, sufficient large aerosols are available to act as CCN and sustain the cloud.
4.2 Limitations and outlook
Our factorial analysis results apply strictly within the bounds of the analyzed parameter space. Therefore, the rankings reported here are specific to the explored ranges and to slightly supercooled AMPC conditions comparable to our case. For example, the chosen ICNC values differ by two orders of magnitude (90 versus 9000 m−3), representing a deliberately large spread; a smaller separation between these ICNC values would likely reduce the variance contribution of ICNC. Furthermore, the chosen model and specific setup inherently limit our findings. Our model setup fixed the surface temperature to a constant value. If we had instead allowed the surface temperature to respond to radiative cooling in the cloud glaciation cases, it would have suppressed turbulence more drastically, further accelerating the cloud dissipation. An additional limitation regarding radiation concerns the absence of interactions with frozen hydrometeors. Liquid hydrometeors, however, modulate radiation much more strongly, and sensitivity simulations conducted with a newer version of MIMICA that includes ice-radiation interactions (not shown) demonstrated only minor differences compared to the simulations presented here. Consequently, this omission does not affect the main conclusions drawn from our factorial analysis. A further caveat is that the ICNC was estimated instead of being measured in situ, even though employing an aerosol-dependent ice nucleation parameterization would have been more physically consistent. Using such a setup, ICNC could not be prescribed directly, but would instead be controlled indirectly by aerosol concentrations and properties. Under such conditions, ANC and likely Atype would exert stronger influences on IWP and the other variables – consistent with the large sensitivity we found with respect to the prescribed ICNC. A natural next step involves using an aerosol-dependent ice nucleation scheme that explicitly couples aerosol properties to the formation of the ice phase. However, producing appreciable ice mass using an aerosol-dependent parameterization remains difficult at warm temperatures (e.g., Ovchinnikov et al., 2014; Wallentin et al., 2025), potentially limiting the effectiveness of such schemes for this specific AMPC case study.
To generalize the relevance of the four chosen parameters, future studies should utilize similar factorial analyses with atmospheric models that span larger and smaller scales beyond LES. Applying factorial analyses to different case studies, including colder AMPCs, offers another path forward. Alternatively, including parameters related to the large-scale environment or turbulence may reveal further controls on AMPC behavior.
Using the LES code MIMICA, we simulated a slightly supercooled Arctic mixed-phase cloud that was observed during the 2023 ARTofMELT campaign. The stratocumulus cloud developed on the morning of 7 June 2023 and persisted for more than 48 h with minimum in-cloud temperatures of −8 °C. Initial simulations using extrapolated observed INP concentrations failed to produce ice mass within the cloud, despite the implementation of two SIP processes. The lack of ice might be attributed to low INP values, due to uncertainties in the INP observations and/or missing ice production processes in MIMICA. To circumvent these fundamental uncertainties, we explicitly prescribed ICNC values, in order to decouple the ice phase from the model's physical mechanisms governing ice formation. Taking this step allowed us to systematically analyze which of four input parameters – aerosol number concentration (ANC), aerosol type (Atype), ice crystal number concentration (ICNC), and ice habit (IChab) – controlled the simulated liquid water path (LWP), ice water path (IWP), and downward longwave radiation at the surface (DWLW), thereby determining the cloud phase partitioning and its radiative effect.
We applied factorial analysis to rank the relative variance contribution of the four identified parameters, which additionally quantifies how much the impact of one parameter depends on other parameters. Furthermore, we analyzed the effect of the parameters on the final phase state of the simulated cloud. The factorial analysis highlighted a clear hierarchy: ANC dominated the response of LWP and DWLW, while ICNC controlled IWP. IChab consistently ranked as the third most important parameter, yet it critically dictated the final phase state of the cloud. Whether the cloud remained mixed-phase, transitioned to purely liquid, or completely glaciated depended entirely on habit. Conversely, aerosol type exerted a negligible impact on the simulated variables relative to the other three parameters. The uncoupled representation of aerosol and ice nucleation in the model setup heavily constrained this last result – linking ice nucleation directly to the aerosol type would amplify the influence of this parameter, at least for IWP, and likely for LWP as well.
Although based on this single case study and model, our results suggest certain observations might be of high priority during future Arctic field campaigns. Observational efforts should prioritize constraining ANC, either ICNC or INP concentrations, alongside active secondary ice enhancement processes (e.g., Luke et al., 2021; Korolev et al., 2022), and, crucially, ice habit. In-situ ICNC measurements represent a long-standing observational bottleneck that requires targeted progress. Ideally, such measurements would serve to evaluate model performance rather than being a prescribed parameter. Importantly, improved observational constraints on ice habit must be matched by models capable of incorporating this information. Furthermore, to make any of these constraints effective, the observations must be conducted directly at cloud level rather than at the surface, since surface measurements frequently fail to reflect the aerosol populations available within the cloud layer. Previous Arctic campaigns offer encouraging examples of achieving this necessary vertical profiling by using aircraft- or balloon-based systems, such as during ACCACIA (Lloyd et al., 2015), NASCENT (Pasquier et al., 2022a), and ACLOUD (Järvinen et al., 2023). Combining such high-impact observations with the integration of ice habit information into models (e.g., Silber et al., 2021; Ong et al., 2024) is essential for accurately representing Arctic mixed-phase clouds, ultimately improving our understanding and prediction of these clouds and their role in the Arctic climate system.
Table A1Mean values over all simulations of the respective parameter set to the different values (boxes in Fig. 10), and differences Δ between the mean values.
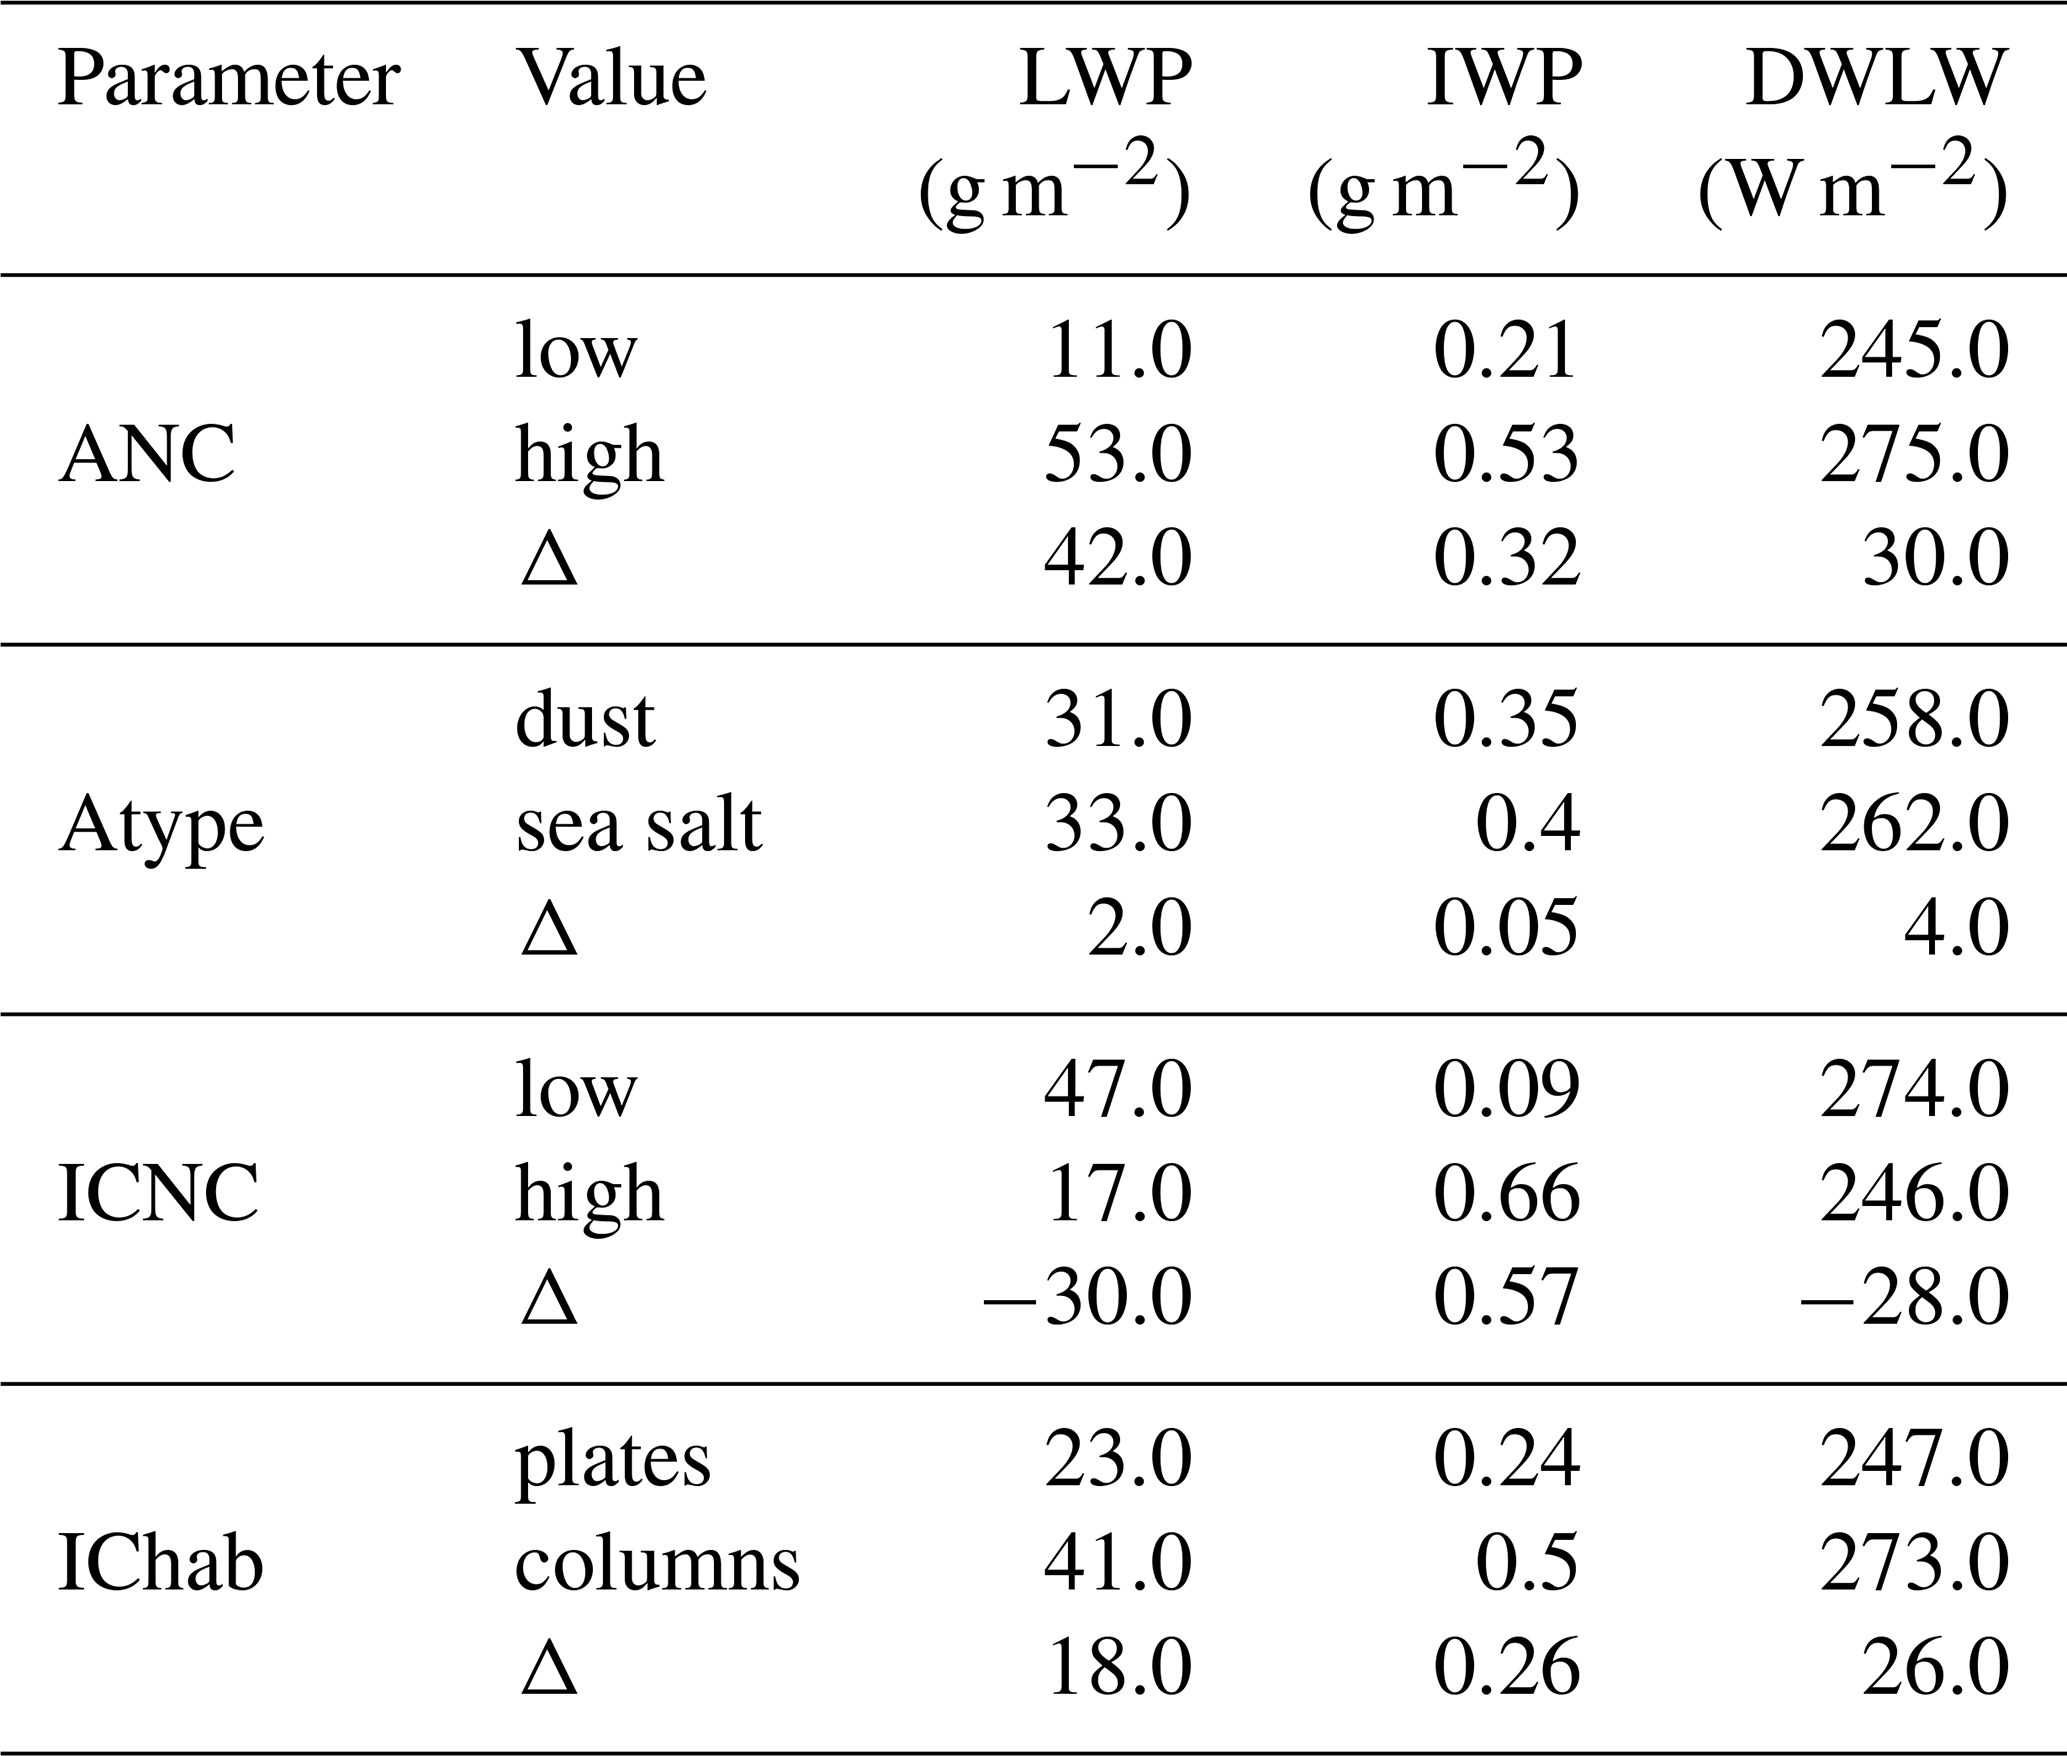
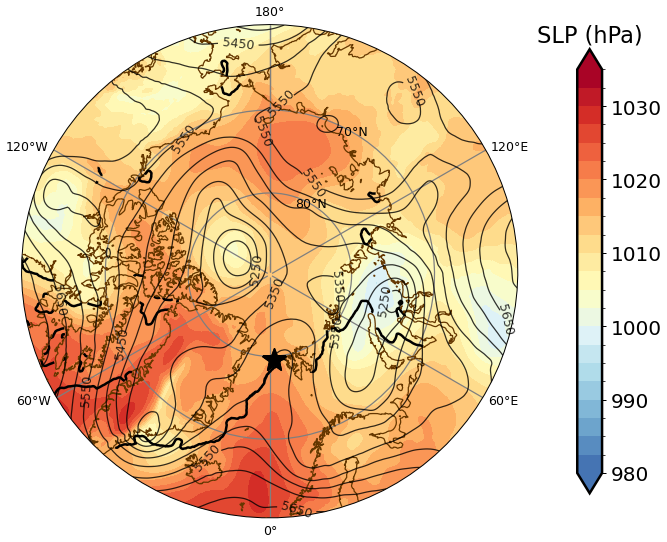
Figure B1Synoptic situation at 8 June 2023, 00:00 UTC according to ERA5 reanalysis. Sea-level pressure (SLP, hPa) in color, 500 hPa geopotential height (gpm; every 50 gpm) illustrated by isolines, and the thick black line shows the 15 % sea ice content border. The star marks Oden's position. The large-scale atmospheric state was very steady throughout the cloud event, thus we show only the synoptic situation closest to the observations used for initializing our simulations (Fig. 2).
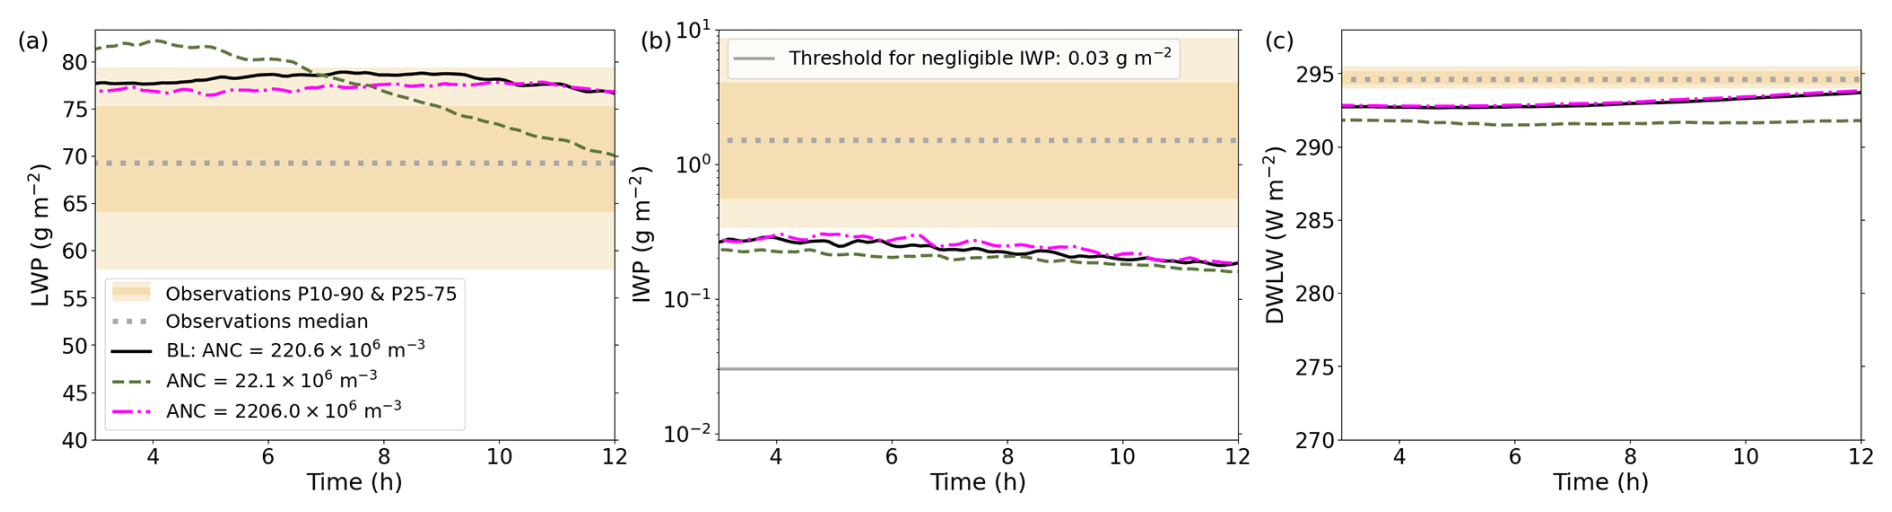
Figure B2Horizontally averaged (a) LWP (g m−2), (b) IWP (g m−2), and (c) DWLW (W m−2) for the baseline simulation (ANC = 220.6×10⁶ m−3) and two simulations with the same setup, but ANC of 22.1×10⁶ m−3 and 2206×106 m−3. The 10th, 25th, 75th, and 90th percentiles of the observations are indicated by the orange bars of differing shade, and the median by the dotted gray line, while the threshold for negligible IWP is shown by the gray line in panel (b). Note the logarithmic axis for IWP in panel (b).
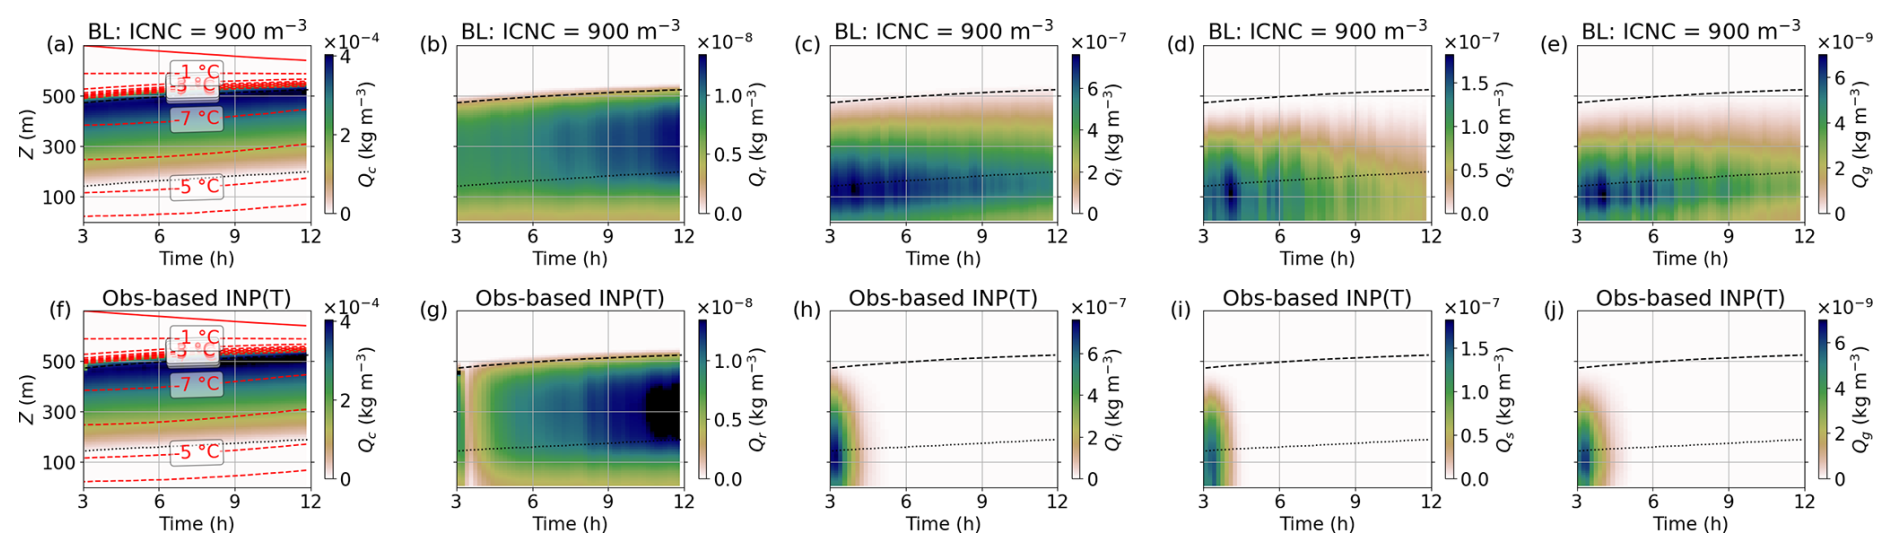
Figure B3Horizontally averaged (a, f) Qc (kg m−3), (b, g) Qr (kg m−3), (c, h) Qi (kg m−3), (d, i) Qs (kg m−3), and (e, j) Qg (kg m−3) profiles for the baseline simulation with prescribed ICNC (a–e) and using an observation-based INP(T) ice nucleation scheme (f–j). Panels (a) and (f) additionally indicate temperature with red dashed contour lines.
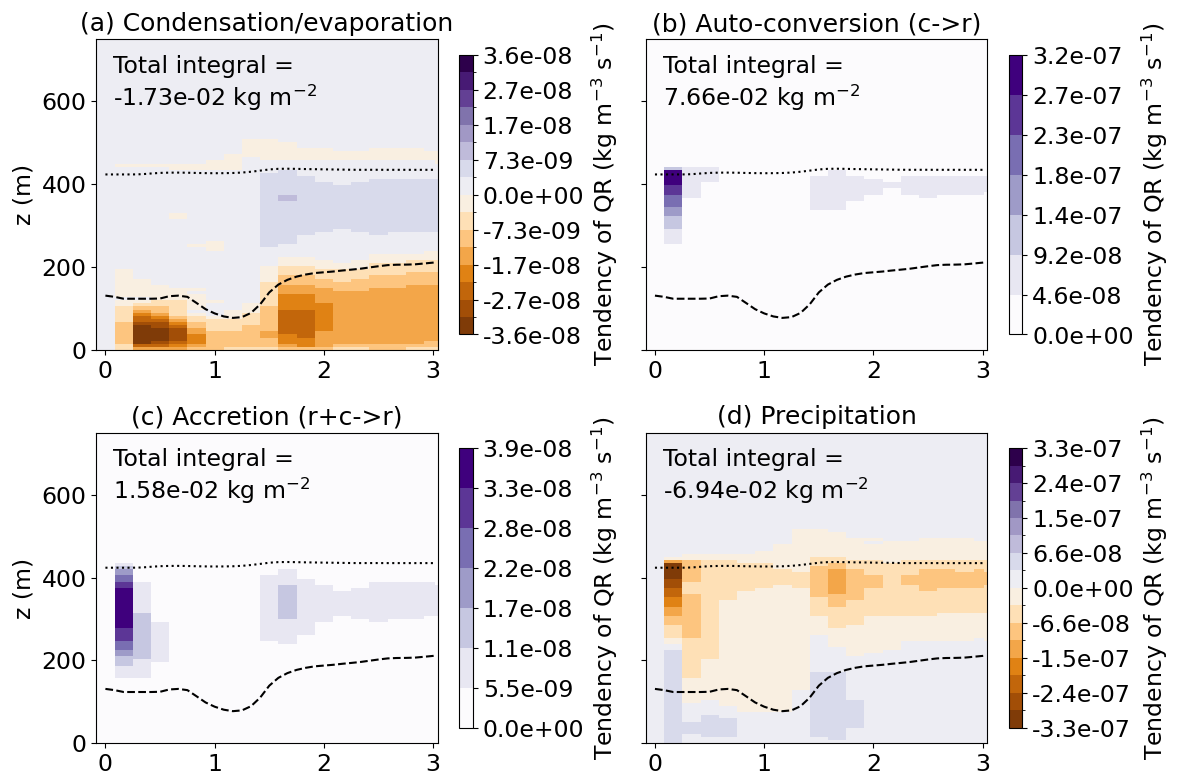
Figure B4Average horizontal profiles of Qr process rates (kg m−3 s−1) for the low ANC spinup simulation: (a) Condensation (positive)/evaporation (negative), (b) auto-conversion, i.e., two cloud droplets colliding and forming a raindrop, (c) accretion, i.e., a raindrop collecting a cloud droplet, and (d) precipitation. Dotted lines show the cloud top, dashed lines the cloud base.
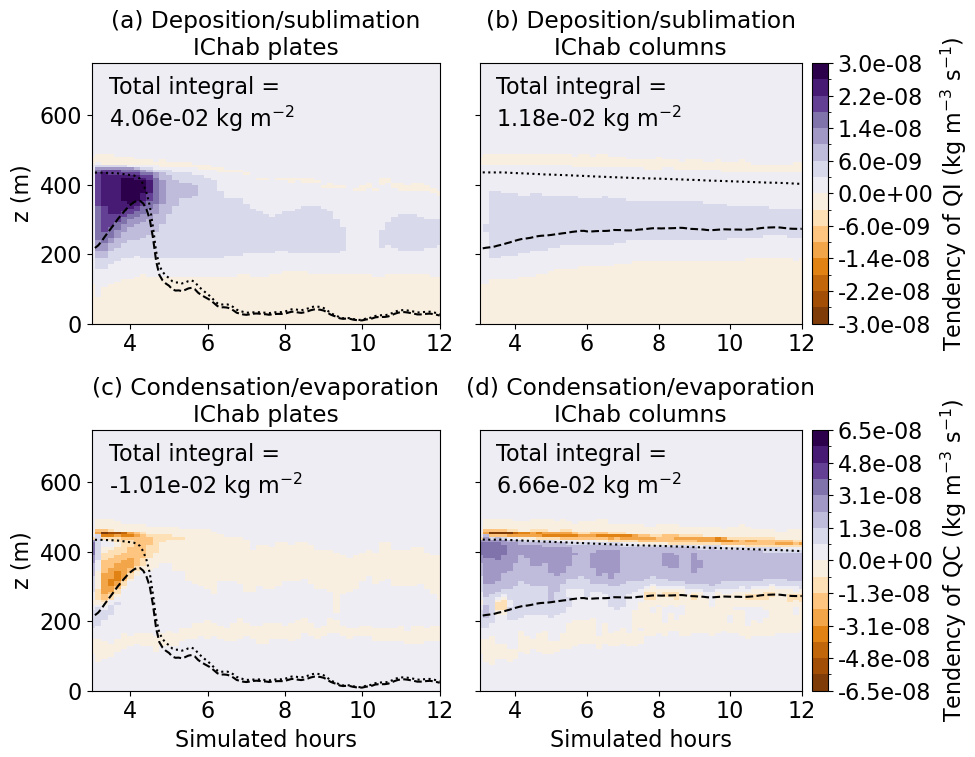
Figure B5Average horizontal profiles of cloud ice deposition (positive)/sublimation (negative) process rates (a, b, kg m−3 s−1) and cloud droplet condensation (positive)/evaporation (negative) for (a, c) ancLO_atypeD_icncHI_ichabP (with IChab plates), and (b, d) ancLO_atypeD_icncHI_ichabC (with IChab column). Dotted lines show the cloud top, dashed lines the cloud base.
All observational datasets used in this study can be accessed on the Bolin Centre for Climate Research database: https://bolin.su.se/data/oden-artofmelt-2023-expedition (last access: 15 September 2026). The DOIs of the individual datasets are listed below:
-
Ceilometer: https://doi.org/10.17043/oden-artofmelt-2023-ceilometer-1 (Murto et al., 2024b)
-
Cloud liquid water content: https://doi.org/10.17043/oden-artofmelt-2023-cloud-liquid-water-1 (Guy and Brooks, 2026)
-
Cloud radar: https://doi.org/10.17043/oden-artofmelt-2023-cloud-radar-1 (Guy et al., 2024b)
-
Cloudnet classification: https://doi.org/10.17043/oden-artofmelt-2023-cloudnet-1 (Guy et al., 2025)
-
Microwave radiometer: https://doi.org/10.17043/oden-artofmelt-2023-microwave-profiles-1 (Tjernström et al., 2024)
-
Radiosondes: https://doi.org/10.17043/oden-artofmelt-2023-radiosonde-1 (Murto et al., 2024a)
-
Surface observations ice station: https://doi.org/10.17043/oden-artofmelt-2023-surface-meteorology-ice-station-1 (Guy et al., 2024a)
-
Tethered balloon vertical in-situ observations: https://doi.org/10.17043/oden-artofmelt-2023-aerosols-vertical-1 (Pohorsky et al., 2025)
-
DMPS and CCNC data available upon request.
-
MIMICA model output is available at https://doi.org/10.5281/zenodo.19761135 (Frostenberg and Ickes, 2026).
-
The MIMICA code is available at https://doi.org/10.5281/zenodo.19762207 (Frostenberg et al., 2026).
HCF, LI, JC, and EST conceptualized the study. HCF conducted the simulations, primary analysis, and wrote the manuscript draft, all under supervision by LI. HG and IMB provided remote sensing and broadband radiometer data, as well as surface observations. RP and JS provided Helikite data, with the exception of INP data provided by CM and JC, and STXM/NEXAFS data provided by NF and EST. SM and MT provided radiosonde and microwave radiometer data. LH, JK, and PZ provided ship-based aerosol data. SM created the synoptic overview map. All authors contributed to the discussion and interpretation of the results and commented on the manuscript.
At least one of the (co-)authors is a member of the editorial board of Atmospheric Chemistry and Physics. The peer-review process was guided by an independent editor, and the authors also have no other competing interests to declare.
Publisher's note: Copernicus Publications remains neutral with regard to jurisdictional claims made in the text, published maps, institutional affiliations, or any other geographical representation in this paper. The authors bear the ultimate responsibility for providing appropriate place names. Views expressed in the text are those of the authors and do not necessarily reflect the views of the publisher.
This work is part of the ARTofMELT (Atmospheric rivers and the onset of Arctic melt) project. The ARTofMELT expedition was supported and organised by the Swedish Polar Research Secretariat (SPRS) on the Swedish research icebreaker Oden in spring 2023 under the SWEDARCTIC program. The MIMICA simulations were enabled by resources provided by the National Academic Infrastructure for Supercomputing in Sweden (NAISS), partially funded by the Swedish Research Council through grant agreement no. 2022-06725.
The Kipp & Zonen radiometers were provided by the Atmospheric Measurement and Observations Facility (AMOF) of the UK National Centre for Atmospheric Science (NCAS). We thank Annica Ekman and Gunilla Svensson for valuable discussions, as well as Nazario Mastroianni and Julien Savre for their technical assistance with MIMICA. Additionally, we express our gratitude to the three anonymous reviewers for carefully reading our paper and for their valuable feedback. The large-language models Perplexity (GPT-5.2) and Google Gemini were used for language editing of the manuscript. All final content was reviewed and approved by the authors.
Support for the ARTofMELT expedition came from the Swedish Council for Research Infrastructures (grant 2021-00153) and the Knut and Alice Wallenberg Foundation (grant 2016-0024). The ARTofMELT project has received funding from the European Union's Horizon 2020 research and innovation programme under grant agreement No. 101003826 via project CRiceS (Climate Relevant interactions and feedbacks: the key role of sea ice and Snow in the polar and global climate system) and the European Research Council (Consolidator grant INTEGRATE No. 865799). Further funding was provided by the Carl Tryggers Foundation (CTS 22:2148), Ymer-80-foundation, the Bolin Centre for Climate Research (RA2) and the Ivar Bendixsons scholarship. HCF and LI were supported by the Chalmers Gender Initiative for Excellence (Genie).
HCF, LI, EST and NF contribute to the Strategic Research Area “ModElling the Regional and Global Earth system”, MERGE, funded by the Swedish government. A research visit by HCF at CSU was supported by the Barbro Oshers Pro Suecia Foundation. EST has been supported by the Swedish Research Councils, VR (2020-03497), the Carl Tryggers Foundation, and the Swedish Strategic Research Area MERGE. JC and CM received funding from the U.S. National Science Foundation (grant no. OPP-2226864). HG and IMB were supported by the UK National Environment Research Council grant no. NE/X000087/1. RP and JS received funding from the Swiss National Science Foundation (grant no. 200021_212101). JS holds the Ingvar Kamprad Chair for Extreme Environments Research sponsored by Ferring Pharmaceuticals. NF has been supported by the Swedish Research Councils, VR (2020-03497), the Ymer-80 Foundation and the Åforsk Foundation. SM was partly funded by the Swedish Research Council, Grant 2022-03052.
The publication of this article was funded by the Swedish Research Council, Forte, Formas, and Vinnova.
This paper was edited by Blaž Gasparini and reviewed by three anonymous referees.
Avramov, A. and Harrington, J. Y.: Influence of Parameterized Ice Habit on Simulated Mixed Phase Arctic Clouds, J. Geophys. Res.-Atmos., 115, https://doi.org/10.1029/2009JD012108, 2010. a, b, c, d, e
Avramov, A., Ackerman, A. S., Fridlind, A. M., van Diedenhoven, B., Botta, G., Aydin, K., Verlinde, J., Korolev, A. V., Strapp, J. W., McFarquhar, G. M., Jackson, R., Brooks, S. D., Glen, A., and Wolde, M.: Toward Ice Formation Closure in Arctic Mixed-Phase Boundary Layer Clouds during ISDAC, J. Geophys. Res.-Atmos., 116, https://doi.org/10.1029/2011JD015910, 2011. a
Barry, K. R., Hill, T. C. J., Kreidenweis, S. M., DeMott, P. J., Tobo, Y., and Creamean, J. M.: Bioaerosols as indicators of central Arctic ice nucleating particle sources, Atmos. Chem. Phys., 25, 11919–11933, https://doi.org/10.5194/acp-25-11919-2025, 2025. a, b
Bergeron, T.: On the physics of clouds and precipitation, Proc. Fifth Assembly of the International Union of Geodesy and Geophysics, International Union of Geodesy and Geophysics, Lisbon, Portugal, 156–180, 1935. a
Birch, C. E., Brooks, I. M., Tjernström, M., Shupe, M. D., Mauritsen, T., Sedlar, J., Lock, A. P., Earnshaw, P., Persson, P. O. G., Milton, S. F., and Leck, C.: Modelling atmospheric structure, cloud and their response to CCN in the central Arctic: ASCOS case studies, Atmos. Chem. Phys., 12, 3419–3435, https://doi.org/10.5194/acp-12-3419-2012, 2012. a
Böhmländer, A., Lacher, L., Brus, D., Doulgeris, K.-M., Brasseur, Z., Boyer, M., Kuula, J., Leisner, T., and Möhler, O.: A novel aerosol filter sampler for measuring the vertical distribution of ice-nucleating particles via fixed-wing uncrewed aerial vehicles, Atmos. Meas. Tech., 18, 3959–3971, https://doi.org/10.5194/amt-18-3959-2025, 2025. a
Boyer, M., Aliaga, D., Pernov, J. B., Angot, H., Quéléver, L. L. J., Dada, L., Heutte, B., Dall'Osto, M., Beddows, D. C. S., Brasseur, Z., Beck, I., Bucci, S., Duetsch, M., Stohl, A., Laurila, T., Asmi, E., Massling, A., Thomas, D. C., Nøjgaard, J. K., Chan, T., Sharma, S., Tunved, P., Krejci, R., Hansson, H. C., Bianchi, F., Lehtipalo, K., Wiedensohler, A., Weinhold, K., Kulmala, M., Petäjä, T., Sipilä, M., Schmale, J., and Jokinen, T.: A full year of aerosol size distribution data from the central Arctic under an extreme positive Arctic Oscillation: insights from the Multidisciplinary drifting Observatory for the Study of Arctic Climate (MOSAiC) expedition, Atmos. Chem. Phys., 23, 389–415, https://doi.org/10.5194/acp-23-389-2023, 2023. a
Bulatovic, I., Igel, A. L., Leck, C., Heintzenberg, J., Riipinen, I., and Ekman, A. M. L.: The importance of Aitken mode aerosol particles for cloud sustenance in the summertime high Arctic – a simulation study supported by observational data, Atmos. Chem. Phys., 21, 3871–3897, https://doi.org/10.5194/acp-21-3871-2021, 2021. a, b
Christiansen, S., Ickes, L., Bulatovic, I., Leck, C., Murray, B. J., Bertram, A. K., Wagner, R., Gorokhova, E., Salter, M. E., Ekman, A. M., and Bilde, M.: Influence of Arctic Microlayers and Algal Cultures on Sea Spray Hygroscopicity and the Possible Implications for Mixed-Phase Clouds, J. Geophys. Res.-Atmos., 125, https://doi.org/10.1029/2020JD032808, 2020. a, b
Creamean, J. M., de Boer, G., Telg, H., Mei, F., Dexheimer, D., Shupe, M. D., Solomon, A., and McComiskey, A.: Assessing the vertical structure of Arctic aerosols using balloon-borne measurements, Atmos. Chem. Phys., 21, 1737–1757, https://doi.org/10.5194/acp-21-1737-2021, 2021. a
Creamean, J. M., Hume, C. C., Vazquez, M., and Theisen, A.: Long-term measurements of ice nucleating particles at Atmospheric Radiation Measurement (ARM) sites worldwide, Earth Syst. Sci. Data, 17, 6943–6963, https://doi.org/10.5194/essd-17-6943-2025, 2025. a
Creamean, J. M., Dexheimer, D., Hume, C. C., Vazquez, M., Hess, B. T. M., Longbottom, C. M., Ruiz, C. A., and Theisen, A. K.: Reaching new heights: Profiling Upper altitudes For Ice Nucleation (PUFIN) on the Atmospheric Radiation Measurement (ARM) tethered balloon systems, Atmos. Meas. Tech., 19, 4601–4615, https://doi.org/10.5194/amt-19-4601-2026, 2026. a, b
Dusek, U., Frank, G. P., Hildebrandt, L., Curtius, J., Schneider, J., Walter, S., Chand, D., Drewnick, F., Hings, S., Jung, D., Borrmann, S., and Andreae, M. O.: Size Matters More Than Chemistry for Cloud-Nucleating Ability of Aerosol Particles, Science, 312, 1375–1378, https://doi.org/10.1126/science.1125261, 2006. a
Escusa dos Santos, L. F., Frostenberg, H. C., Baró Pérez, A., Ekman, A. M. L., Ickes, L., and Thomson, E. S.: Potential impacts of marine fuel regulations on an Arctic stratocumulus case and its radiative response, Atmos. Chem. Phys., 25, 119–142, https://doi.org/10.5194/acp-25-119-2025, 2025. a
Findeisen, W.: Kolloid-meteorologische Vorgänge bei Niederschlagsbildung, Meteor. Z., 55, 121–133, 1938. a
Fridlind, A. M., Ackerman, A. S., McFarquhar, G., Zhang, G., Poellot, M. R., DeMott, P. J., Prenni, A. J., and Heymsfield, A. J.: Ice Properties of Single-Layer Stratocumulus during the Mixed-Phase Arctic Cloud Experiment: 2. Model Results, J. Geophys. Res., 112, D24202, https://doi.org/10.1029/2007JD008646, 2007. a
Frostenberg, H. C. and Ickes, L.: MIMICA LES output to analyze cloud-phase sensitivities in an Arctic stratocumulus, Zenodo [data set], https://doi.org/10.5281/zenodo.19761135, 2026. a
Frostenberg, H. C., Welti, A., Luhr, M., Savre, J., Thomson, E. S., and Ickes, L.: The chance of freezing – a conceptional study to parameterize temperature-dependent freezing by including randomness of ice-nucleating particle concentrations, Atmos. Chem. Phys., 23, 10883–10900, https://doi.org/10.5194/acp-23-10883-2023, 2023. a
Frostenberg, H. C., Ickes, L., and Mastroianni, N.: MIMICA v5 version for analyzing cloud-phase sensitivities of an Arctic stratocumulus (Version AoMv1.0), Zenodo [code], https://doi.org/10.5281/zenodo.19762207, 2026. a
Fu, Q. and Liou, K. N.: Parameterization of the Radiative Properties of Cirrus Clouds, J. Atmos. Sci., 50, 2008–2025, 1993. a
Fu, Q., Liou, K. N., Cribb, M. C., Charlock, T. P., and Grossman, A.: Multiple Scattering Parameterization in Thermal Infrared Radiative Transfer, J. Atmos. Sci., 54, 2799–2812, https://doi.org/10.1175/1520-0469(1997)054<2799:MSPITI>2.0.CO;2, 1997. a
Fu, S., Deng, X., Shupe, M. D., and Xue, H.: A Modelling Study of the Continuous Ice Formation in an Autumnal Arctic Mixed-Phase Cloud Case, Atmos. Res., 228, 77–85, https://doi.org/10.1016/j.atmosres.2019.05.021, 2019. a, b, c, d
Gong, X., Zhang, J., Croft, B., Yang, X., Frey, M. M., Bergner, N., Chang, R. Y.-W., Creamean, J. M., Kuang, C., Martin, R. V., Ranjithkumar, A., Sedlacek, A. J., Uin, J., Willmes, S., Zawadowicz, M. A., Pierce, J. R., Shupe, M. D., Schmale, J., and Wang, J.: Arctic Warming by Abundant Fine Sea Salt Aerosols from Blowing Snow, Nat. Geosci., 16, 768–774, https://doi.org/10.1038/s41561-023-01254-8, 2023. a
Gu, Y., Farrara, J., Liou, K. N., and Mechoso, C. R.: Parameterization of Cloud–Radiation Processes in the UCLA General Circulation Model, J. Clim., 16, 3357–3370, https://doi.org/10.1175/1520-0442(2003)016<3357:POCPIT>2.0.CO;2, 2003. a
Guy, H. and Brooks, I.: Cloud liquid water content retrieval from expedition ARTofMELT, Arctic Ocean, 2023, Dataset version 1, Bolin Centre Database [data set], https://doi.org/10.17043/oden-artofmelt-2023-cloud-liquid-water-1, 2026. a, b, c
Guy, H., Brooks, I., Murto, S., Karalis, M., and Tjernström, M.: Ice station surface meteorology and radiation data from expedition ARTofMELT, Arctic Ocean, 2023, Dataset version 1, Bolin Centre Database [data set], https://doi.org/10.17043/oden-artofmelt-2023-surface-meteorology-ice-station-1, 2024a. a, b
Guy, H., Brooks, I., Murto, S., Tjernström, M., Karalis, M., and Prytherch, J.: Cloud radar data from expedition ARTofMELT, Arctic Ocean, 2023, Dataset version 1, Bolin Centre Database [data set], https://doi.org/10.17043/oden-artofmelt-2023-cloud-radar-1, 2024b. a, b
Guy, H., Brooks, I., Murto, S., Tjernström, M., Karalis, M., and Prytherch, J.: Cloudnet categorize and classification products from expedition ARTofMELT, Arctic Ocean, 2023, Dataset version 1, Bolin Centre Database [data set], https://doi.org/10.17043/oden-artofmelt-2023-cloudnet-1, 2025. a, b
Hallett, J. and Mossop, S. C.: Production of Secondary Ice Particles during the Riming Process, Nature, 249, 26–28, https://doi.org/10.1038/249026a0, 1974. a, b, c
Hartmann, M., Gong, X., Kecorius, S., van Pinxteren, M., Vogl, T., Welti, A., Wex, H., Zeppenfeld, S., Herrmann, H., Wiedensohler, A., and Stratmann, F.: Terrestrial or marine – indications towards the origin of ice-nucleating particles during melt season in the European Arctic up to 83.7° N, Atmos. Chem. Phys., 21, 11613–11636, https://doi.org/10.5194/acp-21-11613-2021, 2021. a
Herbert, R. J., Arnold, S. R., Jones, A. C., Murray, B. J., and Carslaw, K. S.: Long-Lived Sub-Micron Desert Dusts Are Important Ice-Nucleating Particles in the Polar Regions, Geophys. Res. Lett., 53, e2025GL120664, https://doi.org/10.1029/2025GL120664, 2026. a
Hess, M., Koepke, P., and Schult, I.: Optical Properties of Aerosols and Clouds: The Software Package OPAC, B. Am. Meteorol. Soc., 79, 831–844, https://doi.org/10.1175/1520-0477(1998)079<0831:OPOAAC>2.0.CO;2, 1998. a
Hobbs, P. V. and Rangno, A. L.: Microstructures of Low and Middle-Level Clouds over the Beaufort Sea, Q. J. R. Meteorol. Soc., 124, 2035–2071, https://doi.org/10.1002/qj.49712455012, 1998. a
Hogan, R. J., Mittermaier, M. P., and Illingworth, A. J.: The Retrieval of Ice Water Content from Radar Reflectivity Factor and Temperature and Its Use in Evaluating a Mesoscale Model, J. Appl. Meteorol. Climatol., 45, 301–317, https://doi.org/10.1175/JAM2340.1, 2006. a
Ickes, L., Neubauer, D., Proske, U., Villanueva, D., and Lohmann, U.: What Is Triggering Ice in Mixed-Phase Clouds: A Process Analysis With ECHAM6.1-HAM2.3 Using the Factorial Method, J. Geophys. Res.-Atmos., 131, e2025JD045160, https://doi.org/10.1029/2025JD045160, 2026. a, b
Igel, A. L., Ekman, A. M. L., Leck, C., Tjernström, M., Savre, J., and Sedlar, J.: The Free Troposphere as a Potential Source of Arctic Boundary Layer Aerosol Particles, Geophys. Res. Lett., 44, 7053–7060, https://doi.org/10.1002/2017GL073808, 2017. a
Järvinen, E., Nehlert, F., Xu, G., Waitz, F., Mioche, G., Dupuy, R., Jourdan, O., and Schnaiter, M.: Investigating the vertical extent and short-wave radiative effects of the ice phase in Arctic summertime low-level clouds, Atmos. Chem. Phys., 23, 7611–7633, https://doi.org/10.5194/acp-23-7611-2023, 2023. a, b
Juliano, T. W., Tornow, F., Fridlind, A. M., Ackerman, A. S., Elsaesser, G. S., Geerts, B., Lackner, C. P., Painemal, D., Silber, I., Ovchinnikov, M., Svensson, G., Tjernström, M., Wu, P., Baró Pérez, A., Bogenschutz, P., Chechin, D., Chandrakar, K. K., Chylik, J., Debolskiy, A., Fadeev, R., Gupta, A., Ickes, L., Karalis, M., Köhler, M., Kosovic, B., Kuma, P., Li, W., Mortikov, E., Morrison, H., Neggers, R. A. J., Possner, A., Raatikainen, T., Raillard, L., Romakkaniemi, S., Schnierstein, N., Shima, S., Silin, N., Tolstykh, M., Vignon, É., Xue, L., Zhang, M., and Zheng, X.: The Cold-Air Outbreaks in the Marine Boundary Layer Experiment model-observation intercomparison project (COMBLE-MIP), Part I: Model specification, observational constraints, and preliminary findings, EGUsphere [preprint], https://doi.org/10.5194/egusphere-2026-1237, 2026. a
Karlsson, L., Baccarini, A., Duplessis, P., Baumgardner, D., Brooks, I. M., Chang, R. Y.-W., Dada, L., Dällenbach, K. R., Heikkinen, L., Krejci, R., Leaitch, W. R., Leck, C., Partridge, D. G., Salter, M. E., Wernli, H., Wheeler, M. J., Schmale, J., and Zieger, P.: Physical and Chemical Properties of Cloud Droplet Residuals and Aerosol Particles During the Arctic Ocean 2018 Expedition, J. Geophys. Res.-Atmos., 127, e2021JD036383, https://doi.org/10.1029/2021JD036383, 2022. a, b
Khvorostyanov, V. I. and Curry, J. A.: Aerosol Size Spectra and CCN Activity Spectra: Reconciling the Lognormal, Algebraic, and Power Laws, J. Geophys. Res., 111, D12202, https://doi.org/10.1029/2005JD006532, 2006. a
Komurcu, M.: Influences of Ice Crystal Number Concentrations and Habits on Arctic Mixed-Phase Cloud Dynamics, Pure Appl. Geophys., 173, 3125–3140, https://doi.org/10.1007/s00024-015-1132-8, 2016. a, b
Korolev, A., DeMott, P. J., Heckman, I., Wolde, M., Williams, E., Smalley, D. J., and Donovan, M. F.: Observation of secondary ice production in clouds at low temperatures, Atmos. Chem. Phys., 22, 13103–13113, https://doi.org/10.5194/acp-22-13103-2022, 2022. a
Korolev, A. V. and Lawson, R. P.: Microphysics of Arctic Stratiform Boundary-layer Clouds during ARCSIX, Atmos. Chem. Phys., 26, 2331–2352, https://doi.org/10.5194/acp-26-2331-2026, 2026. a
Lauber, A., Kiselev, A., Pander, T., Handmann, P., and Leisner, T.: Secondary Ice Formation during Freezing of Levitated Droplets, J. Atmos. Sci., 75, 2815–2826, https://doi.org/10.1175/JAS-D-18-0052.1, 2018. a, b
Lawson, R. P., Baker, B. A., Schmitt, C. G., and Jensen, T. L.: An Overview of Microphysical Properties of Arctic Clouds Observed in May and July 1998 during FIRE ACE, J. Geophys. Res.-Atmos., 106, 14989–15014, https://doi.org/10.1029/2000JD900789, 2001. a
Letterly, A., Key, J., and Liu, Y.: The Influence of Winter Cloud on Summer Sea Ice in the Arctic, 1983–2013, J. Geophys. Res.-Atmos., 121, 2178–2187, https://doi.org/10.1002/2015JD024316, 2016. a
Lide, D. R.: CRC Handbook of Chemistry and Physics, 85th Edition, CRC Press, Boca Raton, FL, 85th edn., ISBN 978-0849304859, 2004. a
Lloyd, G., Choularton, T. W., Bower, K. N., Crosier, J., Jones, H., Dorsey, J. R., Gallagher, M. W., Connolly, P., Kirchgaessner, A. C. R., and Lachlan-Cope, T.: Observations and comparisons of cloud microphysical properties in spring and summertime Arctic stratocumulus clouds during the ACCACIA campaign, Atmos. Chem. Phys., 15, 3719–3737, https://doi.org/10.5194/acp-15-3719-2015, 2015. a
Loewe, K., Ekman, A. M. L., Paukert, M., Sedlar, J., Tjernström, M., and Hoose, C.: Modelling micro- and macrophysical contributors to the dissipation of an Arctic mixed-phase cloud during the Arctic Summer Cloud Ocean Study (ASCOS), Atmos. Chem. Phys., 17, 6693–6704, https://doi.org/10.5194/acp-17-6693-2017, 2017. a, b, c
Luke, E. P., Yang, F., Kollias, P., Vogelmann, A. M., and Maahn, M.: New insights into ice multiplication using remote-sensing observations of slightly supercooled mixed-phase clouds in the Arctic, P. Natl. Acad. Sci. USA, 118, e2021387118, https://doi.org/10.1073/pnas.2021387118, 2021. a
Mauritsen, T., Sedlar, J., Tjernström, M., Leck, C., Martin, M., Shupe, M., Sjogren, S., Sierau, B., Persson, P. O. G., Brooks, I. M., and Swietlicki, E.: An Arctic CCN-limited cloud-aerosol regime, Atmos. Chem. Phys., 11, 165–173, https://doi.org/10.5194/acp-11-165-2011, 2011. a, b, c
McFarquhar, G. M., Zhang, G., Poellot, M. R., Kok, G. L., McCoy, R., Tooman, T., Fridlind, A., and Heymsfield, A. J.: Ice Properties of Single-Layer Stratocumulus during the Mixed-Phase Arctic Cloud Experiment: 1. Observations, J. Geophys. Res.-Atmos., 112, https://doi.org/10.1029/2007JD008633, 2007. a
Morrison, H., Shupe, M. D., and Curry, J. A.: Modeling Clouds Observed at SHEBA Using a Bulk Microphysics Parameterization Implemented into a Single-Column Model, J. Geophys. Res.-Atmos., 108, https://doi.org/10.1029/2002JD002229, 2003. a
Morrison, H., De Boer, G., Feingold, G., Harrington, J., Shupe, M. D., and Sulia, K.: Resilience of Persistent Arctic Mixed-Phase Clouds, Nat. Geosci., 5, 11–17, https://doi.org/10.1038/ngeo1332, 2012. a
Murto, S., Tjernström, M., Brooks, I., Guy, H., Karalis, M., Vihma, T., Urbancic, G., and Prytherch, J.: Radiosonde profiles from expedition ARTofMELT, Arctic Ocean, 2023, Dataset version 1, Bolin Centre Database [data set], https://doi.org/10.17043/oden-artofmelt-2023-radiosonde-1, 2024a. a, b
Murto, S., Tjernström, M., Karalis, M., and Prytherch, J.: Cloud base heights and atmospheric backscatter observations from expedition ARTofMELT, Arctic Ocean, 2023, Dataset version 1, Bolin Centre Database [data set], https://doi.org/10.17043/oden-artofmelt-2023-ceilometer-1, 2024b. a, b
Ong, C. R., Koike, M., Hashino, T., and Miura, H.: Responses of Simulated Arctic Mixed-Phase Clouds to Parameterized Ice Particle Shape, J. Atmos. Sci., 81, 125–152, https://doi.org/10.1175/JAS-D-23-0015.1, 2024. a
Ovchinnikov, M., Ackerman, A. S., Avramov, A., Cheng, A., Fan, J., Fridlind, A. M., Ghan, S., Harrington, J., Hoose, C., Korolev, A., McFarquhar, G. M., Morrison, H., Paukert, M., Savre, J., Shipway, B. J., Shupe, M. D., Solomon, A., and Sulia, K.: Intercomparison of Large-Eddy Simulations of Arctic Mixed-Phase Clouds: Importance of Ice Size Distribution Assumptions, J. Adv. Model. Earth Syst., 6, 223–248, https://doi.org/10.1002/2013MS000282, 2014. a, b, c
Pasquier, J. T., David, R. O., Freitas, G., Gierens, R., Gramlich, Y., Haslett, S., Li, G., Schäfer, B., Siegel, K., Wieder, J., Adachi, K., Belosi, F., Carlsen, T., Decesari, S., Ebell, K., Gilardoni, S., Gysel-Beer, M., Henneberger, J., Inoue, J., Kanji, Z. A., Koike, M., Kondo, Y., Krejci, R., Lohmann, U., Maturilli, M., Mazzolla, M., Modini, R., Mohr, C., Motos, G., Nenes, A., Nicosia, A., Ohata, S., Paglione, M., Park, S., Pileci, R. E., Ramelli, F., Rinaldi, M., Ritter, C., Sato, K., Storelvmo, T., Tobo, Y., Traversi, R., Viola, A., and Zieger, P.: The Ny-Ålesund Aerosol Cloud Experiment (NASCENT): Overview and First Results, B. Am. Meteorol. Soc., 103, E2533–E2558, https://doi.org/10.1175/BAMS-D-21-0034.1, 2022a. a
Pasquier, J. T., Henneberger, J., Ramelli, F., Lauber, A., David, R. O., Wieder, J., Carlsen, T., Gierens, R., Maturilli, M., and Lohmann, U.: Conditions favorable for secondary ice production in Arctic mixed-phase clouds, Atmos. Chem. Phys., 22, 15579–15601, https://doi.org/10.5194/acp-22-15579-2022, 2022b. a, b
Phillips, V. T. J., Yano, J.-I., and Khain, A.: Ice Multiplication by Breakup in Ice–Ice Collisions. Part I: Theoretical Formulation, J. Atmos. Sci., 74, 1705–1719, https://doi.org/10.1175/JAS-D-16-0224.1, 2017. a, b
Phillips, V. T. J., Patade, S., Gutierrez, J., and Bansemer, A.: Secondary Ice Production by Fragmentation of Freezing Drops: Formulation and Theory, J. Atmos. Sci., 75, 3031–3070, https://doi.org/10.1175/JAS-D-17-0190.1, 2018. a
Pohorsky, R., Baccarini, A., Tolu, J., Winkel, L. H. E., and Schmale, J.: Modular Multiplatform Compatible Air Measurement System (MoMuCAMS): a new modular platform for boundary layer aerosol and trace gas vertical measurements in extreme environments, Atmos. Meas. Tech., 17, 731–754, https://doi.org/10.5194/amt-17-731-2024, 2024. a
Pohorsky, R., Calmer, R., Brooks, I., Guy, H., Fauré, N., Haberstock, L., Creamean, J., Mavis, C., and Schmale, J.: Vertical in situ measurements of aerosols and meteorological variables from expedition ARTofMELT, Arctic Ocean, 2023, Dataset version 1, Bolin Centre Database [data set], https://doi.org/10.17043/oden-artofmelt-2023-aerosols-vertical-1, 2025. a, b
Pohorsky, R., Guy, H., Brooks, I. M., Haberstock, L., Fauré, N., Zieger, P., Kojoj, J., Murto, S., Calmer, R., Heutte, B., Lonardi, M., Thomson, E. S., Tjernström, M., Creamean, J., Nenes, A., and Schmale, J.: Contribution of free tropospheric aerosols to Arctic low-level cloud droplets formation and longwave radiative forcing, Atmos. Chem. Phys., 26, 10331–10353, https://doi.org/10.5194/acp-26-10331-2026, 2026. a, b, c, d, e, f, g, h, i, j
Porter, G. C. E., Sikora, S. N. F., Adams, M. P., Proske, U., Harrison, A. D., Tarn, M. D., Brooks, I. M., and Murray, B. J.: Resolving the size of ice-nucleating particles with a balloon deployable aerosol sampler: the SHARK, Atmos. Meas. Tech., 13, 2905–2921, https://doi.org/10.5194/amt-13-2905-2020, 2020. a
Possner, A., Pfannkuch, K., and Ramadoss, V.: Cloud-Resolving ICON Simulations of Secondary Ice Production in Arctic Mixed-Phase Stratocumuli Observed during M-PACE, J. Atmos. Sci., 81, 417–434, https://doi.org/10.1175/JAS-D-23-0069.1, 2024. a, b
Prenni, A. J., Demott, P. J., Rogers, D. C., Kreidenweis, S. M., Mcfarquhar, G. M., Zhang, G., and Poellot, M. R.: Ice Nuclei Characteristics from M-PACE and Their Relation to Ice Formation in Clouds, Tellus B Chem. Phys. Meteorol., 61, 436–448, 2009. a, b
Pruppacher, H. R. and Klett, J. D.: Microphysics of Clouds and Precipitation, 2nd edn., Kluwer Academic, ISBN 978-0-7923-4211-3, eBook ISBN 978-0-306-48100-0, https://doi.org/10.1007/978-0-306-48100-0, 2010. a, b, c
Rangno, A. L. and Hobbs, P. V.: Ice Particles in Stratiform Clouds in the Arctic and Possible Mechanisms for the Production of High Ice Concentrations, J. Geophys. Res.-Atmos., 106, 15065–15075, https://doi.org/10.1029/2000JD900286, 2001. a
Santos, L. F. E. D., Salo, K., Kong, X., Noda, J., Kristensen, T. B., Ohigashi, T., and Thomson, E. S.: Changes in CCN Activity of Ship Exhaust Particles Induced by Fuel Sulfur Content Reduction and Wet Scrubbing, Environ. Sci.: Atmos., 3, 182–195, https://doi.org/10.1039/D2EA00081D, 2023. a
Savre, J., Ekman, A. M., and Svensson, G.: Technical Note: Introduction to MIMICA, a Large-Eddy Simulation Solver for Cloudy Planetary Boundary Layers, J. Adv. Model. Earth Syst., 6, 630–649, https://doi.org/10.1002/2013MS000292, 2014. a, b, c
Schwarz, M., Savre, J., Sudhakar, D., Quaas, J., and Ekman, A.: The Transition from Aerosol- to Updraft-Limited Susceptibility Regime in Large Eddy Simulations with Bulk Microphysics, Tellus B, 76, 32–46, https://doi.org/10.16993/tellusb.94, 2024. a
Seifert, A. and Beheng, K. D.: A Two-Moment Cloud Microphysics Parameterization for Mixed-Phase Clouds. Part 1: Model Description, Meteorol. Atmos. Phys., 92, 45–66, https://doi.org/10.1007/s00703-005-0112-4, 2006. a, b, c, d
Shupe, M. D.: Clouds at Arctic Atmospheric Observatories. Part II: Thermodynamic Phase Characteristics, J. Appl. Meteorol. Climatol., 50, 645–661, https://doi.org/10.1175/2010JAMC2468.1, 2011. a
Shupe, M. D. and Intrieri, J. M.: Cloud Radiative Forcing of the Arctic Surface: The Influence of Cloud Properties, Surface Albedo, and Solar Zenith Angle, J. Climate, 17, 616–628, https://doi.org/10.1175/1520-0442(2004)017<0616:CRFOTA>2.0.CO;2, 2004. a
Shupe, M. D., Kollias, P., Persson, P. O. G., and McFarquhar, G. M.: Vertical Motions in Arctic Mixed-Phase Stratiform Clouds, J. Atmos. Sci., 65, 1304–1322, https://doi.org/10.1175/2007JAS2479.1, 2008. a
Silber, I., McGlynn, P. S., Harrington, J. Y., and Verlinde, J.: Habit-Dependent Vapor Growth Modulates Arctic Supercooled Water Occurrence, Geophys. Res. Lett., 48, e2021GL092767, https://doi.org/10.1029/2021GL092767, 2021. a
Smagorinsky, J.: General circulation experiments with the primitive equations: I. The basic experiment, Mon. Weather Rev., 91, 99–164, https://doi.org/10.1175/1520-0493(1963)091<0099:GCEWTP>2.3.CO;2, 1963. a
Solomon, A., Feingold, G., and Shupe, M. D.: The role of ice nuclei recycling in the maintenance of cloud ice in Arctic mixed-phase stratocumulus, Atmos. Chem. Phys., 15, 10631–10643, https://doi.org/10.5194/acp-15-10631-2015, 2015. a, b
Sotiropoulou, G., Sullivan, S., Savre, J., Lloyd, G., Lachlan-Cope, T., Ekman, A. M. L., and Nenes, A.: The impact of secondary ice production on Arctic stratocumulus, Atmos. Chem. Phys., 20, 1301–1316, https://doi.org/10.5194/acp-20-1301-2020, 2020. a, b, c, d, e
Sotiropoulou, G., Ickes, L., Nenes, A., and Ekman, A. M. L.: Ice multiplication from ice–ice collisions in the high Arctic: sensitivity to ice habit, rimed fraction, ice type and uncertainties in the numerical description of the process, Atmos. Chem. Phys., 21, 9741–9760, https://doi.org/10.5194/acp-21-9741-2021, 2021. a, b
Stevens, R. G., Loewe, K., Dearden, C., Dimitrelos, A., Possner, A., Eirund, G. K., Raatikainen, T., Hill, A. A., Shipway, B. J., Wilkinson, J., Romakkaniemi, S., Tonttila, J., Laaksonen, A., Korhonen, H., Connolly, P., Lohmann, U., Hoose, C., Ekman, A. M. L., Carslaw, K. S., and Field, P. R.: A model intercomparison of CCN-limited tenuous clouds in the high Arctic, Atmos. Chem. Phys., 18, 11041–11071, https://doi.org/10.5194/acp-18-11041-2018, 2018. a, b, c
Stull, R.: An introduction to boundary layer meteorology, Kluwer Academic Publishers, ISBN 978-90-277-2768-8, https://doi.org/10.1007/978-94-009-3027-8, 1988. a
Sullivan, R. C., Moore, M. J. K., Petters, M. D., Kreidenweis, S. M., Roberts, G. C., and Prather, K. A.: Effect of chemical mixing state on the hygroscopicity and cloud nucleation properties of calcium mineral dust particles, Atmos. Chem. Phys., 9, 3303–3316, https://doi.org/10.5194/acp-9-3303-2009, 2009. a
Taylor, P. C., Boeke, R. C., Li, Y., and Thompson, D. W. J.: Arctic cloud annual cycle biases in climate models, Atmos. Chem. Phys., 19, 8759–8782, https://doi.org/10.5194/acp-19-8759-2019, 2019. a
Teller, A. and Levin, Z.: Factorial Method as a Tool for Estimating the Relative Contribution to Precipitation of Cloud Microphysical Processes and Environmental Conditions: Method and Application, J. Geophys. Res.-Atmos., 113, https://doi.org/10.1029/2007JD008960, 2008. a, b
Tjernström, M. and Zieger, P. (Eds.): ARTofMELT 2023: Expedition report, Swedish Polar Research Secretariat, ISBN 978-91-519-5134-8, https://www.polar.se/en/expeditions/expedition-reports/ (last access: 15 September 2026), 2025. a
Tjernström, M., Murto, S., Karalis, M., and Prytherch, J.: Temperature and humidity profiles from microwave radiometer during expedition ARTofMELT, Arctic Ocean, 2023, Dataset version 1, Bolin Centre Database [data set], https://doi.org/10.17043/oden-artofmelt-2023-microwave-profiles-1, 2024. a, b
Tobo, Y., Adachi, K., DeMott, P. J., Hill, T. C. J., Hamilton, D. S., Mahowald, N. M., Nagatsuka, N., Ohata, S., Uetake, J., Kondo, Y., and Koike, M.: Glacially Sourced Dust as a Potentially Significant Source of Ice Nucleating Particles, Nat. Geosci., 12, 253–258, https://doi.org/10.1038/s41561-019-0314-x, 2019. a, b
Tornow, F., Ackerman, A. S., and Fridlind, A. M.: Preconditioning of overcast-to-broken cloud transitions by riming in marine cold air outbreaks, Atmos. Chem. Phys., 21, 12049–12067, https://doi.org/10.5194/acp-21-12049-2021, 2021. a
Tukiainen, S., O'Connor, E., and Korpinen, A.: CloudnetPy: A Python Package for Processing Cloud Remote Sensing Data, J. Open Source Softw., 5, 2123, https://doi.org/10.21105/joss.02123, 2020. a
Twomey, S.: Pollution and the Planetary Albedo, Atmos. Environ., 8, 1251–1256, https://doi.org/10.1016/0004-6981(74)90004-3, 1974. a
Vardiman, L.: The Generation of Secondary Ice Particles in Clouds by Crystal–Crystal Collision, J. Atmos. Sci., 35, 2168–2180, https://doi.org/10.1175/1520-0469(1978)035<2168:TGOSIP>2.0.CO;2, 1978. a
Wallentin, G., Oertel, A., Ickes, L., Achtert, P., Tesche, M., and Hoose, C.: Sensitivities of simulated mixed-phase Arctic multilayer clouds to primary and secondary ice processes, Atmos. Chem. Phys., 25, 6607–6631, https://doi.org/10.5194/acp-25-6607-2025, 2025. a, b, c
Wegener, A.: Thermodynamik der Atmosphäre, J. A. Barth, Leipzig, Germany, 1911. a
Welti, A., Bigg, E. K., DeMott, P. J., Gong, X., Hartmann, M., Harvey, M., Henning, S., Herenz, P., Hill, T. C. J., Hornblow, B., Leck, C., Löffler, M., McCluskey, C. S., Rauker, A. M., Schmale, J., Tatzelt, C., van Pinxteren, M., and Stratmann, F.: Ship-based measurements of ice nuclei concentrations over the Arctic, Atlantic, Pacific and Southern oceans, Atmos. Chem. Phys., 20, 15191–15206, https://doi.org/10.5194/acp-20-15191-2020, 2020. a
Westwater, E. R., Han, Y., Shupe, M. D., and Matrosov, S. Y.: Analysis of Integrated Cloud Liquid and Precipitable Water Vapor Retrievals from Microwave Radiometers during the Surface Heat Budget of the Arctic Ocean Project, J. Geophys. Res.-Atmos., 106, 32019–32030, https://doi.org/10.1029/2000JD000055, 2001. a
Wex, H., Huang, L., Zhang, W., Hung, H., Traversi, R., Becagli, S., Sheesley, R. J., Moffett, C. E., Barrett, T. E., Bossi, R., Skov, H., Hünerbein, A., Lubitz, J., Löffler, M., Linke, O., Hartmann, M., Herenz, P., and Stratmann, F.: Annual variability of ice-nucleating particle concentrations at different Arctic locations, Atmos. Chem. Phys., 19, 5293–5311, https://doi.org/10.5194/acp-19-5293-2019, 2019. a, b, c
Wu, P., Ovchinnikov, M., Xiao, H., Lackner, C. P., Geerts, B., Tornow, F., and Elsaesser, G.: Effect of Ice Number Concentration on the Evolution of Boundary Layer Clouds During Arctic Marine Cold-Air Outbreaks, J. Geophys. Res.-Atmos., 130, e2024JD041282, https://doi.org/10.1029/2024JD041282, 2025. a
Zieger, P., Väisänen, O., Corbin, J. C., Partridge, D. G., Bastelberger, S., Mousavi-Fard, M., Rosati, B., Gysel, M., Krieger, U. K., Leck, C., Nenes, A., Riipinen, I., Virtanen, A., and Salter, M. E.: Revising the Hygroscopicity of Inorganic Sea Salt Particle, Nat. Commun., 8, 15883, https://doi.org/10.1038/ncomms15883, 2017. a