
the Creative Commons Attribution 4.0 License.
the Creative Commons Attribution 4.0 License.
 | 02 Nov 2026
Secondary ice production affects tropical convective clouds under different aerosol conditions

Paul J. Connolly
Paul R. Field
Declan L. Finney
Alan M. Blyth
Secondary ice production (SIP) modulates tropical convection, but its interactions with aerosol loading remain uncertain. Using the UK Met Office Unified Model with detailed SIP parameterizations, this study investigates how multiple SIP mechanisms affect a Hector storm under weak instability and varying cloud condensation nuclei (CCN) concentrations. A reference simulation including all SIP mechanisms at a prescribed droplet number concentration (Nd) of 400 cm−3 is first evaluated against satellite, radar and aircraft observations. At moderate aerosol loading (Nd = 400 cm−3), SIP substantially enhances the ice phase. Ice number increases by over 3 orders of magnitude at temperatures warmer than −10 °C, and ice water content rises by up to ∼ 120 % in the anvil. SIP also reduces outgoing longwave radiation (OLR) by 6.8 W m−2 (−2.5 %), increases outgoing shortwave radiation (OSR) by 7.9 W m−2 (+2 %), over a 110 km × 110 km region in 6 h. For this case, precipitation becomes more organized near the convective core, with total accumulation increasing by ∼ 25 %. Under polluted (Nd = 800 cm−3) and clean (Nd = 200 cm−3) conditions, SIP effects are weaker or spatially fragmented, indicating non-linear aerosol dependence. Sensitivity experiments show that, when combined with rime-splintering (RS), Mode 1 (droplet fragmentation during freezing) weakens at high CCN owing to reduced supercooled raindrop supply in the mixed-phase layer, while Mode 2 (drop–ice collisions with splashing) is inhibited at low CCN due to fewer encounters with large rimed ice particles. In contrast, RS and its combination with ice–ice collisional breakup show relatively limited aerosol sensitivity in this case.
- Article
(10604 KB) - Full-text XML
-
Supplement
(1218 KB) - BibTeX
- EndNote


Tropical deep convection plays a central role in the global climate and hydrological cycle by regulating precipitation, radiation, and energy transport. It also redistributes aerosols and trace gases, shapes the vertical structure of temperature and humidity in the troposphere, and contributes to setting the tropical tropopause through radiative–convective equilibrium (e.g., Houze, 2004; Fueglistaler et al., 2009; Sherwood et al., 2014). The microphysical processes governing the development of these systems remain a major source of uncertainty in weather and climate models (e.g., Bony et al., 2015; Grabowski, 2015; Morrison et al., 2020). In particular, the formation of ice in mixed-phase clouds is not fully explained by primary ice nucleation alone, as observed ice crystal number concentrations (ICNC) often exceed measured ice-nucleating particle (INP) concentrations by several orders of magnitude (e.g., Hobbs and Rangno, 1985; Ladino et al., 2017; Field et al., 2017). This discrepancy points to the importance of secondary ice production (SIP), whereby new ice particles are generated from pre-existing ones.
A range of SIP mechanisms has been identified, including rime-splintering (hereafter RS; Hallett and Mossop, 1974), collisional breakup of ice particles (hereafter BR; Vardiman, 1978; Grzegorczyk et al., 2023), and sublimation-induced fragmentation (Oraltay and Hallett, 1989). Droplet shattering during freezing has also been documented and is commonly classified into Mode 1 and Mode 2 based on the symmetry of freezing (Dye and Hobbs, 1968; Lauber et al., 2018; Phillips et al., 2018; James et al., 2021). Laboratory experiments confirm that these processes can generate large numbers of new ice particles, while SIP signatures have also been reported in both mid-latitude and tropical convection, as reviewed by Field et al. (2017), Korolev and Leisner (2020) and Huang et al. (2022). At the microphysical level, SIP substantially enhances ICNC and ice water content (IWC), and alters the phase distribution between liquid and ice (Phillips et al., 2017a; James et al., 2023; Han et al., 2024).
At the storm scale, modeling and observational studies have shown that SIP can strongly influence cloud radiative and precipitation responses. By increasing anvil extent and optical depth, SIP modifies outgoing longwave radiation (OLR) and shortwave reflection (Young et al., 2019; Hawker et al., 2021a). At the same time, changes in riming and melting pathways modify rainfall intensity and organization. For instance, Han et al. (2024) reported that including SIP in central European convection increased ICNC by more than twentyfold and reduced surface precipitation by up to 20 %. Grzegorczyk et al. (2025a) found that enabling SIP in a heavy-precipitation case improved agreement with in-situ ice measurements while reducing heavy rain occurrence. Dedekind et al. (2021) showed that in mid-latitude winter convection, SIP enhanced ICNC and surface precipitation, with impacts highly sensitive to the chosen parameterizations. In tropical convection, SIP has been associated with the maintenance of extensive anvils and changes in precipitation efficiency (Hawker et al., 2021b; Qu et al., 2022; Waman et al., 2022), while in stratiform and Arctic mixed-phase clouds it helps explain persistent ICNC well above INP limits (Sotiropoulou et al., 2020; Zhao et al., 2021). Despite these advances, substantial uncertainties remain. Different SIP mechanisms dominate in different temperature ranges, their relative importance varies across environments, and parameterizations diverge among models (Field et al., 2017; Sullivan et al., 2018; Korolev and Leisner, 2020).
Beyond SIP itself, changes in CCN concentration are expected to modulate its efficiency by reshaping hydrometeor properties in the mixed-phase region. Under lower CCN, collision–coalescence tends to occur earlier, accelerating warm-rain processes. This can increase the abundance of raindrops that participate in riming, but it also depletes the supercooled liquid aloft that sustains SIP (Rosenfeld and Woodley, 2000; Khain et al., 2005). With increasing cloud condensation nuclei (CCN), more numerous, smaller droplets delay autoconversion and loft more liquid above the freezing level, maintaining supercooled water and modifying droplet shattering and collisional breakup between ice particles (Rosenfeld et al., 2008; Qu et al., 2020). Which SIP route dominates therefore depends on temperature, the intensity of riming, and the availability of precipitation hydrometeors suitable for riming, implying a non-linear dependence of SIP efficiency on aerosol loading (Fan et al., 2016; Grabowski and Morrison, 2020; Varble et al., 2023). Qu et al. (2020) showed that aerosol-controlled droplet spectra modulate SIP and the partition between liquid and ice, influencing storm evolution. Previous studies have also linked CCN impacts to changes in SIP and subsequent storm electrification (Phillips and Patade, 2022; Huang et al., 2025). However, most existing studies examine aerosol effects and SIP sensitivities separately. Systematic evaluations of aerosol–SIP interactions across CCN regimes, particularly in tropical convection, remain limited (e.g., Field et al., 2017; Korolev and Leisner, 2020).
This study addresses this gap by investigating how SIP interacts with CCN to influence cloud–precipitation–radiation processes in tropical convection. We focus on a weak-CAPE Darwin storm on 6 February 2006 and conduct sensitivity experiments with the Unified Model and CASIM microphysics across clean, moderate, and polluted CCN levels. We first evaluate a reference simulation of the complete model, including all SIP mechanisms, against the available observations, and then use matched sensitivity experiments to diagnose the effects of SIP and CCN relative to this reference state. In addition, we examine the CCN sensitivity of RS and RS-based configurations with additional SIP mechanisms (Mode 1, Mode 2, and BR), to clarify their relative contributions. Through this analysis, we aim to provide new insights into how SIP and aerosols jointly modulate tropical convection and storm evolution, and to emphasize the importance of representing SIP processes accurately in weather and climate models.
2.1 Model description
The Met Office Unified Model (UM) vn13.0 with the Cloud AeroSol Interacting Microphysics Module (CASIM; Field et al., 2023) is used in this study. Simulations are conducted using the Regional Atmosphere and Land (RAL) 3.2 configuration (Bush et al., 2023). The UM employs the ENDGame non-hydrostatic dynamical core with a semi-Lagrangian formulation (Wood et al., 2014). Subgrid cloud fraction is diagnosed using the bimodal cloud fraction scheme of Van Weverberg et al. (2021) for coupling to radiation in the RAL3.2 configuration, and no convection parameterization is active. Subgrid mixing in the boundary layer is represented by the Lock et al. (2000) scheme. Further details are provided in Bush et al. (2025).
Cloud microphysics are represented using the CASIM scheme, configured in two-moment mode to prognostically predict both mass and number concentrations for five hydrometeor species: cloud droplets, raindrops, ice crystals, graupel, and snow. Particle size distributions follow a generalized gamma distribution. In CASIM, the cloud droplet number concentration (Nd) can be either prescribed as a fixed value or diagnosed from background aerosol. To systematically examine aerosol sensitivity and isolate the effects of prescribed droplet-number conditions, we adopt the fixed Nd approach in this study. As in RAL3.2, a vertical taper is imposed on the fixed Nd to avoid unrealistically high droplet concentrations at upper levels and the associated excessive homogeneous freezing (Bush et al., 2025).
Rain is generated through auto-conversion, accretion, and melting of ice-phase particles, while losses include evaporation and freezing by ice. The separate treatment of mass and number concentrations allows for variability in hydrometeor size and fall speed, which directly affects sedimentation and evaporation. In contrast to single-moment schemes where particle size is fixed for a given mass, CASIM allows dynamic adjustment of size distributions based on aerosol and microphysical evolution.
Heterogeneous ice nucleation is parameterized using the default scheme of Cooper (1986), which prescribes ice crystal number concentrations as a function of temperature. Immersion freezing of raindrops is parameterized following Bigg (1953), with freezing probability depending on drop volume and temperature. When freezing occurs, rain mass and number are converted to graupel, providing a bulk representation of raindrop freezing in CASIM (Field et al., 2023; Miltenberger et al., 2020). In addition, rain–ice interactions are represented through accretion/collection processes in CASIM, and rain collecting ice can contribute to snow or graupel formation depending on the hydrometeor state and model configuration. Homogeneous freezing of cloud droplets is parameterized to occur below −38 °C (Field et al., 2023). In this study, aerosol perturbations are represented by prescribed Nd. INP concentrations are not varied and are not linked to Nd; therefore coupled CCN–INP effects are not represented. In CASIM, aggregation and accretion among ice-phase hydrometeors are represented through parameterizations for self-collection and inter-species collection processes involving ice, snow, and graupel. The associated collection efficiencies are prescribed in the model and are temperature-dependent.
In addition to primary ice nucleation, this study incorporates multiple secondary ice production (SIP) mechanisms. The default SIP process in CASIM is rime-splintering (RS), which produces ice splinters through the riming of supercooled droplets by graupel and snow between −2.5 and −7.5 °C, with peak efficiency at −5 °C (Hallett and Mossop, 1974; Mossop, 1985). The production rate is based on the cloud liquid accreted by graupel and snow, using a default efficiency of 350 ice splinters per milligram of rimed liquid. In our previous study (Sun et al., 2025), we implemented three additional SIP mechanisms into CASIM: ice-ice collisional breakup (BR), and droplet shattering during symmetrical and asymmetrical freezing (Mode 1 and Mode 2). The BR parameterization follows the theoretical formulation of Phillips et al. (2017b), and accounts for collisions between ice-phase particles (graupel, snow, and ice crystals). The production rate depends on collision kinetic energy, rimed fraction, temperature, and particle size. For droplet shattering, we adopt the two-mode parameterization from Phillips et al. (2018). Mode 1 (M1) describes the collisions between frozen drops and smaller ice particles, with splinter numbers fitted to laboratory data using Lorentzian curves, peaking around −15 °C. Mode 2 (M2) involves collisions between freezing raindrops and more massive ice particles, where fragmentation is governed by the ratio of collision kinetic to surface energy. An empirical factor of 0.3, representing the ice-containing fraction of fragments, is applied following James et al. (2021).
Radiative transfer is handled by the SOCRATES scheme (Edwards and Slingo, 1996; Manners et al., 2024), which employs the two-stream approximation for fluxes and spherical harmonics for radiance. The single-scattering properties of ice crystals are derived from both the ice water content and the number concentration of ice-phase hydrometeors predicted by CASIM. This allows changes in ice particle characteristics associated with different SIP mechanisms to influence the simulated cloud optical properties. Turbulence is represented by the blended boundary layer scheme (Boutle et al., 2014), which incorporates both local and non-local mixing processes.
2.2 Model set-up and design of the simulations
Simulations were conducted for the 6 February 2006 case from the Aerosol and Chemical Transport in tropIcal convection (ACTIVE) campaign (Vaughan et al., 2008; Connolly et al., 2013). The ACTIVE campaign was carried out in the Darwin region of northern Australia and aimed to investigate aerosol-cloud interactions in tropical convection. This case, which occurred during the break period of the monsoon season, featured a relatively weaker convective storm over the Tiwi Islands (Fig. 1a). In contrast to the vigorous pre-monsoon convection, the environment was characterized by a dry mid-troposphere and limited convective instability, with a convective available potential energy (CAPE) of approximately 1010 J kg−1 (Fig. 1b). The sounding also suggests a warm cloud base and a relatively deep warm-cloud layer, which likely favor warm-rain formation during the early stage of storm development.
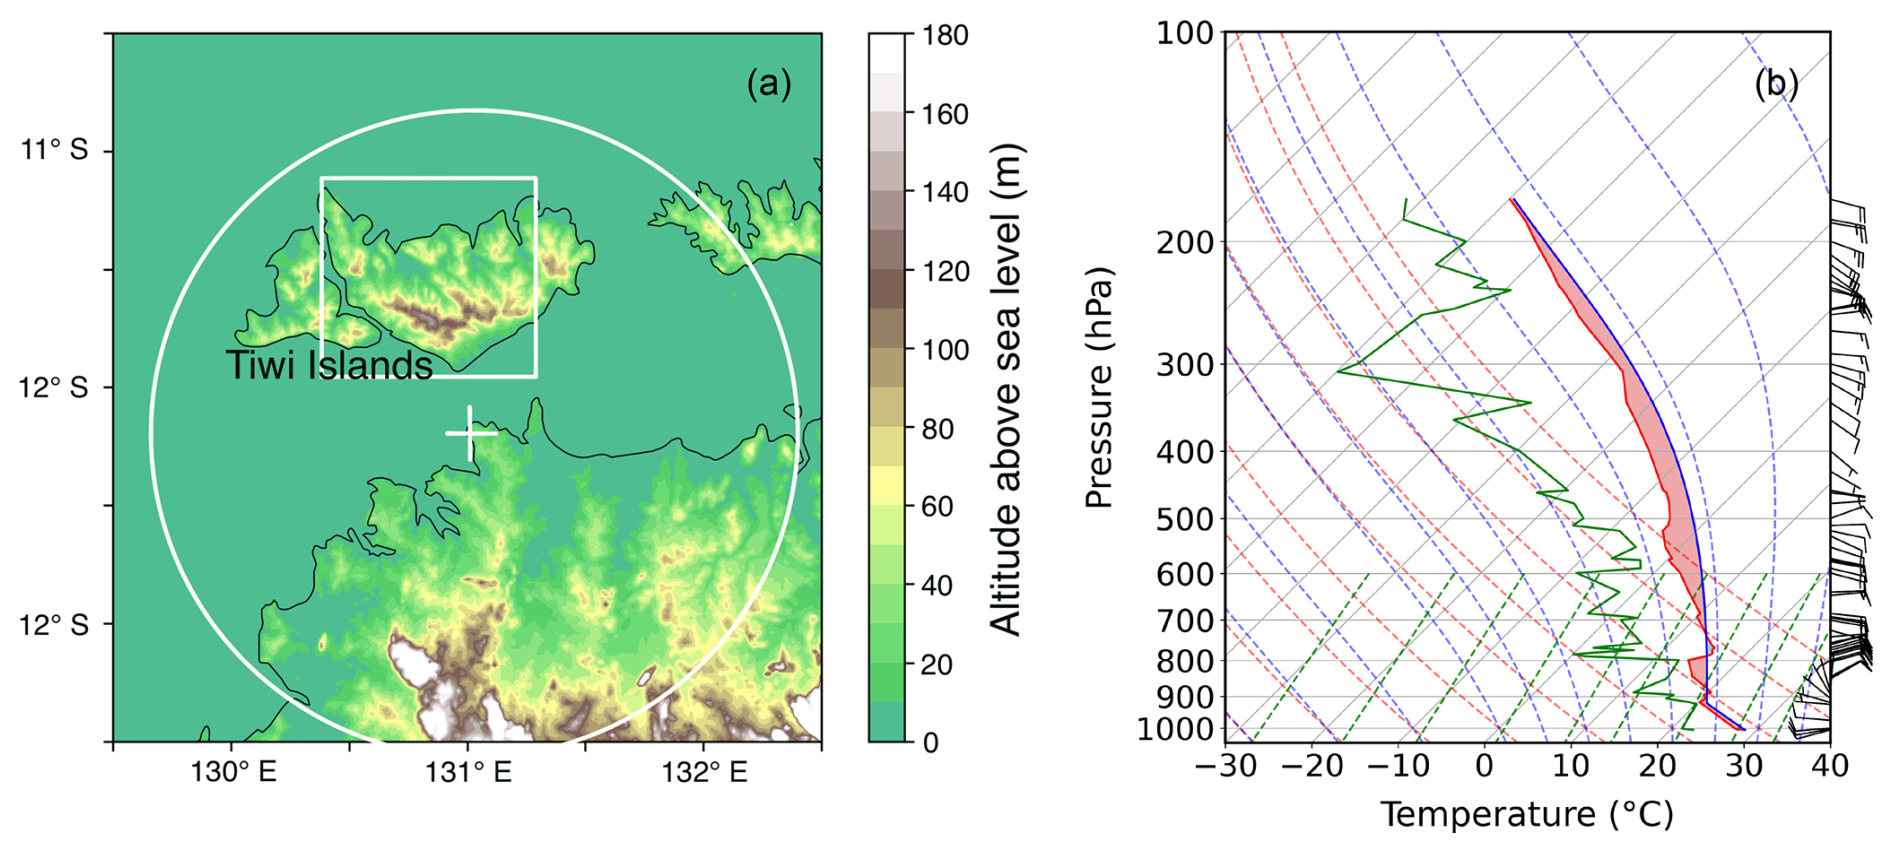
Figure 1(a) Overview of model orography (terrain height, unit: m) and spatial domains used for radar and satellite data analysis (adapted from Sun et al., 2025). The full simulation domain is a 1350 km × 1350 km square centered at (12.4° S, 130.8° E). The subdomain used for radar evaluation and model diagnostics is indicated by the white box. The effective range of the CPOL radar, centered at (12.25° S, 131.05° E), is shown as the overlaid circle. (b) Atmospheric profiles from Darwin Airport station (12.42° S, 130.89° E) at 00:00 UTC on 6 February 2006. The green and red solid lines represent dew point and temperature, and the blue line represents the parcel lapse rate.
The cloud-resolving simulations are conducted at a horizontal resolution of 1.5 km, using a domain of 900 × 900 grid points centered over the Darwin region (12.4° S, 130.8° E). The vertical grid contains 90 levels, extending up to 40 km, with finer resolution in the lower atmosphere (52 levels below 10 km, 33 below 4 km, and 16 below 1 km). Each simulation starts at 18:00 UTC on 5 February 2006 and runs for 36 h. Boundary and initial conditions are prescribed from the ECMWF Reanalysis version 5 (ERA5) reanalysis data, updated every 6 h. A spin-up period of 6 h is applied, with a model time step of 75 s. In this configuration, the semi-Lagrangian dynamical core permits relatively large time steps. To avoid hydrometeors crossing multiple vertical levels within a single time step, sedimentation is treated using an approach based on Rotstayn (1997), as implemented in the UM (Wilson and Ballard, 1999; Field et al., 2023). To better represent surface features, we incorporate the Shuttle Radar Topography Mission (SRTM; NASA, 2013) dataset as ancillary input. For analysis, we focus on a 1° × 1° subdomain over the Tiwi Islands (indicated by the white box in Fig. 1a), selected to minimize potential boundary effects.
Table 1Model experiment overview.
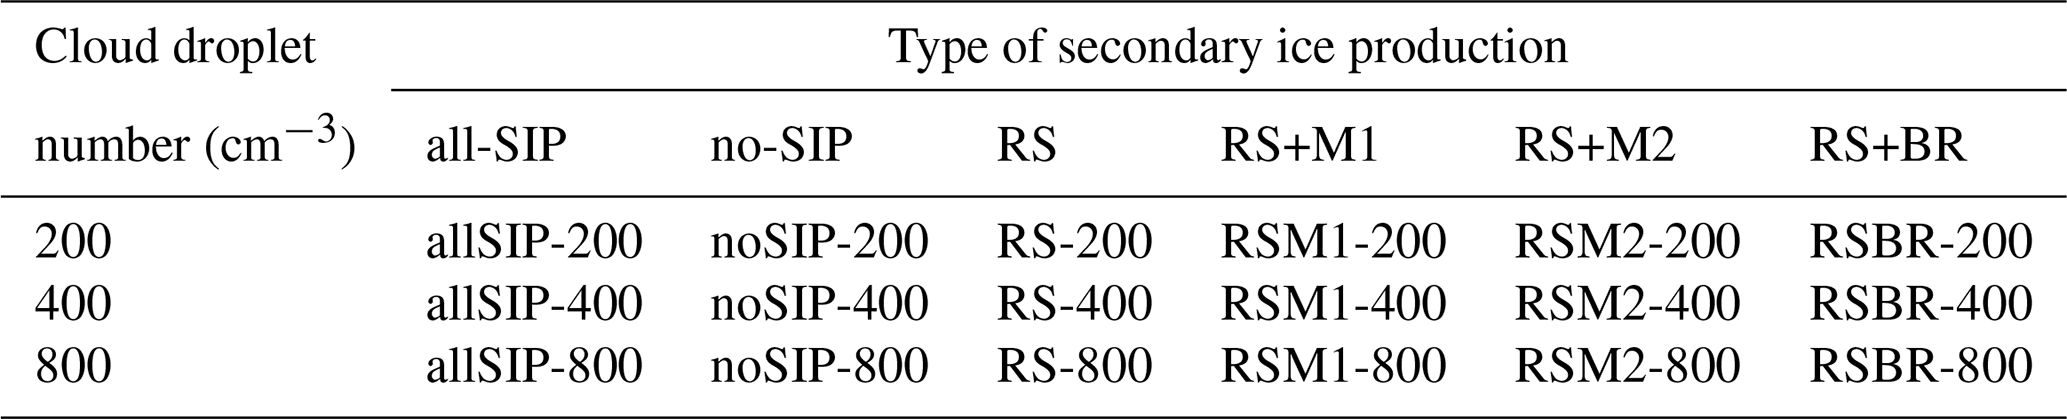
Note: RS refers to rime-splintering (Hallett and Mossop, 1974); M1 and M2 indicate two droplet shattering modes (Phillips et al., 2018); BR denotes ice-ice collisional breakup (Phillips et al., 2017b).
To investigate the sensitivity of mixed-phase convection to secondary ice production (SIP) mechanisms and aerosol conditions, a series of simulations was conducted by combining three prescribed in-cloud droplet number concentrations (Nd) with different SIP configurations (Table 1). A fixed Nd approach was employed to provide controlled droplet-number conditions and to allow the microphysical, radiative, and precipitation responses to SIP to be compared consistently across three different aerosol environments. The rates of the different SIP pathways are linked to Nd through the prescribed droplet field and its influence on warm-rain production, providing the basis for assessing SIP impacts across the three prescribed Nd conditions. Nd was specified at 200, 400, and 800 cm−3, corresponding to low, intermediate, and high droplet-number conditions (hereafter referred to as “clean”, “moderate”, and “polluted”, respectively). These values span the range reported during ACTIVE, where cloud droplet number concentrations of approximately 150, 500, and 900 cm−3 were associated with the monsoon-break, pre-monsoon, and burning-period environments, respectively (Connolly et al., 2013). The three prescribed values therefore provide a consistent framework for examining how the SIP response varies across plausible aerosol conditions.
For each Nd value, six SIP scenarios were tested: all SIP mechanisms active (allSIP), no SIP process enabled (noSIP), rime-splintering only (RS), and three combined schemes involving RS with one additional mechanism: RS with Mode 1 (RS+M1), RS with Mode 2 (RS+M2), and RS with ice–ice collisional breakup (RS+BR). For each prescribed Nd, the noSIP simulation at the same Nd provides the matched comparison for the corresponding SIP experiments, so that SIP effects are diagnosed with Nd held fixed. The matched comparison between allSIP and noSIP is used to quantify the combined effect of SIP, while the RS, RS+M1, RS+M2, and RS+BR simulations are used to examine the contributions and aerosol dependence of individual mechanisms. RS was retained as the baseline SIP configuration because it is the default SIP process in CASIM. This design enables a systematic assessment of how aerosol conditions influence the impacts of SIP on cloud microphysics, radiation, and precipitation. Of these simulations, allSIP-400 is used as the reference simulation, that is, the complete model configuration, with all SIP mechanisms active, that provides the most observationally defensible representation of the observed storm. Its prescribed Nd is selected by comparing the three complete-model configurations (allSIP-200, allSIP-400 and allSIP-800) with the satellite, radar and aircraft observations (Sect. 3.1). Although the ACTIVE monsoon-break value (∼ 150 cm−3; Connolly et al., 2013) lies closer to the clean configuration, allSIP-400 agrees more closely with the observations than allSIP-200, and the uncertainty in Nd is represented by the 200 and 800 cm−3 experiments. The remaining simulations are treated as perturbations of the SIP treatment and of Nd (Sect. 3.2–3.4).
2.3 Observational data
The modeled reflectivity fields were evaluated against observations from the C-band polarimetric radar (CPOL), located at Gunn Point (12.25° S, 131.05° E). The CPOL radar provides volumetric scans every 10 min, with a vertical resolution of 0.5 km and horizontal resolution of 2.5 km. In the model, radar reflectivity was diagnosed from the simulated hydrometeor particle size distributions using a forward operator based on a simple Rayleigh scattering assumption, consistent with Field et al. (2023). To facilitate comparison with the model, we used the Statistical Coverage Product (May et al., 2008), which represents the time–height distribution of the fraction of a defined domain exceeding 10 dBZ, a threshold chosen to capture the spatial and temporal characteristics of convective precipitation. The same 10 dBZ threshold was applied to the simulated reflectivity fields for comparison. The analysis domain is indicated in Fig. 1a.
Simulated rainfall accumulations were also compared against CPOL radar–derived precipitation datasets, available at 10 min intervals and 1 km horizontal resolution. Although residual uncertainty may arise from reflectivity calibration and C-band attenuation, CPOL quantitative precipitation estimates generally provide a reliable representation of tropical rainfall (Louf et al., 2019; Jackson et al., 2021). Aircraft observations from the ACTIVE campaign were also considered, with the NERC Dornier sampling the lower troposphere up to approximately 4 km and the Egrett sampling the upper-level anvil outflow at approximately 12–14 km (Vaughan et al., 2008). Available in situ measurements of IWC and ice particle number concentration were confined to upper-level clouds and did not directly sample the mixed-phase region where SIP is expected to be most active. These upper-level observations are compared with the reference simulation in Fig. 4. Radiosonde profiles from Darwin Airport station (12.42° S, 130.89° E) were used to characterize the thermodynamic environment. Additionally, top-of-atmosphere radiation was evaluated using equivalent outgoing longwave radiation (OLR) calculated from Multifunctional Transport Satellite (MTSAT) brightness temperature, with spatial and temporal resolutions of 1.25 km and 30 min, respectively. The observed and simulated OLR are compared in Fig. 2.
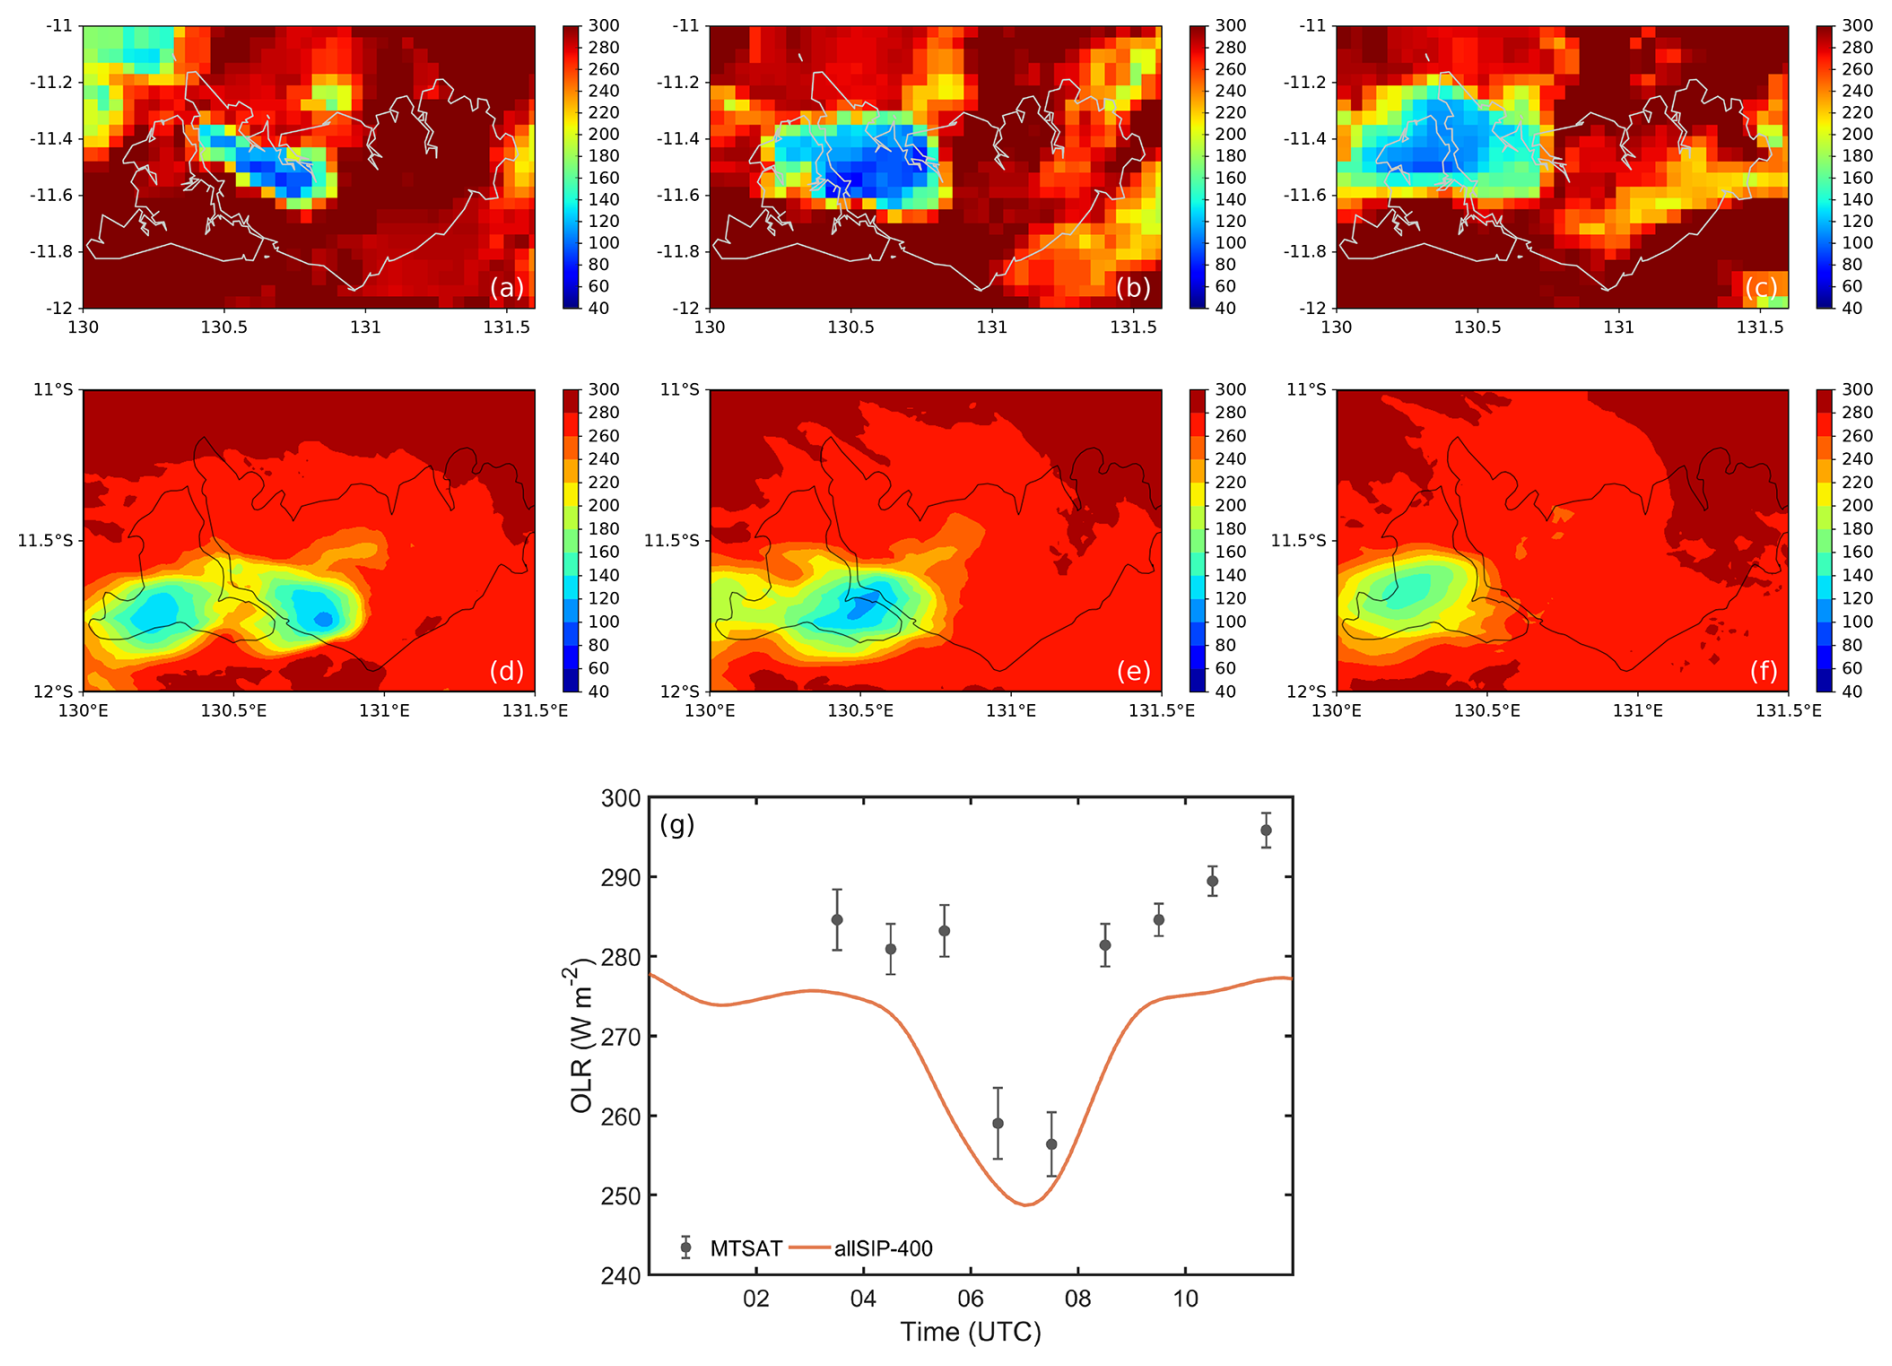
Figure 2Evaluation of the reference simulation (allSIP-400) against MTSAT-derived equivalent outgoing longwave radiation (OLR; W m−2). (a–c) Observed OLR at 07:30, 08:30 and 09:30 UTC on 6 February 2006. (d–f) Simulated OLR from allSIP-400 at 06:30, 07:30 and 08:30 UTC; simulation times are shifted by −1 h to match the earlier convective development in the model. (g) Domain-averaged OLR from allSIP-400 (red line) and MTSAT (grey markers; error bars show ±1 standard error).
Section 3.1 first evaluates the reference simulation (allSIP-400) against the available observations. Section 3.2–3.4 then analyse the sensitivity experiments, in which SIP effects are diagnosed from matched SIP–noSIP differences at fixed Nd, and the dependence on Nd is assessed across the three prescribed values. Observations are not used in these sensitivity sections.
3.1 Evaluation of the reference simulation
On 6 February 2006, the Hector storm developed over the Tiwi Islands during the break period of the monsoon season. MTSAT imagery (Fig. 2a–c) shows shallow cumulus initiating along the sea-breeze front (Connolly et al., 2013), developing rapidly between 07:30 and 08:30 UTC, and reaching maturity by 09:30 UTC. The coldest cloud tops, with OLR below 150 W m−2, were concentrated over the central island, with an expanding westward anvil. With the simulation time shifted by −1 h to account for the earlier development of the simulated storm, allSIP-400 reproduces the location of the storm and its westward anvil expansion (Fig. 2d–f), although its minimum OLR remains higher than observed. In the domain mean (Fig. 2g), allSIP-400 captures the observed decrease and recovery of OLR. Its mature-stage minimum is lower than observed by ∼ 7 W m−2, and OLR is underestimated before and after the mature stage by up to ∼ 15 W m−2.
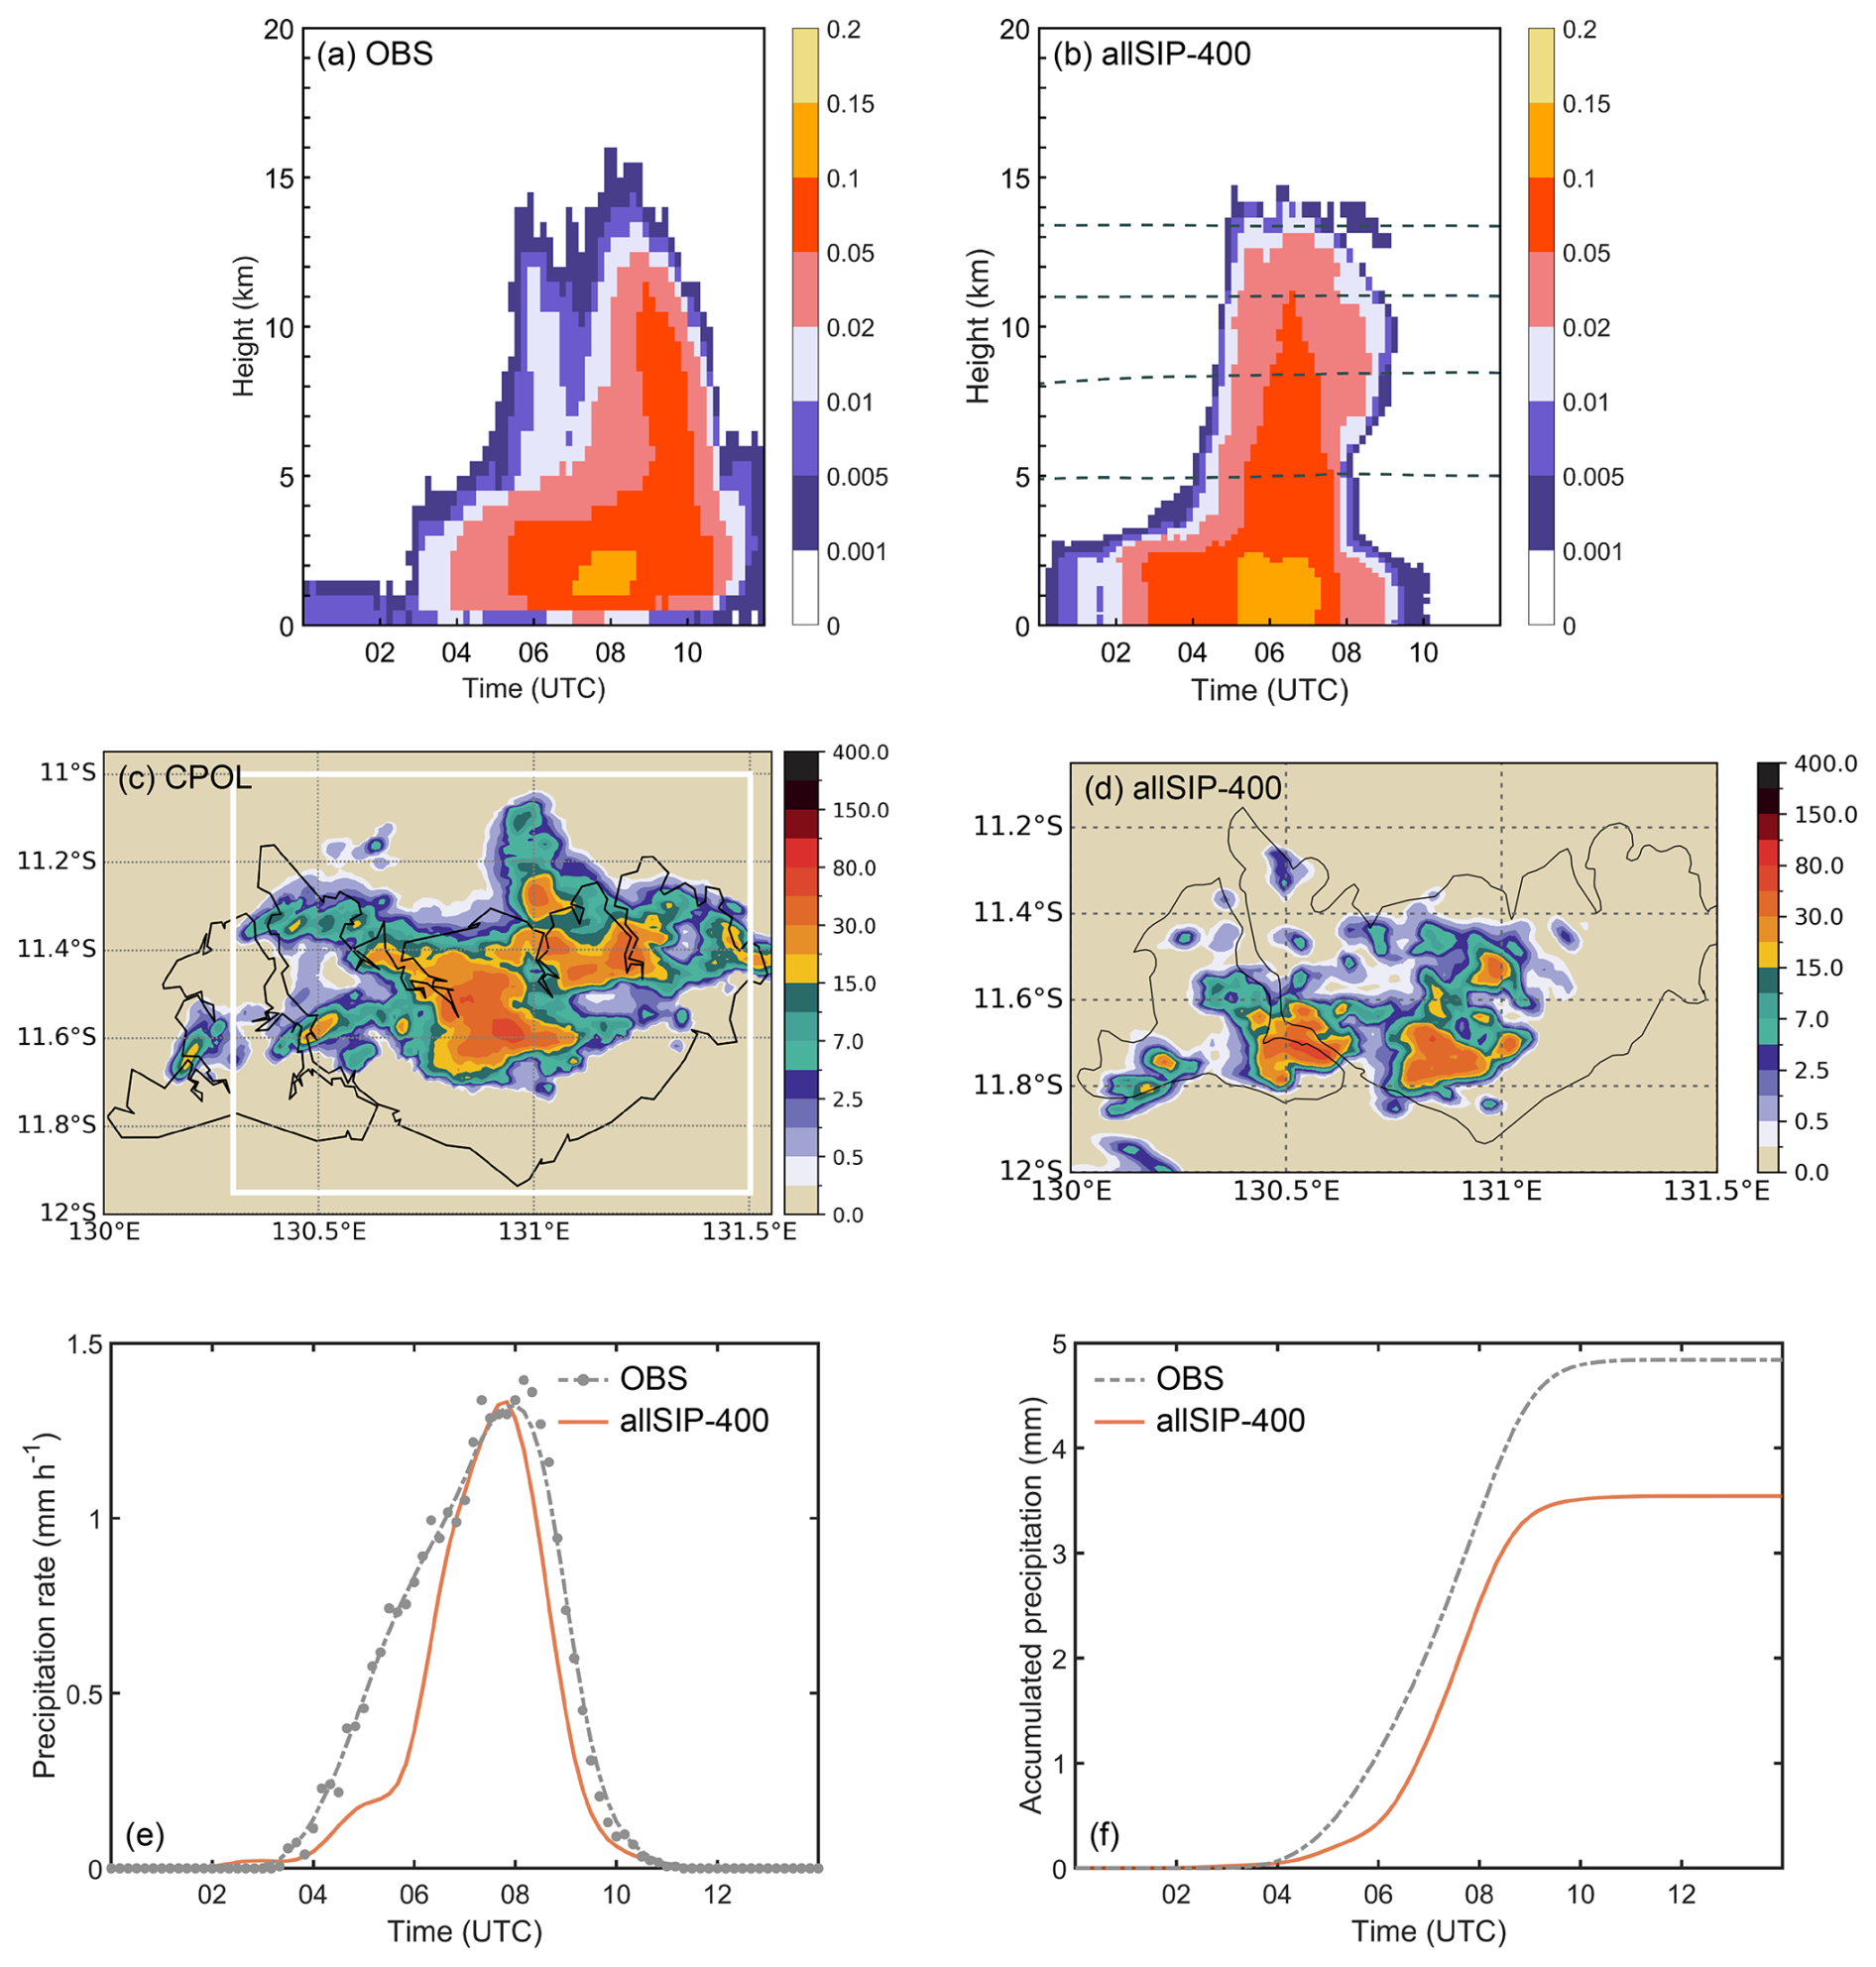
Figure 3Evaluation of the reference simulation (allSIP-400) against CPOL radar observations. Time–height CFADs of reflectivity greater than 10 dBZ from (a) CPOL and (b) allSIP-400. Accumulated precipitation (mm) during 04:00–10:00 UTC on 6 February 2006 from (c) CPOL and (d) allSIP-400. Domain-averaged (e) precipitation rate (mm h−1) and (f) accumulated precipitation (mm) from CPOL (grey) and allSIP-400 (red); the grey dashed line in panel (e) is a fitted curve to the observations. Simulation times are shifted by −1 h. The 0, −20, −40 and −60 °C isotherms are shown as dashed lines in panel (b).
The CPOL reflectivity CFAD (Fig. 3a) shows echoes exceeding 10 dBZ extending to about 15 km during the mature stage. allSIP-400 reproduces this vertical extent, with frequent echoes above 10 km (Fig. 3b). The simulated rainband structure and heavy rainfall cores (> 100 mm) are broadly consistent with the CPOL accumulation (Fig. 3c, d). The peak domain-mean precipitation rate in allSIP-400 (∼ 1.35 mm h−1) is close in timing and magnitude to the observed peak (Fig. 3e). Accumulated precipitation is underestimated, at ∼ 3.54 mm compared with ∼ 4.8 mm observed (Fig. 3f).
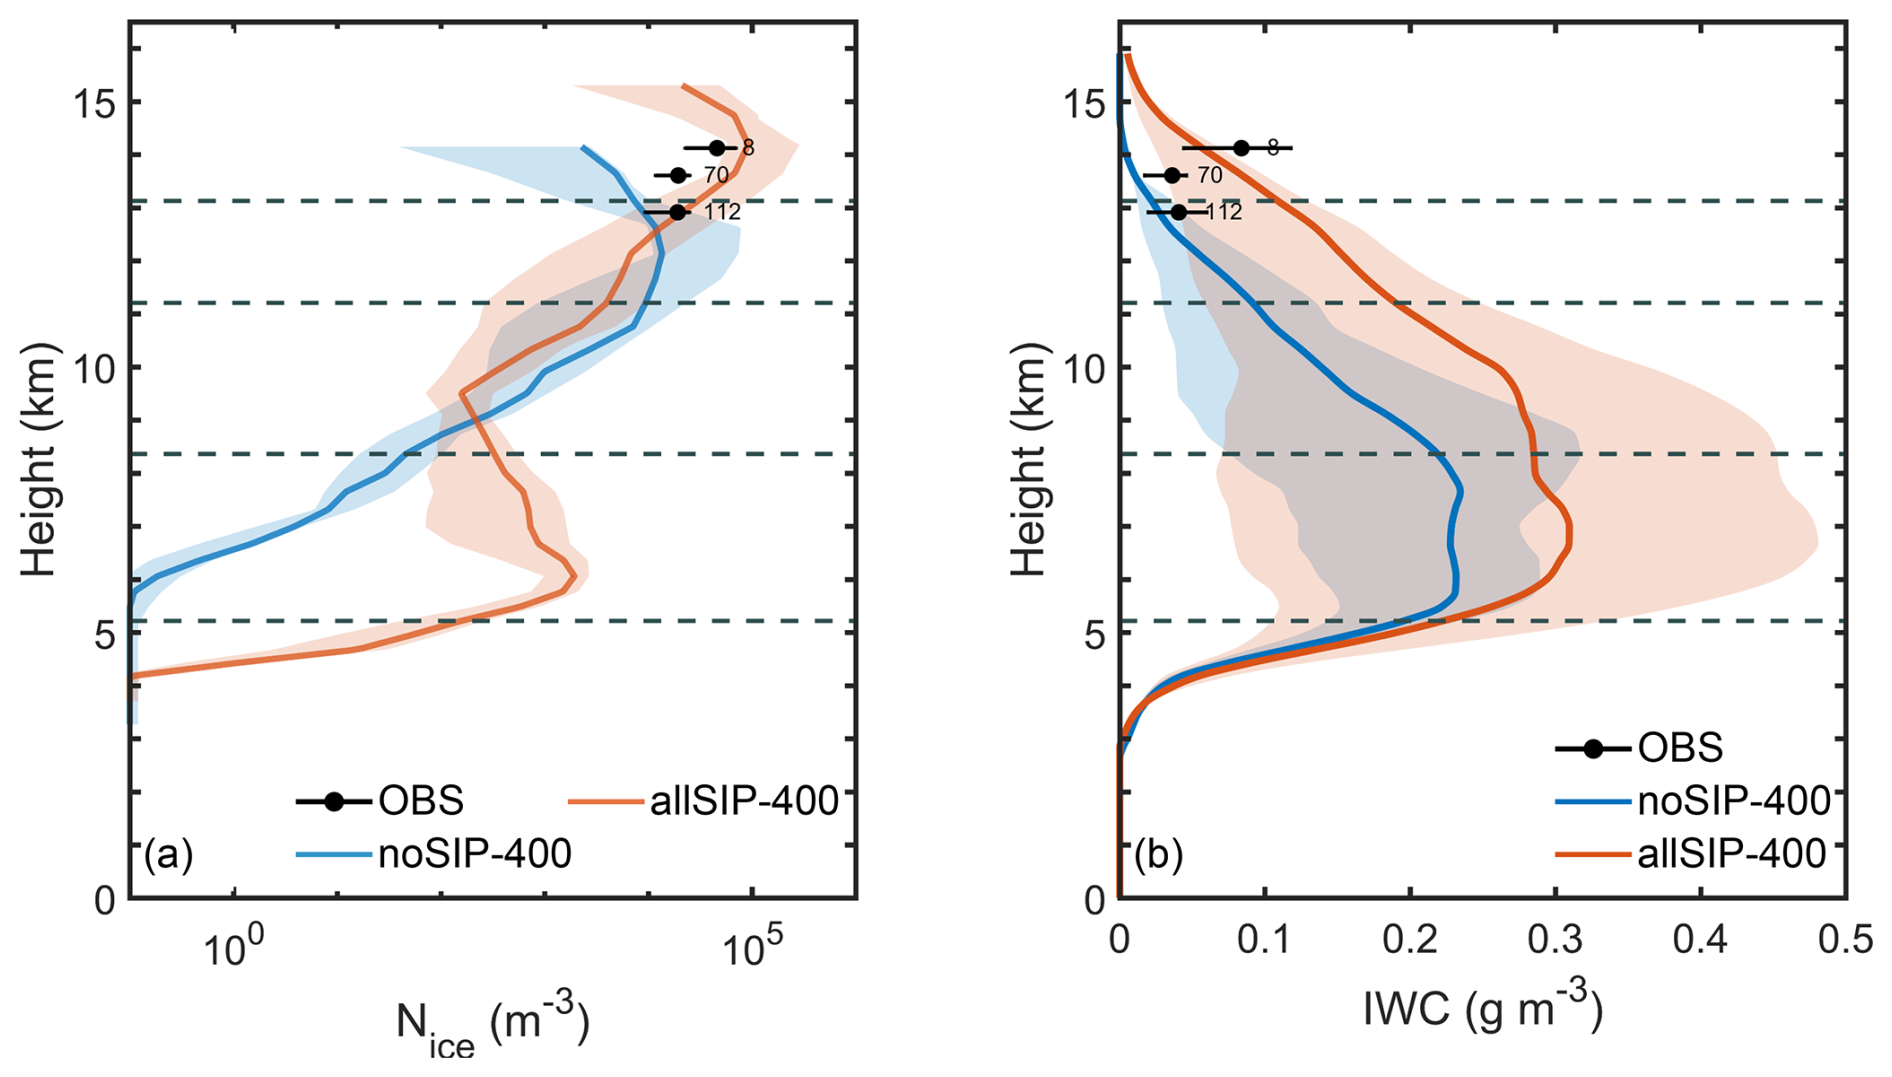
Figure 4Vertical profiles of (a) ice number concentration (Nice) and (b) ice water content (IWC) from the reference simulation (allSIP-400; red) and the corresponding simulation without SIP (noSIP-400; blue), compared with Egrett in situ observations. Shading shows the model interquartile range. Both are calculated over regions where IWC > 0.01 g m−3 during 02:30–08:30 UTC on 6 February 2006. Observations are grouped into 0.5 km height bins: black dots show bin means, horizontal bars the first and third quartiles, and numbers the sample count in each bin. Grey dashed lines indicate the 0, −20, −40 and −60 °C isotherms. The aircraft sampled only the upper-level anvil and not the mixed-phase region.
Egrett observations sampled the anvil outflow at about 12–14 km. Within this layer, the ice particle number concentration and IWC of allSIP-400 are broadly consistent with the observations (Fig. 4; noSIP-400 is also shown, to indicate how far the SIP response extends into the sampled layer). These observations do not sample the mixed-phase region between about 5 and 9 km, where SIP is most active. However, the upper-level ice population reflects the cumulative history of the convective ascent, including the supercooled liquid lofted to homogeneous-freezing levels, which is itself influenced by SIP lower in the cloud (Phillips and Patade, 2022). The other two complete-model configurations agree less well with these observations, which is the basis for choosing allSIP-400 as the reference. allSIP-200 produces a higher minimum OLR (∼ 165 W m−2), a lower peak precipitation rate (∼ 0.95 mm h−1) and a smaller accumulation (∼ 3.25 mm). allSIP-800 produces a lower peak precipitation rate (∼ 0.94 mm h−1), a smaller accumulation (∼ 3.11 mm), and a more fragmented anvil and rainfall pattern than observed.
Overall, the reference simulation reproduces the main observed features of the storm: the timing and location of convection, the depth of the radar echoes, the organisation and peak intensity of rainfall, and the upper-level ice properties. The main remaining differences are the OLR minimum, the OLR before and after the mature stage, the accumulated rainfall, and the absence of in situ observations in the mixed-phase layer. These differences provide the context for interpreting the sensitivity experiments that follow.
3.2 SIP impacts on radiation under varying CCN conditions
Figure 5 shows simulated OLR from the allSIP simulations at the three prescribed Nd values (allSIP-200, allSIP-400 and allSIP-800), with the corresponding noSIP fields in Fig. S1 in the Supplement. The underlying microphysical mechanisms are discussed in Sect. 3.4.1.
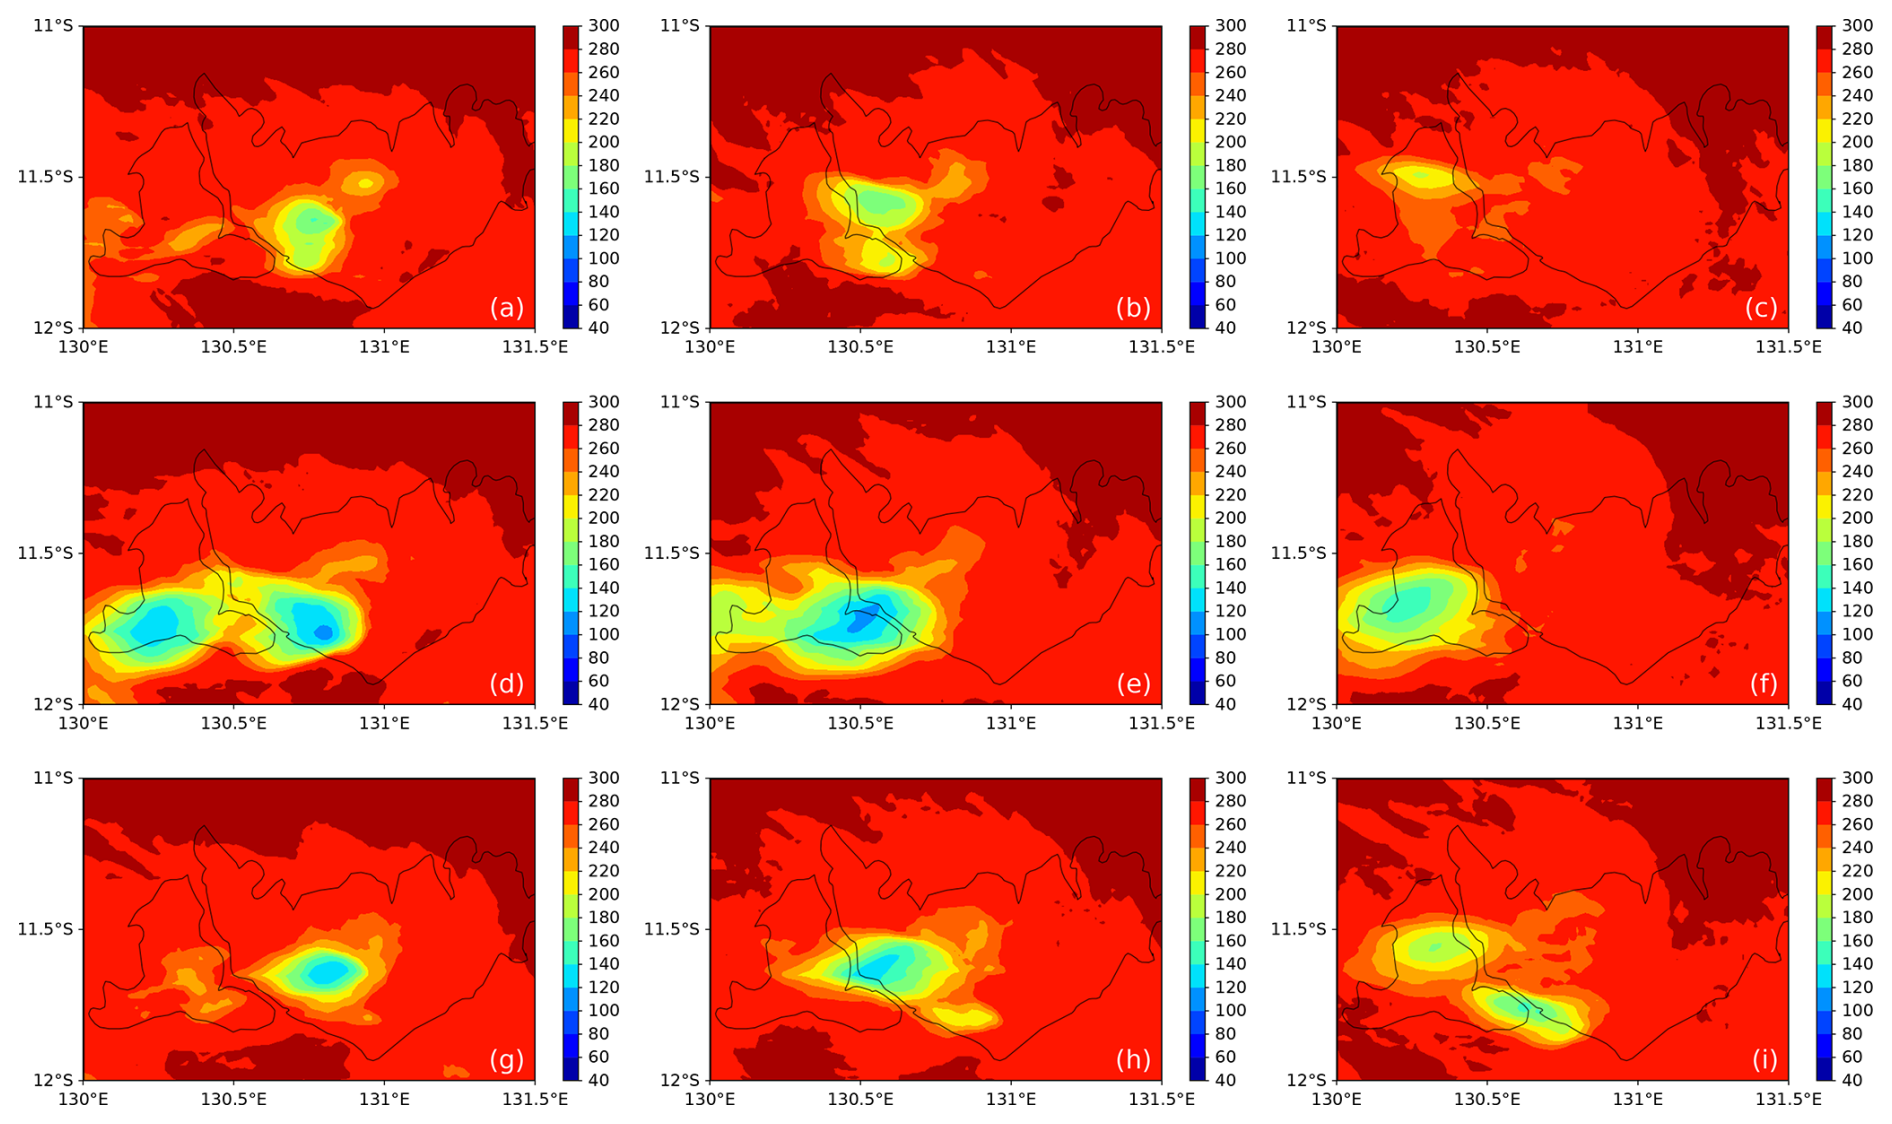
Figure 5Spatial distribution of simulated outgoing longwave radiation (OLR; W m−2) from allSIP simulations for (a–c) Nd = 200 cm−3, (d–f) Nd = 400 cm−3 and (g–i) Nd = 800 cm−3 at 06:30, 07:30 and 08:30 UTC, respectively. Nd denotes the prescribed in-cloud droplet number concentration. Simulation times are shifted by −1 h to match the earlier convection development in the model. Equivalent plots for simulated noSIP cases are provided in Fig. S1 in the Supplement.
The impacts of SIP on radiation were first examined by comparing the spatial distribution of OLR between each allSIP simulation and its corresponding noSIP case at 07:30 UTC (Fig. S1). For Nd = 200 cm−3, allSIP-200 shows a weaker OLR reduction relative to noSIP-200 (Figs. 5b, S1b), with a minimum OLR of ∼ 165 W m−2 and a smaller increase in the low-OLR coverage (∼ 10 %–15 %). For Nd = 400 cm−3, allSIP-400 produces a minimum OLR of ∼ 150 W m−2 (Fig. 5e), about 25 W m−2 lower than noSIP-400 (∼ 175 W m−2), and expands the area with OLR < 200 W m−2 by around 25 %–30 % (Fig. S1e). At Nd = 800 cm−3, allSIP-800 still exhibits reduced OLR relative to noSIP-800, but the low-OLR region becomes more fragmented (Figs. 5h, S1h).
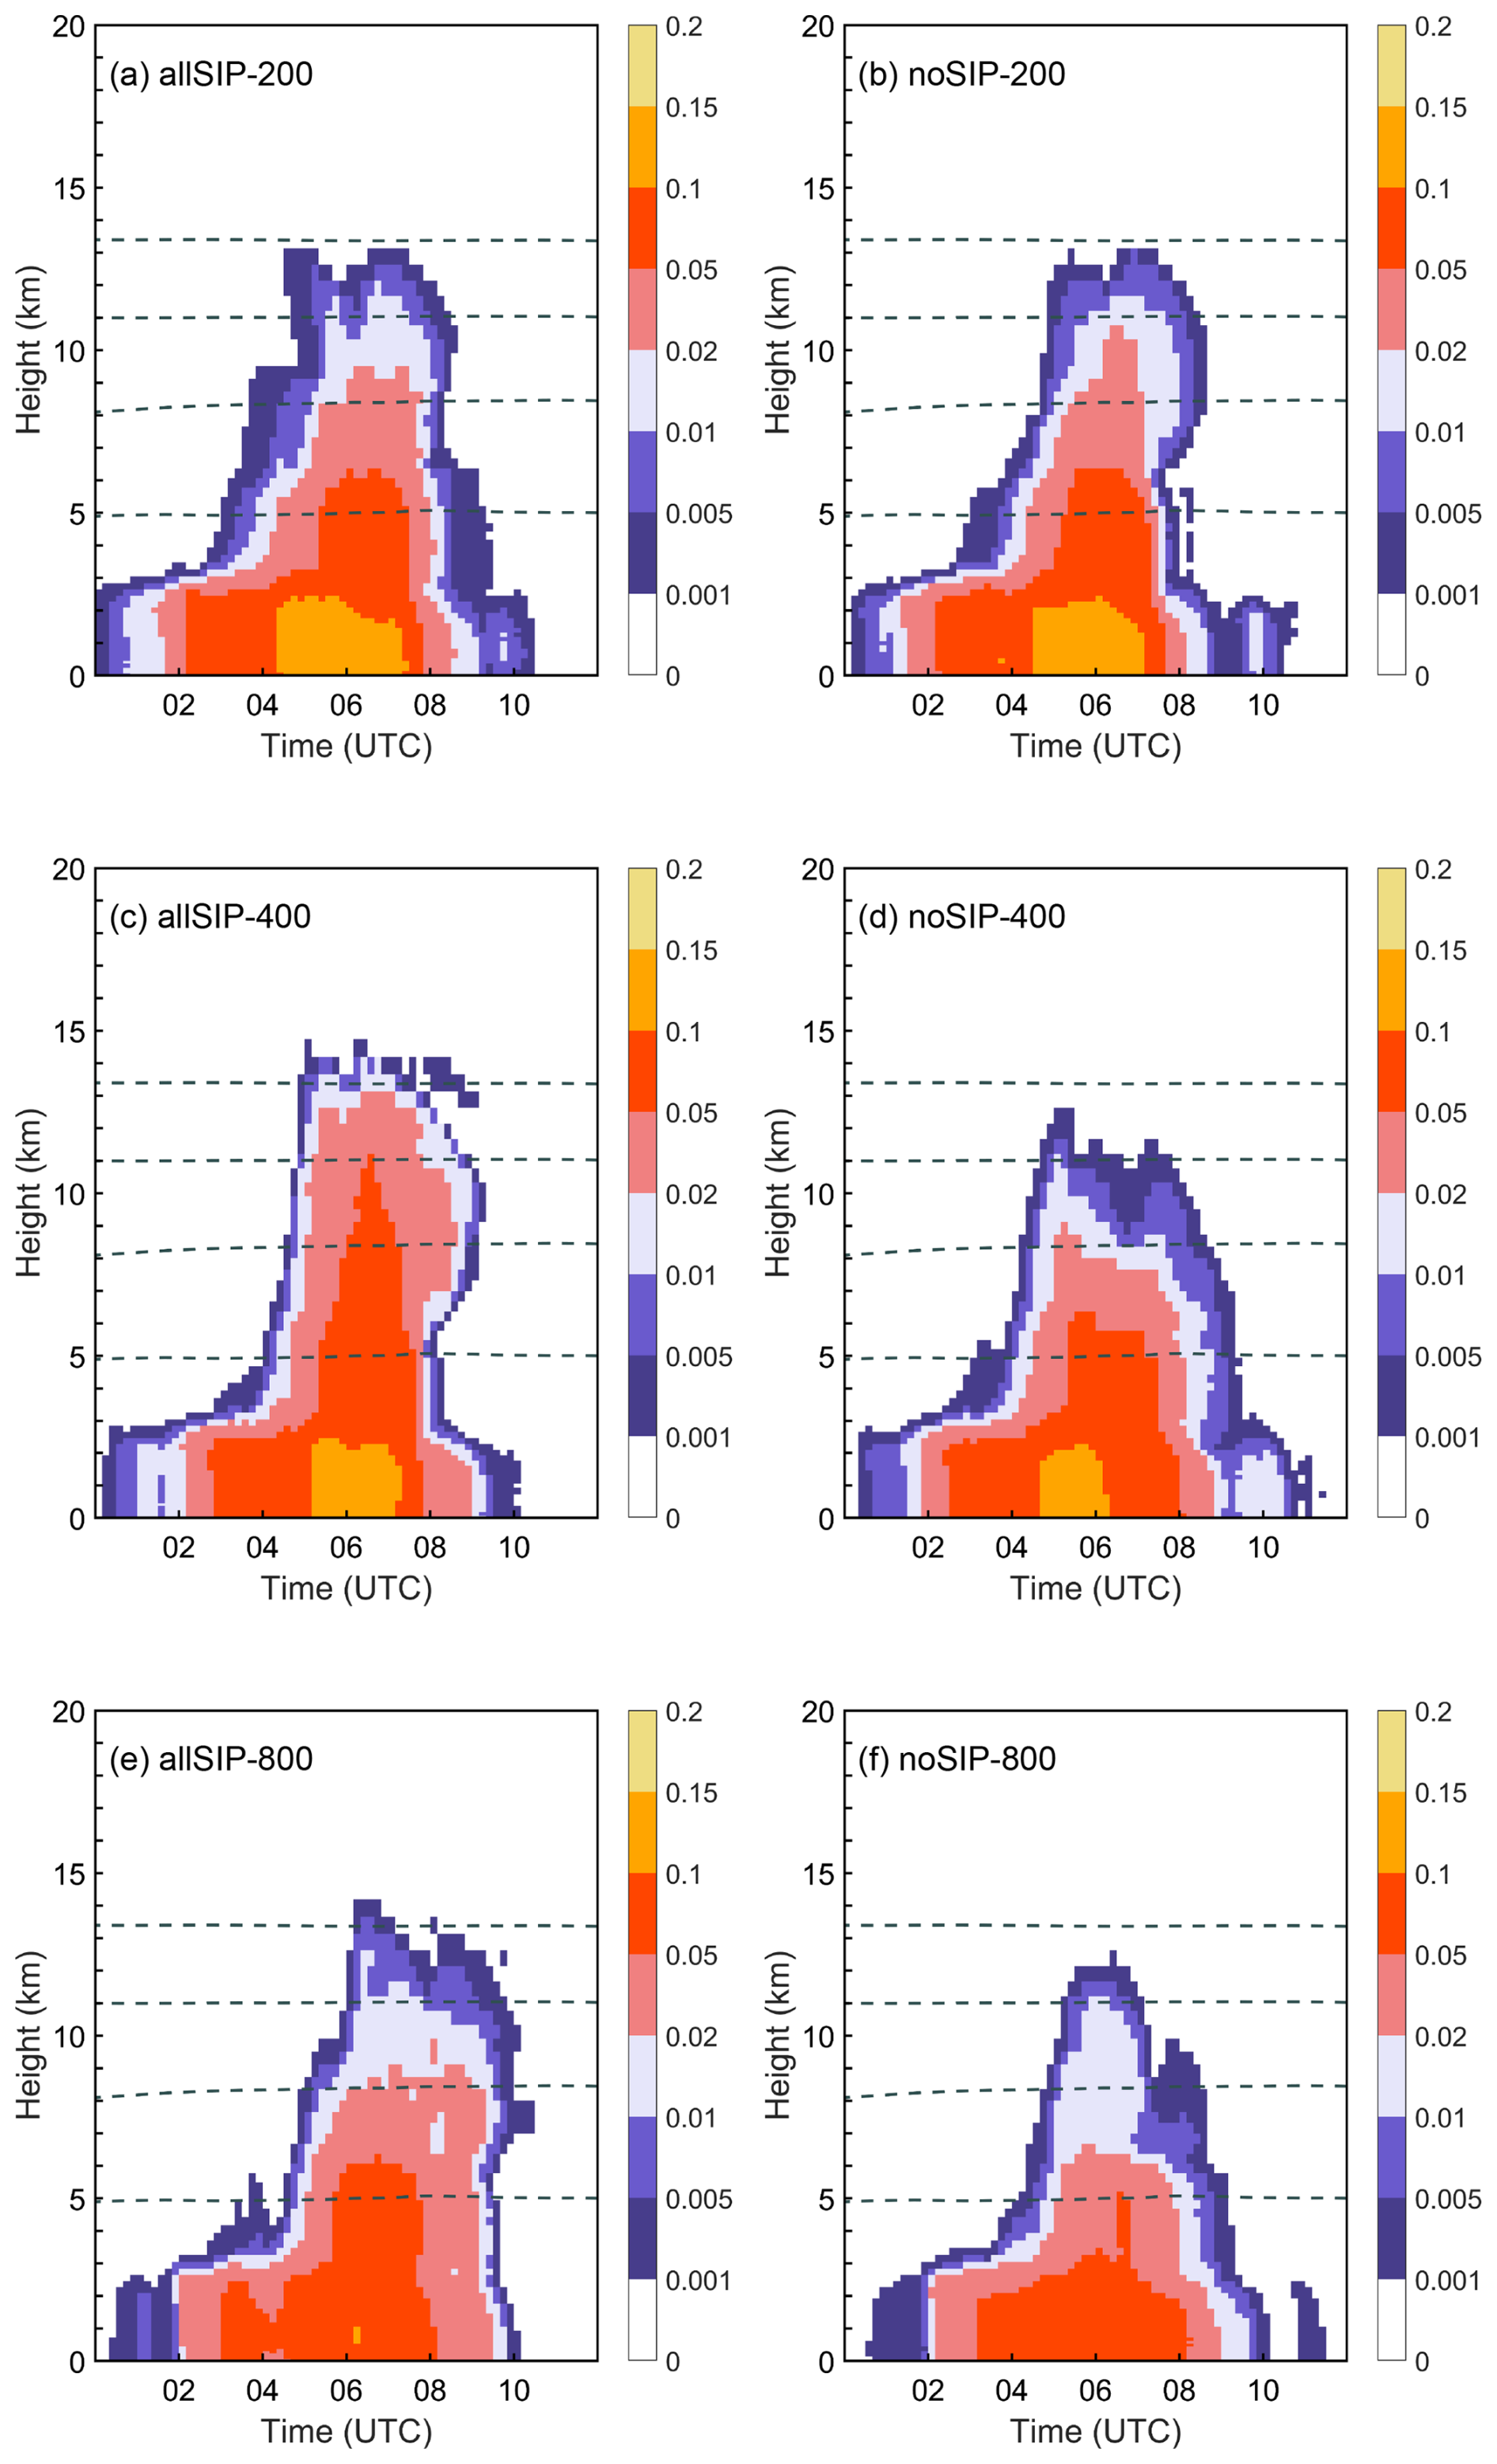
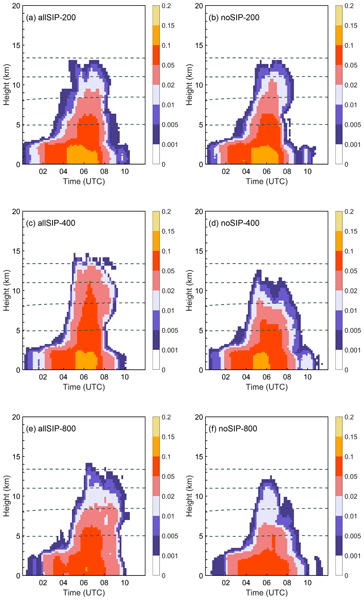
Figure 6Time-height plots of CFADs (contoured frequency by altitude diagrams) for radar reflectivity greater than 10 dBZ from (a) allSIP-200, (b) noSIP-200, (c) allSIP-400, (d) noSIP-400, (e) allSIP-800 and (f) noSIP-800 simulations. The 0, −20, −40, and −60 °C isotherms are indicated by dashed lines in all panels.
The CFADs (contoured frequency by altitude diagrams) of reflectivity (> 10 dBZ), as shown in Fig. 6, further link these radiative patterns to storm structure. For Nd = 200 cm−3, the difference between allSIP-200 and noSIP-200 is smaller and mainly confined to mid-levels (Fig. 6a, b), consistent with the weaker radiative impact (Fig. 5a–c). For the Nd = 400 cm−3 pair, allSIP-400 sustains a deeper vertical extent of reflectivity > 10 dBZ above 10 km than noSIP-400 (Fig. 6c, d), consistent with the expanded low-OLR region. At Nd = 800 cm−3, reflectivity > 10 dBZ reaches upper levels (Fig. 6e, f), but the echoes are more vertically dispersed and occur with lower frequency at each height than in the Nd = 400 cm−3 pair. This suggests a deeper yet optically thinner distribution of hydrometeors, which may explain the less concentrated low-OLR region (Fig. 5g–i). Overall, the intermediate Nd simulations produce the most persistent upper-level reflectivity, particularly when all SIP mechanisms are included. The response to SIP is weaker under low Nd, while the high Nd simulations exhibit a more vertically dispersed reflectivity structure.
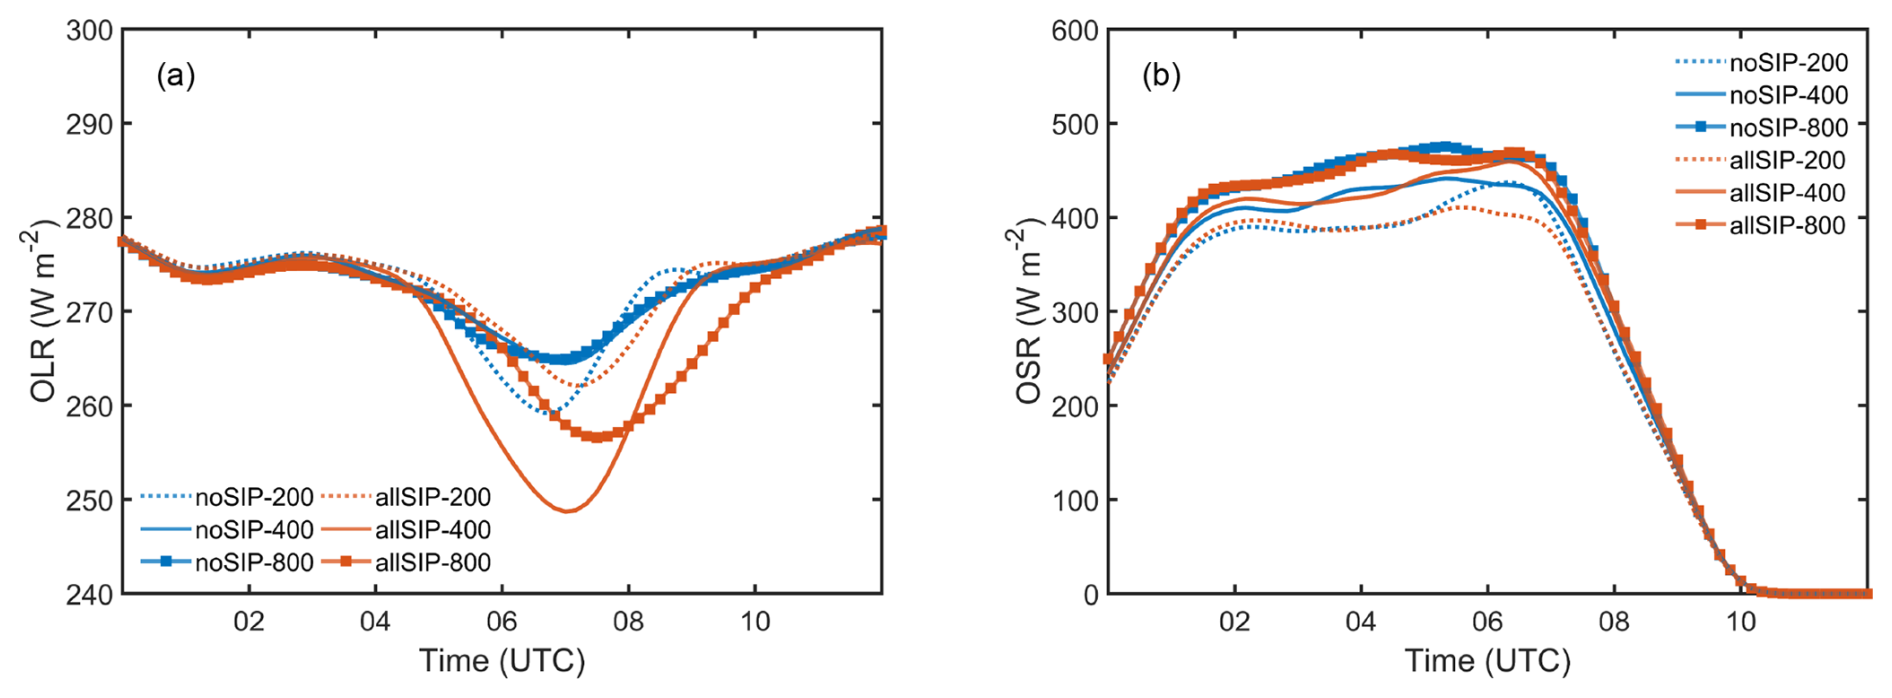
Figure 7Time series of domain-averaged (a) outgoing longwave radiation (OLR) and (b) outgoing shortwave radiation (OSR) from the simulations. Blue and red lines denote noSIP and allSIP simulations, respectively. Dotted lines denote Nd = 200 cm−3, solid lines denote Nd = 400 cm−3, and solid lines with square markers denote Nd = 800 cm−3. The same time adjustment is applied to all simulations to account for the earlier development of the simulated storm.
Table 2Comparison of radiation responses to SIP across CCN levels.
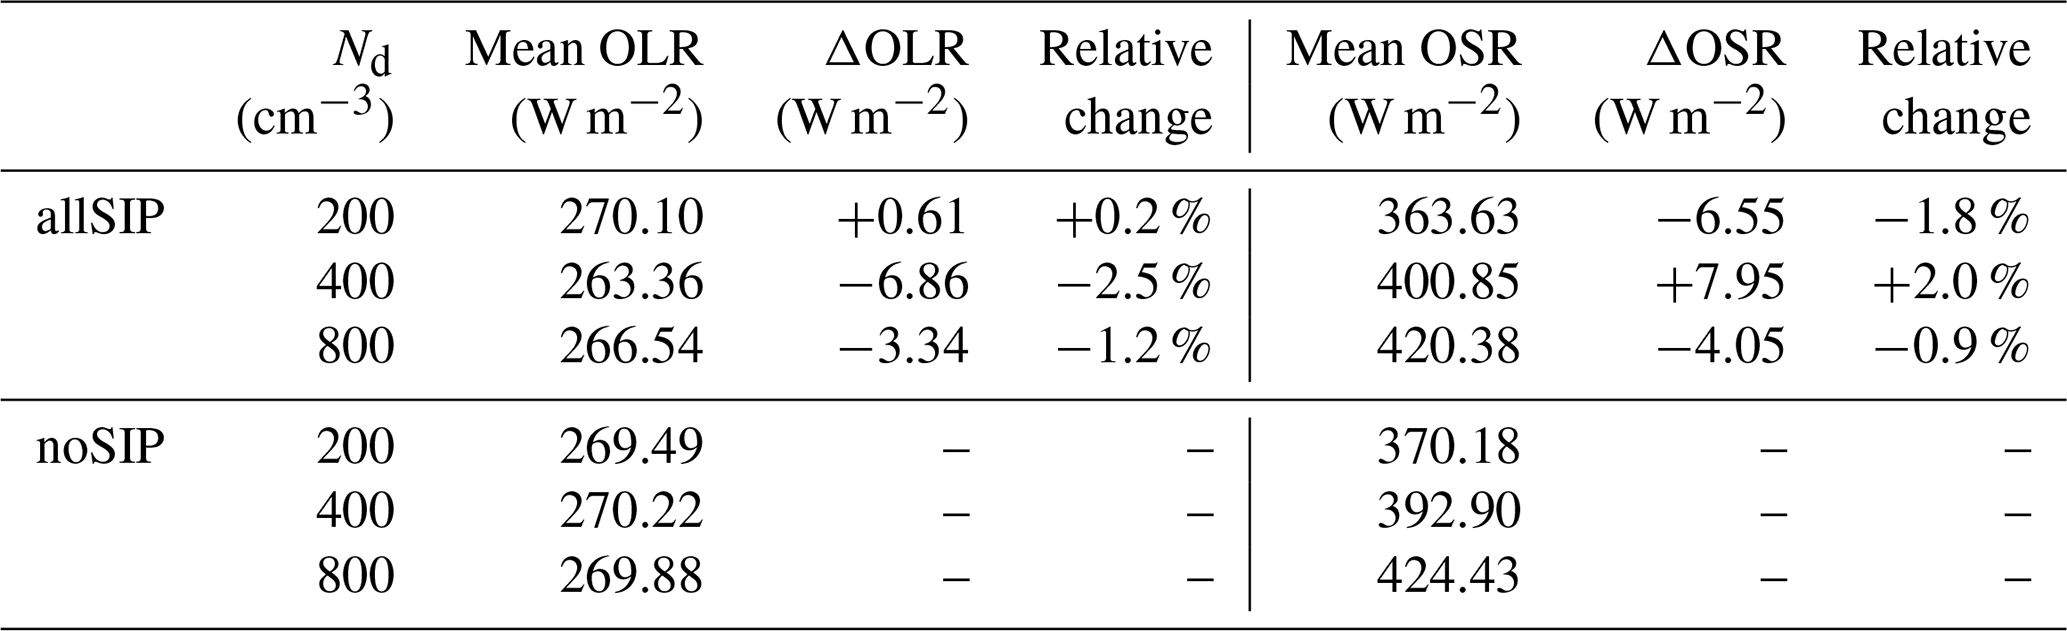
Note: All values are calculated over the analysis region shown in Fig. 1a, during 02:30–08:30 UTC on 6 February 2006. ΔOLR and ΔOSR represent the differences between SIP and noSIP simulations. Relative change (%) is calculated as (OLRSIP − OLRnoSIP) OLRnoSIP × 100 %, and similarly for OSR.
The temporal evolution of domain-averaged OLR is shown in Fig. 7a, and the SIP-induced changes are summarized in Table 2. In all simulations, OLR decreases after approximately 02:00 UTC as convection develops, reaches a minimum during the mature stage, and recovers towards the end of the analysis period. At Nd = 400 cm−3, allSIP-400 reaches a substantially lower minimum than noSIP-400. The SIP-induced change is smaller at Nd = 800 cm−3, and small and of opposite sign at Nd = 200 cm−3. Quantitatively, the strongest reduction occurs at Nd = 400 cm−3, where the allSIP case drops below 250 W m−2 and the mean allSIP–noSIP difference reaches −6.86 W m−2 (−2.5 %). At Nd = 200 cm−3, allSIP-200 produces a slight increase of +0.61 W m−2 (+0.2 %) relative to noSIP-200, whereas at Nd = 800 cm−3, allSIP-800 produces a decrease of −3.34 W m−2 (−1.2 %) relative to noSIP-800. The reductions under the intermediate and high Nd conditions are consistent with stronger anvil development and enhanced upper-level ice content.
In contrast, outgoing shortwave radiation (OSR; Fig. 7b) increases after 02:00 UTC and peaks around 06:00 UTC, but its response to SIP is more variable. At Nd = 400 cm−3, SIP enhances OSR relative to noSIP, with peak values exceeding 500 W m−2 compared to ∼ 480 W m−2, and a mean increase of +7.95 W m−2 (+2.0 %). At Nd = 200 cm−3, however, SIP reduces OSR by −6.55 W m−2 (−1.8 %), while at Nd = 800 cm−3 the reduction is smaller at −4.05 W m−2 (−0.9 %). This contrast suggests that SIP has a robust and consistent impact on longwave radiation by maintaining colder, more extensive anvils, whereas its shortwave effect is weaker and dependent on CCN concentration. In addition, OSR differences may be further influenced by variations in cloud phase, particle size, and the timing of solar insolation (Yin and Porporato, 2017).
3.3 SIP impacts on precipitation under varying CCN conditions
The spatial distribution of accumulated precipitation from 04:00–10:00 UTC (Fig. 8) shows that SIP affects both the intensity and organization of rainfall, with responses depending on CCN concentrations. At Nd = 200 cm−3 (Fig. 8a, b), allSIP-200 slightly increases the number of rainfall cores relative to noSIP-200 but does not substantially change the overall coverage, indicating a weaker response in this case. allSIP-400 produces a more organized rainband with more heavy rainfall cores (> 100 mm) than noSIP-400 (Fig. 8c, d), indicating stronger organization when SIP is included. Under Nd = 800 cm−3 (Fig. 8e–f), allSIP-800 broadens the precipitation area relative to noSIP-800, but the rainfall pattern is more fragmented than in allSIP-400, resembling the more dispersed pattern in the OLR distribution (Fig. 5h–i).
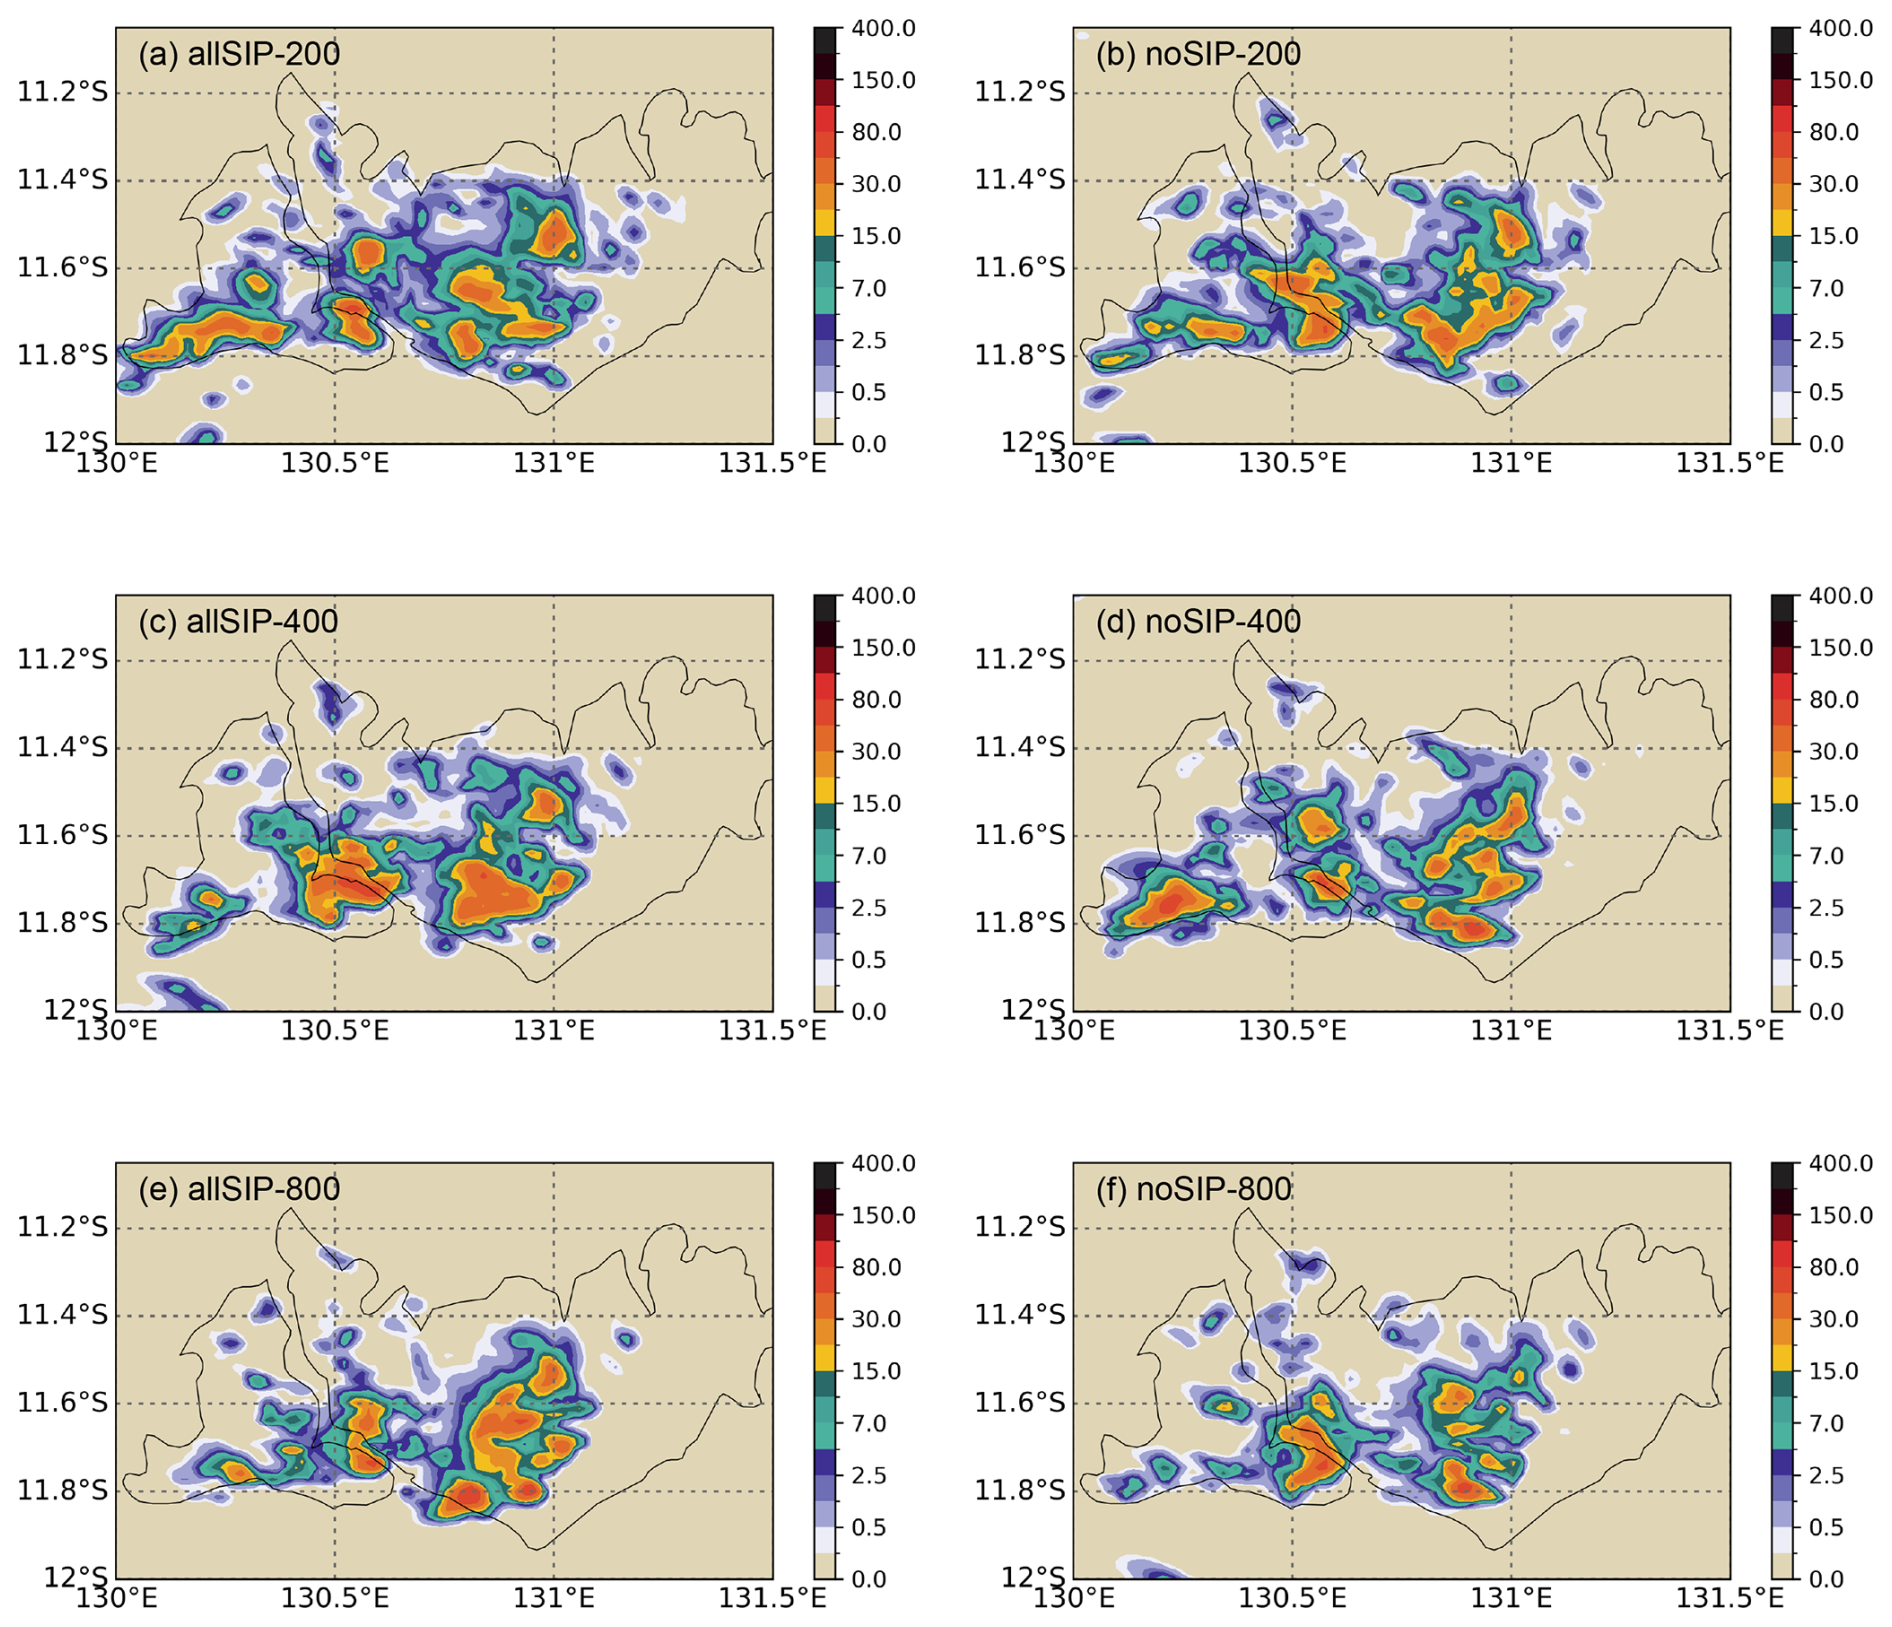
Figure 8Spatial distribution of accumulated precipitation (mm) during 04:00–10:00 UTC on 6 February 2006 from (a) allSIP-200, (b) noSIP-200, (c) allSIP-400, (d) noSIP-400, (e) allSIP-800 and (f) noSIP-800.
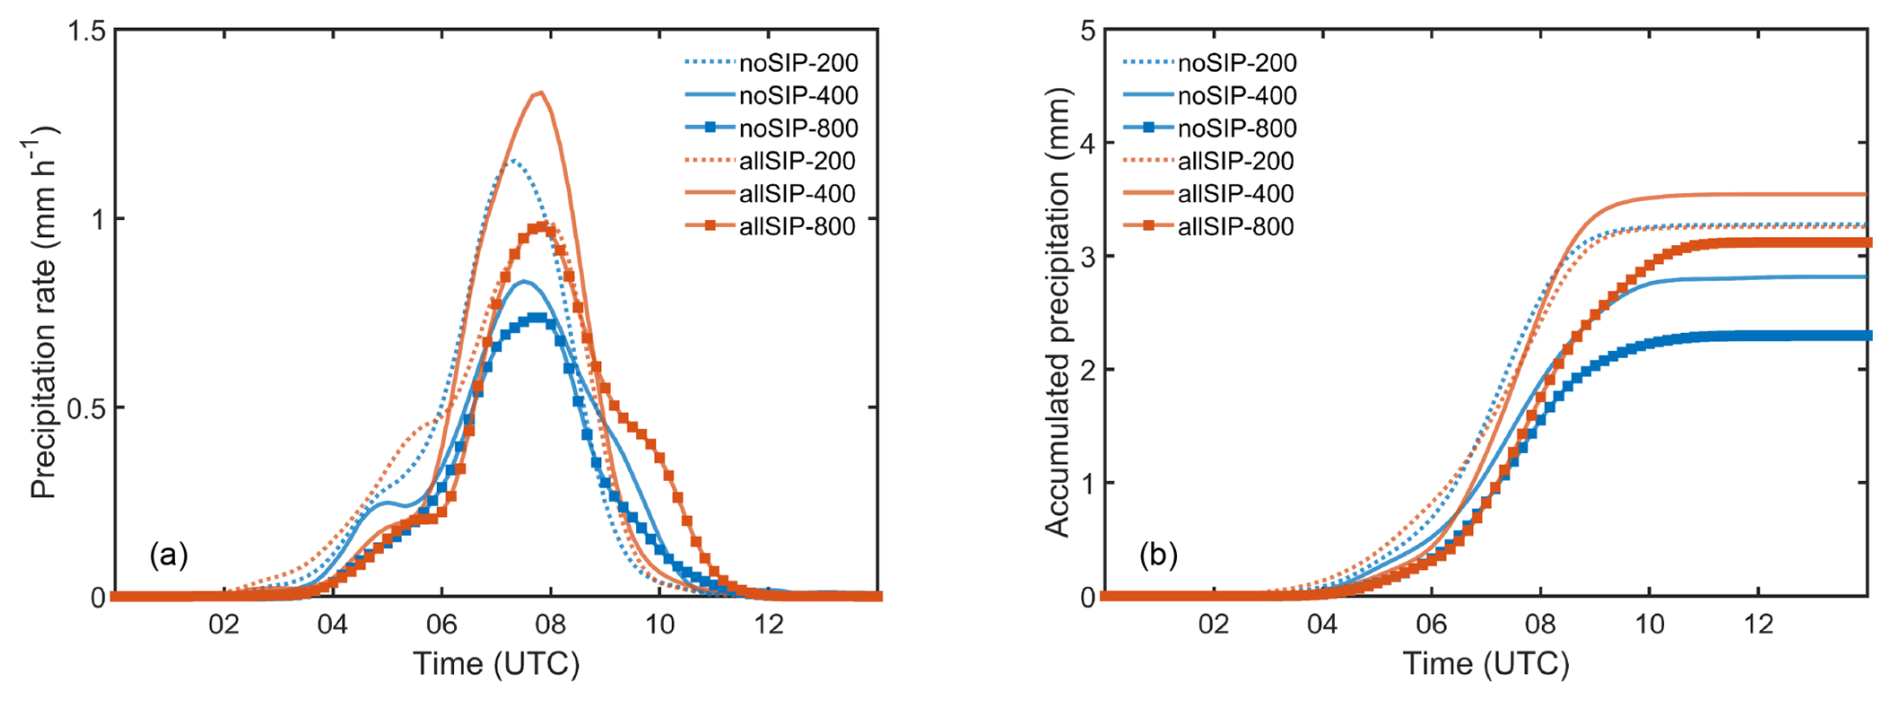
Figure 9Time series of domain-averaged (a) precipitation rate (mm h−1) and (b) accumulated precipitation (mm) from simulations without SIP (noSIP; blue) and with all SIP mechanisms activated (allSIP; red) for Nd = 200 cm−3 (dotted lines), Nd = 400 cm−3 (solid lines), and Nd = 800 cm−3 (solid lines with square markers). The time axis of the simulations has been shifted by −1 h, as in Fig. 3.
Domain-averaged precipitation time series (Fig. 9) further quantify these effects. The peak precipitation rate in allSIP-400 (∼ 1.35 mm h−1) is notably higher than in noSIP-400 (∼ 0.80 mm h−1; Fig. 9a). In the Nd = 400 cm−3 pair, SIP enhances the production of ice-phase particles aloft, accelerating mixed-phase processes (Sun et al., 2025). This promotes melting and sustains a robust rain region, as shown in Fig. 8c. For Nd = 200 cm−3, allSIP-200 (∼ 0.95 mm h−1) produces a lower peak rate than noSIP-200 (∼ 1.20 mm h−1). In clean conditions, early precipitation formation likely involves a stronger contribution from warm-rain processes. SIP accelerates glaciation during the early storm stage, shifting part of the condensate from liquid to ice phase and likely reducing the liquid water available for warm-rain collision–coalescence. This is consistent with the lower peak precipitation rates under clean conditions. The precipitation duration remains comparable, resulting in similar accumulated totals between allSIP-200 (∼ 3.25 mm) and noSIP-200 (∼ 3.27 mm; Fig. 9b). For Nd = 400 cm−3, allSIP-400 (∼ 3.54 mm) yields a higher accumulated total than noSIP-400 (∼ 2.81 mm, +25 %; Fig. 9b), consistent with its stronger precipitation peak. At Nd = 800 cm−3, high aerosol loading delays precipitation onset due to smaller cloud droplet sizes and reduced collision–coalescence efficiency. In this case, SIP increases ice water content, leading to greater late-stage precipitation in allSIP-800 than in noSIP-800 (∼ 2.30 mm). However, the total accumulation in allSIP-800 (∼ 3.11 mm) remains lower than in allSIP-400 (∼ 3.54 mm), as the limited warm-rain formation under high droplet number concentrations cannot be fully compensated by the enhanced ice-phase process. The simulated domain totals span approximately 50 % across the combinations of SIP and Nd (2.30–3.54 mm), demonstrating the sensitivity of precipitation accumulation to both prescribed droplet number and SIP configuration. This provides a clear motivation to represent and constrain these processes more accurately in precipitation prediction.
Overall, these results suggest that SIP can intensify rainfall and produce a more concentrated precipitation pattern, with the strongest response in allSIP-400 relative to noSIP-400. At Nd = 200 cm−3, large cloud droplets allow warm-rain processes to occur efficiently even without SIP, so the additional ice-phase pathway has only a small impact on precipitation. At Nd = 800 cm−3, enhanced cloud droplet numbers delay warm-rain processes and lead to more dispersed precipitation; allSIP-800 increases totals relative to noSIP-800 but does not reach the allSIP-400 total.
3.4 SIP impacts on cloud microphysics under varying CCN conditions
3.4.1 Microphysics associated with radiation and precipitation responses
To interpret the radiative and precipitation responses presented in previous sections, we examine the vertical structures of key hydrometeors under different CCN and SIP conditions (Fig. 10). These include cloud droplets, raindrops, ice crystals, graupel, total ice water content (IWC), and updraft strength. Cloud droplet number concentration increases with CCN as expected, ranging from ∼ 0.5 × 10⁸ m−3 at Nd = 200 cm−3 to over 2.0 × 10⁸ m−3 at Nd = 800 cm−3 (Fig. 10a), while the mean-mass radius of cloud droplets decreases with increasing CCN (Fig. 10f). The impact of SIP on cloud droplets is negligible compared to the dominant effect of CCN.
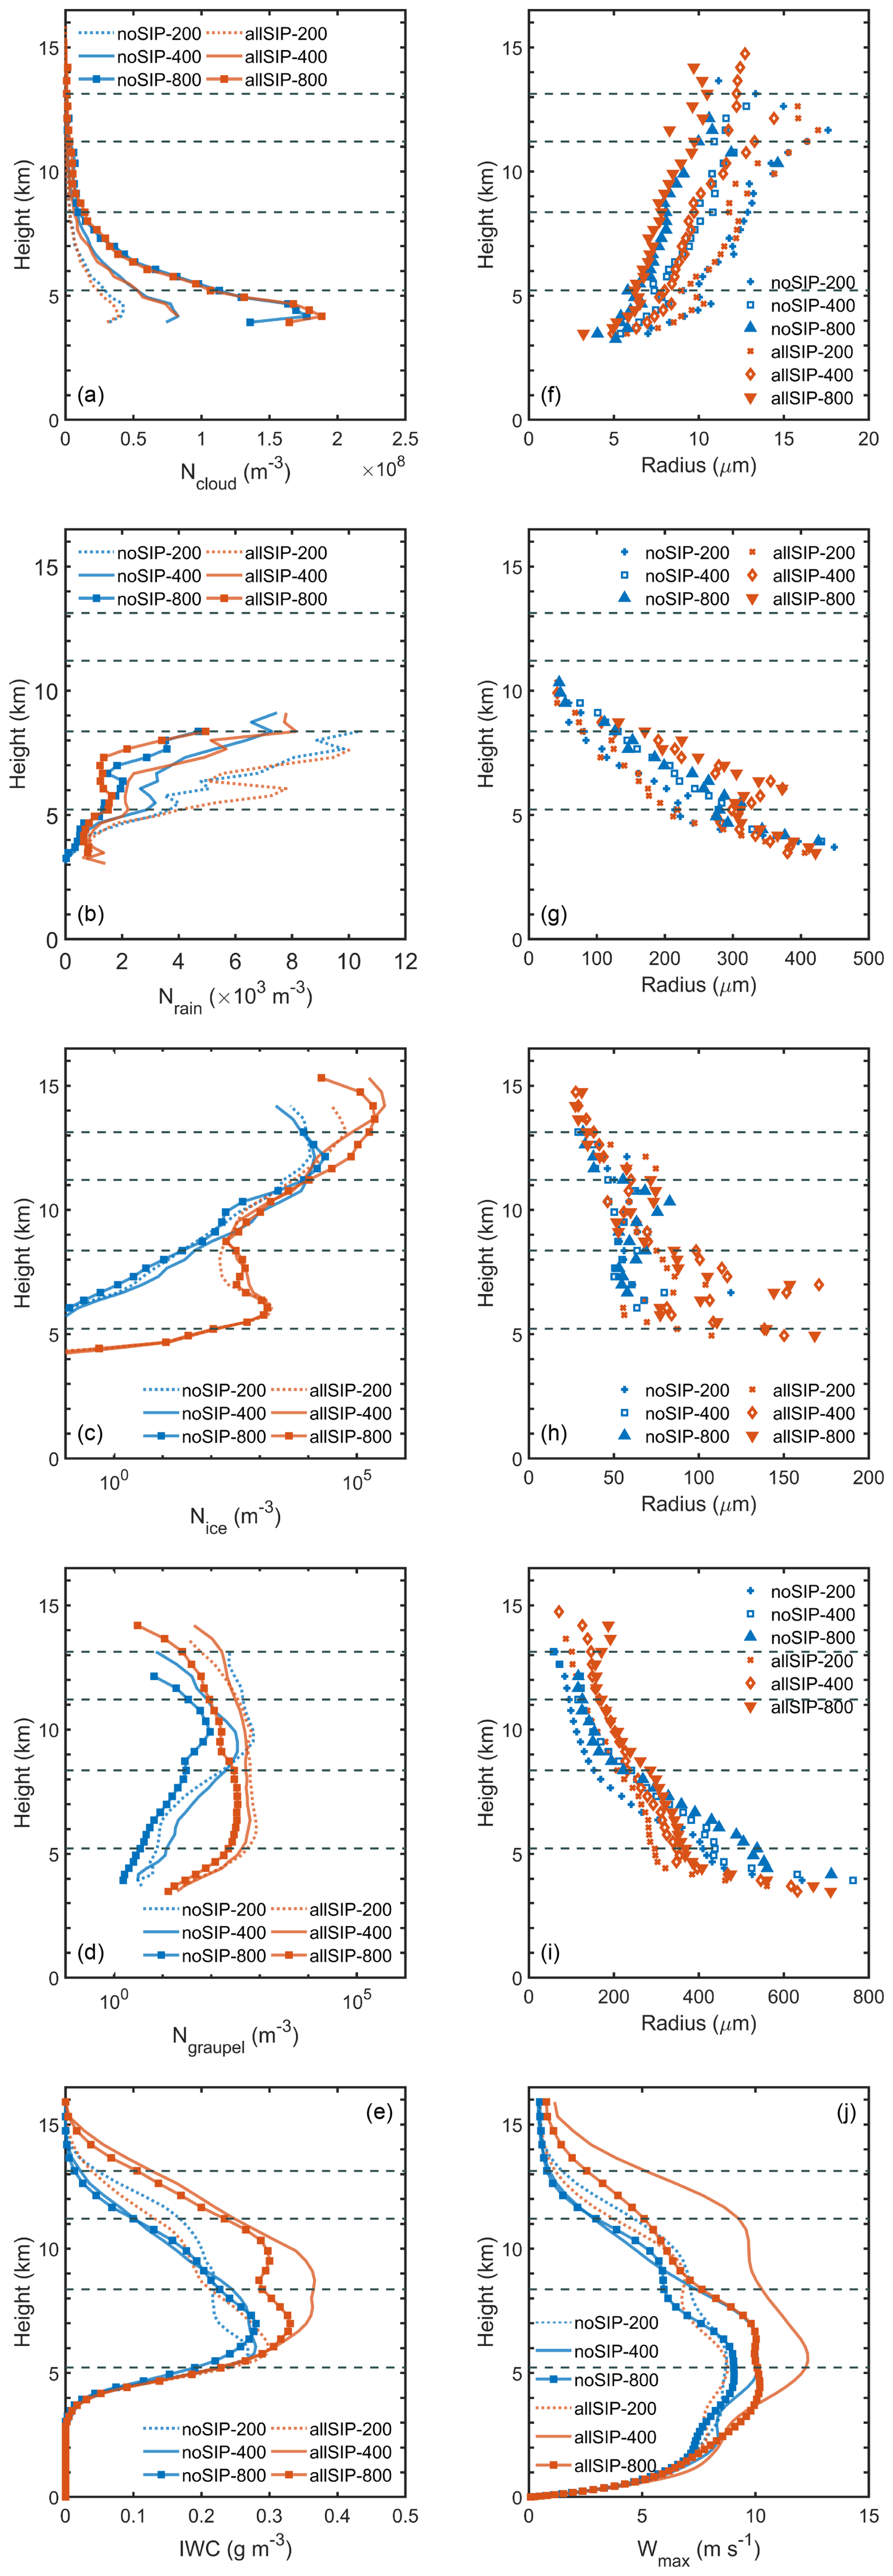
Figure 10Vertical profiles of horizontally averaged microphysical and dynamical properties from simulations without SIP (noSIP) and with all SIP mechanisms (allSIP), under three CCN concentrations (Nd = 200, 400, and 800 cm−3). Panels (a)–(d) show number concentrations of cloud droplets, rain, ice crystals, and graupel, respectively. Panels (f)–(i) show the corresponding mean-mass radii. Panels (e) and (j) display the ice water content (IWC, sum of ice crystals, graupel, and snow) and 95th percentile updraft velocity (Wmax), used as a proxy of maximum updraft strength. Panels (a)–(b) and (f)–(g) are averaged over regions where either the ice water path or rain water path exceeds 1 g m−2, while panels (c)–(e) and (h)–(j) are averaged over regions where IWC > 0.01 g m−3 during 02:30–08:30 UTC on 6 February 2006. In panels (a)–(e) and (j), dotted lines denote Nd = 200 cm−3, solid lines denote Nd = 400 cm−3, and solid lines with square markers denote Nd = 800 cm−3. Gray dashed lines indicate the 0, −20, −40, and −60 °C isotherms.
SIP alters the vertical distribution of raindrops, and its impact varies with CCN levels. Raindrop number concentration (Nrain) decreases from the 200 to 800 cm−3experiments (Fig. 10b), consistent with reduced warm-rain efficiency at higher CCN. Near the melting level (∼ 4–5 km), Nrain is controlled primarily by CCN and differs little between allSIP and noSIP at a given CCN. Below 4 km, however, Nrain is generally higher in allSIP-200, allSIP-400, and allSIP-800 than in their noSIP counterparts, indicating that melting of SIP-generated ice contributes additional raindrops to lower levels. Above 5 km, SIP increases Nrain at Nd = 200 cm−3 but decreases it at Nd = 400 and 800 cm−3. In the clean pair, allSIP-200 shows higher Nrain than noSIP-200 at 5–7 km, suggesting earlier melting of the relatively limited ice produced aloft. By contrast, allSIP-400 and allSIP-800 both show lower Nrain than noSIP-400 and noSIP-800 above 5 km, implying that more condensate is retained in frozen form aloft before being converted to rain at lower levels. This behaviour suggests a stronger ice-phase contribution to rainfall in allSIP-400 and allSIP-800 than in the clean pair, as further examined using the ice and IWC diagnostics below.
For raindrop size, the mean-mass radius below 5 km is similar across CCN levels and between noSIP and allSIP runs (Fig. 10g), indicating that mixing, coalescence, and evaporation tend to homogenize raindrop sizes at low levels. Above 5 km, raindrops are smallest at Nd = 200 cm−3 and larger at Nd = 400 and 800 cm−3. In particular, allSIP-200 shows a smaller radius than noSIP-200 at 5–7 km, with allSIP-200 reaching < 160 µm compared with ∼ 200 µm in noSIP-200. This likely reflects a higher Nrain with little change in rainwater content, reducing the mean mass per drop and thus the radius. In contrast, allSIP-400 and allSIP-800 produce larger raindrops than noSIP-400 and noSIP-800 by ∼ 30–100 µm above 5 km, consistent with a contribution from melting of enhanced ice-phase hydrometeors to fewer but larger drops.
Time–height sections of rainwater content (RWC) further support this pathway (Fig. S2 in the Supplement). Compared to noSIP-400, allSIP-400 shows a pronounced RWC enhancement at ∼ 3–6 km from ∼ 04:00–06:00 UTC (Fig. S2b), followed by a near-surface (0–2 km) RWC peak around ∼ 06:30 UTC that coincides with the precipitation-rate maximum in Fig. 9a. The enhancement is weaker and delayed in allSIP-800 relative to allSIP-400, consistent with suppressed warm-rain development at high CCN. Nevertheless, allSIP-800 still exceeds noSIP-800 (Fig. S2c, f, i), indicating that SIP continues to enhance rainwater under polluted conditions through the melting of SIP-enhanced ice-phase hydrometeors. In the clean pair, differences between allSIP-200 and noSIP-200 are small or negative, especially between 04:00–06:00 UTC (Fig. S2g), indicating that SIP only weakly modifies rainwater mass under low-CCN conditions. Taken together, these rain diagnostics are consistent with the contrasting precipitation responses across the three CCN regimes: the clearest enhancement occurs in allSIP-400, the response in allSIP-800 is weaker and delayed, and differences between allSIP-200 and noSIP-200 remain small.
SIP leads to substantial enhancement in ice crystal number concentration (Nice) between 5 and 9 km, especially in allSIP-400 (Fig. 10c). At 5–7 km, allSIP-400 reaches ∼ 3 × 10³ m−3, more than three orders of magnitude higher than noSIP-400. AllSIP-800 shows a similar enhancement in this layer, but the increase is more vertically dispersed, with a secondary peak (∼ 0.5 × 10³ m−3) near 8 km. In the clean case, the Nice enhancement in allSIP-200 is confined below 7 km, and values between 7–9 km (∼ 0.2 × 10³ m−3) are roughly half those in allSIP-400 and allSIP-800. The mean-mass radius of ice crystals (Fig. 10h) also increases in allSIP runs, especially in allSIP-400, where values exceed 100 µm near 7 km compared with ∼ 60 µm in noSIP-400. In contrast, the noSIP cases show little variation in radius across CCN levels between 5–9 km. Previous studies have shown that SIP tends to produce numerous smaller ice particles with reduced sedimentation (e.g. Dedekind et al., 2021). In this case, however, the enhanced crystal population is associated with larger mean-mass radii in allSIP-400 and, to a lesser extent, in allSIP-800. This suggests that part of the SIP-generated crystal population continues to grow after formation, likely through vapor deposition aided by stronger updrafts and greater IWC aloft (Field et al., 2023). In the clean pair, the radius difference between allSIP-200 and noSIP-200 remains small, likely because both updraft and IWC changes are small under low-CCN conditions.
Graupel number concentration (Ngraupel) is also enhanced by SIP across all CCN levels (Fig. 10d). The largest increases occur in allSIP-200 and allSIP-400, both of which reach ∼ 103 m−3 near 6 km, compared to ∼ 10 m−3 in the corresponding noSIP runs. The enhancement is smaller in allSIP-800, consistent with previous findings that polluted conditions suppress graupel formation by delaying raindrop freezing (Sun et al., 2021, 2024). In contrast to the ice crystals, graupel radius decreases in all SIP runs (Fig. 10i). For example, at ∼ 5.5 km, graupel radius is ∼ 300 µm in allSIP-200 and ∼ 400 µm in noSIP-200. This suggests that SIP increases the number of graupel particles, while the available supercooled liquid is distributed among more particles, limiting the growth of individual graupel through riming. By contrast, the diagnosed snow category shows a weaker response, suggesting that the SIP signal in snow may be partly moderated by aggregation and sedimentation in this case (Field et al., 2023). This is also consistent with a previous Hector simulation with CASIM (e.g., Sun et al., 2025). We therefore focus on crystals and graupel here.
Table 3Comparison of IWC and updraft responses to SIP mechanisms across CCN levels.
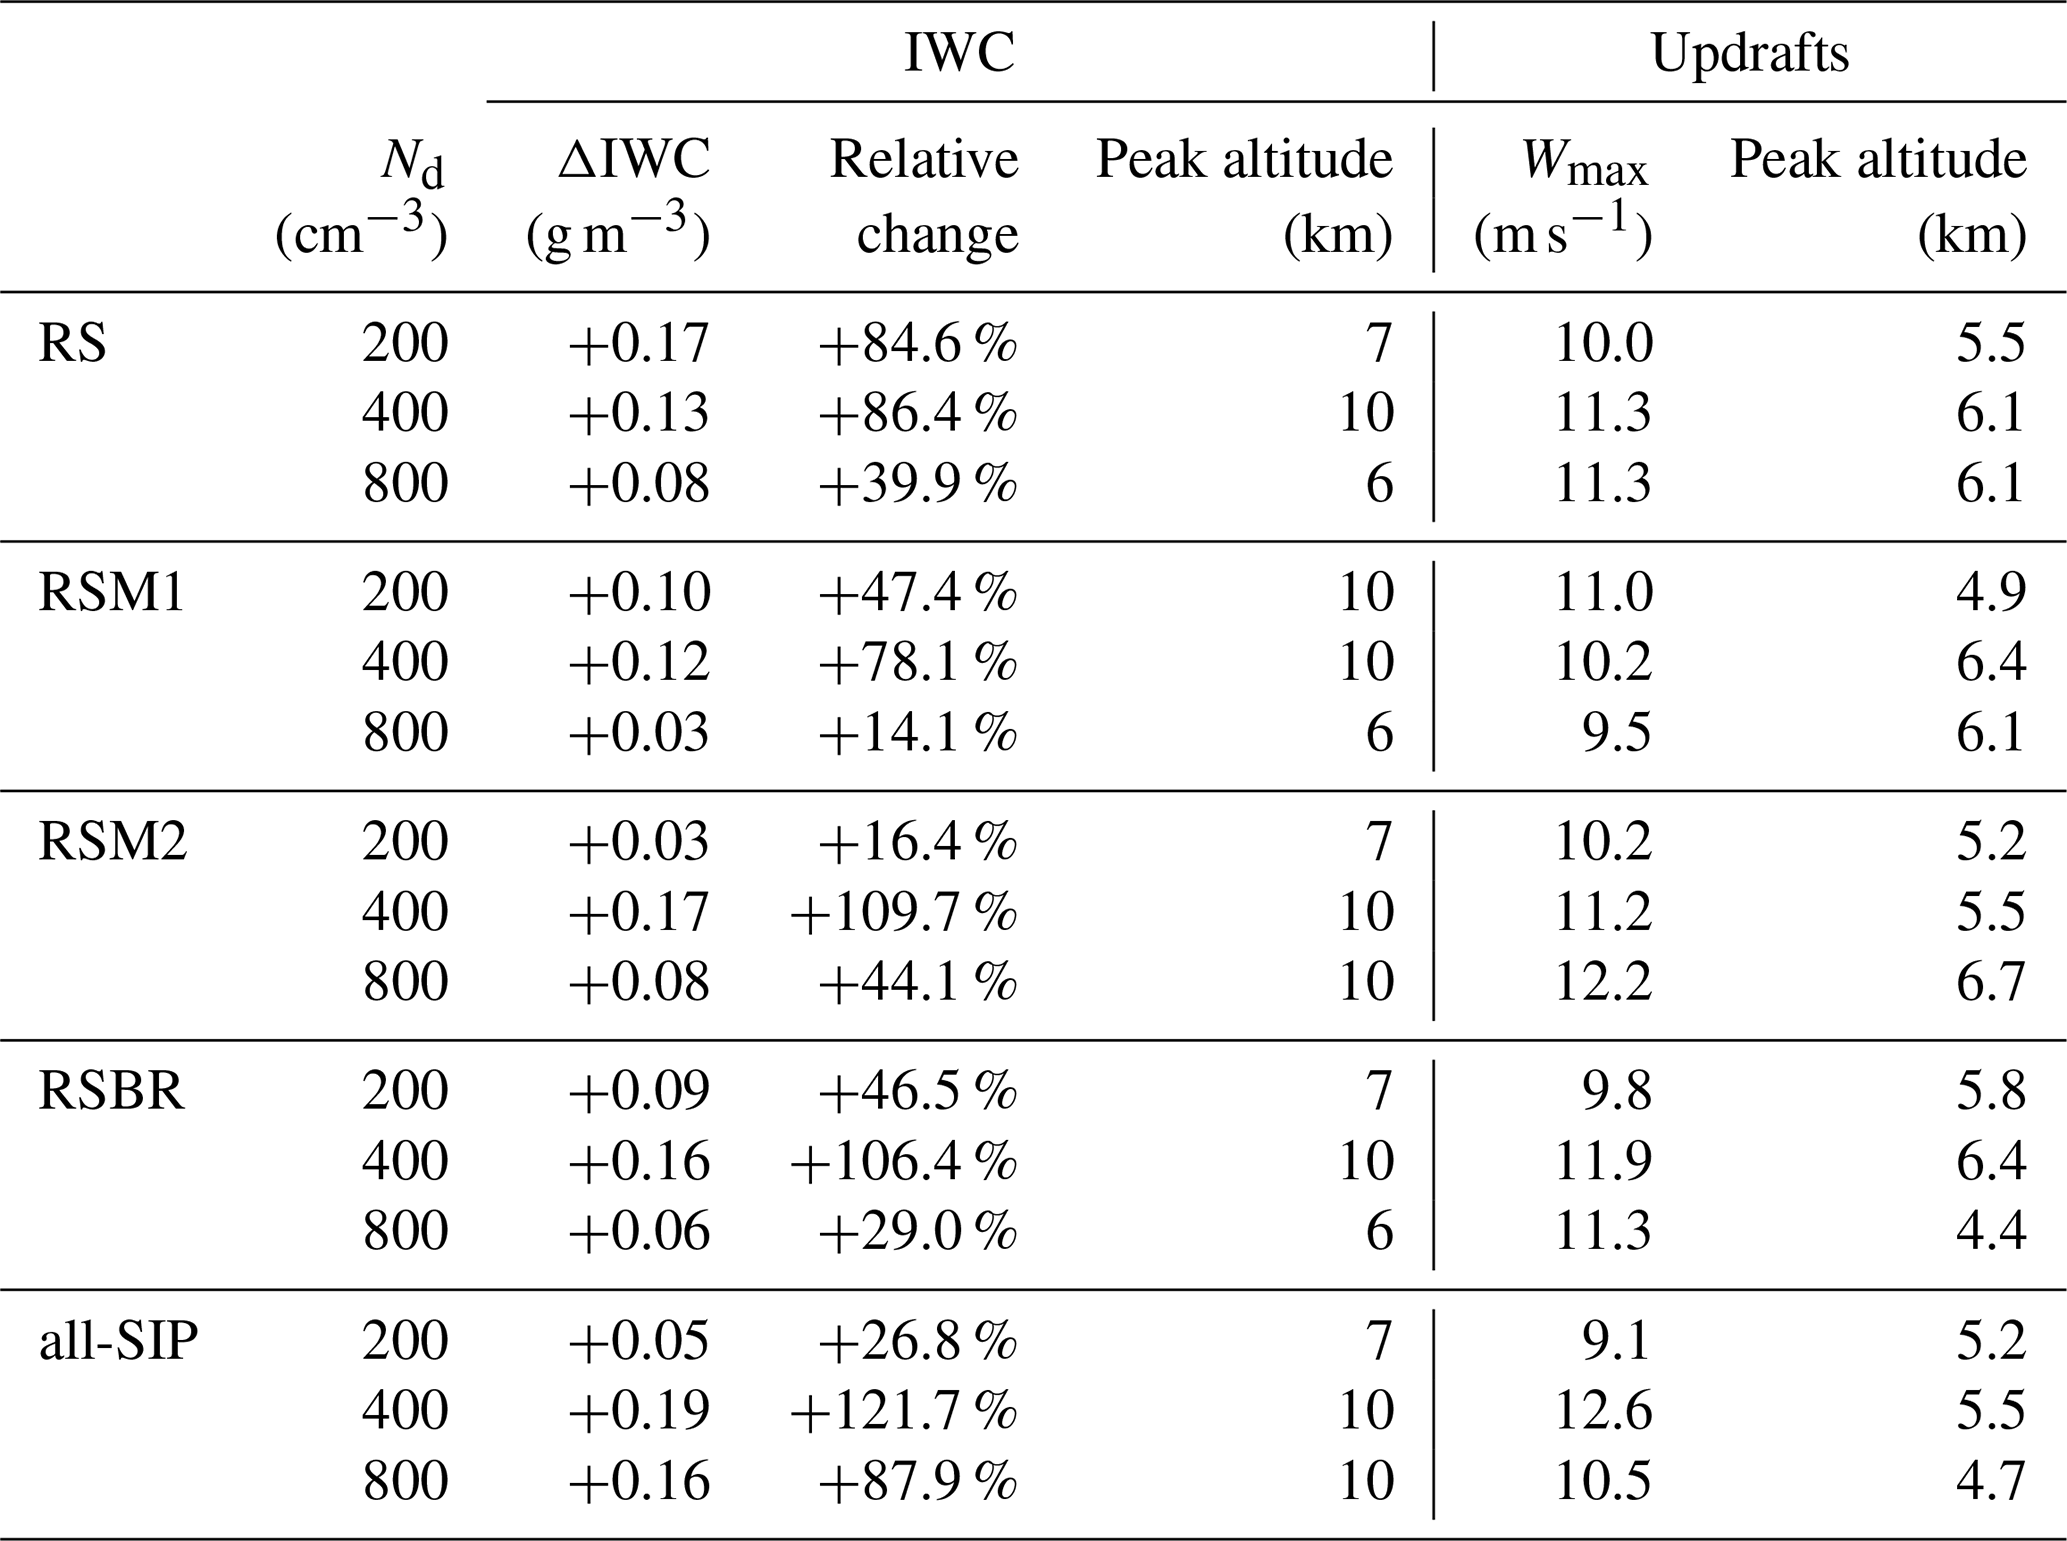
Note: ΔIWC is taken at the time of maximum difference between SIP and noSIP simulations. Relative change (%) is calculated as (IWCSIP − IWCnoSIP) IWCnoSIP × 100 %. Peak altitudes correspond to the vertical levels where ΔIWC or Wmax reaches its maximum for each configuration.
Together, increases in ice crystal and graupel enhance total ice water content (IWC) and the associated latent heating. The strongest IWC enhancement occurs in allSIP-400, where values exceed 0.35 g m−3 above 7 km, compared with ∼ 0.25 g m−3 in noSIP-400 at the same altitude (Fig. 10e). Near 10 km, allSIP-400 shows a maximum enhancement of +121.7 % relative to noSIP (Table 3). The response in allSIP-800 is weaker and more vertically dispersed, with peaks near 7 and 10 km and a maximum difference of +0.16 g m−3 (+87.9 %) around 10 km. In the clean pair, the IWC difference between allSIP-200 and noSIP-200 remains small despite increases in both Nice and Ngraupel. Under low-CCN conditions, larger cloud droplets and earlier rainfall suggest a stronger warm-rain contribution, which likely reduces available supercooled liquid content. At the same time, the relatively dry environment and weak updrafts are less favorable for sustained vapor deposition, limiting further ice-mass growth. As a result, the IWC difference remains small, and the associated allSIP–noSIP updraft differences are also weak (Fig. 10j). By contrast, allSIP-400 and allSIP-800 produce larger and more persistent IWC aloft (Fig. 10e). The latent heating from freezing strengthens mid- to upper-level updrafts by 2–4 m s−1 relative to noSIP-400 and noSIP-800 (Fig. 10j), which helps maintain condensate aloft and supports further ice growth.
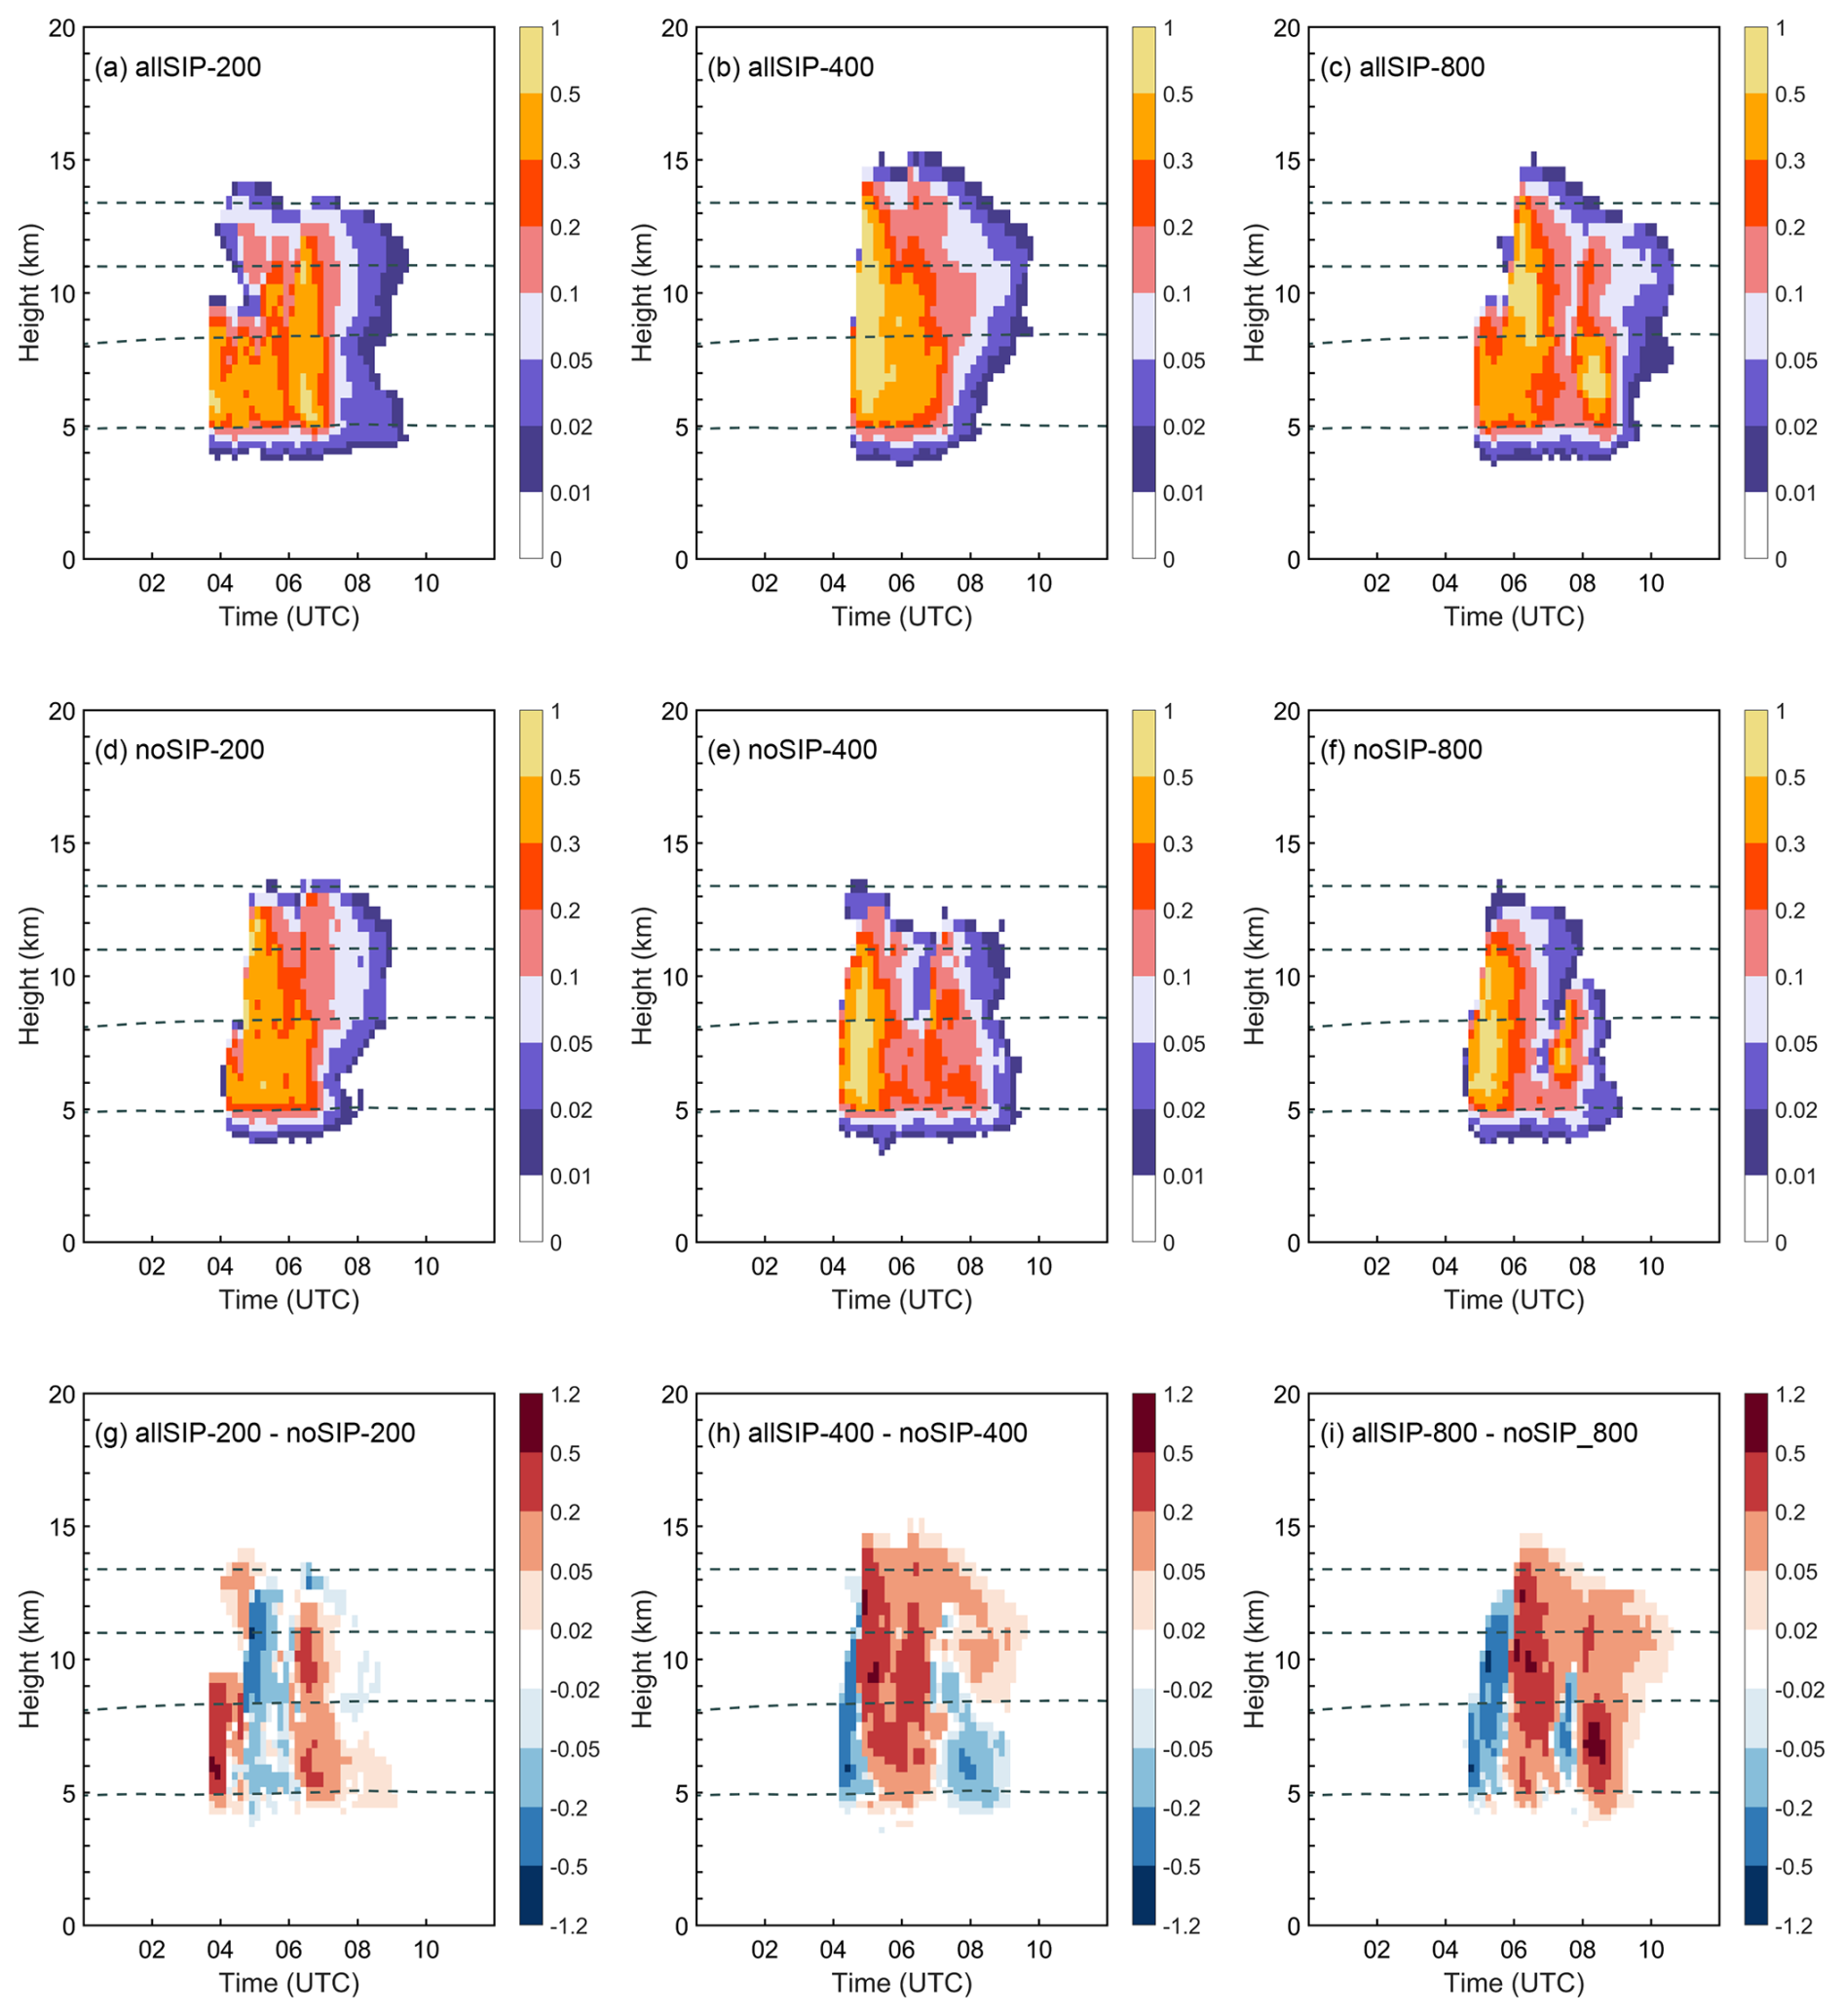
Figure 11Time–height cross sections of ice water content (IWC; g m−3) for simulations with all SIP mechanisms included: (a) allSIP-200, (b) allSIP-400, and (c) allSIP-800; and without SIP: (d) noSIP-200, (e) noSIP-400, and (f) noSIP-800. Panels (g)–(i) show the differences between allSIP and noSIP simulations at each CCN concentration (Nd = 200, 400, 800 cm−3; i.e., allSIP minus noSIP). Panels (a)–(f) are averaged over regions where IWC > 0.01 g m−3. The 0, −20, −40, and −60 °C isotherms are shown by the dashed lines. Corresponding plots for rain water content (RWC) are shown in Fig. S2 in the Supplement.
Time–height cross sections of IWC (Fig. 11) further illustrate how SIP modifies vertical cloud structure across aerosol conditions. IWC increases occur primarily above the melting level (∼ 5 km) during 04:00–08:30 UTC (Fig. 11a–f). The response is strongest at Nd = 400 cm−3, with deeper and longer-lasting IWC enhancement at upper levels than in the corresponding noSIP run (Fig. 11b, e, h), consistent with the largest IWC increase in Fig. 10e. At Nd = 800 cm−3, enhancement is weaker and delayed relative to Nd = 400 cm−3 (Fig. 11c, f, i), which is consistent with the weaker OLR suppression. At Nd = 200 cm−3, the changes induced by SIP are small and short-lived (Fig. 11a, d, g), indicating limited mass growth in the clean case. The difference panels (Fig. 11g–i) show that the SIP-induced IWC increase is concentrated at mid- to upper levels (∼ 7–13 km), with the strongest enhancement in the 400 cm−3 case (Fig. 11h). Together with the rain and RWC diagnostics discussed above, these differences help explain why the radiative response is strongest and the precipitation enhancement is clearest in allSIP-400.
3.4.2 Sensitivity to individual SIP mechanisms
We examine how different secondary ice production pathways, namely allSIP, RS, RSM1, RSM2, and RSBR, modify the storm relative to the corresponding noSIP simulations at Nd = 200, 400, and 800 cm−3, as shown in Figs. 10 and 12. Diagnostics are expressed as height-dependent enhancements over noSIP (e.g., ΔIWC = IWCSIP − IWCnoSIP; see Table 3).
At the case level with all mechanisms active, SIP substantially increases IWC, with the largest enhancement at Nd = 400 cm−3. The maximum ΔIWC reaches about +0.19 g m−3 (+121.7 %), and the IWC maximum is close to 10 km (Fig. 10e and Table 3). The peak updraft shows the same nonmonotonic dependence on CCN. Wmax attains 12.6 m s−1 at Nd = 400 cm−3, compared with 9.1 and 10.5 m s−1 at Nd = 200 and 800 cm−3 respectively (Fig. 10j). The altitude of Wmax is higher at Nd = 400 cm−3, around 5.5 to 7 km, and lower in the clean and polluted cases (Table 3).
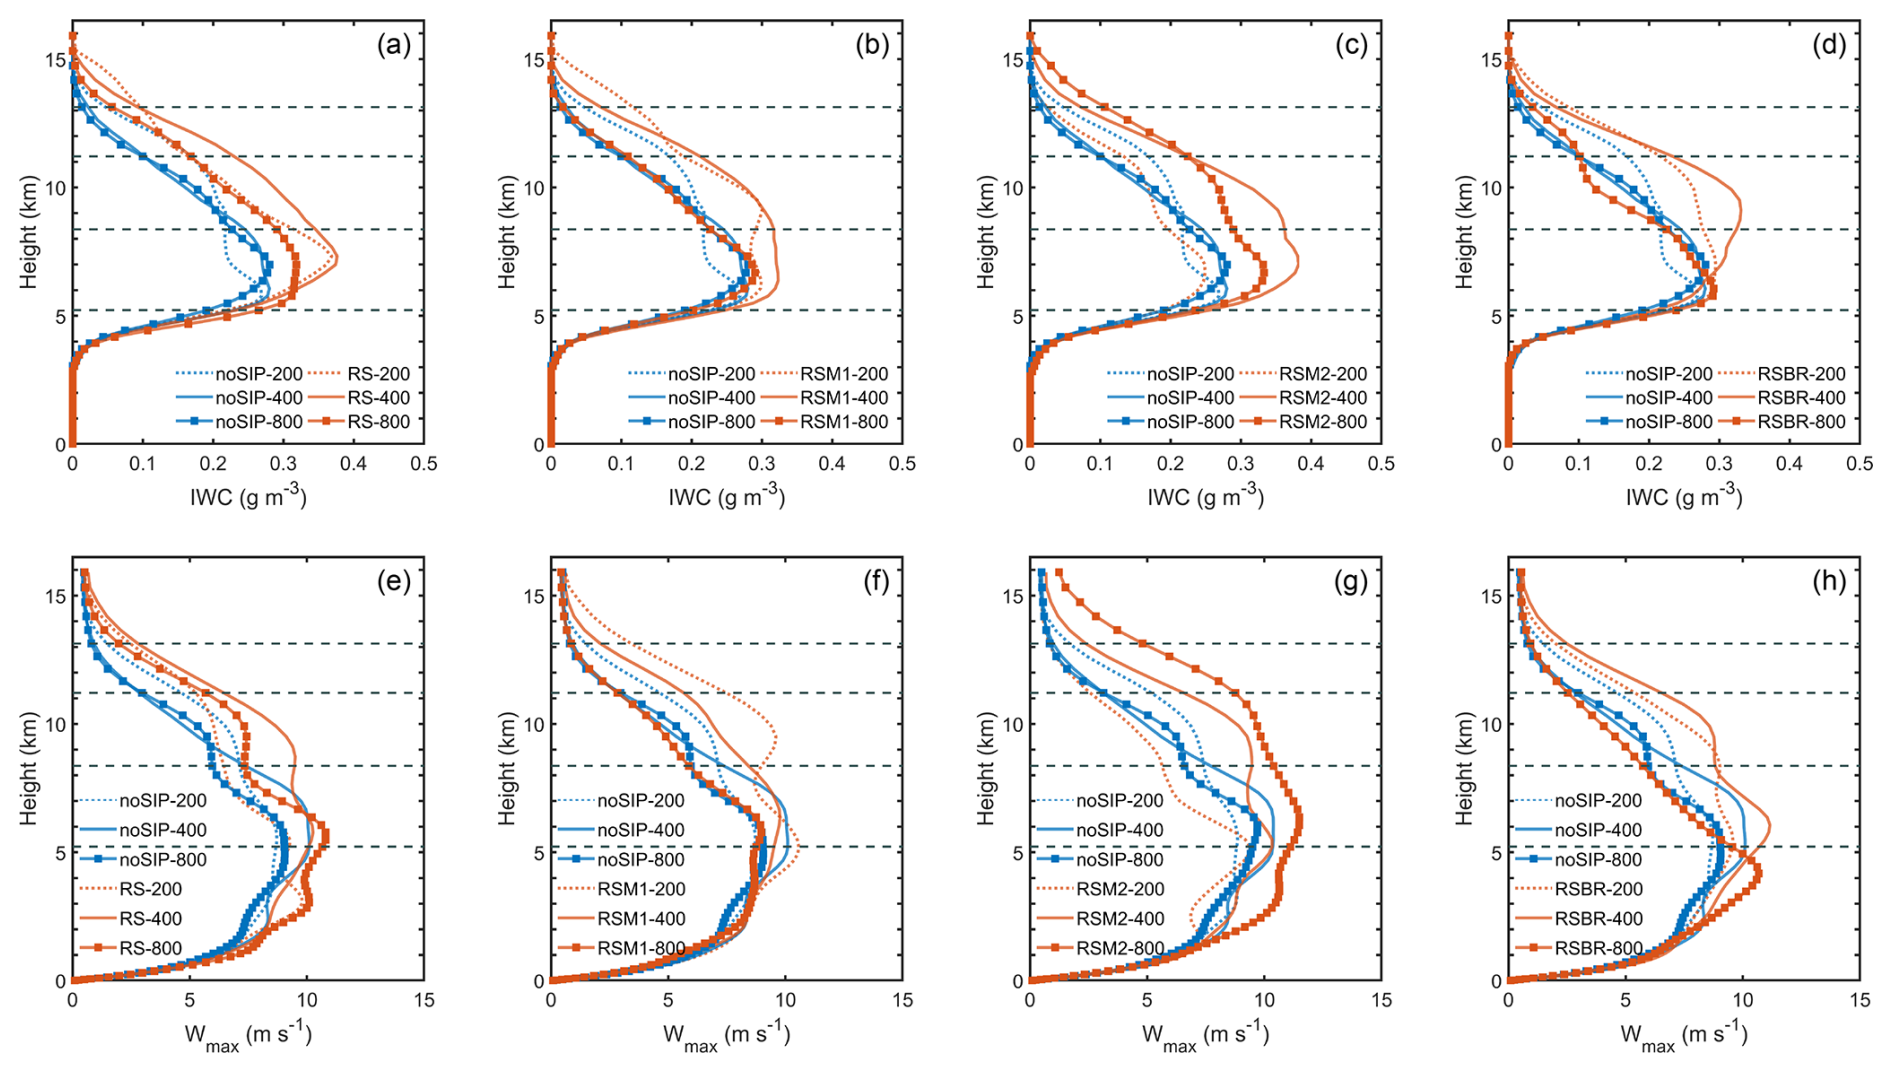
Figure 12Vertical profiles of horizontally averaged (a–d) ice water content (IWC) and (e–h) 95th percentile updraft velocity (Wmax) from simulations without SIP (noSIP) and with different SIP configurations: (a, e) RS, (b, f) RSM1, (c, g) RSM2, and (d, h) RSBR. Dotted lines denote Nd = 200 cm−3, solid lines denote Nd = 400 cm−3, and solid lines with square markers denote Nd = 800 cm−3. All profiles are averaged over regions with IWC > 0.01 g m−3 during 02:30–08:30 UTC on 6 February 2006. Gray dashed lines indicate the 0, −20, −40, and −60 °C isotherms.
The CCN sensitivity of ΔIWC depends on the mechanism. RSM1 peaks at Nd = 400 cm−3 with +0.12 g m−3 (+78.1 %), remains moderate at Nd = 200 cm−3 with +0.10 g m−3 (+47.4 %), and becomes weak at Nd = 800 cm−3 with +0.03 g m−3 (+14.1 %; Fig. 12b). RSM2 also peaks at Nd = 400 cm−3 with +0.17 g m−3 (+109.7 %), reduces to +0.08 g m−3 (+44.1 %) at Nd = 800 cm−3, and is weakest at Nd = 200 cm−3 with +0.03 g m−3 (+16.4 %; Fig. 12c). RS and RSBR produce large enhancements at Nd = 200 and 400 cm−3, approximately +0.13–0.16 g m−3 (+85 %–106 %), but weaker responses at Nd = 800 cm−3, approximately +0.06–0.08 g m−3 (+29 %–40 %; Fig. 12a, d, and Table 3).
CCN also modulates the altitude of the SIP-induced maxima (Fig. 12 and Table 3). For RSM1, the altitude of the ΔIWC maximum shifts from about 10 km at Nd ≤ 400 cm−3 to about 6 km at Nd = 800 cm−3. For RSM2, the maximum remains near 10 km at Nd ≥ 400 cm−3 but lowers to about 7 km at Nd = 200 cm−3. For RS and RSBR, the peak rises from about 7 km at Nd = 200 cm−3 to about 10 km at Nd = 400 cm−3. These vertical shifts are consistent with the stronger upper-level ice in the Nd = 400 cm−3 case and the weaker enhancement under polluted conditions, which helps explain the CCN dependence of the OLR reduction. Peak updraft response is weaker than the IWC response, with ΔWmax rarely exceeding 1.5 m s−1, and the largest Wmax occurring at RS-400 and RS-800, RSM1-200, RSM2-800, and RSBR-400 (Fig. 12e–h).

Figure 13Vertical profiles of horizontally averaged (a–d) ice crystal number concentration (Nice) and (e–h) ice crystal mean-mass radius from simulations without SIP (noSIP) and with different SIP configurations: (a, e) RS, (b, f) RSM1, (c, g) RSM2, and (d, h) RSBR. Dotted lines denote Nd = 200 cm−3, solid lines denote Nd = 400 cm−3, and solid lines with square markers denote Nd = 800 cm−3. All profiles are averaged over regions with IWC > 0.01 g m−3 during 02:30–08:30 UTC on 6 February 2006. Gray dashed lines indicate the 0, −20, −40, and −60 °C isotherms. Equivalent plots for cloud droplet and rain properties are shown in Figs. S3–S4 in the Supplement.
Microphysical diagnostics provide further detail. As shown in Fig. 13, for RS and RSBR, ice crystal number concentrations exhibit evident peaks (> 103 m−3) between 5 and 8 km, and the three CCN profiles are nearly overlapping, indicating limited aerosol sensitivity. In the same layer, ice crystal mean-mass radii range from ∼ 50–120 µm and show little variation with CCN (Fig. 13e, h). For RSM1, the three CCN profiles are close together between 5 and 7 km, while between 7 and 9 km the Nd = 800 cm−3 case is clearly weaker than the Nd = 200 and 400 cm−3 cases. RSM1 produces the largest crystal radii among the mechanisms, often ∼ 150–200 µm between 5 and 9 km, but these radii are nearly invariant with CCN. To test whether the suppression of RSM1 under polluted conditions arises from limited raindrop supply, we examine vertical profiles of cloud droplet and raindrop properties (Figs. S3–S4 in the Supplement), focusing on number concentrations and mean-mass radii from about 0 to −20 °C, corresponding to about 5–9 km in these simulations. As shown in Fig. S3, cloud droplets are primarily controlled by CCN rather than by the SIP configuration. Number concentrations increase from Nd = 200 to 800 cm−3, whereas mean-mass radii decrease with CCN. In contrast, differences between RSM1 and noSIP are minor compared with the CCN effect. The prevalence of numerous but smaller droplets under high CCN (Fig. S3) is consistent with slower collision–coalescence and delayed growth toward raindrop sizes, implying a source limitation for Mode 1 in the 0 to −20 °C layer. Raindrop fields show the corresponding signature for RSM1 (Fig. S4). Between 5–7 km, raindrop number concentration decreases with CCN, with the ordering Nd = 200 > 400 > 800 cm−3, while the radius is largest at Nd = 400 cm−3, smaller at Nd = 800 cm−3, and smallest at Nd = 200 cm−3. Between 7–9 km, the number concentration retains the same ordering, and the radius at Nd = 400 and 800 cm−3 is similar and both exceed that at Nd = 200 cm−3 (Fig. S4). The larger radii above 5 km at Nd = 400 and 800 cm−3 are consistent with the concentration of available liquid into fewer drops at higher levels and may be aided by the melting of ice-phase hydrometeors. Taken together, these patterns indicate that polluted conditions do not favor the availability of the supercooled raindrops required by Mode 1. Although raindrops are similar or larger at higher levels for Nd = 800 cm−3, their number and residence time in this layer are reduced, so the frequency of Mode 1 is lower. The reduced raindrop supply at Nd = 800 cm−3 also aligns with the weaker RSM1 ice production between 7–9 km (Fig. 13) and with the minimum ΔIWC reported for RSM1 at high CCN (Table 3). Collectively, these diagnostics support the interpretation that the suppression of RSM1 under polluted conditions arises from a warm-rain source limitation.

Figure 14Same as Fig. 13, but for (a–d) graupel number concentration (Ngraupel), and (e–h) graupel mean-mass radius.
For RSM2, the ice crystal number concentration shows little sensitivity to CCN below ∼ 7 km, whereas between 7 and 9 km it is highest at Nd = 400 cm−3, lower at Nd = 800 cm−3, and lowest at Nd = 200 cm−3 (Fig. 13c). Unlike Mode 1 (RSM1), Mode 2 (RSM2) relies on collisions between raindrops and large ice particles, such as graupel. Therefore, we examine graupel characteristics to assess the efficiency of Mode 2 under different CCN levels. As shown in Fig. 14, graupel number in 5–9 km exceeds noSIP and generally decreases with increasing CCN. The graupel radius is smallest at Nd = 200 cm−3 (∼ 240 µm) and larger at 400–800 cm−3 (∼ 400 µm) between 5 and 7 km, and this contrast remains at higher levels. Clean conditions (Nd = 200 cm−3) also promote earlier warm rain, reducing supercooled liquid at upper levels and limiting liquid–ice overlap with sufficiently large graupel. Together, smaller graupel and reduced overlap lower the likelihood of effective collisions and suppress Mode 2 efficiency. In contrast, at Nd = 400 cm−3, both liquid water and graupel size are more favorable, consistent with the ΔIWC maximum at Nd = 400 cm−3 and the minimum at Nd = 200 cm−3. Overall, Mode 2 is suppressed under clean conditions due to smaller graupel, weaker liquid–ice overlap, and the reduced likelihood of effective collisions.
4.1 SIP–CCN effects on radiation and precipitation
The experiments show that SIP alters the radiative and precipitation characteristics of the 6 February 2006 storm, but its impacts depend on CCN concentrations. Under moderate aerosol loading (Nd = 400 cm−3), SIP produces the largest reduction in outgoing longwave radiation (OLR), expansion of low-OLR anvil areas, and the strongest enhancement of organized precipitation. By contrast, SIP effects are weaker under clean (Nd = 200 cm−3) and polluted conditions (Nd = 800 cm−3), and the OSR response is overall modest and varies in sign with CCN. These results highlight a non-linear SIP–CCN influence on storm structure and radiative forcing.
Agreement between the reference simulation and the available observations (Sect. 3.1) does not exclude compensating errors. The observations constrain the storm-scale radiative, reflectivity and precipitation evolution and the upper-level ice field, but not the mixed-phase layer in which SIP operates. Offsetting biases in, for example, primary ice nucleation, raindrop freezing or aggregation therefore cannot be ruled out. The SIP responses diagnosed from the matched experiments should thus be interpreted as model responses relative to an observationally consistent reference state, rather than as validated estimates of SIP in the observed storm.
The underlying mechanisms can be linked to the modulation of cloud microphysics by CCN. At low CCN, large droplets form and precipitation develops early through warm-rain processes, depleting supercooled liquid water and leaving little available for SIP-induced ice growth. As a result, OLR reduction and precipitation changes are limited. At high CCN, numerous small droplets delay warm-rain processes and sustain supercooled liquid water at higher altitudes. The reduced collision–coalescence efficiency leads to the lowest accumulated rainfall in noSIP-800 among the three CCN levels (Fig. 9b). When SIP is activated, this additional supercooled liquid water provides a source for secondary ice production. In this case, the extra ice particles enhance riming and graupel formation, and subsequent melting increases surface rainfall, so allSIP-800 yields more rainfall than noSIP-800. The SIP-related increase remains smaller than at Nd = 400 cm−3, because at moderate CCN the mixed-phase layer contains a more favorable combination of supercooled liquid water, raindrops, and large rimed particles within the temperature ranges where the SIP mechanisms are active, allowing more efficient ice growth and melt out. At moderate CCN, the SIP mechanisms therefore act together most effectively, leading to stronger upper-level ice growth, thicker and more organized anvils, a larger reduction in OLR (Figs. 5, 7), and enhanced rainfall (Figs. 8, 9). Previous studies also suggest that SIP impacts on precipitation can depend strongly on the parameterization used, and may increase ice particle number while suppressing localized or heavy precipitation (e.g., Dedekind et al., 2021; Grzegorczyk et al., 2025b). Thus, SIP partly compensates for warm rain suppression under polluted conditions, but its strongest combined radiative and precipitation impact occurs at moderate CCN, where the microphysical environment most strongly supports secondary ice production and conversion to surface rainfall.
This non-linear response should also be interpreted in the context of the weak-CAPE environment of this case (CAPE ≈ 1010 J kg−1; Fig. 1b). With limited instability, the balance between warm-rain and ice-phase processes could be more sensitive to CCN perturbations. In contrast, our earlier pre-monsoon case (Sun et al., 2025), characterized by higher CAPE and stronger convection, showed larger reductions in OLR, stronger increases in OSR, and suppressed precipitation in allSIP compared to noSIP. This enhanced radiative signal arose from deeper and more persistent anvils formed under high CAPE. Vigorous updrafts transported large amounts of hydrometeors into the upper troposphere, strengthening both longwave cooling and shortwave reflection (Feng et al., 2011; Hartmann and Berry, 2017). At the same time, stronger glaciation converted more supercooled liquid water into ice particles, enhancing the formation of precipitation particles in the upper levels. However, much of this ice was retained in anvils or sublimates/melts before reaching the ground, leading to reduced surface rainfall despite greater ice production (Han et al., 2024; Grzegorczyk et al., 2025a). By contrast, in the weak-CAPE 6 February 2006 storm, OLR responses remain robust but OSR is only weakly affected (Figs. 5, 7). SIP enhances OSR at Nd = 400 cm−3, but this effect reverses at Nd = 200 cm−3 and nearly vanishes at Nd = 800 cm−3. This weak and non-monotonic OSR response likely reflects the combined influences of changes in anvil coverage, optical depth and particle size, and the timing of SIP-induced anvils relative to the maximum solar insolation. As a result, shortwave fluxes exhibit the SIP signal much less clearly than longwave cooling in this case. This behavior is consistent with Finney et al. (2025), who showed across 12 convective cases that changes in cloud droplet number, ice nucleating particles, and secondary ice configurations can modify anvil albedo and high cloud area, but that these shortwave responses are generally small compared with the case to case spread, highlighting the strong role of environmental variability and the need for caution when interpreting single case results. Meanwhile, precipitation increases in allSIP relative to noSIP (Figs. 8, 9). Under weak instability, cloud depth and anvil extent are limited compared to the high-CAPE case. SIP generates additional ice particles that likely promote riming and subsequent melting, which may provide an extra source of surface rainfall. This may help explain why SIP increases precipitation in the 6 February 2006 case, whereas the pre-monsoon case showed the opposite response.
These results underscore the importance of considering environmental conditions, such as CAPE, when assessing SIP-CCN interactions in tropical convection. Across both radiation and precipitation responses, the strongest enhancement consistently occurs under moderate CCN, indicating that SIP plays an important role in amplifying aerosol effects on tropical convection, particularly under weakly unstable environments.
4.2 Sensitivity to SIP mechanisms and model uncertainties
The aerosol response of secondary ice production is mechanism dependent and non-linear. RSM1 is suppressed under polluted conditions (Nd = 800 cm−3), RSM2 is inhibited under clean conditions (Nd = 200 cm−3), and RS together with RSBR show limited CCN sensitivity. The combined effect produces the strongest signals at moderate CCN (Nd = 400 cm−3), including enhanced upper-level ice, higher peak updrafts, and the largest reduction of outgoing longwave radiation (Figs. 12–14; Table 3).
For RSM1, the diagnostics indicate a limitation in the warm-branch supply. Mode 1 depends on the freezing of supercooled raindrops and their collisions with small ice particles. Under high CCN, cloud droplets are more numerous and smaller, collision–coalescence proceeds more slowly, and the delivery of raindrops into the 0 to −20 °C layer is reduced. Consistently, RSM1 exhibits less ice number between 7 and 9 km and the smallest ΔIWC at Nd = 800 cm−3, while crystal sizes remain nearly unchanged across CCN levels (Fig. 13; Table 3).
For RSM2, Mode 2 depends on encounters between raindrops and large rimed ice particles. In clean conditions, warm rain forms and precipitation begins earlier, which limits the overlap of supercooled liquid and large ice in the 7–9 km layer. The diagnostics show the lowest upper-level ice number and the smallest graupel radii at Nd = 200 cm−3, whereas moderate to high CCN maintains larger graupel and stronger upper-level ice production, with ΔIWC maximized at Nd = 400 cm−3 (Fig. 14; Table 3).
Our simulations further demonstrate that the allSIP configuration produces the strongest enhancement at moderate CCN (Nd = 400 cm−3). This non-linear behavior reflects the need for supercooled raindrops and sufficiently large rimed ice to co-exist within the mixed-phase layer. Under clean and polluted conditions, one of the droplet-shattering pathways is limited: Mode 1 at high CCN due to the reduced supply of supercooled raindrops, and Mode 2 at low CCN because collisions with large rimed ice particles are less frequent in the mixed-phase layer. At moderate CCN, supercooled liquid is available, and raindrops occur with larger rimed ice, allowing Mode 1 and Mode 2 to operate concurrently on top of the relatively CCN-insensitive RS and BR processes. As a result, the combined SIP contribution is largest at intermediate aerosol loading, yielding the greatest ΔIWC and clear dynamical and radiative responses (Figs. 7, 9, 10). This peak at intermediate aerosol loading is consistent with previous observational and modeling studies (Rosenfeld et al., 2008; Fan et al., 2016), and our results identify SIP as a process pathway that helps produce this non-linear CCN dependence. This response likely arises because the amounts of supercooled liquid water and rimed ice, which are controlled by Nd, do not change in a simple way across the temperature ranges where each SIP mechanism is most active. Different SIP parameterizations, with other temperature ranges or production rates, could change this relationship and in some cases produce a more monotonic response to Nd. However, the general result that aerosol control of liquid and ice in the mixed-phase layer affects the strength of SIP is expected to remain.
Beyond this CCN dependence, our results also indicate that droplet shattering mechanisms (Mode 1 and Mode 2) contribute more strongly to ice production than ice–ice collisional breakup (BR). This suggests that interactions between raindrops and ice particles can play an important role in sustaining secondary ice production under the simulated conditions. However, Grzegorczyk et al. (2025c) found that BR and RS were the most effective SIP mechanisms in reproducing ice numbers in deep convection, while droplet shattering played a minor role. Previous tagging-tracer analyses in continental deep convection also found a dominant contribution from BR to total ice number, whereas droplet shattering contributed comparatively less (e.g., Waman et al., 2022). Part of this difference may arise from differences in the microphysics schemes, as well as from the environmental conditions in our simulations, where graupel sizes and collision energies are relatively modest (Sun et al., 2025), limiting the efficiency of BR. One specific example is the treatment of raindrop freezing in the two modeling systems. UM-CASIM employs a formulation based on Bigg (1953) with modified parameter values, which is represented separately from the heterogeneous ice nucleation scheme and is not explicitly linked to INP activity. This treatment affects the number of freezing raindrops and graupel particles formed in the mixed phase region where droplet shattering can occur. This differs from recent approaches in which raindrop freezing is related to INP concentrations, such as Waman et al. (2022). In comparison, the bin microphysics model DESCAM uses the original Bigg (1953) scheme (Grzegorczyk et al., 2025c), which tends to produce fewer freezing raindrops (e.g., Morrison et al., 2005; Fan et al., 2009; Sullivan et al., 2018) and thus fewer opportunities for droplet shattering, so that BR and RS account for a larger share of the simulated secondary ice. A further uncertainty concerns the representation of heterogeneous ice nucleation. In the present study, this follows Cooper (1986) and may affect the relative enhancement attributed to SIP. The magnitude of the simulated SIP contribution should therefore be interpreted with caution. Environmental differences, such as CAPE and liquid water content, may also contribute to the SIP responses. These results highlight the uncertainties in quantifying the relative importance of SIP mechanisms. Consistent parameterizations and further observational constraints are still needed to separate the contributions of droplet shattering and collisional breakup in deep convective clouds.
This study examines how secondary ice production (SIP) interacts with aerosol loading to affect tropical convection, using the 6 February 2006 Darwin storm as a weak-CAPE case. The results show that SIP significantly alters cloud radiative properties, precipitation characteristics, and storm microphysics, with the strongest effects occurring at moderate aerosol concentrations (Nd = 400 cm−3). A reference simulation including all SIP mechanisms at Nd = 400 cm−3 reproduces the main observed features of the storm, including the timing and location of convection, the depth of the radar echoes, the peak rainfall rate and the upper-level ice properties, although it underestimates accumulated rainfall and does not reproduce the observed OLR evolution exactly.
Microphysically, SIP substantially enhances the ice phase. At Nd = 400 cm−3, ice crystal number concentration (Nice) exceeds 3 × 10³ m−3 at temperatures warmer than −10 °C, more than three orders of magnitude above noSIP. Ice crystals also grow larger, with mean-mass radii exceeding 100 µm, and ice water content (IWC) increases by up to 121.7 %. The diagnosed snow response to SIP remains weak in this case, even though these changes could potentially favor conversion to snow. Relative to the corresponding noSIP runs, graupel number concentration increases at all CCN levels, although the graupel radius decreases due to enhanced competition for liquid water. These changes strengthen latent heating and vertical motion, with the strongest updrafts (Wmax = 12.6 m s−1) at Nd = 400 cm−3, compared with 10.5 m s−1 at Nd = 800 cm−3 and 9.1 m s−1 at Nd = 200 cm−3.
At the macroscale, SIP enhances both radiation and precipitation responses, but primarily under moderate aerosol loading. At Nd = 400 cm−3, SIP reduces outgoing longwave radiation (OLR) by 6.86 W m−2 (−2.5 %) and expands the low-OLR cloud cover by ∼ 25 %–30 %. In contrast, the OLR response is weaker and spatially fragmented at Nd = 800 cm−3 (−3.34 W m−2, −1.2 %), and small and of opposite sign at Nd = 200 cm−3 (+0.61 W m−2, +0.2 %). Changes in outgoing shortwave radiation (OSR) are smaller and vary in sign, with a clear increase only at Nd = 400 cm−3 (+7.95 W m−2).
SIP also reorganizes rainfall patterns. At Nd = 400 cm−3, rainfall becomes more organized, producing stronger and more concentrated precipitation patterns. The domain-averaged peak rainfall rate rises from 0.80 to 1.35 mm h−1, and total accumulation increases by ∼ 25 %. At Nd = 800 cm−3, rainfall becomes more spatially fragmented, and at Nd = 200 cm−3 the impact is small or negative, with peak rainfall rate suppressed.
Sensitivity experiments show distinct CCN responses among SIP mechanisms. RSM1 (RS + Mode 1) is most active at moderate CCN (ΔIWC = +0.12 g m−3 at Nd = 400 cm−3) but weakens at high CCN (+0.03 g m−3 at Nd = 800 cm−3), owing to a reduced supply of supercooled raindrops in the mixed-phase layer. RSM2 (RS + Mode 2) is strongest at moderate CCN (ΔIWC = +0.17 g m−3 at Nd = 400 cm−3), but weakens at lower CCN (+0.03 g m−3 at Nd = 200 cm−3), where collisions with larger rimed ice particles are less frequent. RS and RSBR are relatively less sensitive to CCN. Their combined contribution peaks at intermediate CCN, producing the largest ΔIWC and clear dynamical and radiative responses.
Nevertheless, the CCN sensitivity of individual SIP mechanisms remains uncertain, owing to differences in the adopted parameterizations, microphysical assumptions in the model, and environmental conditions. In addition, the physical understanding and representations of SIP processes are still subject to substantial uncertainty and ongoing debate. The available aircraft observations provide a useful constraint on upper anvil ice but do not directly constrain ice multiplication within the mixed-phase region. Future work should combine targeted modelling with co-located in situ aircraft measurements in the mixed-phase region, particularly of ice particle number concentration and particle size distributions, to evaluate the modelled ice-phase properties and constrain SIP responses across aerosol regimes.
The simulation data in this study are archived on the UK Met Office MASS system (suite ID: u-dh136) and accessible via the JASMIN platform (http://www.jasmin.ac.uk/, last access: 15 September 2026). The CASIM microphysics code with the integrated SIP parameterizations is hosted on the Met Office Science Repository Service (MOSRS): https://code.metoffice.gov.uk/trac/monc/log/casim/branches/dev/mengyusun/r10208_SIP_rep (last access: 15 September 2026, login required).
The supplement related to this article is available online at https://doi.org/10.5194/acp-26-15349-2026-supplement.
MS and PJC formulated the research objectives and designed the experiments. PRF provided advice on SIP mechanism analysis and supported the UM-CASIM configuration. MS performed the simulations and analysis with input from PRF, DLF, and AMB. MS prepared the manuscript with contributions from all co-authors.
The contact author has declared that none of the authors has any competing interests.
Publisher's note: Copernicus Publications remains neutral with regard to jurisdictional claims made in the text, published maps, institutional affiliations, or any other geographical representation in this paper. The authors bear the ultimate responsibility for providing appropriate place names. Views expressed in the text are those of the authors and do not necessarily reflect the views of the publisher.
We acknowledge the Met Office and NERC for providing access to the Monsoon high-performance computing facility. Data storage and processing were supported by the UK Centre for Environmental Data Analysis (CEDA) via the JASMIN platform (Lawrence et al., 2013).
This research has been supported by the Natural Environment Research Council (grant no. NE/T006420/1) and the EU Horizon Europe programme (grant no. 101137680).
This paper was edited by Greg McFarquhar and reviewed by two anonymous referees.
Bigg, E. K.: The formation of atmospheric ice crystals by the freezing of droplets, Q. J. R. Meteorol. Soc., 79, 510–519, https://doi.org/10.1002/qj.49707934207, 1953.
Bony, S., Stevens, B., Frierson, D. M. W., Jakob, C., Kageyama, M., Pincus, R., Shepherd, T. G., Sherwood, S. C., Siebesma, A. P., Sobel, A. H., Watanabe, M., and Webb, M. J.: Clouds, circulation and climate sensitivity, Nat. Geosci., 8, 261–268, https://doi.org/10.1038/ngeo2398, 2015.
Boutle, I. A., Eyre, J. E. J., and Lock, A. P.: Seamless stratocumulus simulation across the turbulent gray zone, Mon. Weather Rev., 142, 1655–1668, https://doi.org/10.1175/MWR-D-13-00229.1, 2014.
Bush, M., Boutle, I., Edwards, J., Finnenkoetter, A., Franklin, C., Hanley, K., Jayakumar, A., Lewis, H., Lock, A., Mittermaier, M., Mohandas, S., North, R., Porson, A., Roux, B., Webster, S., and Weeks, M.: The second Met Office Unified Model–JULES Regional Atmosphere and Land configuration, RAL2, Geosci. Model Dev., 16, 1713–1734, https://doi.org/10.5194/gmd-16-1713-2023, 2023.
Bush, M., Flack, D. L. A., Lewis, H. W., Bohnenstengel, S. I., Short, C. J., Franklin, C., Lock, A. P., Best, M., Field, P., McCabe, A., Van Weverberg, K., Berthou, S., Boutle, I., Brooke, J. K., Cole, S., Cooper, S., Dow, G., Edwards, J., Finnenkoetter, A., Furtado, K., Halladay, K., Hanley, K., Hendry, M. A., Hill, A., Jayakumar, A., Jones, R. W., Lean, H., Lee, J. C. K., Malcolm, A., Mittermaier, M., Mohandas, S., Moore, S., Morcrette, C., North, R., Porson, A., Rennie, S., Roberts, N., Roux, B., Sanchez, C., Su, C.-H., Tucker, S., Vosper, S., Walters, D., Warner, J., Webster, S., Weeks, M., Wilkinson, J., Whitall, M., Williams, K. D., and Zhang, H.: The third Met Office Unified Model–JULES Regional Atmosphere and Land Configuration, RAL3, Geosci. Model Dev., 18, 3819–3855, https://doi.org/10.5194/gmd-18-3819-2025, 2025.
Connolly, P. J., Vaughan, G., May, P. T., Chemel, C., Allen, G., Choularton, T. W., Gallagher, M. W., Bower, K. N., Crosier, J. and Dearden, C.: Can aerosols influence deep tropical convection? Aerosol indirect effects in the Hector island thunderstorm, Q. J. R. Meteorol. Soc., 139, 2190–2208, https://doi.org/10.1002/qj.2083, 2013.
Cooper, W. A.: Ice Initiation in Natural Clouds, Meteor. Mon., 43, 29–32, https://doi.org/10.1175/0065-9401-21.43.29, 1986.
Dedekind, Z., Lauber, A., Ferrachat, S., and Lohmann, U.: Sensitivity of precipitation formation to secondary ice production in winter orographic mixed-phase clouds, Atmos. Chem. Phys., 21, 15115–15134, https://doi.org/10.5194/acp-21-15115-2021, 2021.
Dye, J. E. and Hobbs, P. V.: The influence of environmental parameters on the freezing and fragmentation of suspended water drops, J. Atmos. Sci., 25, 82–96, https://doi.org/10.1175/1520-0469(1968)025<0082:TIOEPO>2.0.CO;2, 1968.
Edwards, J. M. and Slingo, A.: Studies with a flexible new radiation code. I: Choosing a configuration for a large-scale model, Q. J. R. Meteorol. Soc., 122, 689–719, https://doi.org/10.1002/qj.49712253107, 1996.
Fan, J., Ovtchinnikov, M., Comstock, J. M., McFarlane, S. A., and Khain, A.: Ice formation in Arctic mixed-phase clouds: Insights from a 3-D cloud-resolving model with size-resolved aerosol and cloud microphysics, J. Geophys. Res., 114, D04205, https://doi.org/10.1029/2008JD010782, 2009.
Fan, J., Wang, Y., Rosenfeld, D., and Liu, X.: Review of Aerosol–Cloud Interactions: Mechanisms, Significance, and Challenges, J. Atmos. Sci., 73, 4221–4252, https://doi.org/10.1175/JAS-D-16-0037.1, 2016.
Feng, Z., Dong, X., Xi, B., Schumacher, C., Minnis, P., and Khaiyer, M.: Top-of-atmosphere radiation budget of convective core/stratiform rain and anvil clouds from deep convective systems, J. Geophys. Res., 116, D23202, https://doi.org/10.1029/2011JD016451, 2011.
Field, P. R., Lawson, R. P., Brown, P. R. A., Lloyd, G., Westbrook, C., Moisseev, D., Miltenberger, A., Nenes, A., Blyth, A., Choularton, T., Connolly, P., Buehl, J., Crosier, J., Cui, Z., Dearden, C., DeMott, P., Flossmann, A., Heymsfield, A., Huang, Y., Kalesse, H., Kanji, Z. A., Korolev, A., Kirchgaessner, A., Lasher-Trapp, S., Leisner, T., McFarquhar, G., Phillips, V., Stith, J., and Sullivan, S.: Chapter 7. Secondary Ice Production- current state of the science and recommendations for the future, Meteor. Mon., https://doi.org/10.1175/amsmonographs-d-16-0014.1, 2017.
Field, P. R., Hill, A., Shipway, B., Furtado, K., Wilkinson, J., Miltenberger, A., Gordon, H., Grosvenor D. P., Stevens, R., and Van Weverberg, K.: Implementation of a double moment cloud microphysics scheme in the UK met office regional numerical weather prediction model, Q. J. R. Meteorol. Soc., 149, 703–739, https://doi.org/10.1002/qj.4414, 2023.
Finney, D. L., Blyth, A. M., Field, P. R., Daily, M. I., Murray, B. J., Sun, M., Connolly, P. J., Cui, Z., and Böing, S.: Microphysical fingerprints in anvil cloud albedo, Atmos. Chem. Phys., 25, 10907–10929, https://doi.org/10.5194/acp-25-10907-2025, 2025.
Fueglistaler, S., Dessler, A. E., Dunkerton, T. J., Folkins, I., Fu, Q., and Mote, P. W.: Tropical tropopause layer, Rev. Geophys., 47, RG1004, https://doi.org/10.1029/2008RG000267, 2009.
Grabowski, W. W.: Untangling microphysical impacts on deep convection applying a novel modeling methodology, J. Atmos. Sci., 72, 2446–2464, https://doi.org/10.1175/JAS-D-14-0307.1, 2015.
Grabowski, W. W. and Morrison, H.: Do Ultrafine Cloud Condensation Nuclei Invigorate Deep Convection?, J. Atmos. Sci., 77, 2567–2583, https://doi.org/10.1175/JAS-D-20-0012.1, 2020.
Grzegorczyk, P., Yadav, S., Zanger, F., Theis, A., Mitra, S. K., Borrmann, S., and Szakáll, M.: Fragmentation of ice particles: laboratory experiments on graupel–graupel and graupel–snowflake collisions, Atmos. Chem. Phys., 23, 13505–13521, https://doi.org/10.5194/acp-23-13505-2023, 2023.
Grzegorczyk, P., Wobrock, W., Canzi, A., Niquet, L., Tridon, F., and Planche, C.: Investigating secondary ice production in a deep convective cloud with a 3D bin microphysics model: Part II – Effects on the cloud formation and development, Atmos. Res., 314, 107797, https://doi.org/10.1016/j.atmosres.2024.107797, 2025a.
Grzegorczyk, P., Wobrock, W., Dziduch, A., and Planche, C.: Influence of secondary ice production on cloud and rain properties: analysis of the HYMEX IOP7a heavy-precipitation event, Atmos. Chem. Phys., 25, 10403–10420, https://doi.org/10.5194/acp-25-10403-2025, 2025b.
Grzegorczyk, P., Wobrock, W., Canzi, A., Niquet, L., Tridon, F., and Planche, C.: Investigating secondary ice production in a deep convective cloud with a 3D bin microphysics model: Part I – Sensitivity study of microphysical processes representations, Atmos. Res., 313, 107774, https://doi.org/10.1016/j.atmosres.2024.107774, 2025c.
Hallett, J. and Mossop, S. C.: Production of secondary ice particles during the riming process, Nature, 249, 26–28, https://doi.org/10.1038/249026a0, 1974.
Han, C., Hoose, C., and Dürlich, V.: Secondary Ice Production in Simulated Deep Convective Clouds: A Sensitivity Study, J. Atmos. Sci., 81, 903–921, https://doi.org/10.1175/jas-d-23-0156.1, 2024.
Hartmann, D. L. and Berry, S. E.: The balanced radiative effect of tropical anvil clouds, J. Geophys. Res.-Atmos., 122, 5003–5020, https://doi.org/10.1002/2017JD026460, 2017.
Hawker, R. E., Miltenberger, A. K., Wilkinson, J. M., Hill, A. A., Shipway, B. J., Cui, Z., Cotton, R. J., Carslaw, K. S., Field, P. R., and Murray, B. J.: The temperature dependence of ice-nucleating particle concentrations affects the radiative properties of tropical convective cloud systems, Atmos. Chem. Phys., 21, 5439–5461, https://doi.org/10.5194/acp-21-5439-2021, 2021a.
Hawker, R. E., Miltenberger, A. K., Johnson, J. S., Wilkinson, J. M., Hill, A. A., Shipway, B. J., Field, P. R., Murray, B. J., and Carslaw, K. S.: Model emulation to understand the joint effects of ice-nucleating particles and secondary ice production on deep convective anvil cirrus, Atmos. Chem. Phys., 21, 17315–17343, https://doi.org/10.5194/acp-21-17315-2021, 2021b.
Hobbs, P. V. and Rangno, A. L.: Ice Particle Concentrations in Clouds, J. Atmos. Sci., 42, 2523–2549, https://doi.org/10.1175/1520-0469(1985)042<2523:IPCIC>2.0.CO;2, 1985.
Houze Jr., R. A.: Mesoscale convective systems, Rev. Geophys., 42, RG4003, https://doi.org/10.1029/2004RG000150, 2004.
Huang, S., Yang, J., Li, J., Chen, Q., Zhang, Q., and Guo, F.: Impact of secondary ice production on thunderstorm electrification under different aerosol conditions, Atmos. Chem. Phys., 25, 1831–1850, https://doi.org/10.5194/acp-25-1831-2025, 2025.
Huang, Y., Wu, W., McFarquhar, G. M., Xue, M., Morrison, H., Milbrandt, J., Korolev, A. V., Hu, Y., Qu, Z., Wolde, M., Nguyen, C., Schwarzenboeck, A., and Heckman, I.: Microphysical processes producing high ice water contents (HIWCs) in tropical convective clouds during the HAIC-HIWC field campaign: dominant role of secondary ice production, Atmos. Chem. Phys., 22, 2365–2384, https://doi.org/10.5194/acp-22-2365-2022, 2022.
Jackson, R., Collis, S., Louf, V., Protat, A., Wang, D., Giangrande, S., Thompson, E. J., Dolan, B., and Powell, S. W.: The development of rainfall retrievals from radar at Darwin, Atmos. Meas. Tech., 14, 53–69, https://doi.org/10.5194/amt-14-53-2021, 2021.
James, R. L., Phillips, V. T. J., and Connolly, P. J.: Secondary ice production during the break-up of freezing water drops on impact with ice particles, Atmos. Chem. Phys., 21, 18519–18530, https://doi.org/10.5194/acp-21-18519-2021, 2021.
James, R. L., Crosier, J., and Connolly, P. J.: A bin microphysics parcel model investigation of secondary ice formation in an idealised shallow convective cloud, Atmos. Chem. Phys., 23, 9099–9121, https://doi.org/10.5194/acp-23-9099-2023, 2023.
Khain, A., Rosenfeld, D., and Pokrovsky, A.: Aerosol impact on the dynamics and microphysics of deep convective clouds, Q. J. R. Meteorol. Soc., 131, 2639–2663, https://doi.org/10.1256/qj.04.62, 2005.
Korolev, A. and Leisner, T.: Review of experimental studies of secondary ice production, Atmos. Chem. Phys., 20, 11767–11797, https://doi.org/10.5194/acp-20-11767-2020, 2020.
Ladino, L. A., Korolev, A., Heckman, I., Wolde, M., Fridlind, A. M., and Ackerman, A. S.: On the role of ice-nucleating aerosol in the formation of ice particles in tropical mesoscale convective systems, Geophys. Res. Lett., 44, 1574–1582, https://doi.org/10.1002/2016GL072455, 2017.
Lauber, A., Kiselev, A., Pander, T., Handmann, P., and Leisner, T.: Secondary Ice Formation during Freezing of Levitated Droplets, J. Atmos. Sci., 75, 2815–2826, https://doi.org/10.1175/jas-d-18-0052.1, 2018.
Lawrence, B. N., Bennett, V. L., Churchill, J., Juckes, M., Kershaw, P., Pascoe, S., Pepler, S., Pritchard, M., and Stephens, A.: Storing and manipulating environmental big data with JASMIN, in: 2013 IEEE International Conference on Big Data, 68–75, https://doi.org/10.1109/BigData.2013.6691556, 2013.
Lock, A. P., Brown, A. R., Bush, M. R., Martin, G. M., and Smith, R. N. B.: A New Boundary Layer Mixing Scheme. Part I: Scheme Description and Single-Column Model Tests, Mon. Weather Rev., 128, 3187–3199, https://doi.org/10.1175/1520-0493(2000)128<3187:ANBLMS>2.0.CO;2, 2000.
Louf, V., Protat, A., Warren, R. A., Collis, S. M., Wolff, D. B., Raunyiar, S., Jakob, C., and Petersen, W. A.: An Integrated Approach to Weather Radar Calibration and Monitoring Using Ground Clutter and Satellite Comparisons, J. Atmos. Ocean. Tech., 36, 17–39, https://doi.org/10.1175/JTECH-D-18-0007.1, 2019.
Manners, J., Edwards, J. M., Hill, P., and Thelen, J.-C.: Socrates Technical Guide: Suite Of Community RAdiative Transfer codes based on Edwards and Slingo, Tech. rep., Met Office, Exeter, UK, https://github.com/MetOffice/socrates/releases/download/um13.7/socrates_techguide.pdf (last access: 16 September 2026), 2024.
May, P. T., Mather, J. H., Vaughan, G., Jakob, C., McFarquhar, G. M., Bower, K. N., and Mace, G. G.: The Tropical Warm Pool International Cloud Experiment. B. Am. Meteorol. Soc., 89, 629–646, https://doi.org/10.1175/BAMS-89-5-629, 2008.
Miltenberger, A. K., Field, P. R., Hill, A. H., and Heymsfield, A. J.: Vertical redistribution of moisture and aerosol in orographic mixed-phase clouds, Atmos. Chem. Phys., 20, 7979–8001, https://doi.org/10.5194/acp-20-7979-2020, 2020.
Morrison, H., Shupe, M. D., Pinto, J. O., and Curry, J. A.: Possible roles of ice nucleation mode and ice nuclei depletion in the extended lifetime of Arctic mixed-phase clouds, Geophys. Res. Lett., 32, L18801, https://doi.org/10.1029/2005GL023614, 2005.
Morrison, H., van Lier-Walqui, M., Fridlind, A. M., Grabowski, W. W., Harrington, J. Y., Hoose, C., Korolev, A., Kumjian, M. R., Milbrandt, J. A., Pawlowska, H., Posselt, D. J., Prat, O. P., Reimel, K. J., Shima, S., van Diedenhoven, B., and Xue, L.: Confronting the challenge of modeling cloud and precipitation microphysics, J. Adv. Model. Earth Syst., 12, e2019MS001689, https://doi.org/10.1029/2019MS001689, 2020.
Mossop, S. C.: Secondary ice particle production during rime growth: The effect of drop size distribution and rimer velocity, Q. J. R. Meteorol. Soc., 111, 1113–1124, https://doi.org/10.1002/qj.49711147012, 1985.
NASA: Shuttle Radar Topography Mission (SRTM) Global, distributed by OpenTopography, https://doi.org/10.5069/G9445JDF, 2013.
Oraltay, R. G. and Hallett, J.: Evaporation and melting of ice crystals: A laboratory study, Atmos. Res., 24, 169–189, https://doi.org/10.1016/0169-8095(89)90044-6, 1989.
Phillips, V. T. J. and Patade, S.: Multiple Environmental Influences on the Lightning of Cold-Based Continental Convection. Part II: Sensitivity Tests for Its Charge Structure and Land–Ocean Contrast, J. Atmos. Sci., 79, 263–300, https://doi.org/10.1175/JAS-D-20-0234.1, 2022.
Phillips, V. T. J., Yano, J.-I., Formenton, M., Ilotoviz, E., Kanawade, V., Kudzotsa, I., Sun, J., Bansemer, A., Detwiler, A. G., Khain, A., and Tessendorf, S. A.: Ice Multiplication by Breakup in Ice–Ice Collisions. Part II: Numerical Simulations, J. Atmos. Sci., 74, 2789–2811, https://doi.org/10.1175/jas-d-16-0223.1, 2017a.
Phillips, V. T. J., Yano, J.-I., and Khain, A.: Ice Multiplication by Breakup in Ice–Ice Collisions. Part I: Theoretical Formulation, J. Atmos. Sci., 74, 1705–1719, https://doi.org/10.1175/JAS-D-16-0224.1, 2017b.
Phillips, V. T. J., Patade, S., Gutierrez, J., and Bansemer, A.: Secondary Ice Production by Fragmentation of Freezing Drops: Formulation and Theory, J. Atmos. Sci., 76, 3031–3070, https://doi.org/10.1175/JAS-D-17-0190.1, 2018.
Qu, Y., Khain, A., Phillips, V., Ilotoviz, E., Shpund, J., Patade, S., and Chen, B.: The role of ice splintering on microphysics of deep convective clouds forming under different aerosol conditions: Simulations using the model with spectral bin microphysics, J. Geophys. Res., 125, e2019JD031312, https://doi.org/10.1029/2019JD031312, 2020.
Qu, Z., Korolev, A., Milbrandt, J. A., Heckman, I., Huang, Y., McFarquhar, G. M., Morrison, H., Wolde, M., and Nguyen, C.: The impacts of secondary ice production on microphysics and dynamics in tropical convection, Atmos. Chem. Phys., 22, 12287–12310, https://doi.org/10.5194/acp-22-12287-2022, 2022.
Rosenfeld, D. and Woodley, W. L.: Deep convective clouds with sustained supercooled liquid water down to −37.5 °C, Nature, 405, 440–442, https://doi.org/10.1038/35013030, 2000.
Rosenfeld, D., Lohmann, U., Raga, G. B., O'Dowd, C. D., Kulmala, M., Fuzzi, S., Reissell, A., and Andreae, M. O.: Flood or Drought: How Do Aerosols Affect Precipitation?, Science, 321, 1309–1313, https://doi.org/10.1126/science.1160606, 2008.
Rotstayn, L. D.: A physically based scheme for the treatment of stratiform clouds and precipitation in large-scale models. I: Description and evaluation of the microphysical processes, Q. J. R. Meteorol. Soc., 123, 1227–1282, https://doi.org/10.1002/qj.49712354106, 1997.
Sherwood, S. C., Bony, S., and Dufresne, J.-L.: Spread in model climate sensitivity traced to atmospheric convective mixing, Nature, 505, 37–42, https://doi.org/10.1038/nature12829, 2014.
Sotiropoulou, G., Sullivan, S., Savre, J., Lloyd, G., Lachlan-Cope, T., Ekman, A. M. L., and Nenes, A.: The impact of secondary ice production on Arctic stratocumulus, Atmos. Chem. Phys., 20, 1301–1316, https://doi.org/10.5194/acp-20-1301-2020, 2020.
Sullivan, S. C., Barthlott, C., Crosier, J., Zhukov, I., Nenes, A., and Hoose, C.: The effect of secondary ice production parameterization on the simulation of a cold frontal rainband, Atmos. Chem. Phys., 18, 16461–16480, https://doi.org/10.5194/acp-18-16461-2018, 2018.
Sun, M., Liu, D., Qie, X., Mansell, E. R., Yair, Y., Fierro, A. O., Yuan, S., Chen, Z., and Wang, D.: Aerosol effects on electrification and lightning discharges in a multicell thunderstorm simulated by the WRF-ELEC model, Atmos. Chem. Phys., 21, 14141–14158, https://doi.org/10.5194/acp-21-14141-2021, 2021.
Sun, M., Li, Z., Wang, T., Mansell, E. R., Qie, X., Shan, S., Liu, D., and Cribb, M.: Understanding the effects of aerosols on electrification and lightning polarity in an idealized supercell thunderstorm via model emulation, J. Geophys. Res.-Atmos., 129, e2023JD039251, https://doi.org/10.1029/2023JD039251, 2024.
Sun, M., Connolly, P. J., Field, P. R., Finney, D. L., and Blyth, A. M.: Influence of secondary ice formation on tropical deep convective clouds simulated by the Unified Model, Atmos. Chem. Phys., 25, 18549–18569, https://doi.org/10.5194/acp-25-18549-2025, 2025.
Van Weverberg, K., Morcrette, C. J., Boutle, I., Furtado, K., and Field, P. R.: A Bimodal Diagnostic Cloud Fraction Parameterization. Part I: Motivating Analysis and Scheme Description, Mon. Weather Rev., 149, 841–857, https://doi.org/10.1175/MWR-D-20-0224.1, 2021.
Varble, A. C., Igel, A. L., Morrison, H., Grabowski, W. W., and Lebo, Z. J.: Opinion: A critical evaluation of the evidence for aerosol invigoration of deep convection, Atmos. Chem. Phys., 23, 13791–13808, https://doi.org/10.5194/acp-23-13791-2023, 2023.
Vardiman, L.: The Generation of Secondary Ice Particles in Clouds by Crystal–Crystal Collision, J. Atmos. Sci., 35, 2168–2180, https://doi.org/10.1175/1520-0469(1978)035<2168:TGOSIP>2.0.CO;2, 1978.
Vaughan, G., Schiller, C., MacKenzie, A. R., Bower, K., Peter, T., Schlager, H., Harris, N. R. P., and May, P. T.: SCOUT-O3/ACTIVE high-altitude aircraft measurements around deep tropical convection, B. Am. Meteorol. Soc., 89, 647–662, https://doi.org/10.1175/BAMS-89-5-647, 2008.
Waman, D., Patade, S., Jadav, A., Deshmukh, A., Gupta, A. K., Phillips, V. T. J., Bansemer, A., and DeMott, P. J.: Dependencies of Four Mechanisms of Secondary Ice Production on Cloud-Top Temperature in a Continental Convective Storm, J. Atmos. Sci., 79, 3375–3404, https://doi.org/10.1175/JAS-D-21-0278.1, 2022.
Wilson, D. R. and Ballard, S. P.: A microphysically based precipitation scheme for the UK meteorological office unified model, Q. J. R. Meteorol. Soc., 125, 1607–1636, https://doi.org/10.1002/qj.49712555707, 1999.
Wood, N., Staniforth, A., White, A., Allen, T., Diamantakis, M., Gross, M., Melvin, T., Smith, C., Vosper, S., Zerroukat, M., and Thuburn, J.: An inherently mass-conserving semi-implicit semi-Lagrangian discretization of the deep-atmosphere global non-hydrostatic equations, Q. J. R. Meteorol. Soc., 140, 1505–1520, https://doi.org/10.1002/qj.2235, 2014.
Yin, J. and Porporato, A.: Diurnal cloud cycle biases in climate models, Nat. Commun., 8, 2269, https://doi.org/10.1038/s41467-017-02369-4, 2017.
Young, G., Lachlan-Cope, T., O'Shea, S. J., Dearden, C., Listowski, C., Bower, K. N., Choularton, T. W., and Gallagher, M. W.: Radiative Effects of Secondary Ice Enhancement in Coastal Antarctic Clouds, Geophys. Res. Lett., 46, 2312–2321, https://doi.org/10.1029/2018gl080551, 2019.
Zhao, X., Liu, X., Phillips, V. T. J., and Patade, S.: Impacts of secondary ice production on Arctic mixed-phase clouds based on ARM observations and CAM6 single-column model simulations, Atmos. Chem. Phys., 21, 5685–5703, https://doi.org/10.5194/acp-21-5685-2021, 2021.