the Creative Commons Attribution 4.0 License.
the Creative Commons Attribution 4.0 License.
 | 05 Jan 2026
The impact of Sahara dust aerosols on the three-dimensional structure of precipitation systems of different sizes in spring
Jing Xi
Yu Wang
Rui Li
Banghai Wu
Xiaoye Fan
Xinbin Ma
Zixiang Meng
Saharan dust aerosols interacting with clouds and precipitation in the Atlantic Ocean's intertropical convergence zone can significantly impact storm microphysical and thermodynamic processes. Previous satellite research often focused on individual, km-scale rain pixels, neglecting interconnections among different locations. This study innovatively employs a clustering method to group satellite precipitation radar-observed profiles into organized precipitation systems (PSs) of varying horizontal sizes. Key features such as the mean storm top height, 85 GHz polarization-corrected microwave brightness temperature, and horizontal area with specific radar reflectivity per layer are analyzed to uncover system-level precipitation characteristics. Observations indicate that dust-laden PSs have higher storm tops, broader upper-level precipitation areas with more large particles, stronger ice scattering signals, and heavier surface rain rates than clean systems. These PSs also exhibit greater convective available potential energy (CAPE) and distinct differences in related dynamic and moisture conditions. Partial correlation and sensitivity analyses revealed that CAPE-induced changes are the primary confounding factor for dust aerosol effects. Notably, even after constraining CAPE and other thermodynamic factors, significant dust-induced changes in PS properties persist. This implies that, under comparable thermodynamic conditions, Saharan dust aerosols may enhance mid- and upper-level ice heterogeneous nucleation, thereby increasing the number of ice particles, releasing extra latent heat, and invigorating storms. Overall, this study offers a novel perspective on how dust aerosols affect organized precipitation systems.
- Article
(8209 KB) - Full-text XML
-
Supplement
(1764 KB) - BibTeX
- EndNote


Mineral dust is a key component of the Earth system with important impacts on weather and climate dynamics, the Earth's radiative budget, cloud microphysics, and atmospheric chemistry (Knippertz and Stuut, 2014; Ryder et al., 2019). Dust particles coated with soluble materials (e.g., sea salt and anthropogenic pollutants) can serve as effective cloud condensation nuclei (CCN), decreasing the size of the cloud droplet for a given liquid water content, which makes collision and coalescence processes less efficient, and delays or suppresses warm rain onset and development (Kaufman et al., 2005; Rosenfeld et al., 2001). However, there are also studies that have reached the opposite conclusion that dust aerosols can act as giant CCN and enhance precipitation (Kelly et al., 2007; van den Heever et al., 2006). Furthermore, mineral dust is found to be the most important natural source of ice nuclei (IN) in mixed-phase clouds and cirrus clouds (Cziczo et al., 2013; DeMott et al., 2003; Sassen et al., 2003; Tobo et al., 2019). A series of satellite-based studies have shown that, compared with homogeneous nucleation, the dust IN effect can enhance the heterogeneous freezing process and initialize ice nucleation at warmer temperatures and lower super saturations (Li et al., 2017; Min and Li, 2010; Patel et al., 2019). This effect can also influence the vertical structure of precipitation (Dong et al., 2018; Li and Min, 2010; Min et al., 2009). For instance, Zhu et al. (2023) found that precipitating drops under dusty condition grow faster in the middle atmospheric layers (with temperatures between −5 and +2 °C) but slower in the upper and lower layers compared with their pristine counterparts.
Note that previous satellite-based observational studies on the dust effects on precipitation have mainly taken an isolated raining pixel or a single rainfall profile as the basic research unit (Patel et al., 2019; Zhu et al., 2023; Jiang et al., 2018; Han et al., 2022; Zhang et al., 2020). In fact, precipitation is spatially organized with certain three-dimensional (3-D) structure (Zhang and Wang, 2023; Li et al., 2022; Houze, 2014), i.e., precipitation system (PS), which can reflect the combined effects of multiple complex physical processes occurring inside it, including dynamic, thermodynamic, and microphysical processes (Houze, 2014; Li and Min, 2010; Zhang et al., 2022). Aerosols can modify the cloud hydrometeor profiles and phase changes, in turn altering the dynamics and thermodynamics of one PS through latent heat release (Min et al., 2009; Zhu et al., 2024). Therefore, grouping precipitation pixels with similar formation processes in advance into the same PS and studying dust effects on its 3-D structure can provide a new perspective for better understanding the interactions between aerosols and precipitation.
Several typical individual PS cases have been used to investigate dust aerosol effects. Based on multi-platform observations, Min et al. (2009) and Li and Min (2010) investigated the impact of dust aerosols on a well-developed mesoscale convective system (MCS) occurred in the tropical eastern Atlantic and found that more small-sized cloud particles and precipitating hydrometeors formed in the dust-laden cloud system. The dust-induced microphysical effect is more evident for stratiform precipitation, where the rain rate at higher altitudes is enhanced. The simulation of the same MCS case (Gibbons et al., 2018) indicated that increasing the IN concentration in dust scenarios results in the formation of more numerous small ice particles in the heterogeneous nucleation regime (between −38 and −5 °C) than in the clean case. Depositional growth and riming of these particles release more latent heat, which in turn invigorates convective updrafts. However, the particle growth rates decrease due to the increased competition between individual particles for limited water vapor during diffusional growth, as well as available small drops or crystals during collection processes. Chen et al. (2019) investigated the effects of dust particles acting as CCN and IN on the growth of hail in convective clouds through a storm case simulation. The results showed that increasing CCN concentration led to larger supercooled liquid water content and larger size of hail particles, while more IN caused a decrease in the size of graupel and suppressed the growth of hailstones. Although these case studies have demonstrated the possible impacts of dust aerosols on PS to some extent, it is still unclear how the 3-D structure of PS responds to changes in dust loading, especially from a statistical perspective.
It should also be noted that the case studies mentioned above have mainly focused on MCSs with high organization and large areal coverage (Li et al., 2017; Gibbons et al., 2018; Huang et al., 2019), while not enough attention has been paid to smaller PSs. Based on CloudSat radar observations, Douglas and L'Ecuyer (2021) found that aerosols can increase the precipitation formation rate and in-cloud vertical motion in warm clouds, and this effect is more pronounced when the warm rain system is smaller in size. In fact, aerosols and PSs are simultaneously influenced by the meteorological conditions, which compose a buffered system with complex feedback processes (Stevens and Feingold, 2009; Rosenfeld et al., 2014; Guo et al., 2018). Numerous studies have shown that meteorological factors, such as convective available potential energy (CAPE), relative humidity (RH), wind shear, and other parameters, can modify the effects of aerosols on clouds and precipitation (Zhao et al., 2024; Zhu et al., 2024; Chen et al., 2020; Zang et al., 2023). In general, the larger horizontal coverage and more organization the PS has, the stronger instability energy and more abundant water vapor supply can be found (Fu et al., 2021; Zhou et al., 2013), which may obscure or even cancel out the effect of dust on precipitation. In order to deepen the understanding of the dust aerosol effects, therefore, it is necessary to investigate the properties of PSs of different sizes as a function of dust loading and meteorological conditions.
In this study, the impact of dust aerosols on PSs is statistically investigated based on the long-term satellite observations. The tropical Atlantic Ocean (30° W–10° E, 5° S–25° N) on the western side of Africa is chosen as the study area. The large quantities of dust aerosols are transported here by trade winds in springtime from the adjacent Sahara desert (Choobari et al., 2014; Prospero et al., 2021), and interact with the frequently occurred PSs over the Atlantic intertropical convergence zone (ITCZ) (Li and Min, 2010; Rosenfeld et al., 2014), making this region an ideal testbed for studying the interactions between dust aerosols and precipitation (Dong et al., 2018).
This paper is organized as follows: Sect. 2 introduces the data and methods used in this study. Section 3 presents the variations of 3-D structure of PSs with different sizes and different dust concentrations, and explores the influence of meteorological conditions. Sections 4 and 5 include the discussion and conclusion of the main findings of this study.
2.1 Dataset
The Tropical Rainfall Measuring Mission (TRMM) satellite is a joint mission between the National Aeronautics and Space Administration (NASA) of the United States and the National Space Development Agency (NASDA) of Japan, and is designed to improve our understanding of the distribution and variability of tropical and subtropical (between 38° N and 38° S) precipitation (Kummerow et al., 1998; Zipser et al., 2006). It carries the first space-borne precipitation radar (PR) and a nine-channel passive microwave radiometer, the TRMM Microwave Imager (TMI). The former operates at 13.8 GHz with a 215 km swath, enabling the capture of the 3-D storm structure. The latter measures brightness temperatures at the following five frequencies: 10.65, 19.35, 21.3, 37.0, and 85.5 GHz and has a 759 km swath (Kummerow et al., 1998; Fu and Liu, 2001), providing information on a variety of geophysical parameters including liquid and solid hydrometeors in the atmosphere.
12 years (2003–2014) of TRMM observations from March to May are used, including PR level-2 product 2A25 and TMI level-1 product 1CTRMMTMI. The 2A25 product is widely used in global precipitation analysis (Liu and Fu, 2001; Liu et al., 2008; Nesbitt et al., 2006), providing vertical profiles of attenuation-corrected radar reflectivity factor and rain rate with a horizontal (vertical) resolution of 5 km (250 m). Each precipitation profile is classified into three rain types including stratiform, convective and other, based on the vertical and horizontal variability in radar reflectivity (Awaka et al., 2009; Schumacher and Houze, 2003). The vertically and horizontally polarized brightness temperatures at 85.5 GHz from 1CTRMMTMI product are used to calculate the polarization corrected temperature (PCT85), as an indicator of the amount of ice scattering within the cloud (Vivekanandan et al., 1991; Wall et al., 2014). Considering the inconsistent horizontal resolutions of PR (∼ 4.5 km at nadir) and TMI (5 km × 7 km at 85.5 GHz), their measurements are merged using the moving surface fitting method, with the PR measurements acting as the target data (Fu et al., 2013).
Similar to Xi et al. (2024), PSs are identified as contiguous precipitation area consisting of pixels with PR near-surface rain rate greater than 0 mm h−1. It should be noted that only PSs untruncated by the edge of the PR swath were used in our study to ensure completeness. Additionally, PSs should contain at least four precipitating pixels (covering more than 80 km2) to reduce uncertainties in subsequent statistical analysis.
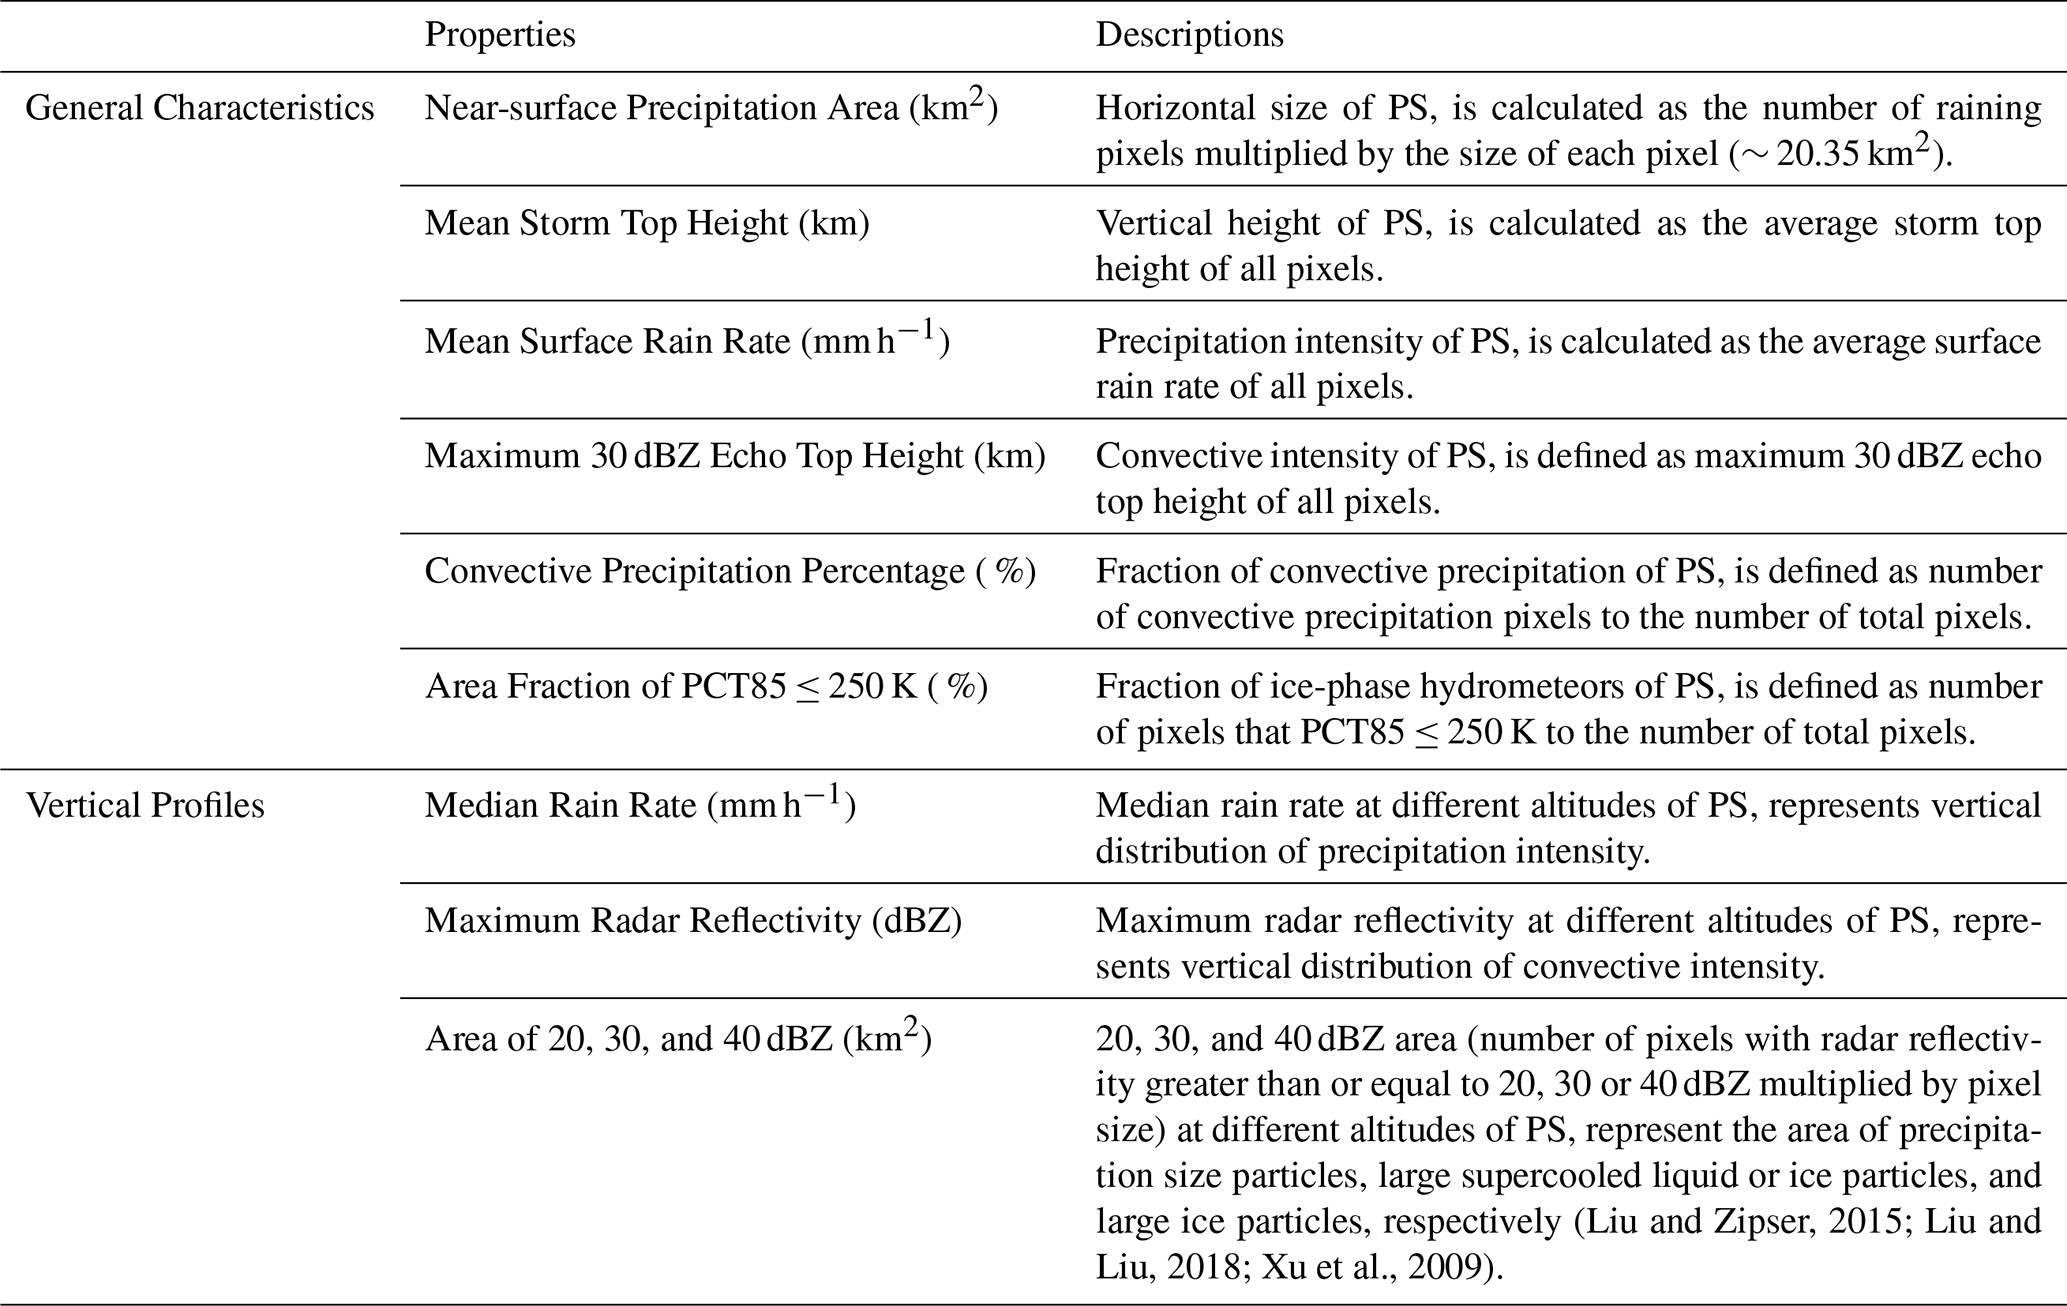
As shown in Table 1, the selected parameters describing PS properties of 3-D structure and intensity are divided into two categories: general characteristics and vertical profiles. The former includes the near-surface precipitation area, mean storm top height, mean surface rain rate, maximum 30 dBZ echo top height, convective precipitation percentage and area fraction of PCT85 ≤ 250 K. In these characteristics, maximum 30 dBZ echo top height represents the maximum altitude that large hydrometeors can reach, which is often used as an indicator of convective intensity because intense updrafts are required to lift large hydrometeors to higher altitudes (Liu and Zipser, 2013, 2015). In addition, the area fraction of PCT85 ≤ 250 K represents the fraction of ice-phase hydrometeors in the PS (Toracinta et al., 2002). The vertical characteristics of PS are composed of variables such as the median rain rate, maximum radar reflectivity and precipitation area of 20, 30 and 40 dBZ. It should be mentioned that the mean rain rate is typically used to represent precipitation intensity when performing statistical analysis on isolated raining pixels. Within a complete PS, however, the distribution of precipitation rates tends to follow a gamma distribution (Martinez-Villalobos and Neelin, 2019; Fan et al., 2024), with a majority of weak precipitation largely determining the average value. Therefore, the median rain rate is used here to indicate the precipitation intensity of the entire PS.
Aerosol data are obtained from Moderate Resolution Imaging Spectroradiometer (MODIS) sensors onboard Terra and Aqua satellites, which are in sun-synchronous orbits crossing the equator at 10:30 and 13:30 local time, respectively (Barnes et al., 2003). Level-3 collection 6 daily aerosol optical depth (AOD) products (MOD08_D3/MYD08_D3) with a 1° × 1° grid are used (Levy et al., 2013; Remer et al., 2005).
Table 1Definitions of parameters describing the PS 3-D structure.
Note that MODIS cannot detect aerosols below clouds (Shin et al., 2019; Christopher and Gupta, 2012), so it is difficult to determine the dust concentration of each PS. Given that Saharan dust outbreaks can last for several days and affect an extensive area (Knippertz and Stuut, 2014), we estimated the dust concentration of PSs using spatiotemporal interpolation and extrapolation methods. Specifically, the available AOD from a total of 7 d (the day of the PS event, and 3 d before and after), and from all grids extending 3° outward from the selected PS, were averaged to determine the dust aerosol content corresponding to this PS. In fact, we also conducted sensitivity tests by selecting different numbers of days and grids extending outward, and found that these changes had little impact on the classification of dust loading for the specific PS mentioned later, with more than 75 % of the classification results remaining consistent (see Table S1 in the Supplement). In addition, the potential impact of cloud coverage on the estimation of dust concentration was also examined (see Text S1, and Figs. S1–S3 in the Supplement).
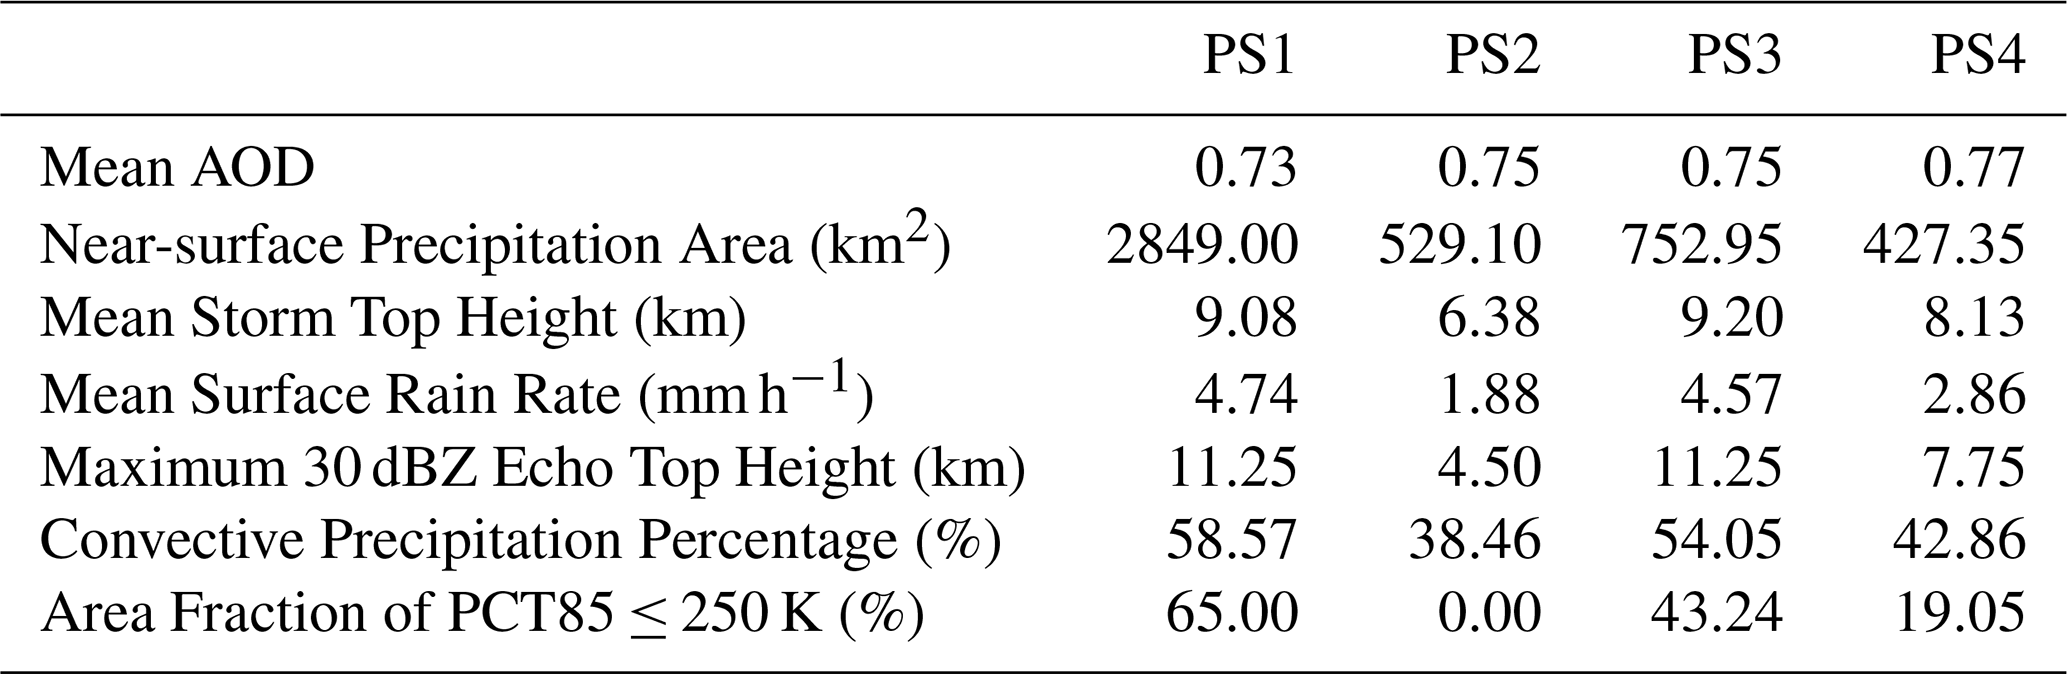
As an example, Fig. 1 shows the spatial distributions of near-surface rain rate and AOD for the 4 PSs that occurred over Atlantic Ocean on 27 February 2008, and their general characteristics are given in Table 2. It can be seen that different PSs are highly variable in terms of the horizontal scale, as well as other properties and dust conditions. For example, PS2 and PS4 have similar horizontal sizes but exhibit noticeable differences in storm top heights and surface rain rates, implying differences in thermodynamic and dynamic conditions, or possibly aerosol effects. In particular, the higher maximum 30 dBZ echo top height and greater convective precipitation percentage in PS4 demonstrate stronger convective intensity, with a greater number of ice-phase particles. Moreover, it is interesting that PS1 and PS3 have different near-surface precipitation areas but similar other properties, such as maximum 30 dBZ echo top height, surface rain rate and convective precipitation percentage, which may be due to their locations in adjacent regions, resulting in relatively consistent background fields and dust aerosol concentrations.
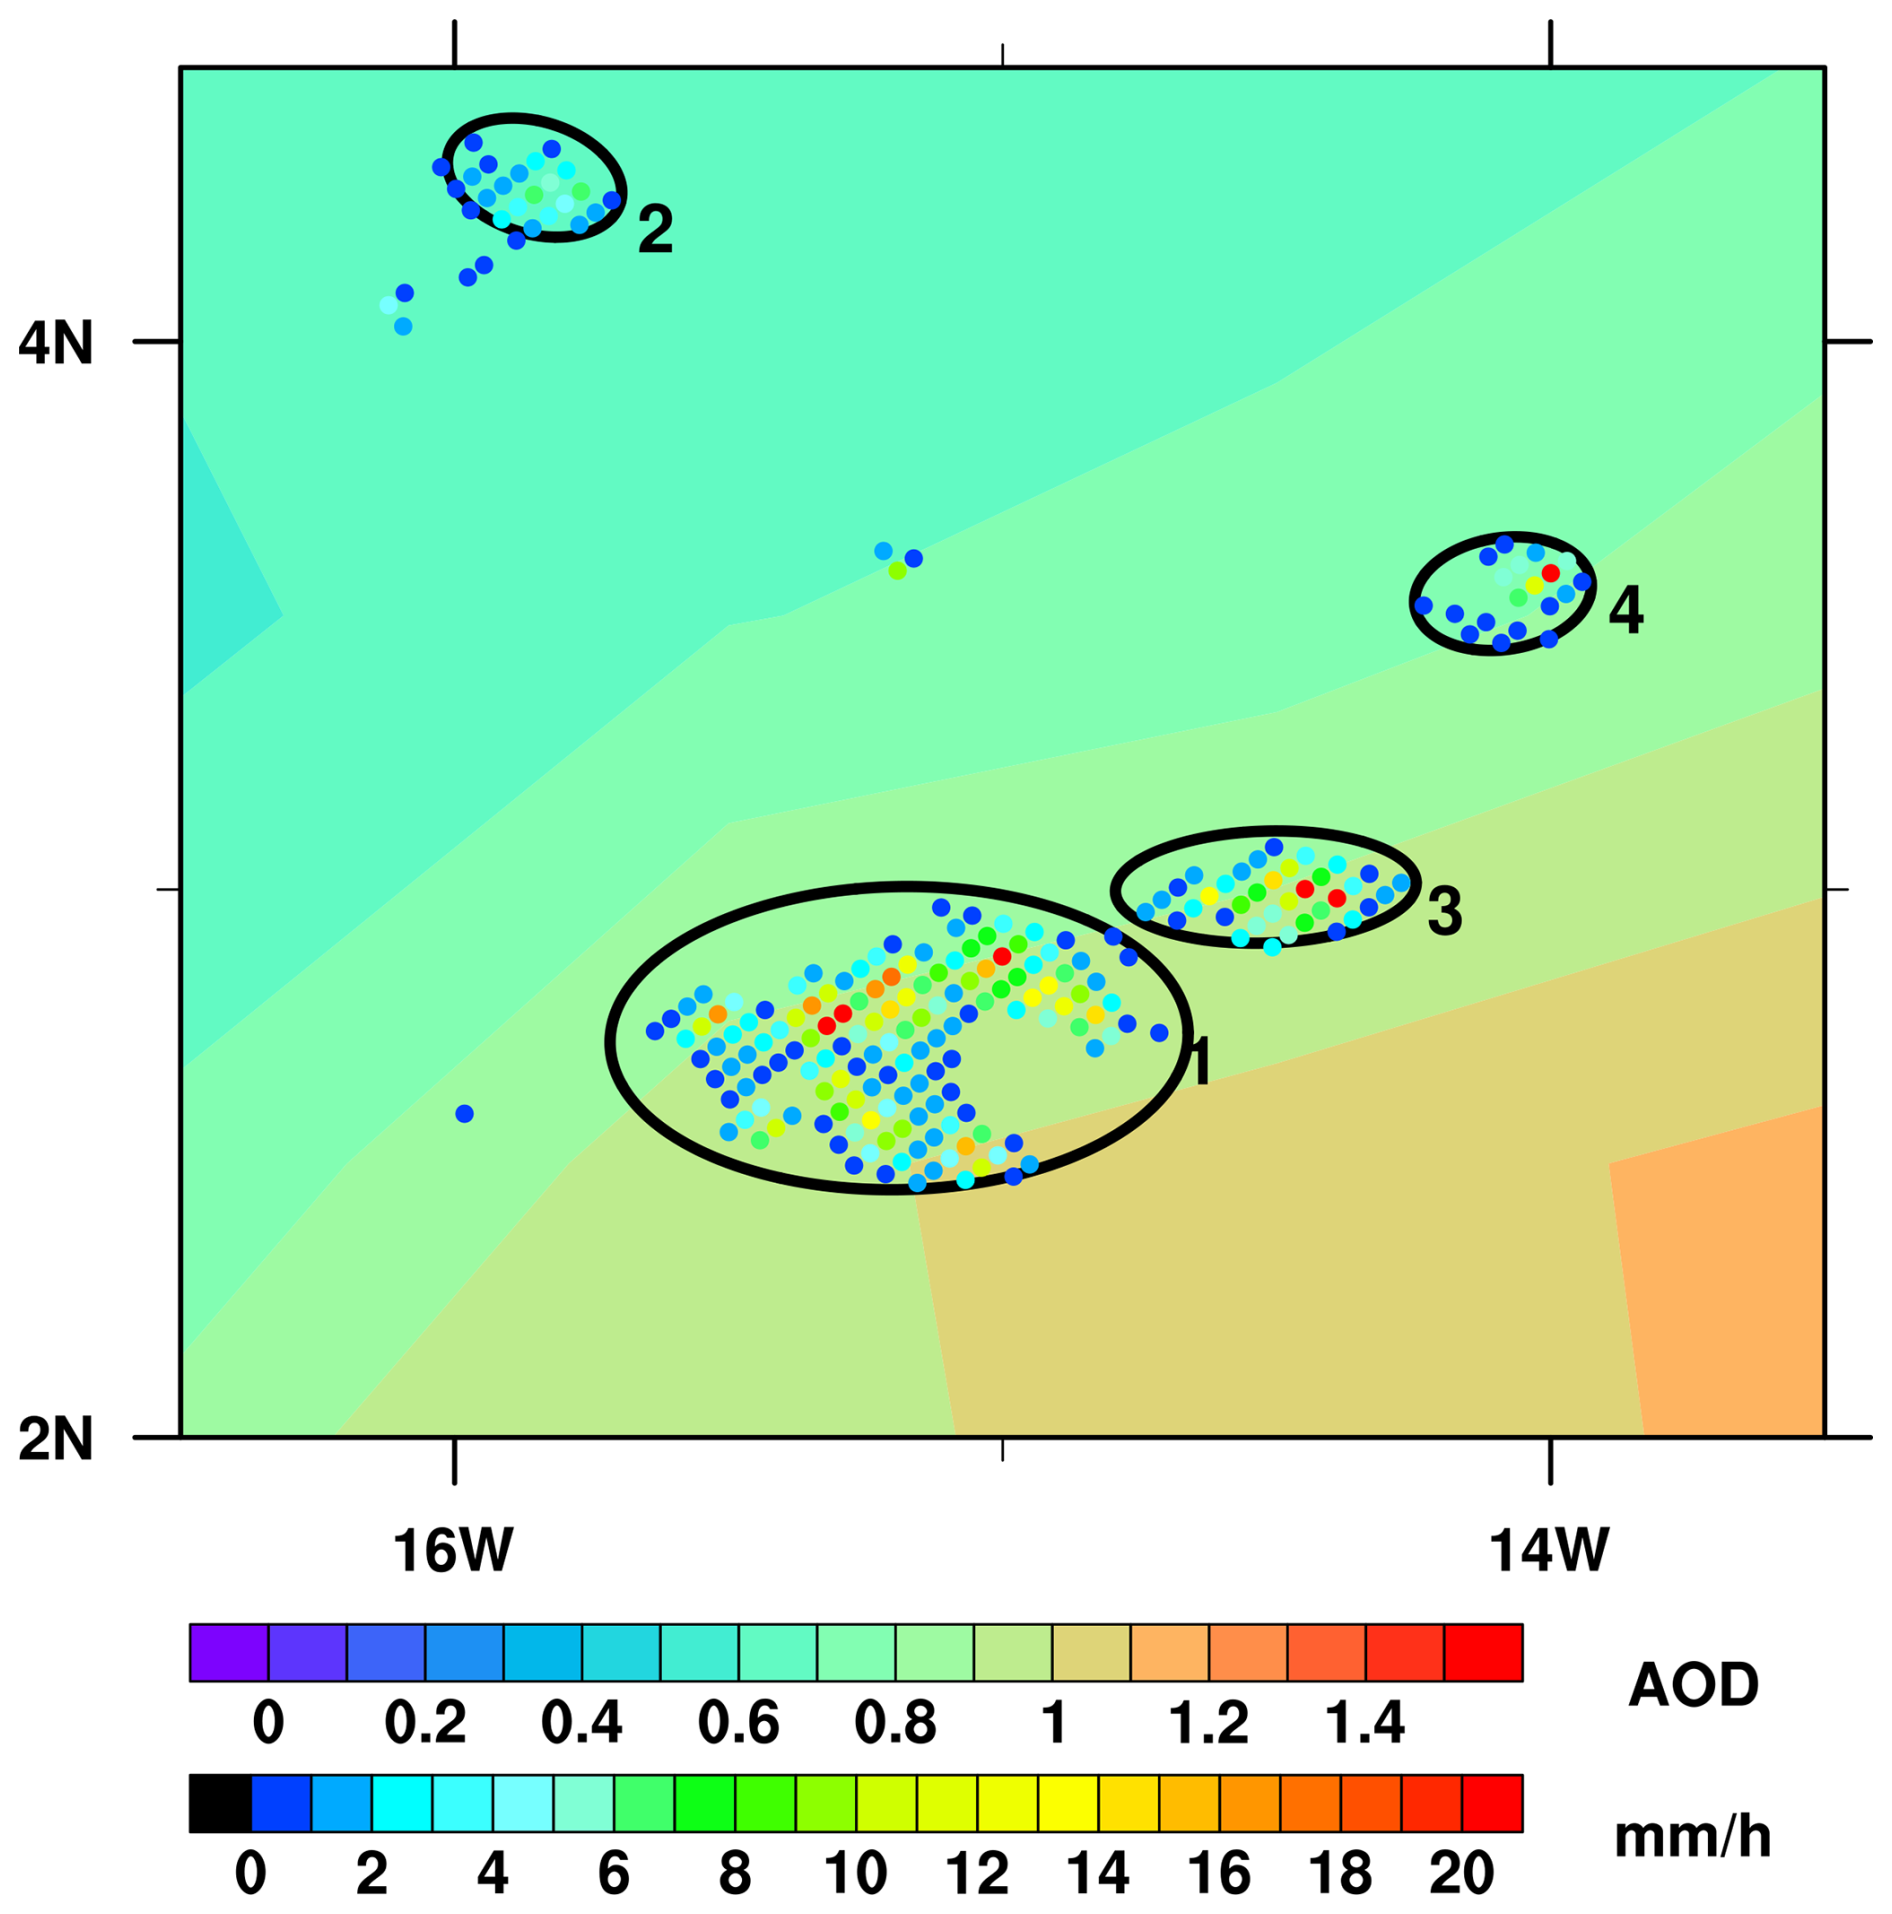
Figure 1Near-surface rain rates of several PSs idealized as ellipses over the tropical Atlantic Ocean on 27 February 2008 measured by PR (orbit number: 58594). The shaded map is the spatial distribution of MODIS AOD. The four PSs are numbered and represented by black elliptical outlines.
In addition, a set of meteorological variables (Table 3) are used to analyze the influence of meteorological conditions on aerosols affecting cloud and precipitation, which are obtained from the fifth generation European Centre for Medium-Range Weather Forecasts (ECMWF) atmospheric reanalysis of the global climate (ERA5) with high spatial and temporal resolutions (0.25° and 1 h, respectively) (Hersbach et al., 2020). They are matched to the closest PS pixel spatiotemporally. The average of all pixels within one PS is then used to represent the corresponding meteorological field.
Table 3Definitions of variables describing PS meteorological conditions.
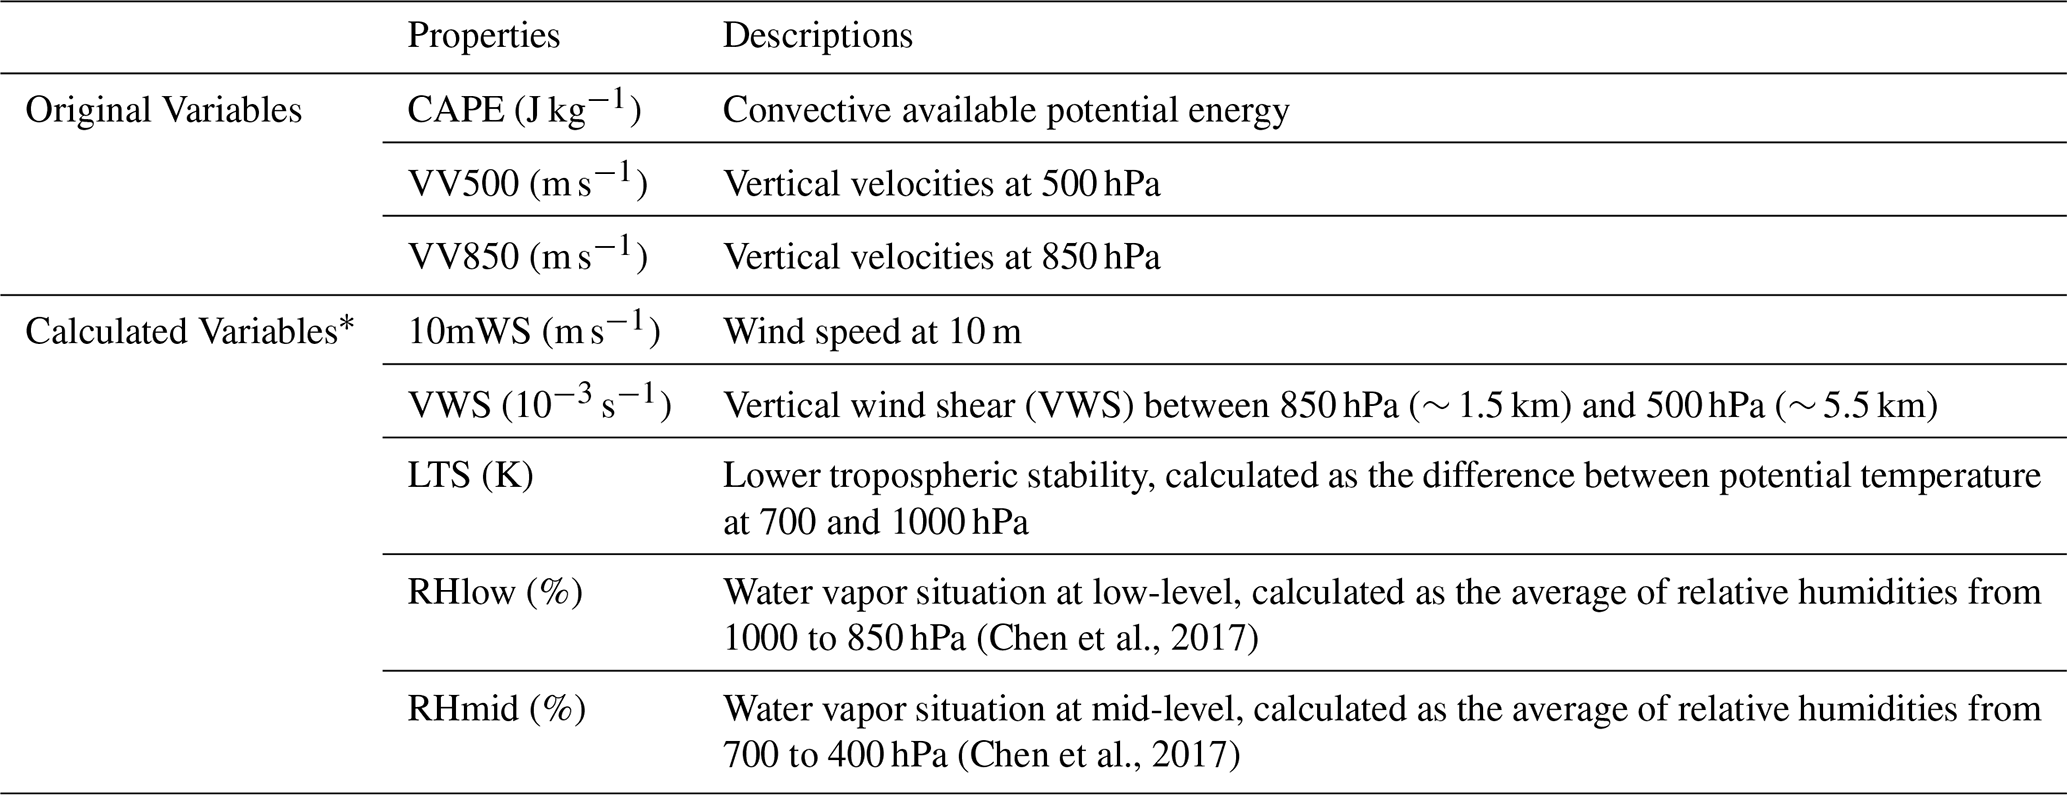
* The details of the calculation methods are given in Text S2 in the Supplement.
2.2 Classification of PSs
Considering that convective cloud systems driven by thermal convection are more susceptible to aerosols compared to synoptic precipitation caused by large-scale uplift associated with frontal or low-pressure systems (Guo et al., 2017, 2019), only those PSs that have at least one embedded convective core were used here. Moreover, since the dust IN effect is the focus of this study, the precipitation height of the selected PSs was further required to be higher than 6 km to reduce the possible confusion caused by warm rain processes.
In this study, we attempted to investigate the effects of dust on precipitation by comparing the differences in the general characteristics and 3-D structure of PSs under clean and dusty conditions (Guo et al., 2018; Koren et al., 2012), using the 30th (0.24) and 70th (0.36) percentiles of AOD for all PSs as thresholds (Fig. S4), respectively. To further analyze the relationship between dust effects and PS size, we categorized the collected PSs into three types based on near-surface precipitation area: small-sized (< 2000 km2), medium-sized (between 2000 and 10 000 km2), and large-sized (> 10 000 km2), and thus performed a comparative study, following the thresholds commonly used in previous studies (Zipser et al., 2008; Liu et al., 2017, 2019).
Figure 2 shows the spatial distributions of all dust-free and dust-laden PSs of different sizes during spring from 2003 to 2014. Obviously, small-sized PSs have the largest number of samples, while large-sized ones have the smallest. Most of the PSs are located in the ITCZ, where the convergence of warm and moist trade winds brings updrafts favoring the development of convection and precipitation (Schneider et al., 2014). Dust-laden PSs are closer to land than clean ones, which is consistent with the distribution of the multi-year average AOD (the shaded background in Fig. 2) due to the transport of dust aerosols from land. This suggests that the proposed method dividing PSs into clean and dusty conditions is reasonable. It should be noted that the closer the PSs are to the coastline, the stronger the thermodynamic conditions are likely to be. As a result, the influence of meteorological conditions needs to be carefully considered later in this study.
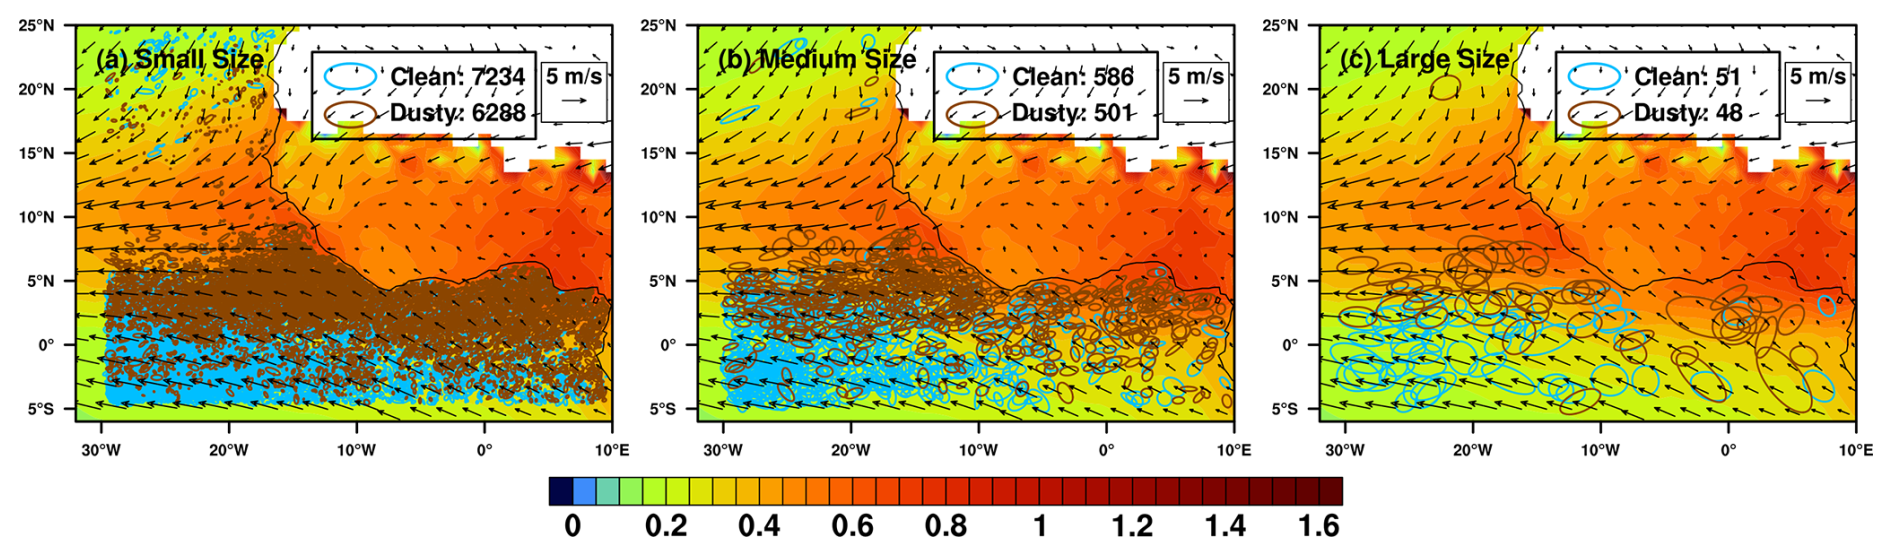
Figure 2Spatial distributions of (a) small-sized, (b) medium-sized and (c) large-sized of PSs idealized as ellipses. Blue and brown ellipses denote clean and dusty PSs respectively, and the numbers in the legends denote the sample numbers. The fields are composites of average AOD from MODIS (shaded) and wind vectors at 850 hPa from ERA5 (m s−1) during 2003–2014 (March to May).
3.1 Dust effects on the 3-D structure of PSs
Figure 3 shows the mean values of the general characteristics of PSs of different sizes under clean and dusty conditions, respectively. Regardless of PS size, almost all the parameters including the mean storm top height, mean surface rain rate, maximum 30 dBZ echo top height, convective precipitation percentage and area fraction of PCT85 ≤ 250 K are significantly higher under dusty conditions than those under clean conditions, indicating that dust aerosols would invigorate PSs with stronger convective activity, more ice-phase particles and more precipitation.
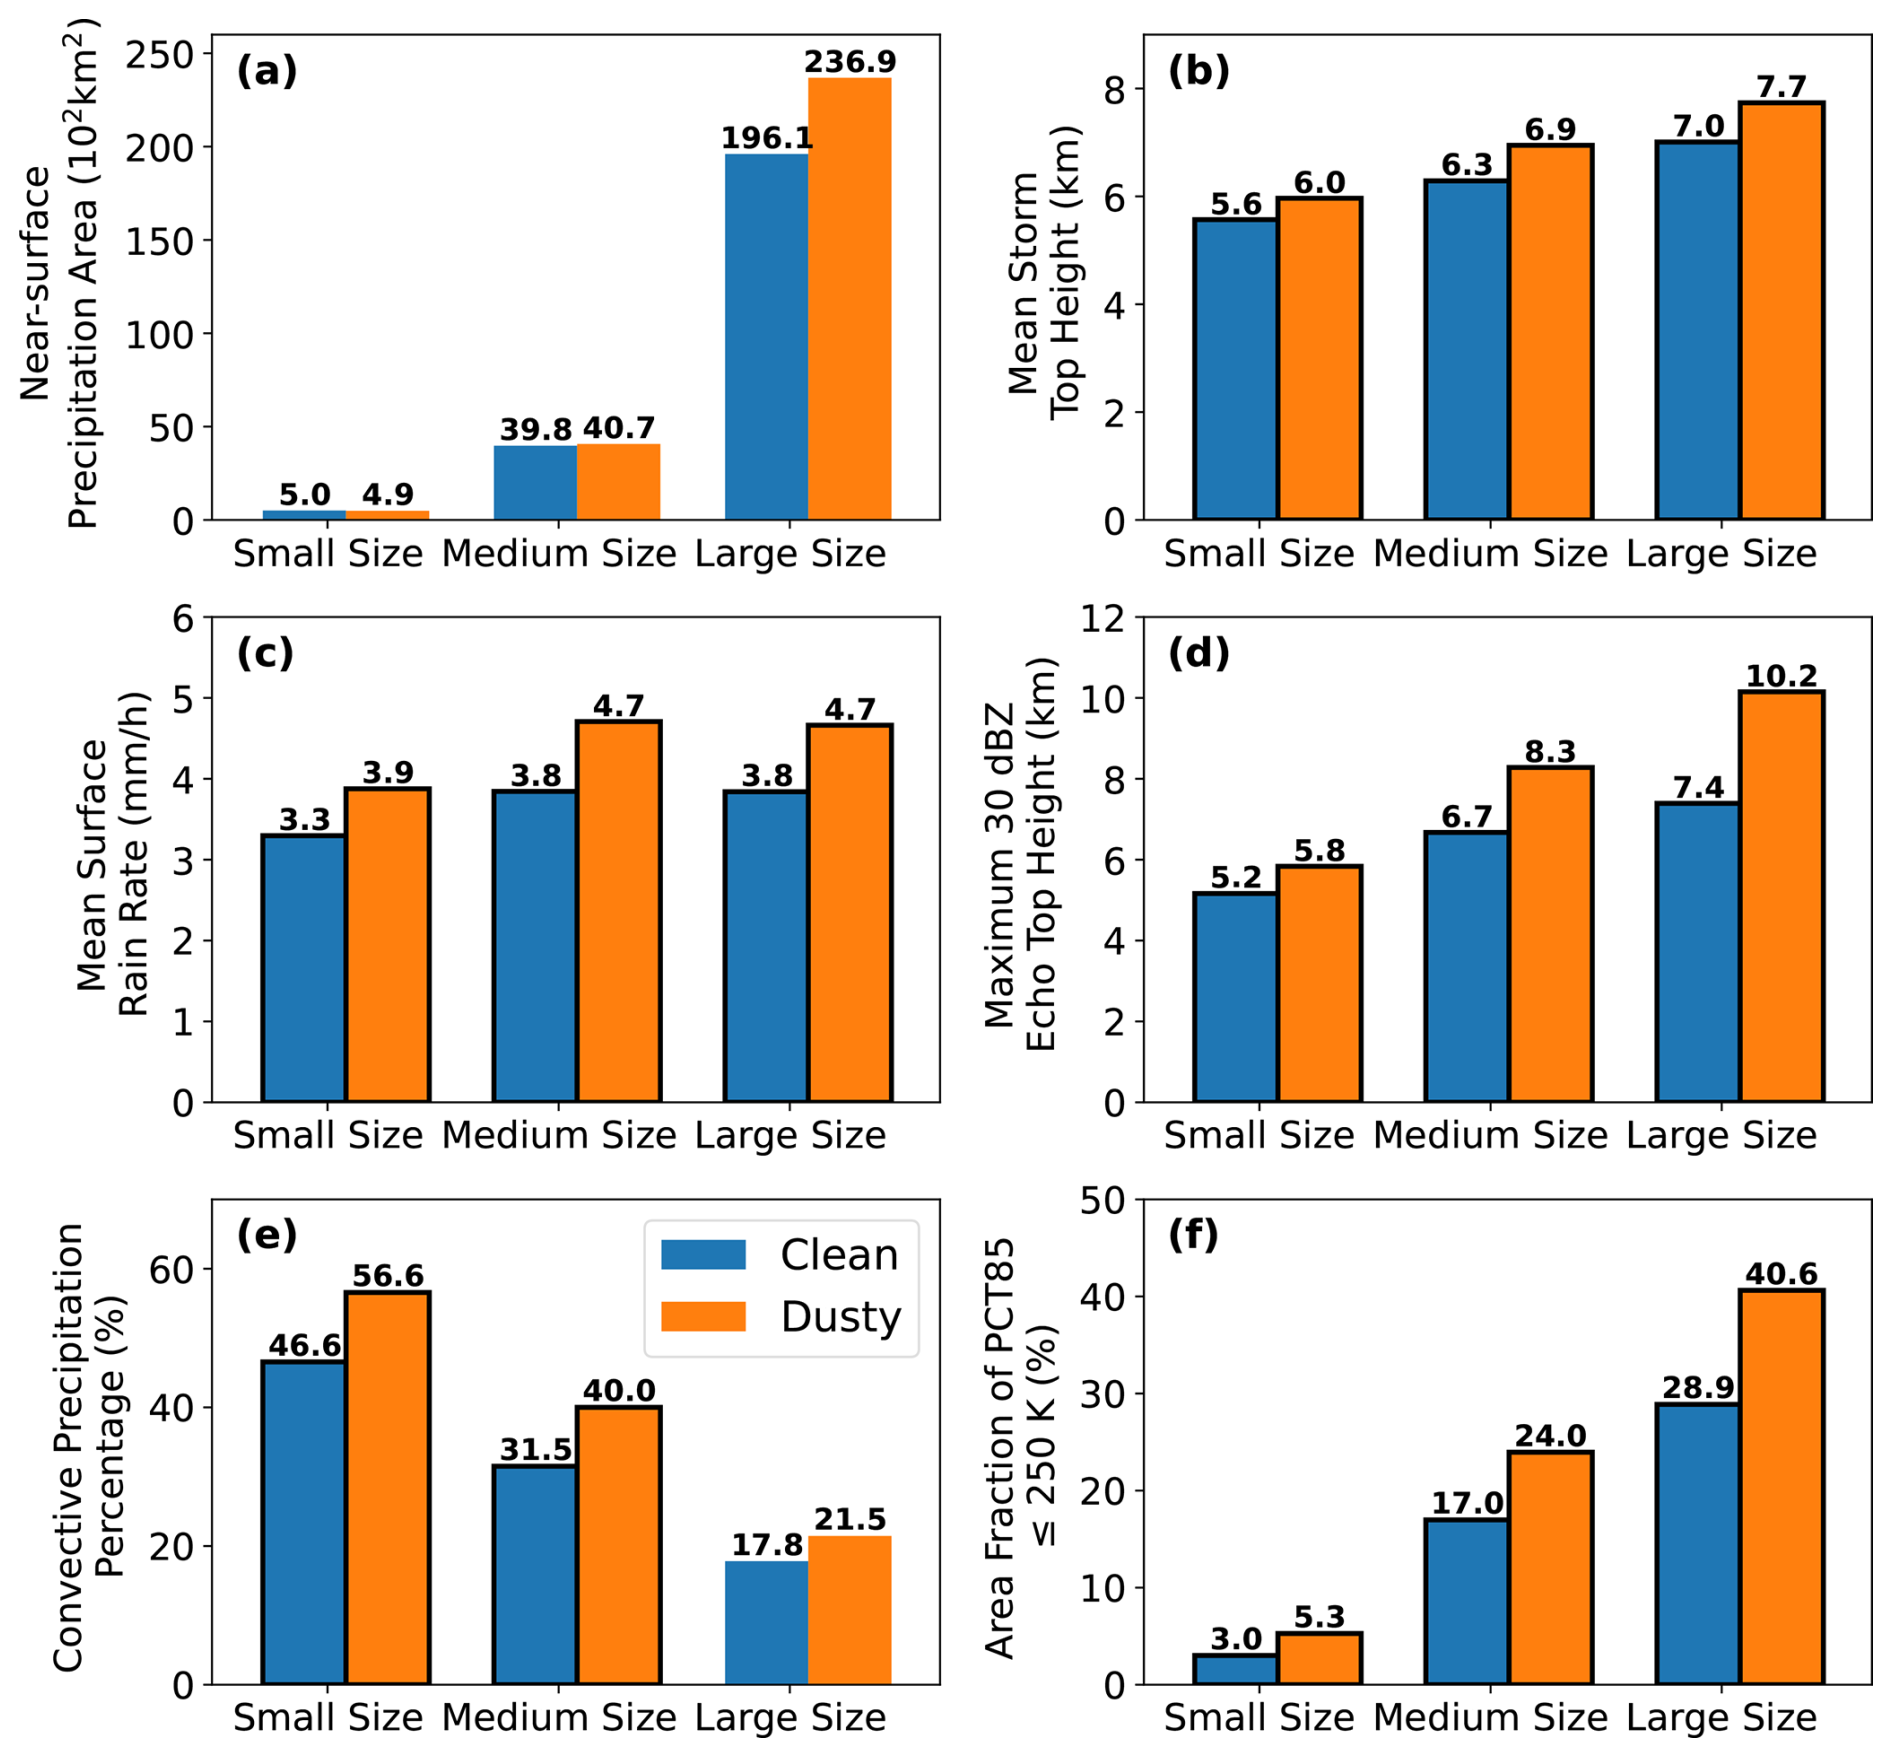
Figure 3The averages of general characteristics of PSs of different sizes, including (a) near-surface precipitation area (km2), (b) mean storm top height (km), (c) mean surface rain rate (mm h−1), (d) maximum 30 dBZ echo top height (km), (e) convective precipitation percentage (%) and (f) area fraction of PCT85 ≤ 250 K (%) under clean and dusty conditions. The average values of these properties are labeled on the data bars. The black border around the data bar indicates that the difference between clean and dusty conditions is statistically significant at the 95 % confidence level using a Student's t-test.
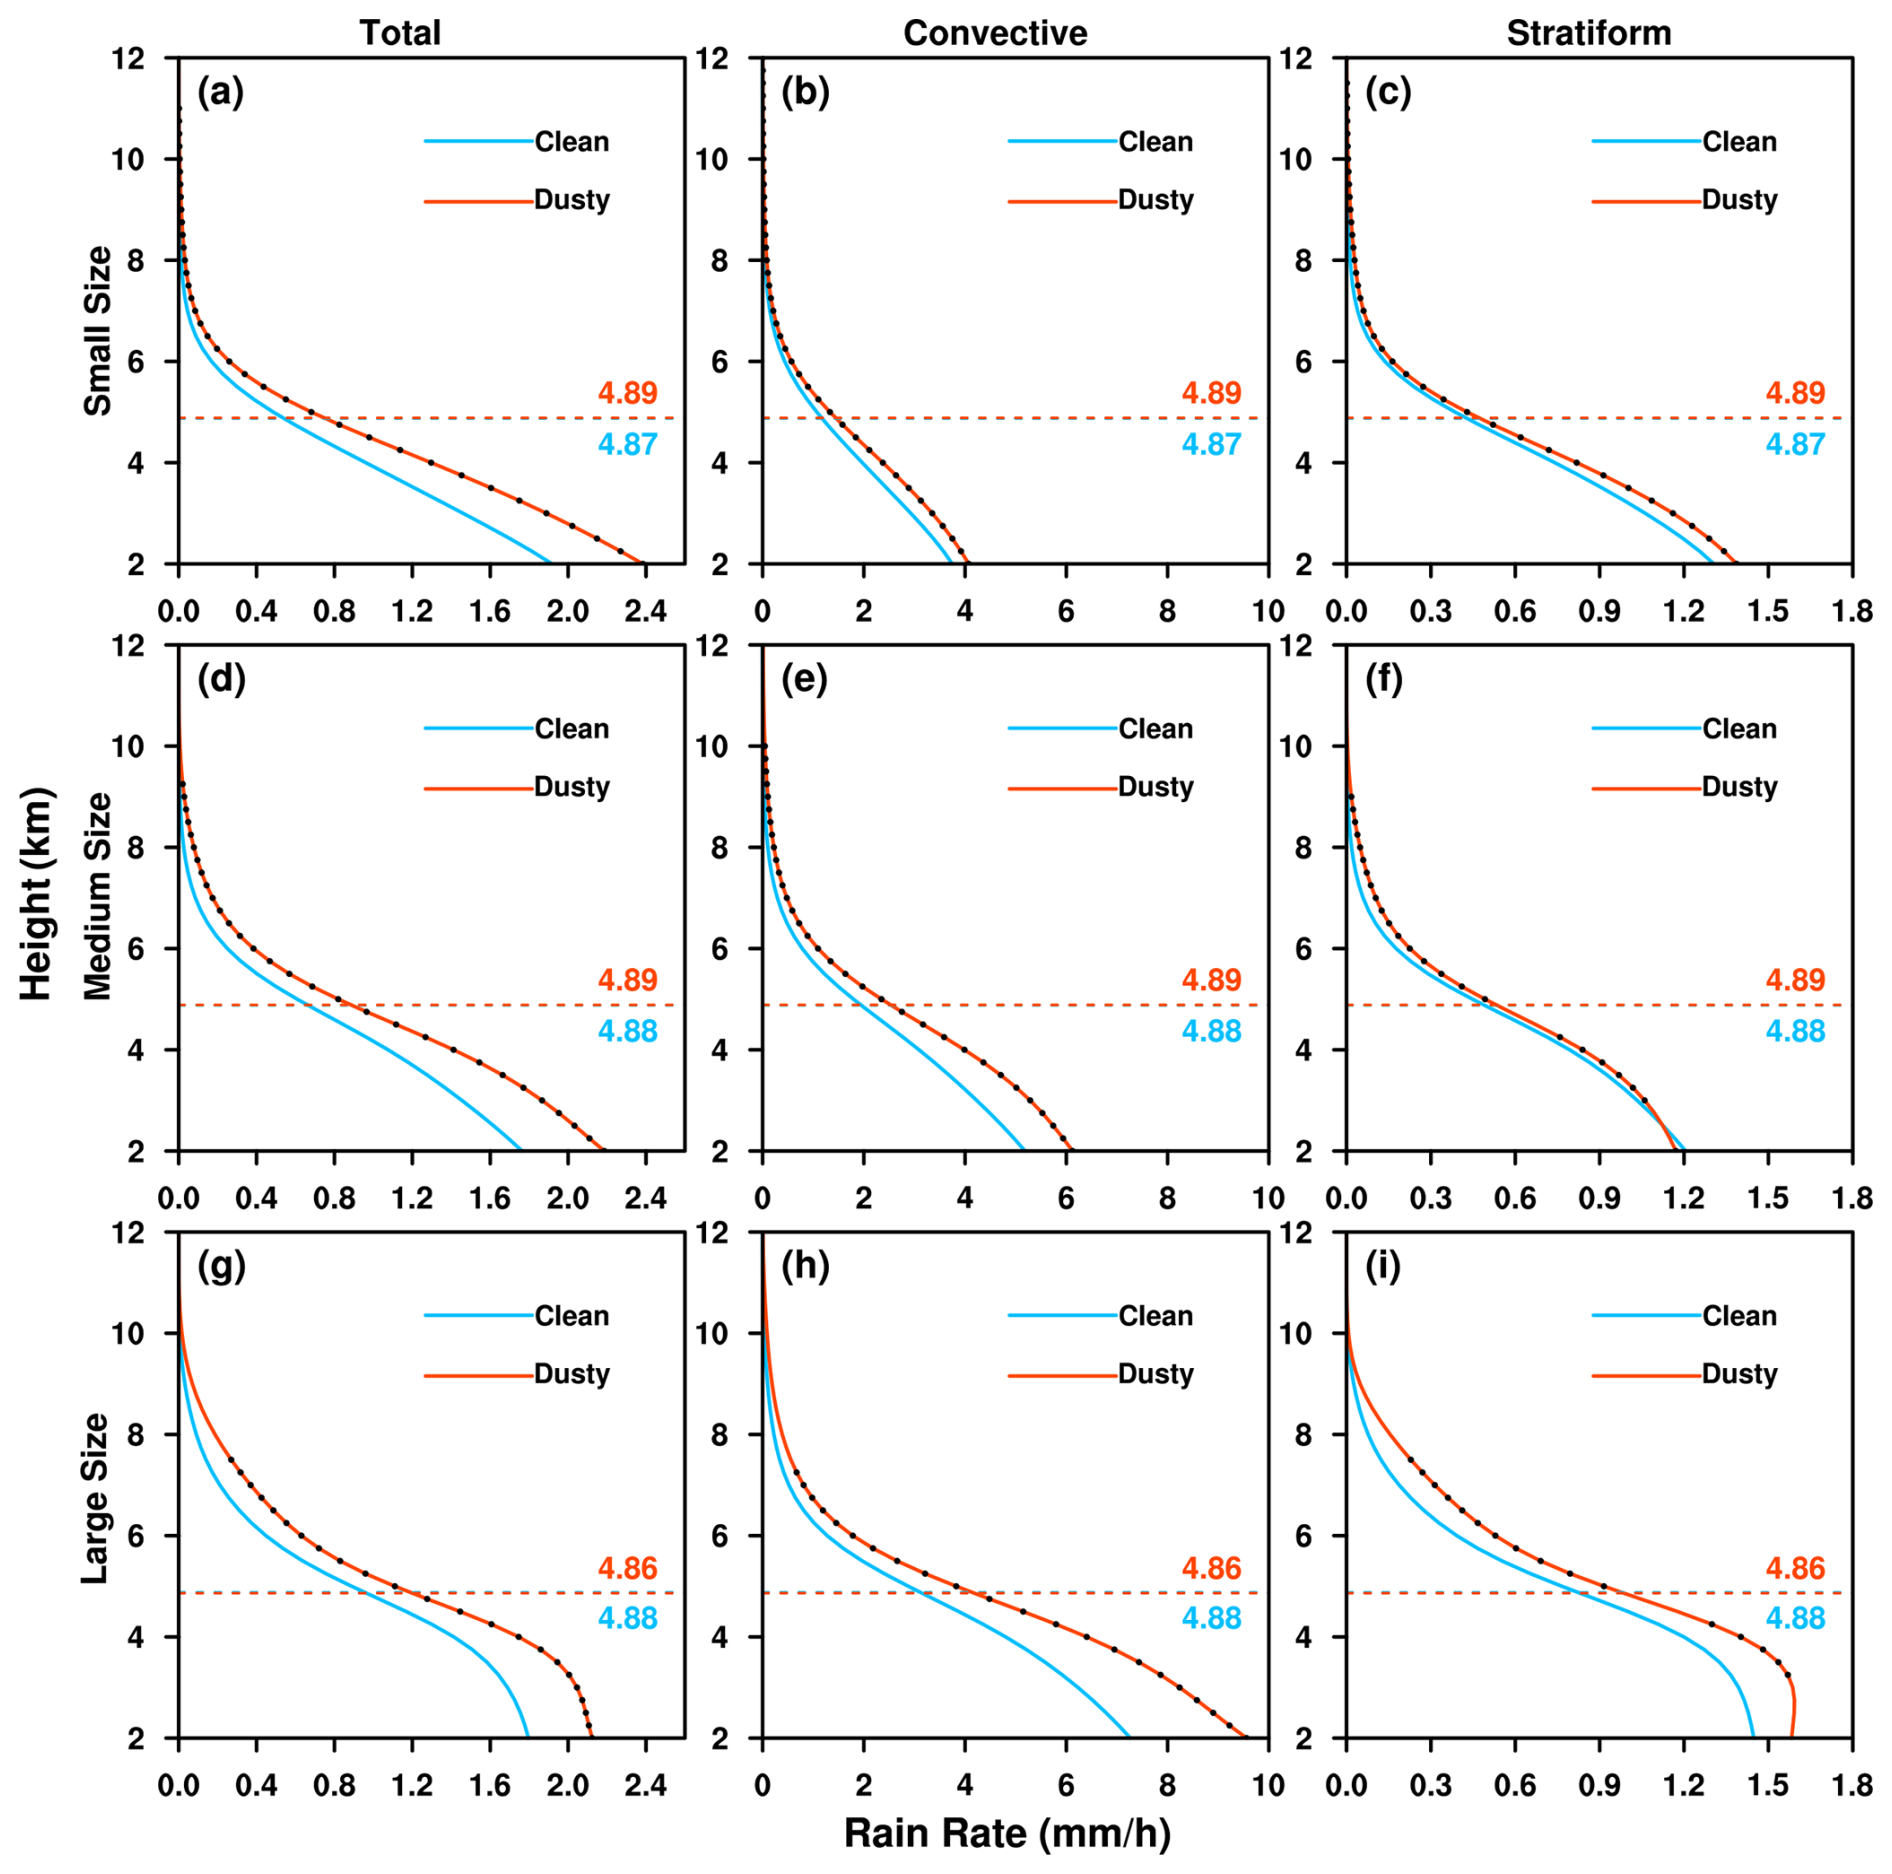
Figure 4The mean vertical profiles of median rain rates for total, convective and stratiform precipitation of small-sized (upper row), medium-sized (middle row), and large-sized (bottom row) PSs under clean and dusty conditions. The black dot on the red line indicates that the difference between clean and dusty conditions is statistically significant at the 95 % confidence level using a Student's t-test. The horizontal dashed lines show the freezing level with values labeled.
Regarding the vertical characteristics of precipitation, it can be seen that the median rain rate increases significantly at all heights with the presence of dust, regardless of PS size or precipitation type (Fig. 4). In particular, the enhancement in convective precipitation is more pronounced than that in stratiform precipitation. This suggests that dust aerosols can enhance the precipitation intensity of PSs, mainly by increasing convective precipitation. In addition, the difference in rain rates above the freezing level between dust-laden and dust-free scenarios increases with PS size, implying that the impact of dust on solid precipitation is more obvious for larger PSs.
The average 20, 30 and 40 dBZ area profiles for various sizes of PSs under clean and dusty conditions are shown in Fig. 5, respectively. For convective precipitation, all reflectivity areas are significantly enhanced at all heights under dusty conditions, regardless of the PS size (Fig. 5b, e, and h). A similar conclusion is made for total precipitation, which indicates a substantial increase in the number of precipitation particles of different phases and sizes due to the presence of dust. In contrast, for stratiform precipitation, this increase (mainly 20 dBZ) is only present above the freezing level (Fig. 5c, f, and i), because more ice particles due to the dust IN effect can be advected into stratiform regions with convection outflows at upper levels within a PS (Min et al., 2009; Li and Min, 2010). In those small- or medium-sized PSs, the 20 dBZ area below the freezing level is even reduced significantly under high dust loading. This decrease may be attributed to the fact that the warm and dry Saharan Air Layer (SAL) can interact with cloud and precipitation systems along its path across the tropical Atlantic (Li and Min, 2010; Braun, 2010; Barreto et al., 2022) and enhance the evaporation process (Dong et al., 2018; Li and Min, 2010). In particular, the cloud margin under sub-saturation is more susceptible to evaporation effect caused by the entrainment of ambient dry and warm air than the cloud core (French et al., 2009; Sun et al., 2023). This makes the reduction in the precipitation area more pronounced for small-sized PSs, although the median precipitation rate still increases due to the presence of dust (Fig. 4c). As the PS size increases, dynamic and thermodynamic forcings such as sustained large-scale water vapor transport and convergence become stronger, so that the particle size becomes larger, which in turn makes the evaporation effect less significant. For large-sized PS, therefore, the increase in various reflectivity areas at different altitudes due to dust aerosols can be observed, even in stratiform regions (Fig. 5i). It should be noted that the near-surface precipitation area shown in Fig. 3 primarily reflects the changes occurring in the lower layers (i.e., below the freezing level), as depicted in Fig. 5. Therefore, the differences in precipitation areas between clean and dusty conditions are not pronounced, although other characteristics of PSs increase significantly under dusty conditions.
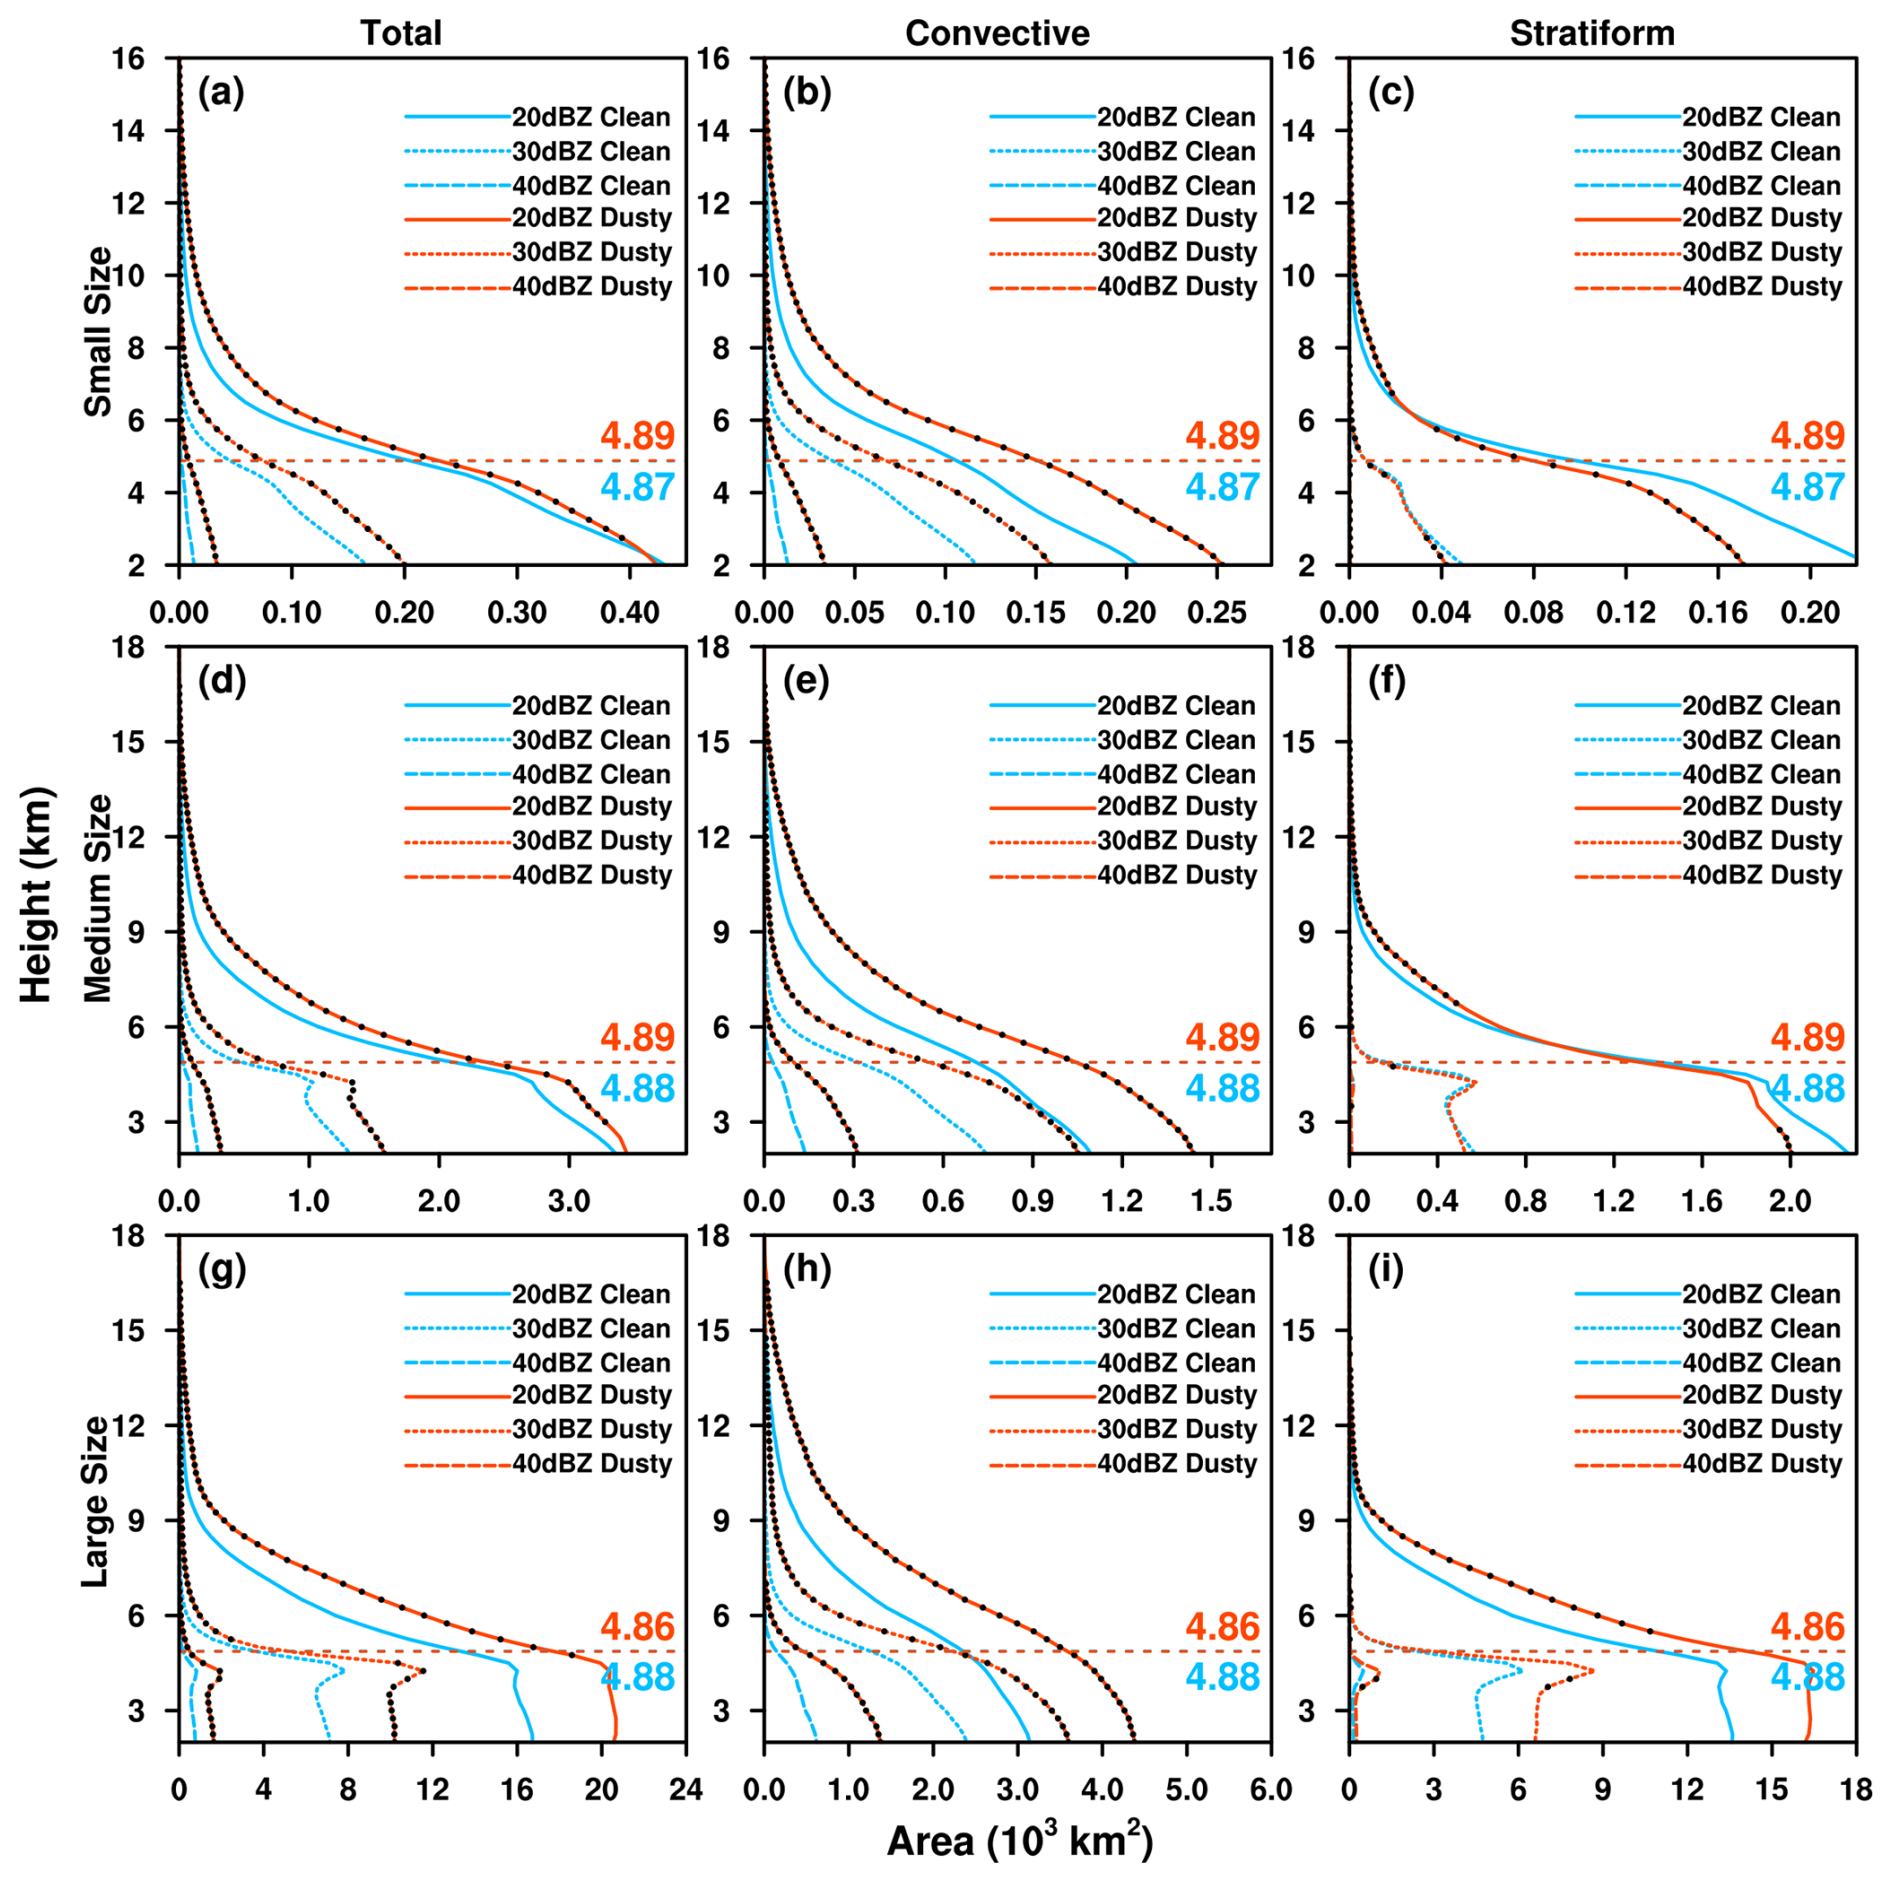
Figure 5The mean vertical profiles of 20, 30 and 40 dBZ areas for total, convective and stratiform precipitation of small-sized (upper row), medium-sized (middle row), and large-sized (bottom row) PSs under clean and dusty conditions. The black dot on the red line indicates that the difference between clean and dusty conditions is statistically significant at the 95 % confidence level using a Student's t-test. The horizontal dashed lines show the freezing level with values labeled.
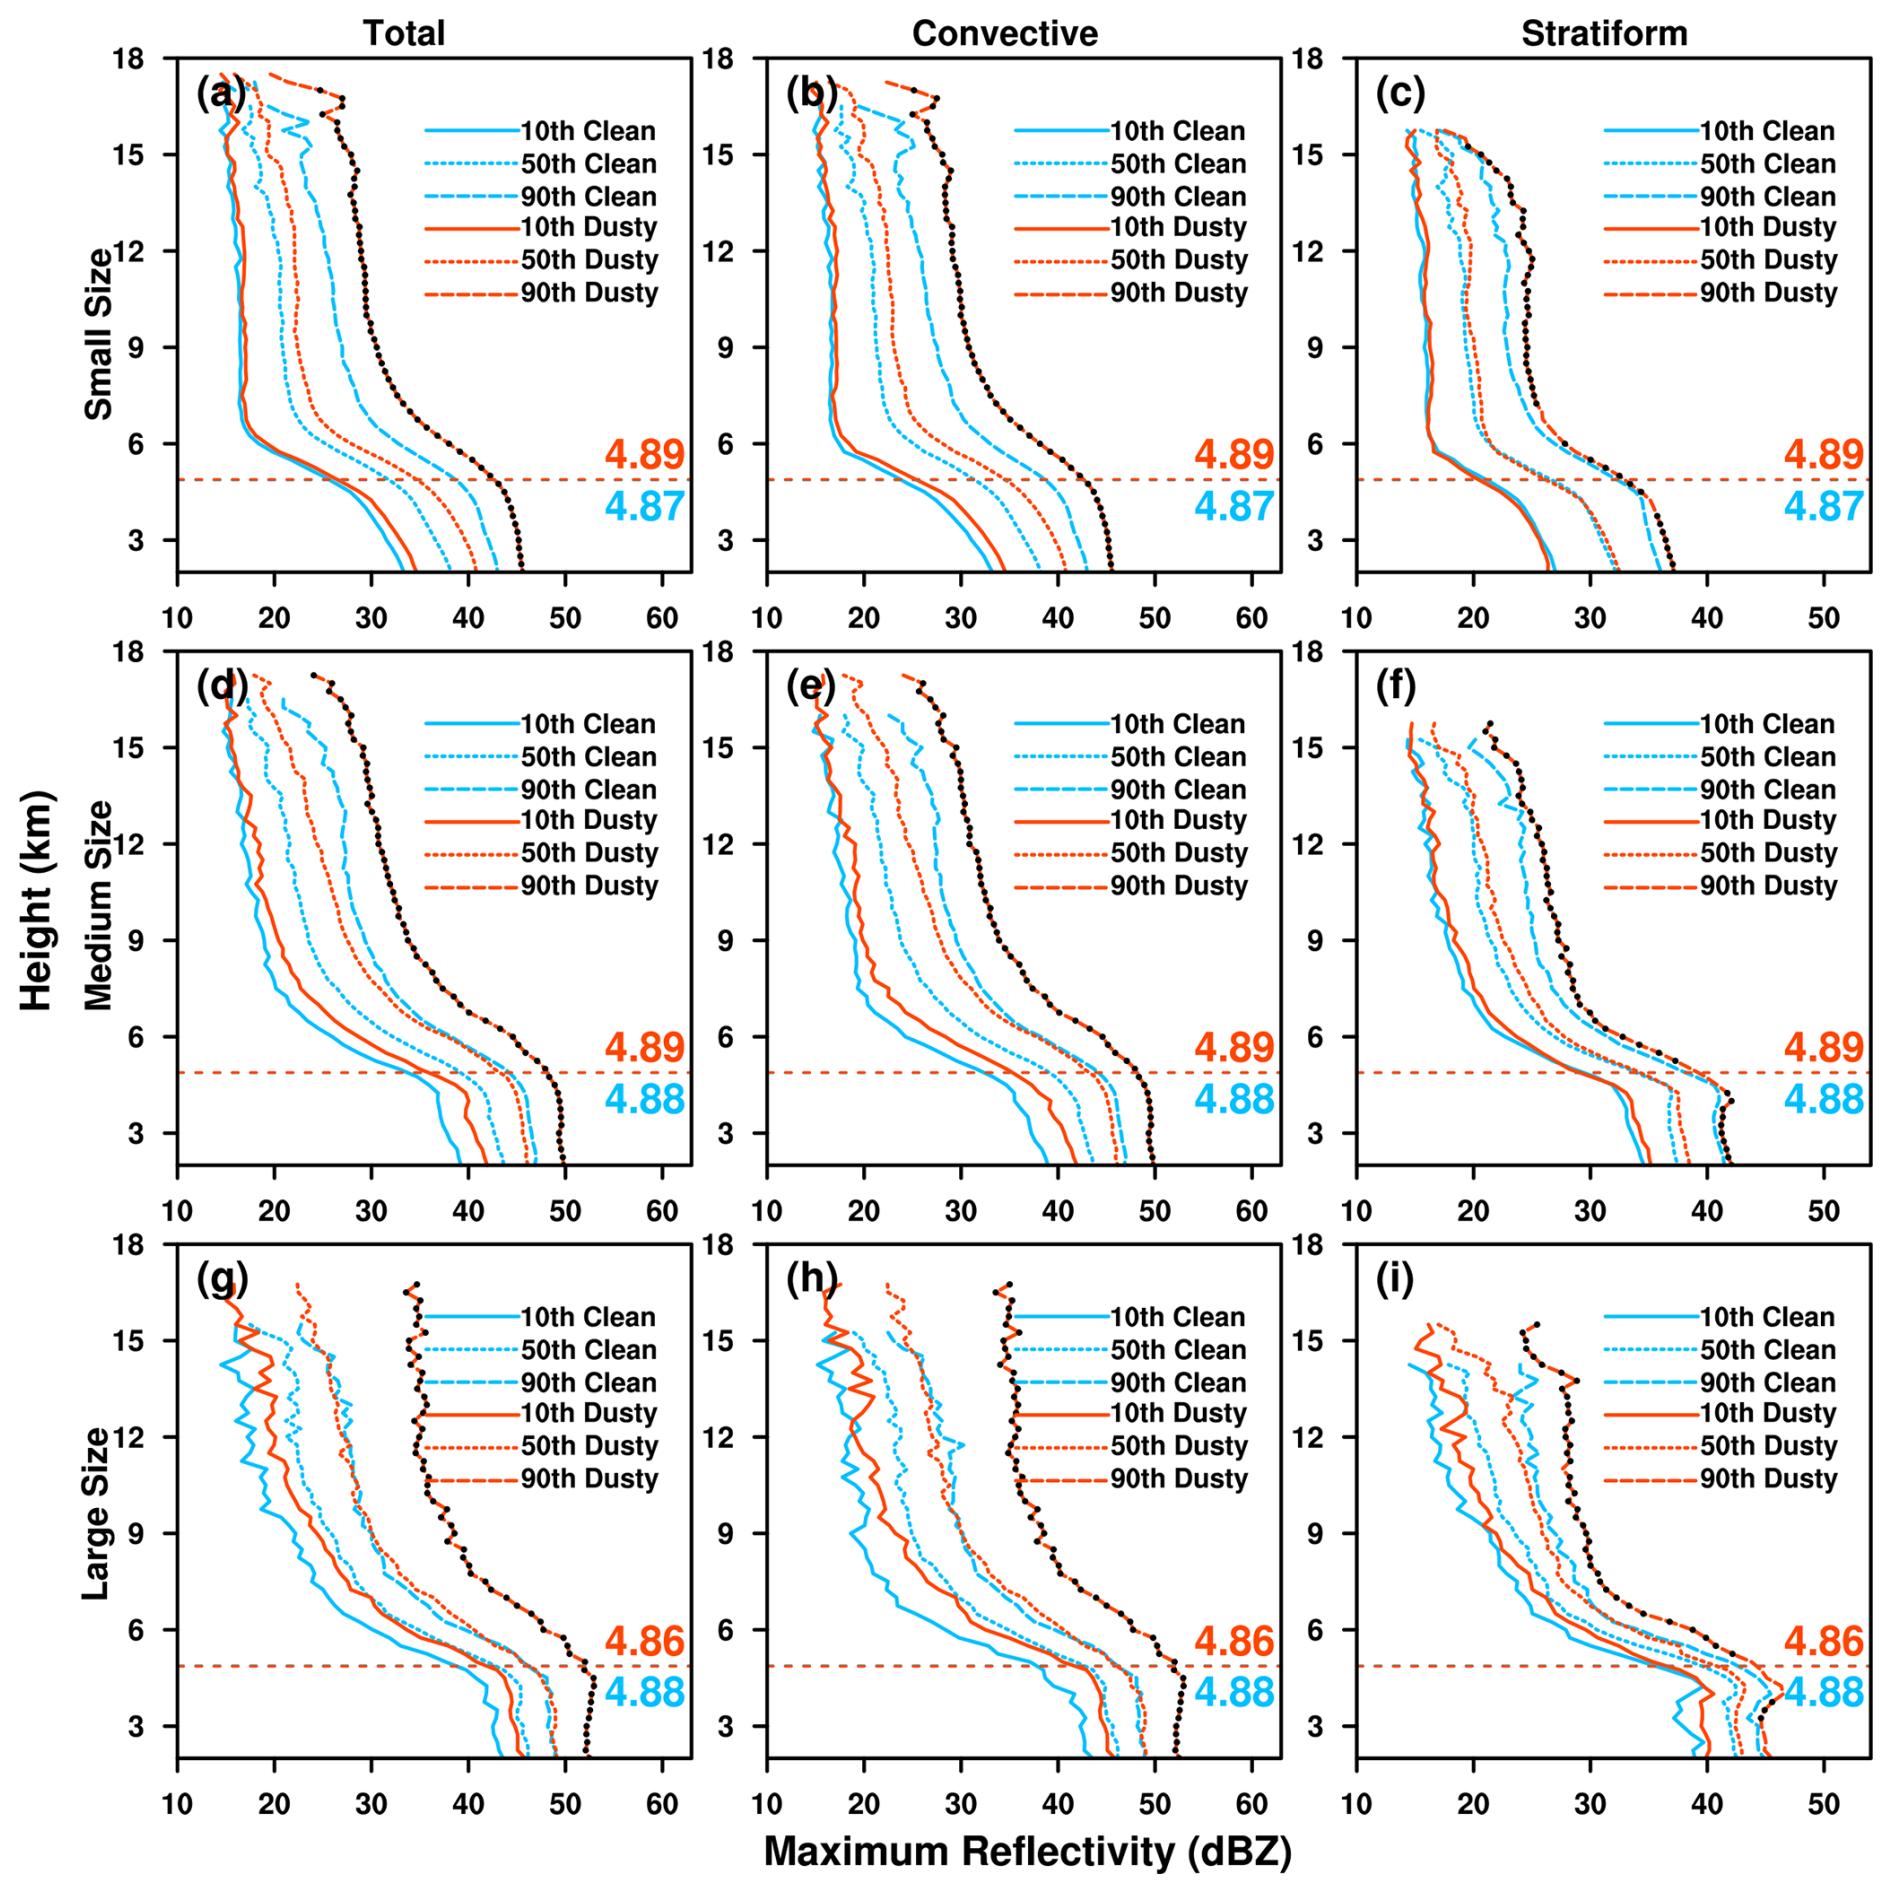
Figure 6Vertical profiles of the 10th, 50th, and 90th percentiles of PS maximum radar reflectivity for total, convective and stratiform precipitation of small-sized (upper row), medium-sized (middle row), and large-sized (bottom row) PSs under clean and dusty conditions. The horizontal dashed lines show the freezing level with values labeled. The black dot on the red line of 90th percentile profile indicates that the difference between clean and dusty conditions is statistically significant at the 95 % confidence level using a Student's t-test.
Figure 6 shows the vertical profiles of the 10th, 50th, and 90th percentiles of maximum radar reflectivities as proxies of various convective strengths (Zipser and Lutz, 1994; Xu et al., 2009). It is clearly seen that the maximum radar reflectivities at different percentiles increase at all heights in response to higher aerosol loading, regardless of PS size or precipitation type, which again suggests that dust can stimulate stronger convective activity in PSs. In addition, the difference in the 90th percentile of maximum radar reflectivity between clean and dusty conditions is greater than that for the 10th percentile. This might be explained by the fact that stronger updrafts within a well-developed PS can lift dust particles to higher altitudes more easily, and allow more smaller ice particles produced by dust IN effect to grow to larger size. Similar enhancement in convective precipitation with increasing dust aerosols have also been found in previous modeling and observational studies (van den Heever et al., 2006; Zhang et al., 2020, 2021).
3.2 Influence of meteorological conditions
It has been a great challenge to disentangle aerosol effects from meteorological conditions in observational studies (Rosenfeld et al., 2014; Zhu et al., 2023). In fact, the interactions among meteorology, precipitation and aerosols are complex. As mentioned above, the warm and dry SAL associated with dust outbreaks enhances the evaporation effect and masks the dust enhancement effect below the freezing level for 20 dBZ area of stratiform precipitation (Fig. 5). In addition, the stronger dynamic and thermodynamic conditions related to large-sized PSs could amplify the dust enhancement effect on convection, as seen in the variation of maximum radar reflectivity (Fig. 6).
On the other hand, the differences in the zonal distribution of PSs between dust-free and dust-laden scenarios (Fig. 2) may also be accompanied by variations in meteorological fields, due to the strong land-sea thermal contrast. The high surface temperatures near land and abundant moisture inflow from the ocean increase atmospheric instability in coastal areas, resulting in higher CAPE values (Roy Bhowmik et al., 2008; Alappattu and Kunhikrishnan, 2009). In this regard, Fig. S5a shows that the multi-year average CAPE is indeed higher in areas closer to the coastline. Also, it is interesting that the mean CAPE over the ocean for PSs with heavy dust is higher than that under pristine conditions (Fig. S5d). Therefore, the influence of the background field should not be ignored when studying dust effects on PSs, although in above analysis we have attempted to constrain it through classifying PSs by size.
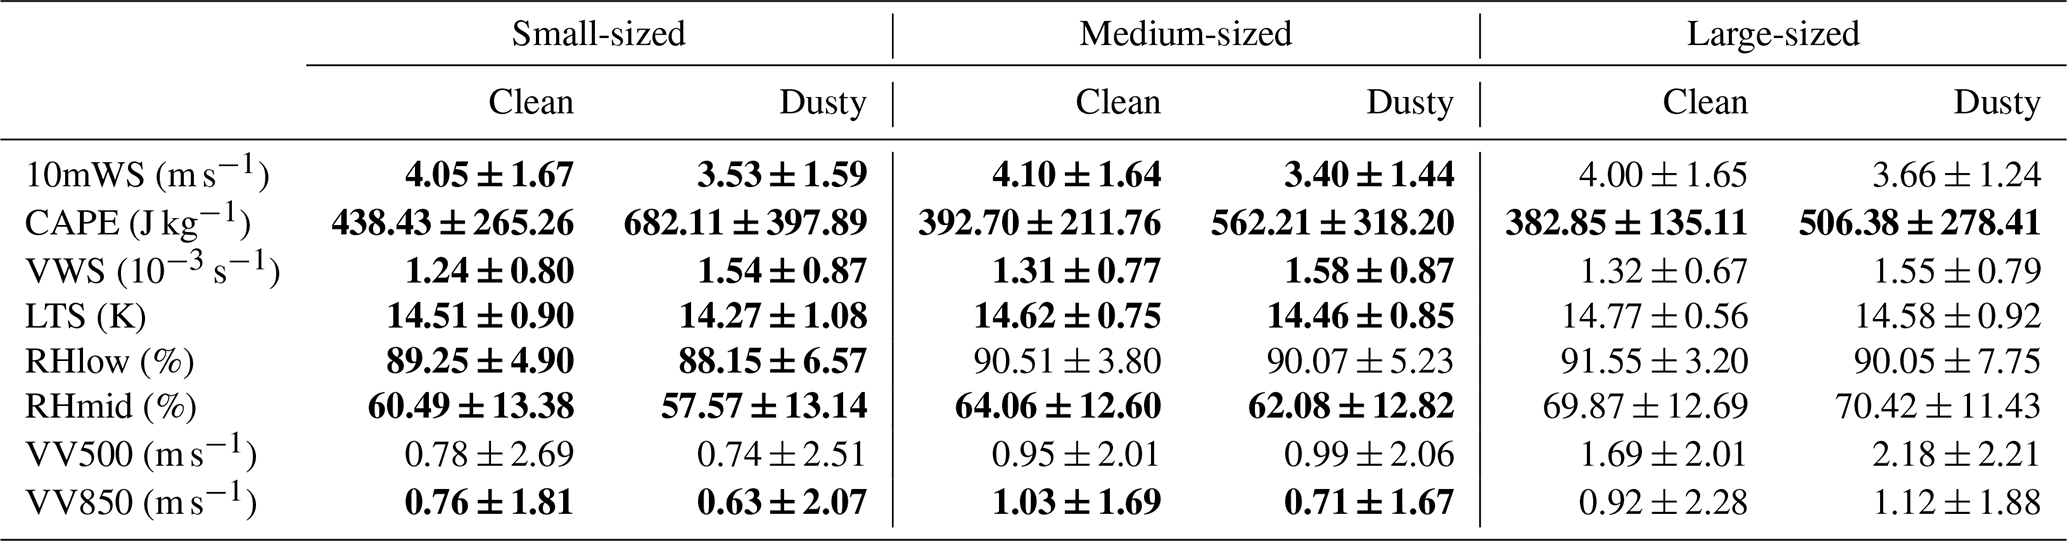
Table 4 presents the statistical results of several meteorological parameters for clean and dusty PSs of different sizes, respectively. It is remarkable that dust-affected PSs exhibit stronger thermodynamic conditions (significantly higher CAPE and lower LTS), which are more favorable for the development of PSs. Also, the VWS increases significantly, similar to previous studies (Dunion and Velden, 2004). This may be due to the fact that PSs with dust aerosol loading are mainly located in the SAL, where the midlevel African easterly jet centered near 700 hPa can greatly increase the low-level VWS. The intrusion of dry and warm air here (Dong et al., 2018) also causes lower RHmid in these PSs. On the other hand, the meteorological conditions favorable for large-sized PSs, such as strong atmospheric instability and persistent large-scale moisture transport and convergence (Zhou et al., 2013), are always similar regardless of dust concentration. In contrast, the differences in meteorological conditions between pristine and dusty conditions are more significant for small- and medium-sized PSs.
Table 4Statistical characteristics of the meteorological parameters of PSs of different sizes under clean and dusty conditions. The bold font indicates that the difference between clean and dusty conditions is statistically significant at the 95 % confidence level using a Student's t-test.
To further investigate the potential influence of meteorological conditions, the total correlations between AOD and PS characteristics, and the partial correlations with the effects of meteorological parameters eliminated are calculated (Fig. 7), similar to the methods of Xi et al. (2024). More details of the calculation method for partial correlations are given in Text S3. Generally speaking, if the partial correlation for a certain meteorological factor is similar to the corresponding total correlation, it means that this parameter does not affect the correlationship between AOD and PS characteristics. In particular, if the total correlation coefficient is high enough, this suggests that dust aerosols have a significant effect on the specific PS characteristic, regardless of the role of meteorological fields (Jiang et al., 2018; Han et al., 2022). For all sizes of PSs, all properties show a significant positive correlation with AOD, except for the near-surface precipitation area of small- and medium- sized PSs and the convective precipitation percentage of large-sized PSs. This indicates again that PSs can develop more vigorously under dusty conditions. After removing the influence of meteorological factors, except for CAPE, most of the partial correlation coefficients can still pass the significance test, maintaining the same sign phase and changing by less than 20 %. Even for CAPE, the relative change in the partial correlation coefficient to the total is less than 40 %, which suggests that dust aerosols rather than meteorological conditions contribute significantly to the observed variations in PS characteristics.
Interestingly, Zhu et al. (2023) also highlighted the important role of CAPE in the effects of dust on the vertical profiles of the precipitation growth rate in southeastern China, where stronger CAPE facilitates the vertical development of precipitation and leads to a decrease in precipitation top temperature. As mentioned earlier, CAPE values are higher in areas closer to land (Fig. S5a), which corresponds to dust-laden PSs (Fig. 2). This may be the main reason why CAPE has a greater impact on the relationship between dust aerosols and PS characteristics than other meteorological factors do.
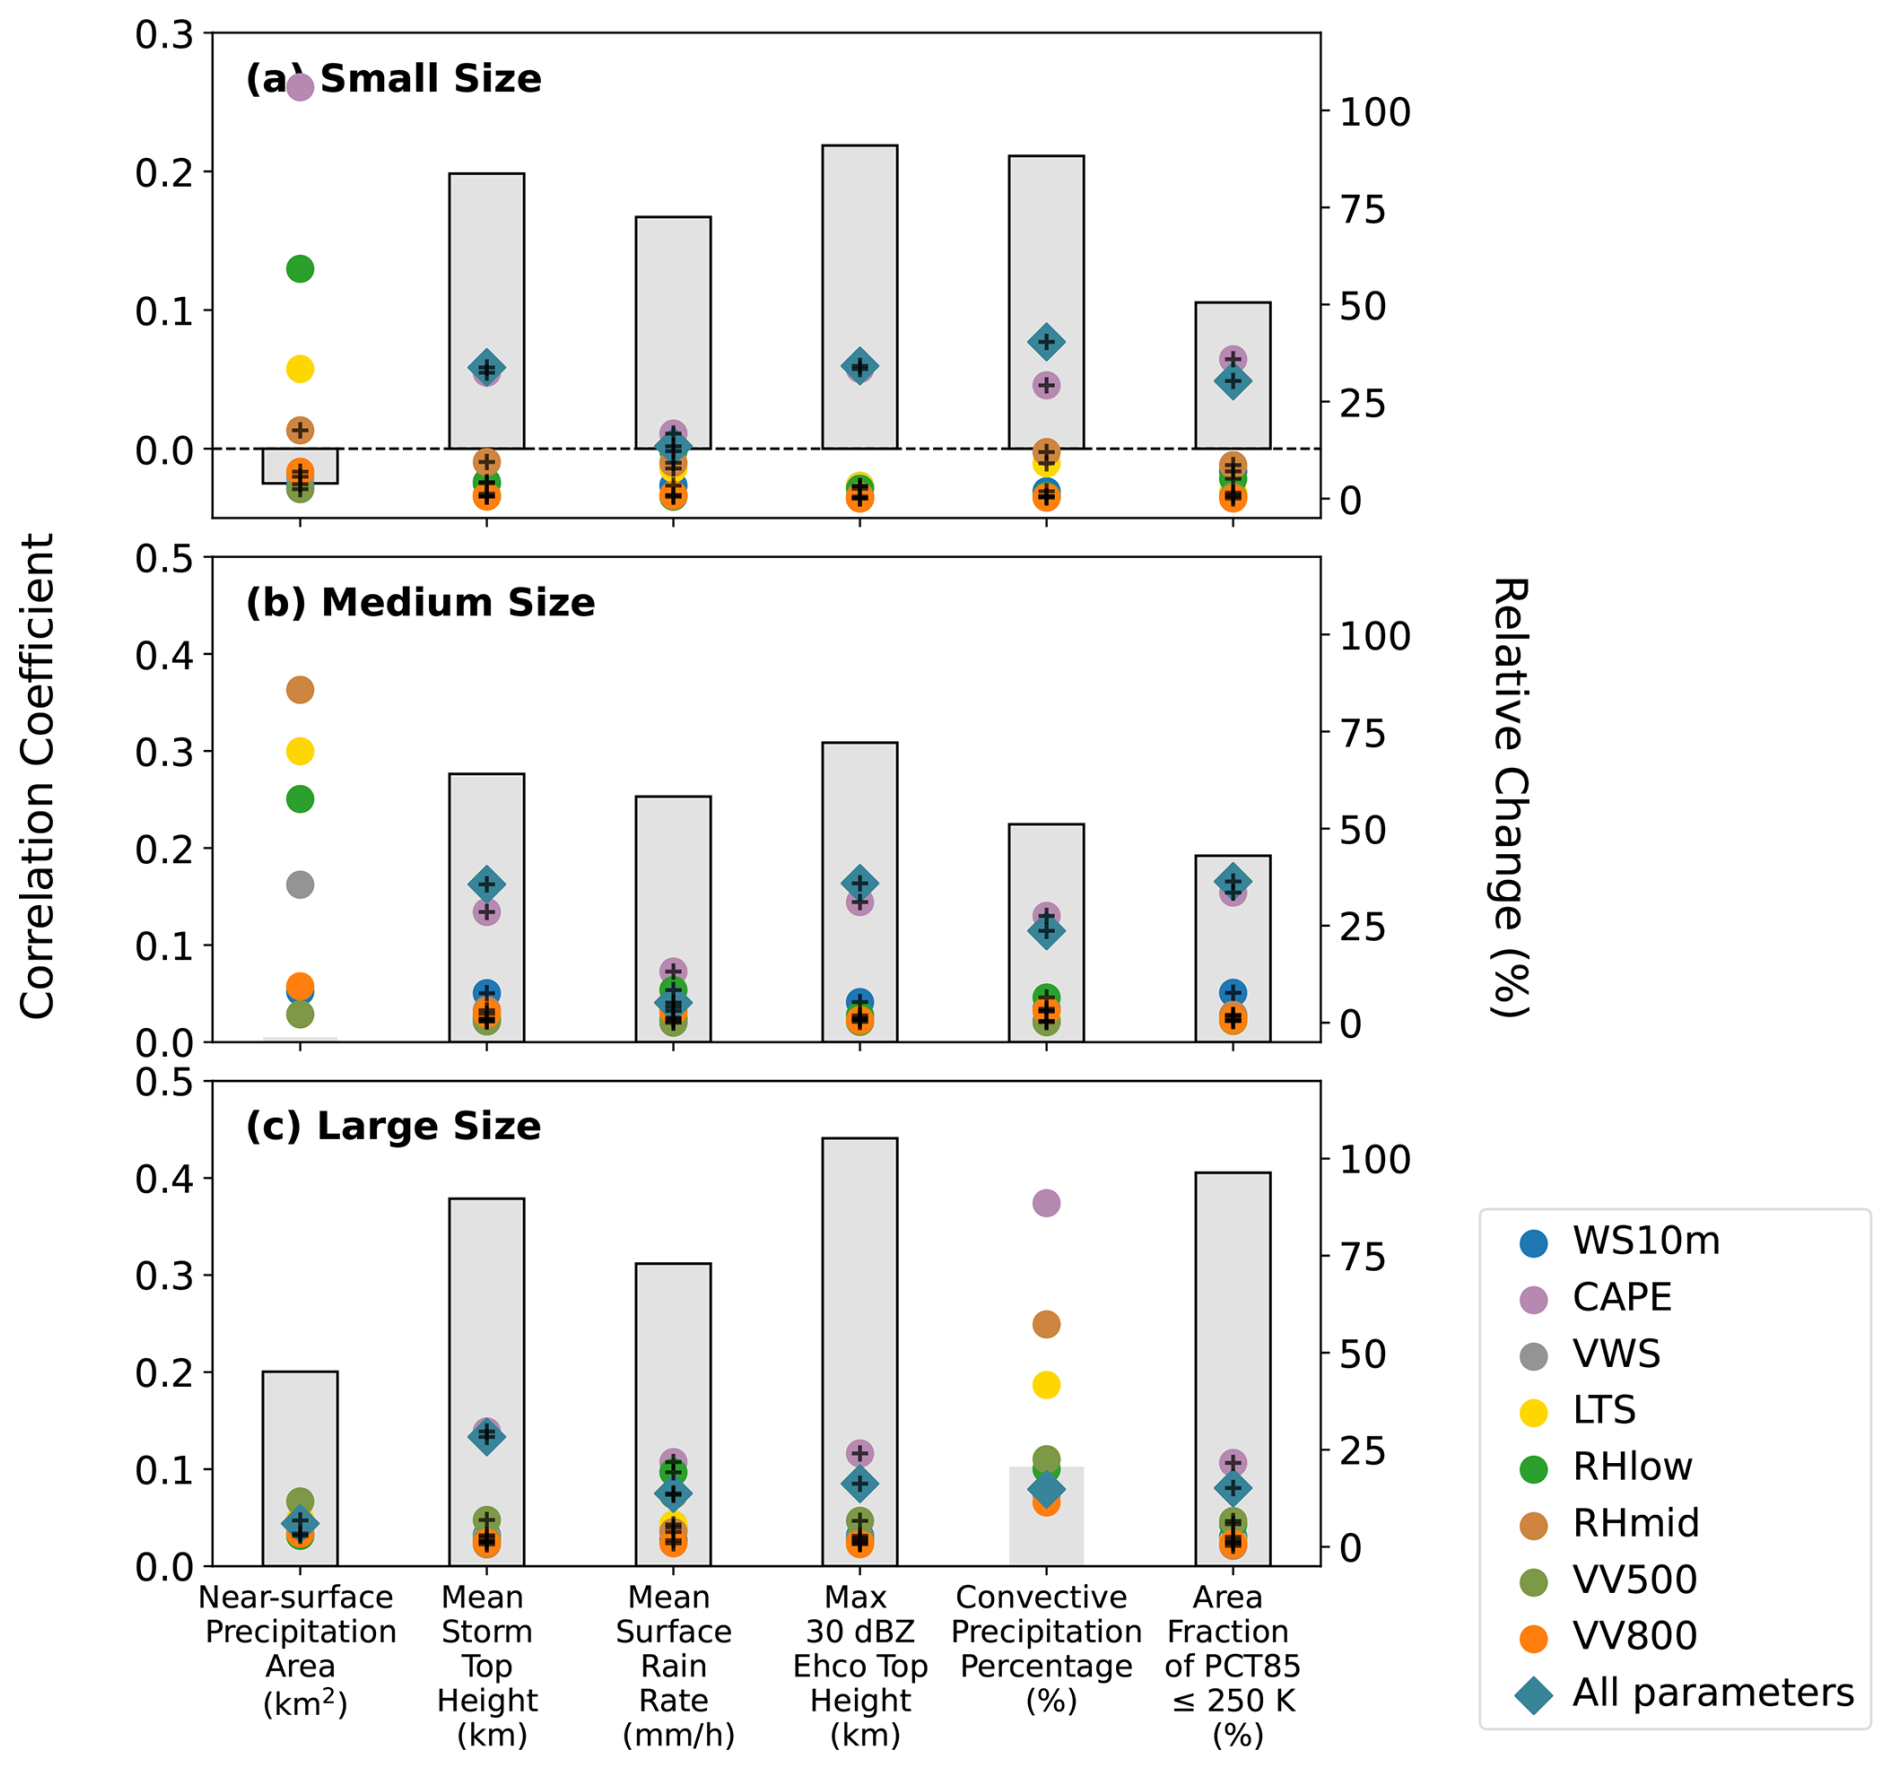
Figure 7Total correlations between AOD and PS properties (bars, left y-axis), and the relative changes in partial correlations with the effects of 8 meteorological parameters eliminated individually (colored circular markers) and totally (diamond-shaped markers), compared with total correlations (right y-axis) for (a) small-sized, (b) medium-sized and (c) large-sized PSs. The black border around grey data bar and the black cross on the marker indicate that the total correlation and the partial correlation are statistically significant at the 95 % confidence level, individually.
To clarify the influence of CAPE, PSs of each size were divided into 5 groups with similar sample numbers as CAPE increased (Table 5). Figure 8 shows the variations in the general characteristics of PSs of different sizes as a function of CAPE under clean and dusty environments, respectively. Clearly, regardless of dust loading or PS size, all the characteristics except for the near-surface precipitation area, increase with CAPE. This reflects the influence of thermodynamic conditions on PSs, as higher CAPE allows PSs to develop more vigorously. On the other hand, regardless of the CAPE group and PS size, it always shows that for dust-laden PSs, the near-surface precipitation area, mean storm top height, mean surface rain rate, maximum 30 dBZ echo top height, convective precipitation percentage and area fraction of PCT85 ≤ 250 K are higher compared to those for dust-free PSs, with most of these changes passing significance tests. This demonstrates that the enhancing effect of dust aerosols on PSs can still be observed with constrained CAPE conditions. It is noted that the sample sizes for large-sized PSs across different CAPE bins are relatively small in Table 5. This is mainly due to the lower frequency of large-sized PSs compared to smaller ones, and the limitations of the PR swath, as only untruncated PSs were selected for analysis. While significance tests were applied to the data, the limited sample sizes may affect the statistical robustness of the results, which should be interpreted with caution.
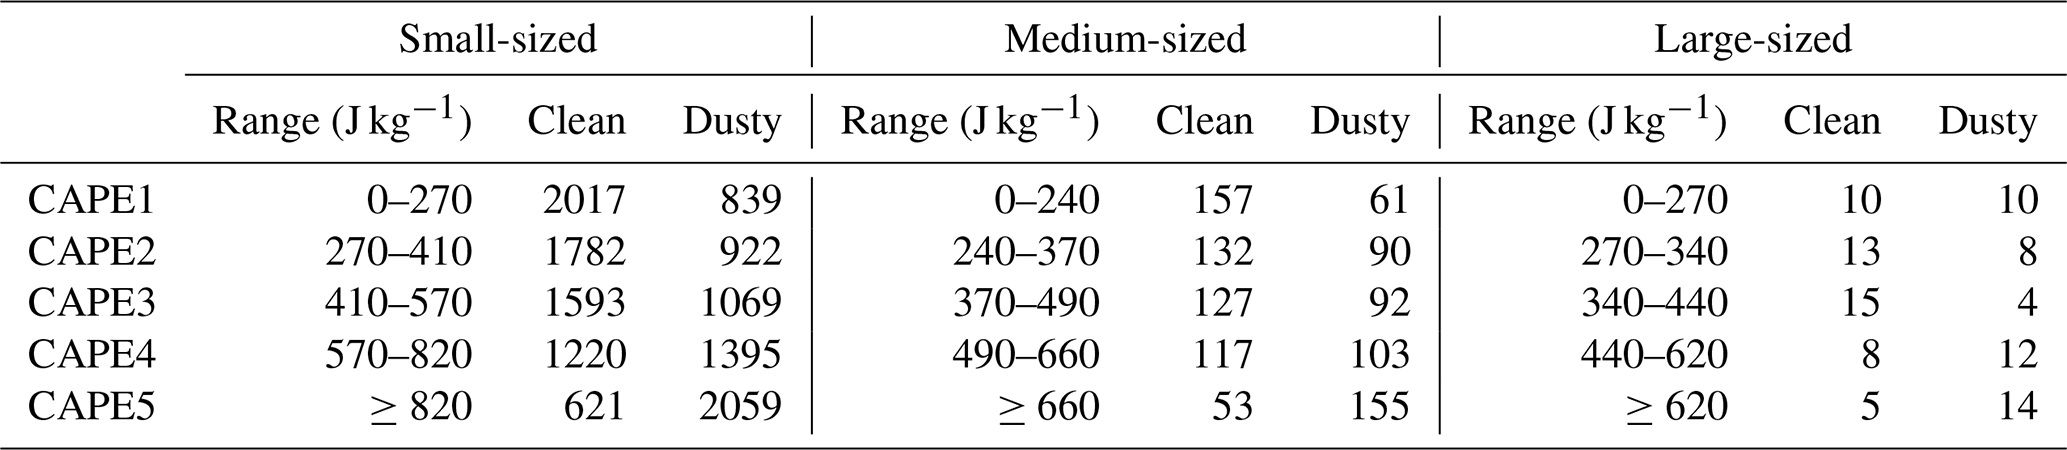
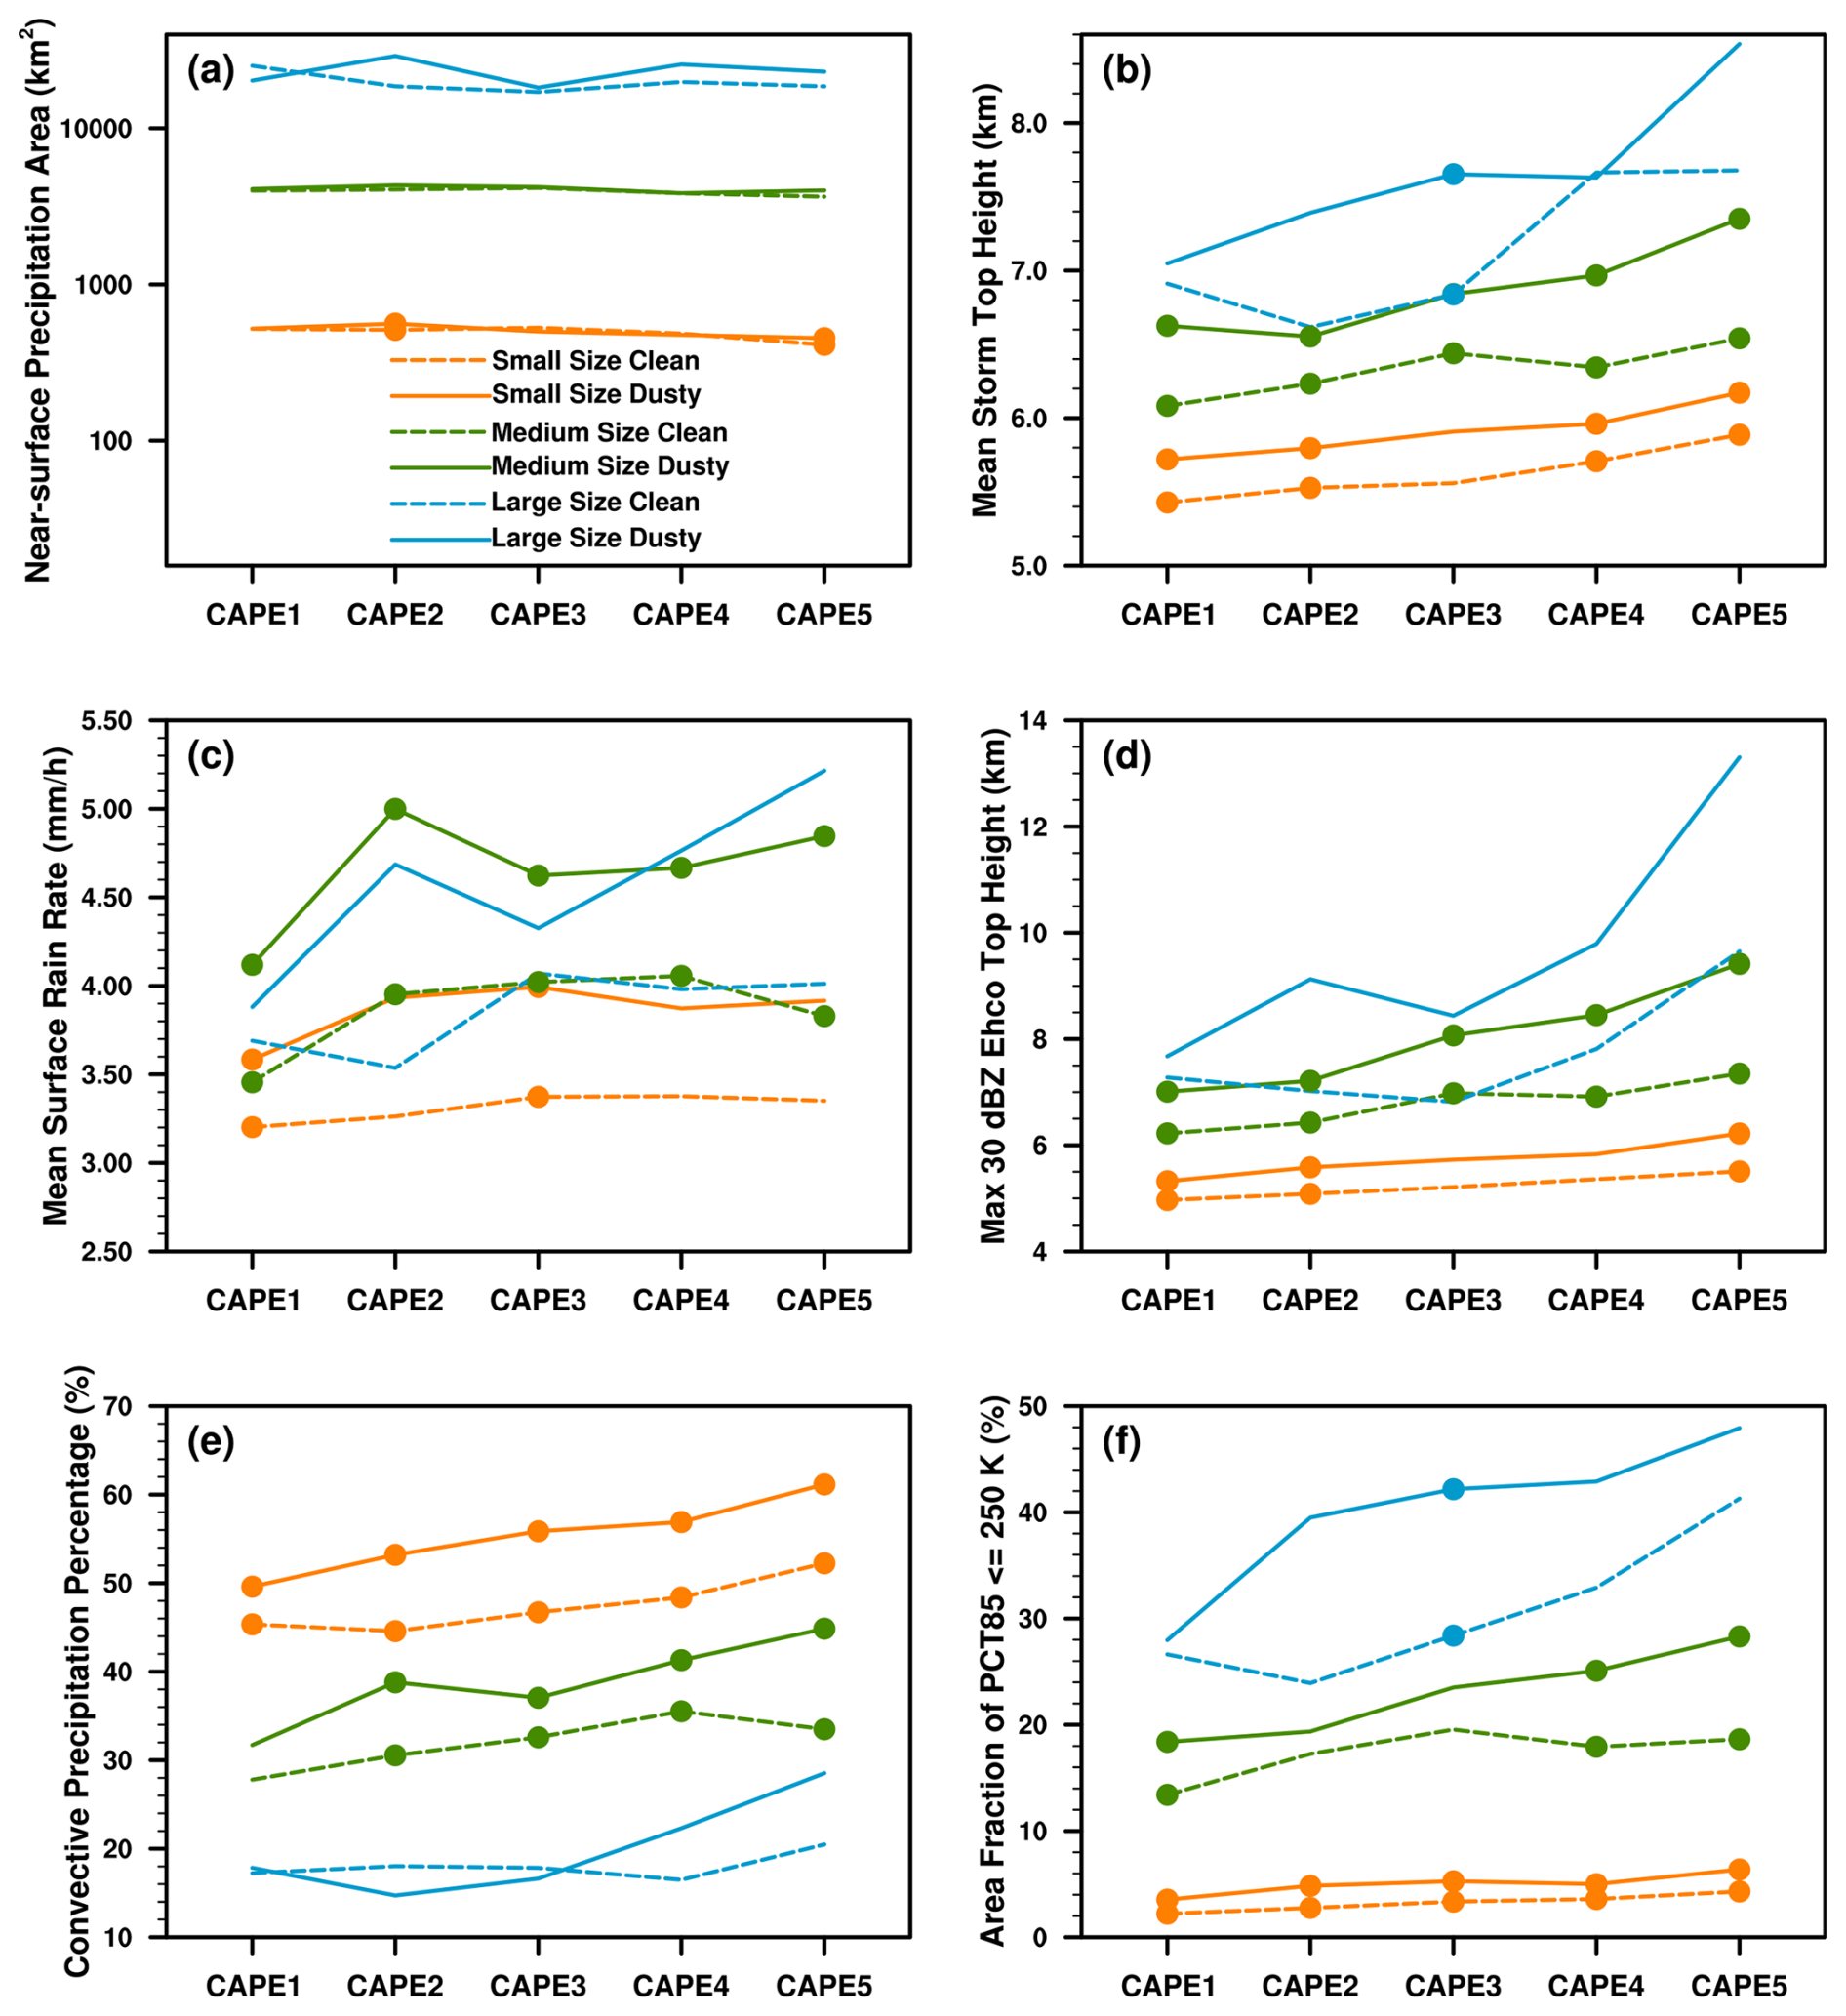
Figure 8Variations in PS properties, including (a) near-surface precipitation area (km2), (b) mean storm top height (km), (c) mean surface rain rate (mm h−1), (d) maximum 30 dBZ echo top height (km), (e) convective precipitation percentage (%) and (f) area fraction of PCT85 ≤ 250 K (%), as a function of CAPE, for different sizes of PSs under clean and dusty conditions. The orange, green, and blue lines represent small-, medium- and large-sized PSs, respectively. The dashed and solid lines represent clean and dusty conditions, respectively. The circular marker indicates that the difference between clean and dusty conditions is statistically significant at the 95 % confidence level using a Student's t-test.
Also, the differences in the 3-D structure of PSs between clean and dusty conditions with various CAPE values are shown in Figs. 9 and S6–S7, taking small-sized PSs as an example. A similar conclusion is drawn that CAPE does not substantially change the dust effect on the 3-D structure of PSs. For instance, in both convective and total precipitation, regardless of the CAPE level, dust-laden PSs have higher precipitation rates (Fig. S6), larger radar reflectivity areas (Fig. 9), and higher maximum radar reflectivity (Fig. S7) at all altitudes. This result further confirms the enhancement effect of dust aerosols on PSs. Interestingly, in both precipitation rate and radar reflectivity areas, the differences between pristine and dusty PSs increase as CAPE level rises. As shown in the partial correlation analysis, this indicates the modulation of thermodynamic conditions on the dust effects, i.e., stronger thermodynamic forcing can amplify the dust effects, leading to stronger precipitation and convective intensity.
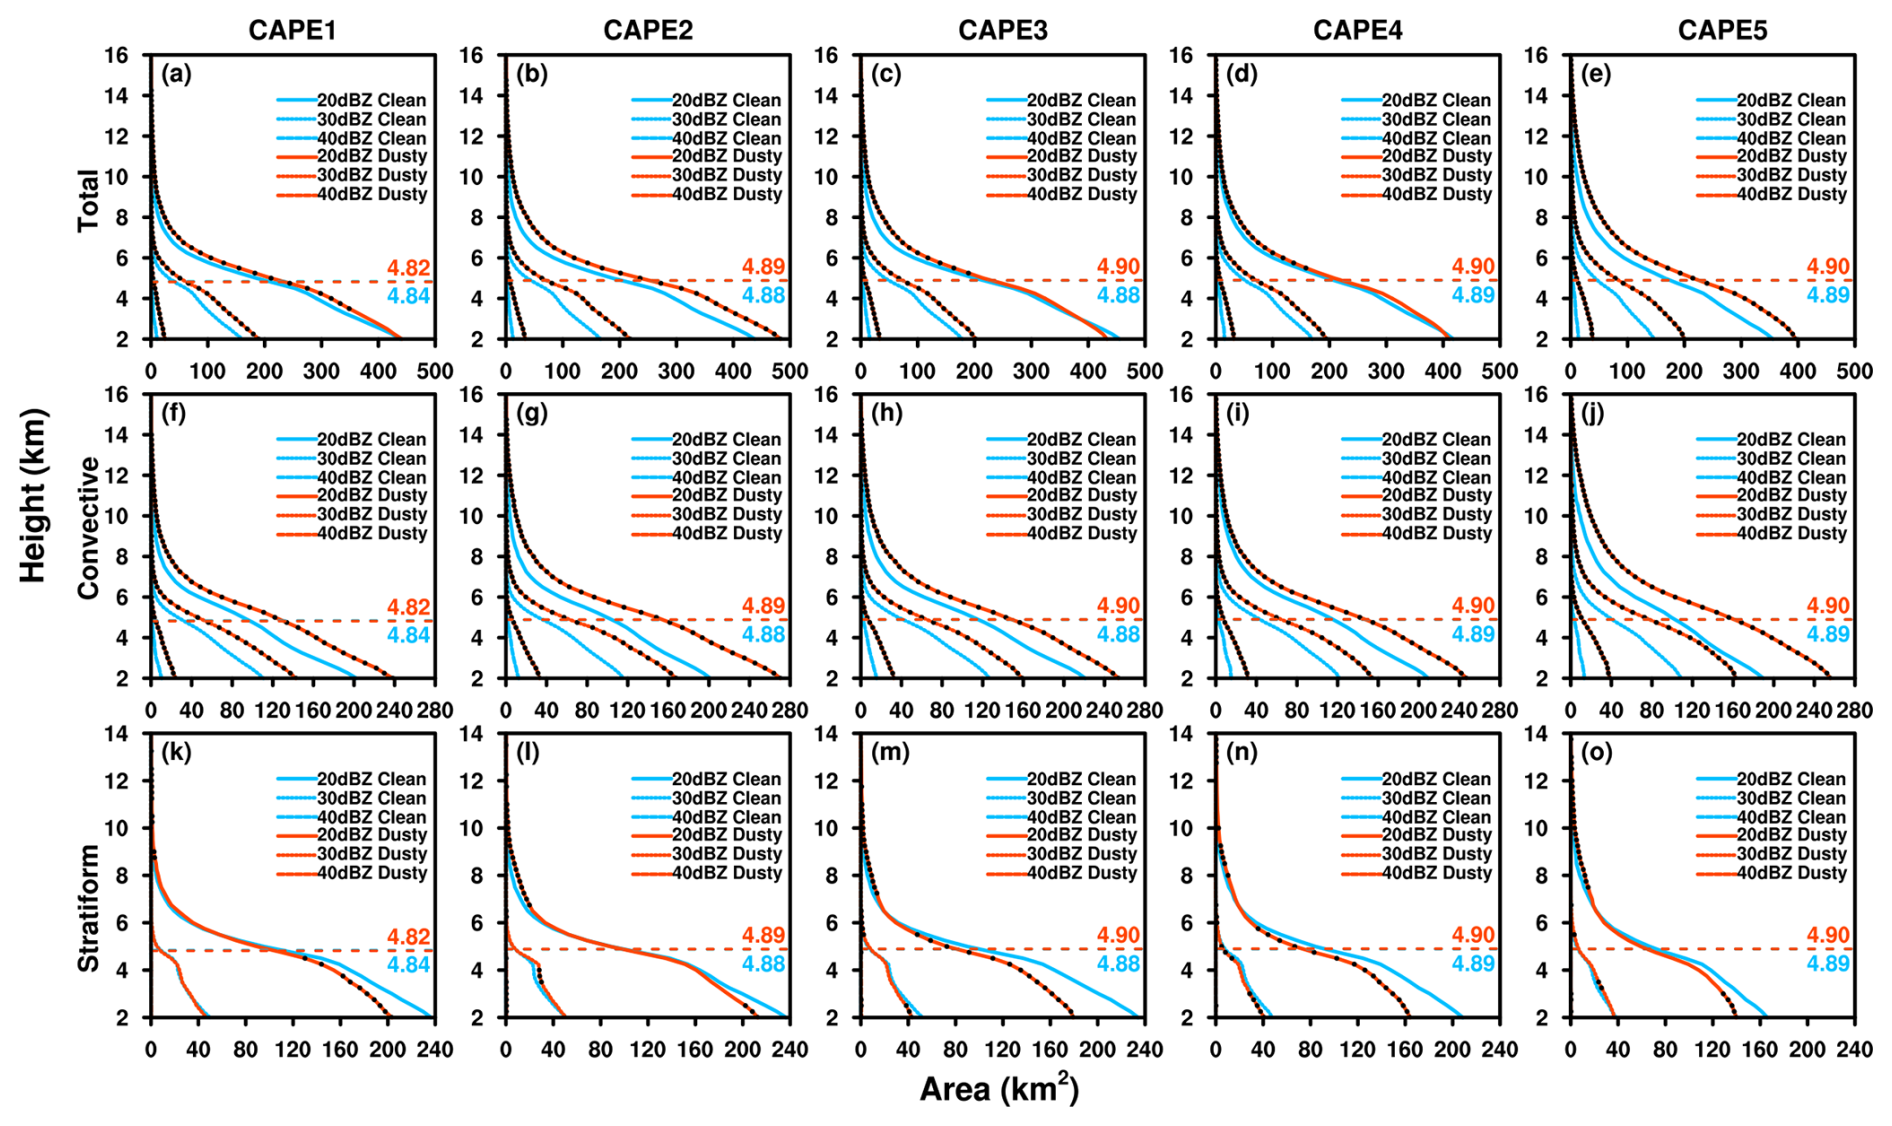
Figure 9The mean vertical profiles of 20, 30 and 40 dBZ areas for total (upper row), convective (middle row) and stratiform (bottom row) precipitation of small-sized PSs with different CAPE values under clean and dusty conditions. The black dot on the red line indicates that the difference between clean and dusty conditions is statistically significant at the 95 % confidence level using a Student's t-test. The horizontal dashed lines show the freezing level with values labeled.
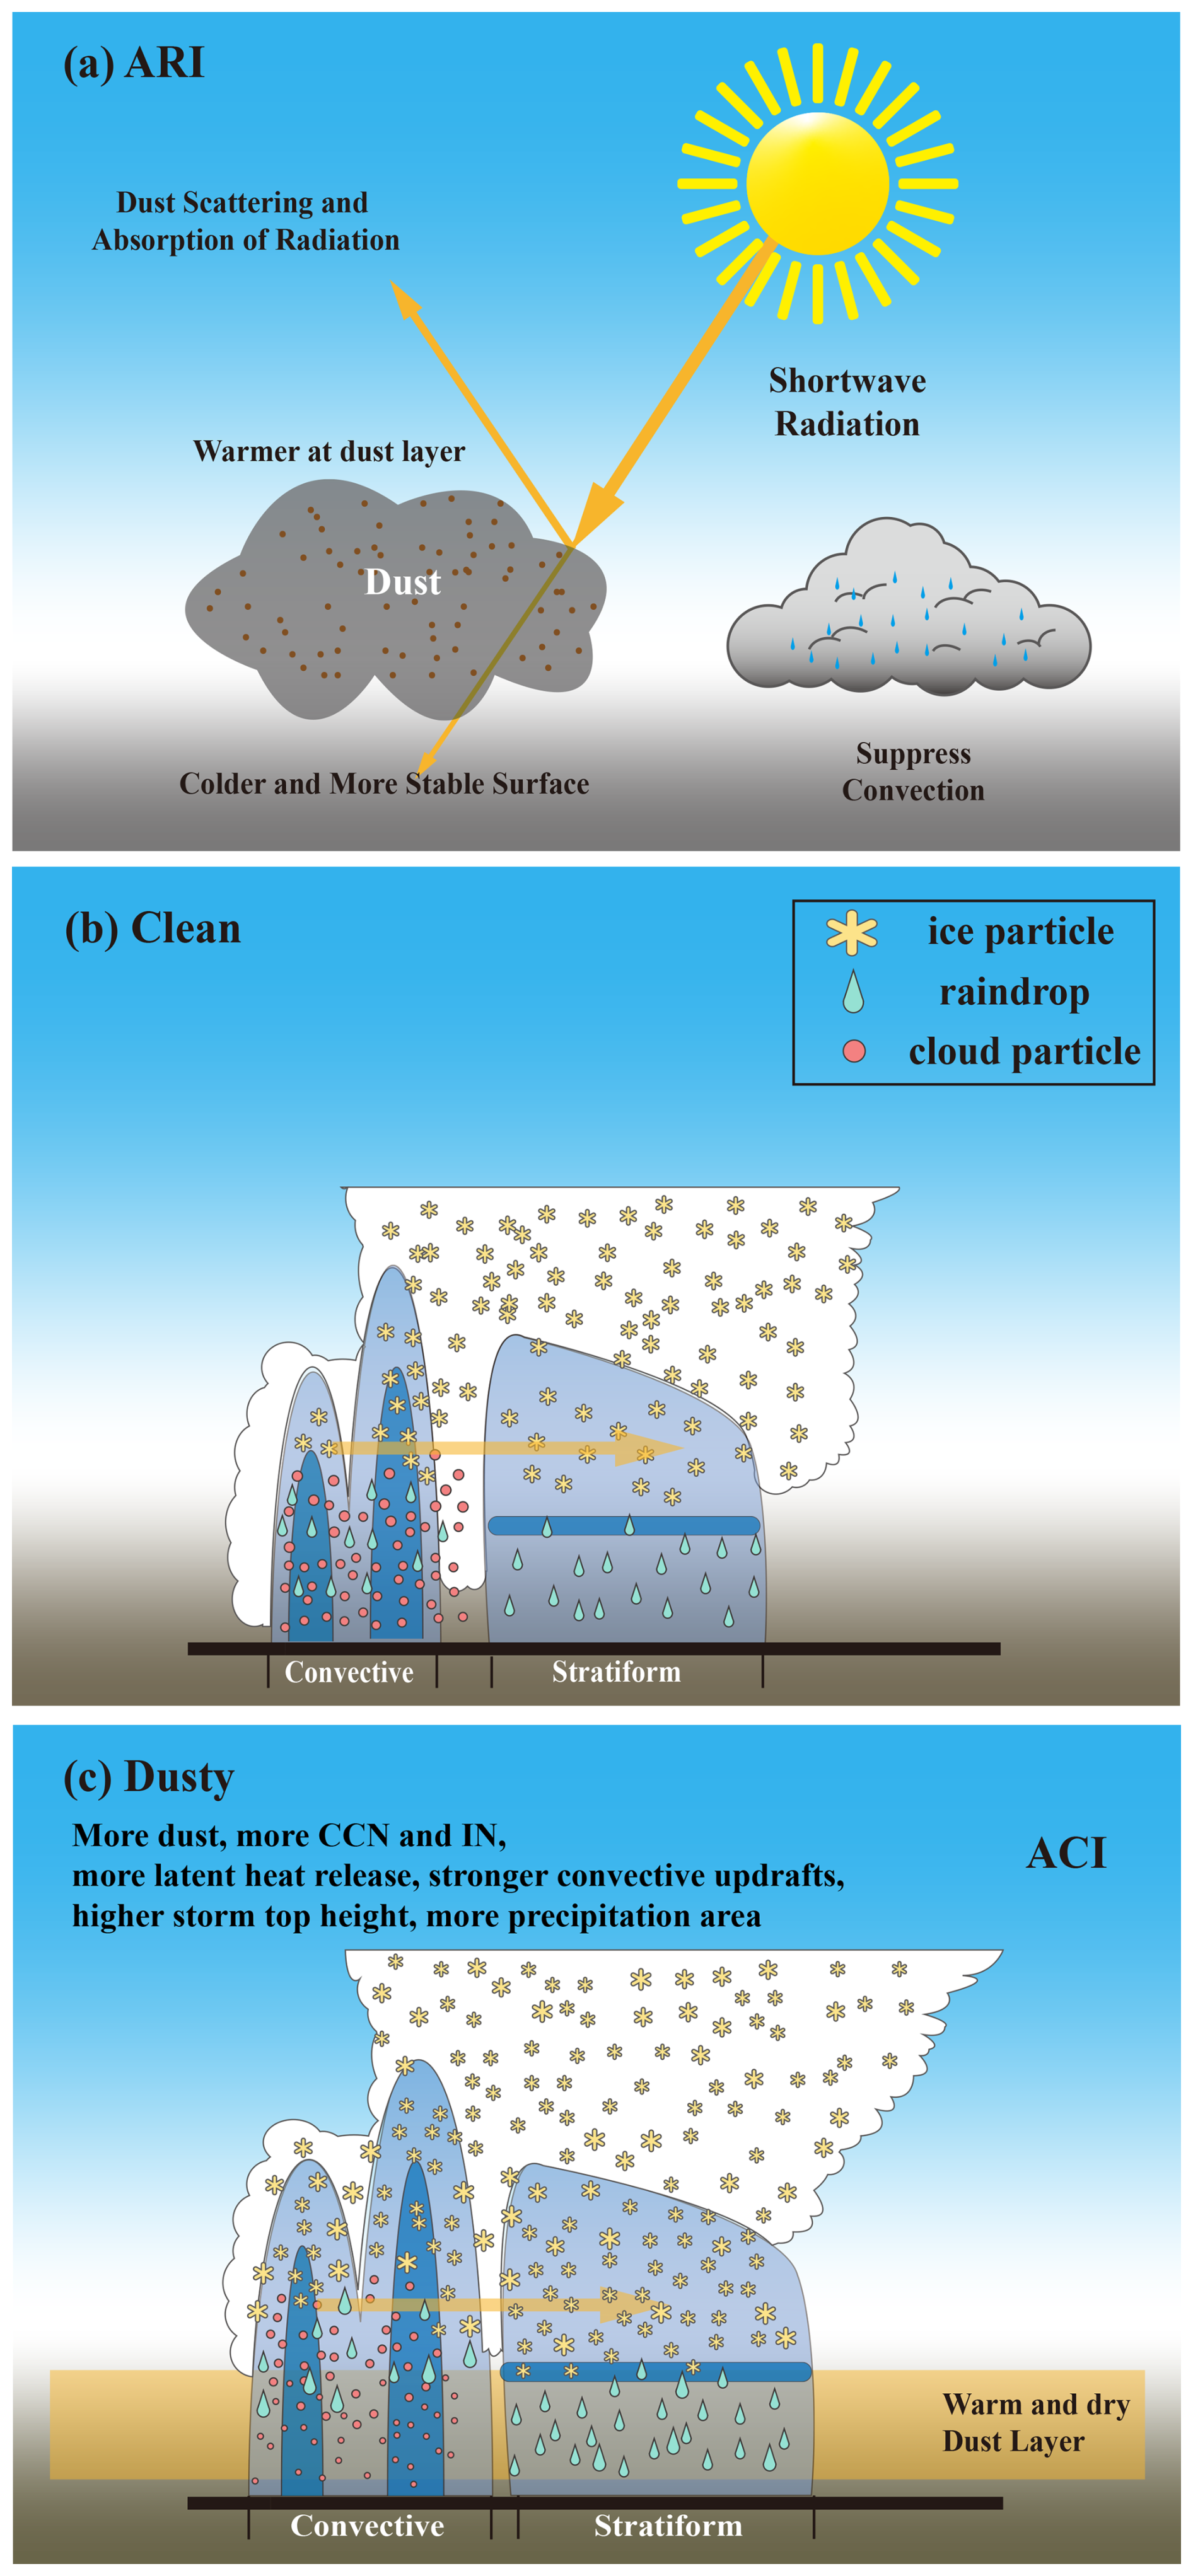
The scattering and absorption properties of dust would cause warming of the midtroposphere and cooling of the near surface, which increases low-level atmospheric stability and suppresses convection (Chaboureau and Martínez, 2018; Huang et al., 2006) (Fig. 10a). On the contrary, the microphysical effects of dust could increase the effective CCN and IN, leading to the formation of more cloud droplets and ice particles of smaller sizes. In turn, the heterogeneous freezing process is enhanced, and more numerous particles participate in depositional growth and riming, which increases latent heat release and invigorates the convective intensity of PSs thermodynamically (Gibbons et al., 2018) (Fig. 10c). Therefore, the enhancement effect of dust on PSs found in this study is more likely related to the aerosol microphysical effect rather than the radiative effects. Stronger updrafts of dust-affected PSs support the growth of more numerous particles and transport a greater number of large particles to higher altitudes in the convective core and into the adjoining stratiform regime. This results in a significant increase in the precipitation rate, maximum radar reflectivity and precipitation area at all heights in the convective regions, as well as those above the freezing level in the stratiform regions. Below the freezing level, however, due to the entrainment of ambient dry and warm air caused by the SAL, raindrops near the edge of PS are more prone to evaporation, resulting in a reduction in the stratiform precipitation area.
Although the microphysical effects are considered to play a dominant role, the possible contribution of radiative effects cannot be excluded. A few modeling studies (e.g., Cheng et al., 2019) have shown that dust radiative effects can delay convection initiation, allowing for energy accumulation, which may ultimately lead to more intense convective development once triggered. This highlights the complexity of dust radiative effects, thus it is difficult to quantify their impact using observational data. Future modeling studies will be needed to conduct sensitivity experiments to disentangle the contributions of dust radiative and microphysical effects.
It should be mentioned that the current statistical results of PSs are somewhat different from previous case studies conducted over the tropical Atlantic Ocean (Li and Min, 2010; Dong et al., 2018), where the convective precipitation rate is lower at all heights in the presence of dust aerosols. One possible reason for this discrepancy is the difference in sample size, with previous studies using cases of less than a month, compared with more than 10 years of observations here. Additionally, this study focuses on completely observed PSs that have developed to at least 6 km, whereas some other studies have mainly performed rainfall profile statistics at the pixel level (Li and Min, 2010; Dong et al., 2018). Apart from differences in data sample size and research subjects, the discrepancy may also be related to differences in the background field, such as water vapor and thermodynamic conditions. In convective regions of PSs, whether dust acts as IN or CCN, it tends to reduce the particle size and increase the particle numbers. This enhances competition for water vapor during particle growth, and reduces the efficiency of collection processes, thereby weakening precipitation when the water vapor supply is limited. Gibbons et al. (2018) found that convective cloud formation is weakened when reducing water vapor content based on simulations. In this statistical study, however, the chosen PS samples are mainly located in the ITCZ region (Fig. 2) with abundant water vapor conditions, which are favorable for particle growth and the development of convective precipitation.
Mineral dust is an important component of the Earth system. It can not only influence the global radiation budget by scattering and absorbing shortwave and longwave radiation, but also can alter cloud microphysical properties by acting as cloud condensation nuclei (CCN) and ice nuclei (IN) (Knippertz and Stuut, 2014; Ryder et al., 2019). To investigate dust effects on organized precipitation systems (PSs), a statistical comparison was conducted on the general characteristics and 3-D structure of PSs with different horizontal sizes under clean and dusty conditions over the tropical Atlantic Ocean during spring from 2003 to 2014, using long-term observations from multiple satellite-borne sensors, as well as reanalysis data.
The results show that dust aerosols can invigorate the development of PSs, with significant increases in various general characteristics, including the mean storm top height, mean surface rain rate, maximum 30 dBZ echo top height, convective precipitation percentage and area fraction of PCT85 ≤ 250 K. In terms of the 3-D structure of PSs, the precipitation rate, the precipitation area (20, 30, and 40 dBZ), and the maximum radar reflectivity with increased dust aerosols were also significantly enhanced, except for stratiform precipitation in small- and medium-sized PSs below the freezing level due to the evaporation effect. In addition, the analysis of potential meteorological influences indicates that convective available potential energy (CAPE) is the primary confounding factor for dust aerosol effects, but after constraining the variations in CAPE, significant dust-related PS changes persist.
In our study, both the CCN and IN effects of dust contribute to changes of PS properties. Given the complexity of the microphysical processes within PSs, it is challenging to clearly separate these effects based solely on observational data. For future work, we propose conducting a statistical analysis of PSs that develop in warm clouds and comparing the results with those of PSs exceeding 6 km as considered in this study. This comparison would help to understand the distinct roles of CCN and IN effect on precipitation structure.
It should be noted that the precipitation data used in this study are from the precipitation radar (PR) onboard the Tropical Rainfall Measuring Mission (TRMM) satellite. Although PR can offer a long-time span and a large sample size of PSs for statistical analysis, it cannot provide accurate precipitation particle size information, which limits our understanding of the microphysical effects of dust. Therefore, future work will utilize observations from the dual-frequency precipitation radar (DPR) on the Global Precipitation Measurement (GPM) satellite to obtain more detailed microphysical information within PSs. Also, the PR can only detect precipitation particles, not smaller cloud particles, so that the dust effects on cloud properties and cloud cover are not included in our study. This merits further analysis using more comprehensive datasets in which cloud clusters and PSs can be well matched. Our study primarily focuses on deep convective PSs with vertical development exceeding 6 km. Whether these conclusions can be extended to other types of PSs requires further investigation.
Precipitation data were obtained from the Tropical Rainfall Measuring Mission (TRMM) satellite product (https://gpm.nasa.gov/missions/trmm, NASA, 2025a). Aerosol optical depth data were obtained from the Moderate Resolution Imaging Spectroradiometer (MODIS) product (https://modis.gsfc.nasa.gov/data/, NASA, 2025b). Hourly meteorological data were obtained from European Centre for Medium-Range Weather Forecasts ERA5 reanalysis (https://www.ecmwf.int/, ECMWF, 2025).
The supplement related to this article is available online at https://doi.org/10.5194/acp-26-15-2026-supplement.
JX: Conceptualization, Methodology, Validation, Formal analysis, Software, Visualization, Writing – Original Draft. YW: Conceptualization, Methodology, Validation, Formal analysis, Writing – Original Draft, Project administration, Supervision, Funding acquisition. RL: Conceptualization, Methodology, Validation, Formal analysis, Writing – Original Draft. BW: Software. XF, XM and ZM: Writing – Original Draft.
The contact author has declared that none of the authors has any competing interests.
Publisher’s note: Copernicus Publications remains neutral with regard to jurisdictional claims made in the text, published maps, institutional affiliations, or any other geographical representation in this paper. While Copernicus Publications makes every effort to include appropriate place names, the final responsibility lies with the authors. Views expressed in the text are those of the authors and do not necessarily reflect the views of the publisher.
We are greatly appreciative of NASA for providing the Precipitation Radar (PR) level-2 product 2A25, TRMM Microwave Imager (TMI) level-1 product 1CTRMMTMI, and Moderate Resolution Imaging Spectroradiometer (MODIS) level-3 daily aerosol optical depth (AOD) products (MOD08_D3/MYD08_D3). We are grateful to European Centre for Medium-Range Weather Forecasts (ECMWF) for providing the fifth generation ECMWF atmospheric reanalysis of the global climate (ERA5) product.
This research has been supported by the National Key Research and Development Program of China (grant no. 2022YFC3104303); the Meteorological Joint Fund of the National Natural Science Foundation of China (grant no. U2542205); Anhui Provincial Key Research and Development Project (grant no. 2408055UQ005); the China Meteorological Administration Science the Technology Projects (grant no. CMAJBGS202502).
This paper was edited by Shaocheng Xie and reviewed by two anonymous referees.
Alappattu, D. P. and Kunhikrishnan, P.: Premonsoon estimates of convective available potential energy over the oceanic region surrounding the Indian subcontinent, J. Geophys. Res. Atmos., 114, D08108, https://doi.org/10.1029/2008JD011521, 2009.
Awaka, J., Iguchi, T., and Okamoto, K.: TRMM PR standard algorithm 2A23 and its performance on bright band detection, J. Meteor. Soc. Japan, 87A, 31–52, https://doi.org/10.2151/jmsj.87A.31, 2009.
Barnes, W. L., Xiong, X., and Salomonson, V. V.: Status of terra MODIS and aqua MODIS, Adv. Space Res., 32, 2099–2106, https://doi.org/10.1016/S0273-1177(03)90529-1, 2003.
Barreto, Á., Cuevas, E., García, R. D., Carrillo, J., Prospero, J. M., Ilić, L., Basart, S., Berjón, A. J., Marrero, C. L., Hernández, Y., Bustos, J. J., Ničković, S., and Yela, M.: Long-term characterisation of the vertical structure of the Saharan Air Layer over the Canary Islands using lidar and radiosonde profiles: implications for radiative and cloud processes over the subtropical Atlantic Ocean, Atmos. Chem. Phys., 22, 739–763, https://doi.org/10.5194/acp-22-739-2022, 2022.
Braun, S. A.: Reevaluating the role of the Saharan Air Layer in Atlantic tropical cyclogenesis and evolution, Mon. Weather Rev., 138, 2007–2037, https://doi.org/10.1175/2009mwr3135.1, 2010.
Chaboureau, J. and Martínez, I. R.: Precipitation and mesoscale convective systems: radiative impact of dust over northern Africa, Mon. Weather Rev., 146, 3011–3029, https://doi.org/10.1175/mwr-d-18-0103.1, 2018.
Chen, B., Liu, C., and Mapes, B. E.: Relationships between large precipitating systems and atmospheric factors at a grid scale, J. Atmos. Sci., 74, 531–552, https://doi.org/10.1175/jas-d-16-0049.1, 2017.
Chen, Q., Yin, Y., Jiang, H., Chu, Z., Xue, L., Shi, R., Zhang, X., and Chen, J.: The roles of mineral dust as cloud condensation nuclei and ice nuclei during the evolution of a hail storm, J. Geophys. Res. Atmos., 124, 14262–14284, https://doi.org/10.1029/2019jd031403, 2019.
Chen, Q., Fan, J., Yin, Y., and Han, B.: Aerosol impacts on mesoscale convective systems forming under different vertical wind shear conditions, J. Geophys. Res. Atmos., 125, e2018JD030027, https://doi.org/10.1029/2018jd030027, 2020.
Cheng, C.-T., Chen, J.-P., Tsai, I. C., Lee, H.-H., Matsui, T., Earl, K., Lin, Y.-C., Chen, S.-H., and Huang, C.-C.: Impacts of dust–radiation versus dust–cloud interactions on the development of a modeled mesoscale convective system over North Africa, Mon. Weather Rev., 147, 3301–3326, https://doi.org/10.1175/mwr-d-18-0459.1, 2019.
Choobari, O. A., Zawar-Reza, P., and Sturman, A.: The global distribution of mineral dust and its impacts on the climate system: a review, Atmos. Res., 138, 152–165, https://doi.org/10.1016/j.atmosres.2013.11.007, 2014.
Christopher, S. A. and Gupta, P.: Satellite remote sensing of particulate matter air quality: the cloud-cover problem, J. Air Waste Manag. Assoc., 60, 596–602, https://doi.org/10.3155/1047-3289.60.5.596, 2012.
Cziczo, D. J., Froyd, K. D., Hoose, C., Jensen, E. J., Diao, M. H., Zondlo, M. A., Smith, J. B., Twohy, C. H., and Murphy, D. M.: Clarifying the dominant sources and mechanisms of cirrus cloud formation, Science, 340, 1320–1324, https://doi.org/10.1126/science.1234145, 2013.
DeMott, P. J., Sassen, K., Poellot, M. R., Baumgardner, D., Rogers, D. C., Brooks, S. D., Prenni, A. J., and Kreidenweis, S. M.: African dust aerosols as atmospheric ice nuclei, Geophys. Res. Lett., 30, https://doi.org/10.1029/2003gl017410, 2003.
Dong, X., Li, R., Wang, Y., Fu, Y., and Zhao, C.: Potential impacts of Sahara dust aerosol on rainfall vertical structure over the Atlantic Ocean as identified from EOF analysis, J. Geophys. Res. Atmos., 123, 8850–8868, https://doi.org/10.1029/2018jd028500, 2018.
Douglas, A. and L'Ecuyer, T.: Global evidence of aerosol-induced invigoration in marine cumulus clouds, Atmos. Chem. Phys., 21, 15103–15114, https://doi.org/10.5194/acp-21-15103-2021, 2021.
Dunion, J. P. and Velden, C. S.: The impact of the Saharan air layer on Atlantic tropical cyclone activity, Bull. Am. Meteorol. Soc., 85, 353-366, https://doi.org/10.1175/bams-85-3-353, 2004.
ECMWF: ECMWF Reanalysis v5, ECMWF, https://www.ecmwf.int/ (last access: 18 December 2025), 2025.
Fan, X., Wu, B., Wang, Y., and Xi, J.: Diurnal cycles of rain storms over South China during the presummer rainy season, Atmos. Res., 310, 107641, https://doi.org/10.1016/j.atmosres.2024.107641, 2024.
French, J., Geerts, B., and Wang, Y.: Dynamics of the cumulus cloud margin: an observational study, J. Atmos. Sci., 66, 3660–3677, https://doi.org/10.1175/2009jas3129.1, 2009.
Fu, Y. and Liu, G.: The variability of tropical precipitation profiles and its impact on microwave brightness temperatures as inferred from TRMM data, J. Appl. Meteorol., 40, 2130-2143, https://doi.org/10.1175/1520-0450(2001)040<2130:Tvotpp>2.0.Co;2, 2001.
Fu, Y., Liu, Q., Gao, Y., Hong, X., Zi, Y., Zheng, Y., Li, R., and Heng, Z.: A feasible method for merging the TRMM microwave imager and precipitation radar data, J. Quant. Spectrosc. Ra., 122, 155–169, https://doi.org/10.1016/j.jqsrt.2012.08.028, 2013.
Fu, Y., Chen, Y., Zhang, X., Wang, Y., Li, R., Liu, Q., Zhong, L., Zhang, Q., and Zhang, A.: Fundamental characteristics of tropical rain cell structures as measured by TRMM PR, J. Meteorol. Res., 34, 1129–1150, https://doi.org/10.1007/s13351-020-0035-5, 2021.
Gibbons, M., Min, Q., and Fan, J.: Investigating the impacts of Saharan dust on tropical deep convection using spectral bin microphysics, Atmos. Chem. Phys., 18, 12161–12184, https://doi.org/10.5194/acp-18-12161-2018, 2018.
Guo, J., Su, T., Li, Z., Miao, Y., Li, J., Liu, H., Xu, H., Cribb, M., and Zhai, P.: Declining frequency of summertime local-scale precipitation over eastern China from 1970 to 2010 and its potential link to aerosols, Geophys. Res. Lett., 44, 5700–5708, https://doi.org/10.1002/2017gl073533, 2017.
Guo, J., Su, T., Chen, D., Wang, J., Li, Z., Lv, Y., Guo, X., Liu, H., Cribb, M., and Zhai, P.: Declining summertime local-scale precipitation frequency over China and the United States, 1981–2012: the disparate roles of aerosols, Geophys. Res. Lett., 46, 13281–13289, https://doi.org/10.1029/2019gl085442, 2019.
Guo, J., Liu, H., Li, Z., Rosenfeld, D., Jiang, M., Xu, W., Jiang, J. H., He, J., Chen, D., Min, M., and Zhai, P.: Aerosol-induced changes in the vertical structure of precipitation: a perspective of TRMM precipitation radar, Atmos. Chem. Phys., 18, 13329–13343, https://doi.org/10.5194/acp-18-13329-2018, 2018.
Han, X., Zhao, B., Lin, Y., Chen, Q., Shi, H., Jiang, Z., Fan, X., Wang, J., Liou, K. N., and Gu, Y.: Type-dependent impact of aerosols on precipitation associated with deep convective cloud over East Asia, J. Geophys. Res. Atmos., 127, e2021JD036127, https://doi.org/10.1029/2021jd036127, 2022.
Hersbach, H., Bell, B., Berrisford, P., Hirahara, S., Horányi, A., Muñoz-Sabater, J., Nicolas, J., Peubey, C., Radu, R., Schepers, D., Simmons, A., Soci, C., Abdalla, S., Abellan, X., Balsamo, G., Bechtold, P., Biavati, G., Bidlot, J., Bonavita, M., Chiara, G., Dahlgren, P., Dee, D., Diamantakis, M., Dragani, R., Flemming, J., Forbes, R., Fuentes, M., Geer, A., Haimberger, L., Healy, S., Hogan, R. J., Hólm, E., Janisková, M., Keeley, S., Laloyaux, P., Lopez, P., Lupu, C., Radnoti, G., Rosnay, P., Rozum, I., Vamborg, F., Villaume, S., and Thépaut, J. N.: The ERA5 global reanalysis, Q. J. R. Meteorol. Soc., 146, 1999–2049, https://doi.org/10.1002/qj.3803, 2020.
Houze, R. A.: Nimbostratus and the separation of convective and stratiform precipitation, in: International geophysics, edited by: Houze, R. A., Academic Press, 141–163, https://doi.org/10.1016/B978-0-12-374266-7.00006-8, 2014.
Huang, C. C., Chen, S. H., Lin, Y. C., Earl, K., Matsui, T., Lee, H. H., Tsai, I. C., Chen, J. P., and Cheng, C. T.: Impacts of dust-radiation versus dust-cloud interactions on the development of a modeled mesoscale convective system over North Africa, Mon. Weather Rev., 147, 3301–3326, https://doi.org/10.1175/mwr-d-18-0459.1, 2019.
Huang, J., Minnis, P., Lin, B., Wang, T., Yi, Y., Hu, Y., Sun-Mack, S., and Ayers, K.: Possible influences of Asian dust aerosols on cloud properties and radiative forcing observed from MODIS and CERES, Geophys. Res. Lett., 33, L06824, https://doi.org/10.1029/2005gl024724, 2006.
Jiang, J. H., Su, H., Huang, L., Wang, Y., Massie, S., Zhao, B., Omar, A., and Wang, Z.: Contrasting effects on deep convective clouds by different types of aerosols, Nat. Commun., 9, 3874, https://doi.org/10.1038/s41467-018-06280-4, 2018.
Kaufman, Y. J., Koren, I., Remer, L. A., Rosenfeld, D., and Rudich, Y.: The effect of smoke, dust, and pollution aerosol on shallow cloud development over the Atlantic Ocean, Proc. Natl. Acad. Sci. USA, 102, 11207–11212, https://doi.org/10.1073/pnas.0505191102, 2005.
Kelly, J. T., Chuang, C. C., and Wexler, A. S.: Influence of dust composition on cloud droplet formation, Atmos. Environ., 41, 2904–2916, https://doi.org/10.1016/j.atmosenv.2006.12.008, 2007.
Knippertz, P. and Stuut, J. B. W. (Eds.): Mineral dust: a key player in the earth system, Springer Netherlands, https://doi.org/10.1007/978-94-017-8978-3, 2014.
Koren, I., Altaratz, O., Remer, L. A., Feingold, G., Martins, J. V., and Heiblum, R. H.: Aerosol-induced intensification of rain from the tropics to the mid-latitudes, Nat. Geosci., 5, 118–122, https://doi.org/10.1038/ngeo1364, 2012.
Kummerow, C., Barnes, W., Kozu, T., Shiue, J., and Simpson, J.: The Tropical Rainfall Measuring Mission (TRMM) sensor package, J. Atmos. Oceanic Technol., 15, 809-817, https://doi.org/10.1175/1520-0426(1998)015<0809:Ttrmmt>2.0.Co;2, 1998.
Levy, R. C., Mattoo, S., Munchak, L. A., Remer, L. A., Sayer, A. M., Patadia, F., and Hsu, N. C.: The Collection 6 MODIS aerosol products over land and ocean, Atmos. Meas. Tech., 6, 2989–3034, https://doi.org/10.5194/amt-6-2989-2013, 2013.
Li, R. and Min, Q. L.: Impacts of mineral dust on the vertical structure of precipitation, J. Geophys. Res. Atmos., 115, D09203, https://doi.org/10.1029/2009jd011925, 2010.
Li, R., Qi, D., Zhang, Y., and Wang, K.: A new pixel-to-object method for evaluating the capability of the GPM IMERG product to quantify precipitation systems, J. Hydrol., 613, 128476, https://doi.org/10.1016/j.jhydrol.2022.128476, 2022.
Li, R., Dong, X., Guo, J., Fu, Y., Zhao, C., Wang, Y., and Min, Q.: The implications of dust ice nuclei effect on cloud top temperature in a complex mesoscale convective system, Sci. Rep., 7, 13826, https://doi.org/10.1038/s41598-017-12681-0, 2017.
Liu, C. and Liu, N.: Synoptic environments and characteristics of convection reaching the tropopause over Northeast China, Mon. Weather Rev., 146, 745–759, https://doi.org/10.1175/mwr-d-17-0245.1, 2018.
Liu, C. and Zipser, E. J.: Why does radar reflectivity tend to increase downward toward the ocean surface, but decrease downward toward the land surface?, J. Geophys. Res. Atmos., 118, 135–148, https://doi.org/10.1029/2012jd018134, 2013.
Liu, C. and Zipser, E. J.: The global distribution of largest, deepest, and most intense precipitation systems, Geophys. Res. Lett., 42, 3591–3595, https://doi.org/10.1002/2015gl063776, 2015.
Liu, C., Zipser, E. J., Cecil, D. J., Nesbitt, S. W., and Sherwood, S.: A cloud and precipitation feature database from nine years of TRMM observations, J. Appl. Meteor. Climatol., 47, 2712–2728, https://doi.org/10.1175/2008jamc1890.1, 2008.
Liu, C., Chen, B., and Mapes, B. E.: Relationships between large precipitating systems and atmospheric factors at a grid scale, J. Atmos. Sci., 74, 531–552, https://doi.org/10.1175/jas-d-16-0049.1, 2017.
Liu, G. S. and Fu, Y. F.: The characteristics of tropical precipitation profiles as inferred from satellite radar measurements, J. Meteorol. Soc. Jpn., 79, 131–143, https://doi.org/10.2151/jmsj.79.131, 2001.
Liu, N., Liu, C., and Lavigne, T.: The variation of the intensity, height, and size of precipitation systems with El Niño–Southern Oscillation in the tropics and subtropics, J. Climate, 32, 4281–4297, https://doi.org/10.1175/jcli-d-18-0766.1, 2019.
Martinez-Villalobos, C. and Neelin, J. D.: Why do precipitation intensities tend to follow gamma distributions?, J. Atmos. Sci., 76, 3611–3631, https://doi.org/10.1175/jas-d-18-0343.1, 2019.
Min, Q. and Li, R.: Longwave indirect effect of mineral dusts on ice clouds, Atmos. Chem. Phys., 10, 7753–7761, https://doi.org/10.5194/acp-10-7753-2010, 2010.
Min, Q.-L., Li, R., Lin, B., Joseph, E., Wang, S., Hu, Y., Morris, V., and Chang, F.: Evidence of mineral dust altering cloud microphysics and precipitation, Atmos. Chem. Phys., 9, 3223–3231, https://doi.org/10.5194/acp-9-3223-2009, 2009.
NASA: The Tropical Rainfall Measuring Mission (TRMM), NASA, https://gpm.nasa.gov/missions/trmm (last access: 18 December 2025), 2025a.
NASA: MODIS Aerosol Product, NASA [data set], https://modis.gsfc.nasa.gov/data (last access: 18 December 2025), 2025b.
Nesbitt, S. W., Cifelli, R., and Rutledge, S. A.: Storm morphology and rainfall characteristics of TRMM precipitation features, Mon. Weather Rev., 134, 2702–2721, https://doi.org/10.1175/mwr3200.1, 2006.
Patel, P. N., Gautam, R., Michibata, T., and Gadhavi, H.: Strengthened Indian summer monsoon precipitation susceptibility linked to dust-induced ice cloud modification, Geophys. Res. Lett., 46, 8431–8441, https://doi.org/10.1029/2018gl081634, 2019.
Prospero, J. M., Delany, A. C., Delany, A. C., and Carlson, T. N.: The discovery of African dust transport to the Western Hemisphere and the Saharan Air Layer: a history, Bull. Am. Meteorol. Soc., 102, E1239–E1260, https://doi.org/10.1175/bams-d-19-0309.1, 2021.
Remer, L. A., Kaufman, Y. J., Tanre, D., Mattoo, S., Chu, D. A., Martins, J. V., Li, R. R., Ichoku, C., Levy, R. C., Kleidman, R. G., Eck, T. F., Vermote, E., and Holben, B. N.: The MODIS aerosol algorithm, products, and validation, J. Atmos. Sci., 62, 947–973, https://doi.org/10.1175/jas3385.1, 2005.
Rosenfeld, D., Rudich, Y., and Lahav, R.: Desert dust suppressing precipitation: a possible desertification feedback loop, Proc. Natl. Acad. Sci. USA, 98, 5975–5980, https://doi.org/10.1073/pnas.101122798, 2001.
Rosenfeld, D., Andreae, M. O., Asmi, A., Chin, M., de Leeuw, G., Donovan, D. P., Kahn, R., Kinne, S., Kivekäs, N., Kulmala, M., Lau, W., Schmidt, K. S., Suni, T., Wagner, T., Wild, M., and Quaas, J.: Global observations of aerosol-cloud-precipitation-climate interactions, Rev. Geophys., 52, 750–808, https://doi.org/10.1002/2013rg000441, 2014.
Roy Bhowmik, S., Sen Roy, S., and Kundu, P.: Analysis of large-scale conditions associated with convection over the Indian monsoon region, Int. J. Climatol., 28, 797–821, 2008.
Ryder, C. L., Highwood, E. J., Walser, A., Seibert, P., Philipp, A., and Weinzierl, B.: Coarse and giant particles are ubiquitous in Saharan dust export regions and are radiatively significant over the Sahara, Atmos. Chem. Phys., 19, 15353–15376, https://doi.org/10.5194/acp-19-15353-2019, 2019.
Sassen, K., DeMott, P. J., Prospero, J. M., and Poellot, M. R.: Saharan dust storms and indirect aerosol effects on clouds: CRYSTAL-FACE results, Geophys. Res. Lett., 30, 1633, https://doi.org/10.1029/2003gl017371, 2003.
Schneider, T., Bischoff, T., and Haug, G. H.: Migrations and dynamics of the intertropical convergence zone, Nature, 513, 45–53, https://doi.org/10.1038/nature13636, 2014.
Schumacher, C. and Houze, R. A.: Stratiform rain in the tropics as seen by the TRMM precipitation radar, J. Climate, 16, 1739–1756, https://doi.org/10.1175/1520-0442(2003)016<1739:Sritta>2.0.Co;2, 2003.
Shin, M., Kang, Y., Park, S., Im, J., Yoo, C., and Quackenbush, L. J.: Estimating ground-level particulate matter concentrations using satellite-based data: a review, GISci. Remote Sens., 57, 174–189, https://doi.org/10.1080/15481603.2019.1703288, 2019.
Stevens, B. and Feingold, G.: Untangling aerosol effects on clouds and precipitation in a buffered system, Nature, 461, 607–613, https://doi.org/10.1038/nature08281, 2009.
Sun, Y., Wang, Y., Zhao, C., Zhou, Y., Yang, Y., Yang, X., Fan, H., Zhao, X., and Yang, J.: Vertical dependency of aerosol impacts on local scale convective precipitation, Geophys. Res. Lett., 50, e2022GL102186, https://doi.org/10.1029/2022gl102186, 2023.
Tobo, Y., Adachi, K., DeMott, P. J., Hill, T. C. J., Hamilton, D. S., Mahowald, N. M., Nagatsuka, N., Ohata, S., Uetake, J., Kondo, Y., and Koike, M.: Glacially sourced dust as a potentially significant source of ice nucleating particles, Nat. Geosci., 12, 253–258, https://doi.org/10.1038/s41561-019-0314-x, 2019.
Toracinta, E. R., Cecil, D. J., Zipser, E. J., and Nesbitt, S. W.: Radar, passive microwave, and lightning characteristics of precipitating systems in the tropics, Mon. Weather Rev., 130, 802–824, https://doi.org/10.1175/1520-0493(2002)130<0802:Rpmalc>2.0.Co;2, 2002.
van den Heever, S. C., Carrio, G. G., Cotton, W. R., DeMott, P. J., and Prenni, A. J.: Impacts of nucleating aerosol on Florida storms. Part I: Mesoscale simulations, J. Atmos. Sci., 63, 1752–1775, https://doi.org/10.1175/jas3713.1, 2006.
Vivekanandan, J., Turk, J., and Bringi, V. N.: Ice water path estimation and characterization using passive microwave radiometry, J. Appl. Meteor. Climatol., 30, 1407-1421, https://doi.org/10.1175/1520-0450(1991)030<1407:Iwpeac>2.0.Co;2, 1991.
Wall, C., Zipser, E., and Liu, C. T.: An investigation of the aerosol indirect effect on convective intensity using satellite observations, J. Atmos. Sci., 71, 430–447, https://doi.org/10.1175/jas-d-13-0158.1, 2014.
Xi, J., Li, R., Fan, X., and Wang, Y.: Aerosol effects on the three-dimensional structure of organized precipitation systems over Beijing-Tianjin-Hebei region in summer, Atmos. Res., 298, 107146, https://doi.org/10.1016/j.atmosres.2023.107146, 2024.
Xu, W., Zipser, E. J., and Liu, C.,: Rainfall characteristics and convective properties of mei-yu precipitation systems over South China, Taiwan, and the South China Sea. Part I: TRMM observations, Mon. Weather Rev., 137, 4261–4275, https://doi.org/10.1175/2009mwr2982.1, 2009.
Zang, L., Rosenfeld, D., Pan, Z., Mao, F., Zhu, Y., Lu, X., and Gong, W.: Observing aerosol primary convective invigoration and its meteorological feedback, Geophys. Res. Lett., 50, e2023GL104151, https://doi.org/10.1029/2023gl104151, 2023.
Zhang, A., Chen, C., Chen, Y., Li, W., Chen, S., and Fu, Y.: Resilient dataset of rain clusters with life cycle evolution during April to June 2016–2020 over eastern Asia based on observations from the GPM DPR and Himawari-8 AHI, Earth Syst. Sci. Data, 14, 1433–1445, https://doi.org/10.5194/essd-14-1433-2022, 2022.
Zhang, Y. and Wang, K.: Global precipitation system scale increased from 2001 to 2020, J. Hydrol., 616, 128768, https://doi.org/10.1016/j.jhydrol.2022.128768, 2023.
Zhang, Y., Yu, F., Luo, G., Chen, J. P., and Chou, C. C. K.: Impact of mineral dust on summertime precipitation over the Taiwan region, J. Geophys. Res. Atmos., 125, e2020JD033120, https://doi.org/10.1029/2020jd033120, 2020.
Zhang, Y., Yu, F., Luo, G., Fan, J., and Liu, S.: Impacts of long-range-transported mineral dust on summertime convective cloud and precipitation: a case study over the Taiwan region, Atmos. Chem. Phys., 21, 17433–17451, https://doi.org/10.5194/acp-21-17433-2021, 2021.
Zhao, C., Sun, Y., Yang, J., Li, J., Zhou, Y., Yang, Y., Fan, H., and Zhao, X.: Observational evidence and mechanisms of aerosol effects on precipitation, Sci. Bull., 69, 1569–1580, https://doi.org/10.1016/j.scib.2024.03.014, 2024.
Zhou, Y., Lau, W. K. M., and Liu, C.: Rain characteristics and large-scale environments of precipitation objects with extreme rain volumes from TRMM observations, J. Geophys. Res. Atmos., 118, 9673–9689, https://doi.org/10.1002/jgrd.50776, 2013.
Zhu, H., Li, R., Yang, S., Zhao, C., Jiang, Z., and Huang, C.: The impacts of dust aerosol and convective available potential energy on precipitation vertical structure in southeastern China as seen from multisource observations, Atmos. Chem. Phys., 23, 2421–2437, https://doi.org/10.5194/acp-23-2421-2023, 2023.
Zhu, H., Yang, S., Zhao, H., Wang, Y., and Li, R.: Complex interplay of sulfate aerosols and meteorology conditions on precipitation and latent heat vertical structure, npj Clim. Atmos. Sci., 7, 191, https://doi.org/10.1038/s41612-024-00743-w, 2024.
Zipser, E. J. and Lutz, K. R.: The vertical profile of radar reflectivity of convective cells: a strong indicator of storm intensity and lightning probability, Mon. Weather Rev., 122, 1751–1759, https://doi.org/10.1175/1520-0493(1994)122<1751:Tvporr>2.0.Co;2, 1994.
Zipser, E. J., Cecil, D. J., Liu, C., Nesbitt, S. W., and Yorty, D. P.: Where are the most intense thunderstorms on Earth?, Bull. Am. Meteorol. Soc., 87, 1057–1072, https://doi.org/10.1175/bams-87-8-1057, 2006.
Zipser, E. J., Liu, C., Cecil, D. J., Nesbitt, S. W., and Sherwood, S.: A cloud and precipitation feature database from nine years of TRMM observations, J. Appl. Meteorol., 47, 2712–2728, https://doi.org/10.1175/2008jamc1890.1, 2008.