
the Creative Commons Attribution 4.0 License.
the Creative Commons Attribution 4.0 License.
 | 23 Oct 2026
Long-term evolution and effects of primary brown carbon aerosol in China
Guochao Chen
Yiheng Wang
Qi Ying
Xiaofei Wang

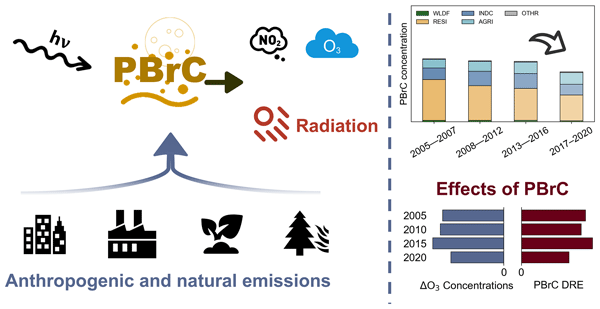
Brown carbon (BrC) is a light-absorbing component of organic aerosols that influences atmospheric environment and climate. Although biomass burning is recognized as the major source of primary BrC (PBrC) globally, anthropogenic sources can contribute comparably or more to PBrC in regions with intensive human activities, yet variations in concentrations and effects of PBrC remain underexplored in China, where dramatic emission changes occurred in last two decades.
We apply an internal mixing model to simulate the long-term (2005–2020) variations of PBrC surface and vertical concentrations and their effects across China. The mean surface PBrC concentration is 0.81 µgC m−3, with anthropogenic emissions dominating: residential, industrial combustion, and agricultural sectors contribute on average 57 %, 22 %, and 18 %, respectively, together accounting for 91 % of column concentrations in 2010. PBrC (−20.8 %) declined more than PM2.5 (−8.1 %), accompanied by a slight reduction in O3 and a decrease in direct radiative effect (DRE) from +0.032 W m−2 in 2005 to +0.023 W m−2 in 2020 (−25.7 %), with anthropogenic sources contributing 84.2 % of total DRE.
This study provides the first long-term assessment of PBrC trends, sources, and radiative effects in human-dominated regions, demonstrating that emission controls can deliver both environment and climate co-benefits.
- Article
(6115 KB) - Full-text XML
-
Supplement
(2723 KB) - BibTeX
- EndNote


Brown carbon (BrC), a light-absorbing component of organic aerosols (OA), absorbs solar radiation in the near-ultraviolet (UV) and visible spectrum ranges, influencing the Earth's radiative balance and atmospheric environment. It represents one of the major sources of uncertainty in global climate model systems (Liu et al., 2020a; Saleh, 2020). Unlike black carbon (BC), the light absorption of BrC exhibits a strong wavelength dependence – strong at shorter wavelengths but weak at longer ones (Kirchstetter et al., 2004; Laskin et al., 2015). Its absorption in the near-UV and visible ranges can be comparable to, or even exceed, that of BC in some regions (Xie et al., 2019; Zhang et al., 2017). In addition to its radiative effects, BrC can also affects atmospheric photochemistry and poses potential risks to human health (Choi et al., 2024; Jo et al., 2016; Liu et al., 2017; Mok et al., 2016; Shrivastava et al., 2017). Understanding the spatiotemporal patterns of BrC is therefore essential for improving the knowledge of its climate and environment impacts.
Although the chemical composition of BrC has not yet been fully resolved, it is generally categorized into primary brown carbon (PBrC) and secondary brown carbon (SBrC) according to their sources, with PBrC contributing most to overall light absorption (Li et al., 2025; Yan et al., 2018). PBrC is mainly emitted from fuel combustion processes, including low-temperature pyrolysis, smoldering, and high-temperature combustion (Saleh, 2020). Globally, biomass burning represents the dominant source of PBrC (Wang et al., 2017; Washenfelder et al., 2015), as low-temperature and fuel-rich combustion conditions are conducive to its formation (Chen and Bond, 2010; Saleh et al., 2014). However, in regions such as East Asia, where human activities are more intense, natural sources account for only 4 % of total PBrC emissions, significantly lower than the global average of 57 % (Xiong et al., 2022). PBrC exhibits relatively stable chemical properties and stronger light absorption, typically contributing more than two-thirds of total BrC absorption worldwide (Li et al., 2025; Saleh, 2020). In contrast, SBrC is mainly produced via the oxidation of volatile organic compounds (VOCs) or aqueous-phase reactions in cloud droplets and wet aerosols (Laskin et al., 2025; Li et al., 2025). These multiphase reactions generate SBrC with weaker light absorption and higher volatility, making it more susceptible to atmospheric aging processes (Calderon-Arrieta et al., 2024; Laskin et al., 2025). Consequently, SBrC contributes less to the global radiative balance (Li et al., 2025), while in certain regions with abundant precursors, it can exceed PBrC due to the enhanced production of secondary organic aerosols (SOA) (Tsigaridis and Kanakidou, 2018).
BrC exerts significant impacts on the atmospheric environment and global radiation through light absorption. Its effective absorption in the UV range can suppress the photolysis rates of photochemically active gas such as nitrogen dioxide (NO2), affecting atmospheric oxidants like ozone (O3). Previous simulations in wildfire regions indicated that BrC can reduce the net production rates and concentrations of O3 and radicals by 5 %–15 % in core areas with decreased radical levels, suggesting its role in atmospheric photochemical processes (Choi et al., 2024; Mok et al., 2016). BrC also influences the global radiative budget through both direct and indirect effects and remains an important source of uncertainty in climate models (Hansen et al., 1997; Laskin et al., 2015). It is estimated that BrC contributes approximately 10 %–40 % of the total absorption by carbonaceous aerosols, with its global direct radiative effect (DRE) ranging from +0.03 to +0.57 W m−2 (Feng et al., 2013; Li et al., 2025; Lin et al., 2014; Saleh, 2020; Wang et al., 2014, 2018; Zhang et al., 2020, 2017). The aging of BrC is a key factor affecting its radiative impact. Recent studies revealed that exposure to hydroxyl radicals (OH) and UV light can lead to bleaching of BrC (Browne et al., 2019; Wang et al., 2018; Wong et al., 2017), whereas nighttime oxidation by nitrate radicals (NO3) may enhance its light absorption (Kuang et al., 2025; Wang et al., 2025), both of which remain subjects of ongoing research. PBrC dominates the overall impact of total BrC. It is reported that PBrC can darken during aging by enriching strongly absorptive and less volatile chromophores, owing to its low volatility and chemical stability (Calderon-Arrieta et al., 2024; Hettiyadura et al., 2021; Laskin et al., 2025), suggesting its stronger potential effects than SBrC (Jo et al., 2016; Wang et al., 2014).
Numerous modeling studies have assessed the global and regional patterns and effects of PBrC. However, most of them focused on regions where biomass burning exerts strong influences, while anthropogenic impacts received less attention. Regional assessments of wildfire emissions demonstrated that the DRE of biomass burning in the Indochina can reach up to 0.6 W m−2 (Huang et al., 2025; Zhang et al., 2021). In contrast, global simulations suggested that regions with intensive human activities can exhibit comparable DRE to those dominated by biomass burning (Li et al., 2025; Wang et al., 2025). Wang et al. further explored the global DRE of BrC by considering OH oxidation using an external mixing model, showing that DRE of BrC without aging processes was +0.102 W m−2 globally and exceeded +0.8 W m−2 over eastern China, whereas the inclusion of aging reduced the global DRE to +0.048 W m−2, with eastern China remaining at +0.7 W m−2 (Wang et al., 2018). Park et al. estimated the radiative effects of PBrC in East Asia and also suggested significant contributions from anthropogenic emissions (Park et al., 2010). These studies highlight the substantial influence of anthropogenic PBrC in regions with intensive human activities, distinct from that originating from biomass burning.
In recent decades, China has experienced profound changes in anthropogenic emissions and PM2.5 levels (Wang et al., 2020), which may have also led to substantial shifts in PBrC. Yet, the temporal evolution and drivers of PBrC in such regions dominated by anthropogenic emissions remain less understood. Several global simulations have investigated PBrC over different periods, but differences in emission inventories, optical properties, and chemical mechanisms make direct comparisons of long-term trends difficult. Assessment of long-term PBrC variability in China is therefore essential to clarify changes in its concentrations, sources, and effects.
In this study, we utilized a coupled Weather Research Forecast-Community Multiscale Air Quality Modeling System (WRF-CMAQ) with a source tracing method to investigate the sources and effects of PBrC. A comprehensive set of observational datasets, including aerosol mass concentrations and optical properties, was collected to evaluate the model simulations. We analyzed the long-term concentration patterns, source characteristics, and effects of PBrC, and discussed the associated model uncertainties at last.
2.1 WRF-CMAQ introduction and configuration
The two-way coupled WRF-CMAQ modeling system was employed in this study. WRF-CMAQ is an advanced framework with a feedback path between meteorological processes and chemical reactions (Wong et al., 2012). In the traditional CMAQ configuration, archived meteorological fields are used to drive chemical transport and dynamics, without accounting for the influence of atmospheric pollutants on the energy budget. Given the non-negligible radiative effects of PBrC, we adopted the coupled WRF-CMAQ to establish two-way coupling system. The presence of aerosols can alter the amount of solar radiation reaching the surface, which has been incorporated through the shortwave Rapid Radiative Transfer Model for General Circulation Models (RRTMG) radiation scheme within WRF, where aerosol optical properties are derived from aerosol composition and size distributions simulated by CMAQ. The implementation follows a core-shell approach with BC treated as the core and other substances forming the shell. The aerosol optics calculations are based on the methodology of Bohren and Huffman (1998).
We used WRF version 4.5 and CMAQ version 5.5 to construct the coupled model and conducted simulations for the full years from 2005 to 2020. The model domain employed a 36 km horizontal resolution (197 × 127 grid cells) covering the entire China (Fig. S1). Meteorological input data were obtained from the FNL (Final) Operational Global Analysis data produced by the National Center for Environmental Prediction (NCEP) (https://rda.ucar.edu/datasets/ds083.2, last access: 1 March 2025). The vertical grids were divided into 18 sigma levels, extending from the surface to the upper troposphere. Original emission inventory was from the Emissions Database for Global Atmospheric Research (EDGAR) version 8.1 and Fire INventory from NCAR (FINN) version 2.5, while biogenic emissions were generated using the Model of Emissions of Gases and Aerosols from Nature (MEGAN) version 2.1 (Guenther et al., 2012). In this study, we considered nine PBrC source categories: agriculture, residential (small scale non-industrial stationary combustion), fuel exploitation, industrial combustion, industrial processes, power industry, transport, waste, and wildfires.
We designed five model scenarios to evaluate the impacts of PBrC and associated uncertainties:
-
No_PBrC: primary organic aerosols are assumed to be non-absorptive.
-
PBrC_baseline: PBrC are scaled by 10−5 for emissions and by 105 for the imaginary part of the complex refractive index (k).
-
PBrC_nowldf: identical to PBrC_baseline but excluding wildfire emissions.
-
PBrC_k_adj: identical to PBrC_baseline but with k multiplied or divided by a factor of five.
-
PBrC_age: identical to PBrC_baseline but including OH-induced bleaching following previous studies (Browne et al., 2019; Choi and Ying, 2025).
The aging process is represented by:
where CPBrC denotes the concentration of primary brown carbon (including its non-carbon components), and COH represents the gas phase OH radical concentration. The effective second-order rate constant (kPBrC), was measured by Browne et al. (2019), approximately (7.4 ± 0.7) × 10−13 cm3 molecules−1 s−1.
Differences among these scenarios were used to quantify the effects of PBrC, while these estimations remain subject to considerable uncertainties due to the complicated climate feedback processes. The optical properties and radiative effects of PBrC were derived from the differences between PBrC_baseline and No_PBrC. Wildfire contributions were obtained from PBrC_baseline minus PBrC_nowldf, while the impacts of k variability and aging were estimated from PBrC_k_adj minus PBrC_baseline and PBrC_age minus PBrC_baseline, respectively.
2.2 Processing method for PBrC
In this study, we adopted the PBrC emission estimation approach developed by Xiong et al. (2022) to derive the emissions of PBrC. Xiong et al. proposed that PBrC consists of specific organic components whose total mass can be inferred, even though its detailed chemical composition remains uncertain. In their work, Xiong et al. used a bottom-up method to estimate global historical PBrC emissions, based on directly measured emission factors and reported PBrC to organic carbon (OC) ratios from previous studies (Table S1 in the Supplement). Following their framework, we applied source-specific PBrC to OC ratios to the EDGAR emission inventory to estimate PBrC emissions. This method has also been applied in previous CMAQ modeling studies (Choi and Ying, 2025).
Given the debate of BrC components, some studies have alternatively estimated OA absorption using BC to OA ratios to infer BrC-related absorption and radiative effects (Huang et al., 2025; Saleh et al., 2014). However, this approach only provides the light absorption of OA and cannot resolve the concentration of PBrC, which is needed to quantify the evolution of this pollutant in China, where anthropogenic emissions dominate. Therefore, to simulate the spatiotemporal evolution of PBrC and its effects on the atmospheric environment, we adopted the method proposed by Xiong et al. for PBrC emission estimation (Xiong et al., 2022). To account for the non-carbon components within PBrC aerosols, we applied an additional factor of 1.1 to estimate brown non-carbon organic matter, based on the simulated primary organic carbon (POC) to primary organic matter (POM) ratio and recommended correction factors, representing the total absorptive PBrC aerosol mass (Via et al., 2021; Xing et al., 2013; Yang et al., 2025). Thus, the effects discussed in this study refer to those of the overall primary brown carbon aerosol, encompassing both its carbon and non-carbon fractions.
To incorporate PBrC into the model without perturbing other aerosol processes, we applied a tracer tagging method. Specifically, a scaling factor of 10−5 was multiplied to the PBrC mass, enabling the tracking of source-specific PBrC dynamics in the atmosphere while minimizing the influence of newly introduced species on other processes. The tracer approach has been widely employed in source apportionment and atmospheric transport studies (Chen et al., 2025; Ying and Kleeman, 2006). To reproduce the optical and radiative effects of PBrC, the complex refractive index () of the tagged species was subsequently scaled by a factor of 105, thereby restoring the original magnitude of its optical impact (Table S1) (Wang et al., 2014; Yang et al., 2025). In WRF-CMAQ model, aerosol optical properties are calculated under the internal mixing assumption using a core-shell model, where the optical characteristics of shell are determined from the volumetric fractions of each component (Bond et al., 2006). Since PBrC is intrinsically part of primary OC, we set the absorption of primary OC to zero and prescribed other bulk properties of PBrC to be identical to those of primary OC. This approach avoids double-counting of brown carbon absorption and prevents introducing additional uncertainties. In addition, no modifications were made to the optical calculation scheme in CMAQ, which represents particles as a BC core surrounded by a shell whose complex refractive index is a volume-weighted average of the other shell species, and obtains the optical properties from Mie theory. Therefore, this treatment is physically consistent and computationally reasonable.
2.3 Observational data
We collected long-term PM2.5 and OC mass concentration data to evaluate the modeled aerosol mass. Ground-based air quality observations across China were obtained from the China National Environmental Monitoring Centre (CNEMC; http://www.cnemc.cn/, last access: 26 July 2024), which provides hourly concentration data from thousands of national monitoring sites. Since public data are available only from 2014 onward, PM2.5 observations from 2015 and 2020 were used to assess the accuracy of modeled PM2.5 concentrations. As the CNEMC dataset does not include OC component measurements, we additionally compiled monthly observational OC records corresponding to the modeled periods from multiple published literatures (Table S2). These data primarily cover eastern China, a representative region characterized by high OC concentrations and intensive human activities, thus providing robust spatial representation for model evaluation.
We used ground-based observations to evaluate the modeled aerosol optical properties. Aerosol Robotic Network (AERONET) provides globally distributed measurements of aerosol optical depth (AOD) across multiple spectral bands, along with inversion products such as absorption and scattering parameters (Giles et al., 2019). Considering the strong shortwave absorption of PBrC, AOD at 380 nm and absorption AOD (AAOD) at 440 nm were selected to validate the modeled optical characteristics. Due to the sparse spatial coverage of AERONET sites within China, additional data from nearby regions like Japan, Vietnam, and India were also included for comparison. In addition, field Aethalometer measurements of PBrC light absorption at 370 nm from previous studies were collected to further evaluation (Table S3) (Wang et al., 2019). In these studies, BrC absorption was isolated with the BC-tracer method, in which the absorption arising from primary combustion sources is estimated as the measured BC mass concentration multiplied by a representative ratio of primary absorption to BC mass concentration, and the remaining absorption is attributed to SBrC.
The Modern-Era Retrospective analysis for Research and Applications, Version 2 (MERRA-2), produced by the Global Modeling and Assimilation Office of NASA, provides global long-term reanalysis data for aerosols. MERRA-2 assimilates satellite retrievals as well as ground-based measurements (Randles et al., 2017). Although the dataset contains larger uncertainties compared with ground-based measurements, it offers valuable information for assessing large-scale spatial distributions. In this study, surface OC concentrations and AAOD at 550 nm from MERRA-2 were used to evaluate the modeled distributions of carbonaceous aerosol concentrations and AAOD.
3.1 Model performance
The chemical composition of PBrC remains constrained, resulting in a lack of long-term direct observation of PBrC concentrations. To assess whether our simulations realistically reproduce atmospheric conditions, both indirect (e.g., aerosol concentrations) and direct (e.g., AAOD and PBrC absorption) indicators were employed to evaluate the model's ability to capture atmospheric dynamics and PBrC characteristics. The comparison indicates overall good model performance.
PBrC is a component of particulate matter, meaning that the model's performance in reproducing observed PM2.5 and O3 concentrations can serve as an indicator of its ability to represent the physical and chemical processes governing PBrC in the atmosphere. Validation against ground-based PM2.5 and O3 observations across China demonstrated that the model successfully reproduced the observed concentrations (Table S4). For PM2.5, the annal mean fractional bias (MFB) and mean fractional error (MFE) from 2015 to 2020 fall within the recommended performance criteria of the US Environmental Protection Agency (MFB %, MFE ≤ 75 %) (Boylan and Russell, 2006; U.S. EPA, 2007). Monthly evaluations indicated similar results, confirming that the model captures seasonal variations effectively. The O3-related statistics also demonstrated satisfactory performance. Although ground-based observations were unavailable for 2005–2014, the consistent performance during 2015–2020, combined with the identical model configuration for all simulation years, suggests reliable model behavior across the entire study period.
PBrC constitutes a subset of OC, sharing similar emissions, transport, and deposition processes. Therefore, we further validated the model performance for carbonaceous aerosols using observed OC concentrations from published studies across China (Table S2). The modeled OC concentrations correlated well with observations (Fig. 1a, R=0.61), although underestimations occurred under heavily polluted conditions. Despite uncertainties in emissions, part of these biases likely arises from underestimation of SOA, as current models still exhibit systematic deficiencies in SOA simulation (Ying et al., 2015). Nevertheless, as this study primarily focused on PBrC, such discrepancies are acceptable within the study context. Comparisons between modeled OC and MERRA-2 data further support the ability of model to capture spatial distributions, capturing high OC concentrations over eastern China, South Asia, and Southeast Asia (Fig. S2). While the modeled OC levels were higher than those in MERRA-2, it can be partly attributed to the errors of reanalysis data itself compared with ground-based observations (Fig. S3). Overall, the consistent results across model simulations, ground observations, and reanalysis data provide confidence in the model's ability to reproduce behaviors of PBrC aerosols.
The light absorption of PBrC is one of its most important properties, thus we used AOD and AAOD data from AERONET and MERRA-2, along with field measurements of PBrC light absorption, to evaluate the modeled optical properties. Given PBrC's strong absorption in shortwaves, we selected AAOD at 440 nm from AERONET for validation. The agreement between the simulated and observed AAOD improved slightly after PBrC was incorporated (Fig. 1b), with the regression slope increasing from 0.61 (R=0.41) without PBrC to 0.67 (R=0.43) with PBrC. This modest improvement may reflect the fact that AAOD at 440 nm is contributed jointly by several light-absorbing aerosol components, namely BC, BrC, and mineral dust (Li et al., 2025). Changing the complex refractive index of PBrC alone may therefore yield only a limited improvement in the total AAOD at 440 nm. Similar improvement was observed for AOD at 380 nm, where the slope reached 0.75 (R=0.52) (Fig. S4). Comparison with MERRA-2 AAOD at 550 nm also revealed broadly consistent spatial distributions between simulations and reanalysis data (Fig. 1d–e), albeit with derivations in northwestern China and Indochina. At this wavelength, PBrC contributes relatively weakly to light absorption, thus these derivations are likely related to uncertainties in other absorptive aerosols like BC and mineral dust. For example, abundant dust aerosols in arid regions like Northwestern China may explain the pronounced underestimations there, while in Indochina, frequent wildfires and possible overestimation in the FINN emission inventory could introduce biases in simulated carbonaceous aerosols (Song et al., 2022). Furthermore, we evaluated the modeled PBrC using field Aethalometer measurements of PBrC light absorption at 370 nm reported in previous studies, where a BC-tracer method was applied to separate primary and secondary BrC contributions (Wang et al., 2019). The comparison shows good agreement between the simulations and measurements (R=0.54), indicating that the model effectively captures the PBrC contributions (Fig. 1c and Table S3). Overall, given the model's strong performance over China in shortwaves, as well as comparable accuracy to previous modeling studies (Choi and Ying, 2025; Li et al., 2025; Wang et al., 2025), we conclude that our model generally represents the key characteristics of PBrC.
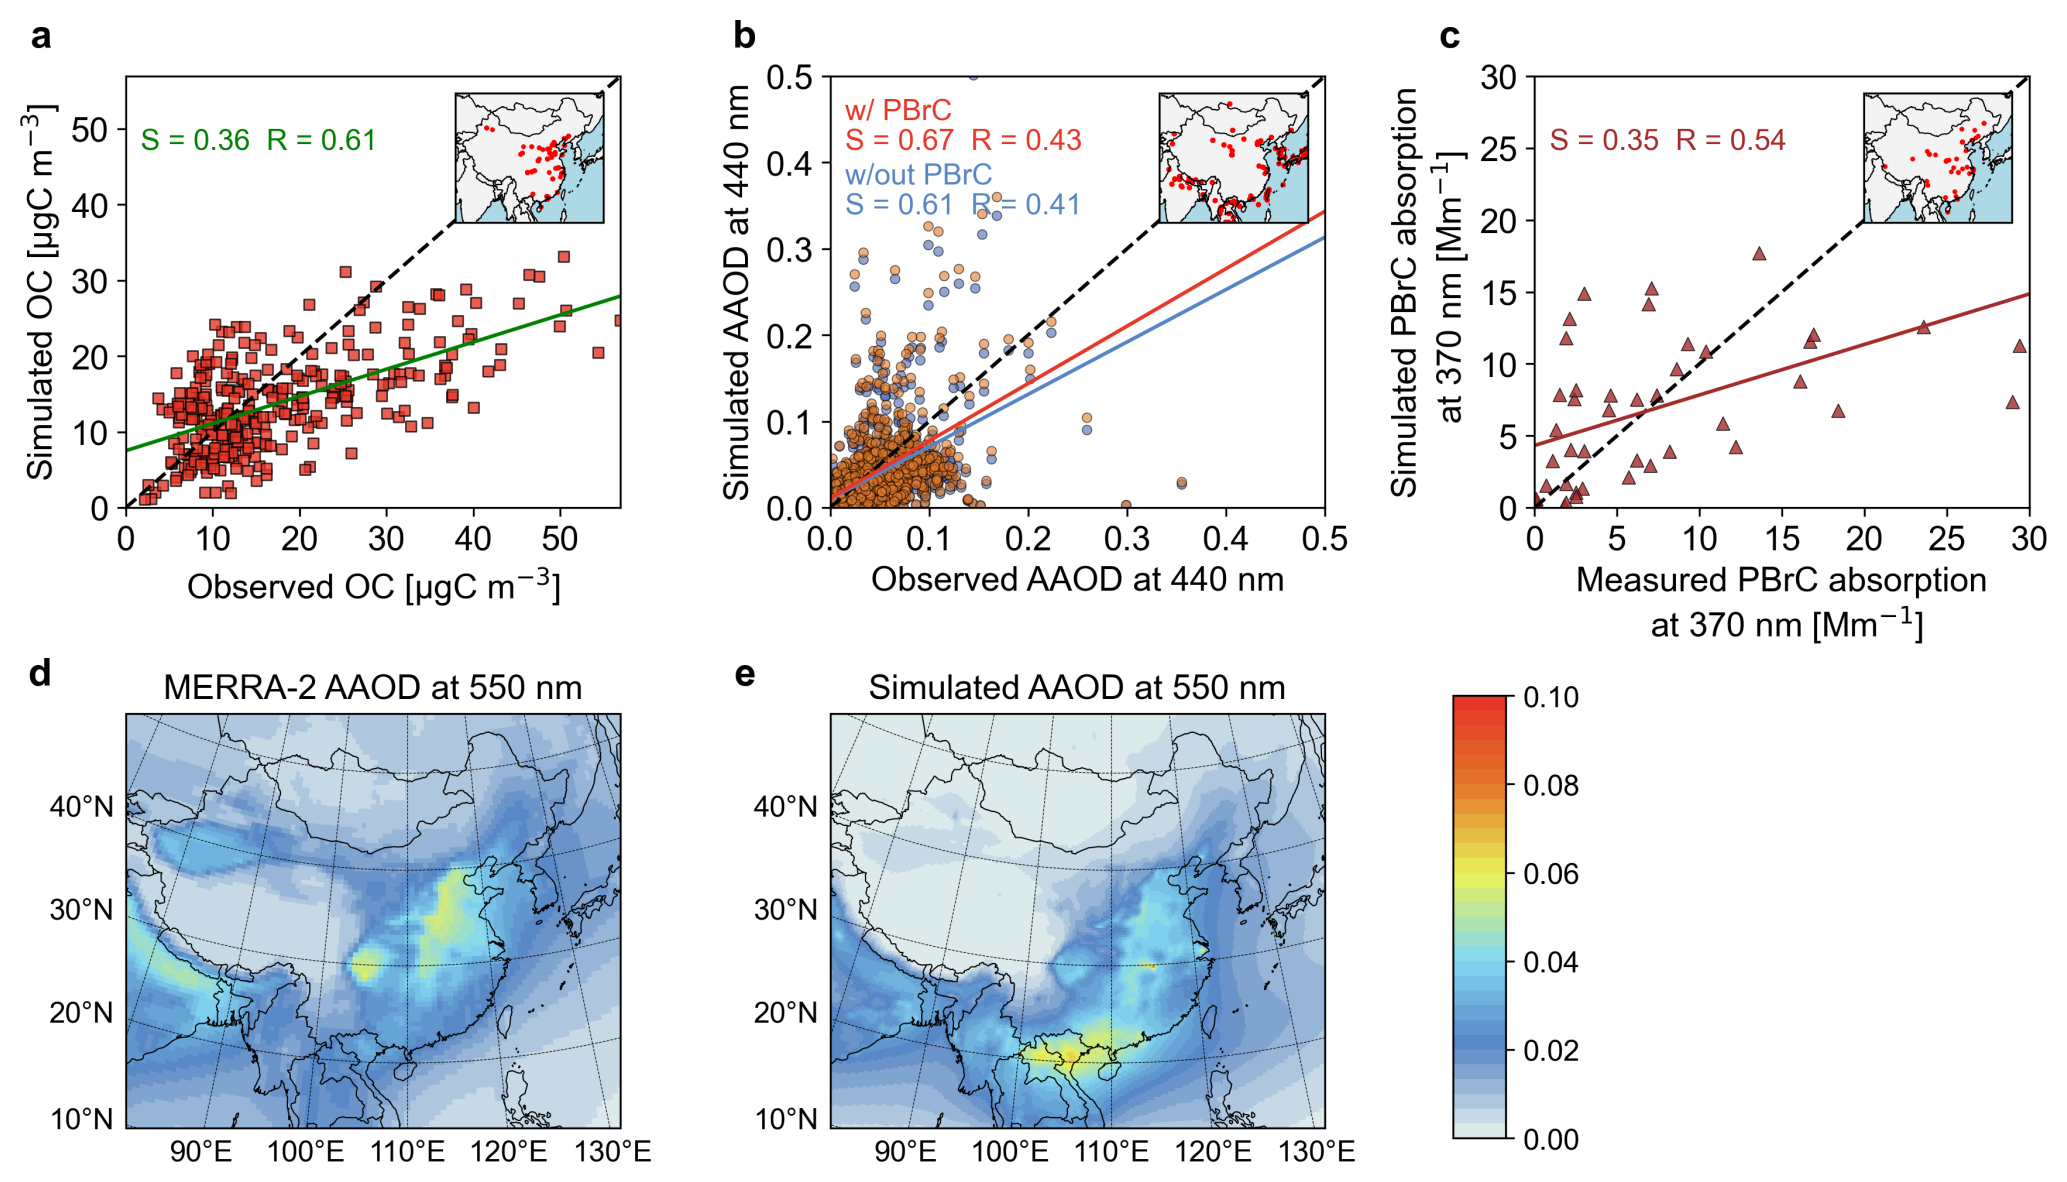
Figure 1Validation of OC concentrations and AAOD. (a) Simulated monthly OC versus observed OC concentrations. (b) Simulated monthly AAOD at 440 nm for the No_PBrC scenario (w/out PBrC, blue) and the PBrC_baseline scenario (w/ PBrC, red) compared with observations. (c) Simulated PBrC absorption versus measured PBrC absorption. (d–e) Comparison of multi-year mean AAOD at 550 nm between MERRA-2 data and simulations. The locations of observation sites for OC and AAOD, the slopes (S) of the regression lines, and the Pearson correlation coefficients (R) are shown as insets. The dashed lines indicate the 1:1 line.
3.2 Concentrations and sources of surface PBrC
A decreasing trend in PBrC concentrations occurred in China from 2005 to 2020, while the major surface PBrC burden was dominated by contributions from residential, industrial combustion, and agricultural sectors. The national mean surface PBrC concentration during this period was approximately 0.81 µgC m−3. Both national and major regional surface PBrC levels exhibited consistent declines, with anthropogenic sources accounting for 97.7 % of the total and the national mean decreasing from 0.83 µgC m−3 in 2005 to 0.66 µgC m−3 in 2020 (−20.8 %), a more pronounced reduction than that for PM2.5 (−8.1 %) (Figs. 2 and S5).
High surface PBrC concentrations were mainly distributed in regions with intensive anthropogenic emissions, such as eastern and central China (Fig. 2). The North China Plain (NCP) and the Yangtze River Delta (YRD) exhibited the highest PBrC levels nationwide. Residential emissions are strongly influenced by heating demand, leading to elevated PBrC levels over the NCP during winter (Figs. S6 and S7). Owing to its low combustion efficiency, the residential sector also exhibits higher PBrC to OC ratios (Fig. S8) (Saleh, 2020). Industrial emissions are concentrated in the NCP with little seasonal variability. Although industrial sectors consumed large amount of coals, their PBrC concentrations remains lower than those from the residential sector, largely due to higher combustion efficiencies that suppress PBrC formation (Saleh, 2020). Agricultural emissions are spatially localized and occur mainly during spring and autumn, producing periodic impacts in regions with intensive agricultural activities such as the NCP.
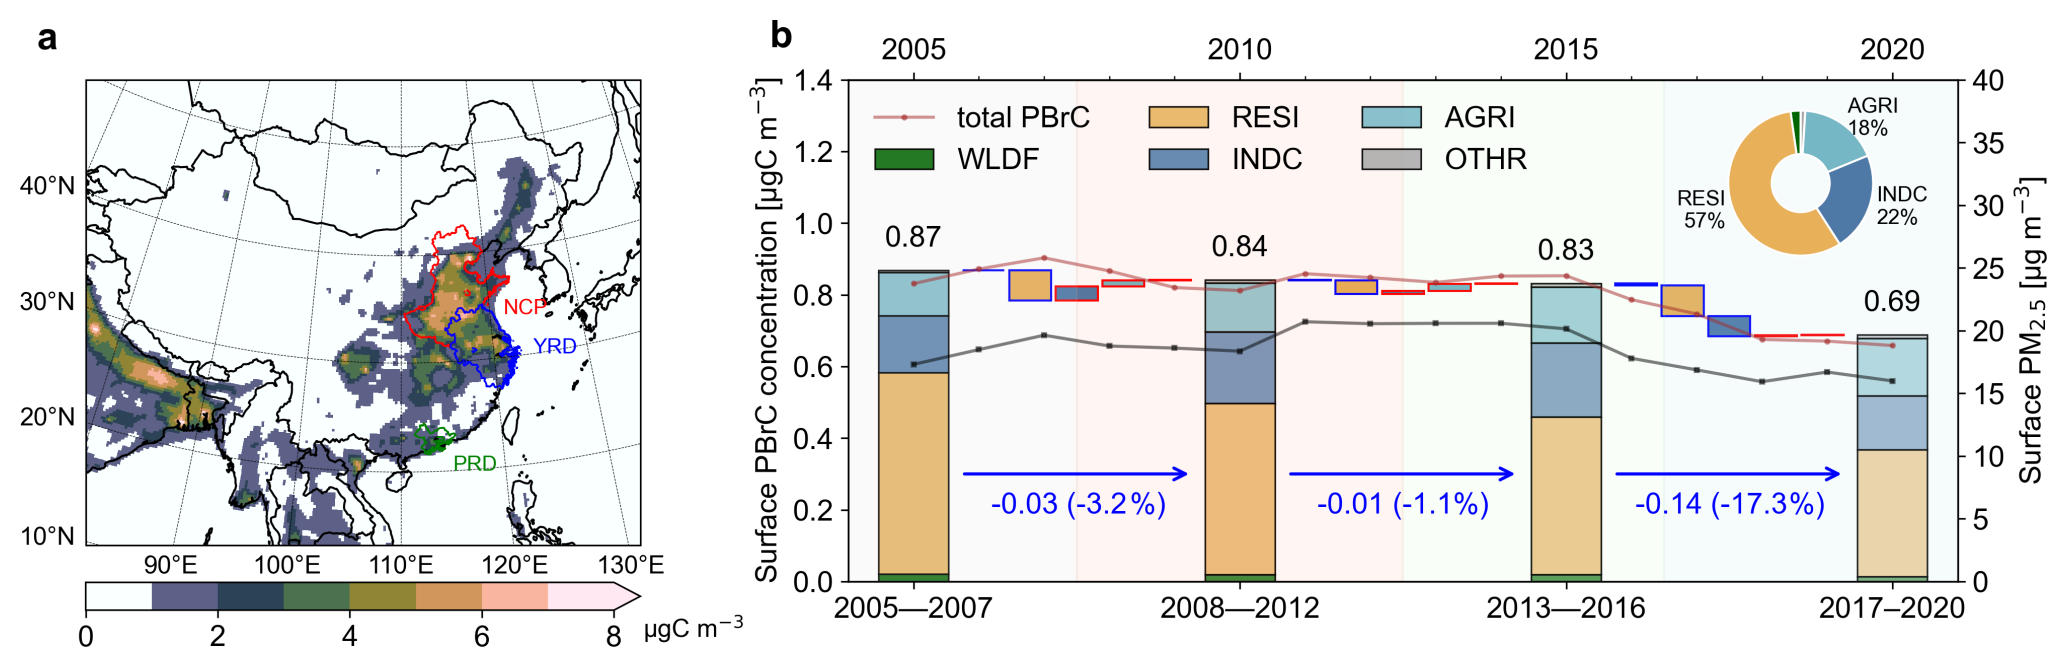
Figure 2Spatial and temporal patterns of surface PBrC. (a) Multi-year mean total concentrations of surface PBrC. Red, blue, and green outlines indicate the NCP, YRD, and PRD, respectively. (b) Source contributions to surface PBrC in China from 2005 to 2020. Red borders indicate increased contributions; blue borders indicate decreases. Loop diagram shows multi-year mean contributions from each source.
PBrC exhibits a pronounced temporal variability distinct from that of PM2.5, reflecting the evolving contributions of its sources (Figs. 2 and S5). Residential emissions were the dominant contributor to PBrC in China, accounting for 57 % of multi-year mean total concentrations owing to widespread inefficient combustion. Reductions in residential emissions, whose concentrations dropped from 0.56 µgC m−3 in 2005–2007 to 0.35 µgC m−3 in 2017–2020, drove the overall decline in PBrC, offsetting increases from other sectors. Industrial combustion also contributed substantially to national total PBrC, though it displayed a pattern of initial increase followed by decline. Agriculture represents another important PBrC source, primarily due to inefficient biomass combustion. Unlike other anthropogenic sources, agricultural PBrC displayed an increasing trend, with its contribution rising from 13.8 % in 2005–2007 to 23.3 % in 2017–2020. Although its concentration remains relatively low and spatially localized, agricultural emissions have become increasingly prominent as other anthropogenic sources declined sharply. Contributions from wildfires and other sources were relatively minor, despite wildfires being globally recognized as a major PBrC source. However, with changes in global wildfire emissions and continuous decline in anthropogenic emissions across China, the relative impacts of wildfires is expected to fluctuate, particularly in regions frequently affected by wildfires (Chen et al., 2024). Compared with PM2.5, PBrC shows a different temporal pattern. Before 2013, PM2.5 increased while PBrC remained stable, but both declined substantially after the implementation of the Air Pollution Prevention and Control Action Plan (2013–2017) and the Three-Year Action Plan for Winning the Blue Sky Defense Battle (2018–2020) (Xiao et al., 2022). For PM2.5, pre-2013 industrial expansion outweighed residential declines and produced a net increase. By contrast, the less industrial contribution to PBrC meant that this growth only partly offset residential reductions. Consequently, sector-wide emission controls drove a sharp drop in PBrC, revealing the distinct responses of PM2.5 and PBrC to changes in anthropogenic emission.
Column concentrations and vertical cross-sections of PBrC were further examined to characterize its distribution (Figs. 3 and S9). The column concentrations exhibited a spatial distribution similar to that of the surface concentrations, with anthropogenic sources accounting for 91 % of the national total, reflecting the dominant influence of anthropogenic emissions. Since anthropogenic sources are primarily confined to near-surface layers and seldom reach high altitudes, PBrC tends to accumulate in the lower troposphere. In contrast, wildfire emissions contributed more substantially to column PBrC, as the plumes can reach higher altitudes and transported by prevailing southwesterly winds in the free troposphere (Huang et al., 2025). Although their annual contributions to surface concentrations in China were only 0.8 %, wildfire influence become dominant at higher altitudes (e.g., 2–3 km) and in regions influenced by wildfire plumes, such as the Perl River Delta (PRD), where their contributions can reach up to 71 %.
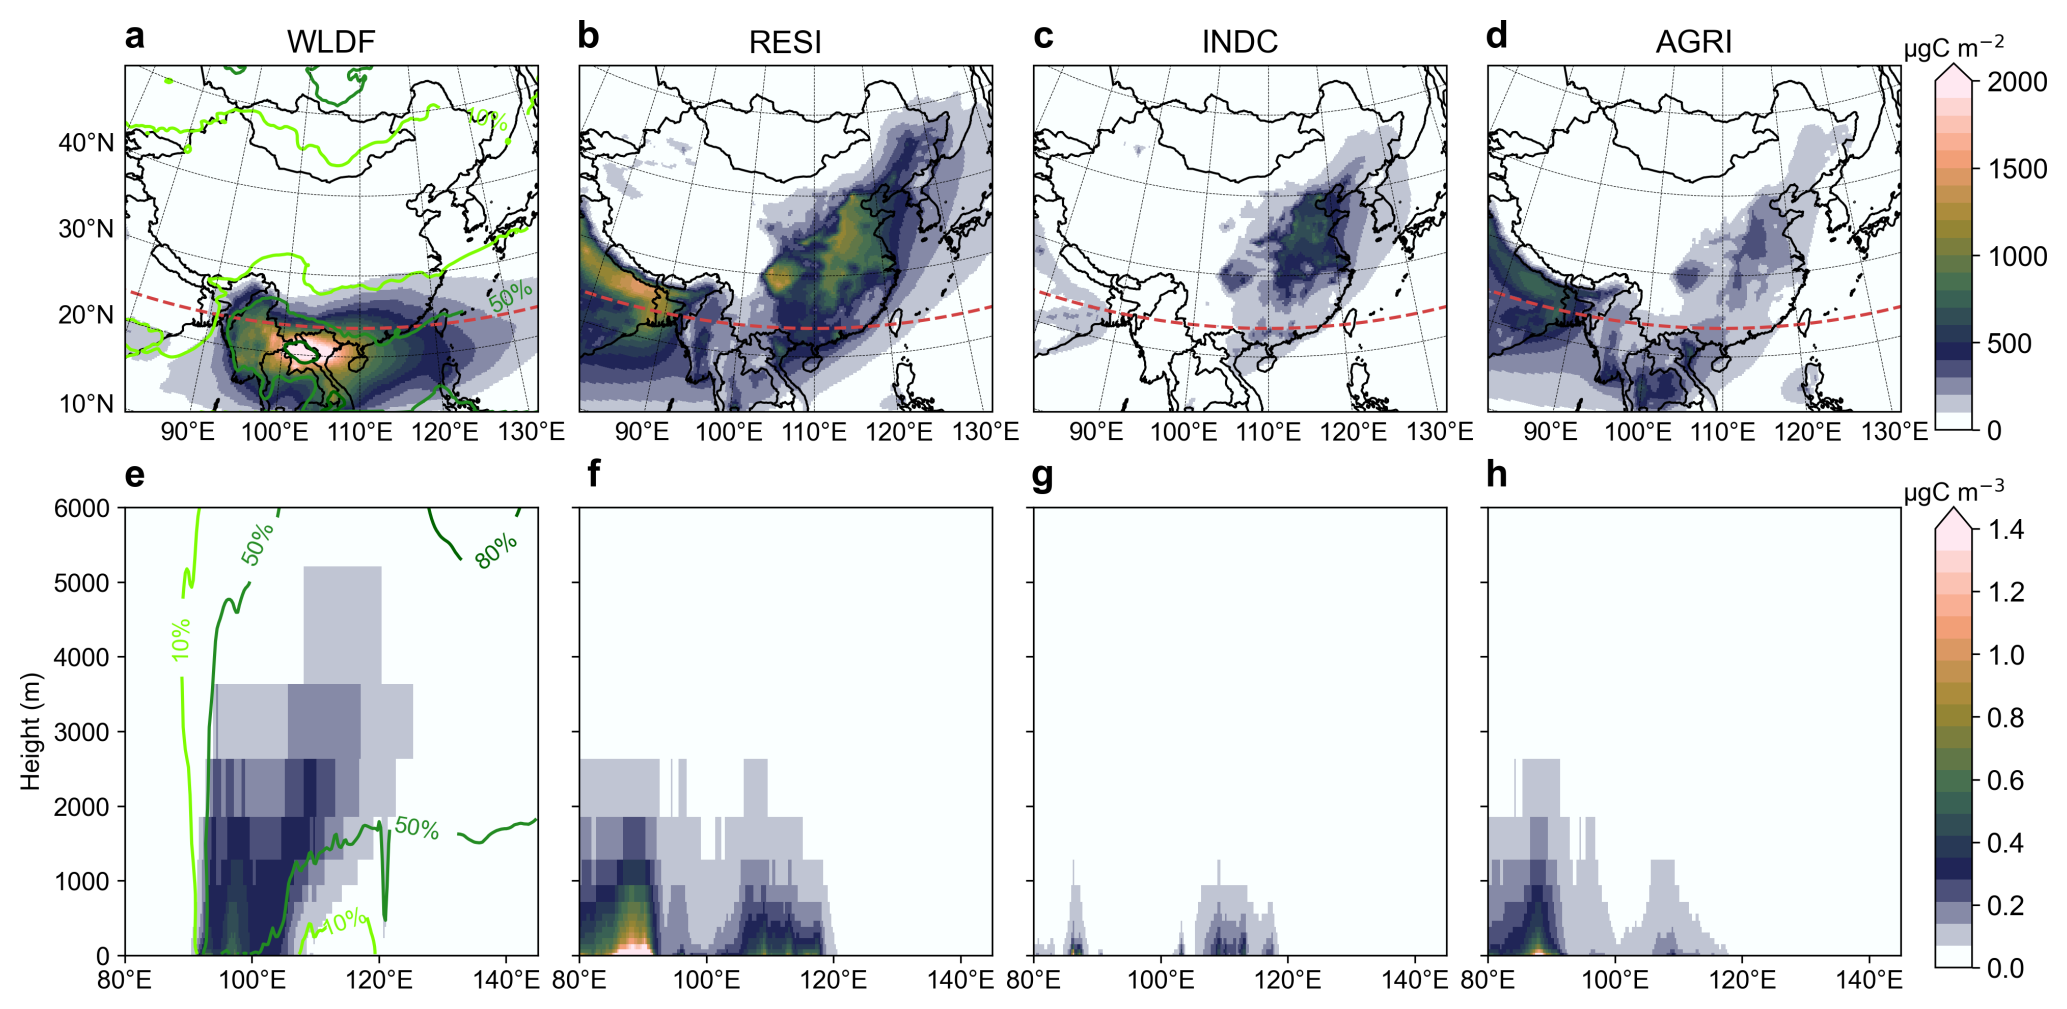
Figure 3Column concentrations and vertical cross-sections of PBrC in 2010. (a–d) Column contributions from wildfires (WLDF), residential (RESI), industrial combustion (INDC), and agricultural (AGRI) sources. (e–f) Vertical cross-sections of PBrC concentrations along 23.5° N from wildfires, residential, industrial combustion, and agricultural sources. Contour lines in (a) and (e) indicate the proportion of wildfires to the total PBrC concentrations. Red dashed lines mark 23.5° N.
3.3 Impacts of PBrC on surface O3
PBrC can influence surface O3 by altering photochemical processes. In China, despite a decline in anthropogenic emissions, surface O3 has exhibited an increasing trend, with maximum daily 8 h average (MDA8) O3 rising from 40.0 to 42.6 ppb (+6.57 %). This trend is particularly evident in the densely populated NCP, where nonlinear responses between precursor reductions and O3 formation intensify this pattern (Wang et al., 2021). Light-absorbing PBrC, however, can attenuate photolysis rates of NO2 (JNO2), thereby affecting O3concentrations, especially in cities with elevated PBrC levels (Fig. 4). In the NCP, the impact of PBrC on O3fluctuated, likely associated with variations in NO2 photolysis rates. Larger reductions in JNO2 caused with PBrC light absorption generally correspond to greater O3 decreases; for example, during 2013–2016, a mean JNO2 reduction (−1.9 %) coincided with a mean O3 decrease (−1.0 %). Subsequently, the influence of PBrC on JNO2 weakened owing to decreased PBrC, leading to a corresponding decline in its effects on O3. Overall, PBrC exerts a relatively modest impacts on O3, typically reducing surface concentrations by 1 %–2 % in eastern and central China. The suppression effect is stronger in winter owing to high PBrC concentrations and weakens as PBrC concentrations decrease.
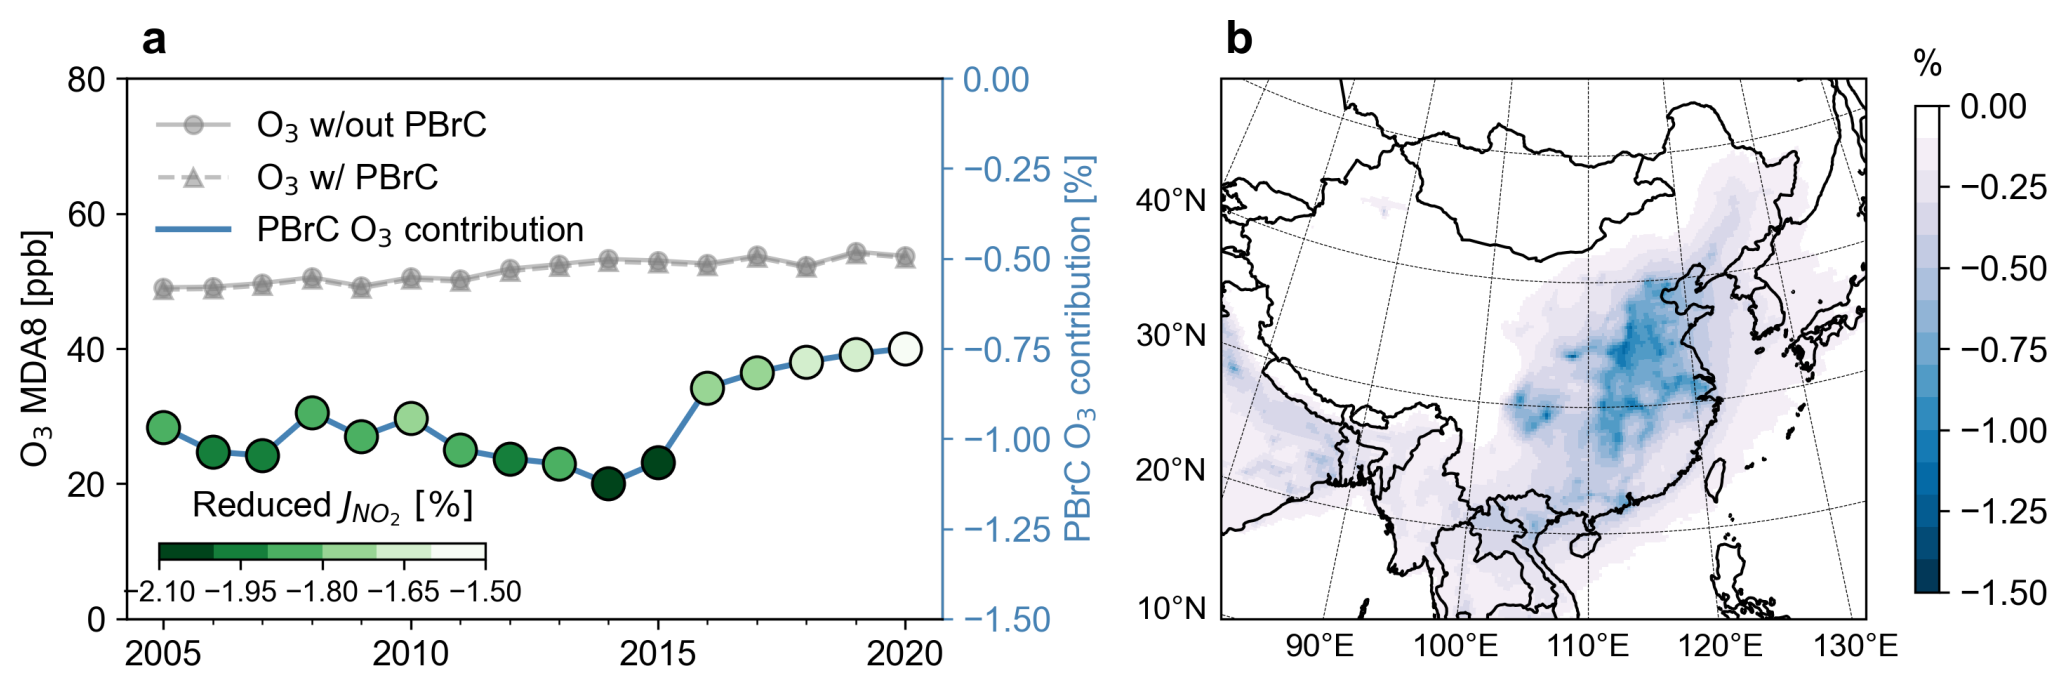
Figure 4Spatial and temporal patterns of PBrC impacts on surface O3 concentrations. (a) Surface O3 concentrations in NCP for the No_PBrC scenario (w/out PBrC, solid line) and the PBrC_baseline scenario (w/ PBrC, dashed line), along with relative reductions attributeable to PBrC (blue line). Green circles represent the relative reduction in NO2 photolysis rates caused by PBrC, with darker colors indicating a larger reduction. The right side of the y-axis shows the PBrC-induced change in O3 concentration, with more negative values indicating a stronger suppression of O3. (b) Multi-year mean reductions of surface O3 due to PBrC.
3.4 Radiative effects of PBrC
We quantified the PBrC absorption DRE over China and its surrounding regions (Figs. 5 and S10). In China, anthropogenic sources contributed approximately 84.2 % of total DRE. The DRE at the top of the atmosphere (TOA) decreased from +0.032 ± 0.006 W m−2 in 2005 to +0.023 ± 0.008 W m−2 in 2020 (−25.7 %), correspinding to a trend of −0.004 W m−2 decade−1, in line with the decline in PBrC concentrations. However, the relationship between PBrC concentrations and DRE is not strictly linear, suggesting complex interactions within climatic system. Source attributions indicated that the DRE associtated with anthropogenic emissions also declined, with its relative contribution decreasing from 90.9 % in 2005 to 87.8 % 2020. Spatially, strong DRE signals were concentrated over eastern China, consistent with regions of intense human activity. By contrast, southern China exhibited relatively low PBrC concentrations but comparable or stronger radiative effects, primarily influenced by transport of wildifre emissions from the Indochinese Peninsula. It should be noted that the DRE in this study is likely underestimated due to the low prescribed absorption.
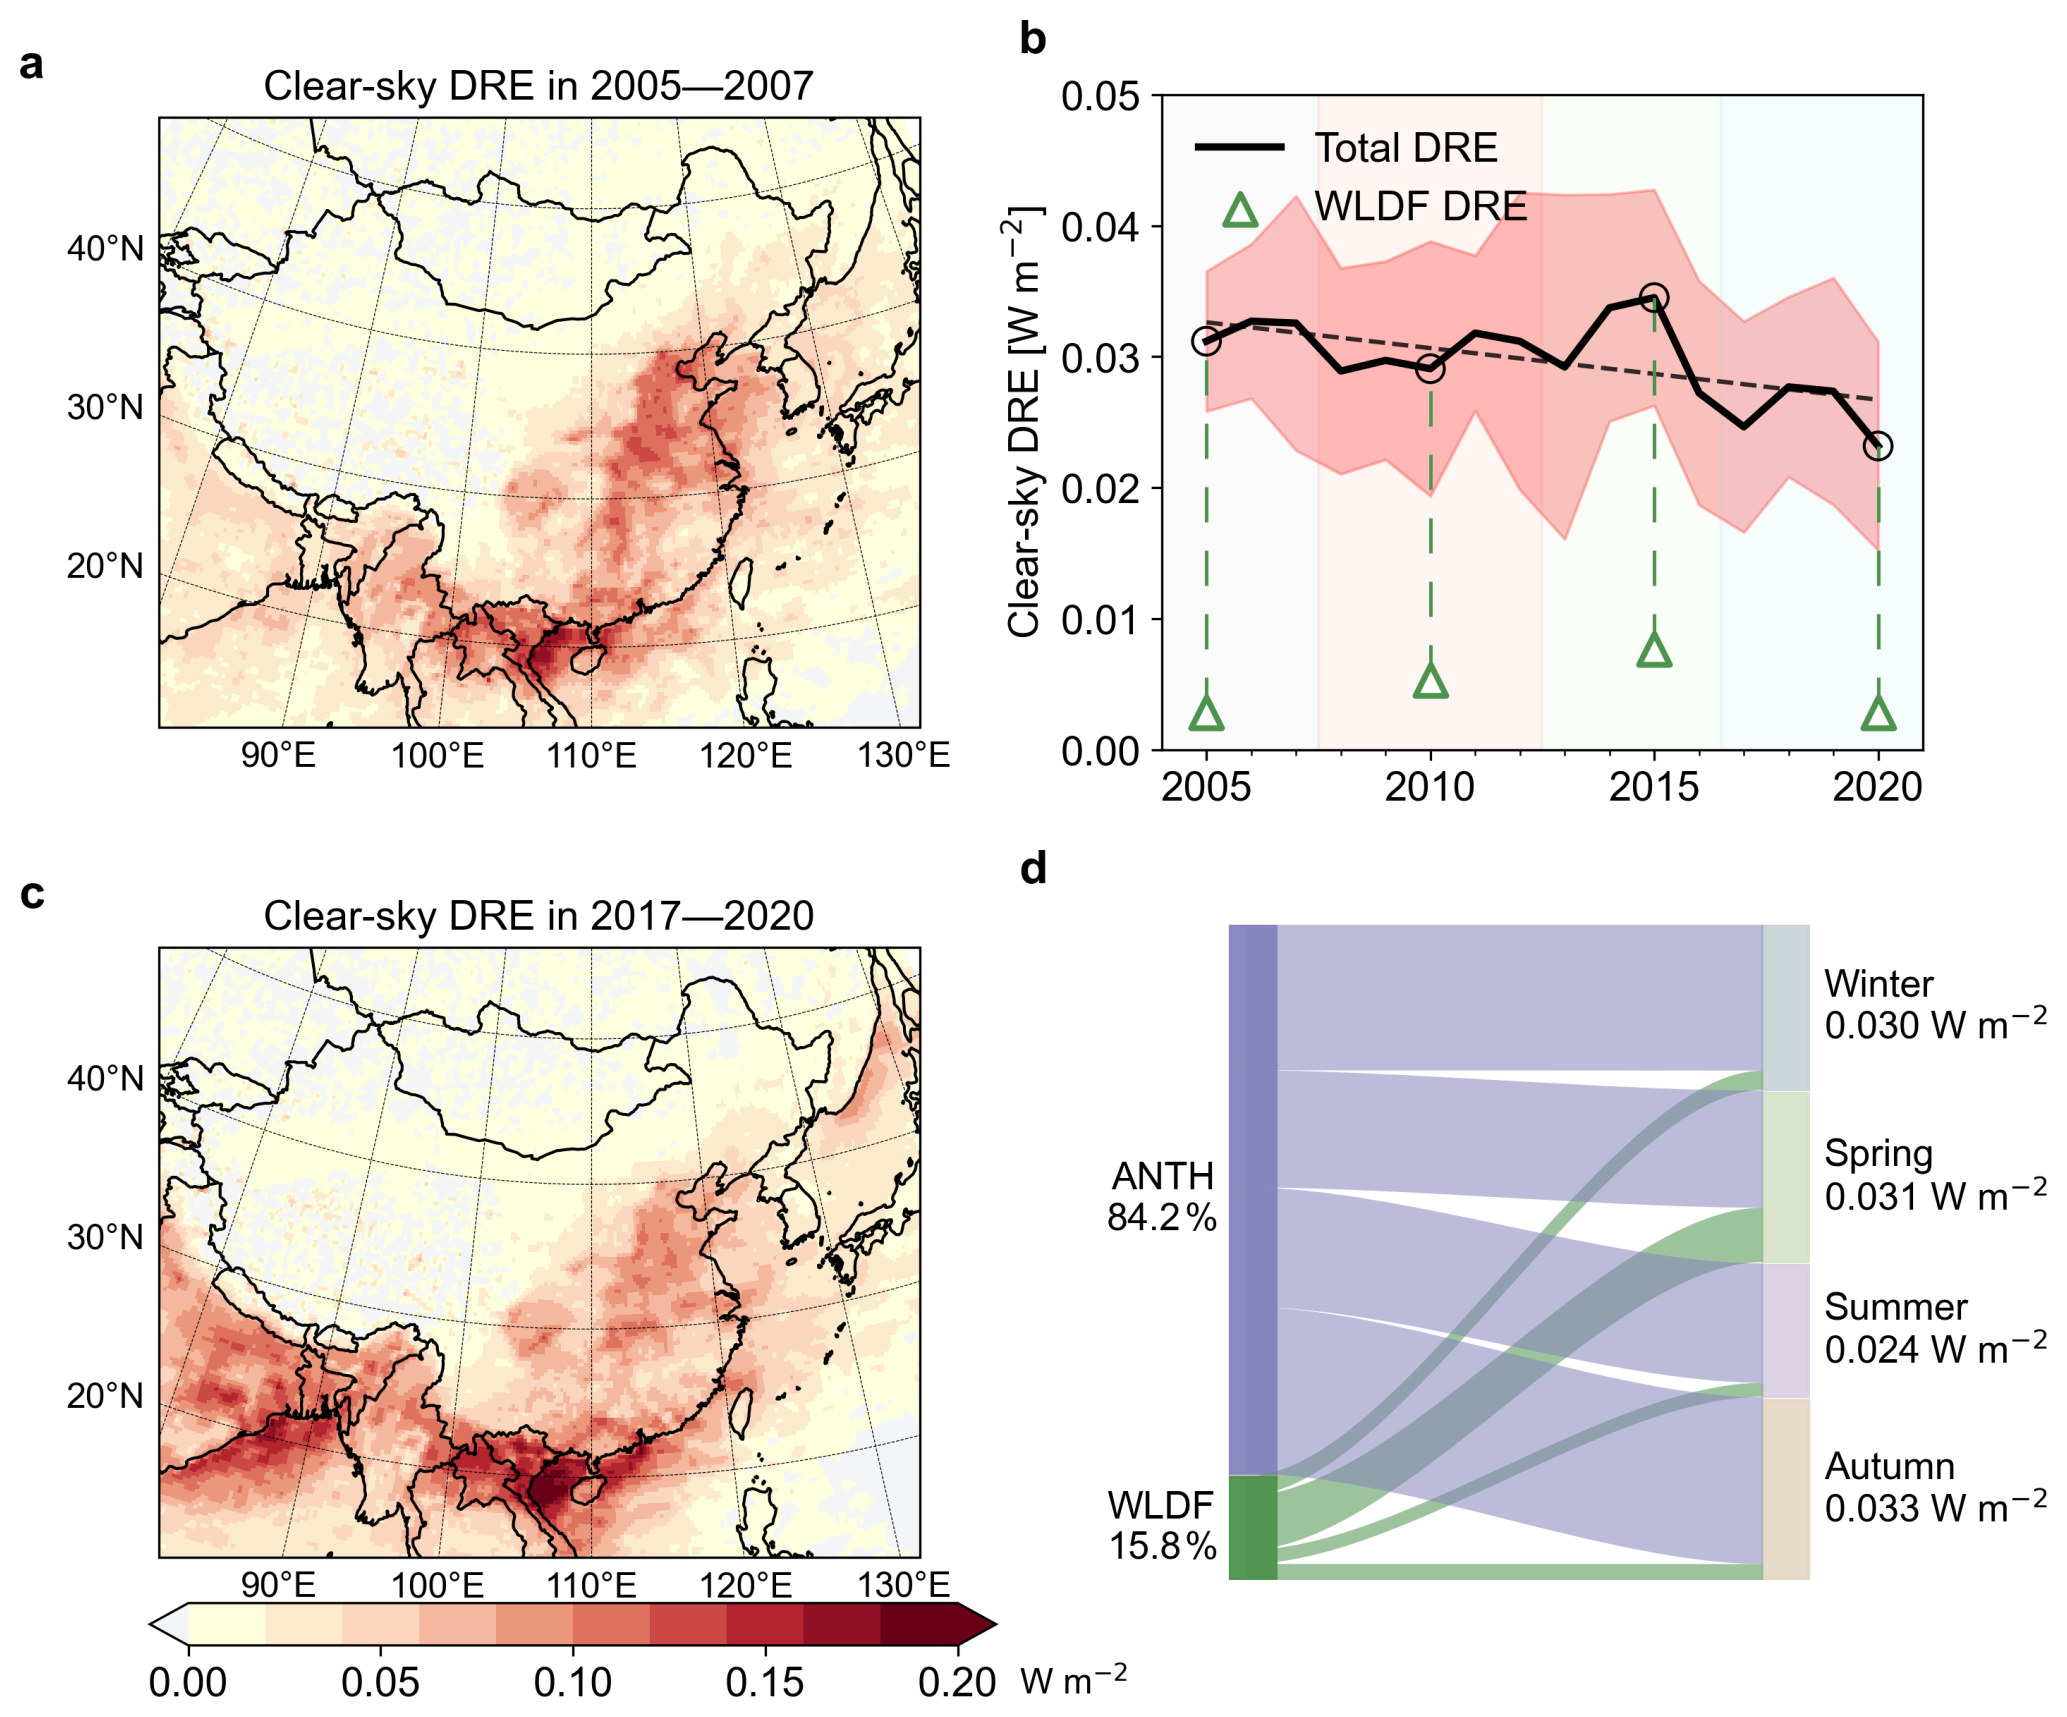
Figure 5Spatial and temporal patterns of PBrC DRE. (a) Spatial distribtuions of PBrC DRE in 2005–2007. (b) PBrC DRE in China. Green triangles indicate the contributions of wildfires (WLDF) to DRE for 2005, 2010, 2015, and 2020. (c) Spatial distribtuions of PBrC DRE in 2017–2020. (d) Mean contributions of wildfires and anthropogenic (ANTH) sources to PBrC DRE in China for winter (December, January, and February), spring (March, April, and May), summer (June, July, and August), and autumn (September, October, and November).
The radiative effects of PBrC ehibit pronounced seasonal variability (Fig. 5d). Anthropogenic emissions dominate the overall DRE and largely drive seasonal changes. However, substantial DRE persists even during seasons with relatively low human activity. In spring, the highest values occurred over southern China near the Indochina, coinciding with intense wildfire events. Although wildfires contribute relatively modestly to PBrC mass concentrations, lensing effects can enhance the absorption of co-emitted BC (Yan et al., 2018), further amplifying the wildfire PBrC DRE. By contrast, during non-fire seasons, PBrC radiative effects remain largely controlled by anthropogenic sources, which in China generate non-negligible effects compared to regions globally dominated by wildfire emissions.
PBrC in China is primarily derived from anthropogenic emissions but did not exhibit fully synchronized changes with PM2.5. Both PBrC and PM2.5 show broadly similar spatiotemporal variations across China, reflecting rapid urbanization and industrialization and China's clean air actions since 2013 (Wang et al., 2020). However, the differing rates of change indicate distinct source characteristics. While PM2.5 is largely produced by residential, power plants, and industrial sources (Zhang et al., 2012), the contribution from power sector to PBrC is minor due to its higher combustion efficiency of power plants and industrial facilities. Consequently, residential sectors are the dominant contributor to PBrC emissions. Another key distinction is the agricultural sources. While agriculture contributes little to total PM2.5 (Liu et al., 2020b), its role in PBrC is more pronounced because PBrC is primarily generated from biomass burning. The phase-out of open crop-residue burning under the straw-burning bans, the replacement of coal by gas and electricity for household heating, and the rapid urbanization of China over recent decades declined their emissions significantly (Zheng et al., 2018). The long-term PBrC dataset generated here provides a valuable reference for future studies on its climatic and environmental impacts. Regarding the effects of PBrC, while the overall trends were consistent, the decline in anthropogenic emissions did not lead to exactly proportional changes in O3 and DRE, reflecting potential modulation by atmospheric processes and nonlinear climate responses.
There remain substantial uncertainties in model simulations due to the limited understanding of the physiochemical properties of BrC. The exclusion of SBrC, which is significant in China, leads to underestimation of BrC effects compared with other studies and should be incorporated in future work (Tsigaridis and Kanakidou, 2018). Large uncertainty also arises from emission inventories. In this study, PBrC emissions were estimated based on OC emissions and corresponding PBrC to OC ratios (Xiong et al., 2022). Compared with previous simulations that primarily focused on biofuel and biomass burning emissions (Huang et al., 2025; Saleh et al., 2014; Wang et al., 2014), our work expands the emission to comprehensively include all anthropogenic emission sources. The current estimation of PBrC remains constrained by the use of fixed PBrC to OC ratios, owing to the lack of detailed chemical characterization of PBrC (Xiong et al., 2022). In addition, wildfire emissions in the FINN inventory have been reported to be overestimated compared with other inventories, potentially inflating wildfire contributions (Song et al., 2022). These limitations inevitably introduce uncertainties in the temporal accuracy of emission inventories (Cheng et al., 2022; Weyant et al., 2019), though the overall estimation approach remains reasonable and widely accepted.
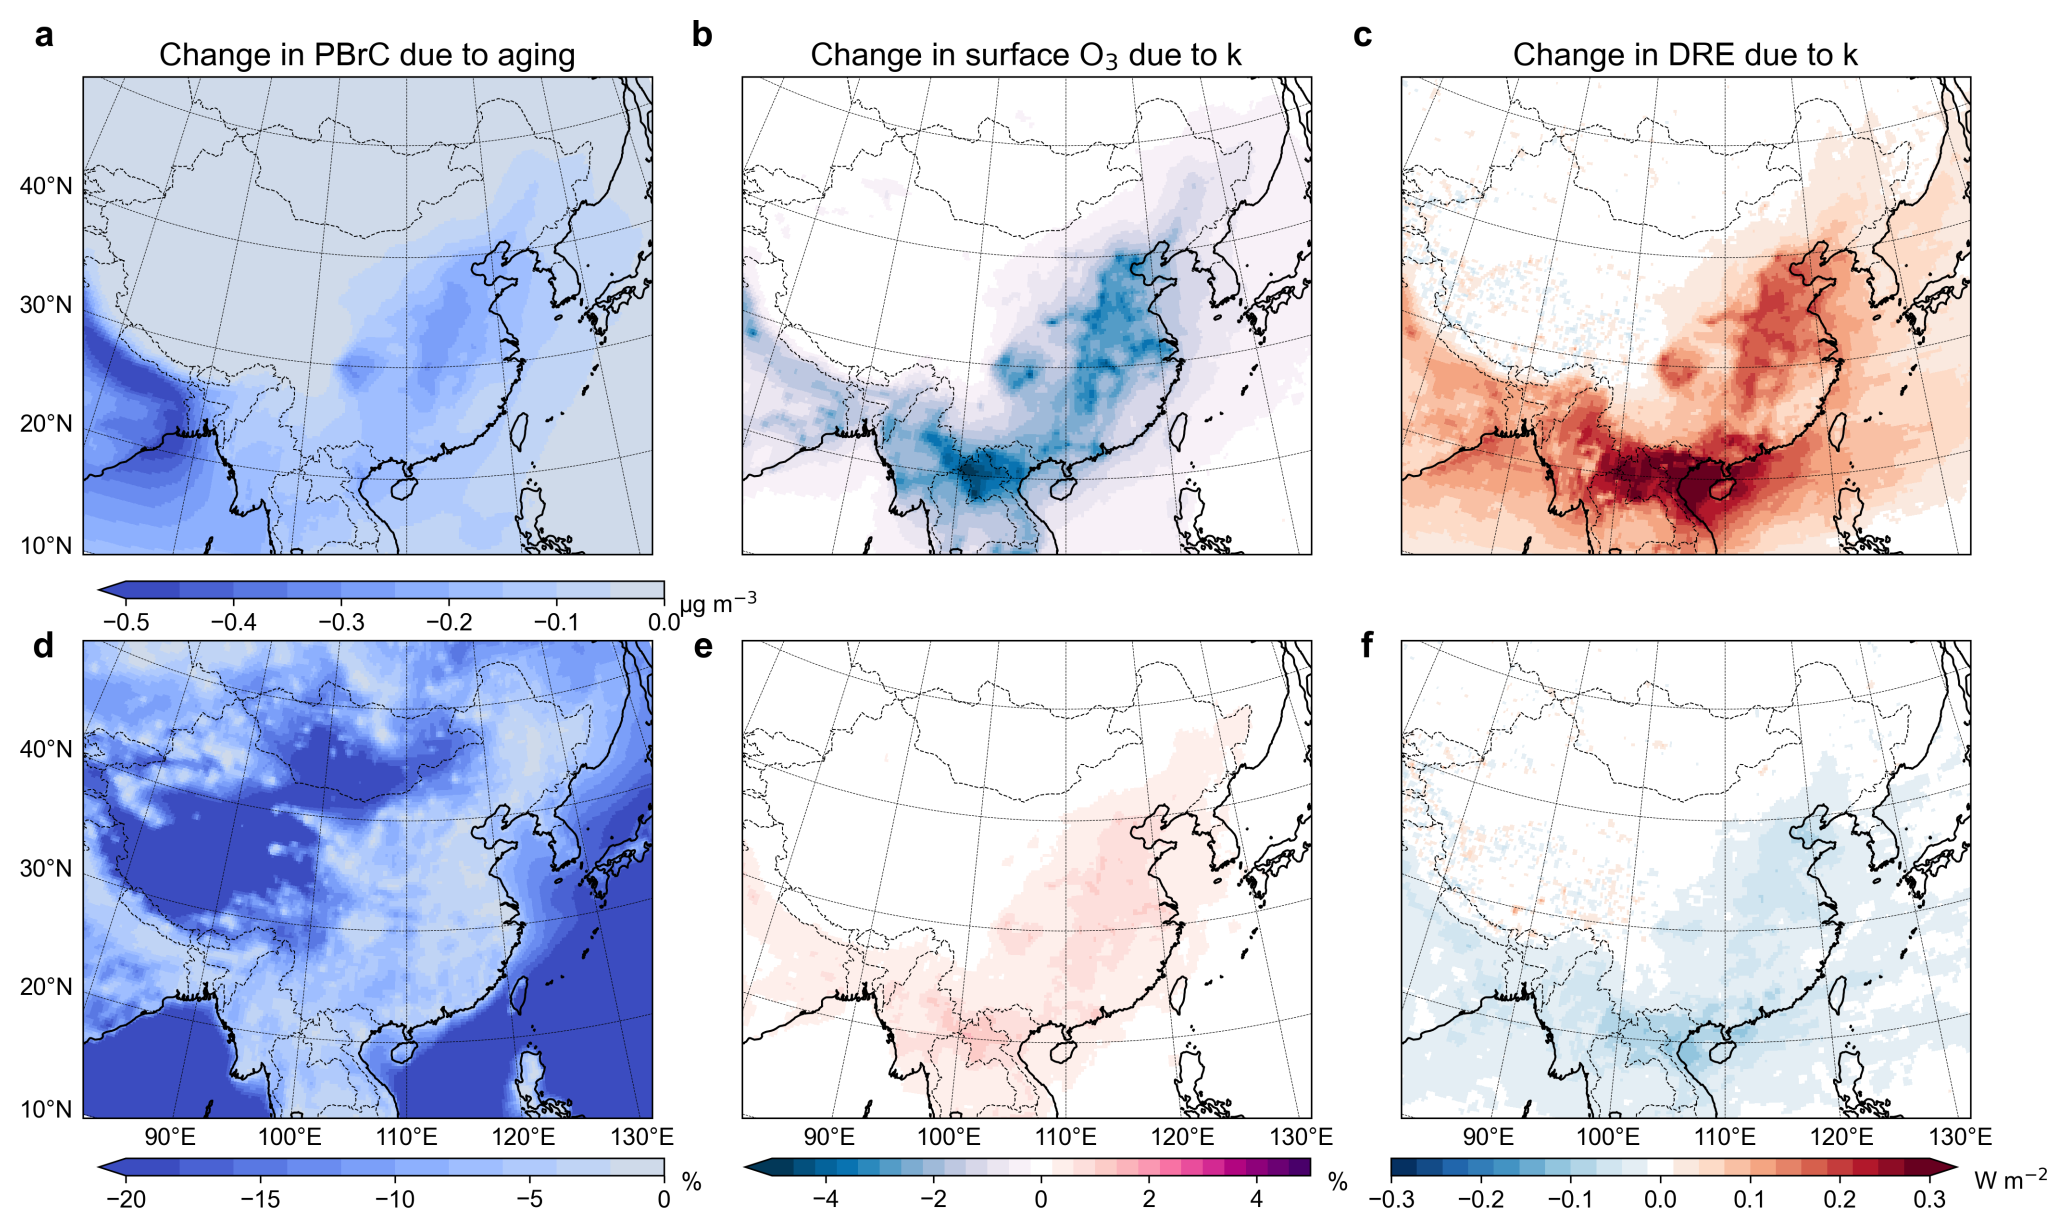
Figure 6Impacts of aging and prescribed PBrC absorptivity (k) on PBrC. (a, d) Change in surface PBrC absolute and relative concentrations due to aging. (b, e) Change in O3 relative surface concentrations due to aging. (c, f) Change in PBrC DRE due to enhanced and reduced k.
Beyond emissions, the aging processes and assumed parameters of PBrC also significantly influence its atmospheric concentration and light absorption. We conducted sensitivity test incorporating OH-induced bleaching to assess its impact. The results indicated minor impacts, with nationwide PBrC and O3 concentrations and decreasing by approximately 3.9 % and less than 0.1 % in 2010, respectively (Figs. 6 and S11). Unlike most global regions where PBrC is dominated by biomass burning, our study region is characterized by infrequent wildfires, anthropogenic-dominated and heavily polluted background. The OH-induced aging of PBrC is therefore relatively less pronounced, consistent with previous findings of minimal DRE changes from OH aging in East Asia (Wang et al., 2018). Nevertheless, further investigation of the aging processes of PBrC from different sources is warranted. Another major source of uncertainty lies in the optical properties of PBrC, particularly the choice of the imaginary part of the complex refractive index. Due to the scarcity of comparable measurements across sources, regions, and aging states, most studies employ a fixed k value to represent absorption (Choi et al., 2024; Lu et al., 2015). Based on previous study reporting source-dependent differences of a factor of five in k (Lu et al., 2015), we performed sensitivity experiments multiplying and dividing k by a factor of five in 2010 (Fig. 6). The results show corresponding changes of −1.0 % and +0.3 % in surface O3, and +0.056 and −0.017 W m−2 in PBrC DRE relative to the baseline, respectively. The estimated PBrC DRE in 2010 therefore ranges from +0.012 to +0.085 W m−2 around a baseline value of +0.029 W m−2, underscoring the need for accurate field measurements of k. Furthermore, comparison with previous studies suggests that our DRE estimates are likely underestimated. For example, while our model simulates a March DRE of approximately 0.24 W m−2 in southern China, Huang et al. (2025) reported values of approximately 0.89 W m−2. To assess the influence of absorption, we tested an alternative k parameterization derived in this study based on BC to OA ratios, which increased the simulated DRE in southern China to approximately 0.62 W m−2 (Fig. S12), consistent with previous estimates. It indicates that the low prescribed k in our baseline simulation leads to an underestimation of PBrC DRE. In addition, SBrC is not included in our simulations. Previous research suggested that SBrC may contribute DRE equivalents to roughly 15 % of that of PBrC in China (Yang et al., 2025). While this does not affect our conclusions regarding PBrC, which is the focus of this study, further research on SBrC is warranted.
Overall, both the concentrations and radiative effects of PBrC have declined markedly due to reductions in anthropogenic emissions, partly offseting the enhaced influence of biomass burning activities. Previous studies have estimated that the DRE of total BrC can reach 10 % of that of BC (Huang et al., 2025; Li et al., 2025), highlighting its climatic impacts and implying that declining anthropogenic emissions may also affect the radiative effects of BC. It indicates the co-benefits of emission controls for air quality and climate. To achieve long-term climate objectives, the role of light-absorbing aerosols under declining anthropogenic emissions requires to be considered. In the context of global climate change, variations in wildfire activitity exert growing influences on PBrC, introducing additional challenges for its management and climate implications. The compensation between declining anthropogenic emissions and rising wildfire emissions suggests a crucial mitigation pathway: effective climate governance should target not only wildfire management but anthropogenic emissions, especially across East Aasia, South Asia, and Southeast Asia with intensive human activity.
In this study, we employed a two-way coupled WRF-CMAQ modeling system to investigate the long-term spatiotemporal distribution of PBrC in China and to quantify its impacts on atmospheric O3 concentrations and DRE. Our results indicate that: PBrC in China is predominantly emitted from residential, industrial, and agricultural sources, with high concentrations mainly concentrated in regions with intensive anthropogenic emissions. Over the past decades, PBrC concentrations in China have exhibited a pronounced decreasing trend. Compared with 2005, surface PBrC concentrations in 2020 declined by 20.8 %, which can be largely attributed to substantial reductions in residential emissions. While wildfires dominate the global PBrC burden, their influence in China is relatively limited and is mainly confined to higher altitudes over southern China.
We examined the impacts of PBrC on atmospheric environment and radiative effects. The influences of PBrC on atmospheric photochemistry are generally modest across China. Even in eastern and central China, PBrC leads to only approximately 2 % reduction in annual mean JNO2 and a 1 %–2 % decrease in MDA8 O3. We assessed the long-term DRE of PBrC and found that anthropogenic emissions dominate their radiative effects. Consistent with the declining PBrC concentrations, the national mean DRE decreased from +0.032 ± 0.006 W m−2 in 2005 to +0.023 ± 0.008 W m−2 in 2020, representing a reduction of −25.7 %.
This study provides valuable insights into the long-term evolution of the sources, distributions, and impacts of PBrC in China, highlighting the important role of changes in anthropogenic emissions from different sectors in shaping PBrC trends and their associated atmospheric and radiative effects.
All data supporting this study and its findings have been included in the Supplement. They are available in an online data repository at https://doi.org/10.17632/rnt7m6w269.1 (Chen et al., 2026).
The supplement related to this article is available online at https://doi.org/10.5194/acp-26-14867-2026-supplement.
GC processed data, designed the models, and wrote the original draft. YW contributed to the result discussion. QY contributed to the methodology and result analysis. XW contributed to the result discussion. HZ designed and supervised the research. All coauthors helped improve the paper.
The contact author has declared that none of the authors has any competing interests.
Publisher's note: Copernicus Publications remains neutral with regard to jurisdictional claims made in the text, published maps, institutional affiliations, or any other geographical representation in this paper. The authors bear the ultimate responsibility for providing appropriate place names. Views expressed in the text are those of the authors and do not necessarily reflect the views of the publisher.
The authors would like to acknowledge availability of models and publicly accessible observational datasets.
This work was supported by the National Key R&D Program of China (2022YFC3701105), the National Natural Science Foundation of China (42077194/42061134008/42377098), and the Shanghai International Science and Technology Partner-ship Project (21230780200).
This paper was edited by Alex Lee and reviewed by two anonymous referees.
Bohren, C. F. and Huffman, D. R.: Absorption and Scattering of Light by Small Particles, Wiley, New York, ISBN 9780471293408, https://onlinelibrary.wiley.com/doi/book/10.1002/9783527618156 (last access: 20 October 2026), 1998.
Bond, T. C., Habib, G., and Bergstrom, R. W.: Limitations in the enhancement of visible light absorption due to mixing state, J. Geophys. Res.-Atmos., https://doi.org/10.1029/2006JD007315, 2006.
Boylan, J. W. and Russell, A. G.: PM and light extinction model performance metrics, goals, and criteria for three-dimensional air quality models, Atmos. Environ., 40, 4946–4959, https://doi.org/10.1016/j.atmosenv.2005.09.087, 2006.
Browne, E. C., Zhang, X., Franklin, J. P., Ridley, K. J., Kirchstetter, T. W., Wilson, K. R., Cappa, C. D., and Kroll, J. H.: Effect of heterogeneous oxidative aging on light absorption by biomass burning organic aerosol, Aerosol Sci. Tech., 53, 663–674, https://doi.org/10.1080/02786826.2019.1599321, 2019.
Calderon-Arrieta, D., Morales, A. C., Hettiyadura, A. P. S., Estock, T. M., Li, C., Rudich, Y., and Laskin, A.: Enhanced Light Absorption and Elevated Viscosity of Atmospheric Brown Carbon through Evaporation of Volatile Components, Environ. Sci. Technol., 58, 7493–7504, https://doi.org/10.1021/acs.est.3c10184, 2024.
Chen, G., Qiu, M., Wang, P., Zhang, Y., Shindell, D., and Zhang, H.: Continuous wildfires threaten public and ecosystem health under climate change across continents, Front. Environ. Sci. Eng., 18, 130, https://doi.org/10.1007/s11783-024-1890-6, 2024.
Chen, G., Wang, Y., Tao, C., Zhang, Z., Zhou, M., Yan, R., Huang, D. D., Wang, H., and Zhang, H.: Nitrate-driven extreme winter PM2.5 pollution in Shanghai, China, npj Clean Air, 1, 28, https://doi.org/10.1038/s44407-025-00028-3, 2025.
Chen, G., Wang, Y., Ying, Q., Wang, X., and Zhang, H.: Data to “Long-term evolution and effects of primary brown carbon aerosol in China”, Mendeley Data [data set], V1, https://doi.org/10.17632/rnt7m6w269.1, 2026.
Chen, Y. and Bond, T. C.: Light absorption by organic carbon from wood combustion, Atmos. Chem. Phys., 10, 1773–1787, https://doi.org/10.5194/acp-10-1773-2010, 2010.
Cheng, Y., Kong, S., Yao, L., Zheng, H., Wu, J., Yan, Q., Zheng, S., Hu, Y., Niu, Z., Yan, Y., Shen, Z., Shen, G., Liu, D., Wang, S., and Qi, S.: Multiyear emissions of carbonaceous aerosols from cooking, fireworks, sacrificial incense, joss paper burning, and barbecue as well as their key driving forces in China, Earth Syst. Sci. Data, 14, 4757–4775, https://doi.org/10.5194/essd-14-4757-2022, 2022.
Choi, M. and Ying, Q.: Modeling the impacts of open biomass burning on regional O3 and PM 2.5 in Southeast Asia considering light absorption and photochemical bleaching of Brown carbon, Atmos. Environ., 342, https://doi.org/10.1016/j.atmosenv.2024.120942, 2025.
Choi, M., Zhang, J., Zhang, Y., Fan, J., Li, X., and Ying, Q.: Impact of wildfires on regional ozone and PM2.5: Considering the light absorption of Brown carbon, Atmos. Environ., 316, https://doi.org/10.1016/j.atmosenv.2023.120196, 2024.
Feng, Y., Ramanathan, V., and Kotamarthi, V. R.: Brown carbon: a significant atmospheric absorber of solar radiation?, Atmos. Chem. Phys., 13, 8607–8621, https://doi.org/10.5194/acp-13-8607-2013, 2013.
Giles, D. M., Sinyuk, A., Sorokin, M. G., Schafer, J. S., Smirnov, A., Slutsker, I., Eck, T. F., Holben, B. N., Lewis, J. R., Campbell, J. R., Welton, E. J., Korkin, S. V., and Lyapustin, A. I.: Advancements in the Aerosol Robotic Network (AERONET) Version 3 database – automated near-real-time quality control algorithm with improved cloud screening for Sun photometer aerosol optical depth (AOD) measurements, Atmos. Meas. Tech., 12, 169–209, https://doi.org/10.5194/amt-12-169-2019, 2019.
Guenther, A. B., Jiang, X., Heald, C. L., Sakulyanontvittaya, T., Duhl, T., Emmons, L. K., and Wang, X.: The Model of Emissions of Gases and Aerosols from Nature version 2.1 (MEGAN2.1): an extended and updated framework for modeling biogenic emissions, Geosci. Model Dev., 5, 1471–1492, https://doi.org/10.5194/gmd-5-1471-2012, 2012.
Hansen, J., Sato, M., and Ruedy, R.: Radiative forcing and climate response, J. Geophys. Res.-Atmos., https://doi.org/10.1029/96JD03436, 1997.
Hettiyadura, A. P. S., Garcia, V., Li, C., West, C. P., Tomlin, J., He, Q., Rudich, Y., and Laskin, A.: Chemical Composition and Molecular-Specific Optical Properties of Atmospheric Brown Carbon Associated with Biomass Burning, Environ. Sci. Technol., 55, 2511–2521, https://doi.org/10.1021/acs.est.0c05883, 2021.
Huang, Y., Lu, X., Li, Z., Fung, J. C. H., Wang, Y., and Chen, Y.: Direct radiative effects of black carbon and brown carbon from Southeast Asia biomass burning with the WRF-CMAQ two-way coupled model, Environ. Pollut., 366, https://doi.org/10.1016/j.envpol.2024.125425, 2025.
Jo, D. S., Park, R. J., Lee, S., Kim, S.-W., and Zhang, X.: A global simulation of brown carbon: implications for photochemistry and direct radiative effect, Atmos. Chem. Phys., 16, 3413–3432, https://doi.org/10.5194/acp-16-3413-2016, 2016.
Kirchstetter, T. W., Novakov, T., and Hobbs, P. V.: Evidence that the spectral dependence of light absorption by aerosols is affected by organic carbon, J. Geophys. Res.-Atmos., https://doi.org/10.1029/2004JD004999, 2004.
Kuang, Y., Luo, B., Huang, S., Liu, J., Hu, W., Peng, Y., Chen, D., Yue, D., Xu, W., Yuan, B., and Shao, M.: Formation of highly absorptive secondary brown carbon through nighttime multiphase chemistry of biomass burning emissions, Atmos. Chem. Phys., 25, 3737–3752, https://doi.org/10.5194/acp-25-3737-2025, 2025.
Laskin, A., Laskin, J., and Nizkorodov, S. A.: Chemistry of Atmospheric Brown Carbon, Chem. Rev., 115, 4335–4382, https://doi.org/10.1021/cr5006167, 2015.
Laskin, A., West, C. P., and Hettiyadura, A. P. S.: Molecular insights into the composition, sources, and aging of atmospheric brown carbon, Chem. Soc. Rev., 54, 1583–1612, https://doi.org/10.1039/d3cs00609c, 2025.
Li, Y., Fu, T.-M., Yu, J. Z., Zhang, A., Yu, X., Ye, J., Zhu, L., Shen, H., Wang, C., Yang, X., Tao, S., Chen, Q., Li, Y., Li, L., Che, H., and Heald, C. L.: Nitrogen dominates global atmospheric organic aerosol absorption, Science, https://doi.org/10.1126/science.adr4473, 2025.
Lin, G., Penner, J. E., Flanner, M. G., Sillman, S., Xu, L., and Zhou, C.: Radiative forcing of organic aerosol in the atmosphere and on snow: Effects of SOA and brown carbon, J. Geophys. Res.-Atmos., 119, 7453–7476, https://doi.org/10.1002/2013JD021186, 2014.
Liu, D., He, C., Schwarz, J. P., and Wang, X.: Lifecycle of light-absorbing carbonaceous aerosols in the atmosphere, npj Climate and Atmospheric Science, 3, https://doi.org/10.1038/s41612-020-00145-8, 2020a.
Liu, J., Zheng, Y., Geng, G., Hong, C., Li, M., Li, X., Liu, F., Tong, D., Wu, R., Zheng, B., He, K., and Zhang, Q.: Decadal changes in anthropogenic source contribution of PM2.5 pollution and related health impacts in China, 1990–2015, Atmos. Chem. Phys., 20, 7783–7799, https://doi.org/10.5194/acp-20-7783-2020, 2020b.
Liu, L., Kong, S., Zhang, Y., Wang, Y., Xu, L., Yan, Q., Lingaswamy, A. P., Shi, Z., Lv, S., Niu, H., Shao, L., Hu, M., Zhang, D., Chen, J., Zhang, X., and Li, W.: Morphology, composition, and mixing state of primary particles from combustion sources – crop residue, wood, and solid waste, Sci. Rep., 7, 5047, https://doi.org/10.1038/s41598-017-05357-2, 2017.
Lu, Z., Streets, D. G., Winijkul, E., Yan, F., Chen, Y., Bond, T. C., Feng, Y., Dubey, M. K., Liu, S., Pinto, J. P., and Carmichael, G. R.: Light Absorption Properties and Radiative Effects of Primary Organic Aerosol Emissions, Environ. Sci. Technol., 49, 4868–4877, https://doi.org/10.1021/acs.est.5b00211, 2015.
Mok, J., Krotkov, N. A., Arola, A., Torres, O., Jethva, H., Andrade, M., Labow, G., Eck, T. F., Li, Z., Dickerson, R. R., Stenchikov, G. L., Osipov, S., and Ren, X.: Impacts of brown carbon from biomass burning on surface UV and ozone photochemistry in the Amazon Basin, Sci. Rep., 6, https://doi.org/10.1038/srep36940, 2016.
Park, R. J., Kim, M. J., Jeong, J. I., Youn, D., and Kim, S.: A contribution of brown carbon aerosol to the aerosol light absorption and its radiative forcing in East Asia, Atmos. Environ., 44, 1414–1421, https://doi.org/10.1016/j.atmosenv.2010.01.042, 2010.
Randles, C. A., Silva, A. M. da, Buchard, V., Colarco, P. R., Darmenov, A., Govindaraju, R., Smirnov, A., Holben, B., Ferrare, R., Hair, J., Shinozuka, Y., and Flynn, C. J.: The MERRA-2 Aerosol Reanalysis, 1980 Onward. Part I: System Description and Data Assimilation Evaluation, https://doi.org/10.1175/JCLI-D-16-0609.1, 2017.
Saleh, R.: From Measurements to Models: Toward Accurate Representation of Brown Carbon in Climate Calculations, Current Pollution Reports, 6, 90–104, https://doi.org/10.1007/s40726-020-00139-3, 2020.
Saleh, R., Robinson, E. S., Tkacik, D. S., Ahern, A. T., Liu, S., Aiken, A. C., Sullivan, R. C., Presto, A. A., Dubey, M. K., Yokelson, R. J., Donahue, N. M., and Robinson, A. L.: Brownness of organics in aerosols from biomass burning linked to their black carbon content, Nat. Geosci., 7, 647–650, https://doi.org/10.1038/NGEO2220, 2014.
Shrivastava, M., Lou, S., Zelenyuk, A., Easter, R. C., Corley, R. A., Thrall, B. D., Rasch, P. J., Fast, J. D., Massey Simonich, S. L., Shen, H., and Tao, S.: Global long-range transport and lung cancer risk from polycyclic aromatic hydrocarbons shielded by coatings of organic aerosol, P. Natl. Acad. Sci., 114, 1246–1251, https://doi.org/10.1073/pnas.1618475114, 2017.
Song, R., Wang, T., Han, J., Xu, B., Ma, D., Zhang, M., Li, S., Zhuang, B., Li, M., and Xie, M.: Spatial and temporal variation of air pollutant emissions from forest fires in China, Atmos. Environ., 281, 119156, https://doi.org/10.1016/j.atmosenv.2022.119156, 2022.
Tsigaridis, K. and Kanakidou, M.: The Present and Future of Secondary Organic Aerosol Direct Forcing on Climate, Current Climate Change Reports, 4, 84–98, https://doi.org/10.1007/s40641-018-0092-3, 2018.
U.S. EPA: Guidance on the use of models and other analyses for demonstrating attainment of air quality goals for ozone, PM2.5, and regional haze, EPA-454/B-07-002, https://nepis.epa.gov/Exe/ZyPDF.cgi?Dockey=P1009OL1.PDF (last access: 20 October 2026), 2007.
Via, M., Minguillón, M. C., Reche, C., Querol, X., and Alastuey, A.: Increase in secondary organic aerosol in an urban environment, Atmos. Chem. Phys., 21, 8323–8339, https://doi.org/10.5194/acp-21-8323-2021, 2021.
Wang, Q., Han, Y., Ye, J., Liu, S., Pongpiachan, S., Zhang, N., Han, Y., Tian, J., Wu, C., Long, X., Zhang, Q., Zhang, W., Zhao, Z., and Cao, J.: High Contribution of Secondary Brown Carbon to Aerosol Light Absorption in the Southeastern Margin of Tibetan Plateau, Geophys. Res. Lett., 46, 4962–4970, https://doi.org/10.1029/2019GL082731, 2019.
Wang, W., van der A, R., Ding, J., van Weele, M., and Cheng, T.: Spatial and temporal changes of the ozone sensitivity in China based on satellite and ground-based observations, Atmos. Chem. Phys., 21, 7253–7269, https://doi.org/10.5194/acp-21-7253-2021, 2021.
Wang, X., Heald, C. L., Ridley, D. A., Schwarz, J. P., Spackman, J. R., Perring, A. E., Coe, H., Liu, D., and Clarke, A. D.: Exploiting simultaneous observational constraints on mass and absorption to estimate the global direct radiative forcing of black carbon and brown carbon, Atmos. Chem. Phys., 14, 10989–11010, https://doi.org/10.5194/acp-14-10989-2014, 2014.
Wang, X., Heald, C. L., Liu, J., Weber, R. J., Campuzano-Jost, P., Jimenez, J. L., Schwarz, J. P., and Perring, A. E.: Exploring the observational constraints on the simulation of brown carbon, Atmos. Chem. Phys., 18, 635–653, https://doi.org/10.5194/acp-18-635-2018, 2018.
Wang, X., Chakrabarty, R. K., Schwarz, J. P., Murphy, S. M., Levin, E. J. T., Howell, S. G., Guo, H., Campuzano-Jost, P., and Jimenez, J. L.: Dark brown carbon from biomass burning contributes to significant global-scale positive forcing, One Earth, 8, https://doi.org/10.1016/j.oneear.2025.101205, 2025.
Wang, Y., Hu, M., Lin, P., Guo, Q., Wu, Z., Li, M., Zeng, L., Song, Y., Zeng, L., Wu, Y., Guo, S., Huang, X., and He, L.: Molecular Characterization of Nitrogen-Containing Organic Compounds in Humic-like Substances Emitted from Straw Residue Burning, Environ. Sci. Technol., https://doi.org/10.1021/acs.est.7b00248, 2017.
Wang, Y., Gao, W., Wang, S., Song, T., Gong, Z., Ji, D., Wang, L., Liu, Z., Tang, G., Huo, Y., Tian, S., Li, J., Li, M., Yang, Y., Chu, B., Petäjä, T., Kerminen, V.-M., He, H., Hao, J., Kulmala, M., Wang, Y., and Zhang, Y.: Contrasting trends of PM2.5 and surface-ozone concentrations in China from 2013 to 2017, Natl. Sci. Rev., 7, 1331–1339, https://doi.org/10.1093/nsr/nwaa032, 2020.
Washenfelder, R. A., Attwood, A. R., Brock, C. A., Guo, H., Xu, L., Weber, R. J., Ng, N. L., Allen, H. M., Ayres, B. R., Baumann, K., Cohen, R. C., Draper, D. C., Duffey, K. C., Edgerton, E., Fry, J. L., Hu, W. W., Jimenez, J. L., Palm, B. B., Romer, P., Stone, E. A., Wooldridge, P. J., and Brown, S. S.: Biomass burning dominates brown carbon absorption in the rural southeastern United States, Geophys. Res. Lett., 42, 653–664, https://doi.org/10.1002/2014GL062444, 2015.
Weyant, C. L., Chen, P., Vaidya, A., Li, C., Zhang, Q., Thompson, R., Ellis, J., Chen, Y., Kang, S., Shrestha, G. R., Yagnaraman, M., Arineitwe, J., Edwards, R., and Bond, T. C.: Emission Measurements from Traditional Biomass Cookstoves in South Asia and Tibet, Environ. Sci. Technol., 53, 3306–3314, https://doi.org/10.1021/acs.est.8b05199, 2019.
Wong, D. C., Pleim, J., Mathur, R., Binkowski, F., Otte, T., Gilliam, R., Pouliot, G., Xiu, A., Young, J. O., and Kang, D.: WRF-CMAQ two-way coupled system with aerosol feedback: software development and preliminary results, Geosci. Model Dev., 5, 299–312, https://doi.org/10.5194/gmd-5-299-2012, 2012.
Wong, J. P. S., Nenes, A., and Weber, R. J.: Changes in Light Absorptivity of Molecular Weight Separated Brown Carbon Due to Photolytic Aging, Environ. Sci. Technol., 51, 8414–8421, https://doi.org/10.1021/acs.est.7b01739, 2017.
Xiao, Q., Geng, G., Xue, T., Liu, S., Cai, C., He, K., and Zhang, Q.: Tracking PM2.5 and O3 Pollution and the Related Health Burden in China 2013–2020, Environ. Sci. Technol., 56, 6922–6932, https://doi.org/10.1021/acs.est.1c04548, 2022.
Xie, C., Xu, W., Wang, J., Wang, Q., Liu, D., Tang, G., Chen, P., Du, W., Zhao, J., Zhang, Y., Zhou, W., Han, T., Bian, Q., Li, J., Fu, P., Wang, Z., Ge, X., Allan, J., Coe, H., and Sun, Y.: Vertical characterization of aerosol optical properties and brown carbon in winter in urban Beijing, China, Atmos. Chem. Phys., 19, 165–179, https://doi.org/10.5194/acp-19-165-2019, 2019.
Xing, L., Fu, T.-M., Cao, J. J., Lee, S. C., Wang, G. H., Ho, K. F., Cheng, M.-C., You, C.-F., and Wang, T. J.: Seasonal and spatial variability of the OM/OC mass ratios and high regional correlation between oxalic acid and zinc in Chinese urban organic aerosols, Atmos. Chem. Phys., 13, 4307–4318, https://doi.org/10.5194/acp-13-4307-2013, 2013.
Xiong, R., Li, J., Zhang, Y., Zhang, L., Jiang, K., Zheng, H., Kong, S., Shen, H., Cheng, H., Shen, G., and Tao, S.: Global brown carbon emissions from combustion sources, Environmental Science and Ecotechnology, 12, https://doi.org/10.1016/j.ese.2022.100201, 2022.
Yan, J., Wang, X., Gong, P., Wang, C., and Cong, Z.: Review of brown carbon aerosols: Recent progress and perspectives, Sci. Total. Environ., 634, 1475–1485, https://doi.org/10.1016/j.scitotenv.2018.04.083, 2018.
Yang, S., Liu, Y., Chen, L., Cao, N., Wang, J., and Gao, S.: Direct radiative forcing of light-absorbing carbonaceous aerosol and the influencing factors over China, Atmos. Chem. Phys., 25, 9335–9355, https://doi.org/10.5194/acp-25-9335-2025, 2025.
Ying, Q. and Kleeman, M. J.: Source contributions to the regional distribution of secondary particulate matter in California, Atmos. Environ., 40, 736–752, https://doi.org/10.1016/j.atmosenv.2005.10.007, 2006.
Ying, Q., Li, J., and Kota, S. H.: Significant Contributions of Isoprene to Summertime Secondary Organic Aerosol in Eastern United States, Environ. Sci. Technol., 49, 7834–7842, https://doi.org/10.1021/acs.est.5b02514, 2015.
Zhang, A., Wang, Y., Zhang, Y., Weber, R. J., Song, Y., Ke, Z., and Zou, Y.: Modeling the global radiative effect of brown carbon: a potentially larger heating source in the tropical free troposphere than black carbon, Atmos. Chem. Phys., 20, 1901–1920, https://doi.org/10.5194/acp-20-1901-2020, 2020.
Zhang, H., Li, J., Ying, Q., Yu, J. Z., Wu, D., Cheng, Y., He, K., and Jiang, J.: Source apportionment of PM2.5 nitrate and sulfate in China using a source-oriented chemical transport model, Atmos. Environ., 62, 228–242, https://doi.org/10.1016/j.atmosenv.2012.08.014, 2012.
Zhang, Y., Forrister, H., Liu, J., Dibb, J., Anderson, B., Schwarz, J. P., Perring, A. E., Jimenez, J. L., Campuzano-Jost, P., Wang, Y., Nenes, A., and Weber, R. J.: Top-of-atmosphere radiative forcing affected by brown carbon in the upper troposphere, Nat. Geosci., 10, 486, https://doi.org/10.1038/NGEO2960, 2017.
Zhang, Y., Peng, Y., Song, W., Zhang, Y.-L., Ponsawansong, P., Prapamontol, T., and Wang, Y.: Contribution of brown carbon to the light absorption and radiative effect of carbonaceous aerosols from biomass burning emissions in Chiang Mai, Thailand, Atmos. Environ., 260, https://doi.org/10.1016/j.atmosenv.2021.118544, 2021.
Zheng, B., Tong, D., Li, M., Liu, F., Hong, C., Geng, G., Li, H., Li, X., Peng, L., Qi, J., Yan, L., Zhang, Y., Zhao, H., Zheng, Y., He, K., and Zhang, Q.: Trends in China's anthropogenic emissions since 2010 as the consequence of clean air actions, Atmos. Chem. Phys., 18, 14095–14111, https://doi.org/10.5194/acp-18-14095-2018, 2018.