
the Creative Commons Attribution 4.0 License.
the Creative Commons Attribution 4.0 License.
 | 29 Sep 2026
Tracing biological, anthropogenic, and inorganic sources of coarse aerosols via single-particle fluorescence and optical morphology

Jinglan Fu
Gabriel Pereira Freitas
Ian Crawford
Pavla Dagsson-Waldhauserová
Radovan Krejci
Yutaka Tobo
Karl Espen Yttri
Coarse-mode aerosol particles influence the environment, climate, and human health in diverse ways depending on their type. While mineral dust and sea spray aerosol (SSA) dominate this size range, rarer biological particles can have outsized impacts, such as initiating hydrometeor freezing at relatively warm temperatures. Accurate type-specific characterization of coarse-mode aerosol is therefore essential for investigating their roles in climate and the environment. We provide a new reference dataset for fluorescence spectra and morphology characteristics of coarse-mode aerosols from common sources, including pollen, dust, bacteria, and microplastics, measured in controlled experiments with a Multiparameter Bioaerosol Spectrometer (MBS). Comparisons with published datasets revealed consistent source-dependent fluorescence features, but also highlighted similarities between biological and non-biological particles that can bias fluorescence-based classifications.
To explore solutions for these confounding similarities, we developed a supervised machine learning classification algorithm integrating fluorescence and morphology information, and evaluated it using MBS and comprehensive chemical tracer observations from Zeppelin Observatory, Svalbard. This evaluation illustrates challenges for inductive methods in distinguishing biomass burning from biological particles, and dust from SSA, suggesting that important particle classes may be missing and/or laboratory-generated aerosols significantly differ from real-world counterparts. We show that domain adaptation using complementary observations can help address these difficulties. Compared to a fluorescence-only approach, the domain-adapted algorithm reproduces the previously published annual bioaerosol cycle while yielding higher summertime concentrations matching those reported from offline analyses. This open-source algorithm provides a basis for quantifying bioaerosols across diverse environments and can be refined with future field and laboratory efforts.
- Article
(4560 KB) - Full-text XML
-
Supplement
(843 KB) - BibTeX
- EndNote


The chemical and physical properties of aerosol particles determine how they interact with atmospheric radiation and moisture, and thus influence climate and weather. Detailed knowledge about these parameters is therefore important for understanding and predicting their impacts. Among primary coarse-mode (defined as supermicron-scale) aerosols, dust and sea spray aerosols (SSA) dominate the global aerosol mass burden (Choobari et al., 2014; Textor et al., 2006) and contribute substantially to solar radiation extinction (Gliß et al., 2021). Both play key roles in atmospheric processes: mineral dust can nucleate ice and trigger heterogeneous freezing in mixed-phase clouds at temperatures < −15 °C (Murray et al., 2012; Hoose and Möhler, 2012; Adebiyi et al., 2023), whereas SSA provide highly hygroscopic surfaces that facilitate important chemical reactions (Bertram et al., 2018; Schiffer et al., 2018). Primary biological aerosol particles (PBAPs), such as pollen, bacteria, fungal spores, and decomposing biological matter, are important for biology, ecology, and human society as vectors of genetic material and pathogens; however, they can also influence climate. In the atmosphere, PBAPs can nucleate ice at much warmer temperatures than dust, with some airborne bacteria being capable of initiating freezing at temperatures as high as −2 °C (Maki et al., 1974). Although PBAPs are far less abundant and their number concentrations are highly variable, typically between 10−3–101 L−1 (Després et al., 2012), even low concentrations may substantially affect mixed-phase cloud properties due to highly efficient glaciation feedbacks at temperatures > −15 °C like the Hallett-Mossop process (Field et al., 2017; Zhao and Liu, 2021).
Attaining robust information on aerosol type, provenance, and composition is not trivial. Offline analysis can offer valuable information about aerosol type, but it is labor-intensive, placing limitations on sampling. Online aerosol mass spectrometers offer higher temporal resolution for chemical composition, but typically only determine bulk composition in a narrow size range (Nash et al., 2006; Pratt and Prather, 2012) or at single-particle resolution. Although single-particle mass spectrometers can offer valuable information about aerosol type, they typically have limited, strongly size-dependent detection efficiencies (Froyd et al., 2019; Jacquot et al., 2024) and are costly and difficult to miniaturize, making their employment quite rare (Lai et al., 2025). Similarly, quantifying PBAP concentrations with offline methods generally requires labor-intensive analysis using e.g. flow cytometry or microscopy (Després et al., 2012).
Fluorescence is a composition-dependent phenomenon that can provide information about particle type. It has long been implemented in offline analytical methods and, more recently, in online particle detectors. Fluorescence refers to the relaxation of electronically excited molecules by emitting photons in the visible range after excitation by absorbing light, usually in the ultraviolet (UV) or (less commonly) visible spectrum. The emitted light has a longer wavelength than the excitation light (Fu and Finney, 2018). Fluorophores, such as the amino acid tryptophan and the coenzyme riboflavin, are common in biological material; thus, bioaerosols often fluoresce strongly (Pöhlker et al., 2012).
In UV light-induced fluorescence (UV-LIF) techniques, sampled particles are exposed to UV light and their visible fluorescence is measured in order to detect fluorophores. UV-LIF spectroscopy additionally resolves the fluorescence emission's spectral dependence, providing proxy information for particle composition at high sampling resolution. This technique has been implemented in several single-particle bioaerosol detectors, including the Wideband Integrated Bioaerosol Sensor (WIBS; Droplet Measurement Technologies, LLC, USA), UV Aerodynamic Particle Sizer (UVAPS; TSI Inc., USA), SwisensPoleno bioaerosol monitor (Swisens AG, Switzerland; Sauvageat et al., 2020), Real-time Airborne Particle Identifier (RAPID; Plair SA, Switzerland; Sikoparija et al., 2024), and Multiparameter Bioaerosol Spectrometer (MBS; University of Hertfordshire, UK; Ruske et al., 2017). Many UV-LIF instruments target the fluorescence of proteins such as tryptophan (excited at 280 nm), while some use multiple excitation wavelengths to probe for a wider range of fluorophores (Pöhlker et al., 2012). Besides PBAPs, biogenic compounds, including fluorophores, can occasionally be present in dust and SSA, potentially influencing atmospheric processes such as ice nucleation (Tobo et al., 2014; Conen and Yakutin, 2018; Wolf et al., 2020; Hartmann et al., 2025). Most UV-LIF instruments also measure optical properties that describe particle morphology, which can be combined with fluorescence spectra for particle characterization. Although fluorescence is not an exact or quantitative technique for determining composition, these instruments provide ample information with which to identify and quantify PBAPs.
A key challenge is that fluorophores are also common in non-biological particles, posing potential problems for PBAP identification. Many polycyclic aromatic hydrocarbons (PAHs) are highly fluorescent (Zhang et al., 2017) and are emitted by the combustion of biomass and fossil fuels. PAHs can also coat co-emitted soot and other non-biological particles, causing them to fluoresce (e.g. Toprak and Schnaiter, 2013; Yu et al., 2016). Plastic polymers typically fluoresce due to the presence of aromatic groups in base materials or trace additives used in their synthesis (Gratzl et al., 2024), or by the production of fluorophores during aging (e.g. Htun and Klein, 2010; Grabmayer et al., 2014). This property has been used to detect airborne and marine microplastics in the environment (Pandey et al., 2022; Morgana et al., 2024; Beres et al., 2024). Although the primary target of the instruments listed above is bioaerosol detection, identifying and quantifying particles of anthropogenic origin may also be a useful application for UV-LIF methods in environmental science.
In this study, we characterized coarse-mode particles from climate-relevant sources and likely interferents in the laboratory to build a reference dataset and improve ambient detection. Fluorescence and morphology measurements were made using the MBS, a single-particle UV-LIF spectrometer that also measures optical scattering properties (Sect. 3.1), and compared with published laboratory datasets (Sect. 3.2). We assessed these characterizations' implications for particle identification, and built a generalized machine learning (ML)-based particle classification algorithm trained on these data (Sect. 3.3). Finally, we applied the algorithm to field observations made with the MBS at the Zeppelin Observatory at Svalbard and assessed its performance against parallel measurements of relevant tracer species and PBAP estimates from a previously used decision-tree particle classifier based solely on fluorescence (Sect. 3.4). In addition to yielding a classification algorithm that may be applied to observations and improved with additional characterization data, these results guide a discussion on addressing challenges in bioaerosol identification with future methodological and instrument development efforts (Sect. 4).
2.1 The multiparameter bioaerosol spectrometer
We used a Multiparameter Bioaerosol Spectrometer (MBS; University of Herefordshire, UK), a UV-LIF spectroscopy device developed for detecting bioaerosols in ambient air (Ruske et al., 2017). The MBS operates at a fixed instrument flow rate set by the user, typically between 1–2.5 L min−1, but particle measurement frequency is constrained by coded triggering sequences. A fixed fraction (0.165) of the total flow is drawn as sample flow with the remainder serving as sheath flow. In the measurement stage, each particle passes sequentially through a low-power laser beam for sizing and a high-power pulsed laser beam for diffraction pattern measurement, and is then exposed to a xenon flash lamp emitting 280 nm light to excite fluorescence. Light scattered from the sizing laser is detected using a photomultiplier, and the particle's size is estimated using Mie scattering theory. With its optical configuration, the effective particle size range for measurement with the MBS is 0.5 to ∼ 20 µm. The high-power laser emits a 10 µs pulse of light for each particle; light scattered by the particle is directed through a beam splitter to two 512-pixel complementary metal oxide semiconductor (CMOS) arrays positioned on the left (L) and right (R) sides of the beam. These arrays measure chords across the particle's diffraction pattern, providing optical scattering information, serving as proxies for morphology. The arrays are offset from the beam centerline by a distance set for the instrument's target particle size range. Consequently, the morphology metrics derived from diffraction are inherently size-dependent because diffraction pattern scales vary with particle size, whereas the array spacing is fixed. Fluorescence emitted after excitation is collected by a hemispheric mirror, limited to exclude < 305 nm light with a long-pass filter, dispersed using a diffraction grating, and measured in eight acceptance intervals (channels, labeled A-H) with roughly equidistant central wavelengths (315, 364, 414, 461, 508, 552, 595, and 640 nm, respectively) spanning a detection region of approximately 305–655 nm (Fig. S1 in the Supplement). Fluorescence intensity is not measured in physical units; we report fluorescence intensities as fractions normalized by detector signals. Fluorescence signals in individual channels may saturate if intensities exceed the detector's upper sensitivity limit. The maximum particle measurement rate is also limited by the xenon lamp's recharge time, yielding an upper rate of about 160 particles s−1 (Freitas et al., 2022), enough to characterize most particles in even high ambient coarse-mode particle concentrations.
2.2 Data treatment
The MBS periodically measures background intensities sensed by each detector, i.e. that of the optical stage after a pulse of excitation light without sample flow, with a series of 42 xenon lamp flashes once when beginning the measurement and then typically after 30 000 samples (Freitas et al., 2022). This provides an estimate of the instrument's baseline detector intensity spectrum, which is subtracted from each subsequently measured particle's measured spectrum. Fluorescence intensity can then be expressed in terms of standard deviations (σ, determined by the spread in background measurements) above the background mean. Because the MBS's sampling efficiency drops below 50 % for sizes < 0.8 µm (Ruske et al., 2017), we exclude all particles smaller than this from our analysis. Particle morphology parameters are calculated by the MBS software from the two CMOS array scattering signals. These parameters distill characteristics of particle scattering properties into statistical and shape descriptors. For each array, the software calculates the mean and variance of signal intensity, as well as the skew and kurtosis (treating each detected curve as a normal distribution). It also locates peaks using a user-defined local peak-trough threshold and derives peak width (width at half maximum of the strongest peak), peak-to-mean ratio (PTMR; also based on the strongest peak), and peak count for each array. Mirror symmetry, defined as the similarity between the bottom and top halves of the signal, is calculated for each array and given as a percentage. Because particles align with the flow and have arbitrary rotational orientations in the detection stage, we report array-specific parameters using an arbitrary array of choice (right; R) for visualization. Two additional asymmetry parameters are provided: left-right (L-R) pixel-wise asymmetry, and pixel-wise asymmetry with one array inverted, both calculated as a percentage.
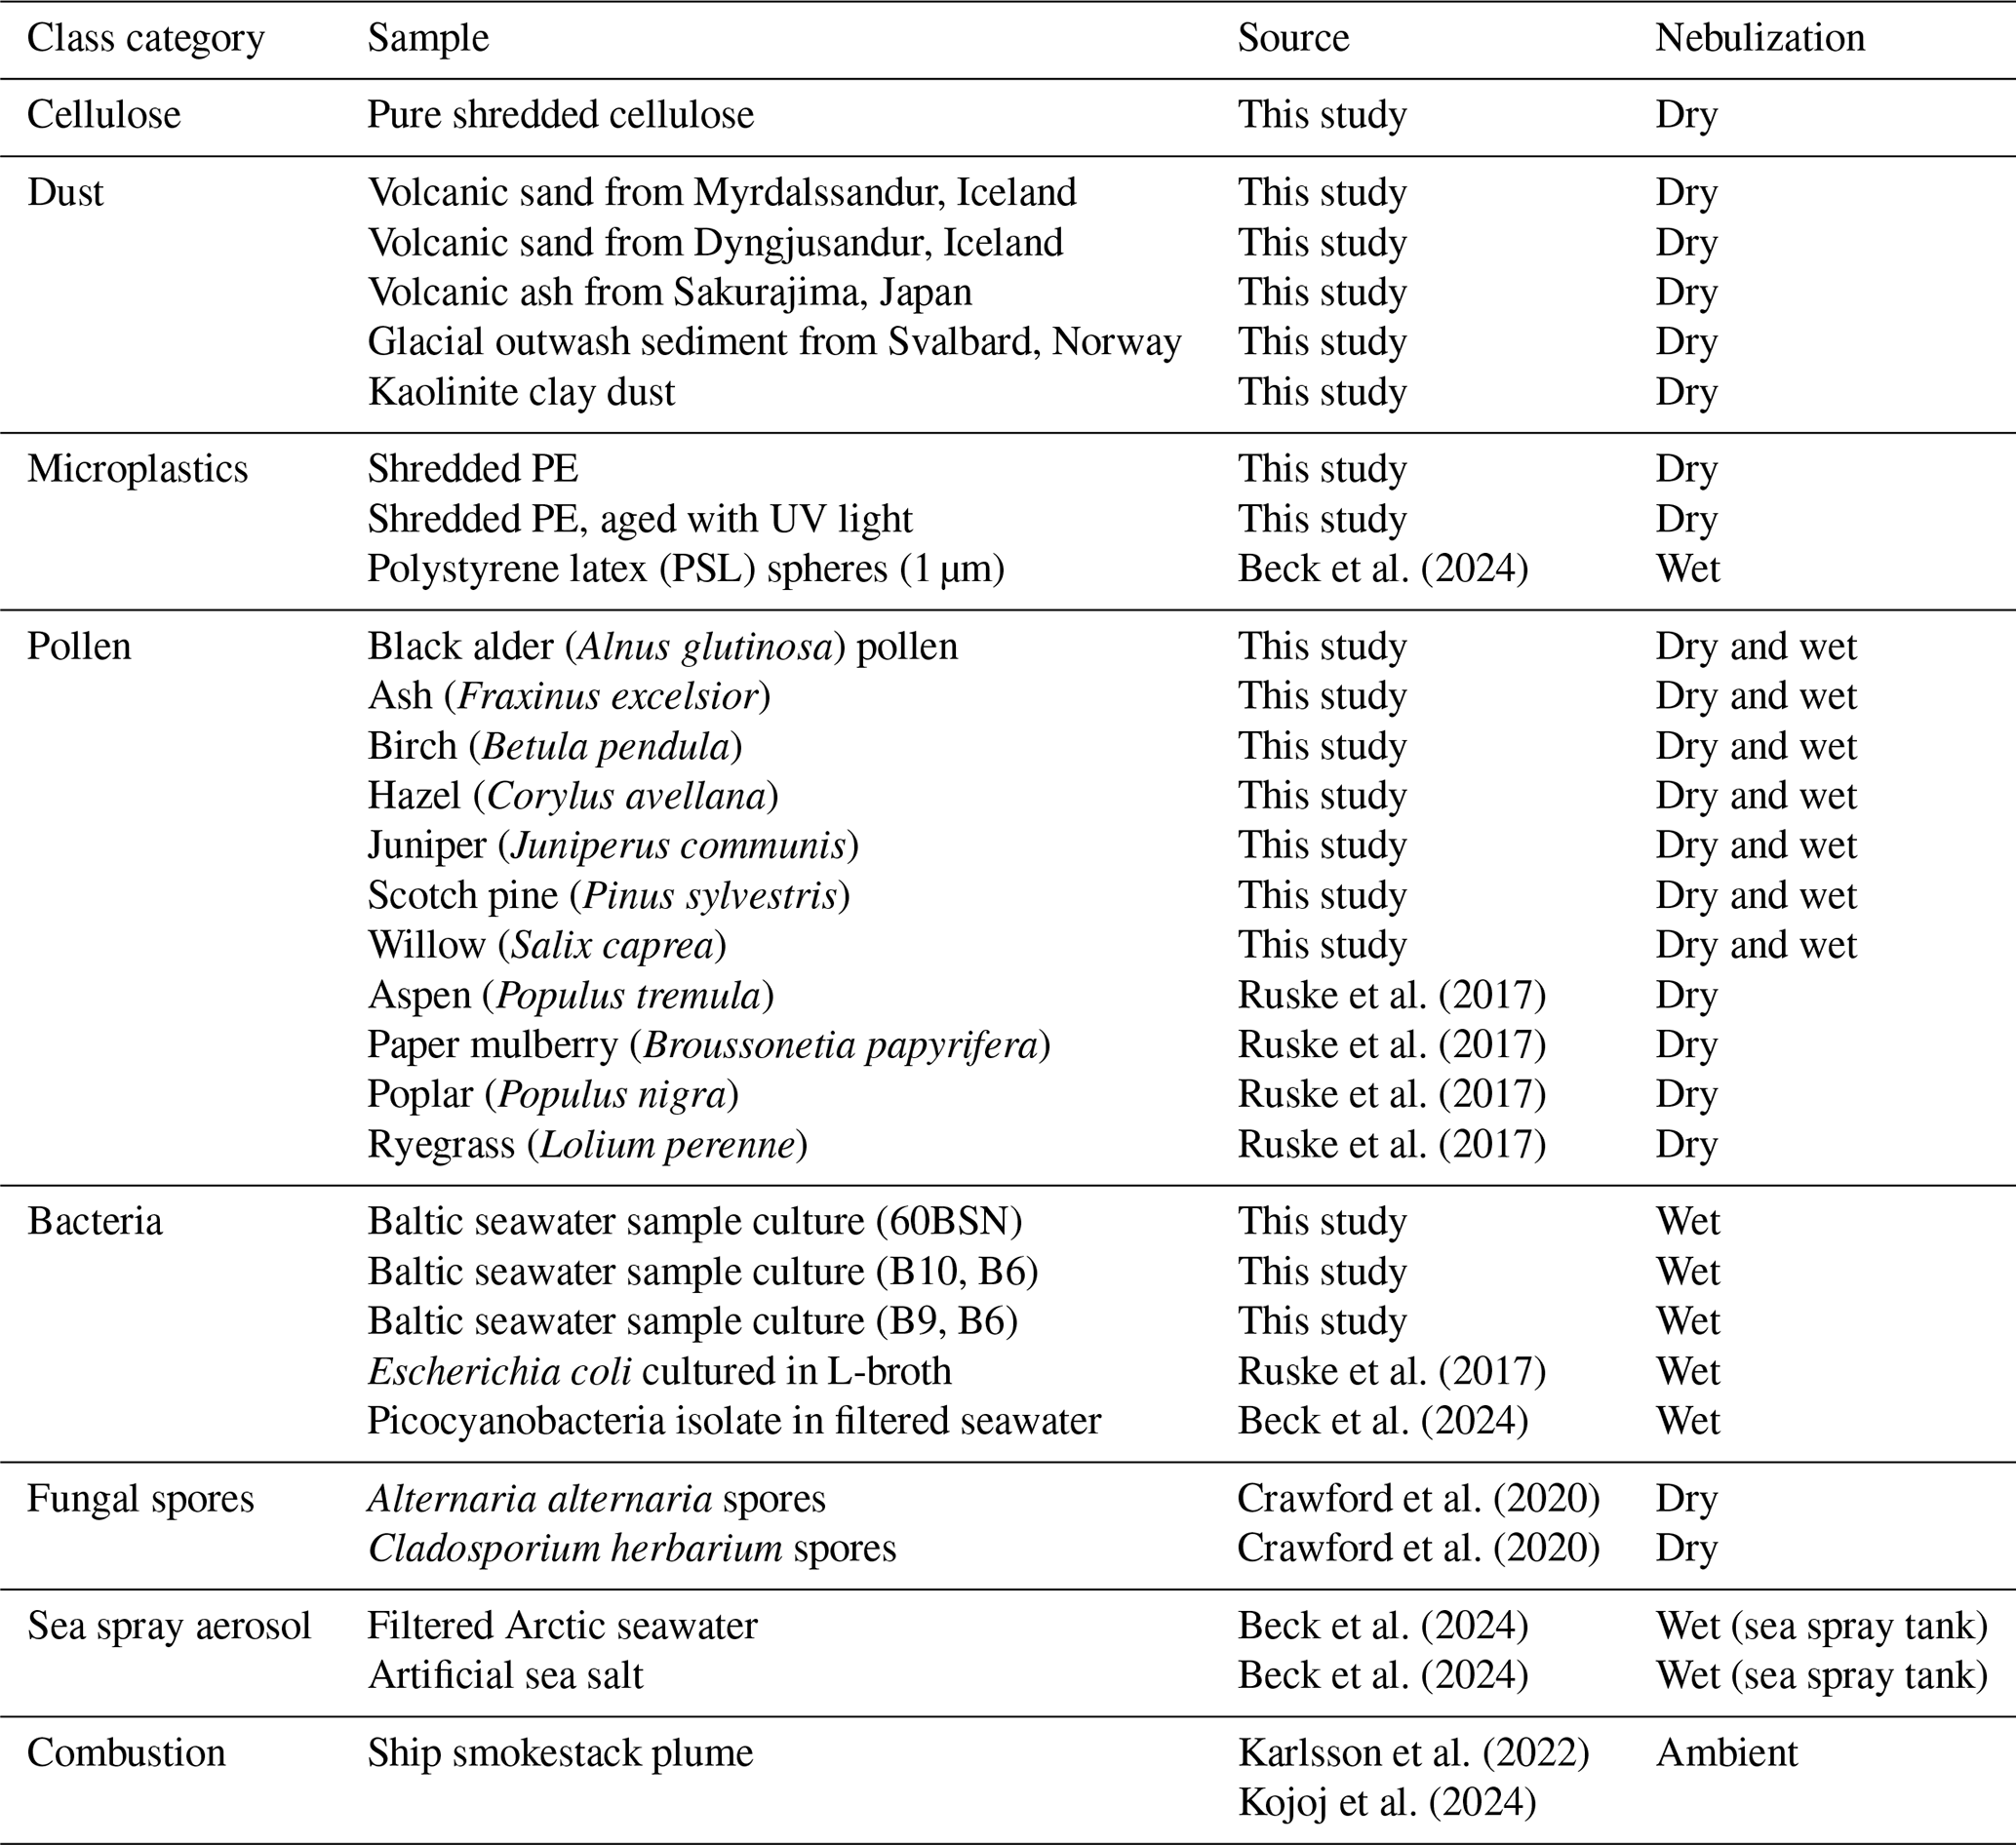
Beck et al. (2024)Ruske et al. (2017)Ruske et al. (2017)Ruske et al. (2017)Ruske et al. (2017)Ruske et al. (2017)Beck et al. (2024)Crawford et al. (2020)Crawford et al. (2020)Beck et al. (2024)Beck et al. (2024)Karlsson et al. (2022)Kojoj et al. (2024)Table 1Overview of the analyzed samples, their citations, and nebulization methods used in their source experiments.
Freitas et al. (2022) developed a heuristic decision tree (DT)-based classification of particles measured by the MBS based on fluorescence, which was later applied and validated in subsequent studies (Freitas et al., 2023a; Zinke et al., 2024; Freitas et al., 2024; Kojoj et al., 2024). In this classification scheme (Fig. 2 in Freitas et al., 2022), particles are classified as fluorescent (3–9σ fluorescence in any channel), highly fluorescent particles (HFPs; > 9σ signal in any channel), and fluorescent PBAPs (fPBAPs), defined as HFPs with a fluorescence maximum in the second (B) channel. It is well documented that PBAPs, especially bacteria, commonly show pronounced fluorescence around 350–400 nm due to fluorophores such as tryptophan (Pöhlker et al., 2012). This feature underpins the MBS's design and is widely used in UV-LIF-based PBAP detection (e.g. Crawford et al., 2015; Tang et al., 2022; Gao et al., 2024). In this study, we used this DT-based method as a benchmark for PBAP identification. As an additional metric of the shapes of fluorescence spectra, we calculated a fluorescence ratio defined as the sum of channels A and B divided by the sum of channels C-H, with higher values indicating a stronger peak in the earlier channels.
2.3 Samples and laboratory characterization experiments
The samples characterized with the MBS in this study were selected to represent common sources of aerosols potentially relevant in many environments, including tree pollen, marine bacteria, dust, and synthetic contaminants (Table 1). Cellulose, a major component of plant cell walls, was chosen as an analog to plant matter and as a constituent of pollen (e.g. Winiwarter et al., 2009; Yttri et al., 2011; Bozzetti et al., 2016). We used pure, synthesized crystalline cellulose (Sigma Aldrich, cat. no. 435236).
Pollen were sourced from various locations in the Czech Republic by Pharmallerga CZ s.r.o. (Lišov, Czech Republic). The species of trees from which pollen was sourced for this study were ash (Fraxinus excelsior), black alder (Alnus glutinosa), birch (Betula pendula), hazel (Corylus avellana), juniper (Juniperus communis), Scotch pine (Pinus sylvestris), and willow (Salix caprea). Pharmallerga assessed pollen quality by microscopy and with acetic blue staining; pollen processing and size ranges they reported are listed in Table S1 in the Supplement. Pollen was collected by hand, with the exception of juniper, collected with vacuum, the spring/summer before the experiments took place (January 2022). All samples were processed dry (sifting and drying), with the exception of willow, which was defatted with acetone. Samples were stored cold (< 8 °C) in centrifuge tubes at the supplier prior to dispatch and in a freezer (∼ −20 °C) thereafter; experiments were conducted over the next two months. To investigate whether aerosolization method affected MBS-observed properties, we used both dry and wet nebulization.
Bacterial samples were mixed cultures of cyanobacteria from Baltic seawater. We selected three cultures with distinct natural pigment profiles (phycobiliproteins and carotenoids) to capture diversity, but we did not identify individual species. These pigments – phycobiliproteins (phycoerythrin, phycocyanin, and allophycocyanin) and other compounds (e.g. carotenoids) – absorb in different spectra of light and differ from chlorophyll A absorption (Gantt and Cunningham, 2001), allowing them to be differentiated from algae.
Ground polyethylene (PE) was chosen as a representative microplastic. Because environmental microplastics undergo weathering processes that may alter their optical and fluorescence properties, we measured freshly ground PE particles, with one subsample exposed to UV light to simulate photolytic aging. While we compare the relative effects of aging in our experiments, we do not attempt to quantify physico-chemical changes resulting from UV aging as the MBS is not suitable to this end. Measured quantities reported here are thus not expected to be directly comparable with those found in other experiments using more exact methods.
Natural dust samples collected in the field from four sources, Dyngjusandur and Myrdalssandur in Iceland, Svalbard, and Sakurajima in Japan, were included as potential high-latitude dust sources relevant to the Arctic. Dyngjusandur and Myrdalssandur samples contain primarily volcanic silt and sand (Arnalds et al., 2016), whereas the Sakurajima sample is primarily volcanic ash. The Svalbard sample, previously characterized for its ice nucleation activity in Tobo et al. (2019) (sample BR1607b), originates from glacial outwash sediment. In addition, kaolinite clay was selected as a sample of mineral dust reference expected to contain minimal organic matter.
For dry, solid materials, 5 mL of the sample was placed in a centrifuge tube mounted on a speaker (Fig. S2b in the Supplement) and vibrated at a frequency selected using a function generator. The optimal frequency depended on the sample type and nebulization efficiency, but stable, high particle concentrations were typically achieved at 15–30 Hz. A commercial nebulizer (Topas GmbH, Germany, model ATM228) with a fixed nebulization pressure of 100 hPa (gauge) was used for wet and liquid samples, including pollen solutions. For wet nebulization using the TOPAS nebulizer, the sample air stream was dried using a Nafion dryer, while the sample air from the dry (speaker) nebulization was not actively dried (see Fig. S2). The sample air relative humidity was monitored using an inline RH/temperature sensor (Hytelog USB, B+B sensors, Germany) immediately upstream of the MBS to ensure particles were measured dry. Each sample was nebulized and measured for at least 10 min. Background tests using empty containers (shaken empty centrifuge tubes for dry samples, nebulized pure Milli-Q water for wet) showed negligible background concentrations, far below those seen in the characterization experiments (∼ 100 L−1). Samples were measured in sequence from those least to most likely to adhere to the instrument and plumbing to minimize carryover between experiments.
2.4 External data
To compare our characterization of specific aerosol types to previous work, we include laboratory data from Ruske et al. (2017), Crawford et al. (2020), and Beck et al. (2024), as well as data from known pollution events in Karlsson et al. (2022) and Kojoj et al. (2024). The pollution events were observed during an Arctic Ocean research cruise when the ship's exhaust plume was transported directly to the inlet from which the MBS was sampling. Because the ship operated in very remote locations (> 80° N) and particle concentrations during the pollution events exceeded background concentrations of other fluorescent particles (e.g., PBAPs) by several orders of magnitude, we consider these observations representative of fossil fuel combustion sources, despite being measured in ambient air. The sea spray aerosol (SSA) measured by Beck et al. (2024) were generated with a plunging-jet sea spray simulation chamber of the type described by Salter et al. (2014) and Salter et al. (2015). We include data from our characterization experiments and these external sources in our ML training and classification algorithm (see Sect. 2.5). This extends the classes of particles to include fungal spores (Crawford et al., 2020) and SSA (Beck et al., 2024), and increases diversity in bacteria, pollen, and dust samples (Ruske et al., 2017; Crawford et al., 2020; Beck et al., 2024). In addition, we include data from polystyrene latex spheres (PSLs) measured for calibration in Beck et al. (2024); these represent particles with well-constrained optical and morphological properties (spherical and opaque) and provide another sample to the microplastic class. Table 1 lists source type, used nebulization methods, and citations for all data considered in our study, including our own characterization experiments.
2.5 Machine learning and classification algorithm
Information from the MBS can be used to train particle identification algorithms on laboratory characterization data; such approaches using ML have previously been applied to measurements made with the MBS (Ruske et al., 2017) and other UV-LIF spectrometers (Ruske et al., 2018). Here, we developed a new and improved classification algorithm for MBS data with three tasks, in order of priority:
- 1.
flag fluorescent particles that are likely interferents, so they can be excluded from PBAP concentration estimates;
- 2.
classify fluorescent particles into broad PBAP subgroups, and;
- 3.
classify non-fluorescent particles as dust- or SSA-like particles.
The methods used for each component model are described below, with their implications discussed in the results (Sect. 3.3). Table S2 in the Supplement summarizes the MBS data input variables and their roles in the classification algorithm.
We treated tasks 1 and 2 as binary classification tasks and used logistic regression modeling (LRM; El Morr et al., 2022) for both. LRMs fit logistic functions to training data to estimate the probability that a new observation belongs to class 0 or 1, and can accommodate many input variables. This approach is well suited to task 1, flagging observations as interferents or non-interferents in a pollution model, and to the dust vs. non-dust decision in a dust model for task 3. The model output is a probability estimate between 0 and 1, obtained by averaging logistic function outputs across input features, which we name pollution-likelihood and dust-likelihood for the pollution and dust models, respectively. Positive identification can be determined by rounding this probability or by choosing a threshold, which can adjust identification confidence. These LRMs were trained using least squares error (L2) loss functions and the limited-memory Broyden–Fletcher–Goldfarb–Shanno (LBFGS) solver (Nocedal, 2006).
Dimensionality reduction is useful for quantifying and presenting differences between observations with a high number of features (Jia et al., 2022), such as the many fluorescence and morphology metrics measured by the MBS. Incorporating morphology metrics into particle classification can help prevent overly strong influence by fluorescence information, which may not be enough to distinguish particle types. Dimensionality reduction can be used to rapidly map similarities with known particles and as a pre-processing step for other ML methods, or as its own classification method (e.g., Crawford et al., 2020, 2023) in certain cases. For task 2, we used uniform manifold approximation and projection (UMAP), a technique for approximating a topological manifold on which data with any number of dimensions are located and quantifying their relative proximities in a lower dimensional space. UMAP approximators are created by iteratively considering n neighbors in the dataset and estimating proximities between members, projecting the graph in e.g. two-dimensional space, and ensuring that connections between individual points in the original data are preserved (Healy and McInnes, 2024). Our UMAP approximators were made using the UMAP-learn Python library; details about the package's methods and underlying theory are described in McInnes et al. (2020). For training, we used 100 neighbors, set a minimum separation between transformed points of 0.15, and provided training class labels for clustering. The approximator's outputs are the transformed data positions in two arbitrary dimensions, here defined as UMAP1 and UMAP2, similar to other non-metric multidimensional scaling methods (e.g. Clarke, 1993).
After UMAP transformation, we used k-nearest neighbors (kNN) to classify data according to their positions in the transformed space relative to the positions of particles of known types from source characterization data. In kNN, observations are compared to the k closest neighbors in the training data and classified by votes defined as the number of neighbors belonging to each class. The kNN outputs a class identification corresponding to the class with the most votes and the percentage of votes among the k neighbors cast for each class. Because kNN classifiers generally struggle with high-dimensional data, the use of UMAP both simplifies class labeling (compared to other multiclass methods such as random forest) and provides an additional clustering step for more robust identification.
2.6 Algorithm assessment and domain adaptation
To assess our classification algorithm, we applied it to MBS observations from Zeppelin Observatory, Svalbard made over 2020 during the Ny-Ålesund Aerosol Cloud Experiment (NASCENT) campaign (Pasquier et al., 2022). This reproduces the analysis of Freitas et al. (2023a), who applied and further validated the fluorescence-only DT-based approach that has since proven successful in other studies made with the MBS (Freitas et al., 2024; Zinke et al., 2024; Kojoj et al., 2024). Repeating this published analysis with our new classification algorithm allows a direct assessment of its strengths and weaknesses. Additional data for assessment were obtained from 24 h to weekly resolved filter sampling (Platt et al., 2022), except for equivalent black carbon (eBC), which was obtained with the Multiangle Aerosol Absorption Photometer (MAAP) at minutely resolution averaged to daily values (Freitas et al., 2023a). Sampling frequencies and references for the species (tracers) used for the assessment here and in Freitas et al. (2023a) are summarized in Table S3 in the Supplement. Both classification algorithms were applied to MBS data collocated with the tracer sampling windows. Particle class concentrations were calculated as the number of observed particles assigned to each class divided by the MBS sample air volume during that period. Sample volume was determined from the sampling duration and the constant sample flow rate of 0.33 L min−1 reported in Freitas et al. (2023a).
We used chemical tracers for dust (silicon, iron, potassium) (Lu et al., 2019; Bai et al., 2021; Hird et al., 2024), PBAP (fructose, glucose, arabitol, and mannitol) (Bauer et al., 2008; Winiwarter et al., 2009), SSA (sodium, chloride, magnesium, calcium) (Crawford et al., 2019; Karle et al., 2024), anthropogenic aerosol (eBC), and biomass burning (eBC, levoglucosan) (Vincenti et al., 2022). Fructose and glucose are monosaccharides used as PBAP tracers (Jia and Fraser, 2011). Glucose is ubiquitous across organisms, whereas fructose is a photosynthetic product rapidly metabolized by non-plant organisms and is thus more characteristic of pollen and plant matter (Pacini et al., 2006; Medeiros et al., 2006; Jia et al., 2010; Rathnayake et al., 2017; Mampage et al., 2022). Arabitol and mannitol are sugar alcohols that serve as energy reserves and, owing to their abundance in fungi, are considered as tracers for fungal spores (Bauer et al., 2008), and have been used to verify UV-LIF-based fungal spore detection (Gosselin et al., 2016). Levoglucosan forms from the pyrolysis of cellulose and is an established tracer for biomass burning (BB) (Simoneit, 1999; Yttri et al., 2015; Xu et al., 2018; Yttri et al., 2024). eBC is emitted by both fossil fuel and biomass combustion and is thus used to trace the influence of all combustion aerosols (Andreae and Gelencsér, 2006).
Having simultaneous knowledge about particle composition from detailed tracer data also affords the possibility of directly implementing lessons from the assessment in tuning the classification algorithm, a process known as transfer learning (Venkateswara and Panchanathan, 2020). Domain adaptation is a transfer learning technique for ML wherein a model trained in one domain (here, in laboratory settings) is adapted for use in another (field observations), which helps overcome challenges introduced by differences between the domains (e.g. differences in particle properties between naturally and laboratory-generated aerosol). We implemented domain adaptation in our classification algorithm based on the results of the assessment by using tracer concentrations to construct probability estimates of observing targeted particle types, which were used to further train the model in a controlled manner. The details of the domain adaptation implementation are further explained alongside our assessment of the initial classification algorithm in Sect. 3.4 and in the SI (Sect. S1 in the Supplement).
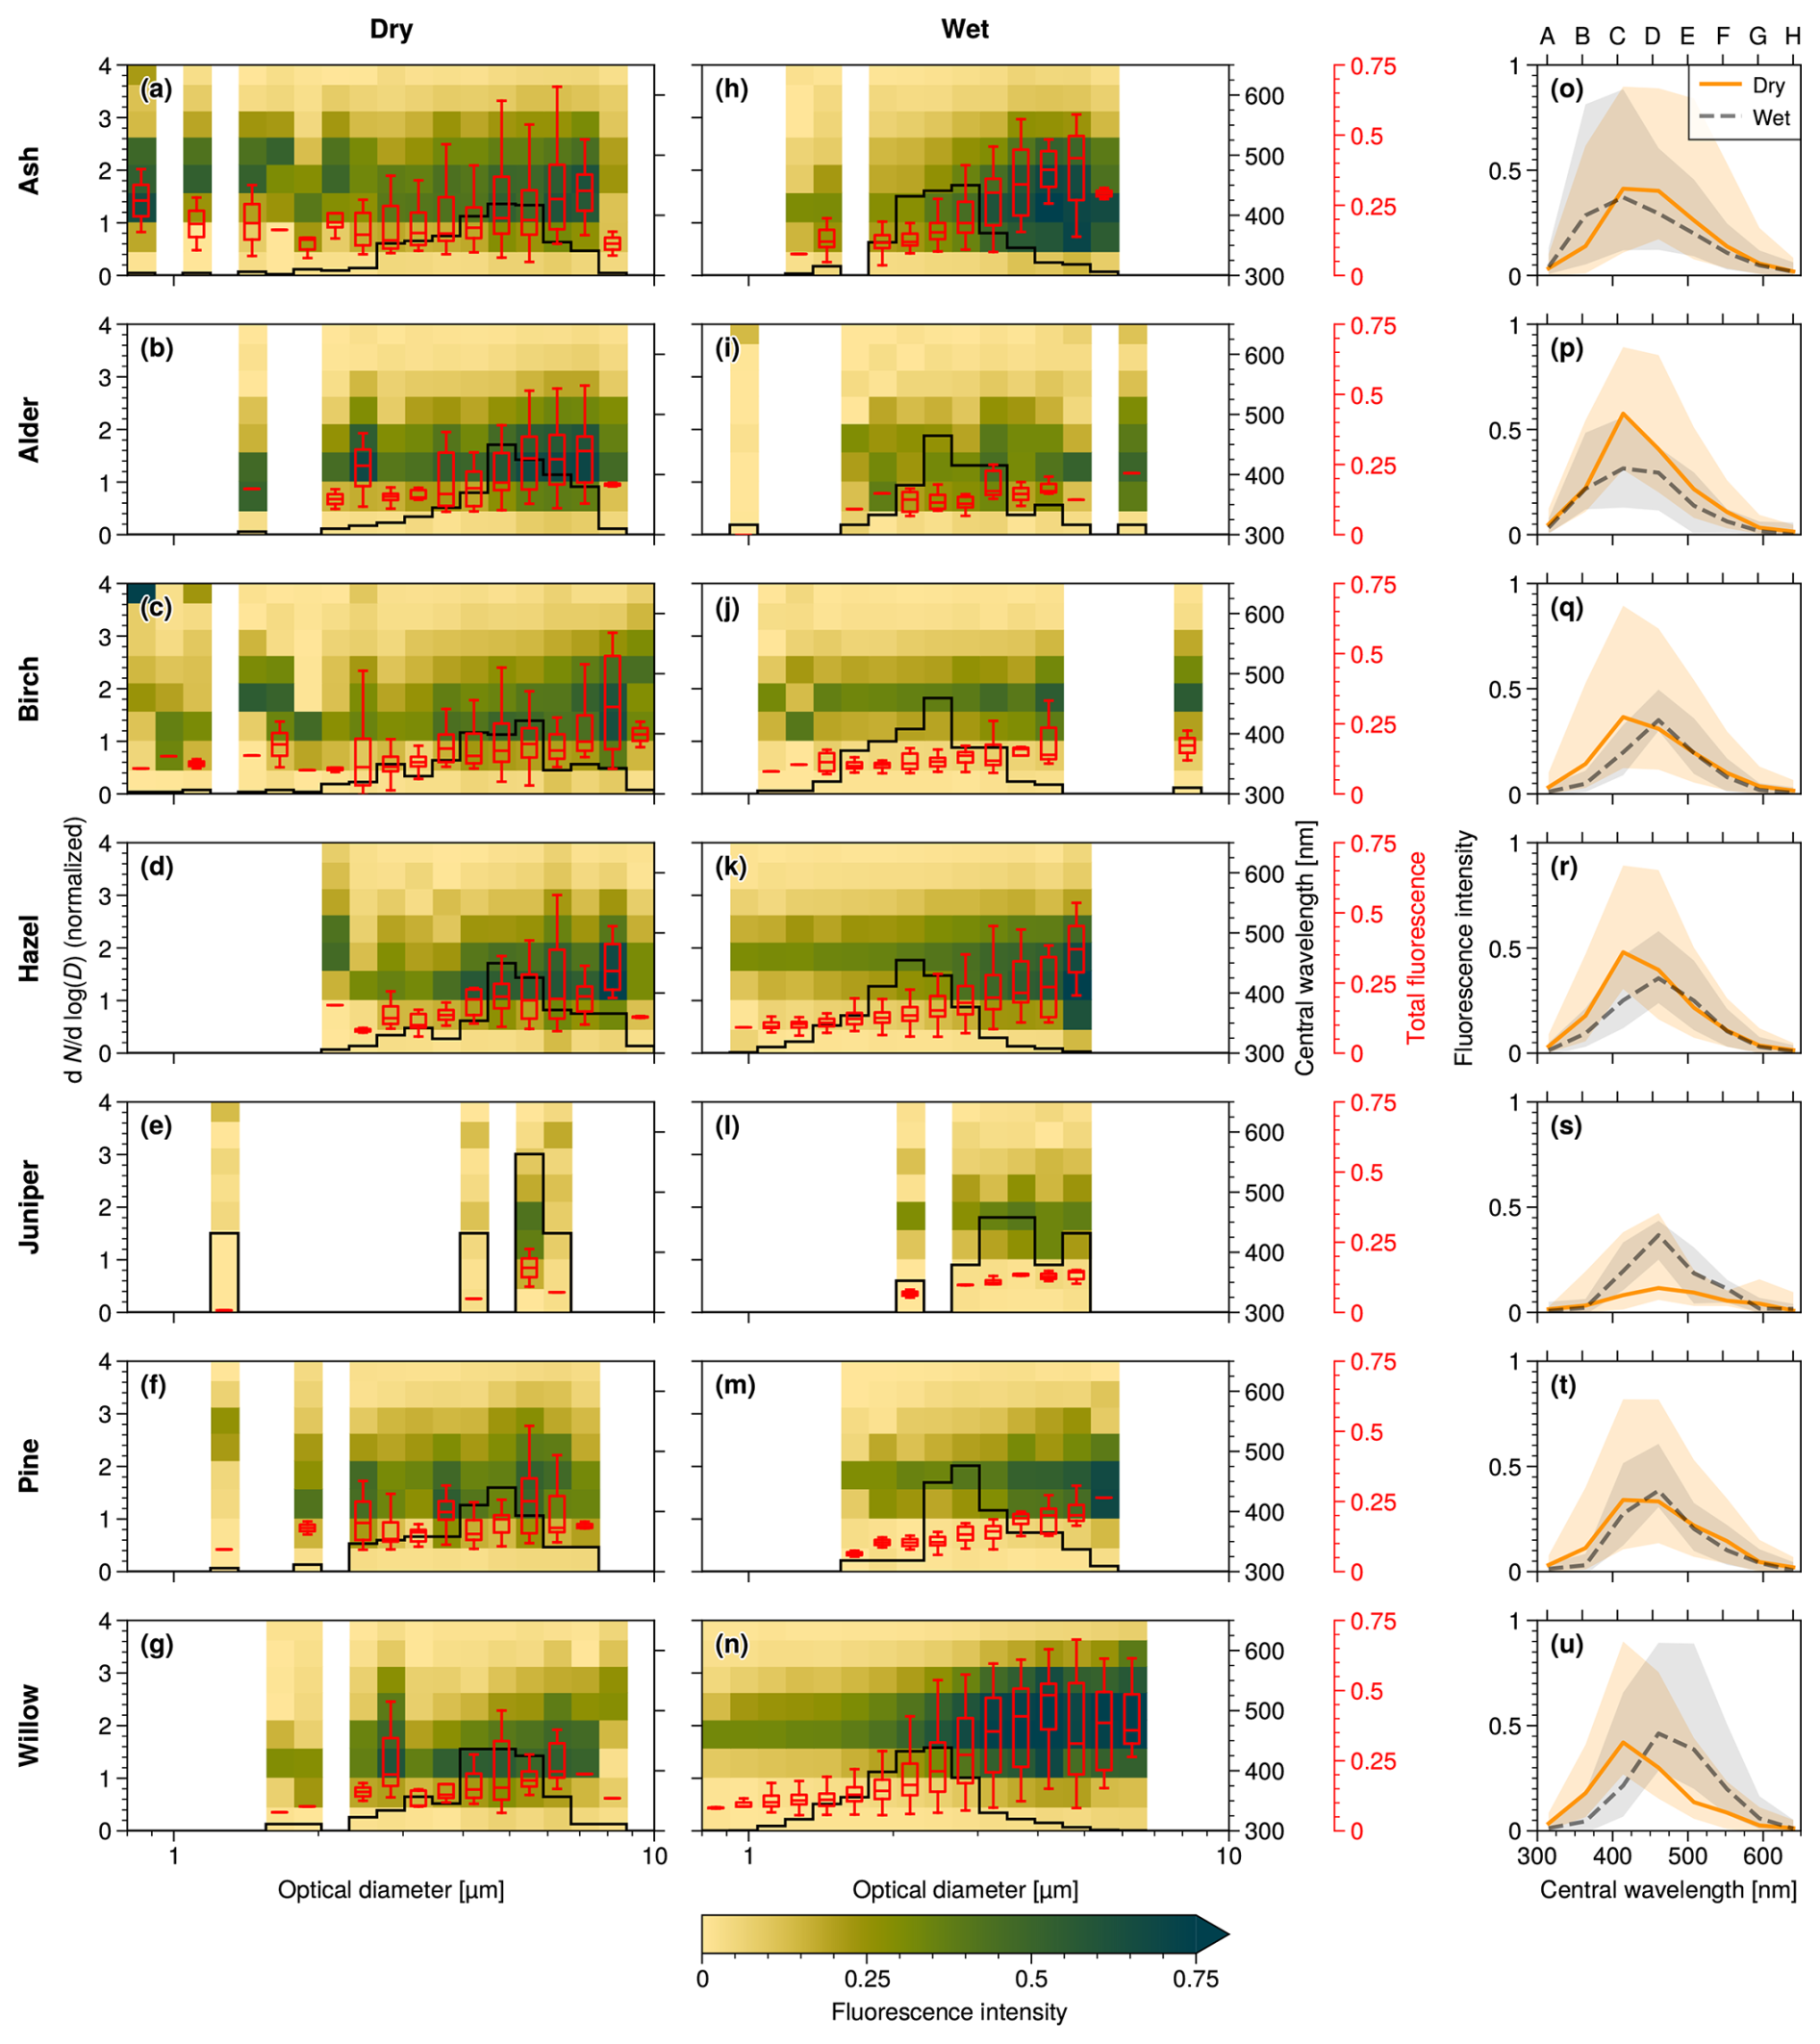
Figure 1Pollen-derived particle fluorescence properties and size distributions measured in our characterization experiments. Size distributions (left axis, black step trace) and fluorescence emission spectra (right axis, color map) for highly fluorescent particles (HFPs) with > 9σ fluorescence signal, binned by size, in (a–g) dry and (h–n) wet pollen characterization experiments. Box plots (red axes) depict the range of total fluorescence in each size bin. Fluorescence intensities are given as a fraction of detector maxima at saturation. (o–u): The median fluorescence emission spectra of HFPs in dry (solid) and wet (dashed) pollen experiments at all sizes; shaded areas represent 10 %–90 % quantile ranges. Upper axes show fluorescence detection channel names corresponding to their central detection wavelengths in the lower axes.
3.1 Laboratory characterization of fluorescent particles
Emission spectra and size distributions measured in dry and wet pollen experiments are shown in Fig. 1. The particles we detected were far smaller than the whole pollen grain sizes reported by the supplier (Table S1); our results therefore represent fragments produced by the rupture or fragmentation of intact pollen grains. Moisture (Suphioglu et al., 1992; Stone et al., 2021; Matthews et al., 2023) and impaction (Visez et al., 2015) are known to induce fragmentation in laboratory experiments and in ambient air, potentially providing a secondary source of PBAPs with a greater transport range and residence time than intact pollen that may affect key atmospheric processes (Wozniak et al., 2018; Hughes et al., 2020; Prank et al., 2025). Although their ambient detection remains difficult, observational evidence of strong variability in pollen fragment emission and concentrations under humid conditions has been found using UV-LIF (Hughes et al., 2020; Zhang et al., 2025). While our data should aid pollen fragment identification in field observations, it is important to note that intact pollen grains lie outside the MBS's detection size range and cannot be measured with this instrument. Additionally, rupture and/or fragmentation may have been promoted during sample transport and storage.
Most dry pollen fragments peak in the C channel (∼ 414 nm), with ash, juniper, and pine having slightly broader spectra (Fig. 1o–u). Wet nebulization consistently broadens the emission spectra of pollen fragments for willow pollen (Fig. 1u) and shifts fluorescence peaks to channel D (∼ 461 nm) for birch, hazel, juniper, pine, and willow pollen (Fig. 1q–u). In general, dry pollen fragment fluorescence is dominated by fluorophores on the grain exterior, composed mainly of sporopollenin (Zimmermann, 2010), whereas pollen fragments can include interior fluorophores, such as phenols, carotenoids, azulene, and anthocyanin, all with different emission characteristics (Fennelly et al., 2018). Wet nebulization produced more numerous, smaller particles (Fig. 1h–n) than dry nebulization (Fig. 1a–g), indicating a different emission mode, likely including soluble material re-formed as residue after drying. These particles show more regular, symmetric, droplet-like scattering signatures (Sect. 3.3). Thus, the aerosolization method clearly affects both fluorescence and morphology, with implications for ambient detection. The especially strong wet-dry contrast in fluorescence seen with willow pollen (Fig. 1g and 1n) may be due to acetone de-fatting (Table S1), as removing surface lipids likely increases water uptake and solubility, promoting rupture and altering fluorescence.
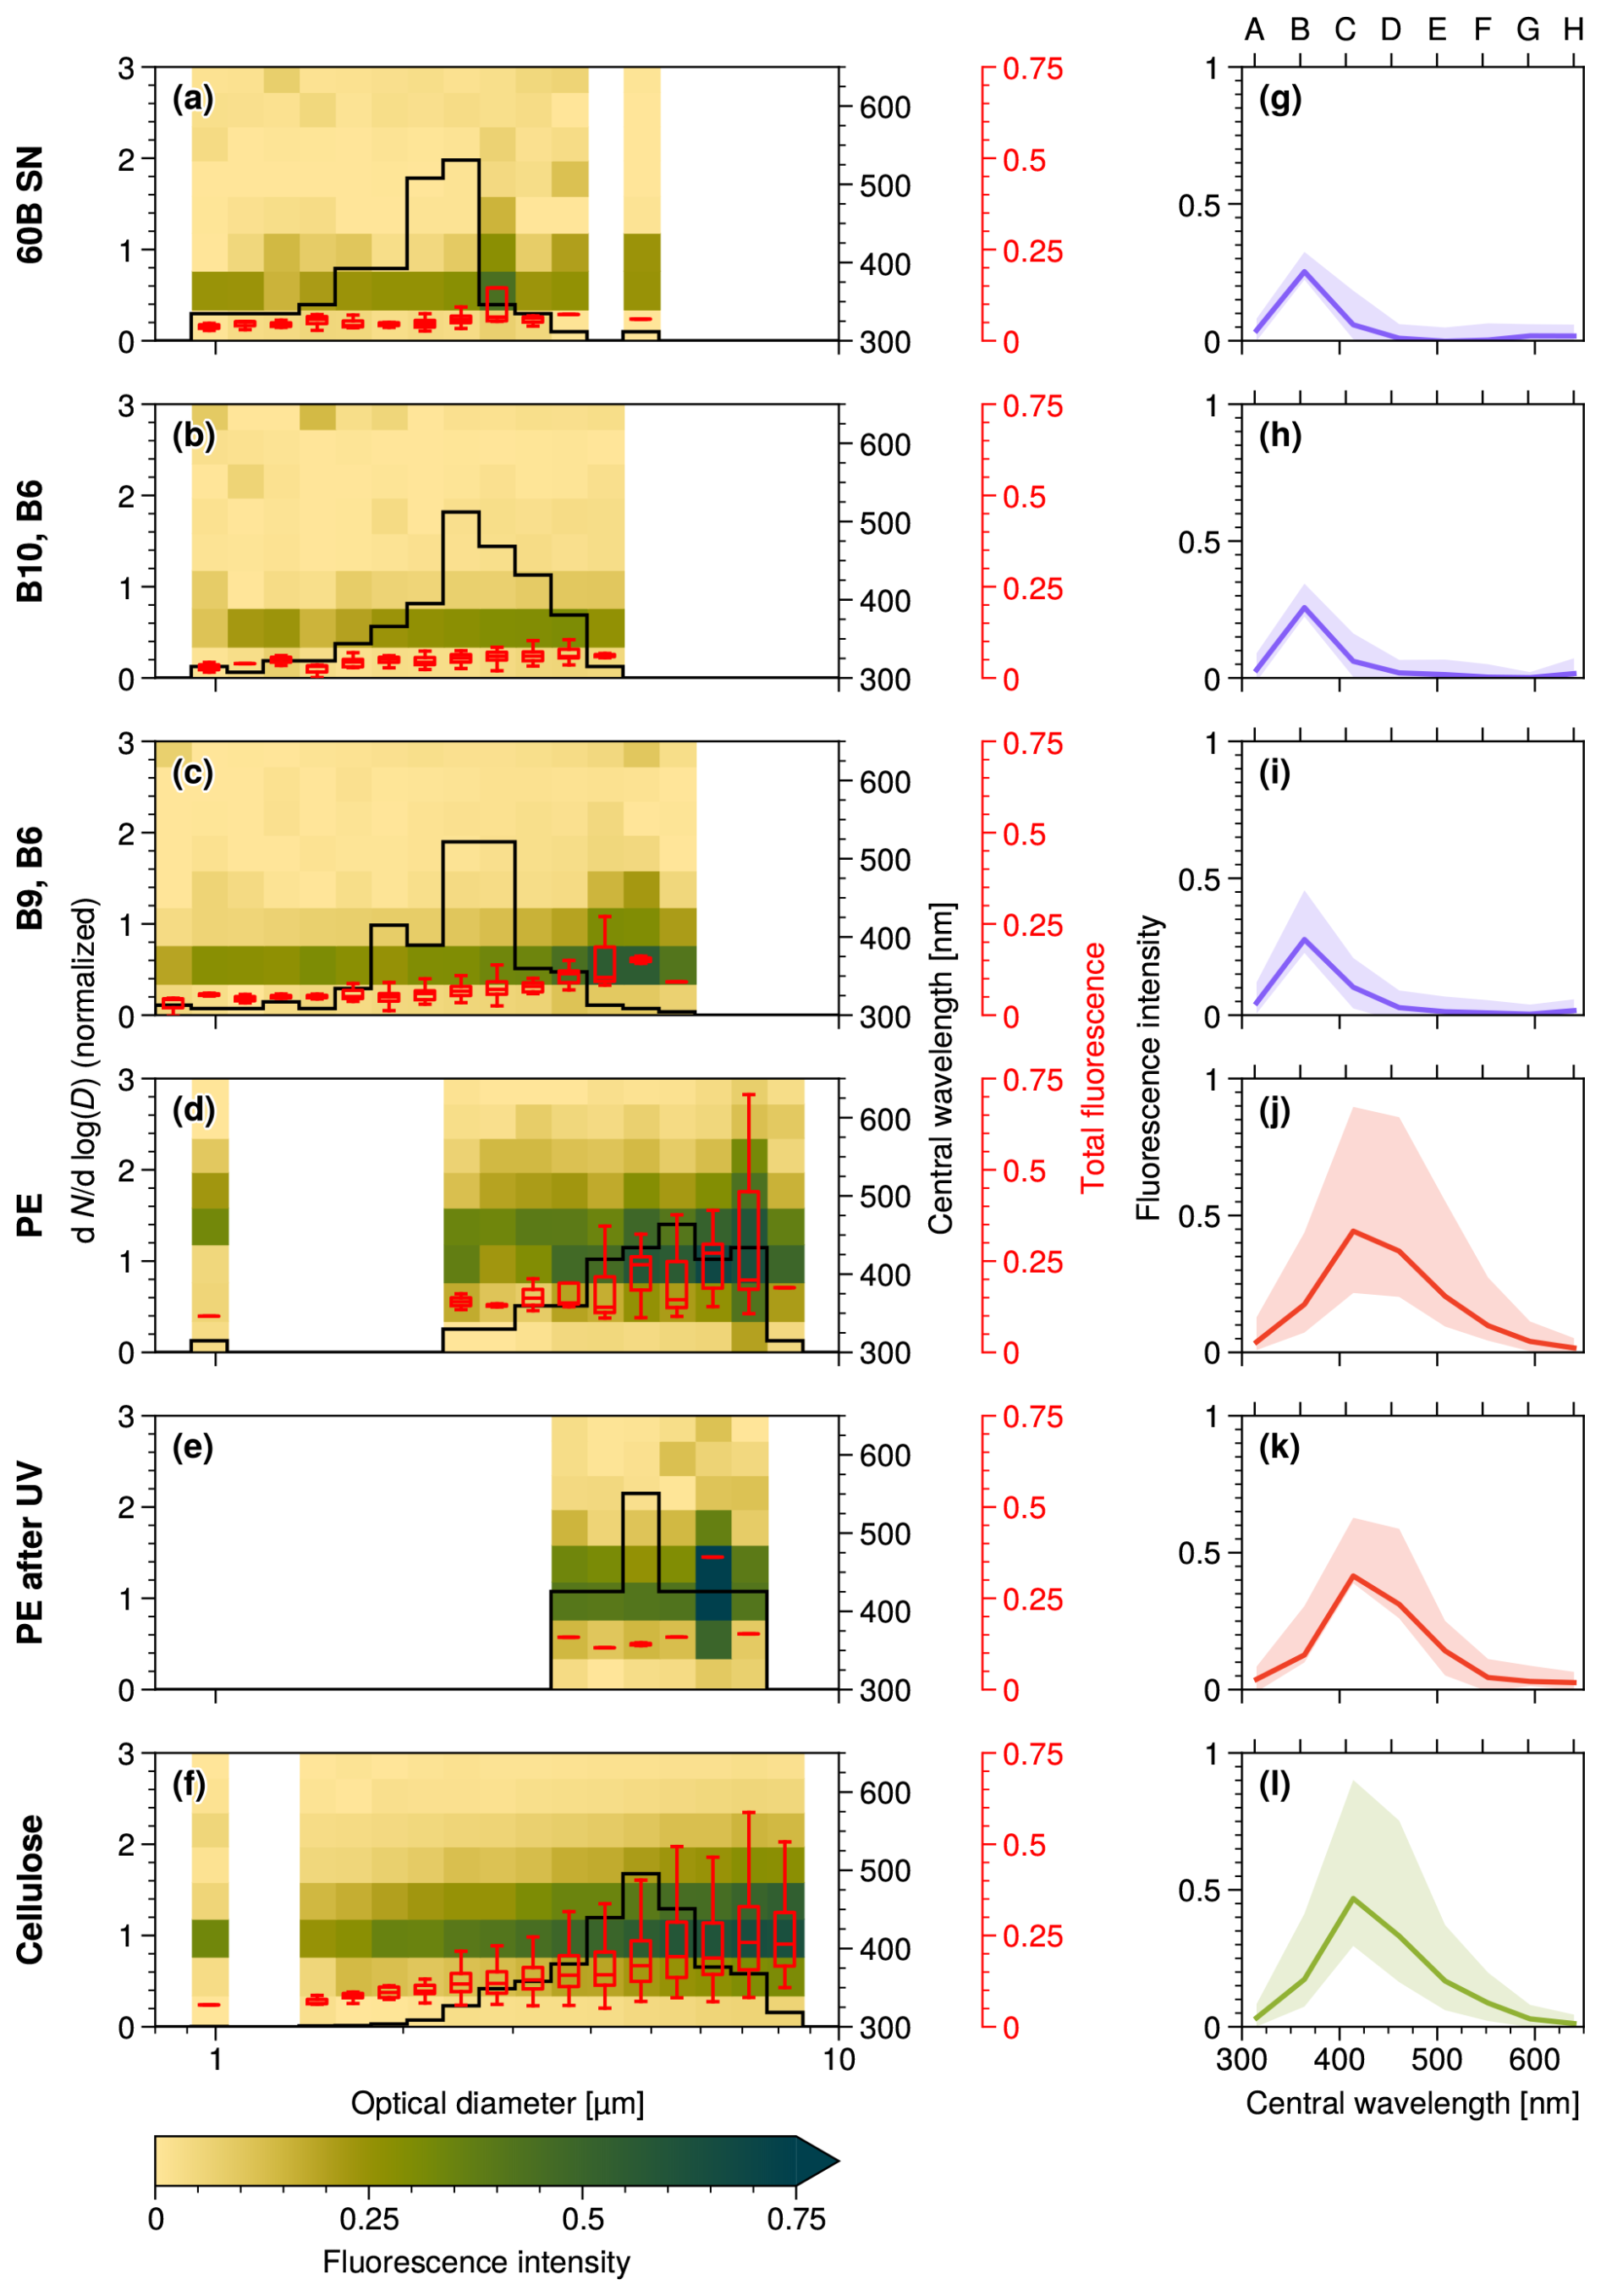
Figure 2Bacteria, microplastic, and cellulose fluorescence properties and size distributions measured in our characterization experiments. (a-f) show size distributions (left axis, black step trace) and fluorescence emission spectra (right axis, color map) for highly fluorescent particles (HFPs) with > 9σ fluorescence signal, binned by size, for bacteria (a–c), fresh and UV-aged polyethylene (PE) (d and e, respectively), and cellulose (f). Box plots (red axes) depict the range of total fluorescence in each size bin. Fluorescence intensities are given as a fraction of detector maxima at saturation. (o–u) show the median fluorescence emission spectra of HFPs at all sizes for these experiments; shaded areas represent 10 %–90 % quantiles. Upper axes show fluorescence detection channel names corresponding to their central detection wavelengths in the lower axes.
Figure 2a–c show that fluorescence spectra recorded for bacteria are dominated by a B channel peak (∼ 315 nm), consistent with the known region of fluorescence emission by tryptophan when excited at this wavelength (Pöhlker et al., 2012; Huffman et al., 2020), the findings of Freitas et al. (2022), and characterizations of bacteria with other UV-LIF instruments (e.g. Hernandez et al., 2016; Savage et al., 2017). This feature is unique among our samples and provides a robust marker for fPBAP identification. In contrast, PE, both fresh and UV-aged, and cellulose (Fig. 2d–f) constitute potential interferents. PE spectra (Fig. 2j and k) closely resemble those of dry pollen fragments with C channel maxima (Fig. 1o–u), and cellulose shows similar pollen-like fluorescence (Fig. 2l). While atmospheric coarse-mode microplastic concentrations are likely only high enough to significantly bias fPBAP detection in specific locations with strong anthropogenic activity, such as roads or urban centers (Han et al., 2024; Ahmadi et al., 2026; Evangelou et al., 2026), these results show that synthetics can mimic the fluorescence properties of fPBAPs. Cellulose-fPBAP similarity (Fig. 2f and 2l), however, is relevant for the atmosphere because cellulose-containing plant debris may be abundant (Hiranuma et al., 2015, 2019). Being PBAPs themselves, they may be less of a complicating factor in UV-LIF detection, although this depends on classification precision requirements. Our pure cellulose spectra agree with published measurements of cellulose (Kulpinski et al., 2012), and the C channel peak may contribute to pollen fluorescence signals because the pollen intine is cellulose-rich and can be exposed during fragmentation (Hess, 1993; Fang et al., 2008). Among all fluorescent samples measured here (Figs. 1 and 2), fluorescence intensity increases with size, as expected from the larger amount of emitting material, implying that fluorescence contrasts among smaller particles are inherently muted compared to larger particles.
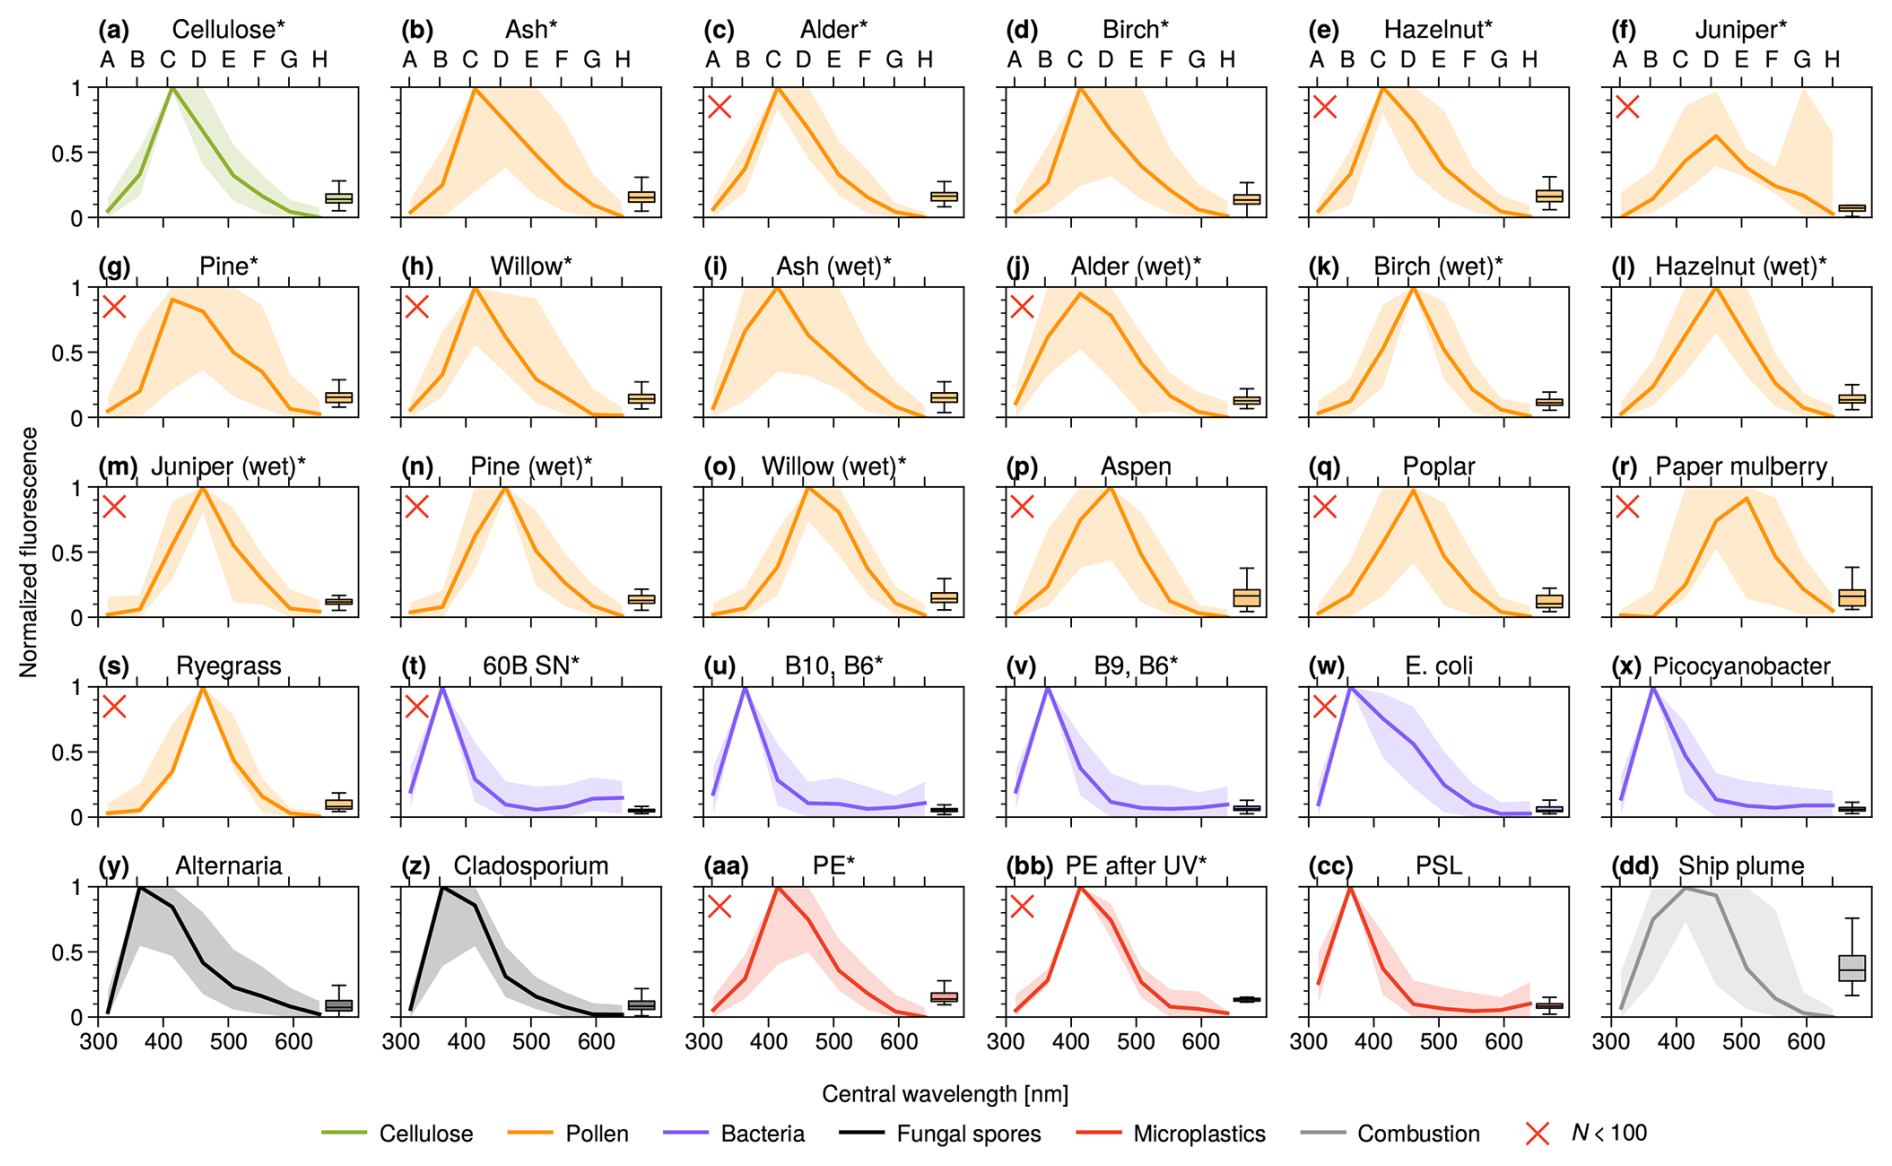
Figure 3Fluorescence emission spectra (normalized by the maximum fluorescence signal measured for each particle) for particles with > 9σ fluorescence signal for all source experiments. Shaded regions indicate 10 %–90 % quantile ranges. Box plots indicate the distribution of total fluorescence (normalized by the maximum possible signal) among particles. Source experiments conducted in this study are marked with an asterisk. Experiments with a sample size of < 100 are marked with an X in the subplot.
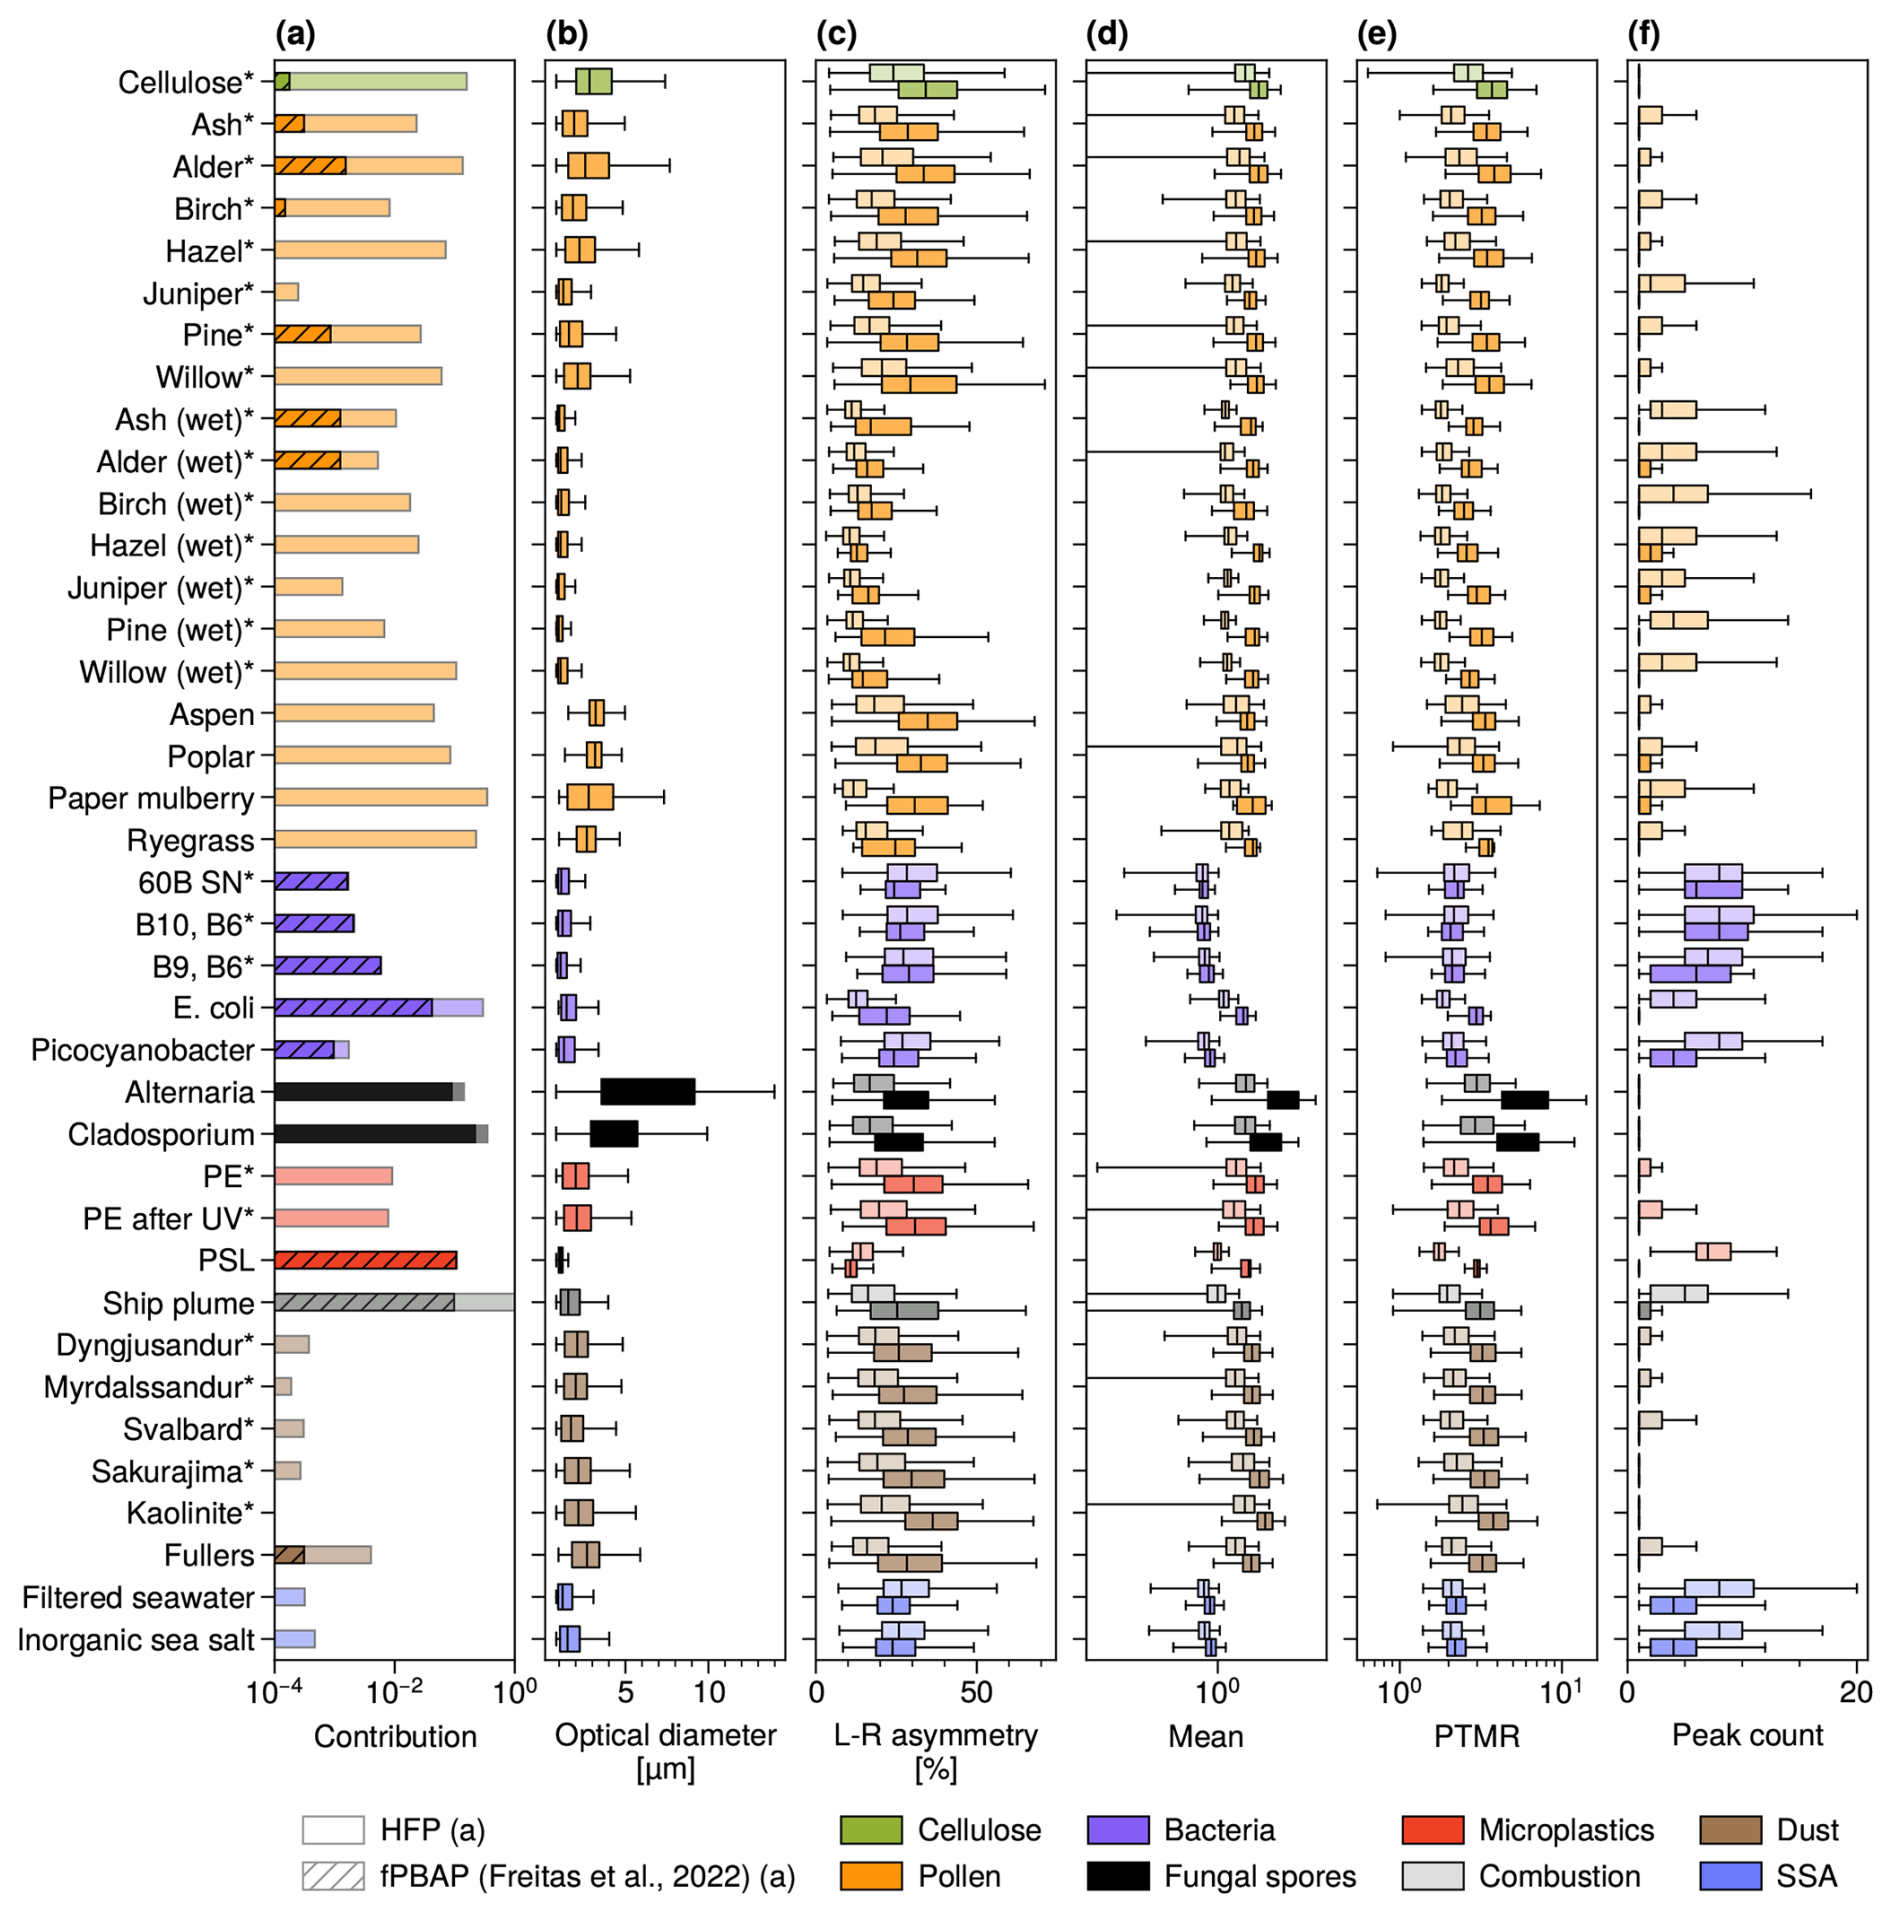
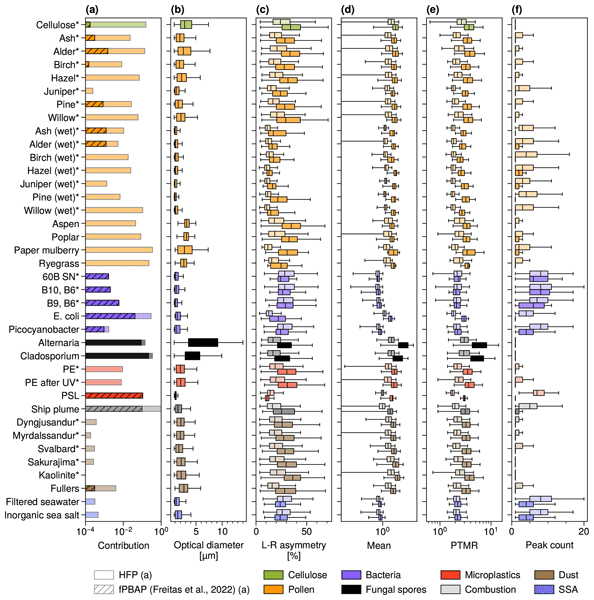
Figure 4Comparison of particle property distributions for all source data. (a): Contributions to total particles measured in the samples by highly fluorescent particles (HFPs, solid bars) and fluorescent primary biological aerosol particles (fPBAPs, hatched bars) as identified by the decision tree method of Freitas et al. (2022). For the ship plume, only HFPs are displayed. (b–f): Size (b) and morphology parameters (c–f) of particles in the samples. In (c–f), dark (light) boxes indicate < (≥) 3 µm particles. The right array is shown for single-array morphology parameters (d–f). The color denotes the source group the sample belongs to (see legend).
3.2 Fluorescence and morphology characteristics across all sources
Here we present the results of all source characterization experiments and MBS observations used in this study (Table 1), processed as described in Sect. 2.2. Figure 3 summarizes fluorescence emission spectra for all fluorescent materials, and Fig. 4 presents class contributions and select morphology parameters. Pollen fragments measured in our experiments (Fig. 3b–o) and those of Ruske et al. (2017) (Fig. 3p–s) show broader spectra and higher intensities than bacteria (Fig. 3t–x). Despite containing many HFPs (Fig. 3a), only a small fraction (∼ 0.01 %–0.1 %) of particles from pollen samples are classified as fPBAP by the Freitas et al. (2022) DT method. This indicates that a substantial share of pollen-derived particles would be missed by fluorescence-only schemes, but the variable peak channels (Figs. 1 and 3b–s) make it difficult to define a robust single-channel classification criterion. Natural dust measured in our experiments and the filtered seawater measurements in Beck et al. (2024) also contained low fractions of HFPs (< 0.1 %), indicating some organics or potential PBAPs present in these samples.
Bacteria samples from Ruske et al. (2017) and Beck et al. (2024) exhibit the same B channel peak and similar fluorescence intensities as our bacteria samples, reinforcing the robustness of the DT-based fPBAP criterion of Freitas et al. (2022). Fungal spores fluoresce more strongly than bacteria and peak in either channels B or C, meaning some fungal spores will be missed by the DT method. We find that PSLs (Fig. 3cc) closely resemble bacterial emission spectra and all highly fluorescent PSLs meet the DT definition of fPBAP (Fig. 4a), demonstrating that synthetic particles can mimic bioaerosols in UV-LIF measurements. We also find that the diesel combustion particles from Karlsson et al. (2022) and Kojoj et al. (2024) exhibit broad, intense fluorescence (Fig. 3dd) and that about 10 % of them meet the DT-based fPBAP criterion (Fig. 4a), consistent with interference by combustion particles noted in Freitas et al. (2023a, 2024). Because combustion particles from fossil fuel and BB are abundant in the atmosphere, their fluorescence similarity to bioaerosols is a primary concern for PBAP quantification. Using multiple excitation wavelengths can add discriminating power to UV-LIF instruments; in studies employing the WIBS, particles excited at a different wavelength than that of the MBS were shown to correlate with combustion tracers (e.g., Gao et al., 2024; Beck et al., 2024; Gratzl et al., 2025). Despite higher spectral resolution in fluorescence emission detection, the MBS is limited in this regard, motivating a combined fluorescence-morphology classification approach.
Beyond fluorescence, the MBS provides extensive optical scattering-based morphology information (Fig. 4b–f), which offers additional leverage against non-biological interferents. Since optical morphology signals are stronger with larger particles, we visualize morphology parameter distributions for < 3 and ≥ 3 µm particles. Importantly, interpretation must account for different emission mechanisms for various bioaerosols. Bacteria and many fungal spores fall within the MBS's size range and may be detected intact, whereas pollen rupture and plant debris emission generate irregular fragments with highly variable shapes. Fungal spores can also fragment under prolonged exposure to high humidity (China et al., 2016; Subba et al., 2021). Accordingly, pollen fragments, and to some extent fungal spores, may be expected to have more irregular morphologies whereas bacteria and intact spores may be expected to exhibit more regular scattering signatures; these behaviors are reflected in their measured properties (Fig. 4c–f). Combustion particles, aside from their high peak counts, exhibit scattering signatures indicative of irregular morphologies. This may help to distinguish them from bacteria and fungal spores but not necessarily from pollen fragments. Consistent with the discussion in Sect. 3.1, wet nebulized pollen fragments have more sphere-like morphologies than dry nebulized pollen (seen in e.g. their asymmetries; Fig. 4c), indicating that many particles are dried residues of dissolved constituents.
Figures 4c–f and S5 in the Supplement compare dust, nascent SSA (Beck et al., 2024), and PSLs (Beck et al., 2024). Dust and SSA particles clearly differ in mean signal (Fig. 4d), peak count (Fig. 4f), variance (Fig. S5e), and peak width (Fig. S5i), even at smaller sizes. L-R asymmetry is broader and more extreme for dust, although overlap remains (Fig. 4c). Surface roughness is reflected in signal mean, PTMR, and peak count (Fig. 4d–f, respectively), as well as in variance, kurtosis, and peak width (Fig. S5e, g, and i, respectively). Rough surfaces smear diffraction patterns, raising scattering signal mean and variance, reducing the number of distinct peaks, and increasing peak width and PTMR. Our dust samples show lower peak counts and higher signal mean and variance, PTMR, and peak widths than SSA and PSLs, indicating rougher, more irregular surfaces. Dust also shows higher and broader skewness distributions (Fig. S5f), consistent with irregular shapes. Strong smearing by diffraction on rough surfaces can increase mirror symmetry, which may explain the relatively high mirror values seen in dust (Fig. S5c). Optically, pollen fragments and fungal spores have irregular scattering signatures resembling dust with low peak counts and high asymmetries, mean signals, and PTMRs. Meanwhile, bacteria optically resemble SSA and PSLs, consistent with smooth surfaces.
In summary, dust exhibits high surface roughness and shape irregularity, whereas SSA shows sharper diffraction features and lower asymmetry. These features are consistent among all dust samples measured here, with small differences in size distributions (Fig. 4b). Dust sample fluorescence varies (Fig. 4a), possibly indicating the presence of fluorophores such as humic substances (Pöhlker et al., 2012). Some of the consistency in measured dust features may derive from the generation method, which can bias certain particle sizes and alter their properties (Gill et al., 2006). SSA morphology is known to vary with size (Kaluarachchi et al., 2022), source conditions such as productivity and organic content (Lee et al., 2020), wind speed at emission (Madawala et al., 2024), and atmospheric processing (Kaluarachchi et al., 2022). However, the SSA samples considered here are freshly generated, representing nascent particles; how aging affects MBS scattering and fluorescence signatures thus remains an open question.
To summarize the comparisons described here and illustrated in Fig. 4, common coarse-mode aerosol sources can produce particles with distinct, consistent sets of features when measured by the MBS. Among biological particles, bacteria displayed prominent tryptophan-like early channel-heavy fluorescence spectra; while fungal spores shared early channel-skewed fluorescence spectra, they exhibited stronger fluorescence in later channels and variable peak channels. Pollen fragments and pure cellulose had broader fluorescence spectra easily distinguishable from bacteria. The fluorescence spectra of freshly emitted combustion and microplastic particles shared similarities with those of all biological particles measured; although microplastic particles fluoresced at similar intensities to most biological particles, the combustion particles fluoresced more strongly despite their small sizes. Morphologically, bacteria stood out from fungal spores with smaller sizes and weaker scattering signals with stronger peaks. While this can help distinguish between them, combustion particle scattering signals resembled those of bacteria. Dry-nebulized pollen fragments were generally larger and had scattering signals indicative of rougher surfaces and higher asymmetry than those of wet-nebulized pollen fragments. Among non-biological particles, the lab-nebulized dust and SSA particles analyzed here had distinctly different optical morphologies, with SSA particles imparting strong diffraction peaks indicative of crisp, sharp edges and dust particles having stronger, non-peaked scattering signals indicative of rough surfaces.
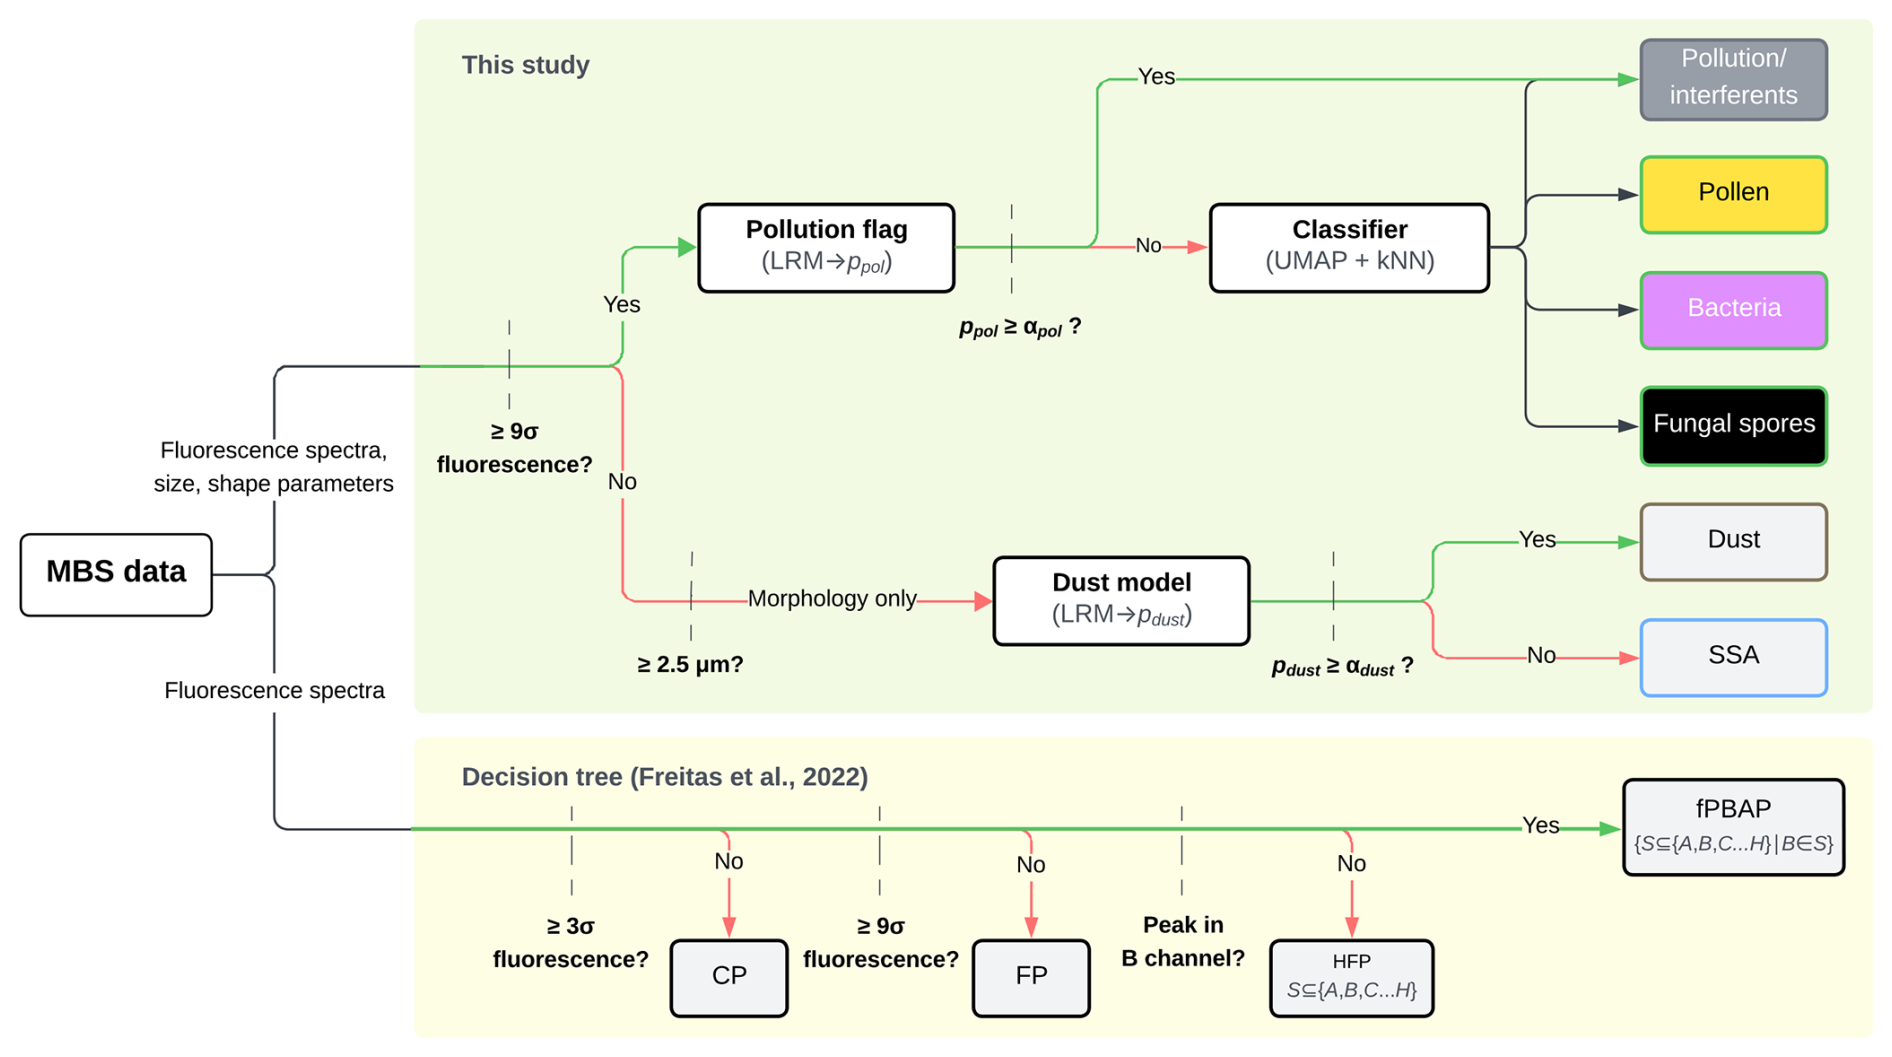
Figure 5A schematic illustrating the particle classification schemes of this study (top branch) and of Freitas et al. (2022) (bottom branch). Dashed lines represent filtering and decision-based steps. In the pollution and dust logistic regression models (LRMs), p is the output probabilities for being flagged as pollution or dust, respectively, and α represents a chosen confidence level. The bioaerosol classifier using uniform manifold approximation and projection (UMAP) and k-nearest neighbors (kNN) classify according to the most likely class. Among highly fluorescent particles (HFPs) and fluorescent biological aerosol particle (fPBAP) classes in the decision tree-based method of Freitas et al. (2022) (lower branch), the class label is denoted as S and consists of combinations of letters A through H corresponding to the fluorescence channels where significant (> 9σ) fluorescence is detected. According to the fPBAP definition, all fPBAP class labels contain B. Specific information about the exact variables used as input for each method is found in the text.
3.3 Particle classification by machine learning
Using the source characterization data presented in Sect. 3.2, we built classification models as a basis for an algorithm for (1) distinguishing fPBAPs from interferents among fluorescent particles, (2) attributing them to broad fPBAP classes, and (3) distinguishing between non-fluorescent dust- and SSA-like coarse-mode particles. For (1), we considered only combustion particles as interferents due to limited synthetic polymer sample diversity in our training data and because they are likely far more abundant than microplastic particles in the atmosphere. This simplifies the task to binary classification (pollution or not). For (2), we divided fPBAPs into three classes: pollen fragments, bacteria, and fungal spores; cellulose is not represented because real plant debris was not included in the source characterization data. Binary classification was also used for (3) to estimate dust- or SSA-likeness among non-fluorescent particles. These components were implemented in the classification algorithm presented in Fig. 5 (given in written form in Table S4 in the Supplement), which also presents the DT method of Freitas et al. (2022) for comparison.
In our algorithm, particles are first filtered according to fluorescence; highly fluorescent (≥ 9σ) particles of all sizes are passed to the pollution/fPBAP identification branch, while the remaining particles with sizes ≥ 2.5 µm are passed to the dust/SSA branch. Following the discussion on Fig. 4, we trained the dust model only on dust and SSA particles ≥ 2.5 µm to ensure more distinct separation between their scattering signatures, as significant overlap in morphology signal distributions among particles of different classes are seen below this size range. Particles in the fluorescent branch are first assigned a pollution-likelihood (ppol) by the pollution model, and are then fed to the UMAP approximator. UMAP outputs are passed to the kNN classifier, which provides class likelihoods for four target classes (pollution, pollen fragments, bacteria, and fungal spores). A fluorescent particle's ppol must not exceed a confidence threshold (αpol), which may be chosen depending on confidence requirements and auxiliary data in each application setting, for it to be classified as a fPBAP. Thus, the algorithm uses a two-step identification process for fPBAPs where a fluorescent particle must be both not flagged as an interferent by the pollution model and positively identified as one of the fPBAP classes by the multiclass model. The multiclass model's output also allows a further confidence threshold for fPBAP identification to be chosen based on the kNN's probability estimates. Particles ≥ 2.5 µm in the non-fluorescent branch are assigned a dust-likelihood (pdust) by the dust model. This may be used for identification based on a confidence threshold (αdust) or as a metric itself (“dust-likeness”). In this assessment, we used the most likely class (the rounded probability for LRMs, i.e. αpol,αdust = 0.5, and the class of highest probability for the kNN) for identification.
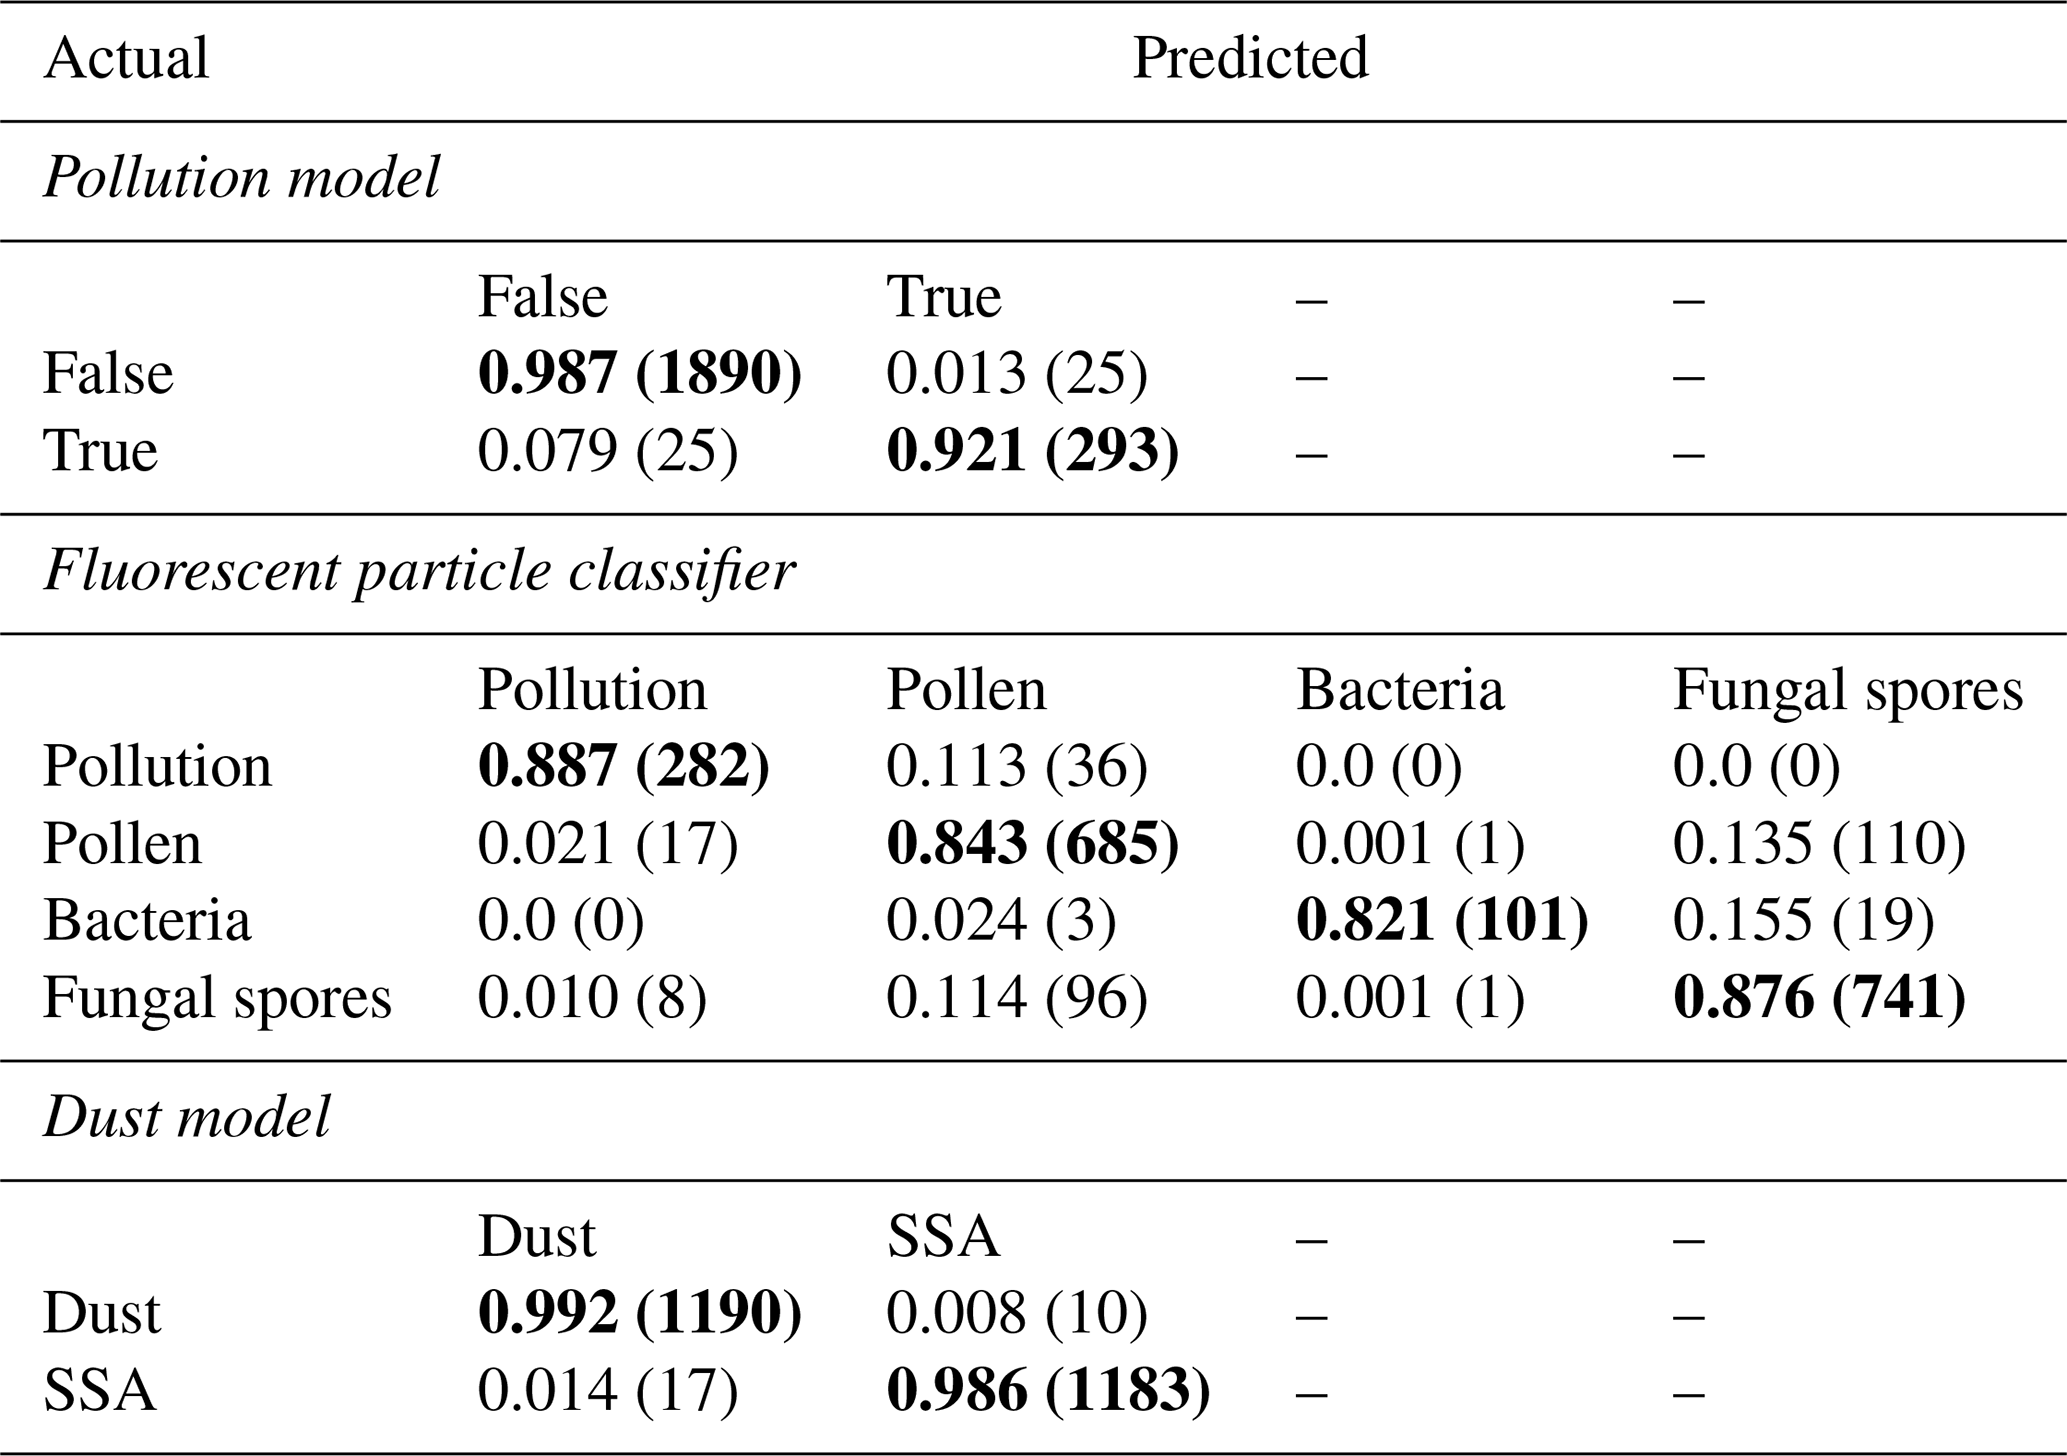
Table 2Confusion matrices for the pollution, bioaerosol classification, and dust model components of our classification algorithm. Pollution and dust models are based on logistic regression, and the multiclass classification is based on uniform manifold approximation and projection (UMAP) and k-nearest neighbors (kNN) models. The fraction of testing data predicted to be in each class is given in columns along with the number of testing data points in parentheses; fractions therefore sum to one across rows. The recall for a given class is identified in bold.
As inputs for the pollution LRM and UMAP approximator, we used 34 features (Table S2), including: normalized fluorescence spectra, fluorescence ratio, total fluorescence, size, L-R asymmetries (top-to-bottom and inverse), and scattering parameters for L and R arrays (nine each). The UMAP approximator was fitted only on highly fluorescent combustion, pollen fragment, bacteria, and fungal spore particle data, and excluded cellulose and microplastics; the limited diversity represented in our data for these latter two classes would likely affect the generalizability of a ML-based approach. However, UMAP transformations were calculated for microplastic and cellulose particles to quantify their similarities with the other classes. After transformation, fluorescent particles can be classified according to their proximity in UMAP phase space to clusters seen in the training data. We trained a kNN classifier on UMAP-projected source characterization data, which uses a brute force global search of training data positions in UMAP space to select the 100 closest neighbors (k=100) according to Euclidean distance. The probability that the unknown particle belongs to each class is the fraction of neighbors belonging to them, weighted inversely by distance.
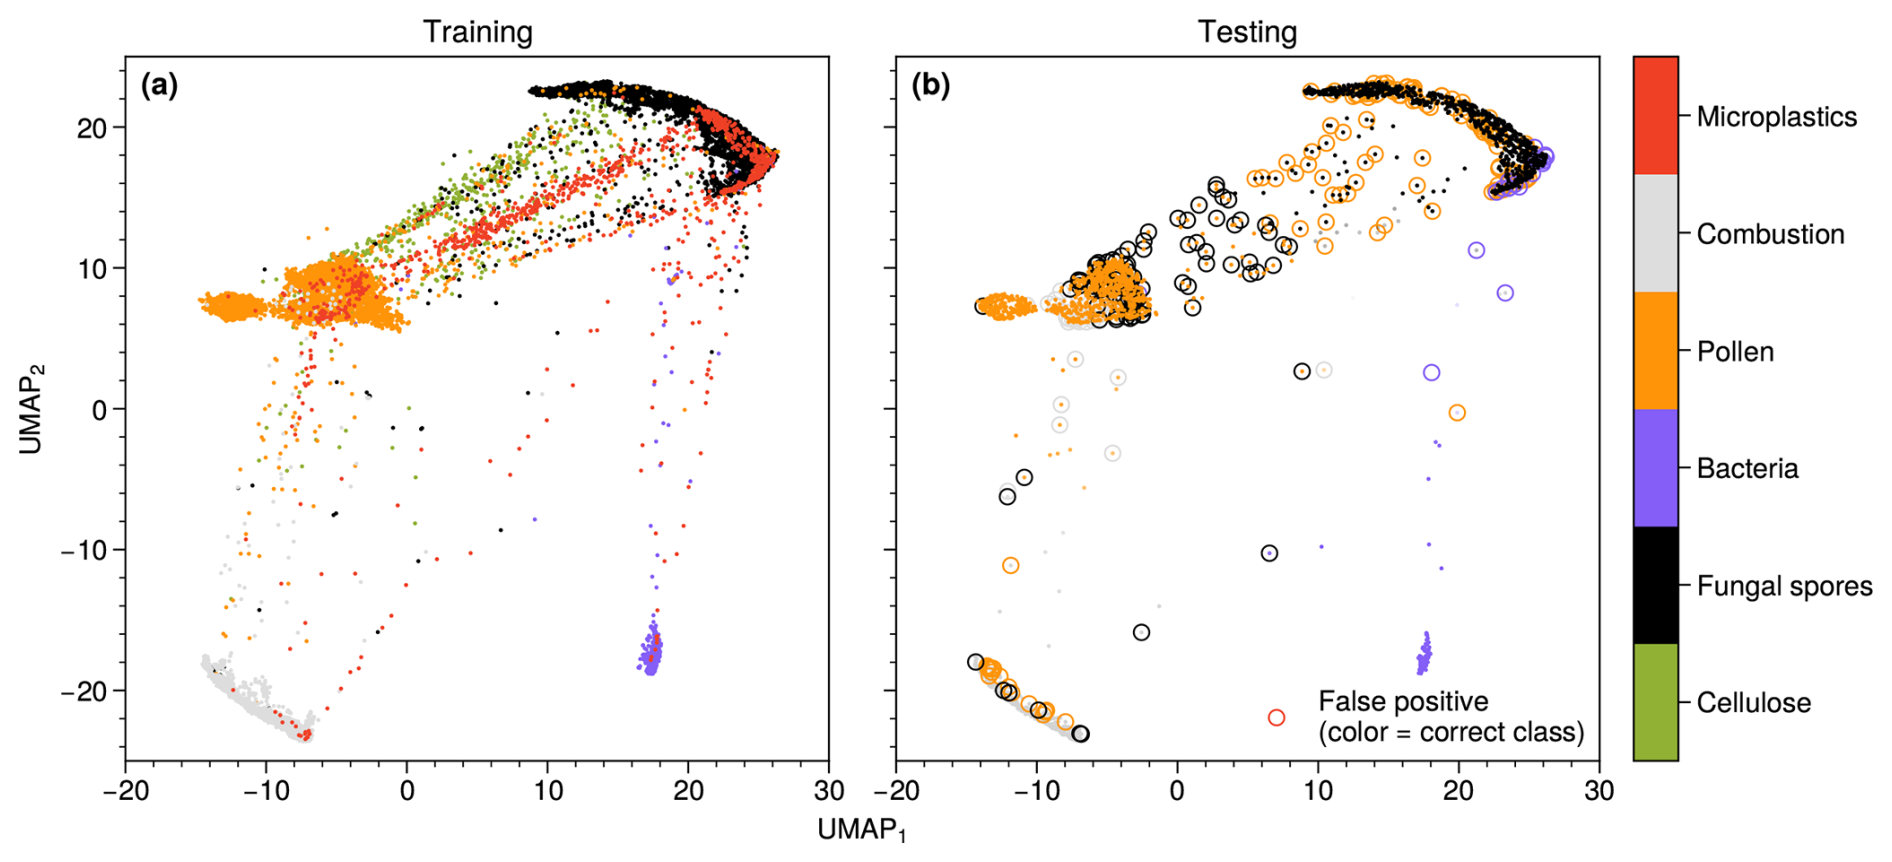
Figure 6Uniform manifold approximation and projection (UMAP) phase space locations of particles for (a) training and (b) testing data. Note that the UMAP approximator and k-nearest neighbors (kNN) models are trained only with combustion, pollen fragment, bacteria, and fungal spore data and not with microplastics and cellulose classes. In (a), the color coding for markers is according to the known particle class. In (b), the marker color is according to the kNN-predicted class, and the alpha of the marker denotes the confidence of the prediction; misclassifications are circled, with the circle's color denoting the correct class.
Table 2 presents confusion matrices for each ML model included in the algorithm. The pollution LRM performed well on testing data, identifying combustion particles as pollution with 92 % precision. Figure 6a shows UMAP projections for fluorescent particles using only pollen fragments, bacteria, fungal spores, and combustion particles for training, illustrating clear separation between the combustion particles and all fPBAP classes. The positions of particles in classes unknown to the UMAP (microplastics and cellulose) are distributed among the three fPBAP classes, indicating similarities shared with each of them. Few microplastic particles appear near the combustion particle cluster, and cellulose particles are mostly positioned near the pollen cluster. These relations between particle clusters in UMAP space reflect their similarities discussed in Sect. 3.2, indicating that the UMAP approximator effectively separated clusters of broad fluorescent particle classes and captures similarities between them.
Figure 6b shows UMAP transformations of the testing data and illustrates that the approximator also produced the general distributions and locations of class clusters seen in Fig. 6b with unknown particles. Lower certainty can be expected where significant overlap exists between clusters, manifested in lower kNN prediction probabilities at midpoints between clusters. Most fPBAP incorrectly classified as pollution were pollen fragments and fungal spores, and combustion particles that were wrongly classified as fPBAP were exclusively labeled as pollen fragments; the UMAP-kNN classifier model misclassified combustion particles as pollen fragments ∼ 11 % of the time (Table 2). This reflects similarities between combustion and pollen fragments discussed in Sect. 3.2 (i.e., their broad fluorescence curves and irregular morphologies). Among fPBAP classes, the UMAP-kNN classifier was weakest at identifying bacteria, and significant confusion between certain fungal spores and bacteria were seen; ∼ 16 % of bacteria particles were misclassified as fungal spores. This may be expected given their similarities in spectral maxima, and because the UMAP-kNN method incorporates morphology information that also determines classification.
For the dust model, we trained a LRM on 22 morphology parameters (top-to-bottom and inverse L-R asymmetries and the nine chord shape parameters for each side; see Table S2). We disregarded particle size in the dust LRM to reduce the influence of biases introduced to the training data by laboratory aerosolization methods via their size distributions, and focused the method of distinction on distributions of optical scattering properties. Equal samples of 6000 particles each were randomly drawn from this size range. The LRM converged quickly (23 iterations) and testing resulted in 99 % precision for both classes (Table 2), indicating that the distributions of optical morphology parameters are distinct enough to accurately distinguish them. Training the same LRM using all particles ≥ 0.8 µm resulted in a slight decrease in the model's overall precision (95 %). Despite this, we argue that training particles in a size range where the instrument better resolves optical scattering signatures produces a more physically sound model and elected to use the LRM trained only on ≥ 2.5 µm particles in our classification algorithm.
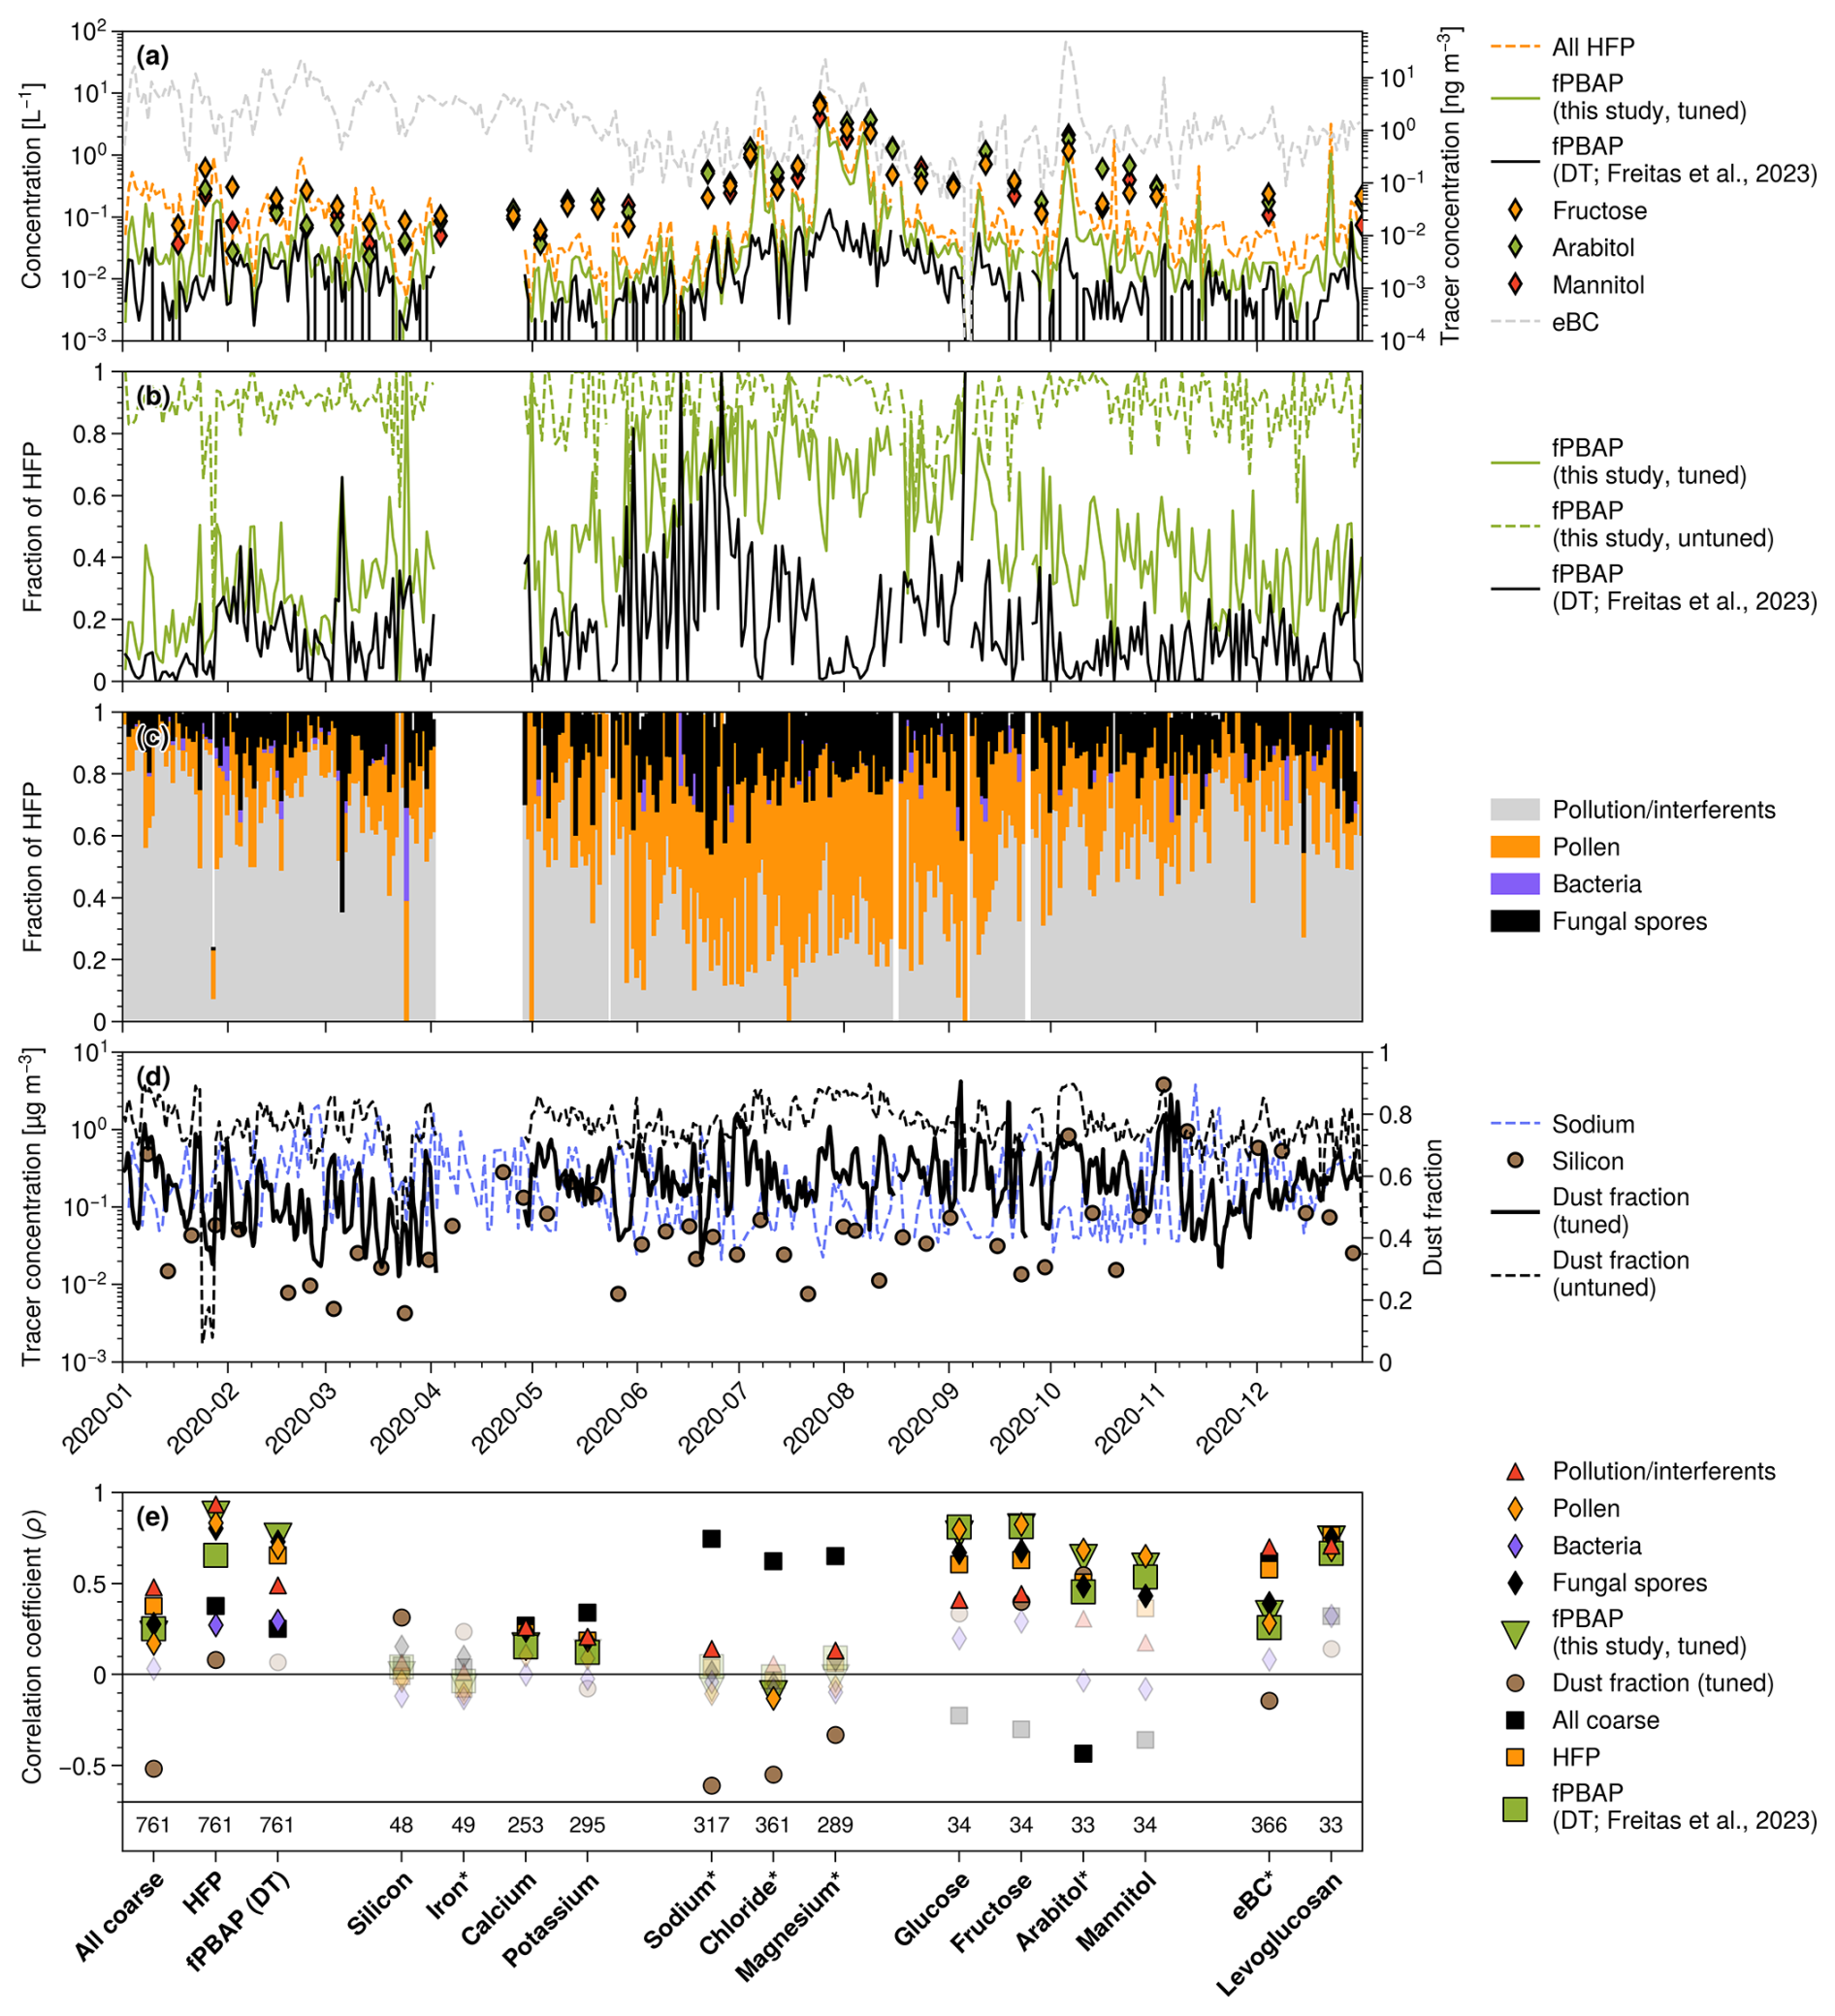
Figure 7Algorithm performance using field observations made at Zeppelin Observatory, Svalbard during 2020. (a) Left axis: time series of highly fluorescent particle (HFP) and fluorescent primary biological aerosol particle (fPBAP) concentrations according to our classifier (this study) and using the decision tree (DT)-based method of Freitas et al. (2023a). Right axis: concentrations of biological tracers fructose, arabitol, and mannitol, and combustion tracer equivalent black carbon (eBC). (b) Contributions to all HFP by fPBAP using our classifier (both tuned and untuned) and the DT method. (c) Contributions by individual classes (pollution/interferents, pollen fragments, bacteria, and fungal spores) to HFP concentrations. (d) Time series for sodium and silicon concentrations (left axis) and the fraction of particles ≥ 2.5 µm identified as dust (both tuned and untuned) (right axis). (e) Spearman correlation coefficients (ρ) between concentrations for all coarse particles, HFPs, fPBAP (determined using both our algorithm and the DT method), individual fPBAP classes identified by our algorithm, and chemical tracers. Correlations not significant with p < 0.05 are made transparent. Tracers used in the domain adaptation steps are marked with an asterisk. The bottom panel displays sample sizes for each tracer.
3.4 Classifier domain adaptation and algorithm assessment
Figure 7 presents the results of our classification algorithm applied to MBS observations made by Freitas et al. (2023a) at Zeppelin Observatory during 2020, again using simple majority classification thresholds for pollution and dust (αpol,αdust = 0.5). The algorithm in its raw, untuned form, trained only on source characterization data, struggled to recognize the types of interferents seen at Zeppelin Observatory, as evidenced by the high correlations between fPBAP concentrations and levoglucosan and eBC (Fig. S6b in the Supplement). That fPBAP concentrations derived from the untuned model correlated more strongly with levoglucosan than with eBC may suggest an influence by specific combustion particle types, i.e., BB- rather than fossil fuel-derived. Biological tracer and DT-based (Freitas et al., 2023a) fPBAP concentrations indicate a clear seasonal cycle of biological aerosol influence (Fig. 7a), which our algorithm initially failed to capture in its untuned form (Fig. 7b). This resulted in likely overestimated fPBAP concentrations, especially evident between January–April when eBC concentrations were high.
To address this, we applied domain adaptation to tune the pollution LRM to HFPs observed at Zeppelin Observatory using tracer-based soft labels describing the degree of pollution vs. biological influence. This is accomplished by choosing a selection of sample periods with overlapping tracer data for both pollution and biological aerosols, attributing “soft” (i.e. continuous and non-discrete) pollution labels for HFPs observed during these periods based on tracer concentrations, and further training the LRM on these data (the tuning block) with lower weights than those of the initial training data to limit its influence on model fit. Details of this step are explained in the SI (Sect. S1 in the Supplement). The pollution influence metric used for soft labeling was calculated using normalized eBC and arabitol concentrations. Individual weights were calculated for tuning data based on our confidence in the soft labels, determined by the pollution influence metric, and a down-weighting term. To reduce the risk of overfitting to uncertain pseudo-labeled particles while preserving the classifier's fit to the laboratory reference data, the total contribution of the soft-labeled tuning set was limited to 20 % of the weight assigned to the laboratory-derived source training data. This follows the common domain adaptation strategy of down-weighting uncertain samples and treating their influence as a regularization term rather than as fully trusted labels (e.g., Kouw and Loog, 2021). A sensitivity test determined that 20 % influence by the tuning samples was conservative enough to preserve accuracy in in-sample testing with the training data while leading to significant changes in classification behavior; hence, we chose this degree of tuning to investigate the effects of domain adaptation on the classification algorithm.
The tuned fluorescent particle classifier reproduced the DT-based fPBAP concentration time series (Freitas et al., 2023a), with few (∼ 10−3–10−2 L−1) fPBAP during winter and early spring, a peak in July (∼ 101 L−1), and a subsequent decrease during winter onset (Fig. 7a and b). This cycle is also in agreement with Tobo et al. (2024), who determined that most carbonaceous coarse-mode particles sampled at Zeppelin Observatory in July 2020 and analyzed with scanning electron microscopy were likely PBAPs (such as microorganisms and plant debris), while none were detected in March 2020. Compared to the DT-based method, the ML-based classifier also better captured a second peak in PBAP tracers during October that coincided with a significant increase in warm-activating INPs (Fig. 1c of Freitas et al., 2023a). The low proportion of HFPs identified as fPBAP between January–April (Fig. 7a) illustrates that the tuned classification algorithm robustly reduced the influence of combustion particles on fPBAP concentrations. This is reflected in improved correlations between fPBAP concentrations with biological tracers arabitol and mannitol (Figs. 7e and S6); however, these correlations do not constitute fully independent validation of the adapted model and should be interpreted cautiously due to their use in the tuning process. In August, when biological tracer concentrations were highest, our algorithm detected fPBAP concentrations nearly two orders of magnitude higher than the DT method did. This is expected because the DT-based fPBAP criterion was validated for one type of fPBAP (marine bacteria; Freitas et al., 2022), while our classification algorithm targets multiple fPBAP types with diverse fluorescence properties. The low (high) proportion of HFPs classified as fPBAPs during March (July) reflects a similar seasonal fPBAP cycle as that described in Freitas et al. (2023a). Both our algorithm's and DT-based fPBAP concentrations correlate significantly with BB tracers (Fig. 7e), in agreement with Freitas et al. (2023a). Although levoglucosan is formed only through pyrolysis, incomplete biomass combustion can release monosaccharides (e.g., glucose, fructose) when wood carbohydrates (e.g., cellulose) are broken down (Medeiros et al., 2006; Zangrando et al., 2016; Ren et al., 2020; Vincenti et al., 2022). This has implications for the interpretation of fructose and glucose as PBAP tracers, as illustrated by their correlations with levoglucosan (Spearman ρ = 0.56 and 0.59, respectively; Fig. S7 in the Supplement).
The pollen class contributed the largest share to particles identified as fPBAP by our algorithm throughout the year but more consistently in summer, followed by fungal spores and bacteria (Fig. 7c). Bacteria made up a small proportion (∼ 0.1 %–1 %) of fPBAP identified by our classifier. It is unlikely that pollen fragments contribute such a large share of PBAPs in Svalbard; earlier identifications of PBAP classes in Ny-Ålesund in two summers found very low concentrations (∼ 10−3–10−1 L−1 in summer) of intact pollen (Johansen and Hafsten, 1988), while the mid-July peak concentration of pollen-class particles identified by our classifier is 3.30 L−1. Considering the similarities between fPBAP classes, cellulose, and combustion particles seen in Sects. 3.2 and 3.3, plant debris or combustion particles may be misidentified as pollen- or fungal spore-like by our classifier due to their broad fluorescence spectra (as in Fig. 6a). This is corroborated by the persistent presence of pollen-like and fungal spore-class particles identified throughout winter (Fig. 7c). Fungal spores misclassified as pollen fragments may possibly also contribute to the dominance of the pollen class in fPBAP identifications, as suggested by the pollen-like class correlating more strongly with fungal tracers arabitol and mannitol (ρ = 0.69 and 0.65, respectively) than the fungal spore class does (ρ = 0.49 and 0.43, respectively; Fig. 7e).
Figure 7d reveals that the untuned dust LRM was also insensitive to variability in SSA and dust tracers (sodium and silicon, respectively), indicated by the near-constant, high fraction (∼ 80 %) of particles labeled as dust. This high a dust fraction is unlikely, since total coarse-mode particle concentrations measured by the MBS are strongly correlated with SSA tracers sodium, chloride, and magnesium, and do not correlate with mineral dust tracers (Fig. 7e). The modest but significant correlation between calcium and potassium with total coarse-mode particle concentrations may reflect that both marine and terrestrial sources can influence calcium aerosol content (Salter et al., 2016; Su et al., 2023; Solomon et al., 1989), and that potassium may be emitted by mineral dust, marine, and BB sources (Andreae, 1983). Inspecting non-fluorescent particles measured at Zeppelin Observatory during a sampling period with minimal dust influence (the wintertime minimum of dust influence relative to SSA tracers; see Sect. S1) reveals that they resembled dust more than SSA when compared to laboratory characterization data (Fig. S8 in the Supplement), suggesting that natural processes (e.g., aging of SSA) may have modified particle morphology. Karlsson et al. (2020) found similar difficulties in correctly identifying out-of-sample lab-generated SSA particles using conformal prediction. Laboratory-generated SSA properties vary markedly depending on generation method (e.g. Salter et al., 2015 and Christiansen et al., 2019), introducing biases to inductive approaches based on laboratory data.
To address this weakness, we applied domain adaptation on the dust LRM, this time constructing soft labels using mineral constituents silicon, aluminum, iron, manganese, titanium, nickel, and chromium for mineral dust mass and the sum of major SSA ions (sodium, chloride, magnesium, and potassium) for SSA mass; details of our dust influence metric's construction are further explained in the SI (Sect. S1). This step's aim is to relax the dust LRM's fit on the highly regular scattering signatures of nascent laboratory-generated SSA described in Sect. 3.1 around Fig. 4. The tuning block's influence was again weighted according to our confidence in the field label based on a dust influence metric and on a scaling factor limiting the total influence of the tuning block on the LRM's training to 20 % of that of the laboratory training data. The model's overall precision in identifying dust and SSA in repeated in-sample testing with laboratory data was not significantly affected by the tuning (Fig. S9 in the Supplement). Tuning the dust model significantly reduced the fraction of particles observed at Zeppelin Observatory classified as dust and increased dust fraction variability (Fig. 7d). The tuned model's resulting dust fraction was lowest when silicon concentrations were lowest between March–April, and increased episodically to maxima of ∼ 0.6 during summer when sodium concentrations were lowest. Although correlations do not independently validate the model, this adaptation results in a significant positive correlation with silicon and anti-correlation with SSA tracers sodium, chloride, and magnesium, which are strengthened relative to the untuned model's output (Fig. S7b). These fractions are consistent with those determined in this size range by Tobo et al. (2024) via electron microscopy (their Fig. 5a), who found that mineral dust particles comprised about half of particles > 2 µm in March and July. A significant proportion of the remainder were mixed sea salt-mineral particles (Tobo et al., 2024); what scattering signatures these mixed particles would exhibit is unknown.
UV-LIF spectroscopy is a powerful tool for detecting bioaerosols, resolving single-particle fluorescence spectra and morphology at high frequency. We characterized common coarse-mode aerosol types in the laboratory, including pollen, bacteria, dust, and potential interferents like microplastics, producing a reference dataset for the MBS. These characterizations clarify what to expect when interpreting ambient measurements and differentiating PBAPs from interfering fluorescent materials. The pollen types assessed showed broadly consistent features, but with strong differences depending on nebulization method. Wet-nebulized pollen particles exhibited broader spectra and with peaks shifted towards the channel centered at 461 nm (wet) from that centered at 414 nm (dry). This suggests that hydration, cloud processing, or surface wetting can substantially modify pollen fluorescence, with implications for their identification in ambient observations. These results may be especially useful for detecting pollen fragments produced by humid/wet atmospheric processes, as well as cloud-activated pollen fragments sampled via e.g. counterflow virtual impactor (CVI) inlets (Freitas et al., 2024) and by whole-air inlets during cloudy conditions. As a complicating factor, pollen rupture is stochastic, leading to high variability in pollen fragment morphologies (as reflected in the wide range of scattering signatures we observed).
Fluorescence spectra of both PE and cellulose closely resemble those of pollen-derived particles, posing potential challenges for distinguishing between pollen fragments and other plant matter. Bacteria cultured from Baltic seawater exhibited fluorescence spectra consistent with previous measurements of marine bacteria and were clearly distinguishable from pollen fragments, cellulose, and microplastics. Dust samples contained a small fraction (∼ 10 %) of weakly fluorescent particles, indicating the presence of some organic matter, potentially humic substances (Pöhlker et al., 2012). This feature may be useful in investigating atmospheric interactions such as ice nucleation, which humic substances have been posited to promote (Tobo et al., 2014; Chen et al., 2021; Pereira et al., 2022), but its exploitation is complicated in practice by interference from, e.g., coating by PAHs. We also compared our results with previously published MBS characterization studies of particles including bacteria, fungal spores, diesel engine combustion particles, and SSA. Notably, combustion particles showed broad fluorescence spectra similar to those of many fPBAP types, posing challenges for UV-LIF-based PBAP detection. Fungal spore and bacterial emission spectra shared strong similarities, complicating class-specific identification.
We demonstrated the training of ML models on the combined body of MBS source experiment data using UMAP dimensionality reduction and k-nearest neighbors. In in-sample testing, the classifier displayed confusion between bacteria and fungal spores, and between pollen fragments and fungal spores. Problematically, the multiclass fluorescent particle classifier misidentified ∼ 12 % of combustion particles as pollen fragments. For more robust filtering, we trained a separate binary classifier using logistic regression for flagging particles as combustion-derived interferents with the same training data, which performed better at distinguishing interferents from fPBAPs. Combining these two methods provides flexibility and builds redundancy into the classifier. The ease of tuning the LRM allowed us to implement domain adaptation using auxiliary data, improving correlations between our algorithm's fPBAP estimates and PBAP tracer concentrations. Significant correlations between fPBAP concentrations derived with the untuned classifier and wood pyrolysis tracer (levoglucosan) concentrations indicates that particles originating from BB were likely misidentified as fPBAPs. These may differ from diesel engine-sourced combustion particles like those included in our training data and could have been modified by aging processes. Our classification algorithm may be improved in the future by including source characterization data from BB experiments; we suggest that the models comprising it be trained from scratch and re-assessed when such data are available before further tuning is applied.
Our classifier identified pollen fragments and fungal spores as the most common classes of fPBAPs observed at Zeppelin Observatory in 2020. While previous work establishes fungal spores as common in Ny-Ålesund (Johansen and Hafsten, 1988), consistent with the prevalence of fungal spores identified by our classifier and the analyses of Freitas et al. (2023a) and Tobo et al. (2024), whole pollen concentrations were very low (∼ 10−3–10−1 L−1 in summer; Johansen and Hafsten, 1988). PBAP sampled during the NASCENT campaign analyzed by Freitas et al. (2023a) and Tobo et al. (2024) with electron microscopy could not be precisely distinguished, although visual comparison suggested that they were likely fungal spores and bacteria. Tobo et al. (2024) also found irregular carbonaceous particles resembling plant debris or possibly pollen fragments. Additional tracers could help verify class contributions to fPBAP detected by our classification algorithm, but source overlap complicates tracer interpretation. Although arabitol and mannitol are considered fungal tracers, they can be found to lesser degrees in pollen and bacteria (Lau et al., 2006; Di Filippo et al., 2013). Wildfires have also been found to directly promote PBAP emissions (Holden et al., 2011; Moore et al., 2020; Kobziar et al., 2022; Ellington et al., 2024), thus it is not unexpected that BB particles and PBAP can co-exist in ambient observations. More source-specific tracers, such as sucrose for pollen (Mampage et al., 2022), dipicolinic acid for bacteria (Mampage et al., 2022), and ergosterol for fungal spores (Lau et al., 2006), are necessary to thoroughly validate PBAP class contributions.
Pollen fragments are difficult to robustly identify and quantify in ambient conditions due to high variability in their emission pathways (Suphioglu et al., 1992; Subba et al., 2021). Our results suggest that BB aerosols may contain particles with strong similarities to pollen fragments, as evidenced by the stronger correlations between BB tracer levoglucosan concentrations and this particle class relative to other fPBAP classes, and by their near-constant presence throughout winter in Svalbard when fluorescent aerosols are likely comprised mostly of combustion-derived particles originating from continental sources (Yttri et al., 2024). Including BB aerosols in future experiments may therefore improve fPBAP and, in particular, pollen fragment identification in our classification algorithm. Based on the apparent similarities in fluorescence characteristics between other fPBAP classes and cellulose assessed in our experiments, it is also possible that many of the particles in the Zeppelin Observatory dataset identified as fPBAP by our classifier were misclassified plant debris. Since real plant debris was missing from the characterization data presented here, representing a potentially important missing class of a globally abundant PBAP (Sánchez-Ochoa et al., 2007; Winiwarter et al., 2009), we suggest that future characterizations measuring e.g., leaf litter be conducted with the MBS to improve identification. Future assessments for specific fPBAP class validations when e.g., pollen trap counts, digital holography-based pollen identification, and aerobiome DNA sequencing are conducted in parallel to MBS observations should be made to provide further validation.
Finally, we trained another LRM to distinguish between larger (> 2.5 µm) dust and SSA particles based only on optical scattering signatures. The dust model likely misidentified a large portion of extant particles observed at Zeppelin Observatory in this size range as dust despite high correlations between total coarse-mode particle concentrations and SSA tracers. Optical morphology signatures of ambient non-fluorescent particles in a period with minimal dust influence were more similar to those measured in dust rather than SSA characterization experiments (Fig. S8). This suggests that nascent laboratory-generated SSA may not fully resemble naturally aged SSA or that the generation method biases certain particle morphologies, which are diverse in SSA (Salter et al., 2014; Christiansen et al., 2019). This may affect non-fluorescent particle identification in humid and cloudy conditions, since wet-processed SSA particles would undergo drying after sampling, or introduce sensitivity to humid measurement conditions in the instrument. Further study on how optical morphology properties measured with the MBS are affected by different aerosol generation methods (e.g. different SSA simulation chamber configurations) and aging processes could help improve particle identification and our interpretations of these optical morphology parameters. While optical methods for detecting irregular and asymmetric particle morphologies are commonly employed to estimate dust influence (Moosmüller et al., 2009), the MBS resolves single-particle morphology via optical diffraction, providing new opportunities for particle characterization and process study. Although the MBS's optics have been employed to distinguish between cloud droplets and ice crystals (Mahrt et al., 2019), our algorithm represents the first implication of these methods in identifying the most common inorganic coarse-mode aerosol types with its detection capabilities.
Although UV-LIF spectroscopy allows for rapid online detection, characterization, and quantification of fluorescent PBAPs, interference from non-biological particle types must be considered. We present an extensive reference dataset of pollen, bacteria, microplastic, cellulose, and dust aerosols made with a multiparameter bioaerosol spectrometer (MBS) with UV-LIF and optical morphology measurements, supplemented with previously published measurements from the same instrument. We show that biological and non-biological particles can share fluorescence signatures, biasing fluorescence-only classifications, and that optical morphology information can improve particle discrimination. While real plant debris was not measured in our characterization experiments, we found broad similarities in the fluorescence properties of cellulose and pollen fragments, suggesting that pollen fragments and plant debris may be easily confused in fluorescence-only classification methods.
Using the combined fluorescence and morphology characterization data, we developed a particle classification algorithm using supervised ML trained on known particle types and applied it to one year of field observations from the Zeppelin Observatory, Svalbard. Compared to the previously used fluorescence-only approach, our algorithm yields up to two orders of magnitude higher fluorescent PBAP concentrations during summer, in agreement with previously reported concentrations of PBAPs in Ny-Ålesund during July–August, while reproducing the annual PBAP cycle. Although the algorithm identified fungal spores as a major type of PBAP present at Zeppelin Observatory, in line with previous studies, it clearly overestimated pollen fragment concentrations, which may be attributable to similarities shared with plant debris and possibly biomass burning particles. In addition, we trained a dust detection model by exploiting optical morphology differences between dust and SSA particles, which may be used to help determine marine and terrestrial influence in ambient observations. Although laboratory-generated dust and SSA particles were readily distinguished, classification of ambient SSA proved challenging. This suggests significant differences between laboratory-generated and natural aerosols that may stem from environmental processing, motivating improvements in laboratory aerosolization and characterization methods.
Compared to fluorescence-only approaches, the ML framework explicitly incorporates morphology and accounts for a broader range of PBAP classes as well as major non-biological interferents. Domain adaptation further improved performance, although both ML-based and fluorescence-only methods likely remained sensitive to combustion aerosols. It is unlikely that any UV-LIF instrument configuration or classification scheme will fully eliminate non-PBAP interference, highlighting the need for parallel observations of e.g., black/brown carbon and source-specific chemical tracers for assessing fPBAP quantifications. However, it is also unlikely that any one method can establish “ground truth” PBAP tracer and number concentration data to compare with due to e.g., source overlap in chemical composition and limits to counting statistics. Despite site-specific variability in aerobiomes and fluorescence signatures, the framework provides a flexible and expandable basis for estimating PBAP concentrations across environments and reanalyzing existing MBS datasets. While our comparison of laboratory characterization data shows that MBS measurements of different particle types have distinct properties readily learnable by ML methods, additional training data are clearly needed to improve both interferent and specific PBAP class identification before it may be suitable for use as a standalone tool. Its continued development will require further validation with field observations and more characterization studies with e.g. biomass burning, pollen emission, fungal sporulation, and atmospheric aging in controlled conditions. The effects of incorporating morphology information in fPBAP identification may also be further explored as new characterization data with more realistic aerosolization mechanisms become available. Coordinated collection and open sharing of such reference datasets across research groups will be essential for improving identification methods.
Code for reproducing the analysis and figures can be found on GitHub (https://github.com/aidenrobert/MBS-source-characterization, last access: 20 August 2026; Jönsson, 2026a) and for the classification algorithm (https://github.com/aidenrobert/truffle, last access: 20 August 2026; Jönsson, 2026b), and the data produced in this study are hosted at the Bolin Centre for Climate Research's database at https://bolin.su.se/data/jonsson-2026-aerosol-mbs (last access: 10 June 2026) for processed data and https://bolin.su.se/data/jonsson-2026-aerosol-mbs-raw (last access: 10 June 2026) for raw (Jönsson et al., 2026a and Jönsson et al., 2026b, respectively). The data of Freitas et al. (2023a) can be found at the Bolin Centre Database at https://bolin.su.se/data/zeppelin-freitas-2023-bioaerosols-1 (last access: 5 November 2025, Freitas et al., 2023b). Zeppelin Observatory tracer data (Yttri, 2023; Aas, 2024, 2025; Calzolai, 2025) used in this study were accessed from EBAS (https://ebas.nilu.no, last access: 13 August 2025), hosted by NILU. Specifically, the use included data affiliated with the frameworks: ACTRIS, GAW-WDCA, GAW-WDCRG, CAMP, AMAP, NILU, and EMEP.
The supplement related to this article is available online at https://doi.org/10.5194/acp-26-13617-2026-supplement.
We follow the Contributor Role Taxonomy (CRediT; https://credit.niso.org/, last access: 15 December 2025). A.J.: Validation, Software, Methodology, Investigation, Formal analysis, Data curation, Visualization, Writing – Original Draft, Writing – Review and Editing; J.F.: Methodology, Investigation, Formal analysis, Data curation, Visualization, Writing – Review and Editing, Resources, Validation; G.F.: Software, Methodology, Investigation, Formal analysis, Data curation, Writing – Review and Editing, Validation; I.C.: Resources, Writing – Review and Editing, Data curation; P.D.-W.: Resources, Writing – Review and Editing; R.K.: Resources, Writing – Review and Editing, Data curation; Y.T.: Resources, Writing – Review and Editing; K.E.Y.: Resources, Writing – Review and Editing, Data curation; P.Z.: Conceptualization, Data curation, Funding acquisition, Investigation, Methodology, Project administration, Resources, Supervision, Writing – Review and Editing, Validation.
At least one of the (co-)authors is a member of the editorial board of Atmospheric Chemistry and Physics. The peer-review process was guided by an independent editor, and the authors also have no other competing interests to declare.
Publisher's note: Copernicus Publications remains neutral with regard to jurisdictional claims made in the text, published maps, institutional affiliations, or any other geographical representation in this paper. The authors bear the ultimate responsibility for providing appropriate place names. Views expressed in the text are those of the authors and do not necessarily reflect the views of the publisher.
This research has been supported by the Horizon 2020 (grant no. 101137639) and the Vetenskapsrådet (grant no. 2018-05045).
The publication of this article was funded by the Swedish Research Council, Forte, Formas, and Vinnova.
We are thankful to Zbynek Drab and Pharmallerga CZ S.r.o. for providing pollen samples and analyses, Julika Zinke and the Baltic Sea Centre for providing bacterial cultures, Elena Gorokhova (Department of Environmental Science, Stockholm University) for providing PE and cellulose samples, Ingrid Zieger for providing the Sakurajima dust sample, Birgitta Liewenborg (Department of Environmental Science, Stockholm University) for providing the clay dust sample, and David Topping (Centre for Atmospheric Science, University of Manchester) for providing the MBS data obtained in Ruske et al. (2017). We also wish to acknowledge the support and collaboration of the University of Hertfordshire, particularly Paul Kaye and Warren Stanley, in the development and maintenance of the MBS instrument.
This work was funded by the European Union's Horizon Europe Programme under Grant Agreement No. 101137639 (CleanCloud), and supported by the Swedish Research Council (grant no. 2018-05045) and Swedish Environmental Protection Agency (Naturvårdsverket). Contributions by PDW were supported by the Icelandic Research Fund (Rannís) grant no. 2612250-051. Contributions by YT were supported by JSPS KAKENHI (grant no. JP24H00761), Arctic Challenge for Sustainability 3 (ArCS-3, grant no. JPMXD1720251001), and the Environment Research and Technology Development Fund (grant nos. JPMEERF20232001, JPMEERF20262002) of the Environmental Restoration and Conservation Agency of Japan. Observations at Zeppelin Observatory were supported by the Swedish Environmental Protection Agency (Naturvårdsverket), Knut and Alice Wallenberg Foundation (Knut och Alice Wallenbergs Stiftelse; KAW) ACAS project grant no. 2016.0024, and by the Swedish Research Council (Vetenskapsrådet)’s ACTRIS-Sweden project (grant no. 2021-00177).
This paper was edited by Luis A. Ladino and reviewed by four anonymous referees.
Aas, W.: CAMP, NILU, EMEP, AMAP, 2017–2025, Heavy metals at Zeppelin mountain (Ny-Ålesund), data hosted by EBAS at NILU, https://doi.org/10.48597/6PXH-3ESD (last access: 11 August 2025), 2024. a
Aas, W.: EMEP, CAMP, NILU, AMAP, 2001–2025, Inorganics in air and particle phase at Zeppelin mountain (Ny-Ålesund), data hosted by EBAS at NILU, https://doi.org/10.48597/H7PV-77C5 (last access: 16 June 2025), 2025. a
Adebiyi, A., Kok, J. F., Murray, B. J., Ryder, C. L., Stuut, J.-B. W., Kahn, R. A., Knippertz, P., Formenti, P., Mahowald, N. M., Pérez García-Pando, C., Klose, M., Ansmann, A., Samset, B. H., Ito, A., Balkanski, Y., Di Biagio, C., Romanias, M. N., Huang, Y., and Meng, J.: A review of coarse mineral dust in the Earth system, Aeolian Res., 60, 100849, https://doi.org/10.1016/j.aeolia.2022.100849, 2023. a
Ahmadi, N., Jangaee, T. Z., Mohammadi, L., and Dargahi, A.: Microplastics in ambient air: a review of atmospheric abundance, human exposure and urgent research needs, Environmental Pollutants and Bioavailability, 38, 2610850, https://doi.org/10.1080/26395940.2025.2610850, 2026. a
Andreae, M. O.: Soot Carbon and Excess Fine Potassium: Long-Range Transport of Combustion-Derived Aerosols, Science, 220, 1148–1151, https://doi.org/10.1126/science.220.4602.1148, 1983. a
Andreae, M. O. and Gelencsér, A.: Black carbon or brown carbon? The nature of light-absorbing carbonaceous aerosols, Atmos. Chem. Phys., 6, 3131–3148, https://doi.org/10.5194/acp-6-3131-2006, 2006. a
Arnalds, O., Dagsson-Waldhauserova, P., and Olafsson, H.: The Icelandic volcanic aeolian environment: Processes and impacts — A review, Aeolian Res., 20, 176–195, https://doi.org/10.1016/j.aeolia.2016.01.004, 2016. a
Bai, X., Luo, L., Tian, H., Liu, S., Hao, Y., Zhao, S., Lin, S., Zhu, C., Guo, Z., and Lv, Y.: Atmospheric Vanadium Emission Inventory from Both Anthropogenic and Natural Sources in China, Environ. Sci. Technol., 55, 11568–11578, https://doi.org/10.1021/acs.est.1c04766, 2021. a
Bauer, H., Claeys, M., Vermeylen, R., Schueller, E., Weinke, G., Berger, A., and Puxbaum, H.: Arabitol and mannitol as tracers for the quantification of airborne fungal spores, Atmos. Environ., 42, 588–593, https://doi.org/10.1016/j.atmosenv.2007.10.013, 2008. a, b
Beck, I., Moallemi, A., Heutte, B., Pernov, J. B., Bergner, N., Rolo, M., Quéléver, L. L. J., Laurila, T., Boyer, M., Jokinen, T., Angot, H., Hoppe, C. J. M., Müller, O., Creamean, J., Frey, M. M., Freitas, G., Zinke, J., Salter, M., Zieger, P., Mirrielees, J. A., Kempf, H. E., Ault, A. P., Pratt, K. A., Gysel-Beer, M., Henning, S., Tatzelt, C., and Schmale, J.: Characteristics and sources of fluorescent aerosols in the central Arctic Ocean, Elementa: Science of the Anthropocene, 12, 00125, https://doi.org/10.1525/elementa.2023.00125, 2024. a, b, c, d, e, f, g, h, i, j, k, l, m, n
Beres, N. D., Burkart, J., Graf, E., Zeder, Y., Dailey, L. A., and Weinzierl, B.: Merging holography, fluorescence, and machine learning for in situ continuous characterization and classification of airborne microplastics, Atmos. Meas. Tech., 17, 6945–6964, https://doi.org/10.5194/amt-17-6945-2024, 2024. a
Bertram, T. H., Cochran, R. E., Grassian, V. H., and Stone, E. A.: Sea spray aerosol chemical composition: elemental and molecular mimics for laboratory studies of heterogeneous and multiphase reactions, Chem. Soc. Rev., 47, 2374–2400, https://doi.org/10.1039/C7CS00008A, 2018. a
Bozzetti, C., Daellenbach, K. R., Hueglin, C., Fermo, P., Sciare, J., Kasper-Giebl, A., Mazar, Y., Abbaszade, G., El Kazzi, M., Gonzalez, R., Shuster-Meiseles, T., Flasch, M., Wolf, R., Křepelová, A., Canonaco, F., Schnelle-Kreis, J., Slowik, J. G., Zimmermann, R., Rudich, Y., Baltensperger, U., El Haddad, I., and Prévôt, A. S. H.: Size-Resolved Identification, Characterization, and Quantification of Primary Biological Organic Aerosol at a European Rural Site, Environ. Sci. Technol., 50, 3425–3434, https://doi.org/10.1021/acs.est.5b05960, 2016. a
Calzolai, G.: NILU, 2017–2020, Heavy metals, inorganics in air and particle phase, silicon and sulphur at Zeppelin mountain (Ny-Ålesund), data hosted by EBAS at NILU, https://doi.org/10.48597/8SEU-C5UP (last access: 12 August 2025), 2025. a
Chen, J., Wu, Z. J., Zhao, X., Wang, Y. J., Chen, J. C., Qiu, Y. T., Zong, T. M., Chen, H. X., Wang, B. B., Lin, P., Liu, W., Guo, S., Yao, M. S., Zeng, L. M., Wex, H., Liu, X., Hu, M., and Li, S. M.: Atmospheric Humic-Like Substances (HULIS) Act as Ice Active Entities, Geophys. Res. Lett., 48, e2021GL092443, https://doi.org/10.1029/2021GL092443, 2021. a
China, S., Wang, B., Weis, J., Rizzo, L., Brito, J., Cirino, G. G., Kovarik, L., Artaxo, P., Gilles, M. K., and Laskin, A.: Rupturing of Biological Spores As a Source of Secondary Particles in Amazonia, Environ. Sci. Technol., 50, 12179–12186, https://doi.org/10.1021/acs.est.6b02896, 2016. a
Choobari, O. A., Zawar-Reza, P., and Sturman, A.: The global distribution of mineral dust and its impacts on the climate system: A review, Atmos. Res., 138, 152–165, https://doi.org/10.1016/j.atmosres.2013.11.007, 2014. a
Christiansen, S., Salter, M. E., Gorokhova, E., Nguyen, Q. T., and Bilde, M.: Sea Spray Aerosol Formation: Laboratory Results on the Role of Air Entrainment, Water Temperature, and Phytoplankton Biomass, Environ. Sci. Technol., 53, 13107–13116, https://doi.org/10.1021/acs.est.9b04078, 2019. a, b
Clarke, K. R.: Non-parametric multivariate analyses of changes in community structure, Aust. J. Ecol., 18, 117–143, https://doi.org/10.1111/j.1442-9993.1993.tb00438.x, 1993. a
Conen, F. and Yakutin, M. V.: Soils rich in biological ice-nucleating particles abound in ice-nucleating macromolecules likely produced by fungi, Biogeosciences, 15, 4381–4385, https://doi.org/10.5194/bg-15-4381-2018, 2018. a
Crawford, I., Ruske, S., Topping, D. O., and Gallagher, M. W.: Evaluation of hierarchical agglomerative cluster analysis methods for discrimination of primary biological aerosol, Atmos. Meas. Tech., 8, 4979–4991, https://doi.org/10.5194/amt-8-4979-2015, 2015. a
Crawford, I., Topping, D., Gallagher, M., Forde, E., Lloyd, J. R., Foot, V., Stopford, C., and Kaye, P.: Detection of Airborne Biological Particles in Indoor Air Using a Real-Time Advanced Morphological Parameter UV-LIF Spectrometer and Gradient Boosting Ensemble Decision Tree Classifiers, Atmosphere, 11, https://doi.org/10.3390/atmos11101039, 2020. a, b, c, d, e, f
Crawford, I., Bower, K., Topping, D., Di Piazza, S., Massabò, D., Vernocchi, V., and Gallagher, M.: Towards a UK Airborne Bioaerosol Climatology: Real-Time Monitoring Strategies for High Time Resolution Bioaerosol Classification and Quantification, Atmosphere, 14, https://doi.org/10.3390/atmos14081214, 2023. a
Crawford, J., Cohen, D. D., Chambers, S. D., Williams, A. G., and Atanacio, A.: Impact of aerosols of sea salt origin in a coastal basin: Sydney, Australia, Atmos. Environ., 207, 52–62, https://doi.org/10.1016/j.atmosenv.2019.03.018, 2019. a
Després, V. R., Huffman, J. A., Burrows, S. M., Hoose, C., Safatov, A. S., Buryak, G., Fröhlich-Nowoisky, J., Elbert, W., Andreae, M. O., Pöschl, U., and Jaenicke, R.: Primary biological aerosol particles in the atmosphere: a review, Tellus B, 64, 15598, https://doi.org/10.3402/tellusb.v64i0.15598, 2012. a, b
Di Filippo, P., Pomata, D., Riccardi, C., Buiarelli, F., and Perrino, C.: Fungal contribution to size-segregated aerosol measured through biomarkers, Atmos. Environ., 64, 132–140, https://doi.org/10.1016/j.atmosenv.2012.10.010, 2013. a
El Morr, C., Jammal, M., Ali-Hassan, H., and El-Hallak, W.: Logistic Regression, Springer International Publishing, Cham, pp. 231–249, https://doi.org/10.1007/978-3-031-16990-8_7, 2022. a
Ellington, A. J., Walters, K., Christner, B. C., Fox, S., Bonfantine, K., Walker, C., Lampman, P., Vuono, D. C., Strickland, M., Lambert, K., and Kobziar, L. N.: Dispersal of microbes from grassland fire smoke to soils, ISME J., 18, wrae203, https://doi.org/10.1093/ismejo/wrae203, 2024. a
Evangelou, I., Bucci, S., and Stohl, A.: Atmospheric microplastic emissions from land and ocean, Nature, 649, 1186–1189, https://doi.org/10.1038/s41586-025-09998-6, 2026. a
Fang, K., Wang, Y., Yu, T., Zhang, L., Baluška, F., Šamaj, J., and Lin, J.: Isolation of de-exined pollen and cytological studies of the pollen intines of Pinus bungeana Zucc. Ex Endl. and Picea wilsonii Mast, Flora, 203, 332–340, https://doi.org/10.1016/j.flora.2007.04.007, 2008. a
Fennelly, M. J., Sewell, G., Prentice, M. B., O’Connor, D. J., and Sodeau, J. R.: Review: The Use of Real-Time Fluorescence Instrumentation to Monitor Ambient Primary Biological Aerosol Particles (PBAP), Atmosphere, 9, https://doi.org/10.3390/atmos9010001, 2018. a
Field, P. R., Lawson, R. P., Brown, P. R. A., Lloyd, G., Westbrook, C., Moisseev, D., Miltenberger, A., Nenes, A., Blyth, A., Choularton, T., Connolly, P., Buehl, J., Crosier, J., Cui, Z., Dearden, C., DeMott, P., Flossmann, A., Heymsfield, A., Huang, Y., Kalesse, H., Kanji, Z. A., Korolev, A., Kirchgaessner, A., Lasher-Trapp, S., Leisner, T., McFarquhar, G., Phillips, V., Stith, J., and Sullivan, S.: Secondary Ice Production: Current State of the Science and Recommendations for the Future, Meteor. Mon., 58, 7.1–7.20, https://doi.org/10.1175/AMSMONOGRAPHS-D-16-0014.1, 2017. a
Freitas, G. P., Stolle, C., Kaye, P. H., Stanley, W., Herlemann, D. P. R., Salter, M. E., and Zieger, P.: Emission of primary bioaerosol particles from Baltic seawater, Environmental Science: Atmospheres, 2, 1170–1182, https://doi.org/10.1039/d2ea00047d, 2022. a, b, c, d, e, f, g, h, i, j, k, l
Freitas, G. P., Adachi, K., Conen, F., Heslin-Rees, D., Krejci, R., Tobo, Y., Yttri, K. E., and Zieger, P.: Regionally sourced bioaerosols drive high-temperature ice nucleating particles in the Arctic, Nat. Commun., 14, 5997, https://doi.org/10.1038/s41467-023-41696-7, 2023a. a, b, c, d, e, f, g, h, i, j, k, l, m, n, o, p
Freitas, G. P., Conen, F., Adachi, K., Yttri, K. E., Krejci, R., and Zieger, P.: Concentration of bioaerosols and ice nucleating particles at Zeppelin Observatory, Svalbard, 2017–2020, Dataset version 1, Bolin Centre Database, https://doi.org/10.17043/zeppelin-freitas-2023-bioaerosols-1 (last access: 9 July 2025), 2023b. a
Pereira Freitas, G., Kopec, B., Adachi, K., Krejci, R., Heslin-Rees, D., Yttri, K. E., Hubbard, A., Welker, J. M., and Zieger, P.: Contribution of fluorescent primary biological aerosol particles to low-level Arctic cloud residuals, Atmos. Chem. Phys., 24, 5479–5494, https://doi.org/10.5194/acp-24-5479-2024, 2024. a, b, c, d
Froyd, K. D., Murphy, D. M., Brock, C. A., Campuzano-Jost, P., Dibb, J. E., Jimenez, J.-L., Kupc, A., Middlebrook, A. M., Schill, G. P., Thornhill, K. L., Williamson, C. J., Wilson, J. C., and Ziemba, L. D.: A new method to quantify mineral dust and other aerosol species from aircraft platforms using single-particle mass spectrometry, Atmos. Meas. Tech., 12, 6209–6239, https://doi.org/10.5194/amt-12-6209-2019, 2019. a
Fu, Y. and Finney, N. S.: Small-molecule fluorescent probes and their design, RSC Adv., 8, 29051–29061, https://doi.org/10.1039/C8RA02297F, 2018. a
Gantt, E. and Cunningham Jr, F. X.: Algal Pigments, John Wiley & Sons, Ltd, https://doi.org/10.1038/npg.els.0000323, 2001. a
Gao, K., Vogel, F., Foskinis, R., Vratolis, S., Gini, M. I., Granakis, K., Billault-Roux, A.-C., Georgakaki, P., Zografou, O., Fetfatzis, P., Berne, A., Papayannis, A., Eleftheridadis, K., Möhler, O., and Nenes, A.: Biological and dust aerosols as sources of ice-nucleating particles in the eastern Mediterranean: source apportionment, atmospheric processing and parameterization, Atmos. Chem. Phys., 24, 9939–9974, https://doi.org/10.5194/acp-24-9939-2024, 2024. a, b
Gill, T. E., Zobeck, T. M., and Stout, J. E.: Technologies for laboratory generation of dust from geological materials, J. Hazard. Mater., 132, 1–13, https://doi.org/10.1016/j.jhazmat.2005.11.083, 2006. a
Gliß, J., Mortier, A., Schulz, M., Andrews, E., Balkanski, Y., Bauer, S. E., Benedictow, A. M. K., Bian, H., Checa-Garcia, R., Chin, M., Ginoux, P., Griesfeller, J. J., Heckel, A., Kipling, Z., Kirkevåg, A., Kokkola, H., Laj, P., Le Sager, P., Lund, M. T., Lund Myhre, C., Matsui, H., Myhre, G., Neubauer, D., van Noije, T., North, P., Olivié, D. J. L., Rémy, S., Sogacheva, L., Takemura, T., Tsigaridis, K., and Tsyro, S. G.: AeroCom phase III multi-model evaluation of the aerosol life cycle and optical properties using ground- and space-based remote sensing as well as surface in situ observations, Atmos. Chem. Phys., 21, 87–128, https://doi.org/10.5194/acp-21-87-2021, 2021. a
Gosselin, M. I., Rathnayake, C. M., Crawford, I., Pöhlker, C., Fröhlich-Nowoisky, J., Schmer, B., Després, V. R., Engling, G., Gallagher, M., Stone, E., Pöschl, U., and Huffman, J. A.: Fluorescent bioaerosol particle, molecular tracer, and fungal spore concentrations during dry and rainy periods in a semi-arid forest, Atmos. Chem. Phys., 16, 15165–15184, https://doi.org/10.5194/acp-16-15165-2016, 2016. a
Grabmayer, K., Wallner, G. M., Beißmann, S., Braun, U., Steffen, R., Nitsche, D., Röder, B., Buchberger, W., and Lang, R. W.: Accelerated aging of polyethylene materials at high oxygen pressure characterized by photoluminescence spectroscopy and established aging characterization methods, Polym. Degrad. Stabil., 109, 40–49, https://doi.org/10.1016/j.polymdegradstab.2014.06.021, 2014. a
Gratzl, J., Seifried, T. M., Stolzenburg, D., and Grothe, H.: A fluorescence approach for an online measurement technique of atmospheric microplastics, Environ. Sci.: Atmos., 4, 601–610, https://doi.org/10.1039/D4EA00010B, 2024. a
Gratzl, J., Böhmländer, A., Pätsi, S., Pogner, C.-E., Gorfer, M., Brus, D., Doulgeris, K. M., Wieland, F., Asmi, E., Saarto, A., Möhler, O., Stolzenburg, D., and Grothe, H.: Locally emitted fungal spores serve as high-temperature ice nucleating particles in the European sub-Arctic, Atmos. Chem. Phys., 25, 12007–12035, https://doi.org/10.5194/acp-25-12007-2025, 2025. a
Han, I., Lee, C., Belchez, C., Shipper, A. G., and Wiens, K. E.: Microplastics in Urban Ambient Air: A Rapid Review of Active Sampling and Analytical Methods for Human Risk Assessment, Environments, 11, https://doi.org/10.3390/environments11110256, 2024. a
Hartmann, S., Schrödner, R., Hassett, B. T., Hartmann, M., van Pinxteren, M., Fomba, K. W., Stratmann, F., Herrmann, H., Pöhlker, M., and Zeppenfeld, S.: Polysaccharides – Important Constituents of Ice-Nucleating Particles of Marine Origin, Environ. Sci. Technol., 59, 5098–5108, https://doi.org/10.1021/acs.est.4c08014, 2025. a
Healy, J. and McInnes, L.: Uniform manifold approximation and projection, Nature Reviews Methods Primers, 4, 82, https://doi.org/10.1038/s43586-024-00363-x, 2024. a
Hernandez, M., Perring, A. E., McCabe, K., Kok, G., Granger, G., and Baumgardner, D.: Chamber catalogues of optical and fluorescent signatures distinguish bioaerosol classes, Atmos. Meas. Tech., 9, 3283–3292, https://doi.org/10.5194/amt-9-3283-2016, 2016. a
Hess, M. W.: Cell-wall development in freeze-fixed pollen: Intine formation of Ledebouria socialis (Hyacinthaceae), Planta, 189, 139–149, https://doi.org/10.1007/BF00201354, 1993. a
Hiranuma, N., Möhler, O., Yamashita, K., Tajiri, T., Saito, A., Kiselev, A., Hoffmann, N., Hoose, C., Jantsch, E., Koop, T., and Murakami, M.: Ice nucleation by cellulose and its potential contribution to ice formation in clouds, Nat. Geosci., 8, 273–277, https://doi.org/10.1038/ngeo2374, 2015. a
Hiranuma, N., Adachi, K., Bell, D. M., Belosi, F., Beydoun, H., Bhaduri, B., Bingemer, H., Budke, C., Clemen, H.-C., Conen, F., Cory, K. M., Curtius, J., DeMott, P. J., Eppers, O., Grawe, S., Hartmann, S., Hoffmann, N., Höhler, K., Jantsch, E., Kiselev, A., Koop, T., Kulkarni, G., Mayer, A., Murakami, M., Murray, B. J., Nicosia, A., Petters, M. D., Piazza, M., Polen, M., Reicher, N., Rudich, Y., Saito, A., Santachiara, G., Schiebel, T., Schill, G. P., Schneider, J., Segev, L., Stopelli, E., Sullivan, R. C., Suski, K., Szakáll, M., Tajiri, T., Taylor, H., Tobo, Y., Ullrich, R., Weber, D., Wex, H., Whale, T. F., Whiteside, C. L., Yamashita, K., Zelenyuk, A., and Möhler, O.: A comprehensive characterization of ice nucleation by three different types of cellulose particles immersed in water, Atmos. Chem. Phys., 19, 4823–4849, https://doi.org/10.5194/acp-19-4823-2019, 2019. a
Hird, C., Perron, M. M. G., Holmes, T. M., Meyerink, S., Nielsen, C., Townsend, A. T., de Caritat, P., Strzelec, M., and Bowie, A. R.: On the use of lithogenic tracer measurements in aerosols to constrain dust deposition fluxes to the ocean southeast of Australia, Aerosol Research, 2, 315–327, https://doi.org/10.5194/ar-2-315-2024, 2024. a
Holden, A. S., Sullivan, A. P., Munchak, L. A., Kreidenweis, S. M., Schichtel, B. A., Malm, W. C., and Collett, J. L.: Determining contributions of biomass burning and other sources to fine particle contemporary carbon in the western United States, Atmos. Environ., 45, 1986–1993, https://doi.org/10.1016/j.atmosenv.2011.01.021, 2011. a
Hoose, C. and Möhler, O.: Heterogeneous ice nucleation on atmospheric aerosols: a review of results from laboratory experiments, Atmos. Chem. Phys., 12, 9817–9854, https://doi.org/10.5194/acp-12-9817-2012, 2012. a
Htun, T. and Klein, U. K.: Laser-induced fluorescence decays of polyethylene films, J. Lumin., 130, 1275–1279, https://doi.org/10.1016/j.jlumin.2010.02.038, 2010. a
Huffman, J. A., Perring, A. E., Savage, N. J., Clot, B., Crouzy, B., Tummon, F., Shoshanim, O., Damit, B., Schneider, J., Sivaprakasam, V., Zawadowicz, M. A., Crawford, I., Gallagher, M., Topping, D., Doughty, D. C., Hill, S. C., and and, Y. P.: Real-time sensing of bioaerosols: Review and current perspectives, Aerosol Sci. Tech., 54, 465–495, https://doi.org/10.1080/02786826.2019.1664724, 2020. a
Hughes, D. D., Mampage, C. B. A., Jones, L. M., Liu, Z., and Stone, E. A.: Characterization of Atmospheric Pollen Fragments during Springtime Thunderstorms, Environ. Sci. Technol. Letters, 7, 409–414, https://doi.org/10.1021/acs.estlett.0c00213, 2020. a, b
Jacquot, J. L., Shen, X., Abou-Ghanem, M., Froyd, K. D., Lawler, M., Schill, G. P., Slovacek, K., Thomson, D. S., Cziczo, D. J., and Murphy, D. M.: A new airborne single particle mass spectrometer: PALMS-NG, Aerosol Sci. Tech., 58, 991–1007, https://doi.org/10.1080/02786826.2024.2331549, 2024. a
Jia, W., Sun, M., Lian, J., and Hou, S.: Feature dimensionality reduction: a review, Complex & Intelligent Systems, 8, 2663–2693, https://doi.org/10.1007/s40747-021-00637-x, 2022. a
Jia, Y. and Fraser, M.: Characterization of Saccharides in Size-fractionated Ambient Particulate Matter and Aerosol Sources: The Contribution of Primary Biological Aerosol Particles (PBAPs) and Soil to Ambient Particulate Matter, Environ. Sci. Technol., 45, 930–936, https://doi.org/10.1021/es103104e, 2011. a
Jia, Y., Bhat, S., and Fraser, M. P.: Characterization of saccharides and other organic compounds in fine particles and the use of saccharides to track primary biologically derived carbon sources, Atmos. Environ., 44, 724–732, https://doi.org/10.1016/j.atmosenv.2009.10.034, 2010. a
Johansen, S. and Hafsten, U.: Airborne pollen and spore registrations at Ny-Ålesund, Svalbard, summer 1986, Polar Res., 6, 11–17, https://onlinelibrary.wiley.com/doi/abs/10.1111/j.1751-8369.1988.tb00577.x (last access: 6 June 2026), 1988. a, b, c
Jönsson, A.: aidenrobert/MBS-source-characterization (Version 1) [code], Zenodo, https://doi.org/10.5281/zenodo.22086099, 2026a. a
Jönsson, A.: aidenrobert/truffle (Version 1) [code], Zenodo, https://doi.org/10.5281/zenodo.22086175, 2026b. a
Jönsson, A., Fu, J., Freitas, G. P., Zieger, P., Crawford, I., Dagsson-Waldhauserová, P., and Tobo, Y.: Multiparameter bioaerosol spectrometer (MBS) laboratory characterization of coarse-mode particles – processed data, Dataset version 1, Bolin Centre Database [data set], https://doi.org/10.17043/jonsson-2026-aerosol-mbs-1, 2026a. a
Jönsson, A., Fu, J., Freitas, G. P., Zieger, P., Dagsson-Waldhauserová, P., and Tobo, Y.: Multiparameter bioaerosol spectrometer (MBS) laboratory characterization of coarse-mode particles – raw data, Dataset version 1, Bolin Centre Database [data set], https://doi.org/10.17043/jonsson-2026-aerosol-mbs-raw-1, 2026b. a
Kaluarachchi, C. P., Or, V. W., Lan, Y., Hasenecz, E. S., Kim, D., Madawala, C. K., Dorcé, G. P., Mayer, K. J., Sauer, J. S., Lee, C., Cappa, C. D., Bertram, T. H., Stone, E. A., Prather, K. A., Grassian, V. H., and Tivanski, A. V.: Effects of Atmospheric Aging Processes on Nascent Sea Spray Aerosol Physicochemical Properties, ACS Earth Space Chem., 6, 2732–2744, https://doi.org/10.1021/acsearthspacechem.2c00258, 2022. a, b
Karle, N. N., Sakai, R. K., Chiao, S., Fitzgerald, R. M., and Stockwell, W. R.: Reinterpreting Trends: The Impact of Methodological Changes on Reported Sea Salt Aerosol Levels, Atmosphere, 15, https://doi.org/10.3390/atmos15070740, 2024. a
Karlsson, L., Boström, H., and Zieger, P.: Classication of aerosol particles using inductive conformal prediction, in: Proceedings of the Ninth Symposium on Conformal and Probabilistic Prediction and Applications, edited by: Gammerman, A., Vovk, V., Luo, Z., Smirnov, E., and Cherubin, G., vol. 128 of Proceedings of Machine Learning Research, 257–268, PMLR, https://proceedings.mlr.press/v128/karlsson20a/karlsson20a.pdf (last access: 12 December 2025), 2020. a
Karlsson, L., Baccarini, A., Duplessis, P., Baumgardner, D., Brooks, I. M., Chang, R. Y.-W., Dada, L., Dällenbach, K. R., Heikkinen, L., Krejci, R., Leaitch, W. R., Leck, C., Partridge, D. G., Salter, M. E., Wernli, H., Wheeler, M. J., Schmale, J., and Zieger, P.: Physical and Chemical Properties of Cloud Droplet Residuals and Aerosol Particles During the Arctic Ocean 2018 Expedition, J. Geophys. Res.-Atmos., 127, e2021JD036383, 2022. a, b, c
Kobziar, L. N., Vuono, D., Moore, R., Christner, B. C., Dean, T., Betancourt, D., Watts, A. C., Aurell, J., and Gullett, B.: Wildland fire smoke alters the composition, diversity, and potential atmospheric function of microbial life in the aerobiome, ISME Communications, 2, 8, https://doi.org/10.1038/s43705-022-00089-5, 2022. a
Kojoj, J., Freitas, G. P., Muilwijk, M., Granskog, M. A., Naakka, T., Ekman, A. M. L., Heutte, B., Schmale, J., Da Silva, A., Lapere, R., Marelle, L., Thomas, J. L., Melsheimer, C., Murray, B. J., and Zieger, P.: An Arctic Marine Source of Fluorescent Primary Biological Aerosol Particles During the Transition from Summer to Autumn at the North Pole, Tellus B, https://doi.org/10.16993/tellusb.1880, 2024. a, b, c, d, e
Kouw, W. M. and Loog, M.: A Review of Domain Adaptation without Target Labels, IEEE T. Pattern Anal., 43, 766–785, https://doi.org/10.1109/TPAMI.2019.2945942, 2021. a
Kulpinski, P., Erdman, A., Namyslak, M., and Fidelus, J. D.: Cellulose fibers modified by Eu3+-doped yttria-stabilized zirconia nanoparticles, Cellulose, 19, 1259–1269, https://doi.org/10.1007/s10570-012-9704-6, 2012. a
Lai, S.-H., Maclot, S., Antoine, R., and Masselon, C. D.: Advances in Single Particle Mass Analysis, Mass Spectrom. Rev., 44, 850–869, https://doi.org/10.1002/mas.21920, 2025. a
Lau, A. P., Lee, A. K., Chan, C. K., and Fang, M.: Ergosterol as a biomarker for the quantification of the fungal biomass in atmospheric aerosols, Atmos. Environ., 40, 249–259, https://doi.org/10.1016/j.atmosenv.2005.09.048, 2006. a, b
Lee, H. D., Morris, H. S., Laskina, O., Sultana, C. M., Lee, C., Jayarathne, T., Cox, J. L., Wang, X., Hasenecz, E. S., DeMott, P. J., Bertram, T. H., Cappa, C. D., Stone, E. A., Prather, K. A., Grassian, V. H., and Tivanski, A. V.: Organic Enrichment, Physical Phase State, and Surface Tension Depression of Nascent Core-Shell Sea Spray Aerosols during Two Phytoplankton Blooms, ACS Earth Space Chem., 4, 650–660, https://doi.org/10.1021/acsearthspacechem.0c00032, 2020. a
Lu, D., Tan, J., Yang, X., Sun, X., Liu, Q., and Jiang, G.: Unraveling the role of silicon in atmospheric aerosol secondary formation: a new conservative tracer for aerosol chemistry, Atmos. Chem. Phys., 19, 2861–2870, https://doi.org/10.5194/acp-19-2861-2019, 2019. a
Madawala, C. K., Molina, C., Kim, D., Gamage, D. K., Sun, M., Leibensperger III, R. J., Mehndiratta, L., Lee, J., Kaluarachchi, C. P., Kimble, K. A., Sandstrom, G., Harb, C., Dinasquet, J., Malfatti, F., Prather, K. A., Deane, G. B., Stokes, M. D., Lee, C., Slade, J. H., Stone, E. A., Grassian, V. H., and Tivanski, A. V.: Effects of Wind Speed on Size-Dependent Morphology and Composition of Sea Spray Aerosols, ACS Earth Space Chem., 8, 1609–1622, https://doi.org/10.1021/acsearthspacechem.4c00119, 2024. a
Mahrt, F., Wieder, J., Dietlicher, R., Smith, H. R., Stopford, C., and Kanji, Z. A.: A high-speed particle phase discriminator (PPD-HS) for the classification of airborne particles, as tested in a continuous flow diffusion chamber, Atmos. Meas. Tech., 12, 3183–3208, https://doi.org/10.5194/amt-12-3183-2019, 2019. a
Maki, L. R., Galyan, E. L., Chang-Chien, M.-M., and Caldwell, D. R.: Ice Nucleation Induced by Pseudomonas syringae, Appl. Microbiol., 28, 456–459, https://doi.org/10.1128/am.28.3.456-459.1974, 1974. a
Mampage, C. B., Hughes, D. D., Jones, L. M., Metwali, N., Thorne, P. S., and Stone, E. A.: Characterization of sub-pollen particles in size-resolved atmospheric aerosol using chemical tracers, Atmospheric Environment: X, 15, 100177, https://doi.org/10.1016/j.aeaoa.2022.100177, 2022. a, b, c
Matthews, B. H., Alsante, A. N., and Brooks, S. D.: Pollen Emissions of Subpollen Particles and Ice Nucleating Particles, ACS Earth Space Chem., 7, 1207–1218, https://doi.org/10.1021/acsearthspacechem.3c00014, 2023. a
McInnes, L., Healy, J., and Melville, J.: UMAP: Uniform Manifold Approximation and Projection for Dimension Reduction, arXiv [preprint], https://doi.org/10.48550/arXiv.1802.03426, 2020. a
Medeiros, P. M., Conte, M. H., Weber, J. C., and Simoneit, B. R.: Sugars as source indicators of biogenic organic carbon in aerosols collected above the Howland Experimental Forest, Maine, Atmos. Environ., 40, 1694–1705, https://doi.org/10.1016/j.atmosenv.2005.11.001, 2006. a, b
Moore, R. A., Bomar, C., Kobziar, L. N., and Christner, B. C.: Wildland fire as an atmospheric source of viable microbial aerosols and biological ice nucleating particles, ISME J., 15, 461–472, https://doi.org/10.1038/s41396-020-00788-8, 2020. a
Moosmüller, H., Chakrabarty, R., and Arnott, W.: Aerosol light absorption and its measurement: A review, J. Quant. Spectrosc. Ra., 110, 844–878, https://doi.org/10.1016/j.jqsrt.2009.02.035, 2009. a
Morgana, S., Casentini, B., Tirelli, V., Grasso, F., and Amalfitano, S.: Fluorescence-based detection: A review of current and emerging techniques to unveil micro/ nanoplastics in environmental samples, TrAC TrAc-Trend. Anal. Chem., 172, 117559, https://doi.org/10.1016/j.trac.2024.117559, 2024. a
Murray, B. J., O'Sullivan, D., Atkinson, J. D., and Webb, M. E.: Ice nucleation by particles immersed in supercooled cloud droplets, Chem. Soc. Rev., 41, 6519–6554, https://doi.org/10.1039/C2CS35200A, 2012. a
Nash, D. G., Baer, T., and Johnston, M. V.: Aerosol mass spectrometry: An introductory review, Int. J. Mass Spectrom., 258, 2–12, https://doi.org/10.1016/j.ijms.2006.09.017, aerosols/Microparticles Special Issue, 2006. a
Nocedal, J.: Large-Scale Unconstrained Optimization, Springer New York, New York, NY, pp. 164–192, https://doi.org/10.1007/978-0-387-40065-5_7, 2006. a
Pacini, E., Guarnieri, M., and Nepi, M.: Pollen carbohydrates and water content during development, presentation, and dispersal: a short review, Protoplasma, 228, 73–77, https://doi.org/10.1007/s00709-006-0169-z, 2006. a
Pandey, D., Banerjee, T., Badola, N., and Chauhan, J. S.: Evidences of microplastics in aerosols and street dust: a case study of Varanasi City, India, Environ. Sci. Pollut. R., 29, 82006–82013, https://doi.org/10.1007/s11356-022-21514-1, 2022. a
Pasquier, J. T., David, R. O., Freitas, G., Gierens, R., Gramlich, Y., Haslett, S., Li, G., Schäfer, B., Siegel, K., Wieder, J., Adachi, K., Belosi, F., Carlsen, T., Decesari, S., Ebell, K., Gilardoni, S., Gysel-Beer, M., Henneberger, J., Inoue, J., Kanji, Z. A., Koike, M., Kondo, Y., Krejci, R., Lohmann, U., Maturilli, M., Mazzolla, M., Modini, R., Mohr, C., Motos, G., Nenes, A., Nicosia, A., Ohata, S., Paglione, M., Park, S., Pileci, R. E., Ramelli, F., Rinaldi, M., Ritter, C., Sato, K., Storelvmo, T., Tobo, Y., Traversi, R., Viola, A., and Zieger, P.: The Ny-Ålesund Aerosol Cloud Experiment (NASCENT): Overview and First Results, B. Am. Meteorol. Soc., 103, E2533–E2558, https://doi.org/10.1175/BAMS-D-21-0034.1, 2022. a
Pereira, D. L., Gavilán, I., Letechipía, C., Raga, G. B., Puig, T. P., Mugica-Álvarez, V., Alvarez-Ospina, H., Rosas, I., Martinez, L., Salinas, E., Quintana, E. T., Rosas, D., and Ladino, L. A.: Mexican agricultural soil dust as a source of ice nucleating particles, Atmos. Chem. Phys., 22, 6435–6447, https://doi.org/10.5194/acp-22-6435-2022, 2022. a
Platt, S. M., Hov, Ø., Berg, T., Breivik, K., Eckhardt, S., Eleftheriadis, K., Evangeliou, N., Fiebig, M., Fisher, R., Hansen, G., Hansson, H.-C., Heintzenberg, J., Hermansen, O., Heslin-Rees, D., Holmén, K., Hudson, S., Kallenborn, R., Krejci, R., Krognes, T., Larssen, S., Lowry, D., Lund Myhre, C., Lunder, C., Nisbet, E., Nizzetto, P. B., Park, K.-T., Pedersen, C. A., Aspmo Pfaffhuber, K., Röckmann, T., Schmidbauer, N., Solberg, S., Stohl, A., Ström, J., Svendby, T., Tunved, P., Tørnkvist, K., van der Veen, C., Vratolis, S., Yoon, Y. J., Yttri, K. E., Zieger, P., Aas, W., and Tørseth, K.: Atmospheric composition in the European Arctic and 30 years of the Zeppelin Observatory, Ny-Ålesund, Atmos. Chem. Phys., 22, 3321–3369, https://doi.org/10.5194/acp-22-3321-2022, 2022. a
Pöhlker, C., Huffman, J. A., and Pöschl, U.: Autofluorescence of atmospheric bioaerosols – fluorescent biomolecules and potential interferences, Atmos. Meas. Tech., 5, 37–71, https://doi.org/10.5194/amt-5-37-2012, 2012. a, b, c, d, e, f
Prank, M., Tonttila, J., Shang, X., Romakkaniemi, S., and Raatikainen, T.: Can pollen affect precipitation?, Atmos. Chem. Phys., 25, 183–197, https://doi.org/10.5194/acp-25-183-2025, 2025. a
Pratt, K. A. and Prather, K. A.: Mass spectrometry of atmospheric aerosols—Recent developments and applications. Part II: On-line mass spectrometry techniques, Mass Spectrom. Rev., 31, 17–48, https://doi.org/10.1002/mas.20330, 2012. a
Rathnayake, C. M., Metwali, N., Jayarathne, T., Kettler, J., Huang, Y., Thorne, P. S., O'Shaughnessy, P. T., and Stone, E. A.: Influence of rain on the abundance of bioaerosols in fine and coarse particles, Atmos. Chem. Phys., 17, 2459–2475, https://doi.org/10.5194/acp-17-2459-2017, 2017. a
Ren, G., Yan, X., Ma, Y., Qiao, L., Chen, Z., Xin, Y., Zhou, M., Shi, Y., Zheng, K., Zhu, S., Huang, C., and Li, L.: Characteristics and source apportionment of PM2.5-bound saccharides and carboxylic acids in Central Shanghai, China, Atmos. Res., 237, 104817, https://doi.org/10.1016/j.atmosres.2019.104817, 2020. a
Ruske, S., Topping, D. O., Foot, V. E., Kaye, P. H., Stanley, W. R., Crawford, I., Morse, A. P., and Gallagher, M. W.: Evaluation of machine learning algorithms for classification of primary biological aerosol using a new UV-LIF spectrometer, Atmos. Meas. Tech., 10, 695–708, https://doi.org/10.5194/amt-10-695-2017, 2017. a, b, c, d, e, f, g, h, i, j, k, l, m, n
Ruske, S., Topping, D. O., Foot, V. E., Morse, A. P., and Gallagher, M. W.: Machine learning for improved data analysis of biological aerosol using the WIBS, Atmos. Meas. Tech., 11, 6203–6230, https://doi.org/10.5194/amt-11-6203-2018, 2018. a
Salter, M. E., Nilsson, E. D., Butcher, A., and Bilde, M.: On the seawater temperature dependence of the sea spray aerosol generated by a continuous plunging jet, J. Geophys. Res.-Atmos., 119, 9052–9072, https://doi.org/10.1002/2013JD021376, 2014. a, b
Salter, M. E., Zieger, P., Acosta Navarro, J. C., Grythe, H., Kirkevåg, A., Rosati, B., Riipinen, I., and Nilsson, E. D.: An empirically derived inorganic sea spray source function incorporating sea surface temperature, Atmos. Chem. Phys., 15, 11047–11066, https://doi.org/10.5194/acp-15-11047-2015, 2015. a, b
Salter, M. E., Hamacher-Barth, E., Leck, C., Werner, J., Johnson, C. M., Riipinen, I., Nilsson, E. D., and Zieger, P.: Calcium enrichment in sea spray aerosol particles, Geophys. Res. Lett., 43, 8277–8285, https://doi.org/10.1002/2016GL070275, 2016. a
Sánchez-Ochoa, A., Kasper-Giebl, A., Puxbaum, H., Gelencser, A., Legrand, M., and Pio, C.: Concentration of atmospheric cellulose: A proxy for plant debris across a west-east transect over Europe, J. Geophys. Res.-Atmos., 112, https://doi.org/10.1029/2006JD008180, 2007. a
Sauvageat, E., Zeder, Y., Auderset, K., Calpini, B., Clot, B., Crouzy, B., Konzelmann, T., Lieberherr, G., Tummon, F., and Vasilatou, K.: Real-time pollen monitoring using digital holography, Atmos. Meas. Tech., 13, 1539–1550, https://doi.org/10.5194/amt-13-1539-2020, 2020. a
Savage, N. J., Krentz, C. E., Könemann, T., Han, T. T., Mainelis, G., Pöhlker, C., and Huffman, J. A.: Systematic characterization and fluorescence threshold strategies for the wideband integrated bioaerosol sensor (WIBS) using size-resolved biological and interfering particles, Atmos. Meas. Tech., 10, 4279–4302, https://doi.org/10.5194/amt-10-4279-2017, 2017. a
Schiffer, J. M., Mael, L. E., Prather, K. A., Amaro, R. E., and Grassian, V. H.: Sea Spray Aerosol: Where Marine Biology Meets Atmospheric Chemistry, ACS Central Science, 4, 1617–1623, https://doi.org/10.1021/acscentsci.8b00674, pMID: 30648145, 2018. a
Sikoparija, B., Matavulj, P., Simovic, I., Radisic, P., Brdar, S., Minic, V., Tesendic, D., Kadantsev, E., Palamarchuk, J., and Sofiev, M.: Classification accuracy and compatibility across devices of a new Rapid-E+ flow cytometer, Atmos. Meas. Tech., 17, 5051–5070, https://doi.org/10.5194/amt-17-5051-2024, 2024. a
Simoneit, B. R. T.: A review of biomarker compounds as source indicators and tracers for air pollution, Environ. Sci. Pollut. R., 6, 159–169, https://doi.org/10.1007/BF02987621, 1999. a
Solomon, P. A., Fall, T., Salmon, L., Cass, G. R., Gray, H. A., and Davidson, A.: Chemical Characteristics of PM10 Aerosols Collected in the Los Angeles Area, JAPCA, 39, 154–163, https://doi.org/10.1080/08940630.1989.10466515, 1989. a
Stone, E. A., Mampage, C. B. A., Hughes, D. D., and Jones, L. M.: Airborne sub-pollen particles from rupturing giant ragweed pollen, Aerobiologia, 37, 625–632, https://doi.org/10.1007/s10453-021-09702-x, 2021. a
Su, B., Bi, X., Zhang, Z., Liang, Y., Song, C., Wang, T., Hu, Y., Li, L., Zhou, Z., Yan, J., Wang, X., and Zhang, G.: Enrichment of calcium in sea spray aerosol: insights from bulk measurements and individual particle analysis during the R/V Xuelong cruise in the summertime in Ross Sea, Antarctica, Atmos. Chem. Phys., 23, 10697–10711, https://doi.org/10.5194/acp-23-10697-2023, 2023. a
Subba, T., Lawler, M. J., and Steiner, A. L.: Estimation of Possible Primary Biological Particle Emissions and Rupture Events at the Southern Great Plains ARM Site, J. Geophys. Res.-Atmos., 126, e2021JD034679, 2021. a, b
Suphioglu, C., Singh, M., Taylor, P., Knox, R., Bellomo, R., Holmes, P., and Puy, R.: Mechanism of grass-pollen-induced asthma, Lancet, 339, 569–572, https://doi.org/10.1016/0140-6736(92)90864-Y, 1992. a, b
Tang, D., Wei, T., Yuan, J., Xia, H., and Dou, X.: Observation of bioaerosol transport using wideband integrated bioaerosol sensor and coherent Doppler lidar, Atmos. Meas. Tech., 15, 2819–2838, https://doi.org/10.5194/amt-15-2819-2022, 2022. a
Textor, C., Schulz, M., Guibert, S., Kinne, S., Balkanski, Y., Bauer, S., Berntsen, T., Berglen, T., Boucher, O., Chin, M., Dentener, F., Diehl, T., Easter, R., Feichter, H., Fillmore, D., Ghan, S., Ginoux, P., Gong, S., Grini, A., Hendricks, J., Horowitz, L., Huang, P., Isaksen, I., Iversen, I., Kloster, S., Koch, D., Kirkevåg, A., Kristjansson, J. E., Krol, M., Lauer, A., Lamarque, J. F., Liu, X., Montanaro, V., Myhre, G., Penner, J., Pitari, G., Reddy, S., Seland, Ø., Stier, P., Takemura, T., and Tie, X.: Analysis and quantification of the diversities of aerosol life cycles within AeroCom, Atmos. Chem. Phys., 6, 1777–1813, https://doi.org/10.5194/acp-6-1777-2006, 2006. a
Tobo, Y., DeMott, P. J., Hill, T. C. J., Prenni, A. J., Swoboda-Colberg, N. G., Franc, G. D., and Kreidenweis, S. M.: Organic matter matters for ice nuclei of agricultural soil origin, Atmos. Chem. Phys., 14, 8521–8531, https://doi.org/10.5194/acp-14-8521-2014, 2014. a, b
Tobo, Y., Adachi, K., DeMott, P. J., Hill, T. C. J., Hamilton, D. S., Mahowald, N. M., Nagatsuka, N., Ohata, S., Uetake, J., Kondo, Y., and Koike, M.: Glacially sourced dust as a potentially significant source of ice nucleating particles, Nat. Geosci., 12, 253–258, https://doi.org/10.1038/s41561-019-0314-x, 2019. a
Tobo, Y., Adachi, K., Kawai, K., Matsui, H., Ohata, S., Oshima, N., Kondo, Y., Hermansen, O., Uchida, M., Inoue, J., and Koike, M.: Surface warming in Svalbard may have led to increases in highly active ice-nucleating particles, Commun. Earth Environ., 5, 516, https://doi.org/10.1038/s43247-024-01677-0, 2024. a, b, c, d, e, f
Toprak, E. and Schnaiter, M.: Fluorescent biological aerosol particles measured with the Waveband Integrated Bioaerosol Sensor WIBS-4: laboratory tests combined with a one year field study, Atmos. Chem. Phys., 13, 225–243, https://doi.org/10.5194/acp-13-225-2013, 2013. a
Venkateswara, H. and Panchanathan, S., eds.: Introduction to Domain Adaptation, Springer International Publishing, Cham, pp. 3–21, https://doi.org/10.1007/978-3-030-45529-3_1, 2020. a
Vincenti, B., Paris, E., Carnevale, M., Palma, A., Guerriero, E., Borello, D., Paolini, V., and Gallucci, F.: Saccharides as Particulate Matter Tracers of Biomass Burning: A Review, Int. J. Env. Res. Pub. He., 19, https://doi.org/10.3390/ijerph19074387, 2022. a, b
Visez, N., Chassard, G., Azarkan, N., Naas, O., Sénéchal, H., Sutra, J.-P., Poncet, P., and Choël, M.: Wind-induced mechanical rupture of birch pollen: Potential implications for allergen dispersal, J. Aerosol Sci., 89, 77–84, https://doi.org/10.1016/j.jaerosci.2015.07.005, 2015. a
Winiwarter, W., Bauer, H., Caseiro, A., and Puxbaum, H.: Quantifying emissions of primary biological aerosol particle mass in Europe, Atmos. Environ., 43, 1403–1409, https://doi.org/10.1016/j.atmosenv.2008.01.037, 2009. a, b, c
Wolf, M. J., Goodell, M., Dong, E., Dove, L. A., Zhang, C., Franco, L. J., Shen, C., Rutkowski, E. G., Narducci, D. N., Mullen, S., Babbin, A. R., and Cziczo, D. J.: A link between the ice nucleation activity and the biogeochemistry of seawater, Atmos. Chem. Phys., 20, 15341–15356, https://doi.org/10.5194/acp-20-15341-2020, 2020. a
Wozniak, M. C., Solmon, F., and Steiner, A. L.: Pollen Rupture and Its Impact on Precipitation in Clean Continental Conditions, Geophys. Res. Lett., 45, 7156–7164, https://doi.org/10.1029/2018GL077692, 2018. a
Xu, J., He, J., Xu, H., Ji, D., Snape, C., Yu, H., Jia, C., Wang, C., and Gao, J.: Simultaneous measurement of multiple organic tracers in fine aerosols from biomass burning and fungal spores by HPLC-MS/MS, RSC Adv., 8, 34136–34150, https://doi.org/10.1039/C8RA04991B, 2018. a
Yttri, K. E.: ACTRIS, GAW-WDCA, EMEP, 2019–2021; Organic tracers at Zeppelin mountain (Ny-Ålesund), data hosted by EBAS at NILU, https://doi.org/10.48597/VYK3-XQEN (last access: 16 June 2025), 2023. a
Yttri, K. E., Simpson, D., Nøjgaard, J. K., Kristensen, K., Genberg, J., Stenström, K., Swietlicki, E., Hillamo, R., Aurela, M., Bauer, H., Offenberg, J. H., Jaoui, M., Dye, C., Eckhardt, S., Burkhart, J. F., Stohl, A., and Glasius, M.: Source apportionment of the summer time carbonaceous aerosol at Nordic rural background sites, Atmos. Chem. Phys., 11, 13339–13357, https://doi.org/10.5194/acp-11-13339-2011, 2011. a
Yttri, K. E., Schnelle-Kreis, J., Maenhaut, W., Abbaszade, G., Alves, C., Bjerke, A., Bonnier, N., Bossi, R., Claeys, M., Dye, C., Evtyugina, M., García-Gacio, D., Hillamo, R., Hoffer, A., Hyder, M., Iinuma, Y., Jaffrezo, J.-L., Kasper-Giebl, A., Kiss, G., López-Mahia, P. L., Pio, C., Piot, C., Ramirez-Santa-Cruz, C., Sciare, J., Teinilä, K., Vermeylen, R., Vicente, A., and Zimmermann, R.: An intercomparison study of analytical methods used for quantification of levoglucosan in ambient aerosol filter samples, Atmos. Meas. Tech., 8, 125–147, https://doi.org/10.5194/amt-8-125-2015, 2015. a
Yttri, K. E., Bäcklund, A., Conen, F., Eckhardt, S., Evangeliou, N., Fiebig, M., Kasper-Giebl, A., Gold, A., Gundersen, H., Myhre, C. L., Platt, S. M., Simpson, D., Surratt, J. D., Szidat, S., Rauber, M., Tørseth, K., Ytre-Eide, M. A., Zhang, Z., and Aas, W.: Composition and sources of carbonaceous aerosol in the European Arctic at Zeppelin Observatory, Svalbard (2017 to 2020), Atmos. Chem. Phys., 24, 2731–2758, https://doi.org/10.5194/acp-24-2731-2024, 2024. a, b
Yu, X., Wang, Z., Zhang, M., Kuhn, U., Xie, Z., Cheng, Y., Pöschl, U., and Su, H.: Ambient measurement of fluorescent aerosol particles with a WIBS in the Yangtze River Delta of China: potential impacts of combustion-related aerosol particles, Atmos. Chem. Phys., 16, 11337–11348, https://doi.org/10.5194/acp-16-11337-2016, 2016. a
Zangrando, R., Barbaro, E., Kirchgeorg, T., Vecchiato, M., Scalabrin, E., Radaelli, M., Đorđević, D., Barbante, C., and Gambaro, A.: Five primary sources of organic aerosols in the urban atmosphere of Belgrade (Serbia), Sci. Total Environ., 571, 1441–1453, https://doi.org/10.1016/j.scitotenv.2016.06.188, 2016. a
Zhang, H., Zheng, X., Xie, N., He, Z., Liu, J., Leung, N. L. C., Niu, Y., Huang, X., Wong, K. S., Kwok, R. T. K., Sung, H. H. Y., Williams, I. D., Qin, A., Lam, J. W. Y., and Tang, B. Z.: Why Do Simple Molecules with “Isolated” Phenyl Rings Emit Visible Light?, J. Am. Chem. Soc., 139, 16264–16272, https://doi.org/10.1021/jacs.7b08592, 2017. a
Zhang, H., Crawford, I., Song, C., Gallagher, M., Zheng, Z., Chan, M. N., Xing, S., Lee, H. B. M., and Topping, D.: Data-Driven Detection of Nocturnal Pollen Fragmentation Triggered by High Humidity in an Urban Environment, Environ. Sci. Technol., 59, 12763–12774, https://doi.org/10.1021/acs.est.4c13905, 2025. a
Zhao, X. and Liu, X.: Global Importance of Secondary Ice Production, Geophys. Res. Lett., 48, e2021GL092581, https://doi.org/10.1029/2021GL092581, 2021. a
Zimmermann, B.: Characterization of Pollen by Vibrational Spectroscopy, Appl. Spectrosc., 64, 1364–1373, https://doi.org/10.1366/000370210793561664, 2010. a
Zinke, J., Pereira Freitas, G., Foster, R. A., Zieger, P., Nilsson, E. D., Markuszewski, P., and Salter, M. E.: Quantification and characterization of primary biological aerosol particles and microbes aerosolized from Baltic seawater, Atmos. Chem. Phys., 24, 13413–13428, https://doi.org/10.5194/acp-24-13413-2024, 2024. a, b