
the Creative Commons Attribution 4.0 License.
the Creative Commons Attribution 4.0 License.
 | 17 Sep 2026
Subseasonal and spatial variability of biomass burning aerosol radiative properties observed over the Southeast Atlantic during ORACLES 2016–2018

Connor J. Flynn
Kristina Pistone
Samuel E. LeBlanc
K. Sebastian Schmidt
Hong Chen
Paquita Zuidema
Robert Wood
Jens Redemann
Biomass Burning Aerosols (BBA) are a source of uncertainty in climate simulations over the Southeast Atlantic. Following emission in Southern Africa, the BBA smoke plume overlies a stratocumulus cloud deck, resulting in aerosol-cloud-radiation interactions that are difficult to observe. During 2016–2018, NASA conducted the ORACLES (ObseRvations of Aerosols above CLouds and their intEractionS) airborne campaigns to constrain BBA uncertainty, employing 4STAR (Spectrometer for Sky-Scanning, Sun-Tracking Atmospheric Research) to retrieve aerosol properties. We use all three months of ORACLES 4STAR sky-scans to investigate the subseasonal variability of BBA radiative properties. Changes in Single Scattering Albedo (SSA) indicate increased scattering relative to extinction as the BBA emission season progresses. We attribute this aerosol brightening to changes in composition, rather than aerosol type, as our Absorption Ångström Exponent analysis provides no evidence for Brown Carbon contributions. SSA from our 4STAR sky-scans is compared against a 30 year climatology from 31 Southern African AERONET (AErosol RObotic NETwork) stations, showing consistent changes in aerosol scattering across land and sea. ORACLES in situ SSA is also examined spatially. Our latitudinal analysis indicates that the September decrease in SSA from 4STAR is affected by the southerly sampling of ORACLES 2016 compared to the other campaigns. Westward gradual increases and sharper decreases in SSA are attributed to late-transport aging processes identified by recent studies. These processes start further eastward in October, in conjunction with the southeastward shift in fires. Understanding these subseasonal and spatial changes in BBA radiative properties has implications for aerosol modelling and validation of satellite products.
- Article
(7695 KB) - Full-text XML
-
Supplement
(2435 KB) - BibTeX
- EndNote


The Southeast Atlantic Ocean (SEA) is a region with a high degree of uncertainty regarding aerosol-radiation and aerosol-cloud interactions (Meyer et al., 2013; de Graaf et al., 2014; Mallet et al., 2020; Brown et al., 2021; Che et al., 2021). A major reason for this is the difficulty involved with observing aerosols in the region, especially due to the presence of a semi-permanent subtropical stratocumulus cloud deck (Sakaeda et al., 2011; Waquet et al., 2013). Satellite-based aerosol retrievals, such as those employed by MODIS (MODerate resolution Imaging Spectroradiometer) onboard the NASA Aqua and Terra satellites, are limited by their simplified reflectance-based atmospheric retrieval algorithms when applied to complex atmospheric conditions. In the case of the SEA, aerosol smoke plumes overlie the stratocumulus cloud deck, making it difficult for satellites to discern the above-cloud aerosol properties (Jethva et al., 2024).
The remoteness of the SEA also makes it difficult to employ ground-based observations within the region. AERONET (AErosol RObotic NETwork), a global confederated network of ground-based Cimel sun/sky photometers for the observation of columnar aerosol properties (Holben et al., 1998), is limited to just three stations in the SEA – Ascension Island, St. Helena, and São Tomé. As such, three widely spaced stations yield insufficient resolution to capture most smoke events in the region. As part of the international concerted efforts to study the aerosol-cloud system over the SEA, many AERONET stations within the aerosol source region of Southern Africa were established (Redemann et al., 2021), but the network still has sizeable gaps. The first AERONET station in Southern Africa was established in Mongu, Zambia (15.25° S, 23.15° E) in 1995, recently allowing for a full thirty-year aerosol climatology of that region for the first time. Thus, airborne campaigns provide a critical link for studying aerosols over the SEA by synergizing with other insights from ground-based measurements and satellite-based observing systems (Zuidema et al., 2016; Zuidema et al., 2018; Formenti et al., 2019; Haywood et al., 2021; Redemann et al., 2021).
ORACLES (ObseRvations of Aerosols above CLouds and their intEractionS) was a NASA Earth Venture Suborbital field campaign to study Biomass Burning Aerosols (BBA) over the SEA from 2016–2018 (Redemann et al., 2021), using a suite of instruments aboard a P-3 Orion aircraft (2016–2018) and a high-flying ER-2 aircraft (2016 only). One of the instruments deployed on the P-3 aircraft was 4STAR (Spectrometer for Sky-Scanning, Sun-Tracking Atmospheric Research), a sun/sky spectrophotometer for retrieving columnar aerosol radiative properties (Pistone et al., 2019; LeBlanc et al., 2020), serving as an airborne complement to ground-based AERONET retrievals. 4STAR sky-scans from ORACLES have also proven quite useful for satellite validation of above-cloud aerosol properties. Jethva et al. (2024) compared Single Scattering Albedo (SSA) from ORACLES 4STAR sky-scans against satellite retrievals from MODIS and OMI (Ozone Monitoring Instrument). They found that satellite observations overestimated SSA by about 0.05 in September 2016 compared to 4STAR, but reducing near-UV absorption in the aerosol model improved SSA agreement by 0.02. The campaigns were approximately a month long each and occurred during August 2017, September 2016, and October 2018, collectively covering the peak of Southern Africa's BBA emission season (Queface et al., 2011), which contributes approximately 35 % of global BBA emissions (van der Werf et al., 2010; Granier et al., 2011). In 2016, ORACLES was based out of Walvis Bay, Namibia, while in 2017 and 2018, it was based out of São Tomé (Fig. 1). BBA smoke plumes are transported from mainland Africa to the SEA by the Southern African Easterly Jet (Adebiyi and Zuidema, 2016; Holanda et al., 2020), with a maximum jet strength at 3 km in August and 4 km in September and October (Ryoo et al., 2021). Once over the SEA, the BBA overlies and interacts with a semi-permanent subtropical stratocumulus cloud deck (Sakaeda et al., 2011; Wilcox, 2012; Waquet et al., 2013).
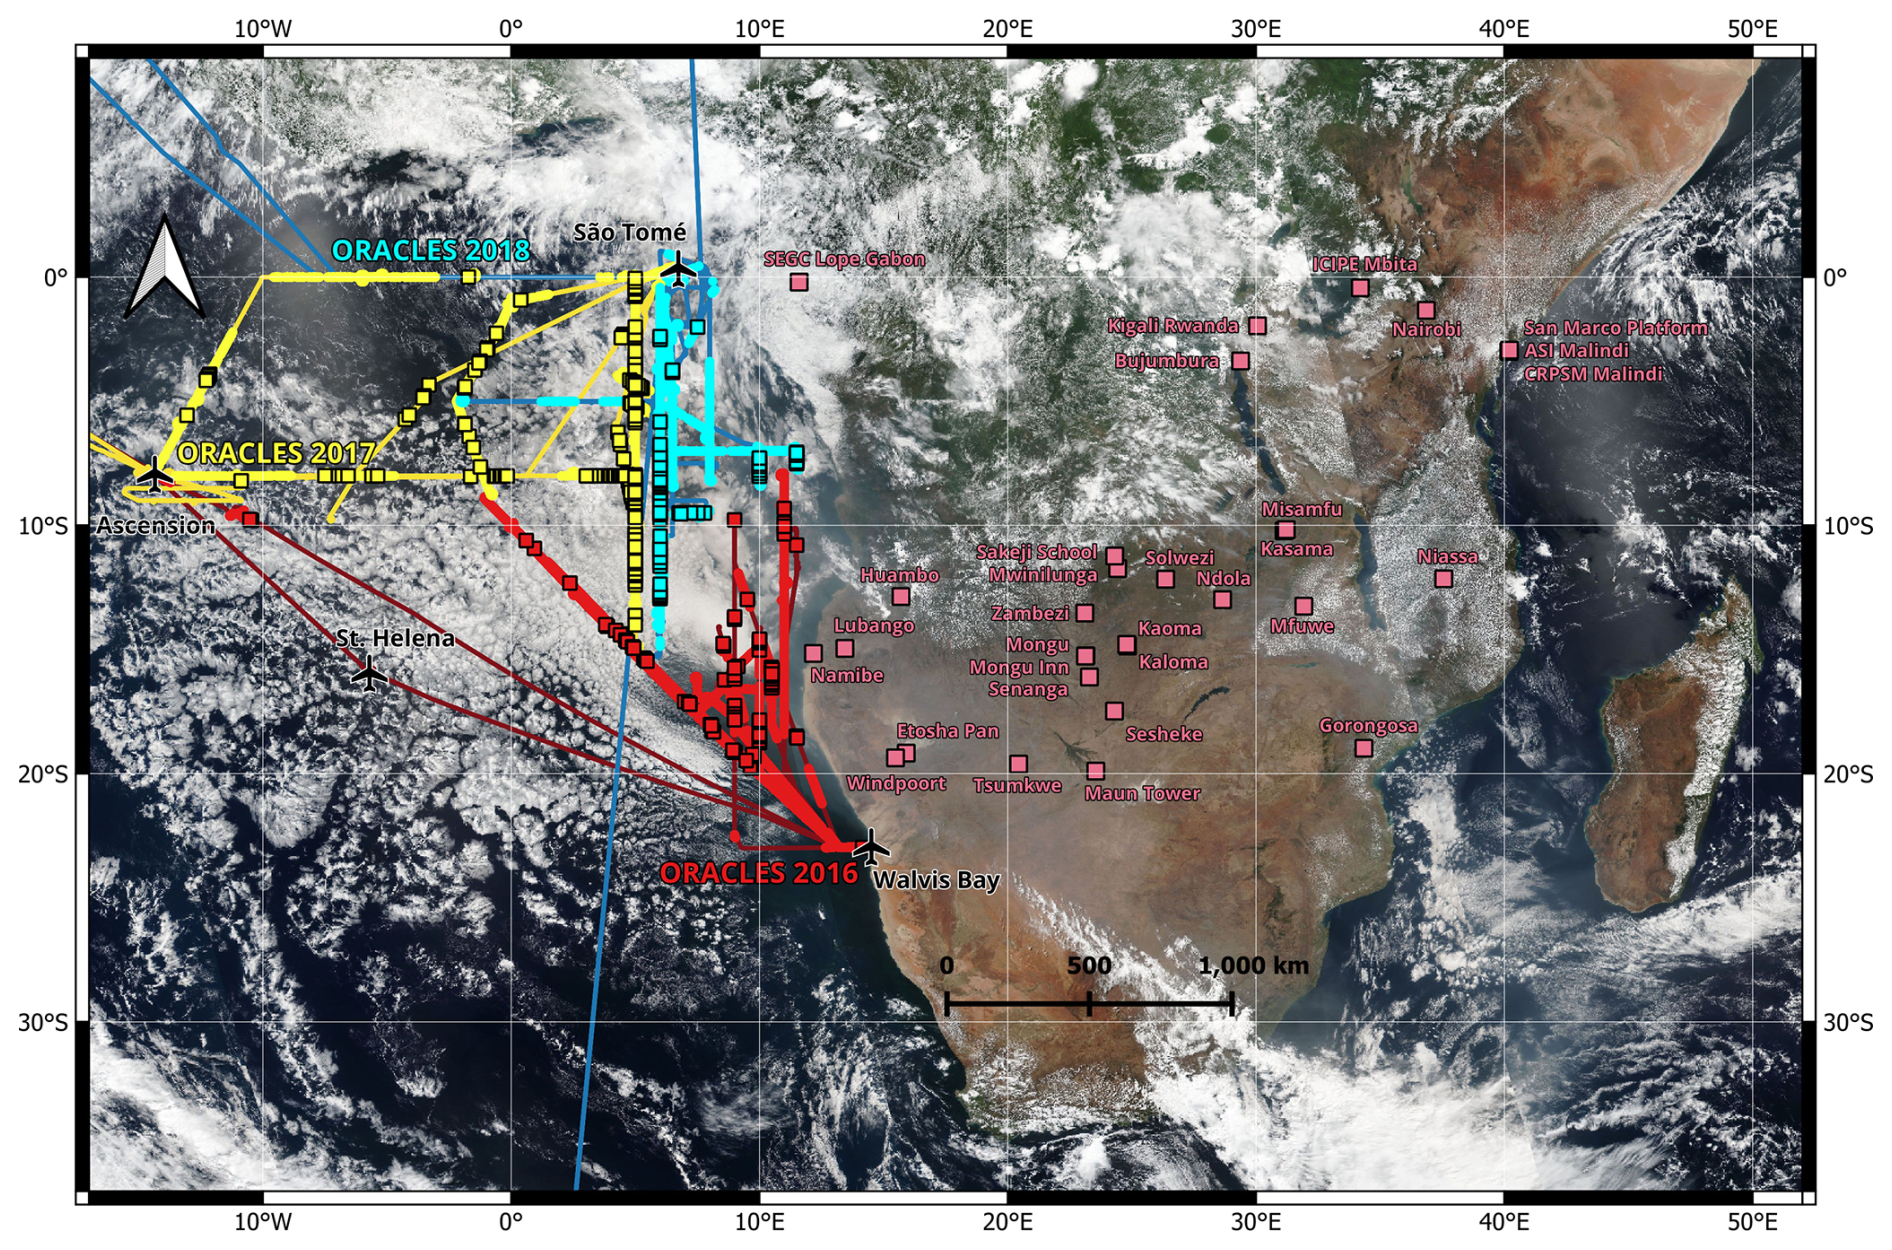
Figure 1The ORACLES 2016–2018 P-3 flight paths over the Southeast Atlantic and the 31 AERONET stations in Southern Africa utilized in this study. ORACLES flight paths are dark lines colored by campaign, with brighter circles for valid in situ measurements and brighter squares for valid 4STAR sky-scans. Pink squares represent AERONET stations. The ORACLES headquarters in Walvis Bay, Namibia (2016) and São Tomé (2017–2018), as well as refuelling stations at St. Helena and Ascension Island are highlighted using airplane symbols. ORACLES 2018 data was transposed 1° eastward as to distinguish it from ORACLES 2017 data, making the north–south transit leg at 5° E visible for both campaigns. Satellite imagery is true color corrected reflectance from the VIIRS (Visible Infrared Imaging Radiometer Suite) aboard the NASA/NOAA Suomi satellite for 12 September 2016, courtesy of NASA Worldview.
There is remarkably little interannual variability in Southern African fires due to the consistency of agricultural burning practices in the region (van der Werf et al., 2010; Redemann et al., 2021). Using the 18 year (2001–2018) European Space Agency Fire Climate Change Initiative, version 5.1 (FireCCI51) dataset derived from MODIS aboard the NASA Terra satellite, Chuvieco et al. (2021) found that Southern Africa had the smallest interannual variability in burned area in the world, with a coefficient of variation<0.5 across the region. Ryoo et al. (2021) documented the interannual variability in meteorological conditions over the Southeast Atlantic, finding that wind velocity, relative humidity, and precipitation were near climatological averages for August 2017, September 2016, and October 2018. They also found that despite sea surface temperatures during the ORACLES campaign months being 0.2–0.4 K above climatological averages, they did not have a systematic effect on low-level cloud fraction. A type of interannual variability that is less constrained is above-cloud Aerosol Optical Depth (AOD), with the August 2017 plume being moderately weaker, the September 2016 plume being slightly weaker, and the October 2018 plume being slightly stronger than climatological averages (Redemann et al., 2021). As such, the results of this study are dependent upon the differing strengths of the smoke plume observed during each ORACLES campaign year.
BBA is the largest global source of carbonaceous aerosols (Bowman et al., 2009) and can be composed of strongly absorbing elemental aerosols called Black Carbon (BC), less-absorbing organic aerosols called Brown Carbon (BrC), and non-absorbing Organic Carbon (OC). The full extent of BrC's contribution to both global and regional BBA absorption is the subject of ongoing research (Andreae and Gelencsér, 2006; Zhang et al., 2020). Previous studies have concluded that little BrC is present over the SEA (Denjean et al., 2020; Taylor et al., 2020; Wu et al., 2020; Dobracki et al., 2023, 2025), with Taylor et al. (2020) estimating that BrC only accounted for 9 %–11 % of absorption at 405 nm. Using TEM-EDX (Transmission Electron Microscopy-Energy Dispersive X-ray spectroscopy) and an assumed BC refractive index, Zhang et al. (2022) determined that BrC could contribute 8 %–22 % of total aerosol absorption at 470 nm. However, their BrC estimate is much lower using the Absorption Ångström Exponent (AAE) attribution method, at only 2 %–6 % of total aerosol absorption at 470 nm, indicating that spectroscopy could reveal a greater BrC presence over the Southeast Atlantic than suggested by optical methods. However, many studies lack optical measurements within the UV spectrum, where BrC absorption is greatest, allowing questions regarding the potential presence of BrC to persist.
Absorbing aerosols cause a decrease in environmental albedo that is strongest over brighter surfaces, while non-absorbing aerosols cause an increase in environmental albedo over darker surfaces (Bellouin et al., 2020). Absorbing aerosols generally cause negative radiative forcing (cooling) over the SEA in cloudless conditions but can cause positive radiative forcing (warming) when above a stratocumulus cloud deck (Keil and Haywood, 2003; Chand et al., 2009). BBA interactions with the stratocumulus cloud deck over the SEA are considered a major source of uncertainty for climate modelling of the region (Stier et al., 2013; Zuidema et al., 2016; Haywood et al., 2021; Doherty et al., 2022), in that models show a large spread in predictions and exhibit significant discrepancies relative to observations.
The goal of this study is to determine the subseasonal changes in BBA radiative properties that occurred in ORACLES 2016–2018, within the Southern African BBA emission season of August–October. We examine SSA and AOD, the two aerosol properties most pertinent to modellers, but also discuss Aerosol Absorption Optical Depth (AAOD), Extinction Ångström Exponent (EAE), AAE, and complex refractive indices as well, for a comprehensive view of aerosol radiative changes. SSA from airborne 4STAR sky-scans and in situ measurements are compared to assess agreement within the ORACLES 2016–2018 campaigns regarding any apparent subseasonal trends. We also conduct spatial analyses (including latitudinal, longitudinal, and altitudinal) on the in situ SSA data, as to further isolate subseasonal variability from other effects due to chemical and physical processing. The spatial analyses will help to explain apparent discrepancies between datasets, as each ORACLES campaign differs in the latitudes, longitudes, and altitudes sampled. SSA and AOD from ORACLES are also compared against AERONET, allowing for comparison of the BBA radiative properties from the SEA study region and the Southern African source region, as well as a comparison against a full aerosol climatology for the first time.
2.1 4STAR
4STAR is a sun/sky spectrophotometer measuring direct beam solar irradiances and diffuse sky radiances (Dunagan et al., 2013), designed as an airborne complement to ground-based AERONET Cimel instruments. During ORACLES, 4STAR was mounted to the top of the NASA P-3 Orion aircraft, where it observed above-cloud, below-plume columnar aerosol radiative properties (Pistone et al., 2019; LeBlanc et al., 2020). 4STAR also features hyperspectral resolution measurements that permit the retrieval of some gas species (Segal-Rozenheimer et al., 2014). Direct solar irradiances and diffuse sky radiances measured by 4STAR, along with flight-level albedo calculated from SSFR (Solar Spectral Flux Radiometer) measurements of nadir upwelling and zenith downwelling spectral irradiances (Coddington et al., 2008; Schmidt and Pilewskie, 2012; Cochrane et al., 2019, 2021, 2022; Schmidt et al., 2021), are used as inputs in an aerosol inversion code adapted from AERONET version 2.0 (Holben et al., 2006, 1998; Dubovik and King, 2000) for airborne use. This code allows us to retrieve aerosol radiative properties from 4STAR and SSFR measurements, including SSA, AOD, AAOD, EAE, AAE, RRI, and IRI. SSA, the ratio of aerosol scattering to total aerosol extinction, is one of the most important variables for determining an aerosol's radiative impacts (Takemura et al., 2002; Bergstrom et al., 2007; Moosmüller et al., 2012). The SSA of BBA emitted from Southern Africa can quickly evolve (Abel et al., 2003), requiring highly accurate observations, preferably over the full aerosol life cycle. AOD measures the columnar extinction of light by aerosols, while AAOD measures the columnar absorption of light by aerosols. EAE is the spectral dependence of AOD, with AAE being the spectral dependence of AAOD. The complex refractive indices are one of the primary outputs of the 4STAR retrievals, which are used to iteratively reduce retrieval errors, with the RRI representing aerosol scattering and IRI representing aerosol absorption. 4STAR sky radiance measurements were calibrated in the laboratory using an NIST (National Institute of Standards and Technology) referenceable 12-lamp 36 in. (91.44 cm) integrating sphere (Brown et al., 2005). Whereas 4STAR direct beam measurements were calibrated via refined Langley regressions (Schmid and Wehrli, 1995) conducted at Mauna Loa Observatory, before and after deployment (LeBlanc et al., 2020; Mitchell et al., 2025).
We utilized 4STAR sky-scans to determine columnar aerosol properties for ORACLES 2016–2018. Our Quality Control (QC) criteria for archival in the NASA ASDC (Atmospheric Science Data Center) repository were:
-
AOD (400 nm) >0.2,
-
altitude difference<50 m,
-
mean sky radiance error ,
-
minimum scattering angle<6°,
-
maximum scattering angle>50°,
-
mean scattering angle difference<3°,
-
maximum scattering angle difference<10°,
-
covariance matrix sky error<10 %,
-
roll standard deviation<3°, and
-
passes the retrieval boundary test.
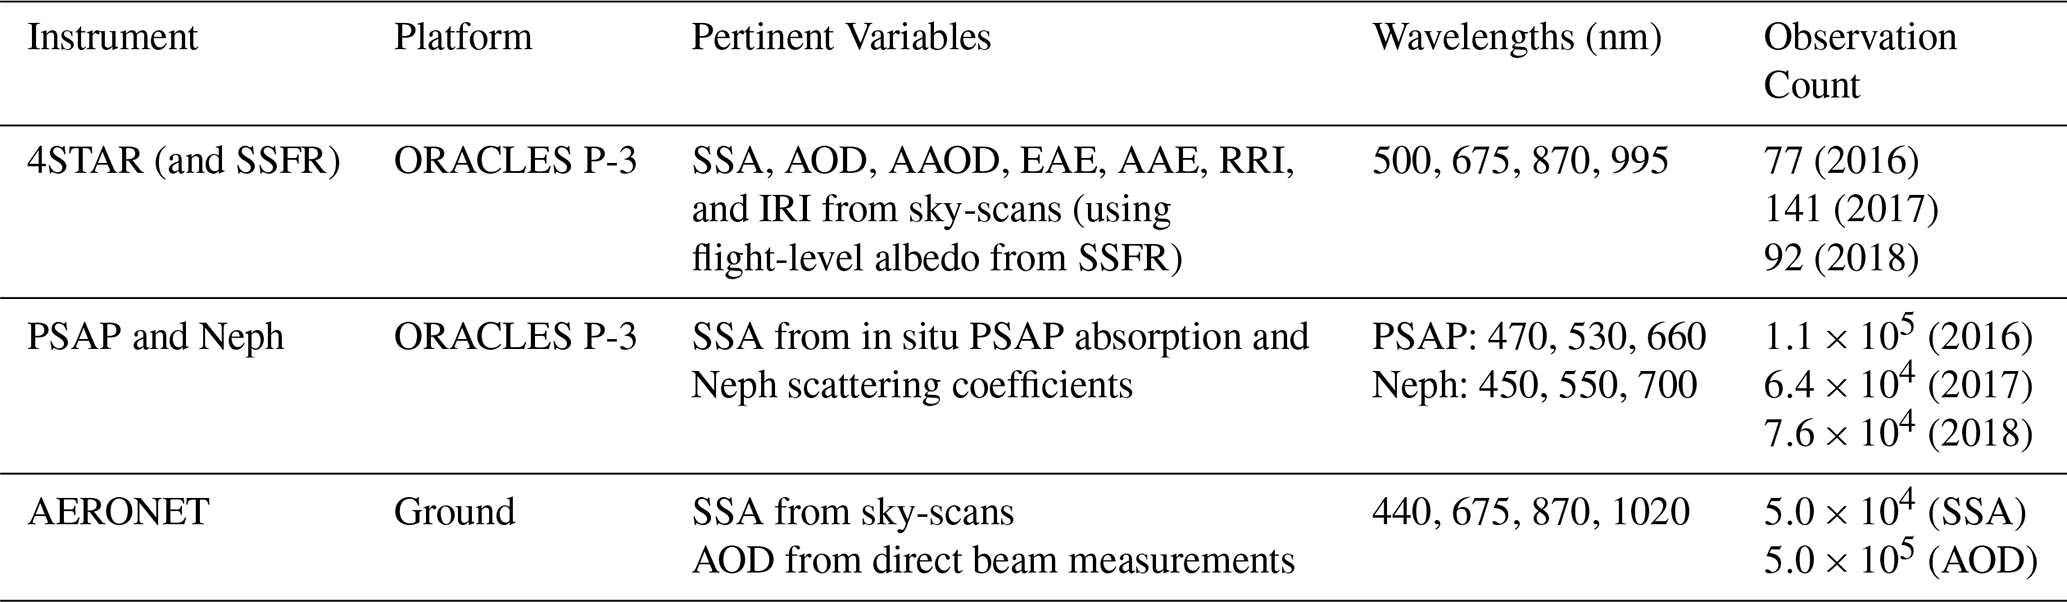
Criteria (6) and (7) are only considered over the critical scattering angle range of 3.5–30°. For this study, we additionally required that all sky-scans were taken from flight altitudes below 3 km, as to best ensure the full column of the smoke plume was observed. These sky-scans retrieve at four wavelengths (500, 675, 870, 995 nm), differing slightly from the five-wavelength set (400, 500, 675, 870, 995 nm) used by Pistone et al. (2019). We excluded 400 nm due to the presence of an instrument artifact (Mitchell et al., 2025) that affected wavelengths near 420 nm in 2017 and 2018. For uniformity, this was applied to ORACLES 2016 as well. These sky-scans are the T0_2016_4wl, R0_2017_4wl, and R0_2018_4wl datasets meeting Selection #2 criteria, as described in Table 2 of Mitchell et al. (2025). The 4STAR sky-scans are summarized in Table 1, along with comparable in situ measurements and ground-based AERONET observations, which are also detailed in the following sections.
Table 1The instruments and variables used in this study, along with their reporting wavelengths and valid observation counts. The PSAP (Particle Soot Absorption Photometer) and Neph (Nephelometer) SSA observation counts are following the interpolation of scattering coefficients from the Neph wavelengths (450, 550, 700 nm) to the PSAP wavelengths (470, 530, 660 nm). The given PSAP & Neph observation count is for 530 nm, with slightly more measurements at 470 nm, and slightly fewer at 660 nm. The AERONET observation counts are from the 31 Southern African stations displayed in Fig. 1, from 1 July–31 October, for 1995–2025.
2.2 In Situ Measurements
During ORACLES, in situ instruments aboard the P-3 Orion aircraft were operated by the HIGEAR (Hawaii Group for Environmental Aerosol Research) team. This includes two TSI 3563 nephelometers (Nephs), which determine in situ aerosol scattering of light. Scattering coefficients are measured at three wavelengths (450, 550, 700 nm) using Anderson and Ogren (1998) corrections that account for Scattering Ångström Exponent (SAE) and depend upon both wavelength and the presence/lack of a submicron impactor. Two Radiance Research PSAPs (Particle Soot Absorption Photometers), also operated by HIGEAR aboard the P-3 aircraft, were used to determine in situ aerosol light absorption. Absorption coefficients are measured at three wavelengths (470, 530, 660 nm) using Virkkula (2010) wavelength-averaged corrections from the fittings of transmission correction functions, black aerosol experiments, and ammonium sulfate experiments.
A newly processed in situ SSA dataset for ORACLES 2016–2018 was also used in this study. SSA was calculated from 1 Hz Neph scattering coefficients (σscat) and PSAP absorption coefficients (σabs) that had been subjected to a 10 s rolling average. A scattering coefficient screening of was applied per wavelength to reduce statistical noise, such that SSA470 requires , SSA530 requires , and SSA660 requires . Additional screenings were also applied to target the free-tropospheric BBA smoke plume (carbon monoxide concentrations>130 ppbv and altitude>1.5 km) allowing for comparison with 4STAR. BBA is the dominant aerosol present in the free troposphere over the SEA, but it may be mixed with or dominated by sea salt aerosols within the boundary layer (Dang et al., 2022), warranting the latter's exclusion. Due to the 10 s rolling average, when using the in situ data for statistical analyses, we assume that the number of independent samples is one tenth of the observation count. Given that the typical ORACLES sampling speed of the NASA P-3 Orion aircraft was ∼382 km per hour, this results in a spatial resolution of about 1.1 km per independent sample.
The ORACLES campaigns span 9 August–2 September 2017, 27 August–27 September 2016, and 24 September–25 October 2018. For simplicity, we will often summarize the ORACLES 4STAR and in situ data per campaign, which we will refer to as “months”, as most research flights occurred in August 2017, September 2016, and October 2018, respectively. For valid 4STAR retrievals, only one research flight was outside of the primary month per campaign. It is a similar case for valid in situ measurements, except that ORACLES 2018 had two research flights outside of the primary month.
2.3 AERONET
AERONET cloud-screened (level 1.5) AOD from direct beam measurements and SSA from almucantar and hybrid sky-scans (Giles et al., 2019; Sinyuk et al., 2020) were obtained for 31 Southern African stations (Fig. 1) for 1995–2025 to represent an aerosol climatology of ground-based measurements of similar data quality to 4STAR. The primary purpose of analyzing the climatology is to assess the representativeness of the three-year ORACLES period. This dataset was then limited to 2016–2018, so that just the concurrent ORACLES years could be compared as well, which contains approximately 31 % of the data within the full climatology.
When selecting AERONET stations, we limited the latitudinal range to 0–20° S, targeting only the near-source AERONET stations upwind of the SEA, while aiming to avoid any anticyclonic recirculations that transport BBA back towards the southerly latitudes of mainland Africa (Adebiyi and Zuidema, 2016; Redemann et al., 2021). These latitudinal restrictions were not applied to ORACLES 2016 in situ data so that its full latitudinal dependence could be observed, while only one valid 4STAR sky-scan occurred south of 20° S.
3.1 SSA Subseasonal Analysis
4STAR radiative properties, including SSA, AOD, AAOD, EAE, AAE, and complex refractive indices, are organized by ORACLES campaign month (August 2017, September 2016, October 2018) and box-plotted to illustrate their subseasonal variabilities. All four wavelengths are displayed within each campaign, so that their spectral dependence can also be observed. For SSA, in situ measurements at all three PSAP wavelengths are also included.
Both 4STAR retrievals and in situ measurements exhibit an increase in median SSA over the course of the BBA emission season (Fig. 2), with the increase from August–October ranging from +0.02 at longer wavelengths to +0.04 at shorter wavelengths. 4STAR displays a decrease in SSA medians from August–September not found in the in situ data, which we address later using spatial analyses. The 4STAR SSA variability of 0.79−0.95 at 500 nm for ORACLES 2017 aligns with that found by Cochrane et al. (2021) using an SSFR absorption-derived method. Applying a two-sample Wilcoxon rank sum test (which determines the equality of medians for samples from continuous distributions of comparable shapes) to the in situ data (reduced to the independent sample size by subsampling every 10 s after the first value) yields p-values <0.001 for both monthly transitions (August–September and September–October) at all three PSAP wavelengths, indicating a strongly significant increase through the season. Applying the same test to the 4STAR sky-scans for the transition from August–September yields p-values <0.05 at 500 and 675 nm, with p-values of 0.17 and 0.07 at 870 and 995 nm, while September–October yields p-values <0.001 at all four 4STAR wavelengths. This indicates that the August–September decrease only recorded by 4STAR is not statistically significant at the longer wavelengths, whereas the September–October increase is strongly significant like that found in the in situ data.
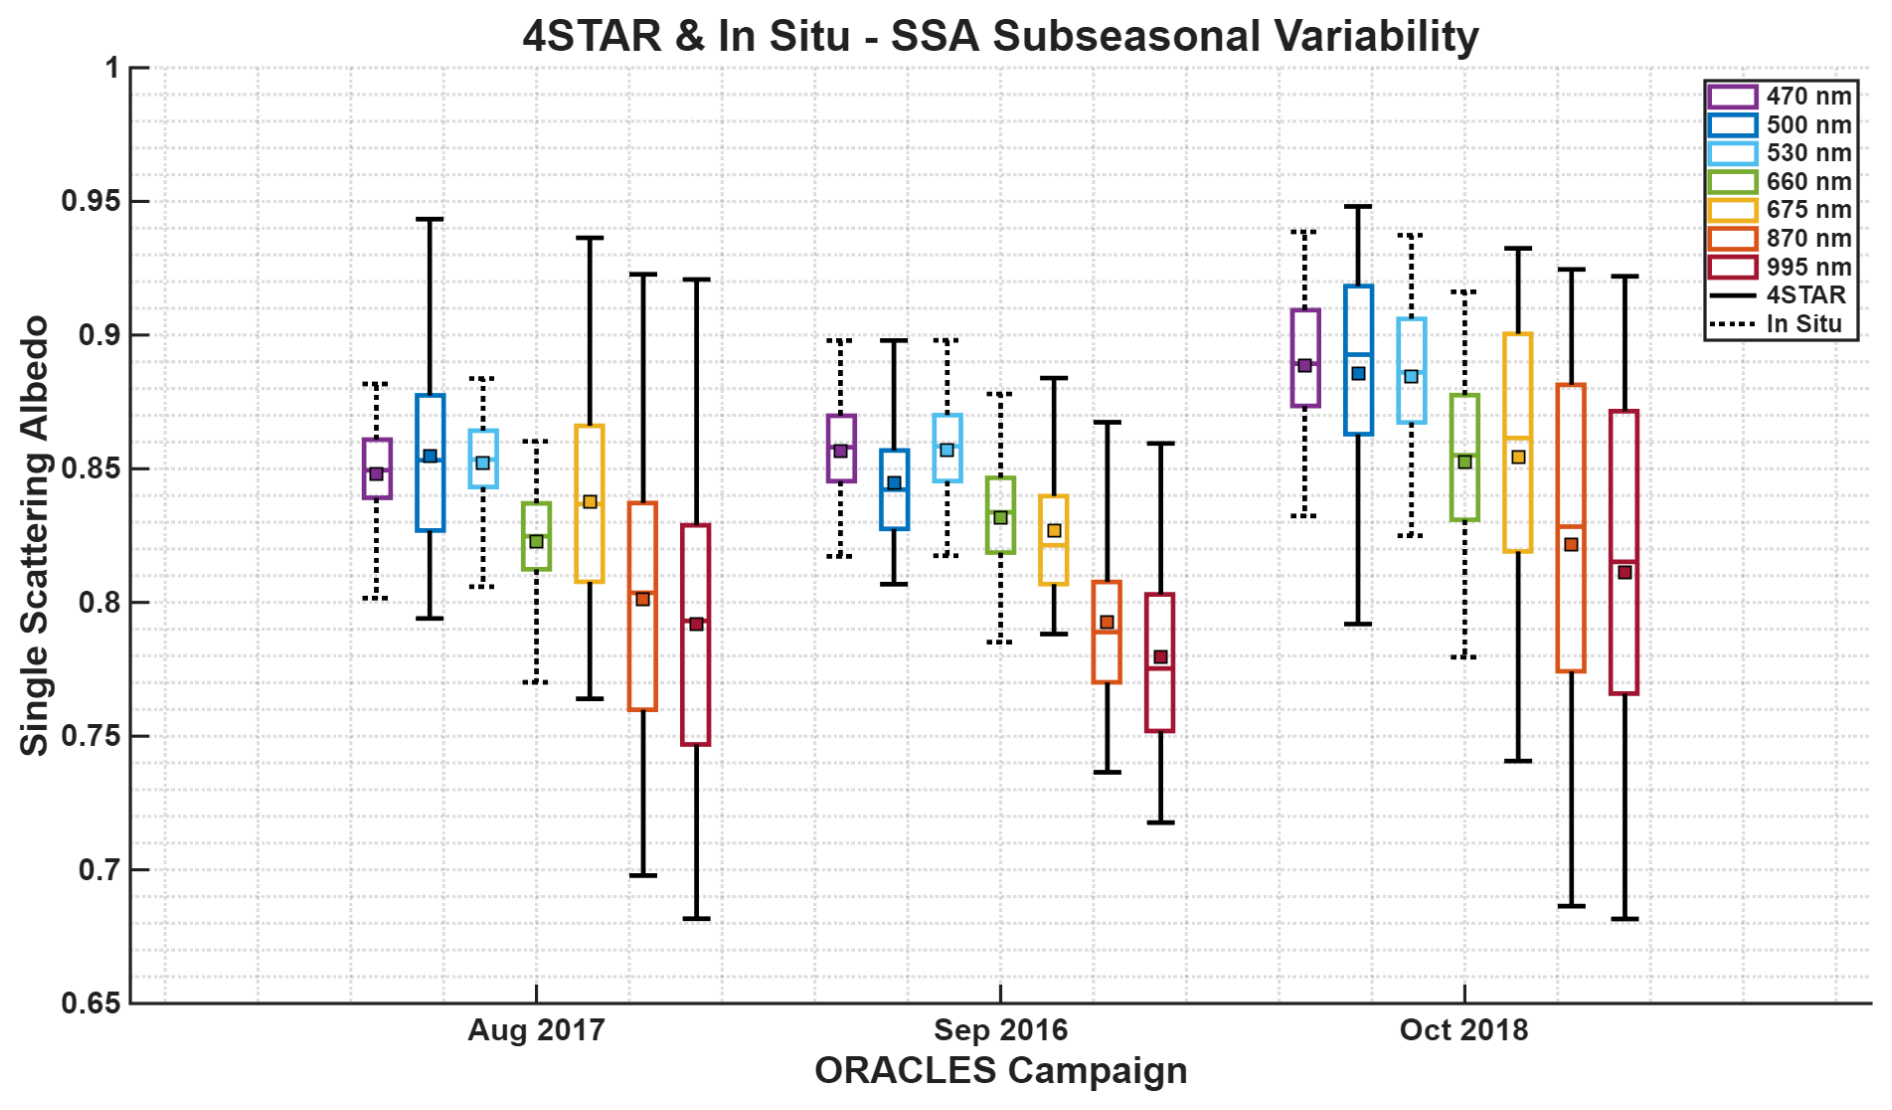
Figure 2Subseasonal variability of 4STAR (solid) and in situ (dashed) SSA from ORACLES 2016–2018. Boxes show the interquartile range, while whiskers extend to the 5th and 95th percentiles. Central lines are medians and squares are means.
This shows an increase in scattering relative to total extinction, suggesting aerosol brightening as the season progresses. An SSA increase of this magnitude has a complex and significant impact on variables related to aerosol-radiation interactions, including the Direct Aerosol Radiative Effect (DARE) and heating rates, so it needs to be properly accounted for in aerosol models. An increase in mid-visible median SSA from 0.84 in August to 0.88 in October can cause critical albedo (the scene albedo whereby an overlying aerosol layer switches from warming to cooling) to increase from 0.23–0.27 (Cochrane et al., 2021). The critical albedo's sensitivity to SSA is particularly important for clear and partially cloudy conditions with flight-level albedos less than 0.25, with heightened SSA in October decreasing the chances for aerosol warming. This implies that heightened SSA in October is likely to weaken DARE and reduce heating rate efficiency aloft (Cochrane et al., 2022), which in turn, would decrease atmospheric stability. This SSA increase has been noted by previous studies and is likely linked to the southeastward shift in fires (Eck et al., 2013; Redemann et al., 2021; Choi et al., 2024; Tatro and Zuidema, 2025), although the exact physical cause has been unclear.
3.2 AOD and AAOD Subseasonal Analysis
At 500 nm, median AOD (and standard deviations) increases from 0.36 in August to a peak of 0.40 in September, then decreases to 0.31 in October, with similar relative changes at longer wavelengths (Fig. 3). Applying a two-sample Wilcoxon rank sum test to AOD, the transition from August–September yields p-values <0.05, while September–October yields p-values <0.001 (both considering all four wavelengths). This indicates that the August to September AOD increase is moderately significant, whereas the September–October decrease is strongly significant. Although burned area in Southern Africa peaks in August, previous studies have found that persistent aerosol accumulation in the atmosphere delays the peak in aerosol loading until September (Eck et al., 2013; Adebiyi et al., 2015; Redemann et al., 2021; Tatro and Zuidema, 2025). 4STAR AOD being greatest in September reflects these previous findings, but the transition from August is less dramatic, likely due to the lack of sampling in early August, when AOD would be lower.
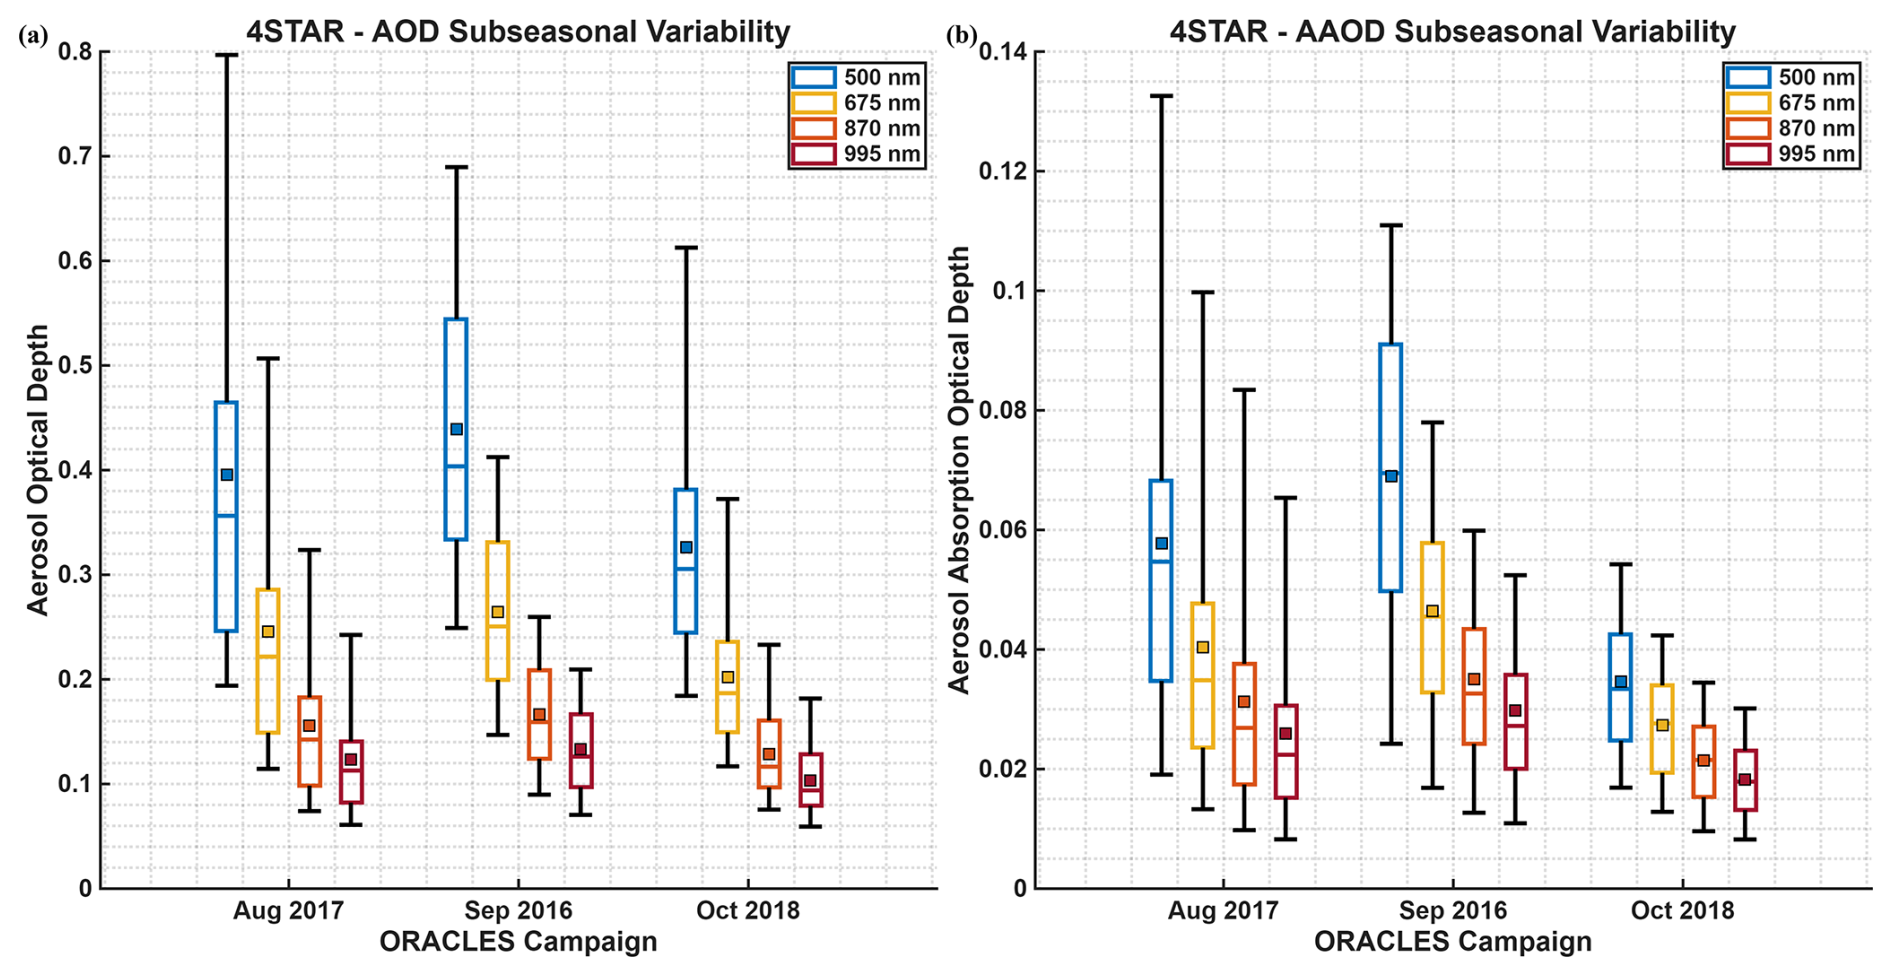
Figure 3Subseasonal variability of 4STAR (a) AOD and (b) AAOD from ORACLES 2016–2018. Boxes show the interquartile range, while whiskers extend to the 5th and 95th percentiles. Central lines are medians and squares are means.
AAOD parallels the trend in AOD, with median values at 500 nm of 0.055 in August, 0.069 in September, and 0.033 in October, which is again reflected at longer wavelengths as well. Applying the two-sample Wilcoxon rank sum test to AAOD, the transition from August–September yields p-values <0.005, while September–October yields p-values <0.001 (again considering all four wavelengths). This indicates that the initial AAOD increase is strongly significant, while the subsequent AAOD decrease has even greater significance. The similarity to the AOD trend is somewhat unsurprising, as AAOD is also an extensive property and thus dependent upon aerosol loading, but the correlated behavior suggests that there is not a significant change in aerosol type, which will be further verified using EAE and AAE in the next section. The decrease in AAOD from September–October is concurrent with the SSA increase from Fig. 2, indicating an absorption decrease coincident with the aerosol brightening.
3.3 EAE and AAE Subseasonal Analysis
EAE and AAE were calculated by performing log-log spectral linear regressions of AOD and AAOD, respectively, using all four wavelengths (500, 675, 870, 995 nm) as input. The EAE campaign medians are centered near 1.73 (Fig. 4), with about 90 % of the total distribution falling within the 1.5–2.0 range, indicating fine aerosols (Schuster et al., 2006). There is greater variability within the AAE distributions, which is expected given its sensitivity to the much smaller absorption component. The AAE interquartile ranges are about 1.05–1.35 for August and September, which drops to 0.8–1.1 in October, remaining within the typical AAE range of BC throughout the season (Liu et al., 2018). If the aerosol brightening in October were caused by increased BrC contributions, then we would expect the AAE to increase, rather than decrease (Russell et al., 2010). This is complemented by BC and OC columnar mass densities from MERRA-2 (Modern-Era Retrospective analysis for Research and Applications, version 2) reanalysis (Fig. S1 in the Supplement), where the BC:OC ratio remains near 1:10 throughout the ORACLES campaign months, suggesting limited change in bulk carbonaceous aerosol partitioning.
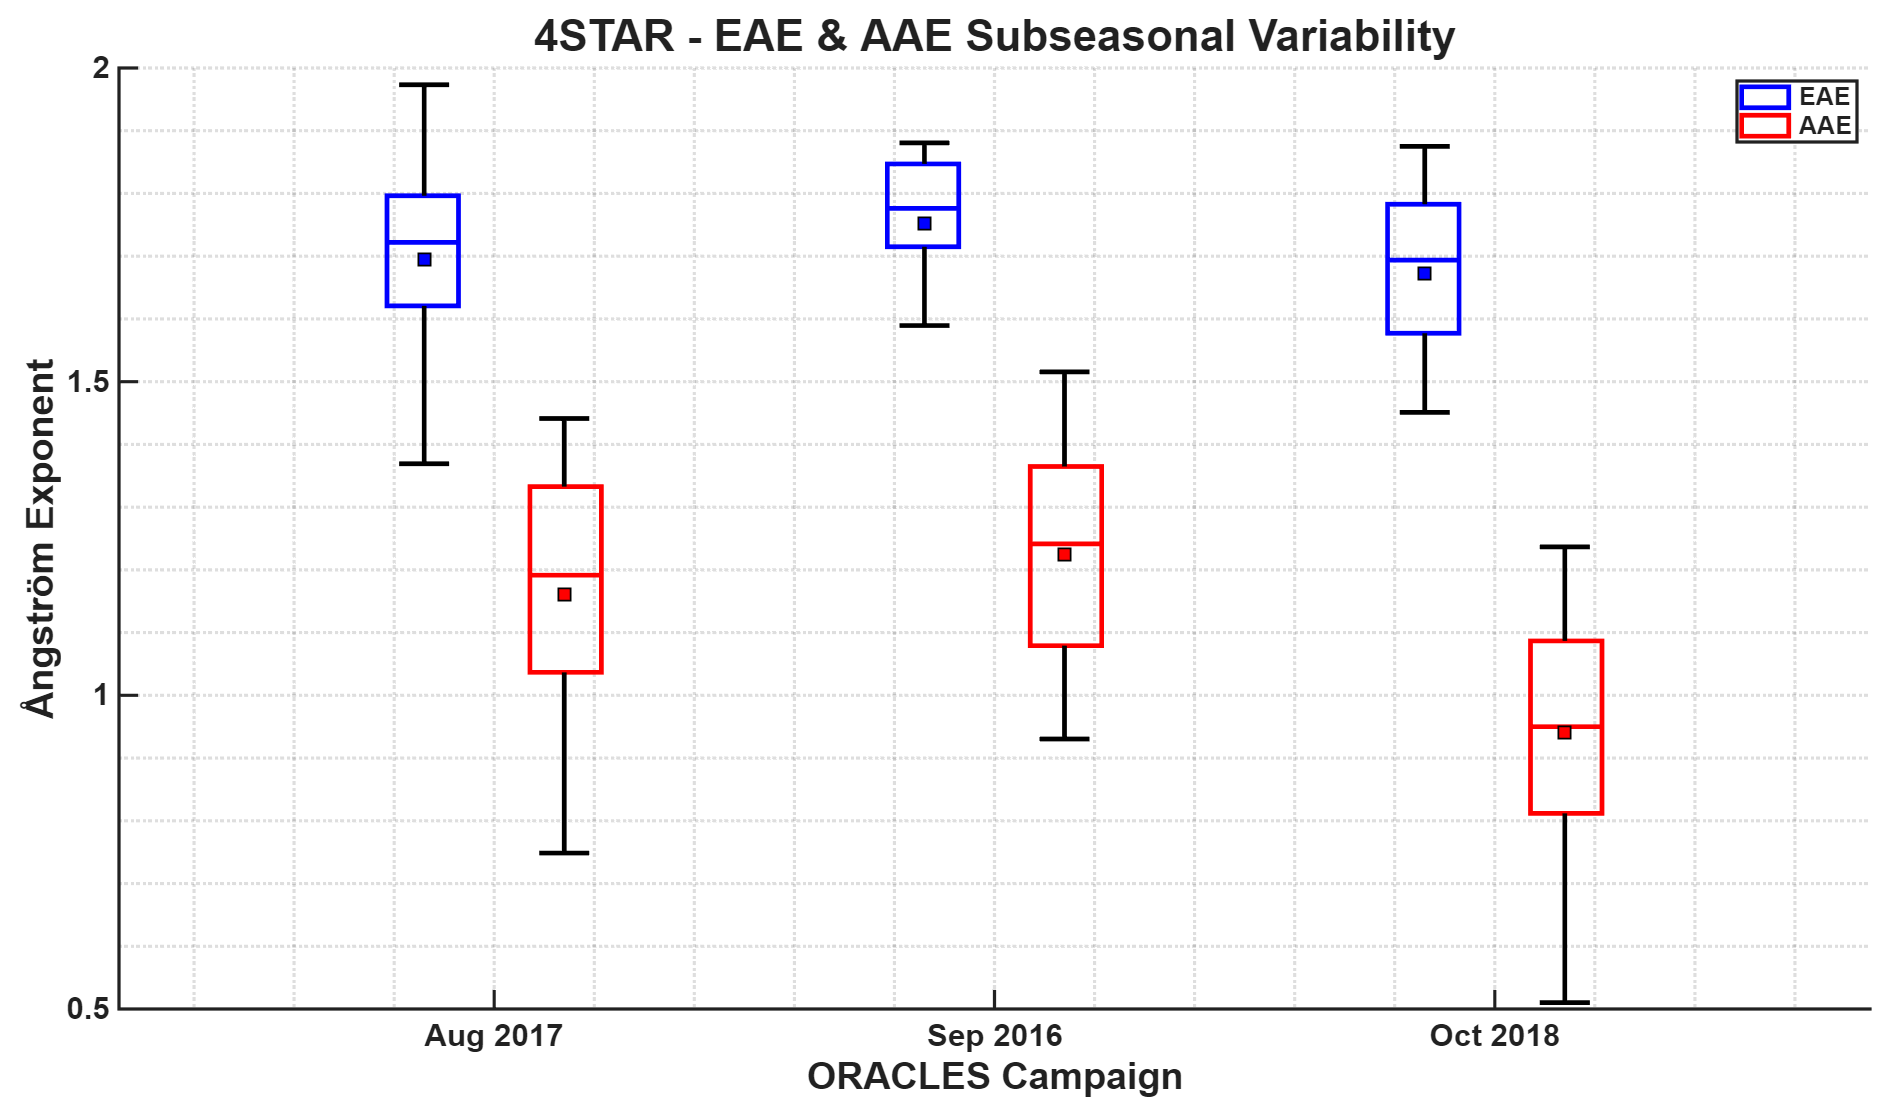
Figure 4Subseasonal variability of 4STAR EAE (blue) and AAE (red) from ORACLES 2016–2018. Boxes show the interquartile range, while whiskers extend to the 5th and 95th percentiles. Central lines are medians and squares are means.
We cannot fully discount the presence of BrC, as this study was unable to directly examine the UV wavelengths best absorbed by BrC (Alexander et al., 2008). Previous studies were also unable to conclusively identify BrC over the Southeast Atlantic through optical methods (Denjean et al., 2020; Taylor et al., 2020; Wu et al., 2020; Dobracki et al., 2023, 2025), although Zhang et al. (2022) noted that electron microscopy yields greater BrC contributions than optical methods. Since there does not appear to be a significant shift in aerosol type during the BBA emission season, such as the processes described by Bond et al. (2013), we posit that the aerosol brightening is instead due to changes in aerosol composition (Eck et al., 2013).
BBA composition is dependent upon both fuel type and burning conditions, with the less-efficient smoldering fire phase generating more organic carbon and less BC than during the flaming phase (Levin et al., 2010; Collier et al., 2016; Jen et al., 2019; Dobracki et al., 2025). Back-trajectories performed by Dobracki et al. (2023) source less-scattering September BBA from grass fuels in the Miombo woodlands of Angola. The source fires then shift southeastward in October to Botswana, Zambia, Zimbabwe, and Mozambique, in alignment with the higher SSA values observed in that region (Eck et al., 2013; Choi et al., 2024; Tatro and Zuidema, 2025). A similar southeastward shift over the course of the BBA emission season is seen in the BC and OC columnar mass densities (Fig. S1), as well as in MODIS-detected vegetation fires (Fig. S2 in the Supplement), and in HYSPLIT (Hybrid Single-Particle Lagrangian Integrated Trajectory) back-trajectories (Fig. S3 in the Supplement). The relationships between AAE, EAE, and SSA are shown per 4STAR sky-scan as scatterplots in Fig. S4 in the Supplement, displaying a shift away from the greater AAE values expected with increased BrC contributions as the BBA emission season progresses, for the retrieved wavelength range.
3.4 Complex Refractive Indices Subseasonal Analysis
We also examined the subseasonal variability of the complex refractive indices (Fig. 5), including both RRI and IRI. At 500 nm, median RRI increases from about 1.48 in August to 1.50 in September, then falling to 1.45 in October, with similar relative changes at longer wavelengths. Applying a two-sample Wilcoxon rank sum test to RRI, the transition from August–September is not statistically significant at any wavelength, while September–October yields p-values <0.05 at 500 and 675 nm, with p-values of 0.10 and 0.14 at 870 and 995 nm. The IRI trend appears similar, with the IRI median at 500 nm increasing from about 0.025 in August to 0.026 in September, and falling to 0.013 in October, which is again reflected at the longer wavelengths. Applying the same test to IRI, the transition from August–September is once again not statistically significant, but the transition from September–October yields p-values <0.001 (both considering all four wavelengths). The lack of an increase in RRI coupled with a strong decrease in IRI suggests that the aerosol brightening in October is dependent upon a decrease in aerosol absorptivity, rather than an actual increase in its scattering, in agreement with the findings of Jethva et al. (2024).
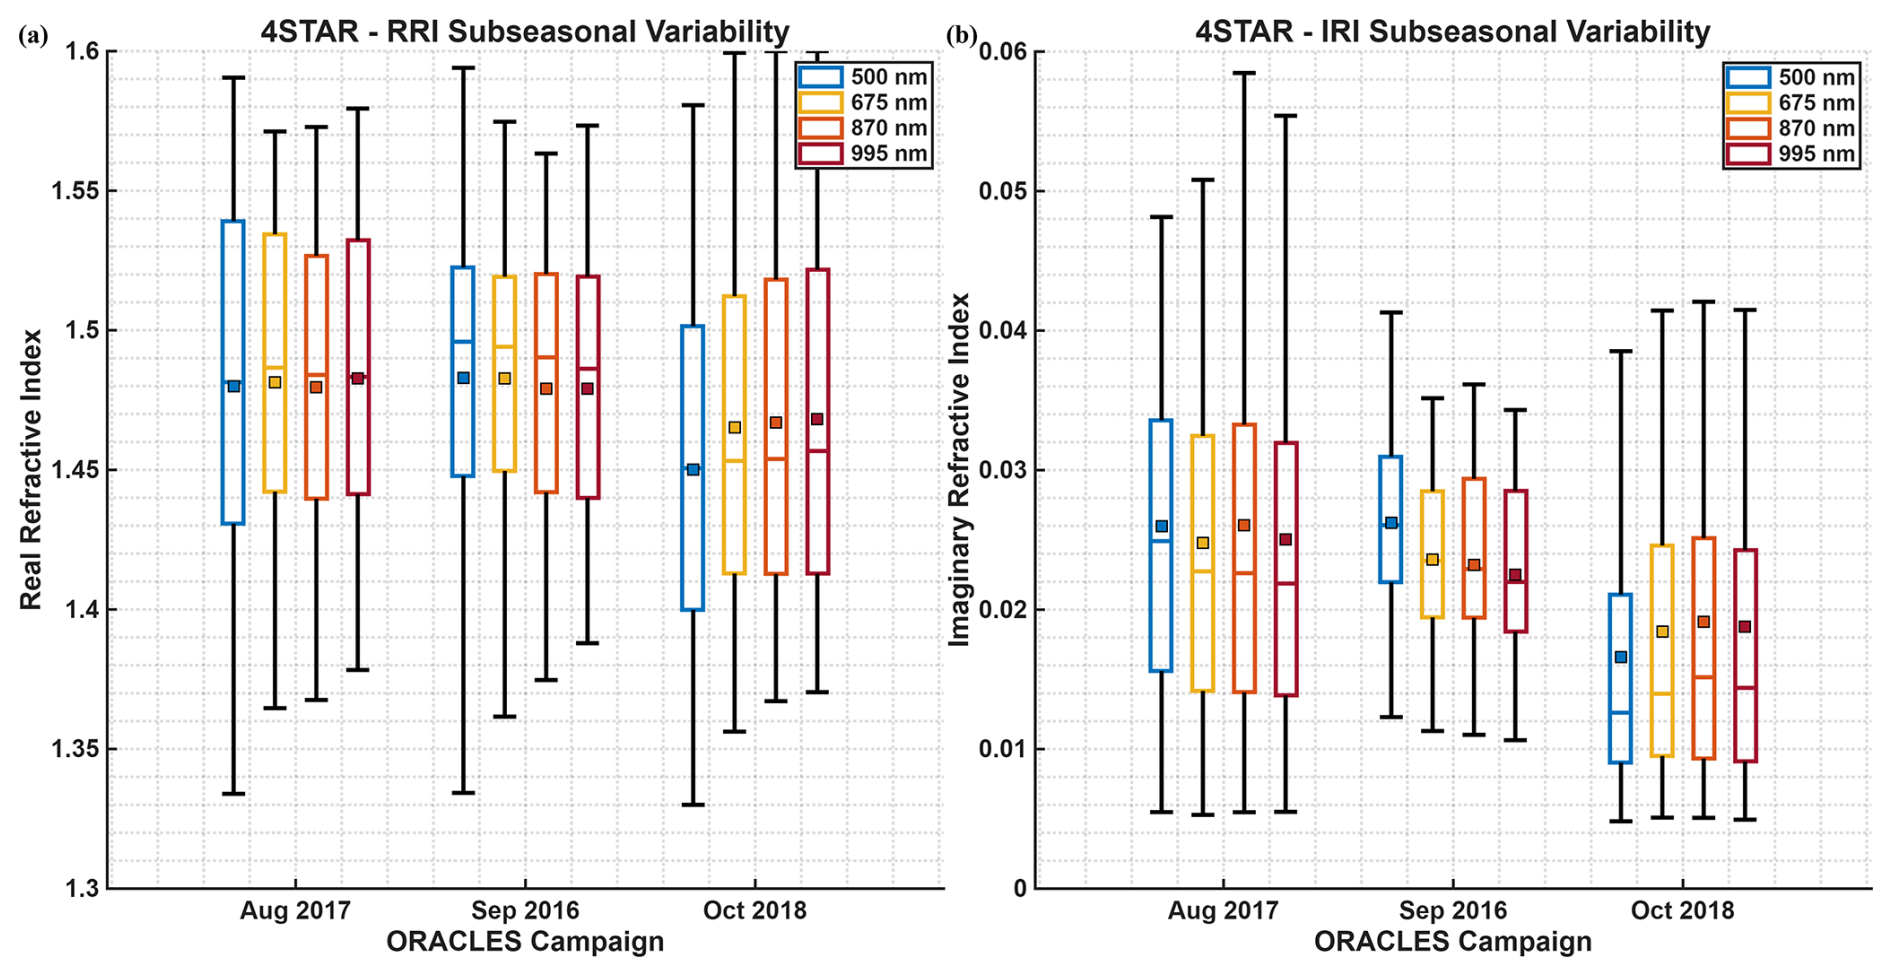
Figure 5Subseasonal variability of 4STAR (a) RRI and (b) IRI from ORACLES 2016–2018. Boxes show the interquartile range, while whiskers extend to the 5th and 95th percentiles. Central lines are medians and squares are means.
4.1 ORACLES and AERONET
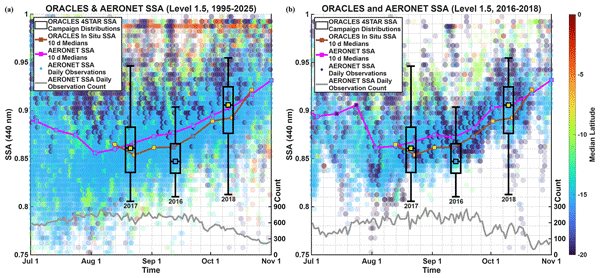
To compare SSA and AOD from ORACLES and AERONET, we updated and expanded upon Fig. 3 from Redemann et al. (2021). AERONET observations are discretized into cells of 0.005 SSA (or 0.05 AOD) per day, then colored by median latitude to emphasize which stations are most contributing to the dataset, with opacity weighted by the number of observations. 10 d (10-day) SSA and AOD medians are calculated from the AERONET observations, centered on Julian dates ending in five. The same method was also applied to determine 10 d medians from ORACLES in situ SSA. SSA and AOD from 4STAR are box-plotted per campaign due to the limited number of sky-scans, compared to the high volume of AERONET and in situ observations, centered on the median campaign dates of 21 August 2017, 12 September 2016, and 10 October 2018. Log-log spectral quadratic regressions of 4STAR AOD and AAOD were performed, with derivatives taken at 500 nm, resulting in EAE500 and AAE500, like the procedure performed by Redemann et al. (2006). EAE500 (and AAE500) were used to extrapolate AOD (and AAOD) from 500–440 nm, allowing for the calculation of 4STAR SSA at 440 nm. In situ SSA was extrapolated using a spectral linear regression, requiring defined SSA inputs from all three wavelengths (470, 530, 660 nm).
After extrapolating to 440 nm, 4STAR and in situ median SSA still show a subseasonal increase of about 0.04 (Fig. 6), in agreement with the shorter wavelengths from Fig. 2. This is echoed by the Southern African AERONET stations, which also saw an increase in median SSA of about 0.04 from 23 August–12 October (the closest 10 d medians to the ORACLES 2017 and 2018 campaign medians), for both the three concurrent campaign years of 2016–2018, as well as for the aerosol climatology of 1995–2025. The AERONET and in situ 10 d SSA medians largely agree on the slope of this increase, barring the very start and end of the ORACLES campaign period. There is good agreement between 4STAR and AERONET SSA medians for ORACLES 2017 and 2018, but the September decrease in SSA shown by 4STAR is not reflected in either the AERONET or in situ datasets. We believe that the southerly location of the ORACLES 2016 campaign impacted 4STAR's September SSA distribution, which is explored further by our spatial analyses.
The AERONET station at Windpoort, Namibia (19.37° S, 15.48° E) is the greatest contributor of July–October SSA retrievals, supplying 18.5 % of 1995–2025 and 25.3 % of 2016–2018 data, with the latter percentage increasing the station's visibility in Fig. 6b. The second greatest contributor of July-October SSA retrievals is the AERONET station at Mongu Inn, Zambia (15.27° S, 23.13° E), supplying 18.0 % of 1995–2025 and 18.7 % of 2016–2018 data, and is well-represented within both panels of Fig. 6 due to its centrality within the latitudinal distribution of AERONET observations. The two AERONET time series are in remarkable agreement with one another, highlighting the ability of the ORACLES 2016–2018 campaigns to reflect a much longer data record. The good agreement between ORACLES and AERONET also suggests that the BBA radiative properties over the Southeast Atlantic remain largely reflective of those emitted from Southern Africa, showcasing how data from ORACLES (and other SEA campaigns) can be relevant outside of its direct study region.
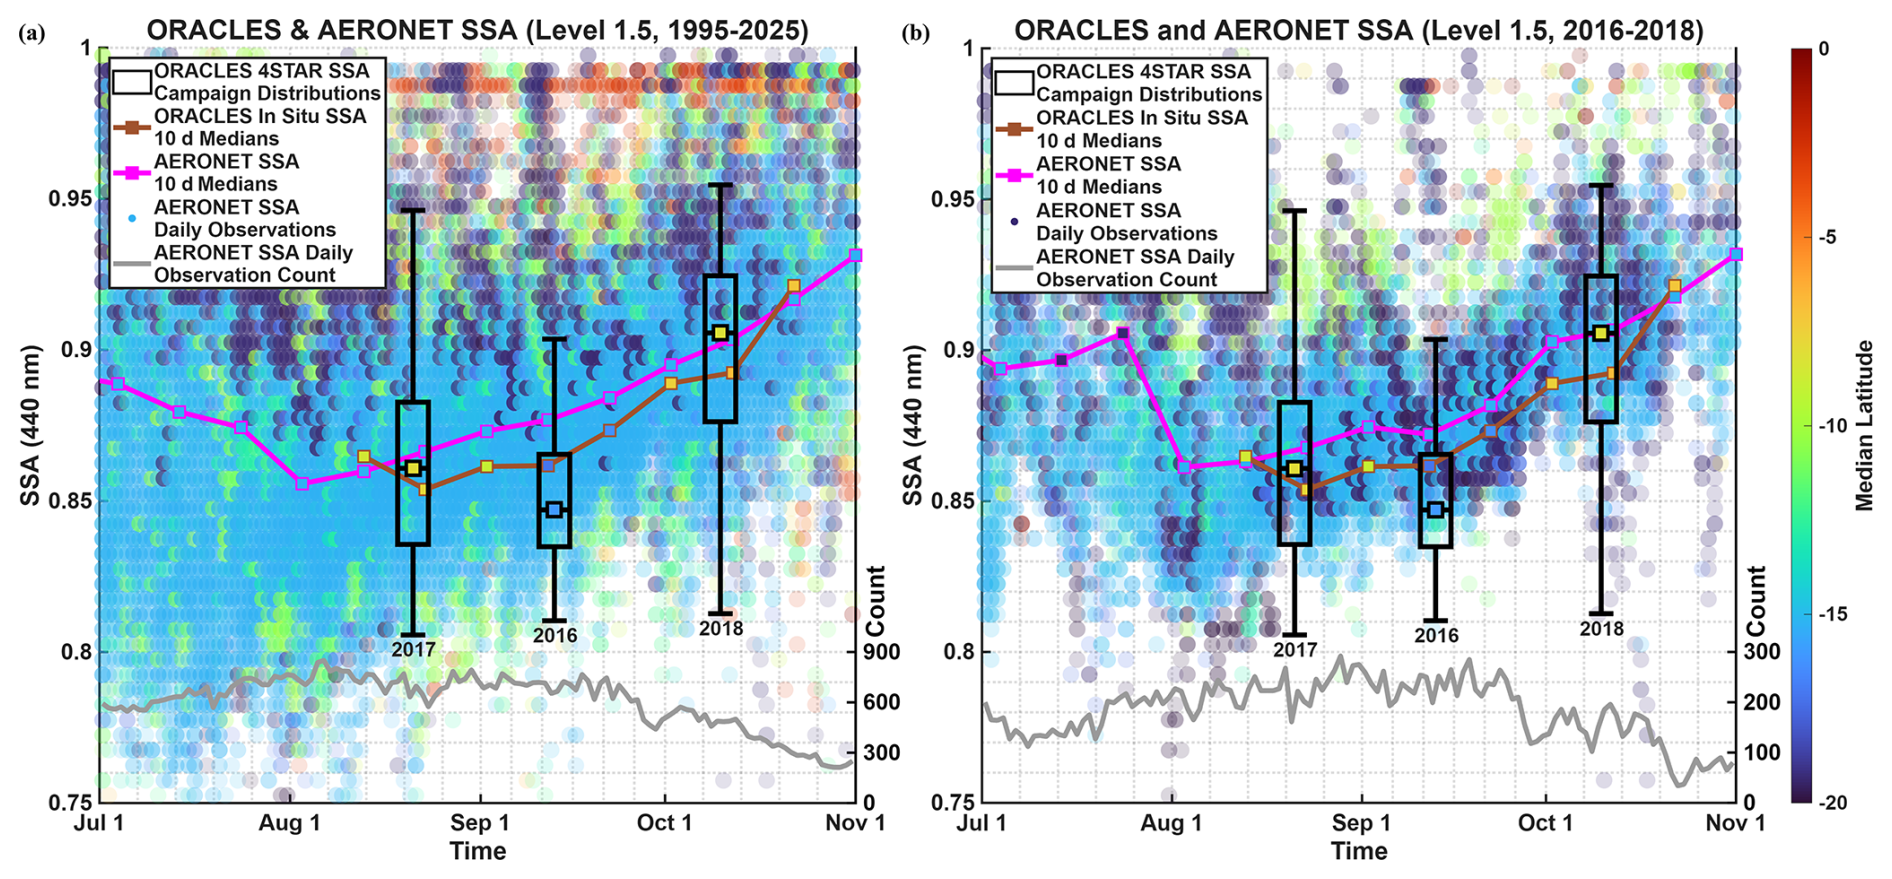
Figure 64STAR and in situ SSA from ORACLES 2016–2018, with AERONET SSA for (a) 1995–2025 and (b) 2016–2018. Black boxes show 4STAR's interquartile range, with square medians, and whiskers extending to the 5th and 95th percentiles. 10 d medians are shown for in situ (brown) and AERONET (pink). Background data are AERONET observations, with opacity weighted by count. The daily count of AERONET observations (gray) is also displayed at the bottom. All other colors represent the median latitude of the observations used to calculate each median SSA value or fill in each cell.
AOD peaks in September for both AERONET and 4STAR at 440 nm (Fig. 7), in agreement with the AOD trend from Fig. 3. Given that AOD is an extensive property, any conclusions drawn from 4STAR are dependent upon its sampling, e.g. when 4STAR operators chose to perform sky-scans and which sky-scans met the QC criteria. Thus, the agreement between 4STAR and AERONET may be somewhat coincidental but also suggests that 4STAR observed a similar distribution of aerosol loadings during sky-scan operation to that obtained by Southern African AERONET stations. The fact that 4STAR observed similar AOD to AERONET (i.e. not observing systematically lower values) implies that aerosol loading was generally conserved during early transport by the Southern African Easterly Jet. A possible mechanism for this is that any aerosol losses may have been compensated by water uptake and hygroscopic growth (Pistone et al., 2021; Pistone et al., 2024) as the aerosols were transported from drier land to moister ocean. Agreement is once again best for ORACLES 2017 and 2018, which had greater sampling of the central smoke plume near 8° S than the ORACLES 2016 campaign, which may account for the latter's AOD underestimate.
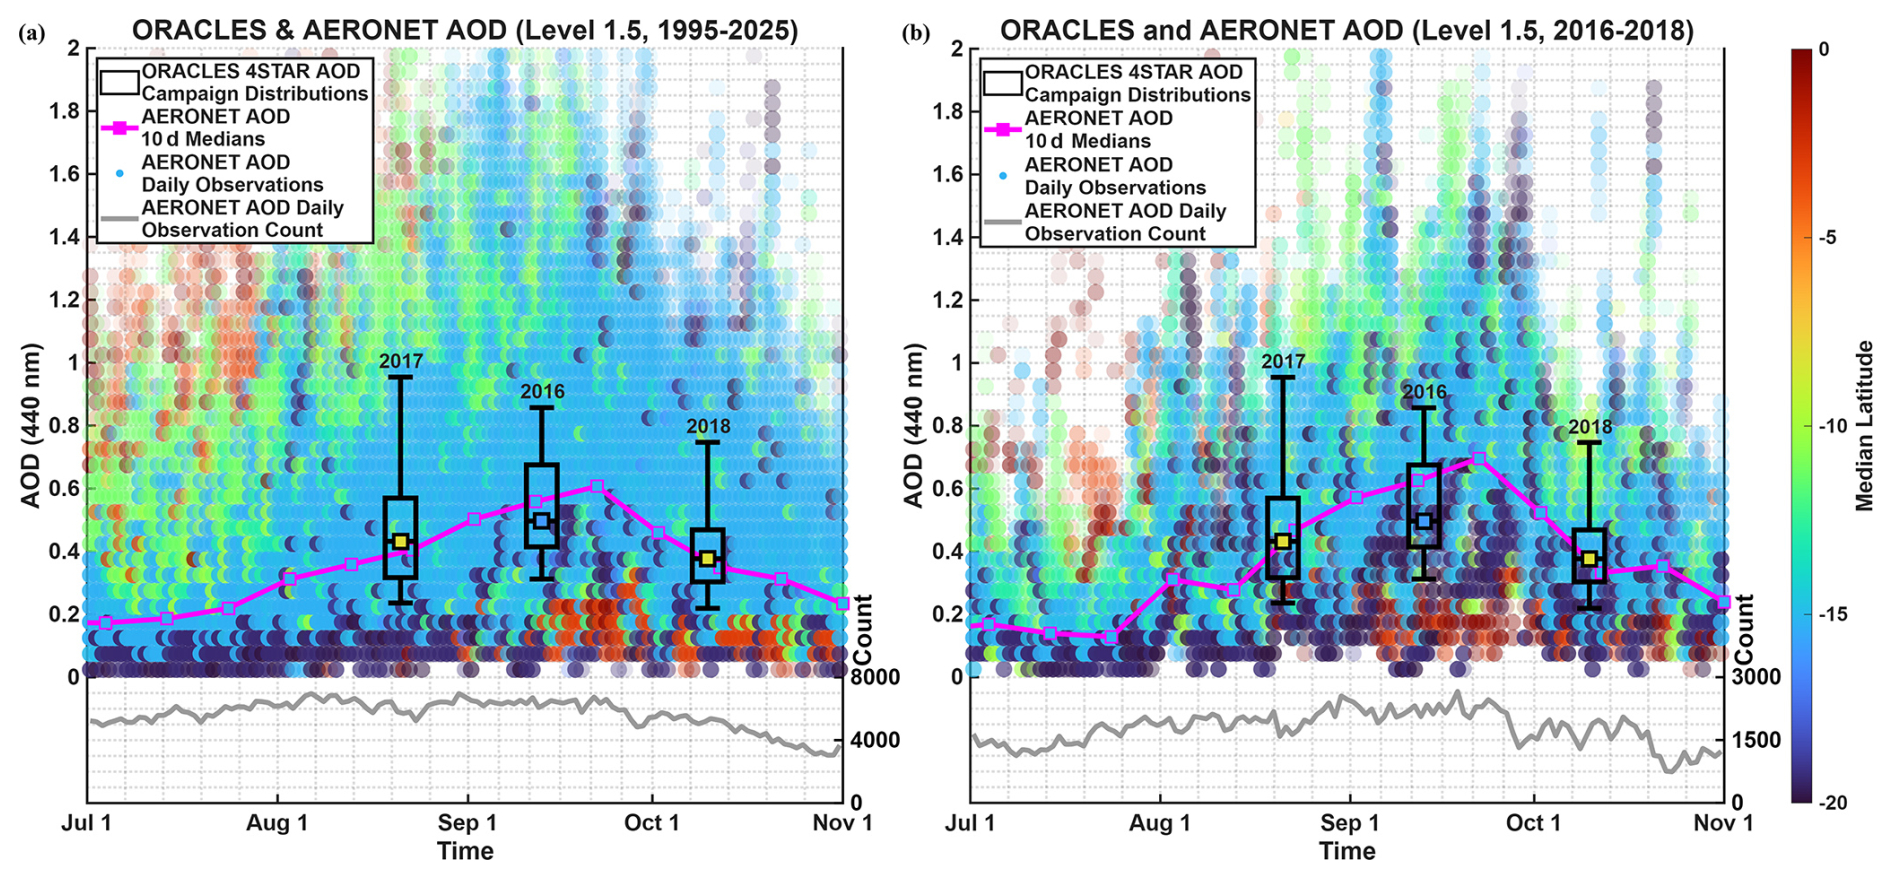
Figure 74STAR AOD from ORACLES 2016–2018, with AERONET AOD for (a) 1995–2025 and (b) 2016–2018. Black boxes show 4STAR's interquartile range, with square medians, and whiskers extending to the 5th and 95th percentiles. AERONET 10 d medians (pink) are also shown. Background data are AERONET observations, with opacity weighted by count. The daily count of AERONET observations (gray) is also displayed at the bottom. All other colors represent the median latitude of the observations used to calculate each median SSA value or fill in each cell.
The greatest contributor of July–October AOD measurements is once again the AERONET station at Windpoort, Namibia (19.37° S, 15.48° E), supplying 14.7 % of 1995–2025 and 20.3 % of 2016–2018 data, with the latter percentage similarly increasing the station's visibility in Fig. 7b. The AERONET station at Mongu Inn, Zambia (15.27° S, 23.13° E) is the second greatest contributor of July–October AOD measurements for 1995–2025, supplying 14.3 % of the aerosol climatology, but is only third greatest for 2016–2018, supplying 14.0 % of the smaller dataset. However, since it is still centrally located within the latitudinal distribution of AERONET observations, it remains well-represented within both panels of Fig. 7. The second greatest contributor of July–October AOD measurements for 2016–2018 is the AERONET station in Lubango, Namibia (14.96° S, 13.45° E), supplying 16.0 % of the smaller dataset, although its contributions are much more muted within the aerosol climatology, at only 8.4 %. The southward trend in African fires can be observed for AERONET AOD greater than 1.0, shifting from near the equator in July, to near 10° S in August and September, to near 15° S in October, which is especially apparent in the climatology.
4.2 Spatial Analyses
By binning SSA by latitude, longitude, and altitude, we can observe its spatial dependences. In situ SSA at 530 nm was chosen for these analyses due to its high volume of data points, as compared to the sparser 4STAR retrievals. For the latitudinal and longitudinal analyses, in situ SSA was binned by 2°, while for the altitudinal analysis, it was binned by 0.5 km. Each ORACLES campaign was kept separated, so that the subseasonal differences between in situ SSA values at each spatial bin could be observed.
The subseasonal increase in median SSA can be seen for latitudes spanning from 10° S–2° N, with about a 0.03 increase from August–October over that range (Fig. 8). For 10–6° S, all three campaigns display the subseasonal increase, while only the ORACLES 2017 and 2018 campaigns can be observed over the 6° S–2° N range. Over 14–10° S, the SSA medians from August are greater than those from September, not aligning with the subseasonal increase, but August has much fewer samples than the other two campaigns at those latitudes, only containing 6 %–32 % as many datapoints.
For ORACLES 2016, median SSA increases by about 0.02 from 20–8° S (excluding south of 20° S due to possible aerosol recirculations and 8–6° S due to limited datapoints), indicating that ORACLES 2016 observed greater aerosol scattering relative to total extinction as it approached the central smoke plume near 8° S. Higher relative humidity near the equator can result in higher SSA values (Ryoo et al., 2021; Dobracki et al., 2023) retrieved by AERONET or 4STAR, but the equatorward increase of in situ SSA cannot solely be attributed to the higher relative humidity, as the PSAP optical block was heated to 30–50 °C and the relative humidity within the Nephs had an interquartile range of 6 %–40 % across the three campaigns. This indicates a change in aerosol composition, which is reflective of the equatorward increase in non-BC components noted by the back-trajectories of Dobracki et al. (2025). The aerosol compositional difference is likely due to equatorward fires being smoldering and of woodier materials, generating more organic carbon.
Due to the relocation from Namibia to São Tomé, there are significant latitudinal differences between the ORACLES 2016 and the ORACLES 2017–2018 campaigns. South of 14° S contains 77 % of in situ measurements (and 82 % of sky-scans) for ORACLES 2016, but <1 % of in situ measurements and sky-scans for ORACLES 2017 and 2018. Conversely, north of 8° S contains 70 %–71 % of in situ measurements (and 46 %–50 % of sky-scans) for ORACLES 2017 and 2018, but <1 % of in situ measurements and sky-scans for ORACLES 2016. We subsampled 4STAR sky-scans from ORACLES 2016 in the overlapping middle region of 14–8° S to determine the effect of the southerly location of that campaign on the SSA retrievals. Doing so yields a median SSA value of 0.86 at 500 nm for that region, which is 0.02 higher than the ORACLES 2016 campaign median. This, combined with the northward increase in ORACLES 2016 in situ SSA medians, suggests that if ORACLES 2016 had been similarly based out of São Tomé and sampled the central smoke plume from the equator, 4STAR and in situ SSA would likely have been higher overall, with greater similarity to AERONET observations and more in alignment with the subseasonal SSA increase.
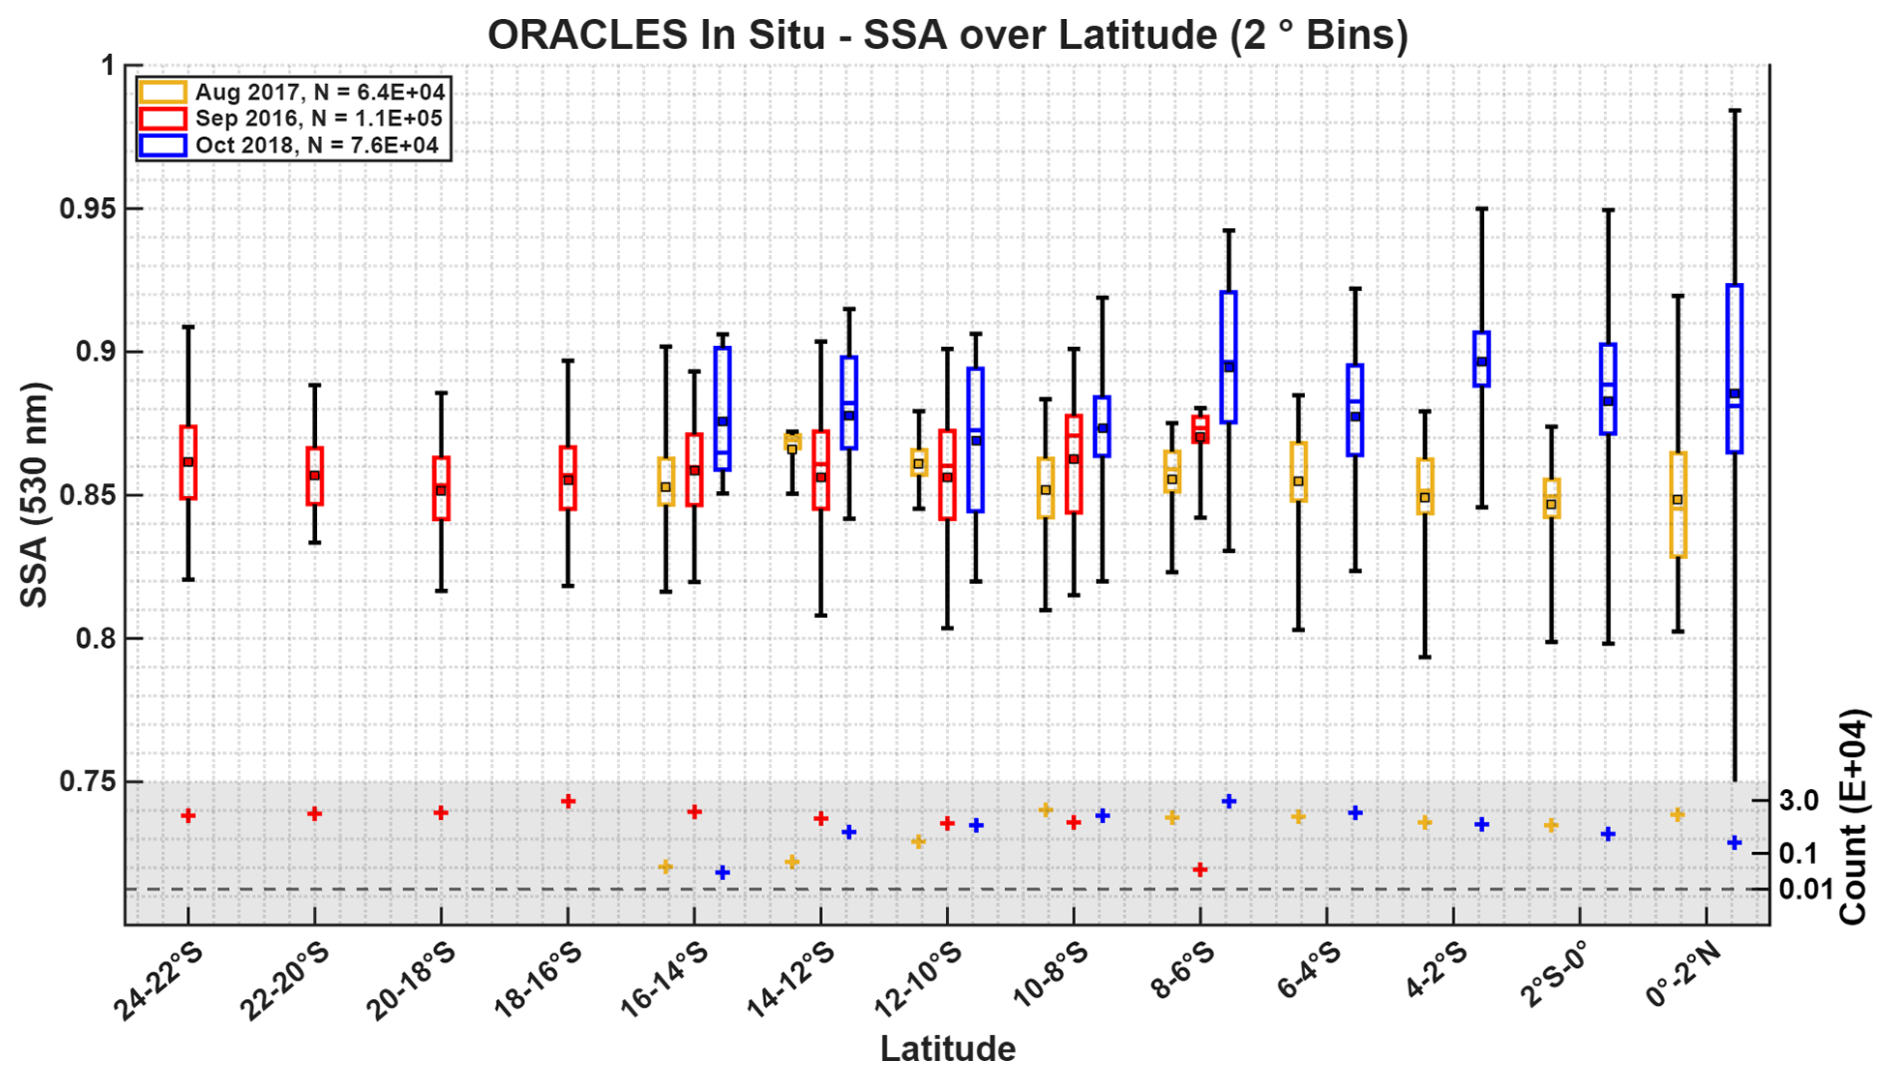
Figure 8In situ SSA for ORACLES 2016–2018, binned by 2° latitude. The ORACLES 2016 (September) campaign is centered, with ORACLES 2017 (August) jittered to its left and ORACLES 2018 (October) to its right. Boxes show the interquartile range, while whiskers extend to the 5th and 95th percentiles. Central lines are medians and squares are means. Observation counts per bin are displayed at the bottom.
The month-to-month increase in median SSA can also be seen for longitudes spanning from 4° W–12° E, with about a 0.03 increase over that range (Fig. 9). For 0–8° E, all three campaigns display the subseasonal increase, while only two campaigns can be observed for 4–0° W and 8–12° E. The longitudes of 12–16° E were only observed by ORACLES 2016, while 10–4° W were only observed by ORACLES 2017, not allowing for a subseasonal analysis.
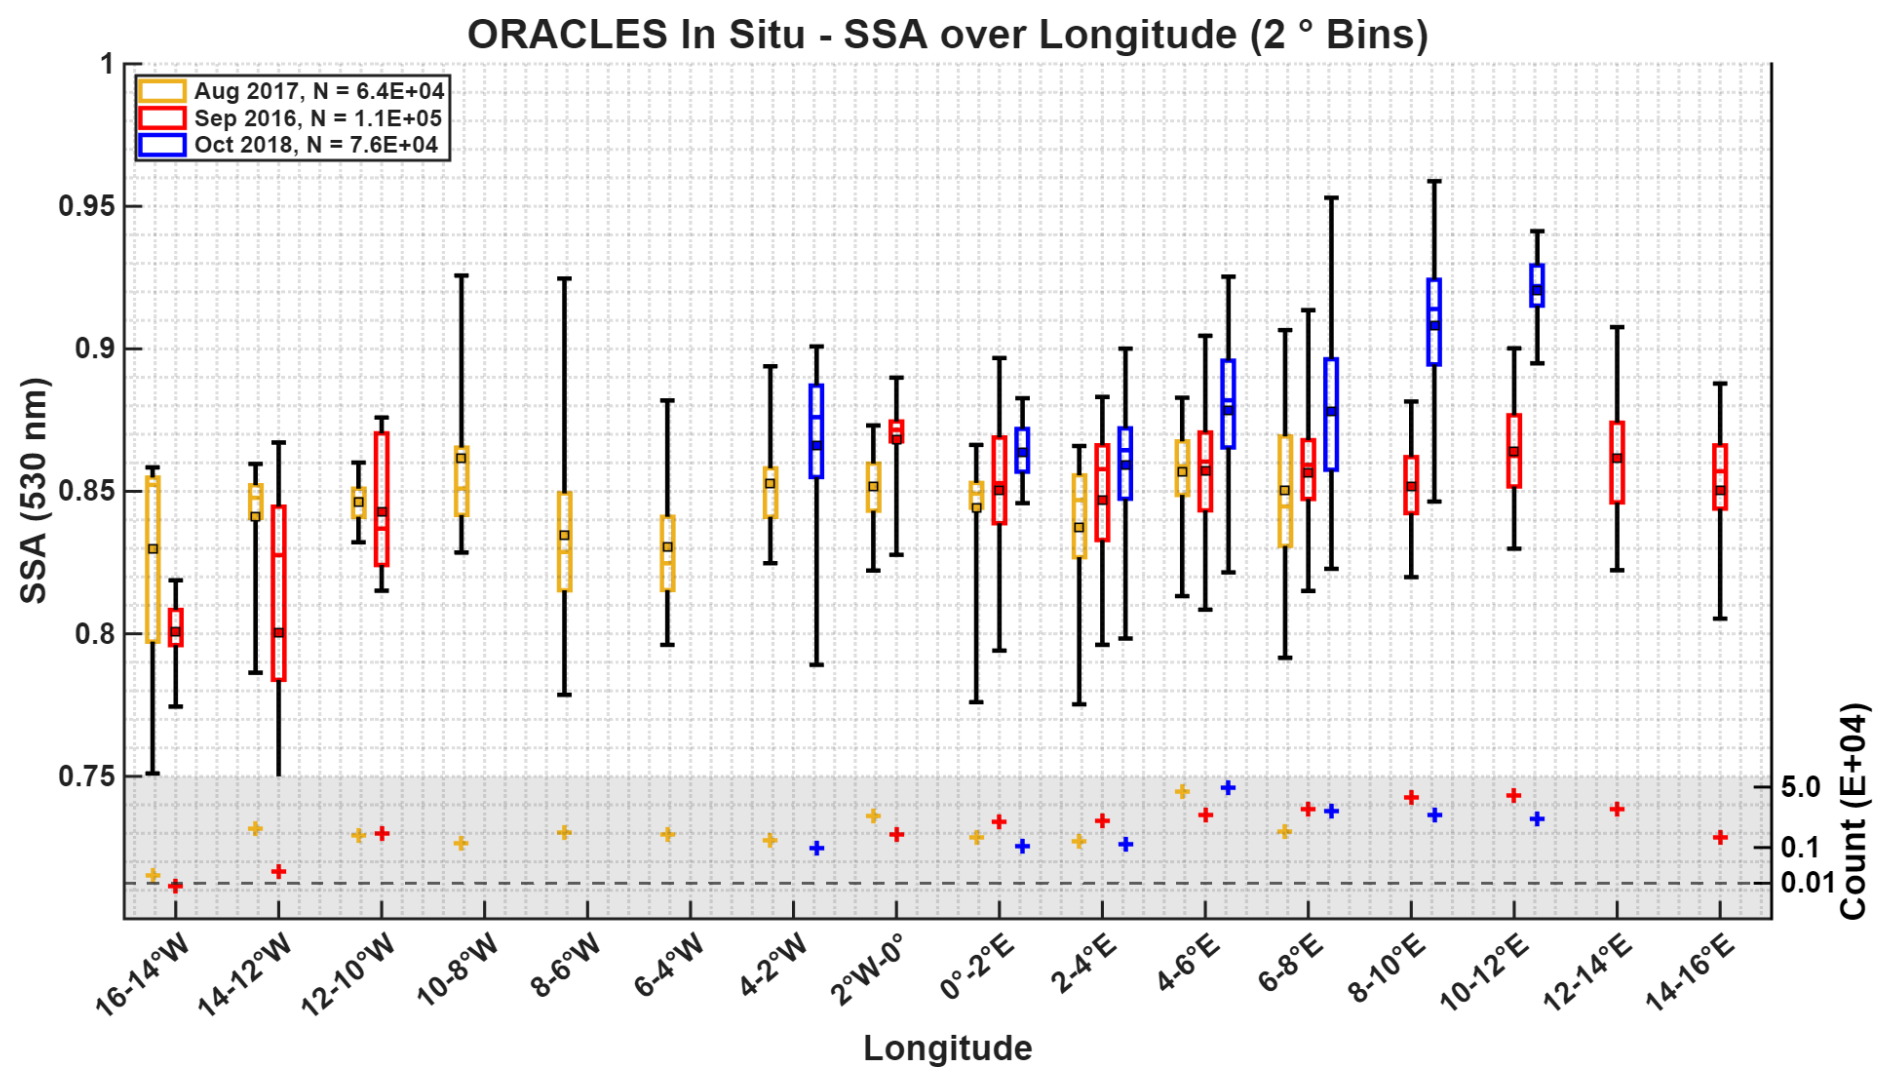
Figure 9In situ SSA for ORACLES 2016–2018, binned by 2° longitude. The ORACLES 2016 (September) campaign is centered, with ORACLES 2017 (August) jittered to its left and ORACLES 2018 (October) to its right. Boxes show the interquartile range, while whiskers extend to the 5th and 95th percentiles. Central lines are medians and squares are means. Observation counts per bin are displayed at the bottom.
In the eastern portion of the basin (16° E–2° W), ORACLES 2016 median SSA is centered near 0.86, with a bin-to-bin variability of about 0.01. Between 10 and 16° W, ORACLES 2016 median SSA decreases from about 0.84–0.80, reflecting a similar SSA decrease found by Fakoya et al. (2025) for aged free tropospheric BBA over the Southeast Atlantic. They attribute this SSA decrease to aerosol aging processes, such as a lensing effect, whereby organic aerosol coatings focus more light on the BC core and increase BBA absorptivity (Taylor et al., 2020), and/or a loss of organic aerosol coating via heterogenous oxidation and subsequent reduction of BBA scattering (Sedlacek et al., 2022). Over the central portion of the basin (8° E–4° W), ORACLES 2017 median SSA remains almost constant near 0.85, with a bin-to-bin variability of about 0.01. This declines to about 0.83 over 4–8° W, which rebounds to 0.85 for 8–16° W, aligning with the transition from nine-day to eleven-day aged aerosols described by Fakoya et al. (2025). For the east-central portion of the basin (12–0° E), ORACLES 2018 median SSA decreases westward from about 0.92–0.86, then rebounds to 0.88 at 2–4° W. This suggests that the aerosol aging processes from Fakoya et al. (2025) occurred much further east for ORACLES 2018 than the other two campaigns. This aligns with the southeastward shift of fires in October, allowing more time for aerosol aging processes to occur before arriving in the ORACLES study region over the Southeast Atlantic.
SSA generally increases with altitude for all three ORACLES campaigns (Fig. 10), in agreement with Fig. 14 from Redemann et al. (2021), with an average increase of about 0.04 per campaign over the entire free-tropospheric range of 1.5–5.5 km. The subseasonal increase in median SSA is strongest in the upper portion of the smoke plume (4–5.5 km), with all three campaigns in ascending order and an increase of about 0.05 from August–October over that span. September median SSA is lower than August within the lower portion of the smoke plume (2–4 km), but there is still an increase of about 0.03 from August–October. Altitudinal increases in SSA have been attributed to increases in ammonium (NH3) with altitude (Wu et al., 2020), although not much NH3 has been measured in the region, estimated to be about 5 % of the mean submicron mass spectrum by Dobracki et al. (2023). The altitudinal increase in SSA is also correlated with a general decrease in the black carbon to organic aerosol ratio with height (Redemann et al., 2021). Another possibility is that stronger winds at higher altitudes result in fresher aerosols aloft, compared to chemically aged aerosols below.
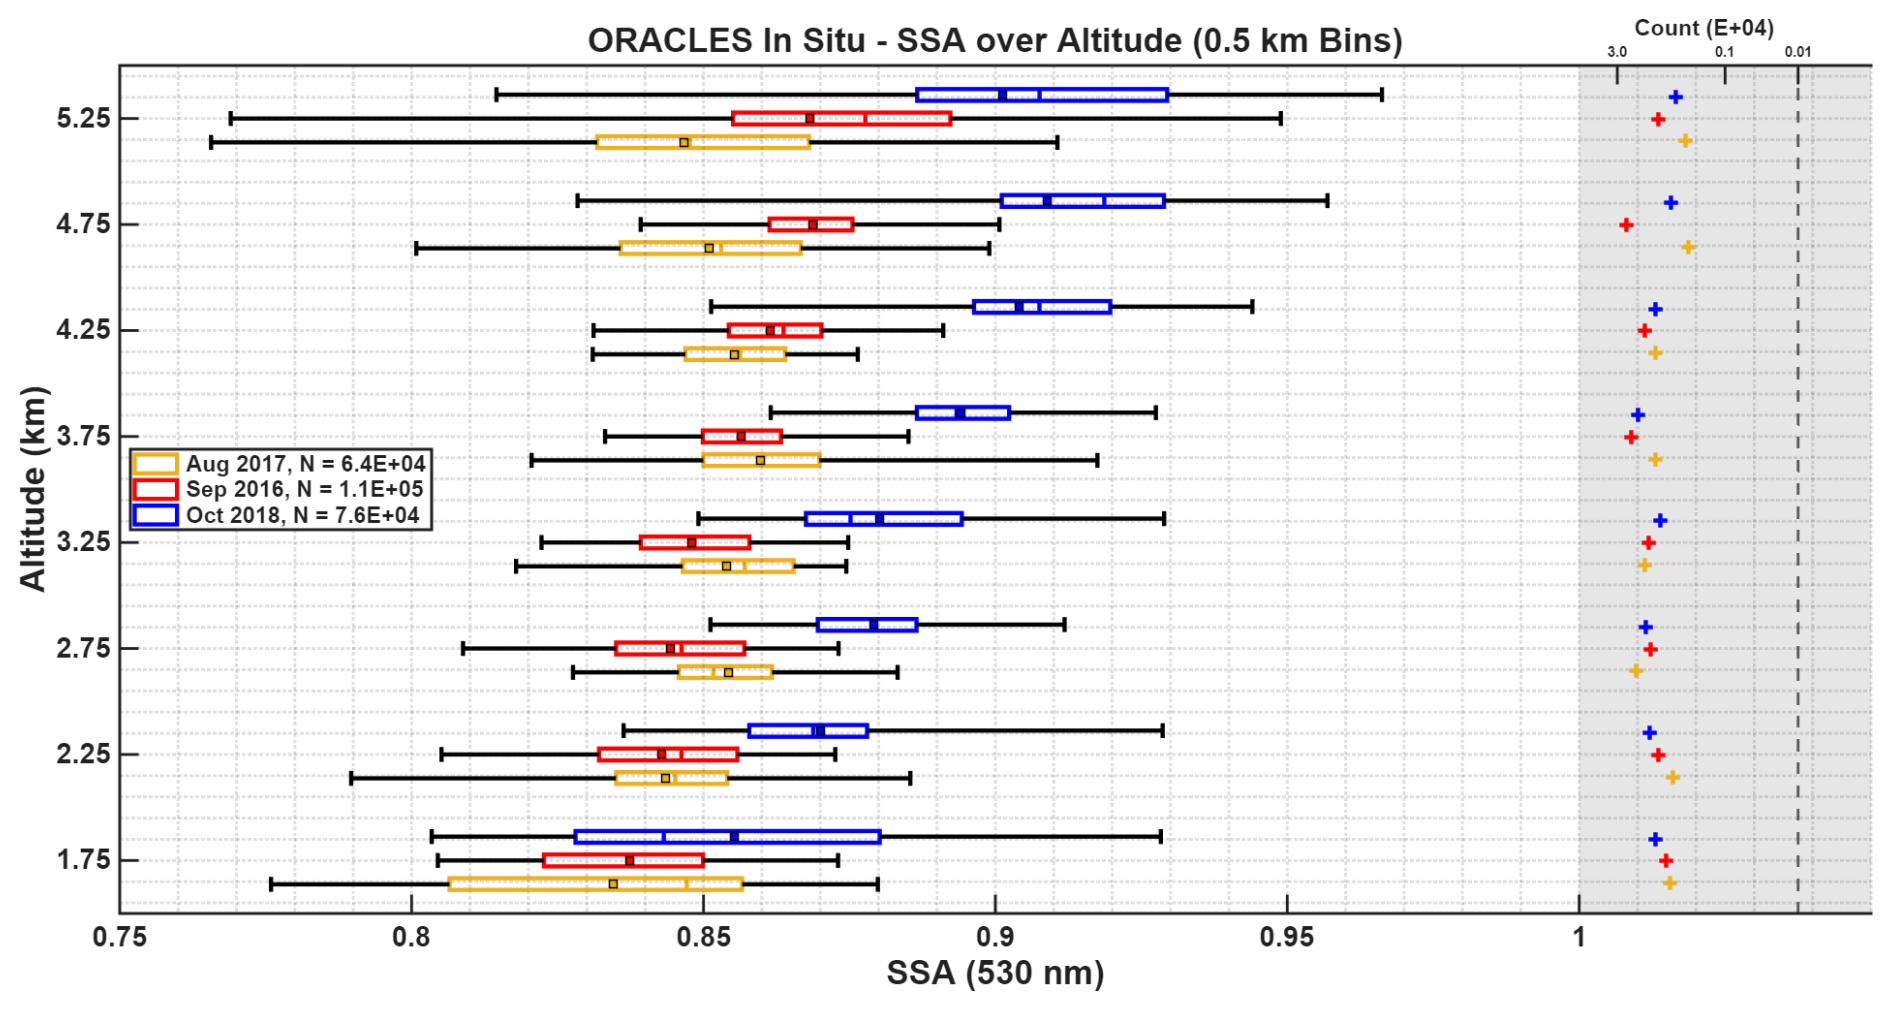
Figure 10In situ SSA for ORACLES 2016–2018, binned by 0.5 km altitude. Ticks represent the altitudinal center of the bin. The ORACLES 2016 (September) campaign is centered, with ORACLES 2017 (August) jittered below it and ORACLES 2018 (October) above it. Boxes show the interquartile range, while whiskers extend to the 5th and 95th percentiles. Central lines are medians and squares are means. Observation counts per bin are displayed on the right.
A subseasonal increase in SSA from 4STAR retrievals and in situ measurements during ORACLES 2016–2018 indicates that biomass burning aerosols over the Southeast Atlantic experience an aerosol brightening process over the course of the BBA emission season. The subseasonal SSA increase is likely to increase critical albedo, which decreases DARE and reduces heating rates in clear and partially cloudy conditions, weakening atmospheric stability. The SSA increase from ORACLES over-ocean observations is also consistent with the near-source observations from Southern African AERONET stations, which have recently reached 30 years of continuous operation, allowing for analysis of a complete aerosol climatology for the first time. EAE has little subseasonal variation, indicating that fine aerosols dominate throughout the season. The AAE values remain within the typical range for BC during the season. If the aerosol brightening in October were caused by an increase in BrC contributions, then we would expect to see an increase in AAE. However, we instead see a decrease in AAE, so there is no clear optical evidence for substantial BrC contributions within the retrieved wavelength range, in alignment with previous studies (Denjean et al., 2020; Taylor et al., 2020; Wu et al., 2020; Dobracki et al., 2023, 2025). This suggests that the aerosol brightening is due to changes in aerosol composition during the season, rather than a change in aerosol type, which had been the subject of ongoing debate (Bond et al., 2013; Eck et al., 2013; Redemann et al., 2021). Improving the ability of the ORACLES 4STAR sky-scans to identify BrC absorption via expansion into the UV spectrum is currently complicated by an instrument artifact near 420 nm and stray light scattering at 360 and 380 nm (Mitchell et al., 2025) but could be overcome with the use of hyperspectral GRASP (Generalized Retrieval of Atmosphere and Surface Properties) code (Román et al., 2018), which is the subject of ongoing work. 4STAR-B, the subsequent version of 4STAR not flown during ORACLES, has implemented instrument improvements that have mostly resolved these issues, allowing it to remain on the cutting-edge of airborne aerosol retrievals. Regarding the complex refractive indices, the decrease in IRI is relatively greater than the concurrent decrease in RRI, suggesting that the aerosol brightening depends more upon a decrease in aerosol absorptivity, rather than an actual increase in scattering. 4STAR retrievals of AOD and AAOD both peak in September, which is also reflected in the AERONET data. These results are in line with the previously reported pattern of BBA emissions across the source regions.
SSA medians from ORACLES 4STAR retrievals and in situ measurements agree well with those from AERONET, indicating that the BBA radiative properties observed over the Southeast Atlantic are still largely reflective of those emitted from the source region of Southern Africa, with both experiencing a similar subseasonal increase in SSA from aerosol brightening. There is also agreement in AOD medians between ORACLES and AERONET, suggesting that any aerosol losses during transport by the Southern African Easterly Jet may have been compensated by water uptake and hygroscopic growth. The general agreement between these two adjacent regions showcases the relevance of the ORACLES dataset even outside of its direct study area. This is true for both the concurrent campaign years and the full AERONET aerosol climatology, highlighting the ability of ORACLES observations to reflect long term trends.
The SSA and AOD medians retrieved by 4STAR during the ORACLES 2016 campaign are generally lower than the respective AERONET medians. A latitudinal analysis of in situ measurements and subsampling of 4STAR sky-scans indicates that the September decrease in SSA noted by 4STAR is affected by the more southerly sampling location of ORACLES 2016 relative to the other two campaigns, rather than from a temporal evolution, such that ORACLES 2016 would have observed greater scattering relative to total extinction if it had similarly targeted the central smoke plume from the equator, bringing the 4STAR SSA medians more in line with the subseasonal increase observed by AERONET. The equatorward increase in SSA also aligns with findings that the source fires within that region are smoldering and of woodier materials. Increased observation of the central smoke plume by ORACLES 2016 would likely have yielded higher aerosol loadings, also bringing AOD into greater agreement with AERONET.
Each campaign observed a westward gradual increase in SSA, followed by a sharper decline, and (in two cases) a subsequent rebound, aligning with late-transport aging processes identified by recent studies, attributed to a lensing effect and/or reduction of organic aerosol coating. This process appears to have occurred much further east for ORACLES 2018, aligning with the southeastward shift of fires in October noted by previous studies (Eck et al., 2013; Choi et al., 2024; Tatro and Zuidema, 2025), allowing more time for aerosol aging processes to occur before arriving to the Southeast Atlantic. SSA generally increases with altitude, in agreement with previous findings, which is attributed to either increasing ammonium, decreasing the black carbon to organic aerosol ratio, or stronger winds keeping fresher aerosols aloft. The subseasonal SSA increase can be seen throughout the free-tropospheric vertical column but is strongest in the upper portion of the smoke plume. 4STAR retrievals and in situ measurements were adept at identifying subseasonal aerosol brightening during the ORACLES campaigns over the Southeast Atlantic, a region that can otherwise be quite difficult to observe. A subseasonal SSA increase of about 0.05 is significant enough to affect physical processes involving DARE, heating rates, and atmospheric stability. As such, this subseasonal variability needs to be properly accounted for in climate models. The airborne 4STAR sky-scans are an invaluable tool for validating above-cloud aerosol products from satellites and other methods, which will in turn reduce aerosol uncertainties within this critical study region.
NASA ORACLES P-3 4STAR aerosol inversions and in situ absorption measurements are accessible via: https://doi.org/10.5067/ASDC_DAAC/ORACLES_Aerosol_AircraftInSitu_Data_1 (NASA/LARC/SD/ASDC, 2020).
AERONET AOD and aerosol inversions are accessible via: https://aeronet.gsfc.nasa.gov/ (NASA GSFC, 2026).
MERRA-2 BC and OC column mass densities (used in a supplementary figure) are accessible via: https://doi.org/10.5067/FH9A0MLJPC7N (Global Modeling and Assimilation Office, 2015).
Aqua and Terra MODIS-detected vegetation fires (used in a supplementary figure) are accessible via: https://doi.org/10.5067/FIRMS/MODIS/MCD14DL.NRT.0061 (NASA MODIS Science Data Support Team, 2021).
HYSPLIT back-trajectories (used in a supplementary figure) are accessible via: https://www.ready.noaa.gov/ (NOAA Air Resources Laboratory, 2026; Stein et al., 2015; Rolph et al., 2017).
The supplement related to this article is available online at https://doi.org/10.5194/acp-26-13083-2026-supplement.
All figures were created by LTM, under the guidance of CJF and JR, and with input from KP and SEL. PZ and RW were PIs for ORACLES Mission Science. JR and SEL were PIs for 4STAR during ORACLES 2016 and ORACLES 2017–2018, respectively. KSS was the PI for SSFR during ORACLES. KP and SEL operated the 4STAR instrument aboard the P-3 aircraft for all of ORACLES, while CJF also operated during ORACLES 2016. LTM prepared the manuscript with contributions from all co-authors.
The contact author has declared that none of the authors has any competing interests.
Publisher's note: Copernicus Publications remains neutral with regard to jurisdictional claims made in the text, published maps, institutional affiliations, or any other geographical representation in this paper. The authors bear the ultimate responsibility for providing appropriate place names. Views expressed in the text are those of the authors and do not necessarily reflect the views of the publisher.
We thank the NASA ORACLES team for a successful mission. Data analysis and visualization were conducted utilizing MATLAB. Mapping was performed using QGIS.
This research was supported by the NASA Atmosphere Observing System (AOS) mission (grant no. 80NSSC23M0083). It was also supported by the University of Oklahoma (OU) start-up package (grant no. 122007900). The ORACLES field campaign was funded through the NASA Earth Venture Suborbital-2 program (grant no. NNH13ZDA001N-EVS2).
This paper was edited by Marco Gaetani and reviewed by two anonymous referees.
Abel, S. J., Haywood, J. M., Highwood, E. J., Li, J., and Buseck, P. R.: Evolution of biomass burning aerosol properties from an agricultural fire in southern Africa, Geophys. Res. Lett., 30, 1783, https://doi.org/10.1029/2003GL017342, 2003.
Adebiyi, A. A. and Zuidema, P.: The role of the southern African easterly jet in modifying the southeast Atlantic aerosol a and cloud environments, Q. J. Roy. Meteor. Soc., 142, 1574–1589, https://doi.org/10.1002/qj.2765, 2016.
Adebiyi, A., Zuidema, P., and Abel, S.: The convolution of dynamics and moisture with the presence of shortwave absorbing aerosols over the southeast Atlantic, J. Climate, 28, 1997–2024, https://doi.org/10.1175/JCLI-D-14-00352.1, 2015.
Alexander, D. T. L., Crozier, P. A., and Anderson, J. R.: Brown carbon spheres in East Asian outflow and their optical properties, Science, 321, 833–836, https://doi.org/10.1126/science.1155296, 2008.
Anderson, T. L. and Ogren, J. A.: Determining aerosol radiative properties using the TSI 3563 integrating nephelometer, Aerosol Sci. Tech., 29, 1, 57–69, https://doi.org/10.1080/02786829808965551, 1998.
Andreae, M. O. and Gelencsér, A.: Black carbon or brown carbon? The nature of light-absorbing carbonaceous aerosols, Atmos. Chem. Phys., 6, 3131–3148, https://doi.org/10.5194/acp-6-3131-2006, 2006.
Bellouin, N., Quaas, J., Gryspeerdt, E., Kinne, S., Stier, P., Watson-Parris, D., Boucher, O., Carslaw, K. S., Christensen, M., Daniau, A.-L., Dufresne, J.-L., Feingold, G., Fiedler, S., Forster, P., Gettelman, A., Haywood, J. M., Lohmann, U., Malavelle, F., Mauritsen, T., McCoy, D. T., Myhre, G., Mülmenstädt, J., Neubauer, D., Possner, A., Rugenstein, M., Sato, Y., Schulz, M., Schwartz, S. E., Sourdeval, O., Storelvmo, T., Toll, V., Winker, D., and Stevens, B.: Bounding global aerosol radiative forcing of climate change, Rev. Geophys., 58, e2019RG000660, https://doi.org/10.1029/2019RG000660, 2020.
Bergstrom, R. W., Pilewskie, P., Russell, P. B., Redemann, J., Bond, T. C., Quinn, P. K., and Sierau, B.: Spectral absorption properties of atmospheric aerosols, Atmos. Chem. Phys., 7, 5937–5943, https://doi.org/10.5194/acp-7-5937-2007, 2007.
Bond, T. C., Doherty, S. J., Fahey, D. W., Forster, P. M. Berntsen, T., DeAngelo, B. J., Flanner, M. G., Ghan, S., Kärcher, B., Koch, D., Kinne, S., Kondo, Y., Quinn, P. K., Sarofim, M. C., Schultz, M. G., Schulz, M., Venkataraman, C., Zhang, H., Zhang, S., Bellouin, N., Guttikunda, S. K., Hopke, P. K., Jacobson, M. Z., Kaiser, J. W., Klimont, Z., Lohmann, U., Schwarz, J. P., Shindell, D., Storelvmo, T., Warren, S. G., and Zender, C. S.: Bounding the role of black carbon in the climate system: A scientific assessment, J. Geophys. Res.-Atmos., 118, 5380–5552, https://doi.org/10.1002/jgrd.50171, 2013.
Bowman, D. M. J. S., Balch, J. K., Artaxo, P., Bond, W. J., Carlson, J. M., Cochrane, M. A., D'Antonio, C. M., DeFries, R. S., Doyle, J. C., Harrison, S. P., Johnston, F. H., Keeley, J. E., Krawchuk, M. A., Kull, C. A., Marston, J. B., Moritz, M. A., Prentice, I. C., Roos, C. I., Scott, A. C., Swetnam, T. W., van der Werf, G. R., and Pyne, S. J.: Fire in the earth system, Science, 324, 481–484, https://doi.org/10.1126/science.1163886, 2009.
Brown, H., Liu, X., Pokhrel, K., Murphy, S., Lu, Z., Saleh, R., Mielonen, T., Kokkola, H., Bergman, T., Myhre, G., Skeie, R. B., Watson-Paris, D., Stier, P., Johnson, B., Bellouin, N., Schulz, M., Vakkari, V., Beukes, J. P., van Zyl, P. G., Liu, S., and Chand, D.: Biomass burning aerosols in most climate models are too absorbing, Nat. Commun., 12, 277, https://doi.org/10.1038/s41467-020-20482-9, 2021.
Brown, S. W., Johnson, B. C., Biggar, S. F., Zalewski, E. F., Cooper, J., Hajek, P., Hildum, E., Grant, P., Barnes, R. A., and Butler, J. J.: Radiometric validation of NASA's Ames Research Center's Sensor Calibration Laboratory, Appl. Optics, 44, 6426–6443, https://doi.org/10.1364/AO.44.006426, 2005.
Chand, D., Wood, R., Anderson, T. L., Satheesh, S. K., and Charlson, R. J.: Satellite-derived direct radiative effect of aerosols dependent on cloud cover, Nat. Geosci., 2, 181–184, https://doi.org/10.1038/ngeo437, 2009.
Che, H., Stier, P., Gordon, H., Watson-Parris, D., and Deaconu, L.: Cloud adjustments dominate the overall negative aerosol radiative effects of biomass burning aerosols in UKESM1 climate model simulations over the south-eastern Atlantic, Atmos. Chem. Phys., 21, 17–33, https://doi.org/10.5194/acp-21-17-2021, 2021.
Choi, M., Lyapustin, A., Schuster, G. L., Go, S., Wang, Y., Korkin, S., Kahn, R., Reid, J. S., Hyer, E. J., Eck, T. F., Chin, M., Diner, D. J., Kalashnikova, O., Dubovik, O., Kim, J., and Moosmüller, H.: Light-absorbing black carbon and brown carbon components of smoke aerosol from DSCOVR EPIC measurements over North America and central Africa, Atmos. Chem. Phys., 24, 10543–10565, https://doi.org/10.5194/acp-24-10543-2024, 2024.
Chuvieco, E., Pettinari, M. L., Koutsias, N., Forkel, M., Hantson, S., and Turco, M.: Human and climate drivers of global biomass burning variability, Sci. Total Environ., 779, https://doi.org/10.1016/j.scitotenv.2021.146361, 2021.
Cochrane, S. P., Schmidt, K. S., Chen, H., Pilewskie, P., Kittelman, S., Redemann, J., LeBlanc, S., Pistone, K., Kacenelenbogen, M., Segal Rozenhaimer, M., Shinozuka, Y., Flynn, C., Platnick, S., Meyer, K., Ferrare, R., Burton, S., Hostetler, C., Howell, S., Freitag, S., Dobracki, A., and Doherty, S.: Above-cloud aerosol radiative effects based on ORACLES 2016 and ORACLES 2017 aircraft experiments, Atmos. Meas. Tech., 12, 6505–6528, https://doi.org/10.5194/amt-12-6505-2019, 2019.
Cochrane, S. P., Schmidt, K. S., Chen, H., Pilewskie, P., Kittelman, S., Redemann, J., LeBlanc, S., Pistone, K., Kacenelenbogen, M., Segal Rozenhaimer, M., Shinozuka, Y., Flynn, C., Dobracki, A., Zuidema, P., Howell, S., Freitag, S., and Doherty, S.: Empirically derived parameterizations of the direct aerosol radiative effect based on ORACLES aircraft observations, Atmos. Meas. Tech., 14, 567–593, https://doi.org/10.5194/amt-14-567-2021, 2021.
Cochrane, S. P., Schmidt, K. S., Chen, H., Pilewskie, P., Kittelman, S., Redemann, J., LeBlanc, S., Pistone, K., Segal Rozenhaimer, M., Kacenelenbogen, M., Shinozuka, Y., Flynn, C., Ferrare, R., Burton, S., Hostetler, C., Mallet, M., and Zuidema, P.: Biomass burning aerosol heating rates from the ORACLES (ObseRvations of Aerosols above CLouds and their intEractionS) 2016 and 2017 experiments, Atmos. Meas. Tech., 15, 61–77, https://doi.org/10.5194/amt-15-61-2022, 2022.
Coddington, O., Schmidt, K. S., Pilewskie, P., Gore, W. J., Bergstrom, R. W., Román, M., Redemann, J., Russell, P. B., Liu, J., and Schaaf, C. C.: Aircraft measurements of spectral surface albedo and its consistency with ground-based and space-borne observations, J. Geophys. Res.-Atmos., 113, D17, https://doi.org/10.1029/2008JD010089, 2008.
Collier, S., Zhou, S., Onasch, T. B., Jaffe, D. A., Kleinman, L., Sedlacek III, A. J., Briggs, N. L., Hee, J., Fortner, E., Shilling, J. E., Worsnop, D., Yokelson, R. J., Parworth, C., Ge, X., Xu, J., Butterfield, Z., Chand, D., Dubey, M. K., Pekour, M. S., Springston, S., and Zhang, Q.: Regional influence of aerosol emissions from fires driven by combustion efficiency: Insights from the BBOP campaign, Environ. Sci. Technol., 50, 8613–8622, https://doi.org/10.1021/acs.est.6b01617, 2016.
Dang, C., Segal-Rozenhaimer, M., Che, H., Zhang, L., Formenti, P., Taylor, J., Dobracki, A., Purdue, S., Wong, P.-S., Nenes, A., Sedlacek III, A., Coe, H., Redemann, J., Zuidema, P., Howell, S., and Haywood, J.: Biomass burning and marine aerosol processing over the southeast Atlantic Ocean: a TEM single-particle analysis, Atmos. Chem. Phys., 22, 9389–9412, https://doi.org/10.5194/acp-22-9389-2022, 2022.
de Graaf, M., Bellouin, N., Tilstra, L. G., Haywood, J., and Stammes, P.: Aerosol direct radiative effect of smoke over clouds over the southeast Atlantic Ocean from 2006 to 2009, Geophys. Res. Lett., 41, 7723–7730, https://doi.org/10.1002/2014GL061103, 2014.
Denjean, C., Brito, J., Libois, Q., Mallet, M., Bourrianne, T., Burnet, F., Dupuy, R., Flamant, C., and Knippertz, P.: Unexpected biomass burning aerosol absorption enhancement explained by black carbon mixing state, Geophys. Res. Lett., 47, e2020GL089055, https://doi.org/10.1029/2020GL089055, 2020.
Dobracki, A., Zuidema, P., Howell, S. G., Saide, P., Freitag, S., Aiken, A. C., Burton, S. P., Sedlacek III, A. J., Redemann, J., and Wood, R.: An attribution of the low single-scattering albedo of biomass burning aerosol over the southeastern Atlantic, Atmos. Chem. Phys., 23, 4775–4799, https://doi.org/10.5194/acp-23-4775-2023, 2023.
Dobracki, A., Lewis, E. R., Sedlacek III, A. J., Tatro, T., Zawadowicz, M. A., and Zuidema, P.: Burning conditions and transportation pathways determine biomass-burning aerosol properties in the Ascension Island marine boundary layer, Atmos. Chem. Phys., 25, 2333–2363, https://doi.org/10.5194/acp-25-2333-2025, 2025.
Doherty, S. J., Saide, P. E., Zuidema, P., Shinozuka, Y., Ferrada, G. A., Gordon, H., Mallet, M., Meyer, K., Painemal, D., Howell, S. G., Freitag, S., Dobracki, A., Podolske, J. R., Burton, S. P., Ferrare, R. A., Howes, C., Nabat, P., Carmichael, G. R., da Silva, A., Pistone, K., Chang, I., Gao, L., Wood, R., and Redemann, J.: Modeled and observed properties related to the direct aerosol radiative effect of biomass burning aerosol over the southeastern Atlantic, Atmos. Chem. Phys., 22, 1–46, https://doi.org/10.5194/acp-22-1-2022, 2022.
Dubovik, O. and King, M. D.: A flexible inversion algorithm for retrieval of aerosol optical properties from Sun and sky radiance measurements, J. Geophys. Res.-Atmos., 105, 20673–20696, https://doi.org/10.1029/2000JD900282, 2000.
Dunagan, S. E., Johnson, R., Zavaleta, J., Russell, P. B., Schmid, B., Flynn, C., Redemann, J., Shinozuka, Y., Livingston, J., Segal-Rosenhaimer, M.: Spectrometer for Sky-Scanning Sun-Tracking Atmospheric Research (4STAR): Instrument Technology, Remote Sens.-Basel, 5, 3872–3895, https://doi.org/10.3390/rs5083872, 2013.
Eck, T. F., Holben, B. N., Reid, J. S., Mukelabai, M. M., Piketh, S. J., Torres, O., Jethva, H. T., Hyer, E. J., Ward, D. E., Dubovik, O., Sinyuk, A., Schafer, J. S., Giles, D. M., Sorokin, M., Smirnov, A., and Slutsker, I.: A seasonal trend of single scattering albedo in southern African biomass-burning particles: Implications for satellite products and estimates of emissions for the world's largest biomass-burning source, J. Geophys. Res.-Atmos., 118, 6414–6432, https://doi.org/10.1002/jgrd.50500, 2013.
Fakoya, A. A., Redemann, J., Saide, P. E., Gao, L., Mitchell, L. T., Howes, C., Dobracki, A., Chang, I., Ferrada, G. A., Pistone, K., Leblanc, S. E., Segal-Rozenhaimer, M., Sedlacek III, A. J., Eck, T., Holben, B., Gupta, P., Lind, E., Zuidema, P., Carmichael, G., and Flynn, C. J.: Atmospheric processing and aerosol aging responsible for observed increase in absorptivity of long-range-transported smoke over the southeast Atlantic, Atmos. Chem. Phys., 25, 7879–7902, https://doi.org/10.5194/acp-25-7879-2025, 2025.
Formenti, P., D'Anna, B., Flamant, C., Mallet, M., Piketh, S. J., Schepanski, K., Waquet, F., Auriol, F., Brogniez, G., Burnet, F., Chaboureau, J.-P., Chauvigné, A., Chazette, P., Denjean, C., Desboeufs, K., Doussin, J.-F., Elguindi, N., Feuerstein, S., Gaetani, M., Giorio, C., Klopper, D., Mallet, M. D., Nabat, P., Monod, A., Solmon, F., Namwoonde, A., Chikwililwa, C., Mushi, R., Welton, E. J., and Holben, B.: The Aerosols, Radiation and Clouds in Southern Africa field campaign in Namibia: Overview, illustrative observations, and way forward, B. Am. Meteorol. Soc., 100, 1277–1298, https://doi.org/10.1175/bams-d-17-0278.1, 2019.
Giles, D. M., Sinyuk, A., Sorokin, M. G., Schafer, J. S., Smirnov, A., Slutsker, I., Eck, T. F., Holben, B. N., Lewis, J. R., Campbell, J. R., Welton, E. J., Korkin, S. V., and Lyapustin, A. I.: Advancements in the Aerosol Robotic Network (AERONET) Version 3 database – automated near-real-time quality control algorithm with improved cloud screening for Sun photometer aerosol optical depth (AOD) measurements, Atmos. Meas. Tech., 12, 169–209, https://doi.org/10.5194/amt-12-169-2019, 2019.
Global Modeling and Assimilation Office (GMAO): MERRA-2 tavgM_2d_aer_Nx, 2d, Monthly mean, Time-averaged, Single-Level, Assimilation, Aerosol Diagnostics V5.12.4, Goddard Earth Sciences Data and Information Services Center (GES DISC) [data set], https://doi.org/10.5067/FH9A0MLJPC7N, 2015.
Granier, C., Bessagnet, B., Bond, T., D'Angiola, A., Denier van der Gon, H., Frost, G. J., Heil, A., Kaiser, J. W., Kinne, S., Klimont, Z., Kloster, S., Lamarque, J.-F., Liousse, C., Masui, T., Meleux, F., Mieville, A., Ohara, T., Raut, J.-C., Riahi, K., Schultz, M. G., Smith, S. J., Thompson, A., van Aardenne, J., van der Werf, G. R., and van Vuuren, D. P.: Evolution of anthropogenic and biomass burning emissions of air pollutants at global and regional scales during the 1980–2010 period, Climatic Change, 109, 163, https://doi.org/10.1007/s10584-011-0154-1, 2011.
Haywood, J. M., Abel, S. J., Barrett, P. A., Bellouin, N., Blyth, A., Bower, K. N., Brooks, M., Carslaw, K., Che, H., Coe, H., Cotterell, M. I., Crawford, I., Cui, Z., Davies, N., Dingley, B., Field, P., Formenti, P., Gordon, H., de Graaf, M., Herbert, R., Johnson, B., Jones, A. C., Langridge, J. M., Malavelle, F., Partridge, D. G., Peers, F., Redemann, J., Stier, P., Szpek, K., Taylor, J. W., Watson-Parris, D., Wood, R., Wu, H., and Zuidema, P.: The CLoud–Aerosol–Radiation Interaction and Forcing: Year 2017 (CLARIFY-2017) measurement campaign, Atmos. Chem. Phys., 21, 1049–1084, https://doi.org/10.5194/acp-21-1049-2021, 2021.
Holanda, B. A., Pöhlker, M. L., Walter, D., Saturno, J., Sörgel, M., Ditas, J., Ditas, F., Schulz, C., Franco, M. A., Wang, Q., Donth, T., Artaxo, P., Barbosa, H. M. J., Borrmann, S., Braga, R., Brito, J., Cheng, Y., Dollner, M., Kaiser, J. W., Klimach, T., Knote, C., Krüger, O. O., Fütterer, D., Lavrič, J. V., Ma, N., Machado, L. A. T., Ming, J., Morais, F. G., Paulsen, H., Sauer, D., Schlager, H., Schneider, J., Su, H., Weinzierl, B., Walser, A., Wendisch, M., Ziereis, H., Zöger, M., Pöschl, U., Andreae, M. O., and Pöhlker, C.: Influx of African biomass burning aerosol during the Amazonian dry season through layered transatlantic transport of black carbon-rich smoke, Atmos. Chem. Phys., 20, 4757–4785, https://doi.org/10.5194/acp-20-4757-2020, 2020.
Holben, B. N., Eck, T. F., Slutsker, I., Tanré, D., Buis, J. P., Setzer, A., Vermote, E., Reagan, J. A., Kaufman, Y. J., Nakajima, T., Lavenu, F., Jankowiak, I., and Smirnov, A.: AERONET – A federated instrument network and data archive for aerosol characterization, Remote Sens. Environ., 66, 1–16, https://doi.org/10.1016/S0034-4257(98)00031-5, 1998.
Holben, B. N., Eck, T. F., Slutsker, I., Smirnov, A., Sinyuk, A., Schafer, J. S., Giles, D. M., and Dubovik, O.: AERONET's version 2.0 quality assurance criteria, Remote Sensing of Atmosphere and Clouds, Proc. SPIE, 6408, 64080Q, https://doi.org/10.1117/12.706524, 2006.
Keil, A. and Haywood, J. M.: Solar radiative forcing by biomass burning aerosol particles during SAFARI 2000: A case study based on measured aerosol and cloud properties, J. Geophys. Res.-Atmos., 108, 8467, https://doi.org/10.1029/2002JD002315, 2003.
Jen, C. N., Hatch, L. E., Selimovic, V., Yokelson, R. J., Weber, R., Fernandez, A. E., Kreisberg, N. M., Barsanti, K. C., and Goldstein, A. H.: Speciated and total emission factors of particulate organics from burning western US wildland fuels and their dependence on combustion efficiency, Atmos. Chem. Phys., 19, 1013–1026, https://doi.org/10.5194/acp-19-1013-2019, 2019.
Jethva, H. T., Torres, O., Ferrare, R. A., Burton, S. P., Cook, A. L., Harper, D. B., Hostetler, C. A., Redemann, J., Kayetha, V., LeBlanc, S., Pistone, K., Mitchell, L., and Flynn, C. J.: Retrieving UV–Vis spectral single-scattering albedo of absorbing aerosols above clouds from synergy of ORACLES airborne and A-train sensors, Atmos. Meas. Tech., 17, 2335–2366, https://doi.org/10.5194/amt-17-2335-2024, 2024.
LeBlanc, S. E., Redemann, J., Flynn, C., Pistone, K., Kacenelenbogen, M., Segal-Rosenheimer, M., Shinozuka, Y., Dunagan, S., Dahlgren, R. P., Meyer, K., Podolske, J., Howell, S. G., Freitag, S., Small-Griswold, J., Holben, B., Diamond, M., Wood, R., Formenti, P., Piketh, S., Maggs-Kölling, G., Gerber, M., and Namwoonde, A.: Above-cloud aerosol optical depth from airborne observations in the southeast Atlantic, Atmos. Chem. Phys., 20, 1565–1590, https://doi.org/10.5194/acp-20-1565-2020, 2020.
Levin, E. J. T., McMeeking, G. R., Carrico, C. M., Mack, L. E., Kreidenweis, S. M., Wold, C. E., Moosmüller, H., Arnott, W. P., Hao, W. M., Collett Jr., J. L., and Malm, W. C.: Biomass burning smoke aerosol properties measured during Fire Laboratory at Missoula Experiments (FLAME), J. Geophys. Res.-Atmos., 115, D18210, https://doi.org/10.1029/2009JD013601, 2010.
Liu, C., Chung, C. E., Yin, Y., and Schnaiter, M.: The absorption Ångström exponent of black carbon: from numerical aspects, Atmos. Chem. Phys., 18, 6259–6273, https://doi.org/10.5194/acp-18-6259-2018, 2018.
Mallet, M., Solmon, F., Nabat, P., Elguindi, N., Waquet, F., Bouniol, D., Sayer, A. M., Meyer, K., Roehrig, R., Michou, M., Zuidema, P., Flamant, C., Redemann, J., and Formenti, P.: Direct and semi-direct radiative forcing of biomass-burning aerosols over the southeast Atlantic (SEA) and its sensitivity to absorbing properties: a regional climate modeling study, Atmos. Chem. Phys., 20, 13191–13216, https://doi.org/10.5194/acp-20-13191-2020, 2020.
Meyer, K., Platnick, S., Oreopoulos, L., and Lee, D.: Estimating the direct radiative effect of absorbing aerosols overlying marine boundary layer clouds in the southeast Atlantic using MODIS and CALIOP, J. Geophys. Res.-Atmos., 118, 4801–4815, https://doi.org/10.1002/jgrd.50449, 2013.
Mitchell, L. T., Flynn, C. J., Pistone, K., LeBlanc, S. E., Schmidt, K. S., and Redemann, J.: The complete 3-year dataset of 4STAR sky-scans from ORACLES 2016–2018, Earth Syst. Sci. Data, 17, 5303–5313, https://doi.org/10.5194/essd-17-5303-2025, 2025.
Moosmüller, H., Engelbrecht, J. P., Skiba, M., Frey, G., Chakrabarty, R. K., and Arnott, W. P.: Single scattering albedo of fine mineral dust aerosols controlled by iron concentration, J. Geophys. Res.-Atmos., 117, D11210, https://doi.org/10.1029/2011JD016909, 2012.
NASA GSFC: AERONET, https://aeronet.gsfc.nasa.gov/, last access: 10 January 2026.
NASA/LARC/SD/ASDC: ORACLES Aerosol Aircraft In Situ Data, NASA Langley Atmospheric Science Data Center DAAC [data set], https://doi.org/10.5067/ASDC_DAAC/ORACLES_Aerosol_AircraftInSitu_Data_1, 2020.
NASA MODIS Science Data Support Team: VIIRS (NOAA-21/JPSS-2) I Band 375 m Active Fire Product NRT (Vector data), NASA LANCE MODIS at the MODAPS [data set], https://doi.org/10.5067/FIRMS/MODIS/MCD14DL.NRT.0061, 2021.
NOAA Air Resources Laboratory: HYSPLIT transport model and READY website, https://www.ready.noaa.gov/, last access: 5 June 2026.
Pistone, K., Redemann, J., Doherty, S., Zuidema, P., Burton, S., Cairns, B., Cochrane, S., Ferrare, R., Flynn, C., Freitag, S., Howell, S. G., Kacenelenbogen, M., LeBlanc, S., Liu, X., Schmidt, K. S., Sedlacek III, A. J., Segal-Rozenhaimer, M., Shinozuka, Y., Stamnes, S., van Diedenhoven, B., Van Harten, G., and Xu, F.: Intercomparison of biomass burning aerosol optical properties from in situ and remote-sensing instruments in ORACLES-2016, Atmos. Chem. Phys., 19, 9181–9208, https://doi.org/10.5194/acp-19-9181-2019, 2019.
Pistone, K., Zuidema, P., Wood, R., Diamond, M., da Silva, A. M., Ferrada, G., Saide, P. E., Ueyama, R., Ryoo, J.-M., Pfister, L., Podolske, J., Noone, D., Bennett, R., Stith, E., Carmichael, G., Redemann, J., Flynn, C., LeBlanc, S., Segal-Rozenhaimer, M., and Shinozuka, Y.: Exploring the elevated water vapor signal associated with the free tropospheric biomass burning plume over the southeast Atlantic Ocean, Atmos. Chem. Phys., 21, 9643–9668, https://doi.org/10.5194/acp-21-9643-2021, 2021.
Pistone, K., Wilcox, E. M., Zuidema, P., Giordano, M., Podolske, J., LeBlanc, S. E., Kacenelenbogen, M., Howell, S. G., and Freitag, S.: Vertical structure of a springtime smoky and humid troposphere over the southeast Atlantic from aircraft and reanalysis, Atmos. Chem. Phys., 24, 7983–8005, https://doi.org/10.5194/acp-24-7983-2024, 2024.
Queface, A. J., Piketh, S. J., Eck, T. F., Tsay, S.-C., and Mavume, A. F.: Climatology of aerosol optical properties in Southern Africa, Atmos. Environ., 45, 2910–2921, https://doi.org/10.1016/j.atmosenv.2011.01.056, 2011.
Redemann, J., Zhang, Q., Schmid, B., Russell, P. B., Livingston, J. M., Jonsson, H., and Remer, L. A.: Assessment of MODIS-derived visible and near-IR aerosol optical properties and their spatial variability in the presence of mineral dust, Geophys. Res. Lett., 33, L18814, https://doi.org/10.1029/2006GL026626, 2006.
Redemann, J., Wood, R., Zuidema, P., Doherty, S. J., Luna, B., LeBlanc, S. E., Diamond, M. S., Shinozuka, Y., Chang, I. Y., Ueyama, R., Pfister, L., Ryoo, J.-M., Dobracki, A. N., da Silva, A. M., Longo, K. M., Kacenelenbogen, M. S., Flynn, C. J., Pistone, K., Knox, N. M., Piketh, S. J., Haywood, J. M., Formenti, P., Mallet, M., Stier, P., Ackerman, A. S., Bauer, S. E., Fridlind, A. M., Carmichael, G. R., Saide, P. E., Ferrada, G. A., Howell, S. G., Freitag, S., Cairns, B., Holben, B. N., Knobelspiesse, K. D., Tanelli, S., L'Ecuyer, T. S., Dzambo, A. M., Sy, O. O., McFarquhar, G. M., Poellot, M. R., Gupta, S., O'Brien, J. R., Nenes, A., Kacarab, M., Wong, J. P. S., Small-Griswold, J. D., Thornhill, K. L., Noone, D., Podolske, J. R., Schmidt, K. S., Pilewskie, P., Chen, H., Cochrane, S. P., Sedlacek, A. J., Lang, T. J., Stith, E., Segal-Rozenhaimer, M., Ferrare, R. A., Burton, S. P., Hostetler, C. A., Diner, D. J., Seidel, F. C., Platnick, S. E., Myers, J. S., Meyer, K. G., Spangenberg, D. A., Maring, H., and Gao, L.: An overview of the ORACLES (ObseRvations of Aerosols above CLouds and their intEractionS) project: aerosol–cloud–radiation interactions in the southeast Atlantic basin, Atmos. Chem. Phys., 21, 1507–1563, https://doi.org/10.5194/acp-21-1507-2021, 2021.
Rolph, G., Stein, A., and Stunder, B.: Real-time Environmental Applications and Display sYstem: READY, Environ. Modell. Softw., 95, 210–228, https://doi.org/10.1016/j.envsoft.2017.06.025, 2017.
Román, R., Benavent-Oltra, J. A., Casquero-Vera, J. A., Lopatin, A., Cazorla, A., Lyamani, H., Denjean, C., Fuertes, D., Pérez-Ramírez, D., Torres, B., Toledano, C., Dubovik, O., Cachorro, V. E., de Frutos, A. M., Olmo, F. J., and Alados-Arboledas, L.: Retrieval of aerosol profiles combining sunphotometer and ceilometer measurements in GRASP code, Atmos. Res., 204, 161–177, https://doi.org/10.1016/j.atmosres.2018.01.021, 2018.
Russell, P. B., Bergstrom, R. W., Shinozuka, Y., Clarke, A. D., DeCarlo, P. F., Jimenez, J. L., Livingston, J. M., Redemann, J., Dubovik, O., and Strawa, A.: Absorption Angstrom Exponent in AERONET and related data as an indicator of aerosol composition, Atmos. Chem. Phys., 10, 1155–1169, https://doi.org/10.5194/acp-10-1155-2010, 2010.
Ryoo, J.-M., Pfister, L., Ueyama, R., Zuidema, P., Wood, R., Chang, I., and Redemann, J.: A meteorological overview of the ORACLES (ObseRvations of Aerosols above CLouds and their intEractionS) campaign over the southeastern Atlantic during 2016–2018: Part 1 – Climatology, Atmos. Chem. Phys., 21, 16689–16707, https://doi.org/10.5194/acp-21-16689-2021, 2021.
Sakaeda, N., Wood, R., and Rasch, P. J.: Direct and semidirect aerosol effects of southern African biomass burning aerosol, J. Geophys. Res.-Atmos., 116, D12, https://doi.org/10.1029/2010JD015540, 2011.
Schmid, B. and Wehrli, C.: Comparison of Sun photometer calibration by use of the Langley technique and the standard lamp, Appl. Optics, 34, 4500–4512, https://doi.org/10.1364/AO.34.004500, 1995.
Schmidt, S. and Pilewskie, P.: Airborne measurements of spectral shortwave radiation in cloud and aerosol remote sensing and energy budget studies, in: Light Scattering Reviews, vol. 6, edited by: Kokhanovsky, A. A., Springer, Berlin, Heidelberg, Germany, 239–288, https://doi.org/10.1007/978-3-642-15531-4_6, 2012.
Schmidt, K. S., Wendisch, M., and Kindel, B.: Airborne solar radiation sensors, in: Springer Handbook of Atmospheric Measurements, edited by: Foken, T., Springer, Cham, Switzerland, 1131–1150, https://doi.org/10.1007/978-3-030-52171-4_40, 2021.
Schuster, G. L., Dubovik, O., and Holben, B. N.: Angstrom exponent and bimodal aerosol size distributions, J. Geophys. Res.-Atmos., 111, D07207, https://doi.org/10.1029/2005JD006328, 2006.
Sedlacek, A. J., III, Lewis, E. R., Onasch, T. B., Zuidema, P., Redemann, J., Jaffe, D., and Kleinman, L. I.: Using the Black Carbon Particle Mixing State to Characterize the Lifecycle of Biomass Burning Aerosols, Environ. Sci. Technol., 56, 14315–14325, https://doi.org/10.1021/acs.est.2c03851, 2022.
Segal-Rosenheimer, M., Russell, P. B., Schmid, B., Redemann, J., Livingston, J. M., Flynn, C. J., Johnson, R. R., Dunagan, S. E., Shinozuka, Y., Herman, J., Cede, A., Abuhassan, N., Comstock, J. M., Hubbe, J. M., Zelenyuk, A., and Wilson, J.: Tracking elevated pollution layers with a newly developed hyperspectral sun/sky spectrometer (4STAR): Results from the TCAP 2012 and 2013 campaigns. J. Geophys. Res.-Atmos., 119, 5, 2611–2628, https://doi.org/10.1002/2013JD020884, 2014.
Sinyuk, A., Holben, B. N., Eck, T. F., Giles, D. M., Slutsker, I., Korkin, S., Schafer, J. S., Smirnov, A., Sorokin, M., and Lyapustin, A.: The AERONET Version 3 aerosol retrieval algorithm, associated uncertainties and comparisons to Version 2, Atmos. Meas. Tech., 13, 3375–3411, https://doi.org/10.5194/amt-13-3375-2020, 2020.
Stein, A. F., Draxler, R. R., Rolph, G. D., Stunder, B. J. B., Cohen, M. D., and Ngan, F.: NOAA's HYSPLIT atmospheric transport and dispersion modeling system, B. Am. Meteorol. Soc., 96, 2059–2077, https://doi.org/10.1175/BAMS-D-14-00110.1, 2015.
Stier, P., Schutgens, N. A. J., Bellouin, N., Bian, H., Boucher, O., Chin, M., Ghan, S., Huneeus, N., Kinne, S., Lin, G., Ma, X., Myhre, G., Penner, J. E., Randles, C. A., Samset, B., Schulz, M., Takemura, T., Yu, F., Yu, H., and Zhou, C.: Host model uncertainties in aerosol radiative forcing estimates: results from the AeroCom Prescribed intercomparison study, Atmos. Chem. Phys., 13, 3245–3270, https://doi.org/10.5194/acp-13-3245-2013, 2013.
Takemura, T., Nakajima, T., Dubovik, O., Holben, B. N., and Kinne, S.: Single-scattering albedo and radiative forcing of various aerosol species with a global three-dimensional model, J. Climate, 15, 333–352, https://doi.org/10.1175/1520-0442(2002)015<0333:SSAARF>2.0.CO;2, 2002.
Tatro, T. and Zuidema, P.: More biomass burning aerosol is being advected westward over the southern tropical Atlantic since 2003, Sci. Total Environ., 965, https://doi.org/10.1016/j.scitotenv.2025.178506, 2025.
Taylor, J. W., Wu, H., Szpek, K., Bower, K., Crawford, I., Flynn, M. J., Williams, P. I., Dorsey, J., Langridge, J. M., Cotterell, M. I., Fox, C., Davies, N. W., Haywood, J. M., and Coe, H.: Absorption closure in highly aged biomass burning smoke, Atmos. Chem. Phys., 20, 11201–11221, https://doi.org/10.5194/acp-20-11201-2020, 2020.
van der Werf, G. R., Randerson, J. T., Giglio, L., Collatz, G. J., Mu, M., Kasibhatla, P. S., Morton, D. C., DeFries, R. S., Jin, Y., and van Leeuwen, T. T.: Global fire emissions and the contribution of deforestation, savanna, forest, agricultural, and peat fires (1997–2009), Atmos. Chem. Phys., 10, 11707–11735, https://doi.org/10.5194/acp-10-11707-2010, 2010.
Virkkula, A.: Correction of the calibration of the 3-wavelength Particle Soot Absorption Photometer (3λ PSAP), Aerosol Sci. Tech., 44, 8, 706–712, https://doi.org/10.1080/02786826.2010.482110, 2010.
Waquet, F., Peers, F., Ducos, F., Goloub, P., Platnick, S., Riedi, J., Tanré, D., and Thieuleux, F.: Global analysis of aerosol properties above clouds, Geophys. Res. Lett., 40, 5809–5814, https://doi.org/10.1002/2013GL057482, 2013.
Wilcox, E. M.: Direct and semi-direct radiative forcing of smoke aerosols over clouds, Atmos. Chem. Phys., 12, 139–149, https://doi.org/10.5194/acp-12-139-2012, 2012.
Wu, H., Taylor, J. W., Szpek, K., Langridge, J. M., Williams, P. I., Flynn, M., Allan, J. D., Abel, S. J., Pitt, J., Cotterell, M. I., Fox, C., Davies, N. W., Haywood, J., and Coe, H.: Vertical variability of the properties of highly aged biomass burning aerosol transported over the southeast Atlantic during CLARIFY-2017, Atmos. Chem. Phys., 20, 12697–12719, https://doi.org/10.5194/acp-20-12697-2020, 2020.
Zhang, A., Wang, Y., Zhang, Y., Weber, R. J., Song, Y., Ke, Z., and Zou, Y.: Modeling the global radiative effect of brown carbon: a potentially larger heating source in the tropical free troposphere than black carbon, Atmos. Chem. Phys., 20, 1901–1920, https://doi.org/10.5194/acp-20-1901-2020, 2020.
Zhang, L., Segal-Rozenhaimer, M., Che, H., Dang, C., Sedlacek III, A. J., Lewis, E. R., Dobracki, A., Wong, J. P. S., Formenti, P., Howell, S. G., and Nenes, A.: Light absorption by brown carbon over the South-East Atlantic Ocean, Atmos. Chem. Phys., 22, 9199–9213, https://doi.org/10.5194/acp-22-9199-2022, 2022.
Zuidema, P., Redemann, J., Haywood, J., Wood, R., Piketh, S. J., Hipondoka, M., and Formenti, P.: Smoke and Clouds above the Southeast Atlantic: Upcoming Field Campaigns Probe Absorbing Aerosol's Impact on Climate, B. Am. Meteorol. Soc., 97, 1131–1135, https://doi.org/10.1175/BAMS-D-15-00082.1, 2016.
Zuidema, P., Sedlacek III, A. J., Flynn, C., Springston, S., Delgadillo, R., Zhang, J., Aiken, A. C., Koontz, A., and Muradyan, P.: The Ascension Island boundary layer in the remote Southeast Atlantic is often smoky, Geophys. Res. Lett., 45, 4456–4465, https://doi.org/10.1002/2017GL076926, 2018.