
the Creative Commons Attribution 4.0 License.
the Creative Commons Attribution 4.0 License.
 | 16 Sep 2026
Advanced insights into biomass burning aerosols during the 2023 Canadian wildfires from dual-site Raman and fluorescence lidar observations
Qiaoyun Hu

Philippe Goloub
Igor Veselovskii
Thierry Podvin
Gaël Dubois
Sergey Khaykin
William Boissière
Fabrice Ducos
Mikhail Korenskiy
Wildfires, as a major source of aerosols, affect air quality and climate at regional and global scales. Fluorescence lidar is a promising technique for characterizing biomass burning aerosols (BBAs) from wildfires, as it detects signals from fluorescent organic compounds in BBAs in addition to elastic and Raman backscatter. However, published fluorescence lidar studies on BBAs remain largely limited to sparse single-site case studies, hindering the development of the technique and a systematic characterization of BBA properties. This study presents dual-site observations of transported BBAs from the exceptional 2023 Canadian wildfires, recorded between May and September at the ATOLL observatory (France) and the GPI site (Russia). ATOLL operates a multi-wavelength Raman lidar with one fluorescence channel at 466 nm; GPI operates a five-channel broadband fluorescence lidar excited at 355 nm. This dual-site dataset combines elastic, depolarization, and fluorescence observations in free troposphere (FT) and upper troposphere–lower stratosphere (UTLS). Compared with FT layers, UTLS layers exhibit higher depolarization, slightly lower lidar ratios, lower Ångström exponents, and a redshift in fluorescence spectral peaks. Cross-site comparisons reveal consistent fluorescence magnitudes and spectral shapes. Depolarization ratio, Ångström exponent, and fluorescence color ratio are moderately correlated with altitude (r2≈0.61–0.68), although altitude likely acts as an intermediate variable governed by plume injection height, in-layer temperature, and plume origin. Finally, the near-absence of hygroscopic growth at RH of 90 %–100 % challenges the assumption that aged BBAs are typically hygroscopic, suggesting their water uptake properties may be more complex than currently represented in climate models.
- Article
(13315 KB) - Full-text XML
- BibTeX
- EndNote


Biomass burning aerosol (BBA) particles originating from wildfire burning are an important atmospheric aerosol component. The Canadian wildfires in 2023 have been unprecedented due to the scale and intensity, with a record-breaking burned area of approximately 15 million hectares. The estimated carbon emission is approximately 647 TgC, comparable to the annual fossil fuel emissions of moderately large nations (Byrne et al., 2024; Jain et al., 2024; Khaykin et al., 2025). Large amounts of particles and vapors are emitted into the atmosphere during wildfire combustion. Depending on the injection height, BBAs from wildfires could remain for several weeks or months before being removed from the atmosphere by wet or dry deposition. Atmospheric BBA particles influence the radiation budget directly by interacting with the solar radiation budget, and indirectly by changing cloud properties and processes. Through atmospheric circulations, BBA particles can distribute over the globe and reach remote regions, influencing air quality and climate over a global scale (Schill et al., 2020). If injected into the stratosphere, BBA particles could also impact the stratospheric chemistry and deteriorate the depletion of ozone layers (Trickl et al., 2015; Ansmann et al., 2022; Ohneiser et al., 2022; Solomon et al., 2022). Freshly emitted BBA particles rapidly enter into an aging process, involving a series of complex and competing chemical and physical processes, such as oxidation, coagulation, condensation, dilution, and evaporation. Aged BBA particles are typically composed of black carbon (BC) cores and organic carbon (OC) coatings. The BC cores represent only a few percent of the total mass, while the OC coatings dominate the particle mass (Yu et al., 2019; Czech et al., 2024). During the transport of BBA plumes, these processes continuously alter the chemical composition and the physical properties of the particles. However, our understanding of long-range transported BBA particles, for example, those involved in intercontinental transport, is still limited. Laboratory experiments face challenges in simulating the aging process over a long period. Similarly, field observations targeted on long-range transported BBA plumes are resource-intensive and limited by the uncontrollable field conditions and long distance tracking of BBA plumes. Furthermore, the aging conditions in the ambient atmosphere are more complicated, as it involves cloud processing and exposure to various precursor species during the transport.
Multi-wavelength lidar measurements have provided crucial insights into the properties and impacts of long-range transported BBAs. These lidar measurements have shown that the particle size of BBAs, after long range transport, is typically bigger than that detected near the source region (Müller et al., 2007; June et al., 2022). The increase in particle size enhances their effectiveness as cloud condensation nuclei (CCN). Lidar measurements also revealed unexpectedly high depolarization ratios in BBA layers in the upper troposphere and lower stratosphere (UTLS), in contrast to the free troposphere (FT). This could be explained by the irregular morphology of BBA particles, attributable to the aging process or the lifting mechanisms during the emission. Additionally, lidar observations provide unique information for the study of aerosol-cloud-interaction (Reichardt, 2014). Ice cloud formation was usually observed simultaneously with BBA plumes, suggesting that BBA particles may act as INPs in the atmosphere (Reichardt et al., 2018, 2025; Hu et al., 2022; Mamouri et al., 2023; Ansmann et al., 2025). The organic species in BBAs, such as the Humic-like substance, polycyclic aromatic hydrocarbon (PAH) and some secondary organic aerosols (SOA) formed during the aging process, are effective fluorophores, making them a good target for laser-induced fluorescence (LIF) lidar (Lee et al., 2013; Garra et al., 2015; Zhang et al., 2019). The fluorescence capacity and the fluorescence spectrum are related to the concentration and the species of the fluorophores in the total aerosol mass. Therefore, the LIF lidar can provide a new dimension of information to aerosol characterization, as the fluorescence signatures (i.e., the fluorescence capacity and spectrum) provide a link to aerosol chemical composition. Currently, there are basically two types of LIF lidar systems—one utilizes single-channel broadband fluorescence channel, which can be conveniently integrated into existing lidar system, and the other detects the fluorescence spectrum with spectrometers (Sugimoto et al., 2012; Reichardt, 2014; Reichardt et al., 2023, 2022) or broadband interference filters at selected spectral range(Veselovskii et al., 2023, 2020; Gast et al., 2025). Observations of aged BBA particles from LIF lidar systems showed particles originating from wildfires have strong fluorescence efficiency, making them distinguishable from other aerosol types and detectable even in some cloud conditions. Additionally, the fluorescence capacity and spectrum of BBAs varied case-to-case, which is probably linked with the fire source, aging condition and lifting mechanism (Reichardt et al., 2022; Veselovskii et al., 2025). However, at the current stage, the sparsity and heterogeneity of existing LIF lidar systems, as well as the gap between field observation, particularly remote sensing observations, and laboratory measurements hinder the understanding of aged BBA properties, their aging process and role in the atmosphere.
In this study, we analyzed the observations of long-range transported BBA plumes from Canadian wildfires in 2023 with two LIF lidar systems at different locations–a multi-wavelength Mie-Raman-polarization lidar equipped with a single broadband fluorescence channel in France and a 5-channel fluorescence lidar in Russia. The two lidar systems are located downwind of long-range transported BBA plumes from Canada. In 2023, both lidar systems accumulated a rich dataset of BBA observation due to the long wildfire season lasting from May to September. The dataset provides complementary information about BBA properties, allowing us to bridge the gap caused by lidar configurations. The description of two lidar systems is presented in Sect. 2, and followed by the case analysis, where important features of BBA particles are demonstrated case-by-case. Additionally, we present a cross-comparison of fluorescence measurements between four lidar systems and the statistical results of BBA properties recorded in the 5-month observation in 2023, providing a comprehensive characterization of BBA particles with LIF lidar observations.
Lidar observations presented in this study are obtained from two lidar systems operated at two different sites – ATOLL observatory (50.611° N, 3.142° E), France and GPI (General Physics Institute of the Russian Academy of Sciences, 55.235° N, 37.548° E) in Moscow, Russia. The distance between the two sites is about 2300 km. Influenced by the polar jet stream and pressure systems over the Atlantic Ocean, air mass transport from North America to the two lidar stations follows typically 2 pathways. The first is a more zonal (west-to-east) flow across the North Atlantic, reaching the ATOLL observatory, while the second is shifted northeastward, passing through the polar region and/or the Scandinavia to reach Moscow. The influence of polar jet stream results in cooler and drier air masses reaching Moscow, whereas the air masses arriving at ATOLL may pick up moisture as they traverse the Atlantic Ocean (Barry and Chorley, 2009; Wallace and Hobbs, 2006). Figure 1 shows the geographical locations of the two sites and the 7 d back trajectories of air mass at 5000 m reaching the two sites, dating back from 20:00 UTC, 14 May 2023, which is the onset of the BBA observation for both sites in 2023.
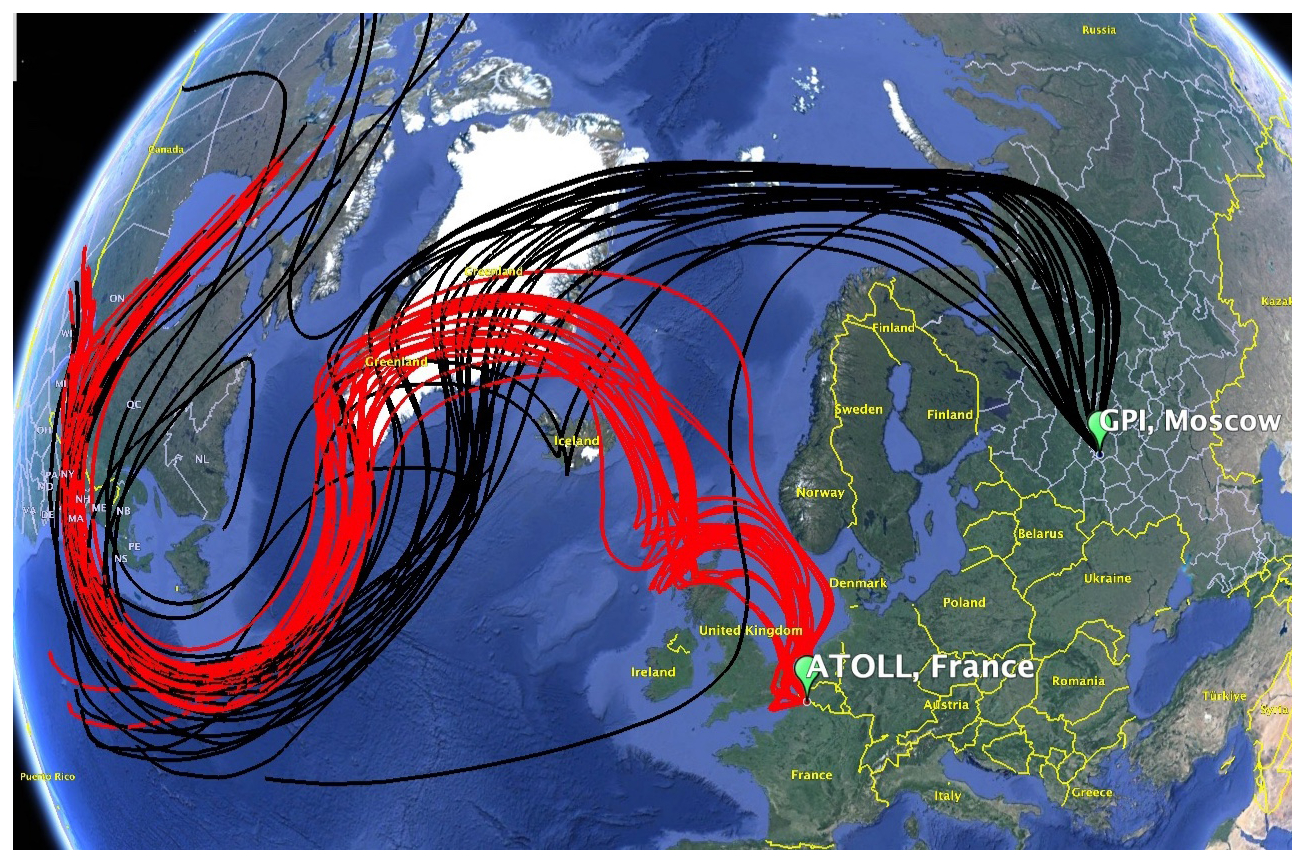
Figure 1The locations of lidar systems at ATOLL observatory (50.611° N, 3.142° E, 60 m a.s.l.), France and Moscow, Russia (55.235° N, 37.548° E, 87 m a.s.l.). The red and black solid lines represent the 7 d HYSPLIT back trajectories for ATOLL and Moscow, starting from 20:00 UTC, 14 May 2023. Imagery © Landsat/Copernicus, Map data © Google Earth 2025.
2.1 Lidar at ATOLL, France–LILAS
The lidar system– LILAS, operated at ATOLL observatory which is a National Facility affiliated to ACTRIS, has a Nd:YAG laser source emitting at 355, 532 and 1064 nm with corresponding pulse energy of 100, 90 and 100 mJ. The laser has a repetition rate of 20 Hz. The backscattered light is collected with a Newtonian telescope of 40 cm diameter. The receiver includes detection channels for the three elastic wavelengths, each equipped with a pair of cross- and co- polarization channels, and three Raman wavelengths: 387 (vibrational Raman of N2), 408 (vib-rotational Raman H2O vapor) and 530 nm (rotational Raman of N2 and O2). Additionally, LILAS has a broadband fluorescence channel of 44 nm width centered at 466 nm. The lidar signals are digitized with Licel Transient recorders, allowing for a simultaneous acquisition of an analog and photon-counting signal (except for 1064 nm channel, which has only analog detection), with a range resolution of 7.5 m. This configuration allows the acquisition of vertical profiles of the (α: extinction coefficient, β: backscatter coefficient, δ: particle linear depolarization ratio) dataset, the spectral fluorescence backscattering coefficient βF,λ and fluorescence capacity GF,λ, as well as the water vapor mixing ratio (WVMR) and the relative humidity (RH). The spectral fluorescence backscattering coefficient is computed in a way similar to the calculation of WVMR and requires a calibration constant, as expressed by Eq. (1):
where ΔD represents the full-width-half-maximum (FWHM) of the interference filters in the fluorescence channels, PF(z) and PR(z) represent the lidar signals of fluorescence and Raman channels, respectively. is the calibration constant, which is determined by the ratio of the instrumental constant of the Raman channel to the fluorescence channel. NR(z) is the vertically distributed number concentration of Raman scatters and σR is the Raman differential scattering cross section in the backward direction.
The calibration constant accounts for the ratio of the opto-electronic efficiency of the nitrogen Raman channel to the fluorescence channel. And it can be determined by swapping the PMTs of the two channels (see Appendix A). The fluorescence capacity – GF,λ, is the ratio of the spectral fluorescence backscattering coefficient to the elastic backscattering coefficient at the fluorescence excitation wavelength (i.e., 355 nm for LILAS system), i.e., . This quantity is influenced by the presence of fluorescent compounds within the particles and reflects their ability to emit fluorescence signals when exposed to radiation. More detailed description about the definition and calculation of fluorescence backscattering and capacity can be found in Veselovskii et al. (2020).
2.2 Five-channel fluorescence lidar at Moscow, Russia
The lidar operated at GPI in Moscow, Russia utilizes a tripled Nd: YAG laser at 355 nm, with pulse energy of 80 mJ and repetition rate of 20 Hz. To avoid the contamination to the fluorescence measurements, the laser radiation at 532 and 1064 nm is redirected by a dichroic mirror and then cleared by an optical dump. The characteristics of the telescope and the data acquisition recorder are the same as LILAS system. The optical receiver consists of an elastic channel at 355 nm, a N2 Raman at 387 nm and five fluorescence channels respectively centered at 438 (ΔD=29), 472 (ΔD=32), 513 (ΔD=29), 560 (ΔD=40), and 614 (ΔD=54) nm. This configuration allows for the detection of the extinction and backscattering coefficient at 355 nm, the spectral fluorescence backscattering coefficients and fluorescence capacities at five channels. The calibration of the 438 nm fluorescence channel is performed by swapping the PMTs, as described in the Appendix. And the relative sensitivity of the rest fluorescence channels with respect to the 438 nm channel is determined using a tungsten–halogen lamp, Thorlabs QTH10/M, with a color temperature of 2800 K. A more detailed description about this lidar system and the calibration procedure is presented in the study of Veselovskii et al. (2023). The spectral fluorescence measurements provide valuable information about the chemical composition of aerosols. In this study, we use the color ratio (CR) between the 560 and 472 nm channel to represent the spectral variation of aerosol fluorescence:
Four representative lidar observation cases, including two cases from ATOLL and two from GPI, were selected for detailed analysis. These observations capture the typical characteristics of BBA properties and demonstrate their variability, likely influenced by the fire origin, injection mechanism in the source region, and atmospheric processing during the long-range transport. The observations were measured in May and June 2023, during the peak wildfire activity, which allows the plume origins to be identified with higher confidence. Moreover, the BBA layers were thick, reducing the possibility of contamination by residual layers from earlier burning events.
3.1 Case 1: 14 May 2023 at ATOLL, France
On 14 May 2023, LILAS detected a thick BBA plume beneath a dense cloud layer extending from 6000 to 12 000 m height, as shown in Fig. 2. According to the back trajectory analysis, the plume originated from wildfire on 5–6 May (shown in Fig. B1a in Appendix), in Alberta in western Canada. This observation suggests the Canadian fires had intensified, as LILAS had only detected some thin and drifting BBA layers before this date. The structure of the BBA layer is clearly illustrated in the quicklook of fluorescence backscatter coefficient in Fig. 2b, which shows the base of the BBA layer at 4000 m and the top at 6000–7000 m, in contact with the cloud base. A very thin BBA layer was observed at around 12 000 m height, shown by an enhancement in the fluorescence backscatter. However, the thick mixed phase and cirrus clouds at 6000–12 000 m height resulted in significant noise in the fluorescence backscattering signal.
Figure 3 exhibits the profiles of BBA properties averaged between 21:00 and 22:00 UTC and relative humidity obtained from both lidar observation and the ERA-5 reanalysis. The cloud base was stable at around 6200 m and the fluorescence backscatter coefficients extended up to 6800 m, indicating the presence of BBA particles inside the cloud base, where the humidity is high. Inside the BBA layer at 4600 to 6000 m, lidar ratios are about 36 and 69 sr at 355 nm and 532 nm and particle linear depolarization ratios at 355, 532 and 1064 nm are respectively 0.08 ± 0.01, 0.05 ± 0.01 and 0.013 ± 0.002, showing a typical spectral dependence of BBAs (Hu et al., 2019; Haarig et al., 2018; Baars et al., 2019). The extinction and backscatter related Angström exponents are approximately 0.7 ± 0.2 and 2.2 ± 0.2. The fluorescence signal is strong inside the layer, and spectral fluorescence capacity is approximately 3.4 ± 0.2 and independent of height, which is an important feature of BBA aerosols due to the abundance of fluorescent molecules formed during the combustion of biomass.
Both ERA-5 and lidar-derived RH profiles show a steep increase from about 30 % at 4000 m to nearly 90 %–100 % at the cloud base. However, the vertical oscillations appearing in the RH profile from lidar measurement were not observed in the ERA-5 data, likely due to the decreasing vertical resolution with increasing height in ERA-5. As RH increases, hygroscopic aerosol particles absorb water from the surrounding air. This water uptake by particles is a rapid process–typically reaching equilibrium within seconds. Therefore, it is often considered as an equilibrium process rather than time-dependent (Carslaw, 2022). Water uptake increases particle size and sphericity, which can be detected in lidar measurements through increased elastic backscattering and a reduction in the depolarization ratio (Navas-Guzmán et al., 2019; Dawson et al., 2020; Veselovskii et al., 2024). In this case, despite a sharp RH increase above 5000 m, the backscatter coefficients at 355 and 532 nm remained steady or even decreased near the cloud base, showing no enhancement of elastic scattering due to water uptake. Additionally, the particle linear depolarization ratio at 532 nm remained low (around 0.05), and the EAE increased only slightly with height, suggesting no obvious response to the RH. Similarly, the variations in lidar ratios and BAE with increasing RH are more attributable to the vertical variability of BBA properties other than hygroscopic growth. The fluorescence capacity, which is sensitive to hygroscopic growth, as shown by Veselovskii et al. (2024) in an urban aerosol layer, exhibited minor changes near the cloud base. These observations suggest that BBA particles did not show significant hygroscopic growth even at RH levels of 90 %–100 %.
The fluorescence quenching – i.e. the suppression of aerosol fluorescence capacity due to environment factors, for instance the humidity–has been reported in several publications (Reichardt et al., 2025; Gast et al., 2025). In Case 1, despite the sharp increase in RH to 90 %–100 % near the cloud base, the fluorescence capacity showed only minor variations (Fig. 3b). This observation contrasts with other events during the 2023 fire season, where quenching was clearly detected using a five-channel fluorescence lidar (Veselovskii et al., 2024). However, with only a single broadband fluorescence channel at ATOLL, we cannot identify the spectra of the aerosols at low and high humidities, to check if they are from the same origin. And lidar observation cannot prove if aerosol and cloud particles interact or they only spatially coexist. Consequently, the absence of fluorescence quenching under high RH conditions remains an open question and requires further observational and laboratory investigations.
Previous studies have claimed that freshly emitted BBAs contain essentially non-hygroscopic compounds, however, they become increasingly hygroscopic during the aging process, due to the increase of oxidation level (Rudich et al., 2007; Jimenez et al., 2009; Massoli et al., 2010; Lambe et al., 2011). Nevertheless, the assessment of BBA hygroscopicity is difficult because of the complex and variability of organic compounds. Our findings in this case contribute to the relatively limited evidence showing that aged BBA particles originated from Canadian wildfires do not exhibit significant hygroscopicity. Similarly, Zheng et al. (2020) found that long-range transported smoke layers descending to the marine boundary layer have substantially lower hygroscopicity compared to the background marine aerosol.
It is worth noting that the influence of aerosol fluorescence on lidar water vapor measurement cannot be completely excluded, particularly in BBA layers whose fluorescence spectrum touches the water vapor Raman wavelength at around 407.5 nm. Two strategies can be adopted to mitigate this effect: either performing a correction to subtract the aerosol fluorescence contribution from water vapor signal, or reducing the bandwidth of water vapor interference filter to minimize the fluorescence contamination (Reichardt et al., 2023; Veselovskii et al., 2024). However, the correction approach is not feasible for LILAS measurements, as it requires at least two fluorescence channels to characterize the spectral behavior of aerosol fluorescence. Instead, LILAS utilizes a very narrow interference filter of 0.3 nm bandwidth at 407.5 nm, to suppress as much as possible the influence of fluorescence. Considering that the humidity derived from measurements during the fire season in 2023 did not exhibit anomalous values in the tropospheric BBA layers, we can reasonably assume the BBA fluorescence had quite limited impact on the measurements of LILAS, although it could increase, to some extent, the uncertainty of the absolute values. To ensure the robustness of our analysis, RH profiles from ERA-5 reanalysis and radiosonde data were used to validate the lidar-derived humidity measurements.
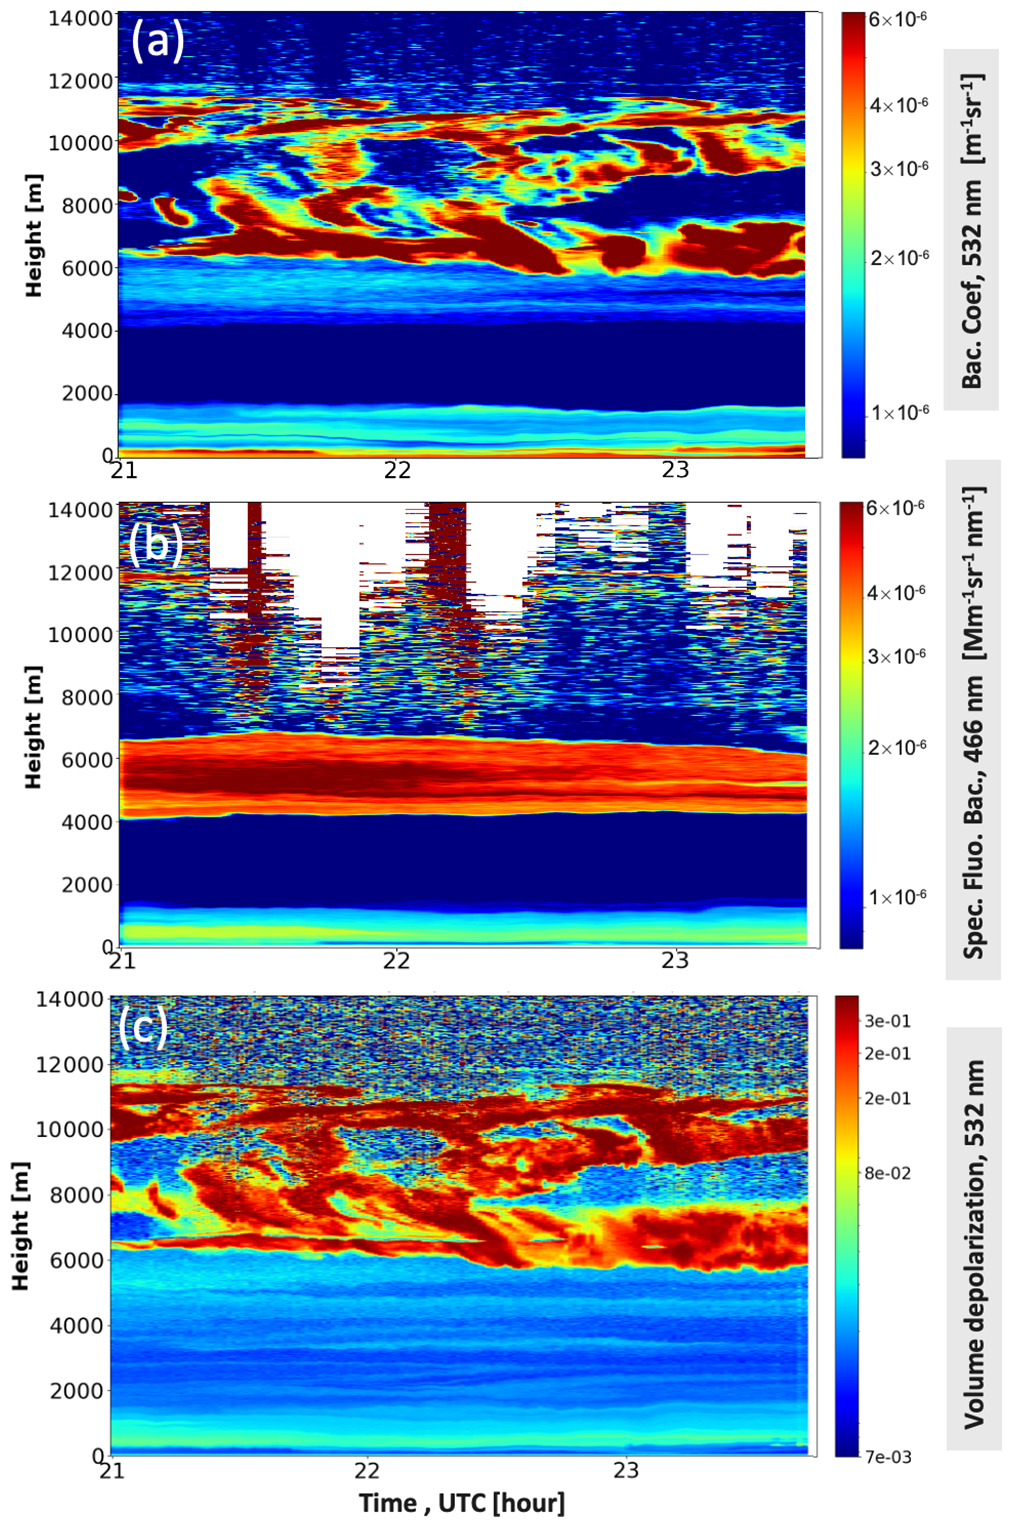
Figure 2Lidar observations at ATOLL observatory in the night of 14 May 2023 (temporal resolution: 1 min per profile, vertical resolution: 7.5 m, inclination angle: 4° off zenith). (a) The backscatter coefficient (unit: m−1 sr−1) at 532 nm. (b) The spectral fluorescence backscattering coefficient at 466 nm (unit: Mm−1 sr−1 nm−1) and (c) the volume linear depolarization ratio at 532 nm. The white pixels on the images are negative values resulted from the low signal-noise-ratio above thick clouds.
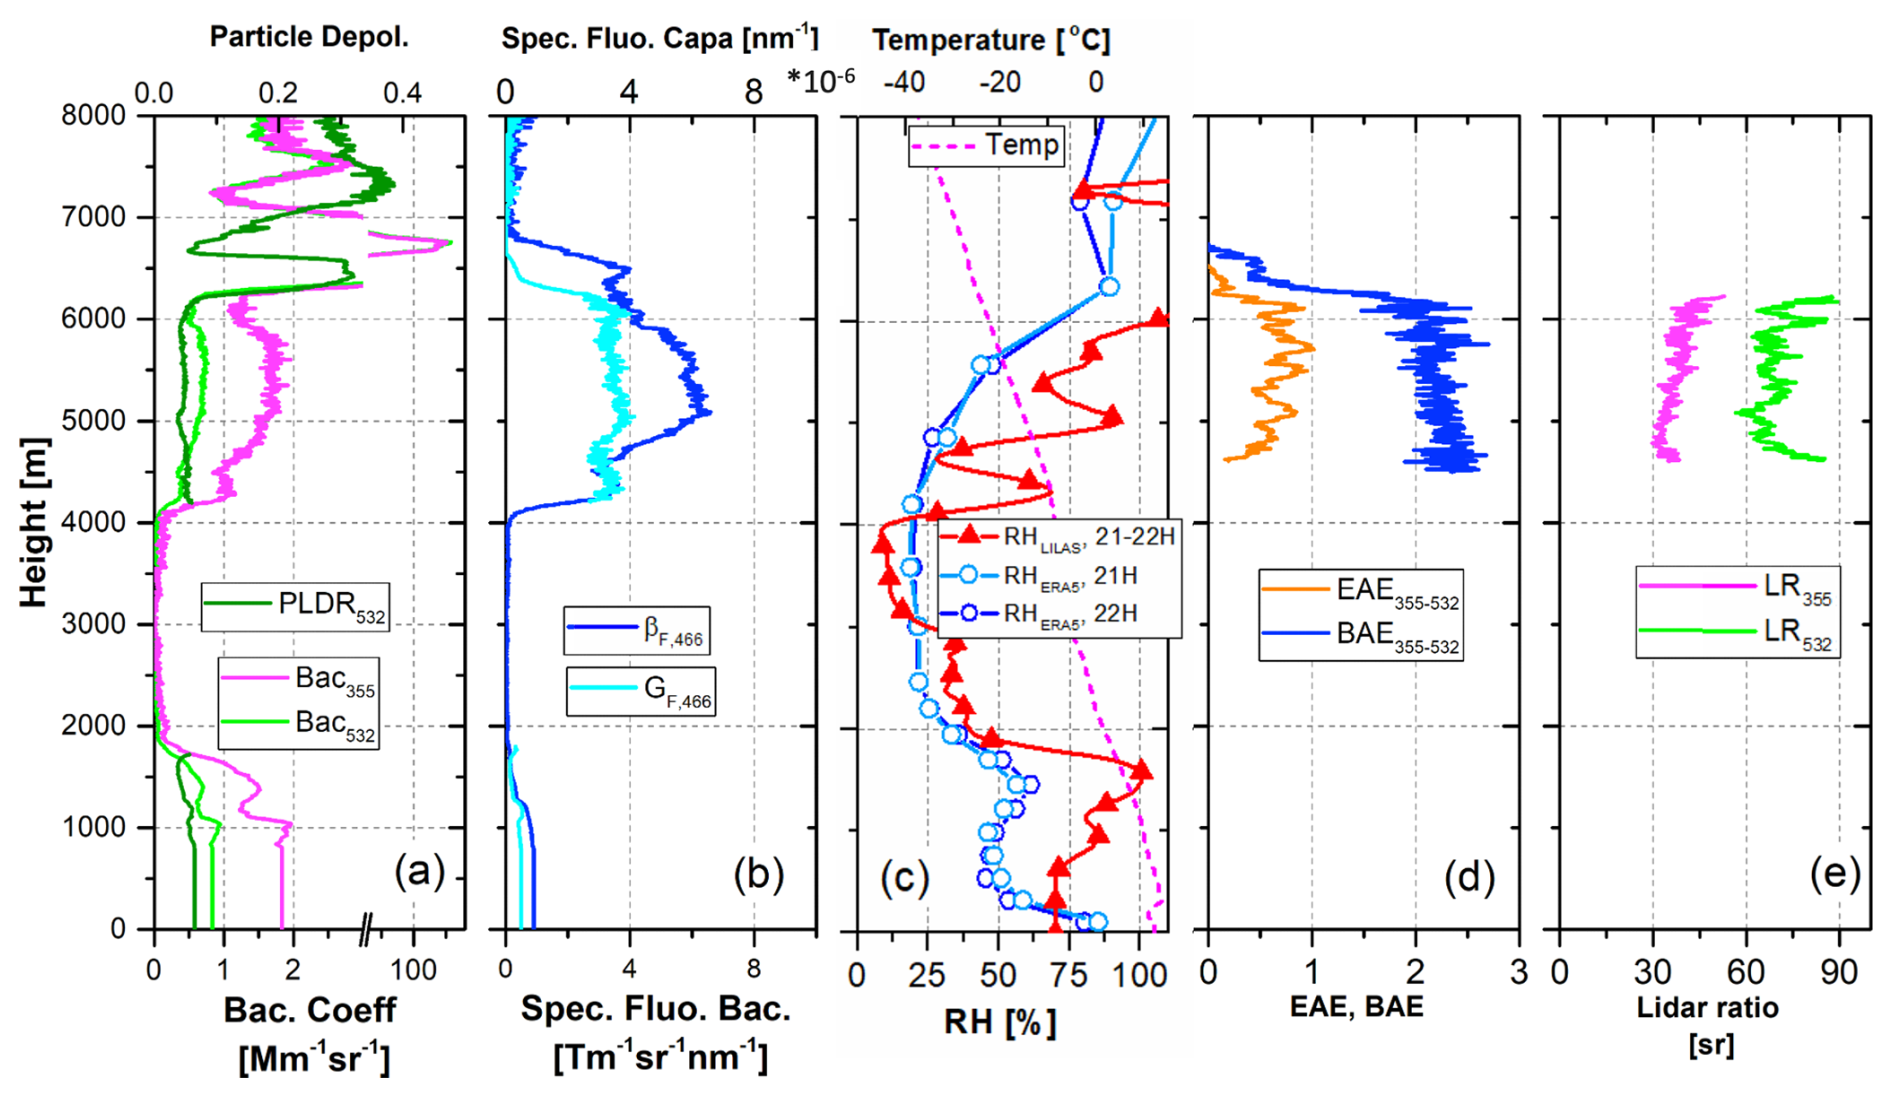
Figure 3Vertical profiles of (a) backscatter coefficient and particle linear depolarization ratio, (b) spectral fluorescence backscatter coefficient and spectral fluorescence capacity, (c) RH (from lidar and ERA-5) and temperature (Beauvechain station, 21:00 UTC, 14 May 2023), (d) Angström exponent: EAE355−532 and BAE355−532, and (e) lidar ratios. The profiles of BBA properties and RH (red triangle line) are calculated from lidar measurements averaged between 21:00 and 22:00 UTC, 14 May 2023. The RH profiles from ERA-5 are at 21:00 and 22:00 UTC, 14 May 2023. The vertical resolution of (fluorescence and elastic) backscatter, particle depolarization and fluorescence capacity is 7.5 m, while the vertical resolution of extinction and lidar ratio is 375 m.
3.2 Case 2: 27–28 May 2023 at ATOLL, France
The BBA layers detected at ATOLL on 27 and 28 May originated from wildfires on 19 and 20 May in Alberta, British Columbia and Saskatchewan, in the western area of Canada. Giant and dense smoke plumes can be observed from MODIS observations in Fig. B1b. In the night of 27 to 28 May, lidar quicklooks revealed stratified BBA plumes over ATOLL at 2000 to 12 000 m height, as shown in Fig. 4. One notable feature is that BBA layers at 12 000 m showed higher depolarization ratio at 532 nm than those in the free troposphere, as shown in Fig. 4c.
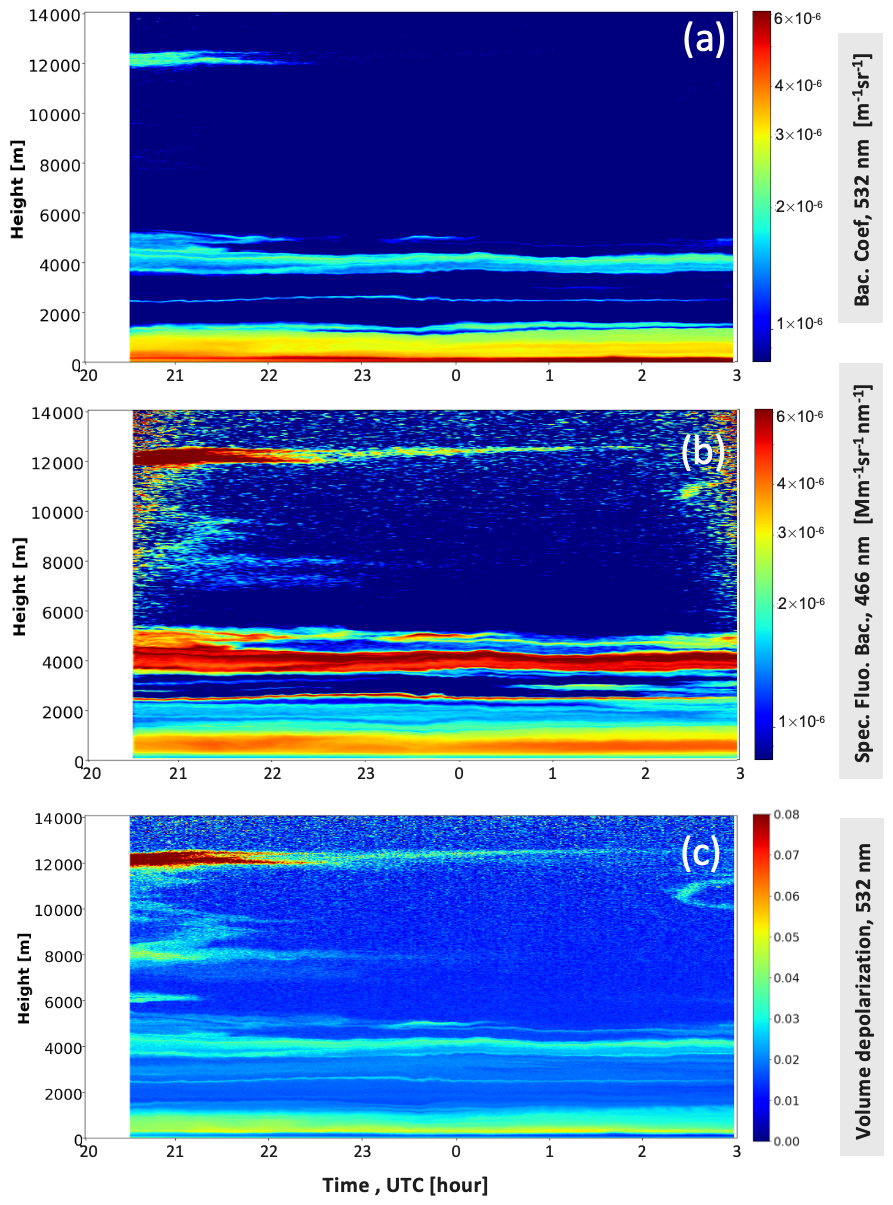
Figure 4Lidar observations at ATOLL observatory between 20:30 and 03:00 UTC in the night of 27 to 28 May 2023 (temporal resolution: 1 min per profile, vertical resolution: 7.5 m, inclination angle: 4° off zenith). (a) The backscatter coefficient (unit: Mm−1 sr−1) at 532 nm. (b) The spectral fluorescence backscattering coefficient at 466 nm (unit: Mm−1 sr−1 nm−1) and (c) the volume linear depolarization ratio at 532 nm.
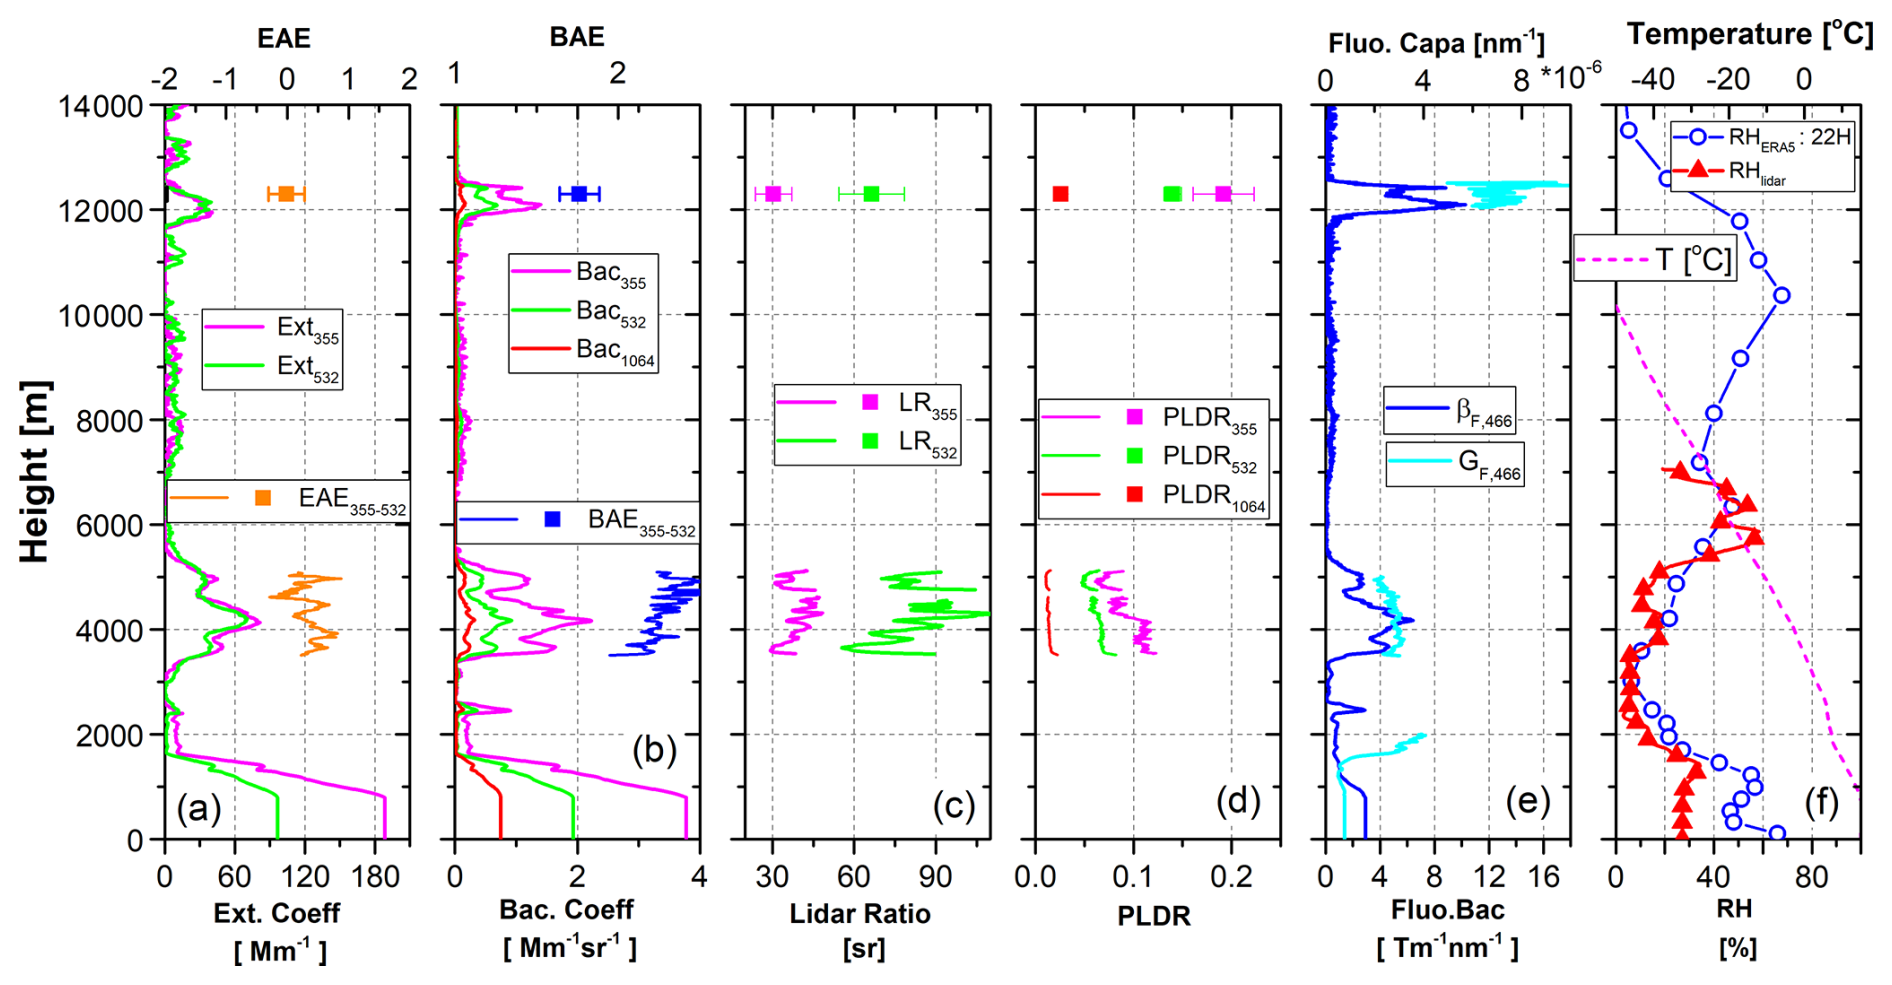
Figure 5Vertical profiles of (a) extinction coefficient (at 355 and 532 nm) and EAE355−532, (b) backscatter coefficient (at 355, 532 and 1064 nm) and BAE355−532, (c) lidar ratios (355 and 532 nm), (d) particle linear depolarization ratios (at 355, 532 and 1064 nm), (e) the spectral fluorescence backscatter coefficient and spectral fluorescence capacity, and (f) relative humidity and temperature (Beauvechain station, 21:00 UTC, 27 May 2023). The square plots and error bars represent the mean values and standard deviations in the UTLS layer at 11 900 to 12 300 m. The lidar observations are averaged between 20:55 and 22:15 UTC, 27 May 2023 and the ERA-5 meteorological data is at 22:00 UTC, 27 May 2023. The vertical resolution of (fluorescence and elastic) backscatter, particle depolarization and fluorescence capacity is 7.5 m, while the vertical resolution of extinction and lidar ratio is 375 m.
BBA optical properties derived from averaged lidar observations between 20:55 and 22:15 UTC are plotted in Fig. 5. The layers with extinction and backscatter coefficients peaking at 4000 and 12 000 m are identified as BBAs, due to their specific signatures in lidar ratios, depolarization ratios and their capability of producing fluorescence when exposed to laser radiation. Between 7000 and 10 000 m, an optically thin residual layer was observed in the profiles of elastic and fluorescence backscattering, although it was near the detection limit of LILAS. In the planetary boundary layer (PBL), below 2000 m, background aerosols dominated. Additionally, the RH from lidar measurement and ERA-5 dataset both show air mass was dry in these two BBA layers, with RH lower than 40 %, therefore, no hygroscopic effect is observed.
Table 1 summarizes the optical properties of two BBA layers at different vertical levels. The BBA layer at around 12 000 m exhibited mean linear depolarization ratios of 0.20. 0.14 and 0.03 at 355, 532, and 1064 nm, respectively, while the depolarization ratios in the BBA layer at around 4000 m are about 50 % lower at each wavelength. Such a difference of depolarization ratio has been detected in previous lidar observations of transported BBA layers. The EAE (extinction-related Angström exponent) of approximately 0.0 is also a characteristic of aged BBA in the UTLS, whereas, typical BBA in the middle or lower troposphere tend to have slightly higher EAE. Notably, in this case we observed a higher fluorescence capacity in the UTLS BBA layer than the tropospheric BBA layer, adding more evidence that UTLS BBAs differ from those in the free troposphere in microphysical and chemical properties.
Table 1Optical properties of BBA particles and RH in different vertical ranges in Case 1 (14 May 2023) and 2 (27 May 2023), observed at ATOLL observatory. The means and standard deviations in three BBA layers: 4600–6000 m (Case 1), 3500–5000 m and 11 900–12 300 (Case 2) m are computed and summarized in the table. Be noted that the values after “±” represent the standard deviation in the vertical range.

3.3 Case 3: 31 May–1 June 2023, at GPI, Russia
In the night of 31 May to 1 June 2023, BBA plumes transported to the GPI site also originated from western Canada, similar to Case 2. The emission of the plumes dated back to 27 May 2023, according to HYSPLIT back trajectory (See Fig. B2a). The lidar quicklooks in Fig. 6 show BBA plumes, marked by strong fluorescence signals, were distributed at 4000 to 10 000 m height. The PBL height was at around 2000 m, with a residual layer suspending above it. Two BBA plumes sequentially appeared in the height range of 9000–10 500 m, and the second plume appearing at 01:40 UTC showed a stronger fluorescence signal.
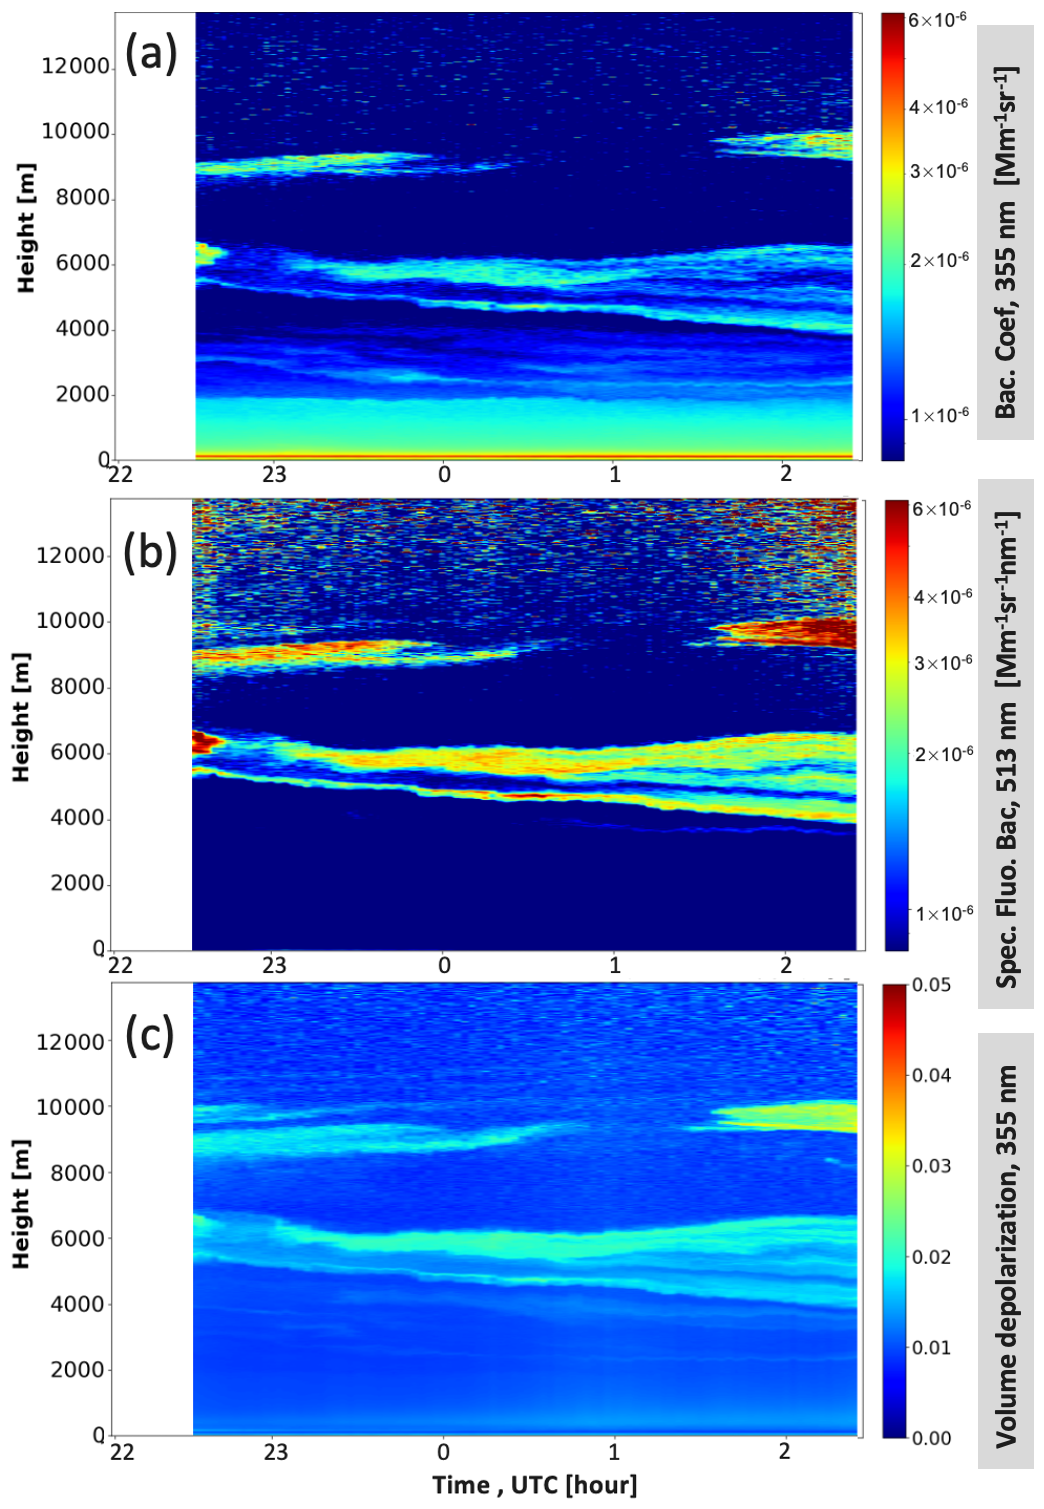
Figure 6Lidar observations at GPI, Moscow, Russia between 22:30 and 02:30 UTC in the night of 31 May to 1 June 2023 (temporal resolution: 3 min per profile, vertical resolution: 7.5 m, inclination angle: 45° off zenith). (a) Backscatter coefficient at 355 nm (unit: Mm−1 sr−1), (b) the spectral fluorescence backscatter coefficient at 513 nm (unit: Mm−1 sr−1 nm−1) and (c) the volume linear depolarization ratio at 355 nm.
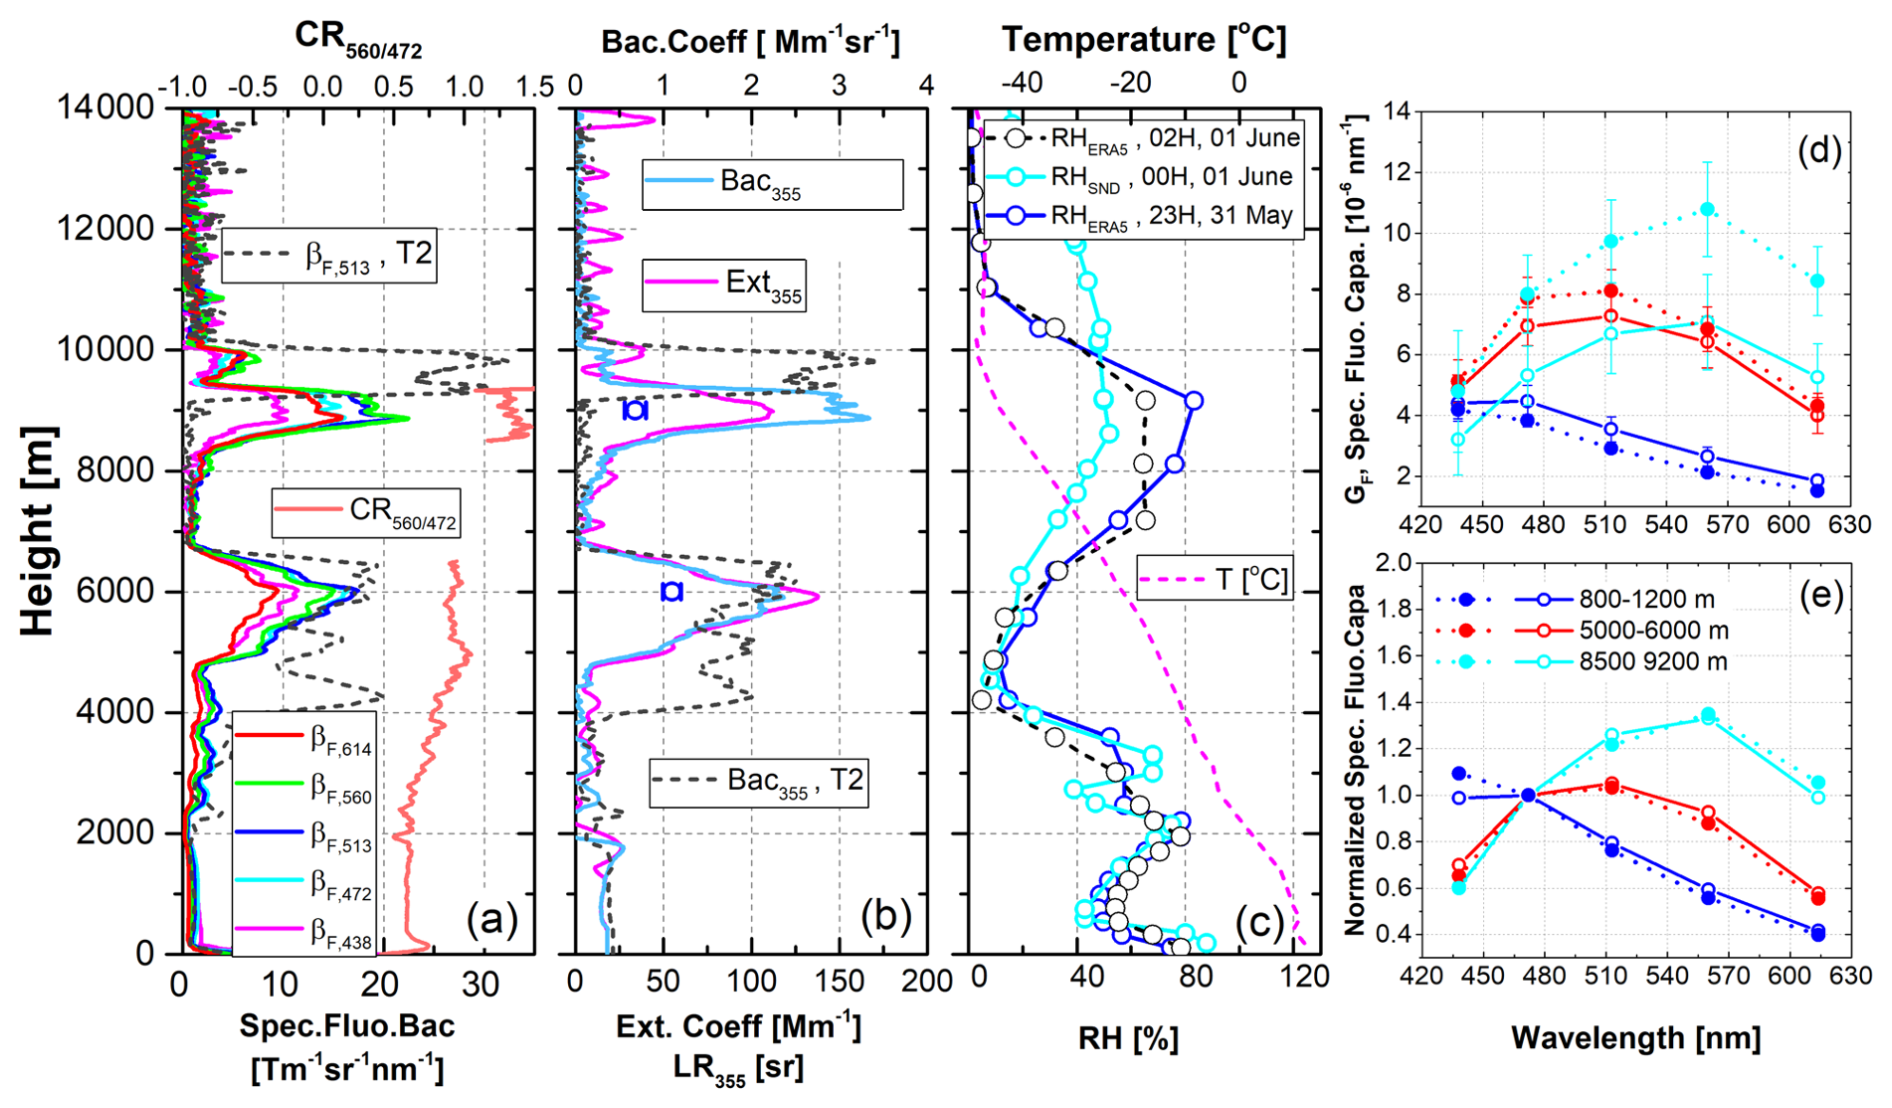
Figure 7Vertical profiles of (a) the spectral fluorescence backscatter coefficients (at 438, 472, 513, 560 and 614 nm) and color ratio of 560 to 472 nm (CR). (b) Extinction and backscatter coefficients and lidar ratio at 355 nm. (c) Relative humidity (radiosonde at 00:00 UTC 1 June; ERA5 at 23:00 UTC 31 May and 02:00 UTC 1 June) and temperature (Moscow station, 00:00 UTC 1 June 2023). Profiles in (a)–(c) were smoothed with a moving average, yielding a vertical resolution of 150 m for backscatter and 375 m for extinction. Two temporal averages are shown: T1 (solid lines; 22:30–23:58 UTC, 31 May 2023) and T2 (dashed lines; 01:30–02:30 UTC, 1 June 2023). (d) The spectral fluorescence capacities and (e) normalized spectra of fluorescence capacity within three vertical ranges: 800–1200 m in the PBL (blue), 5000–6000 m in the FT (red) and 8500–9200 m (T1)/9600–10 000 m (T2) in the UTLS (cyan). For clarity, not all T2 profiles are displayed in panels (a)–(c).
Aerosol properties averaged in two time intervals across the night of 31 May to 1 June are plotted in Fig. 7 and summarized in Table 2. The first time interval (T1) is from 22:30 to 23:58 UTC, 31 May 2023, and the second (T2) from 01:30 to 02:30 UTC, 1 June 2023. For clarity, only the spectral fluorescence backscatter coefficient at 513 nm and the elastic backscatter coefficient, as well as the vertically averaged fluorescence capacities in the second time interval are plotted for comparison with the first time interval. The color ratio of fluorescence signals at 560 to 472 nm, CR in Fig. 7a shows higher values in the UTLS layer than in the tropospheric layer. Similar to Case 2, the lidar ratio in the UTLS layer was about 36 sr, lower than 55 sr in the tropospheric BBA layer. The relative humidity at 4000 to 7000 m was in the range of 10 %–50 %, according to radiosonde and ERA-5 data. In the UTLS layer, radiosonde measurements provided RH values around 50 %, noticeably drier than the prediction of ERA-5, i.e, 60 %–80 %. According to our analysis, higher RH values of ERA-5 reanalysis than radiosonde/lidar measurements are often detected in the UTLS for both ATOLL and GPI station during the wildfire season in 2023. The discrepancy between model and radiosonde data in the UTLS has been reported in several previous studies and may be related to the lack of radiosonde measurements above the upper troposphere or/and the bias in other parameters in the meteorological field, for example, the temperature (Simmons et al., 2020; Sun et al., 2021; Krüger et al., 2022). The radiosonde sensor, for example, the RS92 sonde, has also well-known bias, which could underestimate RH in daytime measurements, however, at night, it showed much smaller errors (Bock et al., 2013). Therefore, in this study we take the radiosonde data as reference when it diverges from ERA-5 data.
The spectra of fluorescence capacity are averaged within three vertical ranges in the PBL, FT and UTLS, and are plotted in Fig. 7d. In both time intervals, the spectral fluorescence capacities in the PBL decreased with wavelength. In the 5000–6000 m, the fluorescence capacities of BBA particles increased significantly at wavelengths greater than 438 nm and peaked at 513 nm, with the values of approximately 7.3 × 10⁻⁶ nm−1 in the first time interval and 8.1 × 10⁻⁶ nm−1 in the second period. The UTLS layer in the first time interval showed even lower spectral fluorescence capacities than in the FT at wavelengths shorter than 560 nm. From the first to the second time interval, the BBA layer in the FT showed minor changes in the values and the spectral dependence. In contrast, the UTLS layer exhibits significantly stronger fluorescence capacities in the second time interval than in the first interval. Whereas, their normalized spectral fluorescence capacities, shown in Fig. 7e, are still in good agreement, both showing a red shift in the peak toward 560 nm in UTLS. This red-shift of BBA fluorescence spectrum in UTLS was also detected by Reichardt et al. (2025) at Lindenberg, Germany in transported BBA plumes from Canadian wildfires in 2023. It confirms that this was not a feature detected during specific events, but a recurring feature of transported BBA plumes during the Canadian wildfire season in 2023.
The BBA plumes detected in Case 2 and 3 shared similarities in geographical locations of fire sources and closeness of detection time, which offers a good opportunity for the comparison of fluorescence measurements. In Case 3, the spectral fluorescence capacity in the 472 nm fluorescence channel is in the same order of magnitude with the 466 nm fluorescence channel in Case 2 (see Tables 1 and 2). While Case 2 showed a markedly higher fluorescence capacity of the BBA layer in the UTLS than in the FT, observations in Case 3 suggest that BBA particles in the UTLS do not necessarily always exhibit higher fluorescence capacity. Instead, the redshift of the fluorescence spectrum is a more recurring feature that BBA layers in UTLS differ from those in the FT.
3.4 Case 4: 20 June 2023 at GPI, Moscow, Russia
Wildfires in Canada intensified significantly from the beginning of June 2023, with active fires spreading from northern British Columbia, Alberta and Saskachewan to central Alberta and the southern region of Northwest Territories. In the same period, large-scale wildfires broke out in eastern Canada, particularly in Quebec, making substantial contributions to the emission of BBA particles into the atmosphere. MODIS observations (see Fig. B2b) show an extensive coverage of BBA plumes stretching from western to eastern Canada on 13 June, making the attribution of individual plumes highly uncertain. According to HYSPLIT back-trajectory analysis in Fig. B2b, the BBA plumes arriving at the GPI station on 20–21 June likely originated from wildfires in Alberta or Quebec, after approximately 6 or 9 d of atmospheric transport, respectively. However, it is difficult to identify the exact source region, as intense wildfire activity occurred simultaneously in both provinces.
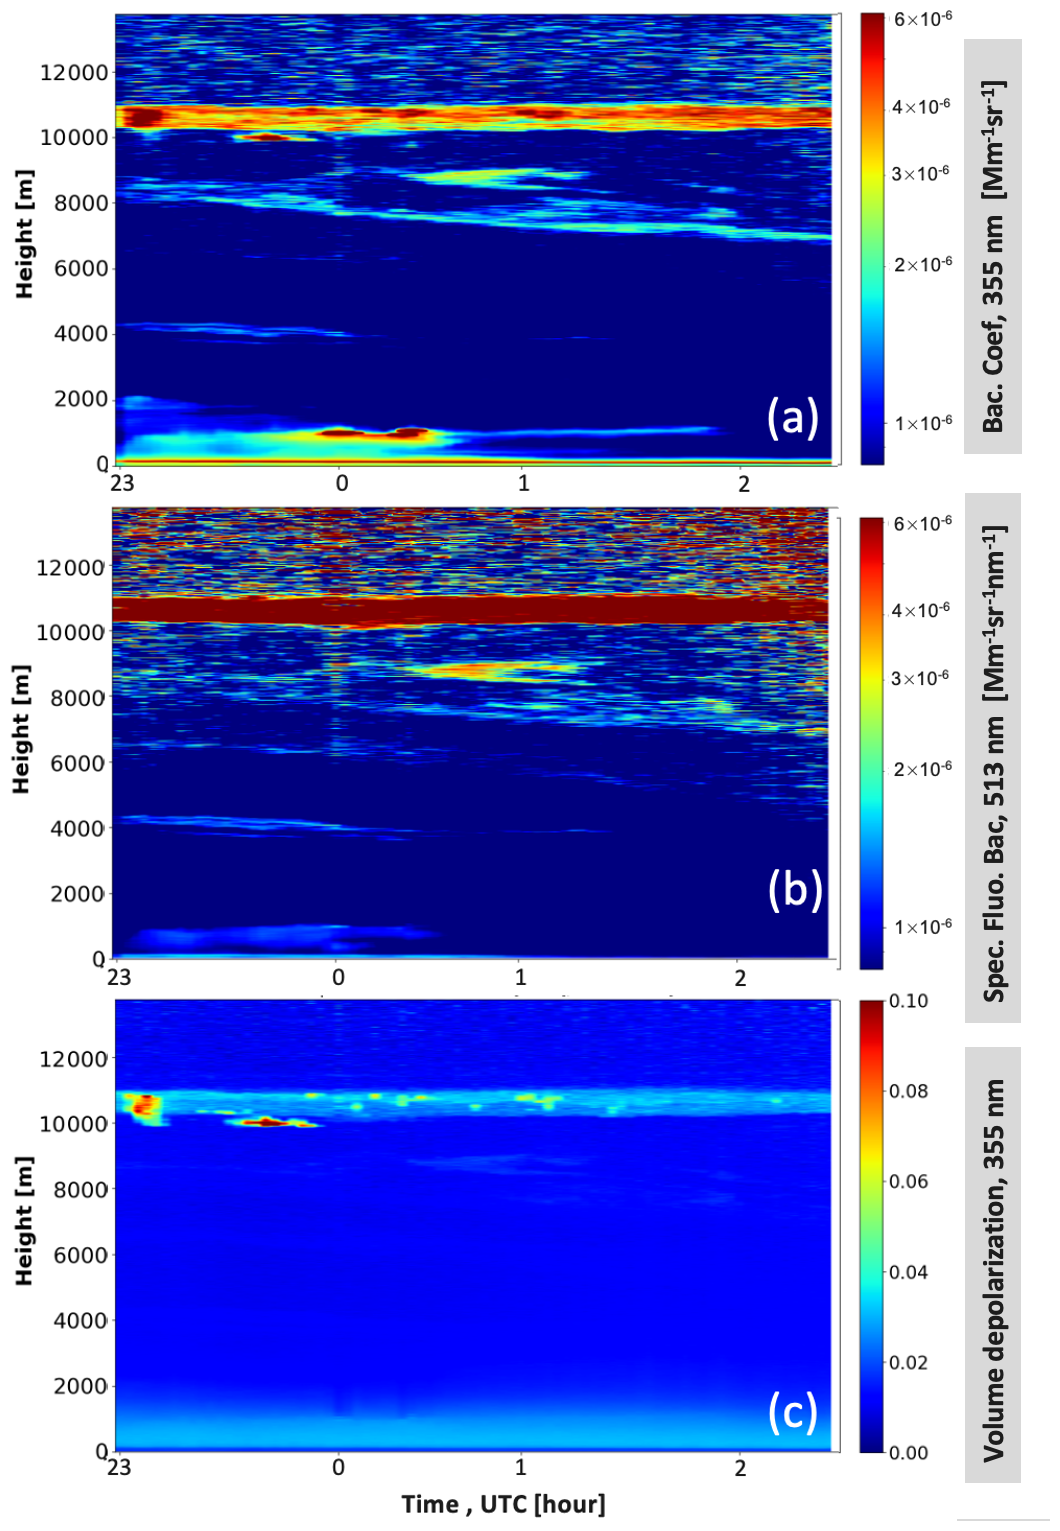
Figure 8Lidar observations at GPI station in Moscow, Russia between 23:00 and 03:00 UTC in the night of 20 to 21 June 2023 (temporal resolution: 3 min per profile, vertical resolution: 7.5 m, inclination angle: 45° off zenith). (a) Backscatter coefficient at 355 nm (unit: Mm−1 sr−1), (b) spectral fluorescence backscatter coefficient at 513 nm (unit: Mm−1 sr−1 nm−1) and (c) the volume linear depolarization ratio at 355 nm.
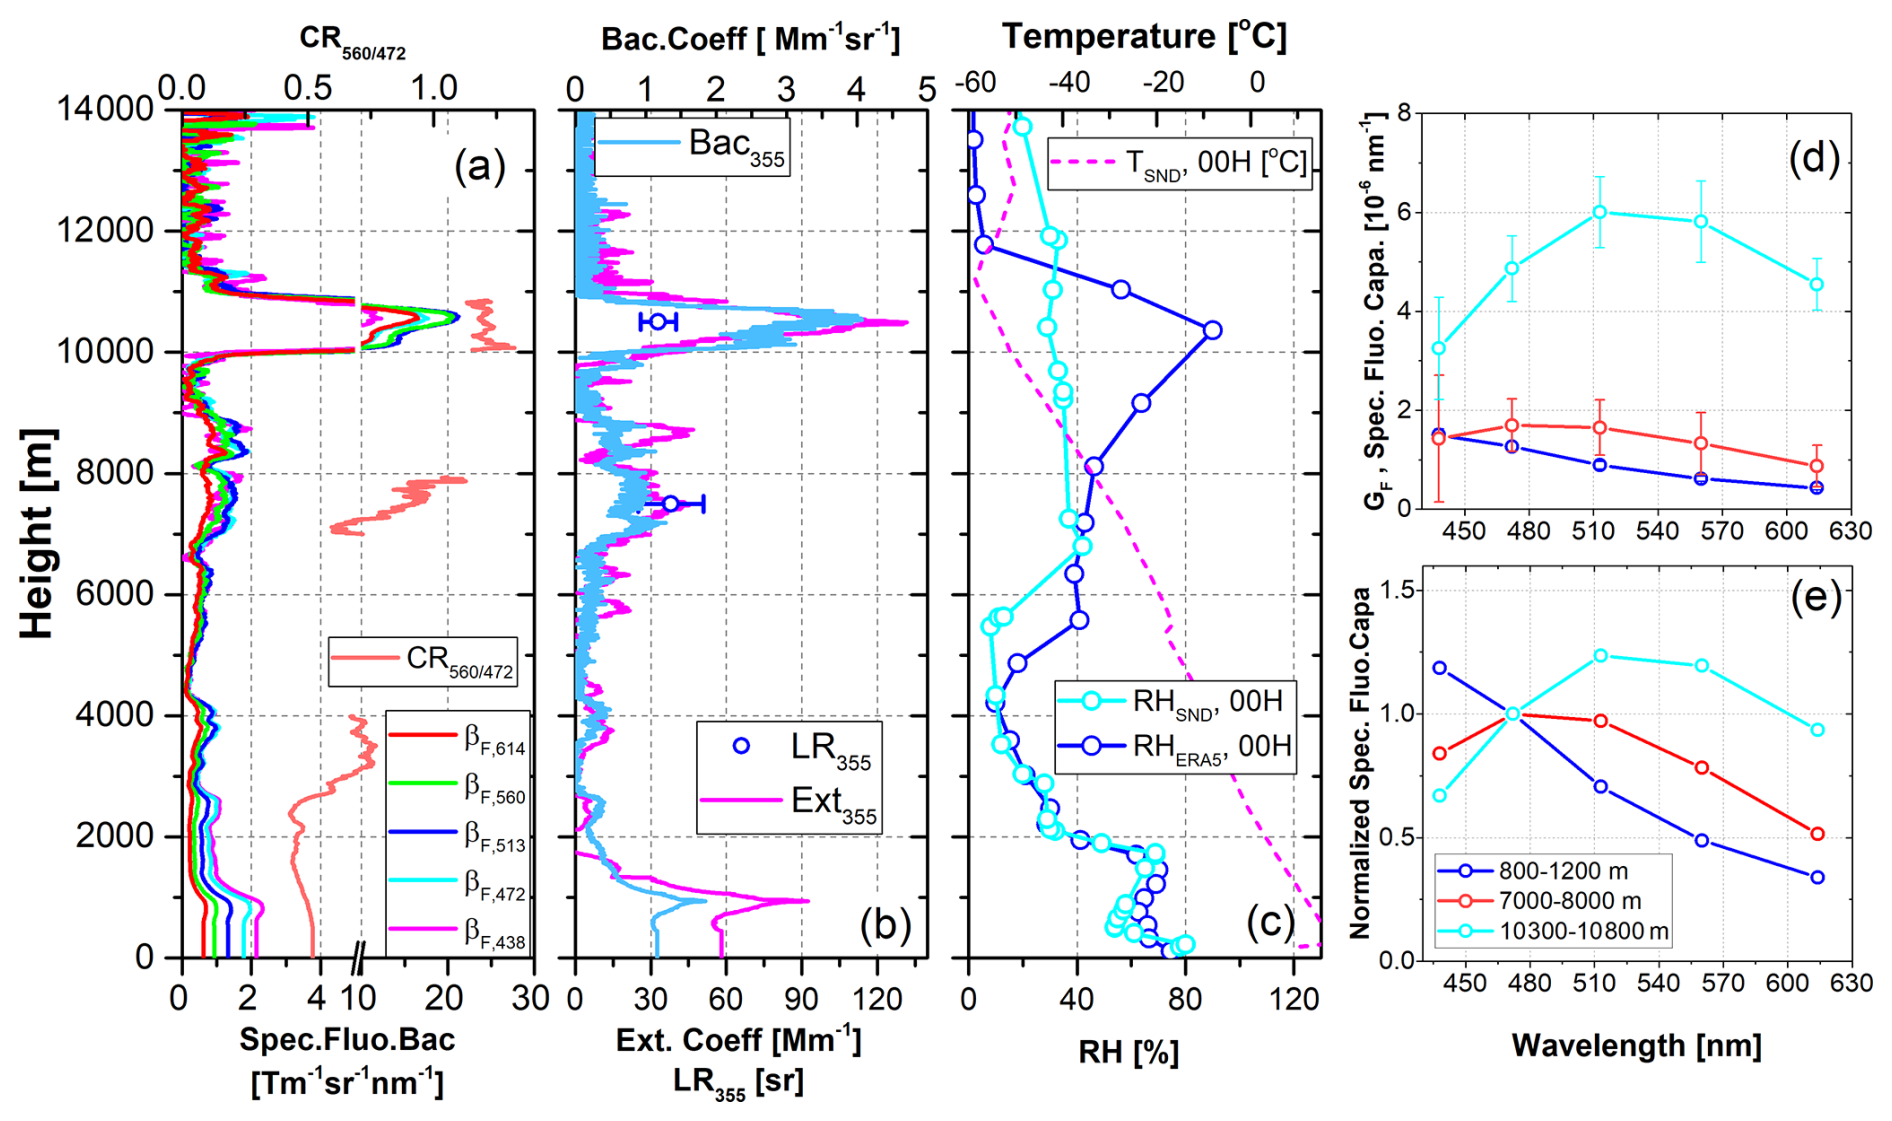
Figure 9Vertical profiles of (a) the spectral fluorescence backscatter coefficients and color ratio between the 560 and 472 nm fluorescence channels, (b) extinction and backscatter coefficients at 355 nm, (c) RH (ERA5 and radiosonde) and temperature (Moscow station, 00:00 UTC, 21 June 2023) profiles, (d) the spectra of fluorescence capacity and (e) the normalized fluorescence capacity at 472 nm within three vertical ranges: 800–1200, 7000–8000 and 10300–10 800 m. The lidar observations were conducted between 00:50 and 02:30 UTC on 21 June 2023 and the RH profiles are at 00:00 UTC 21 June 2023. The vertical resolutions of the (fluorescence and elastic) backscatter and extinction profiles is 150 and 375 m, respectively.
Figure 8 presents the lidar observations during the night of 20 to 21 June 2023. The BBA layers extending from 3000 to 10 000 m are more clearly identified in the quicklook of the fluorescence backscattering at 513 nm, compared to the elastic backscattering signal at 355 nm. The BBA layer above 10 000 m is optically denser than the layers below, and marked with high fluorescence and moderate volume linear depolarization ratio. In Fig. 8c, some data points at around 10 000 m show volume depolarization ratio close to 0.10 between 23:10 and 23:50 UTC. It is likely an indication of ice crystals formed inside or below the BBA layers, which has been quite often observed during BBA observations.
Figure 9 presents the BBA properties derived from averaged lidar observations and the RH profiles from ERA-5 analysis and from radiosonde measurement. The profiles of the spectral fluorescence backscatter coefficients in five channels, in Fig. 9a, show that aerosol layers from the PBL to the tropopause at around 12 000 m presented different levels of fluorescence. The fluorescence backscatter coefficients, the extinction, and backscatter coefficients at 355 nm peaked at 10 500 m, where a thick BBA layer was detected. The color ratio CR, showed a clear increase versus height, from below 0.6 in the PBL to 1.2 near the tropopause. The increasing trend is particularly strong in the thin BBA layer at 7000 to 9000 m.
Lidar ratios at 355 nm calculated for the two BBA layers, 7000–9000 and 10 300–10 800 m, are approximately 38 sr and 32 sr, respectively, which are in good agreement with the observations in Case 2 at ATOLL station, although lower than the values observed in the night of 31 May to 1 June, 2023 (Case 3). Additionally, both Case 2 and Case 3 demonstrate lower lidar ratios (at 355 and 532 nm for ATOLL observations, at 355 nm for GPI observations) in the UTLS layers than in the free tropospheric layer. This signature could be an indicator of different morphology and/or radiative properties of BBA particles in the UTLS and in the troposphere.
Radiosonde measurements at Moscow station indicated RH values generally below 40 % at above 2000 m, whereas ERA-5 reanalysis showed RH increasing above 7000 m to a peak of 90 % near 10 500 m. Despite uncertainties in RH estimates from both radiosonde measurements and model data, we observed no evidence of hygroscopic growth in the BBA layer. Therefore, we can conclude that BBA properties in this case are not significantly influenced by the humidity in the atmosphere.
The spectral fluorescence capacities in five channels and the normalized spectra, averaged in three vertical ranges, are plotted in Fig. 9d and e. Between 800 and 1200 m, where urban aerosol was the dominant aerosol type, the spectral fluorescence capacity monotonically decreased with wavelength–from 1.50 ± 0.12 × 10⁻⁶ nm−1 at 438 nm to 0.43 ± 0.04 × 10⁻⁶ nm−1 at 614 nm. In contrast, within the BBA layer between 7000 and 8000 m, the spectral fluorescence capacity increased at at wavelengths greater than 438 nm, peaking at approximately 1.7 × 10⁻⁶ nm−1 around 472 and 513 nm. In the higher BBA layer (10 300–10 800 m), the spectral fluorescence capacities across the five channels increased significantly, with the spectral peak shifting further to longer wavelengths. The maximum fluorescence capacity reached 6.0 ± 0.7 × 10⁻⁶ nm−1 at 513 nm, closely followed by a second maximum of 5.8 ± 0.8 × 10⁻⁶ nm−1 at 560 nm. The shift of the fluorescence spectrum is further evidenced by the increase of color ratio, CR in this layer, as shown in Fig. 9a.
Table 2Summary of BBA properties presented in Case 3 (31 May–1 June 2023) and Case 4 (20–21 June 2023). The results in the table are plotted in Figs. 7 and 9. Note that the values presented before and after “±” represent the mean and standard deviation in the height range.
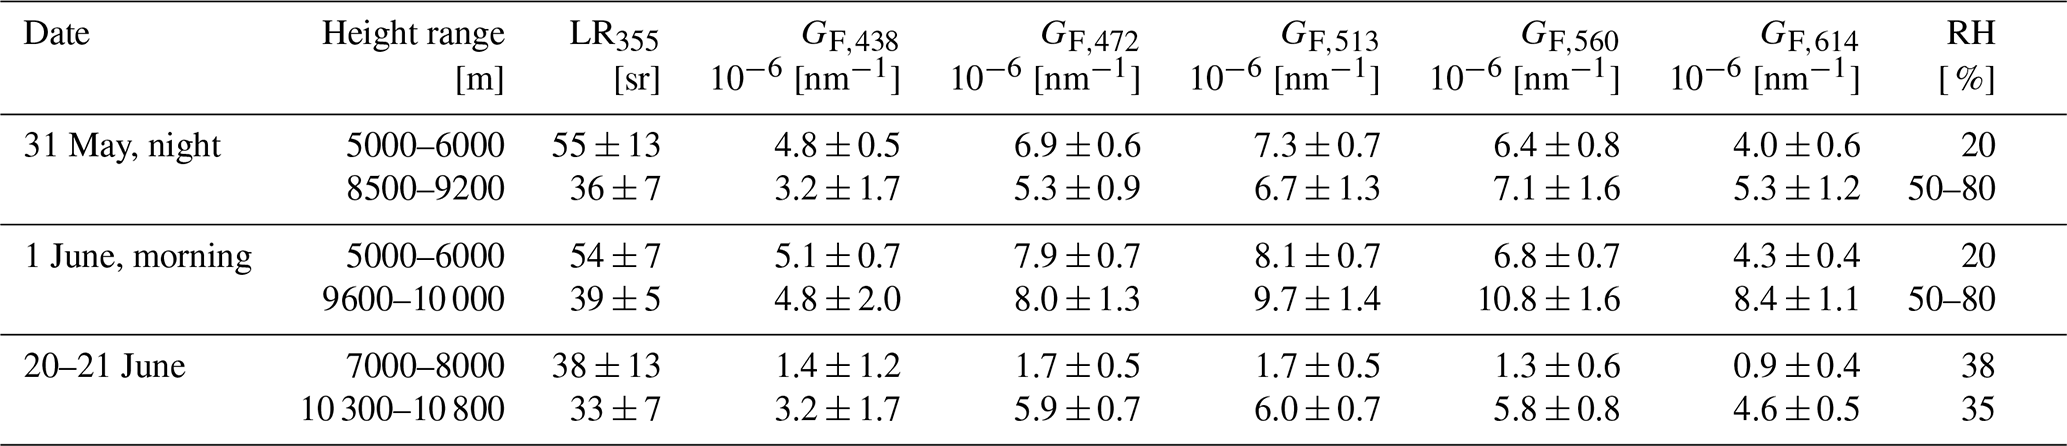
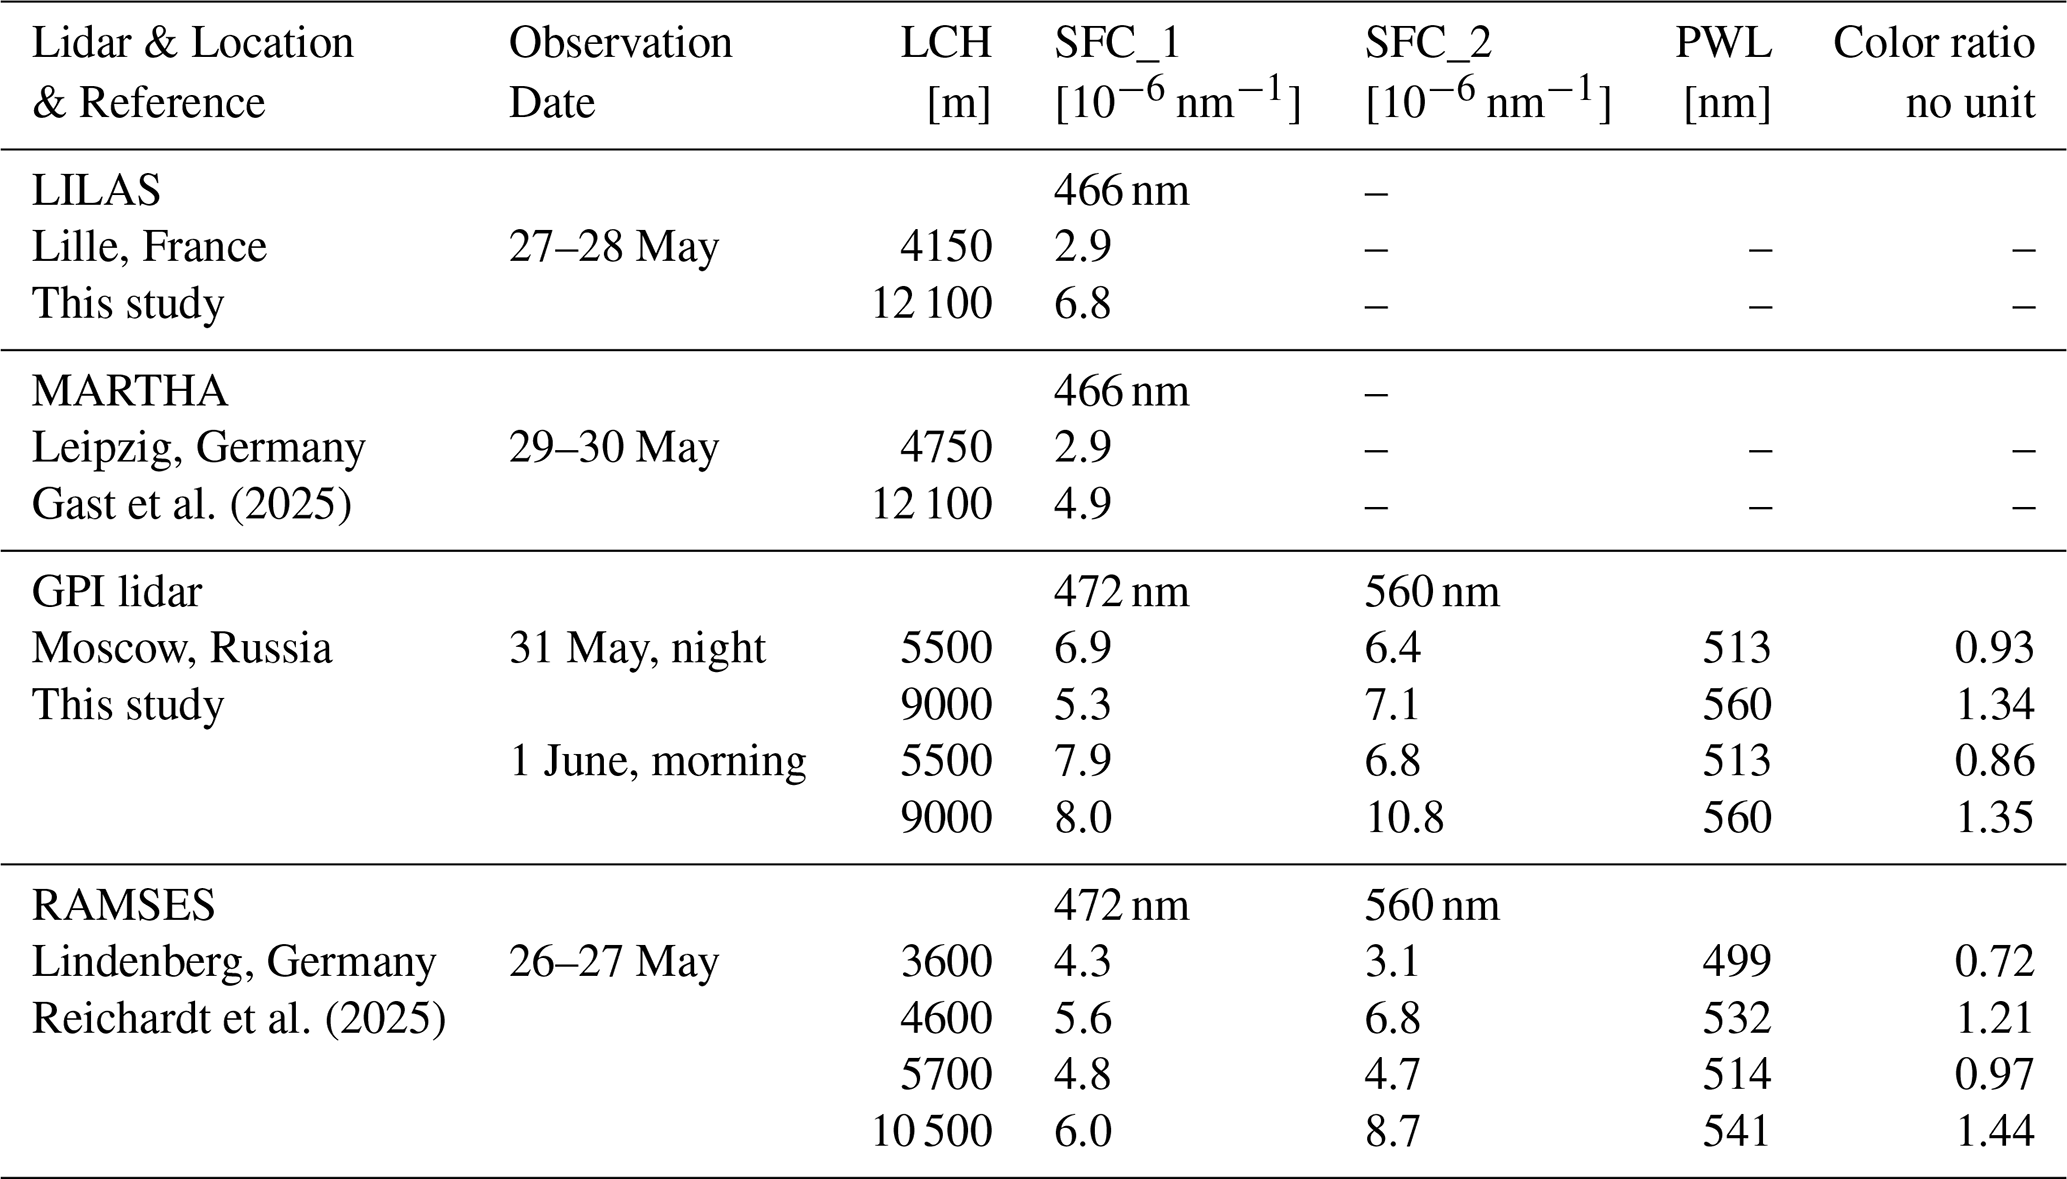
Table 2 presents a summary of the BBA properties observed in Case 3 and Case 4. The fluorescence channel at 472 nm of the GPI lidar is spectrally close to the 466 nm fluorescence channel of LILAS lidar at ATOLL observatory, therefore these two channels are used here for comparison. The spectral fluorescence capacities (at 472 and 466 nm) presented in the four cases are comparable in magnitude. Particularly in Case 2 and Case 4, both the tropospheric and UTLS layer show consistent fluorescence capacities measured by two different lidar systems. Higher fluorescence capacities in the UTLS layer were detected in Case 2, Case 4 and the second time interval of Case 3 at 472 and 466 nm. An exception occurred in the first time interval of Case 3, where the UTLS BBA plume did not exhibit enhanced fluorescence capacity, suggesting that this property is variable and likely influenced by multiple factors. In contrast, a redshift in the fluorescence spectrum within the UTLS was consistently observed in Cases 3 and 4.
4.1 Extinction- and backscatter-related Angström Exponent
The extinction coefficients and Angstöm exponents of 34 BBA layers detected from May to September 2023 at ATOLL observatory are presented in Fig. 10. These layers were identified as BBA based on their signatures in lidar ratios, particle linear depolarization ratios and fluorescence capacity. Among the 34 BBA layers, 26 layers were classified as free tropospheric layers (layer top < 8000 m), and the other 8 layers were classified as UTLS layers (layer base > 8000 m). The extinction coefficients of most BBA layers observed during this period were below 200 Mm−1. The extinction-related Angström exponent in free tropospheric layers averaged 0.8 ± 0.3, generally bigger than those observed in the UTLS layers, where the values averaged 0.1 ± 0.2. The backscatter-related Angström exponents in the free tropospheric BBA layers averaged 2.0 ± 0.2, slightly bigger than those averaged in the UTLS layers, which is 1.5 ± 0.2. Such difference of Angström exponent between tropospheric and UTLS BBAs has been reported in previous lidar observations (Haarig et al., 2018; Hu, 2018; Ohneiser et al., 2020; Mamouri et al., 2023).
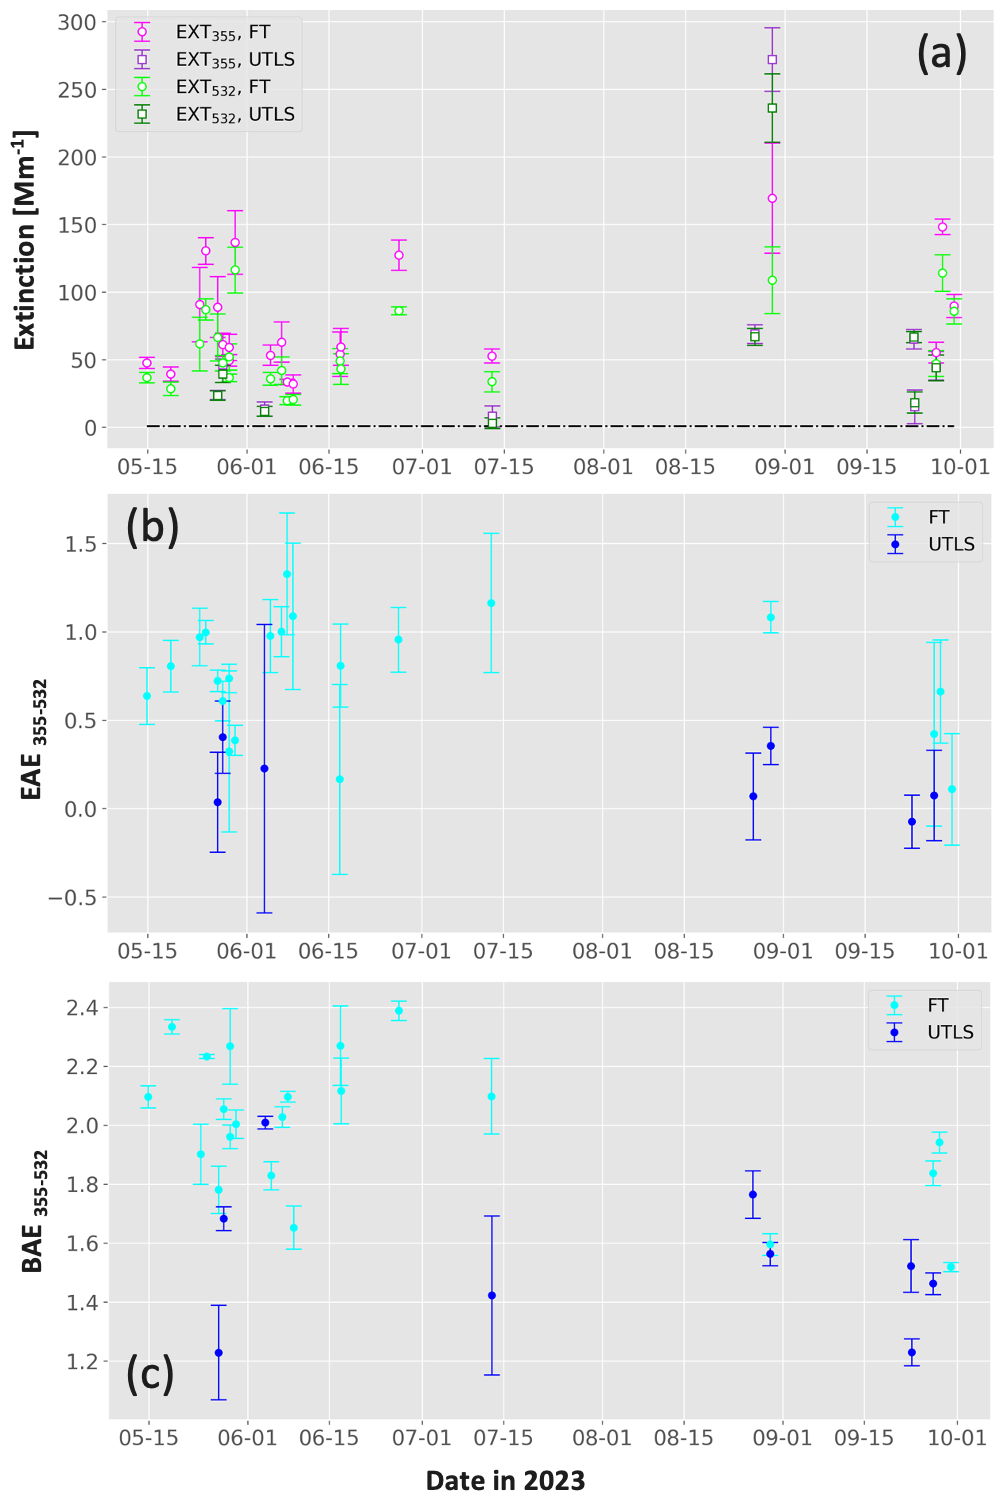
Figure 10(a) Extinction coefficients at 355 and 532 nm, (b) Extinction-related Angström exponent and (c) backscatter-related Angström exponent measured by LILAS at ATOLL observatory from May to September 2023. Note that the BBA layer with extinction coefficient higher than 20 Mm−1 are selected and classified into 2 groups: FT (free troposphere) and UTLS (upper troposphere and lower stratosphere), according to the height of the layer base.
Light scattering models indicate the EAE of aerosols is strongly correlated with aerosol particle size. Both field campaign and laboratory measurements showed that BBA particles tend to grow during the aging process due to the condensation of gas-phase organic compounds and particle coagulation. Particle size can also vary from fire to fire, influenced by the burning conditions, fuel types and lifting mechanisms, which can all affect the morphology and composition of BBA particles injected into the atmosphere (Selimovic et al., 2019; Hodshire et al., 2021; Perring et al., 2017; Katich et al., 2023; Kleinman et al., 2020). For example, aircraft measurements showed BBA particles injected into the UTLS by pyro-cumulonimbus (PyroCb) convections were with thicker coatings, thus resulting in bigger size compared with tropospheric BBA particles. One likely explanation is that the strong updrafts in PyroCb convections lift large amounts of aerosols and vapors, promoting the coagulation of aerosol particles and condensation of the organic vapors, which accelerates the growth of BBA particles. The aging environment in the ambient atmosphere may also play a role. For instance, particles with diameters larger than 50–100 nm are more efficient CCN particles and therefore are more likely to be washed out by wet removal, a process that is more frequent in the free troposphere (Petters et al., 2009).
In contrast to the EAE, the BAE of aerosol particles shows a stronger dependence on the imaginary part of the refractive index (i.e., wavelength-dependent absorption), in addition to the influence of particle morphology. A detailed investigation on the effect of these factors is beyond the scope of this study. So far, there has been few observations addressing differences in BAE between tropospheric and UTLS BBAs, underscoring the need for additional measurements to better understand this feature.
4.2 Lidar and depolarization ratios
The lidar ratios and particle linear depolarization ratios observed from May to September 2023 at ATOLL observatory are displayed in Fig. 11. The spectral dependence of lidar ratios, which correlates with wavelength, aligns with previous observations of BBAs from Canada, the US and Australia. The average lidar ratios in tropospheric BBA layers during this period are respectively 44 ± 9 and 72 ± 11 sr at 355 and 532 nm, while in the UTLS layers they were 36 ± 4 sr and 62 ± 4 sr. The slightly higher lidar ratios in tropospheric layers compared to the UTLS layer are consistent with lidar observation in Moscow, as shown in Case 3 and 4.

Figure 11(a) Lidar ratios at 355 and 532 nm, (b) particle linear depolarization ratios (PLDRs) at 355, 532 and 1064 nm, in the BBA layers measured by LILAS at ATOLL observatory from May to September 2023. The data points are divided into two categories by the height of the selected layers – free tropospheric (FT) layer and UTLS layer. The scatters and error bars represent the means and standard deviations in the selected BBA layers.
The particle linear depolarization ratios in tropospheric BBA layers averaged 0.12 ± 0.08, 0.07 ± 0.03 and 0.02 ± 0.01 at 355, 532 and 1064 nm. In contrast, the corresponding values in the UTLS layers are higher at 355, 532 nm, averaging 0.23 ± 0.08 and 0.14 ± 0.05, respectively, while remaining almost unchanged at 1064 nm with an average of 0.02 ± 0.01. Pronounced depolarization ratios of BBA layers in UTLS have been observed by several lidar systems during the remarkable wildfires in global scale – Canadian wildfire in 2017, Australian wildfire in 2019/2020, Californian wildfire in 2020 (Haarig et al., 2018; Hu et al., 2019; Ohneiser et al., 2020; Hu et al., 2022; Mamouri et al., 2023). High depolarization ratios are usually associated with particle morphology, i.e., their size and irregular shape. In the UTLS, aged BBA particles were detected with thick organic coating, which may appear semi-solid and glassy in cold and dry conditions in UTLS, thereby enhancing their depolarization ratio (Zeng et al., 2025).
The lifting process of wildfire plumes may also influence the morphology of BBA particles. Exceptionally high depolarization ratios were observed on 12 July and from 23 to 30 September 2023, with values at 355 nm approaching or exceeding 0.30. According to Khaykin et al. (2025), these plumes originated from wildfires associated with pyroCb activity, detected in Siberia on 30 June and in Canada on 15 and 22 September. PyroCb-convection can rapidly inject thick clouds of BBA particles, organic vapors, and ice crystals into the UTLS (Peterson et al., 2017). BBA particles processed by pyroCb events are found to exhibit distinctive characteristics, including larger sizes and thicker organic coatings, compared to those not affected by such convective processes (Rosenfeld et al., 2007; Katich et al., 2023). Depolarization ratios at the end of August were also very high. Although the study by Khaykin et al. (2025) indicates that the lifting mechanism in August 2023 was a WCB (Warm Conveyor Belt) rather than a PyroCb, the strong smoke plume intensity observed at ATOLL (with extinction coefficients about 250 Mm−1 at 355 and 532 nm and an EAE around 0.3–0.4 in the night of 29 August) suggested that the plumes were already very dense at emission, which provided favorable conditions for particle growth. In particular, LILAS detected tropospheric BBA layers with depolarization ratios comparable to those in the UTLS on 29 and 30 September. Lidar observations revealed that these layers gradually descended from the free troposphere to the planetary boundary layer over ATOLL within 2–3 d. HYSPLIT back-trajectory analysis suggests that this descent was associated with a dry intrusion – a strong downward motion driven by cyclonic activity that can rapidly transport air masses from the UTLS into the lower troposphere and boundary layer (Danielsen, 1968). Consequently, the observed tropospheric BBA layers with high depolarization ratios were likely of UTLS origin.
4.3 Fluorescence capacity and spectrum
Transported BBA plumes originated from Alberta wildfires in late May 2023 have been reported by other lidar stations in Europe, providing an opportunity for the cross-comparison of fluorescence measurements. Figure 12 presents the spectral fluorescence capacities analyzed in Case 2 and 3 in this study, as well as measurements reported by two German lidar systems–MARTHA at TROPOS in Leipzig and RAMSES at DWD in Lindenberg. MARTHA and LILAS utilize the same interference filter at 466 nm for fluorescence measurements, while the RAMSES lidar employs spectrometers that allow for the detection of the fluorescence spectrum with a spectral resolution of about 12 nm. Consequently, the measurements of RAMSES can reveal more features of the fluorescence spectra and serve as a reference for broadband fluorescence measurements (Reichardt et al., 2023). Another important aspect of this comparison is to assess whether the fluorescence measurements, made by different lidar systems, each calibrated individually by different lidar groups, are consistent. Although the proximity in observational time does not guarantee that the plumes originated from the same wildfire, it can still eliminate the possibility of plumes coming from other regions, since the Alberta wildfires were the dominant fire sources during the second half of May.
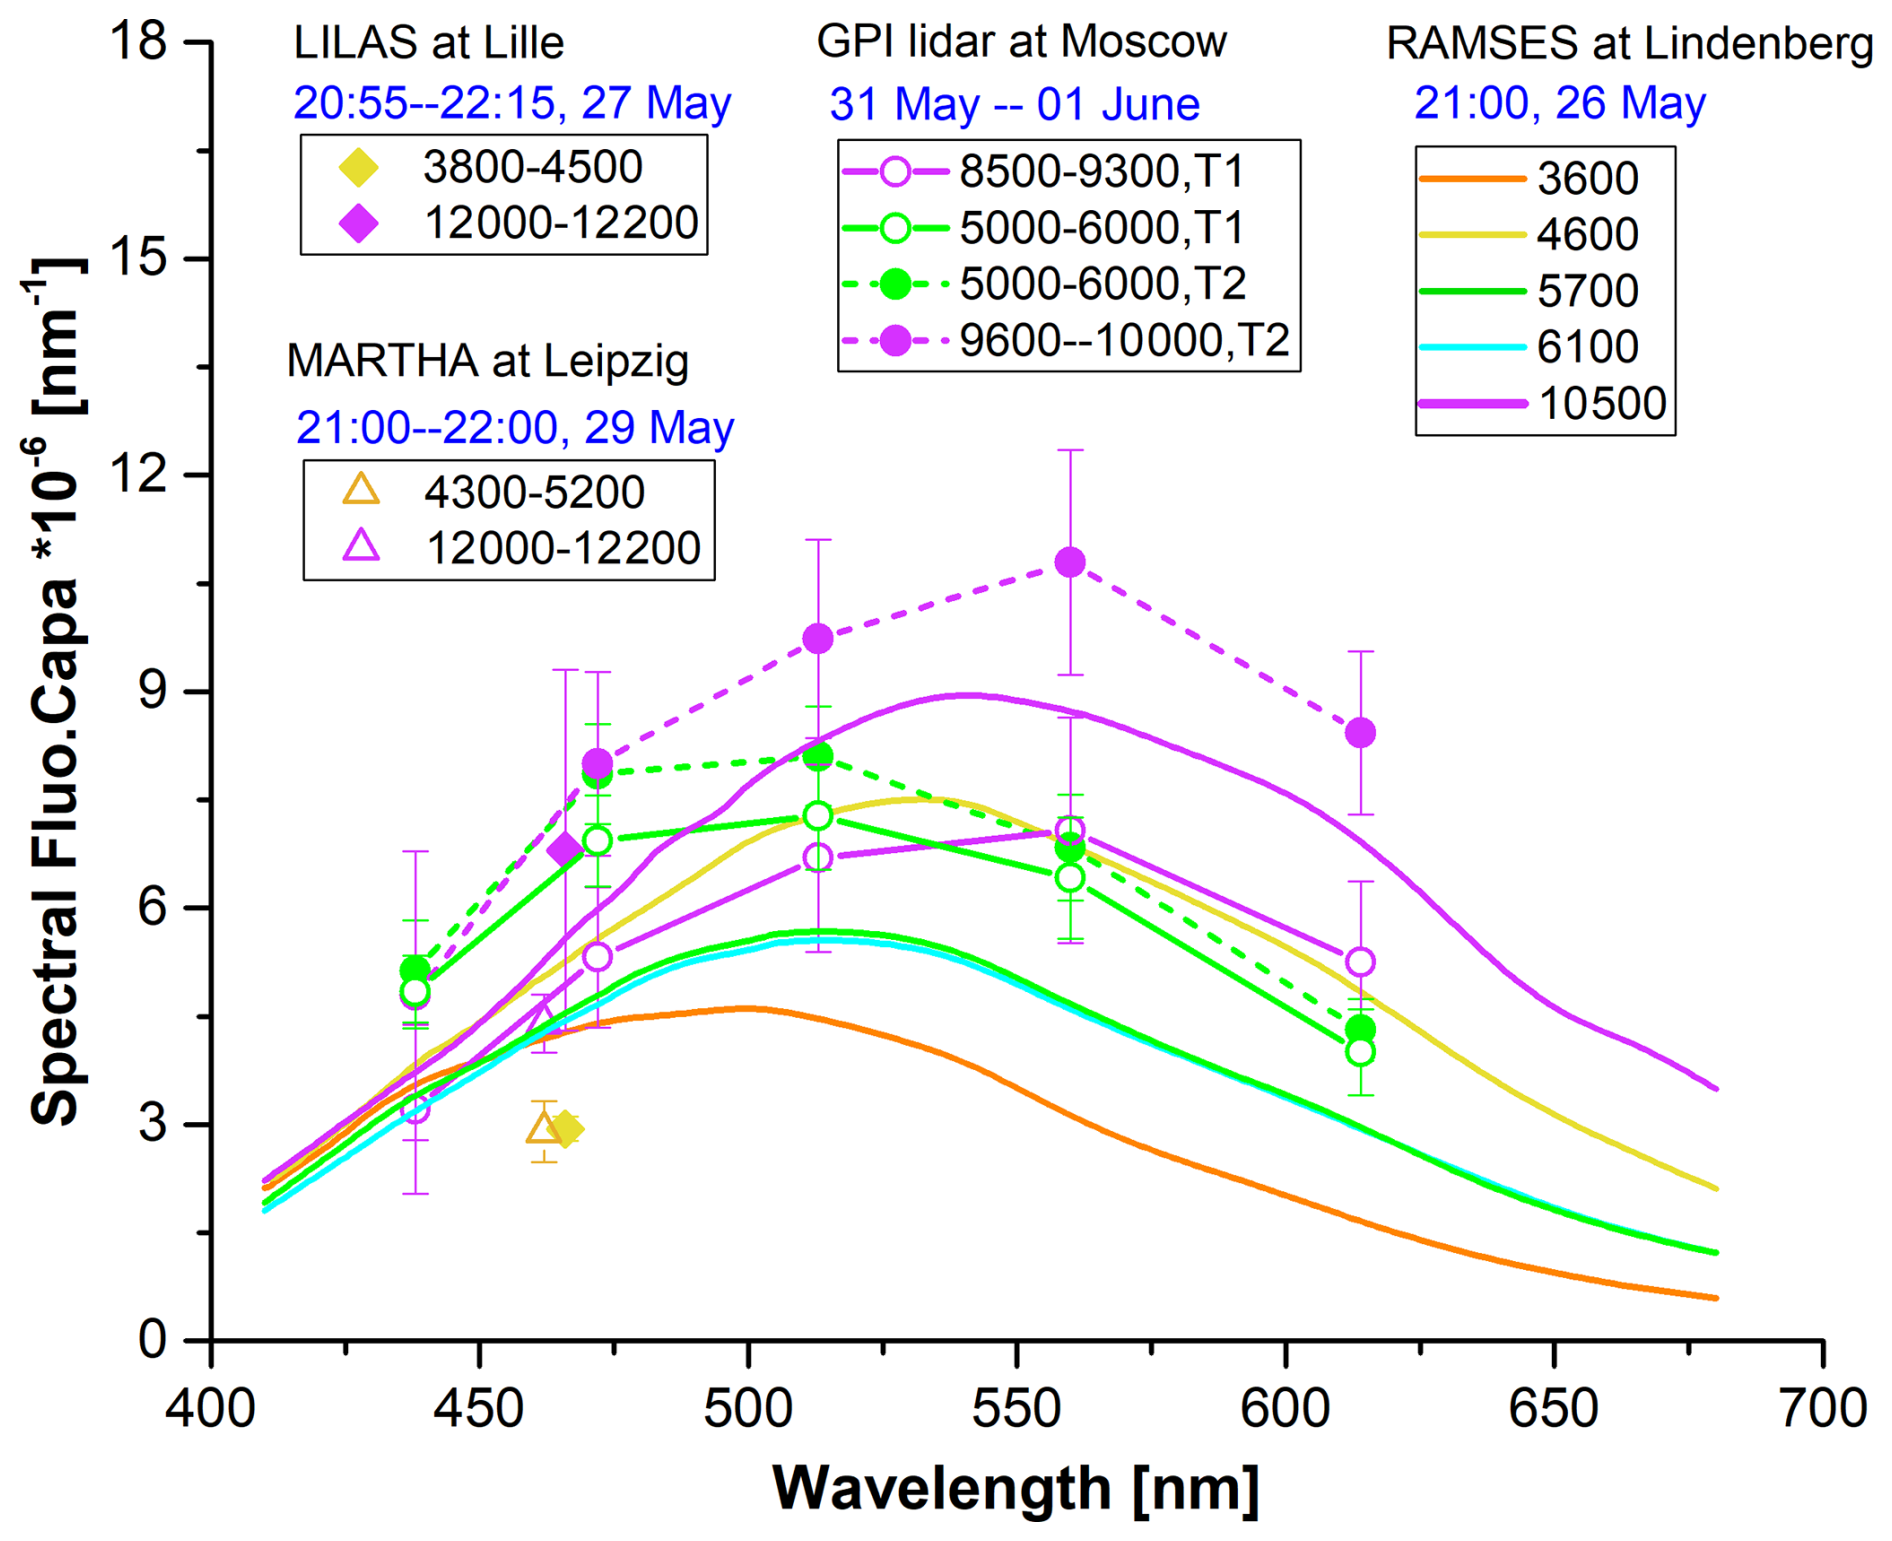
Figure 12Comparison of fluorescence capacities measured by four lidar systems in transported BBA plumes originated from Alberta wildfires in late May 2023. The four lidar systems are – LILAS at ATOLL (Lille, France), MARTHA at TROPOS (Leipzig, Germany), RAMSES at Lindenberg (Germany), and the GPI lidar (Moscow, Russia). Measurements from LILAS and GPI presented respectively in Case 2 (27 May 2023, diamonds ) and Case 3 (31 May–1 June 2023, circles with lines, solid line–time interval T1, dashed line– time interval T2) are compared with measurements from MARTHA on 29 May 2023 (triangles) and RAMSES on 26 May 2023 (solid lines). The measurements from MARTHA and RAMSES were published by Gast et al. (2025) and Reichardt et al. (2025), respectively.
Figure 12 demonstrates the fluorescence capacities measured by LILAS and MARTHA are in good agreement in the tropospheric BBA layer. However, in the UTLS layer MARTHA derived much lower values than LILAS. This low fluorescence capacity is likely linked to cloud processing, as MARTHA detected ice cloud formation at the base of the UTLS BBA layer. Nevertheless, other explanations cannot be excluded, such as different smoke plumes arriving at ATOLL and TROPOS–specifically, those originating from the same fire complex but not the same fire, or having experienced different aging conditions. Additionally, changes in smoke properties during transport between ATOLL and TROPOS may also contribute to the observed differences. Observations from Lindenberg, which is closer to Leipzig than Lille, as well as the data from time interval T1 at GPI, show more consistent values with MARTHA observations in the UTLS layer. And the fluorescence capacity from LILAS is in good agreement with GPI data during time interval T2. In the spectral range around 466 nm, the fluorescence capacities by the four lidar systems are consistent in magnitude, although variability should not be overlooked. At wavelengths greater than 450 nm, the spectra of RAMSES also demonstrate a gradual increase of spectral fluorescence capacities versus BBA layer height, except in the layer at 4600 m. Although spectra of the fluorescence capacities measured by GPI lidar and RAMSES show some extent of variability from layer to layer, the values are generally comparable and show consistent features, particularly in terms of the shape of the spectra and the central wavelengths in the troposphere and UTLS. For instance, the two BBA layers detected by RAMSES at 5700 and 10 500 m over Lindenberg, have almost the same central wavelengths and color ratios , compared with the layers at 5500 and 9000 m over GPI station (Case 3). A quantitative comparison of BBA fluorescence measurements is presented in Table C1 in the Appendix. It is important to note that the calibration of single-channel broadband fluorescence in LILAS currently carries high uncertainty (potentially leading to a 30 % underestimation, see details in Appendix A), due to the insufficient characterization of the transmission ratio between the fluorescence and Raman channels. More sophisticated calibration procedures will be required for future cross-comparisons.
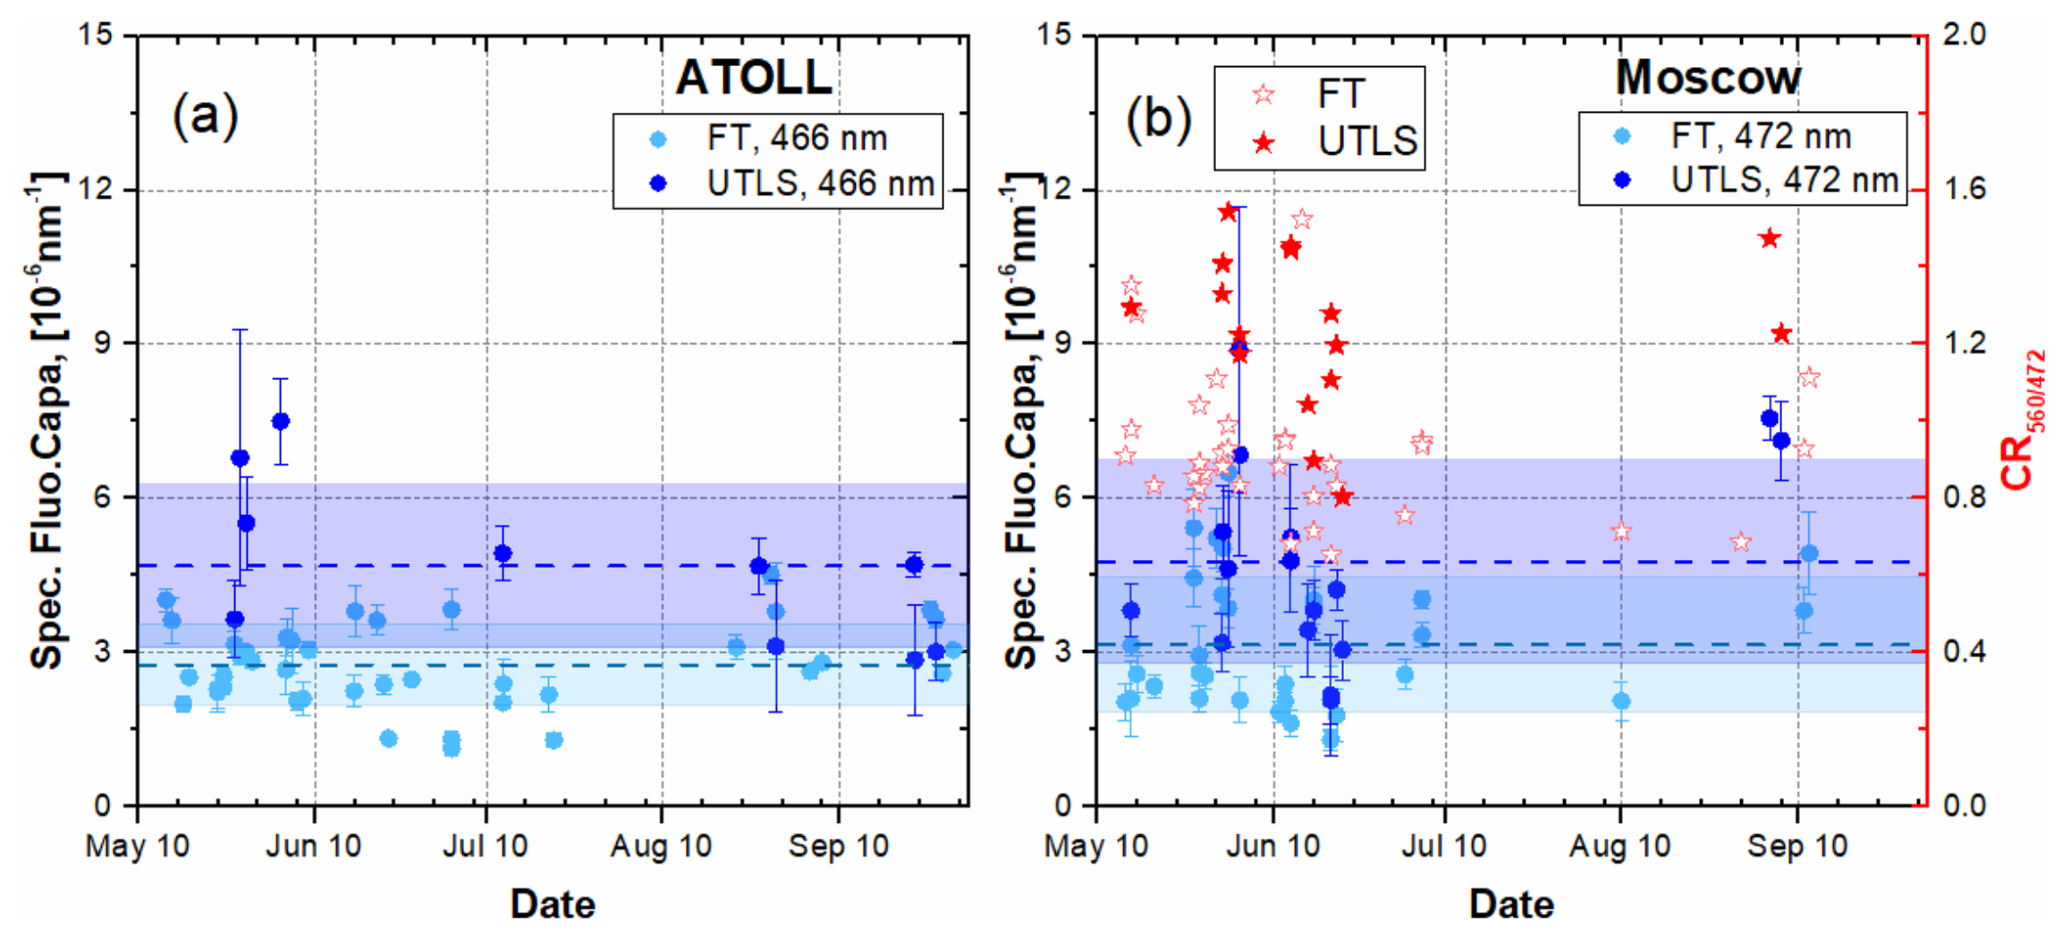
Figure 13The time series of spectral fluorescence capacity at 460 and 472 nm, and the color ratios CR measured by lidar systems at ATOLL observatory (Lille, France) and GPI (Moscow, Russia) during the period from May to September 2023. (a) The spectral fluorescence capacities at 466 nm from ATOLL. (b) The spectral fluorescence capacities at 472 nm and the color ratio of fluorescence between the 560 and 472 nm channels, measured by the multi-channel fluorescence lidar at Moscow.
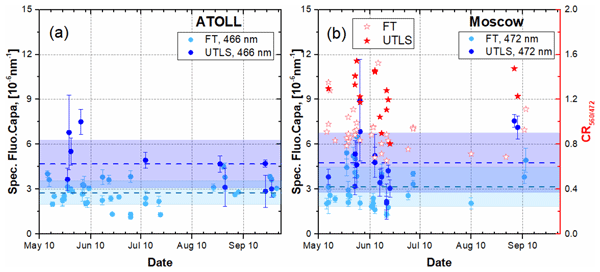
Figure 13a and b show the time series of spectral fluorescence capacities in BBA layers detected by lidar systems at ATOLL observatory and at GPI, respectively, in the period from May to September 2023. The average of the spectral fluorescence capacity in the tropospheric BBA layers was 2.7 ± 0.8 nm−1 at ATOLL and 3.2 ± 1.3 nm−1 GPI, while in the UTLS layers, the values were 4.7 ± 1.6 nm−1 at ATOLL and 4.8 ± 2.0 nm−1 at GPI. Despite differences in spectral coverage and calibration methods between the two fluorescence channels, the spectral fluorescence capacities at both sites are generally comparable in both the troposphere and the UTLS. This consistency validates the comparability of fluorescence measurements between the two different lidar stations and confirms that the properties of BBA particles arriving at these two lidar stations do not exhibit significant geographical variations. The values of spectral fluorescence capacity detected by lidar at GPI at 472 nm are generally greater than those at ATOLL observatory at 466 nm, it is probably because the 472 nm is closer to the peak of BBA fluorescence spectrum, as have been shown in Fig. 12.
In Fig. 13, we can see that enhanced spectral fluorescence capacities of BBA layers in the UTLS were observed at both stations. Although the spectral fluorescence capacity exhibits a substantial variability of approximately 40 %–60 % in both the UTLS and the free troposphere, the highest values were consistently observed in the UTLS, with no comparable peaks detected in the free troposphere. The values of spectral fluorescence capacity of BBAs may depend on multiple factors, such as the geographic location of wildfires, the vegetation, the burning condition, the aging process and so on. However, it is difficult to assess their influences on the fluorescent properties of BBAs, due to the limited information derived from remote sensing observations and uncertainties in the back trajectories of the plumes. The series of CR, which is the color ratio of fluorescence capacity or backscatter coefficient between 560 and 472 nm channels, is generally higher in the UTLS, averaging 1.3 ± 0.2, compared to 0.9 ± 0.2 in the troposphere. Higher color ratio in the UTLS than in the troposphere is a recurring feature of BBAs and has been detected consistently by both GPI and RAMSES during the fire season in 2023 (Veselovskii et al., 2025; Reichardt et al., 2025).

Figure 14(a) The spectrum of aerosol fluorescence capacity in three vertical ranges: PBL(blue line, below 3000 m), FT (cyan line between 3000 and 8000 m) and UTLS (red line, between 8000 and 12 000 m), measured by the five-channel fluorescence lidar at GPI, Moscow from May to September 2023. (b) The same plot as in panel (a) but normalized at 472 nm. This figure is adapted from Fig. 8 in Veselovskii et al. (2025).
Figure 14 summarizes the spectra of fluorescence capacity, as well as their normalized forms, in aerosol layers in three vertical ranges–below 3000, from 3000 to 8000, and 8000 to 12 000 m, measured by the lidar system at GPI from May to September in 2023. Urban aerosols, which dominated below 3000 m, showed fluorescence capacities generally lower than nm−1, with a spectrum monotonically decreasing versus wavelengths. Long-range transported BBAs were the major aerosol type at above 3000 m, while their fluorescence spectra show distinctive characteristics. In the free troposphere at 3000 to 8000 m, the fluorescence capacities varied between 1.5 and nm−1. In the UTLS at above 8000 m, the mean spectral fluorescence capacities are generally higher than their counterparts in the free troposphere. Additionally, the normalized fluorescence spectra in the UTLS showed a clear shift of the spectrum peak toward longer wavelengths.
4.4 Vertical variation of BBA properties
Although the 2023 Canadian wildfire season was exceptional in terms of burnt area, fire emissions and the generated detected PyroCb count, the emitted BBA plumes were mostly limited to the upper troposphere and the lowermost stratosphere. The uppermost BBA layer heights in this study is at 12–14 km, in agreement with SAGE III (Stratospheric Aerosol and Gas Experiment) observation presented in (Khaykin et al., 2025). In this analysis, we collect three intensive parameters of BBAs – the EAE355−532 and particle depolarization ratio at 532 nm from the observations at ATOLL and the color ratio CR from the observations at GPI station, to investigate the vertical variation of BBA properties. Figure 15 presents the variations of the three parameters with respect to the altitude of the BBA layer base, along with the corresponding linear regressions. The EAE decreases gradually with the increasing layer altitude, yielding r2≈0.61, while the depolarization ratio exhibits an increasing trend with r2≈0.68. The color ratio CR also shows a positive trend with altitude, with r2≈ 0.69. These values of r2 suggest moderate correlations; however, the data sets do not provide sufficient evidence to establish a genuine altitude dependence.
Most data points collected at ATOLL were from the free troposphere, as the calculation of EAE and depolarization ratio requires relatively higher optical thickness and signal-to-noise ratio in BBA layers, which are challenging conditions for UTLS layers. Consequently, the number of measurements in UTLS layers is lower than in the free troposphere, which limits the analysis of the vertical dependence. For the depolarization ratio in the troposphere, most data points are clustered near 0.05, with little variation across the altitude range and no clear trend versus altitude. The apparent positive correlation with altitude emerges only when the UTLS data points were included, as they are at higher altitude and exhibit distinctly higher depolarization ratios. The pattern may be an indication that the statistical correlation is driven primarily by the separation between the two regimes–tropospheric and UTLS, rather than by a continuous, altitude-driven relationship. A similar two-cluster distribution is also evident in the color ratio plot. These features are more consistent with discrete differences in BBA properties than with a vertical dependence. These observations indicate a possibility that altitude itself may not be the ultimate controlling factor of the BBA properties, but rather an intermediate variable linked to other factors, which could be the temperature and/or the injection height of the BBA layers in their source region, and so on. Reichardt et al. (2025) investigated the correlation between BBA properties and factors such as the origin, transport time, in-layer temperature and humidity, using RAMSES lidar data. They reported that the fluorescence spectra of the BBAs from different wildfire sources at different geographical locations showed, to some extent, correlation with the vegetation type (or climate zone) and in-layer temperature, while weak correlation with the transport time. Relative humidity also appeared to influence the fluorescence spectra, although its effect likely depends on the origin of BBA plumes. At present, further investigation of the dependence of BBA properties is constrained by the limited variability in the available BBA measurements and the small number of collocated and high-quality humidity and temperature data in the BBA layers.

Figure 15The variation of BBA optical properties versus the height of the layer base observed by lidar systems at ATOLL and GPI from May to September in 2023. (a) The extinction-related Angström exponent at 355 and 532 nm, and (b) the particle depolarization ratio at 532 nm detected by LILAS at ATOLL observatory. (c) The color ratio of the spectral fluorescence backscatter coefficients at 560 to 472 nm, detected by the lidar system at GPI,Moscow, Russian. The error bars in the plot represent the standard deviation within the selected BBA layers. The red dot-dashed lines represent the linear regression line of the data points.
4.5 Relative humidity in BBA layers
RHs within approximately 50 BBA layers observed at each lidar station were determined using a combination of lidar and radiosonde measurements. The RH data at GPI site were obtained from radiosonde measurements at Moscow site, while at ATOLL site, priority was given to RH derived from the lidar water vapor channel. When lidar water vapor measurements were unavailable (10 BBA layers), radiosonde data from Beauvechain (Belgium) station, 100 km from ATOLL, were used.
Figure 16a shows the frequency distribution of detected BBA layers as a function of their mean RH. All the analyzed layers exhibited RH values below 80 %, with the majority (90 % at Moscow and 85 % at ATOLL) showing mean RH below 50 %. At both sites, observations showed that RHs generally decreased at the altitudes where BBA layers occurred, even in the free troposphere where water vapor is more abundant than in the UTLS. The peak occurrence of RH within the detected BBA layers was in the range of 10 %–20 %.
Figure 16b presents the distribution of the spectral fluorescence capacity as a function of the mean RH within the BBA layers. The fluorescence capacities at 472 nm (GPI lidar) and at 466 nm (ATOLL lidar) are comparable and distribute mainly in the range of to . Layers with pronounced fluorescence capacity, greater than , are mainly UTLS layers, with RH approximately at 20 % or lower. According to the vertically averaged data across 5 months, plotted in Fig. 16b, the spectral fluorescence capacities do not show noticeable correlation with RH when air mass is relatively dry, i.e. RH ≤ 60 %. For RH > 60 %, the fluorescence capacity seemingly decreases with RH, however, the number of data points is not sufficient to draw a firm conclusion.
Veselovskii et al. (2025) and Reichardt et al. (2025) investigated the relationship between aerosol (not limited to BBA) fluorescence properties and RH using vertically resolved profiles from selected cases, rather than multi-month layer-averaged means. Reichardt et al. (2025) reported no clear correlation between RH and the central wavelength of the fluorescence spectra for the BBA layers likely originating from Western Canada on 26–27 May. While for BBA plumes from Eastern Canada, the results showed a weak to moderate correlation. These findings are in line with our observation in Case 1 where the fluorescence capacity stayed almost unchanged in the BBA layer with high humidity below the cloud base. While this cannot be considered direct, mutually corroborating evidence, it provides indirect support for limited hygroscopicity of aged BBAs. Most BBA layers analyzed in this study are dry and do not exhibit significant RH gradient, affecting the robustness of the correlation analysis. However, this generally low humidity in BBA layers suggests that aged BBAs have limited ability of absorbing water from the environment, implying low hygroscopicity. Fluorescence measurements have potential as a proxy for assessing aerosol hygroscopicity, but current studies are sparse and scattered, highlighting the need for more systematic investigation.
In previous publications, the atomic oxygen-to-carbon ratio (O:C) of the organic compounds are often used to assess the hygroscopicity organic particles, based on semi-empirical relationships between the hygroscopicity and the oxidation level of the organic aggregates (Jimenez et al., 2009; Massoli et al., 2010; Lambe et al., 2011). These studies, based on laboratory and field measurements, overall derived a generally positive correlation between the hygroscopicity and O:C ratio of organic aerosols. As a result, BBA are typically expected to become increasingly hygroscopic after being emitted into the atmosphere. However, the measured hygroscopicity of aerosols originated from biomass burning is still very variable, with κ – the hygroscopic parameter, varying from below 0.1 (weakly hygroscopic) to 0.4 (moderately hygroscopic) and showing dependence on multiple factors, such as fuel type and aging time (Petters et al., 2009; Carrico et al., 2010; Engelhart et al., 2012; Zheng et al., 2020; Cao et al., 2021; Pöhlker et al., 2023). Recent research reported other factors, such as carbon chain length, organic functionality and water solubility have significant impact on the hygroscopicity of organic aerosols, which explains the widely varying hygroscopicity of organic aerosols. It also points out the oxidation level of organic aerosols is not sufficient for parameterizing their hygroscopicity and the determination of the hygroscopicity of BBAs is a challenging task due to their complex organic composition and aging conditions in the atmosphere (Wang et al., 2019; Kuang et al., 2020; Han et al., 2022).
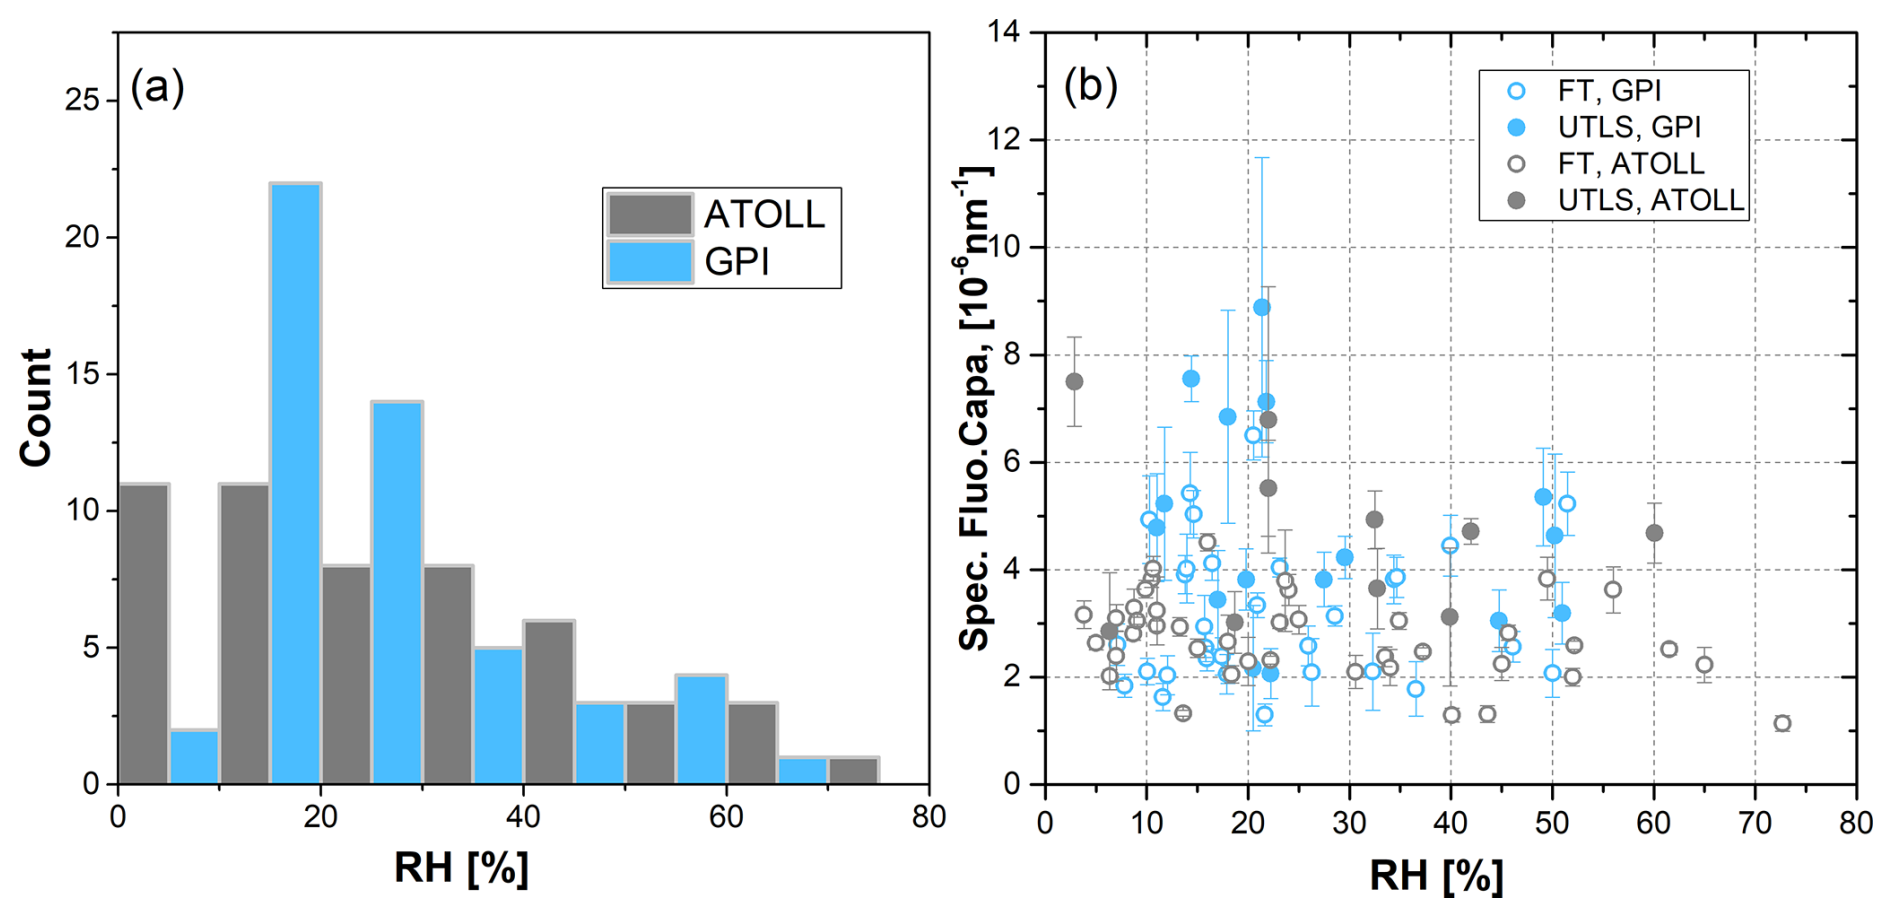
Figure 16(a) The count of BBA layers and (b) their spectral fluorescence capacity as a function of mean RH within the layers observed by lidars at GPI site in Moscow (blue color) and ATOLL site in Lille (gray color) from May to September 2023. The open circles and solid circles represent BBA layers in the free troposphere and UTLS, respectively. Values of spectral fluorescence capacity measured by lidar at Moscow and ATOLL are respectively at 472 and 466 nm.
In this study, we characterized long-range transported biomass burning aerosol (BBA) plumes from the exceptional 2023 Canadian wildfire season using coordinated lidar observations at the ATOLL observatory (France) and GPI (Russia) from May to September 2023. By combining a multi-waevlength Mie-Raman lidar with a multi-channel fluorescence lidar, we addressed key objectives regarding the optical properties, fluorescence signatures, vertical distribution, and hygroscopic behaviour of aged BBAs in both the free troposphere and the upper troposphere–lower stratosphere (UTLS). Four case studies and statistical analyses over five months revealed several robust features.
Measurements at ATOLL showed that UTLS BBAs exhibited higher particle depolarization ratios, lower Ångström exponents, and slightly lower lidar ratios compared to free-tropospheric BBAs. GPI lidar observations detected a clear fluorescence spectral redshift, with the peak shifting from 513 nm in the troposphere to 560 nm in the UTLS, confirmed by high-resolution fluorescence lidar RAMSES at Lindenberg. Fluorescence capacities at 466 nm (ATOLL) and 472 nm (GPI) were consistent in both tropospheric and UTLS BBA layers. The values of fluorescence capacity (at 466 and 472 nm) peaked in UTLS layers (at ATOLL and GPI), although they were not systematically higher in the UTLS than in the free troposphere. Cross-site comparison, combining lidar data from the MARTHA lidar (Leipzig) and RAMSES lidar (Lindenberg), showed good agreement in both the magnitude of fluorescence capacity and the overall spectral shape between broadband multi-channel (GPI station in Russia) and spectrometer-based system (RAMSES at Lindenberg). These results highlight the potential for coordinated multi-lidar fluorescence measurements, though further systematic comparisons are needed to fully reconcile the two detection approaches.
In-layer humidity analysis for more than 100 BBA layers revealed that most BBA layers were mostly dry (RH < 50 %)and did not show clear dependence of fluorescence capacity on RH. Case 1 showed a tropospheric BBA layer at a humid cloud base, while no clear hygroscopic growth was observation at such high RH (90 %–100 %). Moderate correlations (with r2 in the range 0.61 to 0.68) were found between key optical properties (extinction Ångström exponent, particle depolarization ratio, and CR) and layer height, however, these appear largely driven by systematic differences between tropospheric and UTLS regimes, linked to atmospheric processing or injection mechanisms, rather than a continuous altitude dependence.
Our results are largely consistent with earlier studies by showing distinct BBAs properties in the UTLS and the troposphere, while advancing our knowledge by providing dual-site, multi-channel observations across five months and by linking optical properties, fluorescence and humidity within the same plumes. The observation of limited hygroscopicity challenges the common assumption that aged BBAs are typically hygroscopic. As wildfire activities increased in the context of global warming, such observations are important for improving aerosol–cloud parameterizations and reducing uncertainties in biomass burning radiative forcing and climate impacts.
However, several limitations should be acknowledged. First, the dataset covers a single wildfire season and two primary sites, which may limit generalizability to other fire regimes or source regions. Second, relative humidity in BBA layers was derived from multiple sources (ERA5 reanalysis, lidar retrievals, and radiosondes), each carrying different uncertainties. Third, fluorescence calibration remains instrument-specific and contains non-negligible uncertainty, underscoring the need for improved standardization and broader intercomparison.
The calibration of a single-wavelength fluorescence channel integrated to a Raman lidar system is essentially to determine the ratio of optical and electronic efficiency between the fluorescence channel and the Raman channel. The spectrally integrated backscatter coefficient in the fluorescence channel can be expressed by Eq. (1):
where PF(z) and PR(z) are the lidar signals of fluorescence (F) and Raman channel (R), respectively. is the ratio of the instrumental constant between the Raman channel and the fluorescence channel, depending on the efficiencies of optics and detectors in the two channels. This ratio should be determined by the calibration procedure. Figure A1 shows the optical layout of the fluorescence channel and N2 Raman channel, where the transmission of the interference filters (IF) and the efficiencies of photomultipliers are denoted as and , respectively. The transmission of dichroic mirror (DM) splitting the two channels is denoted as . A two-step calibration procedure described as below is dedicated to derive the calibration coefficient .
- Step 1:
-
Keep the PMTs at their original position. SF and SR, representing the lidar signals received by the fluorescence channel at 466 nm and the Raman channel at 387 nm can be written as:
- Step 2:
-
Exchange the two PMTs, without changing the IF. Now the signals can be expressed as:
where S0 represents the incoming light intensity at the DM. The superscript of – k, is used to differentiate the two PMTs in fluorescence channel (k=1, i= F in Step 1 and i= R in Step 2) and Raman channel (k= 2, i= R in Step 1 and i= F in Step 2). And encompass the electronic gain and the quantum efficiency of each PMT.
The ratio of Raman signals before and after swapping PMTs is written as:
Note that the voltages supplying the two PMTs should remain unchanged when their positions are swapped.
The calibration term can be derived as follows:
Note that, in Eqs. (A1)–(A4), we assume the transmission in the optics before the DM is invariant between the spectral range of the Raman and fluorescence channel. Therefore, the ratio of instrument constant between the fluorescence channel and the Raman channel, , is determined by the transmission of the DM, the IFs, and the gain of the PMTs. Since the two channels are well separated in spectrum, the DM is able to split them with high clearance, i.e. tR=0 and tF=1. The ratio can be calculated from the transmission curves of the IFs provided by the manufacturer of optics. In the system of LILAS, the mean transmission is about 65 % in the Raman channel and 90 % in the fluorescence channel, therefore, equals approximately to 0.72. The ratio R is derived in Eq. (A3), following the calibration procedures in Step 1 and 2. At present, we assume the final term in Eq. (A4), , to be unity. This implies that the spectral dependence of both quantum efficiency and the electronic gain of the same PMT between the Raman and fluorescence wavelengths is neglected. This assumption could introduce an underestimation of around 30 % in the fluorescence backscatter and capacity, when using the spectrally resolved quantum efficiencies provided by Hamamatsu while ignoring the wavelength dependence of the electronic gain Gast et al. (2025). However, due to PMT aging (e.g., photocathode degradation), the actual quantum efficiency may deviate significantly from the manufacturer’s nominal values and is difficult to quantify precisely without dedicated calibration. Consequently, by neglecting the spectral dependence of the quantum efficiency, our fluorescence calibration still carries high uncertainty, which is explicitly acknowledged in the Discussion section.
It is also important to mention that the calibration of R specific to analog signal and photon-counting signal are performed simultaneously. The choice of R, analog (R∣AN) or photon-counting (R∣PC), should correspond to the choice of channels used for the calculation of βF. Additionally, if the calibration is performed correctly and the gluing coefficients, converting analog signal to photon-counting signal, are accurate, R∣AN and R∣PC should be exchangeable. For example, according to the calibration performed on LILAS system, 20 December 2023:
The gluing coefficients for 387 and 466 nm channels are approximately 65 and 105, respectively. The values of R∣PC can be approximated using the gluing coefficients
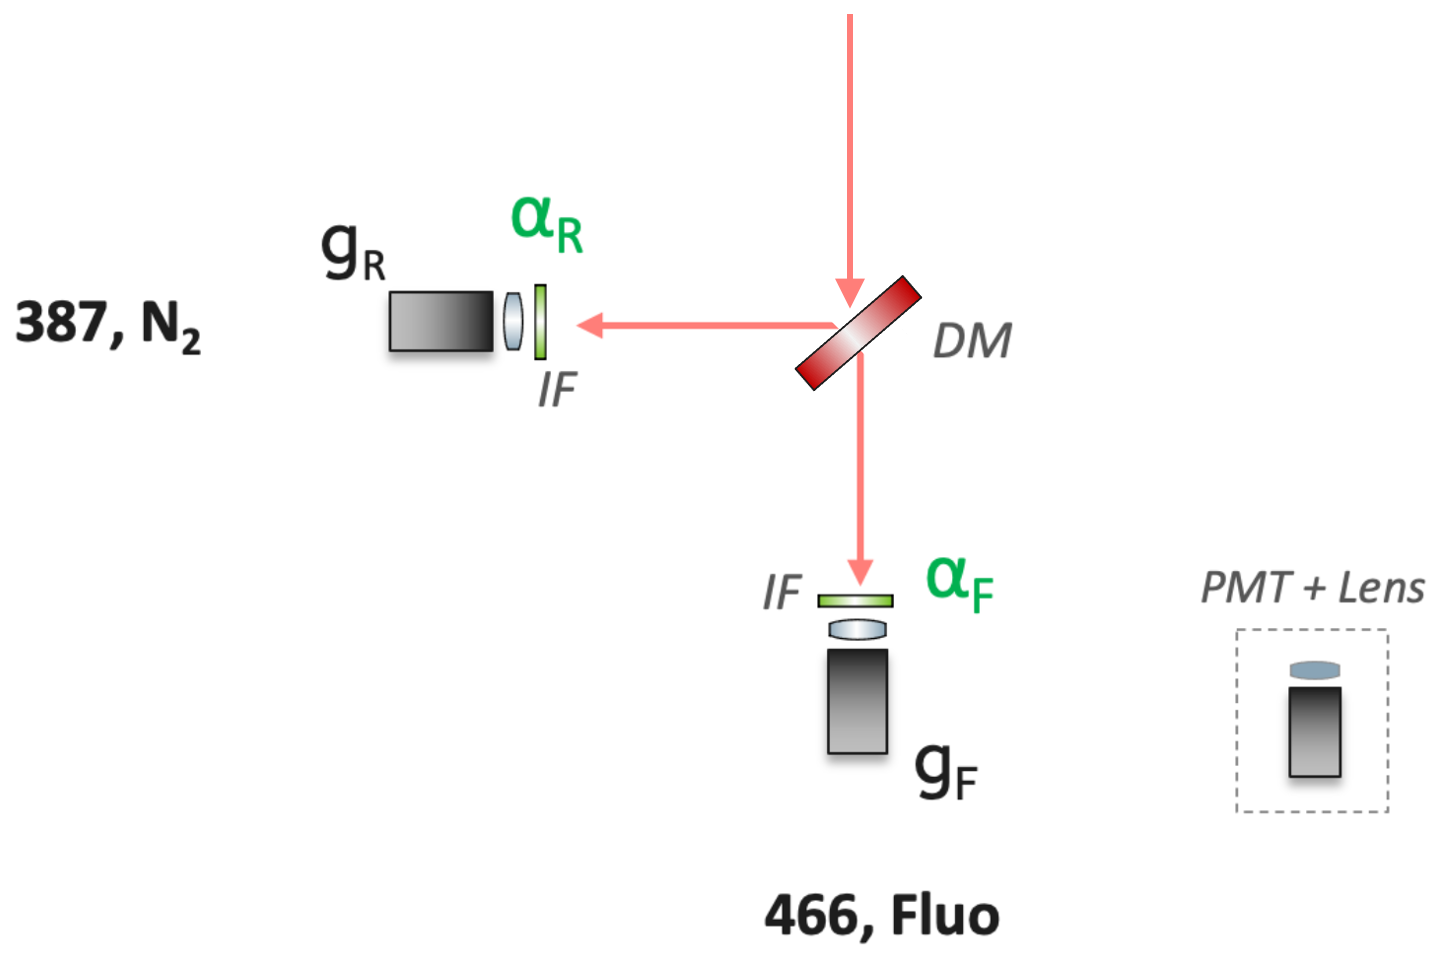
Figure A1The optical layout of the fluorescence channel at 466 nm and the N2 Raman channel at 387 nm in LILAS system at ATOLL observatory, Lille, France. The two channels are split by a dichroic mirror and neither of them is attenuated by neutral density filter. The calibration of the fluorescence channel requires to swapping the two PMTs without changing the interference filters with transmission denoted as α.
Figures B1 and B2 plot the back trajectories of air mass arriving at ATOLL observatory and GPI stations, respectively.
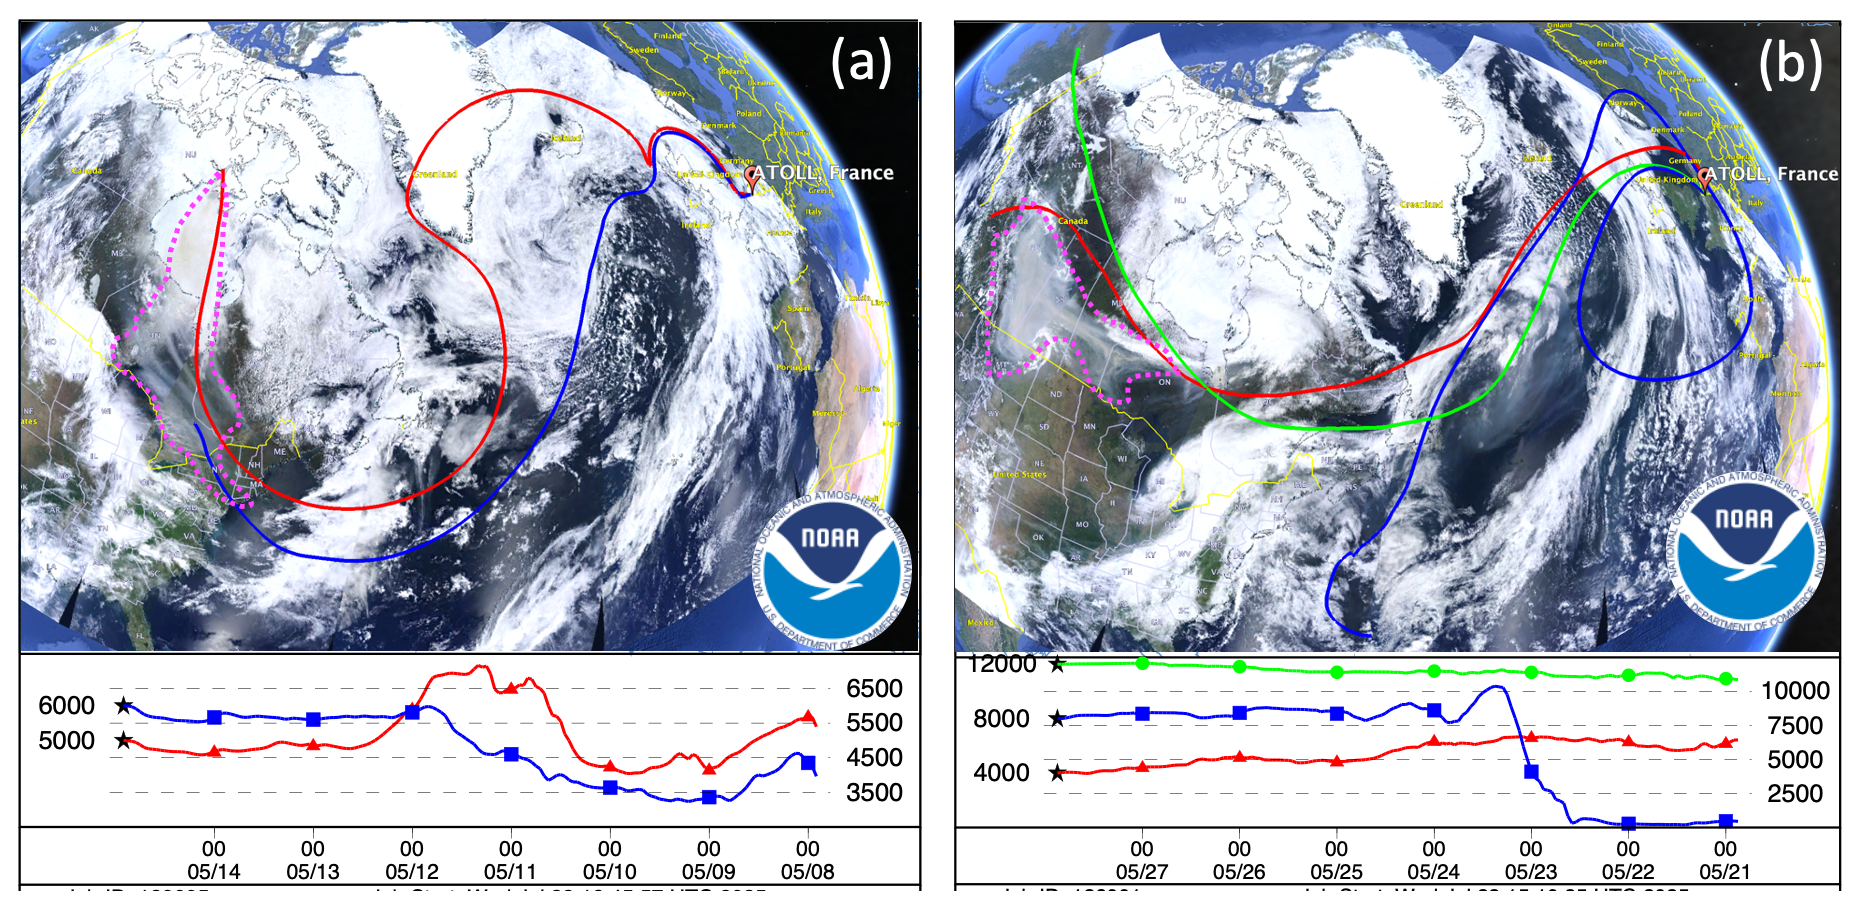
Figure B1The back trajectories of air mass for observations in Case 1 and 2 at ATOLL observatory, Lille, France. (a) 168 h backward trajectory for air mass at 5000 and 6000 height at 22:00 UTC, 14 May 2023, overlaid on MODIS True Color surface image on 8 May 2023. (b) 168 h backward trajectory for air mass at 4000, 8000, and 12 000 m height at 21:00 UTC, 27 May 2023. The base map is the true color image of MODIS on 20 May 2023. The area circled by dotted orange lines were covered by intense BBA plumes (marked by yellowish or gray color), when the airmass passed through. Imagery: Landsat/Copernicus (basemap) and MODIS/NASA (overlaid). Map data © Google Earth 2025..
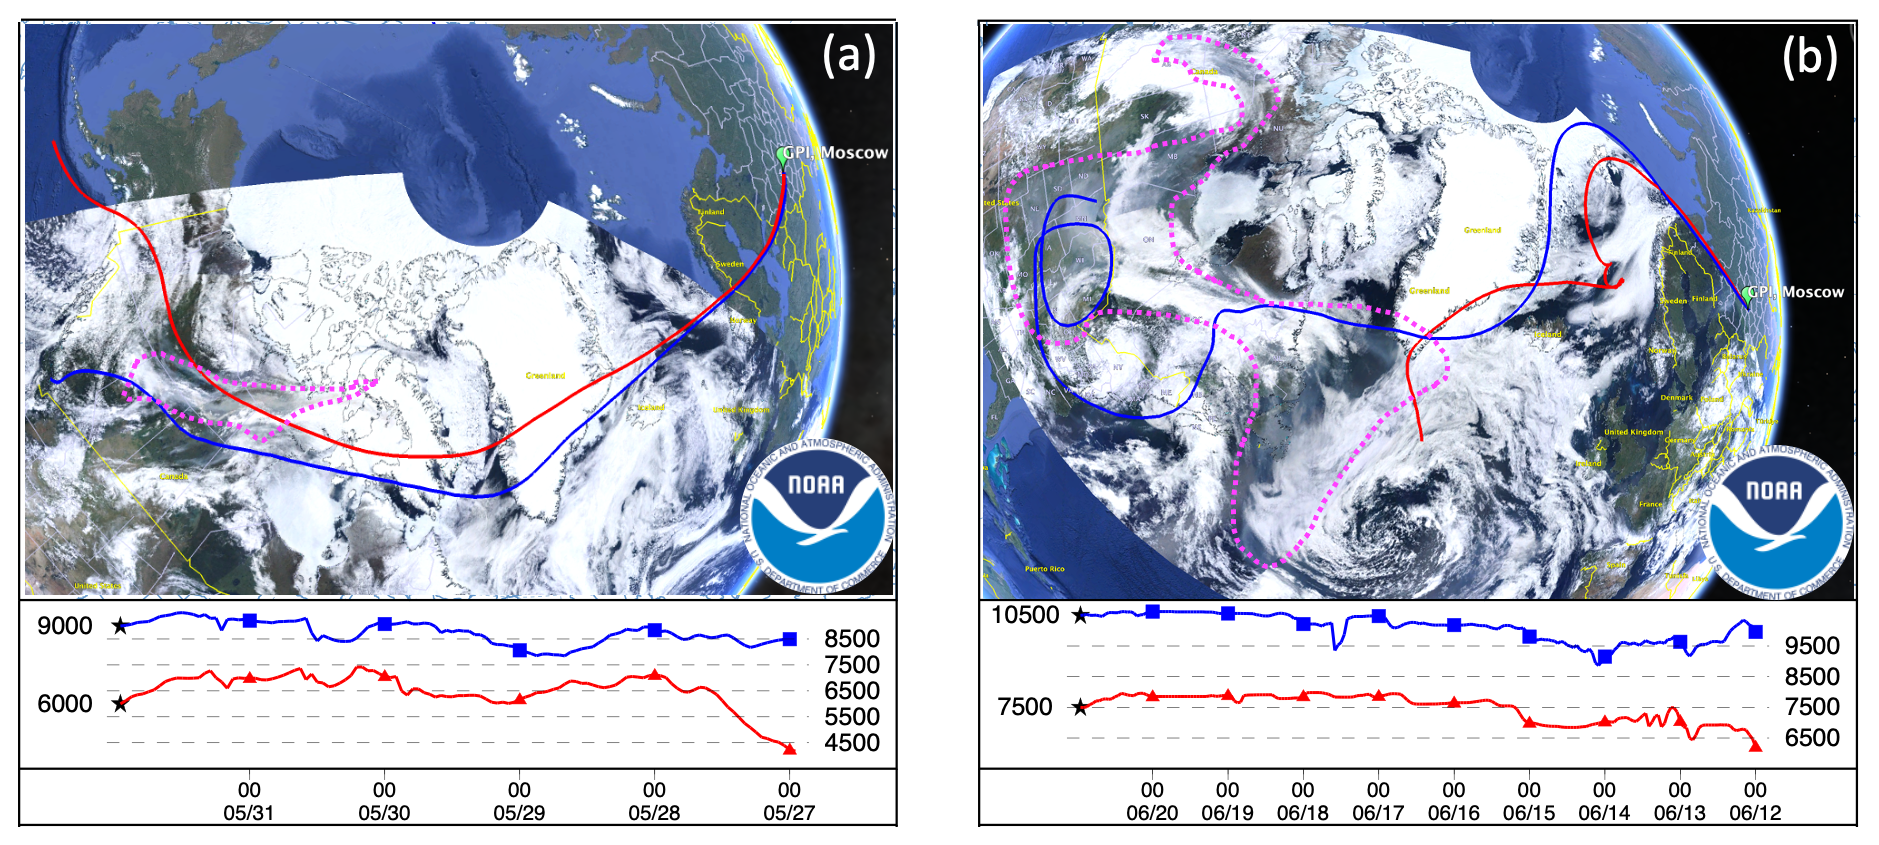
Figure B2The back trajectories of air mass for observations in Case 3 and 4 measured at GPI, Moscow, Russia. (a) 120 h backward trajectory for air mass at 6000 and 9000 m height at 23:00 UTC, 31 May 2023. The base map is the true color image of MODIS on 28 May 2023. (b) 192 h backward trajectory for air mass at 7500 and 10 500 m height at 23:00 UTC, 20 June 2023. The transport pathways are overlaid on MODIS True color surface image on 14 June 2023. The area circled by dotted orange lines represent the area covered by intense BBA plumes, marked by yellowish or gray color. Imagery: Landsat/Copernicus (basemap) and MODIS/NASA (overlaid). Map data © Google Earth 2025.
Table C1Comparison of spectral fluorescence capacities in BBA layers from the 2023 Alberta wildfires (Canada), measured by four fluorescence lidars at different stations. The instruments include LILAS at ATOLL (Lille, France), MARTHA at TROPOS (Leipzig, Germany), RAMSES at DWD (Lindenberg, Germany), and the GPI lidar (Moscow, Russia). LILAS, MARTHA, and the GPI lidar measure fluorescence signals using broadband interference filters. LILAS and MARTHA each operate with a single fluorescence channel (44 nm bandwidth centered at 466 nm), while the GPI lidar has five discrete fluorescence channels; for this comparison, measurements at 472 nm and 560 nm were selected. RAMSES captures the full fluorescence spectrum using a spectrometer, with a spectral resolution about 12 nm (Reichardt et al., 2023). To enable comparison with broadband measurements, RAMSES fluorescence capacity was averaged over two bands centered at 495 and 585 nm (80 nm bandwidth), corresponding to the “cyan” and “green” channels as defined by Reichardt et al. (2025). Abbreviations: LCH – layer central height; SFC – spectral fluorescence capacity; PWL – peak wavelength. The color ratio is calculated as SFC_2 to SFC_1.
Data will be made available upon the request to Qiaoyun Hu (qiaoyun.hu@univ-lille.fr).
QH performed data analysis and wrote the paper. PG supervised the project and revised the manuscript. IV performed measurements and contributed the GPI lidar data. TP, GD and WB performed and contributed to lidar measurements at ATOLL. SK contributed to the conception of this study and revised the manuscript. FD and MK contributed to the development of software used for lidar data analysis.
The contact author has declared that none of the authors has any competing interests.
Publisher's note: Copernicus Publications remains neutral with regard to jurisdictional claims made in the text, published maps, institutional affiliations, or any other geographical representation in this paper. The authors bear the ultimate responsibility for providing appropriate place names. Views expressed in the text are those of the authors and do not necessarily reflect the views of the publisher.
This work is supported by OBS4CLIM (project number: ANR-21-ESRE-0013), CaPPA (project number: ANR-11-LABX-0005-01), ECRIN/FEDER and the ANR PyroStrat project (project number: 21-CE01-335 0007-01, https://pyrostrat.projet.latmos.ipsl.fr, last access: 25 August 2026). In addition, the ESA/QA4EO program is greatly acknowledged for supporting the observation activity at LOA and the Russian Science Foundation is acknowledged for supporting the work at GPI through project 21-17-00114. The research activities performed at ATOLL observatory also benefit from the research infrastructure ACTRIS-FR, as well as from the Center of Aerosol Remote Sensing (CARS) of the ACTRIS Research Infrastructure. At last, we thank Jens Reichardt (Richard-Aßmann-Observatorium, Deutscher Wetterdienst, Lindenberg, Germany) and Benedikt Gast (TROPOS, Leipzig, Germany) for providing their lidar measurement for comparison.
This research has been supported by the Agence Nationale de la Recherche (grant no. ANR-11-LABX-0005-01), OBS4CLIM (project number: ANR-21-ESRE-0013), CaPPA (project number: ANR-11-LABX-0005-01), and ANR PyroStrat 25 project (project number: 21-CE01-335 0007-01).
This paper was edited by Matthias Tesche and reviewed by two anonymous referees.
Ansmann, A., Ohneiser, K., Chudnovsky, A., Knopf, D. A., Eloranta, E. W., Villanueva, D., Seifert, P., Radenz, M., Barja, B., Zamorano, F., Jimenez, C., Engelmann, R., Baars, H., Griesche, H., Hofer, J., Althausen, D., and Wandinger, U.: Ozone depletion in the Arctic and Antarctic stratosphere induced by wildfire smoke, Atmos. Chem. Phys., 22, 11701–11726, https://doi.org/10.5194/acp-22-11701-2022, 2022. a
Ansmann, A., Jimenez, C., Roschke, J., Bühl, J., Ohneiser, K., Engelmann, R., Radenz, M., Griesche, H., Hofer, J., Althausen, D., Knopf, D. A., Dahlke, S., Gaudek, T., Seifert, P., and Wandinger, U.: Impact of wildfire smoke on Arctic cirrus formation – Part 1: Analysis of MOSAiC 2019–2020 observations, Atmos. Chem. Phys., 25, 4847–4866, https://doi.org/10.5194/acp-25-4847-2025, 2025. a
Baars, H., Ansmann, A., Ohneiser, K., Haarig, M., Engelmann, R., Althausen, D., Hanssen, I., Gausa, M., Pietruczuk, A., Szkop, A., Stachlewska, I. S., Wang, D., Reichardt, J., Skupin, A., Mattis, I., Trickl, T., Vogelmann, H., Navas-Guzmán, F., Haefele, A., Acheson, K., Ruth, A. A., Tatarov, B., Müller, D., Hu, Q., Podvin, T., Goloub, P., Veselovskii, I., Pietras, C., Haeffelin, M., Fréville, P., Sicard, M., Comerón, A., Fernández García, A. J., Molero Menéndez, F., Córdoba-Jabonero, C., Guerrero-Rascado, J. L., Alados-Arboledas, L., Bortoli, D., Costa, M. J., Dionisi, D., Liberti, G. L., Wang, X., Sannino, A., Papagiannopoulos, N., Boselli, A., Mona, L., D'Amico, G., Romano, S., Perrone, M. R., Belegante, L., Nicolae, D., Grigorov, I., Gialitaki, A., Amiridis, V., Soupiona, O., Papayannis, A., Mamouri, R.-E., Nisantzi, A., Heese, B., Hofer, J., Schechner, Y. Y., Wandinger, U., and Pappalardo, G.: The unprecedented 2017–2018 stratospheric smoke event: decay phase and aerosol properties observed with the EARLINET, Atmos. Chem. Phys., 19, 15183–15198, https://doi.org/10.5194/acp-19-15183-2019, 2019. a
Barry, R. G. and Chorley, R. J.: Atmosphere, weather and climate, Routledge, https://doi.org/10.4324/9780203871027, 2009. a
Bock, O., Bosser, P., Bourcy, T., David, L., Goutail, F., Hoareau, C., Keckhut, P., Legain, D., Pazmino, A., Pelon, J., Pipis, K., Poujol, G., Sarkissian, A., Thom, C., Tournois, G., and Tzanos, D.: Accuracy assessment of water vapour measurements from in situ and remote sensing techniques during the DEMEVAP 2011 campaign at OHP, Atmos. Meas. Tech., 6, 2777–2802, https://doi.org/10.5194/amt-6-2777-2013, 2013. a
Byrne, B., Liu, J., Bowman, K. W., Pascolini-Campbell, M., Chatterjee, A., Pandey, S., Miyazaki, K., van der Werf, G. R., Wunch, D., Wennberg, P. O., Roehl, C. M., and Sinha, S.: Carbon emissions from the 2023 Canadian wildfires, Nature, 1–5, https://doi.org/10.1038/s41586-024-07878-z, 2024. a
Cao, T., Li, M., Zou, C., Fan, X., Song, J., Jia, W., Yu, C., Yu, Z., and Peng, P.: Chemical composition, optical properties, and oxidative potential of water- and methanol-soluble organic compounds emitted from the combustion of biomass materials and coal, Atmos. Chem. Phys., 21, 13187–13205, https://doi.org/10.5194/acp-21-13187-2021, 2021. a
Carrico, C. M., Petters, M. D., Kreidenweis, S. M., Sullivan, A. P., McMeeking, G. R., Levin, E. J. T., Engling, G., Malm, W. C., and Collett Jr., J. L.: Water uptake and chemical composition of fresh aerosols generated in open burning of biomass, Atmos. Chem. Phys., 10, 5165–5178, https://doi.org/10.5194/acp-10-5165-2010, 2010. a
Carslaw, K. S.: Aerosols and Climate, Elsevier Science Publishing, 1st Edn., https://doi.org/10.1016/C2019-0-00121-5, 2022. a
Czech, H., Popovicheva, O., Chernov, D. G., Kozlov, A., Schneider, E., Shmargunov, V. P., Sueur, M., Rüger, C. P., Afonso, C., Uzhegov, V., Kozlov, V. S., Panchenko, M. V., and Zimmermann, R.: Wildfire plume ageing in the photochemical large aerosol chamber (PHOTO-LAC), Env. Sci. Proc. Impact., 26, 35–55, https://doi.org/10.1039/D3EM00280B, 2024. a
Danielsen, E. F.: Stratospheric-tropospheric exchange based on radioactivity, ozone and potential vorticity, J. Atmos. Sci., 25, 502–518, 1968. a
Dawson, K. W., Ferrare, R. A., Moore, R. H., Clayton, M. B., Thorsen, T. J., and Eloranta, E. W.: Ambient Aerosol Hygroscopic Growth From Combined Raman Lidar and HSRL, J. Geophys. Res.-Atmos., 125, e2019JD031708, https://doi.org/10.1029/2019JD031708, 2020. a
Engelhart, G. J., Hennigan, C. J., Miracolo, M. A., Robinson, A. L., and Pandis, S. N.: Cloud condensation nuclei activity of fresh primary and aged biomass burning aerosol, Atmos. Chem. Phys., 12, 7285–7293, https://doi.org/10.5194/acp-12-7285-2012, 2012. a
Garra, P., Maschowski, C., Liaud, C., Dieterlen, A., Trouvé, G., Le Calvé, S., Jaffrezo, J.-L., Leyssens, G., Schönnenbeck, C., Kohler, S., and Gieré, R.: Fluorescence microscopy analysis of particulate matter from biomass burning: Polyaromatic Hydrocarbons as Main Contributors, Aerosol Sci. Technol., 49, 1160–1169, https://doi.org/10.1080/02786826.2015.1107181, 2015. a
Gast, B., Jimenez, C., Ansmann, A., Haarig, M., Engelmann, R., Fritzsch, F., Floutsi, A. A., Griesche, H., Ohneiser, K., Hofer, J., Radenz, M., Baars, H., Seifert, P., and Wandinger, U.: Invisible aerosol layers: improved lidar detection capabilities by means of laser-induced aerosol fluorescence, Atmos. Chem. Phys., 25, 3995–4011, https://doi.org/10.5194/acp-25-3995-2025, 2025. a, b, c, d, e
Haarig, M., Ansmann, A., Baars, H., Jimenez, C., Veselovskii, I., Engelmann, R., and Althausen, D.: Depolarization and lidar ratios at 355, 532, and 1064 nm and microphysical properties of aged tropospheric and stratospheric Canadian wildfire smoke, Atmos. Chem. Phys., 18, 11847–11861, https://doi.org/10.5194/acp-18-11847-2018, 2018. a, b, c
Han, S., Hong, J., Luo, Q., Xu, H., Tan, H., Wang, Q., Tao, J., Zhou, Y., Peng, L., He, Y., Shi, J., Ma, N., Cheng, Y., and Su, H.: Hygroscopicity of organic compounds as a function of organic functionality, water solubility, molecular weight, and oxidation level, Atmos. Chem. Phys., 22, 3985–4004, https://doi.org/10.5194/acp-22-3985-2022, 2022. a
Hodshire, A. L., Ramnarine, E., Akherati, A., Alvarado, M. L., Farmer, D. K., Jathar, S. H., Kreidenweis, S. M., Lonsdale, C. R., Onasch, T. B., Springston, S. R., Wang, J., Wang, Y., Kleinman, L. I., Sedlacek III, A. J., and Pierce, J. R.: Dilution impacts on smoke aging: evidence in Biomass Burning Observation Project (BBOP) data, Atmos. Chem. Phys., 21, 6839–6855, https://doi.org/10.5194/acp-21-6839-2021, 2021. a
Hu, Q.: Advanced aerosol characterization using sun/sky photometer and multi-wavelength Mie-Raman lidar measurements, Ph.D. thesis, Lille 1, https://www.theses.fr/2018LILUR078/document (last access: 25 August 2026), 2018. a
Hu, Q., Goloub, P., Veselovskii, I., Bravo-Aranda, J.-A., Popovici, I. E., Podvin, T., Haeffelin, M., Lopatin, A., Dubovik, O., Pietras, C., Huang, X., Torres, B., and Chen, C.: Long-range-transported Canadian smoke plumes in the lower stratosphere over northern France, Atmos. Chem. Phys., 19, 1173–1193, https://doi.org/10.5194/acp-19-1173-2019, 2019. a, b
Hu, Q., Goloub, P., Veselovskii, I., and Podvin, T.: The characterization of long-range transported North American biomass burning plumes: what can a multi-wavelength Mie–Raman-polarization-fluorescence lidar provide?, Atmos. Chem. Phys., 22, 5399–5414, https://doi.org/10.5194/acp-22-5399-2022, 2022. a, b
Jain, P., Barber, Q. E., Taylor, S. W., Whitman, E., Castellanos Acuna, D., Boulanger, Y., Chavardès, R. D., Chen, J., Englefield, P., Flannigan, M., Girardin, M. P., Hanes, C. C., Little, J., Morrison, K., Skakun, R. S., Thompson, D. K., Wang, X., and Parisien, M.-A.: Drivers and Impacts of the Record-Breaking 2023 Wildfire Season in Canada, Nat. Commun., 15, 6764, https://doi.org/10.1038/s41467-024-51154-7, 2024. a
Jimenez, J. L., Canagaratna, M. R., Donahue, N. M., Prevot, A. S. H., Zhang, Q., Kroll, J. H., DeCarlo, P. F., Allan, J. D., Coe, H., Ng, N. L., Aiken, A. C., Docherty, K. S., Ulbrich, I. M., Grieshop, A. P., Robinson, A. L., Duplissy, J., Smith, J. D., Wilson, K. R., Lanz, V. A., Hueglin, C., Sun, Y. L., Tian, J., Laaksonen, A., Raatikainen, T., Rautiainen, J., Vaattovaara, P., Ehn, M., Kulmala, M., Tomlinson, J. M., Collins, D. R., Cubison, M. J., E., Dunlea, J., Huffman, J. A., Onasch, T. B., Alfarra, M. R., Williams, P. I., Bower, K., Kondo, Y., Schneider, J., Drewnick, F., Borrmann, S., Weimer, S., Demerjian, K., Salcedo, D., Cottrell, L., Griffin, R., Takami, A., Miyoshi, T., Hatakeyama, S., Shimono, A., Sun, J. Y., Zhang, Y. M., Dzepina, K., Kimmel, J. R., Sueper, D., Jayne, J. T., Herndon, S. C., Trimborn, A. M., Williams, L. R., Wood, E. C., Middlebrook, A. M., Kolb, C. E., Baltensperger, U., and Worsnop, D. R.: Evolution of Organic Aerosols in the Atmosphere, Science, 326, 1525–1529, https://doi.org/10.1126/science.1180353, 2009. a, b
June, N. A., Hodshire, A. L., Wiggins, E. B., Winstead, E. L., Robinson, C. E., Thornhill, K. L., Sanchez, K. J., Moore, R. H., Pagonis, D., Guo, H., Campuzano-Jost, P., Jimenez, J. L., Coggon, M. M., Dean-Day, J. M., Bui, T. P., Peischl, J., Yokelson, R. J., Alvarado, M. J., Kreidenweis, S. M., Jathar, S. H., and Pierce, J. R.: Aerosol size distribution changes in FIREX-AQ biomass burning plumes: the impact of plume concentration on coagulation and OA condensation/evaporation, Atmos. Chem. Phys., 22, 12803–12825, https://doi.org/10.5194/acp-22-12803-2022, 2022. a
Katich, J. M., Apel, E. C., Bourgeois, I., Brock, C. A., Bui, T. P., Campuzano-Jost, P., Commane, R., Daube, B., Dollner, M., Fromm, M., Froyd, K. D., Hills, A. J., Hornbrook, R. S., Jimenez, J. L., Kupc, A., Lamb, K. D., McKain, K., Moore, F., Murphy, D. M., Nault, B. A., Peischl, J., Perring, A. E., Peterson, D. A., Ray, E. A., Rosenlof, K. H., Ryerson, T., Schill, G. P., Schroder, J. C., Weinzierl, B., Thompson, C., Williamson, C. J., Wofsy, S. C., Yu, P., and Schwarz, J. P.: Pyrocumulonimbus affect average stratospheric aerosol composition, Science, 379, 815–820, https://doi.org/10.1126/science.add3101, 2023. a, b
Khaykin, S., Bekki, S., Godin-Beekmann, S., Fromm, M. D., Goloub, P., Hu, Q., Josse, B., Laeng, A., Meziane, M., Peterson, D. A., Pelletier, S., and Thouret, V.: Stratospheric impact of the anomalous 2023 Canadian wildfires: the two vertical pathways of smoke, Atmos. Chem. Phys., 25, 14551–14571, https://doi.org/10.5194/acp-25-14551-2025, 2025. a, b, c, d
Kleinman, L. I., Sedlacek III, A. J., Adachi, K., Buseck, P. R., Collier, S., Dubey, M. K., Hodshire, A. L., Lewis, E., Onasch, T. B., Pierce, J. R., Shilling, J., Springston, S. R., Wang, J., Zhang, Q., Zhou, S., and Yokelson, R. J.: Rapid evolution of aerosol particles and their optical properties downwind of wildfires in the western US, Atmos. Chem. Phys., 20, 13319–13341, https://doi.org/10.5194/acp-20-13319-2020, 2020. a
Krüger, K., Schäfler, A., Wirth, M., Weissmann, M., and Craig, G. C.: Vertical structure of the lower-stratospheric moist bias in the ERA5 reanalysis and its connection to mixing processes, Atmos. Chem. Phys., 22, 15559–15577, https://doi.org/10.5194/acp-22-15559-2022, 2022. a
Kuang, Y., Xu, W., Tao, J., Ma, N., Zhao, C., and Shao, M.: A review on laboratory studies and field measurements of atmospheric organic aerosol hygroscopicity and its parameterization based on oxidation levels, Curr. Pollut. Rep., 6, 410–424, 2020. a
Lambe, A. T., Onasch, T. B., Massoli, P., Croasdale, D. R., Wright, J. P., Ahern, A. T., Williams, L. R., Worsnop, D. R., Brune, W. H., and Davidovits, P.: Laboratory studies of the chemical composition and cloud condensation nuclei (CCN) activity of secondary organic aerosol (SOA) and oxidized primary organic aerosol (OPOA), Atmos. Chem. Phys., 11, 8913–8928, https://doi.org/10.5194/acp-11-8913-2011, 2011. a, b
Lee, H. J., Laskin, A., Laskin, J., and Nizkorodov, S. A.: Excitation–emission spectra and fluorescence quantum yields for fresh and aged biogenic secondary organic aerosols, Environ. Sci. Technol., 47, 5763–5770, https://doi.org/10.1021/es400644c, 2013. a
Mamouri, R.-E., Ansmann, A., Ohneiser, K., Knopf, D. A., Nisantzi, A., Bühl, J., Engelmann, R., Skupin, A., Seifert, P., Baars, H., Ene, D., Wandinger, U., and Hadjimitsis, D.: Wildfire smoke triggers cirrus formation: lidar observations over the eastern Mediterranean, Atmos. Chem. Phys., 23, 14097–14114, https://doi.org/10.5194/acp-23-14097-2023, 2023. a, b, c
Massoli, P., Lambe, A. T., Ahern, A. T., Williams, L. R., Ehn, M., Mikkilä, J., Canagaratna, M. R., Brune, W. H., Onasch, T. B., Jayne, J. T., Petäjä, T., Kulmala, M., Laaksonen, A., Kolb, C. E., Davidovits, P., and Worsnop, D. R.: Relationship between aerosol oxidation level and hygroscopic properties of laboratory generated secondary organic aerosol (SOA) particles, Geophys. Res. Lett., 37, https://doi.org/10.1029/2010GL045258, 2010. a, b
Müller, D., Mattis, I., Ansmann, A., Wandinger, U., Ritter, C., and Kaiser, D.: Multiwavelength Raman lidar observations of particle growth during long-range transport of forest-fire smoke in the free troposphere, Geophys. Res. Lett., 34, https://doi.org/10.1029/2006GL027936, 2007. a
Navas-Guzmán, F., Martucci, G., Collaud Coen, M., Granados-Muñoz, M. J., Hervo, M., Sicard, M., and Haefele, A.: Characterization of aerosol hygroscopicity using Raman lidar measurements at the EARLINET station of Payerne, Atmos. Chem. Phys., 19, 11651–11668, https://doi.org/10.5194/acp-19-11651-2019, 2019. a
Ohneiser, K., Ansmann, A., Baars, H., Seifert, P., Barja, B., Jimenez, C., Radenz, M., Teisseire, A., Floutsi, A., Haarig, M., Foth, A., Chudnovsky, A., Engelmann, R., Zamorano, F., Bühl, J., and Wandinger, U.: Smoke of extreme Australian bushfires observed in the stratosphere over Punta Arenas, Chile, in January 2020: optical thickness, lidar ratios, and depolarization ratios at 355 and 532 nm, Atmos. Chem. Phys., 20, 8003–8015, https://doi.org/10.5194/acp-20-8003-2020, 2020. a, b
Ohneiser, K., Ansmann, A., Kaifler, B., Chudnovsky, A., Barja, B., Knopf, D. A., Kaifler, N., Baars, H., Seifert, P., Villanueva, D., Jimenez, C., Radenz, M., Engelmann, R., Veselovskii, I., and Zamorano, F.: Australian wildfire smoke in the stratosphere: the decay phase in 2020/2021 and impact on ozone depletion, Atmos. Chem. Phys., 22, 7417–7442, https://doi.org/10.5194/acp-22-7417-2022, 2022. a
Perring, A. E., Schwarz, J. P., Markovic, M. Z., Fahey, D. W., Jimenez, J. L., Campuzano-Jost, P., Palm, B. D., Wisthaler, A., Mikoviny, T., Diskin, G., Sachse, G., Ziemba, L., Anderson, B., Shingler, T., Crosbie, E., Sorooshian, A., Yokelson, R., and Gao, R.-S.: In situ measurements of water uptake by black carbon-containing aerosol in wildfire plumes, J. Geophys. Res.-Atmos., 122, 1086–1097, https://doi.org/10.1002/2016JD025688, 2017. a
Peterson, D. A., Fromm, M. D., Solbrig, J. E., Hyer, E. J., Surratt, M. L., and Campbell, J. R.: Detection and Inventory of Intense Pyroconvection in Western North America using GOES-15 Daytime Infrared Data, J. Appl. Meteorol. Clim., 56, 471–493, https://doi.org/10.1175/JAMC-D-16-0226.1, 2017. a
Petters, M. D., Carrico, C. M., Kreidenweis, S. M., Prenni, A. J., DeMott, P. J., Collett Jr, J. L., and Moosmüller, H.: Cloud condensation nucleation activity of biomass burning aerosol, J. Geophys. Res.-Atmos., 114, https://doi.org/10.1029/2009JD012353, 2009. a, b
Pöhlker, M. L., Pöhlker, C., Quaas, J., Mülmenstädt, J., Pozzer, A., Andreae, M. O., Artaxo, P., Block, K., Coe, H., Ervens, B., Gallimore, P., Gaston, C. J., Gunthe, S. S., Henning, S., Herrmann, H., Krüger, O. O., McFiggans, G., Poulain, L., Raj, S. S., Reyes-Villegas, E., Royer, H. M., Walter, D., Wang, Y., and Pöschl, U.: Global organic and inorganic aerosol hygroscopicity and its effect on radiative forcing, Nat. Commun., 14, 6139, https://doi.org/10.1038/s41467-023-41695-8, 2023. a
Reichardt, J.: Cloud and Aerosol Spectroscopy with Raman Lidar, J. Atmos. Ocean. Tech., 31, 1946–1963, https://doi.org/10.1175/JTECH-D-13-00188.1, 2014. a, b
Reichardt, J., Leinweber, R., and Schwebe, A.: Fluorescing aerosols and clouds: investigations of co-existence, in: EPJ Web of Conferences, EDP Sciences, 176, 05010, https://doi.org/10.1051/epjconf/201817605010, 2018. a
Reichardt, J., Lauermann, F., and Behrendt, O.: Aerosol Studies with Spectrometric Fluorescence and Raman Lidar, in: International Laser Radar Conference, Springer, 279–285, https://doi.org/10.1007/978-3-031-37818-8_37, 2022. a, b
Reichardt, J., Behrendt, O., and Lauermann, F.: Spectrometric fluorescence and Raman lidar: absolute calibration of aerosol fluorescence spectra and fluorescence correction of humidity measurements, Atmos. Meas. Tech., 16, 1–13, https://doi.org/10.5194/amt-16-1-2023, 2023. a, b, c, d
Reichardt, J., Lauermann, F., and Behrendt, O.: Fluorescence spectra of atmospheric aerosols, Atmos. Chem. Phys., 25, 5857–5892, https://doi.org/10.5194/acp-25-5857-2025, 2025. a, b, c, d, e, f, g, h, i, j
Rosenfeld, D., Fromm, M., Trentmann, J., Luderer, G., Andreae, M. O., and Servranckx, R.: The Chisholm firestorm: observed microstructure, precipitation and lightning activity of a pyro-cumulonimbus, Atmos. Chem. Phys., 7, 645–659, https://doi.org/10.5194/acp-7-645-2007, 2007. a
Rudich, Y., Donahue, N. M., and Mentel, T. F.: Aging of organic aerosol: Bridging the gap between laboratory and field studies, Annu. Rev. Phys. Chem., 58, 321–352, 2007. a
Schill, G. P., Froyd, K. D., Bian, H., Kupc, A., Williamson, C., Brock, C. A., Ray, E., Hornbrook, R. S., Hills, A. J., Apel, E. C., Chin, M., Colarco, P. R., and Murphy, D. M.: Widespread biomass burning smoke throughout the remote troposphere, Nat. Geosci., 13, 422–427, 2020. a
Selimovic, V., Yokelson, R. J., McMeeking, G. R., and Coefield, S.: In situ measurements of trace gases, PM, and aerosol optical properties during the 2017 NW US wildfire smoke event, Atmos. Chem. Phys., 19, 3905–3926, https://doi.org/10.5194/acp-19-3905-2019, 2019. a
Simmons, A., Soci, C., Nicolas, J., Bell, B., Berrisford, P., Dragani, R., Flemming, J., Haimberger, L., Healy, S., Hersbach, H., Horányi, A., Inness, A., Muñoz-Sabater, J., Radu, R., and Schepers, D.: Global stratospheric temperature bias and other stratospheric aspects of ERA5 and ERA5.1, European Centre for Medium Range Weather Forecasts Reading, UK, Q. J. Roy. Meteor. Soc., 146, 1951–1972, https://doi.org/10.1002/qj.3803, 2020. a
Solomon, S., Dube, K., Stone, K., Yu, P., Kinnison, D., Toon, O. B., Strahan, S. E., Rosenlof, K. H., Portmann, R., Davis, S., Randel, W., Bernath, P., Boone, C., Bardeen, C. G., Bourassa, A., Zawada, D., and Degenstein, D.: On the stratospheric chemistry of midlatitude wildfire smoke, P. Natl. Acad. Sci. USA, 119, e2117325119, https://doi.org/10.1073/pnas.2117325119, 2022. a
Sugimoto, N., Huang, Z., Nishizawa, T., Matsui, I., and Tatarov, B.: Fluorescence from atmospheric aerosols observed with a multi-channel lidar spectrometer, Opt. Express, 20, 20800–20807, https://doi.org/10.1364/OE.20.020800, 2012. a
Sun, B., Calbet, X., Reale, A., Schroeder, S., Bali, M., Smith, R., and Pettey, M.: Accuracy of Vaisala RS41 and RS92 Upper Tropospheric Humidity Compared to Satellite Hyperspectral Infrared Measurements, Remote Sens., 13, https://doi.org/10.3390/rs13020173, 2021. a
Trickl, T., Vogelmann, H., Flentje, H., and Ries, L.: Stratospheric ozone in boreal fire plumes – the 2013 smoke season over central Europe, Atmos. Chem. Phys., 15, 9631–9649, https://doi.org/10.5194/acp-15-9631-2015, 2015. a
Veselovskii, I., Hu, Q., Goloub, P., Podvin, T., Korenskiy, M., Pujol, O., Dubovik, O., and Lopatin, A.: Combined use of Mie–Raman and fluorescence lidar observations for improving aerosol characterization: feasibility experiment, Atmos. Meas. Tech., 13, 6691–6701, https://doi.org/10.5194/amt-13-6691-2020, 2020. a, b
Veselovskii, I., Kasianik, N., Korenskii, M., Hu, Q., Goloub, P., Podvin, T., and Liu, D.: Multiwavelength fluorescence lidar observations of smoke plumes, Atmos. Meas. Tech., 16, 2055–2065, https://doi.org/10.5194/amt-16-2055-2023, 2023. a, b
Veselovskii, I., Hu, Q., Goloub, P., Podvin, T., Boissiere, W., Korenskiy, M., Kasianik, N., Khaykyn, S., and Miri, R.: Derivation of depolarization ratios of aerosol fluorescence and water vapor Raman backscatters from lidar measurements, Atmos. Meas. Tech., 17, 1023–1036, https://doi.org/10.5194/amt-17-1023-2024, 2024. a, b, c, d
Veselovskii, I., Korenskiy, M., Kasianik, N., Barchunov, B., Hu, Q., Goloub, P., and Podvin, T.: Fluorescence properties of long-range-transported smoke: insights from five-channel lidar observations over Moscow during the 2023 wildfire season, Atmos. Chem. Phys., 25, 1603–1615, https://doi.org/10.5194/acp-25-1603-2025, 2025. a, b, c, d
Wallace, J. M. and Hobbs, P. V.: Atmospheric science: an introductory survey, vol. 92, Elsevier, https://doi.org/10.1016/C2009-0-00034-8, 2006. a
Wang, J., Shilling, J. E., Liu, J., Zelenyuk, A., Bell, D. M., Petters, M. D., Thalman, R., Mei, F., Zaveri, R. A., and Zheng, G.: Cloud droplet activation of secondary organic aerosol is mainly controlled by molecular weight, not water solubility, Atmos. Chem. Phys., 19, 941–954, https://doi.org/10.5194/acp-19-941-2019, 2019. a
Yu, P., Toon, O. B., Bardeen, C. G., Zhu, Y., Rosenlof, K. H., Portmann, R. W., Thornberry, T. D., Gao, R.-S., Davis, S. M., Wolf, E. T., de Gouw, J., Peterson, D. A., Fromm, M. D., and Robock, A.: Black carbon lofts wildfire smoke high into the stratosphere to form a persistent plume, Science, 365, 587–590, https://doi.org/10.1126/science.aax1748, 2019. a
Zeng, M. F., Zuend, A., Gerrebos, N. G. A., Yu, P., Schill, G. P., Murphy, D. M., and Bertram, A. K.: Viscosity and Phase State of Wildfire Smoke Particles in the Stratosphere from Pyrocumulonimbus Events: An Initial Assessment, Environ. Sci. Technol., 59, 8037–8047, https://doi.org/10.1021/acs.est.4c10597, 2025. a
Zhang, Y., Wang, L., Liu, P., Li, Y., Zhan, R., Huang, Z., and Lin, H.: Measurement and extrapolation modeling of PAH laser-induced fluorescence spectra at elevated temperatures, Appl. Phys. B, 125, 1–12, https://doi.org/10.1007/s00340-018-7115-6, 2019. a
Zheng, G., Sedlacek, A. J., Aiken, A. C., Feng, Y., Watson, T. B., Raveh-Rubin, S., Uin, J., Lewis, E. R., and Wang, J.: Long-range transported North American wildfire aerosols observed in marine boundary layer of eastern North Atlantic, Environ. Int., 139, 105680, https://doi.org/10.1016/j.envint.2020.105680, 2020. a, b
- Abstract
- Introduction
- Observation site and lidar system
- Case analysis
- Statistics and discussion
- Conclusions
- Appendix A: Calibration of single-wavelength fluorescence channel
- Appendix B: Back trajectory of air mass observed at ATOLL and GPI
- Appendix C: Comparison of fluorescence measurements
- Data availability
- Author contributions
- Competing interests
- Disclaimer
- Acknowledgements
- Financial support
- Review statement
- References
- Abstract
- Introduction
- Observation site and lidar system
- Case analysis
- Statistics and discussion
- Conclusions
- Appendix A: Calibration of single-wavelength fluorescence channel
- Appendix B: Back trajectory of air mass observed at ATOLL and GPI
- Appendix C: Comparison of fluorescence measurements
- Data availability
- Author contributions
- Competing interests
- Disclaimer
- Acknowledgements
- Financial support
- Review statement
- References