
the Creative Commons Attribution 4.0 License.
the Creative Commons Attribution 4.0 License.
 | 07 Sep 2026
Measurement report: Impacts of thermodynamic and dynamic processes on the vertical distribution of carbonaceous aerosols: lessons from in-situ observations at the eastern foothills of Liupan Mountains, Loess Plateau
Shaofeng Qi
Suping Zhao

Longxiang Dong
Tong Zhang
Guo Zhao
Jianglin Li
Xiang Zhang
Yiting Lv
The vertical distribution of carbonaceous aerosols critically influences planetary boundary layer structure and regional climate. However, high-resolution vertical data remain scarce over the Chinese Loess Plateau. To address this gap, coordinated observations of carbonaceous aerosols and meteorological variables were conducted in the Loess Plateau using tethered balloon-borne instruments during two field campaigns in July 2023 and 2024. The average near-surface concentrations of equivalent black carbon (eBC) and ultraviolet-absorbing particulate matter (UVPM) in Pingliang were 0.84 and 1.24 µg m−3, respectively. Vertically, carbonaceous aerosol concentrations generally decreased with height. A comparison of the vertical profiles of eBC, UVPM, VTKE (mechanical turbulence), and potential temperature showed that during the early morning and nighttime, when convective activity was weak, UVPM concentrations in the upper atmosphere were higher than those of eBC. This pattern is primarily attributed to nucleation processes involving gaseous precursors during nighttime. Analysis of the roles of dynamic and thermodynamic processes indicated that thermodynamic processes dominated aerosol vertical transport in the near-surface layer, while enhanced dynamic processes at higher altitudes facilitated horizontal dispersion of pollutants. Air masses from the south of the observation site contributed significantly to UVPM levels. As air mass altitude decreased, the influence of local sources became more pronounced. Overall, this study demonstrated the regulatory mechanism of daytime and nighttime thermodynamic and dynamic impacts on the vertical distribution of air pollutants.
- Article
(11463 KB) - Full-text XML
-
Supplement
(1391 KB) - BibTeX
- EndNote


Carbonaceous aerosols, particulate matter generated from fossil fuel combustion and biomass burning, directly impact the Earth–atmosphere energy budget by absorbing solar radiation. Their primary components are organic carbon (OC) and black carbon (BC). Organic carbon (OC) can be broadly classified into primary organic carbon (POC) and secondary organic carbon (SOC). The primary organic carbon originates directly from sources such as biomass burning, vehicle exhaust, and industrial emissions, whereas SOC is formed through the oxidation of volatile organic compounds (VOCs) via photochemical and dark reaction pathways. Due to its complex chemical composition and the strong ultraviolet light absorption of certain organic fractions, which are referred to as brown carbon (BrC), OC introduces substantial uncertainty into climate impact assessments (Kroll et al., 2011). Black carbon, characterized by strong solar radiation absorption, represents the second-largest anthropogenic climate factor after CO2 (Bond et al., 2013; Ramanathan and Carmichael, 2008). Near the base of the stratosphere, BC's direct radiative forcing can be approximately ten times stronger than at the surface (Samset and Myhre, 2011). Consequently, its vertical position within the atmosphere significantly influences atmospheric stratification (Zhang et al., 2017; Zhao et al., 2021). Within the surface layer, BC can heat the lower atmosphere, enhancing convection and promoting planetary boundary layer (PBL) development. At higher altitudes, however, BC heats the atmosphere while simultaneously reducing solar radiation reaching the surface, leading to increased atmospheric stability. This suppresses the PBL development and exacerbates air pollution (Ding et al., 2016; Petäjä et al., 2016; Wang et al., 2018a).
Over complex terrain, valley wind systems and orographically-induced turbulence can transport surface-emitted BC to higher elevations, where it accumulates within temperature inversion layers. Absorptive BC further heats the atmosphere, suppressing the development of the PBL and altering its height and stability (Zhao et al., 2023a). Additionally, BC modifies cloud microphysical properties, influencing cloud formation, dissipation, and precipitation, thereby affecting regional and global climate systems (Panicker et al., 2014; Wendisch et al., 2008). Over recent decades, the radiative forcing and climate effects of BC have been extensively studied. Published estimates of BC's direct radiative forcing range between 0.25–0.90 W m−2 (Allen and Landuyt, 2014), yet these values are subject to considerable uncertainty. A primary source of this uncertainty is the significant spatiotemporal heterogeneity of BC at the global scale, stemming from regional combustion processes and its short atmospheric lifetime. Consequently, using default model BC profiles to simulate radiative forcing introduces substantial errors (Hodnebrog et al., 2014). Reported studies indicate that differences in BC vertical distribution contribute approximately 20 %–40 % to the uncertainty in calculations of BC's top-of-atmosphere radiative forcing (Chen et al., 2022; Zarzycki and Bond, 2010). Therefore, accurately characterizing the true vertical distribution of BC in the atmosphere is crucial for the precise assessment of its regional and global climate effects.
However, acquiring accurate BC vertical profiles remains a significant challenge for researchers globally. Current observation methods include: Tethered balloons (Guan et al., 2022; Lata et al., 2023; Wang et al., 2021a; Zhao et al., 2023a), Aircraft measurements (Moorthy et al., 2004; Schwarz et al., 2017), Uncrewed Aerial Vehicles (UAVs) (Liu et al., 2020; Wang et al., 2021b; Wu et al., 2021), Cable cars (Zawadzka et al., 2017), Meteorological towers (Wang et al., 2018a; Xie et al., 2019), Topography-dependent in-situ observations (Zhao et al., 2019, 2022). Notably, aircraft measurements face operational constraints in complex terrain due to high costs and requirements for expansive landing areas. UAVs, cable cars, and meteorological towers are limited by maximum achievable altitudes – most UAVs typically reach only ∼500 m, while cable cars and towers cover even lower vertical ranges. Though topography-dependent observations are widely applied in complex terrain, their coarse spatial resolution cannot resolve true vertical distributions of atmospheric constituents. Additionally, while lidar remote sensing enables continuous profiling (Miffre et al., 2015), its accuracy remains inferior to in-situ techniques. In contrast, tethered-balloon systems mitigate these key constraints by providing high-resolution BC profiles within the PBL. This approach has been widely applied in various regions across the globe, including Europe, the Arctic, the United States, and South Asia, as well as several key regions in China, such as the North China Plain, the Sichuan Basin, and the Yangtze River Delta (Bisht et al., 2016; Mazzola et al., 2016; Guagenti et al., 2025; Ran et al., 2016; Samad et al., 2020; Wang et al., 2018a; Zhao et al., 2023a).
Pingliang City, situated in eastern Gansu Province, lies at the convergence of Shaanxi, Gansu, and Ningxia provinces. As a significant component of the Loess Plateau and a major agricultural zone in Northwest China, understanding its climatic–environmental mechanisms is crucial for improving meteorological forecasting accuracy and formulating effective pollution control strategies. The region's complex topography facilitates the transport of urban pollutants to higher-elevation loess tablelands via valley wind circulations, enabling dispersion during transit. Furthermore, influenced by the towering Liupan Mountains, Pingliang exhibits pronounced vertical climatic heterogeneity, resulting in intricate feedback mechanisms between the PBL and aerosols. Current research reveals scarce data on the vertical distribution of BC from fossil fuel combustion, biomass burning, and mineral dust activities in this region. To address this gap, we conducted detailed vertical profile observations using tethered balloon-borne instrumentation over typical loess tableland areas during July 2023 and July 2024. This study aims to supplement the deficiency in local BC aerosol observations, establish a database for assessing aerosol climate effects on the Loess Plateau, and ultimately provide scientific foundations for pollution control strategies.
2.1 Observation methods and data sources
Field observations were conducted at the Pingliang Land Surface Processes and Severe Weather Research Station, Chinese Academy of Sciences, during two intensive campaigns from 15–24 July 2023 and 17–30 July 2024. The station is located in Baimiao Township, Pingliang City, Gansu, with geographic coordinates detailed in Fig. 1. The near-surface meteorological parameters and air pollutant concentrations for Pingliang City are displayed in Fig. S1 in the Supplement. This includes the concentrations of PM10, PM2.5, CO, SO2, NO2, and O3 during the study periods. Meteorological data were obtained from near-surface observations at the station, and air quality measurements originated from the Pingliang Environmental Monitoring Station (Station ID: 2656A; http://eia-data.com/, last access: 23 June 2025). Results indicate that southeasterly or northwesterly winds prevailed during the observation periods, with wind speeds typically below 1 m s−1. The mean temperature was 20.76 °C and mean relative humidity was 76.84 %. Air quality in Pingliang remained generally good except during sporadic dust pollution events.
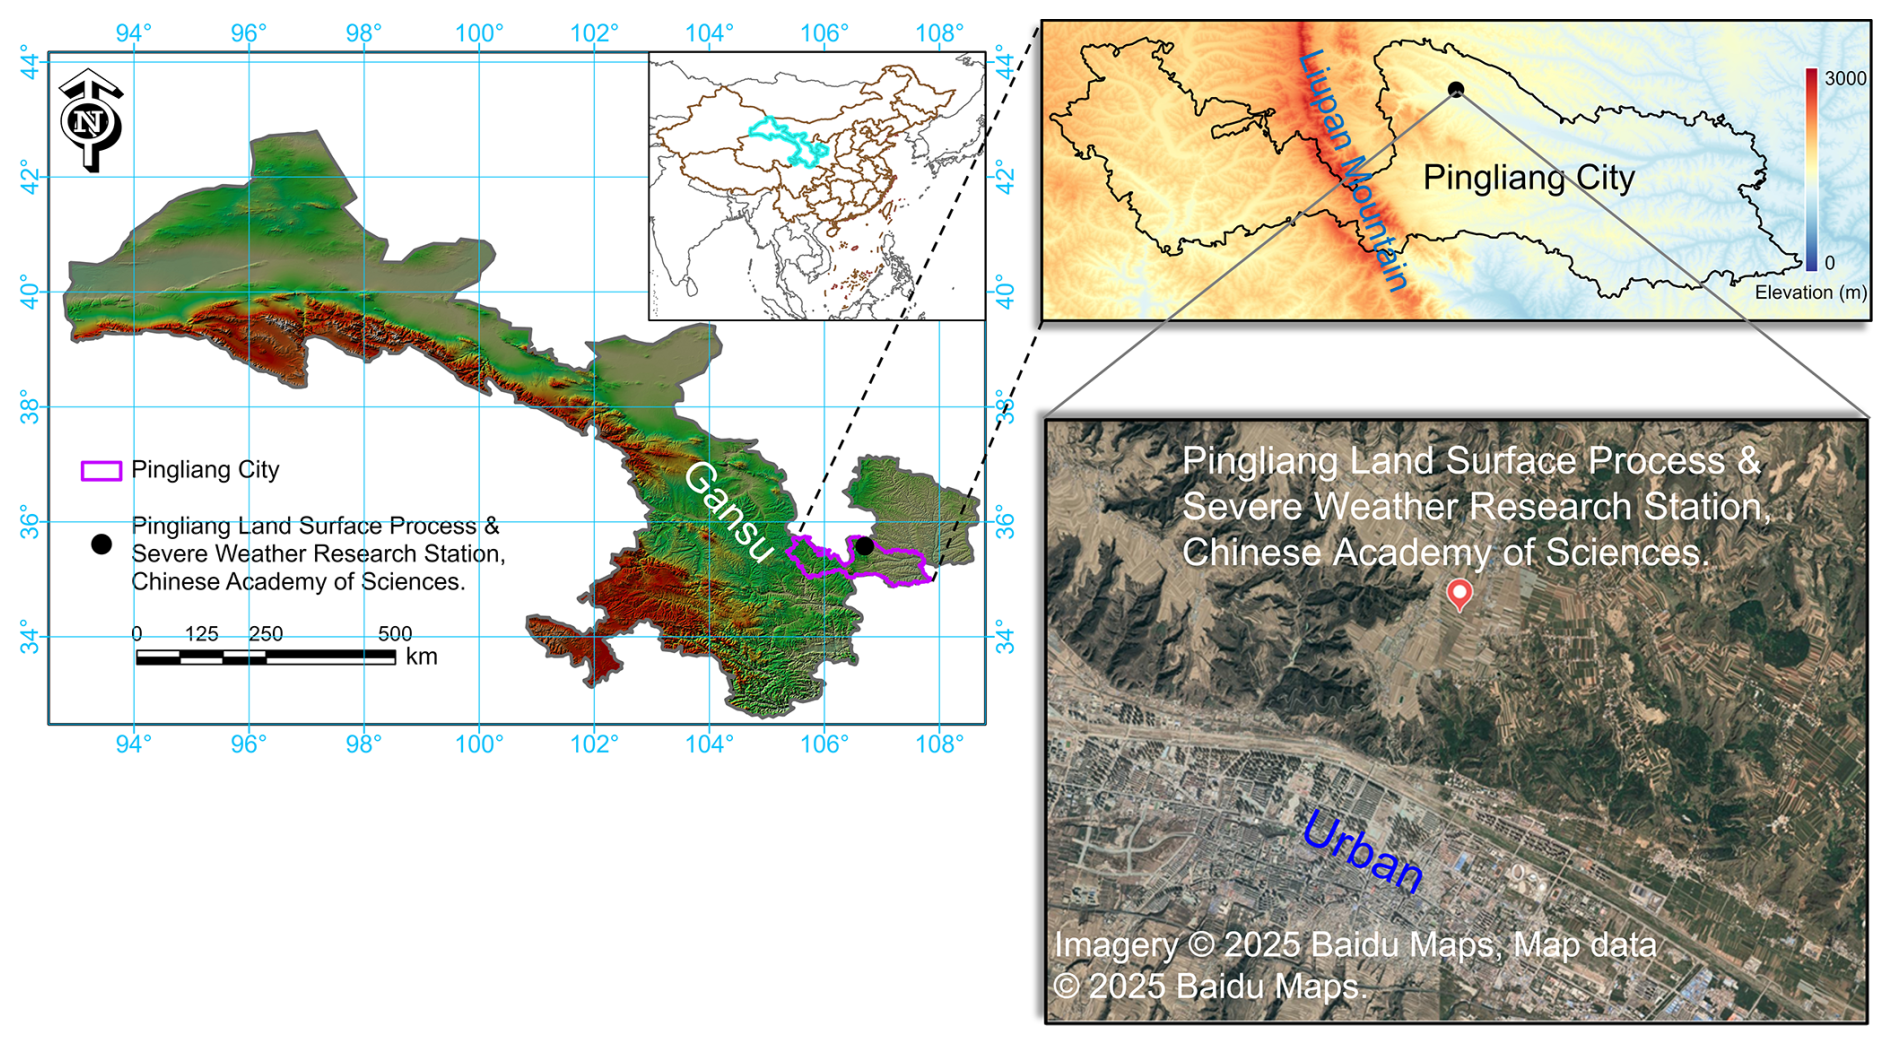
Figure 1Geographic location of the observation site. The map is a pure reproduction of Google Maps with added marks for our study locations. Imagery © 2025 Baidu Maps, Map data © 2025 Baidu Maps. Publisher's note: Please note that the above figure contains disputed territories.
2.1.1 Tethered balloon platform
Vertical profiling was primarily conducted using instrumentation suspended from a tethered balloon system. The system comprised a 10 m3 helium-filled balloon, a tether line, and an electrically powered winch that actively regulated both ascent and descent rates. Buoyancy provided initial lift, while the winch precisely controlled vertical maneuvering. Instruments were mounted 30 m below the balloon to minimize direct atmospheric disturbance. A MicroAeth® MA350 aerosol monitor measured vertical distributions of carbonaceous aerosols, and an iMet-4 radiosonde (iMet, USA) acquired temperature and humidity profiles. Observations were conducted at 3 h intervals from 05:00 to 23:00 LT (05:00, 08:00, 11:00, 14:00, 17:00, 20:00, 23:00 LT) daily. Operations were suspended during adverse conditions (e.g., strong winds or precipitation). Complementary vertical wind profiles were obtained using Doppler Beam Steering (DBS) mode of a Leosphere Windcube 200 s lidar. Each balloon sounding lasted approximately 30–60 min, during which atmospheric conditions remained relatively stable, allowing both ascent and descent paths to characterize vertical structures. A total of 24 and 39 soundings were completed during summer 2023 and 2024, respectively (Fig. S2 in the Supplement shows the observation frequency by time period), yielding 126 vertical atmospheric profiles.
2.1.2 Carbonaceous aerosol mass concentrations
The MicroAeth® MA350 determines carbonaceous aerosol concentration based on the Beer–Lambert law, quantifying light absorption by carbonaceous particles deposited on a PTFE filter at multiple wavelengths. The instrument employs five laser wavelengths: 375 nm (UV), 470 nm (Blue), 528 nm (Green), 625 nm (Red), and 880 nm (IR). Carbon concentrations measured at 880 nm are considered to represent the equivalent black carbon concentration (denoted as eBC) (Zhao et al., 2023a), whereas those measured at 375 nm correspond to ultraviolet-absorbing particulate matter (UVPM), which includes primary brown carbon and black carbon emitted from sources such as biomass burning and coal combustion, as well as secondary brown carbon formed through atmospheric oxidation processes (The relevant introduction/details regarding the substance measured at a wavelength of 375 nm can be referenced in the official manual of the MicroAeth® MA Series MA300 instrument, URL: https://aethlabs.com/products/ma300 (last access: 13 November 2025). The Absorption Ångström Exponent (AAE), calculated from multi-wavelength measurements, characterizes the wavelength dependence of carbonaceous aerosol absorption. During this study, the MA350 operated at a flow rate of 150 mL min−1 with a 5 s sampling interval. Negative optical attenuation (ATN) values occasionally occurred under low aerosol concentrations at high altitudes, which were corrected using the Optimized Noise-reduction Averaging (ONA) algorithm (Hagler et al., 2011; Guan et al., 2022).
2.2 Calculation of light absorption coefficient for carbonaceous aerosols
The light absorption coefficient (bAbs) of black carbon was calculated using the following Eq. (1):
where MAC(λ) denotes the mass absorption cross-section of carbonaceous aerosols at specific wavelengths. For the MicroAeth® series instruments, the MAC values at 375, 470, 528, 625, and 880 nm are 24.07, 19.07, 17.03, 14.09, and 10.12 m2 g−1, respectively (Zhao et al., 2023a). The [C] represents the concentration of carbonaceous aerosol at different wavelengths.
Additionally, the light absorption coefficient of carbonaceous aerosols can be expressed as:
In Eq. (2), k is a wavelength-independent constant, and AAE represents the Absorption Ångström Exponent, which characterizes the wavelength dependence of light absorption of carbonaceous aerosols (Ångström, 1929). A higher AAE value signifies that the aerosol absorption capacity decreases more rapidly with increasing wavelength. By combining the bAbs values derived from Eq. (1) with Eq. (2), vertical profiles of AAE for carbonaceous aerosols were obtained.
2.3 Determination of planetary boundary layer height
Potential temperature (θ, in K), defined as the temperature an air parcel would attain if adiabatically brought to a standard pressure level (Han et al., 2019; Seidel et al., 2010), is calculated as Eq. (3):
where T denotes measured air temperature (°C), P represents air pressure (hPa), P0 is the standard reference pressure (1000 hPa), Rd signifies the gas constant for dry air (287 ), and Cpd corresponds to the specific heat of dry air at constant pressure (1005 ) (Gu and Tan, 2025).
Specific humidity (q, g g−1), defined as the ratio of water vapor mass to the total mass of moist air (water vapor plus dry air), is calculated using Eq. (4) (Gutzler, 1992),
where ε=0.622, e represents vapor pressure, and P denotes atmospheric pressure, with vapor pressure, e being derived from Eq. (5) through relative humidity (RH) and air temperature (T, °C) (Holzworth, 1964).
Planetary boundary layer is the part of the atmosphere closest to the planet's surface, accounting for approximately 10 %–20 % of the troposphere. It is the lowest layer of the troposphere directly influenced by surface forcing, with a response time of less than one hour, playing a critical role in the dispersion and transport of air pollutants. Within the PBL, turbulent mixing processes homogenize air temperature and humidity, resulting in relatively uniform distributions of these properties. PBL height (PBLH) refers to the thickness of the layer most significantly affected by the surface. In other words, it is the vertical extent that surface turbulent motion (caused by surface heating, friction, or topography, etc.) can effectively influence (Emeis et al., 2008; Seibert et al., 2000). This study employs two established methodologies for determining the PBLH: the potential temperature gradient method and the parcel method (Holzworth, 1964; Zhang et al., 2020). The potential temperature gradient method was utilized for calculating the PBLH during the nighttime and early morning hours (20:00, 23:00, 05:00, and 08:00 LT), while the parcel method was applied specifically for the daytime periods (11:00, 14:00, and 17:00 LT). Detailed computational procedures for both approaches are summarized in Table S1 in the Supplement.
2.4 Impacts of thermodynamic and dynamic processes on vertical distribution of carbonaceous aerosols
To quantify the relative contributions of potential temperature gradient, mechanical turbulence index, horizontal wind speed, and vertical wind speed to UVPM variations at different altitudes, we employed a random forest regression algorithm. The model generated training subsets via bootstrap sampling, with random feature subsets selected for optimal splitting at each decision tree node. Observations were categorized into daytime (08:00, 11:00, 14:00, 17:00 LT) and nighttime (20:00, 23:00, 05:00 LT) periods to compare the dominant mechanisms governing aerosol vertical distribution. The mechanical turbulence index was calculated using Eq. (6) (Zhao et al., 2023a).
2.5 Identification of potential source regions
In this study, GDAS1 meteorological data (1°×1° resolution) obtained from the NOAA FTP repository (ftp://arlftp.arlhq.noaa.gov/pub/archives/gdas1, last access: 28 March 2025) were utilized. These data were processed using the MeteoInfo software to calculate backward trajectories and perform cluster analysis (http://www.meteothink.org/, last access: 30 March 2025). Subsequently, the potential source contribution function (PSCF) and concentration weighted trajectory (CWT) analysis toolkits within MeteoInfo were employed to identify potential source regions and quantify their relative contributions (Wang, 2014). To reduce the error caused by the small total number of trajectory samples, a weighting factor Wij was introduced, and the weighted PSCF (WPSCF) and weighted CWT (WCWT) were finally calculated. The detailed calculation processes for WPSCF and WCWT are provided in Sect. S1 in the Supplement.
3.1 Vertical profiles of carbonaceous aerosols
3.1.1 General characteristics of eBC
Observations indicate that near-surface mass concentrations of eBC and UVPM averaged 0.84 and 1.24 µg m−3, respectively. During the campaign, UVPM concentrations varied between 0.05 and 6.78 µg m−3 across different altitudes, whereas eBC ranged from 0.02 to 2.89 µg m−3. Compared with previous studies conducted in other regions of China (Table 1), the concentration of eBC observed in Pingliang is lower than those reported in Beijing, Shanghai, Nanjing, Chengdu, Shenzhen, Hengshui, the Beibu Gulf region, and Lanzhou (Guan et al., 2022; Ran et al., 2016; Shi et al., 2021; Wang et al., 2021a; Wu et al., 2021; Yang et al., 2023, 2022; Zhao et al., 2023a). This discrepancy can be attributed to several factors. Firstly, Pingliang is a relatively small city with a permanent population of fewer than 2 million, whereas the aforementioned cities have much larger urban populations. Consequently, the total amount of air pollutants generated from daily human activities in Pingliang may be comparatively lower than those in the aforementioned cities. Secondly, the observation site in Pingliang is situated at a higher elevation than the urban center, thereby reducing the influence of direct urban emissions. In contrast, observation sites in other cities are typically located in suburban areas that are more directly affected by emissions from urban cores.
Wang et al. (2019) conducted tethered-balloon measurements of the vertical distribution of eBC over the Tibetan Plateau and found even lower eBC concentrations than those in the present study. Furthermore, the rate of decrease in eBC concentrations with altitude was more pronounced at the Plateau site compared to Pingliang. Overall, existing studies consistently indicate that eBC concentrations decrease with increasing altitude. However, due to differences in terrain, PBLH, and atmospheric diffusion conditions, the vertical profiles of eBC vary significantly among different sites. For instance, in Shanghai, Wang et al. (2021a) reported a sharp decline in eBC concentrations at around 600 m in the morning, while in the afternoon, the decrease occurred at approximately 800 m due to stronger convective mixing. Over the Tibetan Plateau, eBC concentrations dropped markedly at altitudes as low as 100–200 m (Wang et al., 2019). Yang et al. (2023) and Zhao et al. (2023a) reported elevated eBC concentrations near 2000–2500 m, which they attributed to the combined effects of upper-level subsidence and lower-level updrafts. Similarly, Lu et al. (2019) and Chen et al. (2022) observed elevated eBC concentrations in the 500–800 m layer over Anhui and Beijing, respectively, primarily influenced by the presence of upper-level temperature inversions.
Table 1Statistics of near-surface eBC concentrations in many cities.
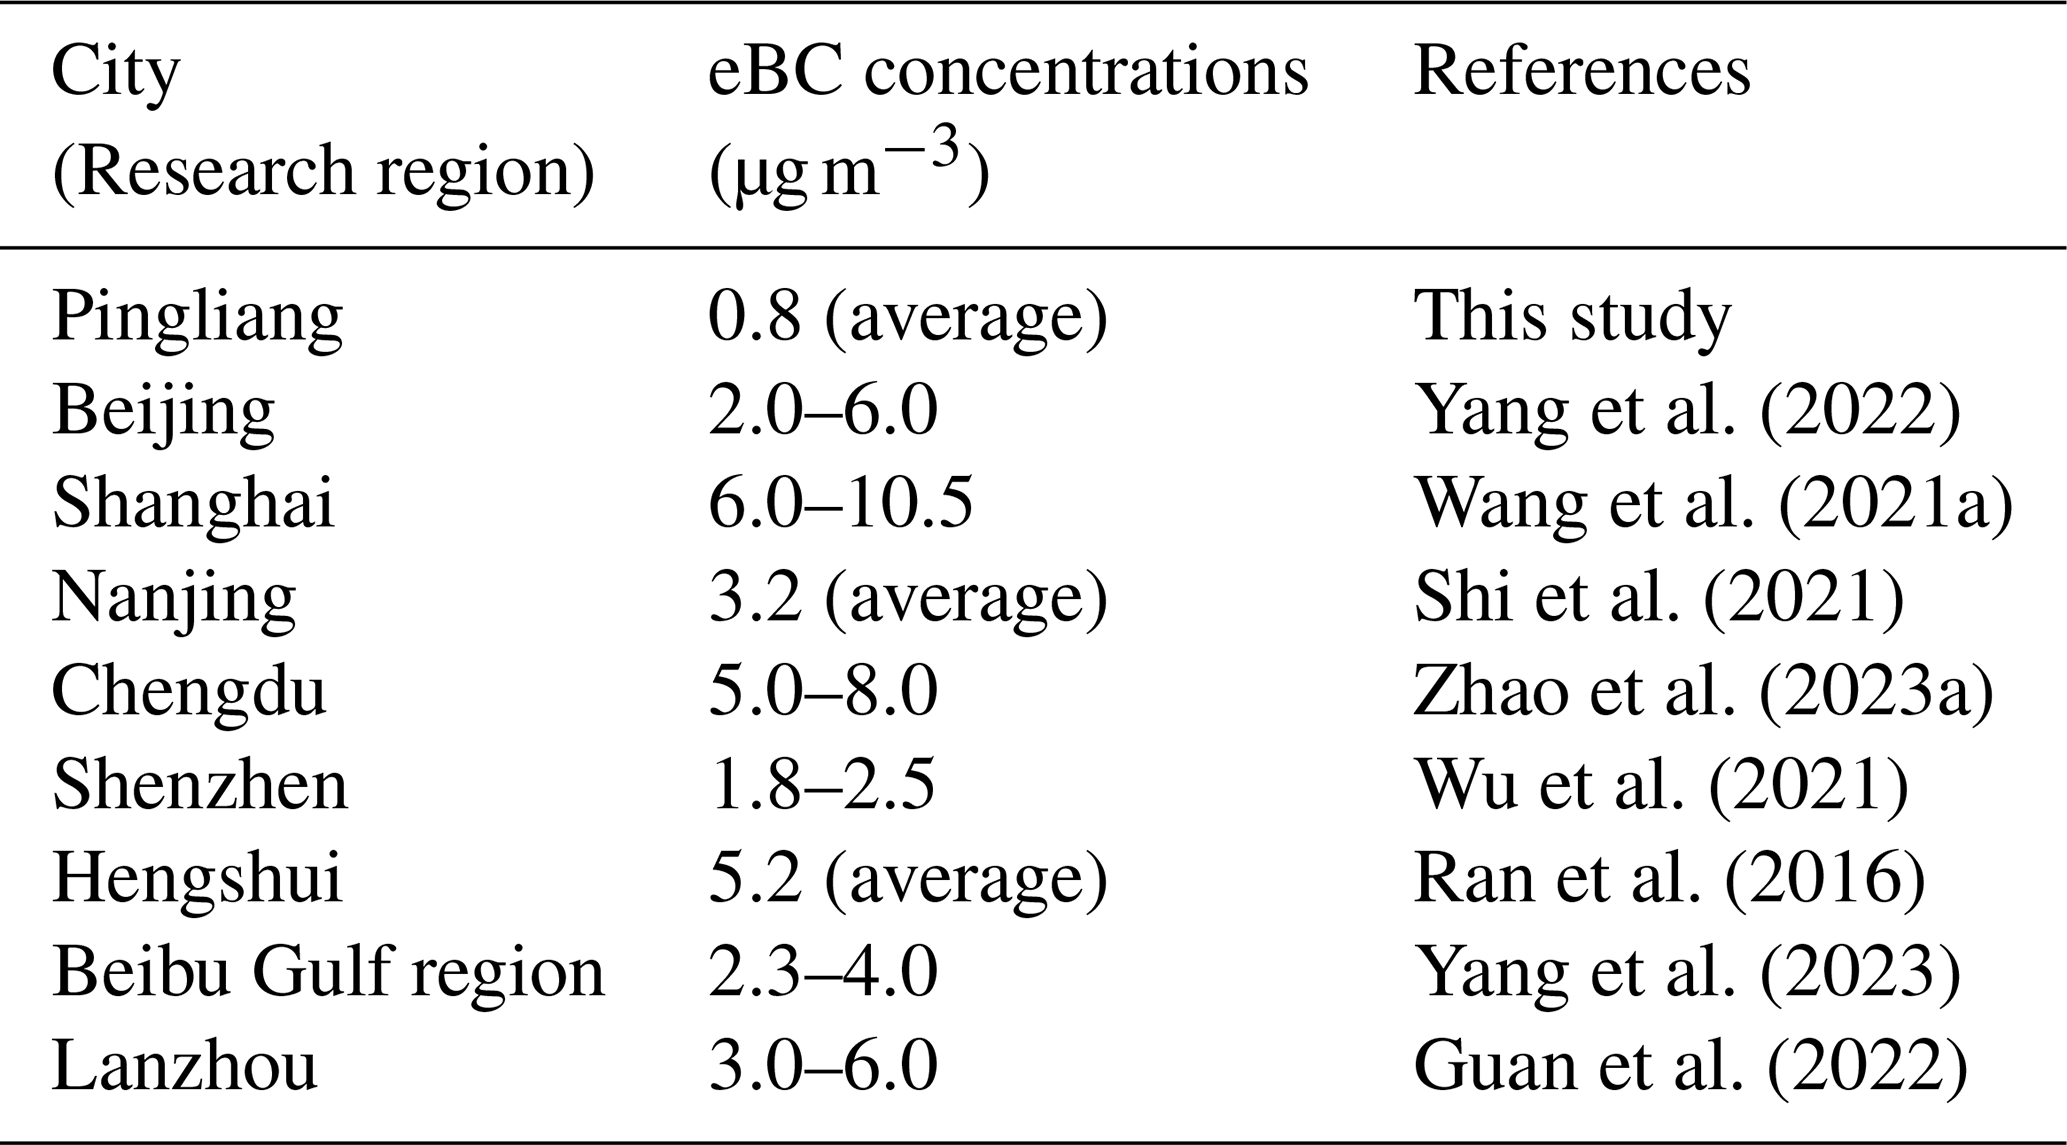
From a global perspectives, the near-surface eBC concentration in Delhi, India, was reported to be approximately 30.00 µg m−3, which is substantially higher than those observed in China and Europe (Bisht et al., 2016). In contrast, near-surface eBC concentrations in Stuttgart, Germany, and Milan, Italy, were found to be comparable to those in Shenzhen, China, at around 2.00–3.00 µg m−3. These values are lower than those reported in other Chinese cities such as Shanghai, Nanjing, Chengdu, Hengshui, and Lanzhou, but still higher than the concentrations observed in this study (Ferrero et al., 2011; Samad et al., 2020). In the Arctic region, due to limited anthropogenic influence, near-surface eBC concentrations are generally lower than those observed both over the Tibetan Plateau in China and in the Loess Plateau region investigated in this study (Ferrero et al., 2016).
3.1.2 Diurnal variations of eBC and UVPM profiles
Figures S3 and S4 in the Supplement respectively depict the trends and correlations of the ascent and descent profiles for eBC and UVPM. The results indicate that the ascent and descent profiles at 05:00, 20:00, and 23:00 LT in this study exhibit similar trends, and thus they can both be treated as independent observational profiles for analysis. For observations at 08:00, 11:00, 14:00 and 17:00 LT, only the ascent data were used for analysis. Figure 2 shows the averaged profiles for all sampling periods during the observation campaign, the red solid line and its shaded envelope denote the mean and standard deviation of eBC, while the blue solid line and its shaded envelope denote the mean and standard deviation of UVPM. Because eBC mass concentration in the upper atmosphere is extremely low (below the instrument's normal limit of detection), optical measurements often yield negative results, which are corrected when the ONA method is used for data quality control. Furthermore, owing to the relatively high wind speeds in the upper atmosphere, our measurements in the early afternoon were typically unable to reach the PBLH.
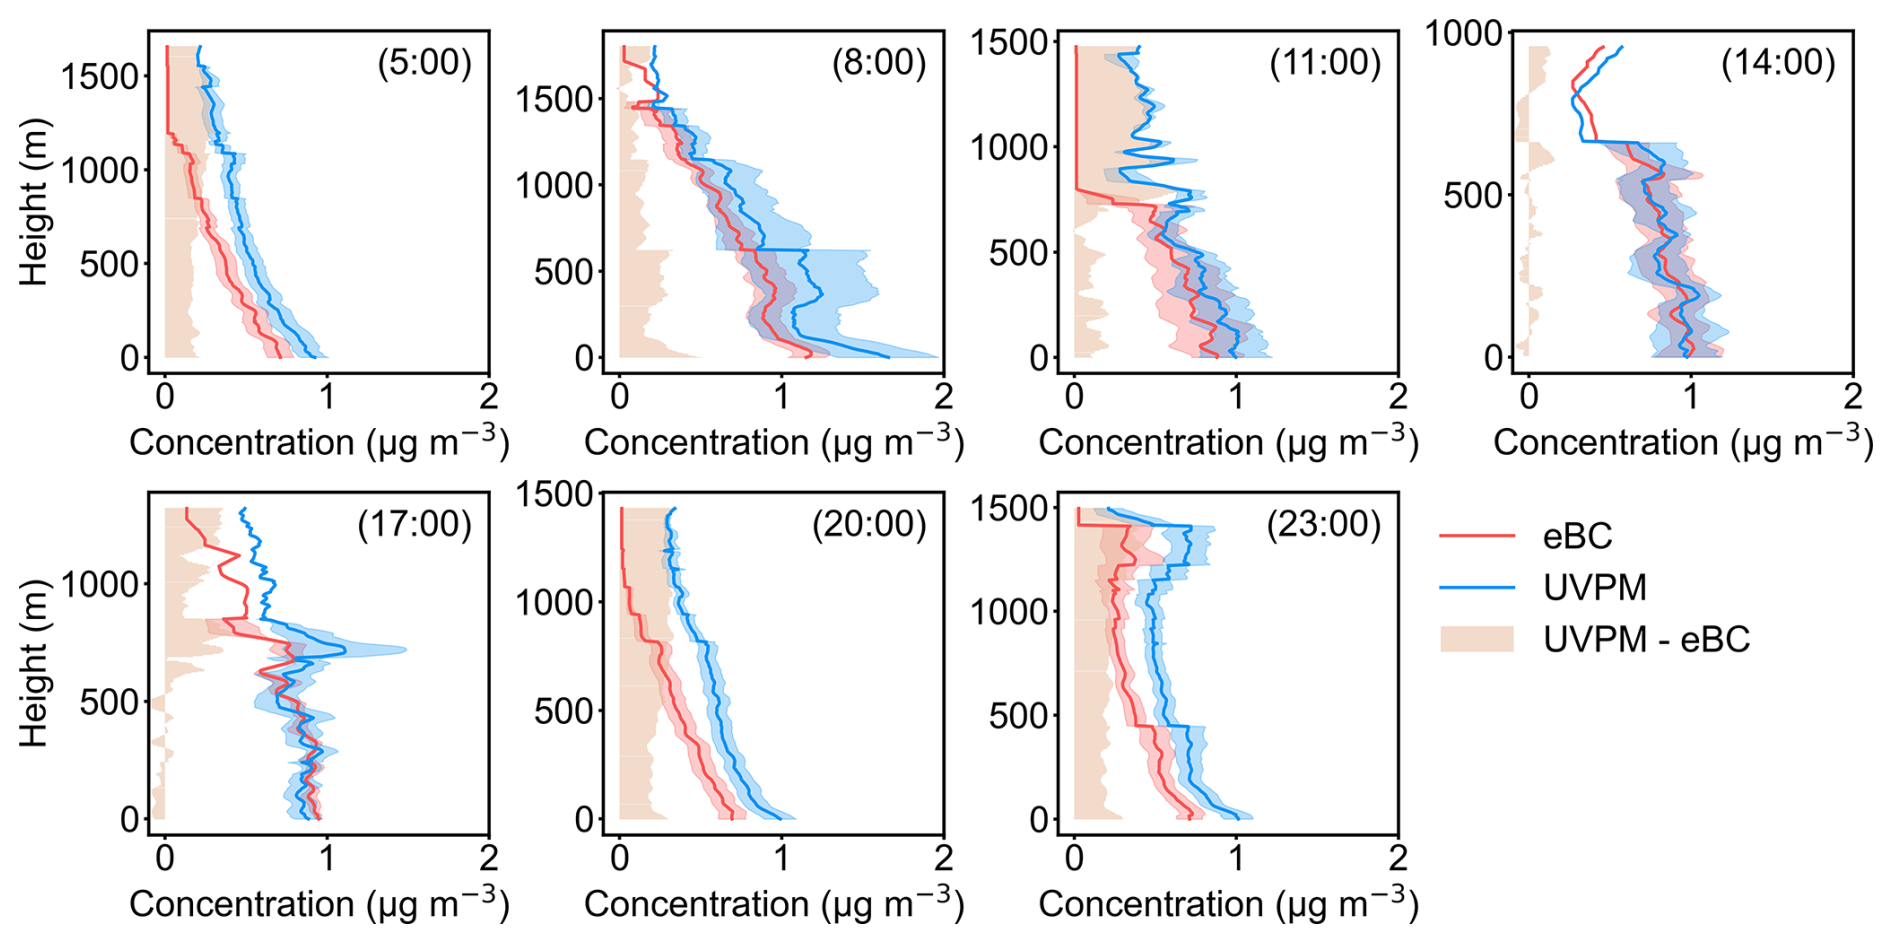
Figure 2Averaged diurnal variation in profiles of the eBC and UVPM concentration during the field campaign. The red and blue lines represent eBC and UVPM concentrations, respectively, while the red and blue shaded areas denote the standard deviation of eBC and UVPM, respectively. The light orange shaded area represents the difference between UVPM and eBC.
Vertical profiles of eBC and UVPM concentrations reveal a consistent decrease with increasing altitude, with the most pronounced gradient observed in the near-surface layer. A comparative analysis of their vertical profiles reveals that during periods of weak convective activity, such as early morning and nighttime (i.e., 05:00, 20:00, and 23:00 LT), UVPM concentrations aloft generally exceed those of eBC (the significance test of the UVPM–eBC differences is provided in Fig. S5 in the Supplement), while near the surface the two species show much smaller differences. To further investigate the underlying causes, we estimated the concentration of secondary UVPM (UVPMsec) using the least-squares method described by Wu and Yu (2016), based on the ratio of UVPM to eBC. Figure 3 presents the mean diurnal variations in vertical distributions of the ratios of UVPMsec to total UVPM, and of UVPMsec to eBC. From 17:00 to 05:00 LT, the UVPM UVPM and UVPM eBC ratios aloft increase markedly, indicating that the elevated UVPM during this period is more strongly influenced by secondary sources. As time progresses, the region characterized by high ratios gradually approaches the ground surface and eventually disappears by 08:00 LT.
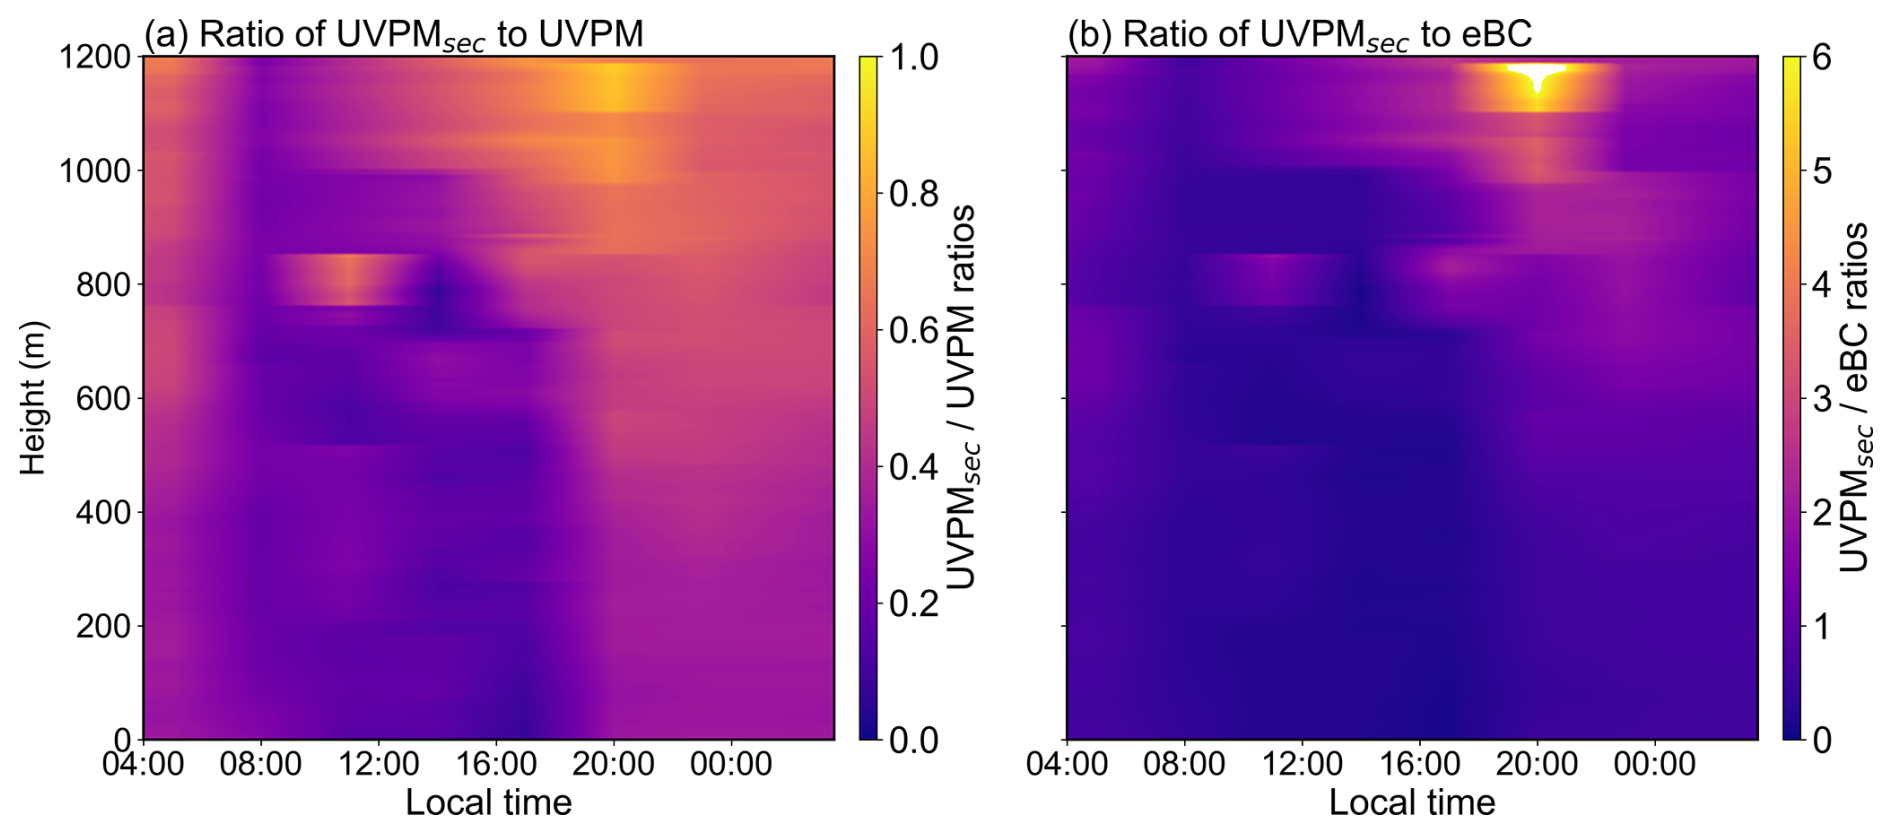
Figure 3Mean diurnal variations in vertical distribution of (a) UVPM UVPM and (b) UVPM eBC ratios during the field campaign.
The enhanced contribution of secondary sources aloft may be attributed to the increasingly stable stratification after 17:00 LT, which suppresses vertical mixing and inhibits the upward transport of both eBC and UVPM. In contrast, gaseous precursors of UVPMsec (i.e., VOCs) can accumulate above the PBL. Under relatively clean atmospheric conditions with limited condensation sinks, nocturnal chemistry dominated by radicals, together with low ambient temperatures, favors the formation of secondary organic aerosols through gas-to-particle partitioning and temperature-dependent condensation (Han and Jang, 2023; Kuang et al., 2025; Kulmala et al., 2022; Morgan et al., 2009; Wang et al., 2023; Zhao et al., 2023b). After sunrise (around 06:00 LT in summer at this site), enhanced solar radiation promotes convective mixing and weakens the nocturnal inversion at the top of the PBL. Consequently, UVPMsec-enriched air masses retained within the residual layer are entrained downward into the growing daytime PBL, thereby reducing the concentration gradient between UVPM and eBC within the PBL (Zhao et al., 2023a). In addition, increased human activities and strengthened thermal convection after sunrise lead to larger primary emissions throughout the atmospheric column, causing carbonaceous aerosols to be increasingly dominated by primary components. Because the PBL is still developing at 08:00 LT, the near-surface concentrations of UVPM and eBC are higher than those observed at 05:00 LT. As thermal convection intensifies, the decline in near-surface UVPM and eBC slows between 11:00 and 14:00 LT. Between 14:00 and 17:00 LT, strong convective mixing results in an approximately uniform vertical distribution of both eBC and UVPM from the surface up to ∼800 m.
To better characterize the vertical structure of UVPM and eBC within the stable PBL, the observed profiles were classified into four types, each exhibiting distinct features (Details of the method can be found in Sect. S2 in the Supplement). Regarding the profile clustering presented in Fig. 4, the classification was performed by analyzing the vertical change rates (or slopes) of the UVPM and eBC concentrations. These profiles were grouped into four distinct categories: Uniformly decreasing (Cluster 1), Non-uniformly decreasing (Cluster 2), Double-inflection point (Cluster 3), and Continuous increasing (Cluster 4). In Cluster 1, eBC and UVPM decrease almost uniformly with altitude at a rate of approximately 0.51 up to 1000 m. Cluster 2 also shows comparable near-surface concentrations of both species, but with a rapid decline of about 1.23 below 250 m followed by a more gradual decrease above, reflecting a stronger nocturnal inversion that inhibits upward diffusion. Cluster 3 profiles, typically observed at 05:00, 08:00, and 20:00 LT under intense inversions, display a modest decrease of approximately 0.10 from the surface to 100 m, an unexpected increase in eBC and UVPM between 100 and 600 m (attributable to pollutant accumulation and upward mixing within the deep neutral residual layer; Kulmala et al., 2023), and a decline above 600 m. In Cluster 4, concentrations remain nearly constant below 200 m but rise with height above this level, likely due to a weak neutral stratification between 200 and 400 m. Because these observations coincided with strong upper-level winds, measurements above approximately 400 m were curtailed to protect instrumentation, leaving open the question of whether Cluster 4 would exhibit a high-altitude decrease similar to Cluster 3.
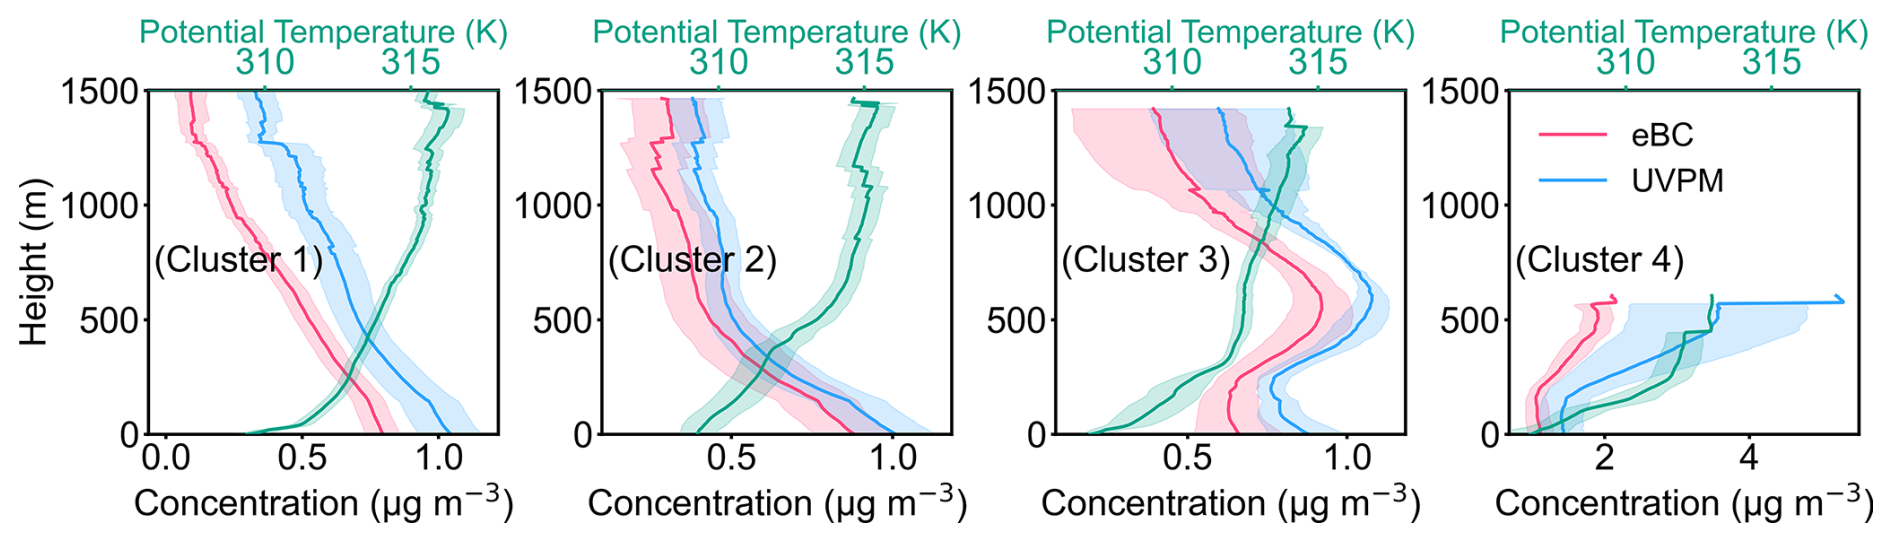
Figure 4Cluster analysis of UVPM and eBC concentration profiles during the field campaign. The blue, red, and green lines represent the profiles of UVPM, eBC, and potential temperature, respectively, and the shaded areas in the corresponding colors denote their standard deviations.
3.1.3 Diurnal variations of AAE profiles
Figure S6 in the Supplement presents the variations of the light absorption coefficients of UVPM and eBC at different altitudes. Overall, both UVPM and eBC absorption coefficients decline steadily with increasing altitude, a pattern primarily controlled by the mass concentrations of carbonaceous aerosols. Moreover, the difference between the UVPM and eBC absorption coefficients diminishes with height, indicating that UVPM dominates light absorption by carbonaceous aerosols in the lower atmosphere, whereas eBC exerts a greater influence aloft, consistent with the findings of Qi et al. (2025). The AAE, which characterizes the wavelength dependence of the mass-specific absorption by carbonaceous aerosols (calculation details are given in Fig. S7 in the Supplement), was calculated for the study period; the average diurnal AAE values are shown in Fig. S8 in the Supplement. Compared with Wu et al. (2021), the AAE of carbonaceous aerosols in Pingliang is substantially higher than that reported for Shenzhen (<1.00). We further selected observations from representative pollution events to compare AAE under different environmental conditions (Fig. 5, detailed explanations regarding the selection of pollution events are provided in Sect. S3 in the Supplement). During dust episodes, AAE increases markedly, by approximately 83 % relative to dust-free conditions. Likewise, emissions from diesel vehicles yield higher AAE than periods without diesel vehicle contributions.
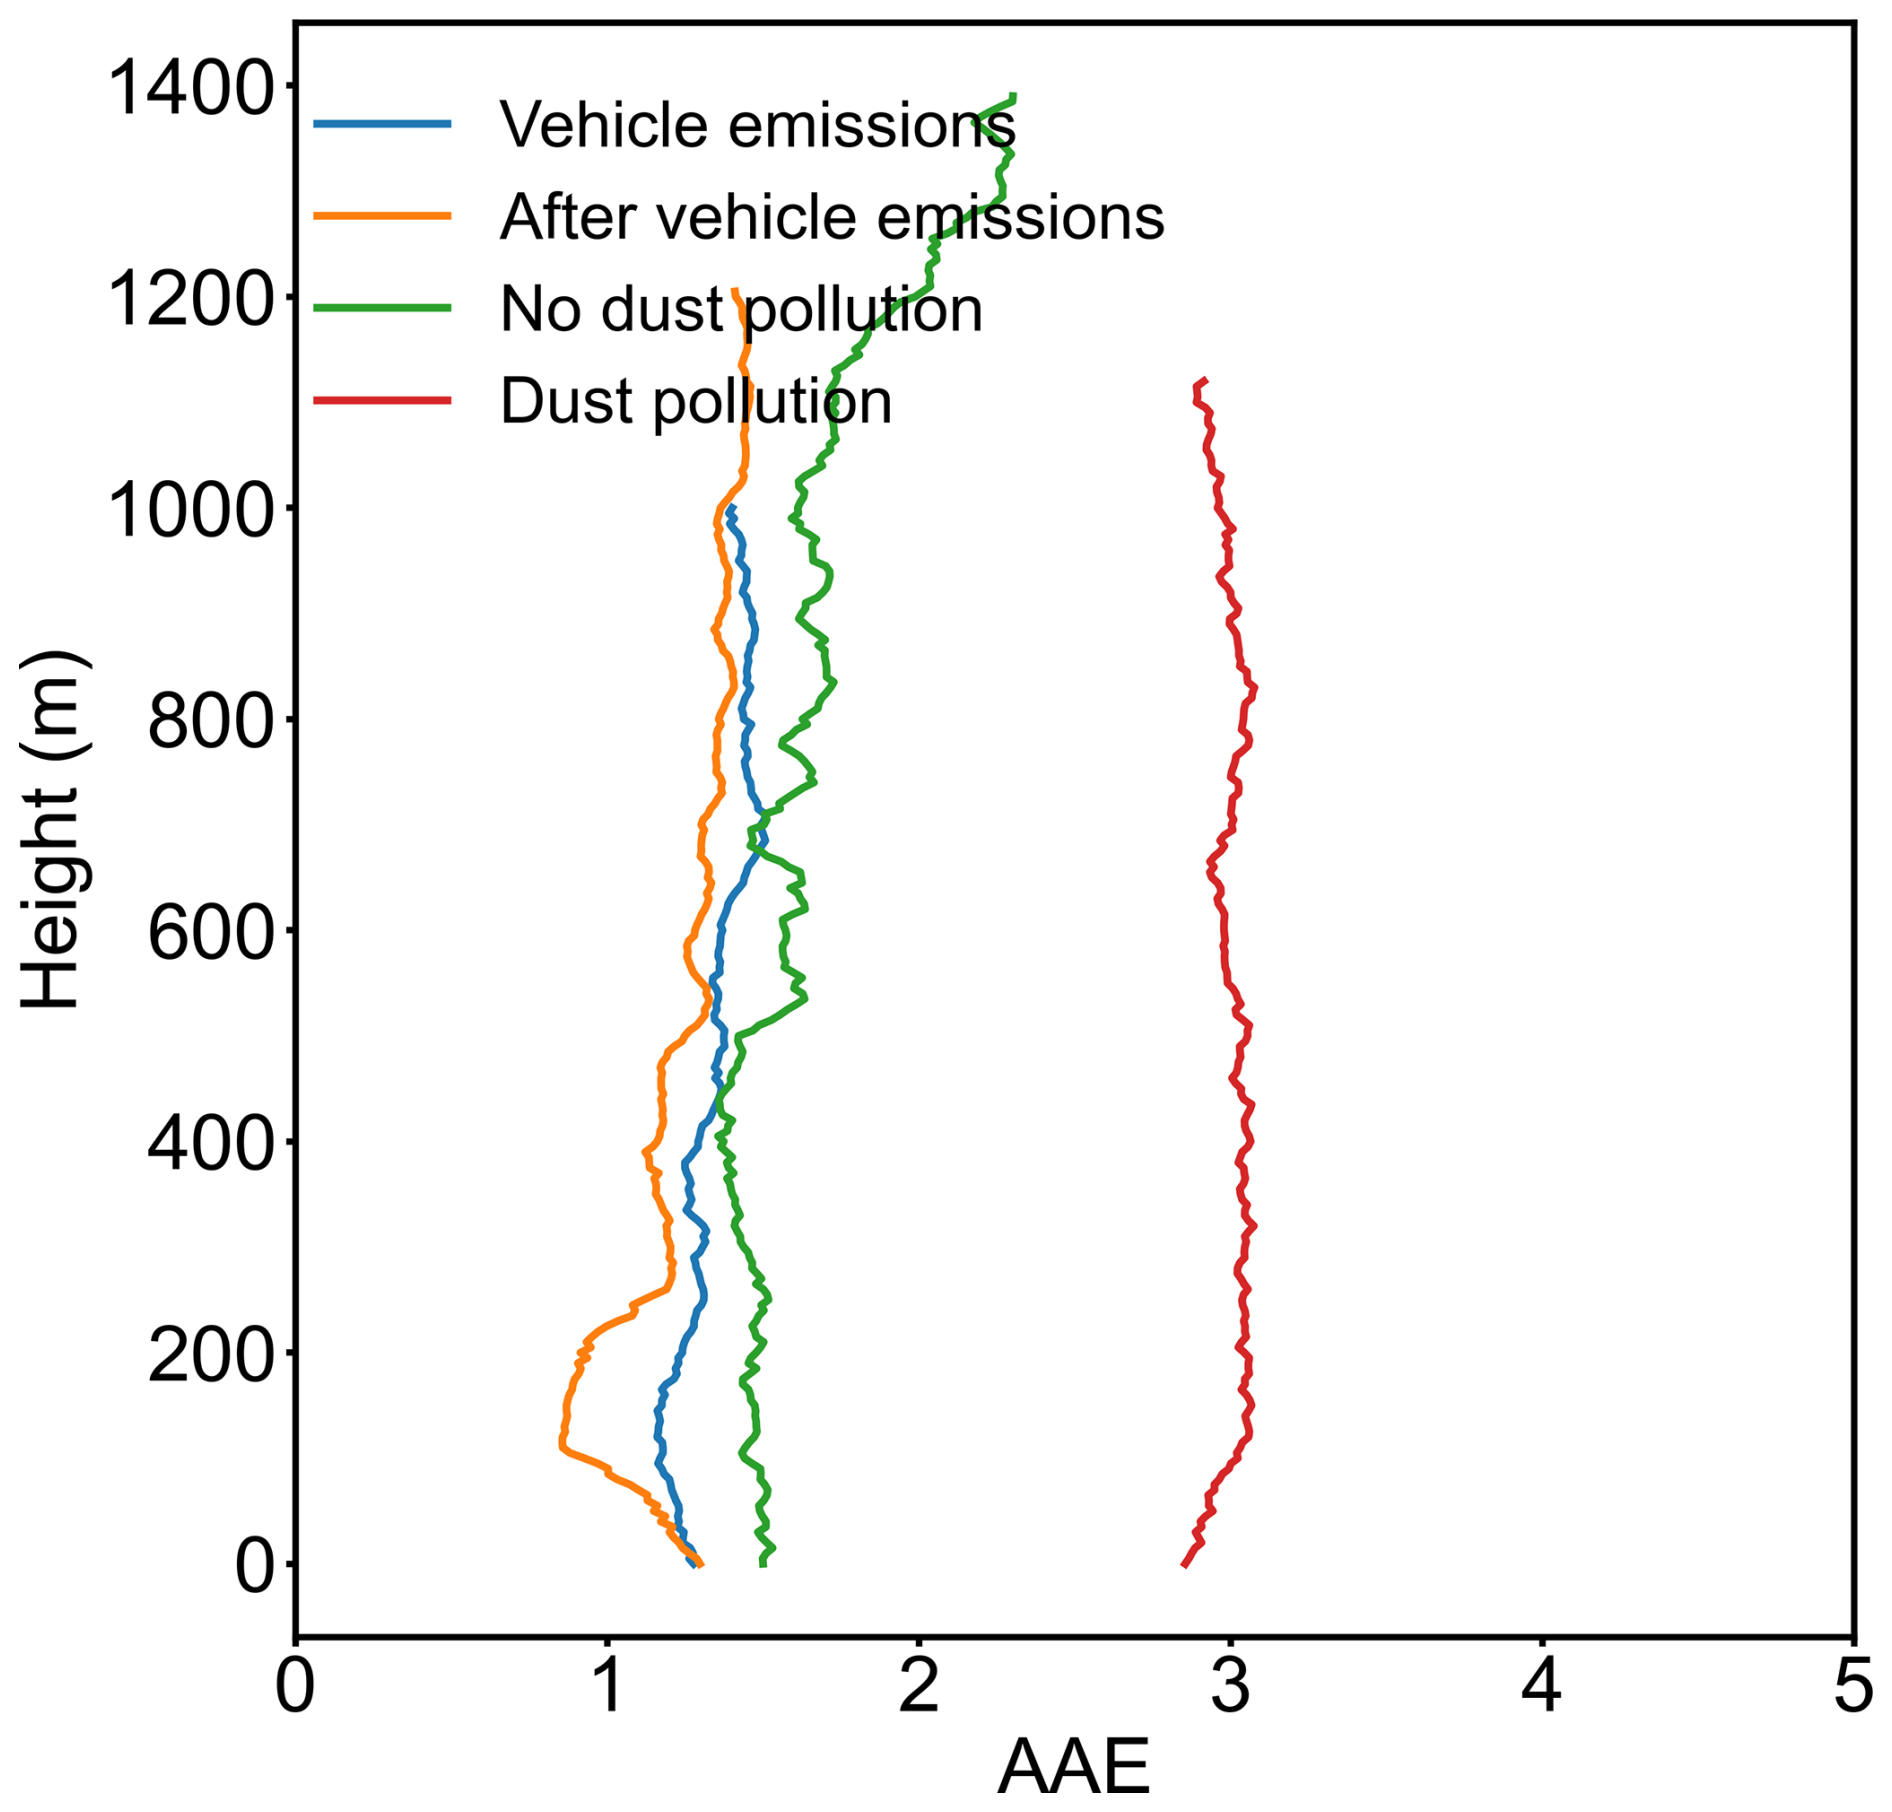
Figure 5AAE profiles under different pollution conditions (Diesel vehicle emissions, after diesel vehicle emissions, no dust pollution, and dust pollution occurred at 20:00 LT on 17 July 2024; 23:00 LT on 17 July 2024; 08:00 LT on 20 July 2024; 08:00 LT on 21 July 2024, respectively).
Previous studies commonly employ a two-component model to differentiate the Absorption Ångström Exponent of equivalent black carbon (AAEeBC) and brown carbon (AAEUVPM), fixing AAEeBC at 1 and thereby deriving AAEUVPM (Fig. S9 in the Supplement, the calculation methodology is provided in Sect. S4 in the Supplement) (Chen et al., 2015; Chow et al., 2018). Elevated values of AAEUVPM are typically indicative of biomass burning and secondary aging processes (Olson et al., 2015; Gombi et al., 2025). The diurnal AAEUVPM profiles shown in Fig. S9 reveal pronounced contributions from secondary organic aerosol formation or from mixed emissions of biomass and fossil fuels at our observation site. Overall, daytime AAEUVPM values exceed those recorded at night and in the early morning, reflecting the stronger photochemical activity during daylight hours that promotes carbonaceous aerosol aging.
Additionally, RH can affect carbonaceous aerosol measurements by the MA200 or MA350 instruments. Water vapor forms a thin film on the PTFE filter membrane, which acts as a refractive index matching layer, enhancing light transmittance and reducing the optical attenuation signal. This results in a negative bias in the measured carbonaceous aerosol light absorption coefficient and mass concentration (Arnott et al., 2003; Düsing et al., 2019; Zieger et al., 2013). To prevent measurement artifacts caused by elevated RH, Arnott et al. (2003) reported that RH should be maintained below 65 % during carbonaceous aerosol observations, while the WMO/GAW Report No. 227 (WMO/GAW, 2016) proposed a more stringent requirement of RH <40 %. To mitigate RH effects on measurements, Düsing et al. (2019) developed an autoregressive moving average model with exogenous variables to correct observations obtained under high RH conditions. This approach fits the instantaneous RH changes and the exponential recovery behavior of the instrument response to RH variations, thereby quantifying the RH-induced bias in the measured carbonaceous aerosol light absorption coefficient. However, the authors explicitly recommended against applying this correction scheme because it requires different fitting parameters for different experimental conditions and the associated uncertainties remain incompletely quantified. In this study, the sample RH measured by the MA350 instrument ranged between 30 % and 60 % (Fig. S1). Although some measurements were influenced by relative humidity, the data can adequately capture the basic characteristics of the vertical distribution of carbonaceous aerosols over the Chinese Loess Plateau. To further improve measurement accuracy, we strongly recommend that future studies incorporate a drying system upstream of the measurement instrument to minimize RH effects on the observations.
3.2 Thermodynamic impacts on profiles of eBC and UVPM
Diurnal evolution of the PBLH is one of the primary factors controlling aerosol vertical distribution and is essential for understanding feedback between the PBL meteorology and aerosols. Because PBLH evolves continuously, we selected a day with uninterrupted observations; however, owing to strong upper-level winds, continuous carbonaceous aerosol profiles were obtained only on 27 July 2024 at seven time slots (Fig. 6). Hence, this day serves as a case study for examining how diurnal PBL evolution influences aerosol vertical structure. The parcel method is well suited to convective conditions but cannot accurately resolve PBLH during early morning and nighttime (Holzworth, 1964), whereas it performs reliably under strong daytime convection. Using this approach, PBLH at 11:00 and 17:00 LT were 503 and 459 m, respectively; at 14:00 LT, measurement ceilings did not reach PBLH. By contrast, the potential temperature gradient method yields accurate estimates at night and in the early morning: PBLH at 05:00, 08:00, 20:00, and 23:00 LT were 255, 181, 260, and 216 m, respectively.
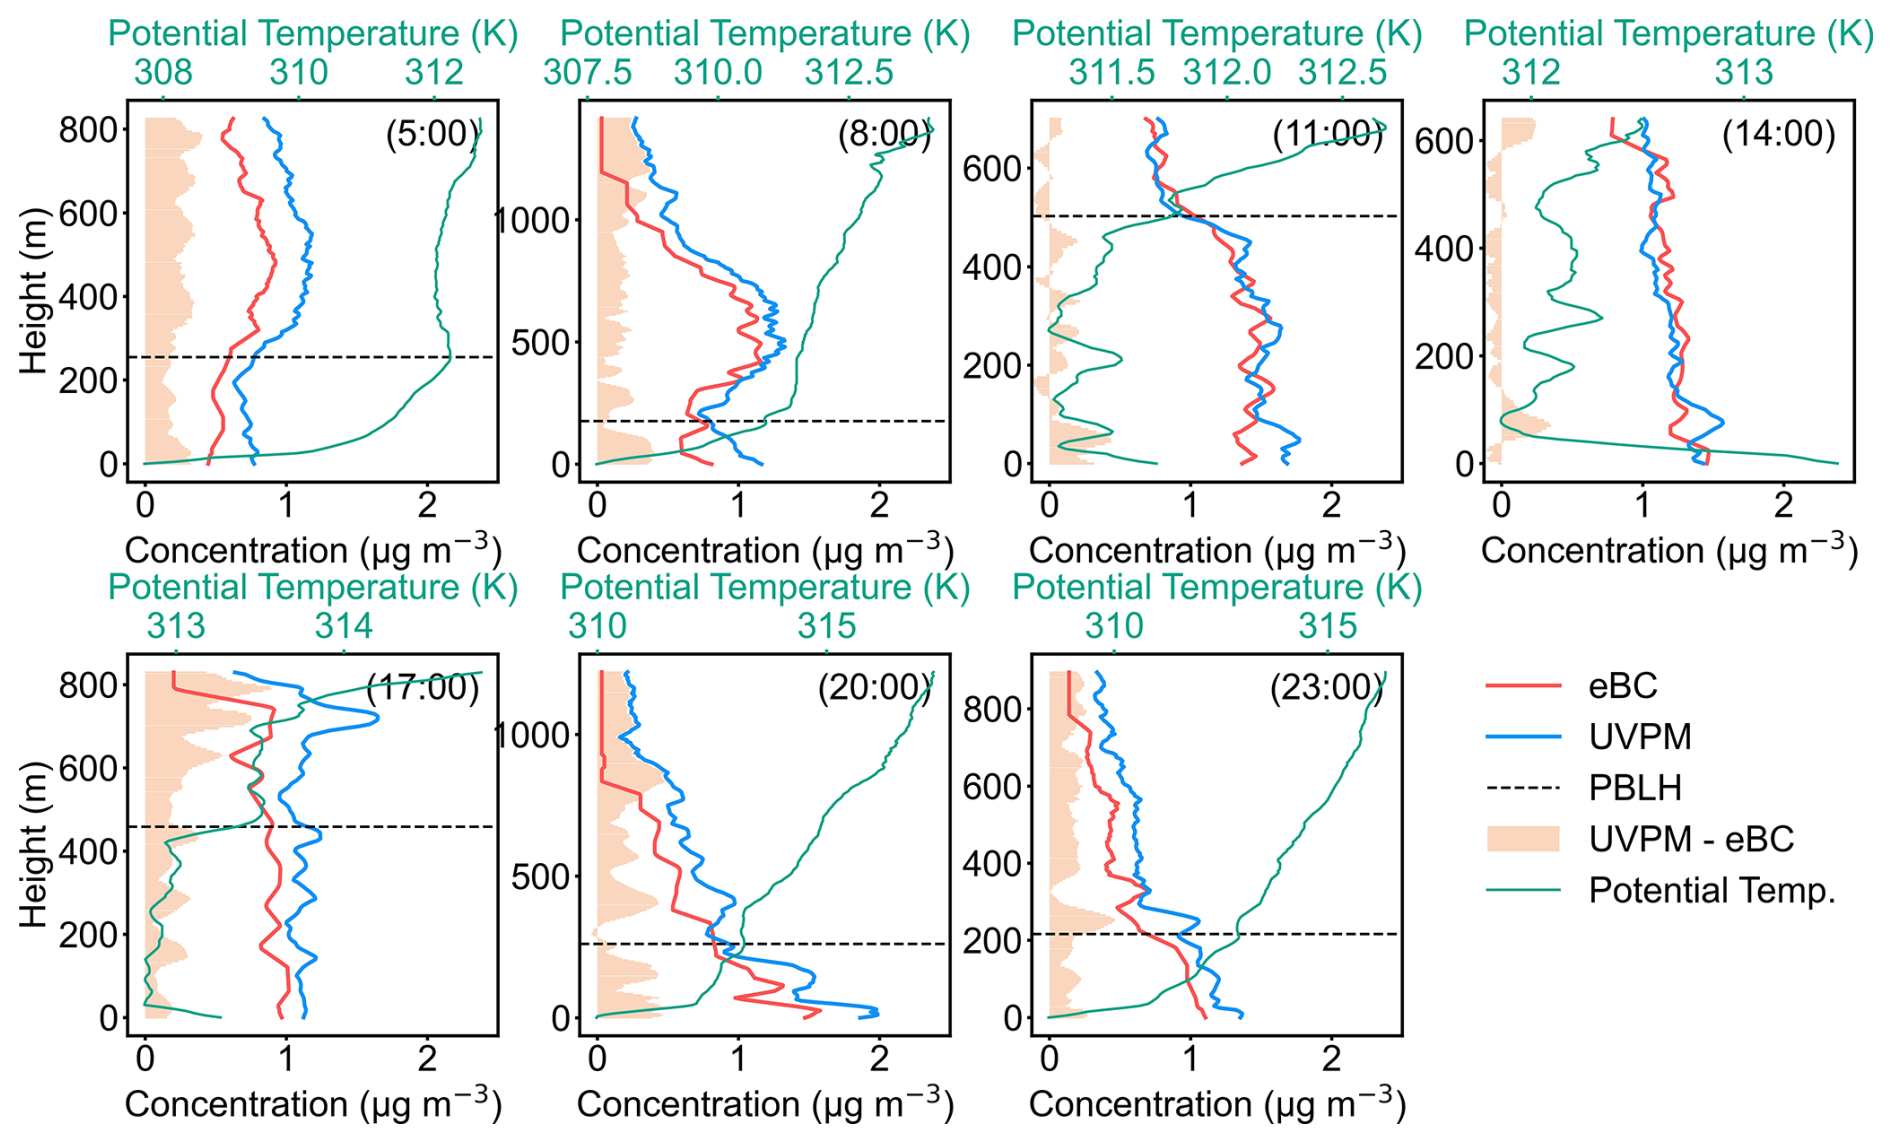
Figure 6Diurnal variations in profiles of eBC, UVPM and potential temperature on 27 July 2024. The red line represents eBC, the blue line represents UVPM, and the green line represents the potential temperature profile. The light orange shaded area represents the difference between UVPM and eBC. The black dashed lines represent the PBLH.
Analysis of the potential temperature profiles in Fig. 6 indicates that at around 05:00 LT the PBL top lay near 260 m. Below this altitude, both eBC and UVPM concentrations decrease slightly with height. The potential temperature profile further reveals a deep residual layer above the PBL top, where colder near-surface air is trapped beneath warmer air aloft, creating a stable stratification that inhibits mixing within that layer and leads to increasing particle concentrations toward its base. In the transition to the free troposphere above the residual layer, comparatively low aerosol concentrations and enhanced turbulence promote further dilution, and beyond approximately 500 m eBC and UVPM again decline with height. By 08:00 LT the PBL remained near 200 m, and the vertical variation in aerosol concentrations mirrored the pattern observed at 05:00 LT. With increasing solar insolation, however, surface heating intensified convection so that by 11:00 LT the PBL top had risen to roughly 500 m. During this stage, relatively small vertical gradients in eBC and UVPM within the PBL indicate well-mixed conditions. At 14:00 LT tethered-balloon sampling did not reach the PBL top, but observations within the PBL show uniform aerosol distributions, preventing a direct assessment of PBLH effects on concentration profiles. The potential temperature gradients between 11:00 and 14:00 LT exhibit significant fluctuations, signaling unstable stratification favorable to vertical pollutant transport (Li, 2019). From 14:00 to 17:00 LT, as solar radiation waned and surface temperatures fell, the PBL top subsided to about 450 m. At this time, potential temperatures within the PBL remained lower than at the surface and displayed pronounced variability, reflecting continued unstable stratification and strong vertical mixing; eBC and UVPM maintained nearly uniform distributions. Above the PBL, a mixed layer approximately 300 m thick persisted; at its top, diminished turbulence inhibited aerosol dispersion, causing localized accumulation of eBC and UVPM (Ding et al., 2016). By 20:00 LT, sunset-driven surface cooling weakened convection, a nocturnal temperature inversion developed near the ground, and calm winds led to pollutant accumulation at low altitudes. As surface temperatures continued to drop, vertical transport further diminished, confining aerosols below roughly 200 m by 23:00 LT.
3.3 Dynamic impacts on profiles of eBC and UVPM
3.3.1 Impacts of long-range transport on carbonaceous aerosols
Long-range transport of air masses plays a crucial role in shaping the vertical distribution of air pollutants. Figure S10 in the Supplement presents the 500 m backward trajectories and their altitude profiles for air masses arriving at the site during the observation period, and Fig. S11 in the Supplement presents temporal variation in the PBLH of the nearest urban area of Pingliang during the observation period. Figure S11 shows that, upon entering the Pingliang region, these air parcels generally descend to below PBLH, meaning that, in addition to pollutants carried within the air mass itself, emissions from surrounding urban areas also significantly impact the receptor site. Trajectory-cluster analysis at 100, 500, and 1000 m (Fig. 7) reveals that, in summer, Pingliang is principally influenced by air masses originating from Inner Mongolia and Ningxia to the north, from Gansu–Qingyang and northern Shaanxi to the east, and from southern Shaanxi to the south. At 500 and 1000 m, regional contributions from these directions are broadly similar, whereas at 100 m the proportion of short-range flow from the southeast increases markedly. The shaded overlays in Fig. 7 show the weighted potential source contribution function (WPSCF) and weighted concentration-weighted trajectory (WCWT) results for UVPM. WPSCF indicates that air parcels from Inner Mongolia, Ningxia, Shanxi, and Shaanxi to the north, east, and south exert the greatest influence on the Pingliang site. Specifically, at 100 m the highest WPSCF values are located in the local Pingliang area and the Shaanxi–Gansu border region, while at 500 m parcels from central Shaanxi and the Shanxi–Henan–Shaanxi nexus dominate, followed by the tri-provincial junction of Shaanxi, Gansu, and Sichuan. The WCWT analysis yields results similar to those of the WPSCF, but it additionally highlights that southern Shaanxi is also an important source region of UVPM at the observation site. Taken together, WPSCF and WCWT pinpoint southern Shaanxi cities and local emissions around Pingliang as major contributors to carbonaceous aerosol pollution, whereas at higher altitudes UVPM is primarily transported from the south.
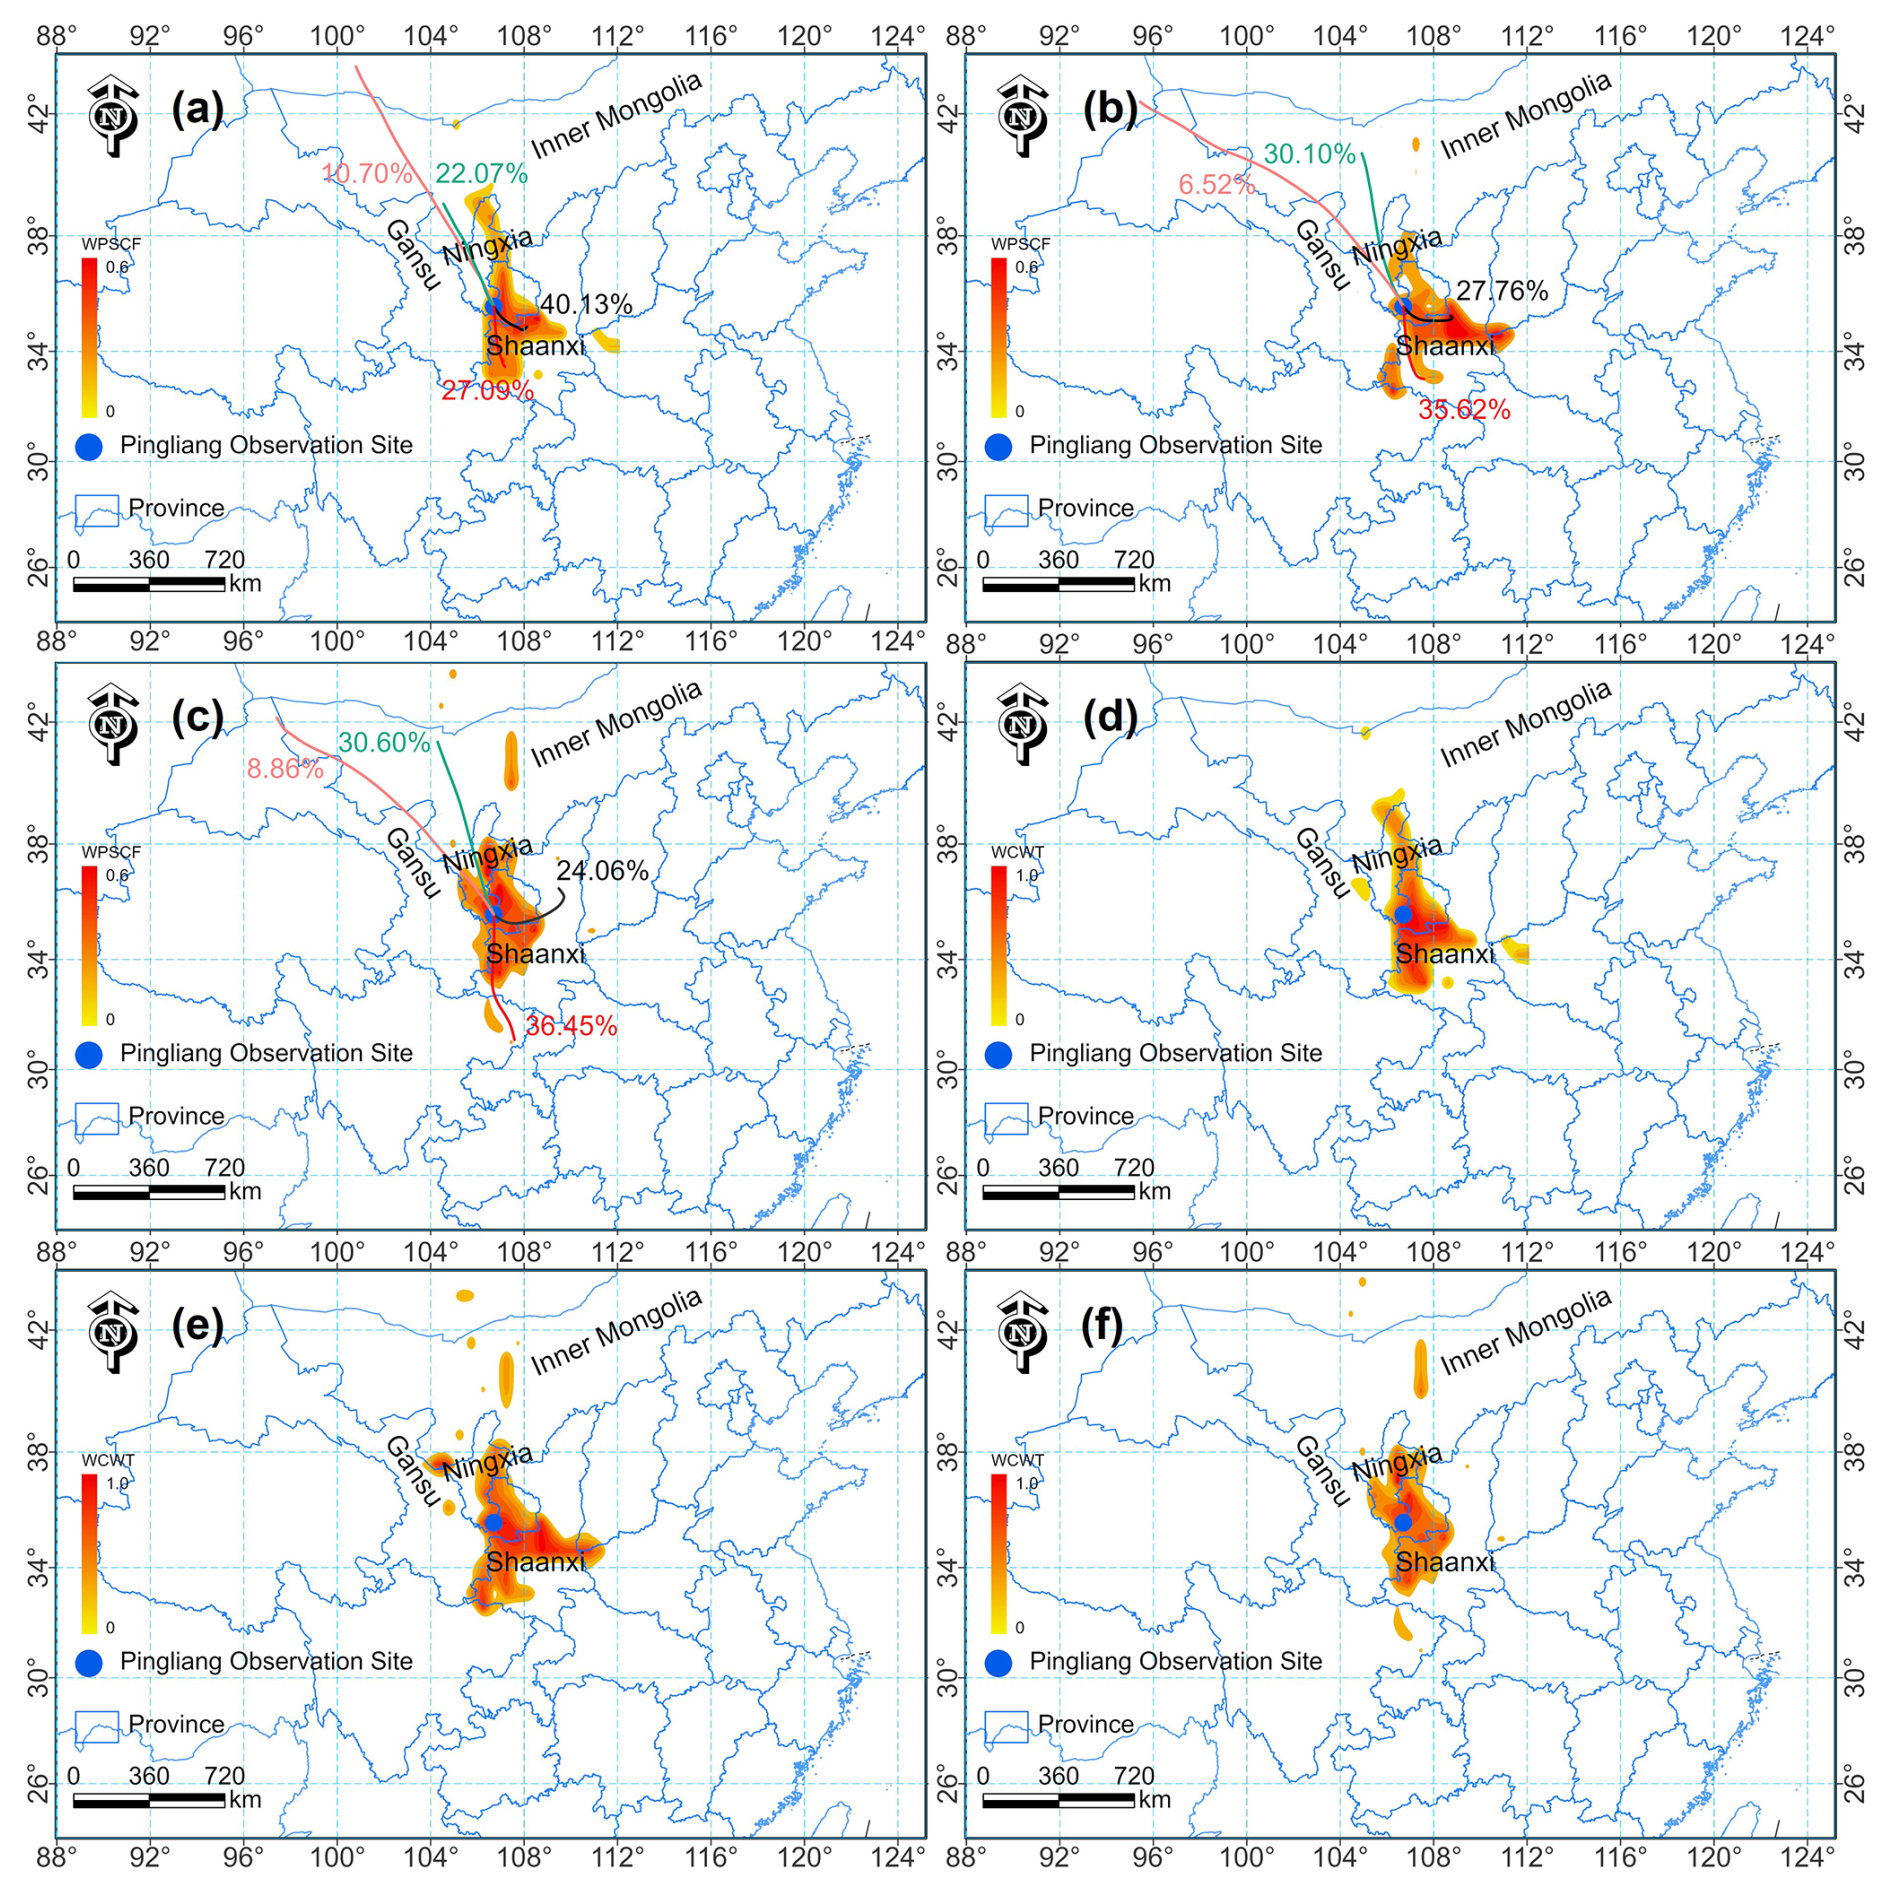
Figure 7Backward trajectory clustering and WPSCF analysis results of air masses at heights of (a) 100 m, (b) 500 m, and (c) 1000 m during the observation period, respectively. WCWT analysis results of air masses at heights of (d) 100 m, (e) 500 m, and (f) 1000 m during the observation period, respectively.
3.3.2 Impacts of local sources on carbonaceous aerosols
In addition to long-range transport, local wind speed and direction significantly modulate the vertical distribution of aerosols at the observation site. Conditional Probability Function (CPF) plots, which relate pollutant concentrations to wind sectors and speeds, help elucidate these local transport and dispersion mechanisms. Figure 8 shows CPF diagrams for the 90th percentile of UVPM and eBC concentrations at 100, 500 and 1000 m. The mean UVPM concentrations decrease with altitude, from 0.86 µg m−3 at 100 m, to 0.63 µg m−3 at 500 m, and to 0.44 µg m−3 at 1000 m, indicating that extreme UVPM events become less probable at higher altitudes. At 100 m, elevated UVPM concentrations are associated with southerly, southwesterly, southeasterly, northerly, and northwesterly winds, reflecting the combined influence of urban emissions and local rural emissions surrounding the observation site. At 500 m, the influence of northwesterly, southwesterly and northerly sectors diminishes, while southerly winds remain the dominant driver of high UVPM, albeit with reduced effect. Southeasterly winds occasionally lead to relatively high UVPM values at both 100 and 500 m altitude, although this occurrence is less frequent, which is consistent with the results of backward trajectories. We hypothesize that this variability may be associated with local and sporadic emissions from residents in the vicinity, as the observation site is located in a rural area with no stationary point sources. However, the specific cause cannot be definitively determined by the CPF alone. We will continue to analyze this phenomenon in subsequent observational studies to provide a clearer explanation.
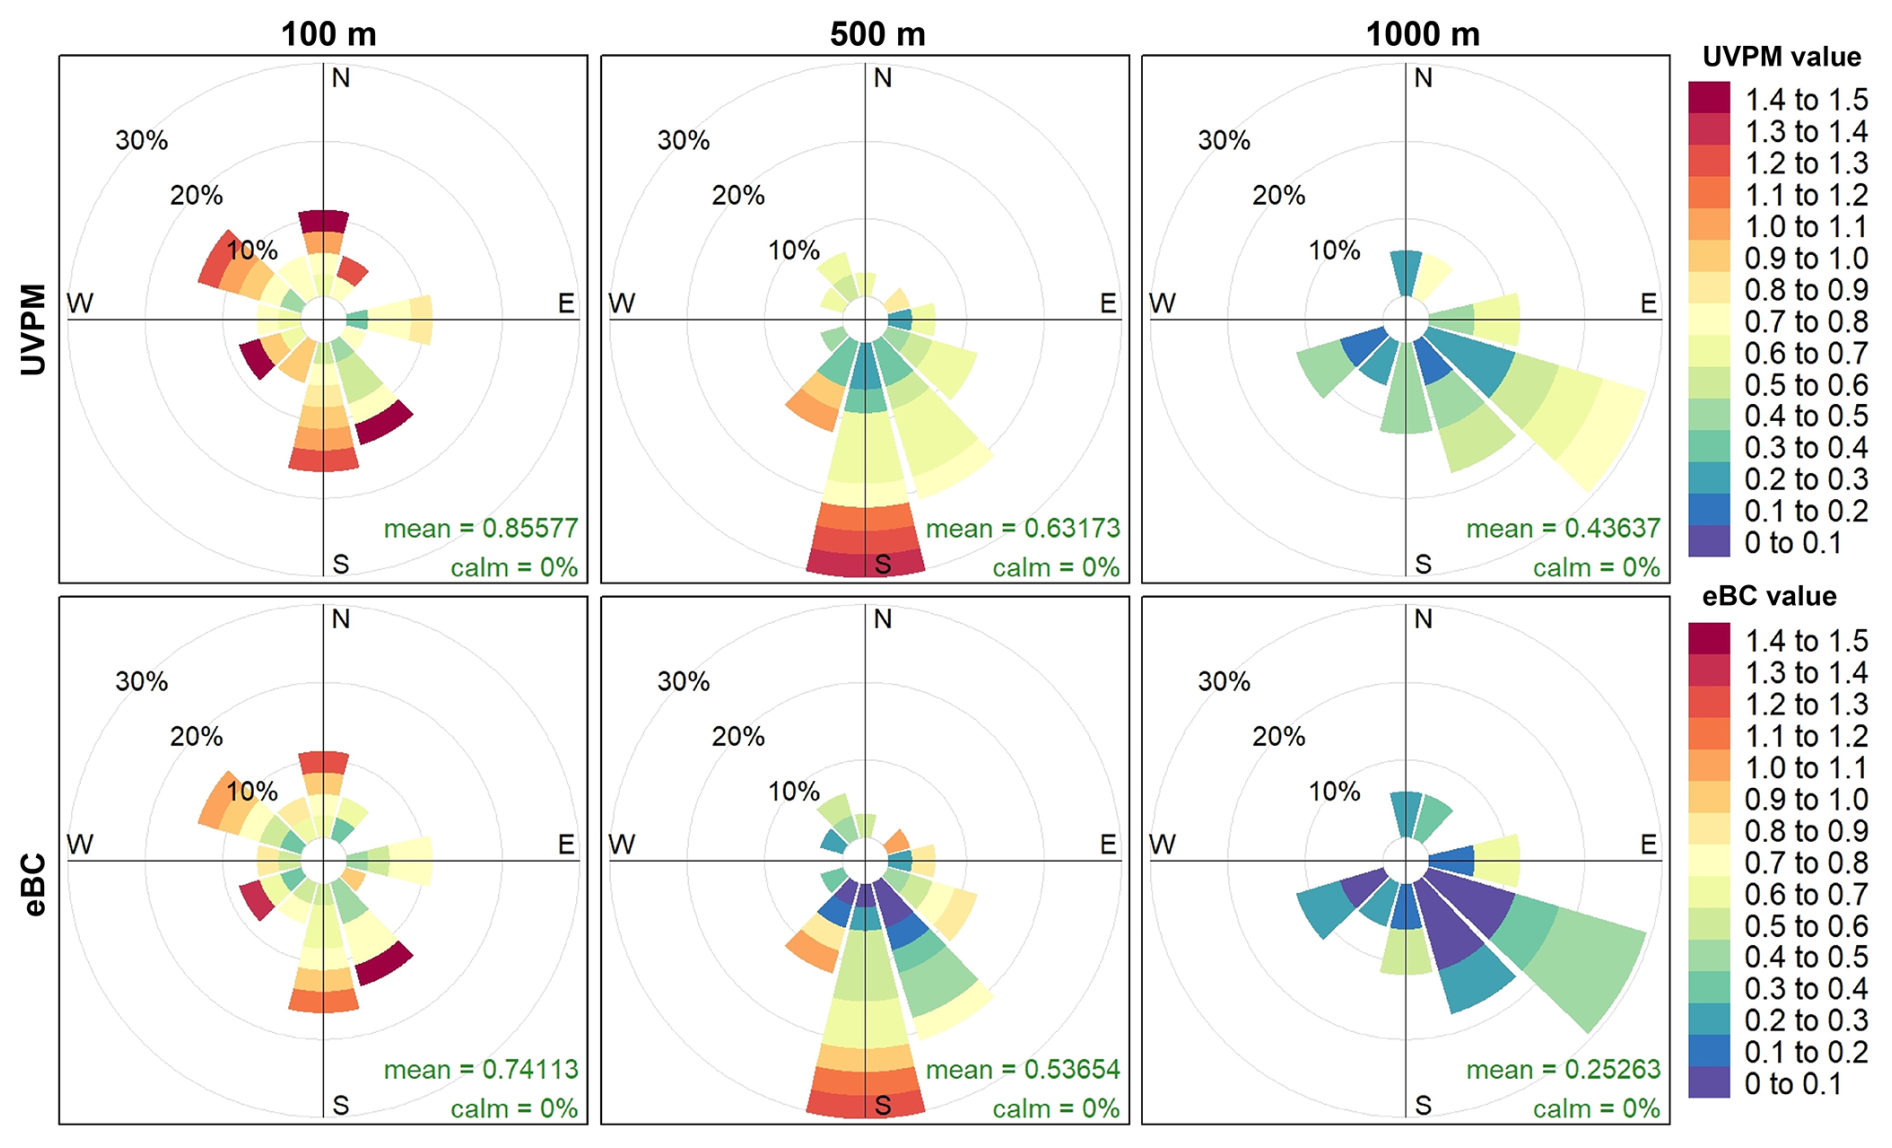
Figure 8Conditional probability function (CPF) diagrams of the 90th percentile of the UVPM and eBC concentrations with respect to wind speed and direction at the heights of 100, 500 and 1000 m above ground level.
The analysis of eBC shows results similar to those of UVPM. The main difference is that at 500 and 1000 m, southeasterly winds exert a slightly stronger influence on UVPM than on eBC. In addition, the relationships between UVPM (or eBC) and wind direction and speed at different altitudes indicate that carbonaceous aerosols at 100 m above the observation site are highly sensitive to almost all wind directions. This is primarily because pollutants at this height are strongly affected by local emissions from rural areas surrounding the site. In contrast, at 500 and 1000 m, carbonaceous aerosol concentrations exhibit a pronounced association with southerly and southeasterly winds, while their dependence on other wind directions weakens. This indicates that transport from the south and southeast is the significant source of the carbonaceous aerosol burden above the observation site, a pattern that is also reflected in the WPSCF and WCWT results shown in Fig. 7. In addition, this may also be related to the fact that Pingliang urban area is located south of the observation site (Fig. 1).
To better compare the thermodynamically driven and dynamically driven influences on pollutant vertical distribution, this section again focuses on 27 July 2024 to examine the effects of wind speed and mechanical turbulence. Figure 9 presents horizontal and vertical wind speeds together with mechanical turbulence measured by the Doppler wind lidar during the sampling periods on that day. At 05:00 LT, both horizontal and vertical wind speeds within the PBL were low, while mechanical turbulence was comparatively high, promoting efficient vertical mixing and producing a nearly uniform distribution of carbonaceous aerosol concentrations throughout the PBL (Fig. 6). Above the residual layer, stronger vertical winds combined with weaker turbulence transported aerosols upward, causing UVPM and eBC concentrations to increase with height between 400 and 600 m. At 08:00 LT, the residual-layer concentrations exhibited a pattern similar to that at 05:00 LT, but stronger vertical winds and reduced turbulence at the residual-layer top led to a more pronounced concentration decrease above the layer (Fig. 6). By late morning, enhanced vertical wind speeds within the PBL facilitated upward transport of pollutants. However, at both 11:00 and 14:00 LT the aerosol concentration profile remained relatively uniform, with only a slight decrease with height; this reflects the competing effects of thermal convection, which lifts near-surface pollutants, and elevated turbulence aloft, which strengthens vertical exchange. At 17:00 LT, subsiding motions prevailed at 900–1200 m and mechanical turbulence index throughout the column was low, weakening vertical exchange and causing pollutants to accumulate near 800 m (Fig. 6). By 20:00 LT, weak mechanical turbulence at the PBL top and widespread subsidence near the surface suppressed upward transport of carbonaceous aerosols; as a result, pollutant concentrations decreased sharply with height within the PBL, while above the PBL top horizontal and vertical winds aided dispersion, producing a continued decline in aerosol concentrations up to 800 m.
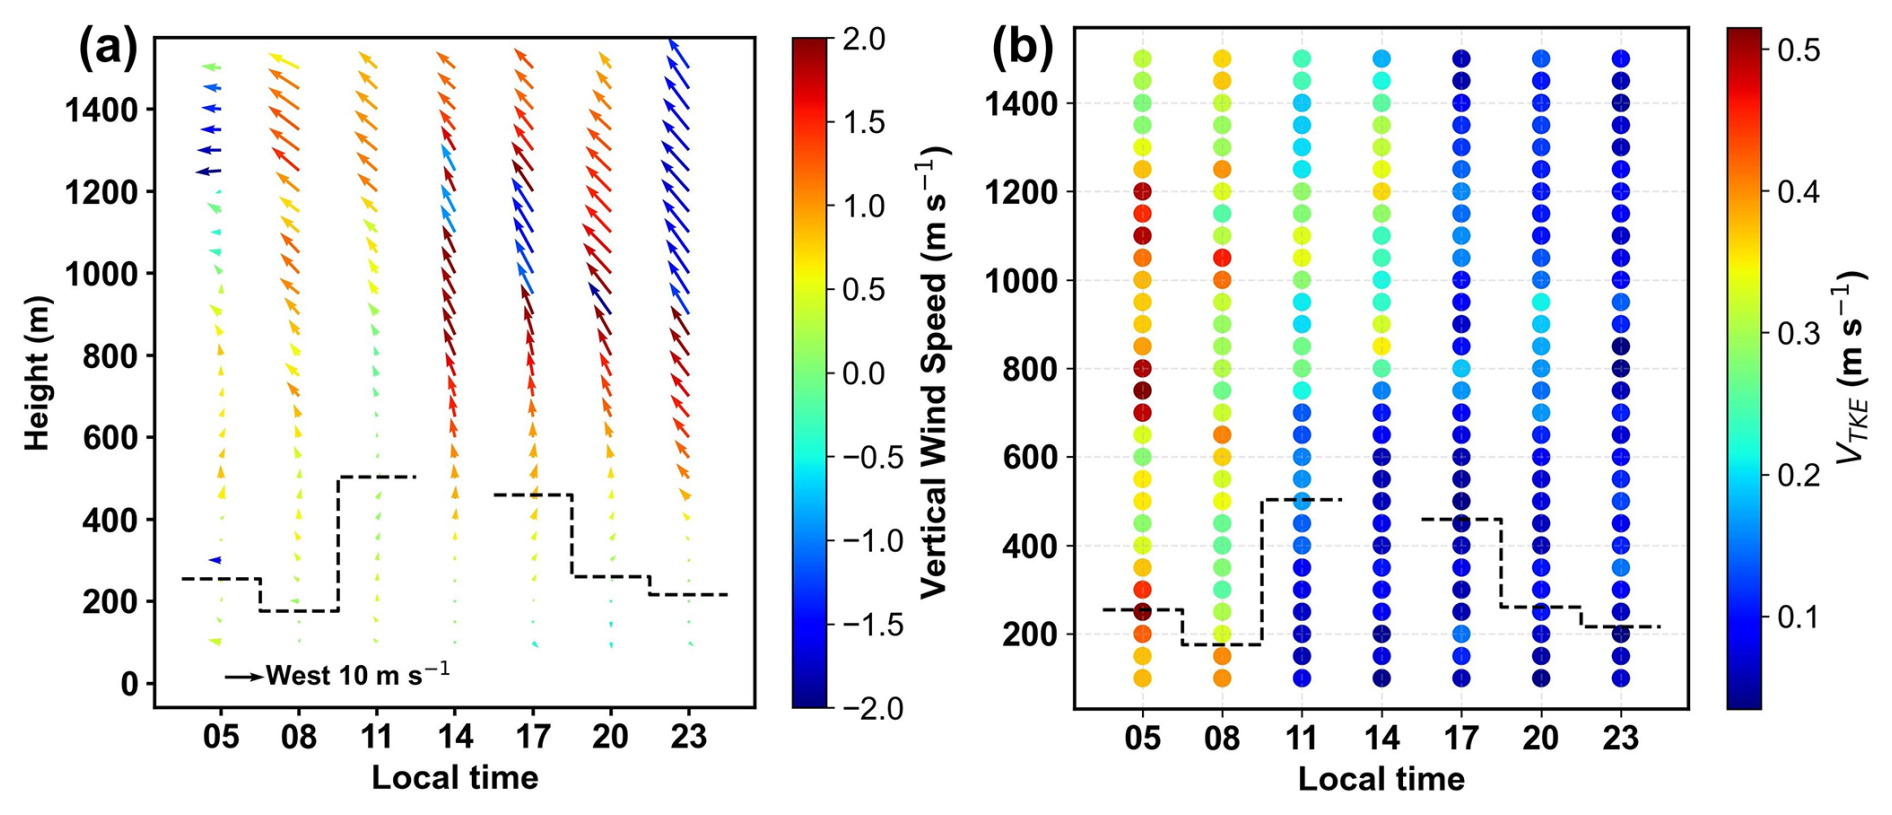
Figure 9(a) Vertical wind speed, horizontal wind speed, and wind direction at heights of 100–1500 m during different periods on 27 July 2024 (the direction of the arrow represents the wind vector direction, i.e., a rightward arrow represents a westerly wind). The height resolution for wind direction and speed is 50 m, and the length of the arrow represents the magnitude of the horizontal wind speed. The color of the arrows represents the vertical wind speed. (b) VTKE values at different heights (calculated based on wind speed data within 5 min), where different colors represent different VTKE values. The black dashed line in the figure represents the PBLH during the observation period.
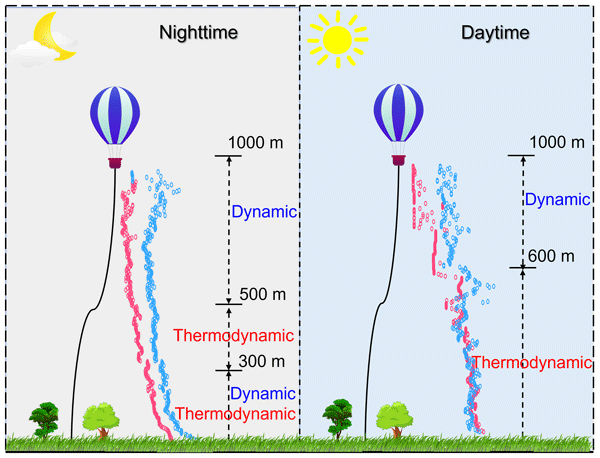
To systematically investigate the mechanisms by which thermodynamic and dynamic processes influence the vertical distribution of carbonaceous aerosols, the observation periods were grouped into daytime (08:00, 11:00, 14:00 and 17:00 LT) and nighttime (20:00, 23:00 and 05:00 LT). A random forest nonlinear regression was applied to quantify the relative contributions of thermal forcing and dynamic forcing to the vertical concentration gradients of carbonaceous aerosols at different altitude layers (Fig. 10). All regressions achieved coefficients of determination (R2) above 0.70, indicating good explanatory power. During daytime, these two processes exhibit clear vertical stratification. From the surface up to 600 m, thermal forcing dominates the evolution of aerosol concentration, whereas between 600 and 1000 m horizontal wind speed is the primary driver. At night, the influence of thermal forcing is more complex. Between the surface and 300 m both thermal forcing and horizontal wind speed jointly govern vertical concentration variability. Between 300 and 500 m, thermal forcing alone exerts decisive control, while above 500 m dynamic processes exert a much stronger influence than thermodynamic processes. Comparison with PBLH analyses shows that 300 m corresponds to the inversion top at night, where both thermodynamic and dynamic mechanisms contribute comparably to aerosol pollution. The layer from 300 to 500 m largely coincides with the residual layer, which retains daytime turbulence characteristics and therefore responds more sensitively to thermal forcing. It should be noted that daytime measurements were taken at 08:00, 11:00 and 17:00 LT, a period when the PBL had not yet fully developed, so that 600 m approximately corresponds to the daytime PBL top. Consequently, the vertical distribution of carbonaceous aerosols within the daytime PBL is primarily governed by thermodynamic processes, in contrast to the combined dynamic and thermodynamic control that dominates within the nocturnal residual layer. A schematic of these regulatory mechanisms for aerosol vertical structure is presented in Fig. 11.
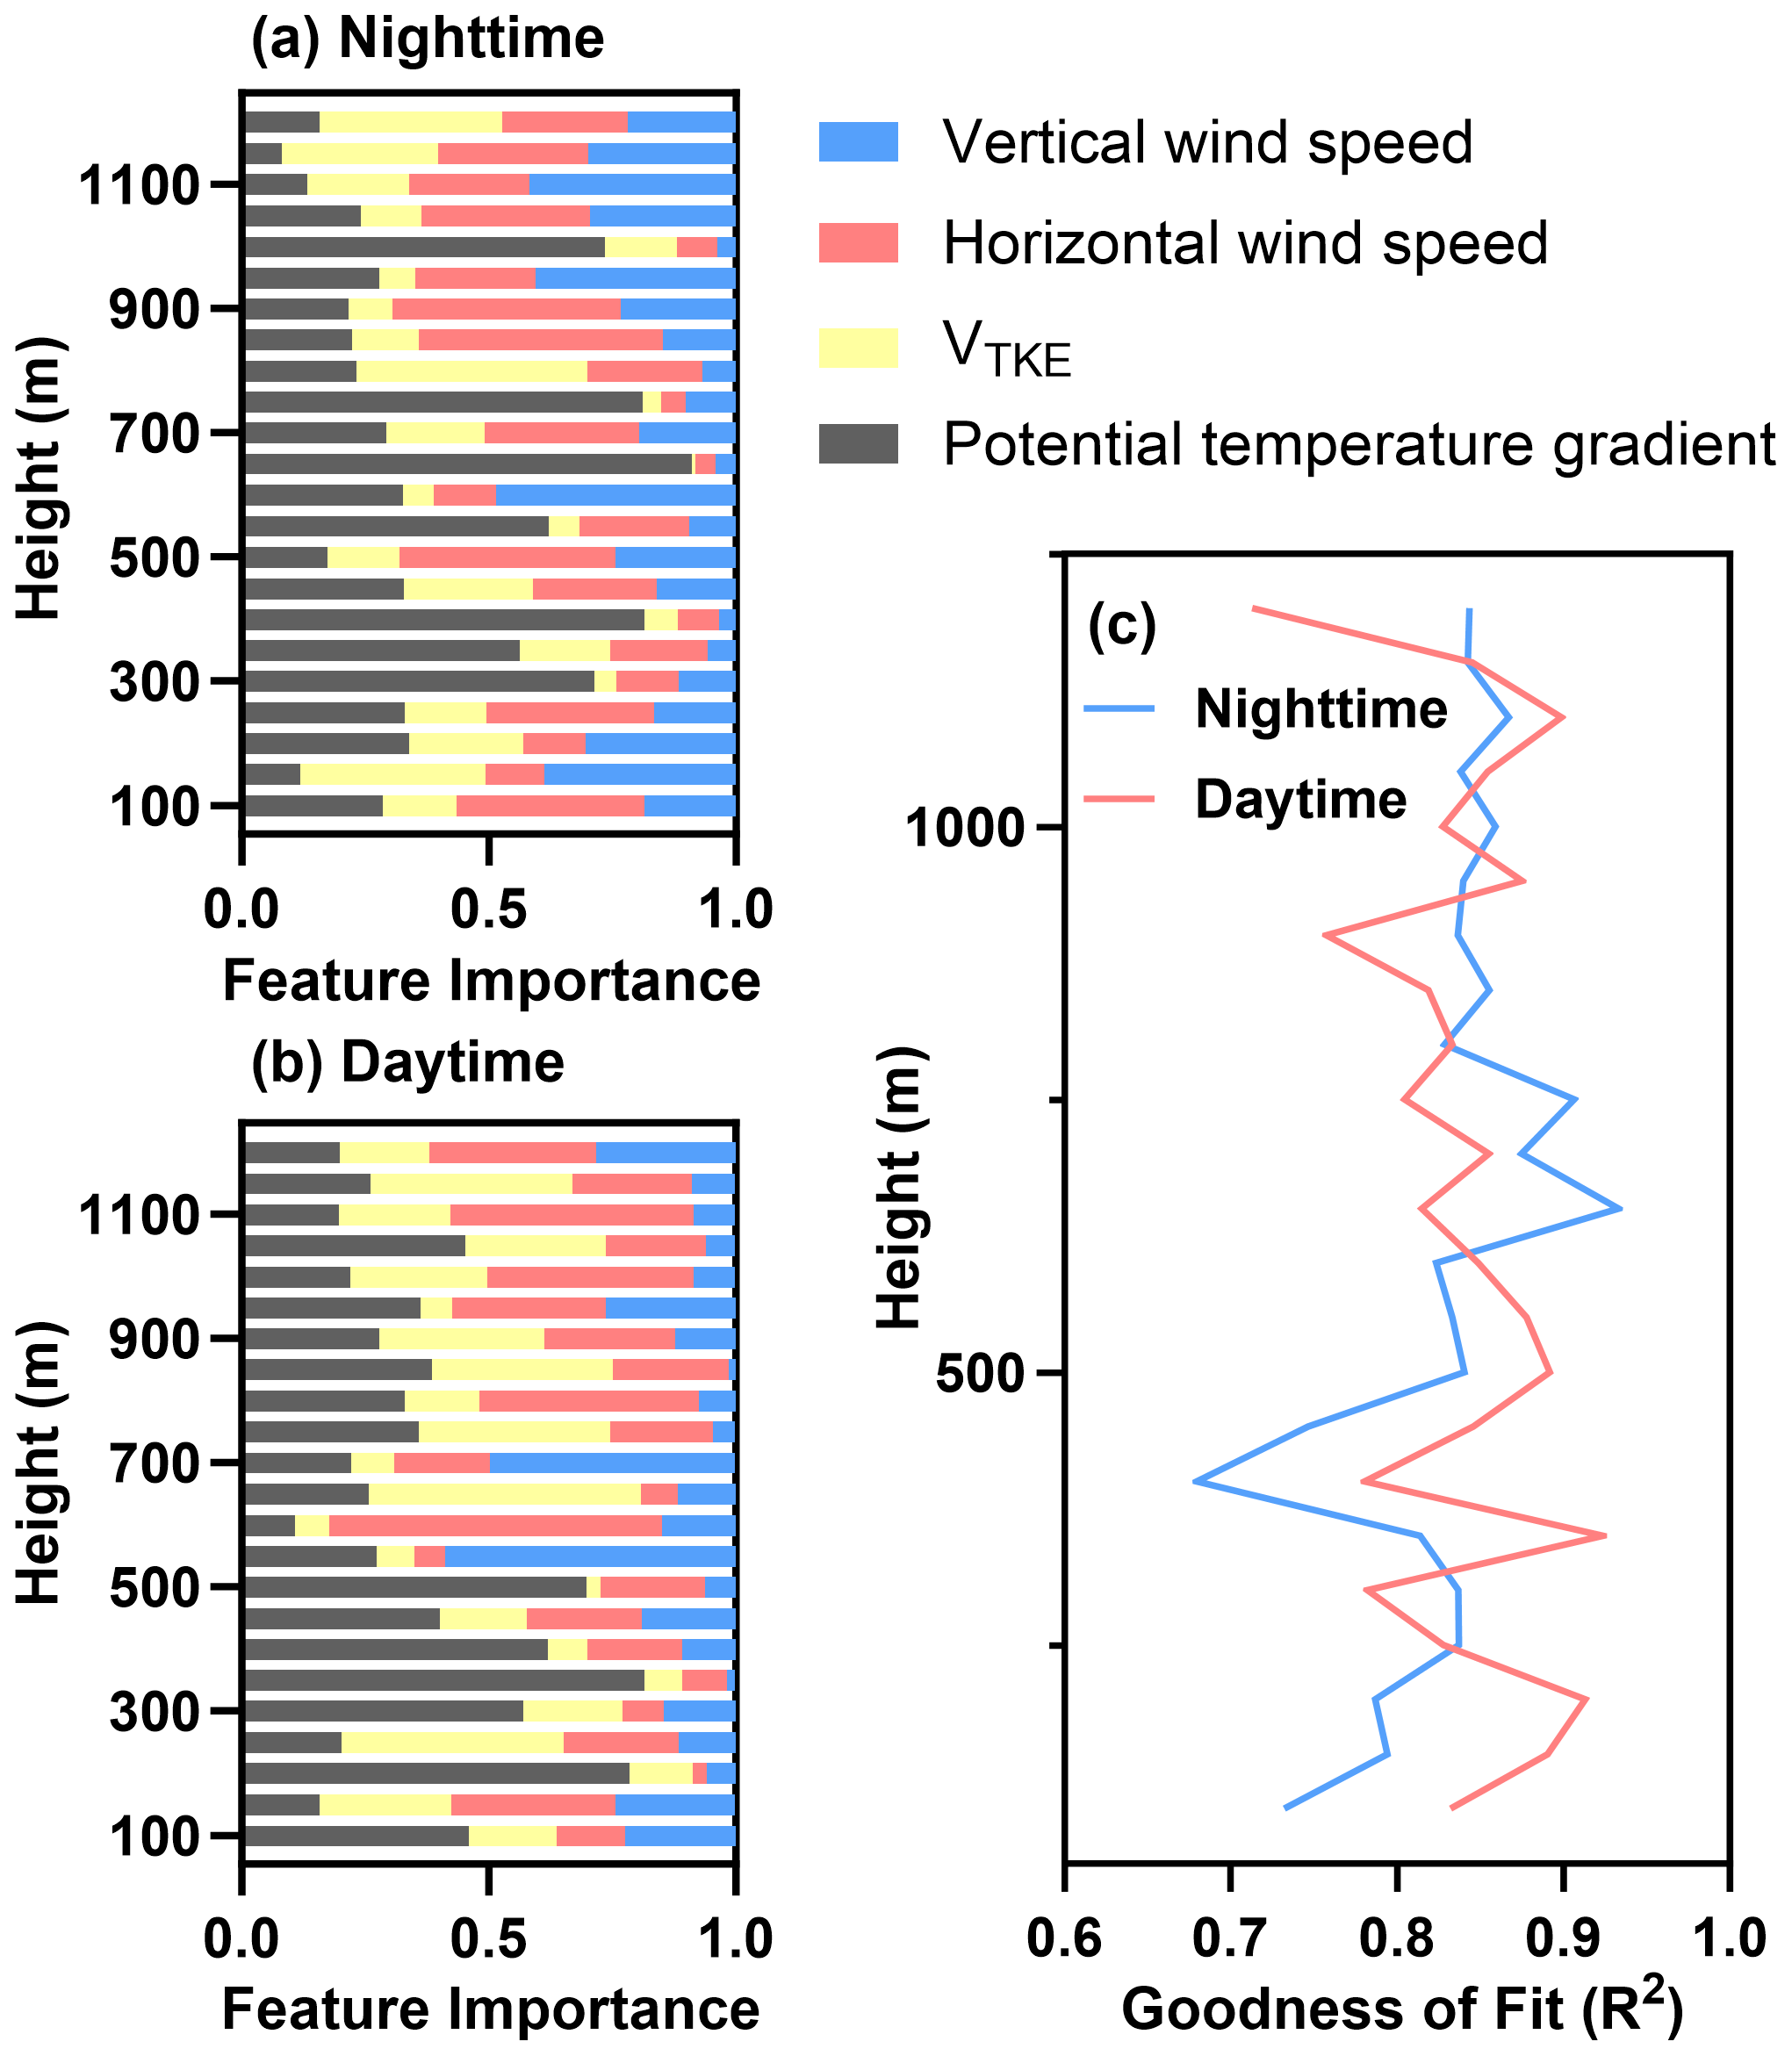
Figure 10Results of feature importance analysis for the impacts of potential temperature gradient, mechanical turbulence, horizontal wind speed, and vertical wind speed on the UVPM gradient during (a) nighttime and (b) daytime, respectively. (c) model goodness of fit (coefficients of determination, R2) in the calculation.
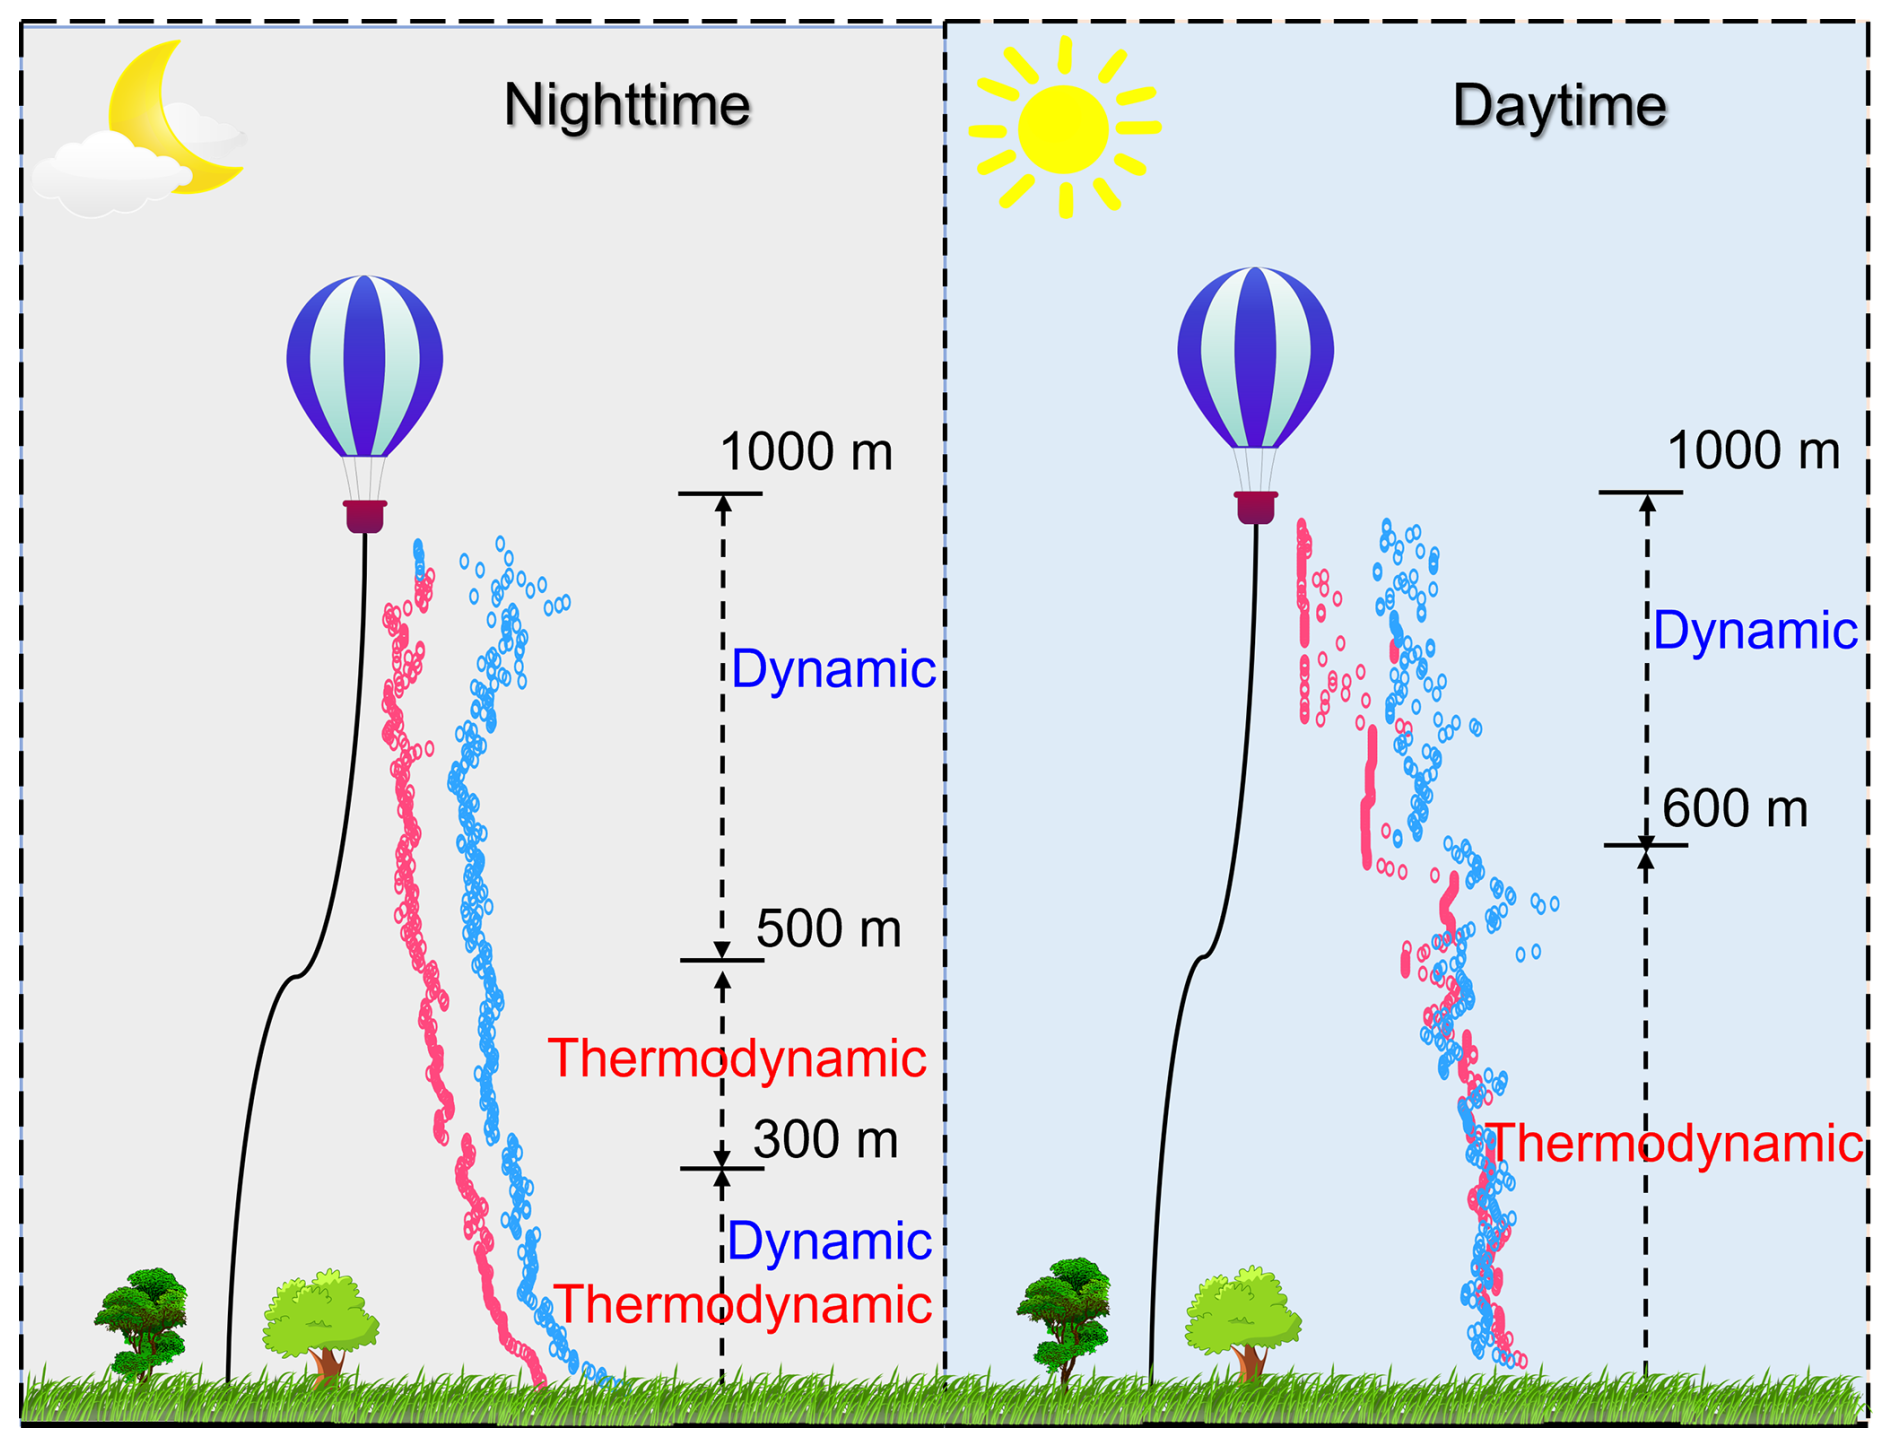
Figure 11Schematic illustration of thermodynamic and dynamic impacts on aerosol vertical distribution. Within the figure, red circles denote eBC concentrations, whereas blue circles denote UVPM concentrations; the more rightward a circle's position, the higher the corresponding concentration.
Li et al. (2019) also found through radiosonde observations that during the daytime, thermodynamic processes induced unstable stratification within the PBL, resulting in well-mixed aerosols. In contrast, at night, the stable atmospheric stratification from the surface to 200 m suppressed vertical dispersion of aerosols. Between 500 and 1000 m, the presence of a low-level jet significantly influenced the vertical distribution of aerosols. In addition, strong mechanical turbulence played a key role in facilitating aerosol dispersion near the top of the PBL (Sun et al., 2024). Their findings are consistent with the conclusions of this study.
Pingliang City is situated on the Loess Plateau in northwestern China, where observational data on the vertical distribution of carbonaceous aerosols and meteorological parameters within the planetary boundary layer remain limited. To address this data gap, this study conducted detailed vertical profiling in a typical tableland region of the Loess Plateau using tethered balloons equipped with relevant observation instruments during July 2023 and July 2024.
The study found that near-surface concentrations of equivalent black carbon (eBC) and ultraviolet-absorbing particulate matter (UVPM) in Pingliang were 0.84 and 1.24 µg m−3, respectively. These concentrations are slightly lower than those reported for major Chinese cities including Beijing, Shanghai, Nanjing, Chengdu, Shenzhen, Hengshui, the Beibu Gulf region, and Lanzhou, as well as European cities such as Stuttgart in Germany and Milan in Italy. However, they are higher than the eBC levels observed over the Tibetan Plateau and in the Arctic. A comparison of the vertical profiles of eBC and UVPM showed that during early morning and nighttime periods, when convective activity is relatively weak, UVPM concentrations in the upper atmosphere are generally higher than those of eBC. Near the surface, the difference between eBC and UVPM concentrations is relatively small. This phenomenon is likely related to the formation of new particles in the upper atmosphere through gas to particle conversion of gaseous pollutants.
Analysis of thermodynamic and dynamic processes influencing the vertical distribution of carbonaceous aerosols shows that thermodynamic processes primarily govern vertical transport in the near-surface layer, while enhanced dynamic processes in the upper atmosphere promote horizontal dispersion of pollutants. The influence of thermodynamic and dynamic mechanisms on aerosol vertical profiles exhibits distinct stratification between daytime and nighttime. At various altitudes, air masses originating from the south are consistently associated with elevated UVPM concentrations. This pattern may be attributed to the combined influence of pollution sources located in the urban area to the south of the site and topographic differences along the north and south directions.
Nevertheless, there are still some limitations in this study that should be addressed in future work. Firstly, observations under strong wind conditions in the upper air were not successfully conducted during the campaign. Secondly, the study primarily focused on a limited set of air pollutants. Future research will incorporate additional gaseous pollutants such as SO2, NO2, O3, and VOCs to enable a more comprehensive analysis of the chemical formation mechanisms and vertical distribution characteristics of aerosols. Thirdly, elevated relative humidity can induce a negative bias in the MA350 measurements of carbonaceous aerosol light absorption coefficient. To improve measurement accuracy, we strongly recommend that future observational studies incorporate a drying system upstream of the measurement instrument to eliminate RH effects on the observations. Furthermore, the field campaign was conducted at only a site, and thus the feedback between aerosols and the PBL meteorology cannot be fully understood across the whole Loess Plateau. The upcoming field campaign will be conducted at the other sites to better reveal the impact of thermodynamic and dynamic processes on the vertical profiles of air pollutants.
The air pollution data were downloaded from the China Environmental Meteorological Data Service Platform (http://eia-data.com/, last access: 23 June 2025), and the station ID for Pingliang City is 2656A. The GDAS1 meteorological fields used to drive the backward trajectory calculations were obtained from the NOAA FTP repository (ftp://arlftp.arlhq.noaa.gov/pub/archives/gdas1, last access: 28 March 2025). Raw data sets (Qi et al., 2025b) used in this paper are available at https://doi.org/10.5281/zenodo.17947573.
The supplement related to this article is available online at https://doi.org/10.5194/acp-26-12671-2026-supplement.
SQ performed the data analysis and prepared the initial draft of the manuscript. SZ and YY designed the experimental approach and revised the manuscript. SQ, SZ, LD, TZ, GZ, JL, XZ, and YL participated in data collection during the experiment.
The contact author has declared that none of the authors has any competing interests.
Publisher's note: Copernicus Publications remains neutral with regard to jurisdictional claims made in the text, published maps, institutional affiliations, or any other geographical representation in this paper. The authors bear the ultimate responsibility for providing appropriate place names. Views expressed in the text are those of the authors and do not necessarily reflect the views of the publisher.
This research has been supported by the National Natural Science Foundation of China (grant no. 42422504), the Science and Technology Department of Gansu Province, Science and Technology Program of Gansu Province (grant no. 24ZD13FA003), and the Youth Innovation Promotion Association of the Chinese Academy of Sciences (grant no. Y2021111).
This paper was edited by Jessie Creamean and reviewed by three anonymous referees.
Allen, R. J. and Landuyt, W.: The vertical distribution of black carbon in CMIP5 models: Comparison to observations and the importance of convective transport, J. Geophys. Res.-Atmos., 119, 4808–4835, https://doi.org/10.1002/2014JD021595, 2014.
Ångström, A.: On the atmospheric transmission of sun radiation and on dust in the air, Geogr. Ann., 11, 156–166, 1929.
Arnott, W. P., Moosmüller, H., Sheridan, P. J., Ogren, J. A., Raspet, R., Slaton, W. V., Hand, J. L., Kreidenweis, S. M., and Collett Jr., J. L.: Photoacoustic and filter-based ambient aerosol light absorption measurements: Instrument comparisons and the role of relative humidity, J. Geophys. Res.-Atmos., 108, 4034, https://doi.org/10.1029/2002JD002165, 2003.
Bisht, D. S., Tiwari, S., Dumka, U. C., Srivastava, A. K., Safai, P. D., Ghude, S. D., Chate, D. M., Rao, P. S. P., Ali, K., Prabhakaran, T., Panickar, A. S., Soni, V. K., Attri, S. D., Tunved, P., Chakrabarty, R. K., and Hopke, P. K.: Tethered balloon-born and ground-based measurements of black carbon and particulate profiles within the lower troposphere during the foggy period in Delhi, India, Sci. Total Environ., 573, 894–905, https://doi.org/10.1016/j.scitotenv.2016.08.185, 2016.
Bond, T. C., Doherty, S. J., Fahey, D. W., Forster, P. M., Berntsen, T., DeAngelo, B. J., Flanner, M. G., Ghan, S., Kärcher, B., Koch, D., Kinne, S., Kondo, Y., Quinn, P. K., Sarofim, M. C., Schultz, M. G., Schulz, M., Venkataraman, C., Zhang, H., Zhang, S., Bellouin, N., Guttikunda, S. K., Hopke, P. K., Jacobson, M. Z., Kaiser, J. W., Klimont, Z., Lohmann, U., Schwarz, J. P., Shindell, D., Storelvmo, T., Warren, S. G., and Zender, C. S.: Bounding the role of black carbon in the climate system: A scientific assessment, J. Geophys. Res.-Atmos., 118, 5380–5552, https://doi.org/10.1002/jgrd.50171, 2013.
Chen, D., Liao, H., Yang, Y., Chen, L., Zhao, D., and Ding, D.: Simulated impacts of vertical distributions of black carbon aerosol on meteorology and PM2.5 concentrations in Beijing during severe haze events, Atmos. Chem. Phys., 22, 1825–1844, https://doi.org/10.5194/acp-22-1825-2022, 2022.
Chen, L.-W. A., Chow, J. C., Wang, X. L., Robles, J. A., Sumlin, B. J., Lowenthal, D. H., Zimmermann, R., and Watson, J. G.: Multi-wavelength optical measurement to enhance thermal/optical analysis for carbonaceous aerosol, Atmos. Meas. Tech., 8, 451–461, https://doi.org/10.5194/amt-8-451-2015, 2015.
Chow, J. C., Watson, J. G., Green, M. C., Wang, X. L., Chen, L.-W. A., Trimble, D. L., Cropper, P. M., Kohl, S. D., and Gronstal, S. B.: Separation of brown carbon from black carbon for IMPROVE and CSN PM2.5 samples, Air Waste Manag. Assoc., 68, 494–510, https://doi.org/10.1080/10962247.2018.1426653, 2018.
Ding, A. J., Huang, X., Nie, W., Sun, J. N., Kerminen, V. M., Petäjä, T., Su, H., Cheng, Y. F., Yang, X. Q., Wang, M. H., Chi, X. G., Wang, J. P., Virkkula, A., Guo, W. D., Yuan, J., Wang, S. Y., Zhang, R. J., Wu, Y. F., Song, Y., Zhu, T., Zilitinkevich, S., Kulmala, M., and Fu, C. B.: Enhanced haze pollution by black carbon in megacities in China, Geophys. Res. Lett., 43, 2873–2879, https://doi.org/10.1002/2016GL067745, 2016.
Düsing, S., Wehner, B., Müller, T., Stöcker, A., and Wiedensohler, A.: The effect of rapid relative humidity changes on fast filter-based aerosol-particle light-absorption measurements: uncertainties and correction schemes, Atmos. Meas. Tech., 12, 5879–5895, https://doi.org/10.5194/amt-12-5879-2019, 2019.
Emeis, S., Schaefer, K., and Muenkel, C.: Surface-based remote sensing of the mixing-layer height – a review, Meteorol. Z., 17, 621–630, https://doi.org/10.1127/0941-2948/2008/0312, 2008.
Ferrero, L., Mocnik, G., Ferrini, B. S., Perrone, M. G., Sangiorgi, G., and Bolzacchini, E.: Vertical profiles of aerosol absorption coefficient from micro-Aethalometer data and Mie calculation over Milan, Sci. Total Environ., 409, 2824–2837, https://doi.org/10.1016/j.scitotenv.2011.04.022, 2011.
Ferrero, L., Cappelletti, D., Busetto, M., Mazzola, M., Lupi, A., Lanconelli, C., Becagli, S., Traversi, R., Caiazzo, L., Giardi, F., Moroni, B., Crocchianti, S., Fierz, M., Močnik, G., Sangiorgi, G., Perrone, M. G., Maturilli, M., Vitale, V., Udisti, R., and Bolzacchini, E.: Vertical profiles of aerosol and black carbon in the Arctic: a seasonal phenomenology along 2 years (2011–2012) of field campaigns, Atmos. Chem. Phys., 16, 12601–12629, https://doi.org/10.5194/acp-16-12601-2016, 2016.
Gombi, C., Rahman, A., Hodovány, S., Magashegyi, I., Bozóki, Z., Szabó, G., and Ajtai, T.: A demonstrative study of a novel approach for spectral based source apportionment of ambient aerosols, Sci. Rep.-UK, 15, 19501, https://doi.org/10.1038/s41598-025-04022-3, 2025.
Gu, J. F. and Tan, Z. M.: Reconciling the discrepancies of equivalent potential temperatures in atmosphere: A general pathway rooted in entropy conservation, J. Adv. Model. Earth Sy., 17, e2025MS004985, https://doi.org/10.1029/2025MS004985, 2025.
Guagenti, M., Dexheimer, D., Ulinksi, A., Walter, P., Flynn III, J. H., and Usenko, S.: A modular approach to volatile organic compound samplers for tethered balloon and drone platforms, Atmos. Meas. Tech., 18, 2125–2136, https://doi.org/10.5194/amt-18-2125-2025, 2025.
Guan, X., Zhang, N. Y., Tian, P. F., Tang, C. G., Zhang, Z. D., Wang, L. G., Zhang, Y. S., Zhang, M., Guo, Y. M., Du, T., Cao, X. J., Liang, J. N., and Zhang, L.: Wintertime vertical distribution of black carbon and single scattering albedo in a semi-arid region derived from tethered balloon observations, Sci. Total Environ., 807, https://doi.org/10.1016/j.scitotenv.2021.150790, 2022.
Gutzler, D. S.: Climatic variability of temperature and humidity over the tropical western Pacific, Geophys. Res. Lett., 19, 1595–1598, https://doi.org/10.1029/92GL01579, 1992.
Hagler, G. S. W., Yelverton, T. L. B., Vedantham, R., Hansen, A. D. A., and Turner, J. R.: Post-processing Method to Reduce Noise while Preserving High Time Resolution in Aethalometer Real-time Black Carbon Data, Aerosol Air Qual. Res., 11, 539–546, https://doi.org/10.4209/aaqr.2011.05.0055, 2011.
Han, S. and Jang, M.: Modeling daytime and nighttime secondary organic aerosol formation via multiphase reactions of biogenic hydrocarbons, Atmos. Chem. Phys., 23, 1209–1226, https://doi.org/10.5194/acp-23-1209-2023, 2023.
Han, Y., Zhou, Y. W., Guo, J. P., Wu, Y. H., Wang, T. J., Zhuang, B. L., and Li, M. M.: The Characteristics of Spatial and Temporal Variations in the PBL during the Landfall of Tropical Cyclones across East China, J. Appl. Meteorol. Clim., 58, 1557–1572, https://doi.org/10.1175/JAMC-D-18-0131.1, 2019.
Hodnebrog, O., Myhre, G., and Samset, B. H.: How shorter black carbon lifetime alters its climate effect, Nat. Commun., 5, 7, https://doi.org/10.1038/ncomms6065, 2014.
Holzworth, G. C.: Estimates of mean maximum mixing depths in the contiguous united states, Mon. Weather Rev., 92, 235–242, https://doi.org/10.1175/1520-0493(1964)092<0235:EOMMMD>2.3.CO;2, 1964.
Kroll, J., Donahue, N., Jimenez, J. Kessler, S., Canagaratna, M., Wilson, K., Altieri, K., Mazzoleni, L., Wozniak, A., Bluhm, H., Mysak, E., Smith, J., Kolb, C., and Worsnop, D.: Carbon oxidation state as a metric for describing the chemistry of atmospheric organic aerosol, Nat. Chem., 133–139, https://doi.org/10.1038/nchem.948, 2011.
Kuang, Y., Luo, B., Huang, S., Liu, J., Hu, W., Peng, Y., Chen, D., Yue, D., Xu, W., Yuan, B., and Shao, M.: Formation of highly absorptive secondary brown carbon through nighttime multiphase chemistry of biomass burning emissions, Atmos. Chem. Phys., 25, 3737–3752, https://doi.org/10.5194/acp-25-3737-2025, 2025.
Kulmala, M., Cai, R., Stolzenburg, D., Zhou, Y., Dada, L., Guo, Y., Yan, C., Petäjä, T., Jiang, J., and Kerminen, V. M.: The contribution of new particle formation and subsequent growth to haze formation, Environ. Sci.: Atmos., 2, 352–361, https://doi.org/10.1039/D1EA00096A, 2022.
Kulmala, M., Kokkonen, T., Ezhova, E., Baklanov, A., Mahura, A., Mammarella, I., Bäck, J., Lappalainen, H. K., Tyuryakov, S., Kerminen, V., Zilitinkevich, S., and Petäjä, T.: Aerosols, Clusters, Greenhouse Gases, Trace Gases and Boundary-Layer Dynamics: on Feedbacks and Interactions, Bound.-Lay. Meteorol., 186, 475–503, https://doi.org/10.1007/s10546-022-00769-8, 2023.
Lata, N. N., Cheng, Z. Z., Dexheimer, D., Zhang, D. M., Mei, F., and China, S.: Vertical Gradient of Size-Resolved Aerosol Compositions over the Arctic Reveals Cloud Processed Aerosol in-Cloud and above Cloud, Environ. Sci. Technol., 57, 5821–5830, https://doi.org/10.1021/acs.est.2c09498, 2023.
Li, X. L., Ma, Y. J., Wang, Y. F., Wei, W., Zhang, Y. H., Liu, N. W., and Hong, Y.: Vertical Distribution of Particulate Matter and its Relationship with Planetary Boundary Layer Structure in Shenyang, Northeast China, Aerosol Air Qual. Res., 19, 2464–2476, https://doi.org/10.4209/aaqr.2019.06.0311, 2019.
Li, Y.: Study on Vertical Atmospheric Observation Based on Tethered Balloon Platform in Wuqing Aera[D], Chinese Research Academy of Environmental Sciences, Beijing, https://doi.org/10.27510/d.cnki.gzhky.2019.000016, 2019.
Liu, B., Wu, C., Ma, N., Chen, Q., Li, Y. W., Ye, J. H., Martin, S. T., and Li, Y. J.: Vertical profiling of fine particulate matter and black carbon by using unmanned aerial vehicle in Macau, China, Sci. Total Environ., 709, 136109, https://doi.org/10.1016/j.scitotenv.2019.136109, 2020.
Lu, Y., Zhu, B., Huang, Y., Shi, S. S., Wang, H. L., An, J. L., and Yu, X. N.: Vertical distributions of black carbon aerosols over rural areas of the Yangtze River Delta in winter, Sci. Total Environ., 661, 1–9, https://doi.org/10.1016/j.scitotenv.2019.01.170, 2019.
Mazzola, M., Busetto, M., Ferrero, L., Viola, A. P., and Cappelletti, D. A.: an atmospheric gondola for aerosol profiling, Rend. Lincei-Sci. Fis., 27, 105–113, https://doi.org/10.1007/s12210-016-0514-x, 2016.
Miffre, A., Anselmo, C., Geffroy, S., Fréjafon, E., and Rairoux, P.: Lidar remote sensing of laser-induced incandescence on light absorbing particles in the atmosphere, Opt. Express, 23, 2347–2360, https://doi.org/10.1364/OE.23.002347, 2015.
Moorthy, K. K., Babu, S. S., Sunilkumar, S. V., Gupta, P. K., and Gera, B. S.: Altitude profiles of aerosol BC, derived from aircraft measurements over an inland urban location in India, Geophys. Res. Lett., 31, https://doi.org/10.1029/2004GL021336, 2004.
Morgan, W. T., Allan, J. D., Bower, K. N., Capes, G., Crosier, J., Williams, P. I., and Coe, H.: Vertical distribution of sub-micron aerosol chemical composition from North-Western Europe and the North-East Atlantic, Atmos. Chem. Phys., 9, 5389–5401, https://doi.org/10.5194/acp-9-5389-2009, 2009.
Olson, M. R., Victiria, G. M., Robinson, M. A., Rooy, P. V., Dietenberger, M. A., Bergin, M., and Schauer, J. J.: Investigation of black and brown carbon multiple-wavelength-dependent light absorption from biomass and fossil fuel combustion source emissions, J. Geophys. Res.-Atmos., 120, 6682–6697, https://doi.org/10.1002/2014JD022970, 2015.
Panicker, A. S., Pandithurai, G., Safai, P. D., Dipu, S., Prabha, T. V., and Konwar, M.: Observations of black carbon induced semi direct effect over Northeast India, Atmos. Environ., 98, 685–692, https://doi.org/10.1016/j.atmosenv.2014.09.034, 2014.
Petäjä T., Järvi, L., Kerminen, V. M., Ding, A. J., Sun, J. N., Nie, W., Kujansuu, J., Virkkula, A., Yang, X. Q., Fu, C. B., Zilitinkevich, S., and Kulmala, M.: Enhanced air pollution via aerosol-boundary layer feedback in China, Sci. Rep.-UK, 6, 18998, https://doi.org/10.1038/srep18998, 2016.
Qi, S. F., Zhao, S. P., Yu, Y., and Kang, S. C.: Optical properties of carbonaceous aerosols and source impacts in the Lanzhou valley: In-situ observations by means of topographical relief, Urban Clim., 59, 102302, https://doi.org/10.1016/j.uclim.2025.102302, 2025a.
Qi, S. F., Zhao, S. P., Yu, Y., Dong, L. X., Zhang, T., Zhao, G., Li, J. L, Zhang, X., and Lv, Y. T.: Measurement report: Impacts of Thermodynamic and Dynamic Processes on the Vertical Distribution of Carbonaceous Aerosols: lessons from in-situ observations at eastern foothills of LiuPan Mountains, Loess Plateau, Zenodo [data set], https://doi.org/10.5281/zenodo.17947573, 2025b.
Ramanathan, V. and Carmichael, G.: Global and regional climate changes due to black carbon, Nat. Geosci., 1, 221–227, https://doi.org/10.1038/ngeo156, 2008.
Ran, L., Deng, Z., Xu, X., Yan, P., Lin, W., Wang, Y., Tian, P., Wang, P., Pan, W., and Lu, D.: Vertical profiles of black carbon measured by a micro-aethalometer in summer in the North China Plain, Atmos. Chem. Phys., 16, 10441–10454, https://doi.org/10.5194/acp-16-10441-2016, 2016.
Samad, A., Vogt, U., Panta, A., and Uprety, D.: Vertical distribution of particulate matter, black carbon and ultra-fine particles in Stuttgart, Germany, Atmos. Pollut. Res., 11, 1441–1450, https://doi.org/10.1016/j.apr.2020.05.017, 2020.
Samset, B. H. and Myhre, G., Vertical dependence of black carbon, sulphate and biomass burning aerosol radiative forcing, Geophys. Res. Lett., 38, 5, https://doi.org/10.1029/2011GL049697, 2011.
Schwarz, J. P., Weinzierl, B., Samset, B. H., Dollner, M., Heimerl, K., Markovic, M. Z., Perring, A. E., and Ziemba, L., Aircraft measurements of black carbon vertical profiles show upper tropospheric variability and stability, Geophys. Res. Lett., 44, 1132–1140, https://doi.org/10.1002/2016GL071241, 2017.
Seibert, P., Beyrich, F., Gryning, S. E., Joffre, S., Rasmussen, A., and Tercier, P.: Review and intercomparison of operational methods for the determination of the mixing height, Atmos. Environ., 34, 1001–1027, https://doi.org/10.1016/S1352-2310(99)00349-0, 2000.
Seidel, D. J., Ao, C. O., and Li, K.: Estimating climatological planetary boundary layer heights from radiosonde observations: Comparison of methods and uncertainty analysis, J. Geophys. Res.-Atmos., 115, D16113, https://doi.org/10.1029/2009JD013680, 2010.
Shi, S. S., Zhu, B., Lu, W., Yan, S. Q., Fang, C. W., Liu, X. H., Liu, D. Y., and Liu, C., Estimation of radiative forcing and heating rate based on vertical observation of black carbon in Nanjing, China, Sci. Total Environ., 756, 11, https://doi.org/10.1016/j.scitotenv.2020.144135, 2021.
Sun, X. Y., Zhou, Y., Zhao, T. L., Fu, W. K., Wang, Z., Shi, C. N., Zhang, H., Zhang, Y. Q., Yang, Q. J., and Shu, Z. Z.: Vertical distribution of aerosols and association with atmospheric boundary layer structures during regional aerosol transport over central China, Environ. Pollut., 362, 124967, https://doi.org/10.1016/j.envpol.2024.124967, 2024.
Wang, D. F., Huo, J. T., Duan, Y. S., Zhang, K., Ding, A. J., Fu, Q. Y., Luo, J. H., Fei, D. N., Xiu, G. L., and Huang, K.: Vertical distribution and transport of air pollutants during a regional haze event in eastern China: A tethered mega-balloon observation study, Atmos. Environ., 246, 118039, https://doi.org/10.1016/j.atmosenv.2020.118039, 2021a.
Wang, H. C., Wang, H. L., Lu, X., Lu, K. D., Zhang, L., Tham, Y. J., Shi, Z. B., Aikin, K., Fan, S. J., Brown, S. S., and Zhang, Y. H.: Increased night-time oxidation over China despite widespread decrease across the globe, Nat. Geosci., 16, 217–223, https://doi.org/10.1038/s41561-022-01122-x, 2023.
Wang, H. L., Liu, A. K., Zhen, Z. X., Yin, Y., Li, B., Li, Y. Y., Chen, K., and Xu, J. P.: Vertical Structures of Meteorological Elements and Black Carbon at Mt. Tianshan Using an Unmanned Aerial Vehicle System, Remote Sens.-Basel, 13, 1267, https://doi.org/10.3390/rs13071267, 2021b.
Wang, M., Xu, B. Q., Yang, S., Gao, J., Zhang, T. H., He, Z. Q., Kobal, M., and Hansen, A. D. A.: Black carbon profiles from tethered balloon flights over the southeastern Tibetan Plateau, Chinese Sci. Bull., 64, 2949–2958, https://doi.org/10.1360/TB-2019-0101, 2019.
Wang, Q., Sun, Y., Xu, W., Du, W., Zhou, L., Tang, G., Chen, C., Cheng, X., Zhao, X., Ji, D., Han, T., Wang, Z., Li, J., and Wang, Z.: Vertically resolved characteristics of air pollution during two severe winter haze episodes in urban Beijing, China, Atmos. Chem. Phys., 18, 2495–2509, https://doi.org/10.5194/acp-18-2495-2018, 2018a.
Wang, Y. Q.: MeteoInfo: GIS software for meteorological data visualization and analysis, Meteorol. Appl., 21, 360–368, https://doi.org/10.1002/met.1345, 2014.
Wang, Z., Huang, X., and Ding, A.: Dome effect of black carbon and its key influencing factors: a one-dimensional modelling study, Atmos. Chem. Phys., 18, 2821–2834, https://doi.org/10.5194/acp-18-2821-2018, 2018b.
Wendisch, M., Hellmuth, O., Ansmann, A., Heintzenberg, J., Engelmann, R., Althausen, D., Eichler, H., Müller, D., Hu, M., and Zhang, Y.: Radiative and dynamic effects of absorbing aerosol particles over the Pearl River Delta, China, Atmos. Environ., 42, 6405–6416, https://doi.org/10.1016/j.atmosenv.2008.02.033, 2008.
WMO/GAW: Aerosol measurement procedures guidelines and recommendations, 2nd edn., GAW Rep. 227, World Meteorological Organisation, Geneva, Switzerland, https://library.wmo.int/doc_num.php?explnum_id=3073 (last access: 9 February 2026), 2016.
Wu, C. and Yu, J. Z.: Determination of primary combustion source organic carbon-to-elemental carbon (OC / EC) ratio using ambient OC and EC measurements: secondary OC-EC correlation minimization method, Atmos. Chem. Phys., 16, 5453–5465, https://doi.org/10.5194/acp-16-5453-2016, 2016.
Wu, C., Liu, B., Wu, D., Yang, H. L., Mao, X., Tan, J., Liang, Y., Sun, J. Y., Xia, R., Sun, J. R., He, G. W., Li, M., Deng, T., Zhou, Z., and Li, Y. J.: Vertical profiling of black carbon and ozone using a multicopter unmanned aerial vehicle (UAV) in urban Shenzhen of South China, Sci. Total Environ., 801, https://doi.org/10.1016/j.scitotenv.2021.149689, 2021.
Xie, C., Xu, W., Wang, J., Wang, Q., Liu, D., Tang, G., Chen, P., Du, W., Zhao, J., Zhang, Y., Zhou, W., Han, T., Bian, Q., Li, J., Fu, P., Wang, Z., Ge, X., Allan, J., Coe, H., and Sun, Y.: Vertical characterization of aerosol optical properties and brown carbon in winter in urban Beijing, China, Atmos. Chem. Phys., 19, 165–179, https://doi.org/10.5194/acp-19-165-2019, 2019.
Yang, X. Y., Ji, D. S., Li, J. W., He, J., Gong, C. S., Xu, X. J., Wang, Z., Liu, Y., Bi, F., Zhang, Z. Z., and Chen, Y. B.: Impacts of springtime biomass burning in Southeast Asia on atmospheric carbonaceous components over the Beibu Gulf in China: Insights from aircraft observations, Sci. Total Environ., 857, 10, https://doi.org/10.1016/j.scitotenv.2022.159232, 2023.
Yang, Y., Zhao, D. L., Huang, Y., Tian, P., Liu, D. T., Huang, M. Y., He, H., Ding, D. P., Li, Y. Y., and Zhao, C.: Effects of black carbon aerosol on air quality and vertical meteorological factors in early summer in Beijing, Sci. Total Environ., 847, 10, https://doi.org/10.1016/j.scitotenv.2022.157529, 2022.
Zarzycki, C. M. and Bond, T. C.: How much can the vertical distribution of black carbon affect its global direct radiative forcing, Geophys. Res. Lett., 37, https://doi.org/10.1029/2010GL044555, 2010.
Zawadzka, O., Posyniak, M., Nelken, K., Markuszewski, P., Chilinski, M. T., Czyzewska, D., Lisok, J., and Markowicz, K. M.: Study of the vertical variability of aerosol properties based on cable cars in-situ measurements, Atmos. Pollut. Res., 8, 968–978, https://doi.org/10.1016/j.apr.2017.03.009, 2017.
Zhang, H. S., Zhang, X. Y., Li, Q. H., Cai, X. H., Fan, S. J., Song, Y., Hu, F., Che, H. Z., Quan, J. N., Kang, L., and Zhu, T.: Research progress on estimation of atmospheric boundary layer height, Acta Meteorol. Sin., 78, 522–536, https://doi.org/10.11676/qxxb2020.044, 2020.
Zhang, Y. Z., Forrister, H., Liu, J. M., Dibb, J., Anderson, B., Schwarz, J. P., Perring, A. E., Jimenez, J. L., Campuzano-Jost, P., Wang, Y. H., Nenes, A., and Weber, R. J.: Top-of-atmosphere radiative forcing affected by brown carbon in the upper troposphere, Nat. Geosci., 10, 486, https://doi.org/10.1038/NGEO2960, 2017.
Zhao, D., Xin, J., Gong, C., Quan, J., Wang, Y., Tang, G., Ma, Y., Dai, L., Wu, X., Liu, G., and Ma, Y.: The impact threshold of the aerosol radiative forcing on the boundary layer structure in the pollution region, Atmos. Chem. Phys., 21, 5739–5753, https://doi.org/10.5194/acp-21-5739-2021, 2021.
Zhao, S., Qi, S., Yu, Y., Kang, S., Dong, L., Chen, J., and Yin, D.: Measurement report: Contrasting elevation-dependent light absorption by black and brown carbon: lessons from in situ measurements from the highly polluted Sichuan Basin to the pristine Tibetan Plateau, Atmos. Chem. Phys., 22, 14693–14708, https://doi.org/10.5194/acp-22-14693-2022, 2022.
Zhao, S. P., Yu, Y., Yin, D. Y., Yu, Z. S., Dong, L. X., Mao, Z. L., He, J. J., Yang, J. C., Li, P., and Qin, D. H.: Concentrations, optical and radiative properties of carbonaceous aerosols over urban Lanzhou, a typical valley city: Results from in-situ observations and numerical model, Atmos. Environ., 213, 470–484, https://doi.org/10.1016/j.atmosenv.2019.06.046, 2019.
Zhao, S. P., He, J. J., Dong, L. X., Qi, S. F., Yin, D. Y., Chen, J. B., and Yu, Y.: Contrasting Vertical Circulation between Severe and Light Air Pollution inside a Deep Basin Results from the Collaborative Experiment of 3D Boundary-Layer Meteorology and Pollution at the Sichuan Basin (BLMP-SCB), B. Am. Meteorol. Soc., 104, E411–E434, https://doi.org/10.1175/BAMS-D-22-0150.1, 2023a.
Zhao, S. P., Yu, Y., He, J. J., Dong, L. X., and Qi, S. F.: A New Physical Mechanism of Rainfall Facilitation to New Particle Formation, Geophys. Res. Lett., 51, e2023GL106842, https://doi.org/10.1029/2023GL106842, 2023b.
Zieger, P., Fierz-Schmidhauser, R., Weingartner, E., and Baltensperger, U.: Effects of relative humidity on aerosol light scattering: results from different European sites, Atmos. Chem. Phys., 13, 10609–10631, https://doi.org/10.5194/acp-13-10609-2013, 2013.