
the Creative Commons Attribution 4.0 License.
the Creative Commons Attribution 4.0 License.
 | 02 Sep 2026
Revisiting the critical role of stabilized Criegee intermediates (sCIs) in sulfuric acid formation: coupling mechanistic updates with interpretable machine learning
Yuhuan Zhu
Qiang Chen

Luyan He
Chunlin Shang
Li Jiang
Donghong Guan
Guirong Yao
Wenkai Guo
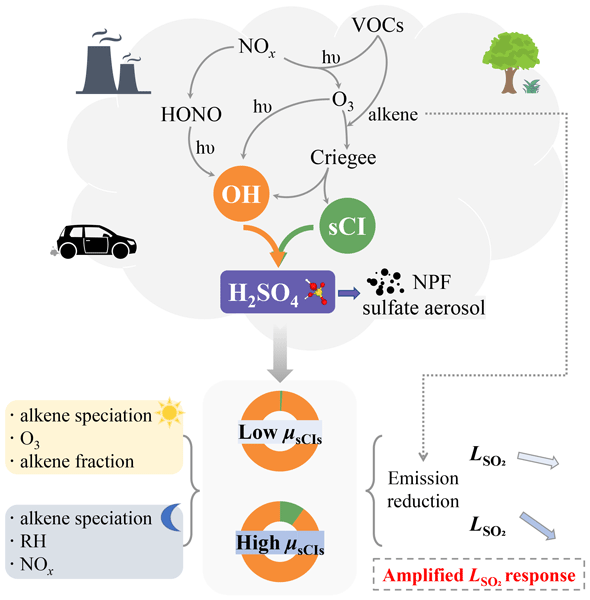
Sulfuric acid, formed via gas-phase SO2 oxidation, drives new particle formation and secondary sulfate aerosol under low relative humidity (RH). Beyond the well-established OH-mediated pathway, stabilized Criegee intermediates (sCIs) from alkene ozonolysis provide an additional SO2 oxidation route whose rate () and fractional contribution (μsCIs) vary markedly across environments. Although prior studies have documented this spatiotemporal heterogeneity, quantifying the individual factor contributions governing these differences remains lacking. Furthermore, because sCI and OH formation share common precursors yet differ mechanistically, μsCIs can alter the sensitivity of total SO2 oxidation () to precursor variations, but the magnitude of this influence remains unclear. Here, we updated Criegee-related reactions in MCM v3.3.1 following recent IUPAC recommendations, conducted extensive AtChem box-model simulations, and trained interpretable XGBoost surrogate models to attribute and μsCIs to their controlling factors and examine how μsCIs regimes modulate sensitivity. was primarily controlled by RH and isoprene. The dominant drivers of μsCIs differed between day and night: daytime factors included alkene speciation, O3, and the alkene fraction in VOCs; nighttime factors included alkene speciation, RH, and NOx. Under high-μsCIs regimes, positive responses to O3, VOCs, and alkene fraction were consistently amplified relative to low-μsCIs regimes. Field observation-based modeling of a summer episode in Wuhai supported these regime-dependent patterns. These findings indicate that reducing VOC emissions provides a more effective mechanism for regulating sulfuric acid formation under conditions with active alkene ozonolysis.
- Article
(9082 KB) - Full-text XML
-
Supplement
(1390 KB) - BibTeX
- EndNote


The environmental and climatic impacts of fine particulate matter (PM2.5) are strongly influenced by sulfate aerosol (SO), which plays a key role in regulating aerosol acidity (Yao et al., 2018), hygroscopicity (Gunthe et al., 2011), and direct radiative forcing (Quaas et al., 2022). Although a minor fraction of particulate sulfate is directly emitted from anthropogenic sources such as coal and biomass combustion (Dai et al., 2019), industrial activities (Song et al., 2025), and transportation (Cao et al., 2025), it is formed predominantly from the atmospheric oxidation of sulfur dioxide (SO2) via gas-phase, aqueous-phase, and heterogeneous pathways (Ye et al., 2023). During severe haze events, elevated relative humidity and aerosol loadings significantly enhance aqueous-phase and heterogeneous SO2 oxidation. These multiphase processes dominate sulfate formation and have therefore been the focus of extensive mechanistic investigations (Cao et al., 2021). Nevertheless, the gas-phase oxidation of SO2 remains critically important because its product, sulfuric acid (H2SO4), is a key precursor for atmospheric new particle formation (NPF). Atmospheric nucleation and the subsequent growth of newly formed particles represent a major source of aerosol particles in terms of number concentration, and NPF has been frequently observed even in highly polluted urban environments characterized by strong condensation sinks (Yao et al., 2018). Moreover, over the past decade, stringent emission-control policies in East Asia, particularly in China, have substantially reduced PM2.5 concentrations (Geng et al., 2021), thereby weakening conditions favorable for aqueous-phase and heterogeneous sulfate formation. In this progressively cleaner atmosphere, the relative importance of gas-phase pathways is expected to increase (Wang et al., 2025). Therefore, under increasingly stringent air pollution control targets (WHO, 2021), the role of SO2 gas-phase oxidation pathways in secondary aerosol production is expected to become more important and warrants further investigation.
Hydroxyl radicals (OH) have long been recognized as the dominant oxidant in gas-phase SO2 oxidation. Since the pioneering work of Cox and Penkett (1971) first demonstrated that Criegee intermediates (CIs, zwitterionic carbonyl oxides) react with SO2 in the gas phase, extensive laboratory and theoretical studies (Taatjes et al., 2013; Vereecken et al., 2012) have advanced understanding of the formation, stabilization, and fate of CIs. Stabilized Criegee intermediates (sCIs) are therefore increasingly considered an important complementary pathway for gas-phase SO2 oxidation and a potentially significant contributor to H2SO4 formation. Multiple field observational studies conducted in the boreal forests in Finland (Mauldin et al., 2012), the SMEAR II station in Finland and the Hohenpeissenberg station in Germany (Boy et al., 2013), in urban Beijing (Guo et al., 2021), and at a remote Mediterranean site strongly influenced by biogenic VOC emissions (Kukui et al., 2021) suggest that sCIs can provide an additional, environment-dependent pathway for SO2 oxidation. Notably, as the direct measurement of atmospheric sCIs concentrations remains a formidable challenge, observational studies have primarily relied on the analysis of precursors and OH radical concentrations to provide qualitative evidence. Consequently, numerical simulations grounded in CIs chemical kinetics are indispensable for quantifying the contribution of sCIs to the gas-phase SO2 oxidation rate.
To date, numerical modeling studies have extensively evaluated the contribution of sCIs to SO2 oxidation across a broad range of spatial scales and environmental conditions. For instance, utilizing a steady-state approximation, Khan et al. (2017) estimated that the OH-driven SO2 oxidation rate in urban London (0.64 Tg yr−1) was approximately 17 times that of the sCI pathway (37.6 Gg yr−1). However, proxy calculations of H2SO4 concentrations have revealed pronounced regional disparities: at the semi-pristine boreal forest site in Hyytiälä, the photochemical pathway (SO2 + OH) and the alkene ozonolysis pathway (SO2 + sCIs) accounted for approximately 34 % and 60 % of H2SO4 production, respectively, whereas in heavily polluted Beijing, the corresponding proportions shifted to 28 % and 22 % (Dada et al., 2020). Vereecken et al. (2017) predicted that in equatorial regions, the contribution of sCIs to the gas-phase conversion of SO2 to sulfuric acid could reach up to 75 %. Furthermore, simulations using the STOCHEM-CRI global atmospheric chemistry and transport model demonstrated (Khan et al., 2018) that the SO2 oxidation contribution from sCIs significantly exceeds that of OH radicals in terrestrial rainforests and high-latitude boreal forests. This pronounced variability is primarily driven by two intertwined factors. First, considerable uncertainty in numerical simulations arises from inherent limitations in our understanding of CIs chemical kinetics. With continuous breakthroughs in monitoring technologies, the scientific understanding of CI evolution processes is dynamically evolving, resulting in discrepancies in the reaction rate coefficients incorporated into models across different periods. Notably, the unimolecular decomposition rates of CIs/sCIs and the bimolecular reaction rates of sCIs with water monomers and dimers (H2O/(H2O)2) exert a decisive influence on numerical calculations (Sarwar et al., 2014). For example, a modeling study under summer conditions in the eastern United States demonstrated that once the competitive reaction between sCIs and H2O/(H2O)2 was introduced, the sCI-driven enhancement in surface sulfate plummeted from 18 % to less than 0.5 % (Li et al., 2013). Similarly, in simulations of nocturnal power plant plumes in the southeastern US, whether CI thermal decomposition was considered led to a seven-fold difference in the estimated contribution to secondary sulfate aerosol (SSA) formation (Meidan et al., 2019). Second, pronounced regional heterogeneity in precursor composition, such as biogenic isoprene and monoterpenes in forested regions and complex anthropogenic alkene mixtures in urban areas, together with differences in relative humidity and NOx levels, leads to highly variable sCI production and scavenging fluxes. While existing studies have made progress in quantifying the contribution of sCIs to gas-phase SO2 oxidation in specific environments and identifying their precursors, the relationship between sCIs and their precursors remains unclear. Consequently, a systematic understanding of the critical driving factors dictating the relative contribution of sCIs is still lacking. Moreover, the production and loss processes of OH and sCIs are not mutually independent; rather, they are deeply coupled within the underlying chemical mechanisms (Lu et al., 2019). This coupled nature dictates that when evaluating the drivers controlling the contribution of the sCIs + SO2 pathway, their concurrent impacts on the OH + SO2 pathway and the overall SO2 oxidation rate cannot be overlooked. Fundamentally, the interplay between precursor abundances and competitive sinks determines the fractional contribution of the sCIs pathway. Yet, how this interplay shapes the sensitivity of the total gas-phase SO2 oxidation to environmental drivers has received remarkably little attention. In particular, it remains elusive how the dominant controlling factors and their directional impacts shift as the atmospheric gas-phase SO2oxidation regime transitions from being strictly OH-dominated to being co-driven by both OH and sCIs.
To this end, this study presents a systematic assessment of the role of sCIs in atmospheric SO2 gas-phase oxidation. As a prerequisite for all subsequent analyses, we first updated the gas-phase kinetics of Criegee intermediates in the Master Chemical Mechanism (MCM v3.3.1, via website: https://mcm.york.ac.uk, last access: 28 August 2026) using the latest evaluated rate coefficients recommended by the International Union of Pure and Applied Chemistry (IUPAC), thereby minimizing the propagation of mechanistic uncertainties into our conclusions. Utilizing an atmospheric box model coupled with this revised mechanism, we integrated interpretable machine learning techniques to quantify the importance of key controlling factors on sCI-mediated SO2oxidation. Building on this insight, we employed a robust experimental design to construct a machine learning surrogate model capable of predicting sCI contributions across diverse and highly variable environmental conditions. Furthermore, analytical methods, including SHAP, Sobol sensitivity analysis, Partial Dependence Plots (PDPs), and individual conditional expectation (ICE) plots, were utilized to quantify how these factors dictate the relative contribution of sCIs, and to elucidate the differential sensitivities of total SO2 oxidation under high- and low-sCI contribution regimes. Finally, leveraging online hourly observational data of atmospheric pollutants, we assessed the disparities in their sensitivity relationships with SO across varying sCI contribution levels, ultimately validating the reliability of our box model-derived surrogate model.
2.1 Updates to alkene ozonolysis and Criegee intermediate chemistry in MCM v3.3.1
The Master Chemical Mechanism (MCM v3.3.1; available at http://mcm.york.ac.uk, last access: 28 August 2026) is a near-explicit chemical mechanism that describes the gas-phase oxidation of 143 volatile organic compounds (VOCs) to carbon dioxide (CO2) and water (H2O). In MCM v3.3.1, the rate coefficients and associated reaction mechanisms for alkene ozonolysis reactions follow the recommendations of Jenkin et al. (1997, 2015) and Saunders et al. (2003). Although this mechanism provides a detailed representation of CI formation, loss, and subsequent chemical evolution, several key rate coefficients and parameters differ substantially from the latest IUPAC recommendations (Cox et al., 2020). In addition, several important processes are not explicitly represented, including the specific fates of CIs, the unimolecular decomposition of sCIs, the reactions of sCIs with water dimers ((H2O)2), and the distinct reactivities of sCI stereoisomers. To address these limitations, we updated the gas-phase alkene + O3 chemistry in MCM v3.3.1 primarily in accordance with current IUPAC recommendations. The updates include the alkene ozonolysis rate coefficients (kO3+alkene), OH yields (Yi,OH), sCI yields (Yi,sCI), and sCI bimolecular reaction rate coefficients (kb), as well as accounting for sCI unimolecular decomposition pathways and adding sCI + (H2O)2 reactions. Where IUPAC provides temperature-dependent kinetic expressions, these were adopted; in addition, a temperature-dependent rate expression was incorporated for the CH2OO + SO2 reaction, based on Onel et al. (2021). Specifically, the branching ratios for the unimolecular decomposition or isomerization pathways of CIs and sCIs were constrained using reported OH yields and the yields of other relevant products. For sCIs exhibiting stereoisomerism, including CH3CHOO, C2H5CHOO, and the C4 intermediates formed during isoprene ozonolysis, the Z-stereoisomers were assumed to undergo predominantly rapid unimolecular decomposition under tropospheric conditions, such that their contribution to bimolecular reactions was considered negligible (Newland et al., 2015). Accordingly, in the updated mechanism, hereafter denoted MCM v3.3.1g, stereoisomeric sCIs participating in bimolecular reactions are represented explicitly by their E-stereoisomers. The unimolecular decomposition pathways of sCIs were considered together with the decomposition or isomerization channels of their corresponding chemically activated CIs. The kinetic parameters and product yields for the alkene ozonolysis reactions before and after the updates are summarized in Tables S1 and S2 in the Supplement. The complete set of updated reaction equations, together with the corresponding rate coefficients and explicit branching ratios, is provided in Table S3. These updates were applied to C1–C4 Criegee intermediates, which are widely recognized to play a critical role in tropospheric chemistry.
The concentration of (H2O)2 is determined by assuming rapid thermal equilibrium between water monomers and dimers. Given this fast atmospheric exchange, the dimer concentration is considered to be in thermodynamic equilibrium with the monomer, as expressed in Eq. (1):
where is the temperature-dependent equilibrium constant for dimer formation (Scribano et al., 2006). Following the methodology of Lade et al. (2024), the reaction of sCIs with water dimers is parameterized using an effective third-order rate coefficient, keff (cm6 molec.−2 s−1), and the rate of sCI loss via reaction with water dimers, , is given by Eq. (2):
where keff is defined as the product of the bimolecular rate coefficient for the sCI + (H2O)2 reaction (kb,dimer, cm3 molec.−1 s−1) and . To calculate accurately, thermochemical data were retrieved from the Active Thermochemical Tables (ATcT). Standard Gibbs free energies of formation () for both the water monomer and dimer were extracted from Tables 1 and 3 in Ruscic (2013). These discrete data points were then used to calculate the reaction Gibbs free energy () over the temperature range of 200–360 K, which spans typical tropospheric conditions. The temperature dependence of was subsequently obtained via a linear regression of as a function of , yielding the following empirical van't Hoff–type parameterization in Eq. (3):
where the coefficients A and B represent the intercept and slope, respectively, derived from the fitting procedure, with cm3 molec.−1 and B=1549.32 K.
2.2 Box model configuration and observation data
2.2.1 AtChem model setup and chemical diagnostics
AtChem (Sommariva et al., 2020), an open-source zero-dimensional atmospheric box model, was used in this study to simulate the gas-phase chemical evolution of SO2, CIs, and their precursors. The AtChem model is coupled with MCM v3.3.1 and MCM v3.3.1g (see Sect. 2.1). H2O concentrations for sCI loss reactions were calculated from relative humidity, temperature, and atmospheric pressure.
Two types of AtChem simulations were performed in this study. The first used an unconstrained configuration, in which the initial concentrations of selected chemical species were prescribed and allowed to evolve according to the chemical mechanism without time-varying constraints. This configuration was used in Sect. 3.1 to quantify the oxidation capacity of sCIs derived from the ozonolysis of specific alkenes, including ethene, propene, but-1-ene, trans-but-2-ene, cis-but-2-ene, 2-methylpropene, and isoprene. The second used a constrained configuration, in which selected trace gases, meteorological parameters, and photolysis frequencies were prescribed as hourly time-varying inputs from observational data or designed perturbation scenarios. This configuration was used in Sect. 3.2 and 3.3 to evaluate the role of sCIs in gas-phase SO2 oxidation under atmospherically relevant conditions. A spin-up period of 2–3 d was implemented to initialize reactive free radicals and intermediates, such as OH, HO2, RO2, and sCIs, allowing them to reach realistic steady-state concentrations.
Chemical production and loss rates were quantified using the Rate of Production/Destruction Analysis (ROPA/RODA) within AtChem. The gas-phase SO2 oxidation rate by sCIs was defined according to Eq. (4):
where i denotes an individual sCI species. The OH-driven SO2 oxidation rate was defined as in Eq. (5):
The total gas-phase SO2 oxidation rate and the fractional sCI contribution were then calculated as in Eqs. (6) and (7):
here, and μsCIs provide complementary perspectives on the absolute rate and fractional contribution, respectively, of the sCI pathway.
2.2.2 Observation data
The observational data used in this study were obtained from the automatic monitoring system at the Wuhai City Atmospheric Environment Super Monitoring Station from 9 October 2019 to 30 June 2022. Wuhai is a semi-arid coal-chemical industrial city in Inner Mongolia, China, characterized by relatively high emissions of SO2 and anthropogenic VOCs (including alkenes), frequent O3 pollution, and comparatively dry atmospheric conditions. The dataset includes air pollutants (PM2.5, carbon monoxide (CO), SO2, nitric oxide (NO), nitrogen dioxide (NO2), and ozone (O3)), meteorological variables (wind speed (WS), temperature (T), pressure (P), and relative humidity (RH)), water-soluble inorganic ions (including NO and SO), elemental components (including Fe), VOCs, and photolysis frequencies. PM2.5, NO, NO2, SO2, CO, and O3 were measured using a Metone BAM-1020 PM2.5 Monitor, an API T201 NH3–NOx Analyzer, an API T100 SO2 Analyzer, an API T300 CO Analyzer, and an API T400 O3 Analyzer, respectively. VOCs were measured using an ENTECH BCT-7800 VOCs Analyzer. Water-soluble inorganic ions were measured using a Metrohm MARGA ADI 2080 online ion chromatograph, and elemental components were measured using a CES Xact-625 atmospheric heavy metal analyzer. Meteorological variables (T, RH, P, WS) were measured using a Lufft WS601-UMB six-parameter meteorological sensor. Photolysis frequencies were measured using a Metcon UF-CCD photolysis spectroradiometer. The observational data had an hourly time resolution and were screened for invalid values. Short missing intervals were linearly interpolated when appropriate, whereas longer gaps were excluded from the analysis.
2.3 Machine learning model and interpretation framework
An interpretable machine learning (ML) framework was developed in this study to systematically evaluate the role of sCIs in SO2 oxidation, encompassing model development, validation, and interpretation. The learning algorithm used throughout was Extreme Gradient Boosting (XGBoost) (Chen and Guestrin, 2016), which constructs an additive ensemble of regression trees by iteratively minimizing a regularized loss function, with each successive tree fitted to the negative gradients (i.e., pseudo-residuals) of the current ensemble's predictions. This formulation enables nonlinear responses and predictor interactions to be represented far more flexibly than a single regression tree. Regularization, subsampling, cross-validation, and early stopping were applied to suppress overfitting, and hyperparameters were tuned via random search or Bayesian optimization. The same sampling–training–testing workflow was applied to every model in this study. Two classes of XGBoost models were constructed (using the XGBoost Python package, version 2.1.3; https://github.com/dmlc/xgboost, last access: 28 August 2026): surrogate models trained on AtChem-simulated chemical evolution, and an observation-based model trained on ambient measurements. Four complementary interpretation methods were used to explain the XGBoost model outputs: SHAP (SHapley Additive exPlanations), Sobol sensitivity analysis, partial dependence plots (PDPs), and individual conditional expectation (ICE) plots.
2.3.1 Model development details
Three surrogate models were developed based on SO2 gas-phase oxidation simulations from AtChem to successively quantify the key controls on sCI-mediated SO2 oxidation, identify the atmospheric conditions under which the sCI pathway becomes important, and examine how this importance affects the sensitivity of total SO2 oxidation. An observation-based model was developed to assess whether the sensitivities inferred from the surrogate models are also reflected in ambient measurements. These XGBoost models are introduced in turn below.
First, a surrogate model was developed to emulate the sCI-mediated SO2 oxidation rate (), with SHAP analysis applied to diagnose the contributions of its key controlling factors, namely the principal sCI precursors and competing sinks (most notably NO2, H2O, and (H2O)2). The feature set therefore comprises O3, RH, NO2, and six alkene precursors: ethene, propene/but-1-ene, trans-but-2-ene, cis-but-2-ene, 2-methylpropene, and isoprene, where propene and but-1-ene are merged into a single feature owing to the close similarity of their ozonolysis mechanisms. To capture individual perturbations and interactions across all features, 3898 simulation scenarios were designed spanning the prescribed feature ranges. In each scenario, the feature values prescribed the initial input concentrations for a 1 h unconstrained AtChem simulation, with SO2 held constant; the mean over the simulated hour, obtained under both MCM v3.3.1 and v3.3.1g, served as the target output. The resulting feature matrix and corresponding simulation outputs together constitute the training dataset for the surrogate model. The prescribed feature ranges, full scenario design, training details, and model performance are provided in Sect. S1 in the Supplement. Note that in all simulation scenarios, temperature and pressure were held constant at T=290 K and P=888 hPa. Temperature-dependent results for the full scenario set are provided in Sect. S4.
Second, to identify the atmospheric conditions that favor sCI contribution to total gas-phase SO2 oxidation, a surrogate model was developed to predict the fractional importance of the sCI pathway (μsCIs), combined with Sobol sensitivity analysis, PDPs, and ICE plots. Unlike , which depends solely on sCI production and loss, μsCIs is also governed by the parallel OH-mediated oxidation pathway and therefore requires a feature set that captures both sCI and OH chemistry. Accordingly, the feature set comprises O3, NOx, NO2 fraction (NO2 % = NO2/NOx), total VOC concentration (VOCs), alkene fraction (alkene % = ∑alkenes/VOC), RH, and the Aggregated Reactivity Index (ARI). The NOx–NO2 % and VOC–alkene % pairs jointly characterize the oxidant state and reactive VOC composition while minimizing multicollinearity among features. ARI is an ordinal variable encoding the sCI-oxidation potential of the prevailing alkene mixture, derived directly from the importance ranking of alkene features established by the surrogate model. The training samples generated for this surrogate differ from those of the model. Rather than prescribing initial concentrations, the feature values here represent normalized scaling factors applied to time-varying constraints, as the AtChem model was run in a constrained configuration. The baseline constraints are the three-year mean diurnal cycles of hourly observations at the Wuhai supersite (Sect. 2.2.2), and the perturbation range of each feature spans the 5th–95th percentile range of the observed concentrations (normalized range is [0, 1]); ARI, as an ordinal discrete variable, is the sole exception and takes integer values of 0, 1, or 2, corresponding to the three tiers of sCI-oxidation potential. Because photolysis frequencies play a decisive role in OH production and radical cycling, daytime and nighttime conditions were treated as entirely separate modeling problems, with target time periods of 08:00–18:00 and 22:00–05:00 LT, respectively. For each scenario, the constraints of the target period were adjusted according to the prescribed feature values, while all remaining constraints (non-feature variables) were held at baseline (Fig. S2 in the Supplement); a constrained AtChem simulation under MCM v3.3.1g then yielded the mean μsCIs and over the target period as the target outputs. The resulting feature matrix and simulated μsCIs values together constitute the training datasets for the daytime and nighttime μsCIs surrogate models. These daytime and nighttime datasets were then each divided into low- and high-μsCIs subsets based on the median μsCIs value, and a further pair of surrogate models was developed to predict separately in each regime, combined with partial dependence analysis to assess whether the sensitivity of to each feature depends on the relative importance of the sCI pathway. The baseline constraints, the mapping from normalized feature values to constraint magnitudes, full scenario design, training details, and model performance are provided in Sect. S2.
Finally, to assess whether the regime-dependent sensitivities inferred from the surrogate models are also expressed in the real atmosphere, we developed an observation-based model trained on ambient observations from the Wuhai supersite (9 October 2019 to 30 June 2022, hourly resolution) to predict SO. The features, including PM2.5, NO, SO2, O3, total VOCs, alkene %, NOx, NO2 %, RH, wind speed, and Fe, were selected to represent sulfate aerosol precursor abundance, photochemical oxidation capacity, aerosol loading, secondary inorganic aerosol formation, meteorological conditions, and gas-phase and aqueous-phase oxidation pathways. SHAP analysis was applied to evaluate the differential contributions of key features to SO under contrasting μsCIs regimes, enabling comparison with the regime-dependent sensitivities diagnosed from the AtChem-based surrogate models. Training details and model performance are provided in Sect. S3.
2.3.2 Model interpretation methods
In this study, XGBoost was not used merely as a black-box surrogate for predicting chemical reaction rates or target pollutant concentrations. Instead, it served as a computationally efficient emulator of the box-model simulations, enabling systematic sensitivity analysis and interpretation of the chemical response within the prescribed parameter space. To interpret the trained XGBoost models, we combined SHAP analysis, Sobol sensitivity analysis, partial dependence plots, and individual conditional expectation plots. These four approaches were selected to provide complementary perspectives spanning global versus local attribution, main effects versus interaction effects, and average versus sample-level response behavior. Specifically, SHAP values were used to quantify the relative importance and direction of predictor effects at both individual-sample and aggregate levels, while SHAP interaction values were used to diagnose key two-factor interactions. Sobol sensitivity analysis was used to provide a variance-based decomposition of the model output, separating the independent contribution of each input factor from interaction-driven contributions. PDPs were used to visualize the average nonlinear response of the model output to selected predictors and to identify potential thresholds, whereas ICE plots were used to examine whether these average responses were consistent across individual samples or instead varied among different chemical regimes, revealing heterogeneity that PDPs alone cannot capture. For models trained on controlled numerical experiments, the feature values were prescribed through independent, design-of-experiments-based sampling, and the target outputs were generated by a deterministic, mechanism-based chemical model (AtChem). Because the training data are thus not subject to uncontrolled confounding, and because XGBoost was trained to approximate the fixed relationships embedded in the chemical mechanism, the resulting SHAP, Sobol, PDP, and ICE analyses were interpreted as model-estimated chemical sensitivities that reasonably reflect the causal structure inherent in the chemical mechanism, within the sampled parameter space. For the model trained on ambient observations, by contrast, the input features are inherently correlated, and the observed feature–outcome relationships may be subject to unknown confounding. Consequently, SHAP-based interpretations for this model were treated as statistical associations used to evaluate consistency with the chemical sensitivities inferred from the AtChem-based surrogate models, rather than as evidence of direct causal effects.
-
SHAP (SHapley Additive exPlanations) is a game-theoretic approach for interpreting machine learning model predictions (Lundberg and Lee, 2017; Lundberg et al., 2018). Each input feature is treated as a “player” in a cooperative game, and the model prediction for any individual sample is expressed as an additive decomposition of per-feature contributions. Specifically, for a sample xi with N features, the predicted value f (xi) is decomposed as Eq. (8):
where ϕ0=E[f(x)] is the base value, i.e., the expected model output averaged over the entire dataset, and ϕj(f,xi) is the SHAP value of feature j for sample xi, quantifying the contribution of feature j to the deviation of the prediction from the base value ϕ0. The SHAP value ϕj(f,xi) is computed as the weighted average marginal contribution of feature j across all possible subsets of the remaining features, as shown in Eq. (9):
where F is the full set of features, S denotes a subset of features that excludes feature j, and f (S) denotes the conditional expectation of the model output given the features in S. The sign of ϕj(f,xi) indicates the direction of the feature effect for a specific sample (positive: the feature j increases the predicted value relative to the baseline; negative: it decreases it), and the magnitude indicates the strength of that effect. For XGBoost models, SHAP values are computed exactly and efficiently using the TreeExplainer algorithm (Lundberg et al., 2020).
The global importance of feature j is summarized by its mean absolute SHAP value (Eq. 10):
where n is the total number of samples. represents the average magnitude of feature j's contribution to model predictions across the dataset and is used to rank features by their global importance.
Pairwise feature interactions are further quantified via SHAP interaction values (Lundberg et al., 2019). The mean absolute interaction value between features j and p is defined as Eq. (11):
where ϕjp(f,xi) is the SHAP interaction value between features j and p for sample xi, quantifying the portion of their joint effect on the prediction.
-
A variance-based global sensitivity analysis was performed using the Sobol method (Saltelli et al., 2010; Sobol, 2001). Sobol analysis decomposes the variance of the model output into contributions from individual input factors and their interactions over a prescribed input space and probability distribution. It thereby provides a global measure of sensitivity that is not determined by the empirical distribution of the training data.
For a model output Y=f(x), where x1, x2, …, xN denote N mutually independent input factors, the total output variance, Var(Y), can be decomposed into contributions from individual factors and their interactions (Eq. 12):
where is the variance attributable to the main effect of xj, whereas Vjk represents the additional variance attributable to the interaction between xj and xk. Higher-order terms represent interactions involving three or more input factors.
Two Sobol sensitivity indices were computed for each input factor. The first-order index, Sj, quantifies the proportion of output variance attributable to the main effect of xj (Eq. 13):
The total-order index, , quantifies the contribution of xj to the output variance, including its main effect and all interaction effects involving xj (Eq. 14):
where x∼j denotes all input factors except xj. Under the assumed independent input distributions, both indices range from 0 to 1. The difference, , quantifies the cumulative contribution of interaction effects involving xj. Thus, values of substantially larger than Sj indicate that xj participates strongly in non-additive interactions with other predictors, an effect that cannot be identified from main-effect rankings alone.
Input samples for the Sobol sensitivity analysis were generated using the Saltelli sampling scheme based on Sobol' quasi-random sequences (Saltelli, 2002). For each continuous input factor, the sampling bounds were defined by the minimum and maximum values in the training dataset, and samples were generated independently over these bounds. A base sample size of 32 768 was used. Following the Saltelli sampling scheme with second-order effects enabled, this resulted in 524 288 surrogate-model evaluations for the seven input factors. This large evaluation budget was made computationally efficient by the trained XGBoost surrogate model, which evaluates each scenario several orders of magnitude faster than the corresponding box-model simulation. For ARI, which was encoded as an ordinal variable with integer values of 0, 1, and 2, the continuous Saltelli samples generated over [0, 2] were rounded to the nearest integer and clipped to the valid range to match the representation used for model training. Sobol indices, including first-order and total-order indices, were estimated using the SALib library (Herman and Usher, 2017). Bootstrap 95 % confidence intervals were estimated for all Sobol indices.
-
Partial dependence plots (PDPs) were used to visualize the model-predicted average relationship between selected factors and the target variable (Friedman, 2001). For a factor xp and the complementary factor set xc, the one-dimensional partial dependence function is defined in Eq. (15):
where the expectation is approximated by averaging the surrogate model predictions () over all n training samples, while fixing xp at each point of a prescribed grid.
Two-dimensional PDPs were further constructed for selected factor pairs to visualize their joint dependence on the target variable. For a factor pair (xp, xq), the two-dimensional partial dependence function is defined in Eq. (16):
where nMC denotes a Monte Carlo subsample of the training data used to reduce computational cost over the two-dimensional grid.
-
Individual conditional expectation (ICE) plots were used to complement the PDP analysis by examining the model response at the individual-sample level (Goldstein et al., 2015). Whereas a PDP describes the average model-predicted relationship between a factor and the target variable across samples, an ICE plot displays a separate conditional response curve for each sample. For each curve, the factor of interest is varied across a prescribed grid, while all remaining factors are held at their sample-specific values.
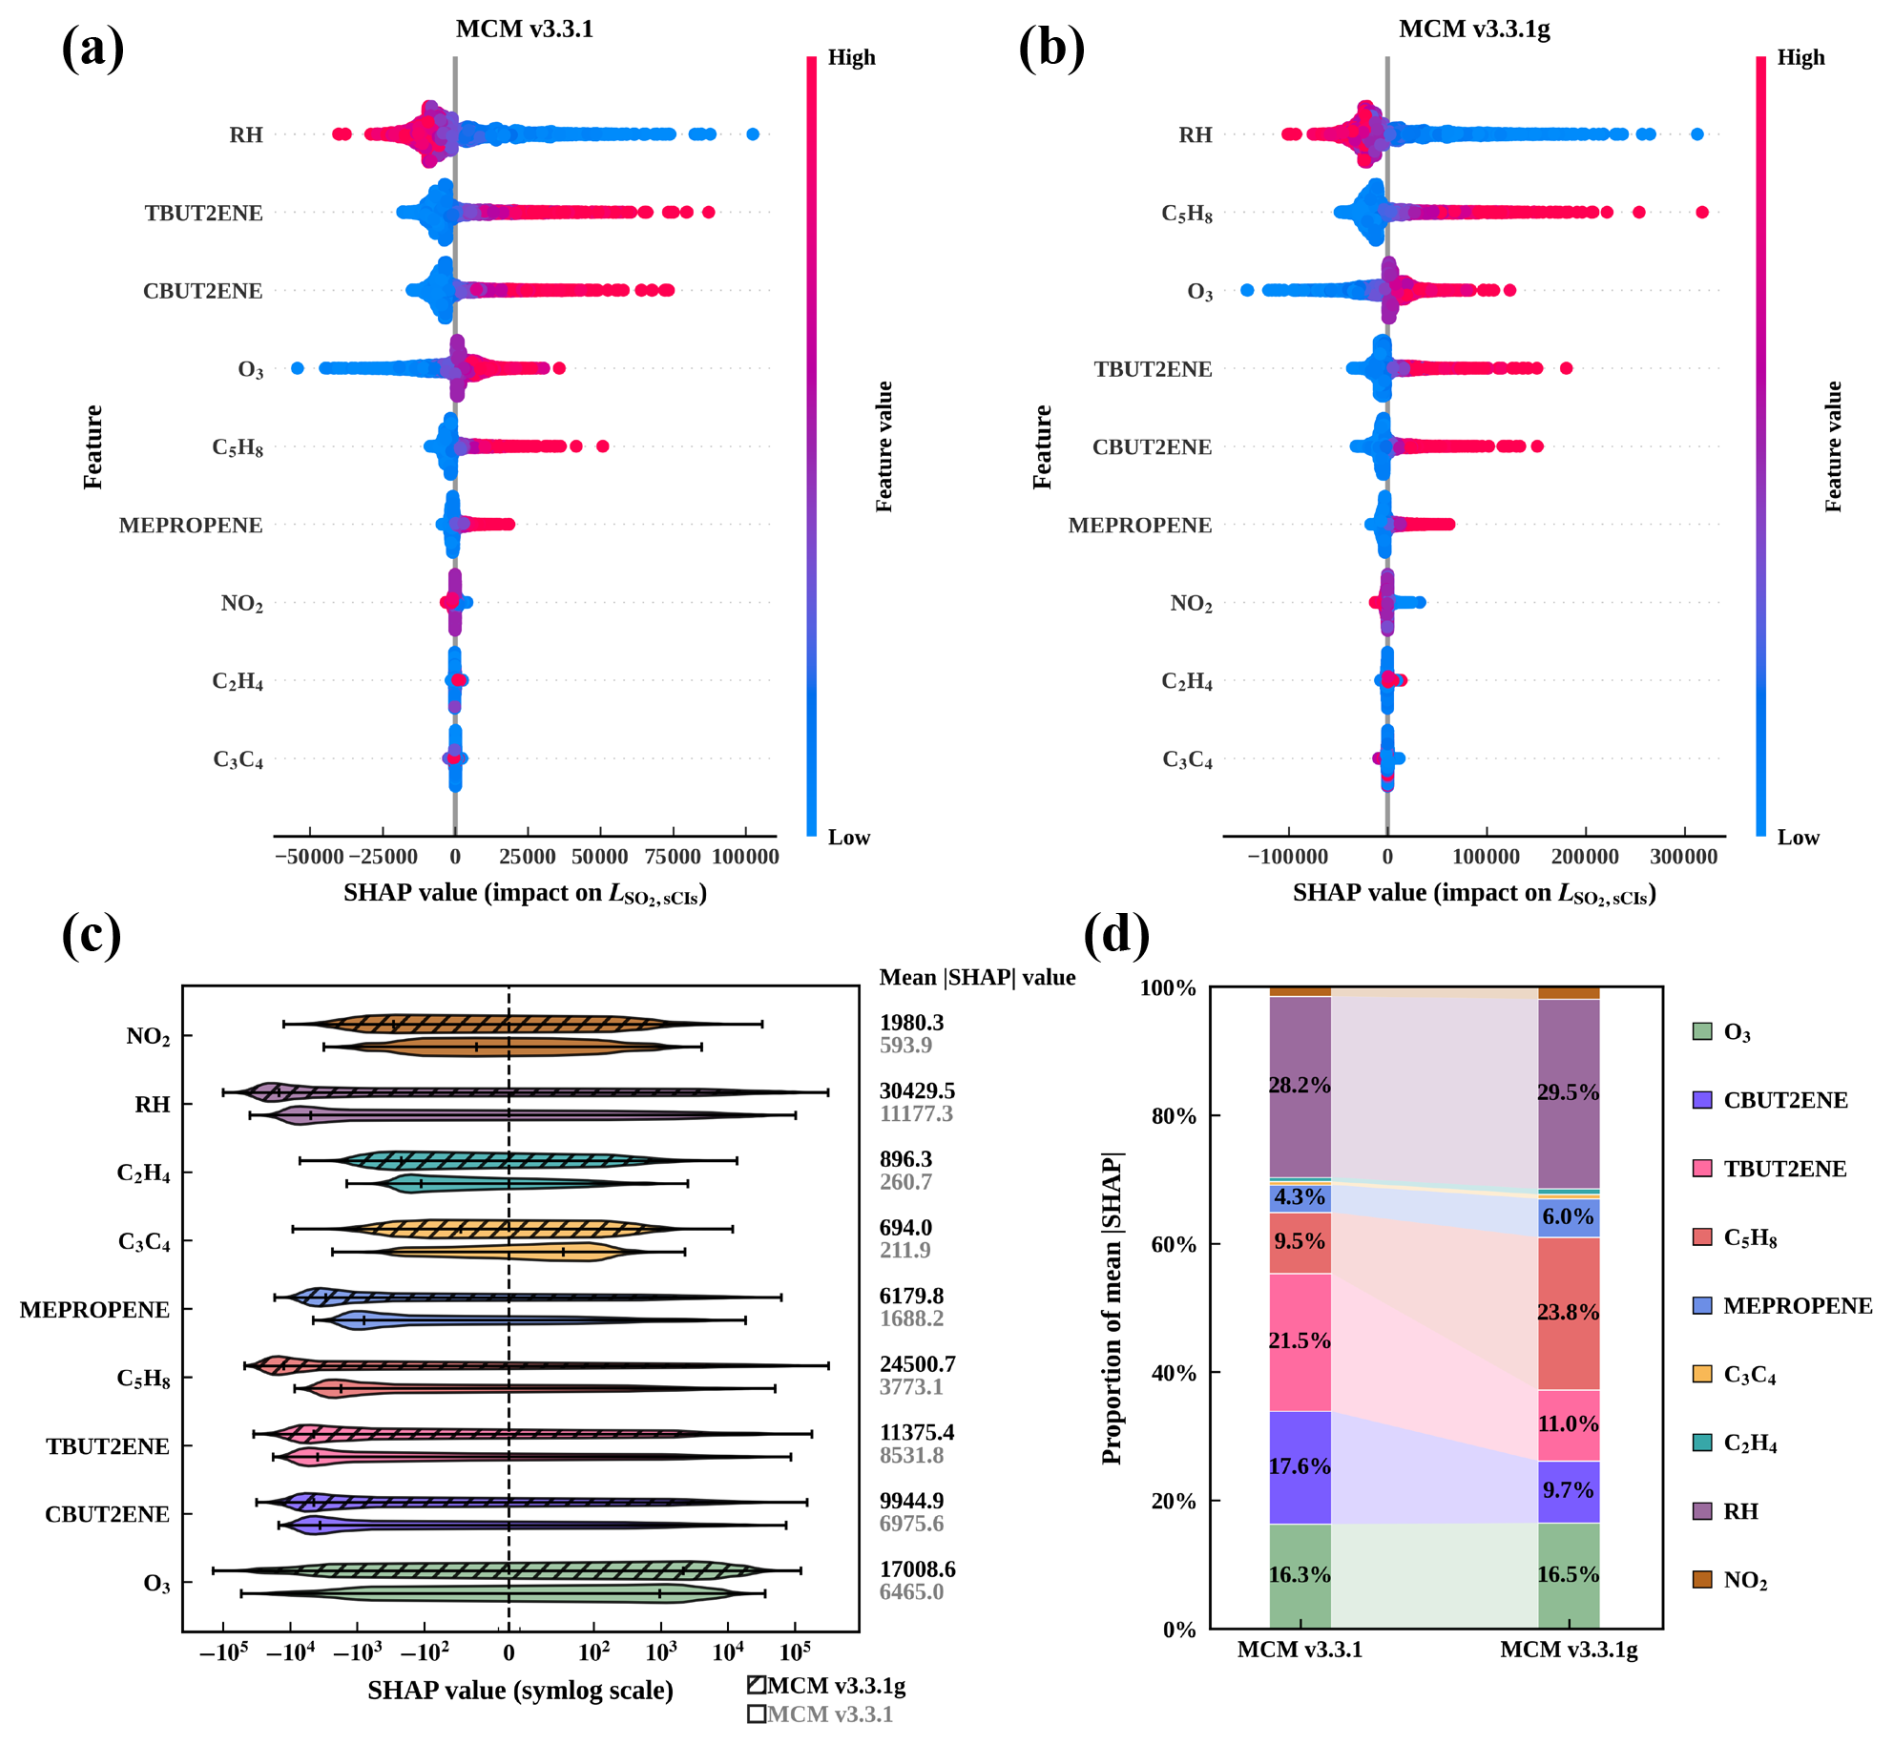
Figure 1SHAP beeswarm summary plots for the XGBoost surrogate models of under (a) MCM v3.3.1 and (b) MCM v3.3.1g. Each point represents one simulation scenario, positioned according to its SHAP value (molec. cm−3 s−1) for the corresponding feature. Point color denotes the feature value from low to high. Features are ordered by mean absolute SHAP value, so that those at the top exert the strongest overall influence on the predicted sCI-driven SO2 oxidation rate. (c) Comparison of SHAP-value distributions for individual features between the XGBoost surrogate models trained on MCM v3.3.1 and MCM v3.3.1g. Boxplots summarize the full distribution of SHAP values across all simulation scenarios. Differences between mechanism versions reflect how the kinetic update changes the magnitude of feature effects. (d) Relative feature contributions to the XGBoost surrogate models of under MCM v3.3.1 and MCM v3.3.1g, quantified as the normalized mean absolute SHAP value of each feature. Contributions are expressed as fractions of the total sum of mean absolute SHAP values across all features for each model. This comparison highlights how the mechanism update redistributes the overall importance among ozonolysis precursors and competing sinks.
3.1 Effects of key controlling factors on sCI-mediated SO2 oxidation
sCIs are short-lived reactive intermediates generated from the ozonolysis of alkenes. Their contribution to gas-phase SO2 oxidation is governed jointly by their atmospheric steady-state concentration and their bimolecular rate coefficient with SO2. The steady-state concentration is itself determined by the initial ozonolysis rate coefficient, the total sCI yield, and the structure-dependent reactivities of individual sCI species toward other competing sinks – most notably H2O, (H2O)2, and NO2 – which collectively regulate the fraction of sCIs available to react with SO2. We therefore introduce the sCI-mediated SO2 oxidation rate, , as the target variable, which simultaneously accounts for sCI production and the effective SO2 oxidation capacity. Figure 1a and b show that, in both MCM v3.3.1 and MCM v3.3.1g, alkene and O3 concentrations are positively correlated with , whereas RH and NOx exhibit marked negative correlations. This pattern is consistent with alkenes and O3 driving sCI production, while H2O/(H2O)2 and NO2 act as competing sinks that reduce the fraction of sCIs available to react with SO2. Notably, updating the mechanism substantially increases the magnitude of the absolute SHAP (|SHAP|) values across all features (Fig. 1c), with the average |SHAP| value ranging from 211.9 to 11 177.3 molec. cm−3 s−1 in MCM v3.3.1, versus 694.0 to 30 429.5 molec. cm−3 s−1 in MCM v3.3.1g. This indicates that the updated mechanism yields a substantially stronger sensitivity of to perturbations in environmental and precursor variables, such that the same change in a given feature produces a larger response in . Importantly, the update does not amplify the influence of all features to the same degree; rather, it also reshapes the relative importance attributed to individual alkenes (Fig. 1d). In MCM v3.3.1, the alkene relative importance follows the order: trans-but-2-ene (TBUT2ENE, 21.5 %) > cis-but-2-ene (CBUT2ENE, 17.6 %) > isoprene (C5H8, 9.5 %) > 2-methylpropene (MEPROPENE, 4.3 %) > ethene (C2H4, 0.7 %) > propene/but-1-ene (C3C4, 0.5 %). In MCM v3.3.1g, isoprene becomes the most important alkene feature (23.8 %), followed by trans-but-2-ene (11.0 %), cis-but-2-ene (9.7 %), and 2-methylpropene (6.0 %), while ethene (0.9 %) and propene/but-1-ene (0.7 %) remain minor contributors. The approximately sixfold increase in the average isoprene |SHAP| value, rising from 3773.1 to 24 500.7 molec. cm−3 s−1 after the mechanism update, is markedly larger than the corresponding shift observed for any other alkene. Indeed, prior studies have shown that regions with intense biogenic emissions tend to exhibit elevated sCI-mediated SO2 oxidation rates, an effect attributed primarily to sCIs derived from isoprene (Hata et al., 2023; Kukui et al., 2021). It should be noted, however, that the relative importance ranking obtained here reflects each alkene's attributed contribution when all alkenes are perturbed over an identical concentration range (0.1–20 ppb); by contrast, isoprene's prominence in previous field and modeling studies may partly reflect its typically higher ambient concentration relative to other alkenes, rather than solely an intrinsically higher sCI reactivity. Within the present perturbation ranges (O3: 2–90 ppb; each alkene: 0.1–20 ppb; RH: 10 %–80 %), RH emerges as the most influential feature overall, exceeding the attributed importance of every alkene (Fig. 1d). This is consistent with prior kinetic evidence that H2O/(H2O)2 dominates the bimolecular loss of sCIs, such that most sCIs have limited capacity to survive under high humidity (Cox et al., 2020; Lade et al., 2024).
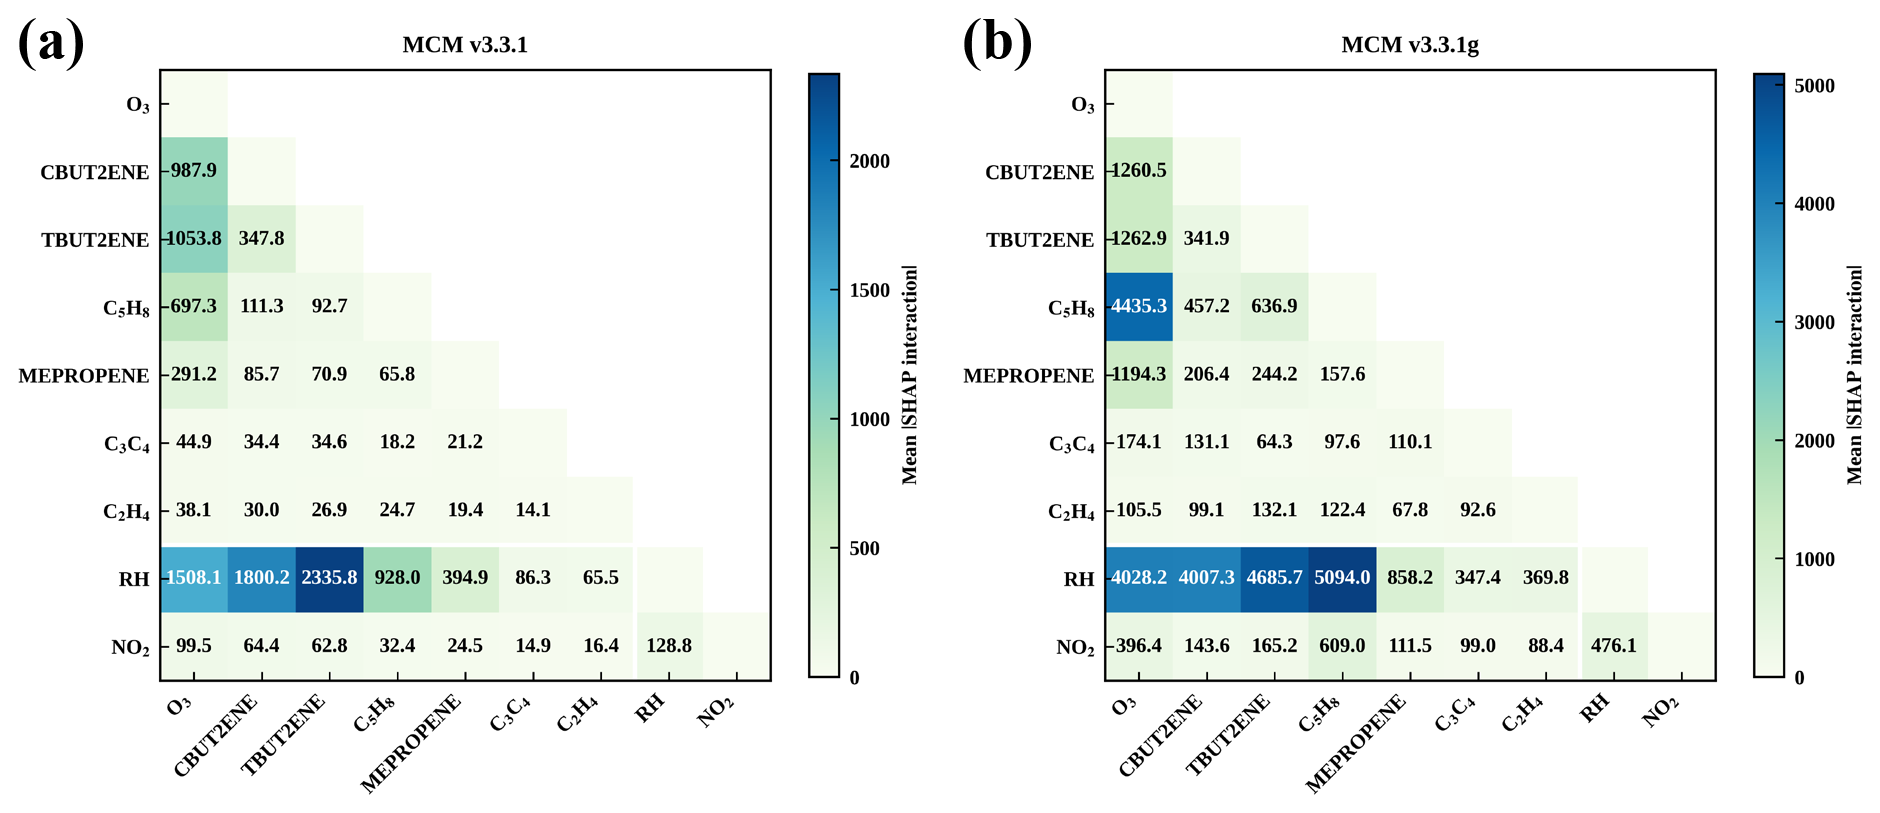
Figure 2Heat maps of pairwise SHAP interaction values among the nine input features for the XGBoost surrogate models of under (a) MCM v3.3.1 and (b) MCM v3.3.1g. Colours denote the mean absolute SHAP interaction value for each feature pair across all simulation scenarios. Larger values indicate stronger non-additive interactions in the surrogate prediction, thereby highlighting the precursor–sink combinations that most strongly modulate sCI-driven SO2 oxidation.
The changes in mean absolute SHAP interaction values before and after the update (Fig. 2) further clarify the mechanistic origin of the differential amplification magnitudes in alkene attribution. In MCM v3.3.1g, the elevated SHAP interaction values involving RH with both O3 and the individual alkenes indicate that MCM v3.3.1 substantially underestimated the competitive scavenging of sCIs by H2O/(H2O)2, thereby masking the strong regulatory role of humidity in sCI-mediated SO2 oxidation. In parallel, the interaction effects between O3 and the individual alkenes are also enhanced in MCM v3.3.1g, indicating that MCM v3.3.1 likewise underestimated the sCI + SO2 oxidation capacity. Critically, the relative degree of underestimation in these two competing removal pathways differs across alkene systems. For isoprene, the RH–C5H8 interaction increased from 928.0 to 5094.0 molec. cm−3 s−1 (a 5.5-fold increase), whereas the O3–C5H8 interaction increased from 697.3 to 4435.3 molec. cm−3 s−1 (a 6.4-fold increase). This indicates that MCM v3.3.1 underestimated the reactivity of its derived sCIs toward SO2 to a greater extent than their reactivity toward H2O/(H2O)2; a comparable pattern is observed for 2-methylpropene. For the remaining alkenes, by contrast, the underestimation of the sCI+H2O/(H2O)2 pathway predominates.
Based on the MCM v3.3.1g results, isoprene contributes more than twice as much as cis-/trans-but-2-ene, 3.8 times as much as 2-methylpropene, and roughly thirty times more than ethene and propene/but-1-ene in terms of their attributed influence on (Fig. 1c). At 298.15 K, the ozonolysis rate coefficients span more than two orders of magnitude (Table S1), following the order: trans-but-2-ene ( cm3 molec.−1 s−1) > cis-but-2-ene ( cm3 molec.−1 s−1) > isoprene ( cm3 molec.−1 s−1) ≈ 2-methylpropene ( cm3 molec.−1 s−1) ≈ propene ( cm3 molec.−1 s−1) ≈ but-1-ene ( cm3 molec.−1 s−1) > ethene ( cm3 molec.−1 s−1). Total sCI yields follow the sequence (Tables S1 and S3): isoprene (0.66; 0.55 CH2OO +0.08 (CH=CH2)(CH3)COO +0.03 (C(CH3)=CH2)CHOO) > ethene (0.42; CH2OO) > propene (0.28; 0.20 CH2OO +0.08 CH3CHOO) > but-1-ene (0.23; 0.15 CH2OO +0.08 C2H5CHOO) ≈ trans-but-2-ene (0.22; CH3CHOO) ≈ cis-but-2-ene (0.20; CH3CHOO) ≈ 2-methylpropene (0.20; 0.13 CH2OO +0.07 (CH3)2COO). Beyond overall yield, sCI speciation varies considerably: aside from cis- and trans-but-2-ene, CH2OO is the dominant sCI across all remaining alkene systems. Critically, the bimolecular reactivities of sCIs are strongly structure-dependent. With respect to SO2 oxidation, CH3CHOO, C2H5CHOO, (CH3)2COO, and (C(CH3)=CH2)CHOO exhibit rate coefficients three to four times higher than those of CH2OO and (CH=CH2)(CH3)COO. The reactivity order toward H2O/(H2O)2 is markedly different, however, broadly following CH3CHOO ≈ C2H5CHOO > CH2OO > (CH=CH2)(CH3)COO ≈ (CH3)2COO ≫ (C(CH3)=CH2)CHOO. These contrasts in sCI fate, including ozonolysis kinetics, effective sCI yield (i.e., the fraction of sCIs that persist to undergo bimolecular reactions), and the relative importance of sCI+SO2 vs. sCI+H2O/(H2O)2 pathways, collectively shape the relationship between alkenes and . Hence, the capacity of different alkene ozonolysis systems to oxidize SO2 cannot be reduced to ozonolysis kinetics and sCI yield alone; the competitive removal of sCIs by H2O/(H2O)2 should also be considered (Fig. 2b). A previous H2SO4 proxy study similarly noted that the apparent rate constant describing the alkene ozonolysis source spans nearly three orders of magnitude in the real atmosphere, reflecting the underlying complexity of sCI chemistry (Yang et al., 2021).
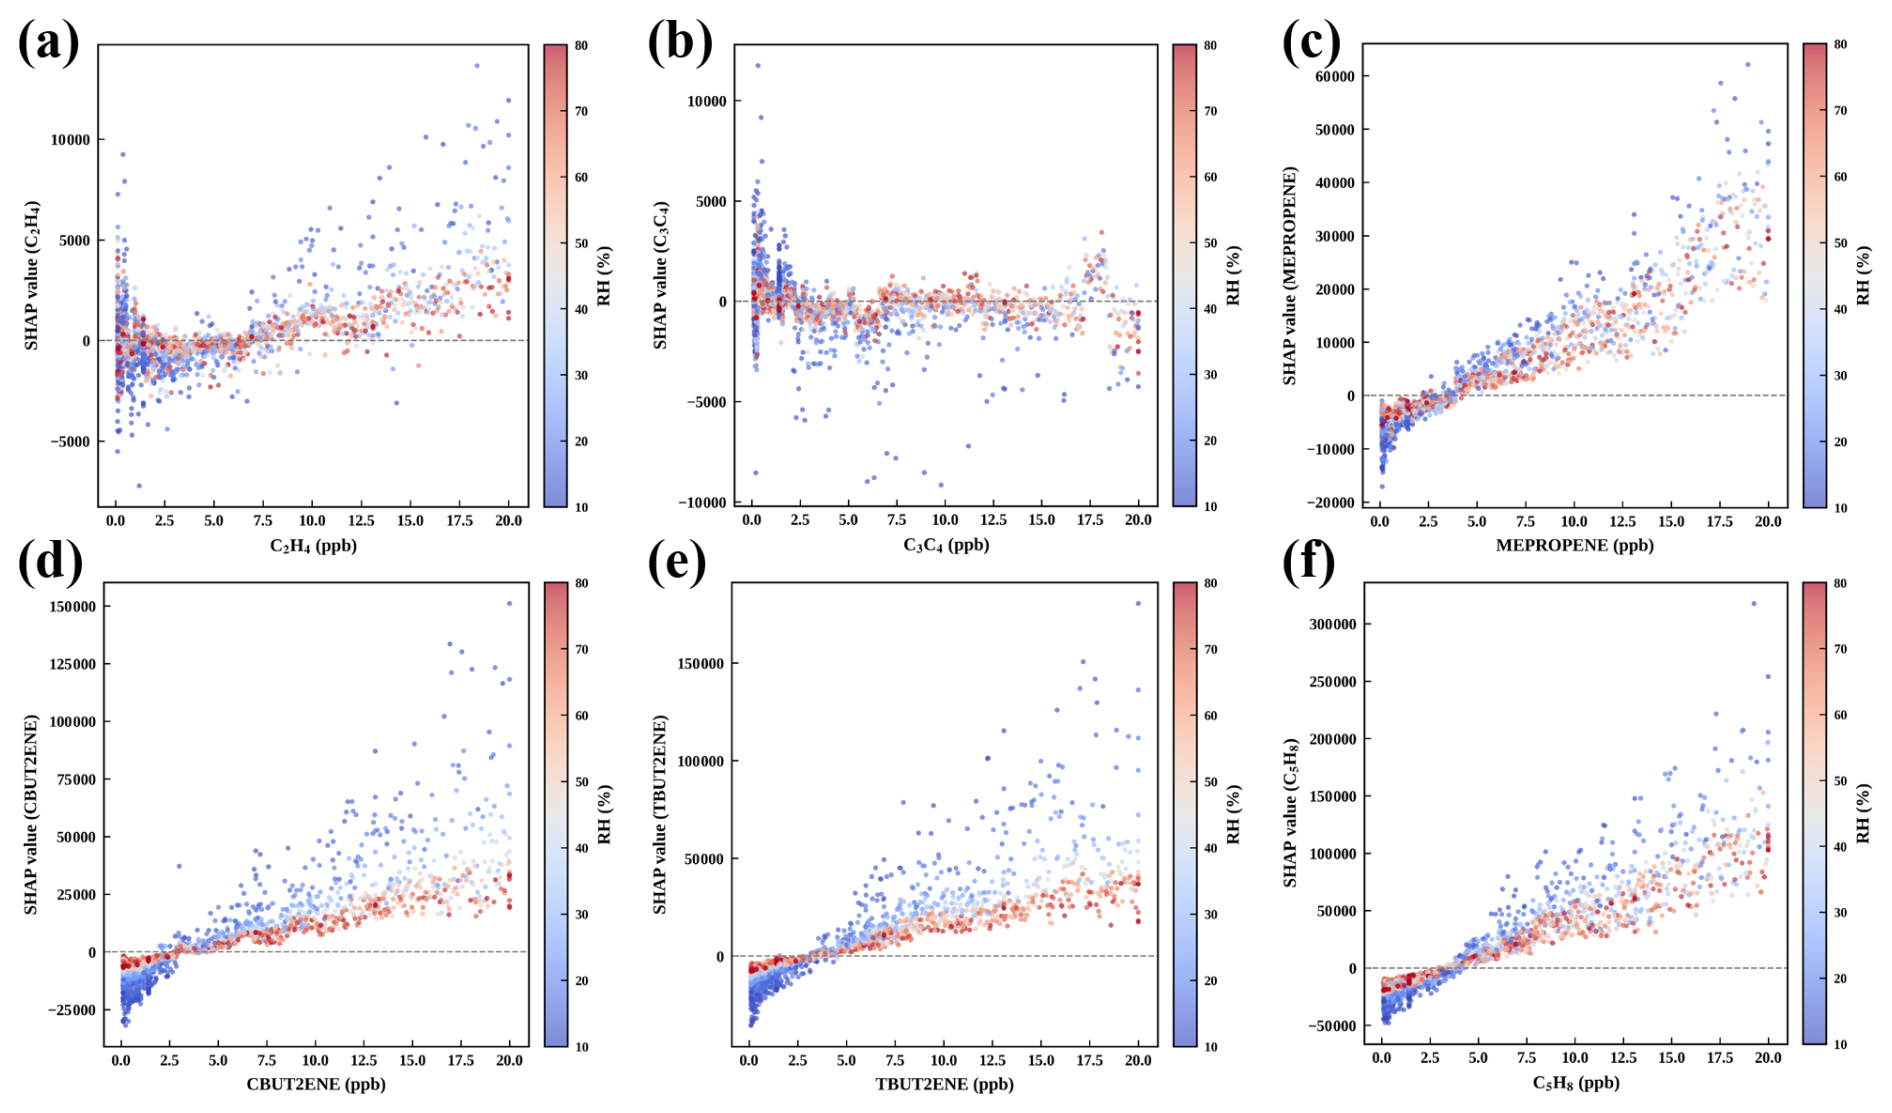
Figure 3SHAP dependence plots for O3 and the six alkene precursors – ethene (a), propene/but-1-ene (b), 2-methylpropene (c), cis-but-2-ene (d), trans-but-2-ene (e), and isoprene (f) – in the XGBoost surrogate models of . The x-axis shows the feature value, the y-axis shows the SHAP value of the same feature, and point color represents RH. Each point corresponds to one simulation scenario. These plots illustrate the marginal effect of each alkene precursor on the predicted sCI-driven SO2 oxidation rate and how this effect varies with humidity.
Figure3 further shows the effects of various alkenes on at different RH under MCM v3.3.1g, illustrating the regulatory role of the sCI+H2O/(H2O)2 pathway. Consistent with the average |SHAP| ranking, isoprene, trans-but-2-ene, cis-but-2-ene, and 2-methylpropene all exhibit substantially positive impacts of varying degrees as their concentrations increase, whereas ethene and propene/but-1-ene display near-zero or weakly positive dependence across the investigated concentration range. The substantial vertical dispersion at fixed alkene concentrations, observed for all alkenes, indicates that identical alkene abundances can yield markedly different impacts on , signifying the non-linear responses arising from interaction effects. For most alkenes (excluding propene/but-1-ene), this vertical spread increases with concentration, indicating that higher alkene concentrations expand the range of possible values, while the realized magnitude remains strongly contingent on ambient conditions. Propene/but-1-ene, by contrast, shows large vertical dispersion across the full concentration range without a significant concentration dependence, suggesting that variability in its SHAP values is driven almost entirely by interaction effects. Ethene similarly shows a significant degree of dispersion in its SHAP values at low concentrations. Taken together, the relationship between alkene concentration and is nonlinear for all alkenes; however, the degree of nonlinearity differs among alkenes, reflecting differences in the relative strength of their interactions with other feature variables.
We use RH coloring in Fig. 3 to visualize the strength of humidity's interactive effects. Across all alkenes, higher RH consistently suppresses the contributions of alkenes to . The degree of suppression, however, varies markedly with alkene identity, and can be rationalized directly from the kinetic properties of their produced sCIs. Under high-humidity conditions, the contribution of propene/but-1-ene to the variation of is weak. This is attributable to the relatively low rate coefficients for the reactions of propene/but-1-ene with O3, which result in significantly lower sCI production than that from ethene and isoprene. The primary sCIs generated from propene/but-1-ene ozonolysis are CH2OO, CH3CHOO, and C2H5CHOO, all of which react rapidly with H2O/(H2O)2. Additionally, CH2OO, which constitutes the largest proportion, has relatively low reactivity toward SO2. Consequently, the limited sCIs produced from these two alkenes make a further restricted contribution to sCI-mediated SO2 oxidation. Ethene, despite having the slowest ozonolysis rate coefficient, produces CH2OO with a substantially higher yield (0.42) than propene or but-1-ene, partially compensating for its sluggish kinetics. However, since CH2OO is efficiently scavenged by H2O/(H2O)2, ethene's contribution remains small and sensitive to humidity, consistent with the mixed positive and negative SHAP values observed at low concentrations in Fig. 3a. In contrast, cis-but-2-ene and trans-but-2-ene benefit from both the highest ozonolysis rate coefficients among the investigated alkenes and the exclusive production of CH3CHOO, which reacts rapidly with SO2. These advantages translate into strong positive contributions to ; however, because CH3CHOO is also highly reactive toward H2O/(H2O)2, the realized contribution is strongly RH-dependent, as evidenced by the pronounced RH stratification in the dependence plots. 2-methylpropene generates both CH2OO and (CH3)2COO. (CH3)2COO reacts rapidly with SO2 but comparatively slowly toward H2O/(H2O)2, resulting in weak competition from H2O/(H2O)2. This explains why 2-methylpropene shows the smallest vertical dispersion growth with concentration among the more influential alkenes, and why its relationship with is more nearly linear, since (CH3)2COO maintains its reactivity toward SO2 even under elevated humidity. Isoprene exhibits the strongest positive contribution to across the full humidity range, arising from the favorable combination of relatively fast ozonolysis, the highest total sCI yield (0.66), and a diverse sCI speciation that includes not only CH2OO but also (CH=CH2)(CH3)COO and (C(CH3)=CH2)CHOO. (C(CH3)=CH2)CHOO reacts rapidly with SO2 while undergoing only slow scavenging by H2O/(H2O)2, sustaining efficient SO2 oxidation even at high RH. The interaction between isoprene and RH is thus primarily attributable to the CH2OO fraction, whereas (CH=CH2)(CH3)COO and (C(CH3)=CH2)CHOO enable isoprene to remain a dominant driver of across a wider humidity range. Taken together, when the investigated alkenes are perturbed over the same concentration ranges, ethene and propene/but-1-ene exert negligible direct control on relative to the remaining alkenes. Isoprene and the C4 alkenes, cis-/trans-but-2-ene and 2-methylpropene, represent the dominant alkene precursors, but their effective impacts are jointly shaped by RH. This finding underscores the need for surrogate modeling to resolve these complex, nonlinear atmospheric reactions into a clear relationship between precursors and . Such modeling enables the identification of key alkene precursors, quantification of the dependence of their contributions on ambient environmental conditions, and elucidation of the key reactions governing their roles in sCI-mediated SO2 oxidation.
3.2 Controls on the sCIs fractional contribution and regime-dependent sensitivities of SO2 oxidation
The surrogate model developed in Sect. 3.1 quantifies how key factors govern , the absolute rate of SO2 oxidation by sCIs. A large , however, does not necessarily imply that sCIs are important for SO2 oxidation, because their importance also depends on the strength of the parallel OH-driven oxidation pathway. OH and sCIs share certain precursors, but their formation pathways are not entirely identical: alkene ozonolysis simultaneously produces both, so alkenes and O3 drive both pathways, yet OH is additionally sustained through routes that do not involve sCIs, including ROx–NOx radical cycling and the direct photolysis of O3, HONO, and other species. OH is therefore governed by a broader set of factors, including NOx, NO2 %, and the wider VOC composition, several of which exert little or no direct influence on sCI chemistry. As a result, the two oxidation pathways do not respond in tandem to environmental perturbations. Variations in the relative importance of sCIs therefore shape the sensitivity of to its controlling factors. To systematically diagnose the atmospheric conditions under which sCIs play a significant role in SO2 oxidation, and to elucidate how this role modulates the precursor sensitivity of , we constructed dedicated surrogate models for μsCIs and . Their feature sets capture the key controls on both pathways (see Sect. 2.3), and the models were trained on a large ensemble of constrained AtChem simulations spanning atmospheric conditions representative of anthropogenically and biogenically influenced environments. Because photolysis exerts decisive control over OH production, daytime (08:00–18:00 LT) and nighttime (22:00–05:00 LT) conditions were analyzed separately.
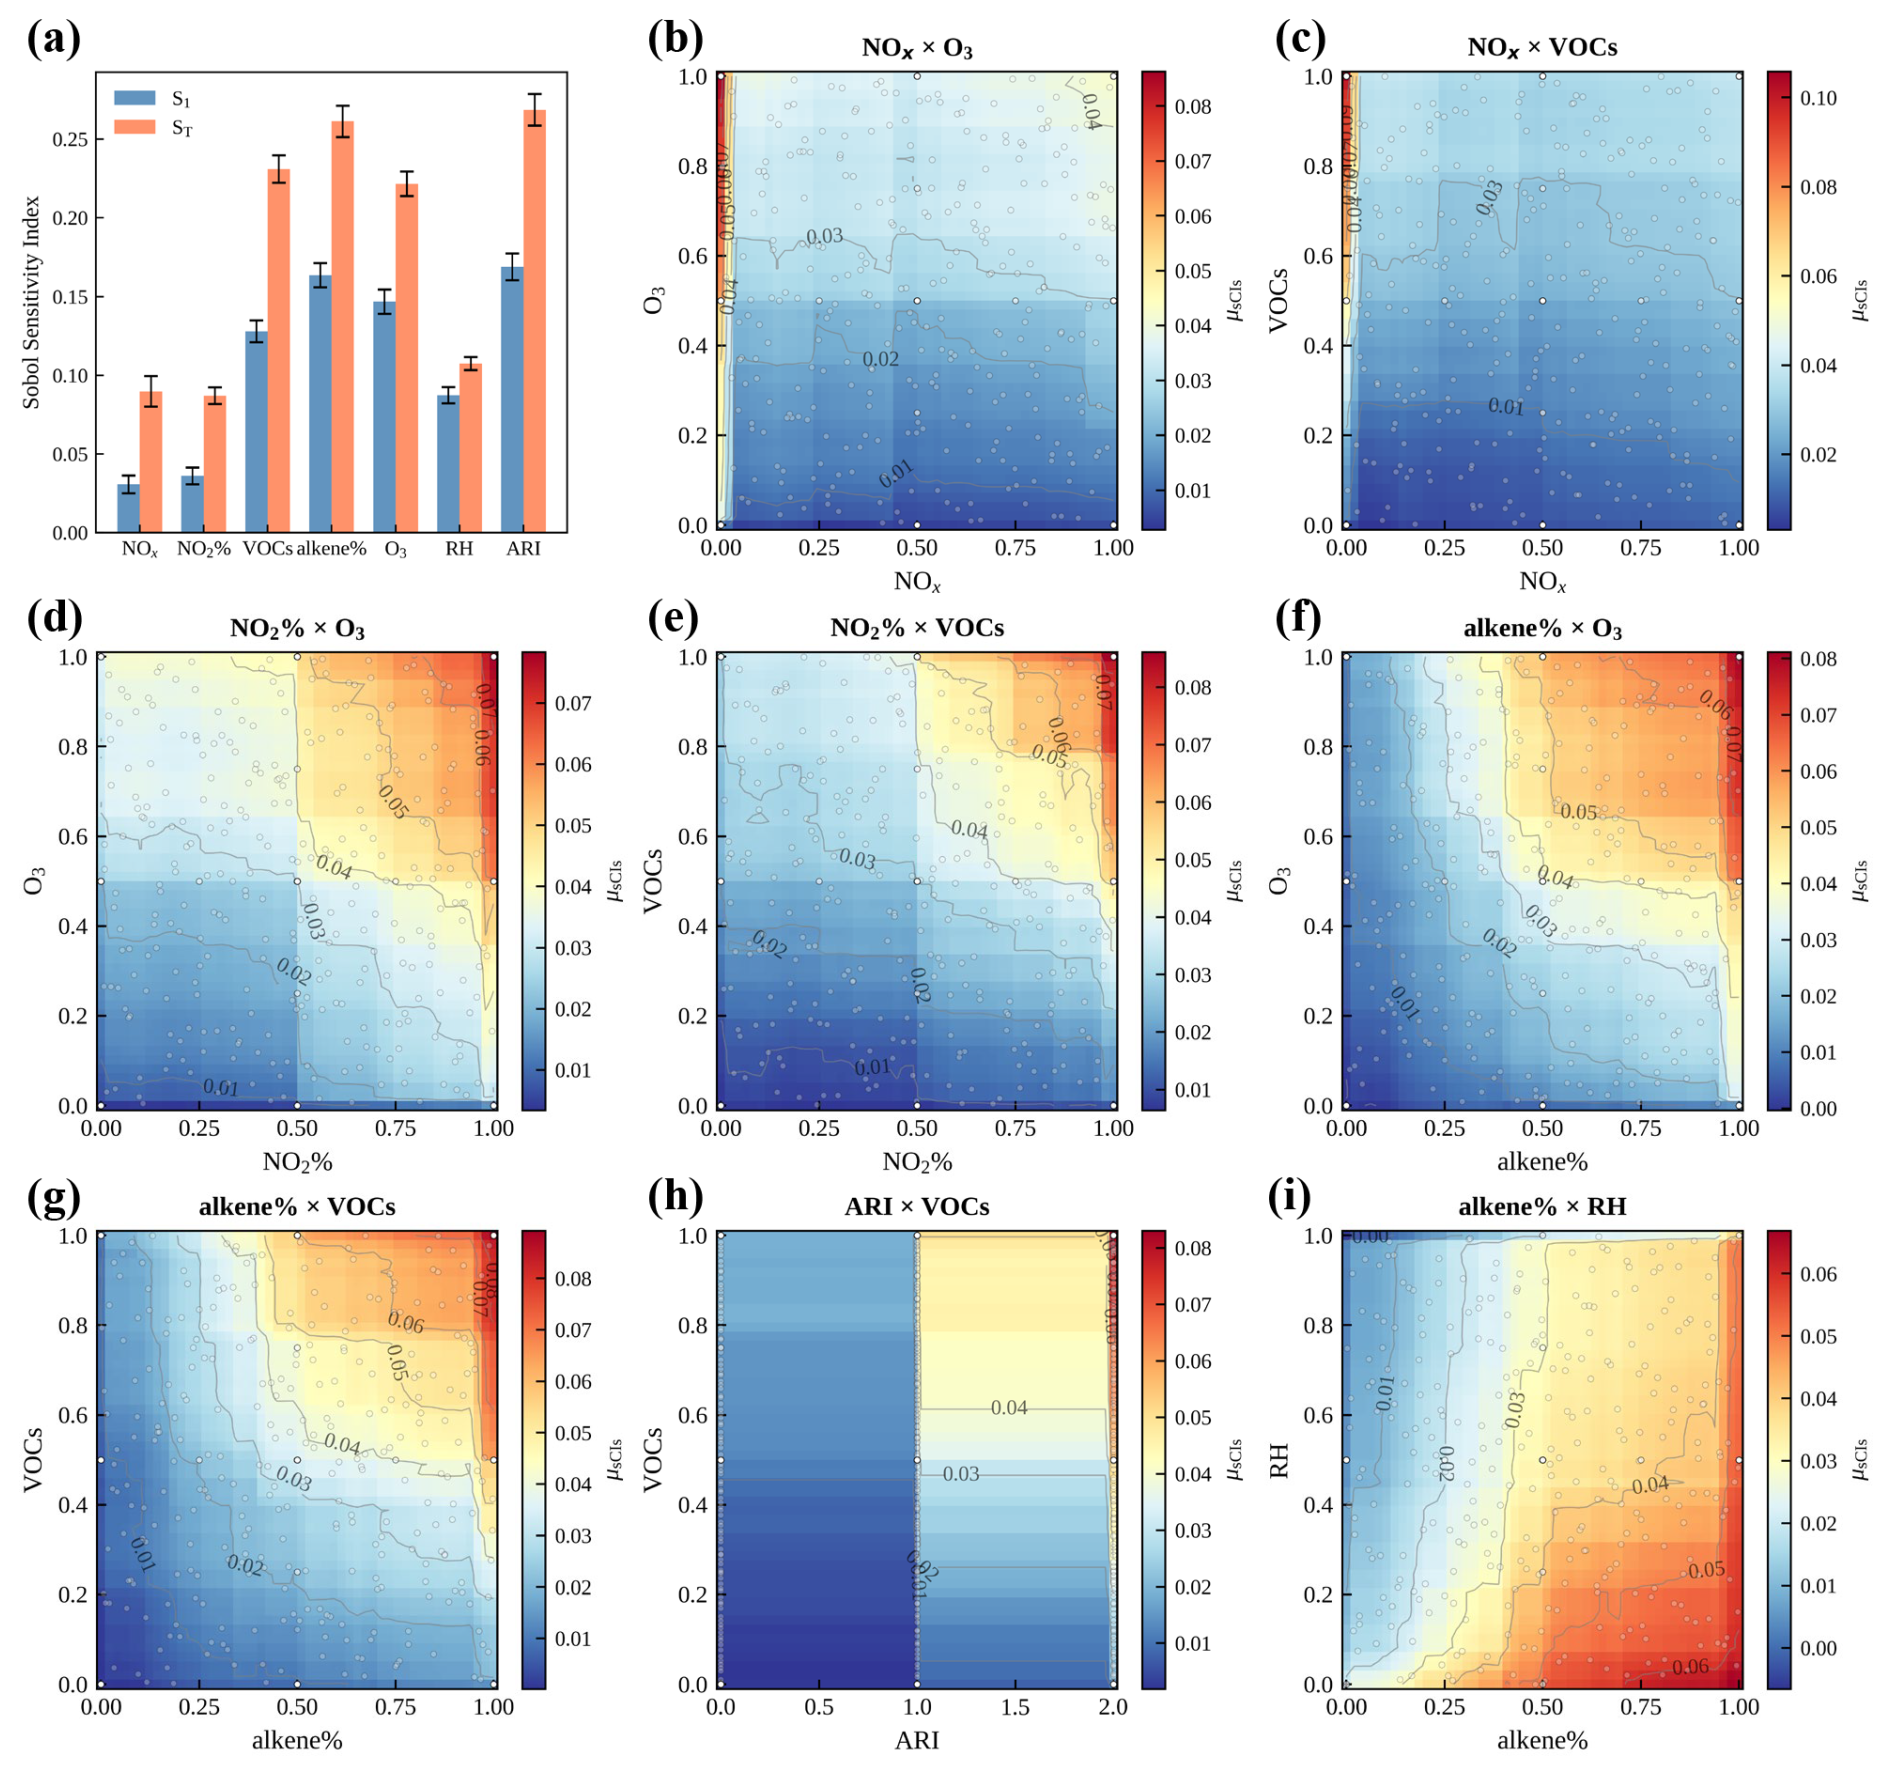
Figure 4(a) First-order (S1) and total-order (ST) Sobol sensitivity indices for the seven input features in the XGBoost surrogate model of μsCIs during daytime. S1 quantifies the main effect of each feature acting alone, whereas ST includes both the main effect and all interaction effects involving that feature. The difference between ST and S1 therefore reflects the extent to which a feature participates in non-additive interactions. (b–i) Two-dimensional partial dependence plots showing the joint effect of O3norm×NOxnorm, VOCsnorm×NOxnorm, O3norm×NO2 %norm, VOCsnorm×NO2 %norm, O3norm×alkene %norm, VOCsnorm×alkene %norm, VOCsnorm×ARIcode, and RHnorm×alkene %norm on the surrogate-model prediction of μsCIs during daytime. The surface represents the average model response after marginalizing over the remaining features. Warmer colors indicate larger predicted μsCIs.
Sobol sensitivity analysis was applied to identify the dominant atmospheric controls on μsCIs and to quantify the extent to which each feature exerts its influence independently or through interaction with other features during the daytime period (Fig. 4a). Here, the first-order index S1 measures the independent main-effect contribution of a single feature, whereas the total-order index ST additionally encompasses all higher-order interactions involving that feature; a markedly larger ST relative to S1 therefore indicates that a feature operates predominantly through coupling with other features rather than through its own variation alone. The analysis identifies ARI, O3, alkene %, and VOCs as the dominant controls on μsCIs, with independent contributions ranked as ARI (S1=0.17) > alkene % (S1=0.16) > O3 (S1=0.15) > VOCs (S1=0.13). RH ranks immediately behind (S1=0.09), while NOx and NO2 % register the weakest direct contributions (S1=0.03 and 0.04, respectively). The low-ARI tier (ARI =0) is dominated by ethene and propene, representative of typical urban anthropogenic emissions (Zhao et al., 2020); the mid-ARI tier (ARI =1) features an elevated proportion of but-2-ene, characteristic of industrial source environments or marine ecosystems (Giorio et al., 2022); and the high-ARI tier (ARI =2) is driven primarily by isoprene, representative of biogenic (Rhew et al., 2017) or petrochemical-influenced conditions (Guo et al., 2022). The alkene mixture proportions at each ARI level are detailed in Fig. S1. Comparing S1 and ST across all features reveals a clear differentiation in how each feature exerts its influence. For RH, ST≈S1 (ST=0.11), indicating negligible interaction effects; RH influences μsCIs almost entirely through its independent main effect. For ARI (ST=0.27), alkene % (ST=0.26), O3(ST=0.22), and VOCs (ST=0.23), ST substantially exceeds S1, indicating that although their independent main effects dominate, non-negligible interaction effects are also present. Among these, ARI exhibits both the largest S1 and ST, reinforcing that alkene speciation not only exerts the strongest independent control on μsCIs but also acts as a key moderator of the effects of O3, alkene %, and VOCs. The contrast is most pronounced for NOx and NO2 %: their S1 values account for less than half of their respective ST values (NOx: ST=0.09; NO2 %: ST=0.09), indicating that their influence on μsCIs is overwhelmingly mediated through interactions with other features rather than through direct action. This strong interaction dependence reflects the fact that the influence of NOx and NO2 % on μsCIs is conditional on the values of other features.
The directional effects of these features are further illustrated by the 2D PDPs (Fig. 4b–i). Hereafter, feature levels denote normalized values rather than the actual concentrations; corresponding time-varying concentrations are shown in Fig. S1. Among the features that directly govern , ARI, O3, VOCs, and alkene % exhibit mutually reinforcing positive effects on μsCIs, suggesting that conditions favorable for alkene ozonolysis simultaneously enhance the relative competitiveness of the sCI pathway. RH negatively affects μsCIs by suppressing the sCI+SO2 pathway through enhanced sCI loss to H2O/(H2O)2. Despite NO2 being a known sCI scavenger, NO2 % exhibits a synergistic co-enhancement with O3 and VOCs on μsCIs. These synergistic effects are expected to arise from the influence of NO2 % on OH, through its role in governing how NOx is partitioned between radical termination and cycling (Sillman and He, 2002). A higher NO2 fraction, at fixed total NOx, is expected to reduce the NO available for HO2/RO2→OH conversion, thereby suppressing the SO2+OH oxidation channel more strongly than it scavenges sCIs, particularly under high-O3 and high-VOCs conditions. Correspondingly, the higher the NO2 %, the more strongly μsCIs increase with rising O3 and VOCs. NOx, by contrast, exerts predominantly suppressive interactions with O3 and VOCs: μsCIs peaks at the lowest NOx levels and declines sharply as NOx increases only slightly from its minimum, before leveling off or increasing slightly at higher concentrations, such that μsCIs at the highest NOx level remains well below the peak observed at the lowest NOx level. The sensitivity of μsCIs to O3 and VOCs is modulated by NOx levels. At the lowest NOxlevel, increases in O3 and VOCs produce the largest increments in μsCIs. Across the remainder of the NOx range, raising O3 or VOCs from their minimum to maximum levels increases μsCIs by only 0.03–0.04. The effect of NOx on μsCIs arises primarily from its control over the steady-state OH concentration: at extremely low NOx level, radical recycling efficiency is greatly diminished, leading to suppressed OH; at excessively high NOx levels, OH is likewise suppressed, but through accelerated termination reactions between radicals and NOx. Under both conditions, the attenuation of OH-mediated SO2 oxidation shifts a greater share of the total oxidation burden to sCIs, resulting in elevated μsCIs.
Taken together, daytime μsCIs tends to be elevated under atmospheric conditions characterized by high O3 concentrations, abundant VOCs, a large alkene fraction, and relatively low RH. With respect to NOx, μsCIs is only appreciably enhanced under extremely low NOx levels; across the remainder of the NOx range, its influence on μsCIs is comparatively weak. This finding is consistent with previous studies reporting that sCI chemistry plays a more prominent role in SO2 oxidation in biogenic-rich forested and rural environments (Kim et al., 2015) than in polluted urban settings (Dada et al., 2020). Among the identified controls, O3, VOCs, alkene %, and ARI, which collectively characterize conditions favorable for sCI formation, not only directly promote but also exhibit pronounced synergistic positive effects on μsCIs. This pattern implies that, as these variables increase, OH increases less strongly than sCI production and may even decrease modestly. Consequently, although O3 and alkenes jointly initiate the chemical processes leading to the formation of both OH and sCIs, their effects on the OH-mediated and sCI-mediated SO2 oxidation pathways differ in both magnitude and direction. Under most daytime conditions, the OH pathway dominates SO2 oxidation, such that the sensitivity of to precursor species is primarily shaped by how those precursors affect OH. However, as shown by the NOx dependence of μsCIs, the response of OH to precursor perturbations is itself condition-dependent, exhibiting a non-monotonic relationship with NOx. This gives rise to distinct OH response patterns under high- and low-μsCIs conditions and, by extension, distinct sensitivities of to its precursors. To quantify the magnitude of these differences, the dataset was partitioned into high- and low-μsCIs subsets based on the median daytime μsCIs value (1.1 %), and the relationship between each feature and was characterized separately for each subset.
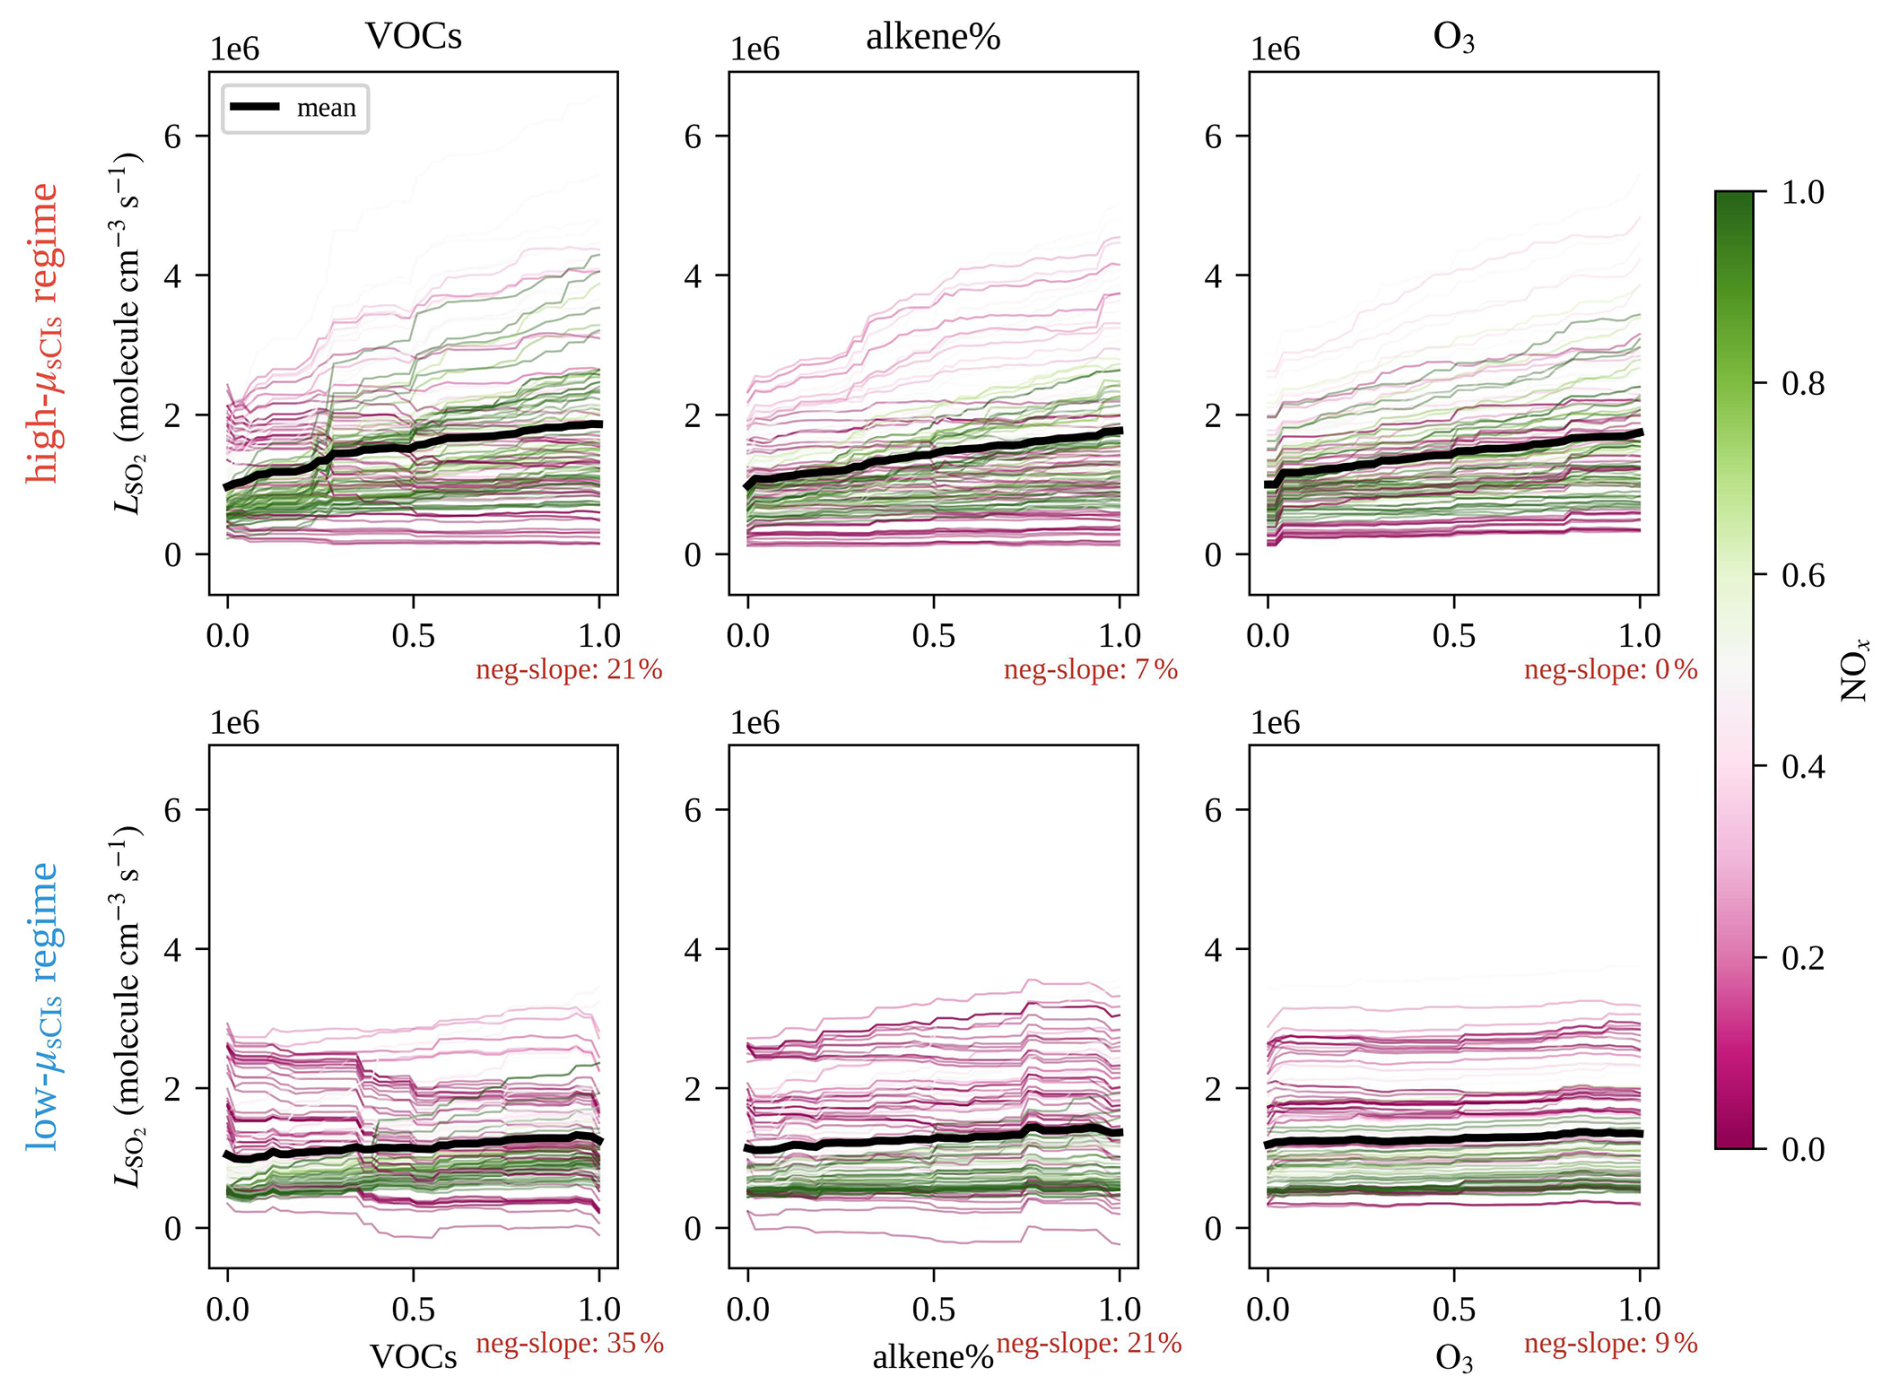
Figure 5Individual conditional expectation (ICE) plots for the regime-specific models during daytime, showing the responses of predicted total gas-phase SO2 oxidation to VOCsnorm, alkene %norm, and O3norm in the low- and high-μsCIs regimes. The two rows correspond to the two μsCIs regimes, and the three columns correspond to the three selected predictors. Each thin curve represents one sampled scenario, colored by normalized NOx. The curves are displayed in absolute prediction space (i.e. without centering), so both the slope and vertical spread reflect heterogeneity in the conditional model responses across different chemical backgrounds.
Figure 5 illustrates how total gas-phase SO2 oxidation rate varies with O3, VOCs, and alkene % across the high- and low-μsCIs regimes. The mean ICE curves show that increases monotonically with all three features under both regimes; however, the response is systematically amplified under high-μsCIs conditions, with the mean curve exhibiting a steeper and more sustained increase across the full feature range. Beyond the mean response, the spread of individual ICE curves provides insight into response heterogeneity, namely, the extent to which the effect of a given feature on varies across different atmospheric conditions. Notably, negative responses to increases in VOCs and alkene % are observed under extremely low NOx level. To quantify this directional heterogeneity, we computed the fraction of individual ICE curves exhibiting a net negative slope between the minimum and maximum feature values, termed the “neg-slope fraction”. For O3, positive associations with are nearly universal in both regimes, with a neg-slope fraction of 0 % under the high-μsCIs regime and 9 % under the low-μsCIs regime. For alkene %, the neg-slope fraction increases from 7 % under the high-μsCIs regime to 21 % under the low-μsCIs regime. A similar pattern is evident for VOCs, with the neg-slope fraction rising from 21 % under high-μsCIs to 35 % under low-μsCIs regimes. This regime contrast warrants further examination. At an extremely low NOx level, high μsCIs is associated with abundant alkene concentrations. Although higher alkene concentrations may promote radical termination and thereby suppress OH and reduce , the high-μsCIs subset nevertheless exhibits a smaller neg-slope fraction than the low-μsCIs subset. This suggests that the alkene ozonolysis pathway offsets part of the OH suppression caused by enhanced radical termination, thereby dampening the negative response. At moderate-to-high NOx levels, positive responses to increases in VOCs, alkene %, and O3 dominate and are considerably stronger under the high-μsCIs regime than under the low-μsCIs regime. This amplified sensitivity likely reflects the fact that high-μsCIs regime is associated with abundant alkenes, which simultaneously promote OH propagation through ROx cycling pathway and drive alkene ozonolysis.
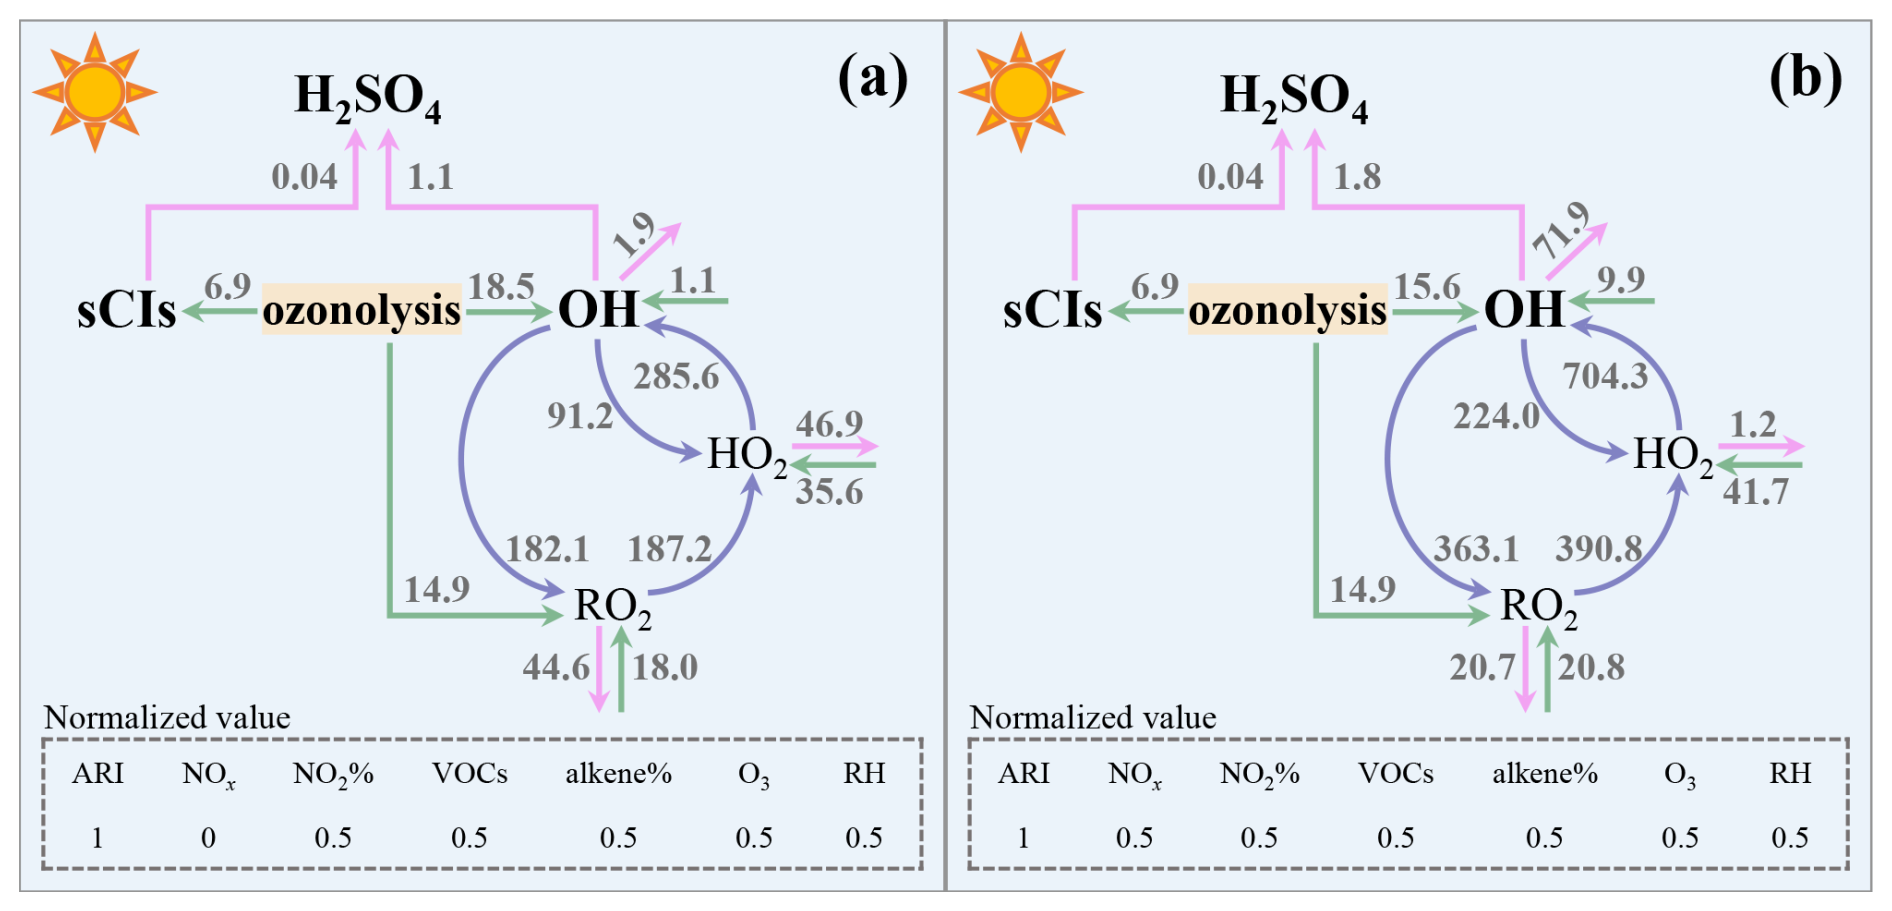
Figure 6Two representative daytime scenarios illustrating the budgets of OH and sCIs at normalized NOx levels of (a) 0 and (b) 0.5. Numbers denote reaction rates (106 molec. cm−3 s−1). Pink, green, and purple lines indicate the termination, initiation, and propagation pathways of OH and sCIs, respectively.
In summary, exhibits both positive and negative responses to VOCs and alkene % across the full scenario space, with the key distinction being that under the high-μsCIs regime, negative responses are less frequent and positive responses are stronger. To clarify the mechanistic basis of this contrast, we examined the OH and sCI budgets for two representative scenarios at normalized NOx levels of 0 and 0.5 (Fig. 6a, b). This analysis was used to explain why negative responses to increases in VOCs and alkene % are more frequent in the low-μsCIs regime. OH production is partitioned into initiation (∑OHnew), which encompasses all primary OH production via photolysis and alkene ozonolysis (Sheehy et al., 2010), and propagation (OHpropag), defined as the rate of HO2→OH conversion. At an extremely low NOx level (NOx, norm = 0), the ozonolysis pathway accounts for 39.65 % of ∑OHnew (see Sect. S5 for detailed calculations), and the ratio OHpropag/∑OHnew is 3.67, indicating that radical propagation contributes approximately 3.7 times as much OH as primary initiation. At a moderate NOx level (NOx, norm =0.5), the ozonolysis share of ∑OHnew decreases to 29.28 %, whereas the OHpropag/∑OHnew ratio rises to 6.96, reflecting substantially enhanced radical cycling efficiency, as evidenced by the HO2→OH conversion rate reaching 7.04×10⁸ molec. cm−3 s−1. At an extremely low NOx level, the ROx recycling is severely suppressed, thus primary OH initiation contributes a correspondingly larger fraction to the total OH budget, and the ozonolysis pathway in turn accounts for a larger share of OH production. Under this condition, the contribution of alkene ozonolysis to OH production can partly offset the suppressive effect of enhanced radical termination on OH, which explains why the neg-slope fraction for is smaller in the high-μsCIs subset than in the low-μsCIs subset. At a moderate NOx level, OH is sustained predominantly through radical cycling rather than through photolysis or ozonolysis, and the increase in NOx additionally enhances HONO photolysis, further diminishing the relative contribution of ozonolysis to OH generation. Under these conditions, perturbations in VOCs and alkene % influence primarily through their modulation of OH propagation. Because high-μsCIs conditions at this NOx level are associated with abundant alkenes, both the ROx cycling and ozonolysis pathways are strongly activated, and therefore exhibits a pronounced positive response to increases in precursor concentrations.
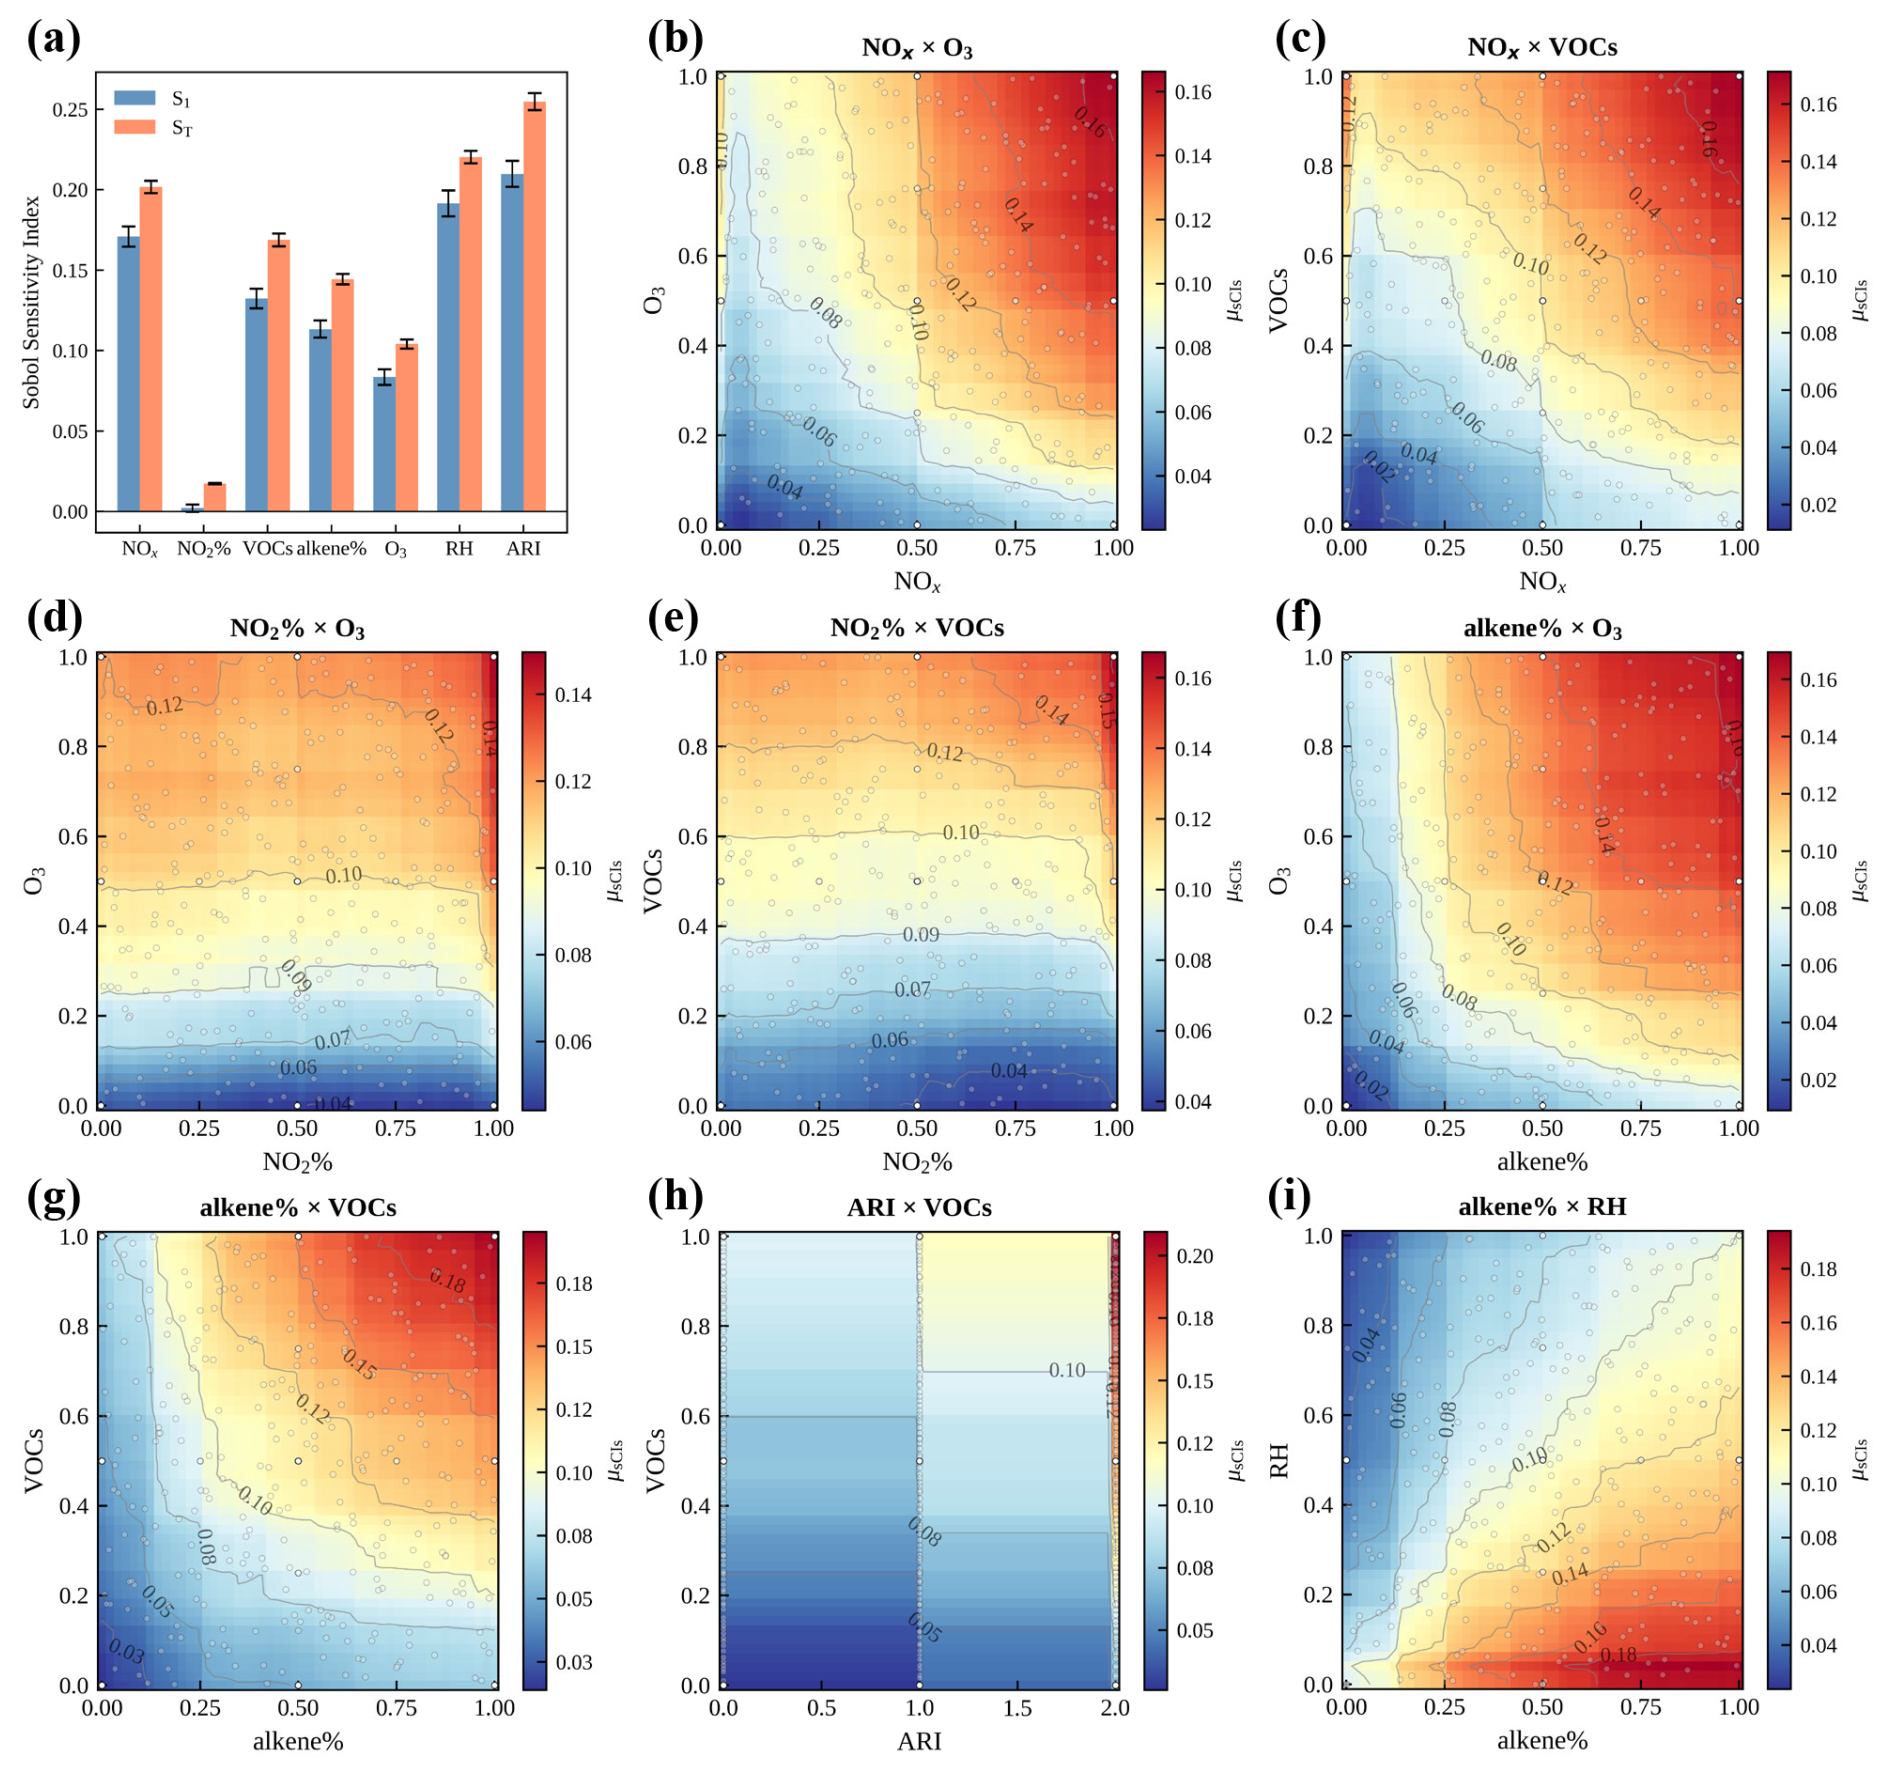
Figure 7(a) First-order (S1) and total-order (ST) Sobol sensitivity indices for the seven input features in the XGBoost surrogate model of μsCIs during nighttime. S1 quantifies the main effect of each feature acting alone, whereas ST includes both the main effect and all interaction effects involving that feature. The difference between ST and S1 therefore reflects the extent to which a feature participates in non-additive interactions. (b–i) Two-dimensional partial dependence plots showing the joint effect of O3norm×NOxnorm, VOCsnorm×NOxnorm, O3norm×NO2 %norm, VOCsnorm×NO2 %norm, O3norm×alkene %norm, VOCsnorm×alkene %norm, VOCsnorm×ARIcode, and RHnorm×alkene %norm on the surrogate-model prediction of μsCIs during nighttime. The surface represents the average model response after marginalizing over the remaining features. Warmer colors indicate larger predicted μsCIs.
The nighttime Sobol sensitivity indices (Fig. 7a) reveal controls on μsCIs that differ markedly from those identified during the day. ARI, RH, and NOx emerge as the dominant controls, with independent contributions ranked as ARI (S1=0.21) > RH (S1=0.19) > NOx (S1=0.17). VOCs (S1=0.13), alkene % (S1=0.11), and O3 (S1=0.08) rank immediately behind, while NO2 % exerts a negligible direct influence (S1=0.002). Comparing S1 and ST across all features, ST only slightly exceeds S1 for most features, indicating that independent main effects dominate and interaction effects are limited, with the total-order ranking following ARI (ST=0.25) > RH (ST=0.22) > NOx (ST=0.20) > VOCs (ST=0.17) > alkene % (ST=0.14) > O3 (ST=0.10). NO2 % retains the smallest ST (ST=0.02), reinforcing that its regulatory effect on μsCIs at night is negligible. The close agreement between ST and S1 across most features at night stands in sharp contrast to the daytime results, where ST substantially exceeded S1 for several key features. This collapse of interaction effects reflects a fundamental mechanistic shift: in the absence of photolysis, the primary OH initiation pathway is alkene ozonolysis, which is simultaneously the sole sCI formation pathway. Perturbations to precursors therefore affect both oxidation pathways in the same direction and with similar magnitude, suppressing the conditional interactions that characterize the daytime sensitivity structure. This finding is broadly consistent with previous studies demonstrating that Criegee intermediate chemistry constitutes a non-negligible OH source under dark or low-light conditions (Khan et al., 2018). The rise of RH from a minor factor during the day to the second-ranked control at night reflects the substantially lower OH concentrations characteristic of nocturnal conditions, which elevate the relative contribution of sCIs to gas-phase SO2 oxidation (Kukui et al., 2021) and thereby amplify the suppressive effect of H2O/(H2O)2 on μsCIs. The contrasting behavior of NOx and NO2 % between day and night also warrants attention. At night, photolytic regeneration of NO from NO2 is effectively absent; instead, NO within NOx is oxidized to NO2 through reactions with O3 and peroxy radicals, leading to progressive NO2 accumulation. This enhances the termination reaction between NO2 and OH, suppressing steady-state OH and indirectly elevating μsCIs. As a result, nighttime μsCIs is governed primarily by total NOx abundance rather than by the NO/NO2 partitioning, which explains why NO2 % exerts a negligible effect at night.
The directional effects of these features are further elucidated by the 2D PDPs (Fig. 7b–i). ARI, O3, VOCs, and alkene % exhibit mutually reinforcing positive effects on μsCIs, consistent with their roles as sCI precursors: conditions favorable for simultaneously enhance the relative competitiveness of the sCI oxidation pathway. RH exerts a pronounced negative effect on μsCIs. With respect to NOx, μsCIs reaches a locally elevated value (approximately 0.1) at the lowest NOx level, then drops sharply as NOx increases only slightly from its minimum, before rising significantly and monotonically across the remainder of the range to reach its global maximum (approximately 0.16) at the highest NOx level, such that a strong positive relationship between NOx and μsCIs prevails across most of the range. This near-monotonic behavior reflects the role of NOx in modulating steady-state OH through radical termination, as described above.
Taken together, nighttime μsCIs tends to be elevated under atmospheric conditions characterized by high O3 concentrations, abundant VOCs, a large alkene fraction, and relatively low RH. With respect to NOx, the highest μsCIs values occur under elevated NOx levels, although a smaller enhancement is also evident under extremely low NOx conditions. This is consistent with a previous study reporting that elevated NOx levels in power plant environments at night are highly conducive to a large sCI contribution fraction (Meidan et al., 2019). Furthermore, ARI, O3, VOCs, and alkene %, which collectively characterize conditions favorable for sCI formation, not only strongly promote but also exert pronounced synergistic effects on μsCIs. This pattern indicates that O3 and alkenes do not affect the OH- and sCI-mediated SO2 oxidation pathways to the same extent. Notably, unlike during the day, when OH is sustained primarily by radical propagation, nocturnal OH production is more strongly linked to primary initiation, alkene ozonolysis, because the absence of photolysis limits OH production from photolytic sources and radical recycling. Alkene ozonolysis is also the sole formation pathway for sCIs. Therefore, differences in the sensitivity of across μsCIs regimes are expected to reflect differences in the strength of the alkene ozonolysis pathway. To examine these differences, the dataset was partitioned into high- and low-μsCIs subsets based on the median nighttime μsCIs value (8.0 %), and the relationship between each feature and was characterized separately for each subset.
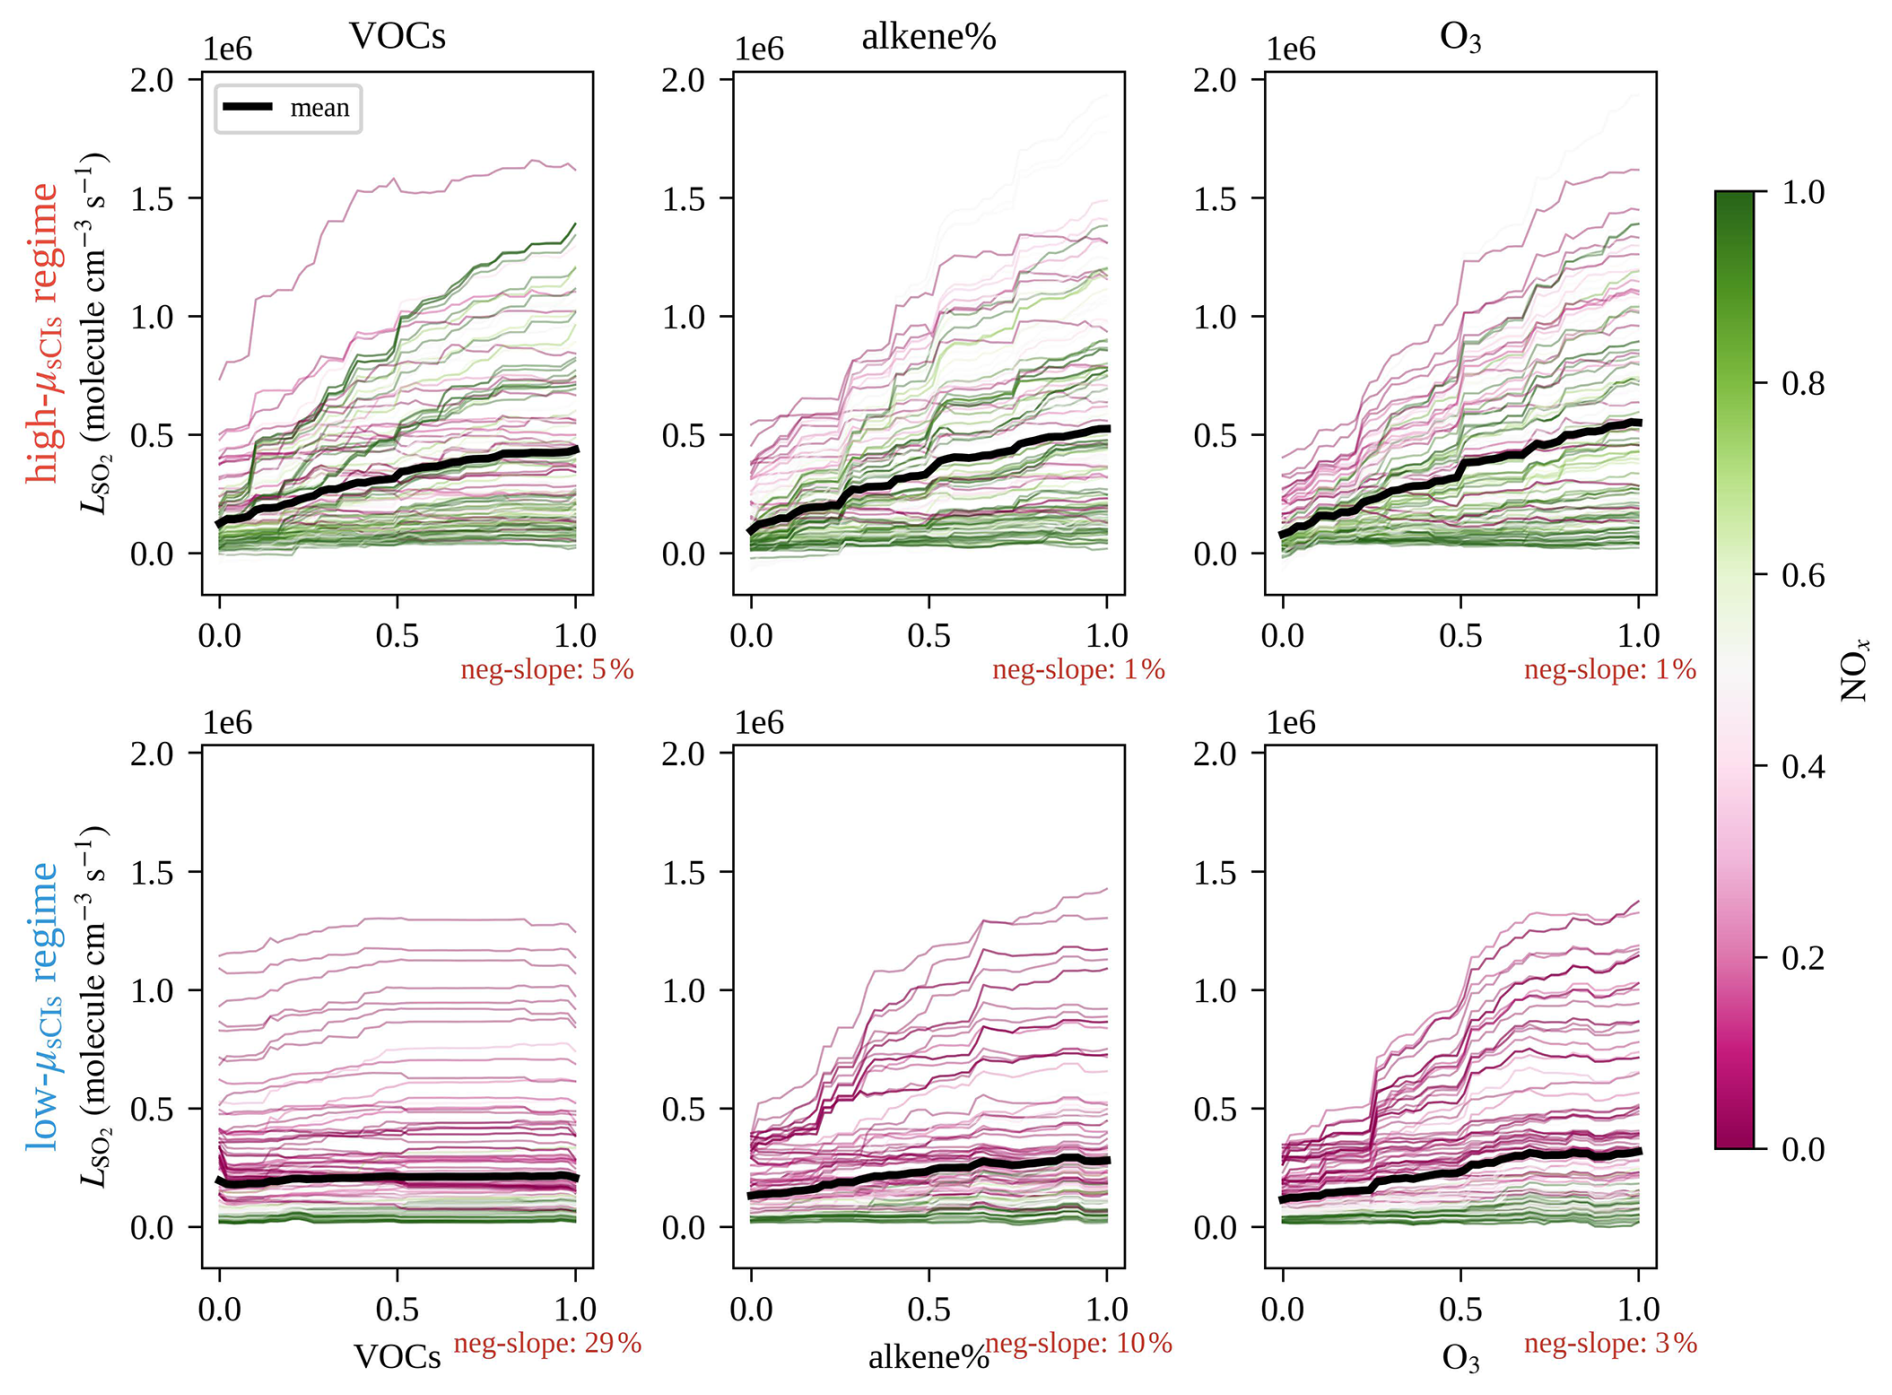
Figure 8Individual conditional expectation (ICE) plots for the regime-specific models during nighttime, showing the responses of predicted total gas-phase SO2 oxidation to VOCsnorm, alkene %norm, and O3norm in the low- and high-μsCIs regimes. The two rows correspond to the two μsCIs regimes, and the three columns correspond to the three selected predictors. Each thin curve represents one sampled scenario, colored by normalized NOx. The curves are displayed in absolute prediction space (i.e. without centering), so both the slope and vertical spread reflect heterogeneity in the conditional model responses across different chemical backgrounds.
Figure 8 shows how responds to precursor perturbations across the high-μsCIs and low-μsCIs regimes at night. The mean ICE curves reveal that increases monotonically with all three features under both regimes; however, the response is systematically enhanced under the high-μsCIs regime, with the mean curve exhibiting a steeper and more sustained increase across the full feature range. Beyond the mean response, the spread of individual ICE curves provides insight into response heterogeneity across different atmospheric conditions. For O3, near-universal positive associations with are observed in both regimes, with neg-slope fractions of 1 % and 3 % under the high- and low-μsCIs regimes, respectively, indicating that O3 consistently promotes regardless of the μsCIs regime. For alkene %, the neg-slope fraction increases from 1 % under the high-μsCIs regime to 10 % under the low-μsCIs regime. The contrast is most pronounced for VOCs, for which the neg-slope fraction rises from 5 % under the high-μsCIs regime to 29 % under the low-μsCIs regime, with the excess negative responses in the low-μsCIs regime arising predominantly from high-NOx scenarios.
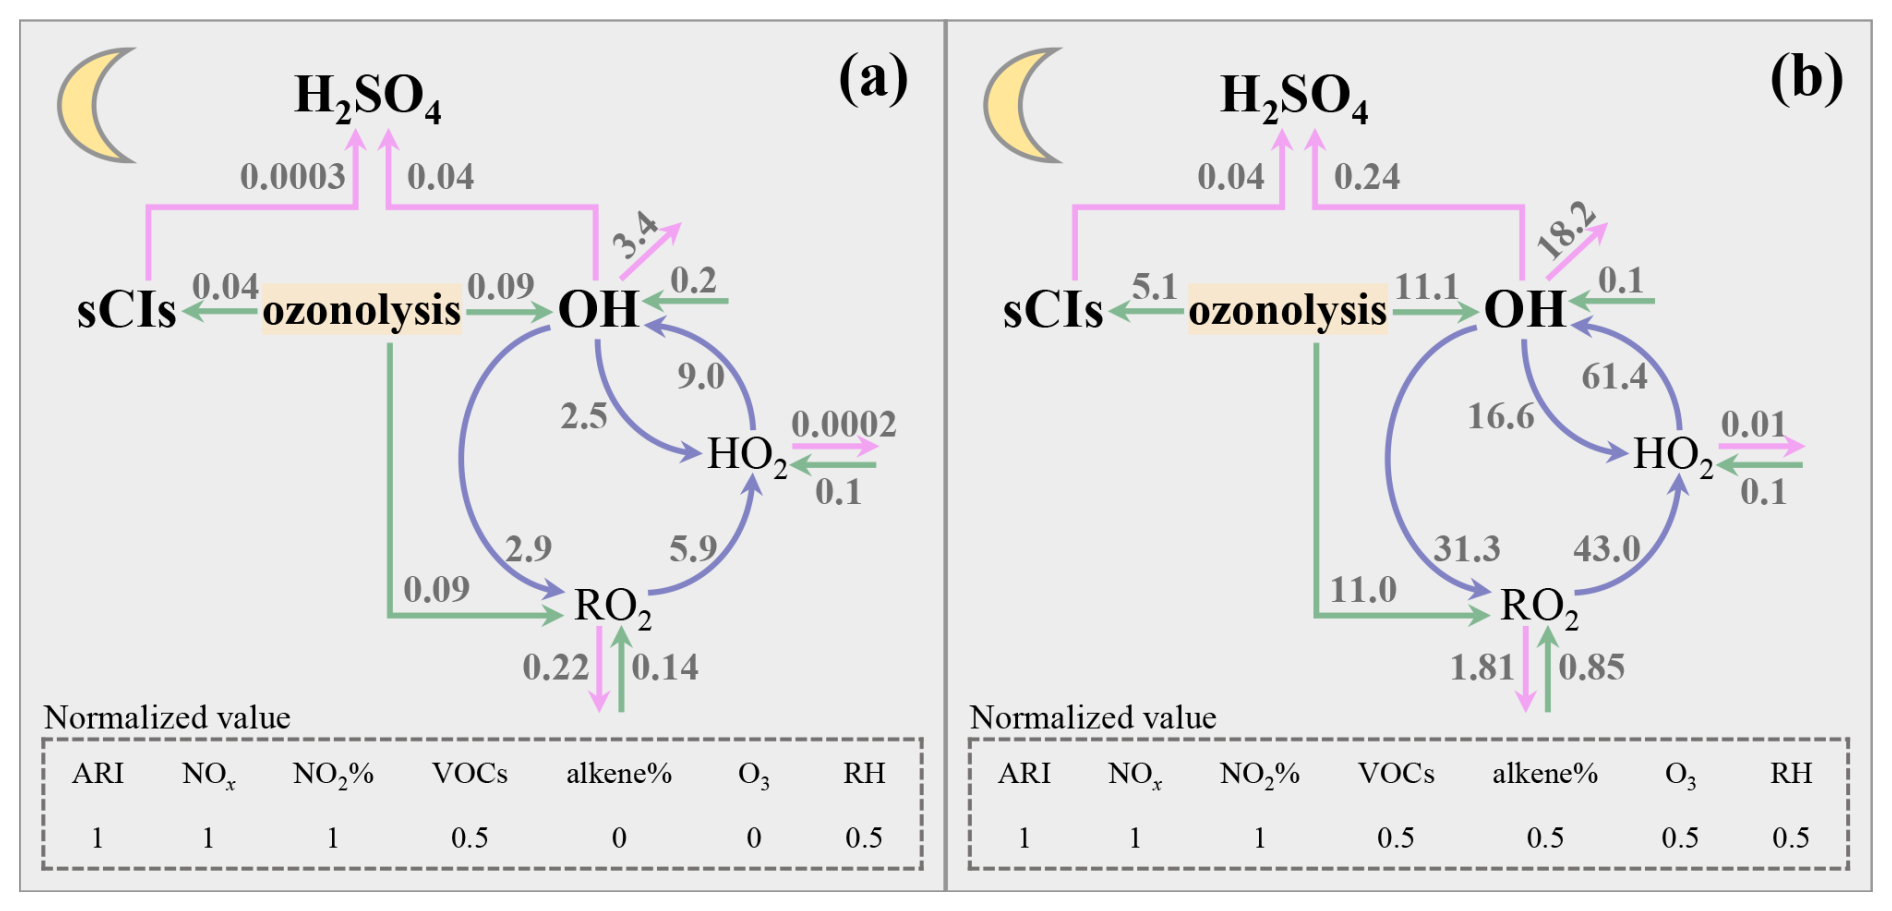
Figure 9Two representative nighttime scenarios illustrating the budgets of OH and sCIs corresponding to (a) the low-μsCIs regime (μsCIs = 0.008) and (b) the high-μsCIs regime (μsCIs = 0.14). Numbers denote reaction rates (106 molec. cm−3 s−1). Pink, green, and purple lines indicate the termination, initiation, and propagation pathways of OH and sCIs, respectively.
To elucidate the role of alkene ozonolysis in driving these response differences, we examined the OH and sCI budgets for two representative high-NOx scenarios corresponding to the low-μsCIs (μsCIs=0.008) and high-μsCIs (μsCIs=0.14) regimes, respectively (Fig. 9a, b). Under the low-μsCIs scenario, alkene ozonolysis accounts for 30.18 % of ∑OHnew, which is 5.56×10⁵ molec. cm−3 s−1. In contrast, under the high-μsCIs scenario, alkene ozonolysis contributes 94.24 % of ∑OHnew, which reaches 2.29×10⁷ molec. cm−3 s−1. These results show that, when alkene ozonolysis is efficient at night, it acts not only as the sole formation pathway for sCIs but also as the dominant OH initiation pathway. When alkene ozonolysis is weak, the ratio OHpropag/∑OHnew is 16.23, indicating that OH is sustained predominantly through radical cycling. In this regime, OH initiation is supplied primarily by photolysis in the early morning hours, with a smaller contribution from ozonolysis. Reducing total VOCs does not affect the photolytic OH initiation source, but decreases the OH–to–RO2 flux and thus weakens OH loss through VOC oxidation. Provided that radical recycling efficiency changes little, this reduction in OH reactivity can slightly increase steady-state OH and . Because the alkene-derived sCI flux is negligible in this regime, is close to zero. The OH-mediated response can therefore dominate, producing a net increase in as VOCs decrease (a negative slope). Conversely, when alkene ozonolysis is strong, it simultaneously serves as the dominant OH initiation source and the principal sCI formation pathway. The ratio OHpropag/∑OHnew decreases to 2.68, far below that under weak ozonolysis, indicating a much greater relative contribution of initiation to OH. Under these conditions, VOC perturbations influence the OH- and sCI-mediated SO2 oxidation pathways in the same direction, thereby reducing the occurrence of negative responses. Between the two scenarios, the rates of ozonolysis-driven sCI and OH formation increase by factors of 127.5 and 123.3, respectively. Accordingly, the rate at which sCIs form H2SO4 increases by a factor of 133, whereas the rate at which OH forms H2SO4 increases by only a factor of six. This difference arises because OH reacts with alkenes and is incorporated into the ROx cycle, such that part of the additional OH production supports radical cycling rather than directly increasing steady-state OH. The contrasting neg-slope fractions for VOCs and alkene % can thus be explained by their distinct chemical roles. Reducing alkene % simultaneously weakens a primary OH initiation source and the sCI formation pathway, such that declines almost universally. By contrast, reducing total VOCs primarily lowers OH reactivity rather than suppressing OH initiation under alkene-poor conditions corresponding to the low-μsCIs regime. The resulting increase in OH-mediated oxidation can outweigh the negligible change in the sCI pathway, producing a negative response (neg-slope =29 %).
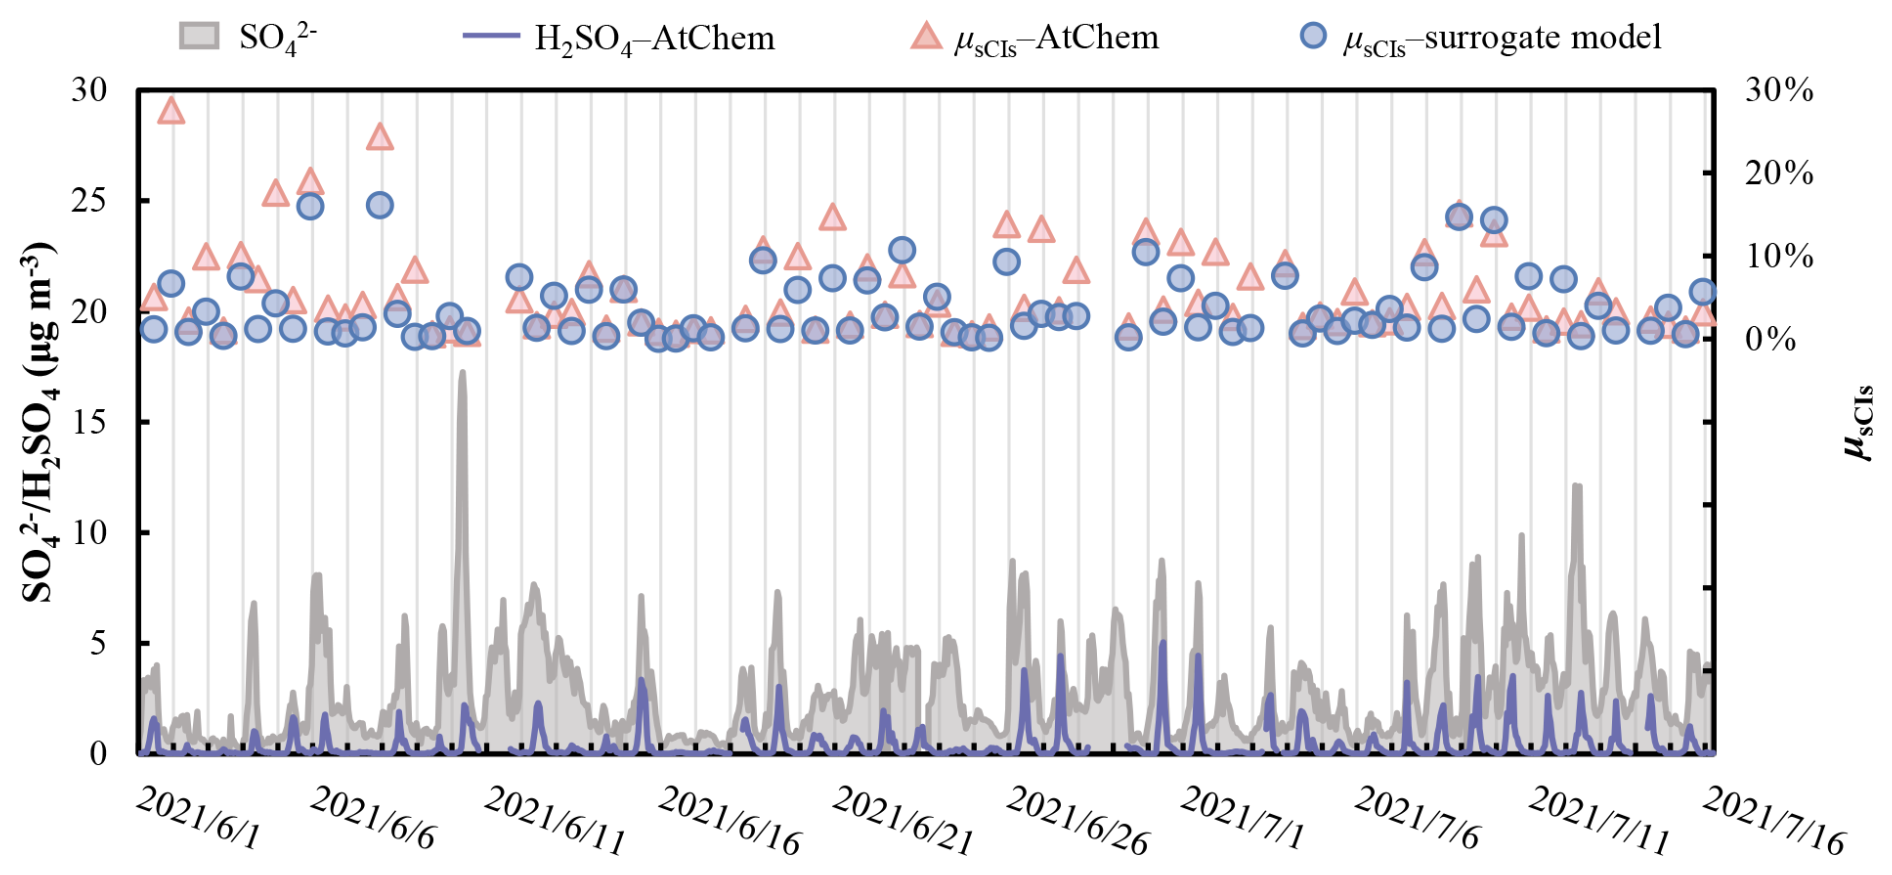
Figure 10Constrained AtChem–MCM v3.3.1 simulations for a summer episode in Wuhai City (1 June–15 July 2021), showing time series of H2SO4–AtChem (AtChem-simulated sulfuric acid concentration), μsCIs–AtChem (AtChem-simulated fractional contribution of sCIs to total SO2 oxidation), SO (concurrently measured ambient particulate sulfate mass concentration), and μsCIs-surrogate model (daytime- and nighttime-averaged μsCIs predicted by the surrogate model).
3.3 Observational–model corroboration for regime-dependent sensitivities of SO2 oxidation
To validate the predictive capability of the surrogate model developed in Sect. 3.2 for μsCIs, and to evaluate how the sensitivity of SO2 oxidation to its precursors depends on the relative contributions of sCIs in ambient air, we selected a summer episode in Wuhai City as a real-atmosphere validation case. Figure 10 presents the constrained simulation results derived from AtChem–MCM v3.3.1, including time series of sulfuric acid concentrations (H2SO4–AtChem) and the daytime- and nighttime-averaged fractional contributions of sCIs to total SO2 oxidation (μsCIs–AtChem) over the period 1 June to 15 July 2021. The corresponding pollutant mixing ratios and meteorological parameters are shown in Fig. S3. SO denotes the ambient particulate sulfate mass concentrations measured concurrently by online ion chromatography. The term “μsCIs–surrogate model” represents the daytime- and nighttime-averaged μsCIs predictions generated by the surrogate model described in Sect. 3.2. The strong agreement (R2=0.75) between the surrogate predictions (μsCIs–surrogate model) and the explicit AtChem simulations (μsCIs–AtChem) demonstrates the robust predictive performance of the constructed machine learning surrogate for μsCIs.
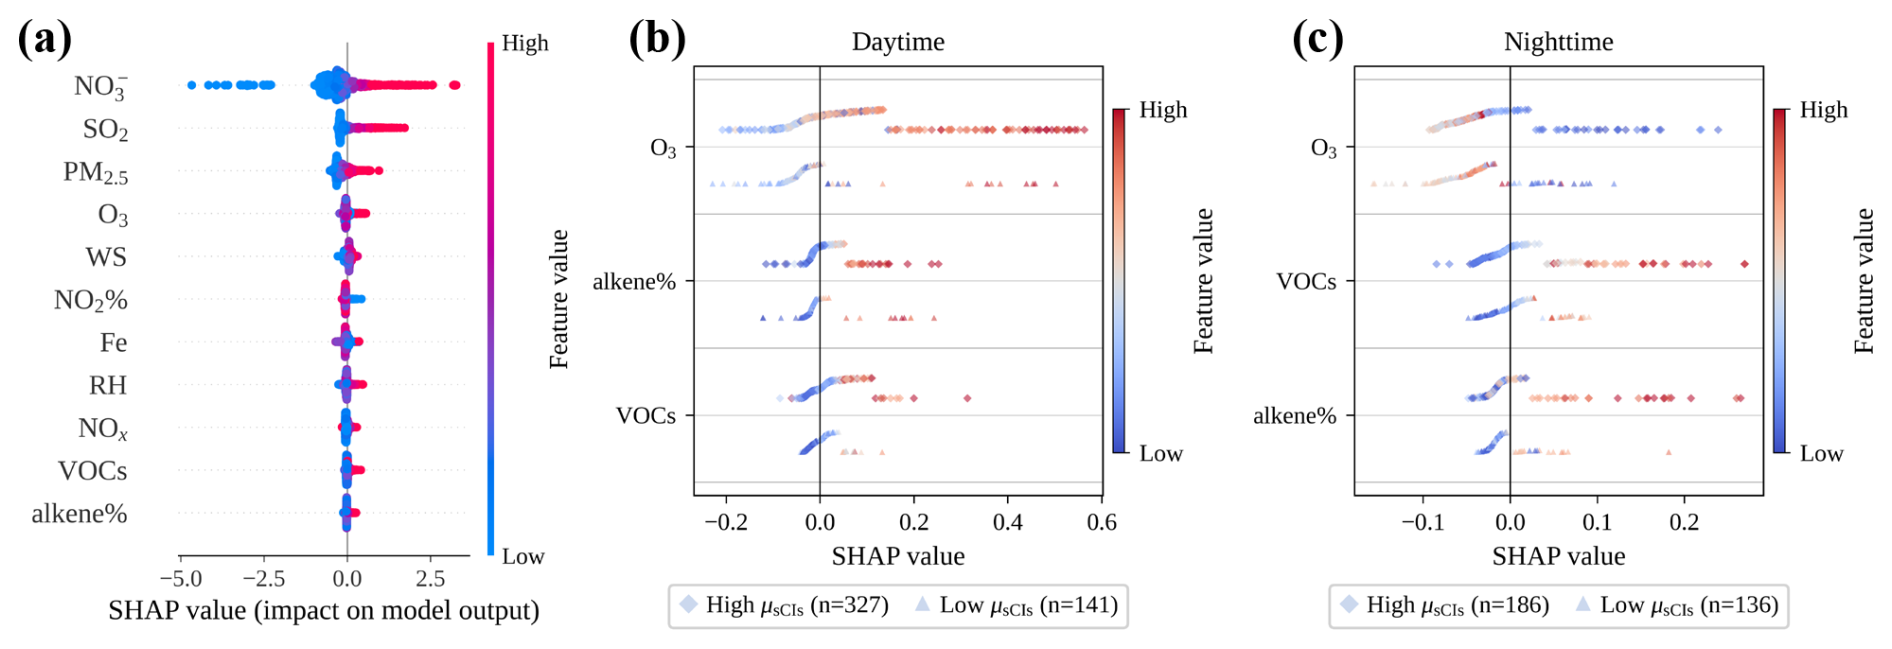
Figure 11(a) SHAP beeswarm summary plot for the observation-based XGBoost model of ambient SO. Each point represents one hourly observation, positioned according to the SHAP value of the corresponding predictor. Positive SHAP values indicate that the predictor increases the model-predicted SO concentration, whereas negative values indicate a suppressing effect. Point colour denotes the predictor magnitude from low to high. Features are ordered by mean absolute SHAP value, so the plot summarizes both the relative importance and the directionality of the physically interpretable features. (b) Comparison of SHAP beeswarm plots for the observation-based XGBoost model under daytime low- and high-μsCIs regimes. Each point represents one hourly observation in the corresponding subset. The horizontal position gives the SHAP value, and the color indicates the feature value. Differences between the two panels illustrate how the relative importance and directional effects of observed predictors on ambient SO vary between daytime chemical regimes with low and high inferred sCI contributions. (c) Comparison of SHAP beeswarm plots for the observation-based XGBoost model under nighttime low- and high-μsCIs regimes. Each point represents one hourly observation in the corresponding subset. The horizontal position gives the SHAP value, and the color indicates the feature value. Differences between the two panels illustrate how the relative importance and directional effects of observed predictors on ambient SO vary between nighttime chemical regimes with low and high inferred sCI contributions.
To evaluate whether ambient SO concentrations serve as a reliable proxy for gas-phase H2SO4 production during the target episode, an XGBoost model was trained on a comprehensive long-term observational dataset spanning 9 October 2019 to 30 June 2022 (summary statistics of all variables are provided in Table S4), with hourly SO concentration as the target variable. The feature set included PM2.5, NO, SO2, O3, VOCs, alkene %, NOx, NO2 %, RH, wind speed (WS), and Fe. Training over this extended period ensures that the model captures the full range of variability in sulfate formation, including seasonal cycles, episodic pollution events, and varying meteorological regimes, thereby establishing a representative and well-generalized mapping between precursor conditions and SO. SHAP values were then extracted exclusively for the target episode (1 June to 15 July 2021) to attribute feature contributions during this specific period. As shown in Fig. 11a, the three highest-ranked features are NO, SO2, and PM2.5, all of which exhibit clear positive correlations with SO. The elevated NO co-occurs with SO, together with the concurrent increase in PM2.5, consistent with the hallmark of secondary inorganic aerosol formation (Gao et al., 2021). The strong positive SHAP contribution of SO2 directly corroborates its role as the primary precursor for SO production. Notably, WS also exerts a discernible positive contribution, suggesting a degree of regional transport influence during this episode, although its impact remains secondary to in situ chemical production. By contrast, RH shows no significant positive correlation with SO and ranks relatively low in feature importance. Fe, a key catalyst for aqueous-phase SO2 oxidation via Fenton-type chemistry (Ye et al., 2023), shows no clear positive association with SO, with elevated ambient Fe concentrations not corresponding to enhanced sulfate formation. Taken together, these results indicate that aqueous-phase oxidation was not the dominant SO formation pathway during the target episode. Meanwhile, O3, VOCs, and alkene %, which serve as key proxies of gas-phase oxidant pathways, exhibit positive correlations with SO, providing evidence that gas-phase oxidation constituted the primary sulfate formation pathway during this period. On this basis, ambient SO concentrations can be regarded as a reliable observational proxy for the variability in total gas-phase H2SO4 production during the target episode.
To further examine whether the sensitivity of SO to key precursors is consistent with the regime-dependent behavior of identified in Sect. 3.2, the target episode was partitioned into high- and low-μsCIs subsets for daytime and nighttime periods separately, using the same classification thresholds applied in Sect. 3.2 (daytime: 1.1 %; nighttime: 8.0 %). SHAP values for O3, VOCs, and alkene % were extracted for each subset and compared. During the daytime (Fig. 11b), the high-μsCIs subset exhibits systematically amplified SHAP responses relative to the low-μsCIs subset across all three features. O3 shows the most pronounced regime contrast: in the high-μsCIs subset, high feature values (red) are associated with distinctly larger positive SHAP contributions and a considerably wider spread, whereas the corresponding responses in the low-μsCIs subset are substantially attenuated. VOCs and alkene % follow the same pattern, with high feature values driving larger positive SHAP contributions under high-μsCIs conditions. This daytime regime contrast is consistent with the finding in Sect. 3.2 that the sensitivity of SO2 oxidation to O3, VOCs, and alkene % is amplified under high-μsCIs conditions, providing observational corroboration of that mechanistic result. At night (Fig. 11c), VOCs and alkene % exhibit stronger positive SHAP contributions to SO in the high-μsCIs subset, consistent with their roles in promoting both sCIs and OH formation through nocturnal alkene ozonolysis. By contrast, O3 exhibits negative SHAP contributions in both subsets, which can be attributed to the distinct behavior of O3 at night: nocturnal O3 is primarily of advective origin rather than in situ photochemical production, and elevated O3 concentrations are often associated with suppressed local NO levels due to rapid O3–NO titration. Taken together, the regime-dependent SO sensitivity patterns observed during the target episode (Fig. 11b, c) provide observational validation for the mechanistic findings derived from the AtChem-based surrogate model simulations in Sect. 3.2, confirming that these findings are manifested in ambient atmospheric measurements. This cross-validation between model-diagnosed sensitivity and observation-based attribution reinforces the conclusion that under high-μsCIs regimes, alkene-targeted emission control strategies can effectively reduce sCIs and suppress the total SO2 oxidation rate, while rarely triggering a rebound in OH-driven oxidation pathways.
Sulfuric acid plays a central role in atmospheric aerosol formation, yet effective mitigation requires quantifying the sensitivity of H2SO4 formation to its precursors, which varies across atmospheric conditions as the relative contributions of different gas-phase SO2 oxidation pathways shift. By treating sCIs as reactive intermediate species linking precursor emissions to H2SO4 formation, this study deploys an interpretable multi-target XGBoost modeling framework trained on ensemble box-model simulations incorporating updated CI chemistry. This framework determines the controls on sCI-mediated SO2 oxidation () and on the fractional sCI contribution (μsCIs), while establishing how the regime of μsCIs itself reshapes the sensitivity of total SO2 oxidation () to its precursors.
is dominated by RH (29.5 %) and isoprene (23.8 %), revealing that low humidity and high biogenic emissions primarily promote the sCI-mediated oxidation pathways. For μsCIs, the dominant controlling factors exhibit a pronounced diurnal shift: daytime control resides in alkene reactivity (ARI), O3, alkene fraction, and total VOCs, whereas nighttime control transitions to ARI, RH, and NOx. High-μsCIs regimes uniformly amplify positive sensitivities to O3, VOCs, and alkene %, while decreasing the frequency of occasional negative responses to VOCs or alkene %. Observation-based modeling of a Wuhai summer episode with SHAP-based attribution of ambient sulfate provided support for this regime dependence.
Previous studies have extensively reported the contribution of the SO2 + sCI reaction to total sCI loss (Cox et al., 2020), and the contribution of sCIs to overall SO2 oxidation across diverse atmospheric conditions (Khan et al., 2018). Building on the understanding that sCI chemistry constitutes one pathway for SO2 oxidation and that sCIs are secondarily formed atmospheric intermediates, this study no longer treats them as terminal oxidants but rather takes seriously their role as an intermediate species and establishes quantitative relationships linking controlling factors to both the sCI-mediated SO2 oxidation rate and its fractional contribution to total SO2 oxidation. The resulting picture goes beyond estimating the sCI contribution for an individual scenario, extending instead to a predictive understanding of the role sCIs may play across a wider range of atmospheric conditions. By further analyzing how the sensitivity of total SO2 oxidation to factor perturbations varies among internal oxidation regimes characterized by different μsCIs values, this work provides a scientific basis for developing strategies to mitigate H2SO4 formation. Beyond these mechanistic-sensitivity insights, the interpretable surrogate modeling framework developed here offers a transferable approach for distilling quantitative relationships between reactants and products from complex reaction networks. By linking targeted box-model scenario design to machine-learning-based sensitivity diagnostics, this methodology enables efficient identification of dominant kinetic controls – providing a basis for prioritizing kinetic processes for explicit representation when developing lumped chemical mechanisms for chemical transport models.
It should be noted that applying these findings to real-world atmospheric phenomena requires recognizing specific applicability conditions. While key feature variables were explicitly modeled, capturing full atmospheric variability also requires future integration of transport, deposition, multiphase processes, temperature dependence, and other factors. Additionally, our 100 % SO3 yield assumption for the sCI + SO2 reaction establishes an upper bound for absolute sCI-mediated H2SO4 production and fractional contributions. Because this yield functions as a linear scaling factor, absolute magnitudes may be overestimated, but the underlying functional relationships between controlling factors and sCI chemistry remain unchanged.
The dataset supporting the findings of this study is publicly available from Zenodo (Zhu, 2026) at https://doi.org/10.5281/zenodo.21969205.
The supplement related to this article is available online at https://doi.org/10.5194/acp-26-12479-2026-supplement.
YZ developed the methodology, performed data curation, visualization, formal analysis, and wrote the original draft. QC conceptualized the study, contributed to formal analysis, acquired funding, and reviewed and edited the manuscript. LH and WG participated in the revision of the manuscript. CS, DG, LJ, and GY contributed to data curation.
The contact author has declared that none of the authors has any competing interests.
Publisher's note: Copernicus Publications remains neutral with regard to jurisdictional claims made in the text, published maps, institutional affiliations, or any other geographical representation in this paper. The authors bear the ultimate responsibility for providing appropriate place names. Views expressed in the text are those of the authors and do not necessarily reflect the views of the publisher.
We thank the editors and anonymous reviewers for their valuable comments on the manuscript. During the preparation of this work, we used ChatGPT to proofread and refine the English expression of the manuscript. This included correcting grammatical errors, enhancing clarity, and improving the overall flow and coherence of the text. After using this tool, we reviewed and edited the content and take full responsibility for the content of the published article.
This research has been supported by the Lanzhou Science and Technology Bureau (project no. 2022-2-15) and the National Natural Science Foundation of China (grant no. 42305118).
This paper was edited by Lisa Whalley and reviewed by two anonymous referees.
Boy, M., Mogensen, D., Smolander, S., Zhou, L., Nieminen, T., Paasonen, P., Plass-Dülmer, C., Sipilä, M., Petäjä, T., Mauldin, L., Berresheim, H., and Kulmala, M.: Oxidation of SO2 by stabilized Criegee intermediate (sCI) radicals as a crucial source for atmospheric sulfuric acid concentrations, Atmos. Chem. Phys., 13, 3865–3879, https://doi.org/10.5194/acp-13-3865-2013, 2013.
Cao, J., Qiu, X., Gao, J., Wang, F., Wang, J., Wu, J., and Peng, L.: Significant decrease in SO2 emission and enhanced atmospheric oxidation trigger changes in sulfate formation pathways in China during 2008–2016, J. Clean. Prod., 326, 129396, https://doi.org/10.1016/j.jclepro.2021.129396, 2021.
Cao, J., Zheng, B., Chen, J., and Liu, Y.: Assessment of sulfate and nitrate variations in China during 1990–2020: Insights into source contributions and formation pathways, J. Hazard. Mater., 489, 137600, https://doi.org/10.1016/j.jhazmat.2025.137600, 2025.
Chen, T. and Guestrin, C.: XGBoost: A Scalable Tree Boosting System, in: Proceedings of the 22nd ACM SIGKDD International Conference on Knowledge Discovery and Data Mining, KDD '16: The 22nd ACM SIGKDD International Conference on Knowledge Discovery and Data Mining, San Francisco California USA, 785–794, https://doi.org/10.1145/2939672.2939785, 2016.
Cox, R. A. and Penkett, S. A.: Oxidation of Atmospheric SO2 by Products of the Ozone–Olefin Reaction, Nature, 230, 321–322, https://doi.org/10.1038/230321a0, 1971.
Cox, R. A., Ammann, M., Crowley, J. N., Herrmann, H., Jenkin, M. E., McNeill, V. F., Mellouki, A., Troe, J., and Wallington, T. J.: Evaluated kinetic and photochemical data for atmospheric chemistry: Volume VII – Criegee intermediates, Atmos. Chem. Phys., 20, 13497–13519, https://doi.org/10.5194/acp-20-13497-2020, 2020.
Dada, L., Ylivinkka, I., Baalbaki, R., Li, C., Guo, Y., Yan, C., Yao, L., Sarnela, N., Jokinen, T., Daellenbach, K. R., Yin, R., Deng, C., Chu, B., Nieminen, T., Wang, Y., Lin, Z., Thakur, R. C., Kontkanen, J., Stolzenburg, D., Sipilä, M., Hussein, T., Paasonen, P., Bianchi, F., Salma, I., Weidinger, T., Pikridas, M., Sciare, J., Jiang, J., Liu, Y., Petäjä, T., Kerminen, V.-M., and Kulmala, M.: Sources and sinks driving sulfuric acid concentrations in contrasting environments: implications on proxy calculations, Atmos. Chem. Phys., 20, 11747–11766, https://doi.org/10.5194/acp-20-11747-2020, 2020.
Dai, Q., Bi, X., Song, W., Li, T., Liu, B., Ding, J., Xu, J., Song, C., Yang, N., Schulze, B. C., Zhang, Y., Feng, Y., and Hopke, P. K.: Residential coal combustion as a source of primary sulfate in Xi'an, China, Atmos. Environ., 196, 66–76, https://doi.org/10.1016/j.atmosenv.2018.10.002, 2019.
Friedman, J. H.: Greedy function approximation: A gradient boosting machine, Ann. Stat., 29, 1189–1232, https://doi.org/10.1214/aos/1013203451, 2001.
Gao, J., Li, Y., Li, J., Shi, G., Liu, Z., Han, B., Tian, X., Wang, Y., Feng, Y., and Russell, A. G.: Impact of Formation Pathways on Secondary Inorganic Aerosol During Haze Pollution in Beijing: Quantitative Evidence From High‐Resolution Observation and Modeling, Geophys. Res. Lett., 48, e2021GL095623, https://doi.org/10.1029/2021GL095623, 2021.
Geng, G., Zheng, Y., Zhang, Q., Xue, T., Zhao, H., Tong, D., Zheng, B., Li, M., Liu, F., Hong, C., He, K., and Davis, S. J.: Drivers of PM2.5 air pollution deaths in China 2002–2017, Nat. Geosci., 14, 645–650, https://doi.org/10.1038/s41561-021-00792-3, 2021.
Giorio, C., Doussin, J., D'Anna, B., Mas, S., Filippi, D., Denjean, C., Mallet, M. D., Bourrianne, T., Burnet, F., Cazaunau, M., Chikwililwa, C., Desboeufs, K., Feron, A., Michoud, V., Namwoonde, A., Andreae, M. O., Piketh, S. J., and Formenti, P.: Butene Emissions From Coastal Ecosystems May Contribute to New Particle Formation, Geophys. Res. Lett., 49, e2022GL098770, https://doi.org/10.1029/2022GL098770, 2022.
Goldstein, A., Kapelner, A., Bleich, J., and Pitkin, E.: Peeking Inside the Black Box: Visualizing Statistical Learning With Plots of Individual Conditional Expectation, J. Comput. Graph. Stat., 24, 44–65, https://doi.org/10.1080/10618600.2014.907095, 2015.
Gunthe, S. S., Rose, D., Su, H., Garland, R. M., Achtert, P., Nowak, A., Wiedensohler, A., Kuwata, M., Takegawa, N., Kondo, Y., Hu, M., Shao, M., Zhu, T., Andreae, M. O., and Pöschl, U.: Cloud condensation nuclei (CCN) from fresh and aged air pollution in the megacity region of Beijing, Atmos. Chem. Phys., 11, 11023–11039, https://doi.org/10.5194/acp-11-11023-2011, 2011.
Guo, W., Yang, Y., Chen, Q., Zhu, Y., Zhang, Y., Zhang, Y., Liu, Y., Li, G., Sun, W., and She, J.: Chemical reactivity of volatile organic compounds and their effects on ozone formation in a petrochemical industrial area of Lanzhou, Western China, Sci. Total Environ., 839, 155901, https://doi.org/10.1016/j.scitotenv.2022.155901, 2022.
Guo, Y., Yan, C., Li, C., Ma, W., Feng, Z., Zhou, Y., Lin, Z., Dada, L., Stolzenburg, D., Yin, R., Kontkanen, J., Daellenbach, K. R., Kangasluoma, J., Yao, L., Chu, B., Wang, Y., Cai, R., Bianchi, F., Liu, Y., and Kulmala, M.: Formation of nighttime sulfuric acid from the ozonolysis of alkenes in Beijing, Atmos. Chem. Phys., 21, 5499–5511, https://doi.org/10.5194/acp-21-5499-2021, 2021.
Hata, H., Hoshino, S., Fujita, M., and Tonokura, K.: Atmospheric impact of isoprene-derived Criegee intermediates and isoprene hydroxy hydroperoxide on sulfate aerosol formation in the Asian region, Atmos. Environ., 20, 100226, https://doi.org/10.1016/j.aeaoa.2023.100226, 2023.
Herman, J. and Usher, W.: SALib: An open-source Python library for Sensitivity Analysis, JOSS, 2, 97, https://doi.org/10.21105/joss.00097, 2017.
Jenkin, M. E., Saunders, S. M., and Pilling, M. J.: The tropospheric degradation of volatile organic compounds: a protocol for mechanism development, Atmos. Environ., 31, 81–104, https://doi.org/10.1016/S1352-2310(96)00105-7, 1997.
Jenkin, M. E., Young, J. C., and Rickard, A. R.: The MCM v3.3.1 degradation scheme for isoprene, Atmos. Chem. Phys., 15, 11433–11459, https://doi.org/10.5194/acp-15-11433-2015, 2015.
Khan, M. A. H., Morris, W. C., Galloway, M., Shallcross, B. M. A., Percival, C. J., and Shallcross, D. E.: An Estimation of the Levels of Stabilized Criegee Intermediates in the UK Urban and Rural Atmosphere Using the Steady-State Approximation and the Potential Effects of These Intermediates on Tropospheric Oxidation Cycles, Int. J. Chem. Kinet., 49, 611–621, https://doi.org/10.1002/kin.21101, 2017.
Khan, M. A. H., Percival, C. J., Caravan, R. L., Taatjes, C. A., and Shallcross, D. E.: Criegee intermediates and their impacts on the troposphere, Environ. Sci.: Processes Impacts, 20, 437–453, https://doi.org/10.1039/C7EM00585G, 2018.
Kim, S., Guenther, A., Lefer, B., Flynn, J., Griffin, R., Rutter, A. P., Gong, L., and Cevik, B. K.: Potential Role of Stabilized Criegee Radicals in Sulfuric Acid Production in a High Biogenic VOC Environment, Environ. Sci. Technol., 49, 3383–3391, https://doi.org/10.1021/es505793t, 2015.
Kukui, A., Chartier, M., Wang, J., Chen, H., Dusanter, S., Sauvage, S., Michoud, V., Locoge, N., Gros, V., Bourrianne, T., Sellegri, K., and Pichon, J.-M.: Role of Criegee intermediates in the formation of sulfuric acid at a Mediterranean (Cape Corsica) site under influence of biogenic emissions, Atmos. Chem. Phys., 21, 13333–13351, https://doi.org/10.5194/acp-21-13333-2021, 2021.
Lade, R. E., Blitz, M. A., Rowlinson, M., Evans, M. J., Seakins, P. W., and Stone, D.: Kinetics of the reactions of the Criegee intermediate CH2OO with water vapour: experimental measurements as a function of temperature and global atmospheric modelling, Environ. Sci.: Atmos., 4, 1294–1308, https://doi.org/10.1039/D4EA00097H, 2024.
Li, J., Ying, Q., Yi, B., and Yang, P.: Role of stabilized Criegee Intermediates in the formation of atmospheric sulfate in eastern United States, Atmos. Environ., 79, 442–447, https://doi.org/10.1016/j.atmosenv.2013.06.048, 2013.
Lu, K., Guo, S., Tan, Z., Wang, H., Shang, D., Liu, Y., Li, X., Wu, Z., Hu, M., and Zhang, Y.: Exploring atmospheric free-radical chemistry in China: the self-cleansing capacity and the formation of secondary air pollution, Natl. Sci. Rev., 6, 579–594, https://doi.org/10.1093/nsr/nwy073, 2019.
Lundberg, S. M. and Lee, S.-I.: A Unified Approach to Interpreting Model Predictions, Neural Inf. Process. Syst., arXiv [preprint], https://doi.org/10.48550/arXiv.1705.07874, 2017.
Lundberg, S. M., Nair, B., Vavilala, M. S., Horibe, M., Eisses, M. J., Adams, T., Liston, D. E., Low, D. K.-W., Newman, S.-F., Kim, J., and Lee, S.-I.: Explainable machine-learning predictions for the prevention of hypoxaemia during surgery, Nat. Biomed. Eng., 2, 749–760, https://doi.org/10.1038/s41551-018-0304-0, 2018.
Lundberg, S. M., Erion, G. G., and Lee, S.-I.: Consistent Individualized Feature Attribution for Tree Ensembles, arXiv [preprint], https://doi.org/10.48550/arXiv.1802.03888, 7 March 2019.
Lundberg, S. M., Erion, G., Chen, H., DeGrave, A., Prutkin, J. M., Nair, B., Katz, R., Himmelfarb, J., Bansal, N., and Lee, S.-I.: From local explanations to global understanding with explainable AI for trees, Nat. Mach. Intell., 2, 56–67, https://doi.org/10.1038/s42256-019-0138-9, 2020.
Mauldin, R. L., Berndt, T., Sipilä, M., Paasonen, P., Petäjä, T., Kim, S., Kurtén, T., Stratmann, F., Kerminen, V.-M., and Kulmala, M.: A new atmospherically relevant oxidant of sulphur dioxide, Nature, 488, 193–196, https://doi.org/10.1038/nature11278, 2012.
Meidan, D., Holloway, J. S., Edwards, P. M., Dubé, W. P., Middlebrook, A. M., Liao, J., Welti, A., Graus, M., Warneke, C., Ryerson, T. B., Pollack, I. B., Brown, S. S., and Rudich, Y.: Role of Criegee Intermediates in Secondary Sulfate Aerosol Formation in Nocturnal Power Plant Plumes in the Southeast US, ACS Earth and Space Chem., 3, 748–759, https://doi.org/10.1021/acsearthspacechem.8b00215, 2019.
Newland, M. J., Rickard, A. R., Alam, M. S., Vereecken, L., Muñoz, A., Ródenas, M., and Bloss, W. J.: Kinetics of stabilised Criegee intermediates derived from alkene ozonolysis: reactions with SO2, H2O and decomposition under boundary layer conditions, Phys. Chem. Chem. Phys., 17, 4076–4088, https://doi.org/10.1039/C4CP04186K, 2015.
Onel, L., Lade, R., Mortiboy, J., Blitz, M. A., Seakins, P. W., Heard, D. E., and Stone, D.: Kinetics of the gas phase reaction of the Criegee intermediate CH2OO with SO2 as a function of temperature, Phys. Chem. Chem. Phys., 23, 19415–19423, https://doi.org/10.1039/D1CP02932K, 2021.
Quaas, J., Jia, H., Smith, C., Albright, A. L., Aas, W., Bellouin, N., Boucher, O., Doutriaux-Boucher, M., Forster, P. M., Grosvenor, D., Jenkins, S., Klimont, Z., Loeb, N. G., Ma, X., Naik, V., Paulot, F., Stier, P., Wild, M., Myhre, G., and Schulz, M.: Robust evidence for reversal of the trend in aerosol effective climate forcing, Atmos. Chem. Phys., 22, 12221–12239, https://doi.org/10.5194/acp-22-12221-2022, 2022.
Rhew, R. C., Deventer, M. J., Turnipseed, A. A., Warneke, C., Ortega, J., Shen, S., Martinez, L., Koss, A., Lerner, B. M., Gilman, J. B., Smith, J. N., Guenther, A. B., and de Gouw, J. A.: Ethene, propene, butene and isoprene emissions from a ponderosa pine forest measured by relaxed eddy accumulation, Atmos. Chem. Phys., 17, 13417–13438, https://doi.org/10.5194/acp-17-13417-2017, 2017.
Ruscic, B.: Active Thermochemical Tables: Water and Water Dimer, J. Phys. Chem. A, 117, 11940–11953, https://doi.org/10.1021/jp403197t, 2013.
Saltelli, A.: Making best use of model evaluations to compute sensitivity indices, Comput. Phys. Commun., 145, 280–297, https://doi.org/10.1016/S0010-4655(02)00280-1, 2002.
Saltelli, A., Annoni, P., Azzini, I., Campolongo, F., Ratto, M., and Tarantola, S.: Variance based sensitivity analysis of model output. Design and estimator for the total sensitivity index, Comput. Phys. Commun., 181, 259–270, https://doi.org/10.1016/j.cpc.2009.09.018, 2010.
Sarwar, G., Simon, H., Fahey, K., Mathur, R., Goliff, W. S., and Stockwell, W. R.: Impact of sulfur dioxide oxidation by Stabilized Criegee Intermediate on sulfate, Atmos. Environ., 85, 204–214, https://doi.org/10.1016/j.atmosenv.2013.12.013, 2014.
Saunders, S. M., Jenkin, M. E., Derwent, R. G., and Pilling, M. J.: Protocol for the development of the Master Chemical Mechanism, MCM v3 (Part A): tropospheric degradation of non-aromatic volatile organic compounds, Atmos. Chem. Phys., 3, 161–180, https://doi.org/10.5194/acp-3-161-2003, 2003.
Scribano, Y., Goldman, N., Saykally, R. J., and Leforestier, C.: Water Dimers in the Atmosphere III: Equilibrium Constant from a Flexible Potential, J. Phys. Chem. A, 110, 5411–5419, https://doi.org/10.1021/jp056759k, 2006.
Sheehy, P. M., Volkamer, R., Molina, L. T., and Molina, M. J.: Oxidative capacity of the Mexico City atmosphere – Part 2: A ROx radical cycling perspective, Atmos. Chem. Phys., 10, 6993–7008, https://doi.org/10.5194/acp-10-6993-2010, 2010.
Sillman, S. and He, D.: Some theoretical results concerning O3–NOx–VOC chemistry and NOx–VOC indicators, J. Geophys. Res.-Atmos., 107, https://doi.org/10.1029/2001JD001123, 2002.
Sobol, I. M.: Global sensitivity indices for nonlinear mathematical models and their Monte Carlo estimates, Math. Comput. Simulat., 55, 271–280, https://doi.org/10.1016/S0378-4754(00)00270-6, 2001.
Sommariva, R., Cox, S., Martin, C., Borońska, K., Young, J., Jimack, P. K., Pilling, M. J., Matthaios, V. N., Nelson, B. S., Newland, M. J., Panagi, M., Bloss, W. J., Monks, P. S., and Rickard, A. R.: AtChem (version 1), an open-source box model for the Master Chemical Mechanism, Geosci. Model Dev., 13, 169–183, https://doi.org/10.5194/gmd-13-169-2020, 2020.
Song, X., Yi, J., Chen, Y., Su, Y., Wang, H., Liu, A., Wu, D., and Li, Q.: Condensable particulate matter emissions regulated by flue gas desulfurization technologies in typical industrial plants, J. Hazard. Mater., 489, 137527, https://doi.org/10.1016/j.jhazmat.2025.137527, 2025.
Taatjes, C. A., Welz, O., Eskola, A. J., Savee, J. D., Scheer, A. M., Shallcross, D. E., Rotavera, B., Lee, E. P. F., Dyke, J. M., Mok, D. K. W., Osborn, D. L., and Percival, C. J.: Direct Measurements of Conformer-Dependent Reactivity of the Criegee Intermediate CH3CHOO, Science, 340, 177–180, https://doi.org/10.1126/science.1234689, 2013.
Vereecken, L., Harder, H., and Novelli, A.: The reaction of Criegee intermediates with NO, RO2, and SO2, and their fate in the atmosphere, Phys. Chem. Chem. Phys., 14, 14682, https://doi.org/10.1039/c2cp42300f, 2012.
Vereecken, L., Novelli, A., and Taraborrelli, D.: Unimolecular decay strongly limits the atmospheric impact of Criegee intermediates, Phys. Chem. Chem. Phys., 19, 31599–31612, https://doi.org/10.1039/C7CP05541B, 2017.
Wang, Z., Nie, W., Liu, Y., Yang, L., Liu, C., Zhang, Y., Yan, C., Zha, Q., Ge, D., Qi, X., Zhou, C., Chen, L., Zhou, X., Wang, L., Huang, D. D., Chi, X., and Ding, A.: Gaseous Sulfuric Acid Contributions to Sulfate Formation in Urban Atmosphere, Environ. Sci. Technol. Lett., 12, 189–195, https://doi.org/10.1021/acs.estlett.4c01028, 2025.
WHO: WHO Global Air Quality Guidelines: Particulate Matter (PM2.5 and PM10), Ozone, Nitrogen Dioxide, Sulfur Dioxide and Carbon Monoxide, 1st edn., World Health Organization, https://iris.who.int/handle/10665/345329 (last access: 31 August 2026), 2021.
Yang, L., Nie, W., Liu, Y., Xu, Z., Xiao, M., Qi, X., Li, Y., Wang, R., Zou, J., Paasonen, P., Yan, C., Xu, Z., Wang, J., Zhou, C., Yuan, J., Sun, J., Chi, X., Kerminen, V.-M., Kulmala, M., and Ding, A.: Toward Building a Physical Proxy for Gas-Phase Sulfuric Acid Concentration Based on Its Budget Analysis in Polluted Yangtze River Delta, East China, Environ. Sci. Technol., 55, 6665–6676, https://doi.org/10.1021/acs.est.1c00738, 2021.
Yao, L., Garmash, O., Bianchi, F., Zheng, J., Yan, C., Kontkanen, J., Junninen, H., Mazon, S. B., Ehn, M., Paasonen, P., Sipilä, M., Wang, M., Wang, X., Xiao, S., Chen, H., Lu, Y., Zhang, B., Wang, D., Fu, Q., Geng, F., Li, L., Wang, H., Qiao, L., Yang, X., Chen, J., Kerminen, V.-M., Petäjä, T., Worsnop, D. R., Kulmala, M., and Wang, L.: Atmospheric new particle formation from sulfuric acid and amines in a Chinese megacity, Science, 361, 278–281, https://doi.org/10.1126/science.aao4839, 2018.
Ye, C., Lu, K., Song, H., Mu, Y., Chen, J., and Zhang, Y.: A critical review of sulfate aerosol formation mechanisms during winter polluted periods, J. Environ. Sci., 123, 387–399, https://doi.org/10.1016/j.jes.2022.07.011, 2023.
Zhao, Q., Bi, J., Liu, Q., Ling, Z., Shen, G., Chen, F., Qiao, Y., Li, C., and Ma, Z.: Sources of volatile organic compounds and policy implications for regional ozone pollution control in an urban location of Nanjing, East China, Atmos. Chem. Phys., 20, 3905–3919, https://doi.org/10.5194/acp-20-3905-2020, 2020.
Zhu, Y.: Data-Revisiting the critical role of stabilized Criegee intermediates (sCIs) in sulfuric acid formation: coupling mechanistic updates with interpretable machine learning, Zenodo [data set], https://doi.org/10.5281/zenodo.21969205, 2026.