
the Creative Commons Attribution 4.0 License.
the Creative Commons Attribution 4.0 License.
 | 31 Aug 2026
Downward transport of tropical upper-tropospheric aerosols: multi-year insights from idealized simulations
Lianet Hernández Pardo

Joachim Curtius
Patrick Jöckel
J. Moritz Menken
Christopher Pöhlker
Mira Pöhlker
Anna Possner
Recent studies suggest that significant aerosol formation occurs in the tropical upper troposphere (UT). However, the impact of these particles at lower levels remains poorly understood. We present results from multi-year global EMAC simulations investigating the downward transport of UT tracers and their resulting spatial distribution. Nineteen idealized tracers were released in the tropical UT and subjected to resolved-scale advection, parameterized convection, turbulent mixing, and wet/dry deposition. Transport diagnostics are highly sensitive to source extent: the age of air at 500 hPa is ≈ 45 d for tropical-wide tracers, compared to over 250 d for regional continental sources, reflecting the importance of mixing, dilution, and source-receptor geometry. A complementary time-to-threshold diagnostic reveals faster transport pathways, with all source regions exhibiting descent times shorter than 7 d to reach 10 % of the source average. Advection dominates vertical transport, with convective and vertical diffusion parameterizations contributing marginally. Injection height exerts a stronger influence on descent time than parameterized transport or particle size in the 20–100 nm range. Tracer maxima are typically advected east of their source centers, resulting in significant concentrations (≈ 10 %–15 % of source values) in the mid-troposphere. Offline calculations show that, for initial particle numbers below ≈ 6×10⁷ kg−1, the mid-troposphere values predicted by the model are reduced by less than 10 % when coagulation is considered, but substantial deviations occur at higher concentrations. These results provide quantitative constraints on particle transport efficiency and inform expectations for aerosol distributions following UT nucleation events.
- Article
(5040 KB) - Full-text XML
- BibTeX
- EndNote


A particular pattern in the global distribution of aerosols, characterized by high concentrations of ultrafine particles (mostly nucleation- and Aitken-mode particles) in the tropical upper troposphere (UT), between ≈ 9–12 km altitude, has been documented over the last three decades (e.g., Clarke, 1993; Clarke et al., 1999; de Reus et al., 2001; Lee et al., 2003; Minikin et al., 2003; Heintzenberg et al., 2011; Andreae et al., 2018; Williamson et al., 2019a). These particles have been attributed to nucleation occurring in the outflow of deep convective clouds, associated with the transport of precursor gases (sulfuric acid and/or organic vapors) from the atmospheric boundary layer (Clarke et al., 1999; de Reus et al., 2001; Froyd et al., 2009; Weigelt et al., 2009; Heintzenberg et al., 2011; Weigel et al., 2011; Andreae et al., 2018; Curtius et al., 2024).
Enhanced aerosol content in the UT has important implications for Earth's radiation budget and may serve as a source of cloud condensation nuclei (CCN) following particle growth and downward transport (Wang et al., 2016; Varanda Rizzo et al., 2018; Andreae et al., 2018; Williamson et al., 2019a; Curtius et al., 2024). For this reason, accurately representing these aerosols is necessary in weather and climate simulations. Attempts to simulate particle production in the UT have been reported by, for instance, Zhang et al. (2010), Yu et al. (2010), English et al. (2011), Ekman et al. (2012), and Watson-Parris et al. (2019). However, it remains challenging to emulate the UT aerosol enhancement within the tropics because of the difficulties in adequately representing sources and sinks of precursor gases, chemical reactions leading to new particle formation, and transport mechanisms. Such representation depends largely on physical parameterizations, including surface emissions, cloud microphysics, convection, and aerosol/gas chemistry, as well as on dynamical feedbacks.
Specifically, transport from the tropical UT may follow different pathways. While transient phenomena – such as low- and high-pressure systems at the synoptic scale, and even mesoscale convective systems – can induce significant short-term variability, the general circulation patterns are expected to dominate in the long term. From a general circulation perspective, part of the UT air may be transported poleward within the Hadley cell and descend in the subtropics, or ascend further into the lower stratosphere above equatorial regions, where it may then be transported poleward and descend at high latitudes within the stratospheric (Brewer–Dobson) circulation on timescales of over 2 years (Brewer, 1949; Dobson and Massey, 1956; Brock et al., 1995). These mechanisms are consistent with multi-year statistics of aerosol observations showing a pronounced latitudinal gradient of aerosol concentration in the mid-to-upper troposphere, decreasing poleward from the tropics (e.g., Clarke and Kapustin, 2002). Similarly, the modeling study of Mann et al. (2012) suggests particle transport and growth from the tropical UT to the subtropical free troposphere. Merikanto et al. (2009) also showed that particle nucleation in the free troposphere and UT led a nearly zonal distribution at ground level, with maximum concentrations near the tropics likely associated with the downward branch of the Hadley cell.
Several observational studies have more directly linked downward transport to aerosol populations in the atmospheric boundary layer, with some more recent work suggesting a possible contribution from UT-origin particles (e.g., Raes, 1995; Covert et al., 1996; Clarke et al., 1998, 1999; Raes et al., 2000; Wang et al., 2016; Franco et al., 2022; Machado et al., 2021). However, observations typically sample the atmospheric state only intermittently in space and/or time, making it difficult to disentangle the transport history of sampled air masses and to distinguish among possible source levels. In other words, it remains unclear over what altitude range CCN budgets are dominated by UT-nucleated particles that grow during descent, and at what levels boundary-layer or free-tropospheric sources become dominant.
For a limited area over the unperturbed Amazon rain forest, the simulations of Zhao et al. (2020) found net downward transport over a wide altitude range, from the UT to the lower troposphere. However, the underlying mechanisms behind this downward transport and their associated timescales are not yet thoroughly understood. For example, the relative roles of isolated and organized convection versus synoptic- or large-scale subsidence remain unexplored. Studies suggest that the connection between UT aerosol formation and lower-level aerosol populations is unlikely to occur through a single direct transport mechanism. For instance, the idealized simulations of Bardakov et al. (2022) showed that Amazonian convective downdrafts can efficiently transport tracers from the middle troposphere, around 5 km, to the boundary layer, whereas direct downward transport from upper-tropospheric levels to the boundary layer within one convective event was not evident in their simulations. Similarly, Wang et al. (2023) found that particles nucleated in the UT in a 4 km-resolution regional Amazonian domain were rarely transported into the boundary layer over several days. Instead, most boundary-layer CCN arriving from higher levels originated outside the region. Because these studies focused on relatively short timescales and limited-area domains, the question remains whether, and how, UT aerosols might be transported downward on longer timescales or across broader spatial scales.
Here, we address this gap by combining multi-year global simulations with idealized tracers initialized in the UT. Our focus is on the large-scale pathways and timescales by which UT air is transported into the mid-troposphere, where subsequent smaller-scale processes may become important. To achieve such extended temporal and spatial coverage, we necessarily use a coarser resolution than most of the aforementioned studies, yet we hypothesize that this approach allows us to isolate large-scale transport pathways and capture the long-term circulation patterns capable of carrying UT air – and the aerosols it contains – downward into the mid-troposphere.
Analyzing typical transport timescales and pathways provides a first step toward characterizing the fate of freshly-nucleated UT particles. To separate transport effects from uncertainties in aerosol formation and growth, we employ inert, passive tracers under an idealized initialization scheme, assuming a constant size distribution. To estimate particle survival rates, besides accounting for intrinsic dilution caused by numerical and parameterized mixing, we incorporate removal processes via wet scavenging, sedimentation, and dry deposition. The uncertainties associated with neglecting particle growth are assessed through a sensitivity test using a larger mean size and offline estimates of the impact of coagulation.
The design of the numerical experiments and the analysis methods are detailed in Sect. 2. Results, including tracer transport timescales and spatial patterns of tracer number mixing ratio, are presented in Sect. 3. A discussion of the relevance and applicability of these results is provided in Sect. 4, followed by concluding remarks in Sect. 5.
We employed the EMAC model (Jöckel et al., 2006, 2010), which is a combination of the ECHAM5 atmospheric general circulation model (Roeckner et al., 2003) with the Modular Earth Submodel System (MESSy; Jöckel et al., 2005, 2010).
In the vertical dimension, equations are solved using finite differences (Burridge and Haseler, 1977; Simmons and Burridge, 1981), based on a hybrid pressure-based terrain-following coordinate with 90 levels and top at 1 Pa. A T106 triangular spectral truncation was chosen for the spherical harmonics dynamical core, with a corresponding 1.125° resolution (≈ 125 km at the Equator) quadratic Gaussian grid for the evaluation of advection terms and subgrid scale parameterizations. Tracer advection follows the flux-form semi-Lagrangian scheme of Lin and Rood (1996).
A semi-implicit scheme is used for time integration, with implicitness factors βDT=0.8 for divergence, temperature and surface pressure and βZQ=1 for vorticity, and with reference temperature and surface pressure of 300 K and 800 hPa, respectively (Robert et al., 1972; Robert, 1981, 1982). A time filter is used to limit the growth of spurious computational modes similar to Asselin (1972), with a time filtering coefficient ϵ=0.1.
Table 1Summary of the idealized tropical upper-tropospheric tracers and their specifications.
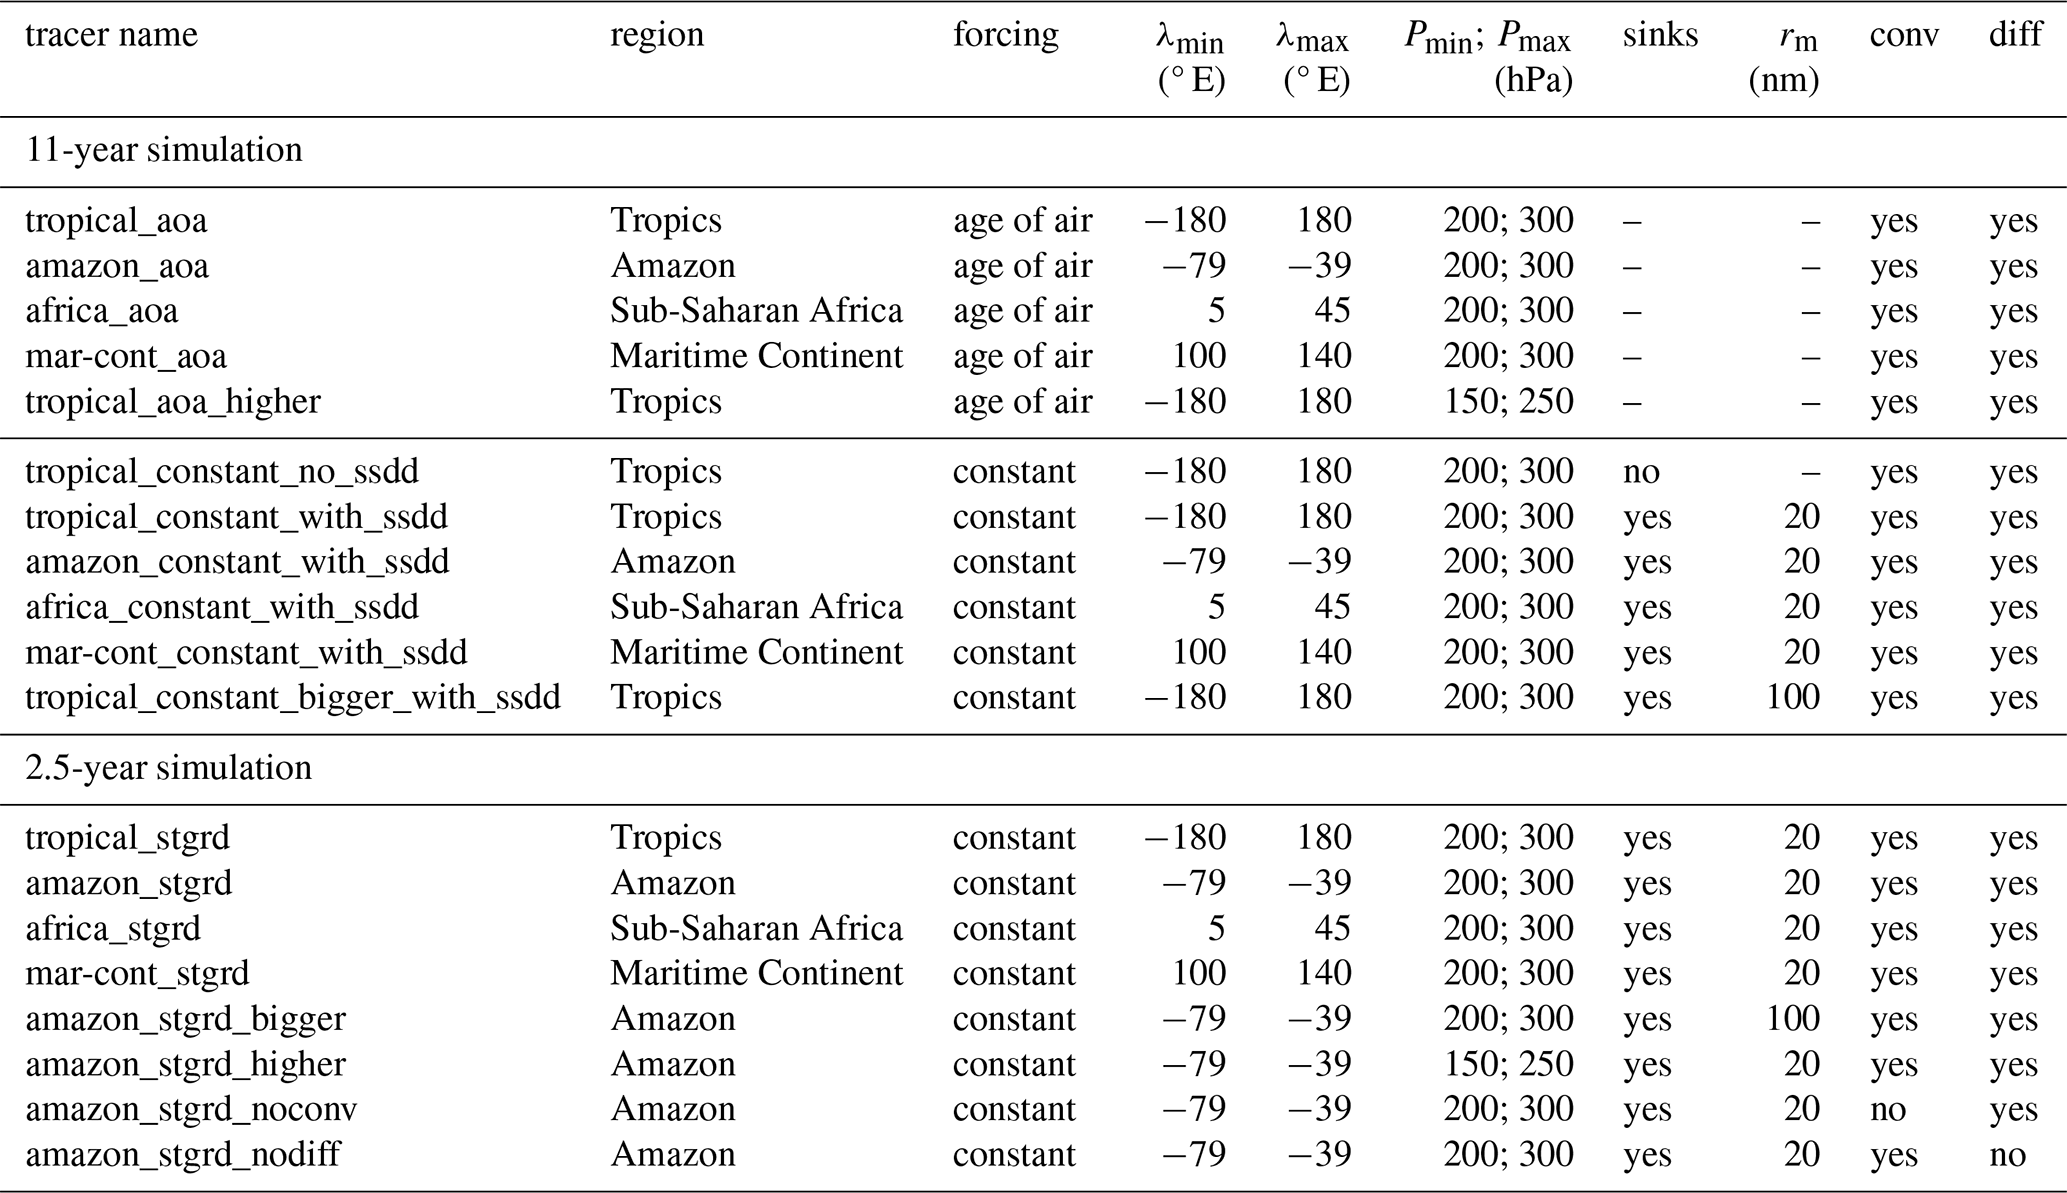
Two simulations were performed, starting on 1 January 1998: an 11-year simulation containing the age-of-air and continuously forced constant tracers, and a 2.5-year simulation containing the staggered-tracer sets; the tracer forcing configurations are summarized in Table 1 and described below. After excluding the first year as spin-up, the longer simulation provided up to 10 years for the analysis of the age-of-air and constant tracers, whereas the shorter simulation provided sufficient time to diagnose early-arrival timescales using the staggered tracers.
An integration time step length of 240 s was employed for the 2.5-year simulation and the first 2 years and two months of the 11-year simulation. At later times in the 11-year simulations, the integration time step length was reduced to 60 s to prevent computational instabilities.
Radiation processes and surface temperature parameterization follow the original ECHAM5 approaches, the former modified according to Dietmüller et al. (2016). The scheme of Emmerichs et al. (2021) is employed to represent land-atmosphere exchange and vertical diffusion. Orographic gravity waves and low level drag are represented by the scheme of Lott and Miller (1997) and Lott (1999), as in ECHAM5. Cloud microphysics are parameterized following Lohmann and Roeckner (1996), with cloud cover calculations following Sundqvist (1978) and Sundqvist et al. (1989). A mass flux convection scheme is applied (Tiedtke, 1989), with the closure assumptions of Nordeng (1994).
Initial conditions were derived from ERA5, the fifth generation ECMWF (European Center for Medium-Range Weather Forecasts) reanalysis (Hersbach et al., 2020). The simulations were not dynamically nudged to reanalysis fields after initialization; instead, the model evolved freely from the initial state, forced only by prescribed surface boundary conditions. The sea surface temperature and sea ice concentration data employed as surface boundary conditions are based on a climatology computed as the multi-year monthly mean over 2000–2019, using output from the Max Planck Institute for Meteorology Earth System Model version 1.2 (MPI-ESM1.2) model prepared for the Coupled Model Intercomparison Project (CMIP6) (Schupfner et al., 2021; Müller et al., 2018; Mauritsen et al., 2019).
To analyze transport pathways and associated timescales from the tropical UT, we introduced 19 idealized tracers (Table 1) via MESSy's submodel PTRAC (Jöckel et al., 2008). The tracers were initialized and forced in the tropical UT between 200–300 hPa, except in some cases (suffix “_higher” in the tracer name), in which the forcing region was shifted to 150–250 hPa to evaluate the impact of uncertainties in the height of the tracer layer. Tracer initialization and forcing used the MESSy submodels IMPORT_GRID and TNUDGE (Kerkweg et al., 2006b; Kerkweg and Jöckel, 2015). Different longitude intervals were defined for the forcing region: all over the Tropics (prefix “tropical_” in the tracer names), restricted to South American longitudes and centered in the Amazon (prefix “amazon_”), over the Sub-Saharan Africa (prefix “africa_”), and over the Maritime Continent (prefix “mar-cont_”). By considering these different forcing regions, we aim to understand the potential implications of longitudinal gradients in the aerosol source region for the transport pathways and timescales. The focus on continental regions is due to their higher potential for UT secondary aerosol nucleation compared to maritime regions, given the strong coupling between vegetation emissions and convective uplift.
A set of 5 tracers followed an “age of air” approach (“aoa” string in the tracer names in Table 1), in which the tracer number mixing ratio Naoa varied quasi-linearly (i.e., step wise) with time within the forcing region and were subject to transport outside of it (Eq. 1). The transport operator 𝒯 includes resolved advection, as well as parameterized turbulent diffusion and convection.
where t is the time in days; ϕ and λ are the latitude and longitude, respectively, in degrees; P is the pressure; kg−1 and ϕ0=20°.
The age of air is defined as the time elapsed since a parcel of air was last in contact with a specific source region. Due to mixing, the age at a given location is better described statistically by the “age spectrum”, denoted by Γ(τ), which represents the fraction of air mass with transit time τ. The mean age of air corresponds to the first moment of this distribution:
representing the average transit time from the source to the target location (Hall and Plumb, 1994; Waugh and Hall, 2002).
In practice, 〈τ〉 can be estimated using a tracer that is uniformly distributed within the source region and increases linearly in time, with no sources or sinks elsewhere. Outside the source, the tracer is passively transported. At a given location, 〈τ〉 is estimated by subtracting the local tracer value from the value in the source region and dividing by the known rate of increase in the source region (i.e., the linear slope). This approach is described by Podglajen and Ploeger (2019) and references therein. Note that, for tracers defined according to Eq. (1), Naoa is not uniform within the forcing region –it is maximum at the Equator and decreases toward the maximum value on the previous day plus e−2 at °. Smoothing the tracer spatial distribution in this way alleviates issues associated with advection near sharp gradients. However, even in the presence of spatial inhomogeneities, this approach remains valid for deriving 〈τ〉 with resolution of 1 d, given that the tracer values across the forcing region do not overlap in time.
To analyze the impact of size-dependent aerosol sinks on the transport patterns, the number mixing ratios of 6 tracers were kept constant within the forcing region throughout the simulation (“constant” string in the tracer names in Table 1), mimicking a continuously-replenished aerosol reservoir:
where t0=0 for the constant tracers discussed here, and ℱ represents the sources/sinks associated with sedimentation, wet scavenging and dry deposition. According to Eq. (3), the average of Ncnt within the forcing region (Nref) is ≈ 1.25×10¹⁶ kg−1.
Some of the constant tracers were subject to sedimentation, wet scavenging, and dry deposition (i.e., ℱ(Ncnt)≠0, suffix “with_ssdd”), where “ssdd” denotes the inclusion of these subgrid-scale processes as parameterized by Tost et al. (2006) and Kerkweg et al. (2006a), via the MESSy submodels SEDI, SCAV, and DDEP, respectively. Here, sedimentation refers to gravitational settling through the atmospheric column, whereas dry deposition refers to removal at the surface. In contrast, other tracers were only transported (i.e., ℱ(Ncnt)=0, suffix “no_ssdd”).
In order to apply these parameterizations, the tracers were assumed to represent aerosol particles distributed according to a log-normal function, with mean radius rm=20 nm and geometric standard deviation equal to 1.6. The value of rm was increased to 100 nm for one of the constant tracers (“bigger” string in the tracer names), to estimate the impact of uncertainties in the particle size on the parameterized sinks.
Adjusting the diagnostic framework to consider not only 〈τ〉 – which reflects the mass-weighted average over the full tracer age distribution Γ(τ) – but also transit times in the left tail of the distribution enables the characterization of faster, more immediate impacts on the target region. To diagnose such timescales, we introduced eight sets of 12 “staggered” tracers Nstgrd, defined identically to Ncnt in Eq. (3), except that each tracer in a set has a different source start time , corresponding to the first day of month m in 1999. After t0,m, the tracer is continuously maintained at the prescribed value inside the forcing region until the end of the 2.5-year simulation. These sets of tracers are denoted by the “_stgrd” suffix in the tracer names in Table 1: one set for each forcing region, and four additional sets corresponding to sensitivity tests for the Amazon source region. These include “_bigger” and “_higher” (as described above), and “_noconv”/“_nodiff” tracers for which parameterized convection or turbulent diffusion, respectively, were disabled.
Specifically, the elapsed time between tracer release and the moment a given fraction of the forcing-region mean number mixing ratio Nref is reached at a location can serve as a proxy for the influence of small amounts of material transported over relatively short timescales. We define this metric as the time-to-threshold tp, where p represents the chosen fractional threshold of Nref. Since the staggered tracers include not only transport but also atmospheric sinks such as wet scavenging, dry deposition, and sedimentation, the time-to-threshold metric reflects not the pure transport-derived age spectrum, but a modified or effective response that is shaped by both transport and removal processes. Conceptually, this response can be viewed as sampling a filtered age spectrum , where S(τ) represents a survival function accounting for tracer loss as a function of age. The diagnostic can then be written as
As such, the resulting timescales represent a convolved measure of both transit and retention, rather than transport alone. This formulation provides a measure of how rapidly a given fraction of the surviving tracer signal has arrived from the source, and captures the timing of fast transport components. Together, 〈τ〉 and tp provide complementary perspectives on downward transport. In the analysis, tp represents the arithmetic mean of the twelve time-to-threshold monthly estimates. This reduces the dependence of the diagnosed timescale on the arbitrary choice of release month.
To investigate downward transport from the UT, we take the 500 hPa level as a representative reference for the mid-troposphere. Figure 1 provides an overview of the simulations, showing time series of the tracer mixing ratio Ncnt and age of air 〈τ〉 over the full 11-year period. The values are averaged over horizontal areas centered on the forcing regions but extending 10° beyond them in each direction (larger red rectangles in Fig. 2), at 500 hPa. The time series evidence a fast increase in 〈τ〉 (Fig. 1a, b) at the beginning of the simulation, as the target regions progressively fill with air originating from the forcing region. Note that grid points not yet reached by air from the forcing region are treated as missing values and are therefore excluded from the averages.
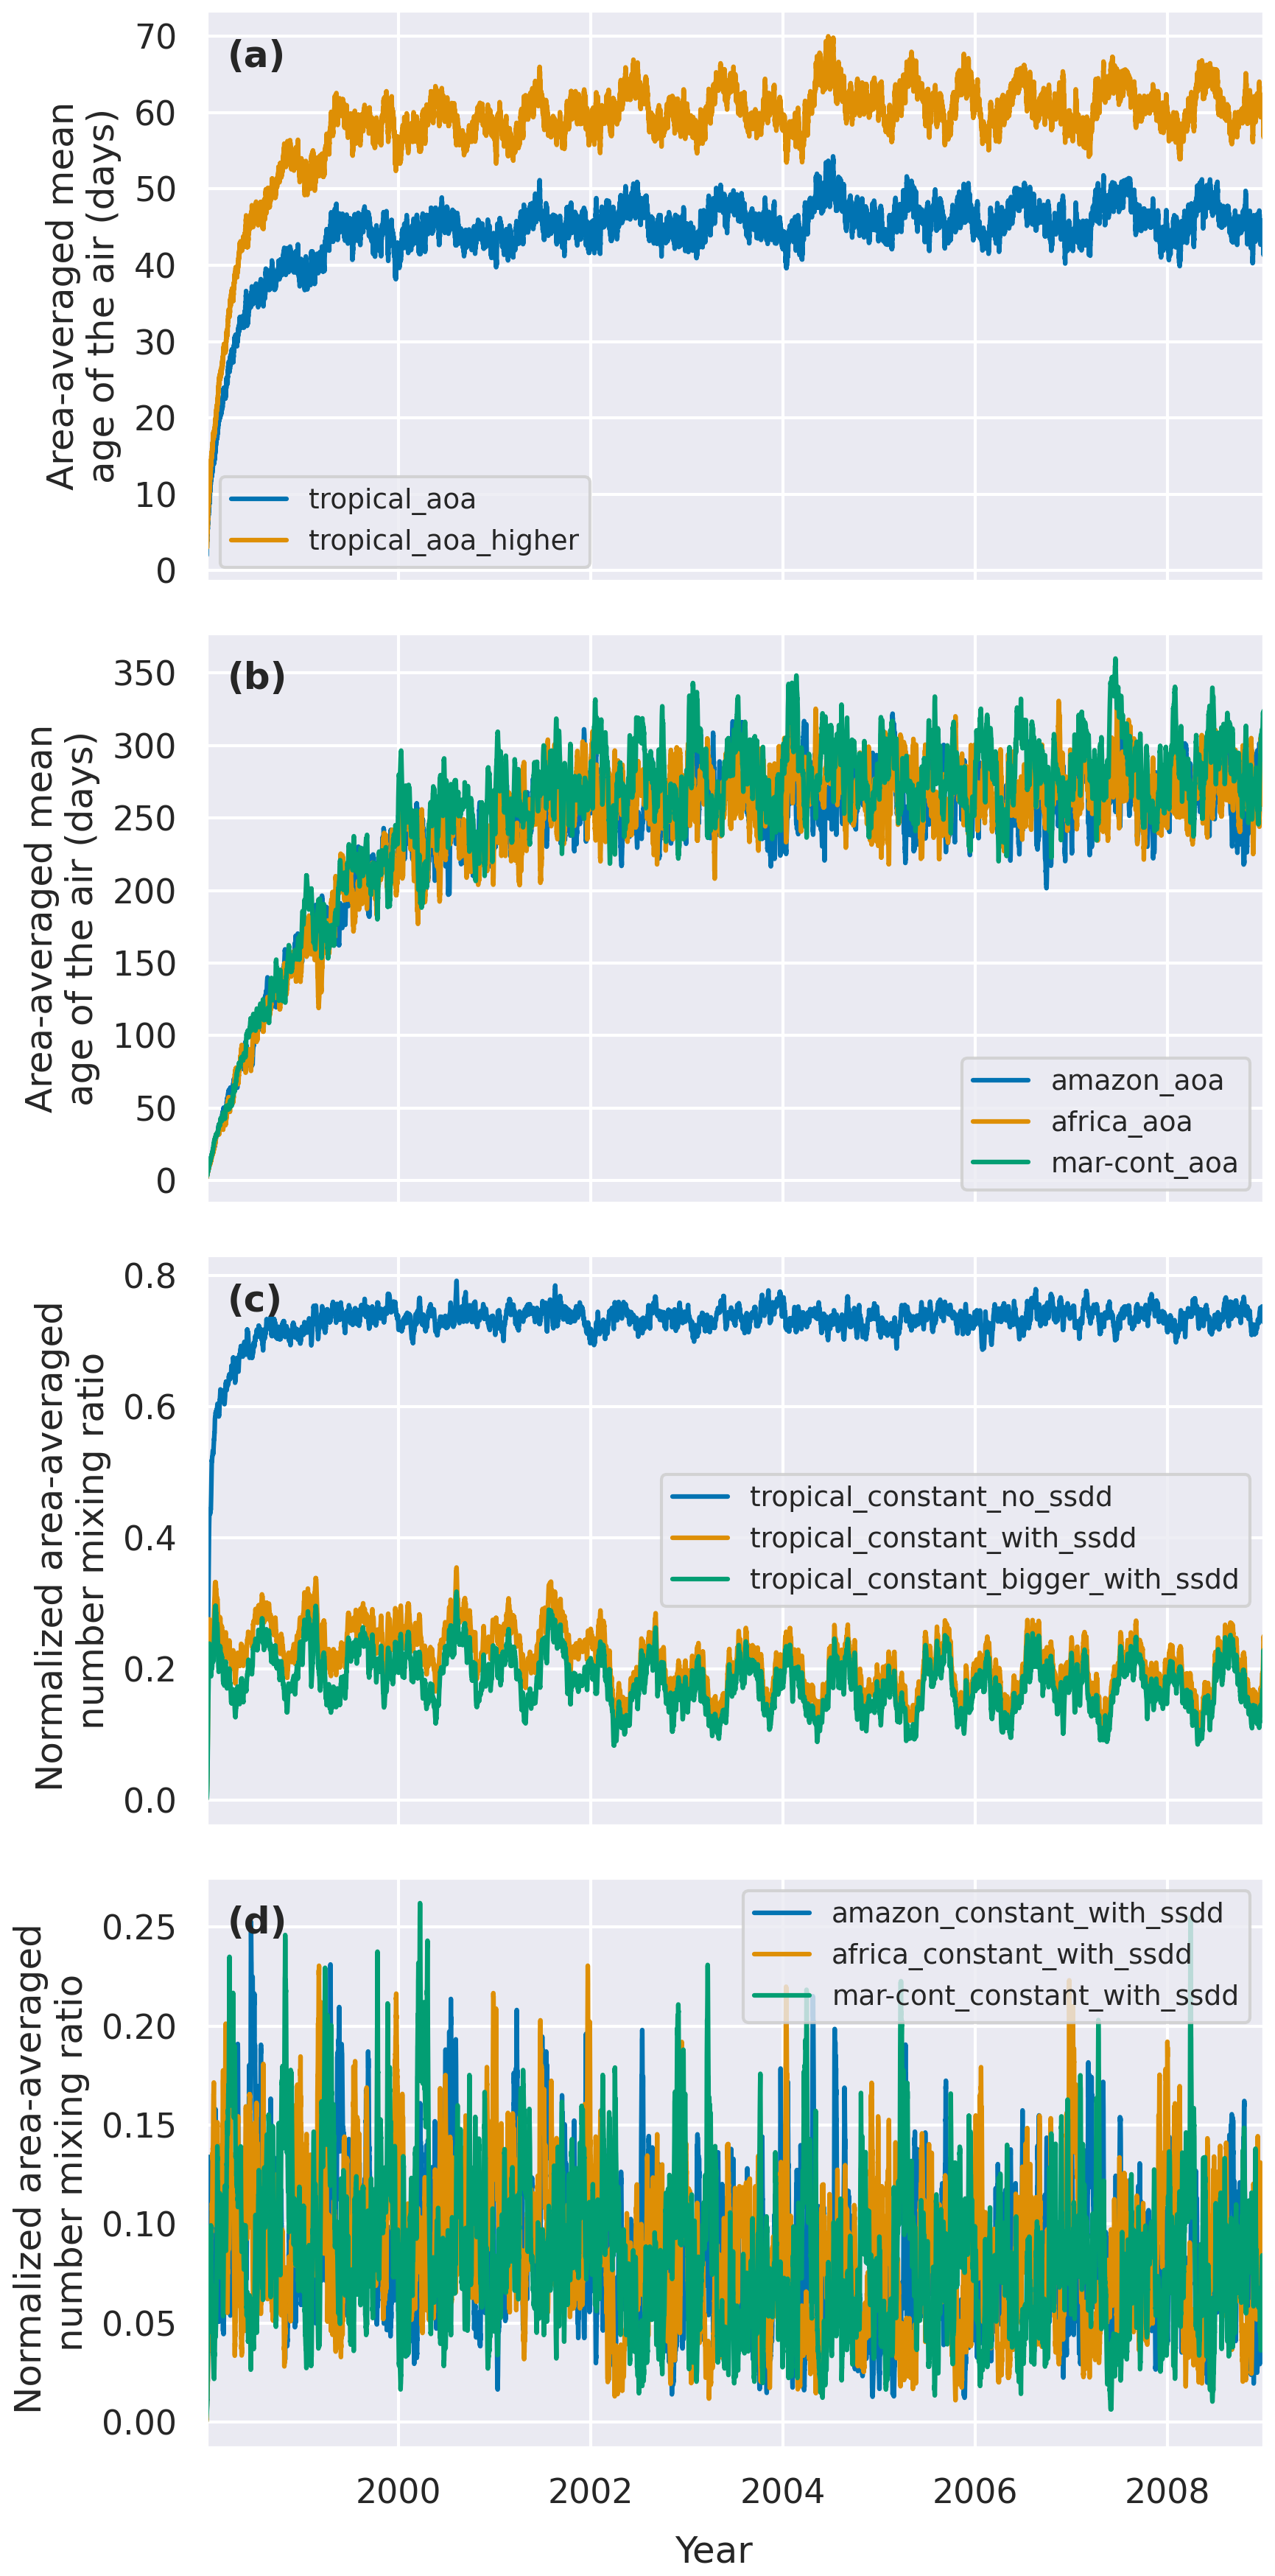
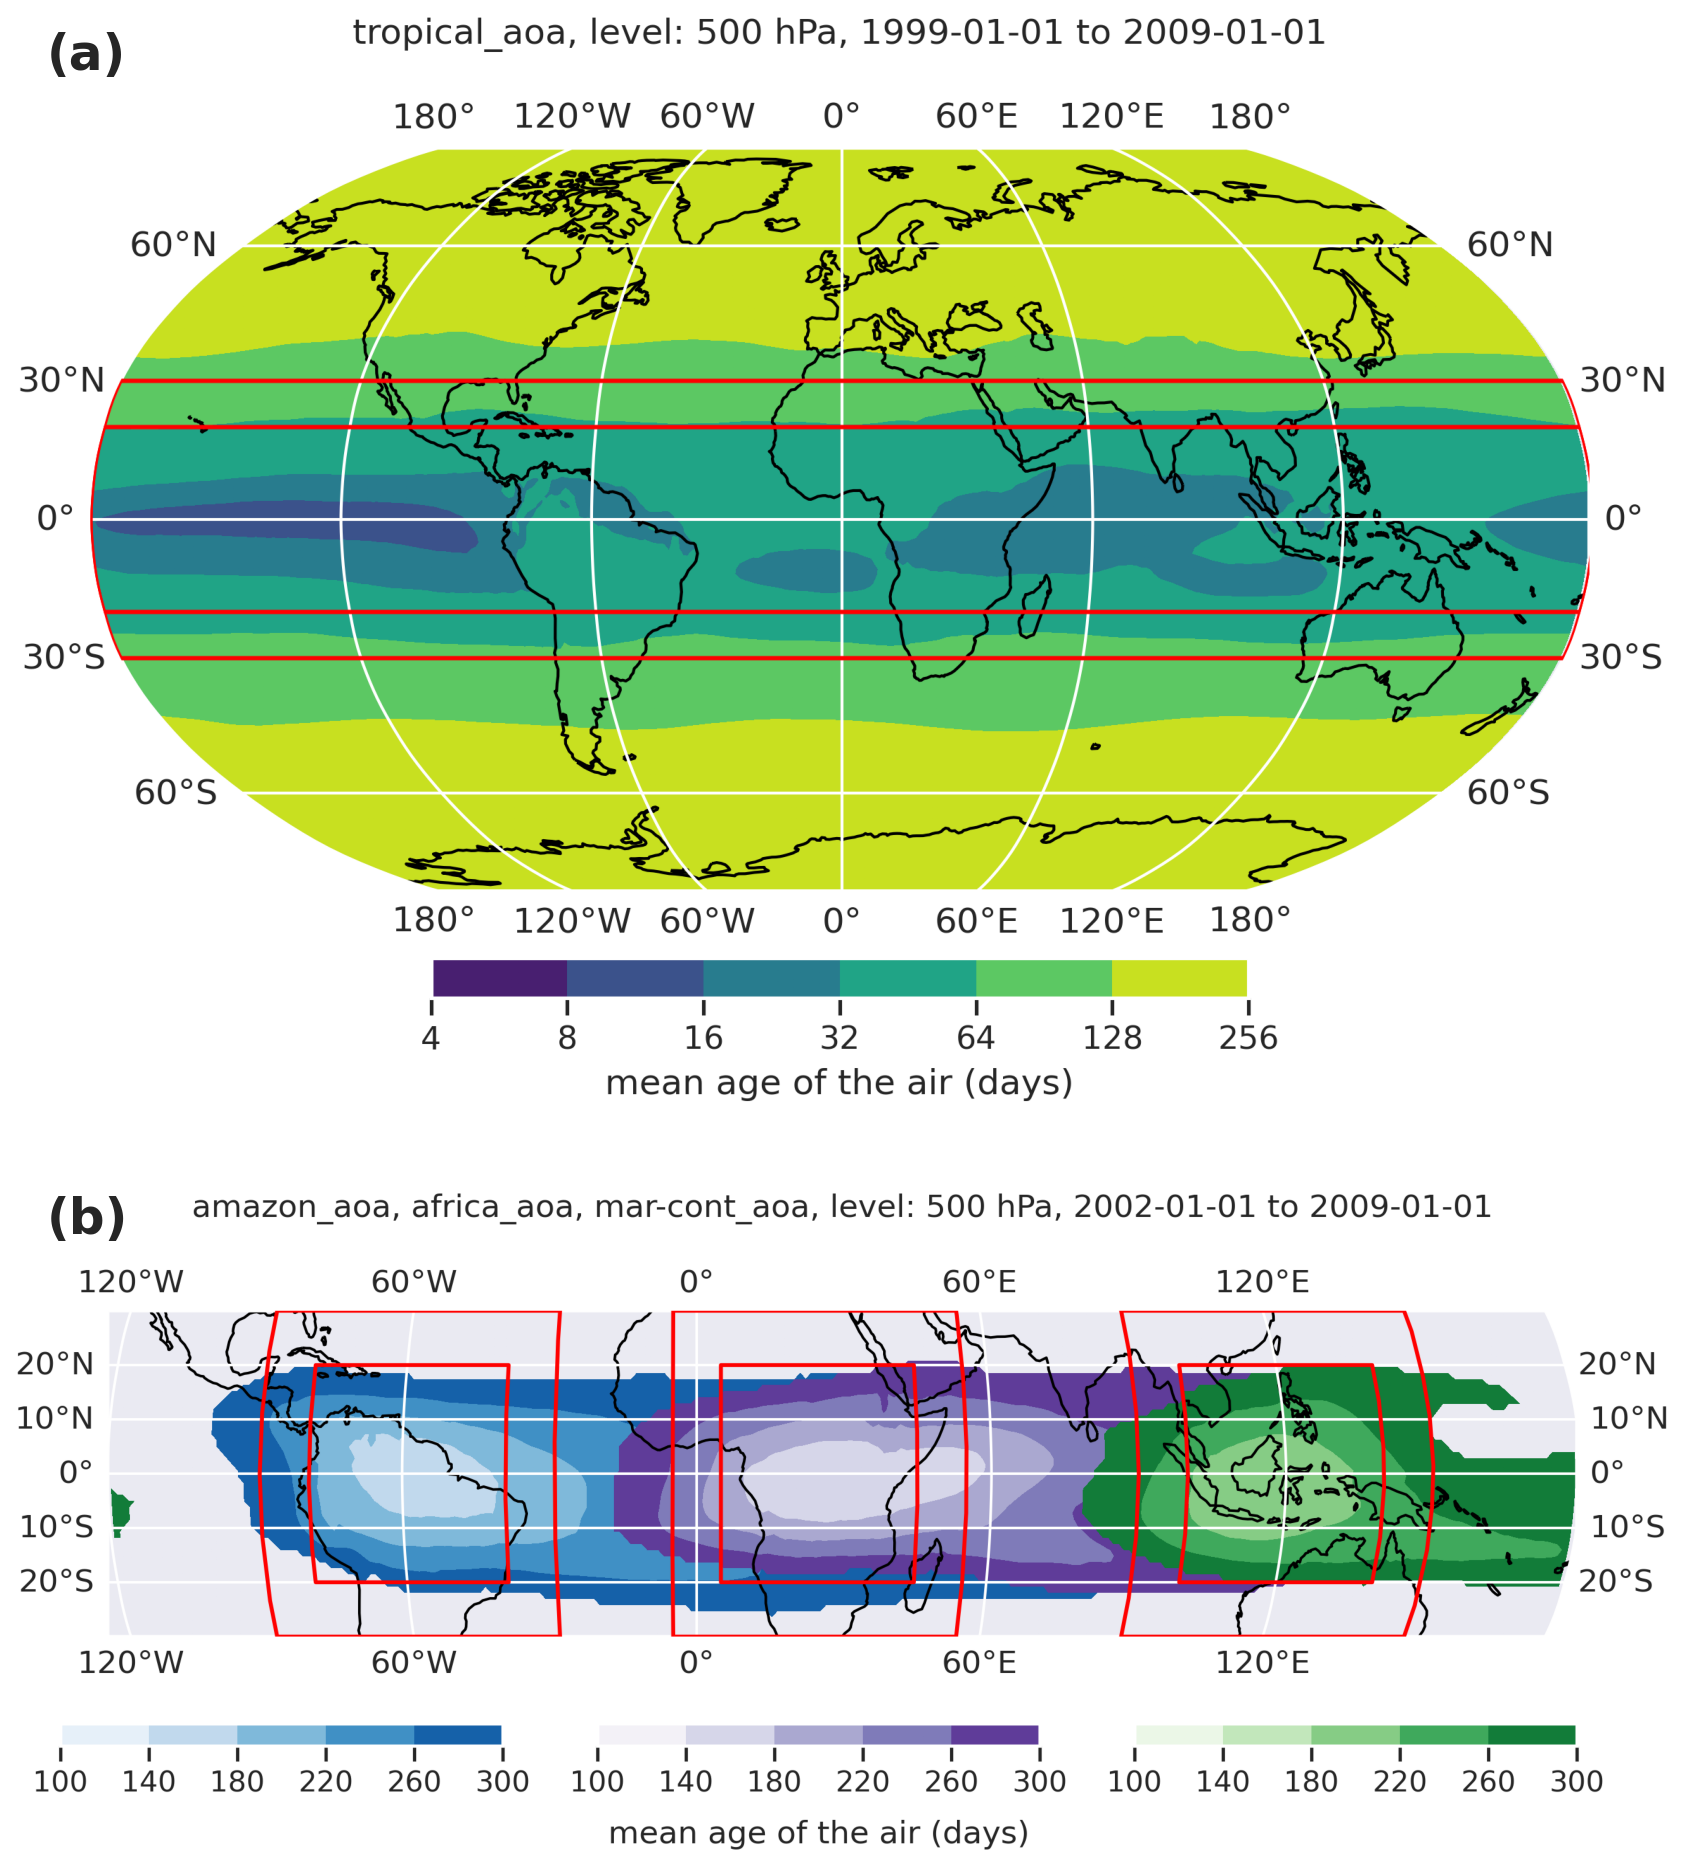
Figure 2Mean age of air 〈τ〉 at 500 hPa, averaged over the simulation period after 1 January 1999 for the tropical tracer (tropical_aoa) and after 1 January 2002 for the regional tracers (amazon_aoa, africa_aoa, and mar-cont_aoa). Red inner rectangles indicate the forcing regions, while red outer rectangles show the averaging regions referenced in other figures (see text for details).
For the tropical tracers (Fig. 1a), the time series stabilize relatively quickly, reaching a plateau shortly after one year. In contrast, the regional tracers (Fig. 1b) require considerably more time to reach equilibrium (≈ 4 years). This difference reflects the source-region dependence of the mean-age diagnostic. All tracers are affected by dilution through mixing with air outside the forcing region. However, this effect is stronger for the regional tracers because their source regions occupy a much smaller fraction of the tropical UT. For the tropical tracer, air arriving at 500 hPa from any tropical longitude contributes to the source-tagged signal. For the regional tracers, however, the receptor regions also receive air from outside the prescribed source longitudes, which further dilutes the tracer signal and broadens the effective transit-time distribution. Typical values of 〈τ〉 derived from the tropical tracer are approximately 40–45 d, increasing to approximately 55–65 d when considering the higher source region. In contrast, 〈τ〉 derived from the regional tracers is approximately 260 d (Fig. 1a, b). This larger value should therefore be interpreted as a consequence of the smaller source-region area, enhanced dilution, mixing, and source-receptor geometry.
Consistent with the age of air, the 500 hPa area-averaged values of Ncnt from the tropics-wide source take approximately one year to reach a plateau (Fig. 1c). For this tracer, plateaus at approximately 0.73, indicating a 27 % reduction due to dilution during downward transport. In contrast, when dry deposition, wet scavenging and sedimentation are applied, stabilizes much faster, albeit at a lower value (≈ 0.15–0.25 for the tropical tracer and ≈ 0.05–0.15 for the regional ones), owing to the sink effect of these processes. Further analysis (not shown) indicated that wet scavenging is by the far the dominant sink in play. Little sensitivity to the role of wet scavenging in relation to variations in rm over the 20–100 nm range is evident by comparing the default and bigger tropical tracer with sinks in Fig. 1c. A bias in of around ≈ 0.05 for the tropical tracer with sinks, and ≈ 0.025 for the regional tracers with sinks, before and after the year 2002 is evident in Fig. 1c, d. Given that this discontinuity is only evident in the time series of tracers with sinks, and that the effects of dry deposition and sedimentation are negligible (as noted above), the bias is likely associated with the wet scavenging parameterization and its sensitivity to the integration time step, which was reduced after 2002.
3.1 Tracer transport timescales
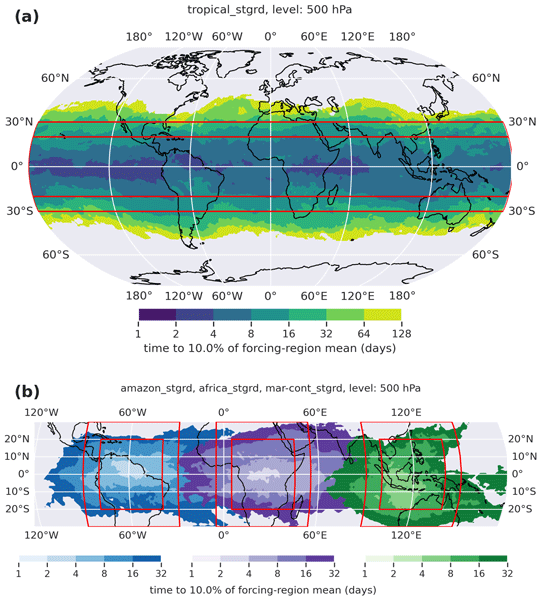
In order to delve further into the details of the transport times scales and pathways from the forcing region down to the mid-troposphere, we analyze here the spatial patterns of the age of the air (Fig. 2) and estimate the time elapsed until a given fraction of the forcing region maximum is reached – the time-to-threshold, tp – for each grid point at 500 hPa, based on the staggered-release tracer sets (Fig. 3).
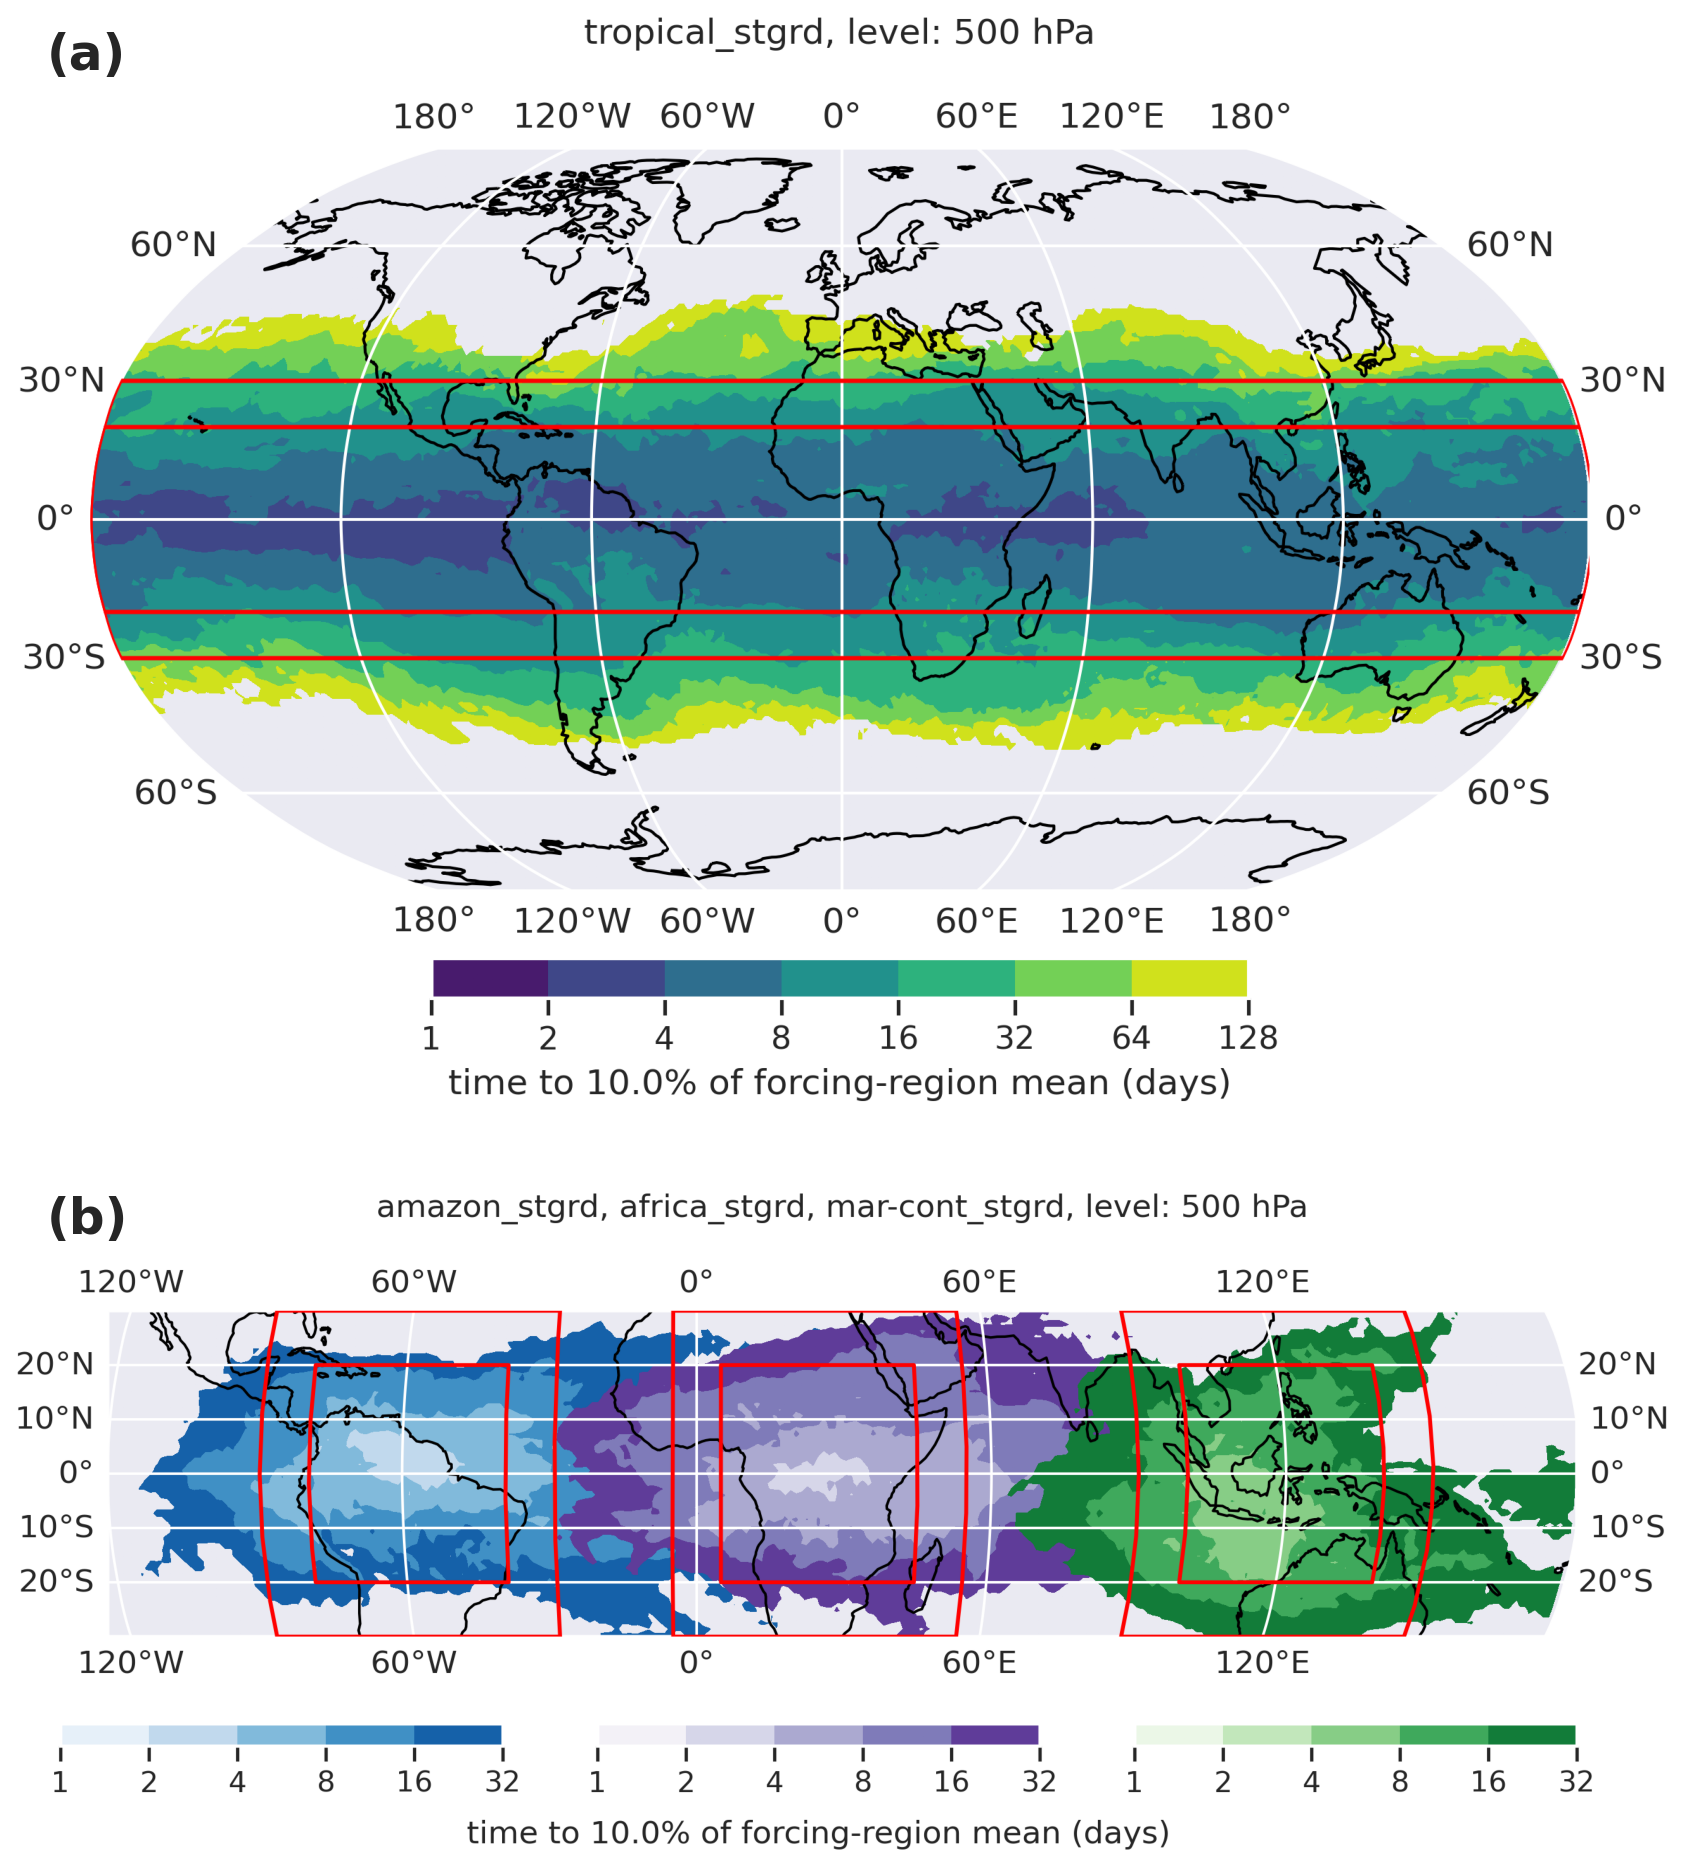
Figure 3Average time to reach 10 % of the mean mixing ratio in the forcing region (t10 %) for the Tropical, Amazon, Africa, and Maritime Continent tracers, at 500 hPa. For each source region, t10 % is diagnosed individually from a set of twelve “staggered” tracers, initialized on the first day of each month in 1999 (“_stgrd” suffix in Table 1). The values shown represent the arithmetic mean of these twelve estimates. Red rectangles indicate the forcing and averaging regions as in Fig. 2, for reference.
The mean age of the tropical-sourced air, averaged over time at 500 hPa (Fig. 2a), reveals a pronounced latitudinal distribution. As expected, younger air is found predominantly near the Equator, associated with tropical zonal overturning and regional subsidence in the deep tropics, where the UT source is centered. The Hadley circulation likely contributes to the poleward extension of relatively young air into the subtropics, but this pathway involves meridional transport before descent and is therefore slower and more diluted. Consequently, its signature appears as a broad subtropical extension of the tracer signal, with 〈τ〉 increasing progressively toward the poles, rather than as a separate minimum in the timescale field.
Significant longitudinal variability is also observed, characterized by more rapid downward transport over the Equatorial Pacific Ocean (approximately 8–16 d), followed by the Indian Ocean, regions of Eastern Sub-Saharan Africa, the Northern South Atlantic Ocean, and the northeastern coast of South America (approximately 16–32 d). This distribution aligns with the locations of large-scale subsidence branches of the Walker Circulation and is expected to vary with phase of the El Niño-Southern Oscillation (ENSO), though such variability is not examined here.
The introduction of non-zero longitudinal gradients via the regional sources allows us to distinguish zonal variations in downward transport. Figure 2b indicates that the spatial distribution of 〈τ〉 from the regional tracers is consistent with the overall equatorially centered pattern shown by the Tropical tracer. Nonetheless, although the youngest regional-source air at 500 hPa remains within or near the forcing regions, it is generally displaced relative to the source centers, often toward the east. This pattern suggests that descent is not purely vertical, but instead occurs along tilted pathways shaped by horizontal advection during subsidence. This displacement may be influenced by upper-tropospheric westerlies, especially when the Intertropical Convergence Zone (ITCZ) shifts north or south and the subtropical jet approaches the source region.
As mentioned earlier in Sect. 3, 〈τ〉 values derived from the regional sources are much longer than those derived from the Tropical tracer, with values above 180 d in most grid points directly below the regional sources. Tilted trajectories may partially contribute to larger 〈τ〉 values compared with purely vertical descent. However, the relatively small horizontal displacement evident here is unlikely to fully account for the substantial increase in 〈τ〉 compared with the tropical source region, thus pointing to the role of mixing and dilution associated with the smaller source-region area.
Extending the analysis beyond the mean age of air to include lower percentiles of Γ(τ), via the time-to-threshold tp, allows for the characterization of faster, more immediate impacts on the target region. Because the staggered tracers used here to derive tp include sinks such as wet scavenging, dry deposition, and sedimentation, the resulting timescales also reflect more physically realistic aerosol arrival times compared to 〈τ〉.
Figure 3 shows the average t10 % from the 12 staggered tracers (i.e., initialized monthly over 1 year) in each set – Tropics, Amazon, Africa, and Maritime Continent. Note that a 10 % threshold is physically relevant, as it is comparable to the fraction of secondary organic aerosols nucleated in the boundary layer relative to the UT in previous numerical studies (e.g., Zhu et al., 2019). Overall, the spatial patterns in Fig. 3 are broadly consistent with the distribution of 〈τ〉, but the timescales are considerably shorter, as expected. Values below one week appear across Equatorial regions for all source areas considered.
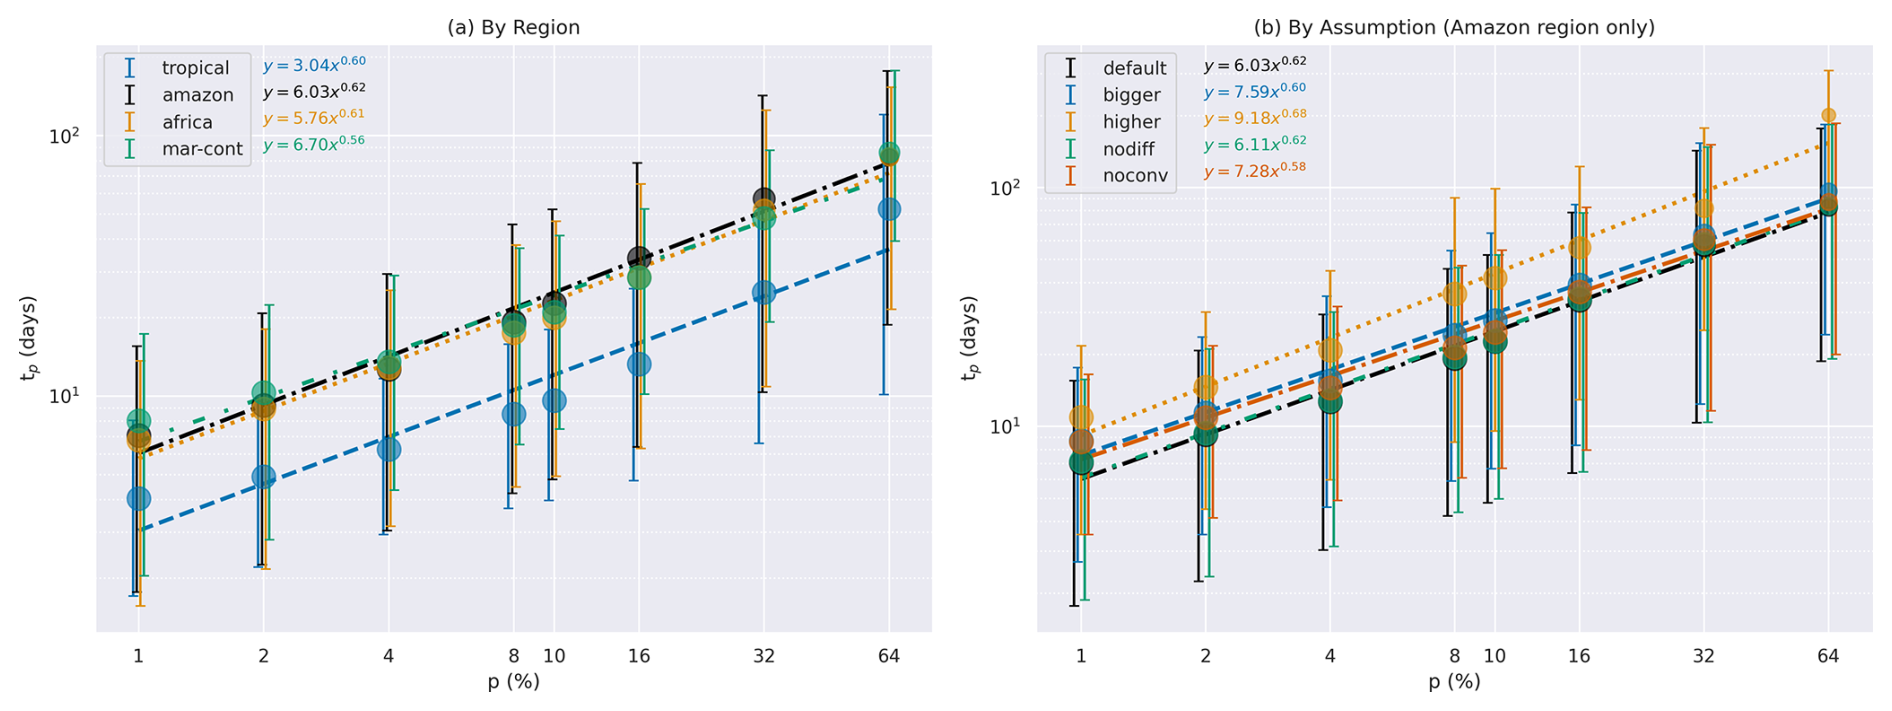
Figure 4Time-to-threshold tp at 500 hPa, inside the outer red polygons in Fig. 3, for varying thresholds. (a) Different regional tracers, and (b) Amazon regional tracer from different sensitivity experiments. Markers represent area averages, and the error bars indicate the interval between the 10th and 90th percentiles of tp. Grid points where the threshold p is not reached by the end of the 2.5-year simulation in June 2000 are excluded. Marker size is proportional to the number of valid grid points. The straight lines illustrate power-law fits obtained via linear regression in log–log space, applied to the valid data points. The fitted parameters (slope and intercept) are shown in the upper-left corner, with text color matching the corresponding lines.
The dependence of the tp on the chosen threshold p is illustrated in Fig. 4. It shows that tp varies approximately as a power law with respect to p. Notably, this power-law relationship is remarkably consistent across the different forcing regions, with timescales from the Tropical source region differing from those of the regional sources by an approximately constant factor of ≈ 2, and little differences across the regional sources (Fig. 4a). Figure 4b shows that the impact of parameterized transport components (convection and turbulent diffusion) is very small overall. Neglecting convection leads to a ≈ 10 % increase in the average tp, while excluding turbulent diffusion is associated with an overall delay of only a ≈ 1 % with respect to the default case. The sensitivity of tp to convection and turbulent diffusion is generally smaller than the sensitivity to the tracer initialization assumptions regarding size and height.
Particularly, the sensitivity of the area-averaged tp to the height of the forcing region highlights the non-linearity of vertical motions. Raising the source layer by 50 hPa (from 300–200 to 250–150 hPa; ≈ 1–1.5 km higher) increases t10 % by ≈ 19 d relative to the baseline (default) tracer, implying a mean descent of ≈ 0.05–0.08 km d−1. By contrast, the baseline tracer has t10 %≈25 d for descent from 300 to 500 hPa (≈ 3–4 km), corresponding to ≈ 0.12–0.16 km d−1. This behavior is physically expected, due to increasing atmospheric stratification with height, as well as other factors such as the decline in radiative cooling rates above ≈ 200–250 hPa (e.g., Hartmann et al., 2022). Among the factors tested, the height of the source region emerges as the dominant control on transport timescales.
3.2 Patterns in the transport of regional tracers with sinks
In Sect. 3.1, we showed that the spatial patterns in downward transport timescales from the regional sources were consistent with those derived from the Tropical tracer, albeit with a scale factor difference due to the enhanced dilution associated with the smaller size of the source region. Given this consistency and the hypothesized greater potential for secondary aerosol nucleation in the UT over continental compared to maritime tropical regions, we focus on the regional tracer sources in this section. Here, 10-year statistics from the Amazon, Africa, and Maritime Continent constant tracers with sinks are used to provide a proxy for the background number mixing ratio in the mid-troposphere, assuming tropical, continental, UT sources under the influence of transport, wet scavenging, dry deposition, and sedimentation.
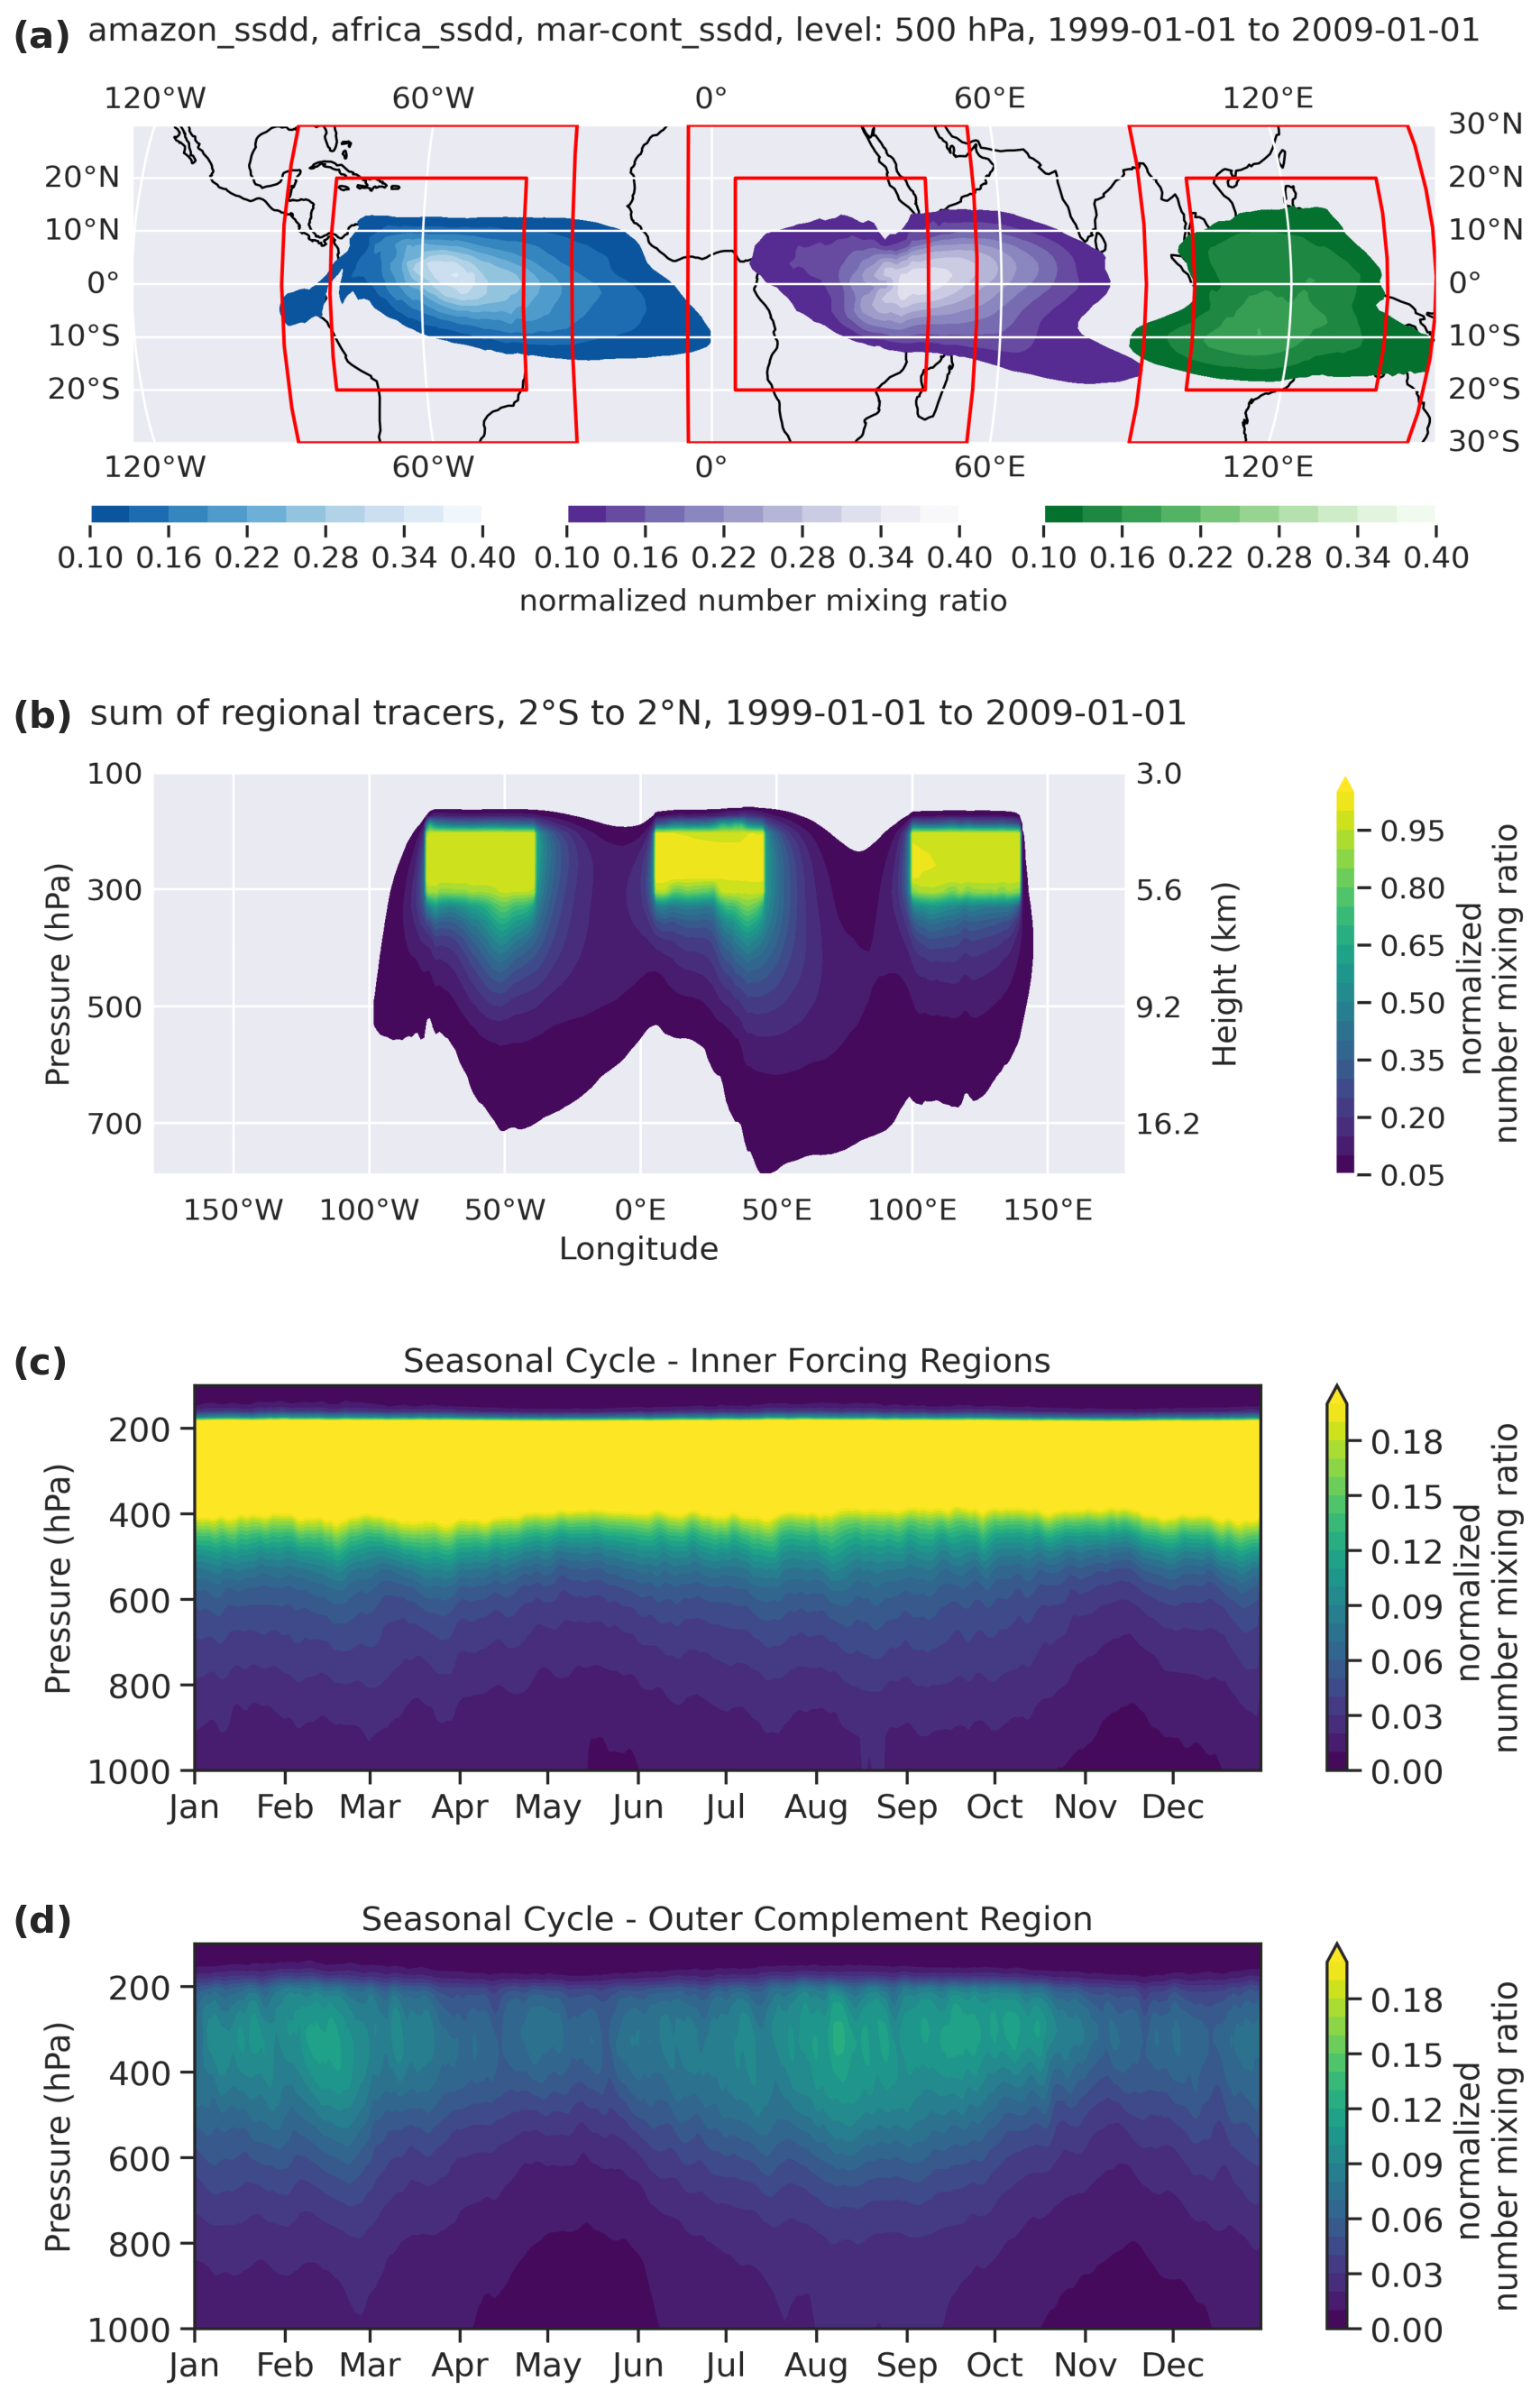
Figure 5Spatial distribution and seasonality of the tracers amazon_constant_with_ssdd, africa_constant_with_ssdd, and mar-cont_constant_with_ssdd. (a) Time-averaged normalized number mixing ratios at 500 hPa; (b) cross-section of the time-averaged sum of the three tracers' number mixing ratios near the Equator (ϕ±2°); (c) multi-year daily average of area-averaged vertical profiles of the sum of the three tracers' number mixing ratios at and below the forcing regions; (d) same as in panel (c), but between ϕ±20°, excluding the forcing region areas. Simulation output from January 1999 to December 2008 was considered. Red rectangles in panel (a) indicate the forcing and averaging regions as in Fig. 2, for reference.
Overall, the distribution of resembles the spatial patterns in the transport timescales discussed in Sect. 3.1. Figure 5a shows that the highest values of from the regional tracers are found below and slightly shifted to the east of the source region –except for the mar-cont tracer, for which the maximum lies slightly southwest– where the downward transport from the regional sources is fastest (compare with Figs. 2 and 3). Values of reaching ≈ 0.4 over northeastern South America and eastern Sub-Saharan Africa contrast with values generally less than 0.2 over the Maritime Continent (Fig. 5a), indicating more efficient downward transport from the Amazon and Africa source regions than from the Maritime Continent overall. The time-averaged equatorial cross section of the sum of the three regional tracers (Fig. 5b) shows that transport from the Maritime Continent exhibits a slightly predominant westward component, in contrast to the mainly eastward transport from the other two regions. This pattern likely reflects regional inhomogeneities in equatorial circulation, including the influence of the Tropical Easterly Jet (Chen and van Loon, 1987) and stronger divergence associated with deep convection (Trenberth et al., 2000), which may lead to partial compensation between eastward and westward transport in the time averages.
Figure 5c, d illustrate the seasonal variation of the area-averaged vertical profiles right below the forcing regions and outside of them, respectively. This shows that downward transport from the source regions to the mid-troposphere is sustained year-round, with in the order of ≈ 0.1–0.15 on average at ≈ 500 hPa. Values of in the mid-troposphere are higher from around January to March and July to October, with seasonal variations being more pronounced for columns in the outer complement region. This seasonality pattern is consistent with the north-south shifts of the ITCZ. The northern and southern extremes of the forcing region may be more easily embedded in the subsidence branch of the Hadley Cell during the local winter, as the ITCZ moves toward the summer hemisphere, accelerating downward transport compared to other seasons.
The results presented in Sect. 3 provide a comprehensive view of the timescales, spatial pathways, and dilution effects associated with the vertical transport of tracers from tropical, UT source regions to the mid-troposphere, analyzed from an Eulerian global-model perspective.
Several robust patterns emerge from the analysis, with important implications for our understanding of aerosol transport from the tropical UT to the mid-troposphere. First, the distinction between tropical-wide and regional tracer sources highlights the sensitivity of the mean-age diagnostic to the spatial extent of the emission region (Fig. 1). The regional tracers exhibit significantly longer mean ages of air (〈τ〉≈260 d) than their tropical counterpart (〈τ〉≈45 d). This difference should not be interpreted as a proportional weakening of vertical transport, but rather as a consequence of the source-region dependence of 〈τ〉. For more geographically constrained sources, the diagnosed mean age is more strongly affected by mixing with air that has not recently been in contact with the source region (i.e., large τ components), which dilutes the source-tagged signal. A parallel can be drawn to previous variability-lifetime studies, which show that tracer spatial variability – and, by analogy, average age – is sensitive not only to residence time but also to the spatial distribution of sources and sinks (e.g., Bolin and Rodhe, 1973; Hamrud, 1983; Ott, 1990; Jobson et al., 1999). In general, enhanced widening of the age spectrum in the troposphere is expected, as it is linked to strong mixing in this layer. This contrasts with stratospheric conditions, where spatial variability is more strongly governed by residence time (Jobson et al., 1999), and the age-of-air approach is more straightforwardly applicable (e.g., Hall and Plumb, 1994; Waugh and Hall, 2002), owing to the strong stratification that limits vertical exchanges compared to the troposphere.
In the context analyzed here, the time-to-threshold diagnostic, particularly at the 10 % level, provides a valuable complement to the mean age of air by capturing the onset of tracer influence in a given target region, effectively emphasizing the fastest-arriving component of the sink-filtered transport response. The broadly similar spatial patterns between these two diagnostics (Figs. 2 and 3) affirm the robustness of the large-scale subsidence pathways, while the shorter timescales (often < 7 d) highlight the potential for relatively rapid vertical connections to the mid-troposphere.
Although not explicitly shown here, these results imply that aerosol transport from the UT to even lower levels – such as the atmospheric boundary layer, where low and convective clouds typically form – would require significantly longer than one week if governed solely by resolved-scale advection. Therefore, while Zhao et al. (2020) reported consistent downward fluxes from the Amazonian UT to the boundary layer during their week-long simulations, our results suggest that such cross-troposphere connections would be difficult to achieve within that short timescale if governed solely by resolved-scale advection. Faster mechanisms – such as convective downdrafts, whose specific role in this context has not been fully elucidated – may therefore play an important role.
The spatial structure of the constant-tracer number mixing ratios Ncnt under the combined influence of transport and sinks (Fig. 5) reinforces the conclusions. Regional tracers with constant sources and sinks dominated by wet scavenging exhibit peak mid-tropospheric number mixing ratios just east of their source regions – and slightly southwest in the case of the Maritime Continent tracer – aligning with the pattern of minimum transport times. This indicates that descent is not purely vertical, but occurs along slightly tilted pathways shaped by horizontal advection during subsidence. The lower-level regions of strongest influence remain within or near the UT source regions, but are displaced relative to the source centers. This is qualitatively consistent with the short-term simulations of Wang et al. (2023), which showed that aerosols entering the boundary layer over the Amazon often originated outside the region. Nonetheless, the duration of their simulation represents an important constraint on the generality of their results. Our findings indicate that, despite the tilted descent path over the Amazon, significant downward transport may still occur within the Amazon region – i.e., within the domain simulated by Wang et al. (2023) – provided the transport timescale exceeds one week.
The resulting largely zonal distribution of tracer mixing ratios and transit times found here is broadly consistent with the results of Merikanto et al. (2009), except that the tropical maxima reported in their study are not evident in our simulations. This difference likely arises from our constraint of the source region to latitudes between ±20°, whereas in Merikanto et al. (2009), the nucleation rate evolved freely in space, depending solely on precursor availability and environmental conditions.
The reduction in number mixing ratios from the UT to the mid-troposphere in our simulations is substantial, but values of –0.15 remain meaningful and potentially important in the absence of other aerosol sources at lower altitudes. Notably, this fractional abundance is comparable to the contribution of secondary organic aerosols nucleated in the boundary layer relative to those formed in the upper troposphere in the numerical study of Zhu et al. (2019).
The quantitative values reported here are subject to uncertainties associated with the parameterized transport and removal processes in EMAC. Among the removal processes, wet scavenging is the dominant sink for the tracers with removal and therefore likely represents the largest parameterization-related uncertainty for the absolute values of . Increasing the mean particle radius to 100 nm leads to a ≈ 22 % increase in descent time, mostly due to enhanced wet scavenging, while dry deposition and sedimentation play a smaller role for the particle sizes considered here.
Parameterized convection and turbulent diffusion can affect the vertical redistribution of tracers, but the sensitivity experiments in which these processes are disabled suggest a modest impact on t10 % at 500 hPa. Neglecting convective transport increases descent time by ≈ 10 %, while removing turbulent diffusion yields a minor delay of only ≈ 1 % (Fig. 4b). Among all sensitivity experiments, the height of the tracer release emerges as the dominant factor controlling descent times. Raising the source region by 50 hPa (from 200–300 to 150–250 hPa; approximately 1–1.5 km higher) increases t10 % by ≈ 19 d on average, which is large compared with the baseline value of t10 % ≈ 25 d for descent from 300 to 500 hPa (≈ 3–4 km). This contrast points to nonlinear vertical transport behavior, presumably governed by factors such as the vertical profile of stratification and radiative cooling rates. In contrast, the influence of particle size, convection, and turbulence in our simulations is modest.
These results indicate that large-scale advection, together with implicit diffusivity, dominates the mean transport from the UT to the mid-troposphere at 500 hPa, at least on regional and climatological scales. Nevertheless, the sensitivity experiments should be interpreted as idealized on/off tests rather than a complete uncertainty quantification of the schemes. Thus, the absolute tracer abundances and threshold times should be regarded as model-dependent, whereas the broader spatial patterns and the dominance of large-scale advection in the mid-tropospheric transport appear more robust within the set of experiments considered here.
Estimated impact of coagulation
The absence of coagulation in our simulations represents a potentially important source of uncertainty in these estimates. To provide a rough assessment of the potential impact of coagulation, we integrated the coagulation equation over 7 d using a 1 min time step and a simple Euler integration method. Only Brownian coagulation was considered, using the kernel from Seinfeld and Pandis (2016, Table 13.1). Pressure was prescribed to increase linearly from 300 to 500 hPa over 7 d. Temperature was initialized at −50 °C at 300 hPa and evolved dry adiabatically, yielding approximately −15 °C at 500 hPa. Particles were initially assumed to follow a log-normal size distribution with a mean radius of 20 nm and a geometric standard deviation of 1.6, as in the EMAC simulations. The size distribution was discretized using a mass-doubling grid with 40 bins, starting from a minimum size edge of 0.47 nm. Based on the mean profile of the number mixing ratio Ncnt, derived from the sum of regional tracers at locations directly below the forcing regions in 10 years of EMAC simulations (NEMAC), an exponential decay was applied with an e-folding time of 3.69 d, corresponding to an 85 % reduction in Ncnt over 7 d, representing the combined effects of dilution and removal, primarily via wet scavenging.
The vertical profiles of number mixing ratio N for different initial values of N0, with and without the EMAC-derived attenuation rate, are shown in Fig. 6. In EMAC, the dominant processes affecting number mixing ratios are transport and wet scavenging, both of which act linearly on the number mixing ratio. As a result, the vertical gradient of the simulated tracer is preserved across different initial values, allowing for consistent scaling. We therefore include scaled versions of NEMAC in Fig. 6a to facilitate comparison with the idealized profiles.
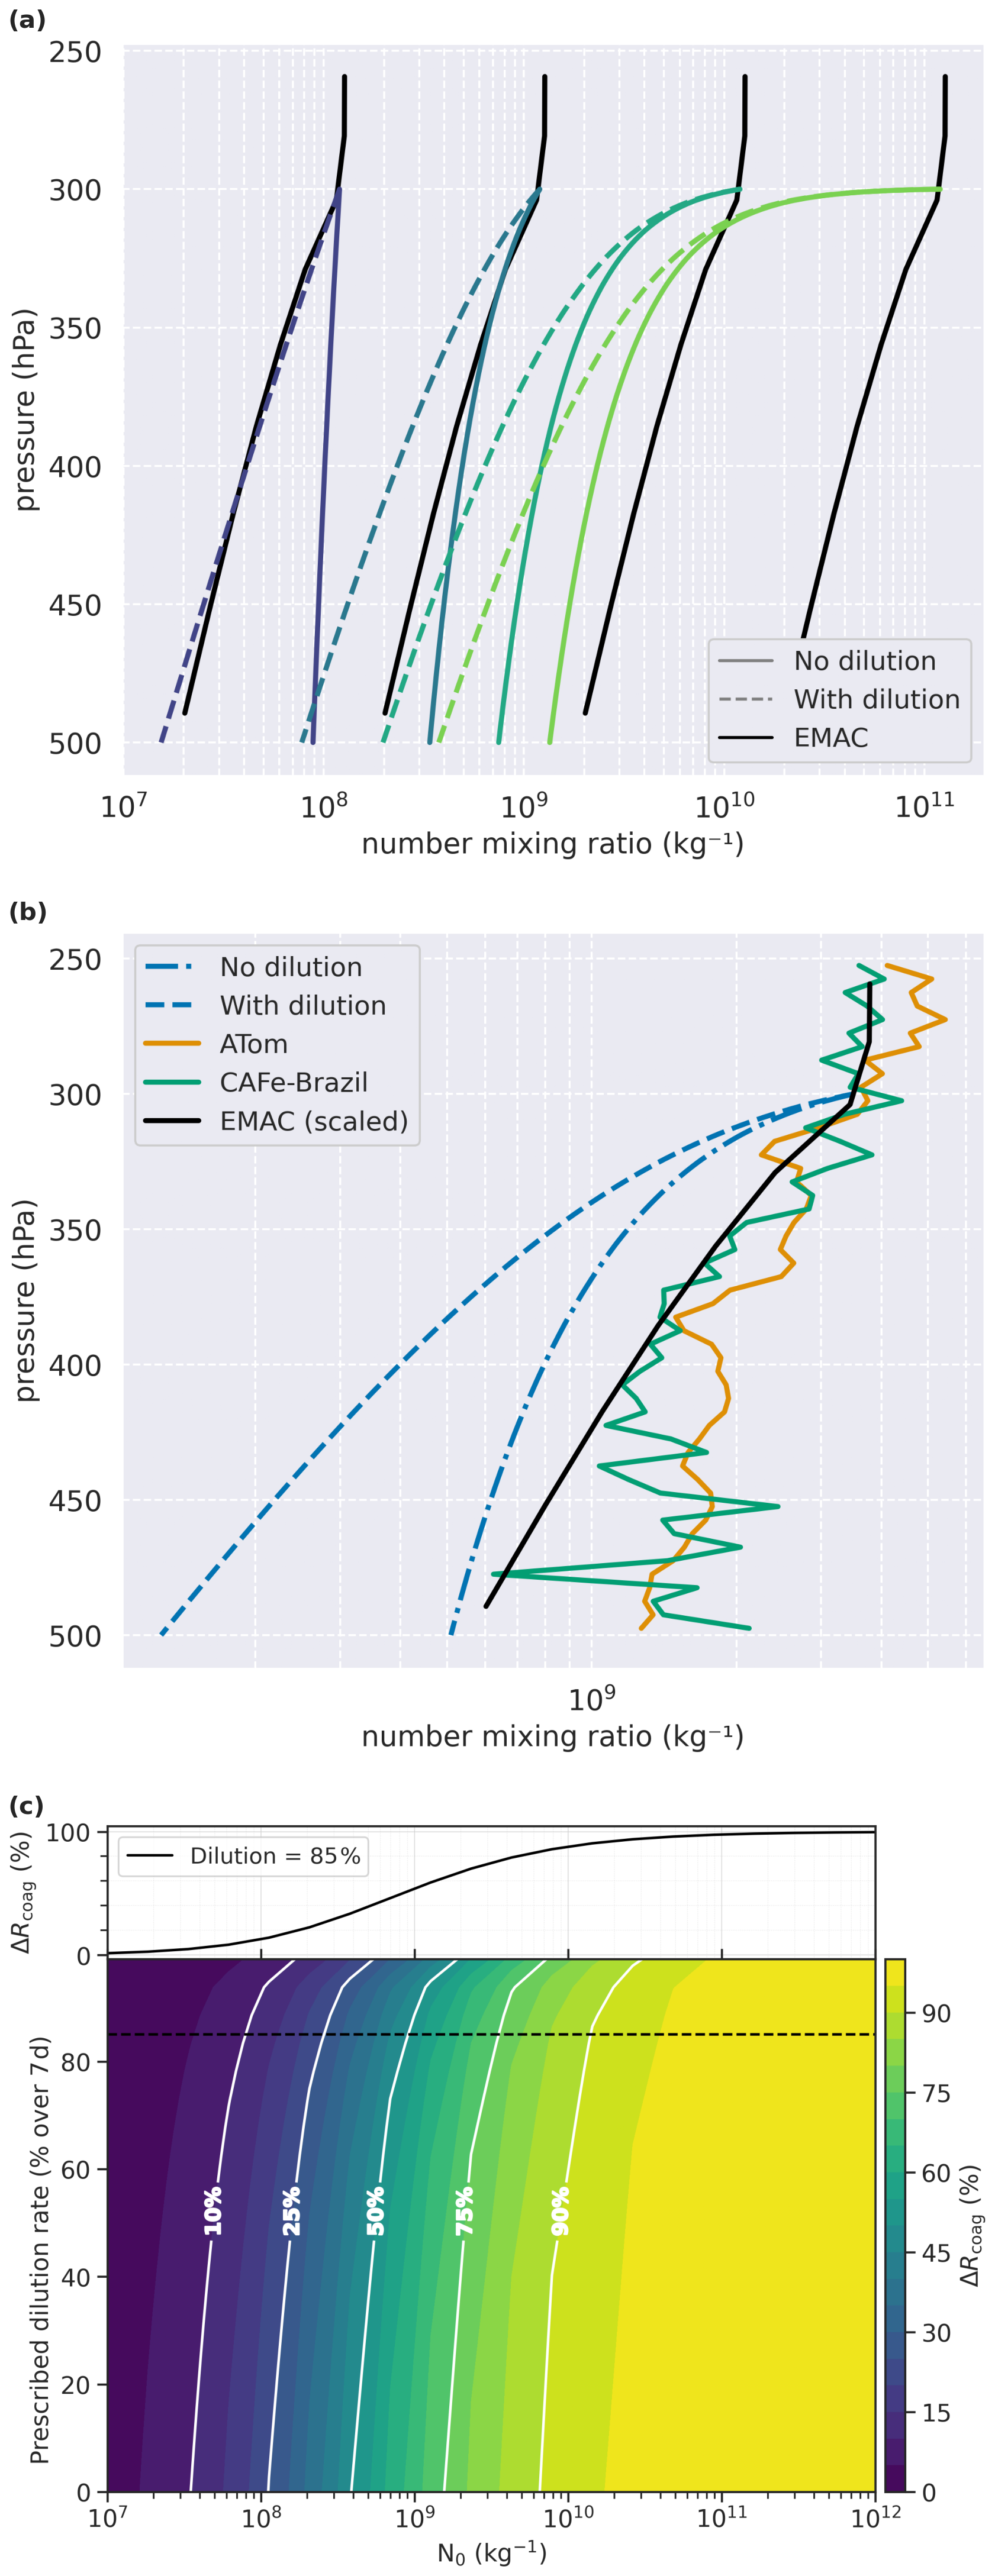
Figure 6Theoretical impact of aerosol coagulation assuming linear descent and a prescribed dilution rate. (a) Theoretical profiles along with scaled versions of the area-averaged number mixing ratio Ncnt below the forcing regions in the simulations. The EMAC profile is derived from simulation output from January 1999 to December 2008. (b) Similar to panel (a), but for the EMAC and theoretical coagulation profiles approximately matching the observed particle mixing ratios at 300 hPa from ATom 1 and 2, with mean ATom (Williamson et al., 2019a, b) and CAFE-Brazil observed profiles overlaid. The ATom data are restricted to latitudes between ±20°. Total number mixing ratios from the observations are derived from particle counts over approximately the 2–5000 nm diameter range. (c) Excess reduction in number mixing ratio due to including coagulation in addition to dilution in the theoretical calculations.
At high N0, coagulation acts rapidly, producing substantial reductions in particle number early in the descent. This is evident in Fig. 6a, where the calculations that include coagulation show much steeper initial decreases in N compared to EMAC, particularly for the larger values of N0. The rapid initial loss reflects the N2-dependence of the coagulation sink: the process is highly efficient when particle concentrations are large, but slows as N drops. When N0≥1010 kg−1 (≈ 4680 cm−3 at a pressure of 300 hPa and a temperature of −50 °C), coagulation dominates over the first ≈ 50 hPa of descent. Below this level, the coagulation rate weakens and the profiles evolve more nearly in parallel with the prescribed EMAC-derived attenuation, which represents the combined effects of dilution and wet scavenging. At lower initial values – particularly kg−1, equivalent to ≈ 562 cm−3 at 300 hPa and −50 °C, in Fig. 6a – the microphysical timescale becomes long compared to the transport timescale, and the prescribed attenuation by dilution and removal, dominated by wet scavenging, governs most of the evolution.
Observations of tropical upper-tropospheric (UT) aerosols typically fall within number mixing ratio ranges where coagulation can be highly effective. This is illustrated in Fig. 6b by comparing the theoretical profiles with the mean vertical profile of aerosol number mixing ratio from the Atmospheric Tomography Mission (ATom-1 and ATom-2, limited to latitudes between ±20°), reproduced from the dataset provided by Williamson et al. (2019a, b), and with the mean vertical profile from Fast Aerosol Size Distribution (FASD) measurements during the Chemistry of the Atmosphere: Field Experiment in Brazil (CAFE-Brazil; Curtius et al., 2024). Both observational profiles are limited to approximately the 2–5000 nm diameter range. For details on the aerosol measurements, see Williamson et al. (2019a) and Curtius et al. (2024).
The profiles observed during ATom and CAFE-Brazil, however, do not exhibit the steep vertical gradient predicted by the idealized coagulation calculations presented here. Instead, the observed profiles more closely resemble the EMAC profile, in which coagulation is not included. Additional calculations (not shown) indicate that, for the theoretical calculations to reproduce the vertical gradient in the ATom and CAFE-Brazil profiles, a mean radius of approximately 100 nm would have to be assumed at 300 hPa. This corresponds to a size range in which Brownian coagulation becomes less efficient, while gravitational coagulation has not yet become important. In contrast, observations suggest that a mean radius of approximately 20 nm is more representative of the natural particle size distributions at these altitudes, which are predominantly unimodal (e.g., Krejci et al., 2003; Williamson et al., 2019a).
The discrepancy in vertical gradients between the theoretical coagulation profile and the ATom/CAFE-Brazil profiles is likely associated with a combination of vertical transport/mixing and a more vertically widespread distribution of aerosol sources in the real atmosphere, in contrast to the source-free evolution assumed in the idealized coagulation calculations. Nevertheless, for the theoretical investigation of UT particle evolution and the relative roles of transport and microphysical growth processes, the approach employed here remains useful.
The idealized coagulation calculations should also be interpreted in light of numerical uncertainties associated with the sectional treatment of the collection equation. In the continuous coagulation equation, particle number decreases while particle mass is conserved. In a discrete bin representation that solves directly for the number distribution, numerical errors can arise from the redistribution of coagulation products across finite size bins, particularly when using fixed grids (e.g., Jacobson and Turco, 1995). In our 7 d idealized calculations, this leads to a cumulative mass non-conservation of approximately 15 %. More conservative approaches, such as the method-of-moments (e.g., Tzivion et al., 1987) or particle-based methods (e.g., Riemer et al., 2009), would be better suited for accurately preserving integral properties such as total aerosol mass while representing the evolution of particle number during coagulation. Nevertheless, the main conclusions here remain physically meaningful because they are based primarily on the strong, nonlinear dependence of the coagulation sink on particle number concentration and on the contrast between low- and high-N0 regimes. Thus, while these calculations should not be interpreted as a fully conservative microphysical simulation, they provide a physically grounded estimate of when coagulation is likely to become important relative to transport, dilution, and wet removal.
To quantify the transition between the regime in which transport dominates and the one in which coagulation introduces significant variability, we compare the final number mixing ratio from the idealized coagulation-plus-attenuation calculations to the theoretical value expected from the EMAC-derived attenuation alone, assuming a constant attenuation rate as in the EMAC mean profile in Fig. 6a. The excess reduction due to coagulation is defined as , and is shown in Fig. 6c as a function of initial N0 and prescribed 7 d attenuation rate. The excess remains below 50 % for kg−1, and below 10 % for kg−1 at low attenuation rates, and decreases monotonically as a function of the prescribed attenuation. At the EMAC mean attenuation rate (85 %), ΔRcoag≈50 % for N0≈109 kg−1, and ΔRcoag≈10 % for kg−1. This identifies a regime in which the omission of coagulation is not expected to significantly bias tracer-based diagnostics. Figure 6 thus provides a first-order physical basis for assessing and scaling potential errors introduced by the absence of coagulation in the EMAC simulations presented here, depending on the value of N0 assumed.
Future studies should further explore several key processes and sensitivities that remain unresolved in the present analysis. In particular, the role of convective clouds in transporting aerosols from the UT downward remains uncertain. Higher-resolution simulations will be necessary to explicitly capture subsidence around convective cores and downdrafts from mature convection, which may locally accelerate vertical transport. Additionally, incorporating a seasonal migration of the aerosol source region accompanying the Intertropical Convergence Zone (ITCZ) and the impact of interannual variability such as ENSO could reveal important modulations of transport pathways and aerosol residence times. A more complete representation of aerosol lifecycle processes – including nucleation, condensational and coagulation growth, and wet removal of both, cloud particles and condensable vapors – would also improve estimates of aerosol number and transformations during descent. A follow-up study will incorporate these additional layers of complexity to better quantify the coupled dynamics-microphysics of aerosol transport from UT sources.
An additional uncertainty in the present analysis arises from numerical diffusion, which may artificially smooth tracer gradients and enhance apparent mixing between source regions and the surrounding atmosphere. This may influence the diagnosed dilution rates, spatial spreading, and inferred transport timescales. While the multi-year simulations provide robust large-scale constraints on tracer redistribution, some of the rapid low-concentration signals identified by the time-to-threshold diagnostic may partly reflect numerical as well as physical mixing.
Lagrangian methods, including parcel trajectories and particle–dispersion models, are widely used to characterize transport pathways and source attribution (e.g., Lin et al., 2003; Stohl et al., 2005; Stein et al., 2015; Sprenger and Wernli, 2015). One of their key advantages is the reduced impact of numerical diffusion compared to Eulerian models. However, they also face several limitations: results depend on sampling density; turbulent mixing and irreversible entrainment/detrainment are difficult to represent; vertical exchanges into and out of air parcels, including sedimentation and wet scavenging with possible re-evaporation, are challenging to treat along individual trajectories; and inferred ages and pathways remain sensitive to uncertainties in the Eulerian wind fields driving them (Lin et al., 2012). Therefore, Eulerian and Lagrangian approaches remain complementary for identifying transport pathways and for case-specific process studies, the Lagrangian tracking component will be considered in future work.
This study provides a detailed assessment of vertical transport timescales and spatial distribution of aerosol tracers released from tropical and tropical-continental UT source regions based on large-scale transport mechanisms. The key findings are:
-
Transport timescales are highly sensitive to the extent of the source region. Regional continental tracers exhibit mean air ages of ≈ 260 d at 500 hPa, compared to ≈ 45 d for tropical-wide sources. This difference reflects the source-region dependence of the mean-age diagnostic, including the effects of mixing, dilution, and source-receptor geometry for spatially confined emissions, rather than a proportional weakening of vertical transport.
-
While the mean age responds to the full distribution of transport pathways and is strongly affected by source-region extent, the time-to-threshold diagnostic isolates the faster components of transport. The two diagnostics differ in their sensitivity to source size, with time-to-threshold varying by a factor of ≈ 2, and mean age by a factor of ≈ 5. Importantly, timescales faster than 7 d were found for all source regions when considering the time to reach a 10 % threshold, underscoring the presence of fast subsidence pathways from all source regions.
-
Descent time is strongly influenced by injection height. A 50 hPa increase in release altitude (from 200–300 to 150–250 hPa) extends the time to reach the 10 % threshold around the Amazon source region by approximately 19 d beyond the control case average (≈ 25 d), indicating a nonlinear sensitivity to source height.
-
Large-scale advection dominates over parameterized convection and turbulent diffusion. Removing parameterized convective transport increases descent time by only ≈ 10 %, while neglecting parameterized vertical diffusion has a negligible effect (≈ 1 %), indicating the primacy of large-scale circulation at the simulated scales.
-
Mid-tropospheric maxima in tracer number mixing ratios appear east of the source region centers – except for the Maritime Continent tracer, which peaks slightly to the southwest – consistent with regional wind patterns. Despite substantial reduction, number mixing ratios on the order of 10 %–15 % of the source region average remain potentially important.
-
Overall, the vertical gradient of number mixing ratio simulated here is, in principle, independent of the values in the forcing region, due to the assumed linearity of transport and wet scavenging. However, these trends hold strictly only for low number mixing ratios, where coagulation effects are negligible. The estimated correction due to coagulation to the fraction of the source region's number mixing ratio reaching the mid-troposphere in our simulations is less than 10 % when the initial assumed number mixing ratio is below approximately 6×10⁷ kg−1. Correction estimates as a function of number mixing ratio and attenuation rate are provided.
The Modular Earth Submodel System (MESSy) is being continuously further developed and applied by a consortium of institutions. The usage of MESSy and access to the source code is licenced to all affiliates of institutions who are members of the MESSy Consortium. Institutions can become a member of the MESSy Consortium by signing the MESSy Memorandum of Understanding. More information can be found on the MESSy Consortium website (http://www.messy-interface.org, last access: 21 August 2026). The model version applied for the presented analyses is https://doi.org/10.5281/zenodo.17052244 (The MESSy Consortium, 2025). The ATom data were obtained from https://doi.org/10.3334/ORNLDAAC/1684 (Williamson et al., 2019b).
AP conceived the study. LHP, AP, JC, and PJ co-designed the model experiments. LHP carried out the simulations, performed all analyses, and wrote the manuscript. MM supported the model setup. MP and CP provided the CAFE-Brazil aerosol measurements. All authors contributed to the editing of the manuscript and provided feedback on the analysis and its interpretation.
At least one of the (co-)authors is a member of the editorial board of Atmospheric Chemistry and Physics. The peer-review process was guided by an independent editor, and the authors also have no other competing interests to declare.
Publisher's note: Copernicus Publications remains neutral with regard to jurisdictional claims made in the text, published maps, institutional affiliations, or any other geographical representation in this paper. The authors bear the ultimate responsibility for providing appropriate place names. Views expressed in the text are those of the authors and do not necessarily reflect the views of the publisher.
This article is part of the special issue “The tropopause region in a changing atmosphere (TPChange) (ACP/AMT/GMD/WCD inter-journal SI)”. It is not associated with a conference.
The authors thank Holger Tost for the discussions on the simulation design and Astrid Kerkweg for the technical support. We thank Martin Heinritzi for his valuable comments on unpublished observational results. We are grateful to Ulrich Pöschl for his support regarding the use of the CAFE-Brazil aerosol measurements in this study. This work was funded by the Deutsche Forschungsgemeinschaft (DFG, German Research Foundation) – TRR 301 – Project-ID 428312742. This work used resources of the Deutsches Klimarechenzentrum (DKRZ) granted by its Scientific Steering Committee (WLA) under project ID bb1311. Further, datasets (MESSy initial and boundary conditions) provided by project pd1279 via the DKRZ data pool were used. AI has been used for grammar and scripting support.
This research has been supported by the Deutsche Forschungsgemeinschaft (grant no. TRR 301 – Project-ID 428312742).
This open-access publication was funded by Goethe University Frankfurt.
This paper was edited by Yun Qian and reviewed by three anonymous referees.
Andreae, M. O., Afchine, A., Albrecht, R., Holanda, B. A., Artaxo, P., Barbosa, H. M. J., Borrmann, S., Cecchini, M. A., Costa, A., Dollner, M., Fütterer, D., Järvinen, E., Jurkat, T., Klimach, T., Konemann, T., Knote, C., Krämer, M., Krisna, T., Machado, L. A. T., Mertes, S., Minikin, A., Pöhlker, C., Pöhlker, M. L., Pöschl, U., Rosenfeld, D., Sauer, D., Schlager, H., Schnaiter, M., Schneider, J., Schulz, C., Spanu, A., Sperling, V. B., Voigt, C., Walser, A., Wang, J., Weinzierl, B., Wendisch, M., and Ziereis, H.: Aerosol characteristics and particle production in the upper troposphere over the Amazon Basin, Atmos. Chem. Phys., 18, 921–961, https://doi.org/10.5194/acp-18-921-2018, 2018. a, b, c
Asselin, R.: Frequency Filter for Time Integrations, Mon. Weather Rev., 100, 487–490, https://doi.org/10.1175/1520-0493(1972)100<0487:FFFTI>2.3.CO;2, 1972. a
Bardakov, R., Krejci, R., Riipinen, I., and Ekman, A. M. L.: The Role of Convective Up- and Downdrafts in the Transport of Trace Gases in the Amazon, J. Geophys. Res.-Atmos., 127, e2022JD037265, https://doi.org/10.1029/2022JD037265, 2022. a
Bolin, B. and Rodhe, H.: A note on the concepts of age distribution and transit time in natural reservoirs, Tellus, 25, 58–62, https://doi.org/10.1111/j.2153-3490.1973.tb01594.x, 1973. a
Brewer, A. W.: Evidence for a world circulation provided by the measurements of helium and water vapour distribution in the stratosphere, Q. J. Roy. Meteor. Soc., 75, 351–363, https://doi.org/10.1002/qj.49707532603, 1949. a
Brock, C. A., Hamill, P., Wilson, J. C., Jonsson, H. H., and Chan, K. R.: Particle Formation in the Upper Tropical Troposphere: A Source of Nuclei for the Stratospheric Aerosol, Science, 270, 1650–1653, https://doi.org/10.1126/science.270.5242.1650, 1995. a
Burridge, D. M. and Haseler, J.: A model for medium range weather forecasting – Adiabatic formulation, Tech. rep., ECMWF, 1977. a
Chen, T.-C. and van Loon, H.: Interannual Variation of the Tropical Easterly Jet, Mon. Weather Rev., 115, 1739–1759, https://doi.org/10.1175/1520-0493(1987)115<1739:IVOTTE>2.0.CO;2, 1987. a
Clarke, A. D.: Atmospheric nuclei in the Pacific midtroposphere: Their nature, concentration, and evolution, J. Geophys. Res.-Atmos., 98, 20633–20647, https://doi.org/10.1029/93JD00797, 1993. a
Clarke, A. D. and Kapustin, V. N.: A Pacific Aerosol Survey. Part I: A Decade of Data on Particle Production, Transport, Evolution, and Mixing in the Troposphere, J. Atmos. Sci., 59, 363–382, https://doi.org/10.1175/1520-0469(2002)059<0363:APASPI>2.0.CO;2, 2002. a
Clarke, A. D., Varner, J. L., Eisele, F., Mauldin, R. L., Tanner, D., and Litchy, M.: Particle production in the remote marine atmosphere: Cloud outflow and subsidence during ACE 1, J. Geophys. Res.-Atmos., 103, 16397–16409, https://doi.org/10.1029/97JD02987, 1998. a
Clarke, A. D., Eisele, F., Kapustin, V. N., Moore, K., Tanner, D., Mauldin, L., Litchy, M., Lienert, B., Carroll, M. A., and Albercook, G.: Nucleation in the equatorial free troposphere: Favorable environments during PEM-Tropics, J. Geophys. Res.-Atmos., 104, 5735–5744, https://doi.org/10.1029/98JD02303, 1999. a, b, c
Covert, D. S., Kapustin, V. N., Bates, T. S., and Quinn, P. K.: Physical properties of marine boundary layer aerosol particles of the mid-Pacific in relation to sources and meteorological transport, J. Geophys. Res.-Atmos., 101, 6919–6930, https://doi.org/10.1029/95JD03068, 1996. a
Curtius, J., Heinritzi, M., Beck, L. J., Pöhlker, M. L., Tripathi, N., Krumm, B. E., Holzbeck, P., Nussbaumer, C. M., Pardo, L. H., Klimach, T., Barmpounis, K., Andersen, S. T., Bardakov, R., Bohn, B., Cecchini, M. A., Chaboureau, J.-P., Dauhut, T., Dienhart, D., Dörich, R., Edtbauer, A., Giez, A., Hartmann, A., Holanda, B. A., Joppe, P., Kaiser, K., Keber, T., Klebach, H., Krüger, O. O., Kürten, A., Mallaun, C., Marno, D., Martinez, M., Monteiro, C., Nelson, C., Ort, L., Raj, S. S., Richter, S., Ringsdorf, A., Rocha, F., Simon, M., Sreekumar, S., Tsokankunku, A., Unfer, G. R., Valenti, I. D., Wang, N., Zahn, A., Zauner-Wieczorek, M., Albrecht, R. I., Andreae, M. O., Artaxo, P., Crowley, J. N., Fischer, H., Harder, H., Herdies, D. L., Machado, L. A. T., Pöhlker, C., Pöschl, U., Possner, A., Pozzer, A., Schneider, J., Williams, J., and Lelieveld, J.: Isoprene nitrates drive new particle formation in Amazon's upper troposphere, Nature, 636, 124–130, https://doi.org/10.1038/s41586-024-08192-4, 2024. a, b, c, d
de Reus, M., Krejci, R., Williams, J., Fischer, H., Scheele, R., and Ström, J.: Vertical and horizontal distributions of the aerosol number concentration and size distribution over the northern Indian Ocean, J. Geophys. Res.-Atmos., 106, 28629–28641, https://doi.org/10.1029/2001JD900017, 2001. a, b
Dietmüller, S., Jöckel, P., Tost, H., Kunze, M., Gellhorn, C., Brinkop, S., Frömming, C., Ponater, M., Steil, B., Lauer, A., and Hendricks, J.: A new radiation infrastructure for the Modular Earth Submodel System (MESSy, based on version 2.51), Geosci. Model Dev., 9, 2209–2222, https://doi.org/10.5194/gmd-9-2209-2016, 2016. a
Dobson, G. M. B. and Massey, H. S. W.: Origin and distribution of the polyatomic molecules in the atmosphere, P. Roy. Soc. Lond. A Mat., 236, 187–193, https://doi.org/10.1098/rspa.1956.0127, 1956. a
Ekman, A. M. L., Hermann, M., Groß, P., Heintzenberg, J., Kim, D., and Wang, C.: Sub-micrometer aerosol particles in the upper troposphere/lowermost stratosphere as measured by CARIBIC and modeled using the MIT-CAM3 global climate model, J. Geophys. Res.-Atmos., 117, https://doi.org/10.1029/2011JD016777, 2012. a
Emmerichs, T., Kerkweg, A., Ouwersloot, H., Fares, S., Mammarella, I., and Taraborrelli, D.: A revised dry deposition scheme for land–atmosphere exchange of trace gases in ECHAM/MESSy v2.54, Geosci. Model Dev., 14, 495–519, https://doi.org/10.5194/gmd-14-495-2021, 2021. a
English, J. M., Toon, O. B., Mills, M. J., and Yu, F.: Microphysical simulations of new particle formation in the upper troposphere and lower stratosphere, Atmos. Chem. Phys., 11, 9303–9322, https://doi.org/10.5194/acp-11-9303-2011, 2011. a
Franco, M. A., Ditas, F., Kremper, L. A., Machado, L. A. T., Andreae, M. O., Araújo, A., Barbosa, H. M. J., de Brito, J. F., Carbone, S., Holanda, B. A., Morais, F. G., Nascimento, J. P., Pöhlker, M. L., Rizzo, L. V., Sá, M., Saturno, J., Walter, D., Wolff, S., Pöschl, U., Artaxo, P., and Pöhlker, C.: Occurrence and growth of sub-50 nm aerosol particles in the Amazonian boundary layer, Atmos. Chem. Phys., 22, 3469–3492, https://doi.org/10.5194/acp-22-3469-2022, 2022. a
Froyd, K. D., Murphy, D. M., Sanford, T. J., Thomson, D. S., Wilson, J. C., Pfister, L., and Lait, L.: Aerosol composition of the tropical upper troposphere, Atmos. Chem. Phys., 9, 4363–4385, https://doi.org/10.5194/acp-9-4363-2009, 2009. a
Hall, T. M. and Plumb, R. A.: Age as a diagnostic of stratospheric transport, J. Geophys. Res.-Atmos., 99, 1059–1070, https://doi.org/10.1029/93JD03192, 1994. a, b
Hamrud, M.: Residence time and spatial variability for gases in the atmosphere, Tellus B, 35, 295–303, https://doi.org/10.3402/tellusb.v35i5.14619, 1983. a
Hartmann, D. L., Dygert, B. D., Blossey, P. N., Fu, Q., and Sokol, A. B.: The Vertical Profile of Radiative Cooling and Lapse Rate in a Warming Climate, J. Climate, 35, 6253–6265, https://doi.org/10.1175/JCLI-D-21-0861.1, 2022. a
Heintzenberg, J., Hermann, M., Weigelt, A., Clarke, A., Kapustin, V., Anderson, B., Thornhill, K., Velthoven, P. V., Zahn, A., and Brenninkmeijer, C.: Near-global aerosol mapping in the upper troposphere and lowermost stratosphere with data from the CARIBIC project, Tellus B, 63, 875–890, https://doi.org/10.1111/j.1600-0889.2011.00578.x, 2011. a, b
Hersbach, H., Bell, B., Berrisford, P., Hirahara, S., Horányi, A., Muñoz-Sabater, J., Nicolas, J., Peubey, C., Radu, R., Schepers, D., Simmons, A., Soci, C., Abdalla, S., Abellan, X., Balsamo, G., Bechtold, P., Biavati, G., Bidlot, J., Bonavita, M., De Chiara, G., Dahlgren, P., Dee, D., Diamantakis, M., Dragani, R., Flemming, J., Forbes, R., Fuentes, M., Geer, A., Haimberger, L., Healy, S., Hogan, R. J., Hólm, E., Janisková, M., Keeley, S., Laloyaux, P., Lopez, P., Lupu, C., Radnoti, G., de Rosnay, P., Rozum, I., Vamborg, F., Villaume, S., and Thépaut, J.-N.: The ERA5 global reanalysis, Q. J. Roy. Meteor. Soc., 146, 1999–2049, https://doi.org/10.1002/qj.3803, 2020. a
Jacobson, M. Z. and Turco, R. P.: Simulating Condensational Growth, Evaporation, and Coagulation of Aerosols Using a Combined Moving and Stationary Size Grid, Aerosol Sci. Tech., 22, 73–92, https://doi.org/10.1080/02786829408959729, 1995. a
Jobson, B. T., McKeen, S. A., Parrish, D. D., Fehsenfeld, F. C., Blake, D. R., Goldstein, A. H., Schauffler, S. M., and Elkins, J. W.: Trace gas mixing ratio variability versus lifetime in the troposphere and stratosphere: Observations, J. Geophys. Res.-Atmos., 104, 16091–16113, https://doi.org/10.1029/1999JD900126, 1999. a, b
Jöckel, P., Sander, R., Kerkweg, A., Tost, H., and Lelieveld, J.: Technical Note: The Modular Earth Submodel System (MESSy) – a new approach towards Earth System Modeling, Atmos. Chem. Phys., 5, 433–444, https://doi.org/10.5194/acp-5-433-2005, 2005. a
Jöckel, P., Tost, H., Pozzer, A., Brühl, C., Buchholz, J., Ganzeveld, L., Hoor, P., Kerkweg, A., Lawrence, M. G., Sander, R., Steil, B., Stiller, G., Tanarhte, M., Taraborrelli, D., van Aardenne, J., and Lelieveld, J.: The atmospheric chemistry general circulation model ECHAM5/MESSy1: consistent simulation of ozone from the surface to the mesosphere, Atmos. Chem. Phys., 6, 5067–5104, https://doi.org/10.5194/acp-6-5067-2006, 2006. a
Jöckel, P., Kerkweg, A., Buchholz-Dietsch, J., Tost, H., Sander, R., and Pozzer, A.: Technical Note: Coupling of chemical processes with the Modular Earth Submodel System (MESSy) submodel TRACER, Atmos. Chem. Phys., 8, 1677–1687, https://doi.org/10.5194/acp-8-1677-2008, 2008. a
Jöckel, P., Kerkweg, A., Pozzer, A., Sander, R., Tost, H., Riede, H., Baumgaertner, A., Gromov, S., and Kern, B.: Development cycle 2 of the Modular Earth Submodel System (MESSy2), Geosci. Model Dev., 3, 717–752, https://doi.org/10.5194/gmd-3-717-2010, 2010. a, b
Kerkweg, A. and Jöckel, P.: The infrastructure MESSy submodels GRID (v1.0) and IMPORT (v1.0), Geosci. Model Dev. Discuss., 8, 8607–8633, https://doi.org/10.5194/gmdd-8-8607-2015, 2015. a
Kerkweg, A., Buchholz, J., Ganzeveld, L., Pozzer, A., Tost, H., and Jöckel, P.: Technical Note: An implementation of the dry removal processes DRY DEPosition and SEDImentation in the Modular Earth Submodel System (MESSy), Atmos. Chem. Phys., 6, 4617–4632, https://doi.org/10.5194/acp-6-4617-2006, 2006a. a
Kerkweg, A., Sander, R., Tost, H., and Jöckel, P.: Technical note: Implementation of prescribed (OFFLEM), calculated (ONLEM), and pseudo-emissions (TNUDGE) of chemical species in the Modular Earth Submodel System (MESSy), Atmos. Chem. Phys., 6, 3603–3609, https://doi.org/10.5194/acp-6-3603-2006, 2006b. a
Krejci, R., Ström, J., de Reus, M., Hoor, P., Williams, J., Fischer, H., and Hansson, H.-C.: Evolution of aerosol properties over the rain forest in Surinam, South America, observed from aircraft during the LBA-CLAIRE 98 experiment, J. Geophys. Res.-Atmos., 108, https://doi.org/10.1029/2001JD001375, 2003. a
Lee, S.-H., Reeves, J. M., Wilson, J. C., Hunton, D. E., Viggiano, A. A., Miller, T. M., Ballenthin, J. O., and Lait, L. R.: Particle Formation by Ion Nucleation in the Upper Troposphere and Lower Stratosphere, Science, 301, 1886–1889, https://doi.org/10.1126/science.1087236, 2003. a
Lin, J., Brunner, D., Gerbig, C., Stohl, A., Luhar, A., and Webley, P. (Eds.): Lagrangian Modeling of the Atmosphere, vol. 200 of Geophysical Monograph Series, American Geophysical Union, Washington, D.C., ISBN 9781118704578, https://doi.org/10.1029/GM200, 2012. a
Lin, J. C., Gerbig, C., Wofsy, S. C., Andrews, A. E., Daube, B. C., Davis, K. J., and Grainger, C. A.: A near-field tool for simulating the upstream influence of atmospheric observations: The Stochastic Time-Inverted Lagrangian Transport (STILT) model, J. Geophys. Res.-Atmos., 108, https://doi.org/10.1029/2002JD003161, 2003. a
Lin, S.-J. and Rood, R. B.: Multidimensional Flux-Form Semi-Lagrangian Transport Schemes, Mon. Weather Rev., 124, 2046–2070, https://doi.org/10.1175/1520-0493(1996)124<2046:MFFSLT>2.0.CO;2, 1996. a
Lohmann, U. and Roeckner, E.: Design and performance of a new cloud microphysics scheme developed for the ECHAM general circulation model, Clim. Dynam., 12, 557–572, https://doi.org/10.1007/BF00207939, 1996. a
Lott, F.: Alleviation of Stationary Biases in a GCM through a Mountain Drag Parameterization Scheme and a Simple Representation of Mountain Lift Forces, Mon. Weather Rev., 127, 788–801, https://doi.org/10.1175/1520-0493(1999)127<0788:AOSBIA>2.0.CO;2, 1999. a
Lott, F. and Miller, M. J.: A new subgrid-scale orographic drag parametrization: Its formulation and testing, Q. J. Roy. Meteor. Soc., 123, 101–127, https://doi.org/10.1002/qj.49712353704, 1997. a
Machado, L. A. T., Franco, M. A., Kremper, L. A., Ditas, F., Andreae, M. O., Artaxo, P., Cecchini, M. A., Holanda, B. A., Pöhlker, M. L., Saraiva, I., Wolff, S., Pöschl, U., and Pöhlker, C.: How weather events modify aerosol particle size distributions in the Amazon boundary layer, Atmos. Chem. Phys., 21, 18065–18086, https://doi.org/10.5194/acp-21-18065-2021, 2021. a
Mann, G. W., Carslaw, K. S., Ridley, D. A., Spracklen, D. V., Pringle, K. J., Merikanto, J., Korhonen, H., Schwarz, J. P., Lee, L. A., Manktelow, P. T., Woodhouse, M. T., Schmidt, A., Breider, T. J., Emmerson, K. M., Reddington, C. L., Chipperfield, M. P., and Pickering, S. J.: Intercomparison of modal and sectional aerosol microphysics representations within the same 3-D global chemical transport model, Atmos. Chem. Phys., 12, 4449–4476, https://doi.org/10.5194/acp-12-4449-2012, 2012. a
Mauritsen, T., Bader, J., Becker, T., Behrens, J., Bittner, M., Brokopf, R., Brovkin, V., Claussen, M., Crueger, T., Esch, M., Fast, I., Fiedler, S., Fläschner, D., Gayler, V., Giorgetta, M., Goll, D. S., Haak, H., Hagemann, S., Hedemann, C., Hohenegger, C., Ilyina, T., Jahns, T., Jimenéz-de-la Cuesta, D., Jungclaus, J., Kleinen, T., Kloster, S., Kracher, D., Kinne, S., Kleberg, D., Lasslop, G., Kornblueh, L., Marotzke, J., Matei, D., Meraner, K., Mikolajewicz, U., Modali, K., Möbis, B., Müller, W. A., Nabel, J. E. M. S., Nam, C. C. W., Notz, D., Nyawira, S.-S., Paulsen, H., Peters, K., Pincus, R., Pohlmann, H., Pongratz, J., Popp, M., Raddatz, T. J., Rast, S., Redler, R., Reick, C. H., Rohrschneider, T., Schemann, V., Schmidt, H., Schnur, R., Schulzweida, U., Six, K. D., Stein, L., Stemmler, I., Stevens, B., von Storch, J.-S., Tian, F., Voigt, A., Vrese, P., Wieners, K.-H., Wilkenskjeld, S., Winkler, A., and Roeckner, E.: Developments in the MPI-M Earth System Model version 1.2 (MPI-ESM1.2) and Its Response to Increasing CO2, J. Adv. Model. Earth Sy., 11, 998–1038, https://doi.org/10.1029/2018MS001400, 2019. a
Merikanto, J., Spracklen, D. V., Mann, G. W., Pickering, S. J., and Carslaw, K. S.: Impact of nucleation on global CCN, Atmos. Chem. Phys., 9, 8601–8616, https://doi.org/10.5194/acp-9-8601-2009, 2009. a, b, c
Minikin, A., Petzold, A., Ström, J., Krejci, R., Seifert, M., van Velthoven, P., Schlager, H., and Schumann, U.: Aircraft observations of the upper tropospheric fine particle aerosol in the Northern and Southern Hemispheres at midlatitudes, Geophys. Res. Lett., 30, https://doi.org/10.1029/2002GL016458, 2003. a
Müller, W. A., Jungclaus, J. H., Mauritsen, T., Baehr, J., Bittner, M., Budich, R., Bunzel, F., Esch, M., Ghosh, R., Haak, H., Ilyina, T., Kleine, T., Kornblueh, L., Li, H., Modali, K., Notz, D., Pohlmann, H., Roeckner, E., Stemmler, I., Tian, F., and Marotzke, J.: A Higher-resolution Version of the Max Planck Institute Earth System Model (MPI-ESM1.2-HR), J. Adv. Model. Earth Sy., 10, 1383–1413, https://doi.org/10.1029/2017MS001217, 2018. a
Nordeng, T.-E.: Extended versions of the convective parametrization scheme at ECMWF and their impact on the mean and transient activity of the model in the tropics, ECMWF, https://doi.org/10.21957/e34xwhysw, 1994. a
Ott, W. R.: A Physical Explanation of the Lognormality of Pollutant Concentrations, J. Air Waste Manage. Assoc., 40, 1378–1383, https://doi.org/10.1080/10473289.1990.10466789, 1990. a
Podglajen, A. and Ploeger, F.: Retrieving the age of air spectrum from tracers: principle and method, Atmos. Chem. Phys., 19, 1767–1783, https://doi.org/10.5194/acp-19-1767-2019, 2019. a
Raes, F.: Entrainment of free tropospheric aerosols as a regulating mechanism for cloud condensation nuclei in the remote marine boundary layer, J. Geophys. Res.-Atmos., 100, 2893–2903, https://doi.org/10.1029/94JD02832, 1995. a
Raes, F., Dingenen, R. V., Vignati, E., Wilson, J., Putaud, J.-P., Seinfeld, J. H., and Adams, P.: Formation and cycling of aerosols in the global troposphere, Atmos. Environ., 34, 4215–4240, https://doi.org/10.1016/S1352-2310(00)00239-9, 2000. a
Riemer, N., West, M., Zaveri, R. A., and Easter, R. C.: Simulating the evolution of soot mixing state with a particle-resolved aerosol model, J. Geophys. Res.-Atmos., 114, https://doi.org/10.1029/2008JD011073, 2009. a
Robert, A.: A stable numerical integration scheme for the primitive meteorological equations, Atmos.-Ocean, 19, 35–46, https://doi.org/10.1080/07055900.1981.9649098, 1981. a
Robert, A.: A scheme that combines semi-ragrangene and semi-imprisit methods for primitive equations, J. Meteorol. Soc. Jpn. Ser. II, 60, 319–325, https://doi.org/10.2151/jmsj1965.60.1_319, 1982. a
Robert, A., Henderson, J., and Turnbull, C.: An Implicit Time Integration Scheme for Baroclinic Models of the Atmosphere, Mon. Weather Rev., 100, 329–335, https://doi.org/10.1175/1520-0493(1972)100<0329:AITISF>2.3.CO;2, 1972. a
Roeckner, E., Bäuml, G., Bonaventura, L., Brokopf, R., Esch, M., Giorgetta, M., Hagemann, S., Kirchner, I., Kornblueh, L., Manzini, E., Rhodin, A., Schlese, U., Schulzweida, U., and Tompkins, A.: The atmospheric general circulation model ECHAM 5. PART I: Model description, Tech. rep., Max-Planck-Institut für Meteorologie, https://doi.org/10.17617/2.995269, 2003. a
Schupfner, M., Wieners, K.-H., Wachsmann, F., Milinski, S., Steger, C., Bittner, M., Jungclaus, J., Früh, B., Pankatz, K., Giorgetta, M., Reick, C., Legutke, S., Esch, M., Gayler, V., Haak, H., de Vrese, P., Raddatz, T., Mauritsen, T., von Storch, J.-S., Behrens, J., Brovkin, V., Claussen, M., Crueger, T., Fast, I., Fiedler, S., Hagemann, S., Hohenegger, C., Jahns, T., Kloster, S., Kinne, S., Lasslop, G., Kornblueh, L., Marotzke, J., Matei, D., Meraner, K., Mikolajewicz, U., Modali, K., Müller, W., Nabel, J., Notz, D., Peters-von Gehlen, K., Pincus, R., Pohlmann, H., Pongratz, J., Rast, S., Schmidt, H., Schnur, R., Schulzweida, U., Six, K., Stevens, B., Voigt, A., and Roeckner, E.: DKRZ MPI-ESM1.2-LR model output prepared for CMIP6 ScenarioMIP, Earth System Grid Federation, https://doi.org/10.22033/ESGF/CMIP6.15349, 2021. a
Seinfeld, J. H. and Pandis, S. N.: Atmospheric chemistry and physics: from air pollution to climate change, John Wiley & Sons, ISBN 978-1-118-94740-1, 2016. a
Simmons, A. J. and Burridge, D. M.: An Energy and Angular-Momentum Conserving Vertical Finite-Difference Scheme and Hybrid Vertical Coordinates, Mon. Weather Rev., 109, 758–766, https://doi.org/10.1175/1520-0493(1981)109<0758:AEAAMC>2.0.CO;2, 1981. a
Sprenger, M. and Wernli, H.: The LAGRANTO Lagrangian analysis tool – version 2.0, Geosci. Model Dev., 8, 2569–2586, https://doi.org/10.5194/gmd-8-2569-2015, 2015. a
Stein, A. F., Draxler, R. R., Rolph, G. D., Stunder, B. J. B., Cohen, M. D., and Ngan, F.: NOAA's HYSPLIT Atmospheric Transport and Dispersion Modeling System, B. Am. Meteorol. Soc., 96, 2059–2077, https://doi.org/10.1175/BAMS-D-14-00110.1, 2015. a
Stohl, A., Forster, C., Frank, A., Seibert, P., and Wotawa, G.: Technical note: The Lagrangian particle dispersion model FLEXPART version 6.2, Atmos. Chem. Phys., 5, 2461–2474, https://doi.org/10.5194/acp-5-2461-2005, 2005. a
Sundqvist, H.: A parameterization scheme for non-convective condensation including prediction of cloud water content, Q. J. Roy. Meteor. Soc., 104, 677–690, https://doi.org/10.1002/qj.49710444110, 1978. a
Sundqvist, H., Berge, E., and Kristjánsson, J. E.: Condensation and Cloud Parameterization Studies with a Mesoscale Numerical Weather Prediction Model, Mon. Weather Rev., 117, 1641–1657, https://doi.org/10.1175/1520-0493(1989)117<1641:CACPSW>2.0.CO;2, 1989. a
The MESSy Consortium: The Modular Earth Submodel System (Versions 2.55.2_762-TPC-TS-setup-C06_e84cbe8f), Zenodo [code], https://doi.org/10.5281/zenodo.17052244, 2025. a
Tiedtke, M.: A Comprehensive Mass Flux Scheme for Cumulus Parameterization in Large-Scale Models, Mon. Weather Rev., 117, 1779–1800, https://doi.org/10.1175/1520-0493(1989)117<1779:ACMFSF>2.0.CO;2, 1989. a
Tost, H., Jöckel, P., Kerkweg, A., Sander, R., and Lelieveld, J.: Technical note: A new comprehensive SCAVenging submodel for global atmospheric chemistry modelling, Atmos. Chem. Phys., 6, 565–574, https://doi.org/10.5194/acp-6-565-2006, 2006. a
Trenberth, K. E., Stepaniak, D. P., and Caron, J. M.: The Global Monsoon as Seen through the Divergent Atmospheric Circulation, J. Climate, 13, 3969–3993, https://doi.org/10.1175/1520-0442(2000)013<3969:TGMAST>2.0.CO;2, 2000. a
Tzivion, S., Feingold, G., and Levin, Z.: An Efficient Numerical Solution to the Stochastic Collection Equation, J. Atmos. Sci., 44, 3139–3149, https://doi.org/10.1175/1520-0469(1987)044<3139:AENSTT>2.0.CO;2, 1987. a
Varanda Rizzo, L., Roldin, P., Brito, J., Backman, J., Swietlicki, E., Krejci, R., Tunved, P., Petäjä, T., Kulmala, M., and Artaxo, P.: Multi-year statistical and modeling analysis of submicrometer aerosol number size distributions at a rain forest site in Amazonia, Atmos. Chem. Phys., 18, 10255–10274, https://doi.org/10.5194/acp-18-10255-2018, 2018. a
Wang, J., Krejci, R., Giangrande, S., Kuang, C., Barbosa, H. M. J., Brito, J., Carbone, S., Chi, X., Comstock, J., Ditas, F., Lavric, J., Manninen, H. E., Mei, F., Moran-Zuloaga, D., Pöhlker, C., Pöhlker, M. L., Saturno, J., Schmid, B., Souza, R. A. F., Springston, S. R., Tomlinson, J. M., Toto, T., Walter, D., Wimmer, D., Smith, J. N., Kulmala, M., Machado, L. A. T., Artaxo, P., Andreae, M. O., Petäjä, T., and Martin, S. T.: Amazon boundary layer aerosol concentration sustained by vertical transport during rainfall, Nature, 539, 416–419, https://doi.org/10.1038/nature19819, 2016. a, b
Wang, X., Gordon, H., Grosvenor, D. P., Andreae, M. O., and Carslaw, K. S.: Contribution of regional aerosol nucleation to low-level CCN in an Amazonian deep convective environment: results from a regionally nested global model, Atmos. Chem. Phys., 23, 4431–4461, https://doi.org/10.5194/acp-23-4431-2023, 2023. a, b, c
Watson-Parris, D., Schutgens, N., Reddington, C., Pringle, K. J., Liu, D., Allan, J. D., Coe, H., Carslaw, K. S., and Stier, P.: In situ constraints on the vertical distribution of global aerosol, Atmos. Chem. Phys., 19, 11765–11790, https://doi.org/10.5194/acp-19-11765-2019, 2019. a
Waugh, D. and Hall, T.: Age of stratospheric air: Theory, observations, and models, Rev. Geophys., 40, 1-1–1-26, https://doi.org/10.1029/2000RG000101, 2002. a, b
Weigel, R., Borrmann, S., Kazil, J., Minikin, A., Stohl, A., Wilson, J. C., Reeves, J. M., Kunkel, D., de Reus, M., Frey, W., Lovejoy, E. R., Volk, C. M., Viciani, S., D'Amato, F., Schiller, C., Peter, T., Schlager, H., Cairo, F., Law, K. S., Shur, G. N., Belyaev, G. V., and Curtius, J.: In situ observations of new particle formation in the tropical upper troposphere: the role of clouds and the nucleation mechanism, Atmos. Chem. Phys., 11, 9983–10010, https://doi.org/10.5194/acp-11-9983-2011, 2011. a
Weigelt, A., Hermann, M., van Velthoven, P. F. J., Brenninkmeijer, C. A. M., Schlaf, G., Zahn, A., and Wiedensohler, A.: Influence of clouds on aerosol particle number concentrations in the upper troposphere, J. Geophys. Res.-Atmos., 114, https://doi.org/10.1029/2008JD009805, 2009. a
Williamson, C. J., Kupc, A., Axisa, D., Bilsback, K. R., Bui, T., Campuzano-Jost, P., Dollner, M., Froyd, K. D., Hodshire, A. L., Jimenez, J. L., Kodros, J. K., Luo, G., Murphy, D. M., Nault, B. A., Ray, E. A., Weinzierl, B., Wilson, J. C., Yu, F., Yu, P., Pierce, J. R., and Brock, C. A.: A large source of cloud condensation nuclei from new particle formation in the tropics, Nature, 574, 399–403, https://doi.org/10.1038/s41586-019-1638-9, 2019a. a, b, c, d, e, f
Williamson, C. J., Kupc, A., Bilsback, K. R., Bui, T. P., Jost, P. C., Dollner, M., Froyd, K. D., Hodshire, A. L., Jimenez, J. L., Kodros, J. K., Luo, G., Murphy, D. M., Nault, B. A., Ray, E. A., Weinzierl, B. B., Yu, F., Yu, P., Pierce, J. R., and Brock, C. A.: ATom: In Situ Tropical Aerosol Properties and Comparable Global Model Outputs (Version 1), ORNL Distributed Active Archive Center [data set], https://doi.org/10.3334/ORNLDAAC/1684, 2019b. a, b, c
Yu, F., Luo, G., Bates, T. S., Anderson, B., Clarke, A., Kapustin, V., Yantosca, R. M., Wang, Y., and Wu, S.: Spatial distributions of particle number concentrations in the global troposphere: Simulations, observations, and implications for nucleation mechanisms, J. Geophys. Res.-Atmos., 115, https://doi.org/10.1029/2009JD013473, 2010. a
Zhang, K., Wan, H., Wang, B., Zhang, M., Feichter, J., and Liu, X.: Tropospheric aerosol size distributions simulated by three online global aerosol models using the M7 microphysics module, Atmos. Chem. Phys., 10, 6409–6434, https://doi.org/10.5194/acp-10-6409-2010, 2010. a
Zhao, B., Shrivastava, M., Donahue, N. M., Gordon, H., Schervish, M., Shilling, J. E., Zaveri, R. A., Wang, J., Andreae, M. O., Zhao, C., Gaudet, B., Liu, Y., Fan, J., and Fast, J. D.: High concentration of ultrafine particles in the Amazon free troposphere produced by organic new particle formation, P. Natl. Acad. Sci. USA, 117, 25344–25351, https://doi.org/10.1073/pnas.2006716117, 2020. a, b
Zhu, J., Penner, J. E., Yu, F., Sillman, S., Andreae, M. O., and Coe, H.: Decrease in radiative forcing by organic aerosol nucleation, climate, and land use change, Nat. Commun., 10, 423, https://doi.org/10.1038/s41467-019-08407-7, 2019. a, b