
the Creative Commons Attribution 4.0 License.
the Creative Commons Attribution 4.0 License.
 | 17 Aug 2026
Tracking air volumes for assessing the effect of urban aerosols on convective precipitation: a multi-member modeling study
Friederike Keil
Markus Quante
Bernd Heinold
Volker Matthias
Urban emissions impact aerosol–cloud interactions and thereby modify precipitation patterns, yet whether realistic emission perturbations from a mid-sized European city produce detectable effects above internal meteorological variability in a high-background aerosol environment remains an open question. This study investigates the influence of urban aerosol fields on convective precipitation through explicit chemistry-cloud coupling, using a trajectory-based ensemble approach designed to isolate weak aerosol signals from natural variability. Using the coupled COSMO-DCEP-MUSCAT modeling system, we simulate two convective events passing over the city of Leipzig, Germany, with experiments comparing total emissions to zero urban emissions, with five ensemble members for each setting. Cloud droplet activation is calculated from prognostic three-dimensional aerosol fields, providing a physically consistent representation of aerosol–cloud interactions. We use backward trajectory analysis to directly trace air volumes carrying urban emissions from convective clouds back to the region of urban emission sources, enabling objective sampling of individual clouds and isolation of local emission effects. The results reveal case-dependent responses. Under moderate atmospheric instability, urban aerosols locally modify the cloud microphysics and precipitation without altering the overall structure of the convective event. Under stronger initial instability, the urban emissions intensify the precipitation, leading to stronger downdrafts and weaker updrafts, altering the convective event's evolution compared to the zero urban emission scenario. Ensemble analysis demonstrates that emission-induced changes are comparable in amount to internal variability, highlighting the need for multiple realizations and significance testing, and that domain-mean surface precipitation remains within the ensemble spread despite detectable microphysical responses and spatial redistribution.
- Article
(6849 KB) - Full-text XML
-
Supplement
(7213 KB) - BibTeX
- EndNote


Urban areas can play a significant role in modifying precipitation patterns. More than half of the cities worldwide, along with their downwind regions, experience higher levels of precipitation compared to nearby rural areas (Sui et al., 2024). The combined effects of climate change and increasing urbanization are expected to further intensify precipitation events (Yan et al., 2024). As atmospheric temperatures rise, the air's capacity to hold moisture increases (Seneviratne et al., 2021). When coupled with urban expansion, this may result in more extreme short-duration rainfall events in and around large cities (Lehmann et al., 2015). The urban heat island effect and alterations in vertical wind due to urban morphology are especially important in influencing urban rainfall and have received much attention in the literature (Liu and Niyogi, 2019; Yue et al., 2021).
Moreover, urban areas emit aerosols from traffic, heating, and industry that, depending on their size and chemical composition, serve as cloud condensation nuclei (CCN, particularly sulfates; Pruppacher and Klett, 1997) and ice-nucleating particles (INP, e.g., black carbon and organics; Burrows et al., 2022). Once activated, they modify the microphysical structure of clouds, which in turn affects the generation and intensity of precipitation. The overall impact of urban aerosols on rainfall is complex, as they can suppress, delay, or enhance precipitation depending on the cloud development stage and whether warm or ice-phase processes dominate (Rosenfeld et al., 2008).
A higher concentration of aerosols may lead to the activation of more cloud droplets (Twomey, 1974). However, the resulting cloud droplet size spectrum tends to consist of more numerous and smaller cloud droplets, which reduces coalescence and collision efficiency, thereby decreasing raindrop growth. This ultimately suppresses precipitation and enhances cloud lifetime (Albrecht, 1989). This effect is particularly relevant in warm-phase clouds, where both models and observations indicate that urban aerosols have a pronounced suppressing effect on precipitation (Van Den Heever and Cotton, 2007; Rosenfeld, 2000).
In deep convective systems, warm-rain suppression is an integral component of aerosol invigoration mechanisms. Condensational invigoration occurs through enhanced condensation and latent heat release relative to clean-air conditions (Cotton and Walko, 2021). When large particles are abundant, they activate at cloud base and suppress warm-rain formation, prolonging the condensation phase and releasing additional latent heat compared to a scenario with fewer large particles. In contrast, when ultrafine aerosol particles (UFPs), a significant component of urban emissions (Kumar et al., 2014), are abundant, the low concentration of large particles allows rapid warm-rain formation, generating high supersaturation that activates the UFPs and producing substantial additional condensation and latent heat release compared to conditions without UFPs (Fan et al., 2018).
Freezing-induced invigoration is a more complex and uncertain mechanism where warm-rain suppression allows more liquid water to ascend to freezing levels, where latent heat release at high altitudes and ice processes (riming, deposition) can invigorate convection (Rosenfeld et al., 2008; Andreae et al., 2004). The net effect on convection depends on three competing processes. First, condensate loading during transport and depositional growth weakens updrafts (Fan and Khain, 2021); second, latent heat release from freezing at high altitudes potentially strengthens updrafts; third, condensate offloading through hydrometeor sedimentation enhances buoyancy. Especially after the publication of Rosenfeld et al. (2008), many observational and modeling studies were conducted concerning aerosol invigoration in deep convection. While condensational invigoration was in general supported, intensities of freezing-induced invigoration differ considerably among the studies and from Rosenfeld et al. (2008). E.g. Igel and van den Heever (2021) report that for storms with warm cloud base the updrafts are weakened instead of strengthened. In contrast, Marinescu et al. (2021) present results from a multi-model comparison investigating the impact of varying CCN concentrations on updrafts in deep convection. All models simulate stronger mean updrafts at altitudes between 4 and 7 km under high CCN conditions. The type of models evaluated is close to that used in the present study. A critical assessment of the state of aerosol invigoration topic is provided in an opinion paper by Varble et al. (2023) as well as in the review by Fan et al. (2025).
Building on the concept of aerosol invigoration, several studies have examined how urban aerosols influence precipitation patterns. Model-based studies indicate that the enhancement of precipitation tends to occur downwind of the city (Han et al., 2012; Kawecki et al., 2016; Sarangi et al., 2018). Consequently, the aerosol invigoration effect leads to a decrease in early-stage rain and an intensification of heavy rainfall, which was found in model and observational studies (Schmid and Niyogi, 2017; Zheng et al., 2020).
Apart from influencing microphysics, light-absorbing aerosols, such as soot or dust, directly influence radiative effects by backscattering or absorbing sunlight. These radiative effects tend to cool the surface by reducing net short-wave radiation at the surface and heating the lower atmosphere through absorption of radiation. This can result in a stabilization of the lower atmosphere, which weakens the updraft and reduces precipitation rates (Fan et al., 2015; Talukdar et al., 2019).
Multiple single-event-based analyses have proven to be useful, offering a detailed examination of urban aerosol impacts under real-world conditions. Kawecki et al. (2016) studied a mesoscale convective event passing Kansas City, Missouri, using scaled urban emission scenarios. They found that increased aerosol loading redistributed precipitation, with higher accumulation in the downwind direction and reduced accumulation upwind, driven by aerosol-induced modifications to cloud microphysics and cold pool strength. Similarly, Sarangi et al. (2018) demonstrated that the urban area of Kanpur, India, and downwind regions experience increased precipitation rates and that the aerosol loading positively correlates with this increase. Further research by Fan et al. (2020) focused on a convective storm near Houston, Texas, highlighting that the urban aerosol effect is more significant than the effects through the changes in land cover types for coastal cities. While the urban land cover effect accelerates rain initiation and slows down the storm's dissipation, the convective intensity and precipitation are increased by urban aerosols through aerosol–cloud interactions. Van Den Heever and Cotton (2007) investigated the development of a convective storm and precipitation over and downwind of St. Louis, Missouri. Their study demonstrated that urban-enhanced aerosol concentrations significantly affect convective storm dynamics and precipitation development in downwind areas. It also highlights that the influence of urban aerosols is more pronounced in less industrialized regions, where lower background aerosol concentrations amplify their impact on convection and precipitation processes.
Although focusing on a single event limits the generalizability of results to other meteorological contexts or regions, such process-level studies are essential for improving our understanding of aerosol–cloud interactions. Collectively, these studies highlight the significant and complex role that urban environments and aerosols play in shaping local weather patterns and influencing precipitation dynamics.
Moreover, these studies have examined individual events under specific meteorological conditions only using a single simulation (Sarangi et al., 2018; Fan et al., 2020; Van Den Heever and Cotton, 2007) or three simulations (Kawecki et al., 2016) per emission scenario. However, Varble et al. (2023) highlighted the necessity of using ensembles with perturbed initial or boundary conditions rather than relying on a single simulation to better capture the sensitivity and robustness of model results. Another significant challenge is isolating the urban aerosol–cloud effect from other factors, such as the roughness and thermal effects of urban morphology (Rozoff et al., 2003). Quantifying the specific impact of urban aerosols on clouds and precipitation is particularly difficult due to the relatively small signal amidst high natural variability.
To address these challenges, we investigate how urban emissions can modify precipitating convective events while accounting for the natural meteorological variability. We perform highly resolved ensemble simulations of two convective events using the online-coupled model system COSMO-MUSCAT-DCEP (Wolke et al., 2004, 2012), integrating urban parameterization and direct aerosol–cloud coupling. The model employs a two-moment bulk microphysics scheme, which predicts both mass and number concentration of hydrometeors. Specifically, to account for the influence of aerosols on cloud droplet formation, we integrated MUSCAT-simulated aerosol fields into the microphysics scheme.
This study focuses on convective events over eastern Germany. The region is characterized by a mix of urban and industrial emission sources and an overall relatively high background aerosol concentration. We specifically selected convective events that pass through the urban emissions plume of Leipzig, a medium-sized city in the eastern German state of Saxony, providing ideal case studies to investigate the influence of realistic urban aerosol perturbations on cloud development and precipitation formation, allowing for a detailed process-level analysis under realistic meteorological conditions.
We trace the transport pathways of polluted urban air volumes from their emission sources into regions of cloud and precipitation formation by analyzing Lagrangian back trajectories, combined with an ensemble modeling framework to capture the range of possible atmospheric responses. The detection of weak urban aerosol signals above the level of internal meteorological variability in a high-background aerosol environment is not straightforward, and it remains an open question to what extent realistic emission perturbations from a mid-sized European city are sufficient to produce discernible effects. Addressing this requires isolating these small signals from natural variability, which motivates the trajectory-based ensemble approach applied here.
By analyzing these events, we aim to deepen our understanding of the complex interactions between urban emissions, cloud microphysics, and precipitation development. This knowledge is crucial for addressing urban-induced alterations of heavy precipitation events.
2.1 Model
We use version 5.05 of the non-hydrostatic regional numerical weather prediction model COSMO (COnsortium for Small scale MOdelling) (Schättler et al., 2018), online-coupled to the chemistry transport model MUSCAT (MUltiScale Chemistry Aerosol Transport) (Wolke et al., 2004, 2012). MUSCAT, driven online by the meteorological model COSMO, simulates the transport and chemical transformation of gas-phase species and aerosol populations using a system of three-dimensional, time-dependent advection–diffusion–reaction equations. Aerosol dynamics are represented by a hybrid bulk–bin scheme, which is the standard configuration for air quality simulations (Wolke et al., 2012). This scheme includes 25 prognostic particle tracers: primary PM2.5 and PM10, primary organic carbon (POC), elemental carbon (EC), sulfate, nitrate, ammonium, secondary organic aerosol (SOA), six sea-salt and marine organic bins (0.01–10 µm), and five desert dust bins (0.2–48 µm). Aerosol species are treated as externally mixed. Natural aerosol sources (desert dust, sea spray) are represented by online parameterizations, complemented by a biogenic emission scheme. Secondary organic aerosol formation and multiphase chemistry are explicitly treated, while anthropogenic emissions of primary particles and aerosol precursors are prescribed from contemporary inventories. Transport processes include advection, turbulent diffusion, sedimentation, and dry and wet deposition. Meteorological drivers, including wind fields, vertical diffusivities, and boundary-layer resistances, are directly provided by COSMO. In turn, the online coupling allows for feedback of modeled aerosol on radiation and clouds in COSMO. To better represent the microclimate of urban areas, the double-canyon urban canopy parameterization (DCEP) (Schubert et al., 2012) is included. This urban parameterization is based on the Building Effect Parameterization (BEP) by Martilli et al. (2002) and incorporates the radiative interactions between two neighboring urban canyons. The DCEP framework represents urban canopy structures through three categories of elements: ground, walls, and roofs. These elements are arranged within idealized double-street-canyon segments. Prior to the simulation, a preprocessing step derives the horizontal distribution of these segments in each model grid cell and determines probabilistic as well as geometric characteristics of the canopy elements, based on a high-resolution building geometry dataset available for Saxony. Within the model, DCEP calculates surface fluxes of momentum, heat, and turbulent kinetic energy (TKE), and additionally resolves the radiative transfer and thermal balance equations for the canopy components. Thereby, a realistic representation of the dynamics of heat transfer, radiation exchange, and airflow within urban street canyons is ensured.
2.1.1 Cloud Microphysics
Here we use the two-moment bulk microphysics scheme developed by Seifert and Beheng (2006a, b). It distinguishes between the six hydrometeor classes: cloud droplets, rain, ice crystals, snow, hail, and graupel, and employs prognostic equations to estimate the mass densities and number concentrations of these hydrometeor particles. Therefore, it can provide more accurate predictions of cloud formation and precipitation than the simpler single-moment scheme employed in the standard COSMO setup (Doms et al., 2018). In the standard setup of the two-moment scheme, the number of activated cloud droplets and ice particles is calculated using prescribed CCN and INP values, respectively, and saturation adjustment is applied. We enhance the model configuration for this study by replacing these prescribed concentrations with calculated activation of cloud droplets and ice particles directly from aerosol mass concentrations simulated by MUSCAT. This dynamic approach allows the model to account for spatial and temporal variability in aerosol properties, which is expected to enable a more realistic representation of CCN and INP with the goal of improving the simulation of aerosol–cloud interactions.
We build upon the work of Weger et al. (2018), who included the effects of dust, soot, and organic carbon on ice particle formation and cloud droplet activation. Cloud droplet activation was computed using the parameterization for multiple aerosol types developed by Abdul-Razzak and Ghan (2000), which accounts for multiple soluble and insoluble aerosol species, representing a multimodal aerosol size distribution. It uses the hygroscopicity parameter κ, which describes the relationship between particle hygroscopicity, dry diameter, and CCN activation (Petters and Kreidenweis, 2007). Experimentally determined values of κ range from greater than 1 for highly hygroscopic particles down to 0 for hydrophobic particles.
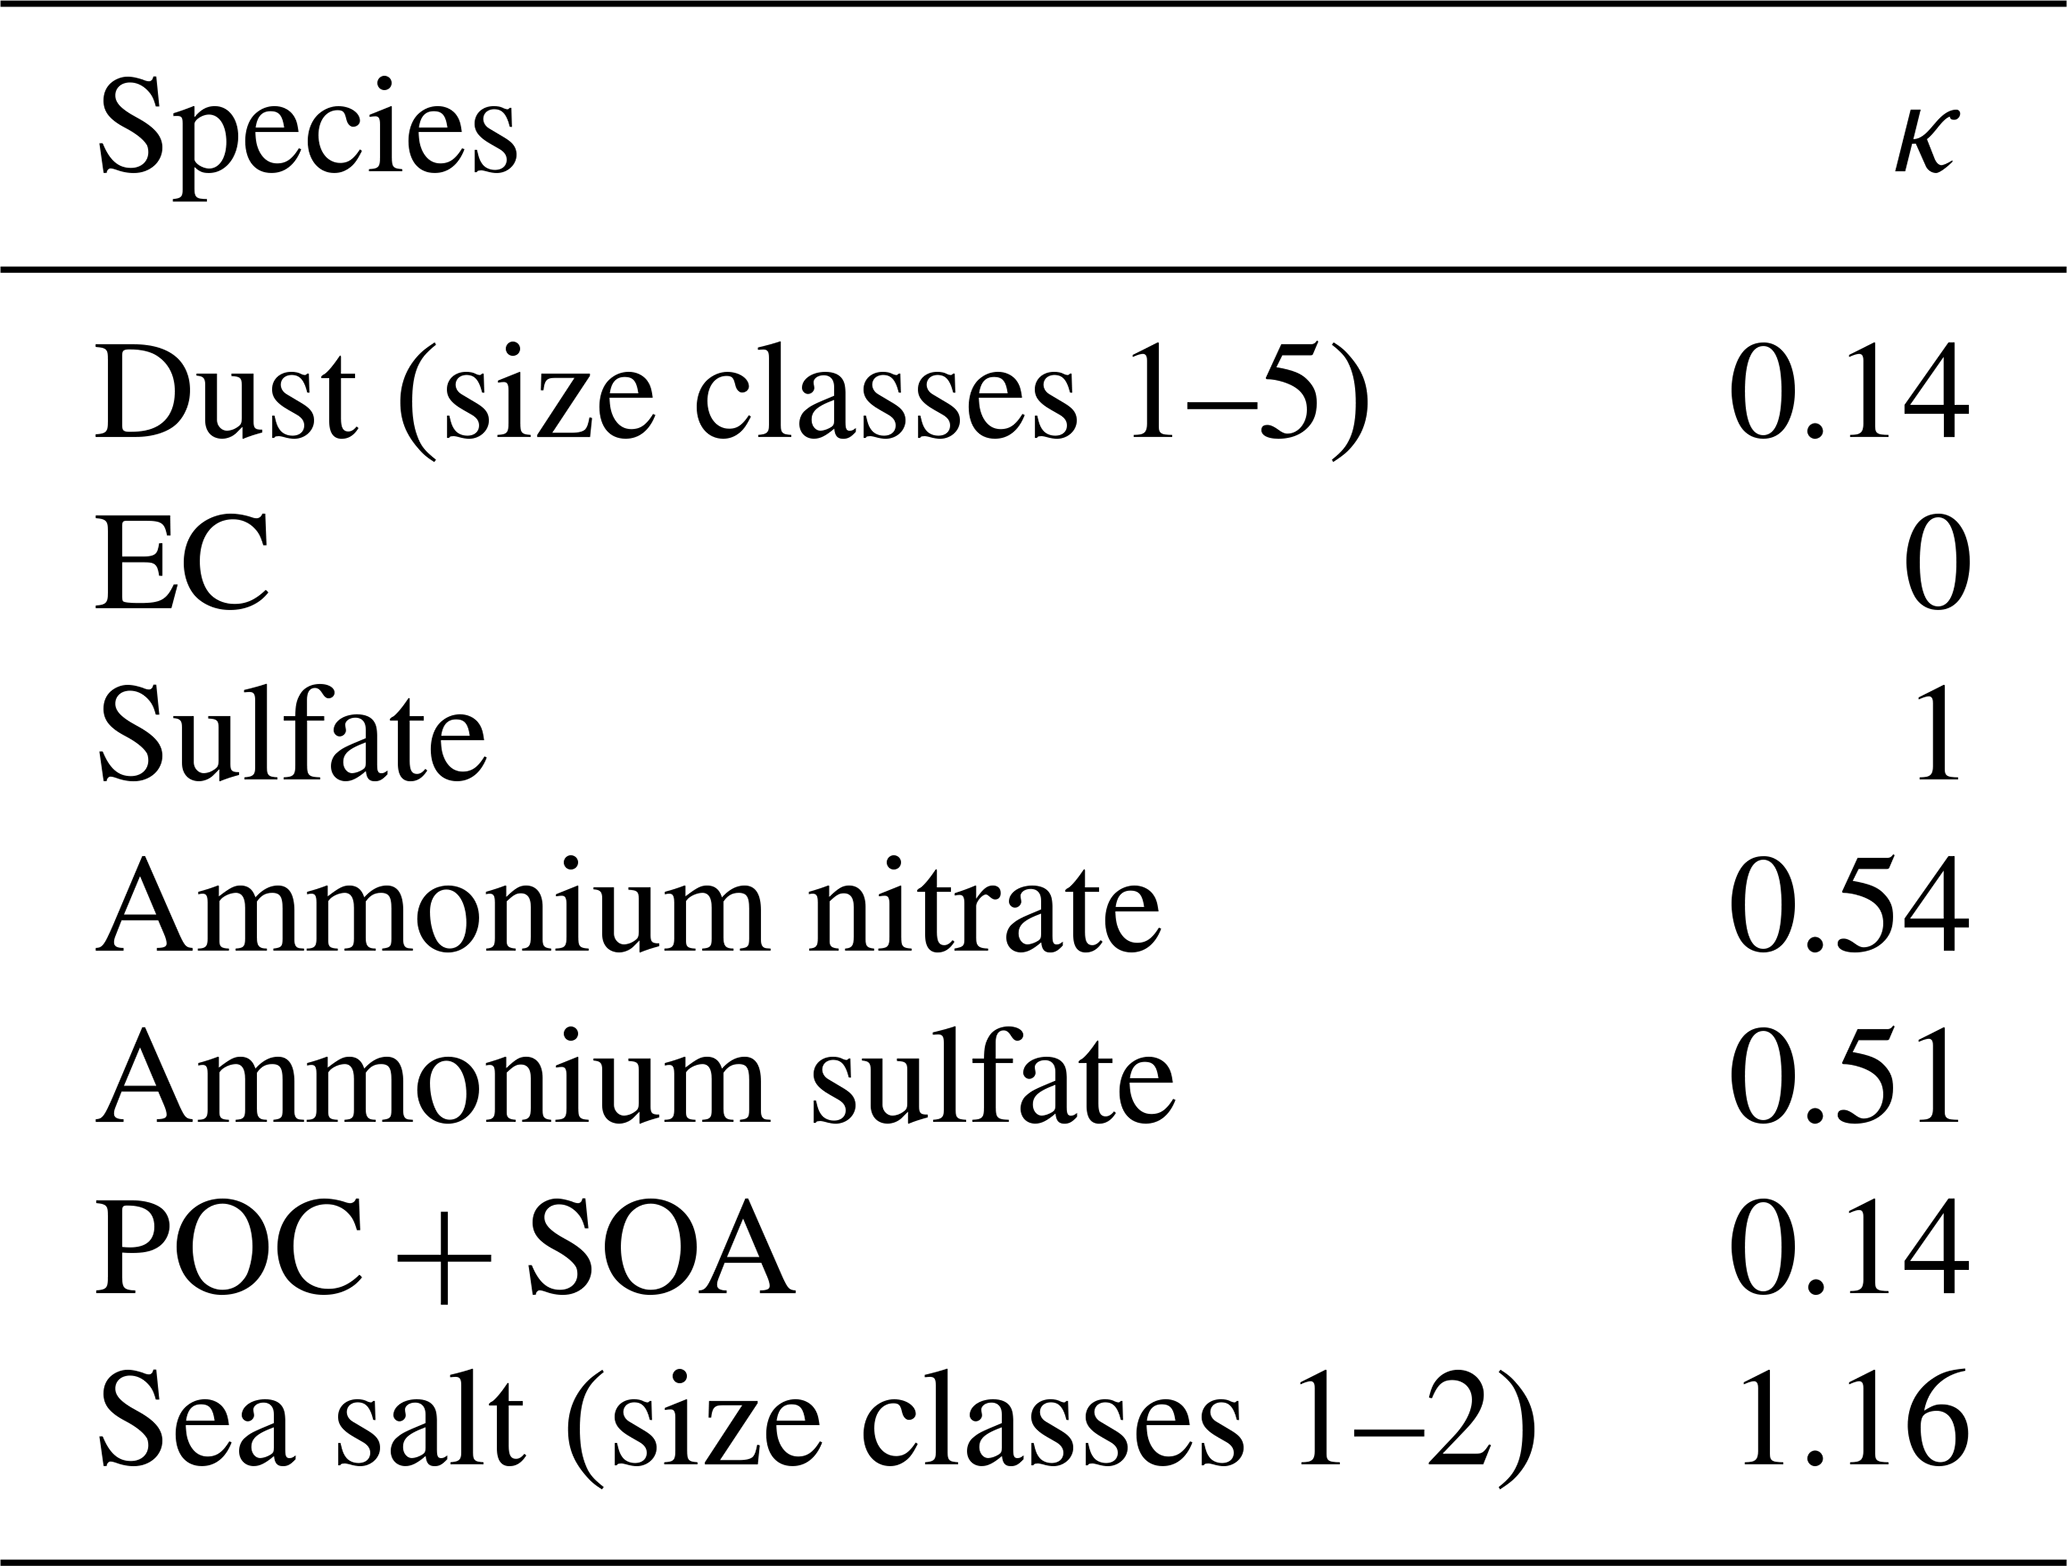
In this study, the treatment of ice particle activation from Weger et al. (2018) is retained, while the cloud droplet activation scheme is extended to include additional aerosol species, such as ammonium sulfate, ammonium nitrate, sulfate, organic carbon, elemental carbon, and two sea salt size classes. The corresponding κ values used in this study are listed in Table 1. Those species were chosen, as they are the most important natural and anthropogenic sources of cloud condensation nuclei (Pruppacher and Klett, 1997). For each species, the aerosol number size distribution is calculated from the simulated mass concentrations, using fixed values for radius and standard deviation, as in Genz et al. (2020). These size distributions are then used to calculate the number of activated particles using the Abdul-Razzak and Ghan (2000) parametrization, which links particle size distribution and composition to the number of particles activated at a given supersaturation. The maximum supersaturation is determined by the competition among aerosols for water vapor and depends on their composition, size distribution, and the updraft velocity. To enable in-cloud activations, already activated cloud droplets are treated as an additional aerosol mode with κ≈0 and a diameter equal to the mean droplet size. This allows the activation scheme to distinguish between activated droplets and activatable aerosol at each model time step, enabling secondary nucleation in updrafts throughout the cloud depth.
Table 1Hygroscopicity parameters κ used in this study, based on Genz et al. (2020).The values are based on findings from multiple laboratory experiments and modeling studies.
2.1.2 Simulation Setup
Two cases with different meteorological characteristics, including flow patterns and boundary layer conditions, were chosen. The cases were systematically selected through evaluation of public reports and the RADKLIM CatRaRe event catalog (Lengfeld et al., 2021) and whether the cases were captured by COSMO-D2 reanalysis. Case I features a small-scale convective event approaching the region of interest with northerly winds in the evening of 13 July 2019, while case II shows a larger event with westerly flow into the region in the evening of 20 July 2019. Despite these differences, both produced considerable precipitation across the region.
To simulate both cases, we employ a 3-step one-way nesting strategy with domains: D0, D1, D2. The outer domain, D0, covers Europe with a grid resolution of 14 km (Fig. 1). There are 40 vertical layers with the highest layer at 22 km altitude. In this domain, COSMO-MUSCAT is run with the single-moment bulk water continuity scheme and without DCEP. The timestep is 80 s and the simulation starts 15 d prior to the actual event. This spin-up time is necessary to allow the model chemistry to develop. To keep the model meteorology close to the real synoptic situation, the meteorological fields are re-initialized for the next simulation cycle every 48 h. The COSMO simulations are initialized and driven by ERA5 meteorological reanalysis data (Hersbach et al., 2020). The first MUSCAT cycle is initialized with an atmospheric chemical composition reanalysis product of CAMS (Copernicus Atmosphere Monitoring Service) (Inness et al., 2019), while subsequent cycles use aerosol and trace gas fields from the previous cycle to maintain temporal consistency in chemical composition. Natural primary aerosols, such as dust and sea salt, are computed within the MUSCAT model (e.g. Heinold et al., 2011) using meteorological fields from COSMO, combined with surface property data. Emission of anthropogenic aerosols and trace gases are taken from the CAMS-REG inventory (Granier et al., 2019), while the temporal profiles of the main air pollutants and greenhouse gases are based on the CAMS-REG-TEMPO dataset (Guevara et al., 2021).
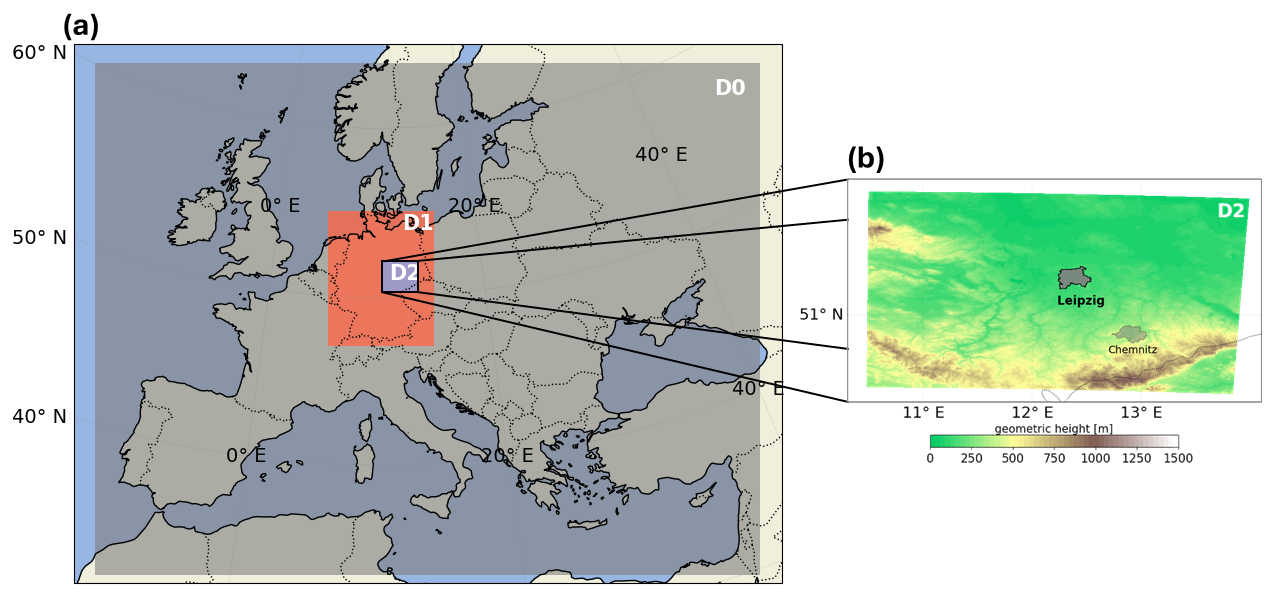
Figure 1(a) Model domains used in the simulation: D0 (14 km grid resolution), D1 (2.3 km), and D2 (1 km). (b) Inner model domain D2 showing geometric height of the earths surface above sea level. The cities Leipzig and Chemnitz are shown as filled areas in grey and light grey to indicate their urban extent.
The next inner domain D1 covers Germany and is configured with a horizontal grid resolution of 2.3 km (Fig. 1). The vertical resolution includes 50 levels with the highest level at 22 km. As meteorological input, the COSMO-D2 reanalysis provided by the German Weather Service (DWD) is used. This high-resolution input is essential for resolving the small convective cells that are the focus of this study. The simulation starts on 12 July 2019 at 00:00 UTC for case I and at 19 July 2019 00:00 UTC for case II, each simulation runs continuously for 48 h without a restart and has a timestep of 20 s. The first 24 h serve as a meteorological spin-up, while the subsequent 24 h comprise the coupled chemistry-meteorology simulation. In this domain, the model is run with the two-moment bulk microphysics scheme. The chemical fields simulated from the coarser European domain are interpolated onto the D1 grid as initial and lateral boundary conditions. Point source, detailed area, and traffic emissions that are used build on the GRETA dataset of the German Federal Environmental Agency (Umweltbundesamt, UBA) (Schneider et al., 2016).
The innermost domain D2 focuses on the greater metropolitan area of Leipzig, with a horizontal grid resolution of 1 km. The chemistry and meteorology for D2 are driven by the outputs from the D1 simulations, maintaining the same simulation time and vertical layers for both cases. The model in D2 operates with the two-moment bulk microphysics scheme, along with the urban parametrization scheme DCEP activated for the city of Leipzig. The simulation uses a timestep of 10 s, with output saved at 10 min intervals. The domain is characterized by predominantly flat topography, bounded by the Erzgebirge along its southern edge. The highest peak of this mountain range rises to an altitude of about 1.2 km. The city of Leipzig lies at the center of the domain.
2.2 Sensitivity experiments
We conducted two different experiments for the Leipzig region. The first experiment (BASE) represents the reference simulation without any alterations. In the second experiment (NONURBAN), emissions within Leipzig are suppressed, whereas all other domain emissions stay included. These realistic emission changes are particularly relevant for future cleaner cities, where urban aerosol perturbations may be of similar magnitude. Comparing the two experiments allows us to isolate the effects of urban emissions on the cloud properties and specifically on precipitation. The chemical boundary and background concentrations were the same for both experiments. Surface parameters and DCEP parametrization stayed unchanged for Leipzig. For each experiment, we created an ensemble with five members, respectively, by varying the length of the meteorological spin-up run, while the 24 h coupled COSMO-MUSCAT simulations remained unchanged. The spin-up lengths for domain D2 are 24, 21, 18, 15 and 12 h. All ensemble members are initialized from the same D1 simulation, with each member extracting boundary conditions at its respective start time, ensuring that the large-scale forcing remains consistent across the entire ensemble. This approach allows to assess the impact of slightly varying initial meteorological conditions on the results. By comparing multiple ensemble members, variability is captured more effectively, and consistent, non-stochastic patterns can be identified more clearly by statistical analysis. This increases the robustness of the findings in this study and helps to separate systematic signals from noise, providing greater confidence in the conclusions drawn from our simulations.
2.3 Observational data
To evaluate the general model performance, we compared our simulations with observed precipitation data from the RADKLIM dataset (Winterrath et al., 2018), a radar-based precipitation climatology provided by the German Weather Service (DWD). RADKLIM provides high-resolution data on a 1 km spatial grid with a 5 min temporal resolution covering the entirety of Germany. The dataset is derived from 17 C-band Doppler radar systems and is offline-adjusted using daily gauge measurements from over 4400 rain gauges that record both hourly and daily precipitation. A more detailed comparison of simulated and observed precipitation is presented in Sect. 3.1.
2.4 Analysis Method
2.4.1 Trajectory Analysis using LAGRANTO
To capture the movement of air volumes influenced by urban emissions, we used the Lagrangian analysis tool LAGRANTO (Sprenger and Wernli, 2015). We calculated backward trajectories starting from a region centered on the area of highest precipitation downwind of Leipzig for each ensemble member, using meteorological fields from the D2 output. For case I, starting at 13 July 2019, 23:00 UTC, trajectories were traced backward for six hours. The starting region of trajectories horizontally covers approximately 40×40 km2 with about 5 km spacing between points. Vertically, the range extends from 1–4.5 km above ground level and is divided into 20 vertical levels. For case II, starting at 20 July 2019, 22:00 UTC, the start points were similarly traced back for six hours. The horizontal box spans roughly 40×60 km2 with 5 km spacing, and vertically, it extends from 1–7.5 km subdivided into 50 levels. These spatial and vertical configurations ensure that the trajectories originate from sufficiently large and well-resolved volumes, capturing the key atmospheric dynamics of each precipitation event. To make sure that we only follow the Leipzig emissions, a filter region was defined as a three-dimensional box in longitude, latitude, and height. By retaining only trajectories that passed through the urban boundary layer over Leipzig, this approach facilitates the attribution of aerosol–cloud interactions (see Fig. S1 in the Supplement).
2.4.2 Moving Box Analysis
For analyzing cloud dynamics and microphysics along the trajectories, a moving box analysis was implemented. At each time step, a rectangular box is centered on the mean urban trajectory point of each ensemble member, and vertical profiles are extracted by horizontally averaging all grid point values within the box, including grid points with zero values (unconditional average). Each box is defined in the COSMO rotated geographical coordinate system as a rectangular area with the mean trajectory point at its center, extending symmetrically in both horizontal directions (east–west and north–south) and including the full vertical column of model layers. The grid point values extracted within each box define the analysis volume at that time step. Although the trajectories are calculated backward in time, the moving box analysis follows the trajectory points in forward temporal order, tracing the evolution of the analysis volume from the urban emission region toward the precipitation area. As the trajectory point advances in time, the box moves accordingly through the model domain. This approach differs from conventional methods that either analyze a single convective system or average over the entire model domain: rather than tracking an individual convective system, the moving box isolates the microphysical state of convection within the aerosol-influenced region at each time step. The box may therefore contain portions of one or more convective cells at any given time, and the resulting profiles reflect the aggregate microphysical state of convection along the plume trajectory. We selected different box sizes depending on the spatial scale of the respective precipitation event. For case I, a box size of approximately 15×15 km2 was chosen to fully enclose the smaller, localized precipitation structure. For case II, a larger 35×35 km2 box was used to capture the broader precipitation area associated with the more extensive event. This selection ensured that the dominant precipitation features were included in the spatial averaging for each case. The associated backward trajectories are shown in Fig. 2a (case I) and Fig. 2b (case II). At each mean trajectory point and time step, we averaged the number of activated cloud droplets, all hydrometeor species, and vertical wind components horizontally for all grid points within each box. This produced one vertical profile per ensemble member every 10 min. These profiles were then aggregated across all ensemble members to derive the ensemble mean, minimum, and maximum values.
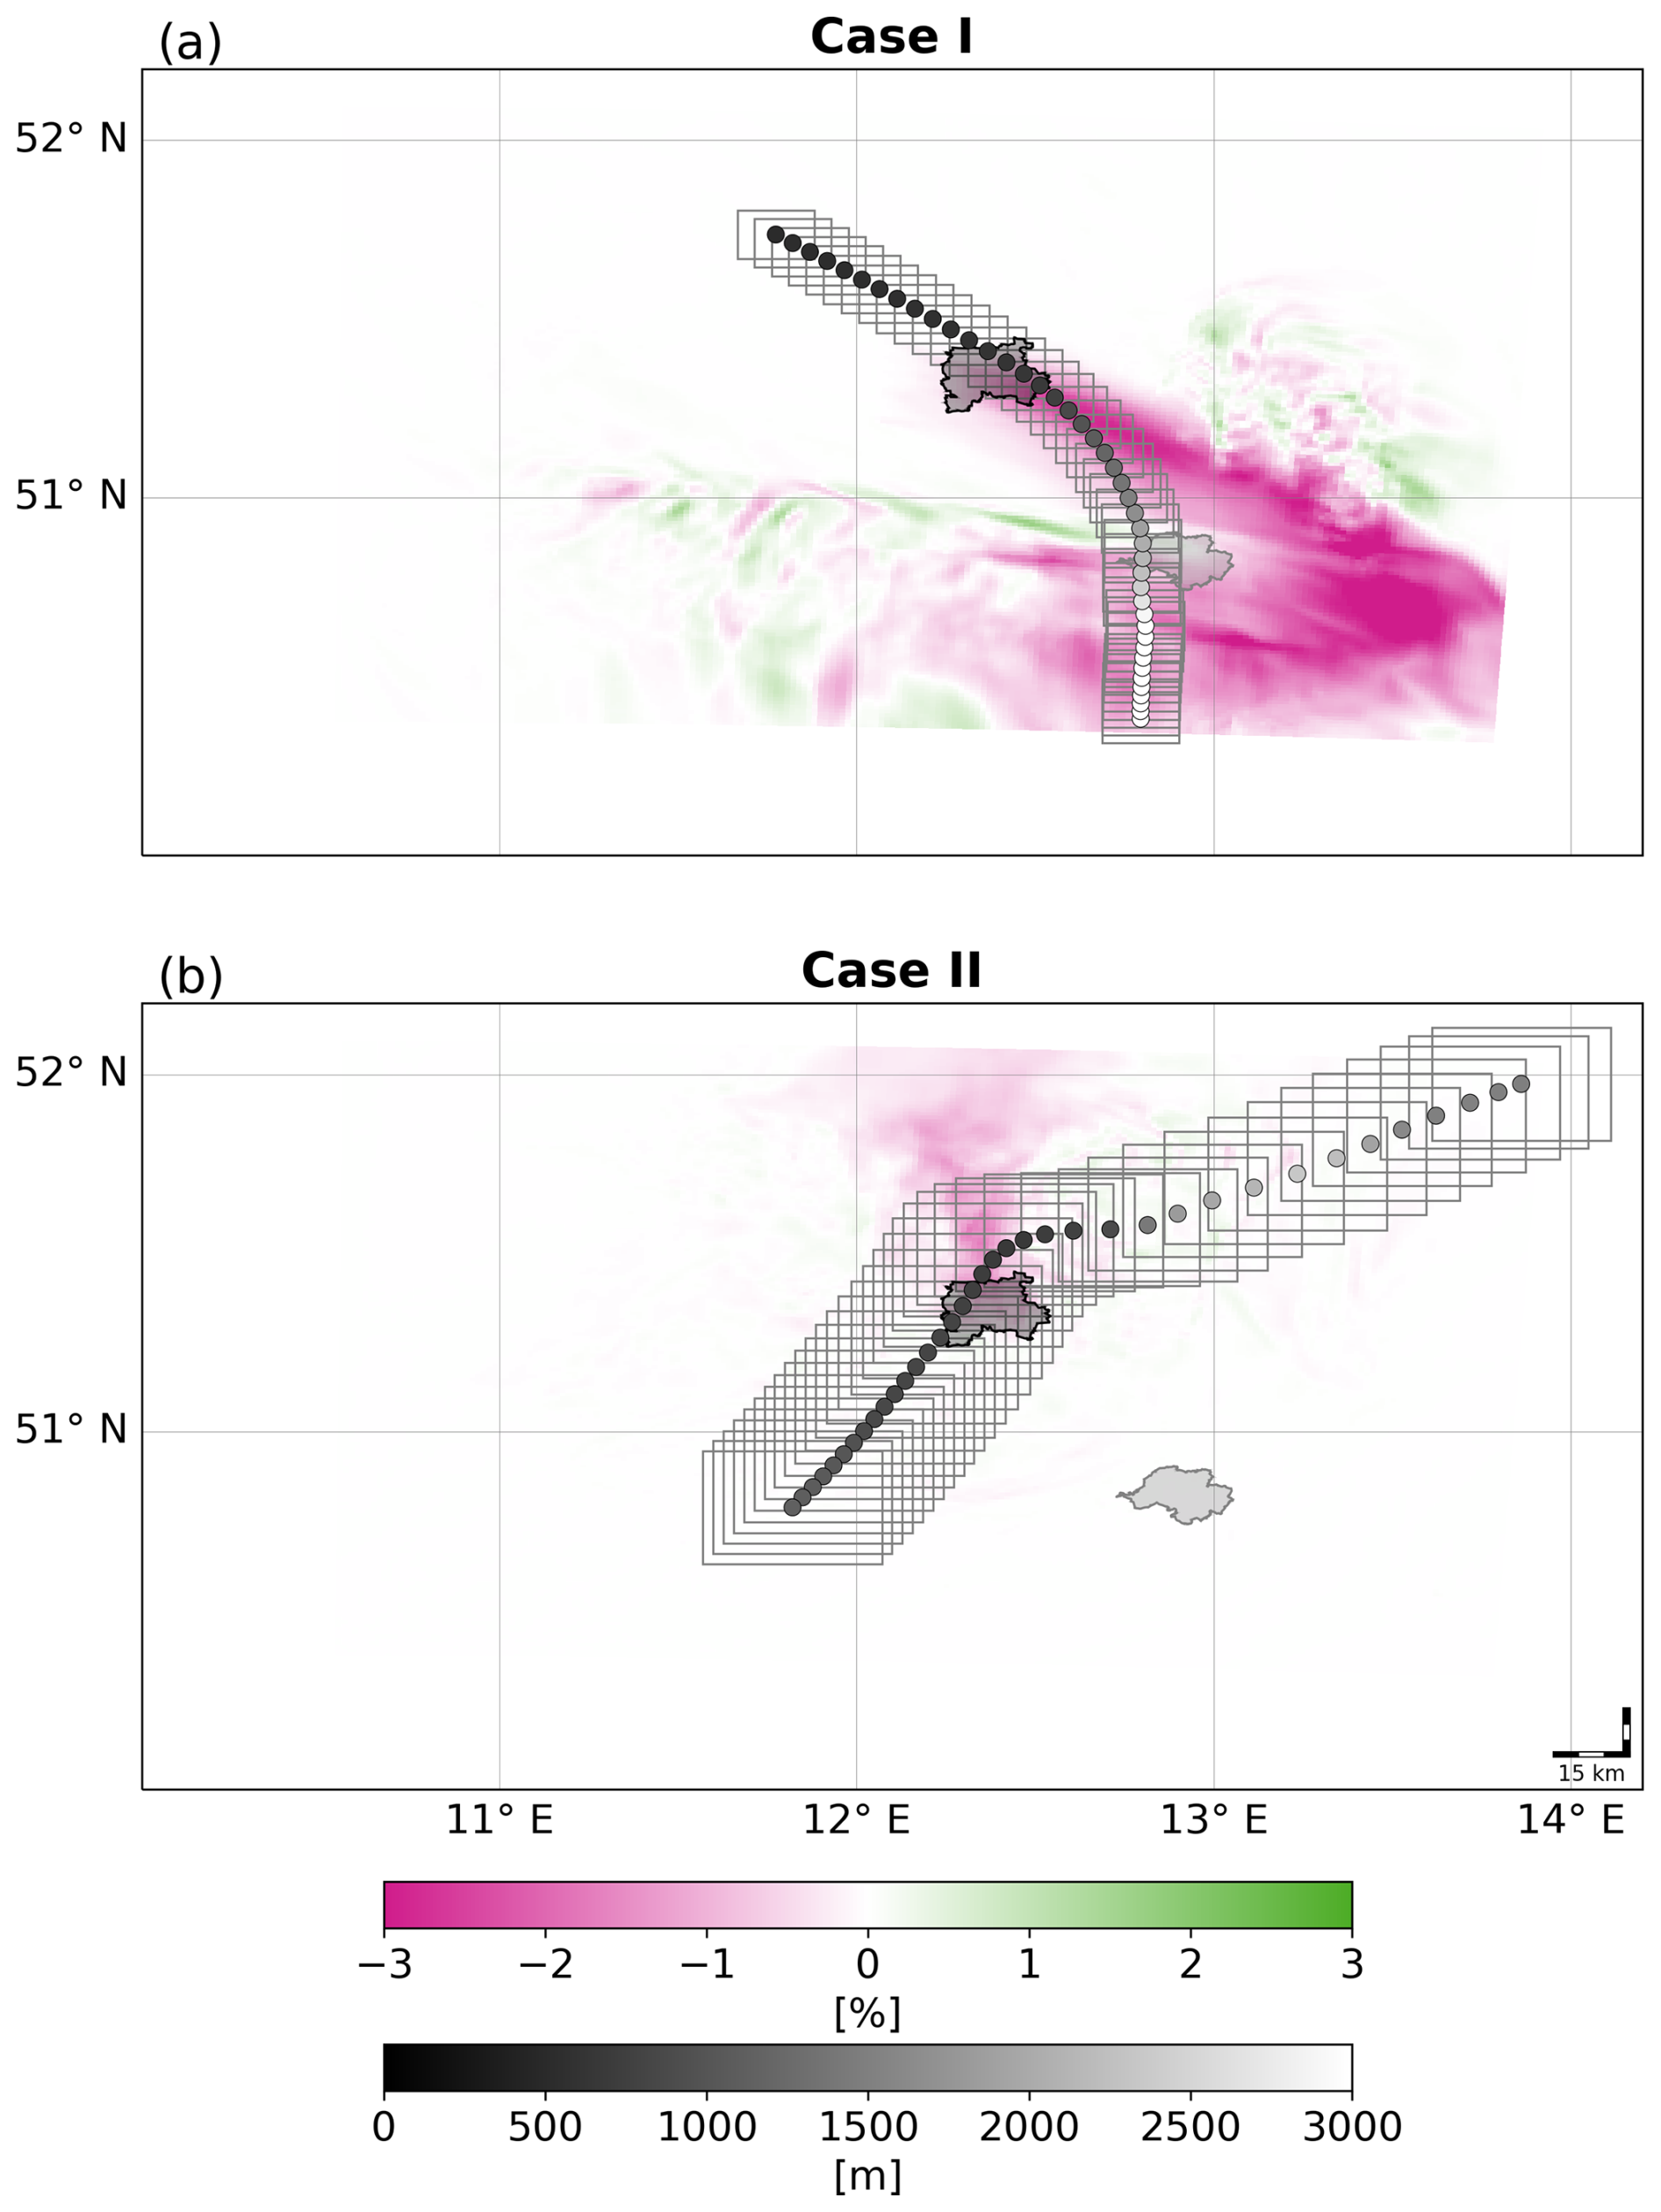
Figure 2Mean trajectories for case I (a) and case II (b). Pink–green shading shows the percentage difference in aerosol mass concentration (NONURBAN-BASE) averaged across all aerosol species considered in the two-moment microphysics scheme (5 dust classes, ammonium sulfate, ammonium nitrate, sulfate, organic carbon, elemental carbon, 2 sea salt classes), vertically averaged below 1000 m and temporally averaged over the periods when trajectories pass through the urban aerosol plume (case I: 17:50–19:00; case II: 18:20–20:00 UTC). Grey shading indicates the average trajectory height and trajectories run in the direction towards higher altitudes. The filled areas mark the urban regions of Leipzig (dark grey) and Chemnitz (light grey). Grey boxes denote the rectangular averaging areas used to extract vertical profiles around each trajectory point.
The same analysis was repeated for the overall mean trajectory (Appendix A). While the analysis box along the filtered mean trajectories captures the effects of urban aerosols on cloud dynamics and microphysics, the analysis box along the overall mean trajectory (Appendix A) represents convective cloud properties from grid cells irrespective of their interaction with urban aerosols. This comparison provides evidence that only air volumes interacting with urban aerosols exhibit systematic changes.
2.4.3 Bootstrap Significance Test
We are aware that five ensemble members are likely insufficient to capture the full range of variability, Sharma et al. (2026) found that an ensemble of ten members is required to sufficiently represent internal variability in aerosol-convection interaction studies. Increasing the ensemble size beyond five members was, however, not computationally feasible within this project. To partially compensate for the limited ensemble size, the grid cells within the analysis box are considered to represent the variability in cloud processes. So, the bootstrapping significance test is applied as follows. Rather than comparing only the five ensemble-mean values per experiment, all grid point values within the moving analysis box (Sect. 2.4.2) at a given height level and time step were pooled across all five ensemble members. This pooling approach increases the effective sample size without requiring additional simulations and better represents the internal spatial variability within the analysis box. For each combination of height level and time step, 1000 bootstrap resamples were drawn with replacement from each pooled distribution, and the difference of the resample means was computed. A difference was considered statistically significant at the 90 % confidence level if the resulting bootstrap confidence interval did not include zero. The same approach was applied to the precipitation fields, where grid point values within a 0.1°×0.1° neighborhood centered on each pixel were pooled across all ensemble members prior to bootstrapping.
We investigate two convective rainfall events that occurred on the evenings of 13 and 20 July 2019, near Leipzig, Germany (51.34° N, 12.37° E). To assess the influence of urban emissions on convective precipitation, both events are analyzed in detail. The first case is characterized by a more localized convective development, whereas the second case involves a broader, more organized system. This contrast allows for a robust examination of urban influences under varying meteorological conditions. A comparison with the RADKLIM precipitation observations and a detailed description of precipitation, microphysics, and dynamics in both case studies follows.
3.1 Comparison with RADKLIM Observations
Due to model simplifications, uncertainties in input and observational data, and limitations in parameterizing sub-grid-scale processes, a precise agreement between simulation and observation is not expected. The focus lies on capturing general features of the events, such as the occurrence of precipitation, the approximate size of substructures, and the range of maximum rainfall rates observed and simulated. The simulated precipitation fields show good agreement with observational data from RADKLIM (Fig. 3). Both convective events are qualitatively reproduced in terms of spatial extent and intensity range. While the model exhibits some deviations in the exact timing and location of peak precipitation, it captures the overall evolution, structure, and propagation direction of the events. The spatial organization and the magnitude of accumulated precipitation are within a comparable range to observations, indicating that the model setup is capable of realistically representing the key features of both convective events. Notably, case II (Fig. 3c) is represented better than case I (Fig. 3a) both in terms of spatial organization and intensity. As commonly observed in convection-permitting models, the simulation of larger-scale, organized systems is more reliable than that of localized, small-scale events, which are more strongly influenced by initial condition uncertainties and model resolution constraints (Prein et al., 2015).
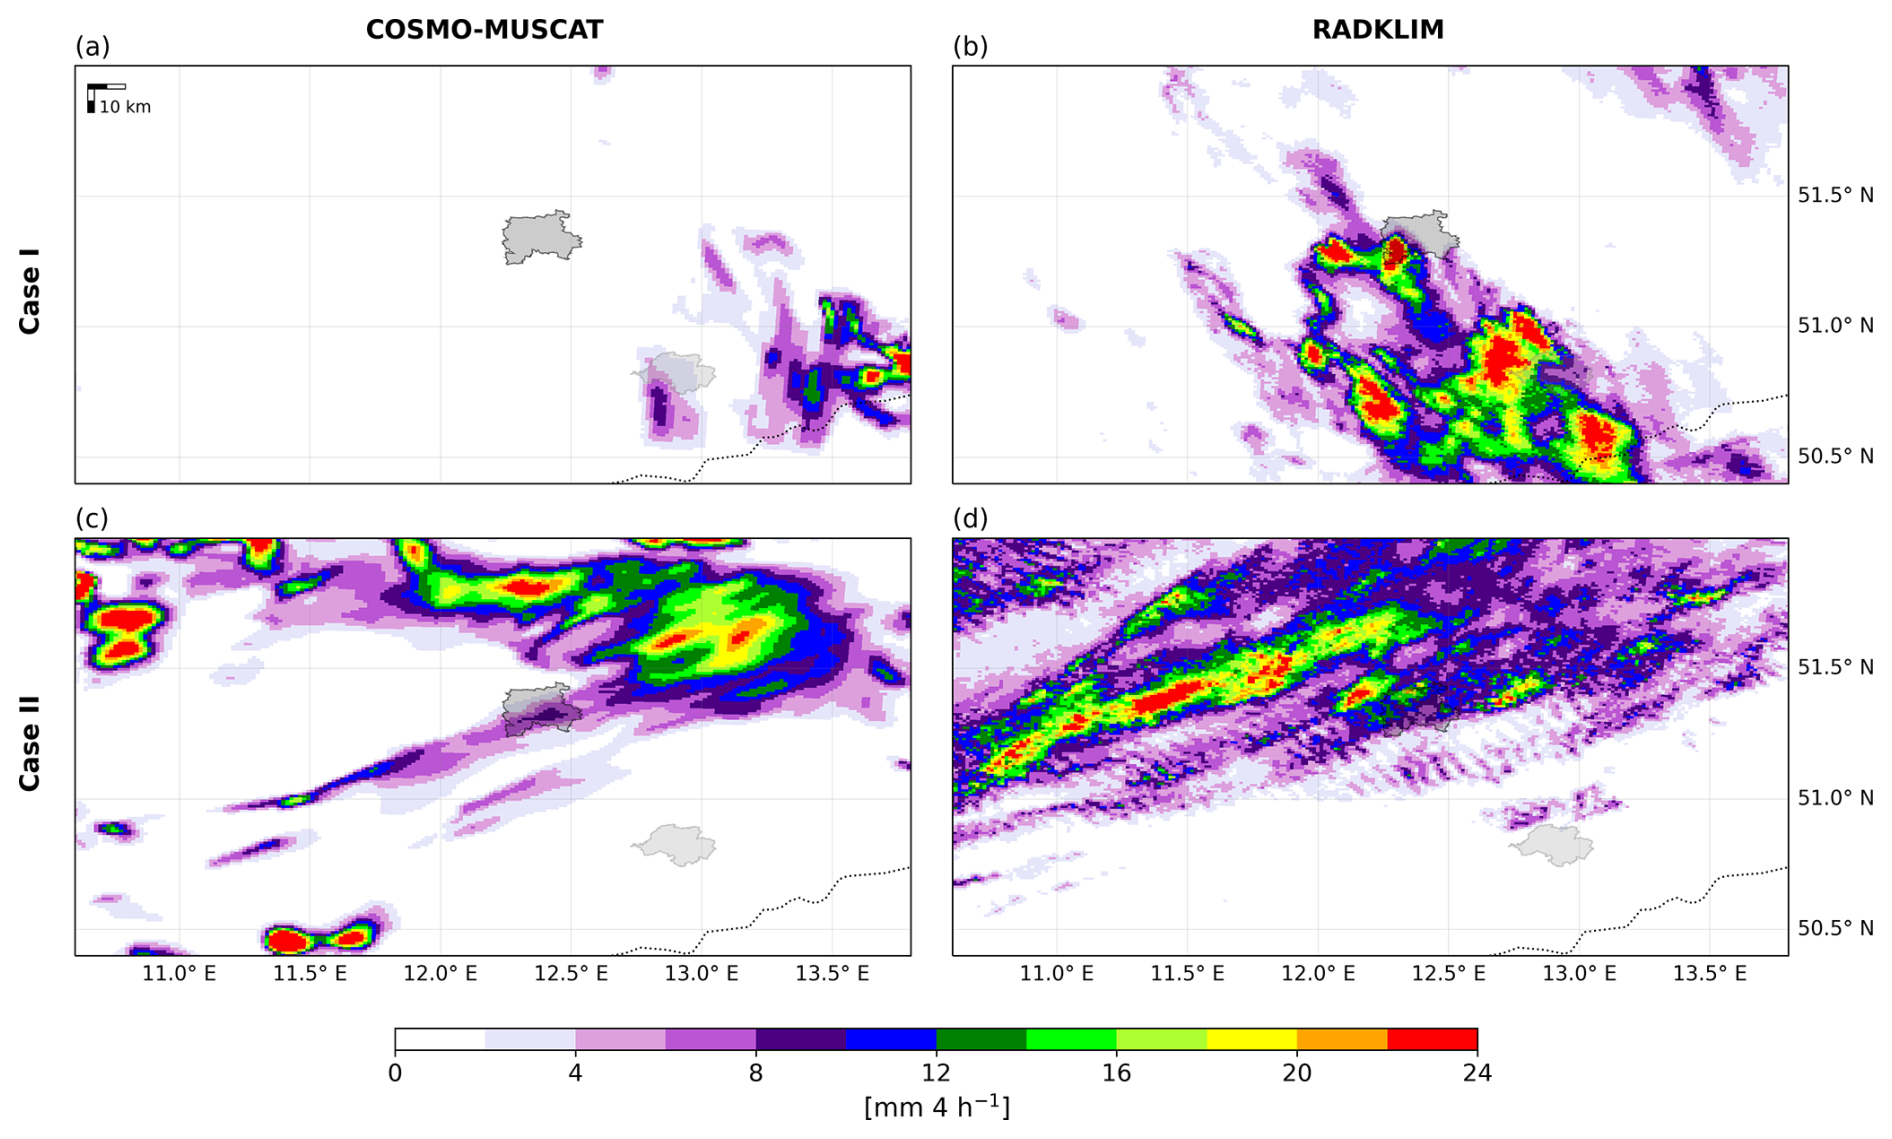
Figure 3Accumulated precipitation over a 4 h period for both cases. Simulated precipitation ensemble mean from COSMO-MUSCAT (a, c) and radar-derived precipitation from RADKLIM (b, d) for case I (top row) and case II (bottom row). City boundaries of Leipzig are marked with a grey and of Chemnitz with light grey outlines.
3.2 Basic meteorological setting and precipitation amounts
3.2.1 Case I
In the first case, atmospheric conditions were dominated by a high-pressure system shifting from the Norwegian Sea toward the British Isles and a broad low-pressure system over Eastern Europe (Fig. S2a–c). This synoptic setup established a northerly flow across Germany, advecting cold, moist air masses (Fig. S3a) into the region of interest. Several small-scale convective events developed over northern and eastern Germany (Fig. S4a). Northerly winds transported large amounts of sulfate into the model domain, reflecting long-range transport from coal combustion and industrial sources in Eastern Europe, and leading to elevated background concentrations between 2 and 6 km (Fig. S5a). The analysis box captures a single convective cell that dominates the precipitation field throughout the analyzed period. The following analysis therefore reflects the evolution of this single cell. The convective cell formed east of Leipzig and propagated southwestward, passing over the city of Chemnitz. Low-level winds transported urban emissions from Leipzig toward the southeast, mixing into the convective cell at higher altitudes. The total accumulated precipitation associated with this convective event exceeded 9 mm over the course of a 4 h period (Fig. 3a). The convective cell began to intensify north of Chemnitz around 20:00 UTC and propagated southward at approximately 10–20 km h−1 (Fig. 4). Maximum precipitation occurred between 21:00 and 21:30 UTC, when the precipitation core (approximately 5 km in diameter) reached intensities of 6–7 mm in 30 min, representing a typical heavy rainfall rate for convective summer events. The core was surrounded by moderate precipitation of 2–4 mm (30 min)−1. The convective cell then continued to propagate southward, gradually dissipating.
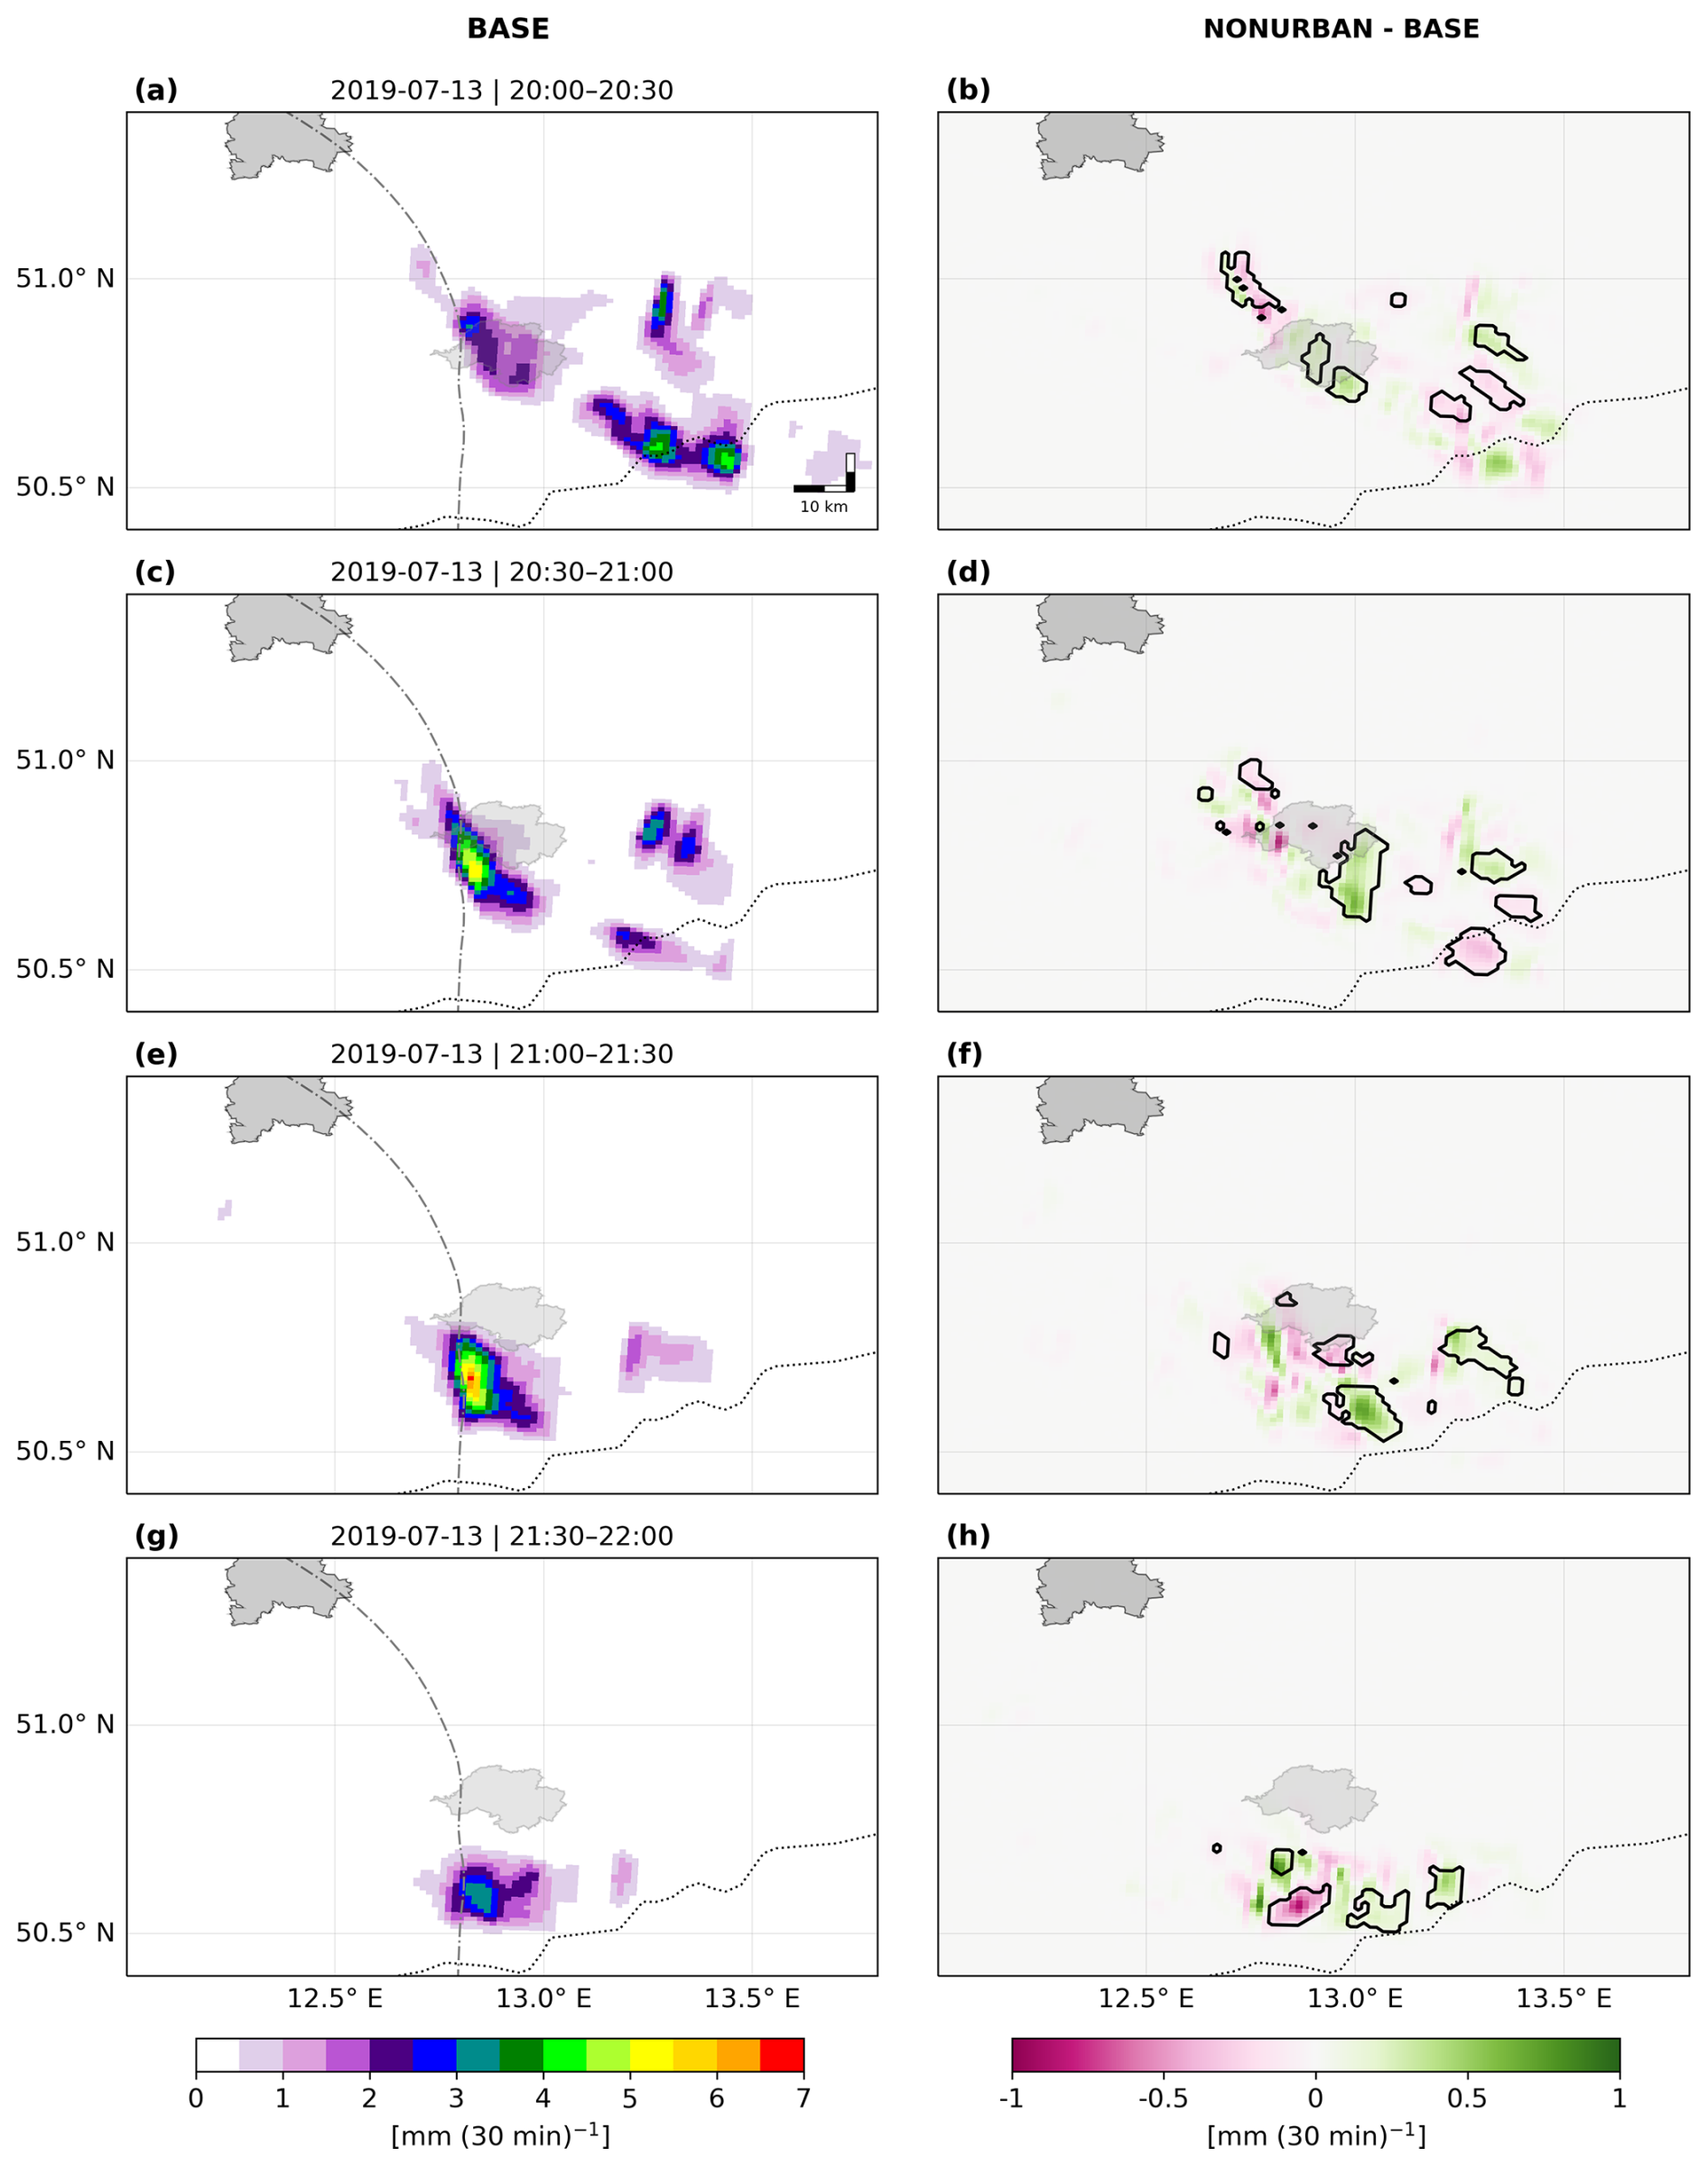
Figure 4Ensemble mean of accumulated precipitation for case I every 30 min (left column) and ensemble mean differences (NONURBAN minus BASE) for four time steps (right column). Black contours indicate areas where differences are statistically significant at the 90 % confidence level. The dash-dotted line shows the mean trajectory. Pink shading indicates increased precipitation due to urban aerosols. City boundaries of Leipzig are marked with a grey and of Chemnitz with light grey outlines.
The analysis reveals a complex and spatially variable pattern of precipitation differences between the BASE and the NONURBAN simulations (Fig. 4). Some regions within the pattern showed statistically significant differences. Throughout, the precipitation differences remained consistently small at . Between 20:00 and 20:30 UTC (Fig. 4b), a precipitation enhancement appeared on the western flank, coinciding with the intersection of the convective cell and the urban plume. This represents the first influence of urban emissions on the precipitation pattern. Simultaneously, the eastern flank exhibited reduced precipitation, indicating a localized atmospheric response to the urban aerosol plume. In the following (Fig. 4d), the differences at both the western and eastern flanks persisted but shifted further south as the cell propagated, demonstrating a continued evolution of the urban emission influence. Around 21:00 UTC (Fig. 4f), the difference shows a more mixed spatial pattern, suggesting complex interactions between the urban emissions and the convective event's internal dynamics. After 21:30 UTC (Fig. 4h), the difference pattern shows a shift to more negative values, indicating that the urban emissions increased rainfall intensity at this later period of the convective event. Additionally, the pattern, initially more positive and later more negative, suggests a southward shift of the precipitation core.
The influence of urban emissions on local precipitation rates ranges between 10 % and 20 %, with both increases and decreases depending on location, although not all differences are statistically significant. Significant changes mainly occur at the edges of the cell, where emissions can reach higher cloud layers, making their impact more pronounced in these regions. The precipitation core maintains its structure and intensity in both experiments, with variations only after 21:00 UTC. This spatial distribution highlights the complex and heterogeneous response of convective events to urban emissions.
3.2.2 Case II
In the second case, a shortwave trough moved northeastward over Benelux on the forward flank of a broad Atlantic upper-level low (Fig. S2d–f). Meanwhile, a cold front reached western Germany during the day. Flow from the southwest advected warm, moist subtropical air into the lower troposphere (Fig. S3b), while colder air aloft associated with the approaching trough increased lapse rates and conditional instability (Fig. S4b). Combined with enhanced vertical wind shear, these conditions favored the development of organized convective events, including a squall line that propagated northeastward across northern and central Germany. The wind field promoted background concentrations dominated by secondary organic aerosols and ammonium sulfate (Fig. S5b). The analysis box captures a portion of the squall line system, which may contain multiple convective cells at different levels of intensity. The following analysis reflects the aggregate microphysical and dynamical response within the analysis box rather than the evolution of a single cell.
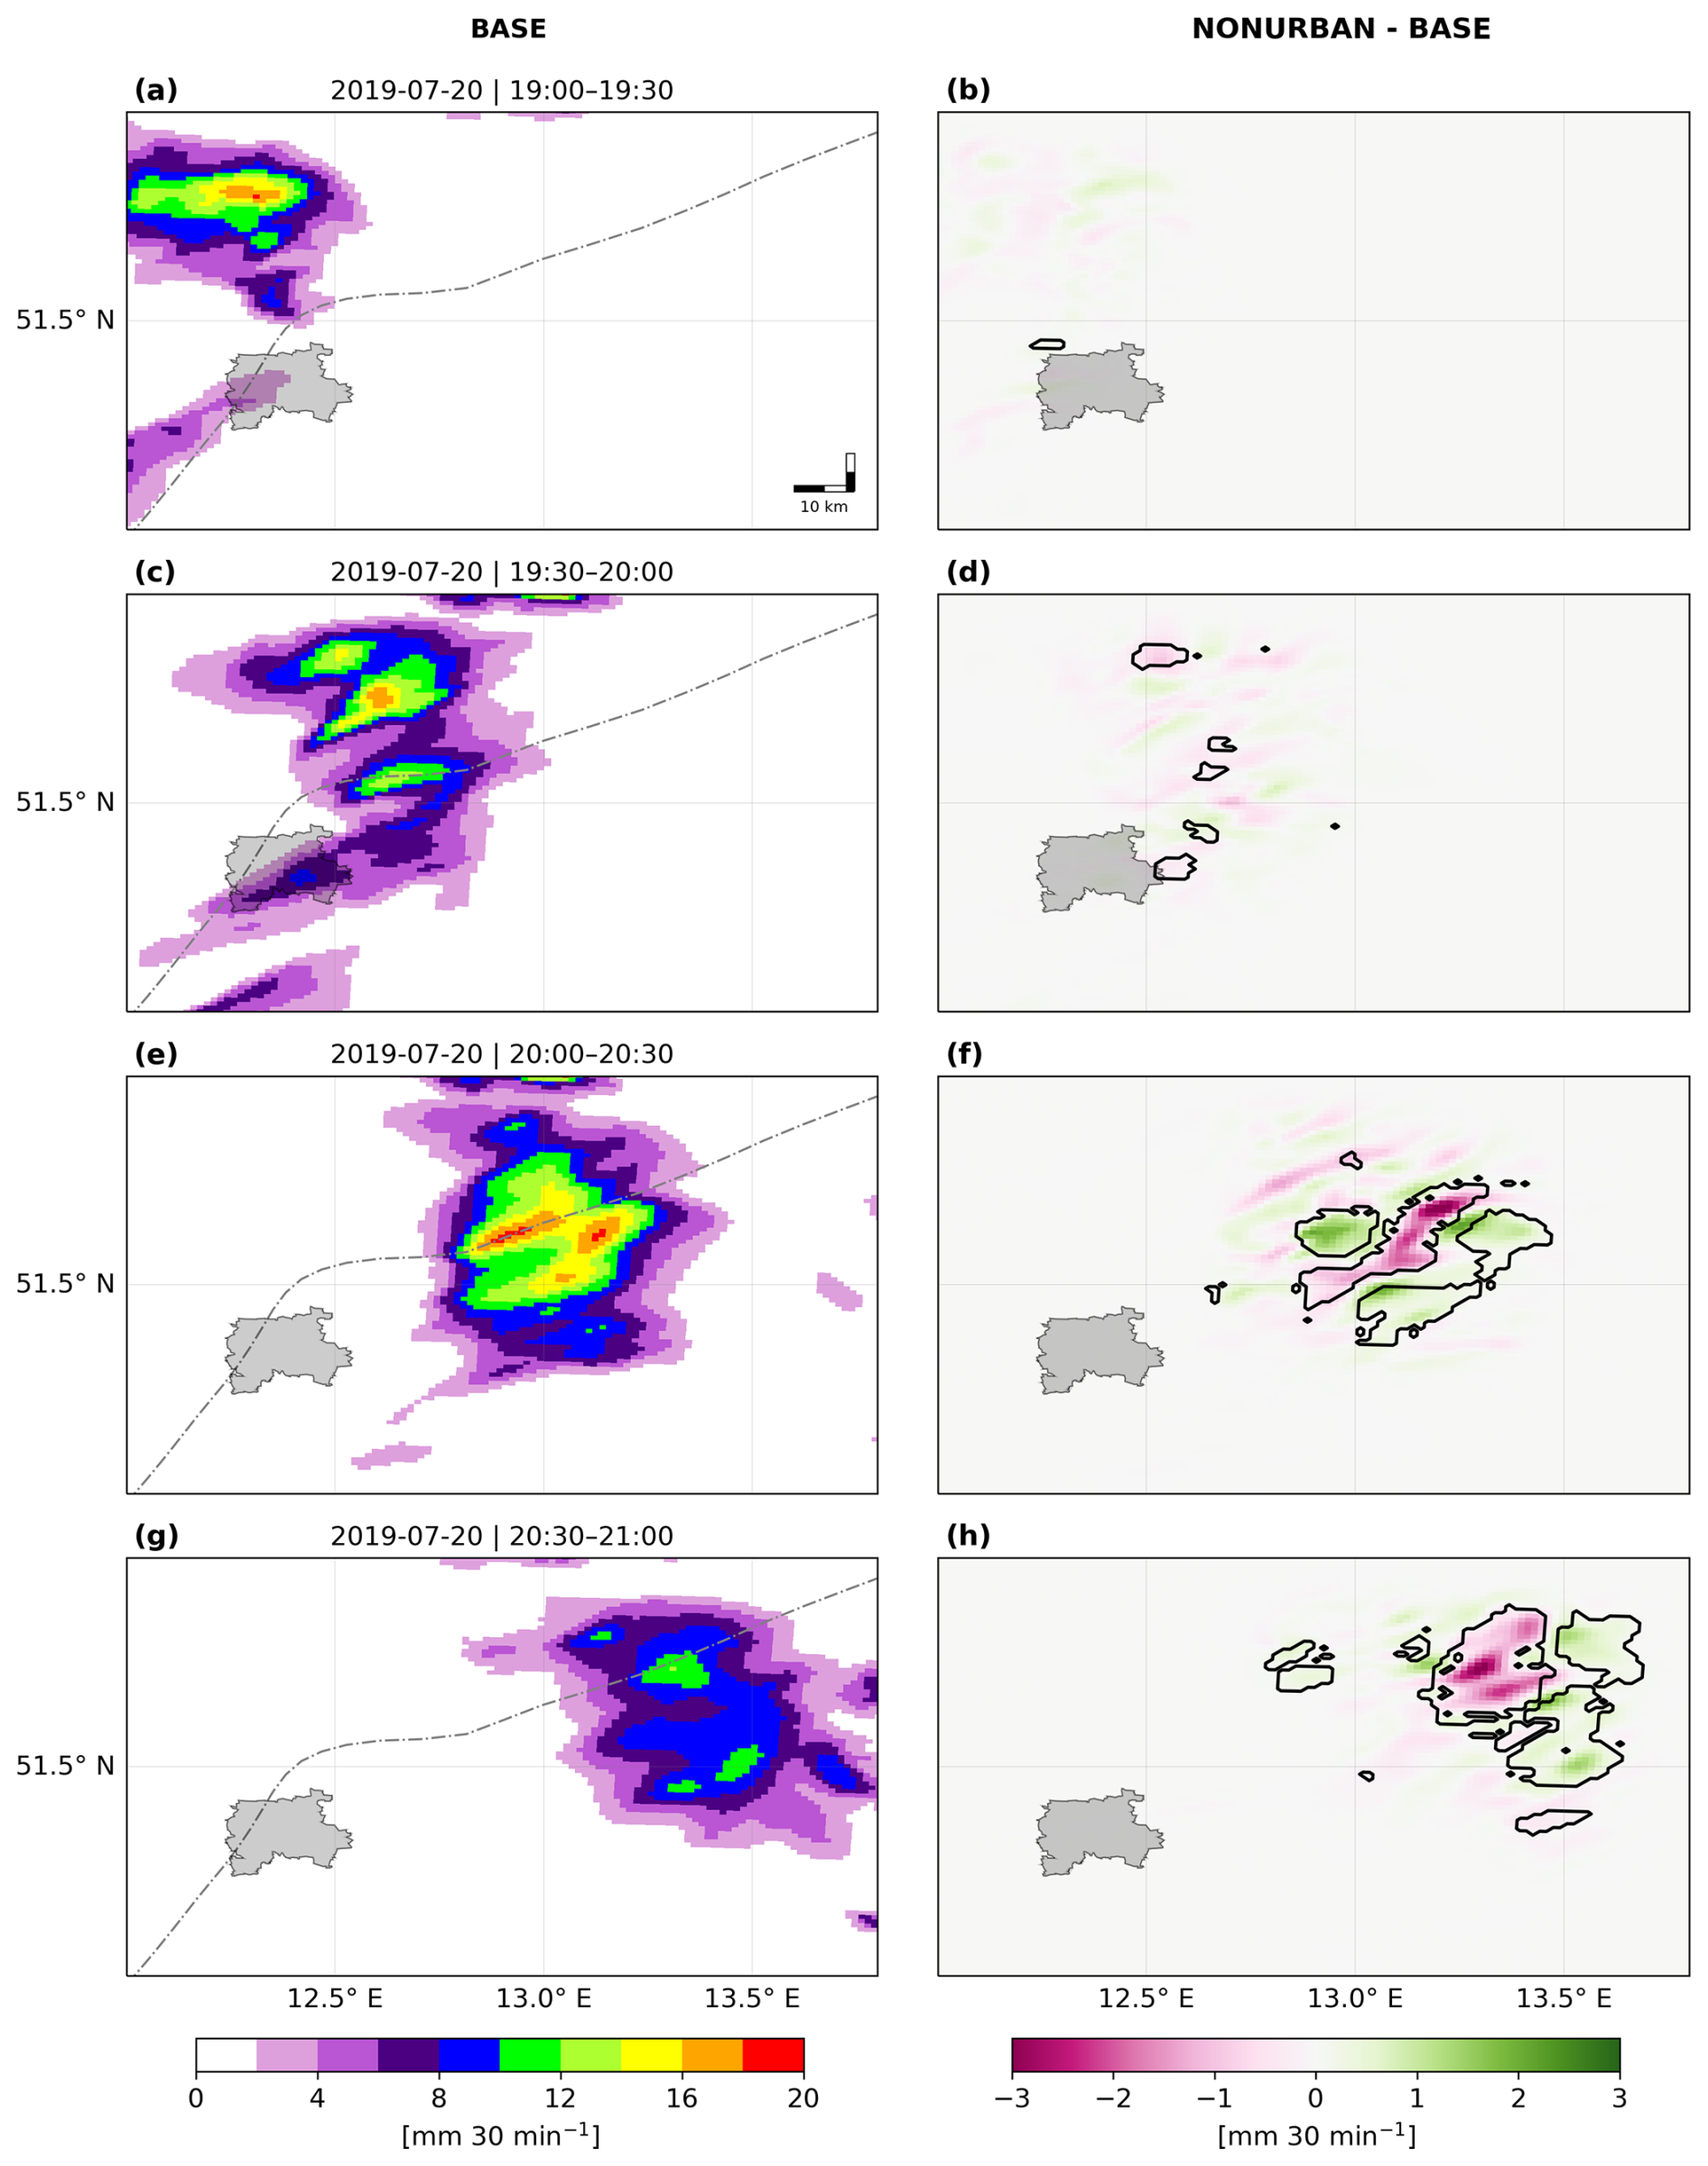
Figure 5Ensemble mean of accumulated precipitation for case II every 30 min (left column) and ensemble mean differences (NONURBAN minus BASE) for four time steps (right column). Black contours indicate areas where differences are statistically significant at the 90 % confidence level. The dash-dotted line shows the mean trajectory. Pink shading indicates increased precipitation due to urban aerosols. City boundaries of Leipzig are marked with a grey outline.
The analyzed convective event exceeded 24 mm accumulated precipitation within a 4 h period, with a total horizontal extent of approximately 100–150 km and moved diagonally through the upper model domain (Fig. 3c). Peak intensity was reached between 20:00 and 20:30 UTC. The core of the event exhibited a multicellular structure with at least two pronounced local maxima (Fig. 5e). Rainfall rates within the core reached 15–20 mm (30 min)−1, classifying the event as heavy precipitation by German Weather Service (DWD) standards. Toward the edges of the event, rainfall intensities decreased to 2.5–10 mm (30 min)−1. Following its peak, the convective event continued to move northeastward and gradually dissipated.
Comparing the BASE and NONURBAN experiment reveals a temporal evolution of the urban influence of the event. Between 19:00 and 20:00 UTC, differences were relatively small below and randomly distributed (Fig. 5b and d). However, after 20:00 UTC when the event reached its maximum intensity, a negative precipitation difference between experiments is seen in Fig. 5f, indicating a precipitation increase in the presence of urban emissions. These differences concentrate mainly around the central precipitation core, while other areas of the event are only marginally affected. The differences range from 2–3 mm (30 min)−1. Additionally, some heterogeneously distributed areas of positive differences ranging from 1–2 mm (30 min)−1 appear at the edges of the convective event. As the convective event propagates, the pattern persists within the same range (Fig. 5h).
These results demonstrate that urban emissions can increase local precipitation intensity by 10 %–20 %. Mainly the precipitation core after 20:00 UTC is affected, showing a clear increase of precipitation by Leipzig's emissions. This demonstrates that urban modifications to cloud microphysics and precipitation processes require time to establish. Given the convective event's rapid propagation speed (), its residence time over the Leipzig area remains limited (∼1 h). Nevertheless, this exposure proves sufficient for the convective event to obtain measurable urban modifications. These modifications continue to influence precipitation patterns as the convective event moves downstream, with increased precipitation effects observable 50–100 km downwind of the urban source region.
3.3 Time series of hydrometeors and vertical structure
To determine how urban emissions may have influenced precipitation formation, we analyze air volumes along trajectories that pass over Leipzig and extend into the precipitation region (Fig. 2). Along these trajectories, we examine the evolution of microphysical processes to assess how the urban aerosol loading within these volumes was transformed and how these changes contributed to either enhanced or suppressed precipitation. Please note, the activated cloud droplet number concentrations presented in the following are lower than typically observed values due to averaging over three-dimensional boxes that contain both cloudy and predominantly cloud-free regions.
3.3.1 Case I
In this case, the mean trajectory originates approximately 30 km northwest of Leipzig and passes through the city diagonally between 17:50 and 18:40 UTC (Fig. 2a). It continues southeast for approximately 15–20 km following the low-level wind field. At this point, it encounters convective activity and is lifted from surface level to cloud height (2–4.5 km altitude), after which it moves straight south for another 80 km within the convective cell. As the trajectory crosses the urban emission plume, which is characterized by up to 3 % increased aerosol concentrations relative to the NONURBAN experiment (Fig. 2a), the air volume picks up an urban signature. This influence is limited to the section of the trajectory prior to convective uplift.
Cloud droplets first appear along the trajectory at 18:30 UTC (Fig. 6a). The number of activated cloud droplets (QNC) increases steadily to a first maximum of 45 cm−3 at 20:00 UTC, then continues rising to 55 cm−3 after 21:00 UTC when strongest updrafts enhance supersaturation conditions. Subsequently, QNC declines to 5 cm−3 as precipitation processes dominate particle removal. The NONURBAN experiment shows a slightly higher QNC peak, but differences remain within ensemble spread. The total amount of cloud condensate (QSUM) reaches a maximum of 0.2 g kg−1 (Fig. 6b). Detailed analysis reveals that QSUM (see Fig. S6) is dominated by graupel, cloud and rain droplets. Indicating that the dynamics in the cloud lead to riming and rapid droplet growth. No substantial differences exist between experiments for total condensate or individual hydrometeor categories. Precipitation begins after 19:00 UTC and increases until reaching a maximum precipitation rate of 0.6 mm (10 min)−1 between 21:00 and 21:30 UTC (Fig. 6c). Both experiments achieve precipitation maxima at the same time, the BASE experiment shows slightly higher rain rates after 21:30 UTC, though the differences remain within ensemble variability.
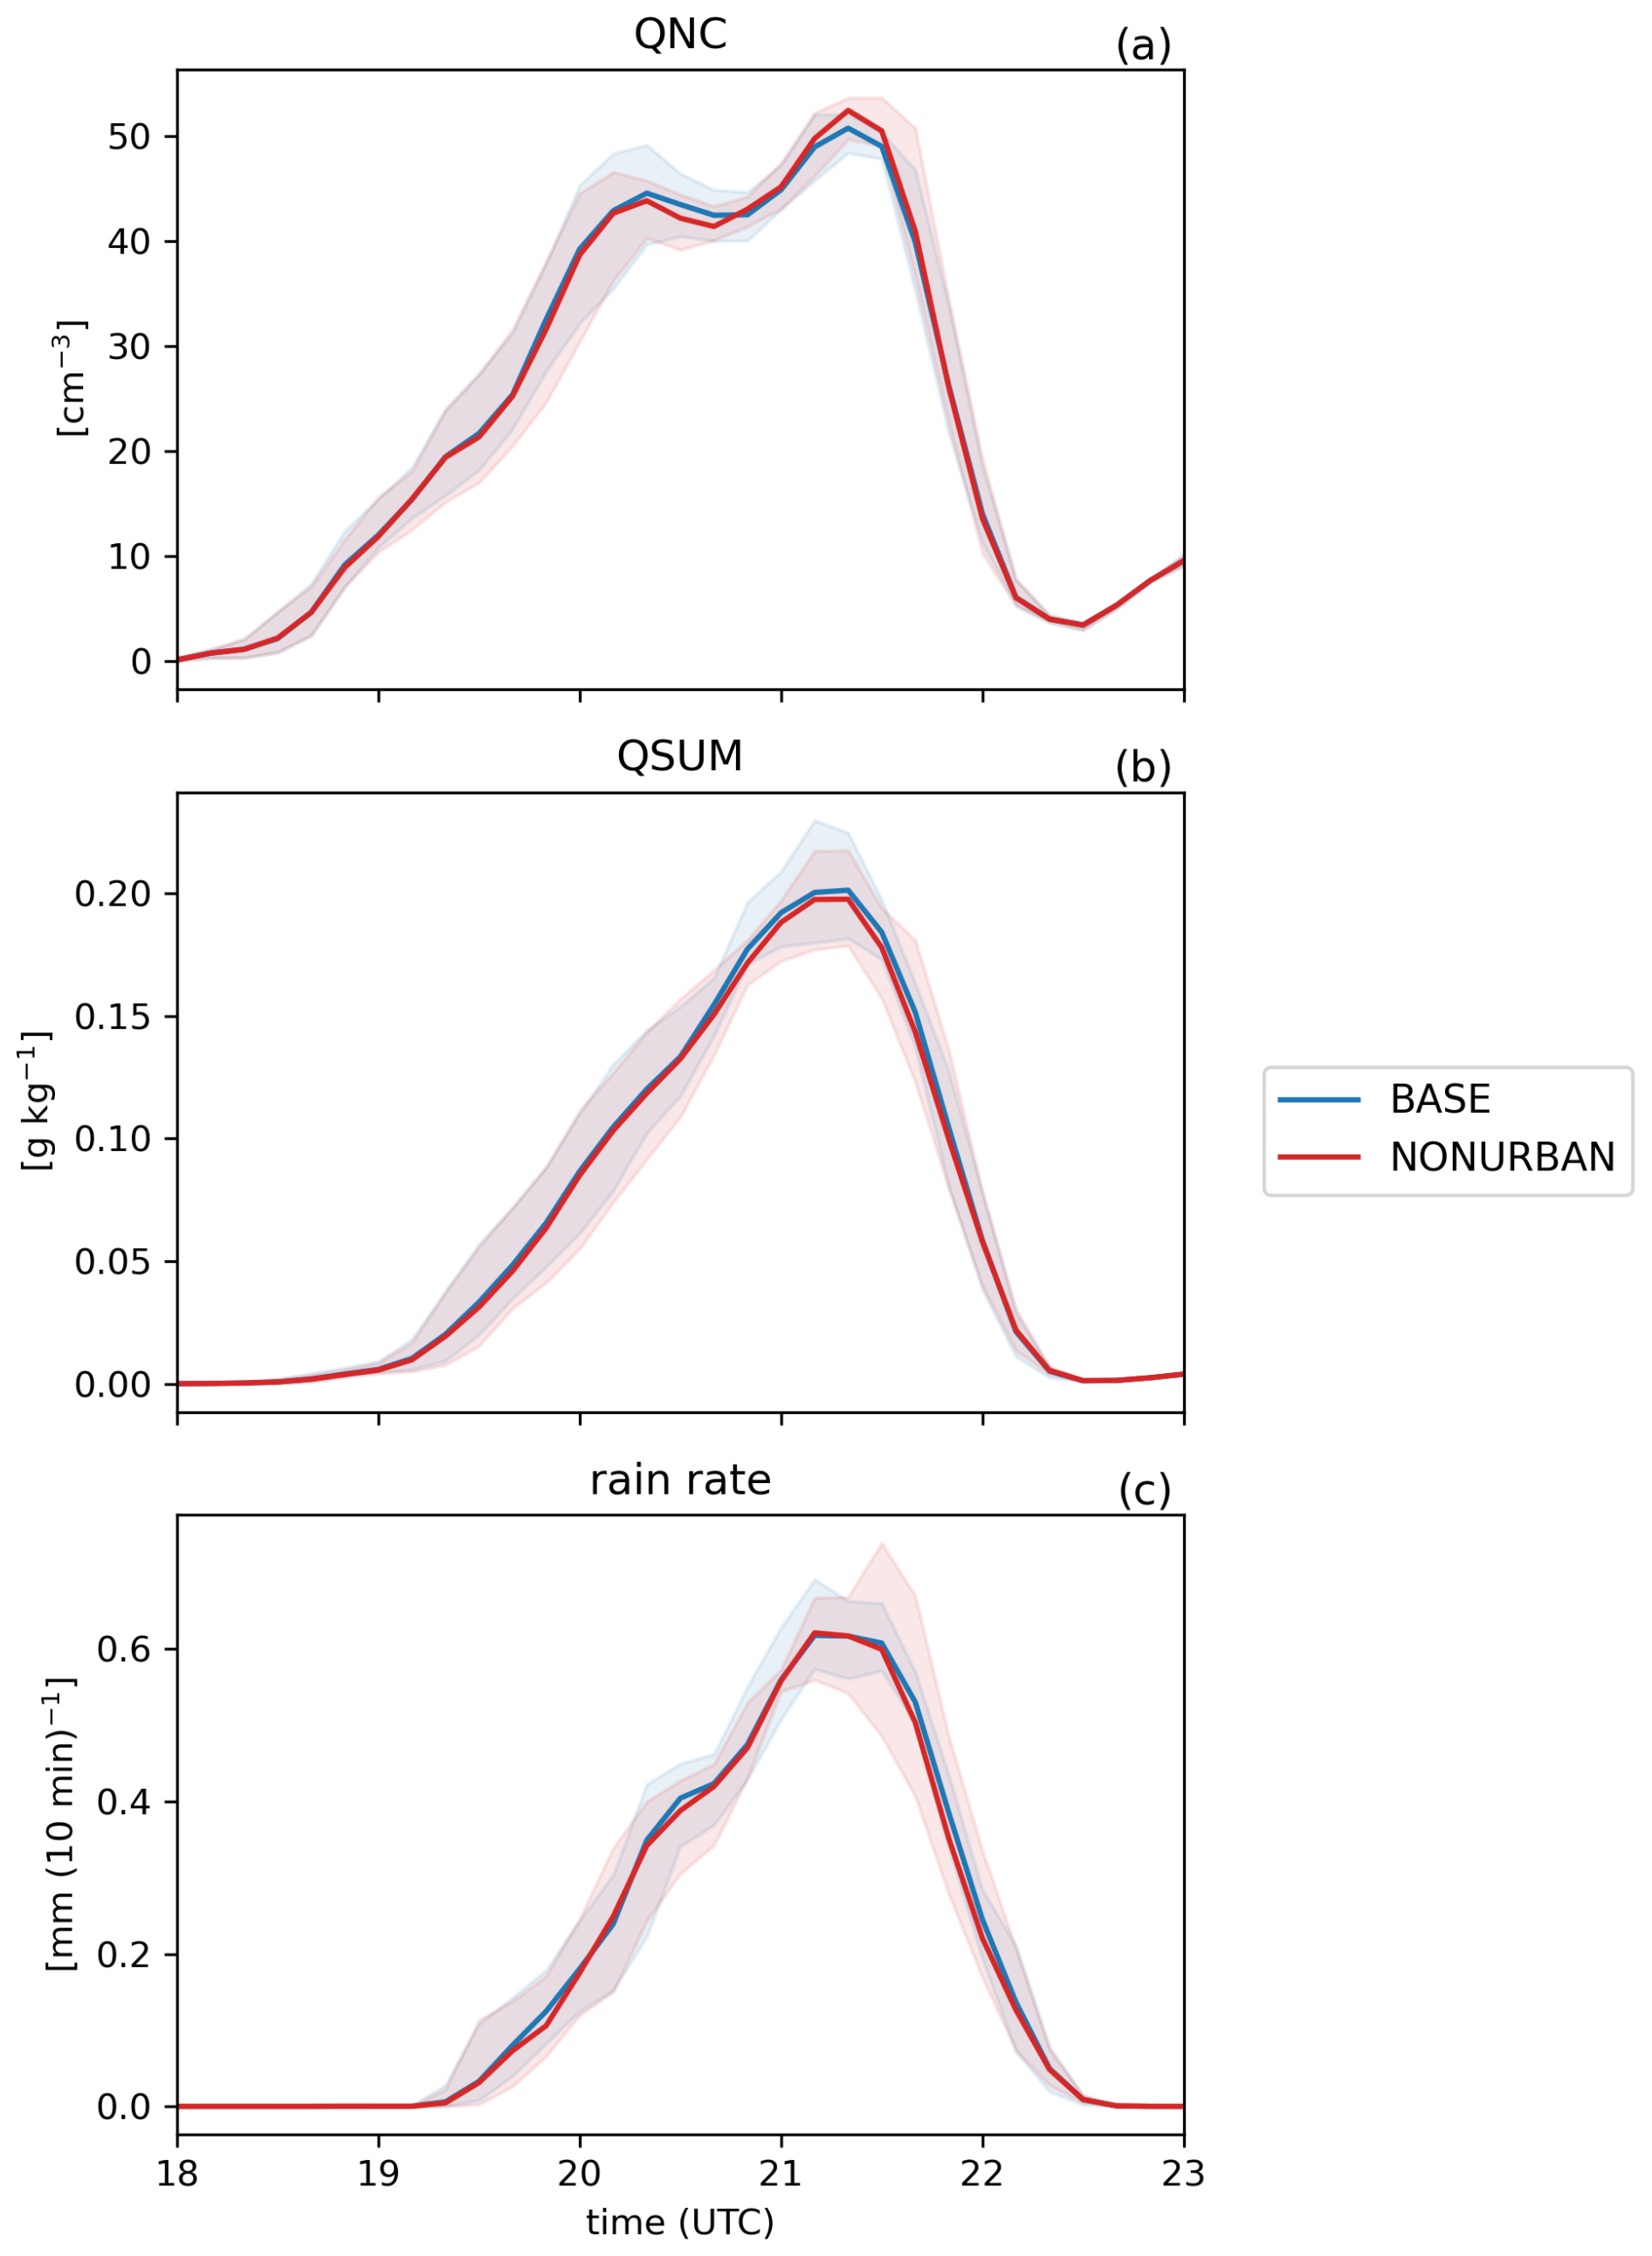
Figure 6Horizontally averaged and layer-thickness-weighted vertical averages (0–13 km) time series of (a) activated cloud droplet number concentration (QNC), (b) total cloud condensate (liquid water, ice, snow, graupel, rain, and hail; QSUM), (c) horizontally averaged rain rate. Lines indicate the ensemble mean, while shading represents the ensemble minimum–maximum range. Blue lines correspond to the BASE experiment, red to the NONURBAN experiment.
Overall, we found no substantial differences in the vertically averaged quantities between the experiments. All analyzed variables show nearly identical temporal evolution, with only minor differences that fell within the natural ensemble variability. Therefore, we conducted a more detailed analysis of vertical variability to better understand the potential urban impact on convective processes that may not be captured by horizontally and vertically averaged fields.
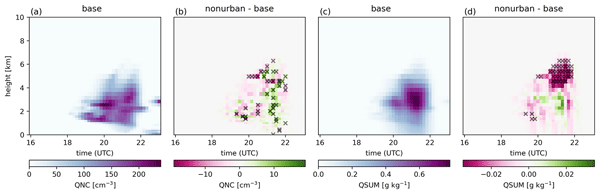
The analysis of the number of activated cloud droplets reveals a distinct temporal evolution of cloud development. Cloud droplet activation initiates at 18:00 UTC and rapidly intensifies reaching concentrations of 150–250 cm−3 with a vertical extent of 1–4 km (Fig. 7a). Between 20:00–22:00 UTC the convective cell continuous to develop vertically, with QNC reaching its maximum vertical extent of up to 6 km. The hydrometeor distribution (Fig. 7c) shows a vertical extent of 6 km between 19:30 and 22:00 UTC. Peak QSUM exceeds 0.8 g kg−1 at 3 km height at 21:30 UTC, corresponding with highest rain intensities. After 21:30 UTC the cloud is mainly dominated by ice phase processes, with substantial formation of graupel and snow.
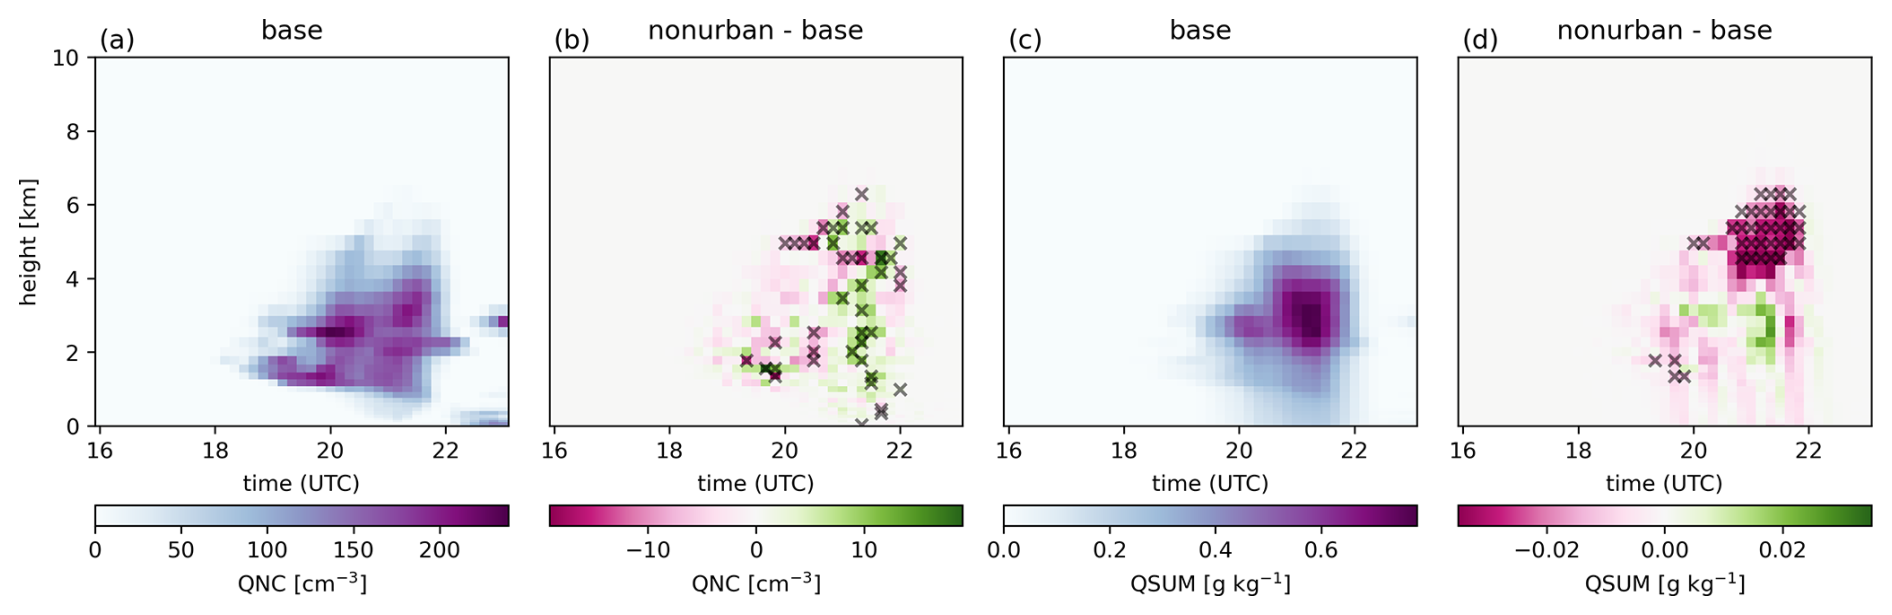
Figure 7Horizontally averaged vertical profiles of number of activated cloud droplets QNC (a) and total cloud condensate QSUM (c), showing ensemble means for the BASE experiment for case I. (b, d) show the corresponding differences between the NONURBAN and BASE experiments for QNC and QSUM, respectively. Black crosses indicate levels where the differences are statistically significant at the 90 % confidence level.
Comparing the BASE and NONURBAN experiment reveals two distinct periods of urban influence on cloud microphysics. During the first period between 18:30 and 20:30 UTC, the negative QNC difference values of 5–10 cm−3 are more prevalent (Fig. 7b), indicating that the urban aerosols act as additional condensation nuclei and the formation of cloud droplets is increased by 2 %–10 % compared to the background aerosol conditions (see Fig. S8). Alongside, QSUM shows a slight increase of 2 %–4 % during this first period.
In the second period, after 20:30 UTC, the pattern in QNC reverses. Positive differences dominate across all vertical layers, showing a 2 %–7 % reduction in QNC compared to the NONURBAN experiment. However, this period is characterized by statistically significant intensification of QSUM between 4 and 6 km altitude of 3 %–7 % (Fig. 7d). This is driven by enhanced ice microphysical processes including increased formation of graupel and snow within the cloud, while simultaneously reducing ice crystals and cloud droplets (see Fig. S8).
This two-stage pattern indicates a spatial redistribution of the cloud microphysics caused by the urban emissions. The additional droplets formed in the first phase are lifted to higher altitudes where temperatures fall below the freezing level, which is located at approximately 2.8 km. At these altitudes, the increased droplet population enhances riming and aggregation processes, leading to more efficient formation of graupel and snow particles. The freezing of additional droplets releases latent heat, which warms the surrounding air and strengthens the updrafts, creating a positive feedback loop between microphysics and dynamics.
The vertical redistribution of cloud condensate with increased concentrations above 4 km after 20:00 UTC and decreased concentrations below supports this interpretation. Urban emissions effectively enhance the ice phase development, promoting more efficient precipitation processes through intensified microphysical interactions. They also provide additional condensation nuclei between 18:30 and 20:30 UTC, which subsequently undergo vertical transport and freezing, ultimately promoting more efficient precipitation formation through intensified ice microphysical processes.
To further support this conclusion, we analyzed the domain-averaged vertical profiles of the positive and negative vertical velocities (Fig. 8). Here we see an increase of the updraft region in the same height as the increased number of hydrometeors. Supporting the presumption that with urban emissions, the ice phase is enhanced, as more particles reach the freezing level, resulting in more freezing of droplets. Hence, more energy is released, which intensifies the updraft in the cloud, leading to more graupel and snow in the clouds. While Fig. 8d shows positive values of the downdraft region difference before 20:00 UTC, which temporally coincide with the increase of precipitation by urban emissions (Fig. 7d).
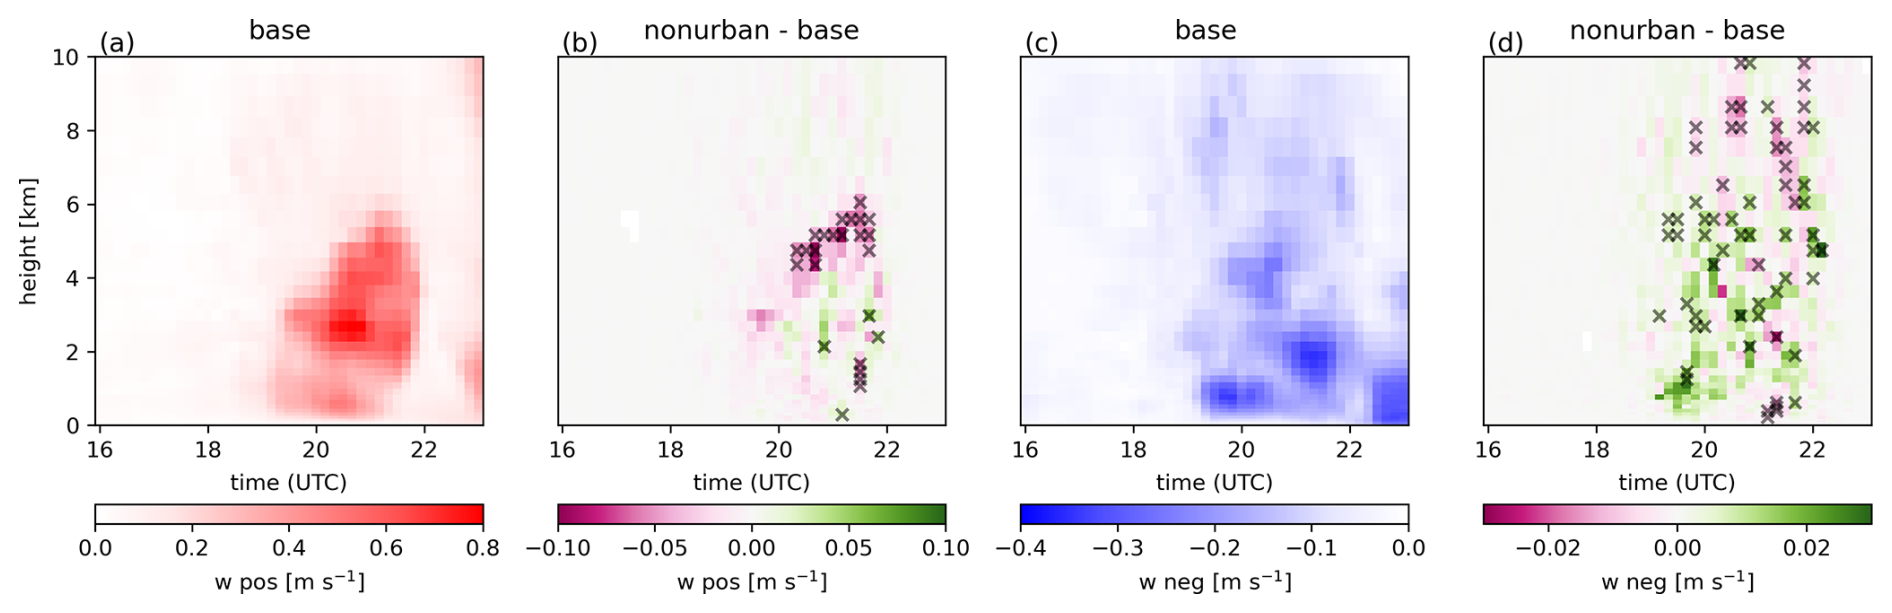
Figure 8Ensemble mean vertical profiles of positive (w pos) (a) and negative (w neg) (c) vertical velocities from the BASE experiment, horizontally averaged over the analysis box for case I. Panels (b) and (d) display the deviations from the BASE case in the NONURBAN experiment. Statistically significant differences at the 90 % confidence level are marked with black crosses. Note: color pattern reversed for w neg, as values are negative.
3.3.2 Case II
For case II, the mean trajectory originates 40–60 km southwest of Leipzig and progresses northeastward, passing over the city between 18:00 and 19:00 UTC (Fig. 2b). North of Leipzig, trajectories follow the urban emissions plume eastward for about 30 min before continuing northeastward. Between 20:00 and 21:00 UTC, convective lifting causes the trajectory to ascend vertically by approximately 2–4.5 km. Prior to convective uplift, the air volume along the trajectory acquires up to 2 % higher urban aerosol concentrations relative to the NONURBAN experiment.
The number of activated cloud droplets (QNC) increased between 19:00 and 20:00 UTC reaching a maximum of 47 cm−3, indicating strong CCN activation (Fig. 9a). The subsequent loss of cloud droplets at a faster rate suggests coalescence processes becoming dominant over nucleation, consistent with the transition to precipitation development. Both experiments display similar temporal patterns, with minor differences occurring after the peak period (20:00–21:00 UTC). Although the BASE simulation shows slightly higher values, these remain within the ensemble spread. The total cloud condensate QSUM peaked at a maximum of 2.0 g kg−1 at 20:00 UTC (Fig. 9b). Comparing the experiments, we see no significant difference. Consistent with case I, QSUM is dominated by rain drops and graupel. The onset of precipitation occurred around 19:00 UTC, coinciding with the increase in QNC and QSUM, intensifying to maximum rates of 2.7 mm (10 min)−1 by 20:30 UTC (Fig. 9c). An observed lag of approximately 30 min between the peak in QNC and the maximum rain rate reflects the microphysical timescale necessary for cloud droplets to grow via condensation and collision-coalescence processes until precipitation-sized particles are formed.
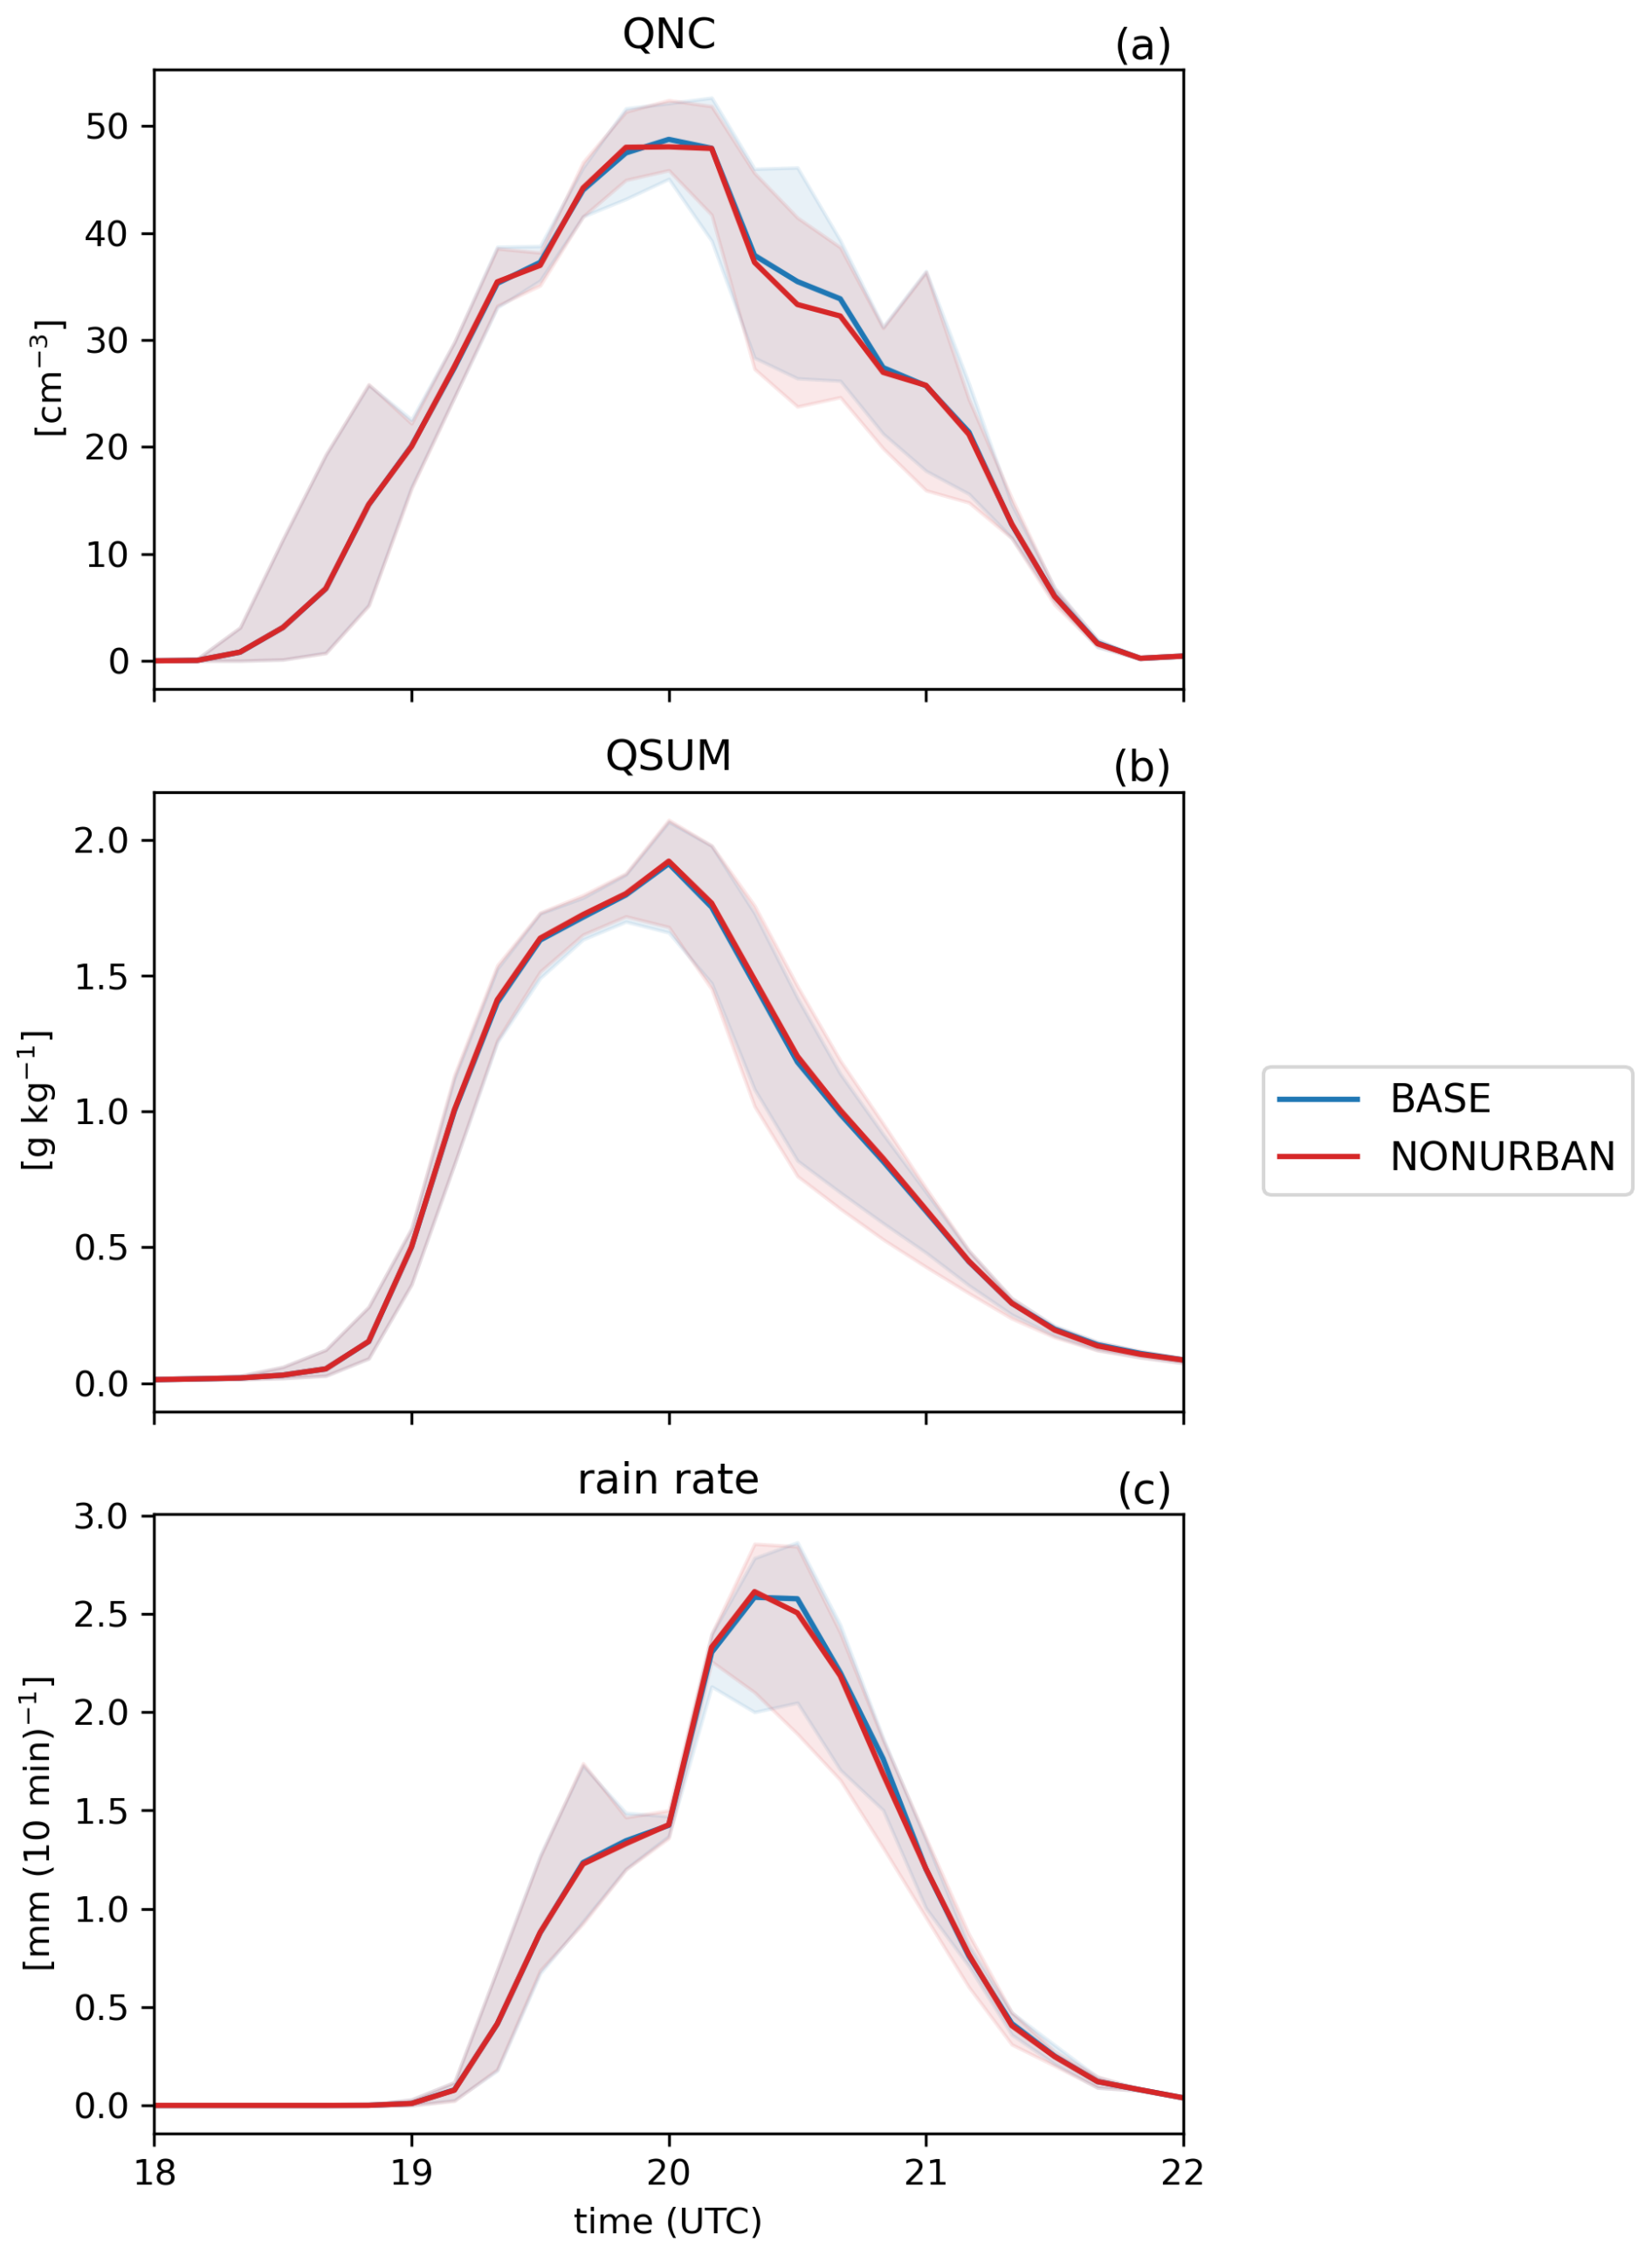
Figure 9Horizontally averaged and layer-thickness-weighted vertical averages (0–13 km) time series of (a) activated cloud droplet number concentration (QNC), (b) total cloud condensate (liquid water, ice, snow, graupel, rain, and hail; QSUM), and (c) horizontally averaged rain rate. Lines indicate the ensemble mean, while shading represents the ensemble minimum–maximum range. Blue lines correspond to the BASE experiment, red to the NONURBAN experiment.
Similarly to case I, no pronounced influence of urban emissions was detected. The temporal evolution of all examined variables was largely consistent between experiments, with minor variations well within the ensemble spread. Here as well, we performed a more detailed examination of vertical variability to better assess potential subtle impacts that might not be evident in horizontally and vertically averaged fields.
The BASE experiment shows a typical convective evolution with a vertical extent reaching up to 13 km (Fig. 10c). The number of activated cloud droplets peaked around 20:00 UTC with maximum values exceeding 150 cm−3 at around 4–5 km height. The total hydrometeor mass mixing ratio reached their maximum of 3.5 g kg−1 at 20:00 UTC (Fig. 10c). During this peak intensity period, strong graupel production dominates (see Fig. S9).
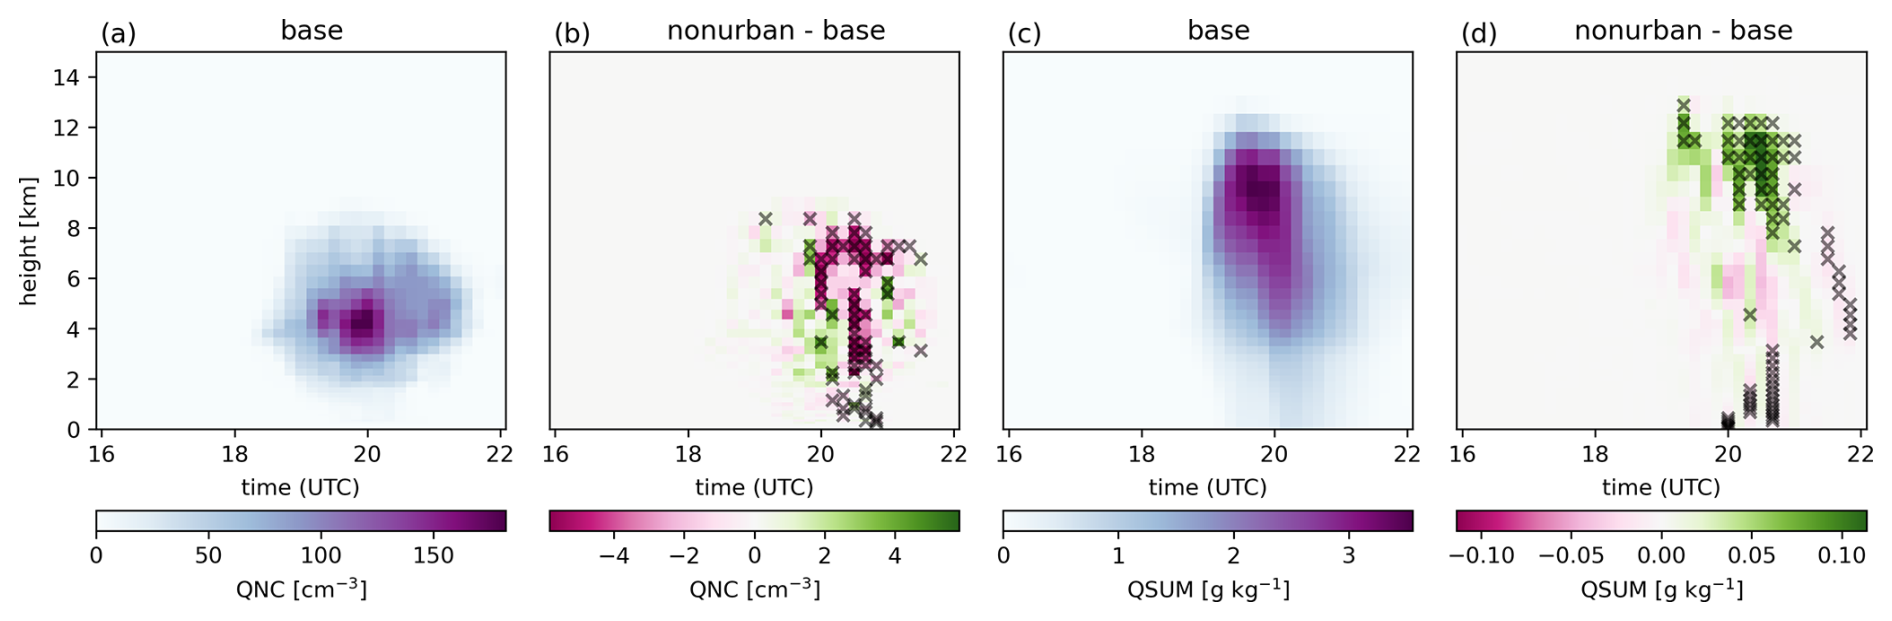
Figure 10Horizontally averaged vertical profiles of number of activated cloud droplets QNC (a) and total cloud condensate QSUM (c), showing ensemble means for the BASE experiment for case II. Panels (b) and (d) show the corresponding differences between the NONURBAN and BASE experiments for QNC and QSUM, respectively. Black crosses indicate levels where the differences are statistically significant at the 90 % confidence level.
The comparison between BASE and NONURBAN experiments reveals contrasting effects across different periods of the analysis. Between 19:00–20:00 UTC, a slight increase in hydrometeor mass mixing ratio is observed in the BASE experiment (Fig. 10d). This increase is primarily attributed to increased cloud droplet numbers above 6 km altitude and enhanced graupel formation shortly before the precipitation maximum. A slight increase in the QNC signal is also detected during this period (Fig. 10b). At the time of peak precipitation (20:00–20:30 UTC), the BASE experiment shows significantly higher numbers of rain drops, reflecting increased rain processes during the most intense period (Fig. S9). After 20:00 UTC, the BASE experiment displays an increase of approximately 10 % in activated cloud droplets. The difference pattern in QSUM shifts compared to the earlier period and is characterized by increased graupel and snow formation of up to 5 % in NONURBAN (Fig. S9). While the BASE experiment shows 8 %–12 % more total ice content.
With urban emissions, cloud droplet activation is increased during the early period (19:00–19:30 UTC) followed by rapid ice formation at higher altitudes. This efficient freezing process increases latent heat release, which intensifies graupel and snow formation, leading to intensified precipitation formation. The resulting increased precipitation leads to a stronger downdraft and suppresses the updraft essential for sustaining convective activity. Analysis of vertical velocity fields confirms significantly stronger downdraft regions by 5 %–10 % in the BASE experiment (Fig. 11d), supporting this mechanism. In contrast, the NONURBAN experiment is characterized by continued graupel and snow production in the later period (20:00–21:00 UTC). Weaker downdrafts allow sustained updraft activity, supporting ongoing aggregation and riming, leading to fewer cloud droplets and ice in the NONURBAN experiment. This is supported by increased updraft regions above 10 km and reduced downdraft regions after 20:30 UTC (Fig. 11).
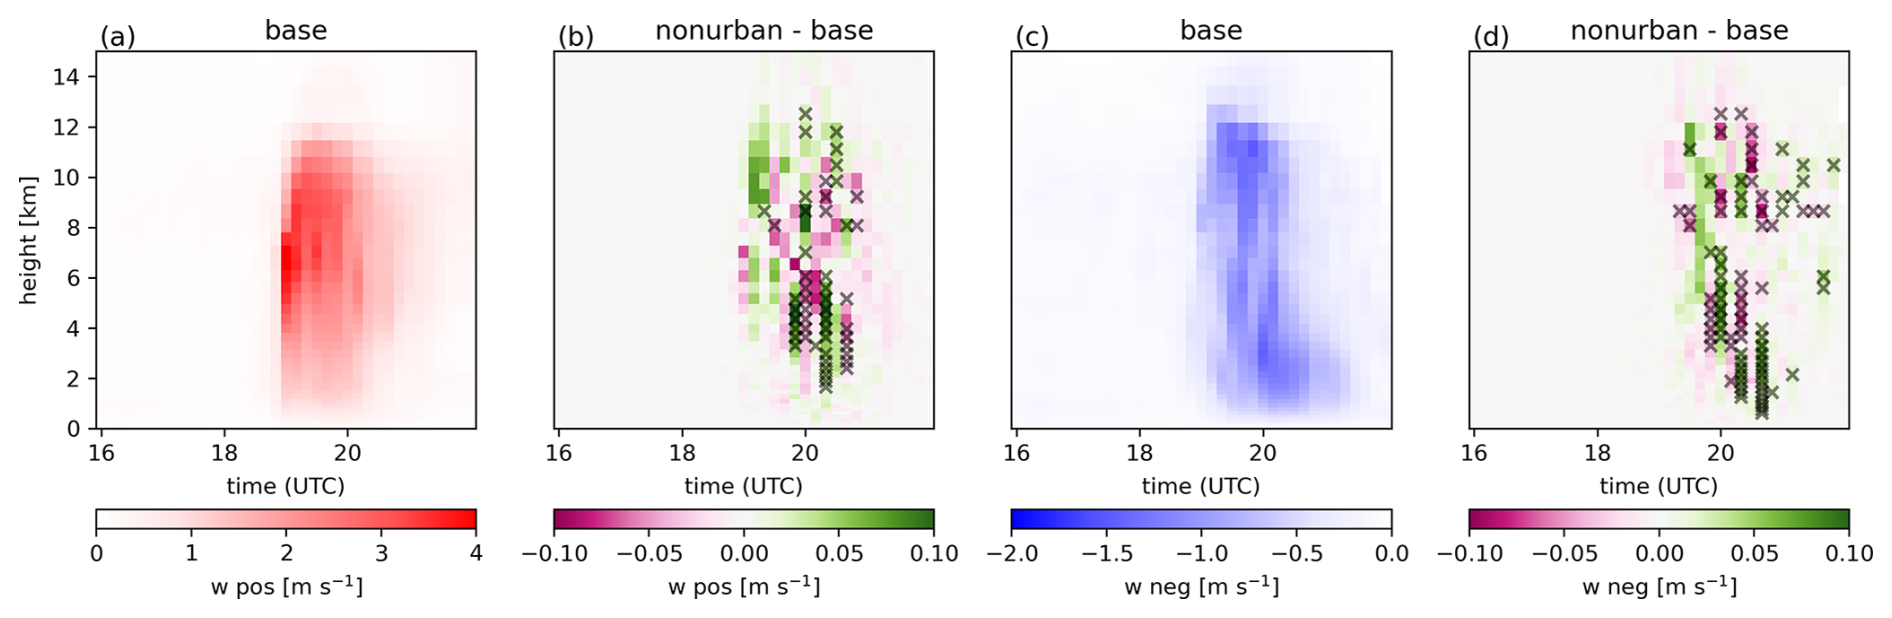
Figure 11Ensemble mean vertical profiles of positive (w pos) (a) and negative (w neg) (c) vertical velocities from the BASE experiment, horizontally averaged over the analysis box for case II. Panels (b) and (d) display the deviations from the BASE case in the NONURBAN experiment. Statistically significant differences at the 90 % confidence level are marked with black crosses. Note: color pattern reversed for w neg, as values are negative.
The comparison reveals different convective evolution patterns with significant implications for precipitation efficiency. When including the Leipzig emissions, the BASE experiment produces increased early precipitation accompanied by stronger downdrafts that suppress further updraft development. Without urban emissions, the convective activity maintains more balanced updraft-downdraft circulation during the later period (20:00–21:00 UTC), enabling sustained aggregation and riming processes. These differences in updraft-downdraft balance suggest distinct convective evolution pathways between the two experiments, though the bulk precipitation time series in Fig. 9 does not reflect a clear temporal shift in overall precipitation amounts.
This study examined the effects of urban emissions on two different convective events passing over the city of Leipzig. We simulated two events with different synoptic settings using the coupled model system COSMO-DCEP-MUSCAT. For each event, ensemble simulations with five members were conducted for two emissions experiments. The BASE experiment serves as a control and is compared to the NONURBAN experiment, where the urban area of Leipzig has been assigned zero emissions while all other emissions are kept unchanged. Case I (13 July 2019) and case II (22 July 2019) both occurred in the evening hours, with convective events interacting with the urban emission plume of Leipzig. Backward trajectory analysis reveals that air volumes carrying urban aerosol signatures were advected into the convective zone. The overall aerosol concentrations in both cases are dominated by background concentrations. However, the urban aerosol plume appears distinctive close to the ground in the levels below 1000 m.
In case I, initial changes of precipitation were detected at the edges of the convective cell, while in the later periods, an increase of ice-phase processes intensified the updraft, leading to increased rainfall. Overall, in this case, precipitation was modified locally by 10 %–20 %, but the structure of the convective cell was not fundamentally altered. In case II, urban emissions accelerated droplet activation and ice formation, which initially intensified precipitation by 10 %–20 %. However, this led to stronger downdrafts of 5 %–10 %, which suppressed the updraft and altered the convective evolution compared to the zero urban emission scenario.
While both cases reveal effects in the ice phase, differences in thermodynamic settings, chemical background and convective intensities determine how these responses unfold. Case I, with moderate instability, allowed for a sustained increase of ice-phase processes and updrafts, whereas in case II, stronger initial instability led to rapid development, with increased precipitation loading suppressing updrafts and weakening further ice processes. These findings highlight that urban aerosol effects depend on the prevailing atmospheric conditions and involve coupled microphysical–dynamical feedback that can either enhance or suppress precipitation. The feedback between microphysical processes and convective dynamics may either boost or counteract each other.
This study addresses several methodological recommendations proposed by Varble et al. (2023), such as an ensemble simulation to mitigate biases from single-run conclusions, prognostic aerosol representation to allow case-dependent evaluation of mixed-phase convection, and trajectory-based analysis for objective sampling of convective clouds and aerosol–cloud interactions. Here, all these aspects and procedures are addressed to ensure robust and process-oriented results.
The five-member ensemble showed that internal variability is comparable in magnitude to urban emission-induced changes. In contrast, many previous studies have relied on single simulations, where apparent aerosol effects may partly reflect natural variability rather than microphysical responses to urban emissions. Only robust effects identified by the bootstrap algorithm are discussed, ensuring that reported modifications in precipitation and ice-phase processes are not artifacts of sampling variability. This highlights why, given the weak signals, ensembles are essential to accurately capture the small changes due to urban emissions
A notable aspect of this study is that the urban emission contribution to the total aerosol loading amounts to less than 3 % in both cases, as the regional background aerosol concentrations dominate. Despite this small relative perturbation, statistically significant microphysical responses and spatial redistribution of precipitation are detected, with magnitudes comparable to studies that examined substantially larger aerosol perturbations. However, domain-mean surface precipitation and total condensate remain within the ensemble spread, indicating no statistically significant net effect on total precipitation amounts. This suggests that even modest urban emission perturbations can produce detectable impacts on convective clouds when the aerosol–cloud coupling is represented explicitly and the analysis is designed to isolate the urban signal from natural variability. Nevertheless, a systematic and robust alteration of convective precipitation patterns likely requires substantially larger emission perturbations, as indicated by sensitivity experiments across a wider range of emission scaling factors in a companion study. These findings have implications for projections of urban aerosol effects under changing air quality conditions: as background aerosol concentrations decline due to emission controls, the relative contribution of urban emissions to total CCN may increase, potentially lowering the perturbation threshold required to produce systematic effects on convection.
The findings of this study generally align with those reported in the multi-model study by Marinescu et al. (2021), who also examined CCN effects on convection, without specifically considering urban influences. Their study reproduced comparable updraft enhancement trends (5 %–15 %), an indication for the latent heating mechanism, although they applied substantially larger CCN perturbations than the moderate urban emission changes examined here. The COSMO version used in Marinescu et al. (2021) exhibited one of the weaker responses compared to the other participating models, likely reflecting limitations in its standard CCN treatment. In contrast, the COSMO-MUSCAT system used here includes a coupled chemistry model that directly calculates cloud droplet activation from prognostic aerosol fields. This explicit aerosol-to-droplet activation process, combined with realistic spatial and temporal aerosol variability, enables a more detailed consideration of aerosol–cloud interactions.
A key advantage of the approach applied here is the use of backward trajectories, which allows us to isolate the effect of local emissions on cloud microphysics and precipitation. In comparison, grid-based or bulk analyses, where variables are averaged over large areas or volumes, often mask these process-level responses. Consequently, the trajectory framework complements the ensemble and prognostic aerosol approach by providing objective, process-based sampling of individual convective clouds and their interactions with urban aerosols.
However, limitations remain as only two convective events and five ensemble members per case were simulated, restricting generalizability. Future work should systematically explore the sensitivity to different emission scenarios and magnitudes, include additional convective events under varying synoptic conditions, and expand ensemble sizes to even more robustly quantify the effects of urban emissions across meteorological regimes. Finally, we note that our microphysical setup, while including explicit aerosol activation and in-cloud nucleation, applies saturation adjustment. This approach may underestimate aerosol effects on convective intensity compared to fully explicit supersaturation schemes (Lebo et al., 2012; Zhang et al., 2021), though the dampening is likely modest for our realistic perturbation scenario. Future work could employ explicit supersaturation methods to provide upper-bound estimates and better constrain the range of urban aerosol effects on precipitation. Nevertheless, the results of this study underpin that modest urban emission variations can modulate microphysical processes in convective events and affect precipitation amounts.
To analyze the convective events prior to urban aerosol influence, we modified our trajectory filtering approach. Instead of following the mean urban trajectory, we tracked the overall mean trajectory (Fig. A1). This approach allows us to examine the convective event evolution before it encounters urban influence. Both cases exhibit a clear temporal pattern in urban aerosol effects (case I: Fig. A2; case II: Fig. A3). In case I, clouds and updrafts that developed before 18:00 UTC show no differences between BASE and NONURBAN simulations. Urban effects only emerge after approximately 18:00–20:00 UTC, when the convective cell encounters the urban plume. Similarly, in case II, the squall line exhibits cloud development before 19:00 UTC with no detectable urban influence, while urban effects become apparent from 20:00 UTC onward. In both cases, the onset of urban influence coincides with the time when the convective events intersect the urban aerosol plume. This confirms that direct exposure to elevated urban aerosol concentrations is required for detectable modifications to convective processes.
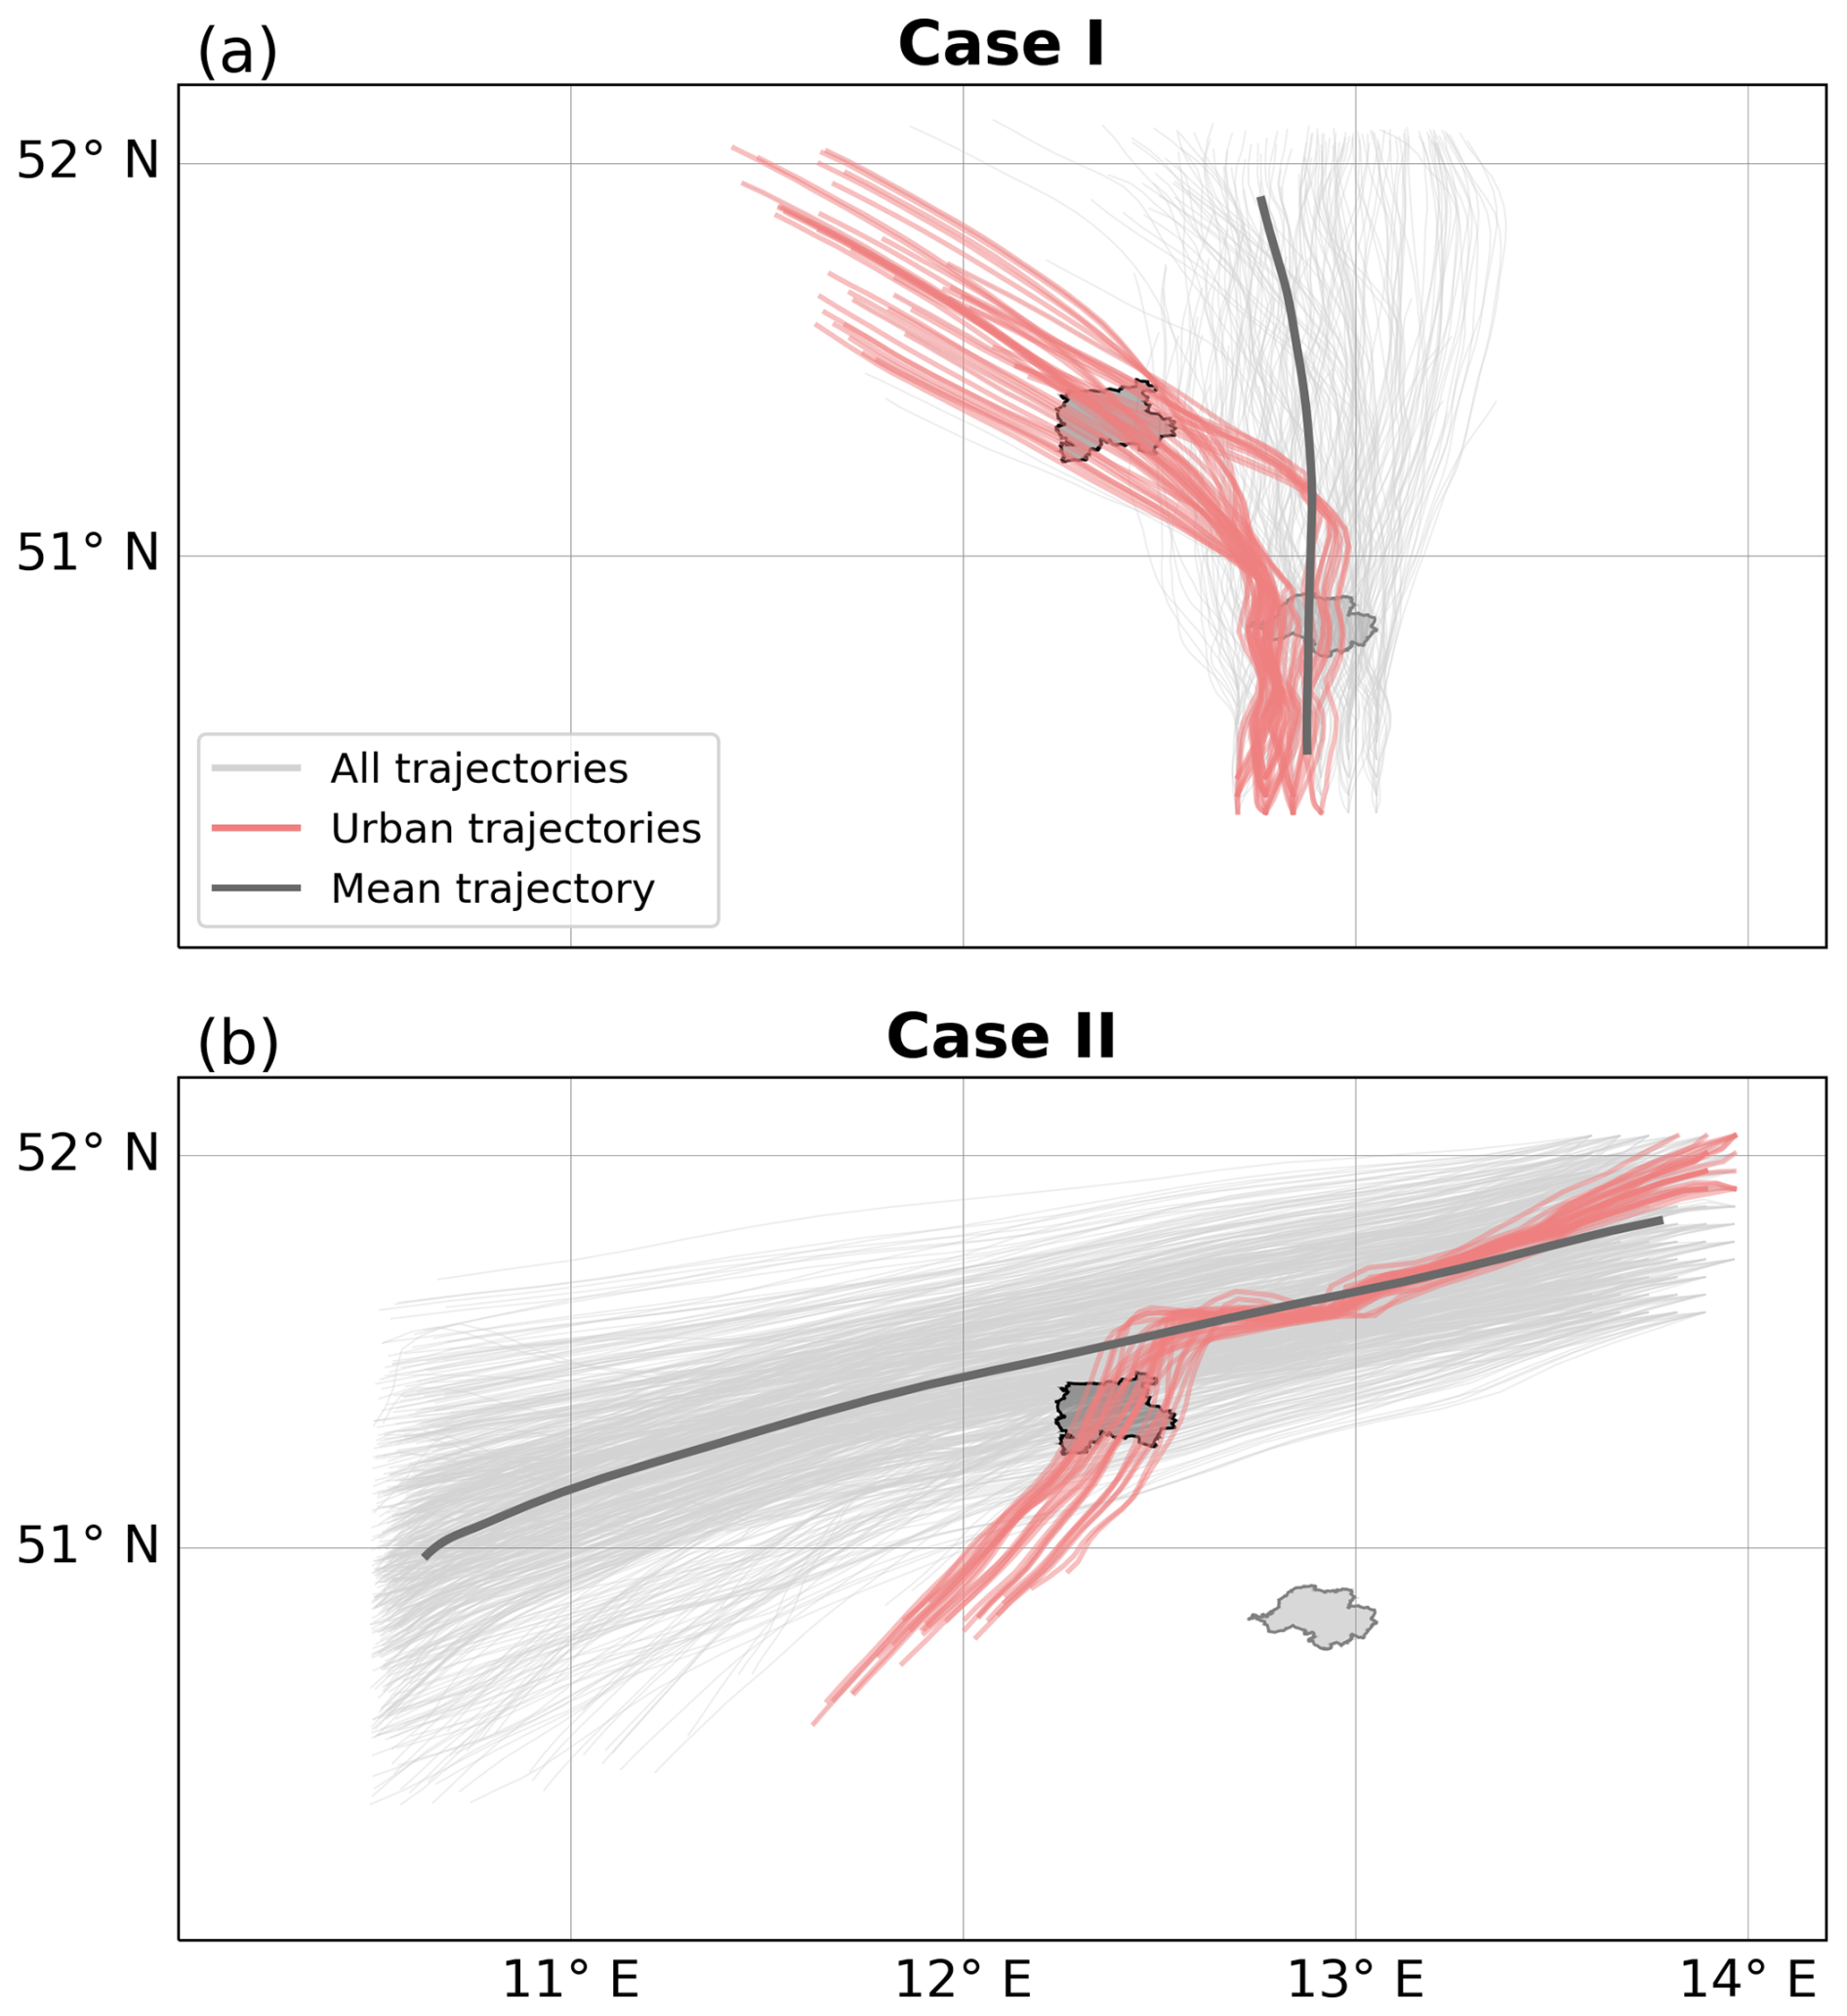
Figure A1Trajectories for case I (a) and case II (b) showing every 5th trajectory in gray. Trajectories passing the urban area of Leipzig in red and mean trajectory in dark gray.
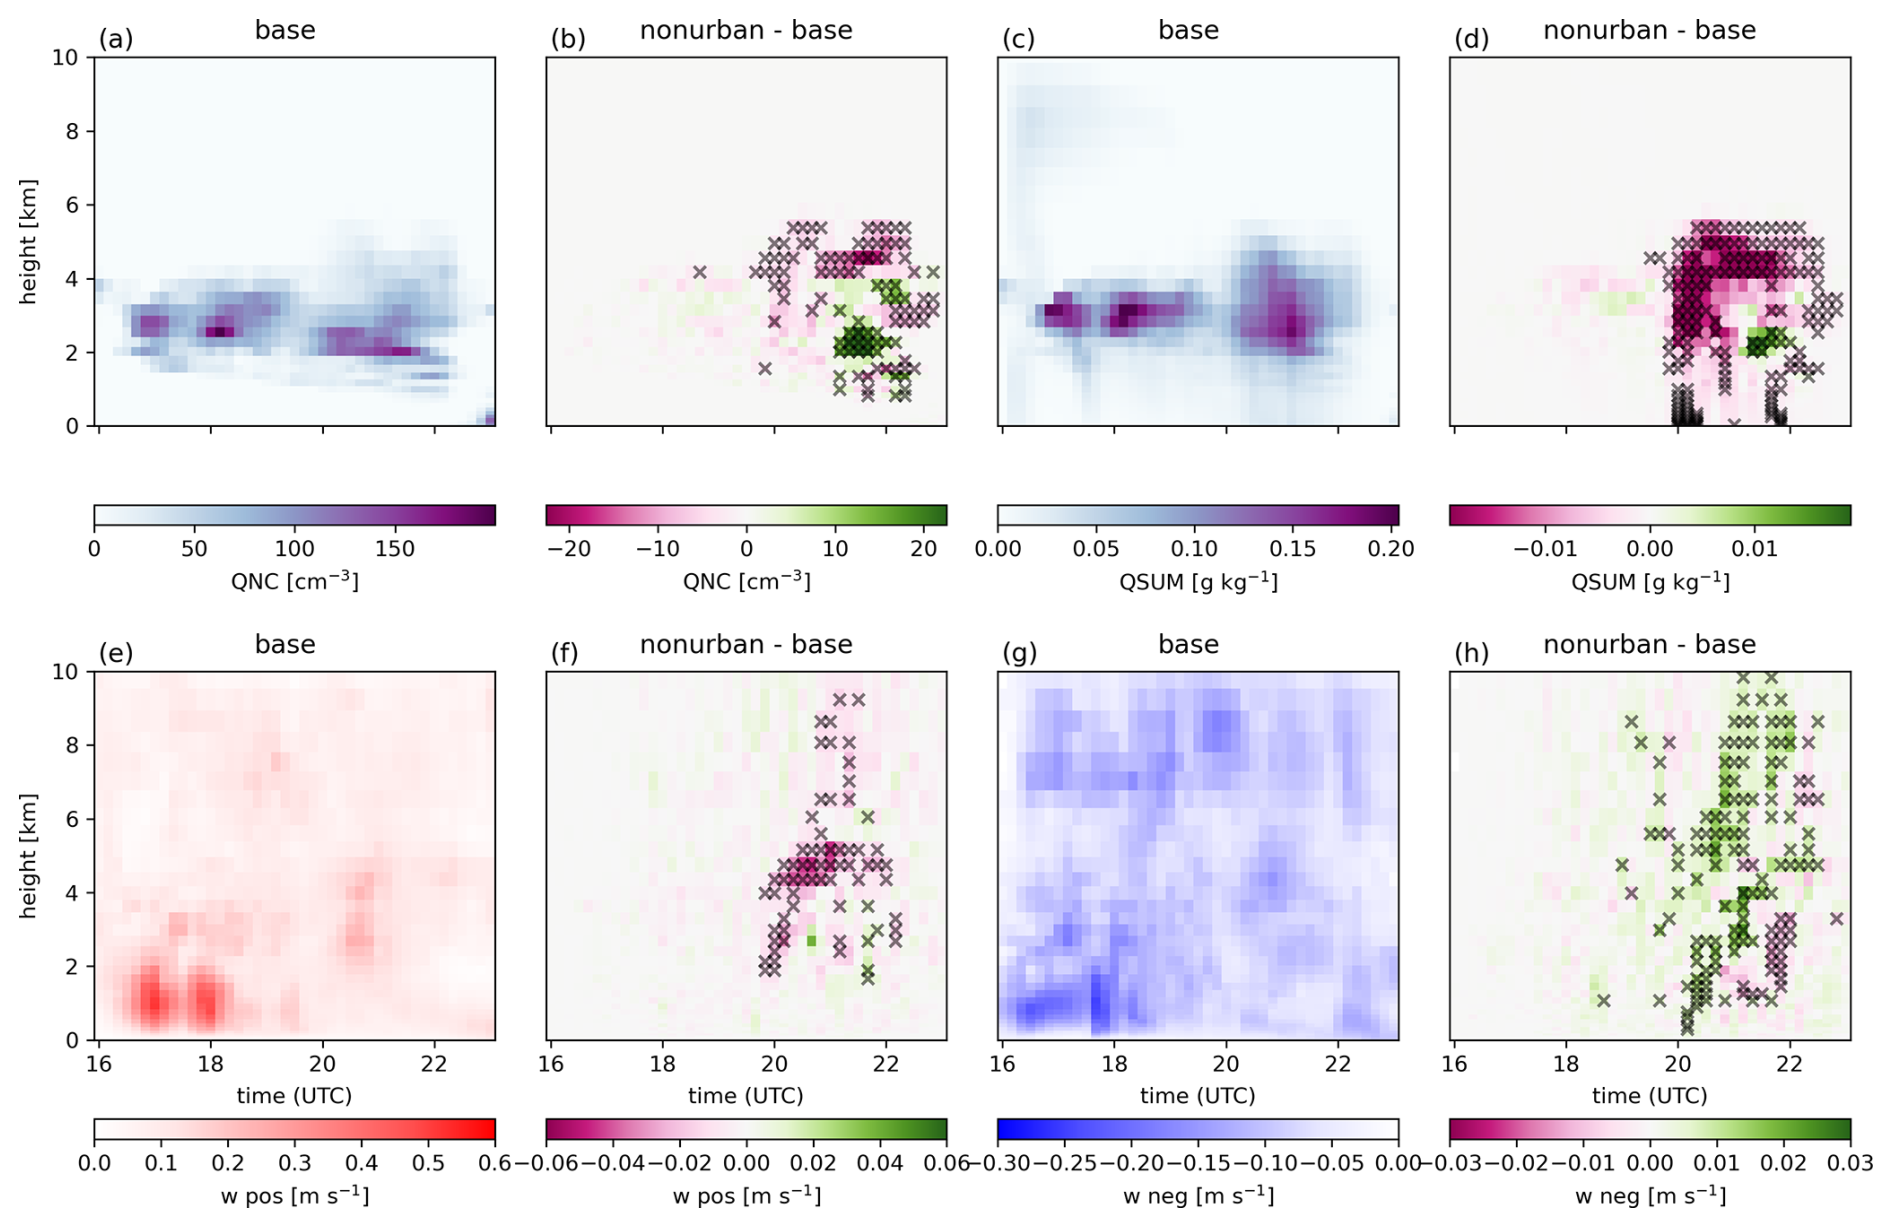
Figure A2Top row is showing horizontally averaged vertical profiles of number of activated cloud droplets QNC (a) and total cloud condensate QSUM (c) along mean trajectory, showing ensemble means for the BASE experiment for case I. (b, d) show the corresponding differences between the NONURBAN and BASE experiments for QNC and QSUM, respectively. Bottom row is showing ensemble mean vertical profiles of positive (w pos) (a) and negative (w neg) (c) vertical velocities from the BASE experiment, horizontally averaged over the analysis box along the mean trajectory for case I. Panels (b, d) display the deviations from the BASE case in the NONURBAN experiment. Black crosses indicate levels where the differences are statistically significant at the 90 % confidence level.
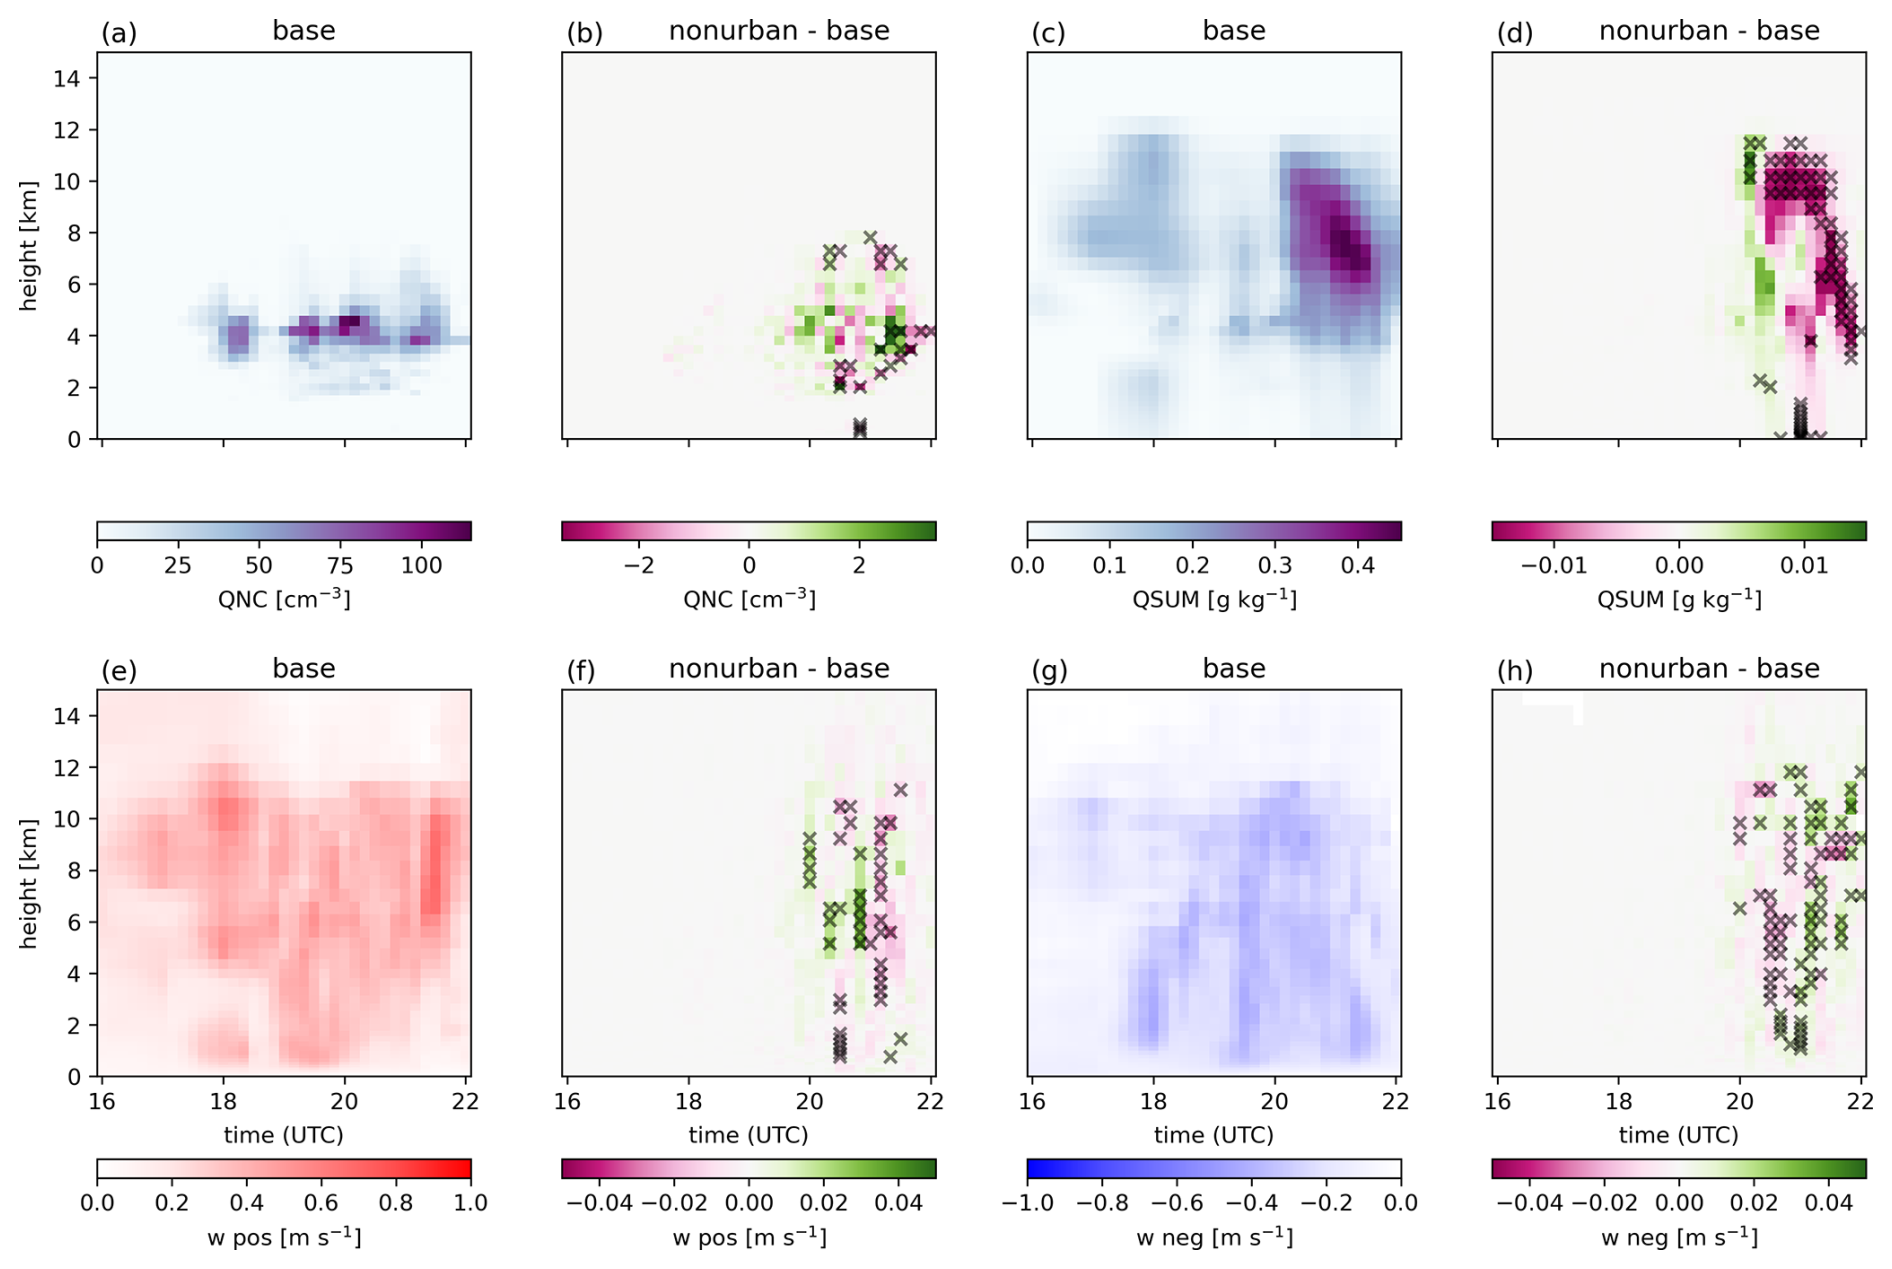
Figure A3Top row is showing horizontally averaged vertical profiles of number of activated cloud droplets QNC (a) and total cloud condensate QSUM (c) along mean trajectory, showing ensemble means for the BASE experiment for case II. Panels (b) and (d) show the corresponding differences between the NONURBAN and BASE experiments for QNC and QSUM, respectively. Bottom row is showing ensemble mean vertical profiles of positive (w pos) (a) and negative (w neg) (c) vertical velocities from the BASE experiment, horizontally averaged over the analysis box along the mean trajectory for case II. Panels (b) and (d) display the deviations from the BASE case in the NONURBAN experiment. Black crosses indicate levels where the differences are statistically significant at the 90 % confidence level.
The COSMO-MUSCAT model output data are archived at DKRZ and are available upon request. The RADKLIM precipitation data is available online at https://opendata.dwd.de (last access: 21 August 2025).
The supplement related to this article is available online at https://doi.org/10.5194/acp-26-11561-2026-supplement.
FK added the aerosol–cloud feedback in COSMO-MUSCAT for anthropogenic aerosol. FK performed the COSMO-MUSCAT simulations, carried out the analysis, and wrote and designed the manuscript with contributions from all co-authors. BH provided support for the simulations and modeling advice. MQ and VM contributed to the project design and discussions. All co-authors reviewed the manuscript, with minor contributions to the text
The contact author has declared that none of the authors has any competing interests.
Publisher's note: Copernicus Publications remains neutral with regard to jurisdictional claims made in the text, published maps, institutional affiliations, or any other geographical representation in this paper. The authors bear the ultimate responsibility for providing appropriate place names. Views expressed in the text are those of the authors and do not necessarily reflect the views of the publisher.
The authors thank the COSMO-MUSCAT team for providing the model data and technical support for this project. We thank Axel Seifert (DWD) for his expert knowledge, advice and insights in 2M-Scheme/COSMO. We are grateful for computing time from the German Climate Computing Center (DKRZ). Recent German-wide emission data were provided on request by the German Environment Agency (Umweltbundesamt, UBA). Building geometries and orography (DGM1) are available from the State Enterprise for Geographic Information and Surveying Saxony (GeoSN; https://www.geodaten.sachsen.de/downloadbereich-digitale-3d-stadtmodelle-4875.html, last access: 14 July 2020). We thank the DWD for good cooperation and support. Minor grammar and style improvements were assisted by AI tools (Claude, DeepL).
This research has been supported by the Deutsche Forschungsgemeinschaft (DFG, German Research Foundation) under Ger570 many's Excellence Strategy – EXC 2037 “CLICCS – Climate, Climatic Change, and Society” – Project Number: 390683824.
This paper was edited by Tak Yamaguchi and reviewed by five anonymous referees.
Abdul-Razzak, H. and Ghan, S. J.: A parameterization of aerosol activation: 2. Multiple aerosol types, J. Geophys. Res.-Atmos., 105, 6837–6844, https://doi.org/10.1029/1999JD901161, 2000. a, b
Albrecht, B. A.: Aerosols, cloud microphysics, and fractional cloudiness, Science, 245, 1227–1230, https://doi.org/10.1126/science.245.4923.1227, 1989. a
Andreae, M. O., Rosenfeld, D., Artaxo, P., Costa, A. A., Frank, G. P., Longo, K. M., and Silva-Dias, M. A. F.: Smoking Rain Clouds over the Amazon, Science, 303, 1337–1342, https://doi.org/10.1126/science.1092779, 2004. a
Burrows, S. M., McCluskey, C. S., Cornwell, G., Steinke, I., Zhang, K., Zhao, B., Zawadowicz, M., Raman, A., Kulkarni, G., China, S., Zelenyuk, A., and DeMott, P. J.: Ice-nucleating particles that impact clouds and climate: Observational and modeling research needs, Rev. Geophys., 60, e2021RG000745, https://doi.org/10.1029/2021RG000745, 2022. a
Cotton, W. R. and Walko, R.: Examination of Aerosol-Induced Convective Invigoration Using Idealized Simulations, J. Atmos. Sci., 78, 287–298, https://doi.org/10.1175/JAS-D-20-0023.1, 2021. a
Doms, G., Förstner, J., Heise, E., Herzog, H.-J., Mironov, D., Raschendorfer, M., Reinhardt, T., Ritter, B., Schrodin, R., Schulz, J.-P., and Vogel, G.: A Description of the Nonhydrostatic Regional COSMO Model. Part II: Physical Parameterizations, Deutscher Wetterdienst, https://doi.org/10.5676/DWD_pub/nwv/cosmo-doc_5.05_II, 2018. a
Fan, J. and Khain, A.: Comments on “Do Ultrafine Cloud Condensation Nuclei Invigorate Deep Convection?”, J. Atmos. Sci., 78, 329–339, https://doi.org/10.1175/JAS-D-20-0218.1, 2021. a
Fan, J., Rosenfeld, D., Yang, Y., Zhao, C., Leung, L. R., and Li, Z.: Substantial contribution of anthropogenic air pollution to catastrophic floods in Southwest China, Geophys. Res. Lett., 42, 6066–6075, https://doi.org/10.1002/2015GL064479, 2015. a
Fan, J., Rosenfeld, D., Zhang, Y., Giangrande, S. E., Li, Z., Machado, L. A. T., Martin, S. T., Yang, Y., Wang, J., Artaxo, P., Barbosa, H. M. J., Braga, R. C., Comstock, J. M., Feng, Z., Gao, W., Gomes, H. B., Mei, F., Pöhlker, C., Pöhlker, M. L., Pöschl, U., and de Souza, R. A. F.: Substantial convection and precipitation enhancements by ultrafine aerosol particles, Science, 359, 411–418, https://doi.org/10.1126/science.aan8461, 2018. a
Fan, J., Zhang, Y., Li, Z., Hu, J., and Rosenfeld, D.: Urbanization-induced land and aerosol impacts on sea-breeze circulation and convective precipitation, Atmos. Chem. Phys., 20, 14163–14182, https://doi.org/10.5194/acp-20-14163-2020, 2020. a, b
Fan, J., Zhang, Y., Li, Z., Yan, H., Prabhakaran, T., Rosenfeld, D., and Khain, A.: Unveiling Aerosol Impacts on Deep Convective Clouds: Scientific Concept, Modeling, Observational Analysis, and Future Direction, J. Geophys. Res.-Atmos., 130, e2024JD041931, https://doi.org/10.1029/2024JD041931, 2025. a
Genz, C., Schrödner, R., Heinold, B., Henning, S., Baars, H., Spindler, G., and Tegen, I.: Estimation of cloud condensation nuclei number concentrations and comparison to in situ and lidar observations during the HOPE experiments, Atmos. Chem. Phys., 20, 8787–8806, https://doi.org/10.5194/acp-20-8787-2020, 2020. a, b
Granier, C., Darras, S., Denier van der Gon, H., Doubalova, J., Elguindi, N., Galle, B., Gauss, M., Guevara, M., Jalkanen, J.-P., Kuenen, J., Liousse, C., Quack, B., Simpson, D., and Sindelarova, K.: The Copernicus Atmosphere Monitoring Service global and regional emissions (April 2019 version), Tech. rep., Copernicus Atmosphere Monitoring Service (CAMS), https://doi.org/10.24380/d0bn-kx16, 2019. a
Guevara, M., Jorba, O., Tena, C., Denier van der Gon, H., Kuenen, J., Elguindi, N., Darras, S., Granier, C., and Pérez García-Pando, C.: Copernicus Atmosphere Monitoring Service TEMPOral profiles (CAMS-TEMPO): global and European emission temporal profile maps for atmospheric chemistry modelling, Earth Syst. Sci. Data, 13, 367–404, https://doi.org/10.5194/essd-13-367-2021, 2021. a
Han, J.-Y., Baik, J.-J., and Khain, A. P.: A numerical study of urban aerosol impacts on clouds and precipitation, J. Atmos. Sci., 69, 504–520, https://doi.org/10.1175/JAS-D-11-071.1, 2012. a
Heinold, B., Tegen, I., Schepanski, K., Tesche, M., Esselborn, M., Freudenthaler, V., Gross, S., Kandler, K., Knippertz, P., MMüller, D., Schladitz, A., Toledano, C., Weinzierl, B., Ansmann, A., Althausen, D., Müller, T., Petzold, A. and Wiedensohler, A.: Regional modelling of Saharan dust and biomass-burning smoke: Part I: Model description and evaluation, Tellus B, 63, 781–799, https://doi.org/10.1111/j.1600-0889.2011.00570.x, 2011. a
Hersbach, H., Bell, B., Berrisford, P., Hirahara, S., Horányi, A., Muñoz-Sabater, J., Nicolas, J., Peubey, C., Radu, R., Schepers, D., Simmons, A., Soci, C., Abdalla, S., Abellan, X., Balsamo, G., Bechtold, P., Biavati, G., Bidlot, J., Bonavita, M., De Chiara, G., Dahlgren, P., Dee, D., Diamantakis, M., Dragani, R., Flemming, J., Forbes, R., Fuentes, M., Geer, A., Haimberger, L., Healy, S., Hogan, R. J., Hólm, E., Janisková, M., Keeley, S., Laloyaux, P., Lopez, P., Lupu, C., Radnoti, G., de Rosnay, P., Rozum, I., Vamborg, F., Villaume, S., and Thépaut, J.-N.: The ERA5 global reanalysis, Q. J. Roy. Meteor. Soc., 146, 1999–2049, https://doi.org/10.1002/qj.3803, 2020. a
Igel, A. L. and van den Heever, S. C.: Invigoration or enervation of convective clouds by aerosols?, Geophys. Res. Lett., 48, e2021GL093804, https://doi.org/10.1029/2021GL093804, 2021. a
Inness, A., Ades, M., Agustí-Panareda, A., Barré, J., Benedictow, A., Blechschmidt, A.-M., Dominguez, J. J., Engelen, R., Eskes, H., Flemming, J., Huijnen, V., Jones, L., Kipling, Z., Massart, S., Parrington, M., Peuch, V.-H., Razinger, M., Remy, S., Schulz, M., and Suttie, M.: The CAMS reanalysis of atmospheric composition, Atmos. Chem. Phys., 19, 3515–3556, https://doi.org/10.5194/acp-19-3515-2019, 2019. a
Kawecki, S., Henebry, G. M., and Steiner, A. L.: Effects of urban plume aerosols on a mesoscale convective system, J. Atmos. Sci., 73, 4641–4660, https://doi.org/10.1175/JAS-D-16-0084.1, 2016. a, b, c
Kumar, P., Morawska, L., Birmili, W., Paasonen, P., Hu, M., Kulmala, M., Harrison, R. M., Norford, L., and Britter, R.: Ultrafine particles in cities, Environ. Int., 66, 1–10, https://doi.org/10.1016/j.envint.2014.01.013, 2014. a
Lebo, Z. J., Morrison, H., and Seinfeld, J. H.: Are simulated aerosol-induced effects on deep convective clouds strongly dependent on saturation adjustment?, Atmos. Chem. Phys., 12, 9941–9964, https://doi.org/10.5194/acp-12-9941-2012, 2012. a
Lehmann, J., Coumou, D., and Frieler, K.: Increased record-breaking precipitation events under global warming, Climatic Change, 132, 501–515, https://doi.org/10.1007/s10584-015-1434-y, 2015. a
Lengfeld, K., Walawender, E., Winterrath, T., and Becker, A.: CatRaRE: A Catalogue of radar-based heavy rainfall events in Germany derived from 20 years of data, Meteorol. Z., 30, 469–487, https://doi.org/10.1127/metz/2021/1088, 2021. a
Liu, J. and Niyogi, D.: Meta-analysis of urbanization impact on rainfall modification, Sci. Rep., 9, 7301, https://doi.org/10.1038/s41598-019-42494-2, 2019. a
Marinescu, P. J., Van Den Heever, S. C., Heikenfeld, M., Barrett, A. I., Barthlott, C., Hoose, C., Fan, J., Fridlind, A. M., Matsui, T., Miltenberger, A. K., Stier, P., Vie, B., White, B. A., and Zhang, Y.: Impacts of varying concentrations of cloud condensation nuclei on deep convective cloud updrafts – A multimodel assessment, J. Atmos. Sci., 78, 1147–1172, https://doi.org/10.1175/JAS-D-20-0200.1, 2021. a, b, c
Martilli, A., Clappier, A., and Rotach, M. W.: An urban surface exchange parameterisation for mesoscale models, Bound.-Lay. Meteorol., 104, 261–304, https://doi.org/10.1023/A:1016099921195, 2002. a
Petters, M. D. and Kreidenweis, S. M.: A single parameter representation of hygroscopic growth and cloud condensation nucleus activity, Atmos. Chem. Phys., 7, 1961–1971, https://doi.org/10.5194/acp-7-1961-2007, 2007. a
Prein, A. F., Langhans, W., Fosser, G., Ferrone, A., Ban, N., Goergen, K., Keller, M., Tölle, M., Gutjahr, O., Feser, F., Brisson, E., Kollet, S., Schmidli, J., van Lipzig, N. P. M., and Leung, R.: A review on regional convection-permitting climate modeling: Demonstrations, prospects, and challenges, Rev. Geophys., 53, 323–361, https://doi.org/10.1002/2014RG000475, 2015. a
Pruppacher, H. R. and Klett, J. D.: Microphysics of Clouds and Precipitation, Atmospheric and Oceanographic Sciences Library, 2nd edn., Springer, https://doi.org/10.1007/978-0-306-48100-0, 1997. a, b
Rosenfeld, D.: Suppression of rain and snow by urban and industrial air pollution, Science, 287, 1793–1796, https://doi.org/10.1126/science.287.5459.1793, 2000. a
Rosenfeld, D., Lohmann, U., Raga, G. B., O'Dowd, C. D., Kulmala, M., Fuzzi, S., Reissell, A., and Andreae, M. O.: Flood or drought: How do aerosols affect precipitation?, Science, 321, 1309–1313, https://doi.org/10.1126/science.1160606, 2008. a, b, c, d
Rozoff, C. M., Cotton, W. R., and Adegoke, J. O.: Simulation of St. Louis, Missouri, land use impacts on thunderstorms, J. Appl. Meteorol. Clim., 42, 716–738, https://doi.org/10.1175/1520-0450(2003)042<0716:SOSLML>2.0.CO;2, 2003. a
Sarangi, C., Tripathi, S., Qian, Y., Kumar, S., and Ruby Leung, L.: Aerosol and urban land use effect on rainfall around cities in Indo-Gangetic Basin from observations and cloud resolving model simulations, J. Geophys. Res.-Atmos., 123, 3645–3667, https://doi.org/10.1002/2017JD028004, 2018. a, b, c
Schättler, U., Doms, G., and Schraff, C.: A description of the nonhydrostatic regional COSMO-model. Part VII: User's guide, Deutscher Wetterdienst, https://doi.org/10.5676/DWD_pub/nwv/cosmo-doc_5.05_VII, 2018. a
Schmid, P. E. and Niyogi, D.: Modeling urban precipitation modification by spatially heterogeneous aerosols, J. Appl. Meteorol. Clim., 56, 2141–2153, https://doi.org/10.1175/JAMC-D-16-0320.1, 2017. a
Schneider, C., Pelzer, M., Tönges-Schuller, N., Nacken, M., and Niederau, A.: ArcGIS basierte Lösung zur detaillierten, deutschlandweiten Verteilung (Gridding) nationaler Emissionsjahreswerte auf Basis des Inventars zur Emissionsberichterstattung, Umweltbundesamt UBA-FB-002360, Texte 71/2016, ISSN 1862-4804, 2016. a
Schubert, S., Grossman-Clarke, S., and Martilli, A.: A double-canyon radiation scheme for multi-layer urban canopy models, Bound.-Lay. Meteorol., 145, 439–468, https://doi.org/10.1007/s10546-012-9728-3, 2012. a
Seifert, A. and Beheng, K.: A two-moment cloud microphysics parameterization for mixed-phase clouds. Part 2: Maritime vs. continental deep convective storms, Meteorol. Atmos. Phys., 92, 67–82, https://doi.org/10.1007/s00703-005-0113-3, 2006a. a
Seifert, A. and Beheng, K. D.: A two-moment cloud microphysics parameterization for mixed-phase clouds. Part 1: Model description, Meteorol. Atmos. Phys., 92, 45–66, https://doi.org/10.1007/s00703-005-0112-4, 2006b. a
Seneviratne, S. I., Zhang, X., Adnan, M., Badi, W., Dereczynski, C., Di Luca, A., Ghosh, S., Iskandar, I., Kossin, J., Lewis, S., Otto, F., Pinto, I., Satoh, M., Vicente-Serrano, S. M., Wehner, M., and Zhou, B.: Weather and Climate Extreme Events in a Changing Climate, in: Climate Change 2021: The Physical Science Basis. Contribution of Working Group I to the Sixth Assessment Report of the Intergovernmental Panel on Climate Change, chap. 11, edited by: Masson-Delmotte, V., Zhai, P., Pirani, A., Connors, S. L., Péan, C., Berger, S., Caud, N., Chen, Y., Goldfarb, L., Gomis, M. I., Huang, M., Leitzell, K., Lonnoy, E., Matthews, J. B. R., Maycock, T. K., Waterfield, T., Yelekçi, O., Yu, R., and Zhou, B., Cambridge University Press, Cambridge, UK and New York, NY, USA, https://doi.org/10.1017/9781009157896.013, 1513–1766, 2021. a
Sharma, M., Rapp, A. D., Nowotarski, C. J., Chen, B., and Brooks, S. D.: The Importance of an Ensemble Approach for Modeling Aerosol-Convection Interactions, Geophys. Res. Lett., 53, e2025GL118530, https://doi.org/10.1029/2025GL118530, 2026. a
Sprenger, M. and Wernli, H.: The LAGRANTO Lagrangian analysis tool – version 2.0, Geosci. Model Dev., 8, 2569–2586, https://doi.org/10.5194/gmd-8-2569-2015, 2015. a
Sui, X., Yang, Z.-L., Shepherd, M., and Niyogi, D.: Global scale assessment of urban precipitation anomalies, P. Natl. Acad. Sci. USA, 121, e2311496121, https://doi.org/10.1073/pnas.2311496121, 2024. a
Talukdar, S., Venkat Ratnam, M., Ravikiran, V., and Chakraborty, R.: Influence of black carbon aerosol on the atmospheric instability, J. Geophys. Res.-Atmos., 124, 5539–5554, https://doi.org/10.1029/2018JD029611, 2019. a
Twomey, S.: Pollution and the planetary albedo, Atmos. Environ. (1967), 8, 1251–1256, https://doi.org/10.1016/0004-6981(74)90004-3, 1974. a
Van Den Heever, S. C. and Cotton, W. R.: Urban aerosol impacts on downwind convective storms, J. Appl. Meteorol. Clim., 46, 828–850, https://doi.org/10.1175/JAM2492.1, 2007. a, b, c
Varble, A. C., Igel, A. L., Morrison, H., Grabowski, W. W., and Lebo, Z. J.: Opinion: A critical evaluation of the evidence for aerosol invigoration of deep convection, Atmos. Chem. Phys., 23, 13791–13808, https://doi.org/10.5194/acp-23-13791-2023, 2023. a, b, c
Weger, M., Heinold, B., Engler, C., Schumann, U., Seifert, A., Fößig, R., Voigt, C., Baars, H., Blahak, U., Borrmann, S., Hoose, C., Kaufmann, S., Krämer, M., Seifert, P., Senf, F., Schneider, J., and Tegen, I.: The impact of mineral dust on cloud formation during the Saharan dust event in April 2014 over Europe, Atmos. Chem. Phys., 18, 17545–17572, https://doi.org/10.5194/acp-18-17545-2018, 2018. a, b
Winterrath, T., Brendel, C., Hafer, M., Junghänel, T., Klameth, A., Lengfeld, K., Walawender, E., Weigl, E., and Becker, A.: Radarklimatologie aus quasi-angeeichten 5-Minuten-Niederschlagsraten Version 2017.002 Gerasterte Niederschlagswerte für Deutschland version v2017.02, https://doi.org/10.5676/DWD/RADKLIM_YW_V2017.002, 2018. a
Wolke, R., Knoth, O., Hellmuth, O., Schröder, W., and Renner, E.: The parallel model system LM-MUSCAT for chemistry-transport simulations: Coupling scheme, parallelization and applications, Adv. Par. Com., 13 363–369, https://doi.org/10.1016/S0927-5452(04)80048-0, 2004. a, b
Wolke, R., Schröder, W., Schrödner, R., and Renner, E.: Influence of grid resolution and meteorological forcing on simulated European air quality: A sensitivity study with the modeling system COSMO–MUSCAT, Atmos. Environ., 53, 110–130, https://doi.org/10.1016/j.atmosenv.2012.02.085, 2012. a, b, c
Yan, H., Gao, Y., Wilby, R., Yu, D., Wright, N., Yin, J., Chen, X., Chen, J., and Guan, M.: Urbanization Further Intensifies Short-Duration Rainfall Extremes in a Warmer Climate, Geophys. Res. Lett., 51, e2024GL108565, https://doi.org/10.1029/2024GL108565, 2024. a
Yue, C., Han, Z., Gu, W., Tang, Y., and Ao, X.: Research Progress for Dynamic Effects of Cities on Precipitation: A Review, Atmosphere, 12, https://doi.org/10.3390/atmos12101355, 2021. a
Zhang, Y., Fan, J., Li, Z., and Rosenfeld, D.: Impacts of cloud microphysics parameterizations on simulated aerosol–cloud interactions for deep convective clouds over Houston, Atmos. Chem. Phys., 21, 2363–2381, https://doi.org/10.5194/acp-21-2363-2021, 2021. a
Zheng, Z., Zhao, C., Lolli, S., Wang, X., Wang, Y., Ma, X., Li, Q., and Yang, Y.: Diurnal variation of summer precipitation modulated by air pollution: observational evidences in the Beijing metropolitan area, Environ. Res. Lett., https://doi.org/10.1088/1748-9326/ab99fc, 2020. a