
the Creative Commons Attribution 4.0 License.
the Creative Commons Attribution 4.0 License.
 | 07 Aug 2026
Physical Interpretation and Implications of Convective Impulses in Thunderstorms Based on Lightning and Polarimetric Radar Observations
Yijun Zhang
Dong Zheng
Liangtao Xu
Wen Yao
Convective impulses (CIs) occur in thunderstorms and are strongly associated with severe convection, often contributing to hazardous weather events. However, the underlying physical mechanisms governing CIs remain poorly understood. In this study, multiple CI events were identified in two selective thunderstorms and analysed from the perspective of the cloud life cycle using polarimetric radar and lightning observations. We investigated the roles of environmental conditions and cloud microphysics in CI events. Our results indicate a pronounced increase in supercooled liquid water and graupel content prior to CI occurrence. The breakup of raindrops is closely linked to the observed increase in supercooled raindrops, suggesting that the fragmentation of large raindrops below the melting layer contributes to raindrop multiplication at subfreezing temperatures. These smaller raindrops subsequently freeze into graupel-like particles, releasing latent heat that may enhance convection and/or lightning activity. This hypothesized physical mechanism is further supported by idealized numerical simulations, which demonstrate that the updraft intensity varies with the efficiency of raindrop breakup. Additionally, large raindrops involved in the breakup process originate from the coalescence of raindrops during the initial pre-CI event, whereas graupel melting or shedding plays a role in subsequent pre-CI events. This improves the understanding of CIs following precipitation loading, melting, and evaporation within a near-stationary thunderstorm cell. These findings reveal a likely physical mechanism contributing to CI events and offer new insights into thunderstorm microphysics and dynamics.
- Article
(8679 KB) - Full-text XML
-
Supplement
(2717 KB) - BibTeX
- EndNote


Thunderstorms are intense convective clouds that play important roles in weather and climate, produce copious amounts of precipitation, lightning, and tornadoes, and affect cloud radiative forcing (MacGorman and Rust, 1998; Williams et al., 2005; Zhang et al., 2009). Explaining how the convective impulse (CI, which is often associated with the convective updraft speed, radar reflectivity, and lightning flash rate) occurs in thunderstorms is always challenging but is key for understanding and simulating thunderstorms (Bruning et al., 2024; Markowski and Richardson, 2010; Zhao et al., 2025; Zipser et al., 2006).
CI is a complex definition in meteorology because of the ambiguous definition of convective intensity. As Zipser et al. (2006) discussed, updraft magnitude, lightning flash rate, and hailstone size, with or without a tornado, were utilized to implicitly equate the convective intensity, whose parameters were selected on the basis of the intent of the researcher. The local maxima of vertical wind velocity or the upwards extension of a high-reflectivity zone were previously used to define updraft impulses or CI via radar observations (Foote and Frank, 1983; Schmid et al., 2000). Such updraft impulse behaviour is also closely linked to cloud microphysical processes. For example, enhanced condensation, freezing, and graupel formation can release latent heat and further accelerate vertical motion, reinforcing short-term updraft intensification (Carey et al., 2019) and associated with lightning activity (Bruning et al., 2024; Zhao et al., 2025). In this study, CI events are identified on the basis of the concurrent intensification of electrical and radar signatures, including increased lightning frequencies and greater maximum reflectivities (≥ 50 dBz). The increasing phase of lightning frequencies is used to define the duration of the CI event.
Unsteady updrafts tied to thermal bubbles generally indicate CI events (Bruning et al., 2024). Three-dimensional thunderstorm modeling studies have clarified thunderstorm development by imposing a warm bubble in the lower levels of a conditionally unstable environment (Markowski and Richardson, 2010). The initiation of a sustained updraft by warm bubbles is followed by an evolution that is strongly influenced by vertical wind shear and the convective available potential energy (CAPE) of the environment (Grabowski and Morrison, 2021; Markowski and Richardson, 2010). Observational studies of the spatial distribution of severe storms have indicated that intense convection strongly preferentially occurs over land and that the frequency of lightning is higher than that over the ocean (Cecil et al., 2014; Orville and Henderson, 1986; Zipser et al., 2006). The thermodynamic difference between land and ocean may account for this difference (Grabowski, 2023; Grabowski and Morrison, 2021; Qie et al., 2024; Thornton et al., 2017; Williams and Stanfill, 2002), although some studies note that aerosol concentrations may also be a factor (Fan J. et al., 2018, 2025; Koren et al., 2004; Rosenfeld and Lensky, 1998; Rosenfeld et al., 2008; Wang et al. 2018). Specifically, substantial storm-scale variability in dominant thermodynamic controls on the strength of convective updrafts coupled with substantial updraft and aerosol variability in many given events are poorly quantified by observations and present further challenges for isolating aerosol effects (Varble et al., 2023).
Previous studies have investigated environmental features corresponding to severe storms, and the results have indicated that thunderstorm intensity is closely related to strong CAPE and wind shear (Liu et al., 2020). CAPE is necessary but insufficient for convection initiation, and most thunderstorms develop in environments with CAPE above 1000 J kg−1 (Lucas et al., 1994; Markowski and Richardson, 2010). Wind shear primarily governs storm organization (e.g., single-cell, multicell, supercell) (Markowski and Richardson, 2010). Although severe weather is more widespread under high shear and significant CAPE, pulse-type severe storms can still arise in high-CAPE, weak-shear environments (Markowski and Richardson, 2010).
The knowledge above essentially clarifies convection development in the real world, as the observational resolutions of CAPE, wind shear, and/or aerosol concentrations are not enough to reveal these relatively short-lived CI events in thunderstorms; thus, convective cloud development or behaviour characteristics during subsequent evolution are unclear, which explains why the CAPE and wind shear cannot be perfect proxies for thunderstorms (Liu et al., 2020). The impulses of convective strength in the subsequent evolution of thunderstorms are strongly modulated by cloud microphysical processes, which are generally accepted by cloud physicists, although some mechanisms that are theorized to drive convective invigoration with increased aerosol loading are controversial (Dagan et al., 2020; Fan et al., 2018a; Grabowski and Morrison, 2020, 2021; Koren et al., 2004; Liu et al., 2020; Rosenfeld et al., 2008; Thornton et al., 2017; Varble et al., 2023; Zhao et al., 2024b). According to Fan et al. (2025), condensational invigoration is most significant under clean atmospheric conditions with high supersaturation levels, where abundant ultrafine particles can be activated and condensation and latent heat release are enhanced. Freezing-induced invigoration can be significant under similarly clean conditions when many relatively large-sized particles are added, as supported by both modelling and observational evidence.
Nevertheless, while the above knowledge can clarify the convective enhancement of thunderstorms that are moving and organized (i.e., the CAPE or aerosol concentration may increase with the variety of environments), it is ineffective for understanding the short-term impulses of convective intensity (i.e., multiple CI events) in thunderstorms or near-stationary thunderstorm cells. Here, the objective of this study is to explore the cloud microphysics and kinematics and the underlying mechanism that are attributed to CI events on the basis of observations of the evolutionary cycle of thunderstorms and numerical simulations.
We selected two special thunderstorms that occurred during the warm season over South China, as detected by a three-dimensional lightning location system and an S-band dual-polarization radar. One thunderstorm cell was a near-stationary thunderstorm with a CAPE value of 2669 J kg−1, weak wind shear, and a relatively clean environment; this thunderstorm remained isolated throughout its life cycle, was referred to as case A, and occurred on 20 June 2016 (the initiation location of case A was marked as red squares in Fig. 1a, b). The other thunderstorm was a moving thunderstorm with a CAPE value of 4076 J kg−1, strong wind shear, and a relatively clean environment; this thunderstorm remained isolated during the early stage of its life cycle, but later experienced partial merging and splitting; this case was referred to as case B and occurred on 13 June 2016 (the initiation location of case B was marked as red squares in Fig. 1c, d).
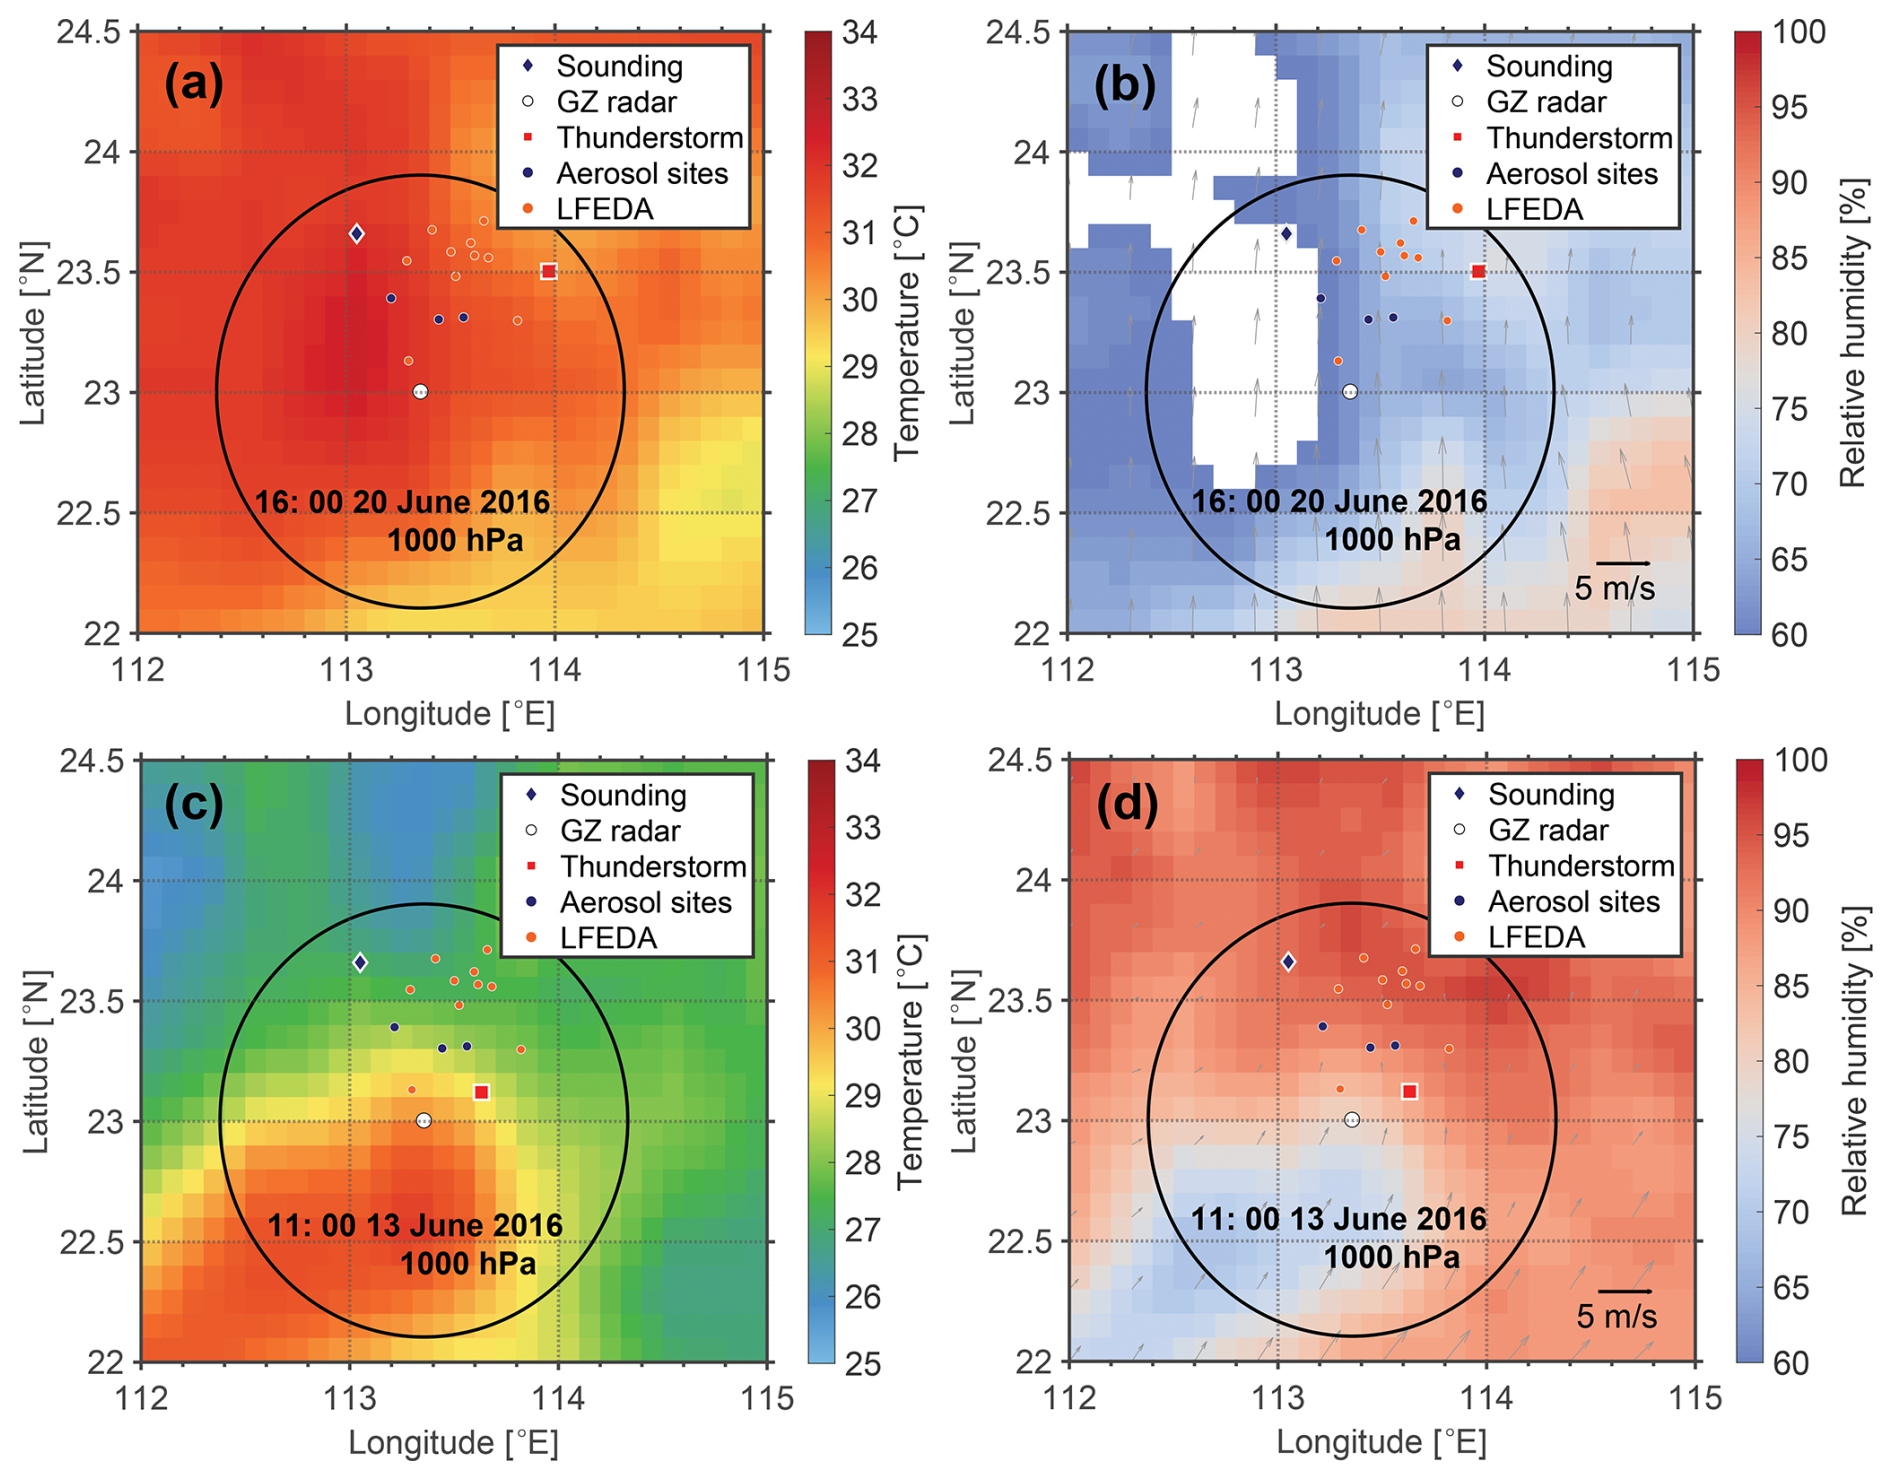
Figure 1Distribution of observational systems and weather backgrounds derived from ERA5. The conditions of the temperature (a, b) and relative humidity overlaid horizontal wind field (c, d) were derived from hourly ERA5 reanalysis data at 1000 hPa, prior to the occurrence of these two thunderstorms (case A occurred at 17:18 on 20 June 2016; case B occurred at 11:48 on 13 June 2016, Beijing time). The upper row indicates case A, and the bottom row indicates case B. The dark blue diamond indicates the Qingyuan meteorological observatory, and the three dark blue dots represent aerosol sites. The white circle indicates the GZ radar, and the 10 orange dots represent the LFEDA network. In addition, the red square indicates the location of the maximum reflectivity of thunderstorm, which occurred at the first identified moment by the GZ radar.
In this study, the evolutionary cycle of thunderstorms is defined as the duration from the first identifiable radar echo (i.e., the radar volume scan in cases where the horizontal reflectivity (ZH) is ≥ 5 dBz when clouds are first detected by radar) to the echo dissipation stage (when the maximum reflectivity decreased below 30 dBz). The evolutionary cycles of the two thunderstorms are displayed in Figs. S1 and S2 in the Supplement. And Fig. S3 shows case B can be distinguished from neighbouring convection cloud during the merging moments. To ensure the quality of the radar and lightning data, the locations of the centers of the two thunderstorms meet the conditions and are restricted to approximately the analyzed areas, which are the regions of overlapping coverage between the radar radii of 25–100 km and the lightning-location-system network center radius of 70 km.
2.1 Lightning location system
A low-frequency E-field detection array (LFEDA, 10 sensors, orange dots in Fig. 1) was used to detect lightning events in the study area and resolve the three-dimensional structures of cloud-to-ground lightning and intracloud lightning. The system achieves ∼ 100 % detection efficiency and a mean location error of ∼ 102 m, representing the highest performance among lightning location systems in Guangzhou, China (Chen et al., 2012; Fan et al., 2018b; Shi et al., 2017). Operating at 160 Hz ∼ 600 kHz, it locates discharge pulse events (DPEs) using a time-of-arrival method. The quality control method for the DPEs followed that of Liu et al. (2020), the located heights should be less than 20 km and the chi-square goodness-of-fit values were limited to 10 or less. The method for grouping DPEs into flashes followed those of Shi et al. (2017) and Zheng et al. (2019); that is, a potential flash DPE must have occurred within 400 ms of the previous DPE and within 4 km and 600 ms of any other flash DPE.
2.2 Radar observations and preprocessing
The Guangzhou S-band dual-polarization radar (GZ radar, as marked by the white circle in Fig. 1) provided radar observations. The configurations of this radar are as follows: the beam width of 1°, the radial range resolution of 250 m, and an azimuth resolution of 1°. This radar works in the mode of volume coverage pattern 21, which consists of nine plan position indicator scans with a volumetric update time of 6 min. A quality control procedure was carried out to remove anomalous propagation, biological scatter, and ground clutter (Zhao et al., 2021a, b, 2022). The differential reflectivity (ZDR) was calibrated during light rainfall periods, and the calibration accuracy ranged from 0.1–0.2 dB (Bringi and Chandrasekar, 2001). The quality-controlled radar data were bilinearly interpolated onto a Cartesian grid at a horizontal resolution of 250 m and a vertical resolution of 500 m from 0.5 to 20 km above the mean sea level (Zhang et al., 2017; Zhao et al., 2024a, c).
2.3 ERA5 data and environmental observations
Hourly ERA5 reanalysis data, with a 0.25° × 0.25° horizontal resolution (Bell et al., 2020), were regridded to 0.1° × 0.1° via linear interpolation to better match the scale of thunderstorms in this study. The environmental temperature and relative humidity provided by the sounding data, which were obtained from the Qingyuan meteorological observatory (as marked by the dark blue diamonds in Fig. 1), were regarded as the true observations for comparison with the ERA5 reanalysis data. Because case A occurred at 17:18 (all instances are in Beijing time) on 20 June 2016 and case B occurred at 11:48 on 13 June 2016, we selected the adjacent sounding moment as the reference time for comparison, namely, 20:00 and 08:00, respectively. Comparisons of the temperature and relative humidity between the sounding and ERA5 data from 1000 to 400 hPa at the same spatial–temporal position revealed that the average difference in temperature was approximately 0.6 °C and that the mean difference in relative humidity was approximately 7 % (Fig. 2). In addition, the difference in CAPE between the sounding and ERA5 data is approximately −246 J kg−1, and the difference in convective inhibition is −171 J kg−1. The hourly observed particulate matter (PM2.5) mass concentration data were provided by the Ministry of Ecology and Environment of the People's Republic of China (Wang and Zhang, 2020), and three ground sites for aerosol concentrations within the analysed area were used, as marked by the dark blue dots in Fig. 1.
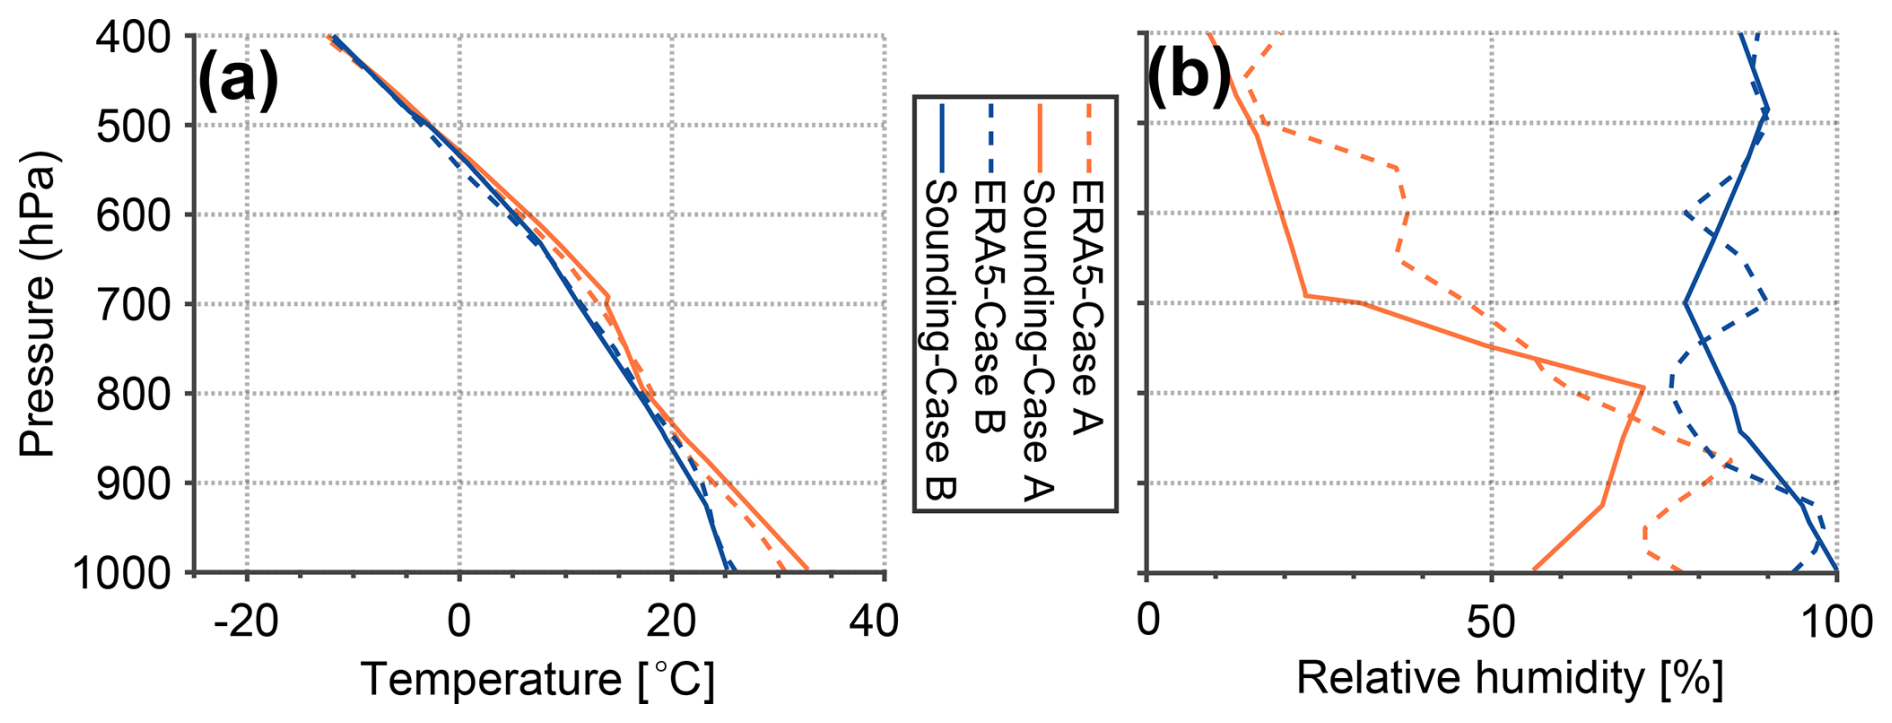
Figure 2Comparison between sounding and ERA5 data. (a) Temperature versus pressure. (b) Relative humidity versus pressure. The orange line indicates case A at 20:00 on 20 June 2016, and the blue line indicates case B at 08:00 on 13 June 2016. The solid line represents the observations from the sounding, and the dashed line represents the ERA5 data.
2.4 Numerical model configuration
The Weather Research and Forecasting (WRF) model was utilized in this study. The idealized em_quarter_ss case was selected because it represents an isolated three-dimensional storm, which is more consistent with the observed thunderstorms investigated in this study. The default thermal perturbation in the original em_quarter_ss experiment was reduced to one-third to avoid producing an excessively intense thunderstorm and to better represent the convective intensities observed in this study. The Morrison two-moment scheme (Morrison et al., 2009) was used. To investigate the effects of raindrop breakup on the graupel concentration and on the convective intensity (updraft velocity) within clouds, the parameterization of raindrop breakup is introduced here.
The drop breakup simulation in the WRF model is based on the self-collection of raindrops; the collection efficiency (Ec) is defined as follows:
where Dm is the volume-number mean diameter of the raindrop and Dth is the threshold mean diameter related to breakup. In the Morrison two-moment scheme, Dth=0.3 mm (Morrison et al., 2012). The default setup, described above, is used for the baseline model configuration (hereafter, RB). To test the role of breakup in convection simulation, a sensitivity experiment (hereafter, noRB) is conducted to close raindrop breakup process; namely, Ec must be greater than zero when Dm>Dth.
The domain size is 80 km × 80 km in the horizontal direction with the model lid at 20 km. The horizontal and vertical grid spacings are approximately 1000 and 250 m, respectively. The simulation was integrated for 180 min, with output data saved every 1 min. The 1 min output interval provides a finer temporal resolution than the radar observations and allows examination of the rapid evolution of the thunderstorm. Convection is initiated by inserting a warm bubble, assuming thermal perturbation, to initiate convection. The sounding data for the simulation are shown in the Supplement.
2.5 Analytical method
Lightning activity and echo-top height provide kinematic variation in the evolutionary cycle of thunderstorms with temporal resolution considerations (Carey and Rutledge, 2000; Zipser et al., 2006). Benefiting from polarimetric radar observations, warm- and mixed-phase microphysics, even the “fingerprint” of microphysical processes, were derived to study how microphysical processes increase convective strength (Carey and Rutledge, 2000; Hu and Ryzhkov, 2022; Kumjian and Prat, 2014; Kumjian et al., 2022; Zhao et al., 2025).
The classified fingerprint of cloud microphysical processes was based on dual-polarization radar observations. Vertical changes in polarimetric variables towards the surface (e.g., ZH or ZDR) can clearly discriminate different microphysical processes (Kumjian et al., 2022). Kumjian and Prat (2014) utilized a one-dimensional bin-microphysical rain shaft model and S-band polarimetric radar observations to display the distinctive signatures related to coalescence, breakup, size sorting/evaporation, and balanced breakup and coalescence processes within specific areas of the ZH–ZDR space. In this study, we used the changes in ZDR and ZH from heights of 0.5 to 3.5 km to determine the warm-rain microphysical processes. Moreover, the mass-weighted mean drop diameter (Dm, mm) was retrieved from the ZH and ZDR to support these fingerprints. The Dm retrieval method followed Tokay et al. (2020) and the absolute bias of Dm ranged from 0.31–0.36 mm in their study.
Specifically, the ice and rain water contents were estimated from the GZ radar measurements via the difference reflectivity (ZDP) method (Carey and Rutledge, 2000; Golestani et al., 1989). The precipitation-sized ice particles were likely more spherically symmetrical or tumble, resulting in a near-zero ZDR (Pruppacher and Klett, 1997). Therefore, ice particles can be regarded as “effective spheres”, and the ZDP is solely influenced by raindrops. The horizontal reflectivity of raindrops can be derived from the relationship between horizontal reflectivity and ZDP (raindrops), where the empirical relationship was derived from 2-year disdrometer data in Guangdong Province (Li et al., 2020), and the residual difference in the observed horizontal reflectivity is associated with ice particles. On the basis of the scattering properties of typical graupel (Zhao et al., 2021b), if ZH ≥ 35 dBz, the corresponding ice mass was regarded as a graupel mass, as used in Carey and Rutledge (2000). The standard error for the relationship between the horizontal reflectivity and ZDP has been reported to be approximately 1 dB in previous studies (e.g., Carey and Rutledge, 2000). The estimated mass is proportional to the actual mass and depends on the variability in the intercept parameter of an assumed inverse exponential distribution for the hydrometeor and its density; thus, the trends of the estimated mass are deemed sufficient for application in this study.
Once the ice water content was determined, the total number concentration (Nt) of ice particles larger than 0.1 mm was computed; the relationship follows that of Hu and Ryzhkov (2022). Notably, the radar retrieval techniques were valid mainly in the stratiform parts of storm systems where graupel and hail are usually absent, and the derived ice microphysics were representative of storm areas where the radar reflectivity does not exceed 30 dBz. Notably, the reflectivity constraint (ZH ≤ 30 dBz) is applied only to the retrieval of ice Nt and does not affect the estimation of the ice or graupel content above the melting layer.
Notably, uncertainties are inherent in the radar-based estimation (e.g., Dm, Nt, and ice and rain water contents). However, our analysis focuses on the relative variations and comparisons rather than their absolute values, which are less sensitive to such systematic errors. Moreover, the interpretation of microphysical processes is jointly supported by multiple polarimetric radar variables and retrieved parameters, providing independent constraints. Therefore, the impact of these uncertainties on the main conclusions is limited.
3.1 Overview of two thunderstorms in the environment and their development
The data from the last hour before the occurrence of these two thunderstorms (case A and case B), derived from hourly ERA5 reanalysis data and hourly averaged concentration observations of particulate matter (PM2.5) from three ground sites show lower CAPE and PM2.5 concentrations in case A (2669 J kg−1 and 23 µg m−3) and higher CAPE and PM2.5 concentrations in case B (4076 J kg−1 and 47 µg m−3, respectively). The PM2.5 concentrations suggest that the environments prior to the presence of these two thunderstorms were relatively clean, especially for case A. The conditions of relative humidity and wind shear derived from the hourly ERA5 reanalysis data indicate more vapour and stronger low-level wind shear (i.e., the variation in the wind speed between 1000 and 850 hPa) in case B than in case A (Fig. 3a, b). These environments suggest that the conditions are more favourable for thunderstorm development in case B than in case A.
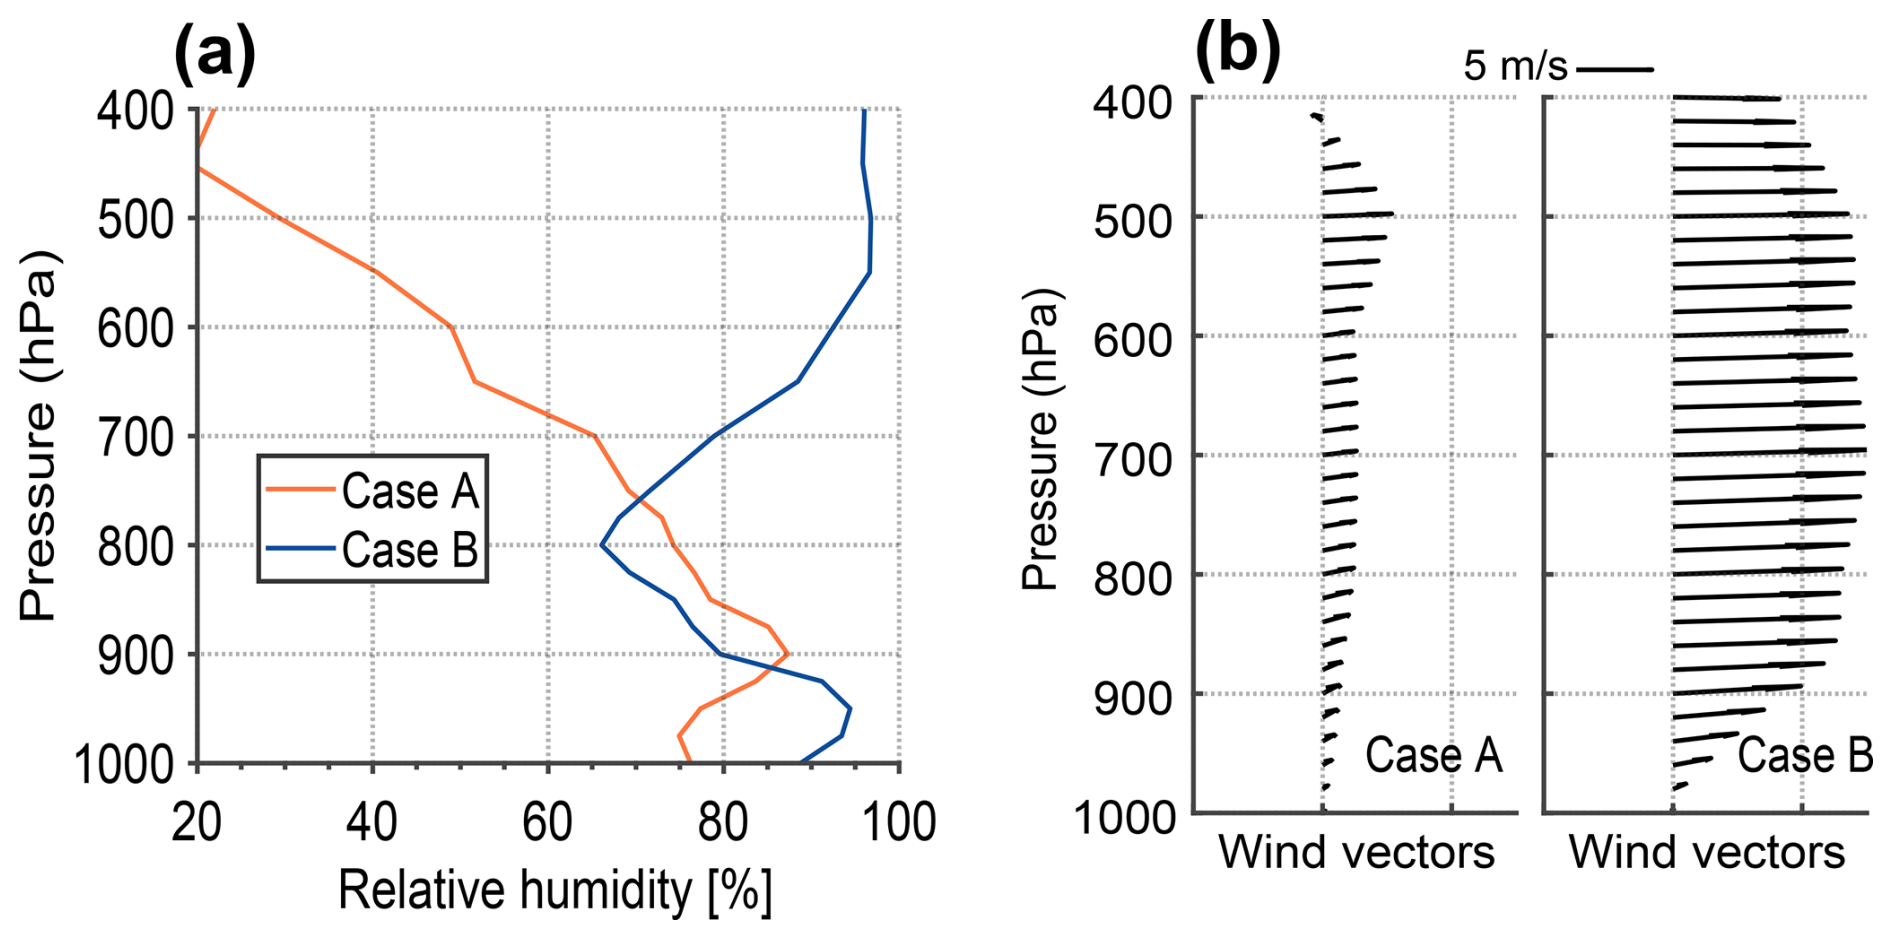
Figure 3The environmental characteristics of the two thunderstorms. The conditions of relative humidity and wind shear from the last hour before the occurrence of these two thunderstorms (case A occurred at 16:00 on 20 June 2016; case B occurred at 11:00 on 13 June 2016) were derived from hourly ERA5 reanalysis data. (a) Relative humidity; the orange line indicates case A, and the blue line indicates case B. (b) Vertical wind vectors; the left column represents case A, and the right column represents case B.
The evolutionary cycles of these two thunderstorms are derived from radar and lightning observations. Specifically, the evolution of the maximum ZH values for every height layer (a vertical resolution of 500 m over 0.5 to 20 km of a radar volume scan) is displayed in Fig. 4a and b; the evolutions of the echo-top height and the maximum ZH value in a radar volume scan are displayed in Fig. 4c and d; and the lightning frequency in a radar volumetric update time of 6 min is displayed in Fig. 4a and b. These two thunderstorms are deep convective clouds (Fig. 4a, b). We divided the evolution cycles of these two thunderstorms into three stages according to the lightning activity and echo intensity: initiation, lightning and collapse. For the initiation stage (Fig. 4c, d), the mean values of the echo-top heights (reflectivity thresholds: 30 and 40 dBz) in case B are clearly greater than those in case A; in addition, the average maximum ZH value in case B (48 dBz) is greater than that in case A (42 dBz). An echo-top height of 50 dBz occurs in case B but is absent in case A. These characteristics indicate that the convective strength is greater in case B during the initiation stage. This confirms the above suggestion provided by environmental characteristics.
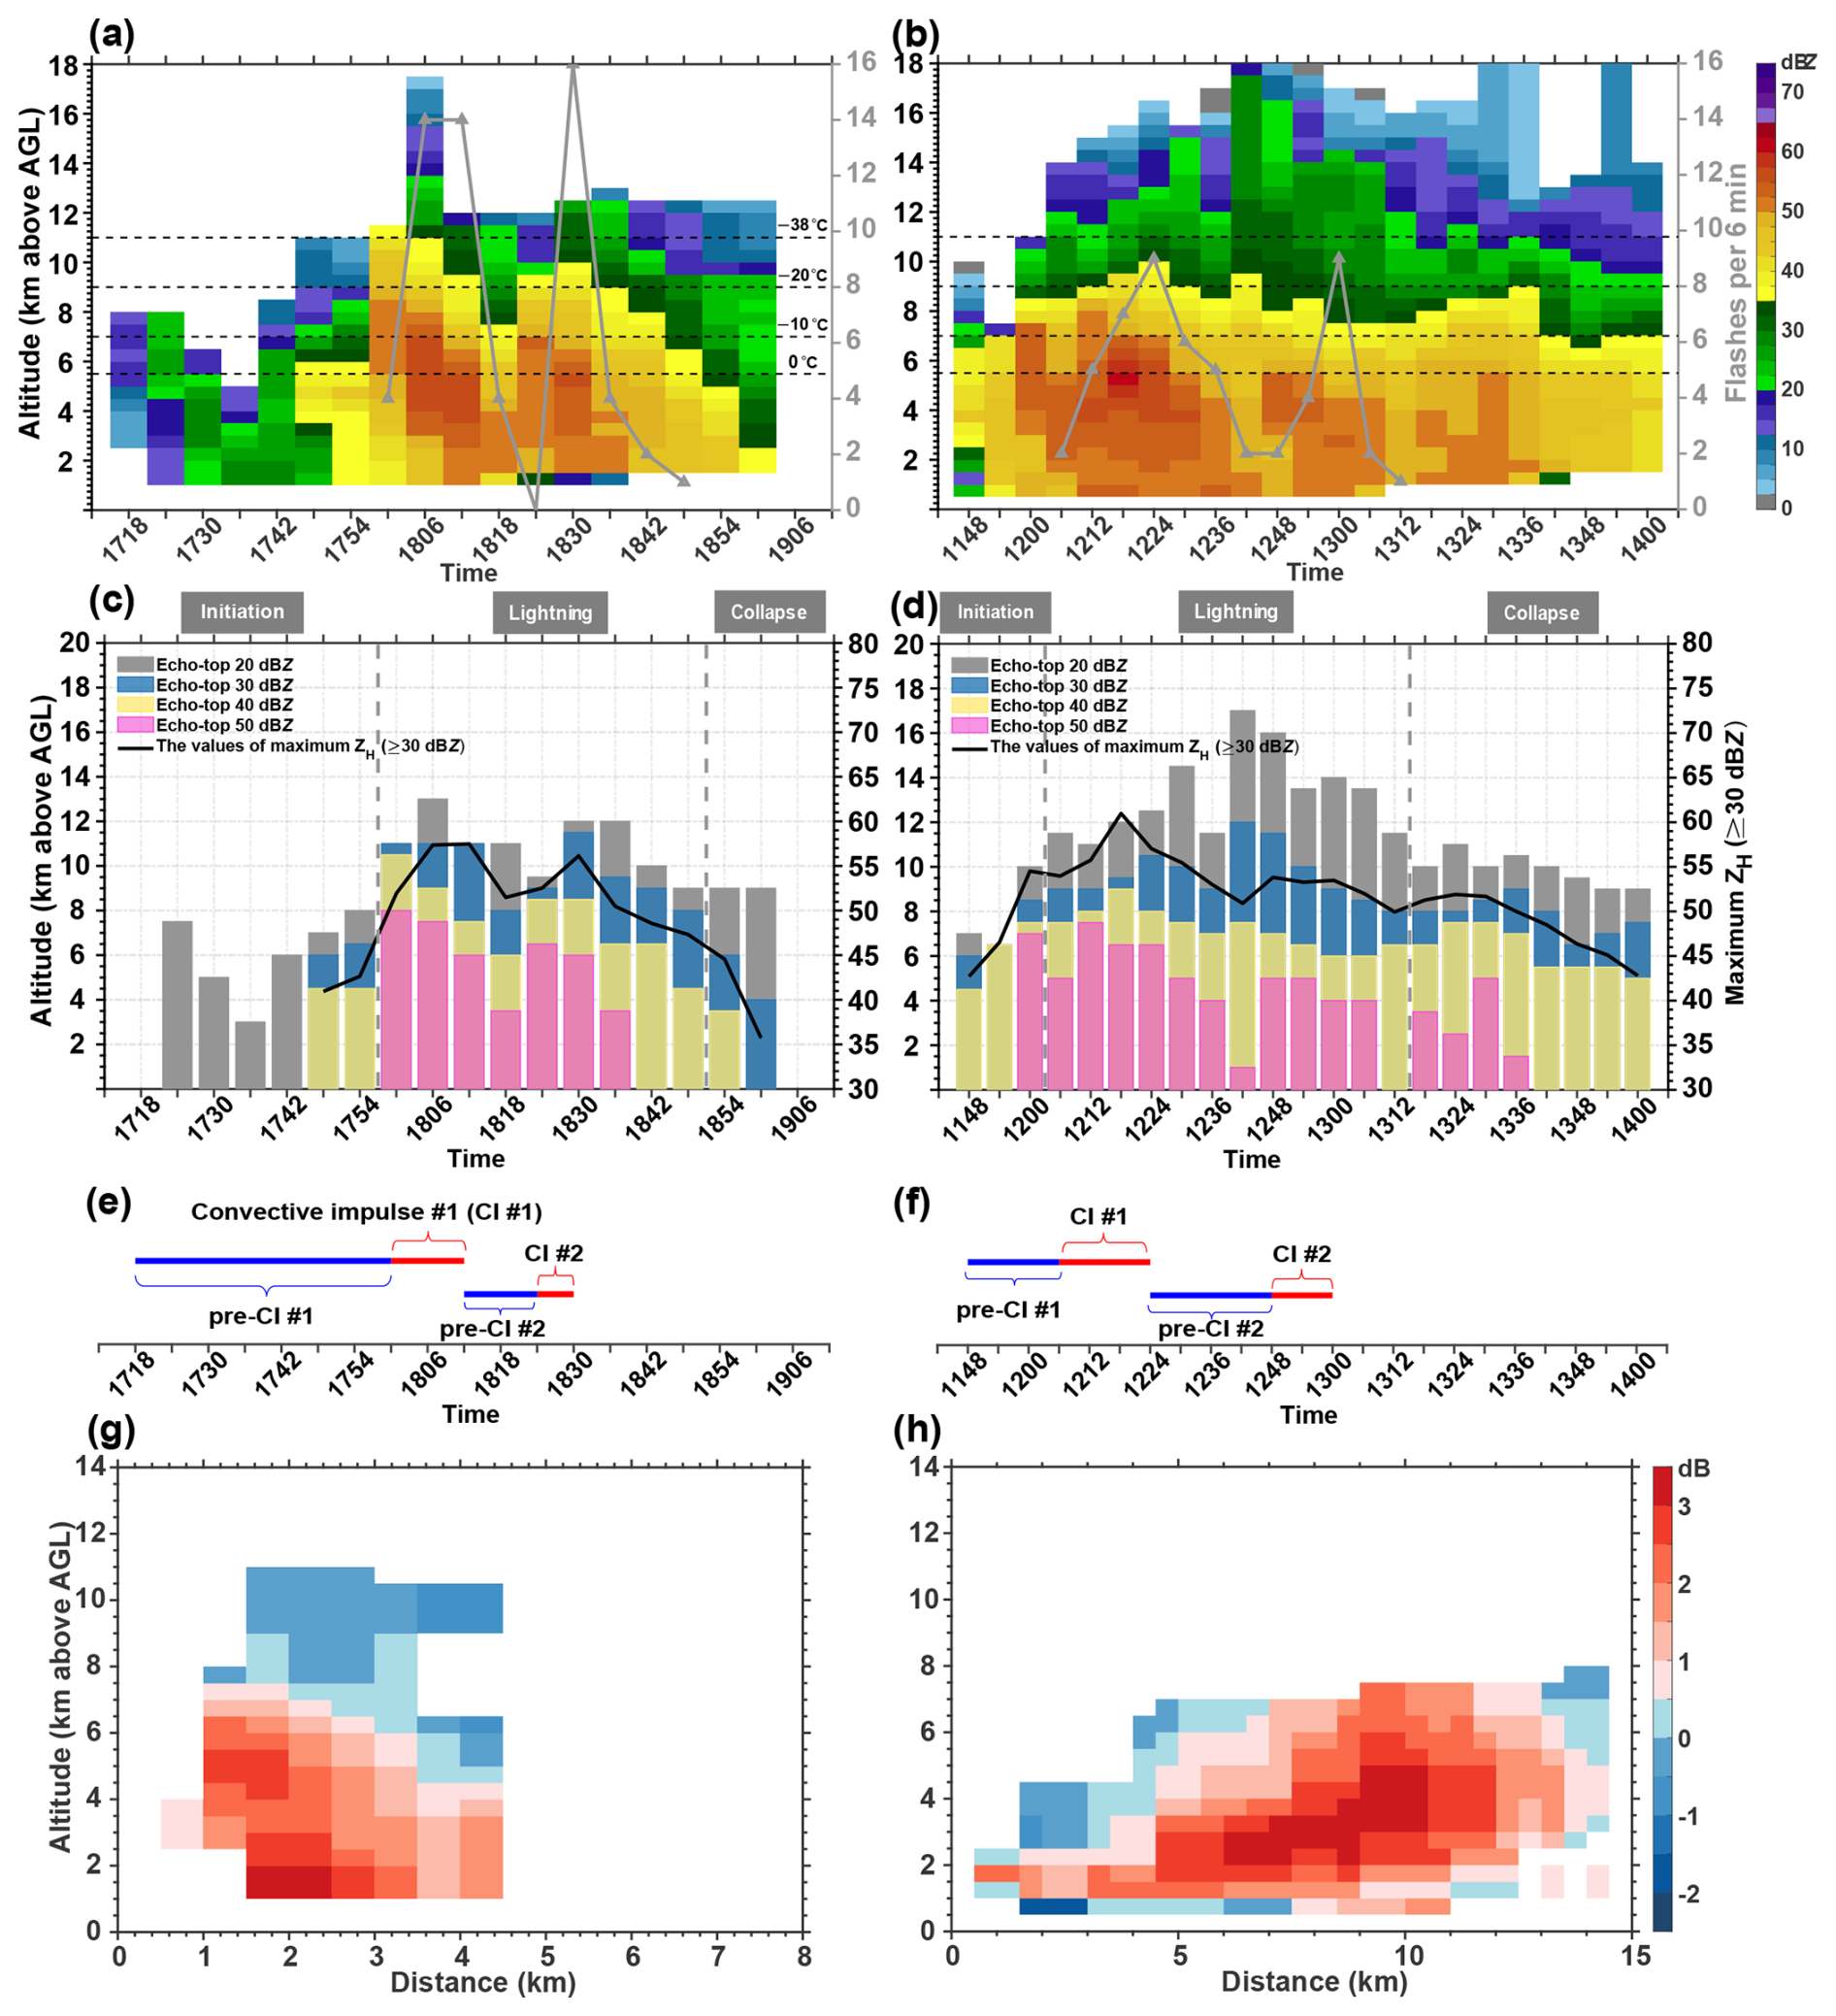
Figure 4Overview of two thunderstorms in their development. Panels (a) and (b) show the evolution of the maximum ZH values for every height layer (a vertical resolution of 500 m over 0.5 to 20 km of a radar volume scan), with cloud development. The left column indicates case A, and the right column indicates case B. The gray lines indicate the flash frequency for a radar volumetric update time of 6 min. The black dashed lines indicate the 0, −10, −20, and −38 °C isotherm heights. The echo-top heights of 20 (gray bars), 30 (blue bars), 40 (yellow bars), and 50 dBz (pink bars) in every radar volume scan with cloud development are shown in (c) case A and (d) case B, respectively. The black lines indicate the evolution of the maximum ZH values of a radar volume scan (neglecting values < 30 dBz). In addition, the gray dashed lines divide the evolutionary cycle of thunderstorms into three stages (i.e., initiation, lightning, and collapse). The durations of the convective impulse (CI) and pre-CI are shown; each case involves two CI events, and two pre-CI events are shown in (e) case A and (f) case B. The overlapping time between the pre-CI and CI indicates CI initiation, and vice versa. Vertical cross-sections of the radar differential reflectivity (ZDR) (g) at 17:54 in case A and (h) at 12:00 in case B.
While environmental characteristics and radar observations during the initiation stage suggest that the thunderstorm in case B is more intense, the convective intensity during the lightning stage is confusing between cases A and B (the average maximum ZH values are 53 and 54 dBz, respectively; the average echo-top heights of 30 and 40 dBz in case A are 0.1 ∼ 0.2 km greater than those in case B, and the average echo-top height of 50 dBz in case A is 1 km greater than that in case B). Moreover, the lightning frequency also has a higher peak value in case A than in case B. Finally, in case A, the thunderstorm rapidly collapsed, but in case B, it slowly dissipated. These characteristics indicate that the convective intensity of the thunderstorm rapidly changed.
3.2 Convective impulse events
The convective intensity indicated by the lightning frequency, echo-top height of 50 dBz, and maximum ZH value clearly displays short-term impulses (Fig. 4a, b, c, and d). We utilized the variation in the lightning frequency to define the duration times of the convective impulse (CI) and pre-CI. Specifically, the CI duration corresponds to the increasing phase of the lightning frequency. There are two CI events and two corresponding pre-CI events in each thunderstorm (Fig. 4e, f). The overlapping time between the pre-CI and CI indicates CI initiation, and vice versa.
In case A (Fig. 4e), the duration of the first CI event ranged from 18:00 to 18:12 (Beijing time), and that of the second CI event ranged from 18:24 to 18:30; the duration of the first pre-CI event ranged from 17:18 to 18:00, and that of the second pre-CI event ranged from 18:12 to 18:24. In case B (Fig. 4f), the duration of the first CI event ranged from 12:06 to 12:24, and that of the second CI event ranged from 12:48 to 13:00; the duration of the first pre-CI event ranged from 11:48 to 12:06, and that of the second pre-CI event ranged from 12:24 to 12:48. The CI event essentially corresponds to the convective enhancement revealed by the lightning activity, echo-top height and maximum ZH. Thus, to study how cloud microphysics modulate convective intensity, we focus on cloud microphysics during the corresponding pre-CI event.
3.3 Cloud microphysics in the first pre-CI
Latent heat release can be regarded as the energy source for increasing buoyancy (Rosenfeld et al., 2008; Varble et al., 2023), but some debates still exist (e.g., Grabowski and Morrison, 2020). More specifically, observational studies indicate that the nucleation process from abundant supercooled liquid water to graupel is closely related to lightning (Bringi et al., 1997; Carey and Rutledge, 2000; Smith et al., 1999). Graupel is rimed ice precipitation. The “coalescence–freezing” mechanism is often regarded as the most important pathway to the first graupel/hail formation, the first significant electrification and the first lightning flash in warm-based clouds (Beard, 1992; Braham, 1986; Bringi et al., 1997; Carey and Rutledge, 2000; Herzegh and Jameson, 1992; Mattos et al., 2017; Smith et al., 1999; Stolzenburg et al., 2015). This mechanism depends on the development of rain drops in warm rain collision–coalescence processes, followed by lofting of the rain drop in the updraft to areas of subfreezing temperatures (which are frequently observed by polarimetric radar, called ZDR column), followed by drop freezing and finally the formation of graupel or small hail.
The logarithmic total water content in cases A and B during the first pre-CI period are shown in Fig. 5a and b. The logarithmic total ice contents in cases A and B during the first pre-CI period are shown in Fig. 5c and d. When the first CI initiates at 18:00 (case A) or 12:06 (case B), graupel sharply occurs, and the contents of warm-phase rainwater and supercooled rainwater reach peak values. The graupel content in case A (107.7 kg) is clearly greater than that in case B (106.1 kg). However, in case B, more liquid water accumulates in less time (corresponding to more favorable moisture and CAPE). In addition, the amount of supercooled rainwater clearly increases beginning at 17:48 in case A, which is approximately 103 times greater than that at 17:42.
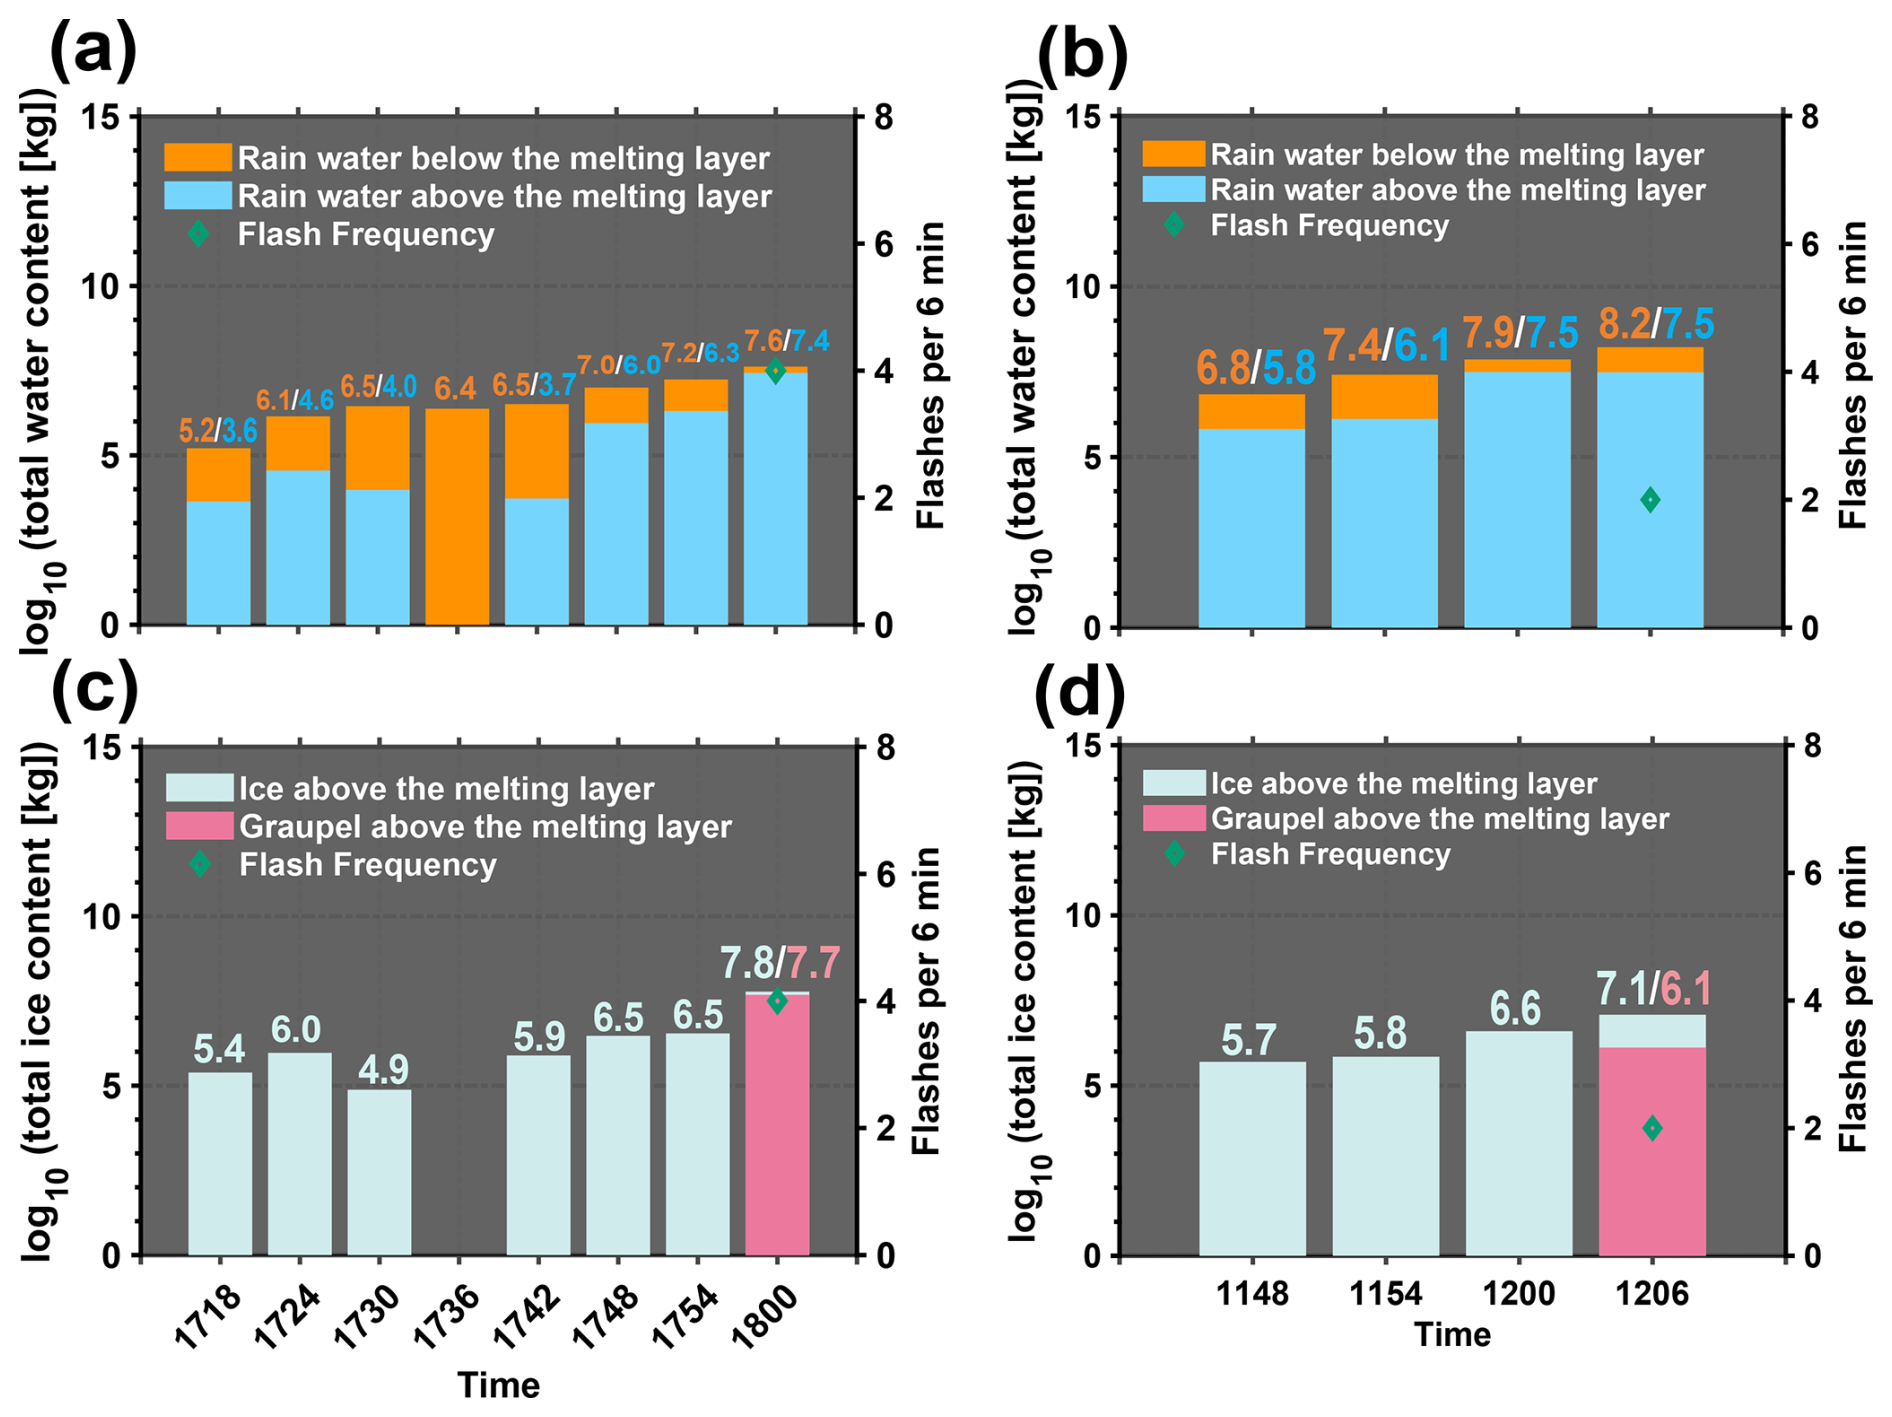
Figure 5Liquid and ice water content in the first pre-CI and comparisons between these thunderstorms. The bar plots display the logarithmic total water content and the logarithmic total ice content in case A (a, c) and case B (b, d). The orange (blue) bars indicate the rainwater content below (above) the melting layer. The cyan and pink bars indicate the contents of ice and graupel above the melting layer, respectively. The numerical values in different colors correspond to the total contents of different hydrometeors (unit, kg). The green diamond indicates the flash frequency.
3.3.1 The microphysical characteristics of ice in the first pre-CI
The latent heat released from supercooled liquid water that freezes and/or rimes into graupel is likely the kinematic source corresponding to the first CI event. From the perspective of the supercooled water content, more abundant supercooled rainwater is present in case B during the last three moments, which seems to suggest that if the number concentrations of graupel embryos in the two cases are similar, the accreted graupel content from the riming process in case A should not be greater than that in case B during short-term variation (the duration of graupel content variation does not exceed 6 min). However, the content is related to both the particle size and the number concentration. We retrieve the content from the echo intensity corresponding to the radar sample volume, and the determination of the nature of the radar sample volume depends mainly on the large particles (e.g., graupel). Thus, if there are more graupel particles distributed in more space, a greater sample volume of graupel in the radar corresponds to a greater graupel content.
The number concentration (log10Nt, L−1) of ice particles (≤ 30 dBz) when the first CI initiates at 18:00 (case A) or 12:06 (case B) is shown in Fig. 6a. Ice particles are potential sources of graupel embryos (Bringi et al., 1997; Carey and Rutledge, 2000). Moreover, the radar sample volume of the graupel particles clearly corresponds to a larger volume in case A (Fig. 6b). Thus, the observational characteristics support the above hypothesis; namely, the number concentration of graupel particles in case A is greater than that in case B, resulting in a clearly greater graupel content derived from radar in case A.
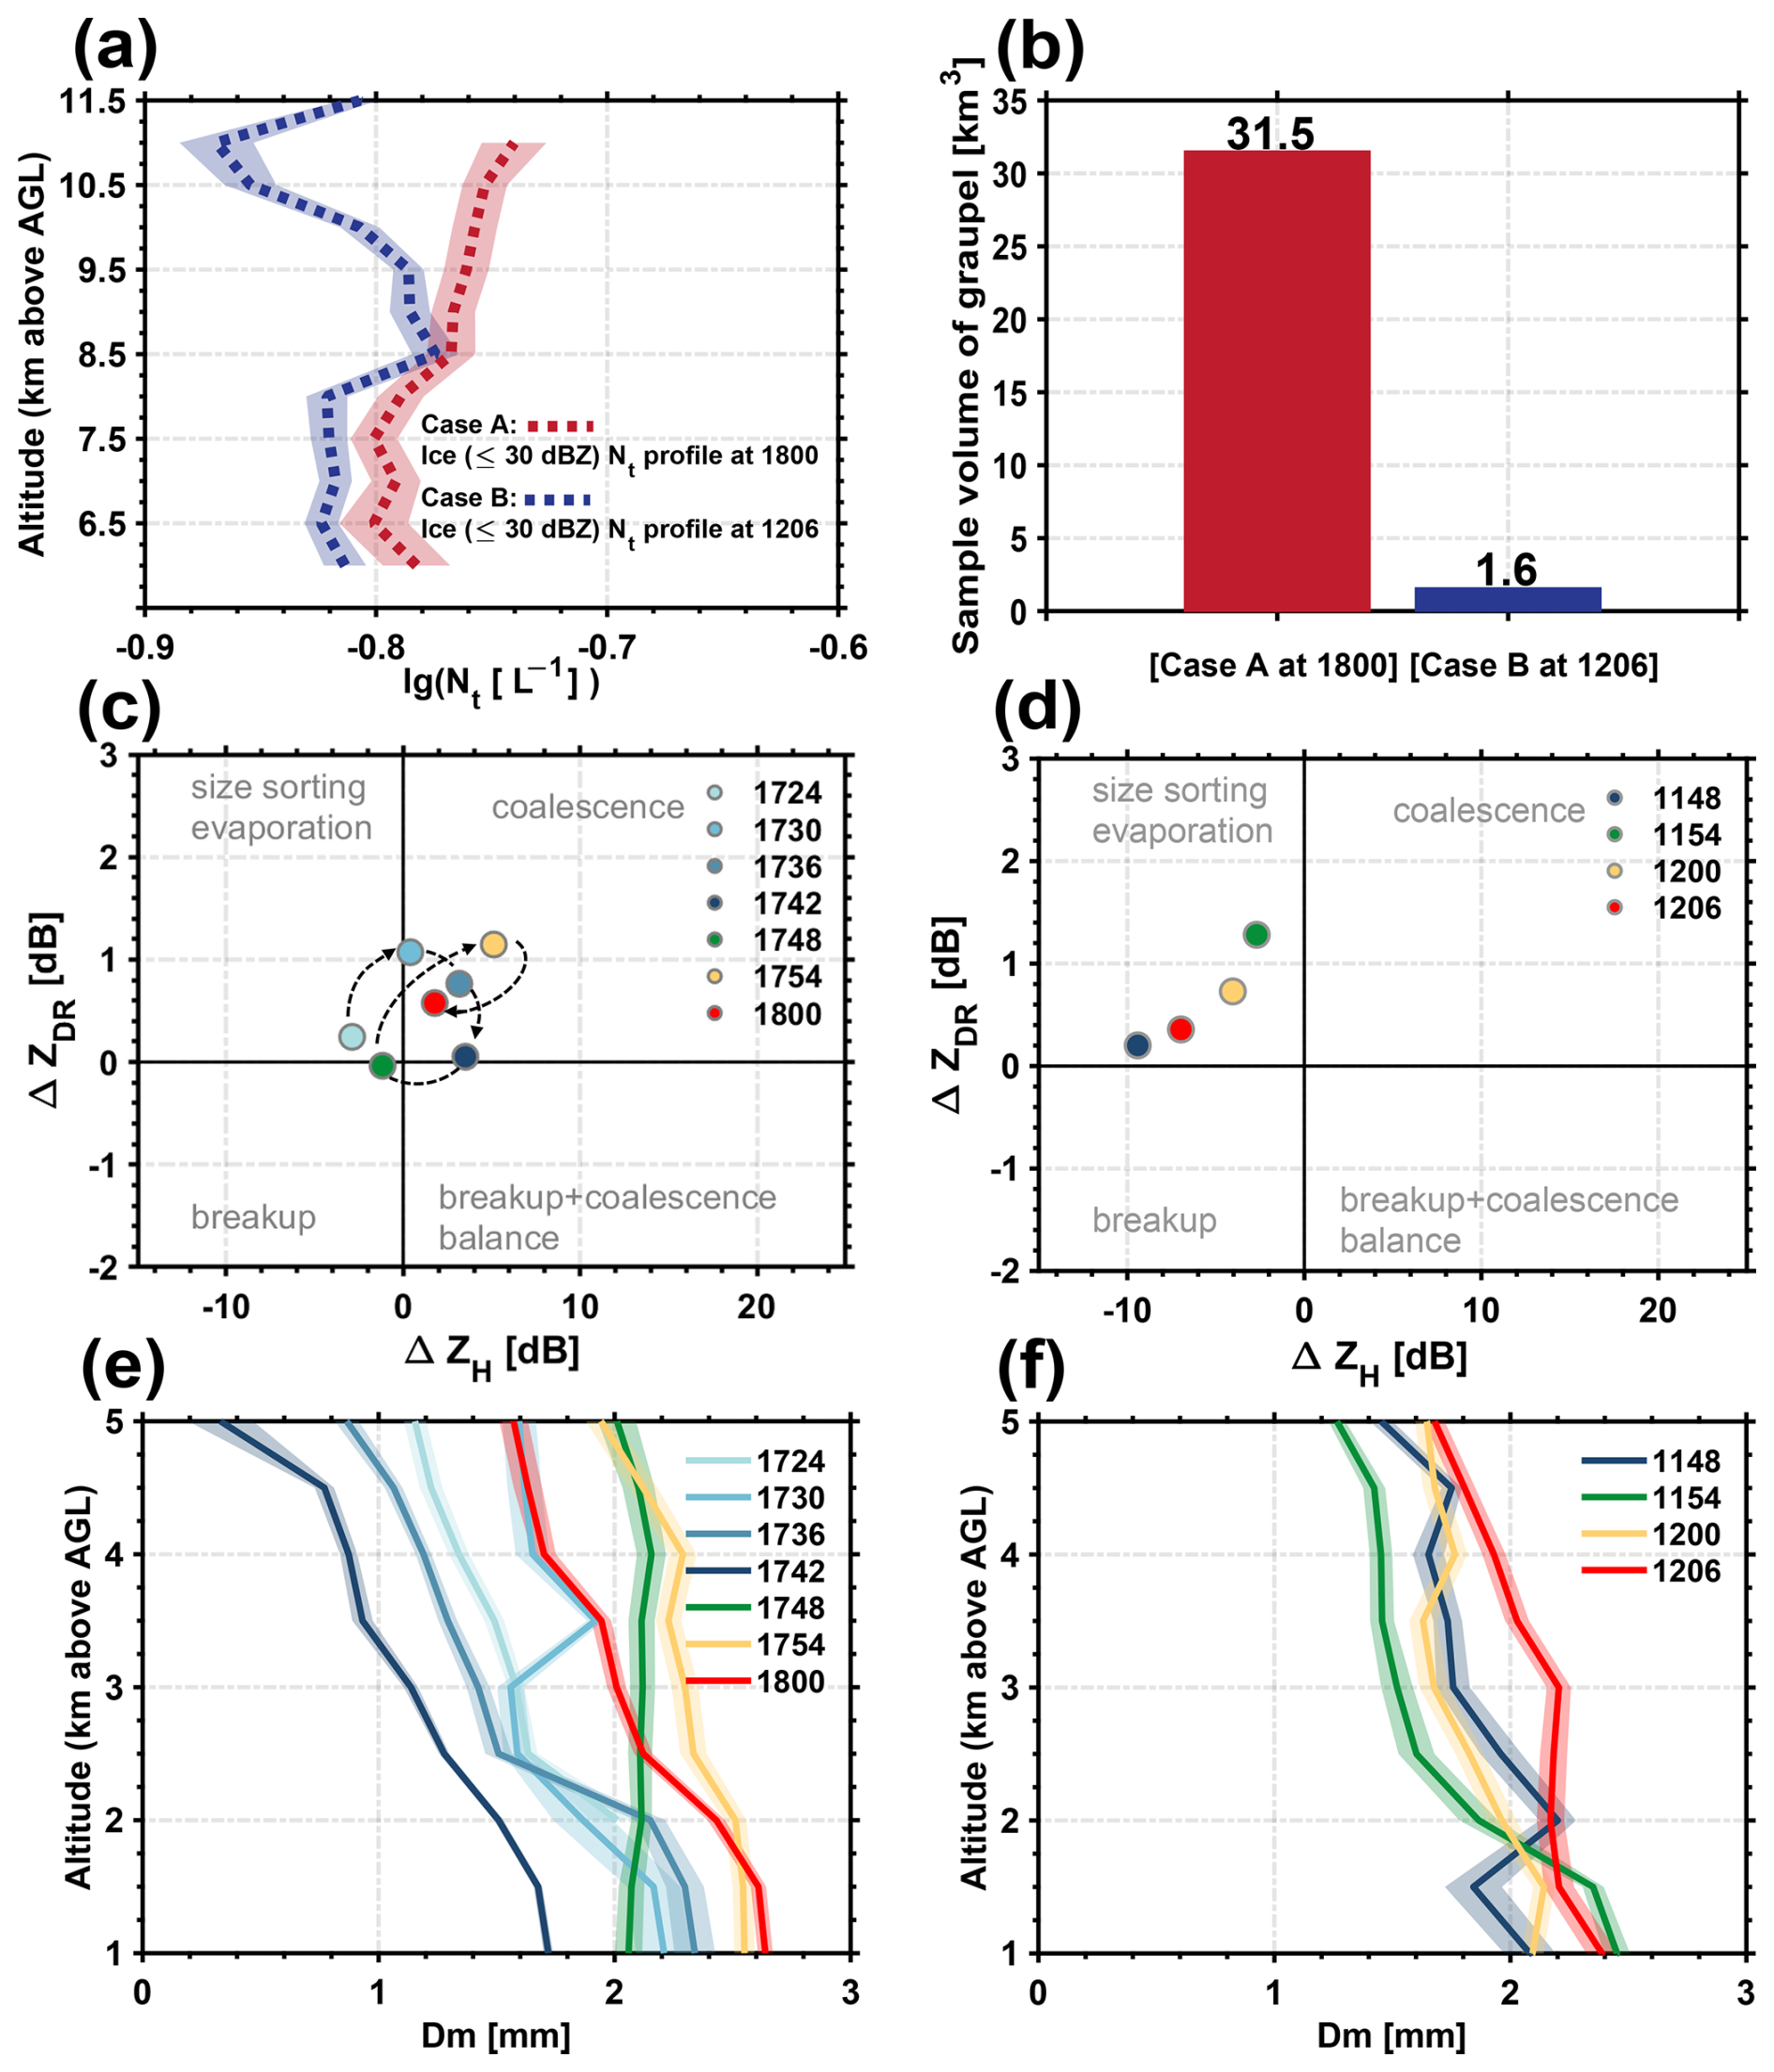
Figure 6Cloud microphysics in the first pre-CI and comparisons between these thunderstorms. (a) The number concentration (log10Nt, L−1) of ice (≤ 30 dBz) particles when CI initiates. The red and blue dashed lines indicate cases A and B, respectively. (b) The radar sample volume of graupel corresponding to the beginning of the CI (unit, km3). The red bar indicates case A, and the blue bar indicates case B. The change in ZDR vs. the change in ZH over an approximate 3 km rain shaft and the microphysical processes represented by each quadrant or “fingerprint” are annotated: (c) case A and (d) case B. Each colored dot indicates the changed ZDR and ZH values over an approximate 3 km rain shaft from one radar volume scan at different times. The retrieved mass-weighted mean drop diameter (Dm) is shown in (e) (case A) and (f) (case B), the lines indicate the mean values and the shaded area indicates the 95 % confidence interval.
A greater number concentration of graupel depends on the increasing number concentration of graupel embryos. However, why are there more graupel embryos? Ice crystals and supercooled raindrops are the main sources of graupel embryos (Bringi et al., 1997; Carey and Rutledge, 2000). While the mechanism through which secondary ice production occurs increases the number concentration of ice crystals, the total time for a 10 µm ice crystal to develop into a 1 mm graupel particle is approximately 10–30 min in vigorous convective clouds, with early growth dominated by diffusion processes and later rapid growth dominated by riming (Pruppacher and Klett, 1997; Rogers and Yau, 1989; Vongpaseut and Barthe, 2025). Thus, although rapid growth may occur under favourable conditions, the conversion of newly generated micrometre-sized secondary ice crystals into millimetre-sized graupel particles within a few minutes (∼ 6 min) is difficult to explain solely by diffusion growth and riming processes. In light of the previous hypothesis and observations, we suggest that the raindrops freeze into graupel particles may dominate the graupel formation during the initial phase of warm-based thunderstorms. The phase transition can be completed in a few minutes. Therefore, increasing the number concentration of supercooled raindrop-sized particles can increase the number concentration of graupel within 6 min.
3.3.2 How do supercooled raindrops increase in the first pre-CI?
Naturally, we seek to determine how the number of supercooled raindrops increases during the first pre-CI. The polarimetric “fingerprint” of warm-rain processes is quantified in Fig. 6c, d. Each colored dot indicates the changed ZDR and ZH values over an approximate 3 km rain shaft from one radar volume scan at different times. Warm-rain processes clearly differ between cases A and B. In case B (Fig. 6d), raindrops continuously undergo size sorting or evaporating processes; the stronger CAPE (4076 J kg−1) and low-level wind shear account for this difference (Carey and Buffalo, 2007; Fuchs et al., 2018; Stough et al., 2021; Williams et al., 2005). Not only does the ERA5 reanalysis data indicate greater low-level wind shear in case B than in case A (Fig. 3b), but the positive ZDR column from the cloud base to the mixed-phase layer in case B is also more tilted than that in case A (Fig. 4g, h).
In case A (Fig. 6c, e), the raindrops undergo size sorting or evaporation first, and then, the liquid drops are more likely to experience cyclic growth by coalescence under upright airflows and/or possibly weaker updrafts (smaller CAPE, 2669 J kg−1) (Kumjian et al., 2014; Mather et al., 1986; Stough et al., 2021); thus, these raindrops coalesce at two subsequent moments, and large raindrops form (exceeding 2 mm). However, aerodynamic deformation causes these raindrops to break into many raindrops at 17:42 and/or 17:48, after which these raindrops can be easily lofted and/or participate in the coalescence process (i.e., 17:54 and 18:00). The breakup of raindrops at 17:42 and/or 17:48 accounts for the sharply increasing amount of supercooled rainwater, which is noted above in Fig. 5a, b.
Therefore, compared with case B, the relatively weaker environmental low-level wind shear and CAPE in case A may influence the storm dynamics and microphysical processes, which could indirectly favour raindrop breakup (e.g., Morrison et al., 2012), and more raindrops are lofted to areas of subfreezing temperatures and freeze into graupel with higher number concentrations but fewer riming processes. We call this underlying mechanism “breakup–freezing”, which is a hypothesis and is likely an important way to clarify the formation of thunderstorms with relatively weak CAPE (i.e., 2669 J kg−1 of case A in this study) and weak wind shear. In contrast, the stronger the environmental low-level wind shear and CAPE are, the more likely it is that more droplets are lifted to areas of subfreezing temperatures and feed less graupel but moderately or heavily riming; this mechanism is similar to those of previous hypotheses (Carey and Buffalo, 2007; Fuchs et al., 2018; Stough et al., 2021). Naturally, we focus on the following question: after the first CI event (i.e., when convective clouds have developed into maturity and produced lightning or precipitation), does the “breakup–freezing” mechanism dominate the subsequent CI events, especially for thunderstorms that are near stationary (i.e., when surface sensible heating is suppressed by rainfall and radiation heating of the surface is weakened by thunderclouds)?
3.4 Why do subsequent CI events occur?
The logarithmic total water and ice contents and the lightning frequency in cases A and B during the second pre-CI event are displayed in Fig. 7a, b, c and d. In general, the contents of liquid water and ice decrease first with decreasing lightning frequency, indicating that the convection intensity is weakening and that rainfall is occurring. However, when the second CI initiates at 18:24 in case A, the supercooled raindrop content increases (Fig. 7a), whereas the graupel content does not increase at 18:24 (Fig. 7c); it obviously increases to 107.3 kg at the next radar volume scan (18:30). Similarly, the supercooled raindrop content and graupel content increase when the second CI initiates at 12:48 in case B (Fig. 7b, d).
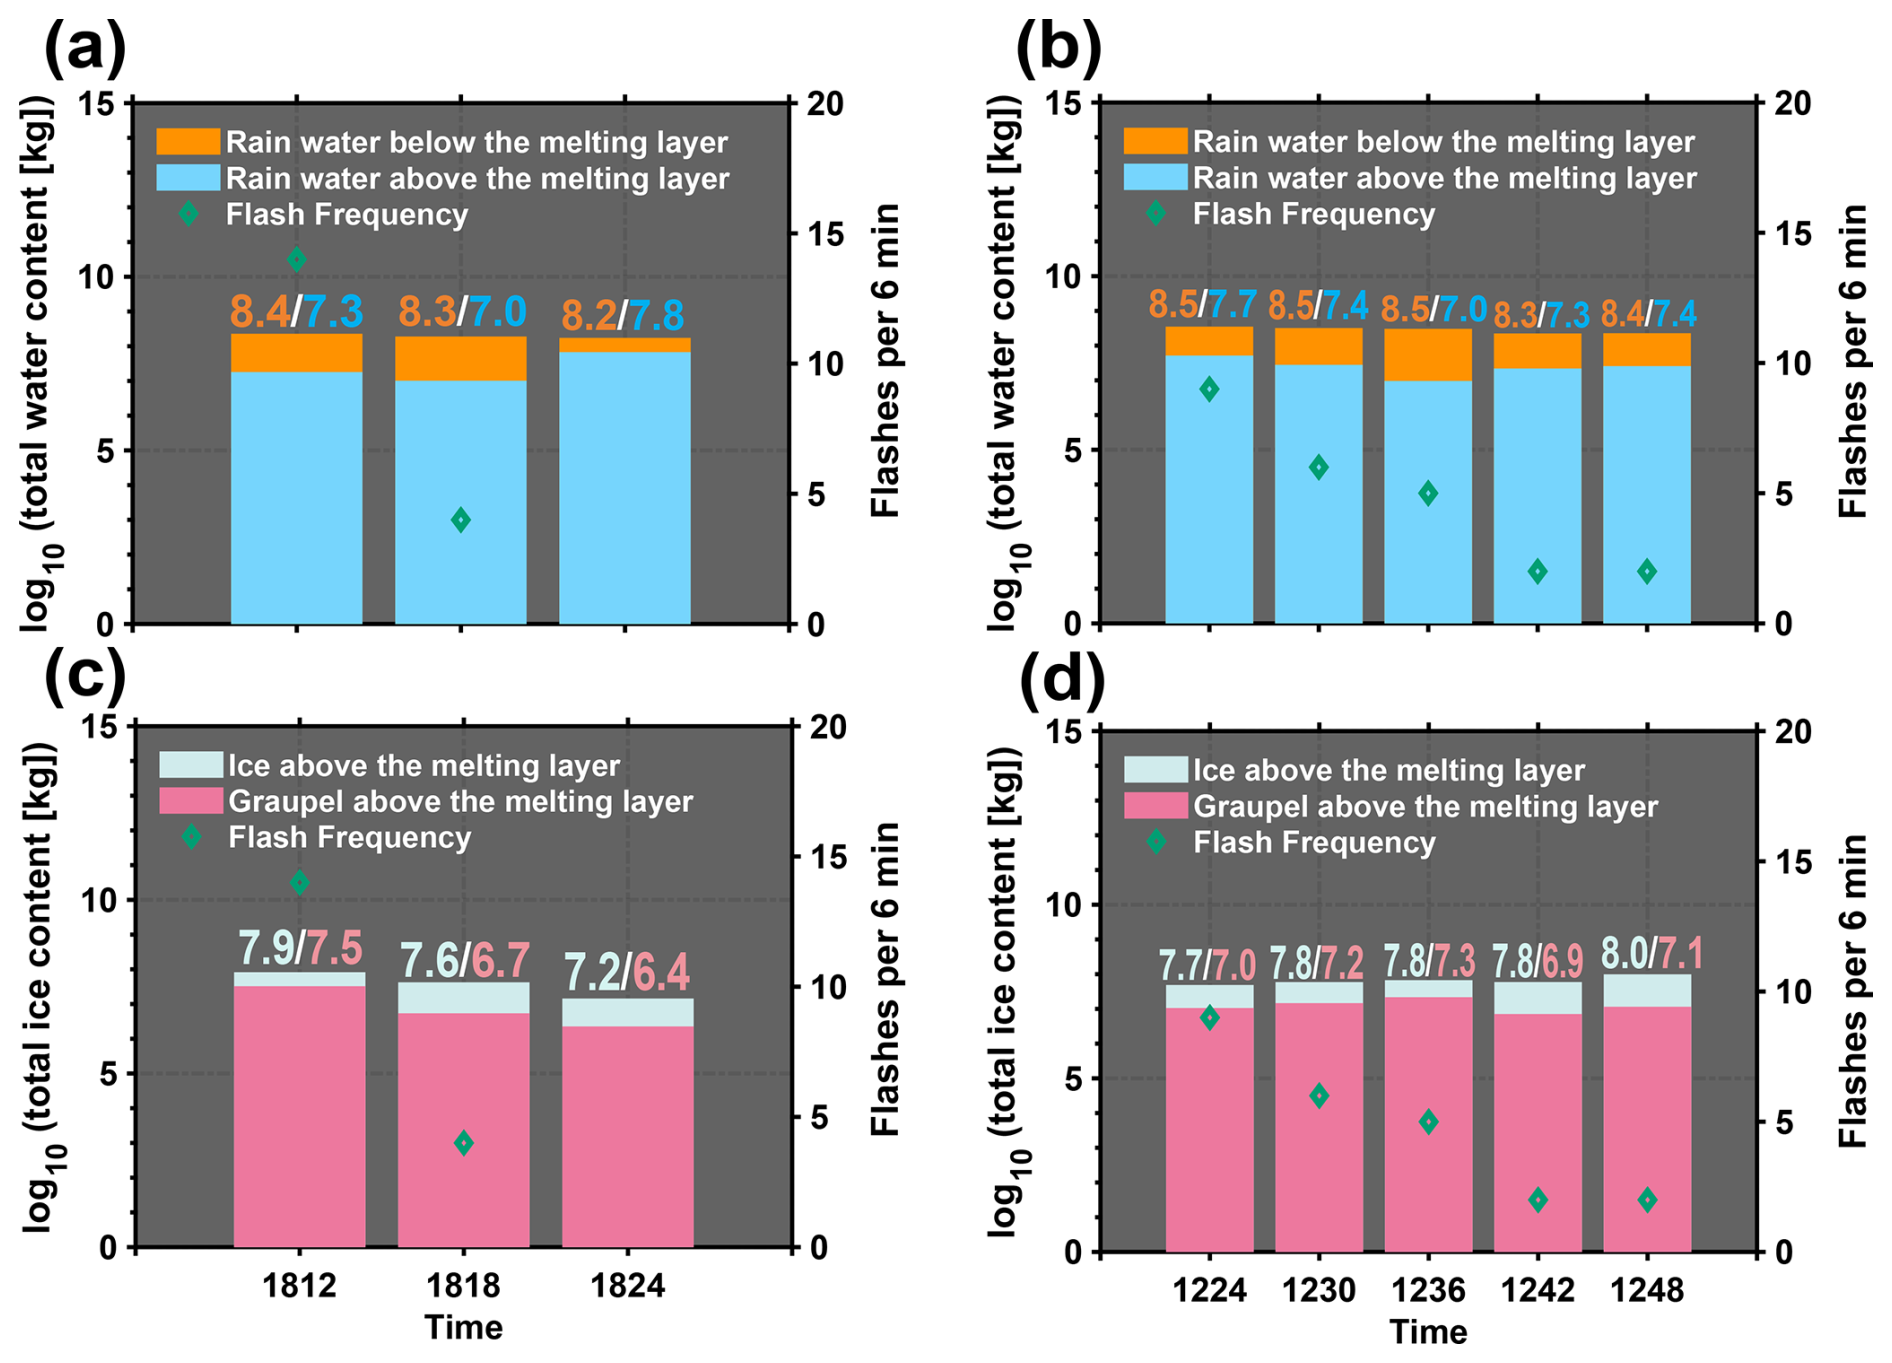
Figure 7Liquid and ice water content during the second pre-CI period. The left column indicates that case A occurred on 20 June 2016. The right column indicates that case B occurred on 13 June 2016. (a, b) Bar plots for the logarithmic total water content. The orange (blue) bars indicate the rainwater content below (above) the melting layer. (c, d) Barplots for the logarithmic total ice content. The cyan and pink bars indicate the contents of ice and graupel above the melting layer, respectively. The numerical values in different colors correspond to the total contents of different hydrometeors (unit, kg). The green diamond indicates the flash frequency.
The frequency of the ZH values (> 35 dBz) in every height layer (a vertical resolution of 500 m over 0.5 to 20 km of a radar volume scan) is shown in Fig. 8a and b, the height of the ZH values (> 35 dBz) tends to decrease during the second pre-CI period, and the height is lower than the 0 °C isotherm height. These characteristics indicate that the graupel particles fall into the warm-phase layer and melt, which can lead to the formation of large raindrops by melting and/or small raindrops by shedding in a short time (Rasmussen and Heymsfield, 1987a, b, c; Wisner et al., 1972). The melting and shedding behavior of graupel is significantly affected by its initial size (Rasmussen and Heymsfield, 1987b). Smaller graupel particles preferentially melt faster than large particles do (Rasmussen and Heymsfield, 1987b). The shedding of graupel can be an important source of new raindrops (Wisner et al., 1972); the rate of shedding depends on the graupel size, and larger graupel produces more shedding (Rasmussen and Heymsfield, 1987b). These findings indicate that the behaviors of melting and shedding with respect to graupel size are inversely related.
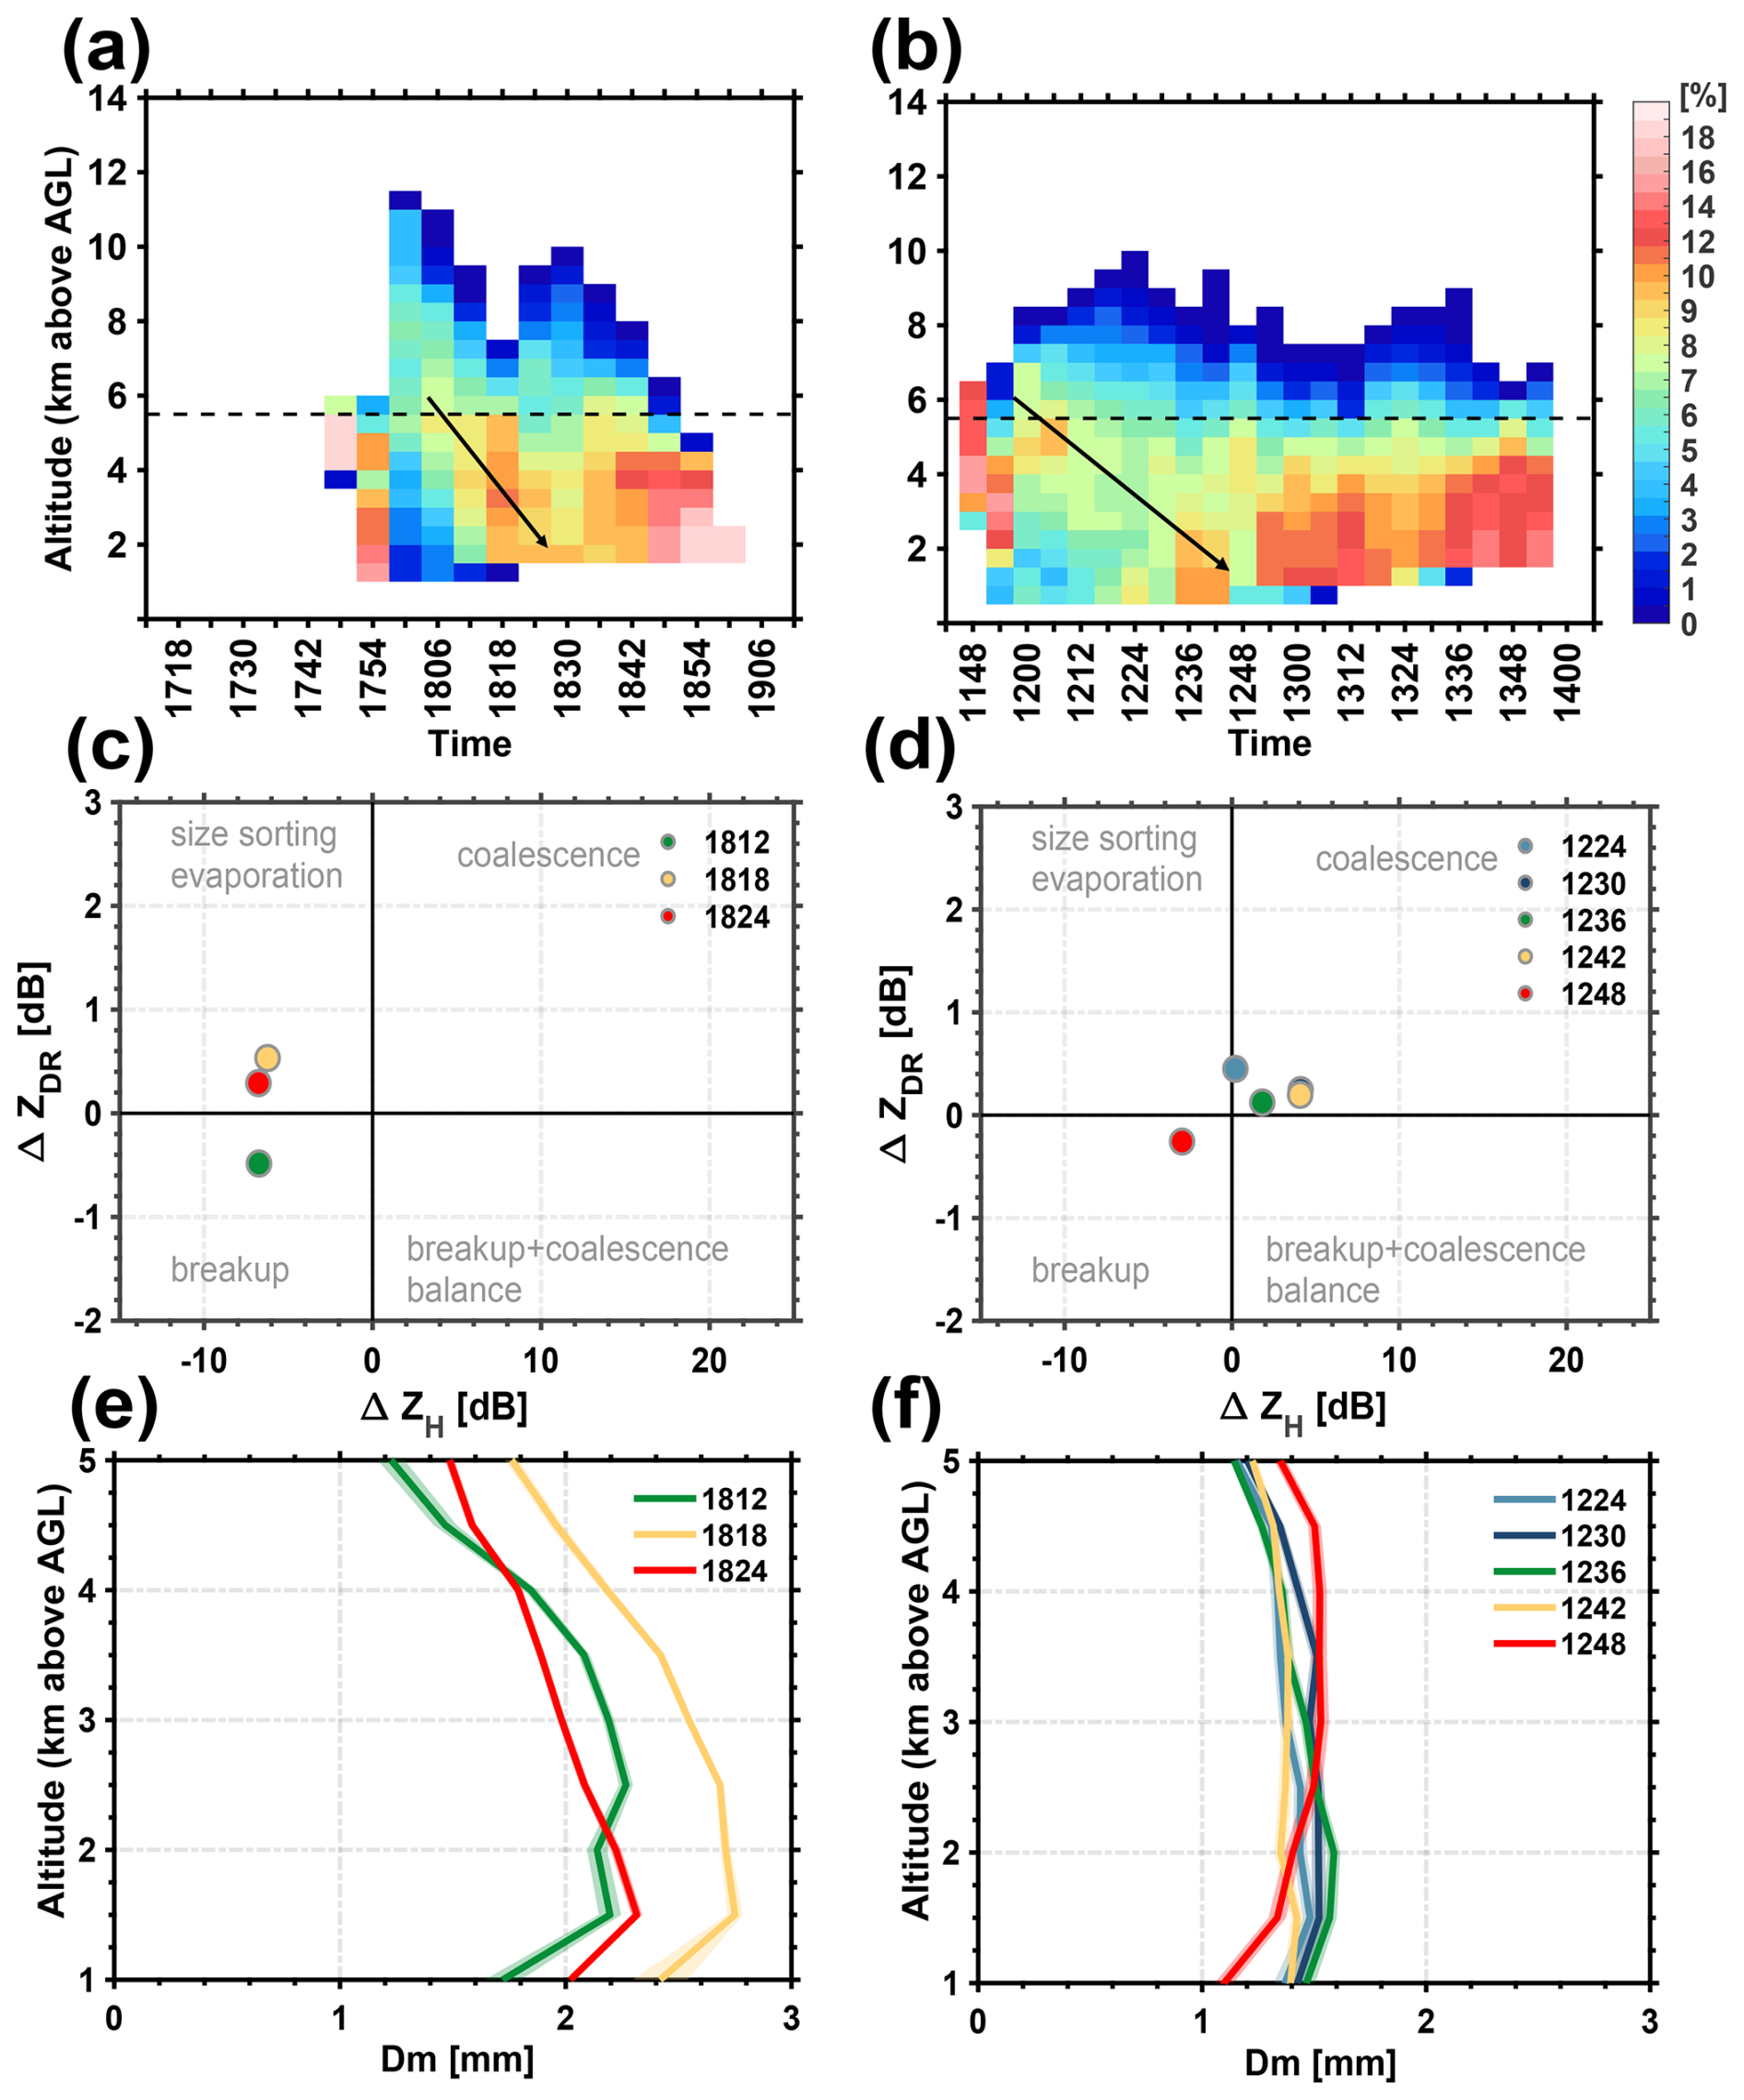
Figure 8Cloud microphysics during the second pre-CI period. The left column indicates that case A occurred on 20 June 2016. The right column indicates that case B occurred on 13 June 2016. (a, b) The frequency in every height layer (a vertical resolution of 500 m over 0.5 to 20 km of a radar volume scan) of ZH> 35 dBz, and the black arrows indicate the approximate direction of movement of high-frequency areas with cloud development during the second pre-CI period. The dashed black line indicates the 0 °C isotherm height. The change in ZDR vs. the change in ZH over an approximately 3 km rain shaft and the microphysical processes represented by each quadrant or “fingerprint” are annotated: (c) case A and (d) case B. Each colored dot indicates the changed values of ZDR and ZH over an approximately 3 km rain shaft from one radar volume scan at different times. The retrieved mass-weighted mean drop diameter (Dm) is shown in (e) (case A) and (f) (case B), the lines indicate the mean values and the shaded area indicates the 95 % confidence interval.
The data in Fig. 8c and d show that raindrop breakup occurred during the second pre-CI period; however, the occurrence time in case A differed from that in case B. Specifically, the occurrence time of raindrop breakup in case A was earlier than that in case B. The coalescence process was absent in case A, but raindrop breakup occurred, corresponding to graupel melting. This suggests that the large raindrops that break may have formed by the complete melting of smaller graupel in a shorter time. In addition, the coalescence process occurred before raindrop breakup in case B, and the small raindrops involved in the coalescence process may have resulted from shedding (Wisner et al., 1972; Rasmussen and Heymsfield, 1987a). This opinion is validated via retrieved raindrops Dm (Fig. 8e, f). In case B, the graupel size would be larger than that in case A (larger maximum ZH values and a lower concentration of graupel in case B (Figs. 4 and 6a, b)). Thus, the larger graupel in case B preferentially produces small raindrops from shedding when the particles fall below the 0 °C isotherm height; the rate of melting is lower than that in case A.
On the basis of the above characteristics and analysis, we suggest that the smaller graupel in case A easily melted into large raindrops (>2 mm, Fig. 8e) in a shorter time, after which the upright airflow promoted raindrop breakup. The precipitation loading, melting, evaporation and upright behavior of the storm affected the updraft intensity, resulting in a delay of broken raindrops from the warm phase lifting to areas of subfreezing temperatures. The larger graupel in case B preferentially produces small raindrops from shedding (< 2 mm, Fig. 8f) in tilted downdrafts, and small raindrops may undergo coalescence to form large raindrops in tilted downdrafts (these large raindrops may reduce the evaporation rate (Pruppacher and Klett, 1997)), followed by breaking into many raindrops and reentering into low-level updrafts. Finally, the stronger updrafts at a low level in case B (likely resulting from moving and organizing air flow, and less consumption by evaporation) lifts raindrops to subfreezing temperatures in a shorter time than those in case A do.
Therefore, abundant raindrops produced by raindrop breakup and lifting to subfreezing temperatures account for the increased supercooled rainwater and graupel contents and the latent heat released to increase the convective intensity within clouds. Notably, while the “breakup–freezing” mechanism likely provided the kinematic source for the second CI, the methods of producing large raindrops to break differed between the second pre-CI period and the first pre-CI period. Moreover, the loading, melting and evaporation of precipitation likely reduced the net kinematic intensity for the second CI, resulting in the echo-top heights gradually decreasing during such CI events (Fig. 4a, b, c, d).
3.5 Physical basis for the “breakup–freezing” hypothesis in model simulations
To support our hypothesis, a sensitivity experiment is conducted with the WRF model. In the first experiment, raindrop breakup is considered, namely, RB; in the second experiment, raindrop breakup parameterization is closed, namely, noRB. The WRF output information reveals that the thunderstorm begins to develop at the 27th minute. At this stage, the echo top is below the −30 °C isotherm height, and updrafts dominate the vertical air flux (Fig. 9a, c). After 95 min of simulation, the thunderstorm reaches its mature stage, with the echo top extending to approximately 14 km (Fig. 9b, d). The rear stratiform region and downdrafts become evident, indicating the mature convective structure of thunderstorms. Notably, the maximum updraft exceeded 50 m s−1 at approximately 95 min, likely resulting from the combined effects of enhanced buoyancy associated with latent heat release and storm-scale dynamic forcing.
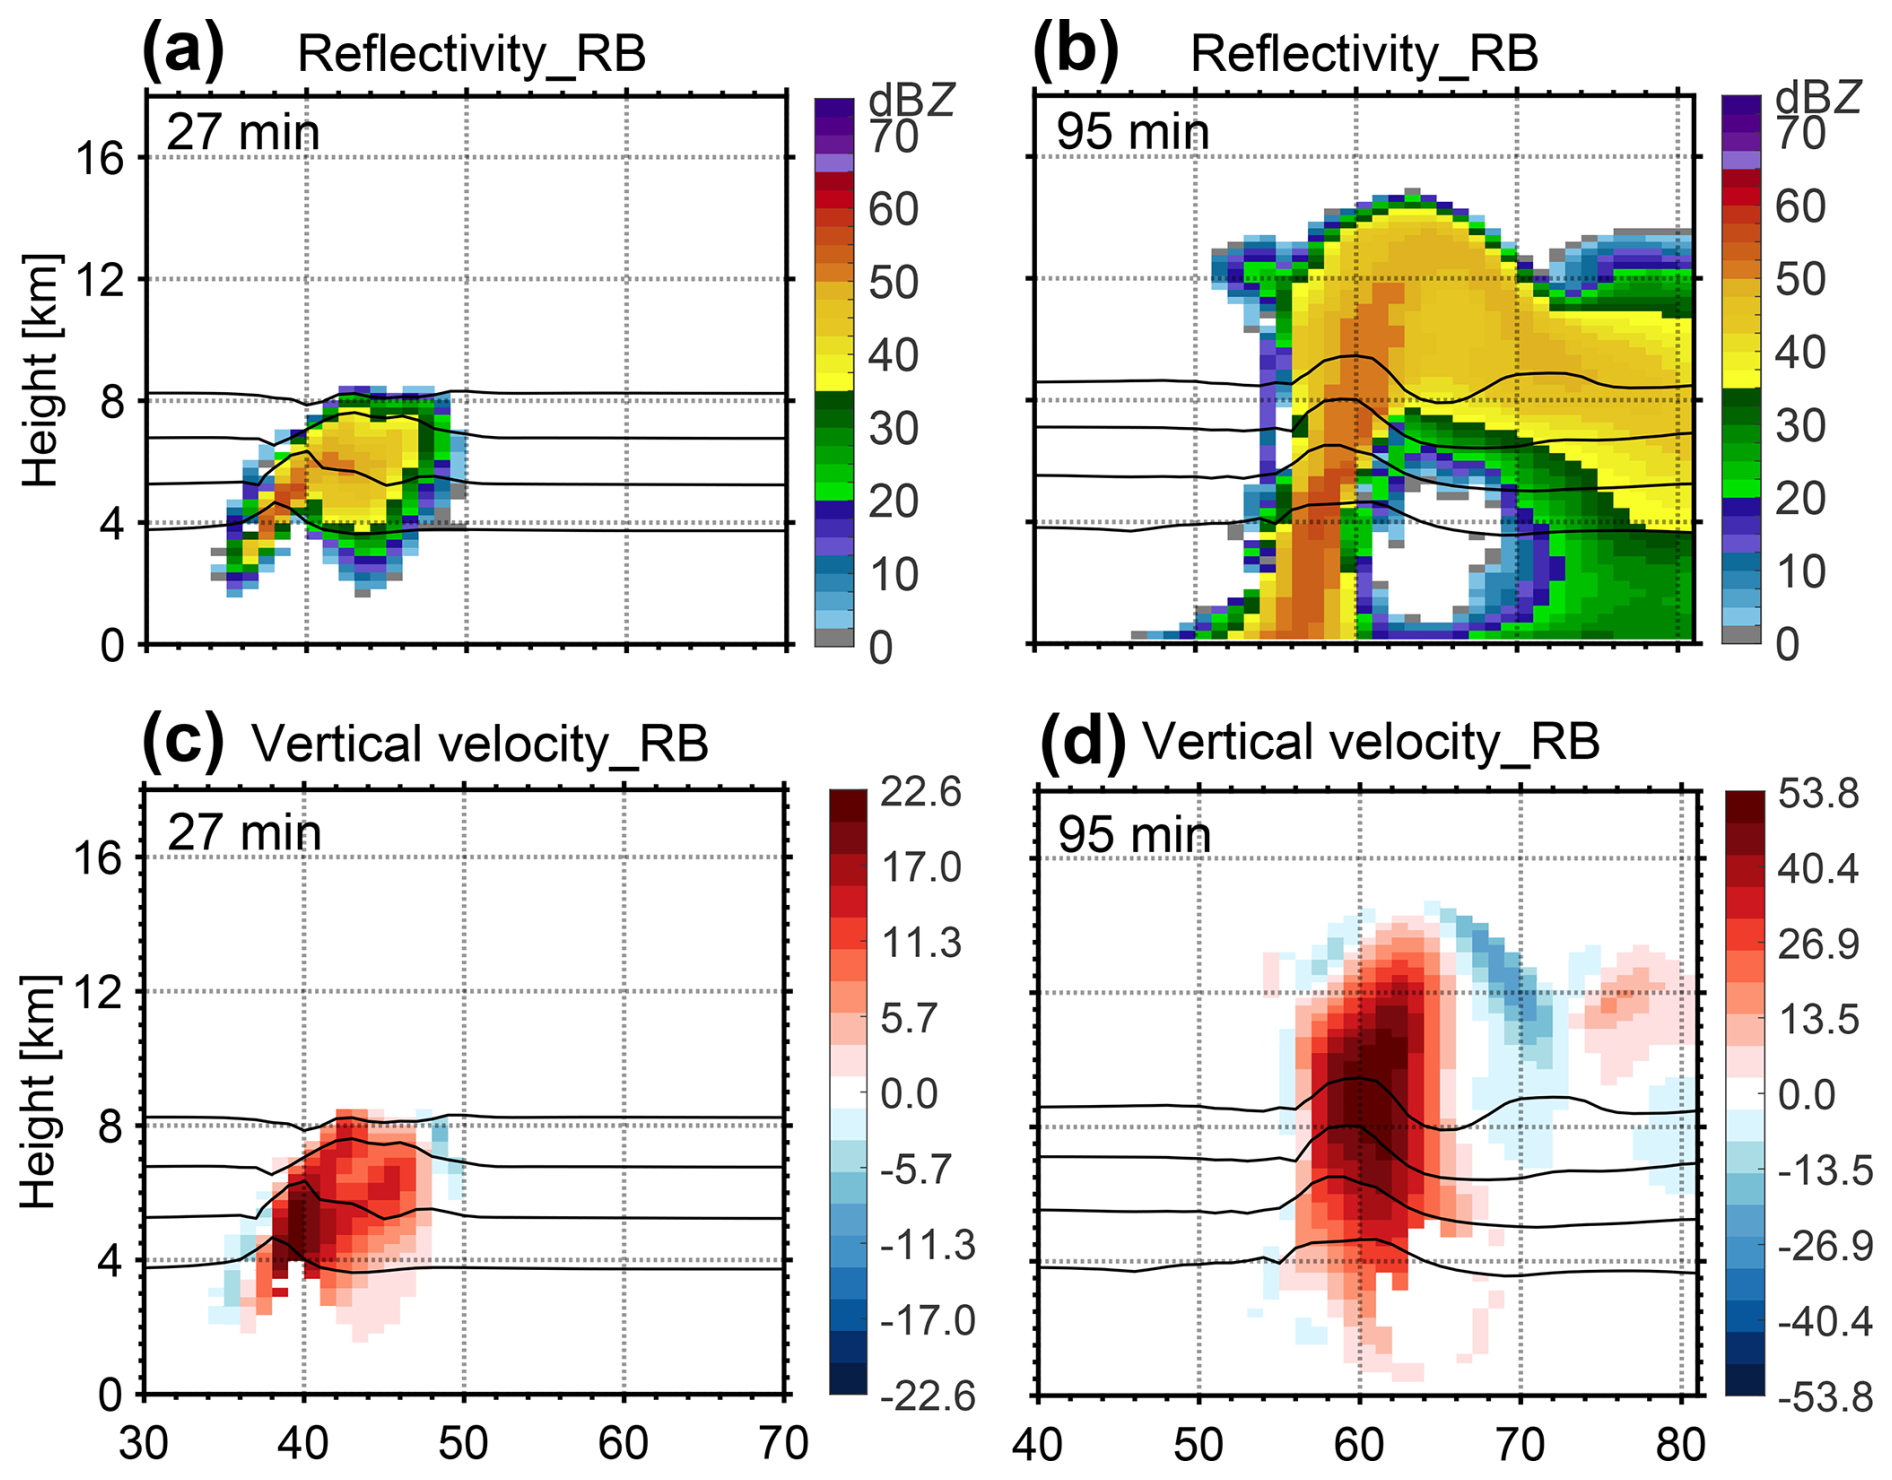
Figure 9Output of the first experiment in the WRF model. The reflectivity and vertical velocity (unit, m s−1) of the first experiment at the 27th minute (a, c). The reflectivity and vertical velocity of the first experiment at the 95th minute (b, d). The black lines indicate the 0, −10, −20, and −30 °C isotherm heights.
The differences in the rain concentrations, graupel concentrations, and vertical velocities between the RB and noRB experiments are shown in Fig. 10. The modelled convection developed at 27 min, and compared with the noRB experiment, the RB experiment exhibited greater raindrop concentrations above the melting layer (Fig. 10a1). At approximately the same location, the RB experiment also revealed increased graupel concentrations and stronger updrafts, while the increase in updraft velocity was relatively small, on the order of 10−2 m s−1 (Fig. 10b1, c1). Similarly, higher raindrop concentrations, graupel concentrations, and stronger updrafts were shown in the RB experiment when the thunderstorm reached its mature stage (Fig. 10a2, b2, and c2). Notably, the regions with enhanced raindrop and graupel concentrations were not completely collocated at 95 min, and the increase in updraft velocity was on the order of 100 m s−1. Thus, the “breakup–freezing” mechanism has a physical basis for explaining the formation of CI events.
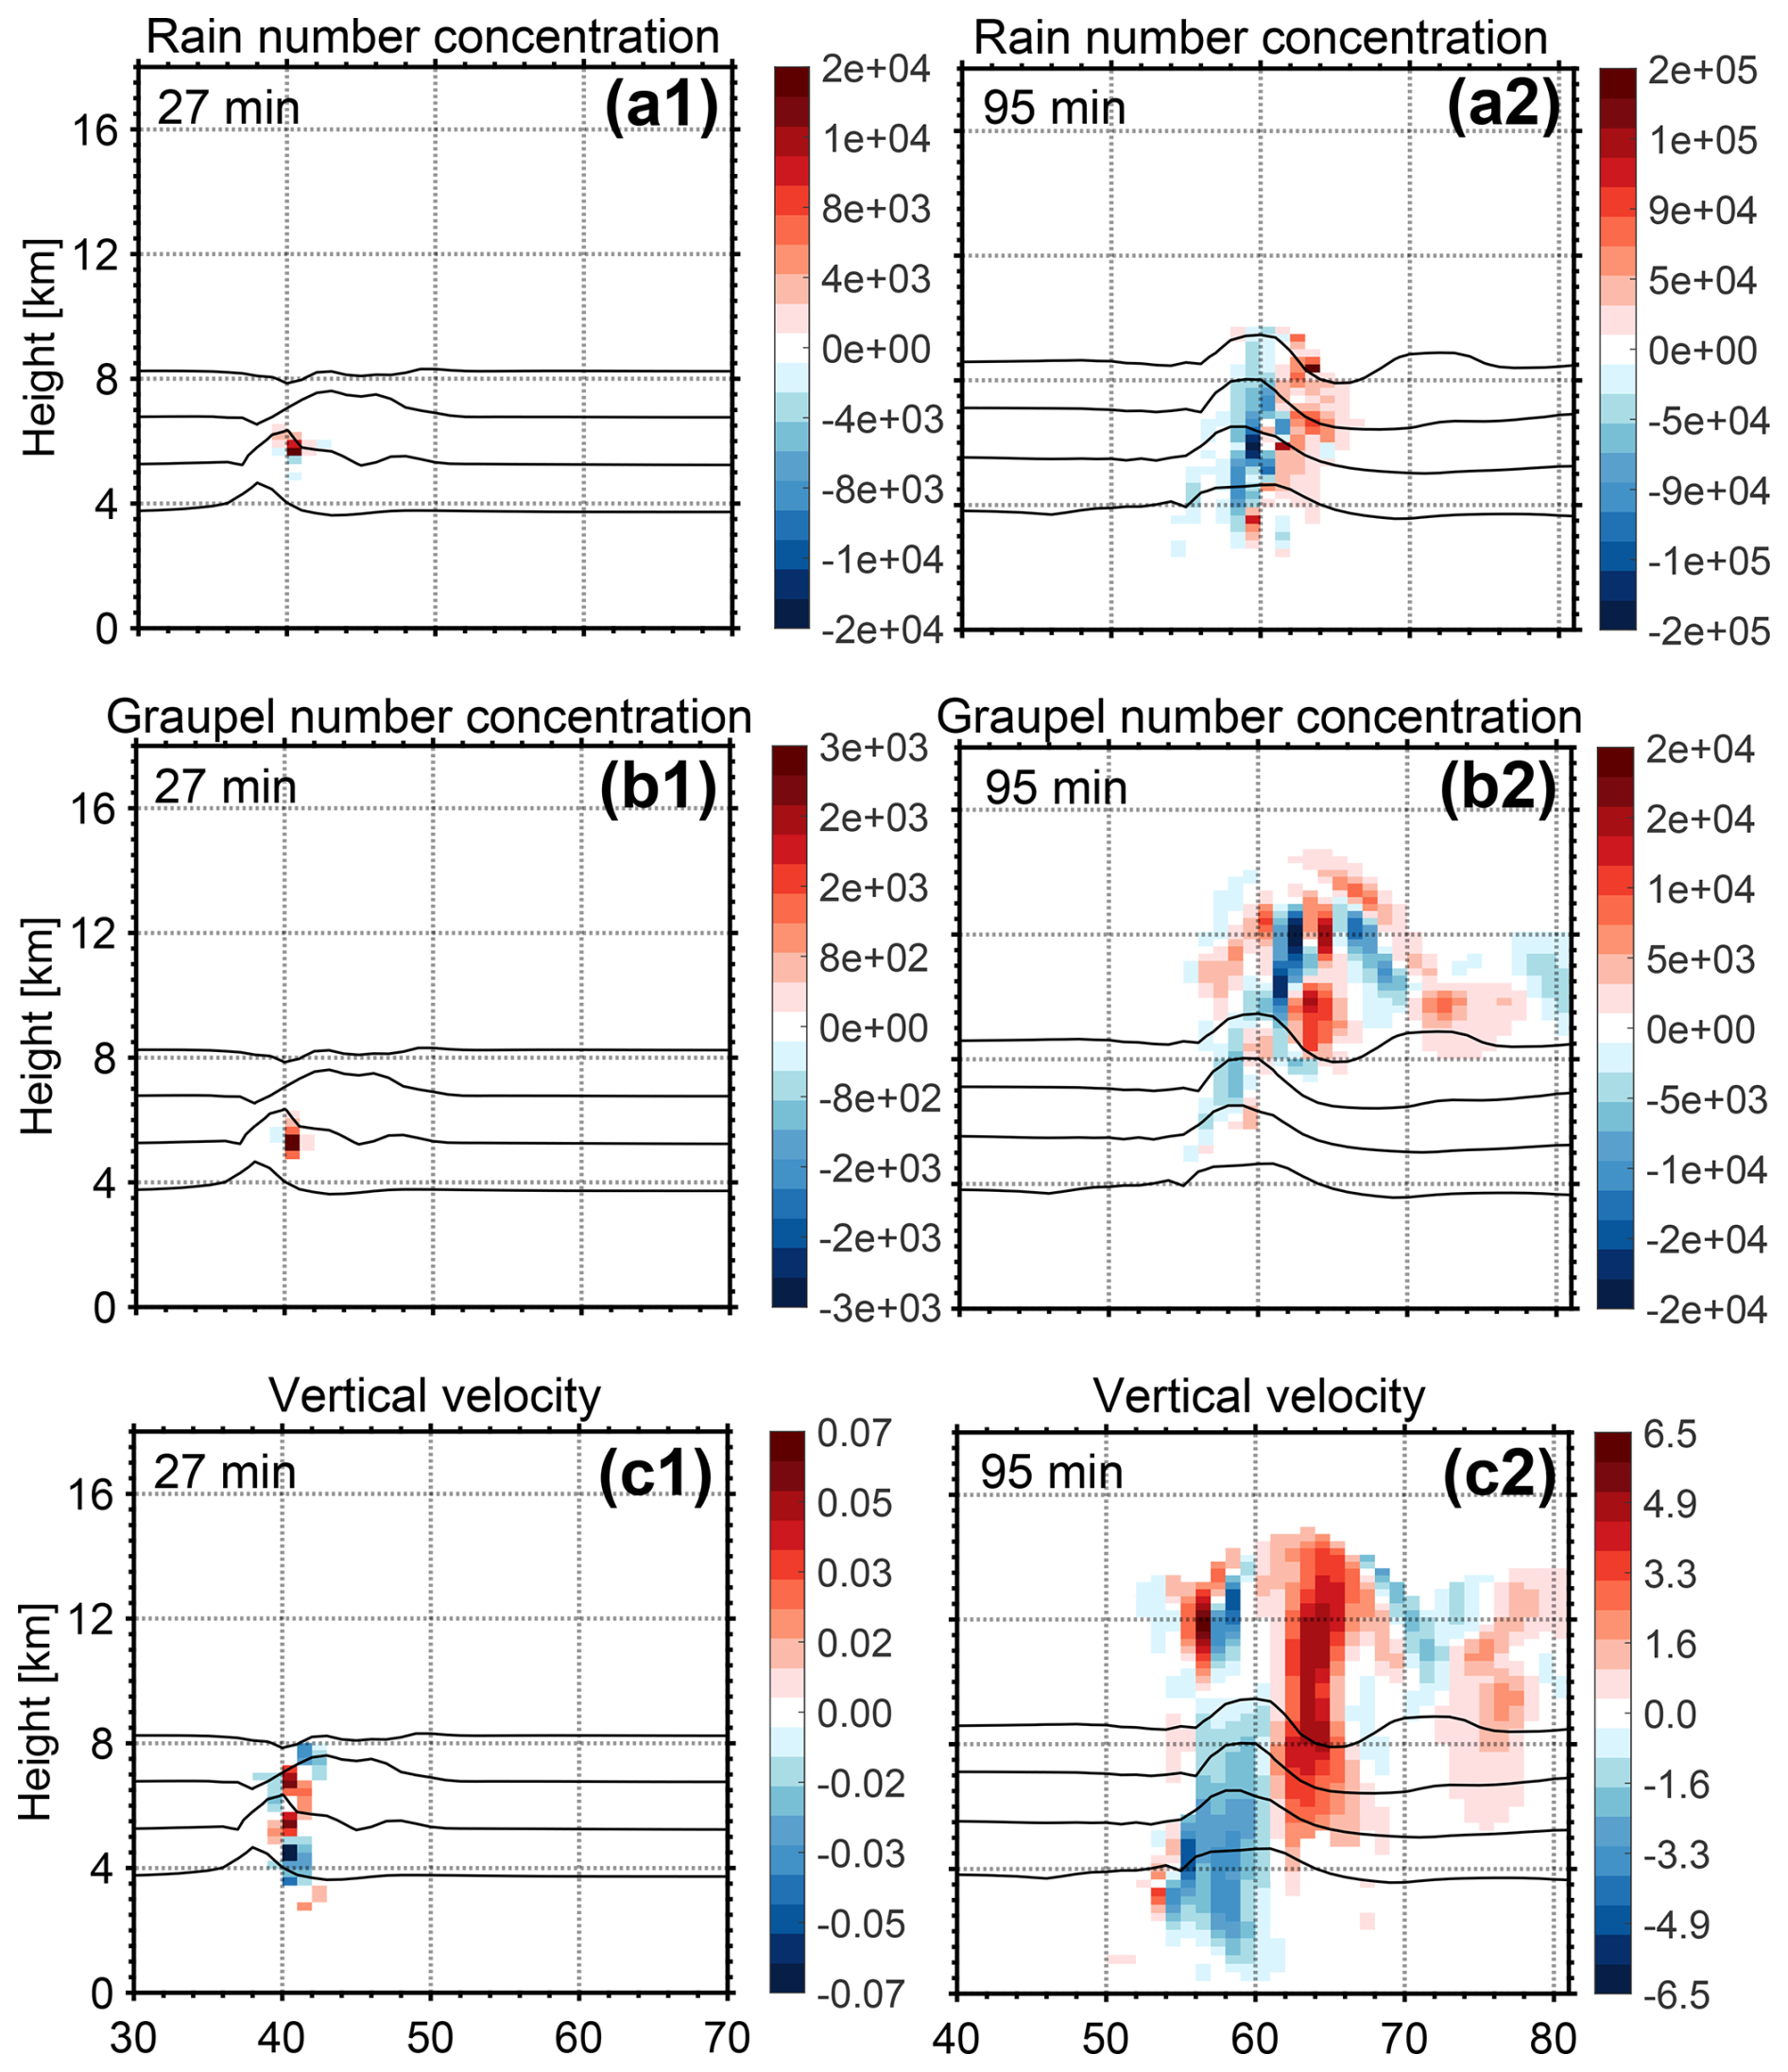
Figure 10Differences between the RB and noRB experiments. Two sensitivity experiments were conducted to investigate the effects of raindrop breakup on the graupel concentrations and on the convective intensities (updraft velocities) within clouds. In the first experiment, raindrop breakup is considered (hereafter RB); in the second experiment, none of the raindrop breakup parameterizations are used (hereafter noRB). This figure shows the differences between the RB and noRB experiments. Rain concentrations (unit, kg−1) at the 27th and 95th minutes, (a1, a2). Graupel concentrations (unit, kg−1) at the 27th and 95th minutes (b1, b2). Vertical velocities (unit, m s−1) at the 27th and 95th minutes, (c1, c2). The black lines indicate the 0, −10, −20, and −30 °C isotherm heights.
In this study, we collected multiple CI events within two thunderstorms on the basis of observations from a polarimetric radar and lightning location system. The convective intensity indicated by the lightning frequency, echo-top height of 50 dBz, and maximum ZH value clearly displayed short-term impulses during the evolutionary cycles of two thunderstorms (case A: 20 June 2016; case B: 13 June 2016) over southern China. Two CI events and two corresponding pre-CI events in each thunderstorm were defined.
By comparing the microphysical characteristics between the thunderstorms in cases A and B from the first pre-CI event to the initial moment of the first CI event, we propose a hypothesis “breakup–freezing” mechanism to potentially explain the convective enhancement in the first CI event with a less significant CAPE, weak low-level wind shear, and clean environment. For significant CAPE, strong low-level wind shear and a clean environment, which followed the previous hypothesis for convective enhancement based on faster updrafts in the environment, resulted from the stronger CAPE, as described in Stough et al. (2021).
This “breakup–freezing” mechanism dominated the subsequent CI events in these two thunderstorms, although the methods for forming large raindrop breakup differed from those dominated by droplet cyclic growth coalescence in the first pre-CI. Large raindrops are formed by the complete melting of smaller graupel or by the coalescence of small raindrops from the shedding of larger graupel. This is important for understanding the enhancement of convection after precipitation loading, melting, and evaporation with a near-stationary thunderstorm cell.
Finally, a sensitivity experiment was conducted with the WRF model to investigate the effects of raindrop breakup on the number concentration of graupel and on the convective intensity within clouds. The simulation results confirmed that the “breakup–freezing” mechanism provided a physical basis for explaining the formation of CI events. The conceptual model in Fig. 11 illustrates the “breakup–freezing” mechanism for the enhancement of convection.
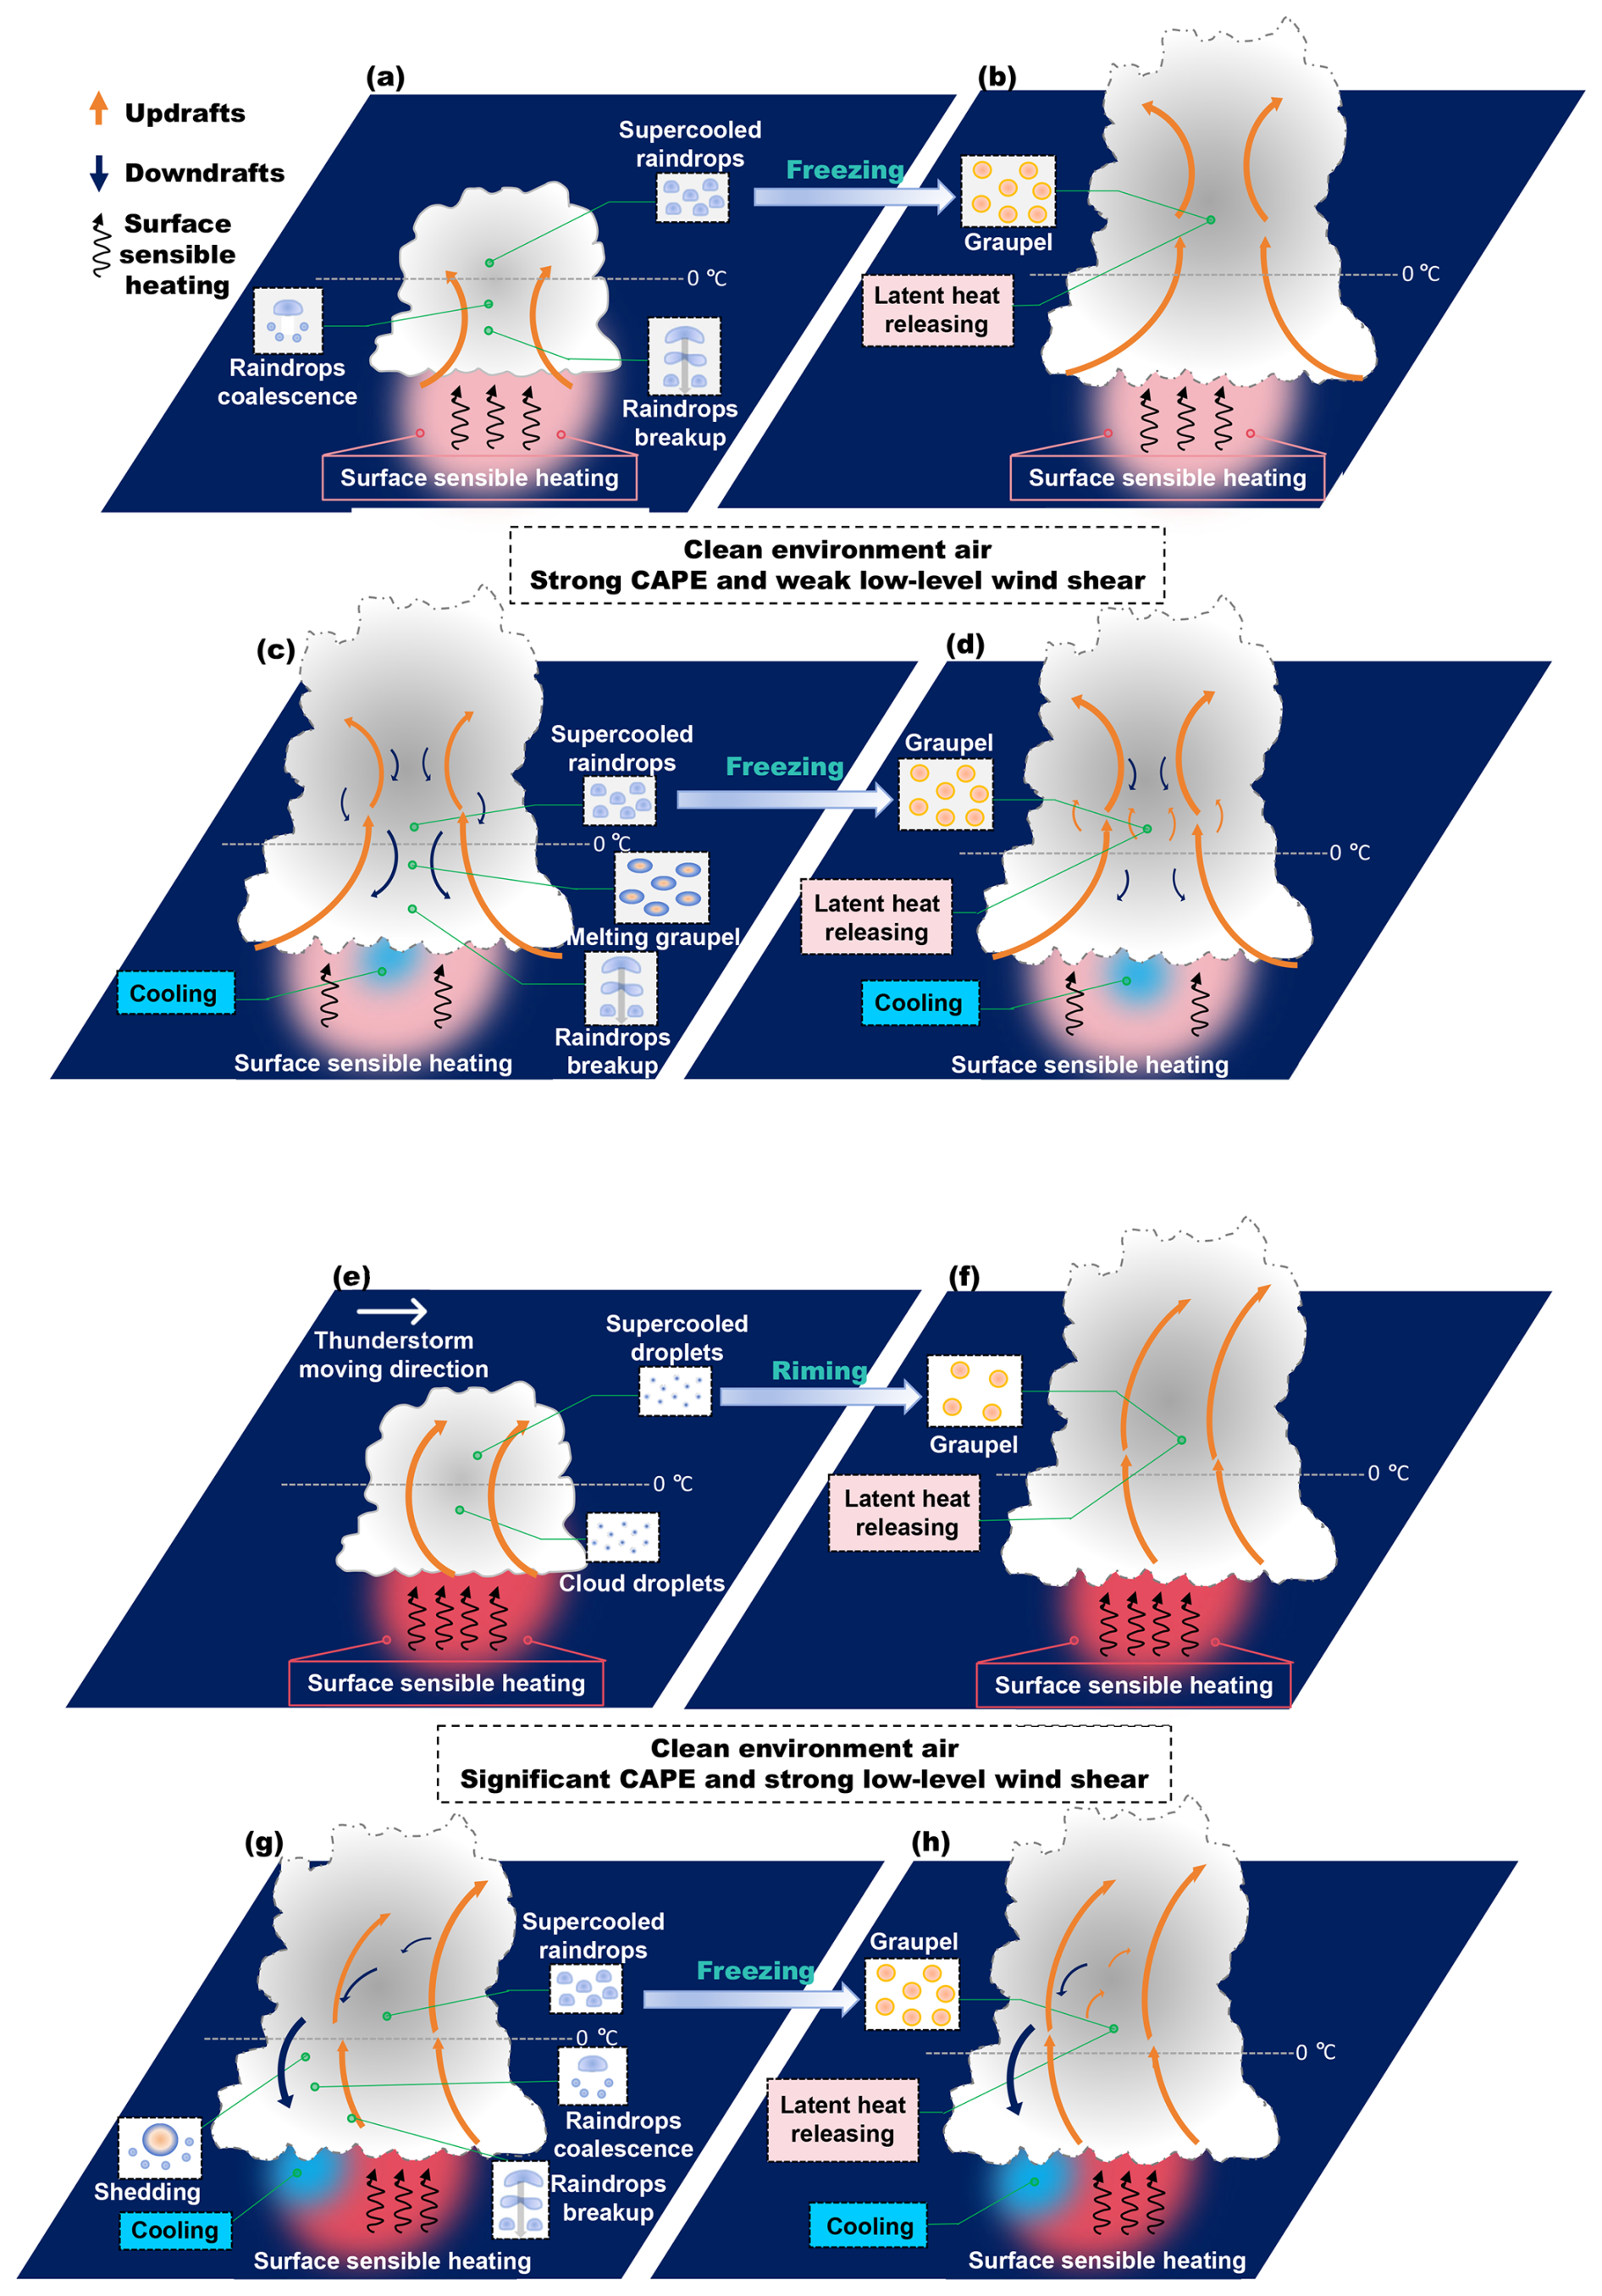
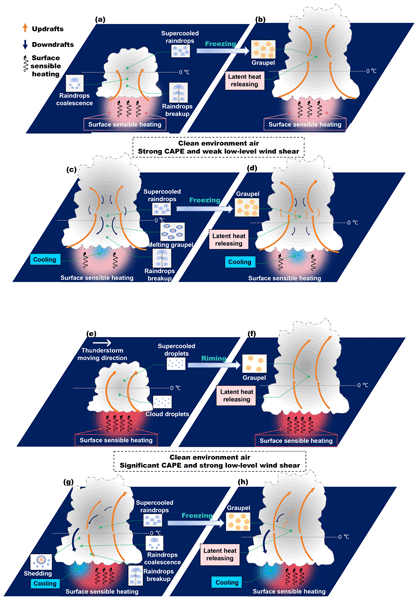
Figure 11A conceptual model of the breakup–freezing mechanism for convective impulses. Convective impulses (CIs) are identified on the basis of radar and lightning observations in this study. CI events in the evolutionary cycle of thunderstorms (case A: 20 June 2016; case B: 13 June 2016) over southern China are studied. The transitions from the first pre-CI stage to the first CI stage are shown in (a) and (b) (case A) and (e) and (f) (case B). In case A, the strong CAPE and weak low-level wind shear promote the formation of large raindrops via coalescence, and many raindrops produced by large raindrop breakup are lifted to subfreezing temperatures and then freeze, and abundant graupel forms and releases latent heat. However, in case B, the significant CAPE and strong low-level wind shear suppress the warm rain processes. More cloud droplets are lifted to subfreezing temperatures, promoting the riming process, the formation of graupel and the release of latent heat. The transitions from the second pre-CI stage to the second CI stage are shown in (c) and (d) (case A) and in (g) and (h) (case B). The smaller graupel in case A easily melts into large raindrops, after which the raindrops break up in the vertical air flow. The many raindrops produced by large-sized raindrop breakup are lifted to subfreezing temperatures and then freeze, leading to the formation of abundant graupel and the release of latent heat. In case B, the larger graupel particles preferentially become small raindrops from shedding in tilted downdrafts, and large raindrops form through small raindrop coalescence in tilted downdrafts, followed by breaking to many raindrops and reentering into updrafts. Finally, the stronger updrafts lift these smaller raindrops into areas of subfreezing temperatures, where they turn into graupel and release latent heat.
CAPE and low-level wind shear are stronger in case B than in case A. Notably, the thunderstorm in case A is nearly stationary (indicating that surface sensible heating is suppressed by rainfall and that radiation heating of the surface is weakened by thunderclouds), but that in case B is moving frequently.
For the first CI event, two mechanisms account for the convective enhancement: (1) the less significant CAPE and weak low-level wind shear promote large raindrop (>2 mm) formation by coalescence, and then, the large raindrops are transferred into many smaller raindrops by breakup in vertical air flow. These raindrops can be easily lifted to subfreezing temperatures and freeze into graupel with a higher number concentration. The latent heat released from raindrop freezing triggered the first CI event (Fig. 11a, b). (2) The significant CAPE and strong wind shear preferentially lift more cloud droplets to subfreezing temperatures and feed less graupel but with moderate or heavy riming, releasing latent heat to increase convection intensity (Fig. 11e, f).
During the second pre-CI period, negative buoyancy is produced by latent heat cooling and precipitation loading. The surface sensible heating is suppressed, and the energy for triggering the second CI event is unlikely to be sourced from increasing surface energy, especially for that in the near-stationary case A. However, the smaller graupel in case A easily melts into large raindrops and then breaks up in the vertical air flow. These raindrops produced by large raindrop breakup are lifted to subfreezing temperatures and then freeze, leading to the formation of abundant graupel and the release of latent heat, thus triggering the second CI event (Fig. 11c, d).
However, the larger maximum ZH values and lower concentration of graupel indicate greater graupel in case B. These large graupel particles preferentially produce small raindrops from shedding in tilted downdrafts instead of rapid melting into large raindrops (Rasmussen and Heymsfield, 1987a, b, c; Wisner et al., 1972). Small raindrops are transformed into large raindrops by coalescence in tilted downdrafts. Large raindrops subsequently break into many raindrops and reenter low-level updrafts. Finally, the updrafts lift these smaller raindrops into areas of subfreezing temperatures, where they turn into graupel and release latent heat (Fig. 10g, h). Notably, the period between large raindrop breakup and the second CI event initiated in case B is shorter than that in case A, which is due to the stronger updrafts at a low level in case B (the construction of tilted air flows and moving behavior and less consumption by evaporation may be beneficial to the updrafts). Notably, the net kinematic intensity for the second CI is weaker than that for the first CI via latent heat cooling and precipitation loading.
In total, the “breakup–freezing” hypothesis involves a sequential microphysical chain: large raindrop formation (through coalescence or melting processes), breakup, lofting-induced multiplication of supercooled raindrops, freezing, graupel formation, and latent heat release. We acknowledge that not all processes in this chain can be directly quantified using the available polarimetric radar and lightning observations.
In this study, several steps are supported by observational evidence. Although polarimetric radar cannot directly detect individual microphysical processes, the changes in polarimetry variables and radar-retrieved Dm values can provide microphysical fingerprints that are associated with coalescence and breakup processes, as discussed by Kumjian et al. (2022) and Yu et al. (2022).
The lofting-induced multiplication of supercooled raindrops is inferred on the basis of the occurrence of breakup signatures in the warm-rain layer and the ensuing increase in the water content above the melting layer. The formation and enhancement of graupel are supported by reflectivity signatures and radar-retrieved ice masses. However, the specific process through which supercooled raindrops freeze into graupel cannot be directly verified from the current observations and remains an inferred process on the basis of an established microphysical understanding.
Furthermore, the associated latent heat release is a physically plausible consequence of freezing processes but cannot be directly quantified in this study. The resulting convective intensification is supported by the concurrent increase in lightning activity and vertical development of strong radar echoes. Therefore, the “breakup–freezing” hypothesis should be considered a mechanism that is supported by multiple observational signatures, while some intermediate microphysical processes remain inferred because of observational limitations.
These limitations do not invalidate the proposed mechanism but highlight the need for further quantitative investigations. Notably, uncertainties in the radar-retrieved microphysical properties are inevitable. Nevertheless, our conclusions are based mainly on the temporal evolution and relative changes in these retrieved microphysical characteristics rather than their absolute values, which may reduce the influence of uncertainties associated with individual retrievals. However, quantitatively constraining these microphysical processes remains essential for incorporating the “breakup–freezing” mechanism into numerical models and may improve simulations of thunderstorms.
In addition, although the breakup parameterization (Morrison et al., 2012) has been widely applied, different breakup schemes may produce different quantitative responses. Future studies using multiple breakup parameterizations are needed to further evaluate the robustness of the “breakup–freezing” mechanism. Specifically, the current WRF simulations do not explicitly simulate the linkage between raindrop breakup and lightning activity in this study. The RB and noRB experiments were designed to investigate whether raindrop breakup can modify microphysical evolution, including the multiplication of supercooled raindrops, graupel formation, and associated latent heat release, which may contribute to convective intensification.
The temporal resolution of radar observations may introduce sampling uncertainties, particularly for fast-moving thunderstorms (e.g., case B in this study). During a volume scan, different parts of a moving storm may be observed at slightly different times, which could affect the representation of the three-dimensional storm structure. Advanced radar with faster scanning, such as phased-array radars, may help reduce these uncertainties and improve observations of rapidly evolving convective clouds.
All data in this study can be obtained from an open repository Figshare (https://doi.org/10.6084/m9.figshare.26779426.v6; Zhao, 2024).
The supplement related to this article is available online at https://doi.org/10.5194/acp-26-11091-2026-supplement.
Conceptualization: CZ and YZ. Data curation: CZ, YZ, DZ and WY. Formal analysis: CZ, YZ and LX. Funding acquisition: YZ, CZ and LX. Investigation: CZ, YZ and LX. Methodology: CZ, YZ, DZ and LX. Project administration: YZ. Resources: CZ and YZ. Software: CZ and DZ. Supervision: YZ and CZ. Validation: CZ and YZ. Visualization: CZ and YZ. Writing (original draft): CZ, YZ and LX.
The contact author has declared that none of the authors has any competing interests.
Publisher's note: Copernicus Publications remains neutral with regard to jurisdictional claims made in the text, published maps, institutional affiliations, or any other geographical representation in this paper. The authors bear the ultimate responsibility for providing appropriate place names. Views expressed in the text are those of the authors and do not necessarily reflect the views of the publisher.
The authors acknowledge the Guangzhou Institute of Tropical and Marine Meteorology for collecting and archiving the radar and surface observations. The authors also acknowledge the State Key Laboratory of Severe Weather Meteorological Science and Technology & CMA Key Laboratory of Lightning for three-dimensional lightning location data.
This research has been supported by the National Natural Science Foundation of China (grant nos. 42305079 and 42075088), the Open Research Fund Project of the Joint Laboratory for Phased-Array Weather Radar Applications in the East China Region (grant no. EPJL_JF2025001), S&T Development Fund of CAMS (grant no. 2026KJ012), and the China Scholarship Council.
This paper was edited by Shaocheng Xie and reviewed by three anonymous referees.
Beard, K. V.: Ice initiation in warm-base convective clouds: An assessment of microphysical mechanisms, Atmos. Res., 28, 125–152, https://doi.org/10.1016/0169-8095(92)90024-5, 1992.
Bell, B., Hersbach, H., Simmons, A., Berrisford, P., Dahlgren, P., Horányi, A., Muñoz-Sabater, J., Nicolas, J., Radu, R., Schepers, D., Soci, C., Villaume, S., Bidlot, J. R., Haimberger, L., Woollen, J., Buontempo, C., and Thépaut, J. N.: The ERA5 global reanalysis: Preliminary extension to 1950, Q. J. R. Meteorol. Soc., 146, 1999–2049, https://doi.org/10.1002/qj.3803, 2020.
Braham Jr., R. R.: The cloud physics of weather modification, Part 1: Scientific basis, WMO Bull., 35, 215–221, 1986.
Bringi, V. N., Knupp, K., Detwiler, A., Liu, L., Caylor, I. J., and Black, R. A.: Evolution of a Florida Thunderstorm during the Convection and Precipitation/Electrification Experiment: The Case of 9 August 1991, Mon. Weather Rev., 125, 2131–2160, https://doi.org/10.1175/1520-0493(1997)125<2131:EOAFTD>2.0.CO;2, 1997.
Bringi, V. N. and Chandrasekar, V.: Polarimetric Doppler Weather Radar: Principles and Applications, Cambridge University Press, Cambridge, ISBN 978-0-521-62384-1, 2001.
Bruning, E. C., Brunner, K. N., van Lier-Walqui, M., Logan, T., and Matsui, T.: Lightning and Radar Measures of Mixed-Phase Updraft Variability in Tracked Storms during the TRACER Field Campaign in Houston, Texas, Mon. Weather Rev., 152, 2753–2769, https://doi.org/10.1175/MWR-D-24-0060.1, 2024.
Carey, L. D. and Buffalo, K. M.: Environmental Control of Cloud-to-Ground Lightning Polarity in Severe Storms, Mon. Weather Rev., 135, 1327–1353, https://doi.org/10.1175/MWR3361.1, 2007.
Carey, L. D. and Rutledge, S. A.: The Relationship between Precipitation and Lightning in Tropical Island Convection: A C-Band Polarimetric Radar Study, Mon. Weather Rev., 128, 2687–2710, https://doi.org/10.1175/1520-0493(2000)128<2687:TRBPAL>2.0.CO;2, 2000.
Carey, L. D., Schultz, E. V., Schultz, C. J., Deierling, W., Petersen, W. A., Bain, A. L., and Pickering, K. E.: An Evaluation of Relationships between Radar-Inferred Kinematic and Microphysical Parameters and Lightning Flash Rates in Alabama Storms, Atmosphere, 10, 796, https://doi.org/10.3390/atmos10120796, 2019.
Cecil, D. J., Buechler, D., and Blakeslee, R. J.: Gridded lightning climatology from TRMM-LIS and OTD: dataset description, Atmos. Res., 135–136, 404–414, https://doi.org/10.1016/j.atmosres.2012.06.028, 2014.
Chen, L., Zhang, Y. J., Lyu, W., Zheng, D., Zhang, Y., Chen, S., and Huang, Z.: Performance evaluation for a lightning location system based on observations of artificially triggered lightning and natural lightning flashes, J. Atmos. Ocean. Technol., 29, 1835–1844, https://doi.org/10.1175/JTECH-D-12-00028.1, 2012.
Dagan, G., Stier, P., Christensen, M., Cioni, G., Klocke, D., and Seifert, A.: Atmospheric energy budget response to idealized aerosol perturbation in tropical cloud systems, Atmos. Chem. Phys., 20, 4523–4544, https://doi.org/10.5194/acp-20-4523-2020, 2020.
Fan, J. W., Rosenfeld, D., Zhang, Y., Giangrande, S. E., Li, Z., Machado, L. A. T., Martin, S. T., Yang, Y., Wang, J., Artaxo, P., Barbosa, H. M. J., Braga, R. C., Comstock, J. M., Feng, Z., Gao, W., Gomes, H. B., Mei, F., Pöhlker, C., Pöhlker, M. L., Pöschl, U., and de Souza, R. A. F.: Substantial convection and precipitation enhancements by ultrafine aerosol particles, Science, 359, 411–418, 10.1126/science.aan8461, 2018a.
Fan, J. W., Zhang,Y., Li, Z., Yan, H., Prabhakaran, T., Rosenfeld, D., and Khain, A.: Unveiling aerosol impacts on deep convective clouds: Scientific concept, modeling, observational analysis, and future direction, J. Geophys. Res.: Atmos., 130, e2024JD041931, https://doi.org/10.1029/2024JD041931, 2025.
Fan, X. P., Zhang, Y. J., Zheng, D., Zhang, Y., Lyu, W. T., Liu, H. Y., and Xu, L. T.: A New Method of Three‐Dimensional Location for Low‐Frequency Electric Field Detection Array, J. Geophys. Res.: Atmos., 123, 8792–8812, https://doi.org/10.1029/2017jd028249, 2018b.
Foote, G. B. and Frank, H. W.: Case Study of a Hailstorm in Colorado. Part III: Airflow From Triple-Doppler Measurements, J. Atmos. Sci., 40, 686–707, https://doi.org/10.1175/1520-0469(1983)040<0686:CSOAHI>2.0.CO;2, 1983.
Fuchs, B. R., Rutledge, S. A., Dolan, B., Carey, L. D., and Schultz, C.: Microphysical and kinematic processes associated with anomalous charge structures in isolated convection, J. Geophys. Res.: Atmos., 123, 6505–6528, https://doi.org/10.1029/2017JD027540, 2018.
Grabowski, W. W.: Daytime convective development over land: The role of surface forcing, Q. J. R. Meteorol. Soc., 149, 2800–2819, https://doi.org/10.1002/qj.4532, 2023.
Grabowski, W. W. and Morrison, H.: Do Ultrafine Cloud Condensation Nuclei Invigorate Deep Convection?, J. Atmos. Sci., 77, 2567–2583, https://doi.org/10.1175/JAS-D-20-0012.1, 2020.
Grabowski, W. W. and Morrison, H.: Supersaturation, buoyancy, and deep convection dynamics, Atmos. Chem. Phys., 21, 13997–14018, https://doi.org/10.5194/acp-21-13997-2021, 2021.
Golestani, Y., Chandrasekar, V., and Bringi, V. N.: Paper presented at the 24th Conference on Radar Meteorology, Tallahassee, FL, Am. Meteorol. Soc., 1989.
Herzegh, P. H. and Jameson, A. R.: Observing Precipitation through Dual-Polarization Radar Measurements, Bull. Am. Meteorol. Soc., 73, 1365–1376, https://doi.org/10.1175/1520-0477(1992)073<1365:OPTDPR>2.0.CO;2, 1992.
Hu, J. and Ryzhkov, A.: Climatology of the Vertical Profiles of Polarimetric Radar Variables and Retrieved Microphysical Parameters in Continental/Tropical MCSs and Landfalling Hurricanes, J. Geophys. Res.: Atmos., 127, https://doi.org/10.1029/2021jd035498, 2022.
Koren, I., Kaufman, Y. J., Remer, L. A., and Martins, J. V.: Measurement of the effect of Amazon smoke on inhibition of cloud formation, Science, 303, 1342–1345, https://doi.org/10.1126/science.1089424, 2004.
Kumjian, M. R. and Prat, O. P.: The Impact of Raindrop Collisional Processes on the Polarimetric Radar Variables, J. Atmos. Sci., 71, 3052–3067, https://doi.org/10.1175/JAS-D-13-0357.1, 2014.
Kumjian, M. R., Khain, A. P., Benmoshe, N., Ilotoviz, E., Ryzhkov, A. V., and Phillips, V. T. J.: The Anatomy and Physics of ZDR Columns: Investigating a Polarimetric Radar Signature with a Spectral Bin Microphysical Model, J. Appl. Meteorol. Climatol., 53, 1820–1843, https://doi.org/10.1175/jamc-d-13-0354.1, 2014.
Kumjian, M. R., Prat, O. P., Reimel, K. J., van Lier-Walqui, M., and Morrison, H. C.: Dual-Polarization Radar Fingerprints of Precipitation Physics: A Review, Remote Sens., 14, 3706, https://doi.org/10.3390/rs14153706, 2022.
Li, H. Q., Wan, Q., Peng, D., Liu, X., and Xiao, H.: Multiscale analysis of a record-breaking heavy rainfall event in Guangdong, China, Atmos. Res., 232,0 104703, https://doi.org/10.1016/j.atmosres.2019.104703, 2020.
Liu, N., Liu, C., Chen, B., and Zipser, E.: What Are the Favorable Large-Scale Environments for the Highest-Flash-Rate Thunderstorms on Earth?, J. Atmos. Sci., 77, 1583–1612, https://doi.org/10.1175/JAS-D-19-0235.1, 2020.
Liu, Z., Zheng, D., Guo, F., Zhang, Y., Zhang, Y., Wu, C., Chen, H., and Han, S.: Lightning activity and its associations with cloud structures in a rainstorm dominated by warm precipitation, Atmos. Res., 246, https://doi.org/10.1016/j.atmosres.2020.105120, 2020.
Lucas, C., Zipser, E. J., and Lemone, M. A.: Vertical Velocity in Oceanic Convection off Tropical Australia, J. Atmos. Sci., 51, 3183–3193, https://doi.org/10.1175/1520-0469(1994)051<3183:VVIOCO>2.0.CO;2, 1994.
MacGorman, D. R. and Rust, W. D.: The Electrical Nature of Storms, Oxford University Press, ISBN 100195073371, 1998.
Markowski, P. and Richardson, Y.: Mesoscale Meteorology in Midlatitudes, John Wiley and Sons Press, ISBN 9780470742136, 2010.
Mather, G. K., Morrison, B. J., and Morgan Jr., G. M.: A Preliminary Assessment of the Importance of Coalescence in Convective Clouds of the Eastern Transvaal, J. Appli. Meteorol. Climatol., 25, 1780–1784, https://doi.org/10.1175/1520-0450(1986)025<1780:APAOTI>2.0.CO;2, 1986.
Mattos, E. V., Machado, L. A. T., Williams, E. R., Goodman, S. J., Blakeslee, R. J., and Bailey, J. C.: Electrification life cycle of incipient thunderstorms, J. Geophys. Res.: Atmos., 122, 4670–4697, https://doi.org/10.1002/2016JD025772, 2017.
Morrison, H., Thompson, G., and Tatarskii, V.: Impact of cloud microphysics on the development of trailing stratiform precipitation in a simulated squall line: Comparison of one- and two-moment schemes, Mon. Weather Rev., 137: 991–1007, https://doi.org/10.1175/2008MWR2556.1, 2009.
Morrison, H., Tessendorf, S. A., Ikeda, K., and Thompson, G.: Sensitivity of a Simulated Midlatitude Squall Line to Parameterization of Raindrop Breakup. Mon. Weather Rev., 140, 2437–2460, https://doi.org/10.1175/MWR-D-11-00283.1, 2012.
Orville, R. E. and Henderson, R. W.: Global Distribution of Midnight Lightning: September 1977 to August 1978, Mon. Weather Rev., 114, 2640–2653, https://doi.org/10.1175/1520-0493(1986)114<2640:GDOMLS>2.0.CO;2, 1986.
Pruppacher, H. R. and Klett, J. D.: Microphysics of Clouds and Precipitation, edn. 2, Kluwer Academic, ISBN 079234409X, 1997.
Qie, X., Yair, Y., Di, S., Huang, Z., and Jiang, R.: Lightning response to temperature and aerosols, Environ. Res. Lett., 19, 083003, https://doi.org/10.1088/1748-9326/ad63bf, 2024.
Rasmussen, R. M. and Heymsfield, A. J.: Melting and Shedding of Graupel and Hail. Part I: Model Physics, J. Atmos. Sci., 44, 2754–2763, https://doi.org/10.1175/1520-0469(1987)044<2754:MASOGA>2.0.CO;2, 1987a.
Rasmussen, R. M. and Heymsfield, A. J.: Melting and Shedding of Graupel and Hail. Part II: Sensitivity Study, J. Atmos. Sci., 44, 2764–2782, https://doi.org/10.1175/1520-0469(1987)044<2764:MASOGA>2.0.CO;2, 1987b.
Rasmussen, R. M. and Heymsfield, A. J.: Melting and Shedding of Graupel and Hail. Part III: Investigation of the Role of Shed Drops as Hail Embryos in the 1 August CCOPE Severe Storm, J. Atmos. Sci., 44, 2783–2803, https://doi.org/10.1175/1520-0469(1987)044<2783:MASOGA>2.0.CO;2, 1987c.
Rogers, R. R. and Yau, M. K.: A Short Course in Cloud Physics, edn. 3, Pergamon Press, ISBN 0-08-0348645, 1989.
Rosenfeld, D. and Lensky, I. M.: Satellite-Based Insights into Precipitation Formation Processes in Continental and Maritime Convective Clouds, Bull. Am. Meteorol. Soc., 79, 2457–2476, https://doi.org/10.1175/1520-0477(1998)079<2457:SBIIPF>2.0.CO;2, 1998.
Rosenfeld, D., Lohmann, U., Raga, G. B., O'Dowd, C. D., Kulmala, M., Fuzzi, S., Reissell, A., and Andreae, M. O.: Flood or Drought: How Do Aerosols Affect Precipitation?, Science, 321, 1309–1313, https://doi.org/10.1126/science.1160606, 2008.
Schmid, W., Schiesser, H., Furger, M., and Jenni, M.: The Origin of Severe Winds in a Tornadic Bow-Echo Storm over Northern Switzerland, Mon. Weather Rev., 128, 192–207, https://doi.org/10.1175/1520-0493(2000)128<0192:TOOSWI>2.0.CO;2, 2000.
Shi, D., Zheng, D., Zhang, Y., Zhang, Y., Huang, Z., Lu, W., Chen, S., and Yan, X.: Low-frequency E-field Detection Array (LFEDA) – Construction and preliminary results, Sci. China Earth Sci., 60, 1896–1908, https://doi.org/10.1007/s11430-016-9093-9, 2017.
Smith, P. L., Musil, D. J., Detwiler, A. G., and Ramachandran, R.: Observations of Mixed-Phase Precipitation within a CaPE Thunderstorm, J. Appl. Meteorol. Climatol., 38, 145–155, https://doi.org/10.1175/1520-0450(1999)038<0145:OOMPPW>2.0.CO;2, 1999.
Stolzenburg, M., Marshall, T. C., and Krehbiel, P. R.: Initial electrification to the first lightning flash in New Mexico thunderstorms, J. Geophys. Res.: Atmos., 120, 11253–11276, https://doi.org/10.1002/2015JD023988, 2015.
Stough, S. M., Carey, L. D., Schultz, C. J., and Cecil, D. J.: Examining conditions supporting the development of anomalous charge structures in supercell thunderstorms in the Southeastern United States, J. Geophys. Res.: Atmos., 126, e2021JD034582, https://doi.org/10.1029/2021JD034582, 2021.
Thornton, J. A., Virts, K. S., Holzworth, R. H., and Mitchell, T. P.: Lightning enhancement over major oceanic shipping lanes, Geophys. Res. Lett., 44, 9102–9111, https://doi.org/10.1002/2017GL074982, 2017.
Tokay, A., D'Adderio, L. P., Marks, D. A., Pippitt, J. L., Wolff, D. B., and Petersen, W. A.: Comparison of Raindrop Size Distribution between NASA's S-Band Polarimetric Radar and Two-Dimensional Video Disdrometers, J. Appl. Meteorol. Climatol., 59, 517–533, https://doi.org/10.1175/JAMC-D-18-0339.1, 2020.
Varble, A. C., Igel, A. L., Morrison, H., Grabowski, W. W., and Lebo, Z. J.: Opinion: A critical evaluation of the evidence for aerosol invigoration of deep convection, Atmos. Chem. Phys., 23, 13791–13808, https://doi.org/10.5194/acp-23-13791-2023, 2023.
Vongpaseut, I. and Barthe, C.: Distinct effects of several ice production processes on thunderstorm electrification and lightning activity, Atmos. Chem. Phys., 25, 14945–14965, https://doi.org/10.5194/acp-25-14945-2025, 2025.
Wang, Q., Li, Z., Guo, J., Zhao, C., and Cribb, M.: The climate impact of aerosols on the lightning flash rate: is it detectable from long-term measurements?, Atmos. Chem. Phys., 18, 12797–12816, https://doi.org/10.5194/acp-18-12797-2018, 2018.
Wang, X. and Zhang, R.: Effects of atmospheric circulations on the interannual variation in PM2.5 concentrations over the Beijing–Tianjin–Hebei region in 2013–2018, Atmos. Chem. Phys., 20, 7667–7682, https://doi.org/10.5194/acp-20-7667-2020, 2020.
Williams, E. R. and Stanfill, S.: The physical origin of the land-ocean contrast in lightning activity, C. R. Physique, 3, 1277–1292, https://doi.org/10.1016/S1631-0705(02)01407-X, 2002.
Williams, E. R., Mushtak, V., Rosenfeld, D., Goodman, S., and Boccippio, D.: Thermodynamic conditions favorable to superlative thunderstorm updraft, mixed phase microphysics and lightning flash rate, Atmos. Res., 76, 288–306, https://doi.org/10.1016/j.atmosres.2004.11.009, 2005.
Wisner, C., Orville, H. D., and Myers, C.: A Numerical Model of a Hail-Bearing Cloud, J. Atmos. Sci., 29, 1160–1181, https://doi.org/10.1175/1520-0469(1972)029<1160:ANMOAH>2.0.CO;2, 1972.
Yu, S., Luo, Y., Wu, C., Zheng, D., Liu, X., and Xu, W.: Convective and Microphsical Characteristics of Extreme Precipitation Revealed by Multisource Observations Over the Pearl River Delta at Monsoon Coast, Geophys. Res. Lett., 49, e2021GL097043, 2022.
Zhang, Y., Yan, M., Sun, A., and Guo, F.: Thunderstorm Electricity, China Meteorology Press, Beijing, 384 pp., ISBN 9787502947682, 2009.
Zhang, Z., Zheng, D., Zhang, Y., and Lu, G.: Spatial-temporal characteristics of lightning flash size in a supercell storm, Atmos. Res., 197, 201–210, https://doi.org/10.1016/j.atmosres.2017.06.029, 2017.
Zhao, C. H.: Data for “Physical Interpretation and Implications of Convective Impulses in Thunderstorms Based on Lightning and Polarimetric Radar Observations”, figshare [data set], https://doi.org/10.6084/m9.figshare.26779426.v6, 2024.
Zhao, C., Zhang, Y., Zhai, H., Li, Z., Zheng, D., Peng, X., Yao, W., Du, S., and Du, Y.: Bridging the polarimetric structure and lightning activity of isolated thunderstorm cells during the cloud life cycle , Atmos. Chem. Phys., 25, 13453–13473, https://doi.org/10.5194/acp-25-13453-2025, 2025.
Zhao, C., Zhang, Y., Zheng, D., Li, H., Du, S., Peng, X., Liu, X., Zhao, P., Zheng, J., and Shi, J.: Technical note: On the ice microphysics of isolated thunderstorms and non-thunderstorms in southern China – a radar polarimetric perspective, Atmos. Chem. Phys., 24, 11637–11651, https://doi.org/10.5194/acp-24-11637-2024, 2024a.
Zhao, C. F., Sun, Y., Yang, J., Li, J., Zhou, Y., Yang, Y., Fan, H., and Zhao, X.: Observational evidence and mechanisms of aerosol effects on precipitation, Sci. Bull., 69, 1569–1580, 2024b.
Zhao, C. H., Zheng, D., Zhang, Y. J., Liu, X., Zhang, Y., Yao, W., and Zhang, W.: Characteristics of cloud microphysics at positions with flash initiations and channels in convection and stratiform areas of two squall lines, J. Trop. Meteorol., 37, 358–369, https://doi.org/10.16032/j.issn.1004-4965.2021.035, 2021a.
Zhao, C. H., Zheng, D., Zhang, Y. J., Liu, X., Zhang, Y., Yao, W., and Zhang, W.: Turbulence Characteristics of Thunderstorms Before the First Flash in Comparison to Non-Thunderstorms, Geophys. Res. Lett., 48, e2021GL094821, https://doi.org/10.1029/2021GL094821, 2021b.
Zhao, C. H., Zhang, Y., Zheng, D., Liu, X., Zhang, Y., Fan, X., Yao, W., and Zhang, W.: Using Polarimetric Radar Observations to Characterize First Echoes of Thunderstorms and Nonthunderstorms: A Comparative Study, J. Geophys. Res.: Atmos., 127, e2022JD036671, https://doi.org/10.1029/2022JD036671, 2022.
Zhao, C. H., Zhang, Y. J., Zheng, D., Yao, W., and Du, S.: Potential Method for Warning the First Lightning Flash of Isolated Thunderstorm Cells over South China, Weather Forecast., 40, 105–115, https://doi.org/10.1175/WAF-D-23-0189.1, 2024c.
Zheng, D., Shi, D., Zhang, Y., Zhang, Y. J., Lyu, W., and Meng, Q.: Initial leader properties during the preliminary breakdown processes of lightning flashes and their associations with initiation positions, J. Geophys. Res.: Atmos., 124: 8025–8042, https://doi.org/10.1029/2019JD030300, 2019.
Zipser, E. J., Cecil, D. J., Liu, C., Nesbitt, S. W., and Yorty, D. P.: Where are the Most Intense Thunderstorms on Earth?, Bull. Am. Meteorol. Soc., 87, 1057–1072, https://doi.org/10.1175/BAMS-87-8-1057, 2006.