
the Creative Commons Attribution 4.0 License.
the Creative Commons Attribution 4.0 License.
 | 07 Aug 2026
Characterizing emissions, chemistry, and health impacts of aged wildfire smoke in a western US city
Damien T. Ketcherside
Vanessa Selimovic
Keri Nauman
Robert J. Yokelson
We report hourly surface observations of PM2.5, CO, NOx, O3, and 75 speciated VOCs in Missoula, Montana, during a strong smoke event in 2020. This study tests our current understanding of wildfire emissions, chemistry, and health effects as implemented in the GEOS-Chem chemical transport model. Three-or-more-day-old smoke transported from California and the Pacific Northwest increased CO, PM2.5, and total measured VOCs by factors of 2–8, with hourly maxima of 800 ppb, 120 µg m−3, and 85 ppb, respectively. In contrast, NOx levels were not elevated compared to the urban background. O3 showed a non-monotonic response to wildfire smoke: MDA8 O3 increased under light smoke but flattened or declined when PM2.5 exceeded ∼ 30–40 µg m−3, a feature that GEOS-Chem failed to reproduce. A 2020-style wildfire season recurring annually would yield an excess lifetime cancer risk of 100-in-1 million or approximately 7 times the non-smoke baseline. The chronic non-cancer hazard index (HI) would reach 3.0, indicating appreciable potential for chronic non-cancer effects. About 90 % of cancer risks are from PM2.5 whereas non-cancer risks are dominated by formaldehyde, benzene, acrolein, and acetaldehyde. GEOS-Chem captured major smoke intrusions but underestimated CO, PM2.5, and VOCs by 30 %–90 %. These model biases propagate to health metrics, with GEOS-Chem underestimating smoke-attributable cancer risk by ∼ 40 % and chronic HI by ∼ 10 times. We attribute the model errors to underpredicted fire emissions and unrepresented VOC chemistry, which together led to an overestimation of OH and insufficient secondary production.
- Article
(4021 KB) - Full-text XML
-
Supplement
(3156 KB) - BibTeX
- EndNote


Wildfires are the second largest source of volatile organic compounds (VOCs) in the western US (Hoesly et al., 2018; Jin et al., 2023). Some VOCs are designated hazardous air pollutants (HAPs) due to their carcinogenicity and potential for acute or chronic health effects (Naeher et al., 2007; Reid et al., 2016). Lengthening and intensified fire seasons in recent decades have posed direct air quality risks to rural populations and the inhabitants of ∼ 50 million US homes that already lie within the fire-prone wildland–urban interface (WUI), a figure expected to grow by one million every three years (Burke et al., 2021). Moreover, recent years have shown that western US and Canadian biomass burning (BB) smoke frequently impacts cities in western North America and can reach population centers thousands of kilometers downwind on the East Coast (Yu et al., 2024). Despite the growing threat of more frequent and intense wildfires, the health effects of HAPs emitted from wildfires are not well documented, and residents often lack chemically resolved data on the pollutants to which they are exposed, because of limited ground-level measurements. Here, we combine hourly ground-based observations of VOCs and criteria pollutants with the GEOS-Chem chemical transport model (CTM) to characterize the composition, chemical evolution, and health implications of aged wildfire smoke.
Past observational efforts have provided valuable yet incomplete insights into the health risks associated with wildfire smoke exposure (Gould et al., 2024). For example, some studies have targeted near-source fireline PM (Navarro et al., 2021), CO (Semmens et al., 2021), or high-altitude plumes sampled by aircraft (O'Dell et al., 2020), and others have examined speciated VOCs and/or aerosol composition (Akagi et al., 2014; Fiddler et al., 2024; Joo et al., 2024; Liang et al., 2022). Speciated, near-surface data where the majority of human exposure to fresh and aged smoke actually occurs are still seriously under sampled. The lack of sufficient measurements also limits the evaluation of CTMs, which are widely used for smoke forecasting and health-risk assessments. Recent aircraft observations show that GEOS-Chem (a commonly used CTM) underestimates BB CO and key HAPs such as formaldehyde by a factor of three or more (Jin et al., 2023). However, analogous ground-based validation remains absent. Because near-surface chemistry differs fundamentally from lofted plumes (e.g., ambient temperature, nighttime oxidants, boundary layer mixing) (Decker et al., 2019; Pagonis et al., 2023), ground observations are urgently needed to improve model validation and exposure assessments.
The western US fire season of 2020 produced some of the most extreme smoke levels on record in OR, WA, and CA (Albores et al., 2023; Reilly et al., 2022), with September standing out as the peak month (Abatzoglou et al., 2021; Mass et al., 2021). More than 1.6 million ha burned in California alone, releasing an estimated ∼ 127 Tg CO2-equivalent, nearly twice the state's cumulative 2003–2019 greenhouse-gas reductions (Jerrett et al., 2022). These BB events provide an ideal natural laboratory for quantifying the composition of aged smoke, and testing CTM capabilities for representing regional smoke and assessing the continental-scale impacts of wildfires.
In this study, we present hourly ground-based measurements of 75 VOCs (including 15 HAPs), PM2.5, CO, NOx, and O3 collected in aged (mostly > 3 d) regional wildfire smoke during September 2020 in Missoula, Montana – a representative northwestern US city frequently impacted by regional wildfire smoke. Leveraging this comprehensive dataset, we (i) characterize the temporal evolution of VOCs and criteria pollutants (Sect. 4), (ii) quantify species-specific BB enhancements (Sect. 5), (iii) investigate O3–PM2.5 relationships (Sect. 6), (iv) assess public health risks using regulatory exposure metrics for PM2.5 and HAPs (Sect. 7), and (v) evaluate GEOS-Chem simulations against observations to diagnose model biases in BB emissions and chemistry, and their implications for health-risk estimates (Sect. 8).
2.1 Missoula Science Observatory
Missoula, MT (46.8721° N, 113.9940° W) lies in a mountain valley in the northern Rocky Mountains with a population of approximately 120 000. Missoula has been studied in the past for its frequent impacts from both local (Montana and Idaho) and regional wildfires, including long-range smoke transport from the West Coast and the Pacific Northwest, such as California, Oregon, Washington, and British Columbia (Selimovic et al., 2019, 2020). Its frequent exposure to surface smoke makes it a representative site for evaluating human exposure and air quality under real-world wildfire conditions.
Long-term air quality monitoring at the Missoula Science Observatory (MSO) began in 2017 with measurements including four criteria pollutants (PM2.5, CO, NO2, and O3) and aerosol optical properties (Selimovic et al., 2019, 2020). In 2020, the monitoring scope expanded to include 75 individual VOCs, of which 15 are classified as HAPs by the U.S. EPA. The University of Montana (UM) campus serves as the primary site for CO, NO, NO2, O3, and VOC measurements. The NO, NO2, and O3 inlet was located 12.5 at the Charles H. Clapp Building; the CO and VOCs inlet was initially located 10 on the Chemistry Building, ∼ 70 m away.
Measurements of PM2.5 were obtained from the Montana Department of Environmental Quality site at Boyd Park, roughly 3 km southwest of the UM campus. Despite the spatial separation between measurement sites, previous studies have validated the temporal and spatial agreement in pollutant concentrations between the two sites for 2017–2019 summers (Selimovic et al., 2019, 2020); we confirm similar agreement among PM2.5 measured at the Boyd Park and other tracers measured at the UM campus for this study (R2 > 0.9), supporting the use of combined datasets in this analysis.
Hourly meteorological data were obtained from the MesoWest database and accessed via the Synoptic Data API (https://synopticdata.com/, last access: 30 July 2026). Incoming shortwave radiation (W m−2) was obtained from the Blue Mountain site (station ID: BLMM8; 46.73° N, 114.09° W), while air temperature (°C), relative humidity (%), and precipitation accumulation (mm) were obtained from the Missoula Valley site (station ID: E0591; 46.86° N, 114.02° W). These stations were selected as the closest available meteorological observations to the MSO (10 and 5 km away, respectively). We used broadband shortwave (SW) as a first-order proxy for actinic flux and photolysis as they were not measured; we note that the SW (200–4000 nm) can diverge from the near-UV range relevant to J(NO2) and J(O1D) (∼ 300–420 nm) under smoke. Planetary boundary layer (PBL) mixing height (m) was obtained from the High-Resolution Rapid Refresh (HRRR, 3 km), an operational forecast and analysis system developed by NOAA with hourly updates at 3 km horizontal resolution (Dowell et al., 2022). We also obtained the mixing height data from the NASA Goddard Earth Observing System Forward Processing system (GEOS-FP, 0.25° × 0.3125°, hourly) as it serves as one of the inputs for GEOS-Chem.
Figure 1 illustrates the climatology of PM2.5, defined here as the multi-year statistical distribution of daily-mean PM2.5 during the wildfire season (June–October) over 2010–2024 in Missoula. Despite large interannual variability, a clear seasonal progression is evident. The multi-year daily average PM2.5 concentrations remain below 15 µg m−3 throughout June, increase steadily during July, and peak from mid-August to occasionally mid-September, coincident with increases in wildfire smoke episodes. Peak hourly PM2.5 even reached ∼ 470 µg m−3 in 2017. Reflecting this chronic smoke burden, in 2024, Missoula ranked 14th among 223 US metropolitan areas for 24 h particle pollution, measured by the weighted annual average number of unhealthy 24 h PM2.5, and 29th for annual particle pollution, measured by the annual average PM2.5 concentration (American Lung Association, 2024). In this study, we focus specifically on September 2020, when regional smoke transport led to one of the most prolonged and chemically distinct episodes of aged wildfire smoke observed at the surface (blue line in Fig. 1; Sect. 4).
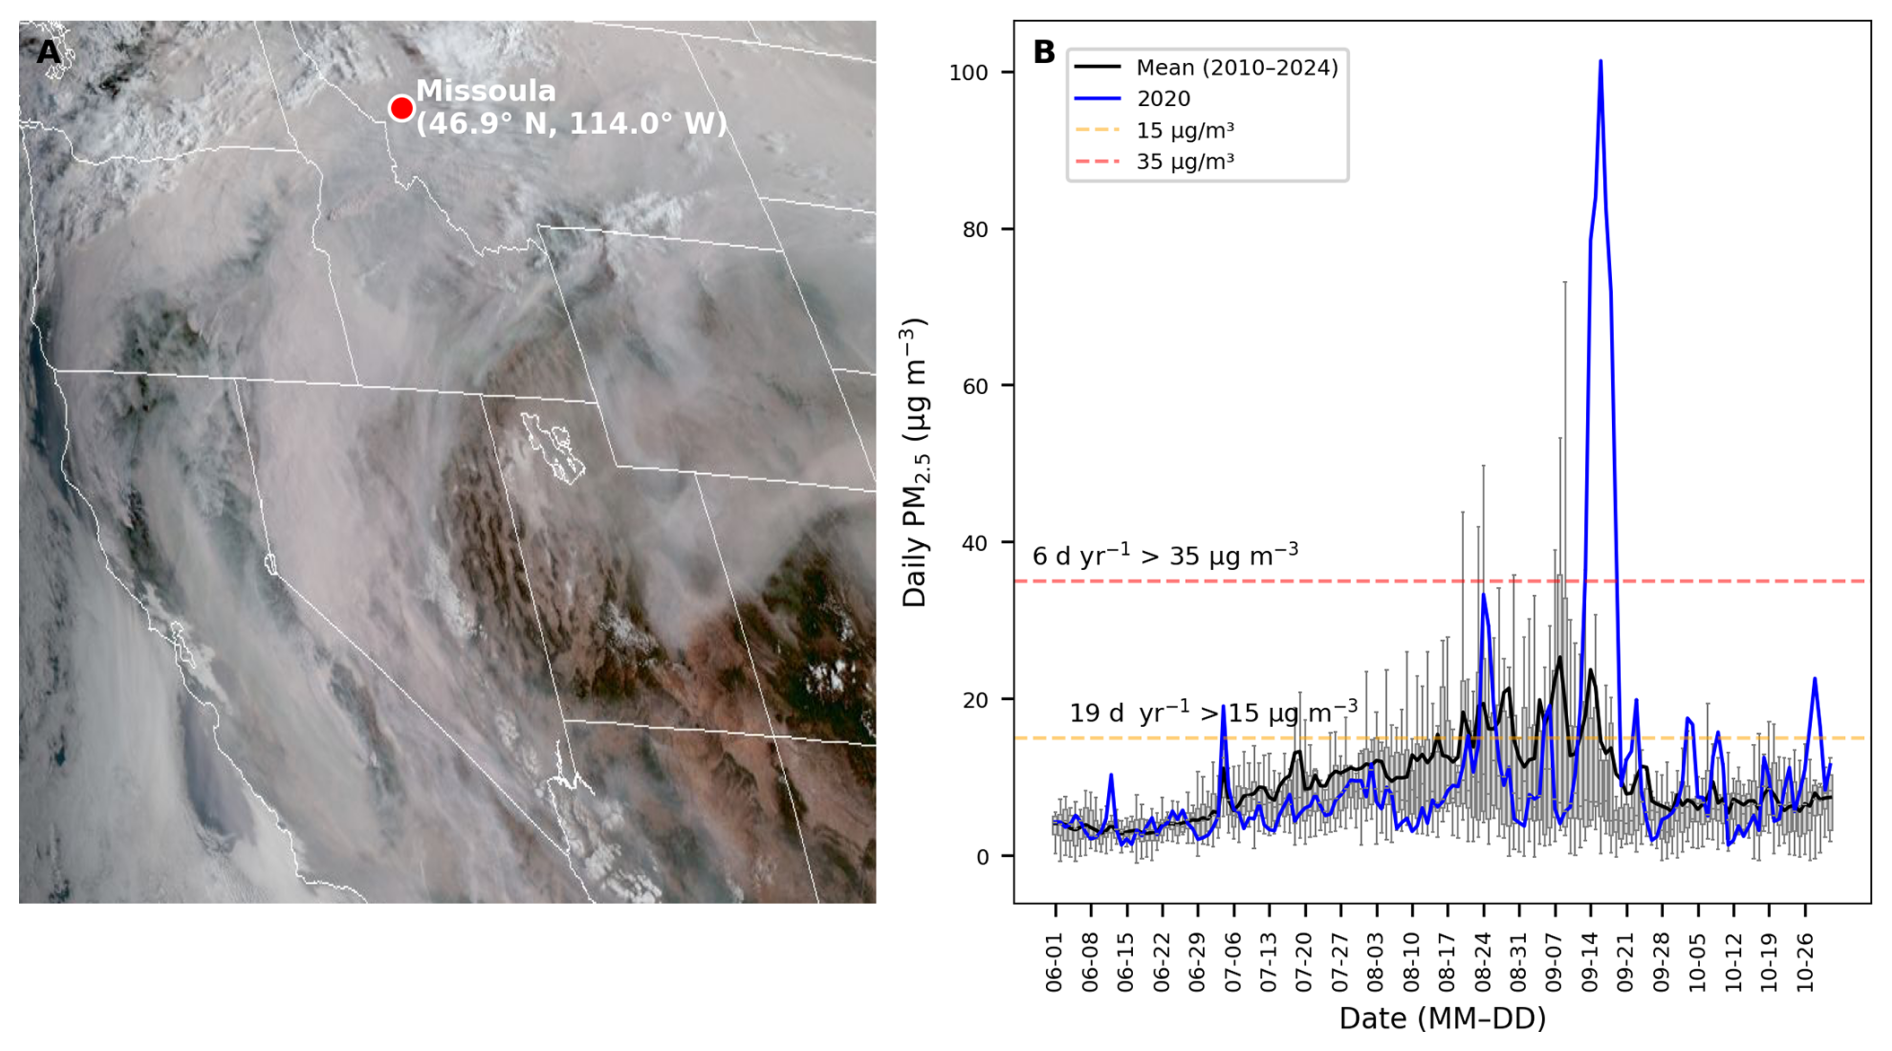
Figure 1Wildfire smoke over the western US and climatological PM2.5 in Missoula, Montana. (A) Cropped GOES-17 GeoColor satellite image (15 September 2020) over the Western United States, with the location of Missoula, Montana indicated by the red dot. (B) Daily-mean PM2.5 concentrations at Missoula during the 2020 fire season (blue) compared with the 2010–2024 climatology (black line; grey box plots give the interquartile range and whisker range (± 1.5×IQR; vertical lines) for each calendar day). Dashed horizontal lines indicate 15 and 35 µg m−3, as the WHO 24 h guideline and the U.S. EPA 24 h standard, respectively.
2.2 VOC measurements
Ambient mixing ratios of 75 VOCs were measured as 2 min averages using a custom-built Proton Transfer Reaction Time-of-Flight Mass Spectrometer (PTR-ToF-MS; PTR-ToF-4000, Ionicon Analytik GmbH, Innsbruck, Austria). Instrument operation followed protocols developed in our previous campaigns (Cope et al., 2024; Permar et al., 2021; Selimovic et al., 2022), with drift tube conditions set to = 130 Td, 3.00 mbar, 60 °C, and 800 V.
Air was continuously sampled from an inlet ∼ 10 through ∼ 10 m of heated (60 °C) 6.35 mm ( in.) outer diameter (O.D.) PTFE tubing. The PTR-ToF-MS then subsampled via ∼ 1 m of 1.59 mm ( in.) O.D. PEEK tubing, also maintained at 60 °C. The sampling inlet featured a 2 µm PTFE filter to prevent particle intrusion. Filters were replaced every 2 weeks, or more frequently during high pollution periods. Instrument backgrounds were quantified every 2.5 h by sampling VOC-free air generated via a heated platinum catalyst (375 °C; Sigma-Aldrich, 1 wt %).
In this work, we included 75 VOC species measured by PTR-ToF-MS in the analysis. Calibrations were conducted every other day using two compressed gas standard cylinders for 25 individual VOCs (± 5 % at ∼ 1 ppmv; Apel-Riemer Environmental, Inc.). Among them, isomers calibrated at the same (i.e., methyl vinyl ketone and methacrolein at 71.049; ethylbenzene and o-xylene at 107.086; 1,2,4- and 1,3,5-trimethylbenzene at 121.101), which used a weighted average sensitivity based on the corresponding isomeric contributions (Permar et al., 2021). A third standard gas cylinder containing 10 species was calibrated after the campaign (± 5 % at ∼ 1 ppmv; Apel-Riemer Environmental, Inc.). The overall measurement uncertainty for these species is estimated to be less than 15 %. Formaldehyde was calibrated after the campaign using a gas standard cylinder (stated accuracy 5 % at ∼ 2 ppm; Airgas USA LLC, Plumsteadville, PA, USA). Gases were mixed in a Liquid Calibration Unit (LCU, Ionicon Analytik GmbH, Innsbruck, Austria) to derive the dependence of instrument sensitivity on changing humidity. Formic and acetic acids were calibrated after the campaign using LCU, which also applied humidity dependence. Uncertainty for these species is estimated at ∼ 30 % (Permar et al., 2021). For 40 uncalibrated species, instrument sensitivities were estimated using theoretical methods (Sekimoto et al., 2017) refined by field comparisons (Permar et al., 2021), yielding overall uncertainties of ∼ 50 %. Sensitivity of all compounds used in this study ranges from 0.9 to 14 ncps ppbv−1, where ncps denotes normalized counts per second. The background signal of all compounds ranges from 0.05 to 10.1 ncps.
2.3 Measurements of CO, NOx, O3, and PM2.5
CO was measured every ∼ 3 min using a Reducing Compound Photometer (Peak Performer 1, PEAK Laboratories, Mountain View, CA, USA), which separates CO by gas chromatography and detects it via photometric absorption of mercury vapor produced from CO reduction of HgO. The instrument was calibrated weekly via CO standard in a compressed standard gas cylinder, with a detection limit of 0.3 ppb. The instrument shared the inlet with PTR-ToF-MS and sampled ambient air at 40 sccm through 5 m of 3.175 mm ( in.) O.D. PTFE tubing.
NO2 and NO were measured every 1 min using a model 405 nm NOx monitor (2B Technologies, Boulder, CO, USA), which directly quantifies NO2 by measuring optical extinction at 405 nm, where NO2 strongly absorbs. NO is measured by adding excess ozone into the optical cell, which quantitatively converts NO to NO2. The instrument was calibrated by the manufacturer with a detection limit of 1 ppb for NO and NO2. Ambient air was drawn at ∼ 1.5 L min−1 through ∼ 1 m of 6.35 mm ( in.) O.D. tubing and passed through a 47 mm, 5 µm PTFE filter (Savillex), which was replaced biweekly or upon visible loading.
PM2.5 and O3 were obtained from the hourly measurements at the Montana DEQ site at Boyd Park. PM2.5 measurements were conducted using a Met One BAM-1020 with VSCC inlet (Volumetric Size-Selective Cyclone), which determines particle mass by measuring the attenuation of beta radiation through the filter tape as particles accumulate. The instrument has a detection limit of 5 µg m−3 for hourly measurements. O3 was measured using an ultraviolet photometric analyzer (Thermo Scientific Model 49i UV photometric O3 analyzer), which quantifies absorption of UV radiation at 254 nm, and with a detection limit of 5 ppb. We note that the Thermo 49i instrument can exhibit positive interferences in wildfire smoke (Bernays et al., 2022; Long et al., 2021). This interference would not affect our conclusion and would, if anything, make the inferred O3 suppression and model ozone biases more conservative.
2.4 GEOS-Chem chemical transport model
We use the nested-grid GEOS-Chem CTM over North America (version 13.3.0; 10–70° N, and 140–60° W) to interpret Missoula ground-based measurements. The model is driven by the NASA GEOS-FP meteorological data, with 0.25° × 0.3125° horizontal resolution (∼ 25 km × 30 km; latitude × longitude) and 47 vertical layers extending up to 0.01 hPa (Kim et al., 2015; Wang et al., 2004). Boundary conditions were updated every 3 h from a 4° × 5° global simulation. Transport and convection time steps were 5 min; emission and chemistry time steps were 10 min. Model spin-up included a 1-year global simulation followed by a 1-week nested simulation to reduce the influence of initial conditions prior to 1 September 2020.
The chemical mechanism included detailed HOx-NOx-VOC-ozone-halogen-aerosol chemistry with fully coupled troposphere and stratosphere (Eastham et al., 2014; Mao et al., 2010; Park et al., 2004; Schmidt et al., 2016). Dry deposition used a resistance-in-series approach (Wesely, 1989), and wet deposition included scavenging of soluble tracers in convective updrafts, as well as rainout and washout of soluble tracers (Liu et al., 2001). GEOS-Chem uses the non-local scheme for PBL mixing (Lin and McElroy, 2010). As a sensitivity test, we also conducted simulations using the “full mixing” scheme, assuming instantaneous vertical mixing of tracers evenly through the mixing depth, which did not affect the conclusions we derived.
Emissions were computed using the HEMCO module (Keller et al., 2014). These include biogenic VOC emissions from MEGANv2.1 (Guenther et al., 2012) as implemented in GEOS-Chem (Hu et al., 2015). Anthropogenic emissions are from the CEDS global emission inventory, overwritten with the 2011 EPA NEI inventory for the US (Hoesly et al., 2018). Daily BB emissions were taken from the Global Fire Assimilation System (GFAS) version 1.2, chosen for its relatively better VOC performance when compared to other commonly used BB inventories over the western US (Jin et al., 2023; van der Werf et al., 2017). Following previous work (Jin et al., 2023), we expanded the default GFAS VOC speciation by adding lumped ≥ C3 aldehydes (RCHO), MEK, formic acid, and acetic acid by scaling CO BB emissions with corresponding emission ratios reported from temperate forest burns (1.01, 0.73, 9.5, and 8.61 ppb ppm−1, respectively) (Permar et al., 2021). All fire emissions followed a climatological diurnal profile, which allocates ∼ 85 % of daily fire emissions to the afternoon (local time) (Western Regional Air Partnership, 2005).
Biomass burning injection heights are prescribed with the daily 0.1° × 0.1° mean altitude of maximum injection (“mami”) product derived from a satellite-constrained plume rise model (Freitas et al., 2007; Latham, 1994; Rémy et al., 2017). For each GEOS-Chem grid cell, we computed emission-flux-weighted “mami” values to correct the grid-dependence inherent in the standard model (Jin et al., 2023). BB emissions were then distributed evenly from the surface up to this “mami”.
Overall, four nested simulations were conducted for September 2020: (i) a base run using default GFAS emissions and non-local PBL mixing scheme, (ii) a sensitivity run as the base but without fire emissions (noBB), (iii) a second sensitivity run as the base but with GFAS VOC and CO emissions tripled (3 × BB), and (iv) a third sensitivity run using GFAS and the full instantaneous mixing within the PBL mixing height.
Wildfire smoke at ground level is often detected using particle-based diagnostics, for example: (i) satellite-derived aerosol products such as the overhead information from the NOAA Hazard Mapping System (HMS) (Jaffe et al., 2022; O'Dell et al., 2021), (ii) column-integrated aerosol optical depth from AERONET, (iii) sustained elevations in surface PM2.5 relative to the general urban background (Selimovic et al., 2019, 2020), and (iv) combinations of these metrics (Kaulfus et al., 2017; McClure and Jaffe, 2018). Many studies also incorporate gas-phase tracers – initially CO, hydrogen cyanide (HCN), acetonitrile (ACN), and more recently, furan and maleic anhydride (MA) (Coggon et al., 2019; de Gouw et al., 2003, 2006; Li et al., 2000). Among these VOCs, furan is a sensitive indicator of fresh BB smoke due to its short lifetime and smaller emission amount from anthropogenic sources. In addition, MA is an oxidation product of furan and its derivatives, with a longer lifetime; thus, it has been proposed as a tracer of aged smoke (Coggon et al., 2019).
Here, we evaluate some current BB-impacted identification metrics in the context of our MSO case study and examine whether our VOC measurements provide additional value in identifying BB events in the urban setting. We first derive the hourly median diurnal urban background for BB tracers and other species using HMS “no-fire” days for September 2020. Any enhancement (ΔX) > 1.5 times the background is considered BB-impacted, and a provisional smoke day is defined when at least six such hours occur. We also tested the criterion (> 30 ) proposed for urban smoke identification (Jaffe et al., 2022). However, at MSO this threshold classified nearly all days as smoke-impacted, consistent with the limitation that becomes non-discriminating when background PM2.5 and CO are low (Jaffe et al., 2022). We therefore do not use as a standalone classifier for this site.
Figure 2 summarizes the various daily BB classifications for September 2020 in Missoula. HMS alone identifies 20 smoke days (the greatest number among the diagnostics), but it can flag a day as smoke-impacted even when surface concentrations remain low if smoke is primarily aloft. For example, HMS triggers on 2 and 30 September (daily average PM2.5 is 8.5 and 5.5 µg m−3, respectively), which likely reflect elevated plumes that were not mixed down to the surface (Liu et al., 2024). By comparison, the ΔPM2.5 criterion identifies 16 d. Its diagnostic power depends strongly on aerosol loading at the surface.
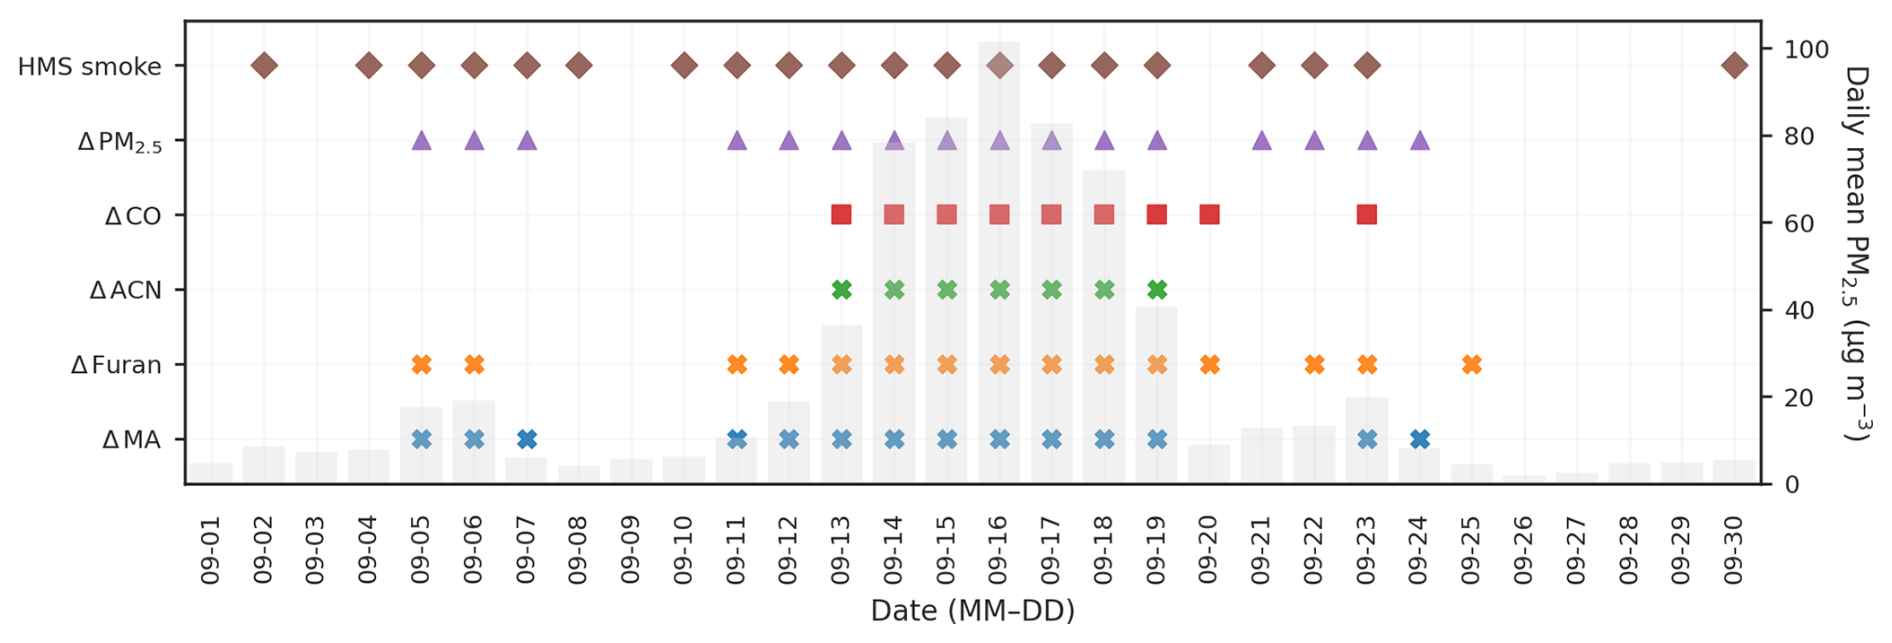
Figure 2Wildfire smoke identification in Missoula, Montana, during September 2020. Rows show the six individual smoke metrics evaluated in this study. A filled marker indicates that HMS smoke was detected, or that the enhancement of a biomass burning (BB) indicator (ΔX) exceeded 1.5× its diurnal background for at least 6 h on that calendar day. Gray bars (right axis) show the daily mean PM2.5 concentration.
When daily mean PM2.5 exceeded 35 µg m−3 (n = 7; 13–19 September), the ΔPM2.5 approach aligned with HMS and with all gas-phase tracers considered here (i.e., CO, ACN, furan, and MA), indicating concentrated smoke that coupled large aerosol mass with gaseous enhancements. A k-means clustering analysis (k = 3: smoke, no-smoke, uncertain) applied to pairwise combinations of CO, PM2.5, and each tracer corroborated this classification, reinforcing that at high aerosol loadings, routine ground-level PM2.5 alone can reliably identify smoke during summer in Missoula. We therefore classify these seven days as a high-confidence BB period.
At intermediate daily mean PM2.5 between 20 and 35 µg m−3 (n = 5; 5–6, 11–12, and 23 September), ΔPM2.5 still overlaps at least two gas-phase tracers but not all, signaling moderately aged or dispersed smoke and therefore medium diagnostic confidence. When the daily-mean PM2.5 falls below 20 µg m−3 (n = 4; 7, 21–22, and 24), PM2.5 overlaps with at most one gas tracer, and HMS does not indicate smoke on 24 September, so these low-load cases warrant only low-to-medium confidence. One additional case (21 September) meets the PM2.5 threshold but lacks corroboration from the gas-phase tracers, suggesting a potential false positive, although HMS indicates overhead smoke. Across September (a total of 30 d), the remaining 14 d do not meet the ΔPM2.5 criterion and are classified as non-smoke by this approach.
Gas-phase tracers extend the detectability of wildfire smoke beyond what is captured by HMS and PM2.5 alone, particularly during precipitation events. For example, on 20 September, CO and furan enhancements were observed in the absence of corroborating HMS smoke or elevated PM2.5. A rain event from the preceding day into the afternoon of 20 September efficiently scavenged aerosol mass, resulting in a sharp decrease of ∼ 30 µg m−3 in PM2.5, whereas gas-phase species were less affected and their enhancements persisted in the boundary layer.
Because no single tracer is definitive, we adopt a balanced multi-indicator rule: an hour is classified as smoke-impacted when at least three independent smoke indicators support smoke influence, based on HMS smoke detection and/or BB-associated species exceeding 1.5 × their background values for at least 6 h on that day. Applied to September 2020, this criterion identified 14 smoke days (5–7, 11–19, and 22–23 September). For subsequent sections, we describe the three smoke events, and we focus on the high-confidence BB period of 13–19 September to analyze its enhancement ratios, thereby minimizing uncertainties from marginal or non-BB sources.
Wildfires across the Pacific Northwest and northern California were exceptionally active in 2020 (Albores et al., 2023; Higuera and Abatzoglou, 2021; Neyra-Nazarrett et al., 2025; Reilly et al., 2022), and September delivered strong smoke signatures in Missoula. Applying the three-tracer classification described in Sect. 3, we identified 16 smoke-impacted days across confidence levels.
Figures 3 and S1 in the Supplement show three distinct multi-day smoke episodes affecting Missoula identified using the criteria described in Sect. 3, including 5–7 September (Event 1), 11–20 September (Event 2), and 22–24 September (Event 3). Because each episode involved multiple overlapping plumes from different fires with varying transport times, we refer to them as “events” rather than discrete “plumes”. Analysis of GOES-17 and VIIRS satellite imagery, and synoptic meteorological conditions indicates that these events were predominantly driven by southwesterly transport of wildfire smoke from Oregon, Idaho, and California, with likely influence from local smaller fires.
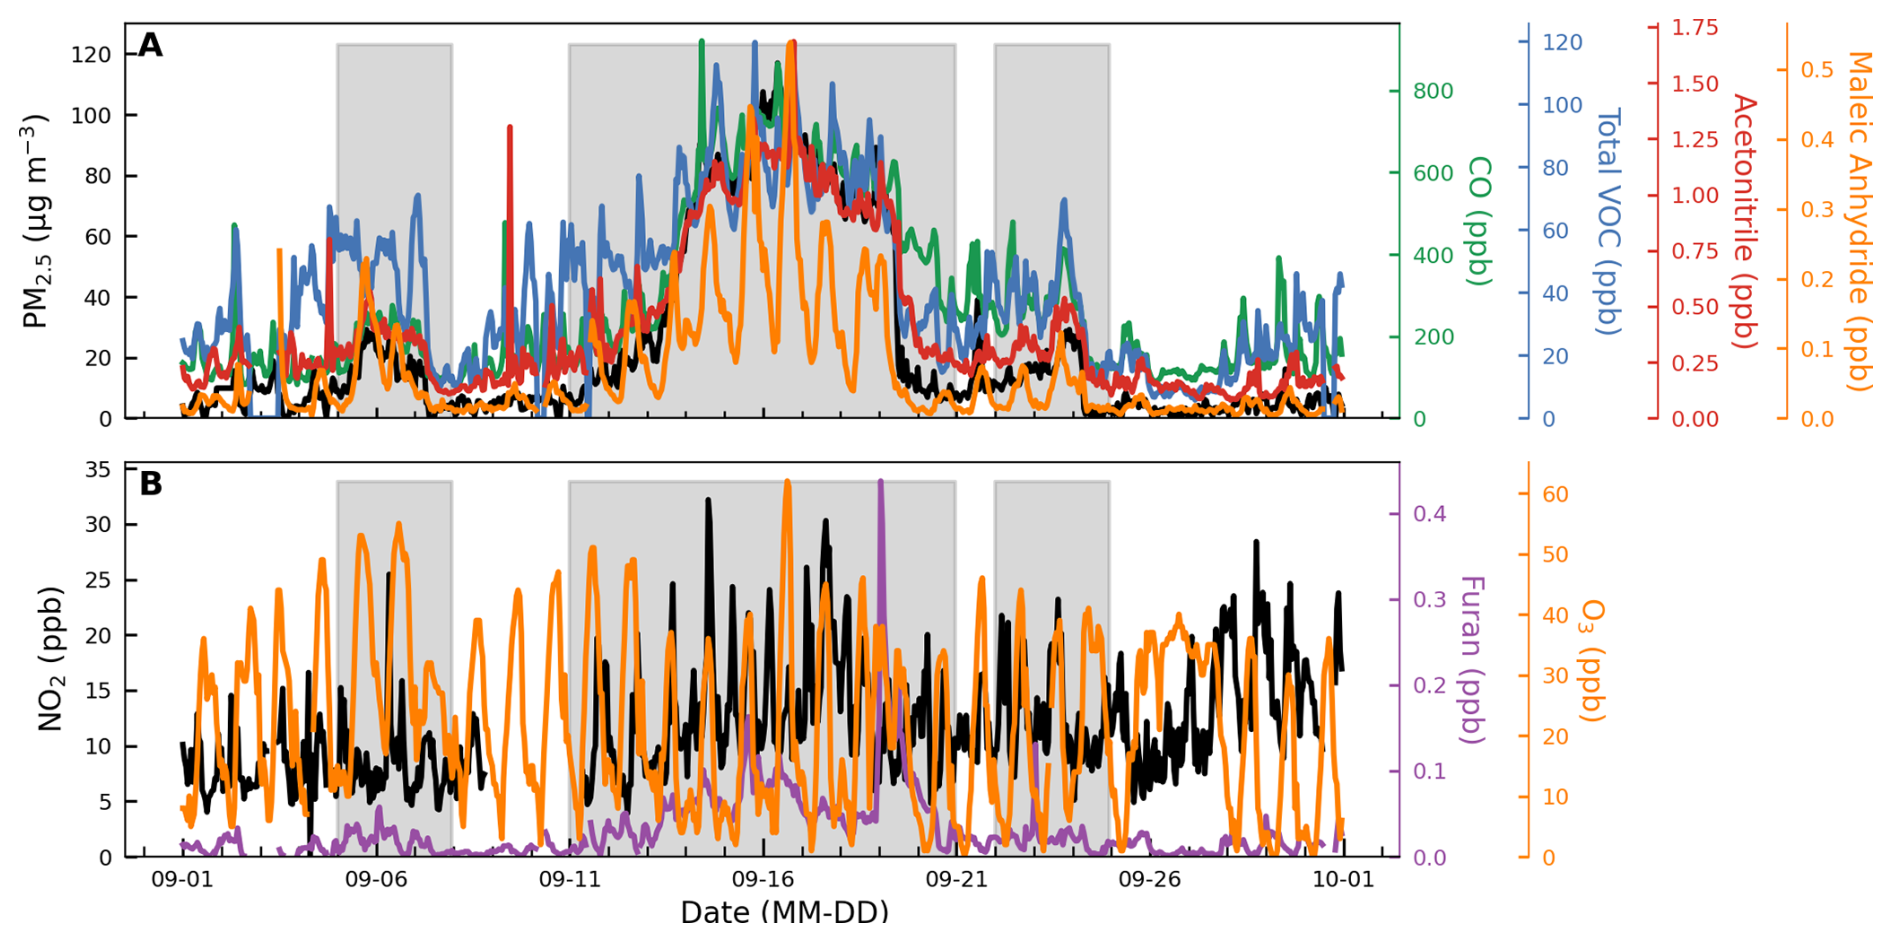
Figure 3Time series of selected VOCs and criteria pollutants in Missoula, Montana, during September 2020. Time is shown in local time (MDT, UTC−6). (A) Hourly measurements of PM2.5 (black; left axis), carbon monoxide (CO; green, right axis), total measured VOCs (blue, right axis), acetonitrile (red, right axis), and maleic anhydride (orange, right axis). (B) Concurrent hourly NO2 (black; left axis), furan (purple; right axis), and ozone (orange, right axis). Gray shading indicates smoke days based on the criteria in Sect. 3.
Event 1 (5–7 September) resulted from the California Creek Fire (United States Forest Service, 2020), which started on 4 September mixing with a localized, narrow plume moving east-northeast over the Bitterroot Mountains toward Missoula, as captured by GOES-17 imagery. Correspondingly, hourly PM2.5 increased rapidly from < 10 to 30 µg m−3 by 06:00 Mountain Daylight Time (MDT, UTC−6) on 6 September and CO from 100 to ∼ 300 ppb by 09:00 MDT the same day, with brief spikes (≤ 50 ppt) of the fresh-smoke tracer furan at 01:00 MDT. Pollutant concentrations returned to the urban background within 24 h after a post-frontal north-westerly wind flushed the valley.
Event 2 (11–20 September) was the longest and strongest impact on Missoula from the Oregon–California “megafire” complex that ignited in August and erupted on 7 September (Abatzoglou et al., 2021). Intense smoke on 8 September was advected westward offshore, where it became entrained into a cut-off low over the NE Pacific (around 42° N, 135° W), and subsequently advected eastward inland, mixing with smoke freshly emitted by the megafire complex and fires in Idaho. By 11 September, dense smoke formed a clearly visible “smoke river” that stretched across Washington, Oregon, and Idaho into western Montana. Back-trajectory analyses indicate that air parcels reaching Missoula had aged for at least two days. Consistently, smoke-impacted hours during this event exhibited pollutant enhancements of four- to fifteen-fold for CO, PM2.5, acetonitrile, and total measured VOCs (TVOCs), reaching peak values of 800 ppb CO, 120 µg m−3 PM2.5, 2 ppb acetonitrile, and 85 ppb TVOCs in mid-September. Strong correlation (r2=0.9; Fig. S2) among PM2.5 measured at the Boyd Park and other tracers measured at the UM campus indicates spatially coherent smoke influence across Missoula at the surface. Brief furan spikes (≤ 0.7 ppb) on 12–13 and 18–19 September suggest additional influence from local fires. Overall, this event accounts for ∼ 80 % of smoke hours in this month and is the focus of the enhancement ratio analysis (Sect. 5).
Event 3 (22–24 September) was a weaker resurgence of smoke from the same Oregon–California fires in Event 2. A preceding rain event on 20 September coincided with a rapid decrease in the 24 h mean PM2.5 from 40 to 10 µg m−3, whereas most gas-phase species decreased less, with CO declining from 500 to 350 ppb and total VOCs from 50 to 30 ppb. This pattern suggests preferential particle removal via precipitation scavenging and may provide a physical explanation for “smoke-present but low-PM2.5” days. It also highlights that smoke identification based on column indicators (e.g., HMS) may not always reflect surface PM exposure when precipitation occurs. Subsequent south-westerly flow reintroduced the residual, aged smoke into the region. As a result, 24 h PM2.5 concentrations reached 40 µg m−3 and hourly CO peaked at 350 ppb before a front cleared the valley, which was especially evident for PM2.5 but still leaving fire influences for trace gases.
Figure 4 compares pollutant concentrations during smoke-impacted and background periods in September 2020. On average, MDA8 ozone increased by 3 ppb (7 %) during smoke episodes, while NOx showed no visible change. In contrast, CO, PM2.5, and TVOCs were significantly elevated, with hourly concentrations increasing by a factor of 3–8 compared to urban background. Average hourly CO concentrations increased from 160 ± 80 ppb (mean ± SD of hourly data) to 420 ± 205 ppb on smoke days. PM2.5 showed even larger enhancements, rising from 6.1 ± 4.5 to 43 ± 34 µg m−3. The background CO and PM2.5 concentrations agree with typical western US urban levels (150–200 ppb and 5–10 µg m−3) (Cope et al., 2024; Lill et al., 2022; Lopez-Coto et al., 2020; Pfister et al., 2011).
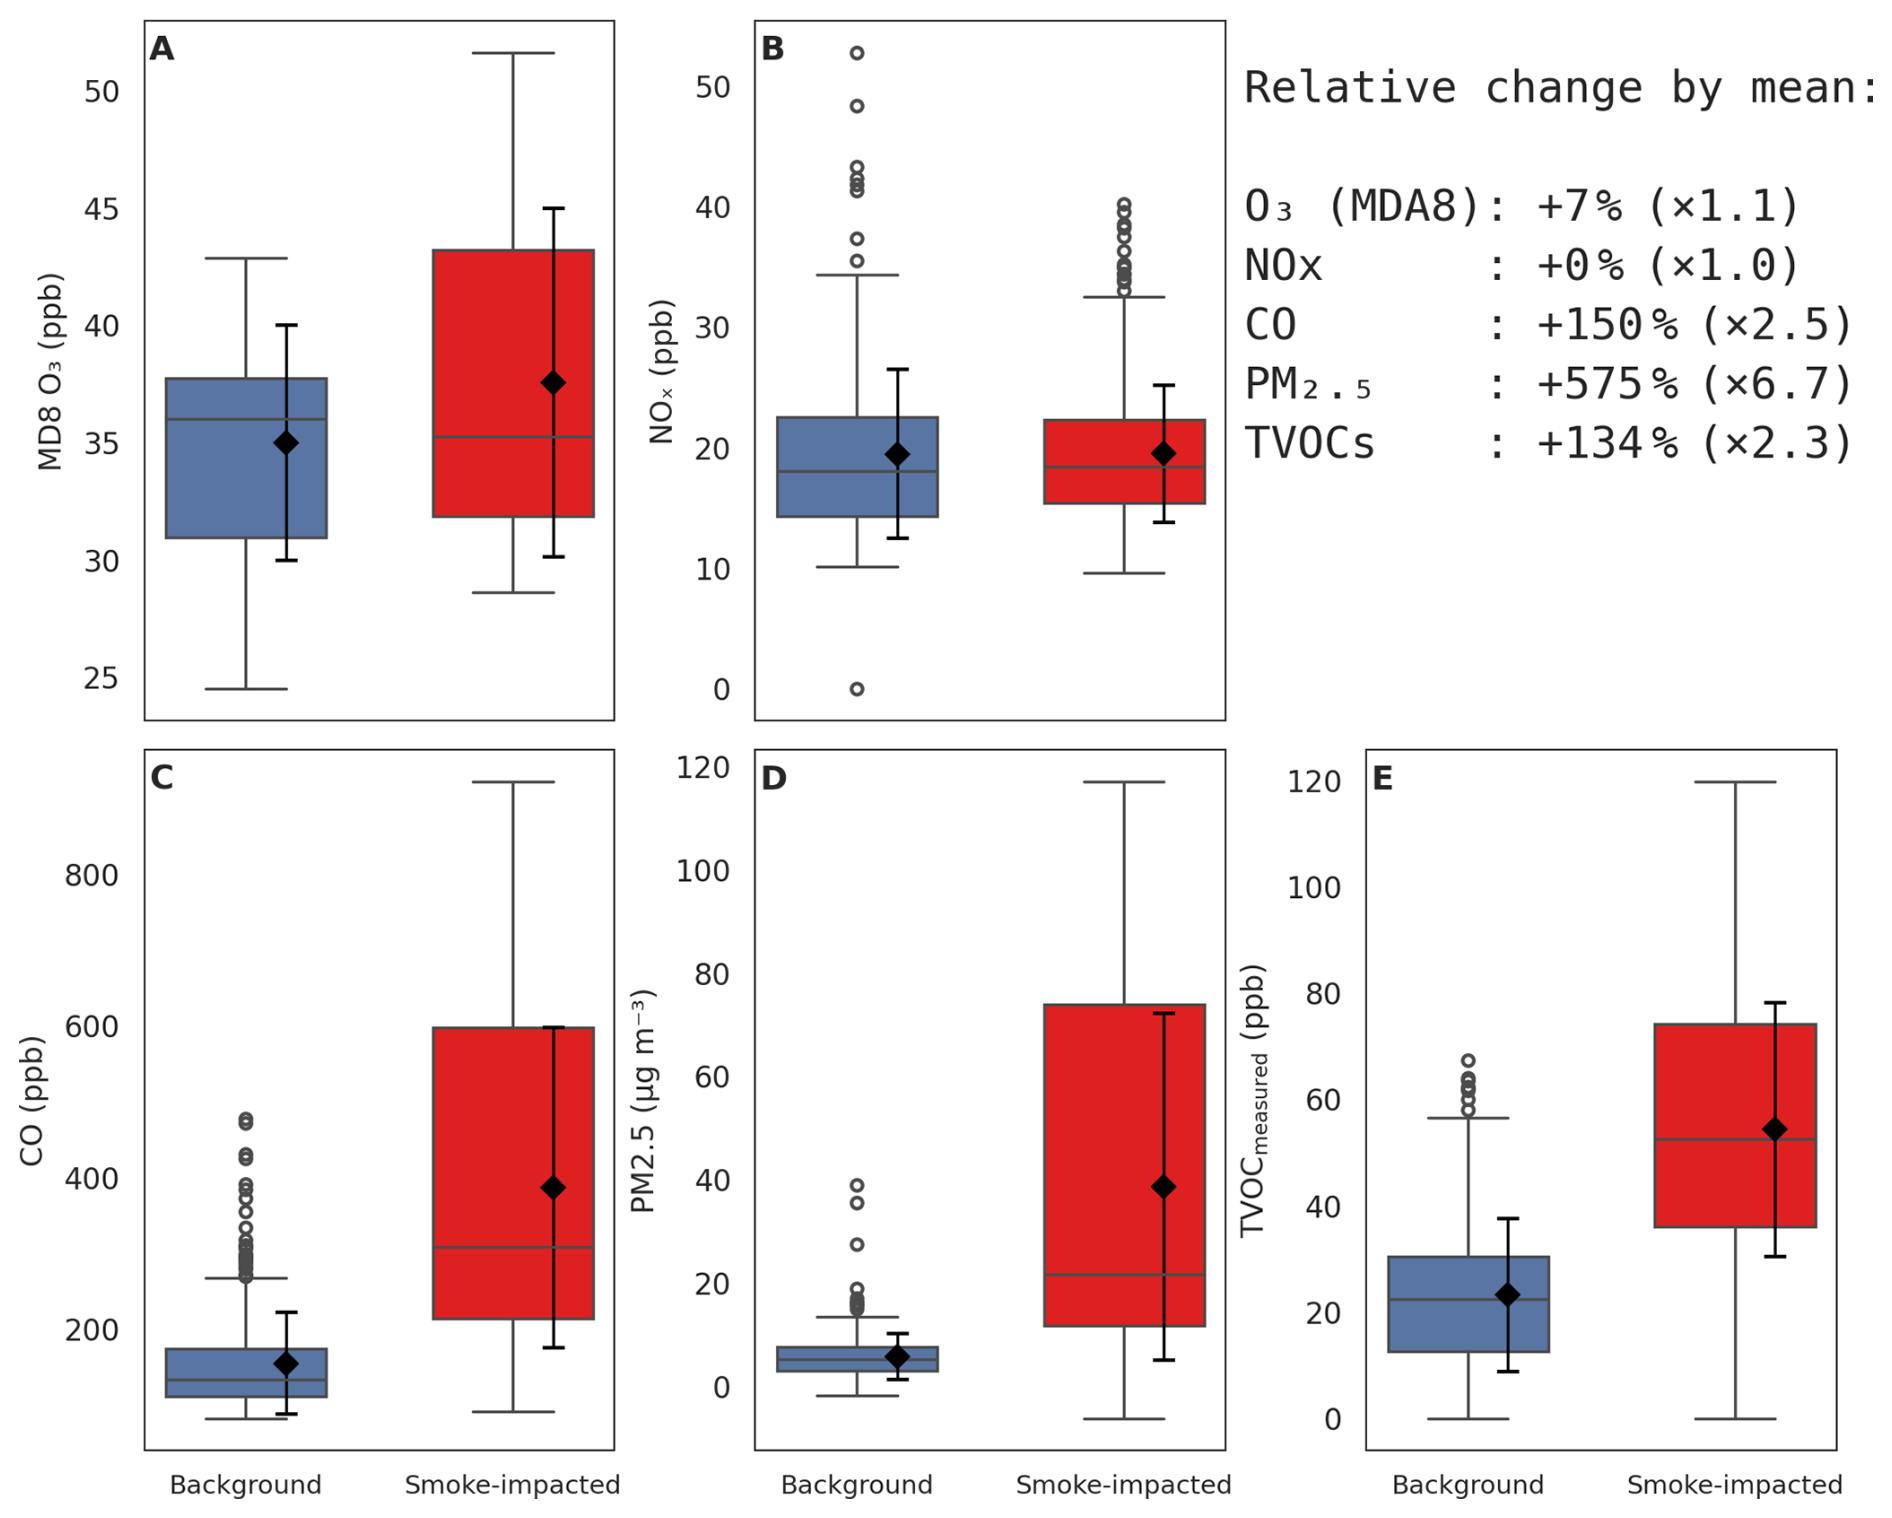
Figure 4Enhanced surface-level pollutant concentrations during smoke-impacted periods. Boxplots show (A) maximum daily 8 h average ozone (MDA8 O3) and hourly concentrations of (B) nitrogen oxides (NOx), (C) carbon monoxide (CO), (D) fine particulate matter (PM2.5), and (E) total measured volatile organic compounds (TVOCs) during smoke-impacted (red) and background (blue) periods in Missoula, Montana, during September 2020. Boxes represent interquartile ranges (25th–75th percentiles) with medians shown as center lines; whiskers extend to 1.5× the interquartile range. Black diamonds and error bars indicate mean ± standard deviation for each group. The right-hand summary block lists mean enhancement factors (smoke-impacted background) for each pollutant.
Measured hourly TVOCs tripled from 23 ± 15 to 55 ± 24 ppb, with individual species enhancements summarized in Table S2 in the Supplement. Ten VOCs increased by factors of ∼ 4–7, five of which were furanoids or their derivatives. These species included furfural, methylfurfural, 2-furanmethanol, 2-furanone, 5-hydroxy-2-furfural/2-furoic acid, maleic anhydride, acrylonitrile, methyl benzoic acid, methyl methacrylate, and anisole. Forty-eight VOCs increased by a factor of 2–4, while 16 species increased by a factor of 1–2. Fifteen of the 75 measured VOCs are on the EPA's list of HAPs, and they collectively represented 51 % of TVOCs by average molar mixing ratio. During smoke events, total HAPs (THAPs) increased threefold relative to background periods (28 ± 13 ppb vs. 11 ± 7 ppb), with individual species exhibiting enhancements ranging from 40 % (dichlorobenzene) to nearly fivefold (acrylonitrile and maleic anhydride). Figure S3 shows that OH reactivity (OHR) from CO and TVOCs approximately doubled during smoke-impacted days compared to background (13.4 vs. 6.5 s−1). During background periods, isoprene was the largest individual contributor to OHR (0.9 s−1; 13.6 % of total OHR), followed by monoterpenes (10.4 %), formaldehyde (9.0 %), CO (8.8 %), and other individual VOCs. During smoke-impacted days, CO became the largest combustion-related contributor (1.4 s−1; 10.7 %), and the relative contribution of monoterpenes fell to 5.9 %, consistent with previous urban smoke OHR analyses in Boise, ID (Permar et al., 2023). Other VOC groups show similar contributions to OHR in both periods. Together, these enhancements underscore the strong influence of regional wildfire smoke on western US air quality and motivate continued monitoring of smoke exposure in communities such as Missoula.
We further apply a photochemical-age framework to determine whether VOC enhancement ratios (EnRs) measured in aged smoke reaching Missoula still preserve interpretable source information after multi-day transport and mixing (Fig. 5). Originally developed for urban plumes, this framework provides a useful diagnostic for separating direct emissions, chemical removal and formation (de Gouw et al., 2017). Here, photochemical age is an oxidation-based metric inferred from the VOC ratio clock and should not be interpreted as the exact physical time since emission. Negative values occur when the observed toluene-to-benzene enhancement ratio exceeds the assumed initial ratio and indicate that the clock assumptions are not fully satisfied for those observations, and large uncertainty exists (Sect. S1 in the Supplement). For primary VOCs, linear fits of ln(EnR) versus photochemical age yield back-extrapolated time-zero emission ratios (ERs) and effective OH rate constants (kOH) under the assumption of plume-integrated aging. For oxygenated VOCs (OVOCs), the same relationships are interpreted qualitatively because secondary formation can offset chemical loss. We provide methodological details in Sect. S1.
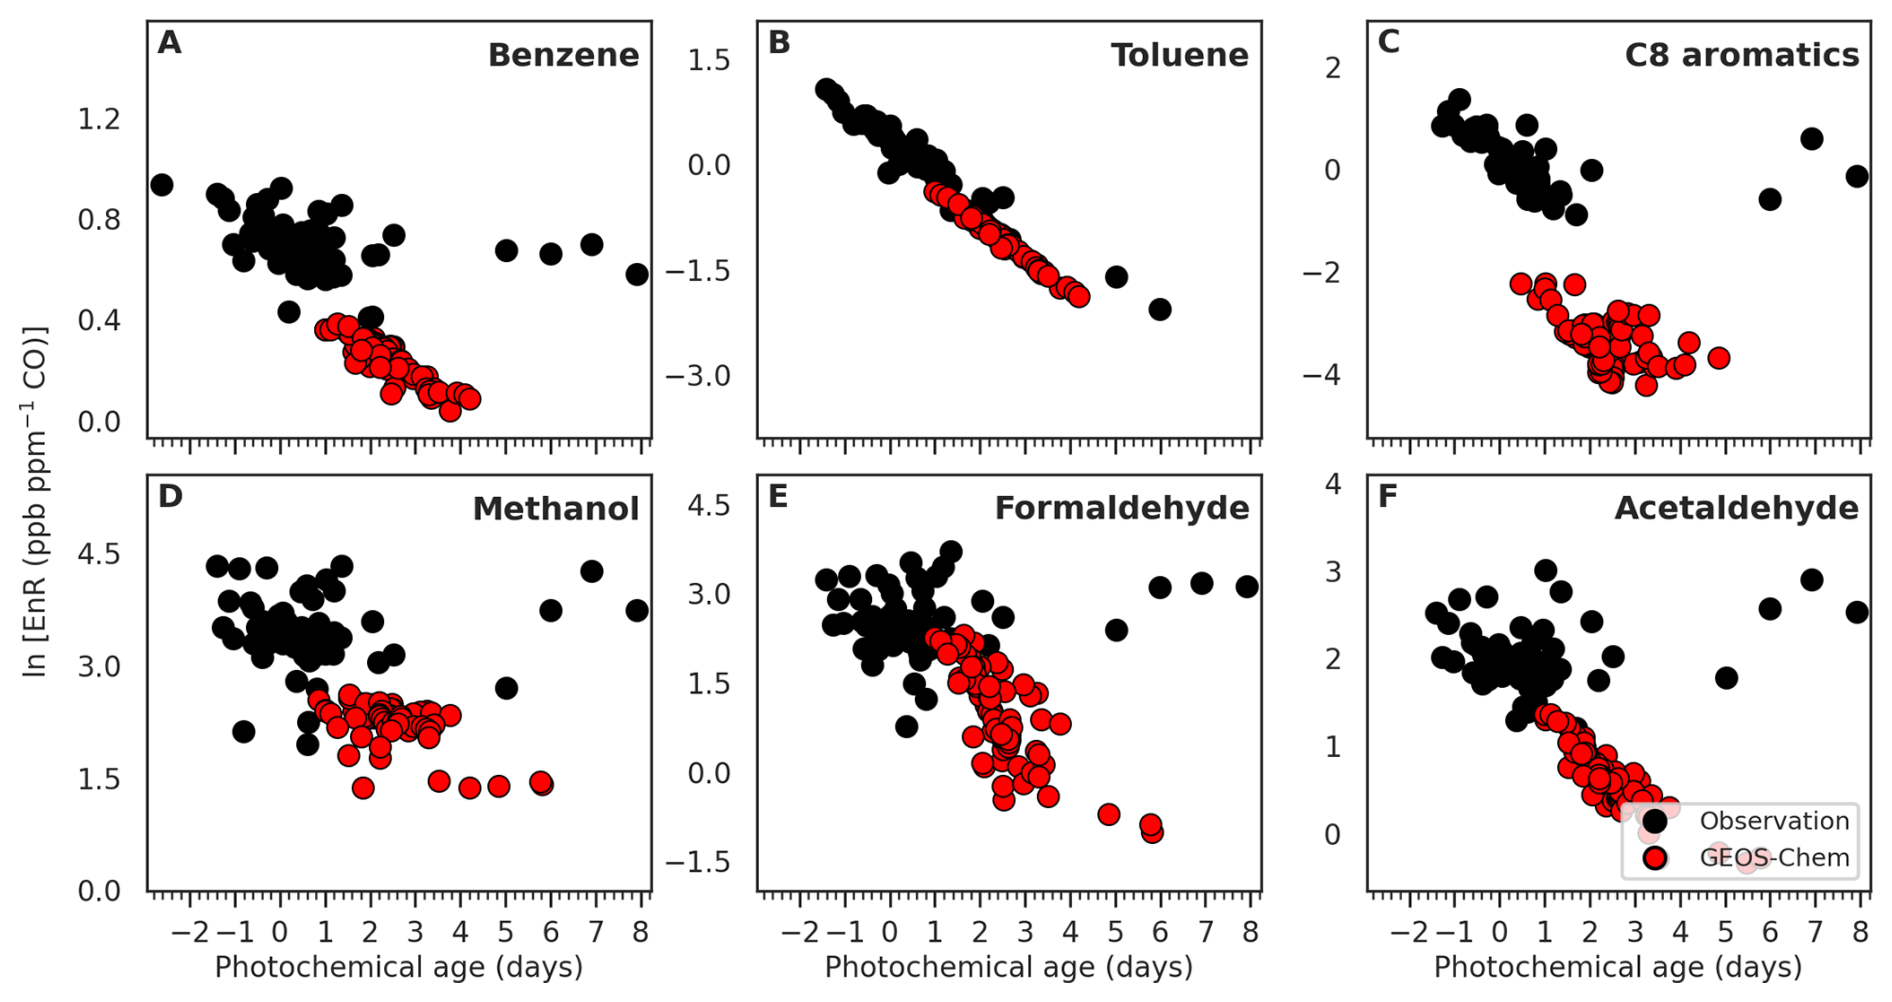
Figure 5Observed and modeled enhancement ratios (EnR) of key volatile organic compounds (VOCs) versus photochemical age. Panels show ln(EnR) versus photochemical age for (A) benzene, (B) toluene, (C) C8 aromatics, (D) methanol, (E) formaldehyde, (F) acetaldehyde, where EnR is defined as (ppb ppm−1 CO). Observations are shown as black circles and results from GEOS-Chem driven by GFAS fire emissions are shown as red circles. Points represent consecutive 3 h binned data during the main aged-smoke event. Photochemical age is derived from the toluene-to-benzene ratio clock (Sect. S1).
For relatively long-lived primary aromatics, the framework-inferred ERs are physically reasonable, indicating that aged smoke arriving in Missoula still retains measurable source signatures for these species, though the high general urban background, the initial fire emission ratio, and the potential mixing of different sources during transport introduce uncertainties that are hard to resolve. Nevertheless, if we infer back-extrapolated time-zero ERs, this approach estimates 2.05 ± 0.02 ppb ppm−1 for benzene and 1.42 ± 0.02 ppb ppm−1 for toluene relative to CO. These values agree with near-source ranges reported from the WE-CAN and FIREX-AQ campaigns within ∼ 20 % (benzene: 1.8–2.3 ppb ppm−1; toluene: 1.2–1.5 ppb ppm−1) (Gkatzelis et al., 2024; Permar et al., 2021), and are the same as what we inputted for the photochemical age calculation (benzene/toluene fire emission ratio of 0.7 ppb ppb−1; Sect. S1; Eq. S1). This agreement indicates that the framework can recover plausible source-like ERs for relatively unreactive primary species even after multi-day transport. However, inferred ERs for C8–C10 aromatics are higher than published near-source wildfire values by roughly a factor of 2–3, suggesting that these species were substantially influenced by non-fire sources during transport. Urban mixing is a likely contributor, consistent with city-based measurements showing elevated aromatics relative to CO during wildfire-smoke periods (Cope et al., 2024).
Beyond ER derivation, the ln(EnR)-age framework also provides insight into the net photochemical evolution of VOCs and is not sensitive to an accurate time-zero estimate, unlike ERs. For primary VOCs, EnRs decreased significantly with photochemical age (p≪ 0.01), and the relative decay rates broadly tracked their OH rate constants (kOH). For example, benzene exhibited only modest decay over 1 week of photochemical aging, whereas toluene and C8 aromatics decayed more rapidly, consistent with their higher reactivity. The inferred kOH values (Sect. S1; Eq. S7) were (9.8 ± 1.6) × 10−13 and (5.6 ± 0.2) × 10−12 for benzene and toluene, respectively. These values agree with the literature within ∼ 10 %–20 % and, again, agree with our photochemical age estimates. For C8 aromatics, the inferred kOH (7.9 × 10⁻¹² ) lies between those of ethylbenzene and the xylene isomers, as expected for a lumped mixture.
The framework becomes less robust for more reactive hydrocarbons and OVOCs. Effective kOH values inferred for C9–C10 aromatics and small alkenes are lower than literature values by factors of 3 or more, indicating that simple plume-integrated first-order loss does not adequately describe these compounds in aged smoke. A likely reason is that the most reactive species were already preferentially removed during the earliest, OH-rich stage of plume evolution, before the smoke reached Missoula. Additional uncertainty likely arises from dilution, urban mixing, background correction, and species lumping. OVOCs such as methanol, formaldehyde, and acetaldehyde, exhibited weaker and often statistically insignificant ln(EnR)-age trends (p ≈ 0.02–0.21), and in several cases the relationships flattened with age. Such behavior is consistent with secondary production partially offsetting chemical loss, while additional contributions from non-fire sources such as biogenic emissions may further obscure the relationships. Together, these results show that the ln(EnR)-age framework remains informative for relatively long-lived primary VOCs, but becomes progressively less diagnostic for reactive hydrocarbons and especially OVOCs in regionally aged smoke.
To complement the age-framework analysis, we also calculated event-integrated EnRs of PM2.5 and 27 VOCs relative to CO as bulk descriptors of the aged-smoke event. These values provide an observational reference for VOC-to-CO relationships in regionally aged smoke and are also used for model evaluation in Sect. 8. Species-level values and literature comparisons are provided in Table S3 and Fig. S4.
Figure 6 shows the relationship between maximum daily 8 h average (MDA8) O3 and daytime mean PM2.5 at Missoula during September 2020. During the strongest smoke episodes, observed MDA8 O3 was suppressed by up to ∼ 15 ppb (e.g., 6–7 September; Fig. 6A). These decreases coincide with ∼ 50 % reductions in downwelling shortwave radiation (SW) (Fig. S5A), a first-order proxy for actinic flux and photolysis J(NO2) and J(O1D), consistent with reduced radical production and in situ O3 formation. Consistent with Fig. 4, MDA8 O3 was only ∼ 3 ppb (7 %) higher during smoke-impacted periods than during the September 2020 background, while NOx showed no discernible enhancement. In addition, heavy smoke was associated with lower observed daytime maximum temperature and a shallower planetary boundary layer height (PBLH) (Fig. S5B–C), which may further reduce surface ozone by slowing reaction rates and weakening entrainment of O3-rich air aloft.
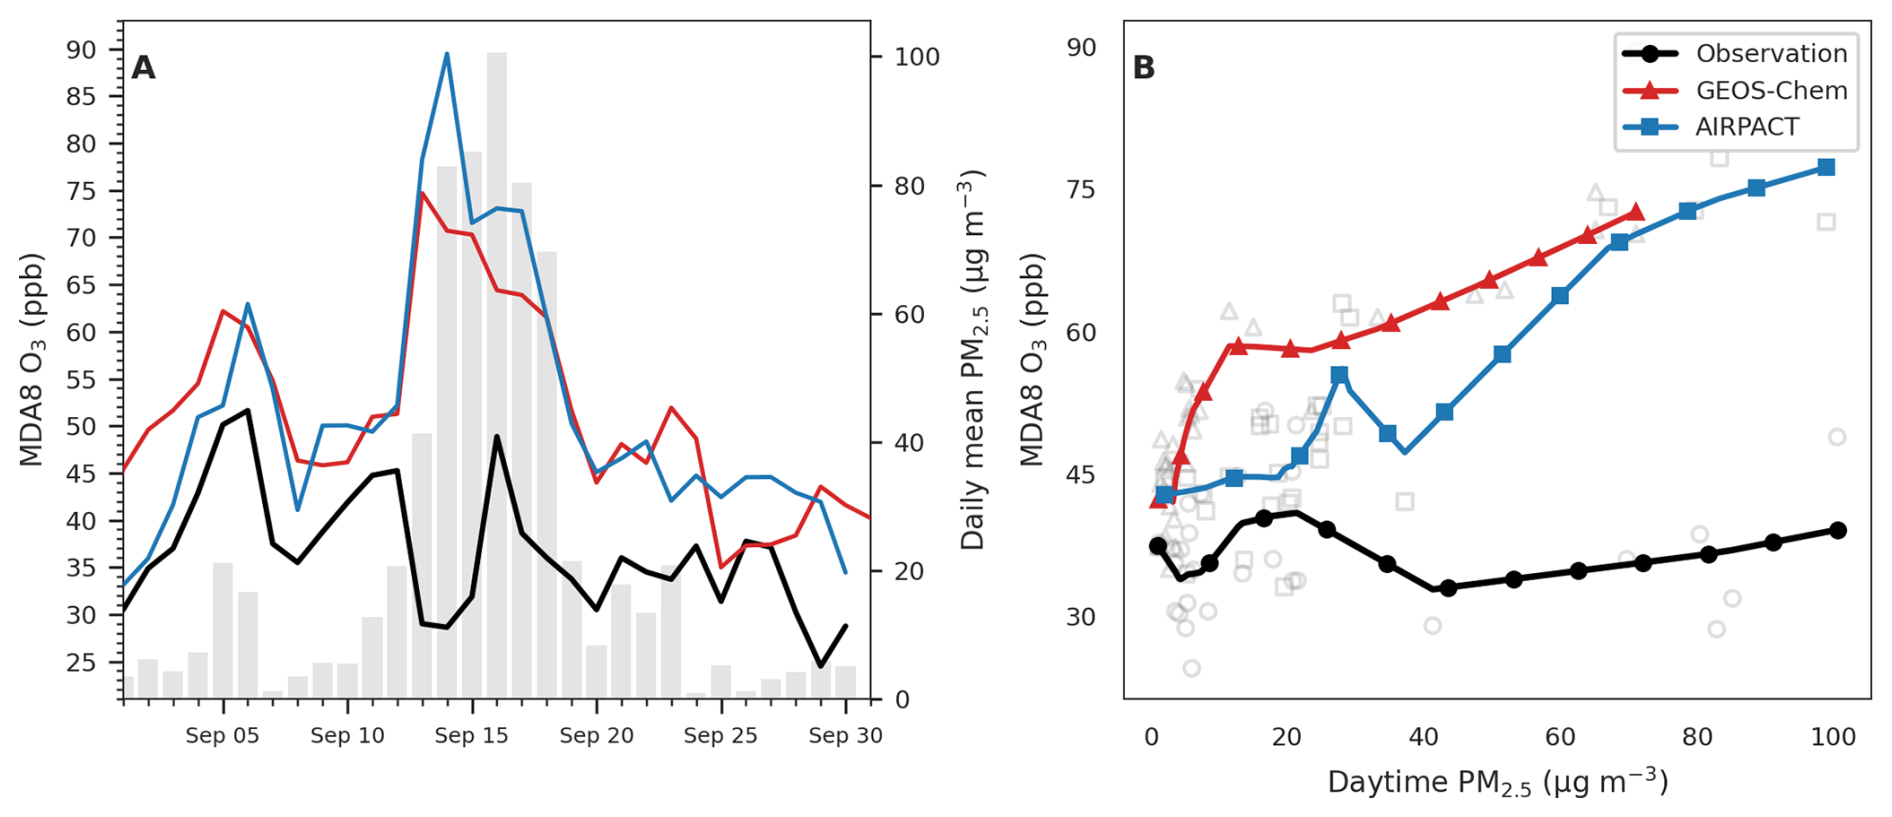
Figure 6Temporal evolution and PM2.5 dependence of maximum daily 8 h average ozone during September 2020. (A) Time series of daily maximum 8 h average ozone (MDA8 O3, ppb) from surface observations (black), GEOS-Chem driven by GFAS fire emissions (red), and the AIRPACT forecast system (blue). Shaded bars (right axis) show observed daily mean PM2.5 (µg m−3), providing context for smoke influence. (B) Relationship between MDA8 O3 and daytime PM2.5 for observations (circles), GEOS-Chem (triangles), and AIRPACT (squares). Open gray symbols show individual daily values for observations and model simulations. Solid curves denote locally weighted regression (LOWESS) fits applied consistently across datasets (smoothing fraction = 0.5; robust iteration = 3). AIRPACT data were obtained from the Washington State University AIRPACT data portal (https://airpact.wsu.edu/, last access: 30 July 2026). LOWESS curves are shown as descriptive guides.
Across the limited number of BB days, the relationship between MDA8 O3 and daytime mean PM2.5 is non-monotonic (Fig. 6B). A locally weighted scatterplot smoothing (LOWESS) curve suggests that MDA8 O3 increases at low PM2.5 (< ∼ 20 µg m−3), but decreases at moderate PM2.5 (∼ 20–60 µg m−3). The non-monotonic relationship may reflect limited local O3 production in the absence of a concurrent NOx enhancement, together with reduced photochemistry at higher aerosol loadings.
The non-monotonic behavior is not unique to Missoula but is also evident across other northwestern sites during the same September 2020 period. At Cheeka Peak (WA) and Eugene (OR), both of which were near BB sources during that month, daily PM2.5 reached up to 250 and 450 µg m−3, respectively. O3 similarly increased with PM2.5 under low smoke but leveled off or declined at higher aerosol loadings (Fig. S6). Similar nonlinear O3–PM2.5 relationships have been reported in multi-year, multi-site analyses across the western US, with O3 increasing with PM2.5 under light-to-moderate smoke and decreasing under heavier smoke (Buysse et al., 2019; McClure and Jaffe, 2018).
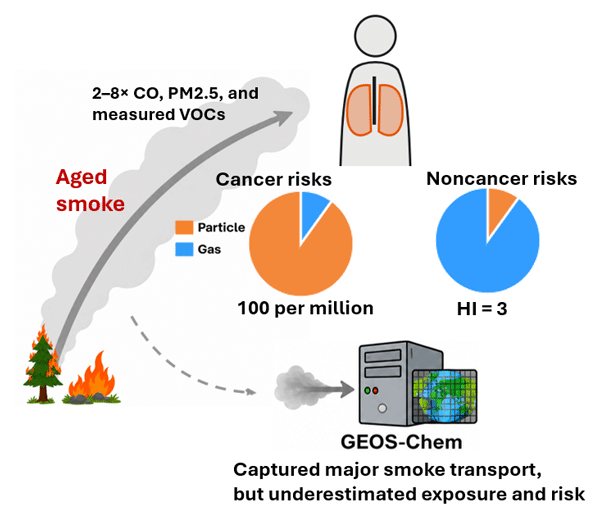
Figure 7 summarizes the upper-limit chronic inhalation risks from wildfire smoke, assuming that a 2020-style wildfire season were to recur annually over a 70-year lifetime. We do not seek to estimate the total public-health burden of wildfire smoke, but instead use several well-defined screening metrics for PM2.5 and HAPs with available toxicity values as a transparent basis for comparison. Methodological details are described in Sect. S2. Over lifetime exposure (70 years), the total excess cancer risk attributable to wildfire smoke is 100 cases per million people. Roughly 90 % of this smoke-driven risk is attributed to PM2.5, with the remaining 10 % arising from HAPs combined. Among HAPs, the major contributors are formaldehyde (42 % of HAP cancer risk), benzene (34 %), acetaldehyde (8 %), acrylonitrile (9 %), and naphthalene (6 %). These relative contributions agree with recent aircraft observations of lofted plumes and confirm that PM2.5 dominates cancer risk both aloft and at ground level (Pye et al., 2024).
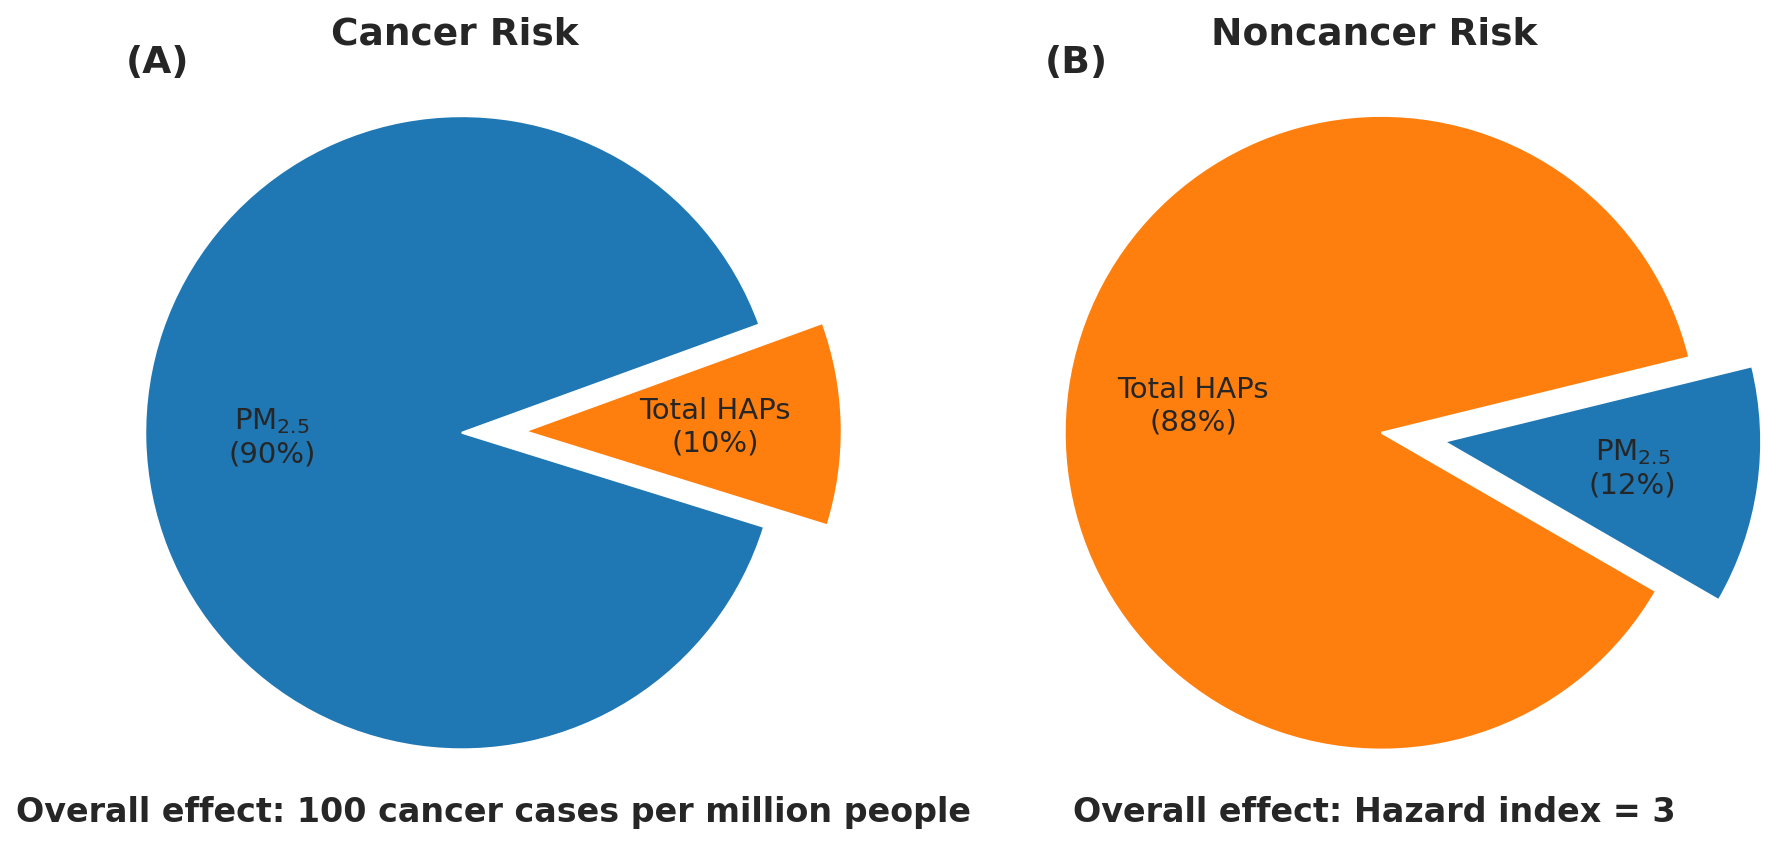
Figure 7Chronic health risk from fine particulate matter (PM2.5) and hazardous air pollutants (HAPs). (A) Estimated excess cancer risk (cases per million people) attributed to ambient PM2.5 versus all combined HAPs. (B) Noncancer hazard index (HI) attributed to ambient PM2.5 versus combined HAPs. In each panel, slices are exploded for clarity, and labels show the percentage of total risk contributed by each component. The bottom annotation reports the overall risk magnitude: total cancer cases per million for panel (A) and HI for panel (B).
For context, the climatological annual-mean of non-smoke background PM2.5 is ∼ 6 µg m−3 in Missoula. If the same BB-impacted days had instead experienced typical non-smoke background concentrations, the corresponding PM2.5-attributable excess cancer risk would be ∼ 15 cases per million people. Thus, the 2020-style wildfire season increases the PM2.5-attributable cancer risk by ∼ 7× relative to the PM-related baseline. Even using a 10-fold lower PM2.5 unit-risk estimate (4.8 × 10⁻⁵ µg−1 m3), PM2.5 still accounts for ∼ 50 % of the total cancer risk, with the total risk remaining ∼ 20 cases per million people (i.e., ∼ 30 % higher than the baseline). Thus, even when the community's exposure to wildfire smoke is annualized and a lower-bound PM2.5 unit-risk estimate is used, aged wildfire smoke at the level experienced in September 2020 in Missoula still shows a quantifiable carcinogenic burden.
Non-cancer chronic risk is expressed as a hazard index (HI), with the dominant effects in this study associated with respiratory and cardiopulmonary systems. The full calculation framework is provided in Sect. S2. The calculated HI = 3 indicates appreciable potential for adverse effects. HAPs account for ∼ 90 % of this index, driven by acrolein (60 % of HAP non-cancer risk), formaldehyde (24 %), acetaldehyde (3 %), and all other species (< 1 % each). PM2.5 contributes to the remaining ∼ 10 %. The result contrasts with aircraft-based assessments, in which PM2.5 dominated non-cancer risk (O'Dell et al., 2020; Pye et al., 2024). The lower relative contribution of PM2.5 observed here likely reflects the evaporation of semi-volatile particulate mass as plumes descend from aloft to the surface (Pagonis et al., 2023; Selimovic et al., 2019, 2020). If PM2.5 were assumed 10 times more toxic, it would instead contribute ∼ 70 % of the HI.
No acute reference exposure levels (RELs) are available for PM2.5, so the acute HI analysis was restricted to HAPs. During September 2020, 719 of 720 one-hour windows exhibited HI < 1, implying negligible acute non-cancer concern. A single exceedance (19 September, HI = 1.05) was apportioned to acrolein (52 %), formaldehyde (32 %), benzene (12 %), and other HAPs (< 5 %). Expanding to eight-hour windows (Fig. S7), 49 % of periods remained below the HI = 1 threshold, whereas 51 % exceeded it, aligned with smoke incursions. Of the exceedances, 30 % fell within HI = 1–2 and 21 % reached up to HI = 5. The 8 h hazards were driven by formaldehyde (38 %), acrolein (31 %), and benzene (29 %), with all other HAPs contributing < 2 %.
The recurrence of the same three drivers across acute and chronic metrics highlights two practical needs. First, smoke-impacted communities would benefit from continuous, high-time-resolution monitoring of formaldehyde, acrolein, and benzene to track rapidly evolving exposures and guide advisories. Second, because particle-only strategies do not address these gases, indoor interventions should pair particle filtration (HEPA or MERV 13+ for PM2.5) with sorbent media (e.g., activated carbon) when using indoor air cleaners during smoke events (Maximoff et al., 2022; May et al., 2021).
8.1 Model uncertainties in fire emissions and OH exposure
Figure 8 compares hourly observations of CO, PM2.5, and four representative VOCs with model simulations; additional VOC comparisons are shown in Fig. S8. The default GEOS-Chem simulation captures the timing of smoke-impacted enhancements during the first two events (5–7 and 11–20 September), with high correlations (R2 = 0.8–0.9 for hourly measurements). The agreement indicates that the model generally captures the timing, transport, and location of fire smoke. However, the model fails to reproduce the observed enhancements during Event 3 (22–24 September), likely reflecting overly efficient modeled wet scavenging during the 21 September rainout and/or unresolved smoke transport pathways discussed in Sect. 4.
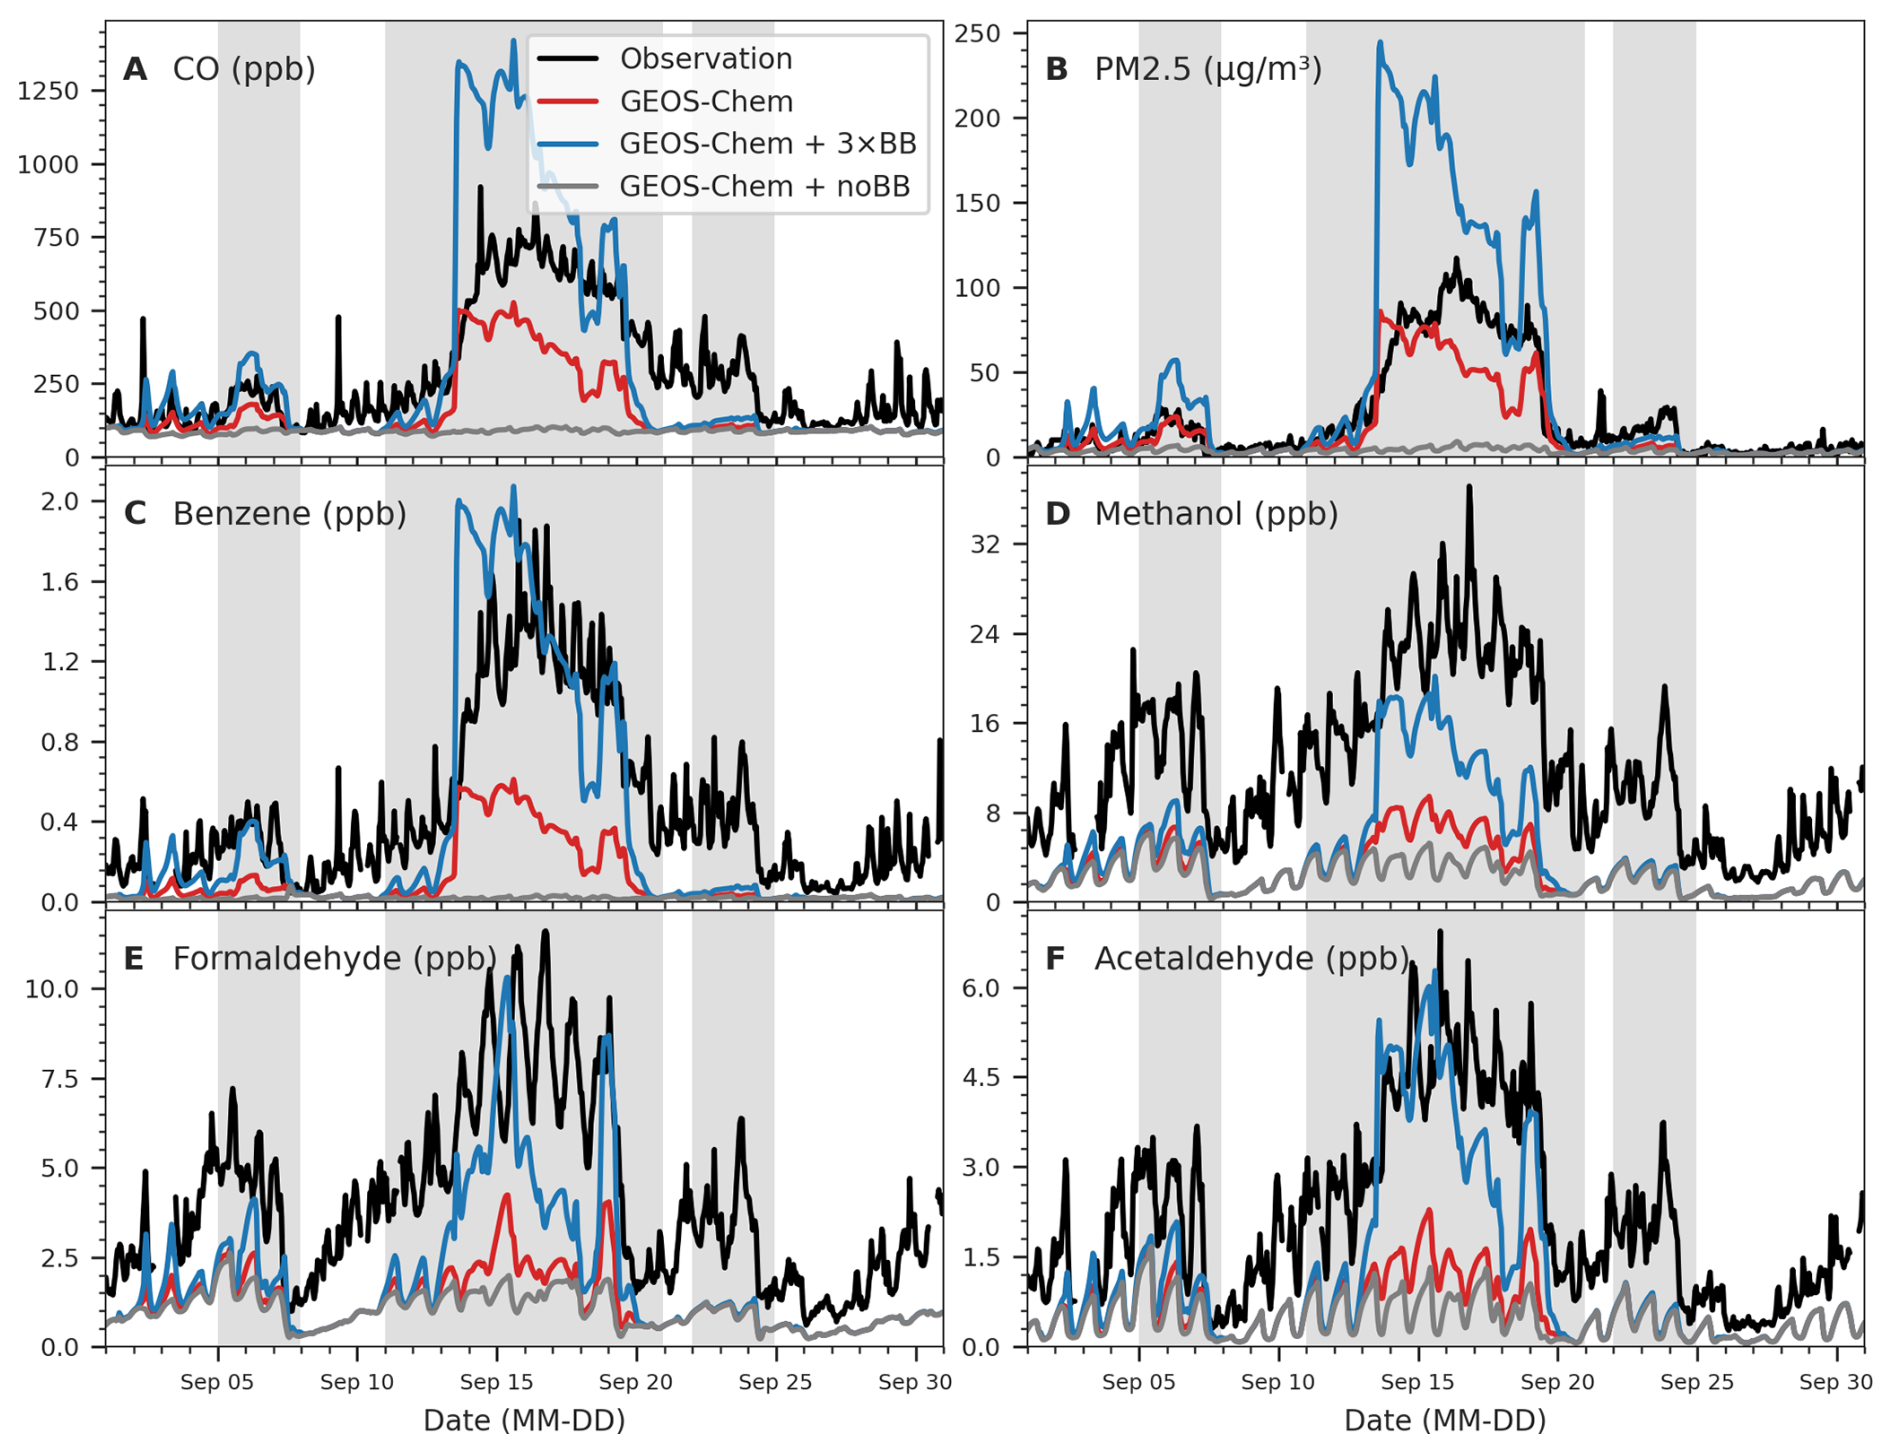
Figure 8Time series of observed and modeled concentrations for key pollutants during September 2020 in Missoula, Montana. Observations (black lines) are compared with the base GEOS-Chem simulation (red). Also shown are two model sensitivity tests: one with tripled biomass burning emissions (GEOS-Chem + 3 × BB; blue) and one with biomass-burning emissions turned off (GEOS-Chem + noBB; gray). Panels show hourly averaged concentrations of (A) carbon monoxide (CO), (B) fine particulate matter (PM2.5), (C) benzene, (D) methanol, (E) formaldehyde, and (F) acetaldehyde. Model outputs are sampled at the observational location and time. Gray shading indicates smoke-impacted days based on the criteria in Sect. 3. The modeled PM2.5 is calculated offline from the SpeciesConc diagnostic as the sum of inorganic ions (1.10 × ), black carbon (BCPI + BCPO), organic matter ((OCPO + 1.05 × OCPI) × OM:OC), fine dust (DST1 + 0.30 × DST2), sea salt (1.86 × SALA), and secondary organic aerosol (1.05 × (T).
Even during Events 1–2, GEOS-Chem underestimates the magnitude of fire impacts, with low biases of 30 %–40 % for CO and PM2.5, 60 %–80 % for primary aromatics, and 50 %–90 % for most OVOCs. Model performance during background periods is notably better, suggesting BB-related emissions and/or chemistry drive the majority of these underestimations under smoky conditions. MEK is the only exception, showing an average high bias of ∼ 20 %, reflecting overestimated anthropogenic or biogenic emissions, as pointed out in earlier studies (Chen et al., 2019; Jin et al., 2023).
GEOS-Chem systematically underestimates event-integrated VOC EnRs by 35 % for benzene and 60 %–80 % for other VOCs (Fig. S9), despite ERs being reproduced within ∼ 20 %–40 % in Fig. 5 and other work (Jin et al., 2023). This ER–EnR decoupling points to chemistry-related biases: the model overpredicts plume photochemical age (Fig. 5) and OH exposure (by ∼ 100 %; Fig. S10), which over-oxidizes VOCs relative to CO and depresses EnRs. For OVOCs, the negative bias of EnRs likely also reflects missing secondary production, particularly for methanol, formaldehyde, and acetone, which exhibit multi-day growth in aged smoke in Fig. 5 and previous work (Alvarado et al., 2020; Bates et al., 2021; Holzinger et al., 2005; Jin et al., 2023). By contrast, GEOS-Chem overestimates the event-integrated PM2.5 EnR by ∼ 33 %, implying excessive PM2.5 produced (or retained) per unit CO, consistent with the reported biases in the simplified GEOS-Chem SOA scheme used here (Oak et al., 2022; Pai et al., 2019).
Our previous study using airborne observations to constrain total western wildfire emissions showed that GFAS likely underestimates the fuel consumed in these fires by a factor of three (Jin et al., 2023). Thus, we conducted a 3 × BB sensitivity test, which improved overall model agreement with 2020 MSO measurements and reduced modeled OH by ∼ 2×. This lowered the OH-exposure positive bias from ∼ 100 % to ∼ 30 % during Missoula smoke episodes. The remaining modeled OH positive bias likely reflects missing OH reactivity from unrepresented compounds such as furanoids (Coggon et al., 2019; Jin et al., 2026; Permar et al., 2023). Correspondingly, gas-phase NMBs improve on average across smoke-impacted periods (CO: −40 % to +20 %; benzene: −70 % to −10 %; toluene: −80 % to −50 %), although CO appears to be overcorrected during some periods, especially Event 2. Several OVOCs remain substantially underestimated (e.g., methanol −80 % to −50 %; formaldehyde −70 % to −40 %; acetaldehyde −75 % to −35 %; acetic acid −80 % to −45 %; acetone −60 % to −40 %), consistent with missing secondary production as a likely cause of the persistent OVOC low bias. Meanwhile, PM2.5 shifts from a −30 % bias to a +80 % bias, indicating that a uniform BB scaling cannot reconcile gases and aerosol. It also points to limitations in the default GEOS-Chem “simple SOA” fire treatment, where the SOA precursor tracer (SOAP) is parameterized proportional to BB CO; scaling fire CO therefore scales SOAP and can over-amplify OA and PM2.5 during smoke events.
8.2 Model uncertainties in ozone formation under high PM2.5
GEOS-Chem overestimates MDA8 O3 in September of 2020 by ∼ 15 ppb on average and fails to capture the observed day-to-day variability (Fig. S11), regardless of the BB emission scenario (noBB, base, or 3 × BB). The persistent positive bias in the noBB simulation suggests an overestimate of background MDA8 O3. Biases further increase on smoke days, reaching up to ∼ 70 ppb at Missoula and scaling with observed daytime PM2.5 in the base model (r ≈ 0.7) (Fig. S12). Similar smoke-amplified positive ozone biases have been reported in other CTMs (e.g., CMAQ-based simulations; Fig. 6A) and in prior CTM work (Baker et al., 2016, 2018; Zhang et al., 2014), suggesting that regional-to-global CTMs may systematically overestimate background O3 and/or net O3 production under BB influence.
However, the main value of this analysis is not simply to document another case of positive O3 bias in smoke. Rather, Fig. 6B shows that GEOS-Chem does not reproduce the observed non-monotonic O3–PM2.5 relationship. At Missoula, the model captures the initial O3 increase when PM2.5 is below ∼ 30–40 µg m−3, but it predicts increasing O3 at higher PM2.5, whereas observations flatten or decline beyond this threshold. A similar failure is evident in AIRPACT, a publicly available regional air quality forecasting system (Chen et al., 2008; Vaughan et al., 2004). Across Missoula and other western US sites (e.g., Eugene, OR; Yreka, CA; Cheeka Peak, WA; Fig. S6), observations show strong O3 suppression under heavy smoke, while AIRPACT predicts a monotonic increase of O3 with PM2.5. Together, these consistent biases across two independent CTM frameworks point to a shared model limitation in representing the nonlinear ozone response under intense BB smoke, which may partly explain the positive O3 bias commonly seen in CTMs under wildfire influence.
Part of the positive model bias may reflect errors in meteorological processes under smoke conditions. First, GEOS-Chem captures the relative reduction in broadband shortwave radiation on smoke days, suggesting reduced photolysis (i.e., J(O1D) and J(NO2)), but it still overestimates the absolute downwelling shortwave flux by ∼ 25 % during smoke-impacted periods (versus ∼ 20 % during non-BB periods) (Fig. S5). These “over-sunny” conditions likely result in excessive radical production, although we lack observed J values for a direct photolysis evaluation. Second, model temperature is biased high by +1.13 °C on smoke days (implying ∼ 20 % faster PAN thermal loss at ∼ 289 K), which could favor enhanced NOx recycling and contribute to higher modeled O3. Third, model PBLH tracks the temporal variability of assimilated products (e.g., HRRR, 3 km) but is higher by ∼ 500 m (33 %) during smoke. The elevated PBLH can increase entrainment of O3-rich air from aloft and thereby contribute to higher modeled background O3. In addition, heterogeneous loss in BB plumes may be too weak (Decker et al., 2019, 2021), which could prolong NOx lifetime and contribute to overproduction of O3 under smoke (Shen et al., 2025). We cannot attribute the discrepancy to a single process, but collectively these factors provide a plausible explanation for the spurious modeled MDA8 O3 increases during heavy smoke and the growth of the O3 error with PM2.5.
8.3 Model uncertainties in health-risk estimates
GEOS-Chem captures the order of magnitude of the smoke-attributable excess lifetime cancer risk but still underestimates it by ∼ 40 % (63 vs. 100 per million), primarily due to its low bias in PM2.5. Because cancer risk is dominated by PM2.5 whereas HI is driven by a small number of high-potency HAPs, model errors in HAP composition have a much larger impact on HI than on cancer risk. Accordingly, the base simulation substantially underestimates chronic non-cancer risk (HI ≈ 0.3, ∼ 10× lower than observed). For acute risk, GEOS-Chem predicts no 1 h HI exceedances (max 1 h HI = 0.2) and only limited 8 h exceedances (15 h with HI > 1; max 8 h HI = 1.2), far fewer and weaker than observed (476 h; max 8 h HI = 6.3).
In the 3 × BB sensitivity run, the modeled cancer risk increases to 155 per million (exceeding the observation-based estimate), highlighting the uncertainty in modeled PM2.5 under smoke conditions. Acute non-cancer risk increases in the 3 × BB run (135 h with 8 h HI > 1; max 8 h HI = 3.4), but the model still predicts no 1 h exceedances (max 1 h HI = 0.5). This low bias in HI is driven by incomplete BB VOC representation, including underestimated BB VOC burdens (by ∼ 3×), missing secondary sources, and missing high-potency HAPs (e.g., acrolein, which accounts for > 50 % of the observed HI). Overall, CTMs such as GEOS-Chem can provide a first-order estimate of PM2.5-driven cancer burden, but the predicted HI is much less reliable without improved HAP speciation, secondary production, and inclusion of high-potency compounds.
Missoula, Montana (46.9° N, 114.0° W), experienced persistent and chemically complex wildfire smoke during September 2020, reflecting the widespread influence of wildfires across California and the Pacific Northwest. We report hourly surface observations of PM2.5, CO, NOx, O3, and 75 speciated VOCs in Missoula during the wildfire-smoke-impacted month of September 2020. Of the 75 measured VOCs, 15 were classified as HAPs by the EPA. Leveraging comprehensive measurements, we quantified EnRs of PM2.5 and VOCs relative to CO in smoke aged for several days, and characterized the temporal evolution of criteria pollutants and VOCs under smoke-impacted and no-/low-smoke conditions. We performed nested GEOS-Chem simulations and compared them with observations to constrain BB emissions and photochemistry in the model. Finally, we assessed public health risks based on regulatory exposure metrics for PM2.5 and HAPs.
We find that combining gas-phase tracers with conventional particle-based diagnostics improves the identification of surface-level wildfire smoke in urban environments. While traditional aerosol-based smoke diagnostics (HMS, AERONET, and PM2.5) remain useful for detecting dense, optically thick plumes, they often misclassify events when plumes are aloft, optically thin, or when rainfall removes aerosols. In contrast, VOC tracers, especially furan and maleic anhydride (MA), provide complementary value: furan identifies fresh smoke, while MA captures more aged plumes. We thus develop a balanced multi-indicator rule that requires concurrent enhancements in at least three independent tracers, thereby capturing smoke episodes with higher confidence. Three major smoke events driven by long-range transport resulted in multi-day elevations of CO and total VOC abundances by factors of 2–3, while ozone increased only modestly and NOx showed little to no change. In addition, PM2.5 and total HAPs (which comprised approximately half of the measured TVOCs by molar fraction) increased by factors of ∼ 3–8 during smoke periods. Concurrently, the total measured OH reactivity approximately doubled (13.4 vs. 6.5 s−1), shifting the relative OHR contributions from biogenic tracers in background conditions toward CO and BB VOCs during smoke. These results highlight the strong influence of regional wildfire smoke on air quality in the western US.
Photochemical-clock analysis constrains ERs for a wide range of primary VOCs in aged BB smoke, yielding values consistent with those reported for western US wildfires. The observed decay patterns of primary VOCs broadly follow their known OH rate constants (kOH). Some underestimation of kOH (by factors of ≈ 3) for reactive VOCs likely arises from rapid depletion, dilution, or background contamination. OVOCs such as methanol, formaldehyde, and acetaldehyde also decrease with age, but their shallow slopes indicate substantial secondary production offsetting primary decay.
Intense smoke episodes in Missoula suppressed surface ozone, with MDA8 O3 declining by up to ∼ 15 ppb (6–7 September), coincident with 50 % reductions in solar radiation and lower planetary boundary layer heights (PBLH), confirming that reduced photolysis and weaker mixing limit in situ ozone formation. Across smoke-impacted days, the MDA8 O3–PM2.5 relationship was non-monotonic: ozone increased under light smoke (PM2.5 < ∼ 20 µg m−3) but tended to flatten or decrease at higher smoke loadings (≳ 20 µg m−3).
Chronic and acute health assessments indicate that prolonged exposure to 2020-level wildfire smoke in Missoula poses quantifiable health risks. If a season of similar intensity were to recur annually, the smoke-attributable excess lifetime cancer risk would be ∼ 100 cases per million people (≈ 7× the non-smoke baseline of ∼ 15 per million for the same days), with PM2.5 accounting for ∼ 90 % of the cancer burden. The chronic non-cancer hazard index (HI) is ∼ 3, with ∼ 90 % attributable to HAPs (driven primarily by acrolein and formaldehyde) and the remaining ∼ 10 % to PM2.5. For acute non-cancer risk, 1 h HI exceedances are rare, but 8 h averaging reveals frequent smoke-aligned exceedances (∼ 51 % of periods with HI > 1). Across both chronic and acute metrics, the repeated importance of the same few HAP drivers (notably acrolein, formaldehyde, and benzene) indicates that mitigating wildfire-related health impacts should extend beyond particle-only strategies to include gas-phase toxics.
The GEOS-Chem simulation reproduces the timing and transport of major smoke plumes (R2 = 0.8–0.9) but underestimates the magnitude of smoke enhancements, with model low biases of ∼ 30 %–40 % for CO and PM2.5 and ∼ 60 %–90 % for most VOCs. The model overestimates OH exposure by roughly 100 %, leading to excessive chemical loss and artificially low EnRs for reactive VOCs. Persistent low EnRs for oxygenated VOCs further suggest missing secondary production during multi-day aging, whereas the +33 % bias in PM2.5 EnR points to overly efficient secondary aerosol formation and/or retention in the GEOS-Chem simplified “simple SOA” treatment. Tripling BB emissions (3× BB) largely improves the modeled primary compounds (e.g., benzene from −70 % to −10 %) and reduces the model bias of OH exposure to ∼ 30 % within smoke-impacted periods, but the modeled PM2.5 is worse (from −30 % to +80 %), demonstrating that uniform emission scaling cannot reconcile errors in both gases and aerosol. Together, these results highlight that reducing model biases in smoky environments requires not only better fire emission magnitudes but also improved representation of missing OH reactivity (e.g., furanoids), secondary OVOC formation, and smoke SOA parameterizations.
GEOS-Chem exhibits a persistent positive bias in September MDA8 O3 in Missoula (+15 ppb on average) and fails to reproduce observed day-to-day variability, regardless of the BB emissions scenario (base, 3 × BB, or noBB). This is in part due to the modeled O3 being too high for general urban background, and the model bias further amplifies on smoke days, reaching +70 ppb and increasing with observed daytime PM2.5 (r ≈ 0.7). More importantly, the model fails to reproduce the observed non-monotonic O3–PM2.5 response, where observations flatten or decline beyond ∼ 30–40 µg m−3. Instead, GEOS-Chem continues to increase O3 with PM2.5. The same monotonic behavior is also present in the independent CMAQ-based AIRPACT forecast system across Missoula and other western US sites, pointing to a shared CTM limitation in representing nonlinear ozone responses under intense BB smoke. These model biases are likely related to overestimated radiation, warm temperature biases, PBLH/entrainment errors, and potentially too-weak heterogeneous loss in CTMs, although isolating the dominant drivers will require additional observational constraints.
GEOS-Chem underpredicts the smoke-attributable lifetime excess cancer risk by 40 % (63 vs. 100 cases per million), due to the underestimated PM2.5. The model's capability to predict non-cancer HI is even worse (∼ 0.3 in GEOS-Chem vs. 3 in observations). The model also underrepresents acute hazards, predicting limited 8 h exceedances (15 h with 8 h HI > 1; max 8 h HI = 1.2), far fewer and weaker than observed (476 h; max 8 h HI = 6). Overall, these results indicate that GEOS-Chem can provide a defensible screening-level estimate of PM2.5-dominated cancer burden, whereas HI estimates remain unreliable without improved BB VOC speciation, secondary production pathways, and inclusion of high-potency toxics such as acrolein.
The data and analysis code supporting this study are publicly available and enable full reproduction of the figures and results presented here. The processed data archive is available at Zenodo (https://doi.org/10.5281/zenodo.18209324, Jin, 2026b). The analysis code is available on GitHub at https://github.com/jinlx/Aged-wildfire-smoke-emission-chemistry-health (last access: 24 March 2026; https://doi.org/10.5281/zenodo.21703742, Jin, 2026a). Raw air-quality observations were obtained from the Montana Department of Environmental Quality and are included in the Zenodo archive. Meteorological and ancillary datasets were obtained from publicly available sources cited in the manuscript.
The supplement related to this article is available online at https://doi.org/10.5194/acp-26-11047-2026-supplement.
LJ: investigation; conceptualization; methodology; simulations; formal analysis; visualization; writing (original draft); data curation. LT: investigation; data curation; writing (review and editing). DTK: investigation; data curation; writing (review and editing). KN: investigation; data curation. VS: investigation; writing (review and editing). RJY: supervision; conceptualization; writing (review and editing). LH: supervision; conceptualization; writing (review and editing); funding acquisition. All authors reviewed and approved the final manuscript.
The contact author has declared that none of the authors has any competing interests.
Publisher's note: Copernicus Publications remains neutral with regard to jurisdictional claims made in the text, published maps, institutional affiliations, or any other geographical representation in this paper. The authors bear the ultimate responsibility for providing appropriate place names. Views expressed in the text are those of the authors and do not necessarily reflect the views of the publisher.
High-performance computing was provided by the National Center for Atmospheric Research (NCAR), a major facility sponsored by the National Science Foundation (NSF) under Cooperative Agreement no. 1852977, and by the Hellgate High-Performance Computing Cluster at the University of Montana. Air-quality observations were obtained from the Montana Department of Environmental Quality (DEQ), and meteorological observations were obtained from the MesoWest network via the Synoptic Data API. We thank the Laboratory for Atmospheric Research at Washington State University for providing publicly available AIRPACT operational forecast output used in this study, and Dr. Jun Meng for clarifying details of the operational AIRPACT configuration. We also acknowledge the GEOS-Chem developer community for maintaining an open-source chemical transport model.
This research has been supported by the National Science Foundation (grant nos. AGS-2144896, AGS-1748266, and EPSCoR-2242802) and the National Oceanic and Atmospheric Administration, Climate Program Office (grant nos. NA16OAR4310100 and NA20OAR4310296).
This paper was edited by Carsten Warneke and reviewed by two anonymous referees.
Abatzoglou, J. T., Rupp, D. E., O'Neill, L. W., and Sadegh, M.: Compound Extremes Drive the Western Oregon Wildfires of September 2020, Geophys. Res. Lett., 48, e2021GL092520, https://doi.org/10.1029/2021GL092520, 2021.
Akagi, S. K., Burling, I. R., Mendoza, A., Johnson, T. J., Cameron, M., Griffith, D. W. T., Paton-Walsh, C., Weise, D. R., Reardon, J., and Yokelson, R. J.: Field measurements of trace gases emitted by prescribed fires in southeastern US pine forests using an open-path FTIR system, Atmos. Chem. Phys., 14, 199–215, https://doi.org/10.5194/acp-14-199-2014, 2014.
Albores, I. S., Buchholz, R. R., Ortega, I., Emmons, L. K., Hannigan, J. W., Lacey, F., Pfister, G., Tang, W., and Worden, H. M.: Continental-scale Atmospheric Impacts of the 2020 Western U.S. Wildfires, Atmos. Environ., 294, 119436, https://doi.org/10.1016/j.atmosenv.2022.119436, 2023.
Alvarado, L. M. A., Richter, A., Vrekoussis, M., Hilboll, A., Kalisz Hedegaard, A. B., Schneising, O., and Burrows, J. P.: Unexpected long-range transport of glyoxal and formaldehyde observed from the Copernicus Sentinel-5 Precursor satellite during the 2018 Canadian wildfires, Atmos. Chem. Phys., 20, 2057–2072, https://doi.org/10.5194/acp-20-2057-2020, 2020.
American Lung Association: Missoula, MT, https://www.lung.org/research/sota/city-rankings/msas/missoula-mt (last access: 16 August 2024), 2024.
Baker, K. R., Woody, M. C., Tonnesen, G. S., Hutzell, W., Pye, H. O. T., Beaver, M. R., Pouliot, G., and Pierce, T.: Contribution of regional-scale fire events to ozone and PM2.5 air quality estimated by photochemical modeling approaches, Atmos. Environ., 140, 539–554, https://doi.org/10.1016/j.atmosenv.2016.06.032, 2016.
Baker, K. R., Woody, M. C., Valin, L., Szykman, J., Yates, E. L., Iraci, L. T., Choi, H. D., Soja, A. J., Koplitz, S. N., Zhou, L., Campuzano-Jost, P., Jimenez, J. L., and Hair, J. W.: Photochemical model evaluation of 2013 California wild fire air quality impacts using surface, aircraft, and satellite data, Sci. Total Environ., 637–638, 1137–1149, https://doi.org/10.1016/j.scitotenv.2018.05.048, 2018.
Bates, K. H., Jacob, D. J., Wang, S., Hornbrook, R. S., Apel, E. C., Kim, M. J., Millet, D. B., Wells, K. C., Chen, X., Brewer, J. F., Ray, E. A., Commane, R., Diskin, G. S., and Wofsy, S. C.: The global budget of atmospheric methanol: new constraints on secondary, oceanic, and terrestrial sources, J. Geophys. Res.-Atmos., 126, e2020JD033439, https://doi.org/10.1029/2020jd033439, 2021.
Bernays, N., Jaffe, D. A., Petropavlovskikh, I., and Effertz, P.: Comment on “Comparison of ozone measurement methods in biomass burning smoke: an evaluation under field and laboratory conditions” by Long et al. (2021), Atmos. Meas. Tech., 15, 3189–3192, https://doi.org/10.5194/amt-15-3189-2022, 2022.
Burke, M., Driscoll, A., Heft-Neal, S., Xue, J., Burney, J., and Wara, M.: The changing risk and burden of wildfire in the United States, P. Natl. Acad. Sci. USA, 118, e2011048118, https://doi.org/10.1073/PNAS.2011048118, 2021.
Buysse, C. E., Kaulfus, A., Nair, U., and Jaffe, D. A.: Relationships between Particulate Matter, Ozone, and Nitrogen Oxides during Urban Smoke Events in the Western US, Environ. Sci. Technol., 53, 12519–12528, https://doi.org/10.1021/ACS.EST.9B05241, 2019.
Chen, J., Vaughan, J., Avise, J., O'Neill, S., and Lamb, B.: Enhancement and evaluation of the AIRPACT ozone and PM2.5 forecast system for the Pacific Northwest, J. Geophys. Res.-Atmos., 113, D14305, https://doi.org/10.1029/2007JD009554, 2008.
Chen, X., Millet, D. B., Singh, H. B., Wisthaler, A., Apel, E. C., Atlas, E. L., Blake, D. R., Bourgeois, I., Brown, S. S., Crounse, J. D., de Gouw, J. A., Flocke, F. M., Fried, A., Heikes, B. G., Hornbrook, R. S., Mikoviny, T., Min, K.-E., Müller, M., Neuman, J. A., O'Sullivan, D. W., Peischl, J., Pfister, G. G., Richter, D., Roberts, J. M., Ryerson, T. B., Shertz, S. R., Thompson, C. R., Treadaway, V., Veres, P. R., Walega, J., Warneke, C., Washenfelder, R. A., Weibring, P., and Yuan, B.: On the sources and sinks of atmospheric VOCs: an integrated analysis of recent aircraft campaigns over North America, Atmos. Chem. Phys., 19, 9097–9123, https://doi.org/10.5194/acp-19-9097-2019, 2019.
Coggon, M. M., Lim, C. Y., Koss, A. R., Sekimoto, K., Yuan, B., Gilman, J. B., Hagan, D. H., Selimovic, V., Zarzana, K. J., Brown, S. S., Roberts, J. M., Müller, M., Yokelson, R., Wisthaler, A., Krechmer, J. E., Jimenez, J. L., Cappa, C., Kroll, J. H., de Gouw, J., and Warneke, C.: OH chemistry of non-methane organic gases (NMOGs) emitted from laboratory and ambient biomass burning smoke: evaluating the influence of furans and oxygenated aromatics on ozone and secondary NMOG formation, Atmos. Chem. Phys., 19, 14875–14899, https://doi.org/10.5194/acp-19-14875-2019, 2019.
Cope, E. M., Ketcherside, D. T., Jin, L., Tan, L., Mansfield, M., Jones, C., Lyman, S., Jaffe, D., and Hu, L.: Sources of Atmospheric Volatile Organic Compounds During the Salt Lake Regional Smoke, Ozone and Aerosol Study (SAMOZA) 2022, J. Geophys. Res.-Atmos., 129, e2024JD041640, https://doi.org/10.1029/2024JD041640, 2024.
Decker, Z. C. J., Zarzana, K. J., Coggon, M., Min, K. E., Pollack, I., Ryerson, T. B., Peischl, J., Edwards, P., Dubé, W. P., Markovic, M. Z., Roberts, J. M., Veres, P. R., Graus, M., Warneke, C., De Gouw, J., Hatch, L. E., Barsanti, K. C., and Brown, S. S.: Nighttime Chemical Transformation in Biomass Burning Plumes: A Box Model Analysis Initialized with Aircraft Observations, Environ. Sci. Technol., 53, 2529–2538, https://doi.org/10.1021/acs.est.8b05359, 2019.
Decker, Z. C. J., Robinson, M. A., Barsanti, K. C., Bourgeois, I., Coggon, M. M., DiGangi, J. P., Diskin, G. S., Flocke, F. M., Franchin, A., Fredrickson, C. D., Gkatzelis, G. I., Hall, S. R., Halliday, H., Holmes, C. D., Huey, L. G., Lee, Y. R., Lindaas, J., Middlebrook, A. M., Montzka, D. D., Moore, R., Neuman, J. A., Nowak, J. B., Palm, B. B., Peischl, J., Piel, F., Rickly, P. S., Rollins, A. W., Ryerson, T. B., Schwantes, R. H., Sekimoto, K., Thornhill, L., Thornton, J. A., Tyndall, G. S., Ullmann, K., Van Rooy, P., Veres, P. R., Warneke, C., Washenfelder, R. A., Weinheimer, A. J., Wiggins, E., Winstead, E., Wisthaler, A., Womack, C., and Brown, S. S.: Nighttime and daytime dark oxidation chemistry in wildfire plumes: an observation and model analysis of FIREX-AQ aircraft data, Atmos. Chem. Phys., 21, 16293–16317, https://doi.org/10.5194/acp-21-16293-2021, 2021.
de Gouw, J. A., Warneke, C., Parrish, D. D., Holloway, J. S., Trainer, M., and Fehsenfeld, F. C.: Emission sources and ocean uptake of acetonitrile (CH3CN) in the atmosphere, J. Geophys. Res.-Atmos., 108, 4329, https://doi.org/10.1029/2002JD002897, 2003.
de Gouw, J. A., Warneke, C., Stohl, A., Wollny, A. G., Brock, C. A., Cooper, O. R., Holloway, J. S., Trainer, M., Fehsenfeld, F. C., Atlas, E. L., Donnelly, S. G., Stroud, V., and Lueb, A.: Volatile organic compounds composition of merged and aged forest fire plumes from Alaska and western Canada, J. Geophys. Res.-Atmos., 111, D10303, https://doi.org/10.1029/2005JD006175, 2006.
de Gouw, J. A., Gilman, J. B., Kim, S. W., Lerner, B. M., Isaacman-VanWertz, G., McDonald, B. C., Warneke, C., Kuster, W. C., Lefer, B. L., Griffith, S. M., Dusanter, S., Stevens, P. S., and Stutz, J.: Chemistry of Volatile Organic Compounds in the Los Angeles basin: Nighttime Removal of Alkenes and Determination of Emission Ratios, J. Geophys. Res.-Atmos., 122, 11,843-11,861, https://doi.org/10.1002/2017JD027459, 2017.
Dowell, D. C., Alexander, C. R., James, E. P., Weygandt, S. S., Benjamin, S. G., Manikin, G. S., Blake, B. T., Brown, J. M., Olson, J. B., Hu, M., Smirnova, T. G., Ladwig, T., Kenyon, J. S., Ahmadov, R., Turner, D. D., Duda, J. D., and Alcott, T. I.: The High-Resolution Rapid Refresh (HRRR): An Hourly Updating Convection-Allowing Forecast Model. Part I: Motivation and System Description, Weather Forecast., 37, 1371–1395, https://doi.org/10.1175/WAF-D-21-0151.1, 2022.
Eastham, S. D., Weisenstein, D. K., and Barrett, S. R. H.: Development and evaluation of the unified tropospheric-stratospheric chemistry extension (UCX) for the global chemistry-transport model GEOS-Chem, Atmos. Environ., 89, 52–63, https://doi.org/10.1016/j.atmosenv.2014.02.001, 2014.
Fiddler, M. N., Thompson, C., Pokhrel, R. P., Majluf, F., Canagaratna, M., Fortner, E. C., Daube, C., Roscioli, J. R., Yacovitch, T. I., Herndon, S. C., and Bililign, S.: Emission Factors From Wildfires in the Western US: An Investigation of Burning State, Ground Versus Air, and Diurnal Dependencies During the FIREX-AQ 2019 Campaign, J. Geophys. Res.-Atmos., 129, e2022JD038460, https://doi.org/10.1029/2022JD038460, 2024.
Freitas, S. R., Longo, K. M., Chatfield, R., Latham, D., Silva Dias, M. A. F., Andreae, M. O., Prins, E., Santos, J. C., Gielow, R., and Carvalho Jr., J. A.: Including the sub-grid scale plume rise of vegetation fires in low resolution atmospheric transport models, Atmos. Chem. Phys., 7, 3385–3398, https://doi.org/10.5194/acp-7-3385-2007, 2007.
Gkatzelis, G. I., Coggon, M. M., Stockwell, C. E., Hornbrook, R. S., Allen, H., Apel, E. C., Bela, M. M., Blake, D. R., Bourgeois, I., Brown, S. S., Campuzano-Jost, P., St. Clair, J. M., Crawford, J. H., Crounse, J. D., Day, D. A., DiGangi, J. P., Diskin, G. S., Fried, A., Gilman, J. B., Guo, H., Hair, J. W., Halliday, H. S., Hanisco, T. F., Hannun, R., Hills, A., Huey, L. G., Jimenez, J. L., Katich, J. M., Lamplugh, A., Lee, Y. R., Liao, J., Lindaas, J., McKeen, S. A., Mikoviny, T., Nault, B. A., Neuman, J. A., Nowak, J. B., Pagonis, D., Peischl, J., Perring, A. E., Piel, F., Rickly, P. S., Robinson, M. A., Rollins, A. W., Ryerson, T. B., Schueneman, M. K., Schwantes, R. H., Schwarz, J. P., Sekimoto, K., Selimovic, V., Shingler, T., Tanner, D. J., Tomsche, L., Vasquez, K. T., Veres, P. R., Washenfelder, R., Weibring, P., Wennberg, P. O., Wisthaler, A., Wolfe, G. M., Womack, C. C., Xu, L., Ball, K., Yokelson, R. J., and Warneke, C.: Parameterizations of US wildfire and prescribed fire emission ratios and emission factors based on FIREX-AQ aircraft measurements, Atmos. Chem. Phys., 24, 929–956, https://doi.org/10.5194/acp-24-929-2024, 2024.
Gould, C. F., Heft-Neal, S., Johnson, M., Aguilera, J., Burke, M., and Nadeau, K.: Health Effects of Wildfire Smoke Exposure, Annu. Rev. Med., 75, 277–292, https://doi.org/10.1146/annurev-med-052422-020909, 2024.
Guenther, A. B., Jiang, X., Heald, C. L., Sakulyanontvittaya, T., Duhl, T., Emmons, L. K., and Wang, X.: The Model of Emissions of Gases and Aerosols from Nature version 2.1 (MEGAN2.1): an extended and updated framework for modeling biogenic emissions, Geosci. Model Dev., 5, 1471–1492, https://doi.org/10.5194/gmd-5-1471-2012, 2012.
Higuera, P. E. and Abatzoglou, J. T.: Record-setting climate enabled the extraordinary 2020 fire season in the western United States, Glob. Change Biol., 27, 1–2, https://doi.org/10.1111/GCB.15388, 2021.
Hoesly, R. M., Smith, S. J., Feng, L., Klimont, Z., Janssens-Maenhout, G., Pitkanen, T., Seibert, J. J., Vu, L., Andres, R. J., Bolt, R. M., Bond, T. C., Dawidowski, L., Kholod, N., Kurokawa, J.-I., Li, M., Liu, L., Lu, Z., Moura, M. C. P., O'Rourke, P. R., and Zhang, Q.: Historical (1750–2014) anthropogenic emissions of reactive gases and aerosols from the Community Emissions Data System (CEDS), Geosci. Model Dev., 11, 369–408, https://doi.org/10.5194/gmd-11-369-2018, 2018.
Holzinger, R., Williams, J., Salisbury, G., Klüpfel, T., de Reus, M., Traub, M., Crutzen, P. J., and Lelieveld, J.: Oxygenated compounds in aged biomass burning plumes over the Eastern Mediterranean: evidence for strong secondary production of methanol and acetone, Atmos. Chem. Phys., 5, 39–46, https://doi.org/10.5194/acp-5-39-2005, 2005.
Hu, L., Millet, D. B., Baasandorj, M., Griffis, T. J., Turner, P., Helmig, D., Curtis, A. J., and Hueber, J.: Isoprene emissions and impacts over an ecological transition region in the U.S. Upper Midwest inferred from tall tower measurements, J. Geophys. Res.-Atmos., 120, 3553–3571, https://doi.org/10.1002/2014JD022732, 2015.
Jaffe, D. A., Schnieder, B., and Inouye, D.: Technical note: Use of PM2.5 to CO ratio as an indicator of wildfire smoke in urban areas, Atmos. Chem. Phys., 22, 12695–12704, https://doi.org/10.5194/acp-22-12695-2022, 2022.
Jerrett, M., Jina, A. S., and Marlier, M. E.: Up in smoke: California's greenhouse gas reductions could be wiped out by 2020 wildfires, Environ. Pollut., 310, 119888, https://doi.org/10.1016/J.ENVPOL.2022.119888, 2022.
Jin, L.: Analysis code for 'Characterizing emissions, chemistry, and health impacts of aged wildfire smoke in a western US city', version 1.0.1, Zenodo [code], https://doi.org/10.5281/zenodo.21703742, 2026a.
Jin, L.: Missoula 2020 wildfire air quality observations and model simulations supporting: Characterizing emissions, chemistry, and health impacts of aged wildfire smoke in a western US city, Zenodo [data set], https://doi.org/10.5281/zenodo.18209324, 2026b.
Jin, L., Permar, W., Selimovic, V., Ketcherside, D., Yokelson, R. J., Hornbrook, R. S., Apel, E. C., Ku, I.-T., Collett Jr., J. L., Sullivan, A. P., Jaffe, D. A., Pierce, J. R., Fried, A., Coggon, M. M., Gkatzelis, G. I., Warneke, C., Fischer, E. V., and Hu, L.: Constraining emissions of volatile organic compounds from western US wildfires with WE-CAN and FIREX-AQ airborne observations, Atmos. Chem. Phys., 23, 5969–5991, https://doi.org/10.5194/acp-23-5969-2023, 2023.
Jin, L., Coggon, M. M., Permar, W., Juncosa Calahorrano, J. F., Palm, B. B., Gkatzelis, G. I., Robinson, M. A., Bourgeois, I., Hall, S. R., Peischl, J., Ullmann, K., Thornton, J. A., Warneke, C., Flocke, F., Fischer, E. V., Yokelson, R. J., and Hu, L.: Ozone photochemistry in fresh biomass burning smoke over the United States, Sci. Adv., 12, eads2157, https://doi.org/10.1126/sciadv.ads2157, 2026.
Joo, T., Rogers, M. J., Soong, C., Hass-Mitchell, T., Heo, S., Bell, M. L., Ng, N. L., and Gentner, D. R.: Aged and Obscured Wildfire Smoke Associated with Downwind Health Risks, Environ. Sci. Tech. Let., 11, 1340–1347, https://doi.org/10.1021/ACS.ESTLETT.4C00785, 2024.
Kaulfus, A. S., Nair, U., Jaffe, D., Christopher, S. A., and Goodrick, S.: Biomass Burning Smoke Climatology of the United States: Implications for Particulate Matter Air Quality, Environ. Sci. Technol., 51, 11731–11741, https://doi.org/10.1021/acs.est.7b03292, 2017.
Keller, C. A., Long, M. S., Yantosca, R. M., Da Silva, A. M., Pawson, S., and Jacob, D. J.: HEMCO v1.0: a versatile, ESMF-compliant component for calculating emissions in atmospheric models, Geosci. Model Dev., 7, 1409–1417, https://doi.org/10.5194/gmd-7-1409-2014, 2014.
Kim, P. S., Jacob, D. J., Fisher, J. A., Travis, K., Yu, K., Zhu, L., Yantosca, R. M., Sulprizio, M. P., Jimenez, J. L., Campuzano-Jost, P., Froyd, K. D., Liao, J., Hair, J. W., Fenn, M. A., Butler, C. F., Wagner, N. L., Gordon, T. D., Welti, A., Wennberg, P. O., Crounse, J. D., St. Clair, J. M., Teng, A. P., Millet, D. B., Schwarz, J. P., Markovic, M. Z., and Perring, A. E.: Sources, seasonality, and trends of southeast US aerosol: an integrated analysis of surface, aircraft, and satellite observations with the GEOS-Chem chemical transport model, Atmos. Chem. Phys., 15, 10411–10433, https://doi.org/10.5194/acp-15-10411-2015, 2015.
Latham, D. J.: PLUMP: a plume predictor and cloud model for fire managers, General Technical Report INT-GTR-314, U.S. Department of Agriculture, Forest Service, Intermountain Research Station, Ogden, UT, 15 pp., https://archive.org/details/CAT10687456 (last access: 30 July 2026), 1994.
Li, Q., Jacob, D. J., Bey, I., Yantosca, R. M., Zhao, Y., Kondo, Y., and Notholt, J.: Atmospheric hydrogen cyanide (HCN): Biomass burning source, ocean sink?, Geophys. Res. Lett., 27, 357–360, https://doi.org/10.1029/1999GL010935, 2000.
Liang, Y., Weber, R. J., Misztal, P. K., Jen, C. N., and Goldstein, A. H.: Aging of Volatile Organic Compounds in October 2017 Northern California Wildfire Plumes, Environ. Sci. Technol., 56, 1557–1567, https://doi.org/10.1021/acs.est.1c05684, 2022.
Lill, E., Lindaas, J., Juncosa Calahorrano, J. F., Campos, T., Flocke, F., Apel, E. C., Hornbrook, R. S., Hills, A., Jarnot, A., Blake, N., Permar, W., Hu, L., Weinheimer, A., Tyndall, G., Montzka, D. D., Hall, S. R., Ullmann, K., Thornton, J., Palm, B. B., Peng, Q., Pollack, I., and Fischer, E. V.: Wildfire-driven changes in the abundance of gas-phase pollutants in the city of Boise, ID during summer 2018, Atmos. Pollut. Res., 13, 101269, https://doi.org/10.1016/J.APR.2021.101269, 2022.
Lin, J. T. and McElroy, M. B.: Impacts of boundary layer mixing on pollutant vertical profiles in the lower troposphere: Implications to satellite remote sensing, Atmos. Environ., 44, 1726–1739, https://doi.org/10.1016/j.atmosenv.2010.02.009, 2010.
Liu, H., Jacob, D. J., Bey, I., and Yantosca, R. M.: Constraints from 210Pb and 7Be on wet deposition and transport in a global three-dimensional chemical tracer model driven by assimilated meteorological fields, J. Geophys. Res.-Atmos., 106, 12109–12128, https://doi.org/10.1029/2000JD900839, 2001.
Liu, T., Panday, F. M., Caine, M. C., Kelp, M., Pendergrass, D. C., Mickley, L. J., Ellicott, E. A., Marlier, M. E., Ahmadov, R., and James, E. P.: Is the smoke aloft? Caveats regarding the use of the Hazard Mapping System (HMS) smoke product as a proxy for surface smoke presence across the United States, Int. J. Wildland Fire, 33, WF23148, https://doi.org/10.1071/WF23148, 2024.
Long, R. W., Whitehill, A., Habel, A., Urbanski, S., Halliday, H., Colón, M., Kaushik, S., and Landis, M. S.: Comparison of ozone measurement methods in biomass burning smoke: an evaluation under field and laboratory conditions, Atmos. Meas. Tech., 14, 1783–1800, https://doi.org/10.5194/amt-14-1783-2021, 2021.
Lopez-Coto, I., Ren, X., Salmon, O. E., Karion, A., Shepson, P. B., Dickerson, R. R., Stein, A., Prasad, K., and Whetstone, J. R.: Wintertime CO2, CH4, and CO Emissions Estimation for the Washington, DC-Baltimore Metropolitan Area Using an Inverse Modeling Technique, Environ. Sci. Technol., 54, 2606–2614, https://doi.org/10.1021/acs.est.9b06619, 2020.
Mao, J., Jacob, D. J., Evans, M. J., Olson, J. R., Ren, X., Brune, W. H., St. Clair, J. M., Crounse, J. D., Spencer, K. M., Beaver, M. R., Wennberg, P. O., Cubison, M. J., Jimenez, J. L., Fried, A., Weibring, P., Walega, J. G., Hall, S. R., Weinheimer, A. J., Cohen, R. C., Chen, G., Crawford, J. H., McNaughton, C., Clarke, A. D., Jaeglé, L., Fisher, J. A., Yantosca, R. M., Le Sager, P., and Carouge, C.: Chemistry of hydrogen oxide radicals (HOx) in the Arctic troposphere in spring, Atmos. Chem. Phys., 10, 5823–5838, https://doi.org/10.5194/acp-10-5823-2010, 2010.
Mass, C. F., Ovens, D., Conrick, R., and Saltenberger, J.: The September 2020 Wildfires over the Pacific Northwest, Weather Forecast., 36, 1843–1865, https://doi.org/10.1175/WAF-D-21-0028.1, 2021.
Maximoff, S. N., Mittal, R., Kaushik, A., and Dhau, J. S.: Performance evaluation of activated carbon sorbents for indoor air purification during normal and wildfire events, Chemosphere, 304, 135314, https://doi.org/10.1016/J.CHEMOSPHERE.2022.135314, 2022.
May, N. W., Dixon, C., and Jaffe, D. A.: Impact of Wildfire Smoke Events on Indoor Air Quality and Evaluation of a Low-cost Filtration Method, Aerosol Air Qual. Res., 21, 210046, https://doi.org/10.4209/AAQR.210046, 2021.
McClure, C. D. and Jaffe, D. A.: Investigation of high ozone events due to wildfire smoke in an urban area, Atmos. Environ., 194, 146–157, https://doi.org/10.1016/J.ATMOSENV.2018.09.021, 2018.
Naeher, L. P., Brauer, M., Lipsett, M., Zelikoff, J. T., Simpson, C. D., Koenig, J. Q., and Smith, K. R.: Woodsmoke Health Effects: A Review, Inhal. Toxicol., 19, 67–106, https://doi.org/10.1080/08958370600985875, 2007.
Navarro, K. M., Clark, K. A., Hardt, D. J., Reid, C. E., Lahm, P. W., Domitrovich, J. W., Butler, C. R., and Balmes, J. R.: Wildland firefighter exposure to smoke and COVID-19: A new risk on the fire line, Sci. Total Environ., 760, 144296, https://doi.org/10.1016/J.SCITOTENV.2020.144296, 2021.
Neyra-Nazarrett, O. A., Miyazaki, K., Bowman, K. W., and Saide, P. E.: An Assessment of TROPESS CrIS and TROPOMI CO Retrievals and Their Synergies for the 2020 Western U.S. Wildfires, Remote Sens., 17, 1854, https://doi.org/10.3390/RS17111854, 2025.
Oak, Y. J., Park, R. J., Jo, D. S., Hodzic, A., Jimenez, J. L., Campuzano-Jost, P., Nault, B. A., Kim, H., Kim, H., Ha, E. S., Song, C. K., Yi, S. M., Diskin, G. S., Weinheimer, A. J., Blake, D. R., Wisthaler, A., Shim, M., and Shin, Y.: Evaluation of Secondary Organic Aerosol (SOA) Simulations for Seoul, Korea, J. Adv. Model. Earth Sy., 14, e2021MS002760, https://doi.org/10.1029/2021MS002760, 2022.
O'Dell, K., Hornbrook, R. S., Permar, W., Levin, E. J. T., Garofalo, L. A., Apel, E. C., Blake, N. J., Jarnot, A., Pothier, M. A., Farmer, D. K., Hu, L., Campos, T., Ford, B., Pierce, J. R., and Fischer, E. V.: Hazardous Air Pollutants in Fresh and Aged Western US Wildfire Smoke and Implications for Long-Term Exposure, Environ. Sci. Technol., 54, 11838–11847, https://doi.org/10.1021/acs.est.0c04497, 2020.
O'Dell, K., Bilsback, K., Ford, B., Martenies, S. E., Magzamen, S., Fischer, E. V., and Pierce, J. R.: Estimated Mortality and Morbidity Attributable to Smoke Plumes in the United States: Not Just a Western US Problem, Geohealth, 5, e2021GH000457, https://doi.org/10.1029/2021GH000457, 2021.
Pagonis, D., Selimovic, V., Campuzano-Jost, P., Guo, H., Day, D. A., Schueneman, M. K., Nault, B. A., Coggon, M. M., DiGangi, J. P., Diskin, G. S., Fortner, E. C., Gargulinski, E. M., Gkatzelis, G. I., Hair, J. W., Herndon, S. C., Holmes, C. D., Katich, J. M., Nowak, J. B., Perring, A. E., Saide, P., Shingler, T. J., Soja, A. J., Thapa, L. H., Warneke, C., Wiggins, E. B., Wisthaler, A., Yacovitch, T. I., Yokelson, R. J., and Jimenez, J. L.: Impact of Biomass Burning Organic Aerosol Volatility on Smoke Concentrations Downwind of Fires, Environ. Sci. Technol., 57, 17011–17021, https://doi.org/10.1021/ACS.EST.3C05017, 2023.
Pai, S. J., Heald, C. L., Pierce, J. R., Farina, S. C., Marais, E. A., Jimenez, J. L., Campuzano-Jost, P., Nault, B. A., Middlebrook, A. M., Coe, H., Shilling, J. E., Bahreini, R., Dingle, J. H., and Vu, K.: An evaluation of global organic aerosol schemes using airborne observations, Atmos. Chem. Phys., 20, 2637–2665, https://doi.org/10.5194/acp-20-2637-2020, 2020.
Park, R. J., Jacob, D. J., Field, B. D., Yantosca, R. M., and Chin, M.: Natural and transboundary pollution influences on sulfate-nitrate-ammonium aerosols in the United States: implications for policy, J. Geophys. Res.-Atmos., 109, D15204, https://doi.org/10.1029/2003JD004473, 2004.
Permar, W., Wang, Q., Selimovic, V., Wielgasz, C., Yokelson, R. J., Hornbrook, R. S., Hills, A. J., Apel, E. C., Ku, I., Zhou, Y., Sive, B. C., Sullivan, A. P., Collett, J. L., Campos, T. L., Palm, B. B., Peng, Q., Thornton, J. A., Garofalo, L. A., Farmer, D. K., Kreidenweis, S. M., Levin, E. J. T., DeMott, P. J., Flocke, F., Fischer, E. V., and Hu, L.: Emissions of trace organic gases from western U.S. wildfires based on WE-CAN aircraft measurements, J. Geophys. Res.-Atmos., 126, e2020JD033838, https://doi.org/10.1029/2020jd033838, 2021.
Permar, W., Jin, L., Peng, Q., O'Dell, K., Lill, E., Selimovic, V., Yokelson, R. J., Hornbrook, R. S., Hills, A. J., Apel, E. C., Ku, I.-T., Zhou, Y., Sive, B. C., Sullivan, A. P., Collett, J. L., Palm, B. B., Thornton, J. A., Flocke, F., Fischer, E. V., and Hu, L.: Atmospheric OH reactivity in the western United States determined from comprehensive gas-phase measurements during WE-CAN, Environ. Sci. Atmos., 3, 97–114, https://doi.org/10.1039/D2EA00063F, 2023.
Pfister, G. G., Avise, J., Wiedinmyer, C., Edwards, D. P., Emmons, L. K., Diskin, G. D., Podolske, J., and Wisthaler, A.: CO source contribution analysis for California during ARCTAS-CARB, Atmos. Chem. Phys., 11, 7515–7532, https://doi.org/10.5194/acp-11-7515-2011, 2011.
Pye, H. O. T., Xu, L., Henderson, B. H., Pagonis, D., Campuzano-Jost, P., Guo, H., Jimenez, J. L., Allen, C., Skipper, T. N., Halliday, H. S., Murphy, B. N., D'Ambro, E. L., Wennberg, P. O., Place, B. K., Wiser, F. C., McNeill, V. F., Apel, E. C., Blake, D. R., Coggon, M. M., Crounse, J. D., Gilman, J. B., Gkatzelis, G. I., Hanisco, T. F., Huey, L. G., Katich, J. M., Lamplugh, A., Lindaas, J., Peischl, J., St Clair, J. M., Warneke, C., Wolfe, G. M., and Womack, C.: Evolution of Reactive Organic Compounds and Their Potential Health Risk in Wildfire Smoke, Environ. Sci. Technol., 58, 19785–19796, https://doi.org/10.1021/acs.est.4c06187, 2024.
Reid, C. E., Brauer, M., Johnston, F. H., Jerrett, M., Balmes, J. R., and Elliott, C. T.: Critical review of health impacts of wildfire smoke exposure, Environ. Health Perspect., 124, 1334–1343, https://doi.org/10.1289/EHP.1409277, 2016.
Reilly, M. J., Zuspan, A., Halofsky, J. S., Raymond, C., McEvoy, A., Dye, A. W., Donato, D. C., Kim, J. B., Potter, B. E., Walker, N., Davis, R. J., Dunn, C. J., Bell, D. M., Gregory, M. J., Johnston, J. D., Harvey, B. J., Halofsky, J. E., and Kerns, B. K.: Cascadia Burning: The historic, but not historically unprecedented, 2020 wildfires in the Pacific Northwest, USA, Ecosphere, 13, e4070, https://doi.org/10.1002/ecs2.4070, 2022.
Rémy, S., Veira, A., Paugam, R., Sofiev, M., Kaiser, J. W., Marenco, F., Burton, S. P., Benedetti, A., Engelen, R. J., Ferrare, R., and Hair, J. W.: Two global data sets of daily fire emission injection heights since 2003, Atmos. Chem. Phys., 17, 2921–2942, https://doi.org/10.5194/acp-17-2921-2017, 2017.
Schmidt, J. A., Jacob, D. J., Horowitz, H. M., Hu, L., Sherwen, T., Evans, M. J., Liang, Q., Suleiman, R. M., Oram, D. E., Le Breton, M., Percival, C. J., Wang, S., Dix, B., and Volkamer, R.: Modeling the observed tropospheric BrO background: Importance of multiphase chemistry and implications for ozone, OH, and mercury, J. Geophys. Res., 121, 11819–11835, https://doi.org/10.1002/2015JD024229, 2016.
Sekimoto, K., Li, S. M., Yuan, B., Koss, A., Coggon, M., Warneke, C., and de Gouw, J.: Calculation of the sensitivity of proton-transfer-reaction mass spectrometry (PTR-MS) for organic trace gases using molecular properties, Int. J. Mass Spectrom., 421, 71–94, https://doi.org/10.1016/J.IJMS.2017.04.006, 2017.
Selimovic, V., Yokelson, R. J., McMeeking, G. R., and Coefield, S.: In situ measurements of trace gases, PM, and aerosol optical properties during the 2017 NW US wildfire smoke event, Atmos. Chem. Phys., 19, 3905–3926, https://doi.org/10.5194/acp-19-3905-2019, 2019.
Selimovic, V., Yokelson, R. J., McMeeking, G. R., and Coefield, S.: Aerosol Mass and Optical Properties, Smoke Influence on O3, and High NO3 Production Rates in a Western U.S. City Impacted by Wildfires, J. Geophys. Res.-Atmos., 125, e2020JD032791, https://doi.org/10.1029/2020JD032791, 2020.
Selimovic, V., Ketcherside, D., Chaliyakunnel, S., Wielgasz, C., Permar, W., Angot, H., Millet, D. B., Fried, A., Helmig, D., and Hu, L.: Atmospheric biogenic volatile organic compounds in the Alaskan Arctic tundra: constraints from measurements at Toolik Field Station, Atmos. Chem. Phys., 22, 14037–14058, https://doi.org/10.5194/acp-22-14037-2022, 2022.
Semmens, E. O., Leary, C. S., West, M. R., Noonan, C. W., Navarro, K. M., and Domitrovich, J. W.: Carbon monoxide exposures in wildland firefighters in the United States and targets for exposure reduction, J. Expo. Sci. Env. Epid., 31, 923–929, https://doi.org/10.1038/S41370-021-00371-Z, 2021.
Shen, J., Cohen, R. C., Wolfe, G. M., and Jin, X.: Impacts of wildfire smoke aerosols on near-surface ozone photochemistry, Atmos. Chem. Phys., 25, 8701–8718, https://doi.org/10.5194/acp-25-8701-2025, 2025.
United States Forest Service: Sierra National Forest Declares the Creek Fire 100 % contained, Forest Service, https://web.archive.org/web/20260122133611id_/https://www.fs.usda.gov/r05/sierra/newsroom/releases/sierra-national-forest-declares-creek-fire-100-contained (last access: 30 July 2026), 2020.
van der Werf, G. R., Randerson, J. T., Giglio, L., van Leeuwen, T. T., Chen, Y., Rogers, B. M., Mu, M., van Marle, M. J. E., Morton, D. C., Collatz, G. J., Yokelson, R. J., and Kasibhatla, P. S.: Global fire emissions estimates during 1997–2016, Earth Syst. Sci. Data, 9, 697–720, https://doi.org/10.5194/essd-9-697-2017, 2017.
Vaughan, J., Lamb, B., Frei, C., Wilson, R., Bowman, C., Figueroa-Kaminsky, C., Otterson, S., Boyer, M., Mass, C., Albright, M., Koenig, J., Collingwood, A., Gilroy, M., and Maykut, N.: A Numerical Daily Air Quality Forecast System for The Pacific Northwest, B. Am. Meteorol. Soc., 85, 549–562, https://doi.org/10.1175/BAMS-85-4-549, 2004.
Wang, Y. X., McElroy, M. B., Jacob, D. J., and Yantosca, R. M.: A nested grid formulation for chemical transport over Asia: Applications to CO, J. Geophys. Res.-Atmos., 109, D22307, https://doi.org/10.1029/2004JD005237, 2004.
Wesely, M. L.: Parameterization of surface resistances to gaseous dry deposition in regional-scale numerical models, Atmos. Environ., 23, 1293–1304, https://doi.org/10.1016/0004-6981(89)90153-4, 1989.
Western Regional Air Partnership: 2002 fire emission inventory for the WRAP region – Phase II, Project No. 178-6, prepared for the Western Governors' Association/Western Regional Air Partnership by Air Sciences Inc., Denver, CO, 22 July 2005, https://web.archive.org/web/20191023232343id_/https://www.wrapair.org/forums/fejf/documents/WRAP_2002_PhII_EI_Report_20050722.pdf (last access: 30 July 2026), 2005.
Yu, M., Zhang, S., Ning, H., Li, Z., and Zhang, K.: Assessing the 2023 Canadian wildfire smoke impact in Northeastern US: Air quality, exposure and environmental justice, Sci. Total Environ., 926, 171853, https://doi.org/10.1016/J.SCITOTENV.2024.171853, 2024.
Zhang, L., Jacob, D. J., Yue, X., Downey, N. V., Wood, D. A., and Blewitt, D.: Sources contributing to background surface ozone in the US Intermountain West, Atmos. Chem. Phys., 14, 5295–5309, https://doi.org/10.5194/acp-14-5295-2014, 2014.
- Abstract
- Introduction
- Methods
- Identification of smoke-impacted events
- Overview of BB smoke in September 2020
- Smoke enhancement ratios (EnRs) and emission ratios (ERs)
- Non-monotonic O3–PM2.5 relationship
- Chronic and acute health risks
- Model evaluation
- Conclusion
- Code and data availability
- Author contributions
- Competing interests
- Disclaimer
- Acknowledgements
- Financial support
- Review statement
- References
- Supplement
- Abstract
- Introduction
- Methods
- Identification of smoke-impacted events
- Overview of BB smoke in September 2020
- Smoke enhancement ratios (EnRs) and emission ratios (ERs)
- Non-monotonic O3–PM2.5 relationship
- Chronic and acute health risks
- Model evaluation
- Conclusion
- Code and data availability
- Author contributions
- Competing interests
- Disclaimer
- Acknowledgements
- Financial support
- Review statement
- References
- Supplement