
the Creative Commons Attribution 4.0 License.
the Creative Commons Attribution 4.0 License.
 | 06 Aug 2026
Measurement report: Evolving sources and composition of urban submicron aerosols in Dublin: impacts of emission reductions and transboundary transport
Lu Lei
Chunshui Lin
Kirsten N. Fossum
Darius Ceburnis
John Gallagher
Colin O'Dowd
Jurgita Ovadnevaite
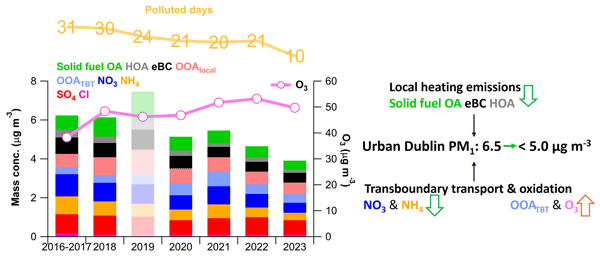
Home heating remains the main driver of winter air pollution across many European cities, yet long-term evaluations of pollution trends and mitigation responses remain limited. Here we present continuous measurements of chemically-speciated PM1 (particles with aerodynamic diameter <1 µm) in Dublin, a temperate European city influenced by local residential heating and continental pollution, from 2016 to 2023 to assess pollution trends under solid fuel burning reduction efforts. Two typical pollution types were identified: intense short-lasting events (few hours, PM1>100 µg m−3) driven by heating emissions, and moderate long-lasting events (several days, PM1<60 µg m−3) originating from transboundary transport. Their interplay shapes seasonal pollution patterns: PM1 peaks in winter, driven by local emissions, while transboundary transport dominates PM1 in spring. Annual PM1 declined from 6.5 to <5.0 µg m−3 over the years, mainly due to reductions in nitrate and ammonium (−0.11 and −0.09 ), followed by solid fuel organic aerosols and black carbon (−0.08 and −0.07 ). Although high pollution events were largely dominated by heating emissions, their intensity and frequency clearly declined. In contrast, limited reductions in locally-formed oxygenated organic aerosols (OOAlocal), combined with increased transported OOA (+0.34 ), raised their relative importance alongside rising ozone levels. This highlights the need for integrated strategies addressing PM1 and ozone pollution. While declining nitrate and ammonium indicates regional precursor reductions, a rebound in local pollutants in 2023 highlighted the persistent vulnerability to heating emissions.
- Article
(2509 KB) - Full-text XML
-
Supplement
(2916 KB) - BibTeX
- EndNote


Air pollution remains one of the leading environmental causes of premature mortality worldwide, with over 99 % of the global population exposed to polluted air exceeding the WHO guidelines and approximately 4.2 million premature deaths each year attributed to such exposure (Lelieveld et al., 2015; Pope and Dockery, 2012; Shiraiwa et al., 2017; Kampa and Castanas, 2008). In particular, despite substantial efforts to control air pollution and the overall decline in pollutant levels in recent years, more than 180 000 deaths in the European Union were still attributable to exposure to air pollution in 2023 (European Environment Agency, 2025). Submicron particles (PM1, particles with aerodynamic diameter <1 µm) are of particular concern as they can penetrate deep into the respiratory system, leading to severe adverse health effects (Wilson and Suh, 1997; Pope and Dockery, 2012). Importantly, the health and climate impacts of particulate matter strongly depends on its chemical composition and physicochemical properties rather than mass concentration alone (Bates et al., 2019; Daellenbach et al., 2020; Lin et al., 2026). Therefore, understanding the chemical composition, sources, and temporal behaviour of PM1 is essential for identifying key components relevant to health and climate impacts, and thus for developing cost-effective control strategies.
Over the past two decades, the development of online mass spectrometric techniques, such as Aerosol Mass Spectrometer (AMS) (Jimenez et al., 2003; Decarlo et al., 2006; Canagaratna et al., 2007) and Aerosol Chemical Speciation Monitor (ACSM) (Ng et al., 2011; Fröhlich et al., 2013; Crenn et al., 2015), has greatly advanced our understanding on PM1 by enabling near real-time and chemically-speciated measurements. Furthermore, when combined with established source apportionment techniques such as positive matrix factorization (PMF) (Zhang et al., 2005; Ulbrich et al., 2009), online measurements based on AMS/ACSM also allow for detailed characterization of organic aerosols (OA), which contribute 20 %–90 % of PM1 mass (Jimenez et al., 2009; Ng et al., 2010), providing more specific information on OA subtypes and sources. Despite the extensive deployment of AMS and ACSM in air pollution studies across Europe and globally (Decarlo et al., 2010; Sun et al., 2012; Lanz et al., 2010), most previous applications have focused on specific pollution episodes or relatively short measurement periods (from several weeks to one year) (Crippa et al., 2013; Chen et al., 2022b). This limitation mainly arises from the high cost and technical demands associated with long-term AMS/ACSM operation. However, short-term observations are usually susceptible to temporal variability in emissions and meteorological conditions and are insufficient to capture long-term changes in air pollution associated with evolving emission sources and atmospheric processes (Seo et al., 2018; Salvador et al., 2022). Importantly, they also lack the temporal coverage needed to reliably evaluate the effectiveness and magnitude of emission control measures.
Several studies have demonstrated the value of long-term, chemically resolved aerosol datasets in understanding seasonal variability, assessing mitigation impacts, and identifying influences from different source sectors on PM pollution. For instance, based on five years of online ACSM measurements, Lei et al. (2020) reported that winter haze pollution in Beijing has greatly declined since 2013, but controlling secondary aerosol pollution has become increasingly challenging after 2018. The long-term observations in South Korea from 2012–2019 revealed that changes in emissions have significantly altered the chemical composition of fine particulate matter in Northeast Asia (Kim et al., 2022). Similarly, the multi-year ACSM measurements at the Southern Great Plains site provided valuable insights into the chemical composition and seasonal variations of PM1 over the central United States (Parworth et al., 2015). A nationwide multi-site study in France revealed clear regional and seasonal patterns in PM1 composition, with OA and nitrate as major contributors, highlighting the value of continuous, high-resolution measurements for model validation and targeted mitigation (Chebaicheb et al., 2024). Nevertheless, long-term AMS or ACSM deployments in Europe remain quite limited, despite their critical role in tracking the evolution of air pollution and evaluating the effectiveness of emission control measures. Consequently, the impacts of recent EU air quality and emission policies, such as the European Green Deal, the Zero Pollution Action Plan, and Ambient Air Quality Directive, on submicron aerosol composition and sources under real-world conditions remain largely unclear.
Ireland is often perceived as having clean air due to its maritime location and relatively low population density. However, its air quality records have revealed a more complex picture: similar to many other European countries (Crippa et al., 2013; Crilley et al., 2015; Casotto et al., 2023), Ireland has historically experienced severe air pollution associated with residential heating. In the 1980s, Ireland experienced severe winter air pollution episodes driven largely by coal combustion for residential heating. For example, during a nationwide pollution episode, the citywide average mass concentration of black smoke in Dublin, the capital and most populated city in Ireland, exceeded 750 µg m−3 (Goodman et al., 2009). In response, the Irish government introduced a smoky coal ban in Dublin in 1990, which was later expanded to other urban areas. This intervention led to significant improvements in air quality, e.g., black smoke levels in Dublin dropped by 70 % after the coal ban (Goodman et al., 2009). However, despite the effectiveness of the coal bans, recent studies have shown that extreme air pollution events still occur, particularly during winter, largely associated with domestic solid fuel combustion. For example, Lin et al. (2018) reported a severe air pollution episode with PM1 mass concentration exceeding 300 µg m−3 in Dublin in December 2016, primarily driven by local heating emissions from biomass fuels, particularly peat and wood. Although these fuels are often promoted as “green” or “carbon-neutral” energy sources and account for only small fractions of residential energy use (less than 13 %), they were responsible for over 70 % of ambient PM1 mass during high-pollution episodes, showing persistent influence on urban air quality in Dublin (Lin et al., 2019b; Ovadnevaite et al., 2021; Lin et al., 2023).
To further mitigate air pollution from domestic solid fuel combustion, in line with recent EU policy frameworks, the Irish government has introduced a series of increasingly stringent regulations in recent years. The smoky coal ban was progressively expanded to more regions and ultimately led to a complete nationwide prohibition on smoky coal sales in late 2022, along with stricter regulations in other solid fuels. The Irish Environmental Protection Agency (EPA) has also been actively communicating the health and environmental impacts of domestic heating emissions to the public in recent years (Environmental Protection Agency Ireland, 2025b). However, while several short-term studies have examined specific pollution sources or episodes (Lin et al., 2019a; Lin et al., 2019b; Perillo et al., 2022; Fossum et al., 2024), a comprehensive long-term analysis of chemically resolved PM1 in Dublin is still missing. How different PM1 components have responded to the recent air quality regulations remains unknown, and the effectiveness of these mitigation measures and public awareness efforts has yet to be fully evaluated, particularly in the context of the ongoing energy crisis, which may have partially offset expected emission reductions. As one of the few European countries with nationwide regulations targeting residential solid fuels, long-term observations in Ireland provide a valuable opportunity to examine how urban atmospheric composition responds to changes in heating emissions. On the other hand, located at the western edge of Europe, Ireland is frequently influenced by long-range transport from continental source regions under easterly flow (Ovadnevaite et al., 2021; Lin et al., 2019b), making it a sensitive receptor of European emission changes. As such, trends observed in Ireland can reflect not only local emission variations but also broader changes in European air pollution patterns.
In this study, we present a detailed analysis on PM1 composition and sources in Dublin based on continuous online measurements from a Quadrupole ACSM (Q-ACSM) and collocated instruments at urban background sites between 2016 and 2023. The typical types of air pollution events in Dublin are identified, seasonal patterns and long-term trends in PM1 components and source contributions are characterized, and the long-term PM1 trends under different pollution levels are also evaluated to distinguish local and transboundary influences. This work provides a comprehensive overview of the evolution of urban air pollution in Dublin over the past decade, offering key insights to inform future air quality management strategies for Ireland and broader European regions.
2.1 Field Measurements and Instrumentation
Real-time measurements of chemical components in sub-micron particulate matter (PM1) were conducted at two urban background sites in Dublin, Ireland, from 5 August 2016 to 31 December 2023. The sampling site was initially located at the Science Center North in University College Dublin (UCD, 53.31° N, 6.22° W) from 5 August 2016 till 28 August 2023. The instrumentation was then relocated to Trinity College Botanical Gardens (TCBG, 53.31° N, 6.26° W) from 6 September 2023 onward, approximately 3 km away from the UCD site (Fig. S1 in the Supplement). A detailed introduction of the UCD sampling site can be found in Lin et al. (2020). At the new TCBG site, all instruments were housed in an air-conditioned shed based on the ground (20 m above sea level), and sub-sampled isokinetically from a community inlet mounted about 5 m above the ground. The sampling shed is located ∼100 m away from the nearest road and is surrounded by gardens and parkland, minimizing impacts from local point sources and traffic emissions. A month-by-month comparison of total PM1 at the new TCBG site with historical measurements from UCD showed no significant differences between the two datasets (Fig. S2 in the Supplement), affirming the data continuity and the suitability of the new site as a representative residential background site.
The non-refractory PM1 species (NR-PM1), including organic aerosols (OA), sulfate (SO4), nitrate (NO3), ammonium (NH4) and chloride (Cl) were measured by a Q-ACSM (Aerodyne Research Inc., USA). The operation and calibration protocols of Q-ACSM have been described in detail in previous studies (Ng et al., 2011; Freney et al., 2019). The Q-ACSM was regularly calibrated following standardized procedures and exhibited stable response factors (RF=(3.01 ± ) over the years (21 calibrations in total), indicating good long-term instrumental performance. Equivalent black carbon (eBC) concentrations were measured using a 7-wavelength Aethalometer (model AE33 from Magee Scientific), and the eBC mass concentration was derived from the 880 nm channel, applying a standard mass absorption cross-section of 7.77 m2 g−1 (Cuesta-Mosquera et al., 2021). A Scanning Mobility Particle Sizer (SMPS), consisting of a differential mobility analyser (DMA) and a condensation particle counter (CPC), was collocated to measure particle number size distributions in the 10–500 nm range. In addition, the mass concentration of PM2.5 (particles with aerodynamic diameter <2.5 µm) and gaseous pollutants, including nitrogen dioxide (NO2), sulfur dioxide (SO2) and ozone (O3), were obtained from the nearby EPA air quality monitoring station at Rathmines, approximately 3 km from our observation sites (Fig. S1). Meteorological data, including wind speed (WS), wind direction (WD), relative humidity (RH), and ambient temperature, were obtained from Dublin Airport, located about 10 km away (https://www.met.ie/climate/available-data/historical-data, last access: 20 July 2026). The hourly data coverage for each instrument and dataset is summarized in Fig. S3 in the Supplement. Please note, eBC data was not available between 2018 and 2020 due to instrumental issues. To allow for more continuous and comparable long-term trend analysis, eBC mass concentrations during this period were estimated from concurrent OA mass concentrations using a single annual average eBCOA ratio (0.24) derived from periods with valid eBC measurements. This approach is supported by the typically strong correlation and relatively stable mass ratios between eBC and OA (see Table S1 in the Supplement), due to their common sources. The uncertainty associated with the eBC reconstruction, including the possible influence of seasonal variability in the eBCOA ratio and the use of reconstructed data in the long-term trend analysis, was evaluated through sensitivity tests described in the Supplement (Sect. S1). Overall, the potential uncertainty introduced by reconstructing eBC from OA is expected to be largely reduced when focusing on monthly or annual scales, making this approximation suitable for long-term analysis. However, compared with components based entirely on direct measurements, the long-term eBC trend, particularly its fitted magnitude, remains subject to greater uncertainty. In addition, data in 2016–2017 were collected from August 2016 to August 2017 (Fig. S3) and are therefore grouped as 2016–2017. All other years correspond to natural calendar years (January–December).
2.2 Data analysis and OA source apportionment
The raw NR-PM1 data collected by the Q-ACSM was processed using the standard data processing software (version 1.6.1.1) based on Igor Pro (Wavemetrices Inc), with instrument-specific RF and relative ionization efficiency (RIE) values obtained from regular ammonium nitrate and ammonium sulphate calibrations. The chemical composition dependent collection efficiency (CDCE) correction was also applied (Middlebrook et al., 2012). To ensure data reliability, all datasets underwent rigorous quality control, during which invalid or anomalous data points were identified and excluded from further analysis. Overall, the total PM1 () tracked well with PM2.5 mass concentrations (slope=0.83, r2=0.80, Fig. S4a in the Supplement) from nearby EPA monitoring station and the volume concentrations (slope=1.15, r2=0.92, Fig. S4b) derived from the collocated SMPS system. Importantly, as shown in Fig. S4a, the ratio between PM1 and EPA PM2.5 remained stable before and after the site relocation, further confirming that the two locations represent comparable urban background environments and that the relocation did not introduce bias on the long-term trend analysis.
The rolling positive matrix factorization (rolling-PMF) (Canonaco et al., 2021; Chen et al., 2022a) technique was applied to the Q-ACSM OA dataset for detailed source attribution. As a result, six OA factors were successfully identified, including four primary OA (POA): OA from (1) peat, (2) wood, (3) coal combustion, and also (4) a hydrocarbon-like OA (HOA) associated with traffic emissions and, more importantly, home oil heating (Lin et al., 2019b), and two oxidized OA factors (OOA): (1) a less oxidized OOA (LO-OOA) and (2) a more oxidized OOA (MO-OOA). More details on the rolling-PMF analysis in Dublin can be found in Lin et al. (2021) and Lei et al. (2025). While PMF is a powerful and widely used tool for resolving OA subtypes from different sources, it has inherent limitations in differentiating OOA. This is mainly because extensive atmospheric aging and fragmentation during AMS measurements leads to highly similar mass profiles among OOA components. Therefore, PMF typically separates OOA only based on their relative oxidation degrees, providing very limited insights into their origins. To address this challenge and enhance source attribution of OOA, a supervised machine learning model was developed to further distinguish OOA from local versus transboundary sources. The details of the OA machine learning model can be found in Lei et al. (2025). In brief, the machine learning model was built on the fact that during local emission dominated pollution episodes, OOA tends to increase concurrently with primary species, while under transboundary influence, such correlation was absent. This distinct difference in temporal behaviour provides a strong basis for the machine learning model to separate OOA origins. The model was first trained using rigorously selected datasets representing local emission-dominated episodes, allowing it to capture the typical features of locally formed OOA (LO-OOAlocal and MO-OOAlocal). After optimization and validation, the model was applied to the full Dublin dataset. By subtracting the local OOA from the total OOA, the remaining fraction was attributed to transboundary transport contributions (LO-OOATBT and MO-OOATBT), providing a more source-specific characterization of OOA. To keep the subsequent discussions concise, the three solid fuel-related POA factors (peat, wood and coal) were grouped into a single solid fuel OA factor, as they originate from the same residential emission category, and, more importantly, exhibit highly similar temporal patterns (Lin et al., 2017; Lei et al., 2025). Similarly, the LO-OOA and MO-OOA from local and transboundary sources were merged into two categories as OOAlocal (LO-OOAlocal + MO-OOAlocal) and OOATBT (LO-OOATBT + MO-OOATBT), respectively.
3.1 General characterization of air pollution in Dublin
To provide a general overview of urban air pollution in Dublin, we first examined the overall chemical composition, dominant pollution sources and seasonal variability of PM1 species using long-term observations from 2016 to 2023. The air quality in Dublin is usually strongly impacted by two typical types of pollution events: (1) transboundary transport from the UK and continental Europe (Ovadnevaite et al., 2021; Lin et al., 2022), and (2) local emissions from domestic heating, particularly during winter months (Lin et al., 2019b, 2018). Although photochemical production in summer and marine aerosols transported from the North-East Atlantic can occasionally elevate PM1 concentrations in Dublin, these sources rarely lead to polluted days and are therefore not the focus of this study.
Generally, local- and transboundary-dominated pollution episodes exhibit distinct temporal and chemical characteristics. Figure 1 shows illustrative examples selected to demonstrate the characteristic temporal evolution and chemical signatures of the two typical pollution episodes frequently observed in Dublin. The first case, as shown in Fig. 1 on the left shaded in light blue, illustrates a transboundary transport event that happened between 28 February and 4 March 2021, under persistent easterly winds originating from continental Europe and the UK (Fig. S5 in the Supplement). During this event, the mass concentration of PM1 began to rise from 1.7 µg m−3 in the evening of 28 February, reaching a peak at 45.5 µg m−3, and remained elevated for nearly 5 d. The pollution episode was characterized by a dominant contribution of inorganic species (66 %), particularly NO3, along with a substantial contribution from transboundary originated OOA (OOATBT). On average, NO3 accounted for 37 % of the total PM1 mass, followed by NH4 (18 %) and SO4 (11 %). OA also played a substantial role (28 %), with 41 % of OA attributed to transboundary OA (OOATBT). Although the peak PM1 concentration was moderate during this episode (<50 µg m−3), the average PM1 mass concentration reached 20.6 (±8.2) µg m−3, resulting in four polluted days, which is defined as days when daily PM1 mass concentration exceeds 15 µg m−3 (based on the WHO daily PM2.5 guideline). Such prolonged pollution episodes, even with moderate PM1 concentrations (generally <60 µg m−3), may still result in considerable health risks by leading to chronic exposure (Manisalidis et al., 2020; Arfin et al., 2023).
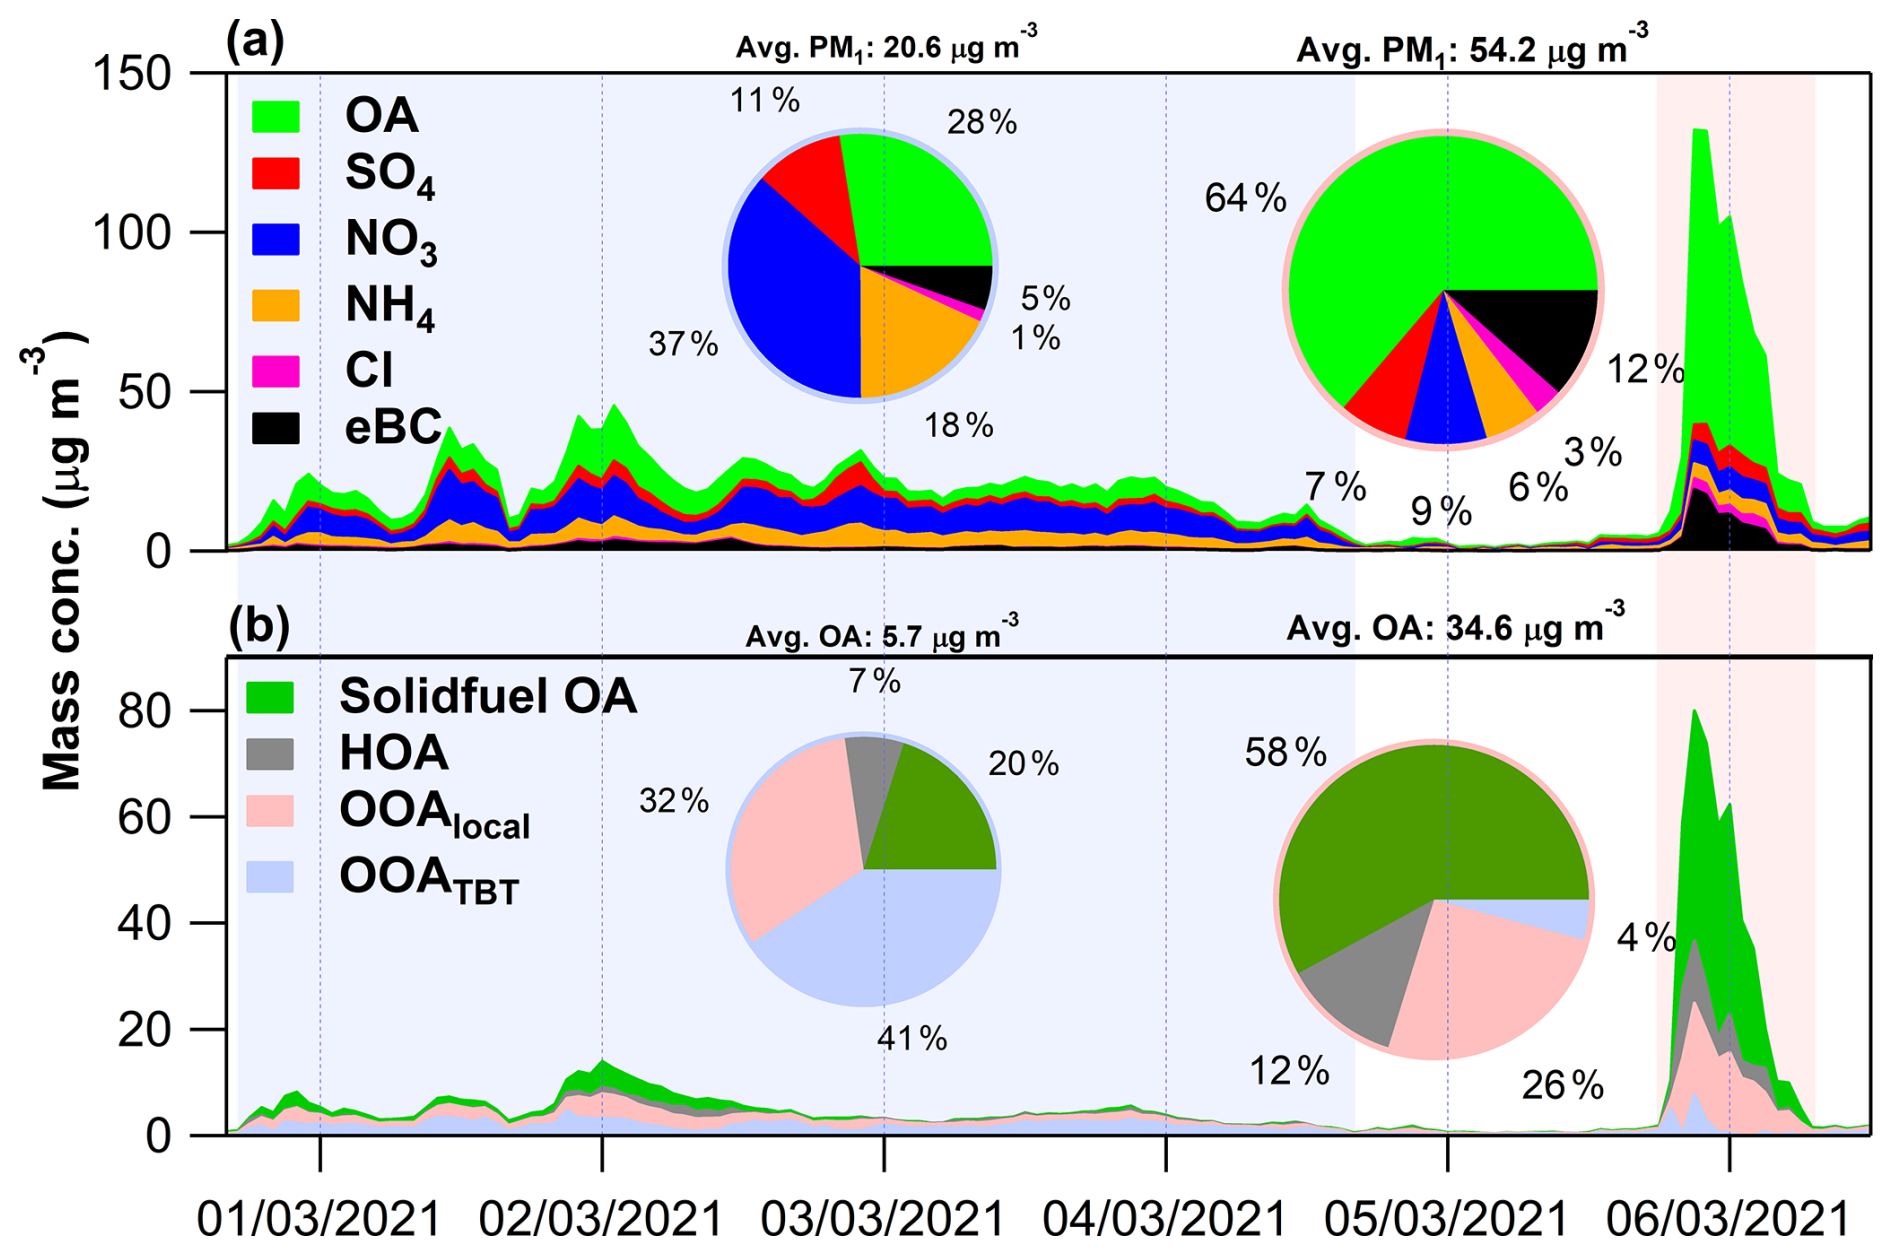
Figure 1Examples of air pollution events in 2021 dominated by transboundary transport (left, light blue shading) and local domestic heating emissions (right, light pink shading). Time series of PM1 species (OA, SO4, NO3, NH4, Cl, and eBC) are shown in (a) and OA factors (solid fuel OA, HOA, OOAlocal, and OOATBT) are shown in (b). Pie charts present the average composition of PM1 and OA during the two episodes.
On the other hand, the second case, shown on the right of Fig. 1 and shaded in light pink, illustrates a local emission-dominated pollution episode that occurred shortly after the transboundary event. In the evening of 5 March 2021, the ambient temperature dropped below 0 °C, thus, triggering an increase in home heating. Under stagnant meteorological conditions (RH>90 %, WS<2 m s−1, Fig. S5a), PM1 mass concentration rapidly increased from 4.4 to 131.7 µg m−3 within a few hours (from 18:00 to 22:00 UTC), before dropping back to below 10 µg m−3 in the early morning of 6 March. At the same time, as shown in Fig. S5a, gaseous pollutants also showed marked changes, with SO2 and NO2 peaking at 21.9 and 69.6 µg m−3, respectively, while O3 was rapidly depleted from over 60 µg m−3 to below 10 µg m−3. Different from the transboundary event, the PM1 chemical composition during this episode was dominated by OA (64 %), associated with a substantial contribution from eBC (12 %). Inorganic species contributed only 22 % of the total PM1 mass. The PMF analysis showed that OA was overwhelmingly dominated by local sources (96 %), particularly solid fuel combustion (58 %), followed by OOAlocal (26 %), while the contribution from OOATBT was minimal (4 %). The average PM1 mass concentration during this local event reached 54.2 (±46.1) µg m−3, however, only one polluted day was recorded due to its short duration. Nevertheless, such short-term but intense exposure to extremely high PM concentrations (>100 µg m−3), particularly high OA, is likely to trigger acute health effects, especially among sensitive populations (Li et al., 2017; Zhang et al., 2019). Similar local pollution episodes in cold season driven by residential heating have been widely reported across Ireland, including western (Lin et al., 2022), central (Rinaldi et al., 2024) and south-eastern regions (Byrne et al., 2023), highlighting the nationwide influence of domestic heating emissions. Comparable patterns are also observed across Europe. For instance, residential heating substantially elevates OA concentrations in Kraków, Poland (Tobler et al., 2021) and in Alpine valleys (Szidat et al., 2007), and solid-fuel combustion contributes up to 54 % of OA during wintertime in the Western Balkans (Bauer et al., 2026). Consistently, multi-site observations (Crippa et al., 2013; Chen et al., 2022b) and emission modelling (Denier Van Der Gon et al., 2015) identify solid fuel combustion as the dominant source of OA across the continent, highlighting the regional relevance of the Dublin observations.
A total of 157 polluted days with daily average PM1 higher than 15 µg m−3 were recorded from 2016 to 2023. To place the two illustrative cases in the context of the full dataset, these polluted days were further classified using broad chemical criteria based on the relative contributions of OA factors and NO3. Specifically, days with local OA (Solid fuel OA + HOA + OOAlocal) contributing more than 80 % of total OA mass were classified as local home heating-dominated, while days with enhanced OOATBT contributions (>40 % of total OA) together with a high NO3 fraction (>20 % of total PM1) were classified as transboundary transport-dominated. The remaining days that did not meet either criterion were classified as mixed events, occasionally with contributions from other sources. This classification was designed to identify the dominant pollution sources in a consistent way across the full dataset. As summarized in Table S2 in the Supplement, local home heating-dominated days accounted for the majority of polluted days (96 d, 61 %), followed by transboundary transport-dominated days (31 d, 20 %) and mixed events with potential contribution from other pollution sources. Only three polluted days showed less clear signatures of the two main pollution regimes, characterized by enhanced SO4 contributions (around 20 %) together with OOA dominance (> 50 %), likely reflecting enhanced local secondary formation during summer.
In addition, to further demonstrate the recurrence and characteristic features of these pollution regimes, additional examples are shown in the Supplement (Figs. S6 and S7 in the Supplement). For local home heating-dominated pollution events, the major events associated with the highest daily PM1 concentrations in each year were selected, with surrounding local-dominated periods also shown when they occurred continuously before or after the selected day. For transboundary transport dominated pollution, illustrative episodes with more pronounced PM1 enhancement, defined here as daily average PM1>20 µg m−3, were selected for each year when available. Examples of mixed and less typical events are also included (Fig. S7f). Despite event-to-event variability, these examples further illustrate the consistent overall characteristics of the two typical pollution regimes over the study period: local heating emission dominated events are typically intense but short-lived, with PM1 enhancements mainly driven by locally emitted components including eBC and local OA, whereas transboundary transport events are generally more persistent, less intense and characterized by elevated NO3 and OOATBT.
Driven primarily by the two aforementioned pollution types, or in some instances, their combination, PM1 concentrations and chemical composition in Dublin show clear seasonal patterns. Here, monthly averages were calculated using available data from all years to provide a representative overview of the dominant seasonal variations in PM1 concentration and composition in urban Dublin. As shown in Fig. 2, the coldest months, i.e., January, November and December (Fig. S8b in the Supplement), consistently show the highest PM1 concentrations (7.0–8.1 µg m−3), with OA contributing over half of the total PM1 mass (51 %–53 %) and eBC accounting for 13 %–14 %, indicating dominant influence from home heating. Indeed, OA during these months comes almost entirely from local sources (around 90 %), primarily from solid fuel OA (39 %–43 %), followed by OOAlocal (around 32 %) and HOA (15 %–17 %, mainly originated from oil heating, Lin et al., 2019b). Although February sees similar ambient temperatures, the average PM1 concentration drops to 6.0 µg m−3, likely due to higher wind speeds in February (see Fig. S8a) favouring pollution dispersion. However, the increase in easterly wind frequency enhances transboundary influence, leading to higher mass fractions of NO3 (from 12 %–13 % to 19 %) and NH4 (from 8 %–9 % to 11 %). The fractional contribution of OOATBT to total OA also rises from 8 %–12 % to 18 %, further suggesting stronger impacts from regional transport in February. In March and April, PM1 chemical composition shifts further as local heating declines with rising ambient temperatures. Concentrations of locally emitted components, including OA from solid fuel combustion, HOA, OOAlocal as well as eBC, all show clear decreases. For example, the monthly concentrations of solid fuel OA and eBC decreased to 0.5–0.7 µg m−3 and 0.5–0.6 µg m−3 respectively, compared to 1.2–1.6 µg m−3 and 1.0–1.2 µg m−3 in the coldest months. In contrast, secondary species, particularly NO3 and NH4, as well as OOATBT, kept increasing, likely due to enhanced springtime agricultural emissions in the UK and continental EU transported by more frequent easterly winds (Fig. S8a). For example, the monthly concentrations of NO3 and OOATBT increased from ∼1.0 and <0.1 µg m−3 to ∼1.5 and ∼0.2 µg m−3, respectively. As a result, despite the reduction in local emissions, the monthly average PM1 concentrations rebounded to 6.3–6.6 µg m−3. Notably, OOATBT reaches 38 % of total OA in April, surpassing OOAlocal (32 %, Fig. 2d), associated with a high fraction of NO3 (23 %, Fig. 2b), indicating a seasonal shift toward transboundary sources.
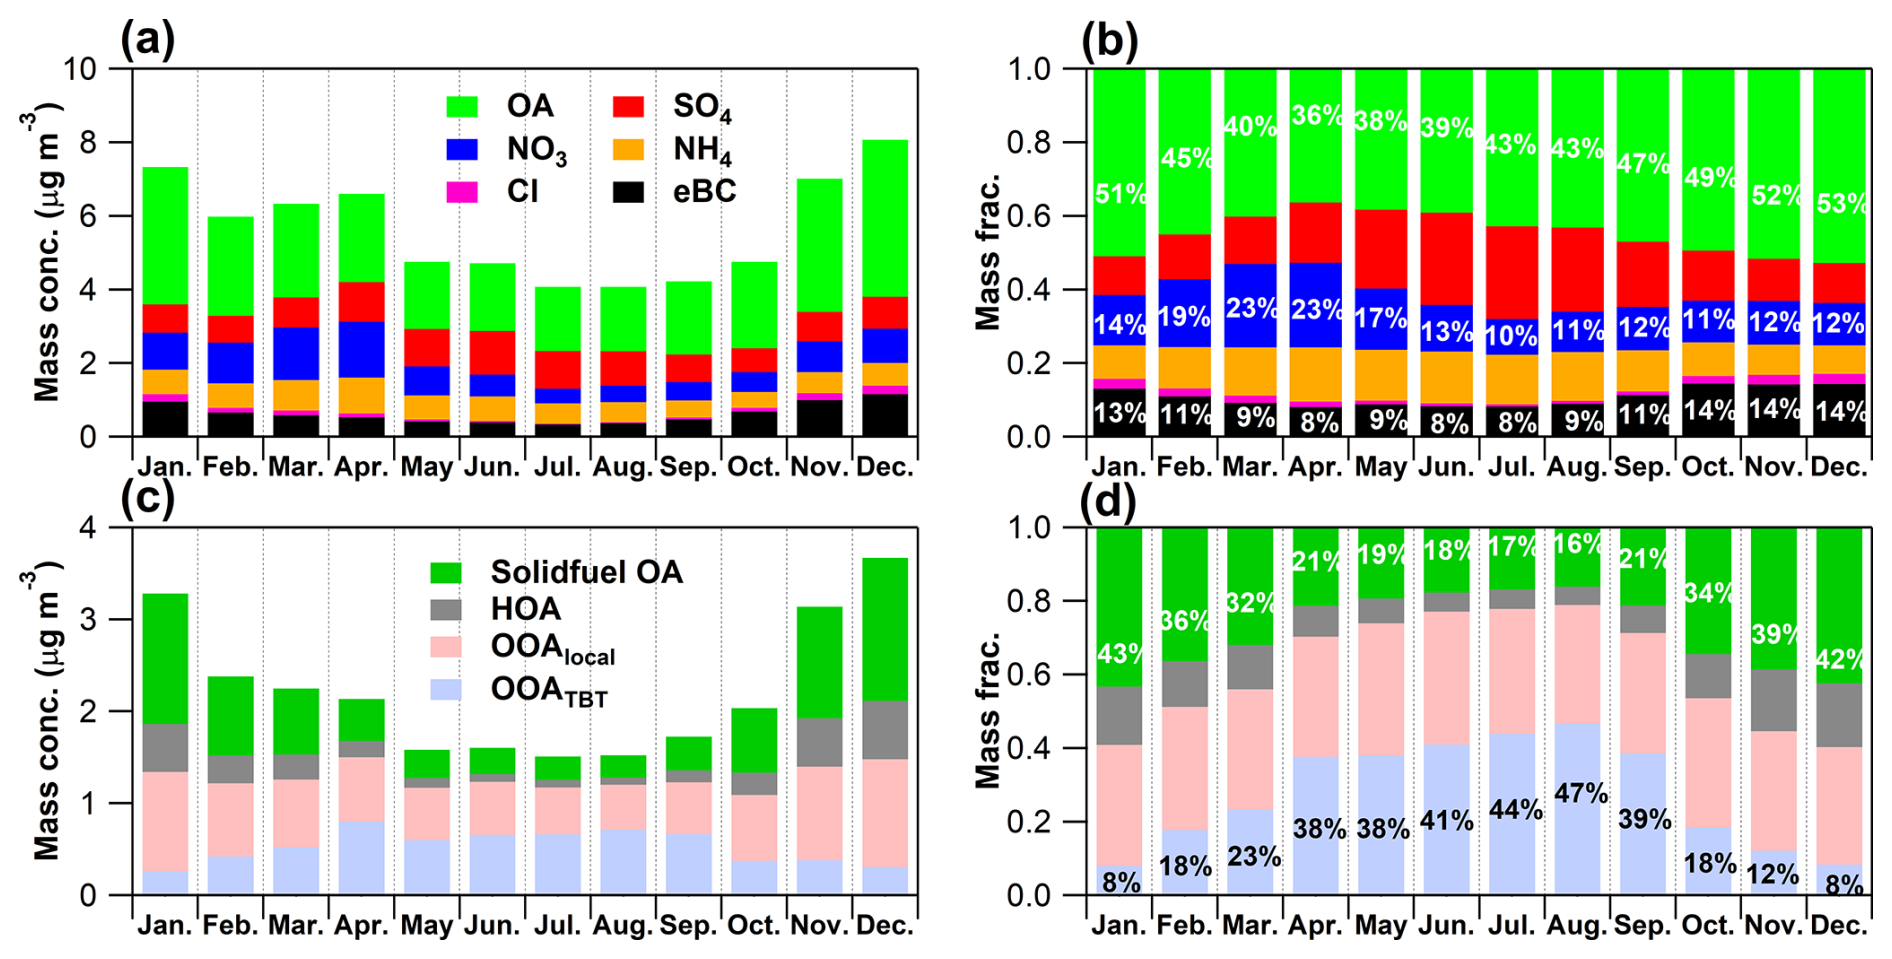
Figure 2Monthly average mass concentrations and chemical composition of (a, b) PM1 and (c, d) OA in Dublin from 2016 to 2023. Panels (b) and (d) show the percentage contributions of major PM1 and OA components, respectively.
During warmer months (May to October, when the average temperature exceeds 10 °C), PM1 concentrations remain consistently low (4.1–4.8 µg m−3), with OA staying below 2 µg m−3 except in October, when local emissions begin to reappear due to sporadic cold spells. From May to September, PM1 is predominately composed of secondary species, with secondary inorganic components (NO3, SO4 and NH4) accounting for 41 %–52 % of total PM1, and secondary OA (OOAlocal and OOATBT) contributing more than 70 % of total OA (71 %–79 %). The elevated contributions of secondary components are consistent with stronger solar radiation during these months, which enhances photochemical production. In addition, this is superposed with transboundary transport that persists in the warm months, although to a lesser degree compared with spring.
Among major gaseous pollutants, NO2 and SO2 presented broadly consistent seasonal behaviours with PM1. Specifically, as shown in Fig. S9a in the Supplement, NO2 remained elevated throughout the year due to persistent traffic emissions (>10 µg m−3), however, concentrations were clearly higher in winter (around 20 µg m−3) when additional emissions from domestic heating and reduced atmospheric dispersion further enhanced ambient levels. SO2 exhibited relatively weak seasonality overall, but concentrations increased noticeably during the coldest months (November–January, >2 µg m−3), consistent with enhanced solid fuel combustion for residential heating. In contrast, O3 exhibited a distinctly different seasonal pattern, with concentrations peaking in late winter and spring (February to May, around 60 µg m−3), while notably lower levels were observed during summer (June–August, around 40 µg m−3) (Derwent et al., 2018). This seasonal behaviour likely reflects enhanced hemispheric and regional transport, possible stratospheric influence, and favourable photochemical production during spring, whereas increased photochemical destruction and reduced transport in summer limit O3 accumulation (Coleman et al., 2025).
3.2 Long-term trends of air quality in Dublin
Previous studies have identified local home heating, particularly solid fuel combustion, as the main culprit of extreme air pollution events in Dublin (Lin et al., 2018; Lin et al., 2019b; Wenger et al., 2020). In response, the Irish government has implemented a series of mitigation measures targeting solid fuel use, including the continued enforcement of the smoky coal ban, the Clean Air Strategy and, more recently, the new Solid Fuel Regulations (Environmental Protection Agency Ireland, 2025a), which are in line with the broader European policy framework aimed at improving air quality and reducing associated health risks. To assess the effectiveness of those interventions, and, more broadly, to understand the evolving characteristics of urban air pollution and health exposure risks, long-term trends in PM1 concentration, composition and sources in Dublin from 2016 to 2023 are analysed.
3.2.1 Long-term trends in PM1 concentration and composition
Figure 3 shows the annual trends of total PM1 and its major components. Please note, as 2019 lacks summer data and would be biased toward winter conditions, it was excluded from the trend analysis and is marked in light grey for clarity. Statistical significance of the long-term trends was assessed using the Mann–Kendall test (Sicard et al., 2023) based on daily average concentrations, while linear regression of annual mean values was used to estimate the magnitudes of the trends (Jaiswal et al., 2015), with the 95 % confidence intervals (95 % CI) showing the associated uncertainties. As shown in Fig. 3a, total PM1 mass concentration exhibited a statistically significant decline over the years, with annual average falling from around 6.5 µg m−3 in 2016–2017 to below 5 µg m−3 starting from 2022 (4.2–4.9 µg m−3). The average annual reduction rate was −0.46 (95 % CI: −0.70 to −0.23, Table 1). While total OA did not show any significant trend (p=0.20, Fig. 3b and Table 1), a clear reduction was observed for locally emitted POA. More specifically, as shown in Fig. 4, both solid fuel OA and HOA exhibited significant downward trends, with the reducing rates of −0.04 (95 % CI: −0.06 to −0.02) and −0.08 (−0.16 to −0.02), respectively. Similarly, eBC showed a significant decreasing trend (−0.07 , −0.10 to −0.04), suggesting that local emissions from home heating have steadily declined. The robustness of the long-term eBC trend, despite the reconstruction of missing eBC data for 2018–2020 using a single annual eBCOA ratio, was validated by a sensitivity test using monthly eBCOA ratios, which produced the same annual mean eBC trend slope and unchanged Mann–Kendall significance (see Fig. S10 and Table S3 in the Supplement for details). An additional sensitivity test excluding the reconstructed years also produced a comparable decreasing trend, indicating that the eBC trend was not significantly biased by the reconstructed data. On the other hand, although the annual average concentration of OOAlocal decreased post 2018, from 0.9 µg m−3 to around 0.6 µg m−3 in 2023, its overall trend did not reach statistical significance (p=0.64). This limited decline in OOAlocal may reflect the competing influences of reduced local emissions and evolving atmospheric processing. In particular, as shown in Fig. S9b and Table S4 in the Supplement, the O3 concentration in Dublin increased from 38.7 µg m−3 in 2016–2017 to 49.4 µg m−3 in 2023 (2.21 , 95 % CI: −0.11–4.53). As one of the most important atmospheric oxidants and a key species closely linked to photochemical chemistry, the significant increase in O3 may indicate enhanced atmospheric oxidative capacity in urban Dublin, which may potentially offset the benefits of reduced primary emissions through more effective secondary production (Huang et al., 2021; Sun et al., 2020; Nassau and Jaeglé, 2025). The increase in O3 concentrations may be related to the non-linear response of O3 chemistry to declining nitrogen oxides (NOx) emissions, leading to a lower O3 titration by NO (Korhale et al., 2026). Indeed, NO2 concentrations in Dublin showed a continuous decreasing trend, from around 20 µg m−3 in 2016–2018 to around 14 µg m−3 in recent years (Fig. S9b). Similar NOx-O3 responses have been reported in the UK (Lee et al., 2020; Finch and Palmer, 2020) and many other urban areas (Yan et al., 2018; Sicard et al., 2020), where volatile organic compound (VOC)-limited photochemistry can lead to increased O3 or slower O3 decreases despite reductions in NOx emissions. In addition, the continuous decline in PM1 concentrations may also indirectly enhance O3 formation by reducing the heterogeneous scavenging of hydroperoxy radicals and reactive nitrogen species that are involved in photochemical O3 production (Li et al., 2019). This highlights the need for coordinated control of PM, O3, and their precursors as reductions in primary PM emissions alone may not be sufficient to achieve better air quality.
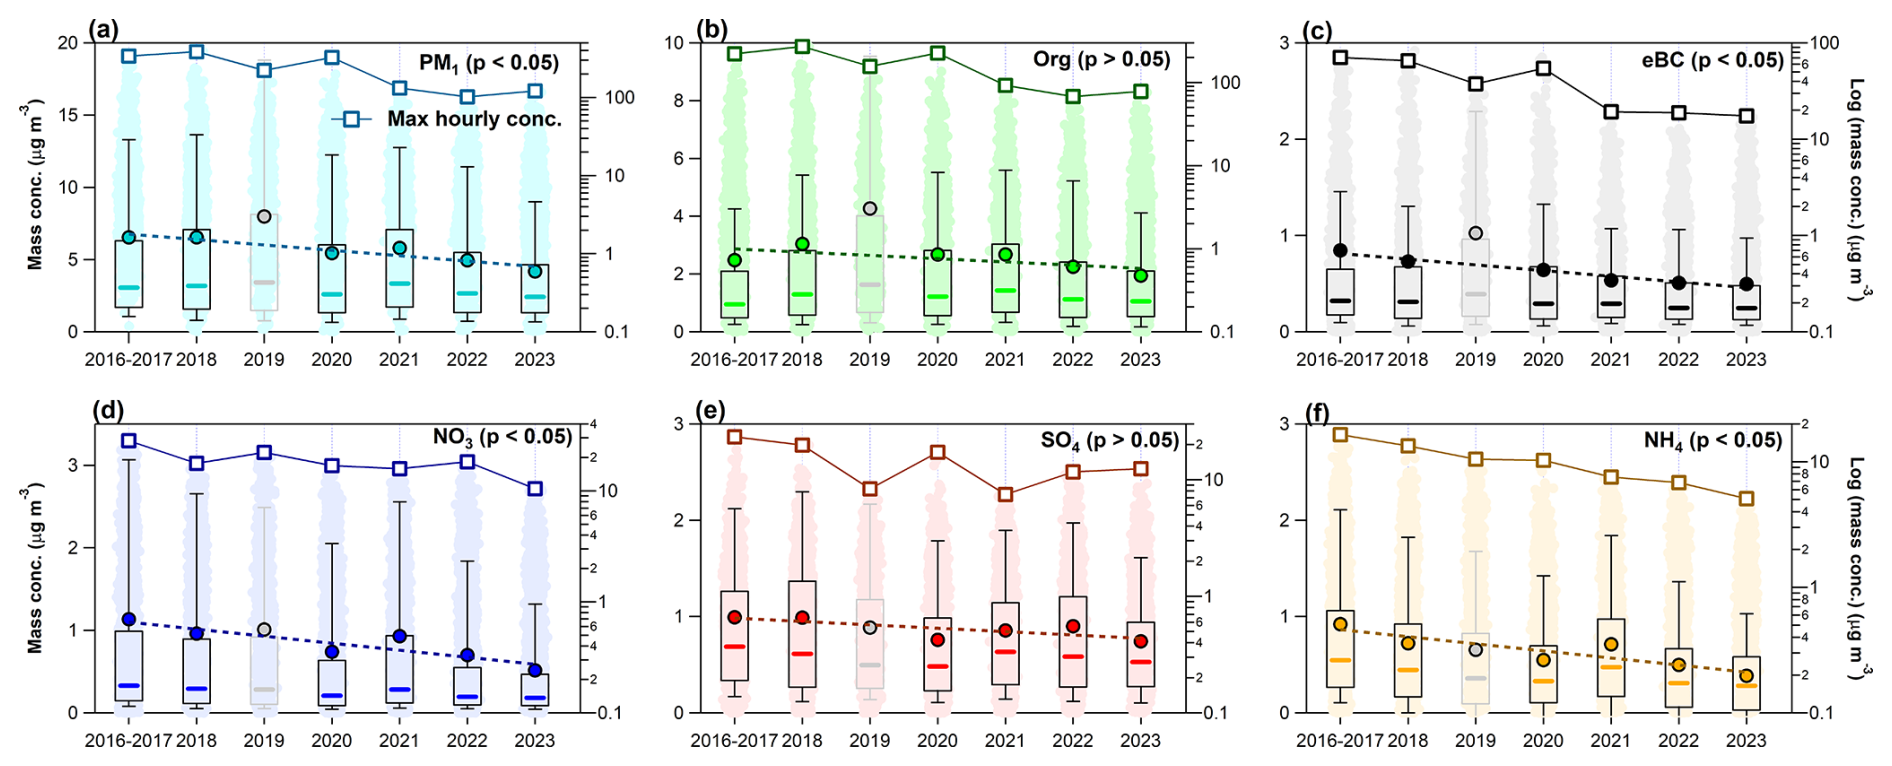
Figure 3Box plots of annual average mass concentrations for (a) total PM1 and major components: (b) OA, (c) eBC, (d) NO3, (e) SO4, and (f) NH4, based on long-term observations in Dublin (2016–2023). Light-colored dots in each annual bin represent all hourly data points from that year. Box plots show the mean (circle), median (horizontal line), 25th–75th percentiles (box), and 10th–90th percentiles (whiskers). Lines with square markers show annual hourly maximum concentrations (right axis, log-scale for clarity). Please note that 2019 is excluded from long-term trend analysis and is shown in grey due to biased data coverage (Fig. S3). The dashed line represents the linear fit of annual average concentrations with 2019 excluded, and the statistical significance of the trends is also shown.
Table 1Mann–Kendall test results for total PM1 and its major components from 2016 to 2023, along with linear regression slopes and the 95 % confidence intervals based on annual average mass concentrations. The upward arrows denote increasing trends, downward arrows denote decreasing trends, and the absence of arrows indicates non-significant trends (p>0.05).

∗ For annual hourly maxima, only the slope is provided, while trend significance is not evaluated.
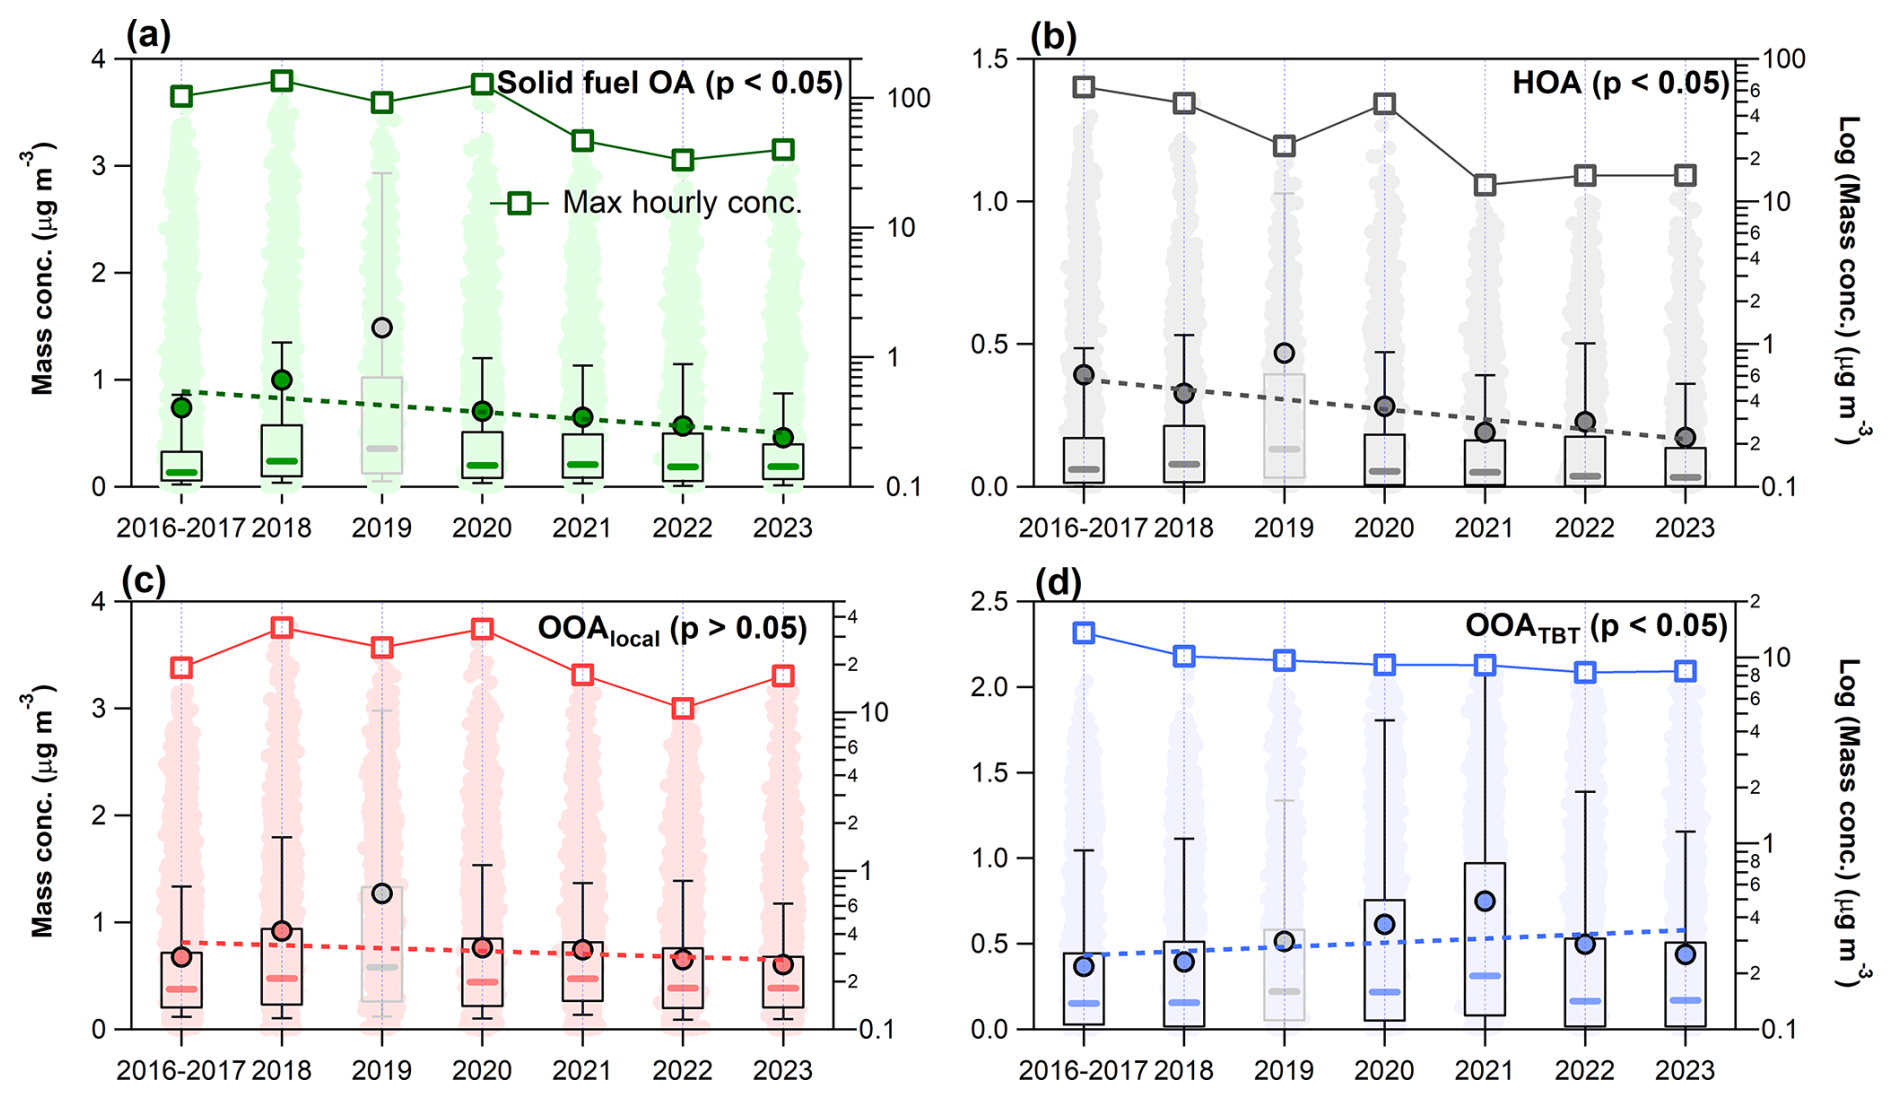
Figure 4Box plots of annual average mass concentrations for OA factors, including (a) Solid fuel OA, (b) HOA, (c) OOAlocal and (d) OOATBT, based on long-term observations in Dublin (2016–2023). Light-colored dots in each annual bin represent all hourly data points from that year. Box plots show the mean (circle), median (horizontal line), 25th–75th percentiles (box), and 10th–90th percentiles (whiskers). Lines with square markers show annual hourly maximum concentrations (right axis, log-scale for clarity). Please note that 2019 is excluded from long-term trend analysis and is shown in grey due to biased data coverage. The dashed line represents the linear fit of annual average concentrations with 2019 excluded, and the statistical significance of the trends is also shown.
Among SIA species, SO4 showed no clear trend over the same period, consistent with only minor changes in its precursor SO2. However, NO3 and NH4 both displayed the strongest decreasing trends, with annual slope of −0.11 (−0.18 to −0.03) and −0.09 (−0.16 to −0.03), respectively. These trends may reflect broader regional reductions in nitrogen-containing precursor emissions, e.g., stricter controls on agricultural ammonia and nitrogen oxide emissions implemented in EU in recent years. For example, NOx concentrations have been reported to decline steadily across various locations in Europe over the past decade (Macdonald et al., 2021; Adame et al., 2022; Nelson and Drysdale, 2025). A satellite-based analysis also revealed regional reductions in atmospheric ammonia across Europe between 2013 and 2020 (Tichý et al., 2023). Consistent with these regional trends, NO2 concentrations in Dublin (Fig. S9b and Table S4) also showed a continuous decrease during the study period, with an average rate of −1.16 (95 % CI: −2.80 to 0.49). In addition, the reductions in local solid fuel combustion, which is another important source of NO3 and NH4, likely also contributed to the observed decline of NO3 and NH4. The continuous reductions in NO3 and NH4 in Dublin are consistent with previous findings based on a combination of online AMS/ACSM data, offline filter analysis, and chemical transport modelling, which revealed widespread decreases in NO3 and NH4 across Europe between 2005 to 2020, primarily driven by precursor emission reductions (Tsimpidi et al., 2025). Conversely, although the absolute rate of change was small (0.02 ), OOATBT was the only component that showed a statistically significant increasing trend. This further supported that the reductions in NO3 and NH4 were more likely due to reduced precursors instead of less frequent easterly transport. As a result of the sustained reductions in multiple PM1 species, the annual number of polluted days has also declined significantly over the study period. Specifically, as shown in Fig. S11 in the Supplement, from ∼30 d in 2016 to 2018 to only 10 d in 2023. Similarly, the number of highly polluted days (daily PM1>25 µg m−3) also decreased from >10 d to less than 5 d in recent years, further highlighting the air quality improvement in Dublin. However, this exceedance (10 d yr−1) remains above the WHO guideline level (3–4 d annually). Moreover, a recent study in Ireland (Lin et al., 2026) suggests that reductions in particle mass do not necessarily imply lower health risks, as ultrafine particle numbers may remain high or even increase despite declining PM1 mass loading. Therefore, sustained actions are still needed to further reduce air pollution exposure and associated health risks.
To further evaluate changes in pollution severity, the annual maximum hourly concentrations of PM1 species were examined. Encouragingly, all species showed remarkable declines in peak concentrations over the years. For instance, the max OA concentration dropped from over 200 µg m−3 before 2018 to below 100 µg m−3 since 2021, with an average reduction rate of −41.9 (95 % CI: −74.9 to −8.8, Fig. 3b and Table 1). The reduction of total OA was primarily driven by a sharp decline in solid fuel OA, whose max concentrations fell from over 100 µg m−3 to below 50 µg m−3 (−20.1 , −40.3 to 0), followed by substantial reductions in max eBC (−12.6 , −19.1 to −6.0), HOA (−10.8 , −17.4 to −4.1) and OOAlocal (−2.78 , −8.8 to 3.7). SIA species also showed clear decreases in their peak concentrations, with average declines ranging from −2.26 to −2.53 . Even OOATBT showed a minor drop in its peak concentration, from 13.6 µg m−3 in 2016–2017 to 8.4 µg m−3 in 2023. As a result, the PM1 peak concentration in Dublin has declined dramatically from around 350 µg m−3 in early years to around 100 µg m−3 in 2022–2023. Interestingly, the most notable reduction occurred in 2021. This sharp reduction was largely driven by a substantial drop in solid fuel OA (from 127.4 to 46.8 µg m−3) and eBC (from 54.4 to 19.3 µg m−3). The timing of the sharp decline in extreme local primary pollutants coincides with the period of intensified public awareness campaigns and preparation for the new solid fuel regulations before the official implementation in October 2022 (Department of Climate Energy and the Environment, 2021). This suggests that the public outreach efforts may have contributed to raising public awareness and reducing extreme pollution events. However, this interpretation needs further confirmation with more direct evidence, such as household fuel-use or behavioural data.
Although the average PM1 and OA composition remained fairly stable over the years (Fig. S12 in the Supplement), with carbonaceous components (OA + eBC) consistently accounting for 51 %–61 % of total PM1 and local OA dominating the total OA mass (68 %–85 %), notable changes were still observed, particularly for OA. Specifically, the average contribution of local OA dropped from 83 %–85 % in 2016–2017 and 2018 to 68 %–75 % in recent years, primarily due to the reduced fractions of solid fuel OA (from 34 %–38 % to 28 %–30 %) and HOA (from 12 %–18 % to 8 %–12 %). In contrast, OOAlocal remained relatively stable at 31 %–36 %. Meanwhile, the fraction of OOATBT, the only OA factor showing a increasing trend, increased clearly from 15 %–17 % to 25 %–32 %, highlighting a growing relative influence of transboundary sources while local emissions continue to reduce.
Since the study period includes 2020 and 2021, COVID-19 related restrictions may have altered human activity patterns and emission intensities (Sun et al., 2020; Shi et al., 2021), potentially influencing the derived long-term trends. To assess this effect, we performed a sensitivity test by repeating the trend analysis after excluding the 2020–2021 data. However, as shown in Table S5 in the Supplement, the overall direction and statistical significance of the trends remained largely unchanged, and the fitted slopes were generally comparable to those obtained using the full dataset. This suggests that, although COVID-19 related behavioural changes may have affected short-term concentrations and chemical composition, the main long-term trend conclusions are not significantly biased by the inclusion of the COVID-affected years. In addition to changes in emissions, meteorological variability can also influence PM1 concentration and composition. Meteorological conditions in Ireland generally exhibit clear and stable annual patterns, featuring prevailing westerly to south-westerly winds. As shown in Fig. S13 in the Supplement, the overall meteorological pattern in Dublin remained broadly consistent from 2016 to 2023, with no evident shifts in temperature, relative humidity, or wind direction. Average wind speeds were even slightly lower after 2021, indicating that the continuous decline in PM1 is unlikely driven by more favourable dispersion conditions. Nevertheless, some meteorologically driven impacts were still observed. For instance, annual PM1 concentrations showed a clear positive correlation with the number of low-temperature days (daily minimum temperature <5 °C, Fig. S14a in the Supplement), particularly since 2018, reflecting the overall strong sensitivity of local heating emissions to colder conditions. Notably, the frequency of such cold days decreased from over 140 d in 2016–2017 to 109 d in 2023, suggesting that meteorological conditions may indeed have contributed to the decline in PM1. However, despite the pronounced reductions in the hourly maximum PM1 concentrations, the annual minimum temperature remained comparable across the years (−5.6 to −4.0 °C, Fig. S14b) and showed no clear correlation with the annual maximum PM1 concentrations. This suggests that the sharp decline in extreme PM1 levels is mainly driven by local emission reductions rather than warmer conditions. Overall, the results indicate that the improved air quality in Dublin has been driven mainly by reduced emissions, with meteorological variations playing a minor role. Further analysis is needed to better quantify their relative impacts. Besides, potential changes in PM1 seasonal patterns associated with the long-term concentration trends were also evaluated (Fig. S15 in the Supplement) and discussed in detail in Sect. S1.2. Overall, the comparison between 2016–2018 and 2021–2023 shows that the long-term decreases mainly affected the absolute concentration levels, while the dominant seasonal structure was preserved.
3.2.2 Long-term trends of PM1 under different pollution levels
To better understand the sources and characteristics of air pollution in Dublin, we further examined the differences in PM1 composition under different pollution levels, i.e., low (PM1<15 µg m−3), moderate ( µg m−3) and high (PM1≥50 µg m−3) conditions. Here, the low pollution threshold follows the WHO daily guideline for fine particulate matter, while the high-pollution threshold was selected as an operational level representing severe air pollution episodes in Ireland. Please note that the Mann–Kendall analysis here is based on hourly data. Generally, the mass concentrations of all PM1 and OA components (Fig. 5a and c), along with the key gaseous pollutants SO2 and NO2 (Fig. S16a in the Supplement), increase with pollution severity, partly due to increasingly stagnant meteorological conditions (Fig. S17 in the Supplement). However, the relative contributions of individual PM1 components vary markedly with pollution level, reflecting shifts in the dominant pollution sources. As shown in Fig. 5b, carbonaceous components consistently dominate PM1 mass across all pollution levels, but their contribution becomes increasingly pronounced during more polluted periods. Specifically, the average OA fraction rises from 42 % under low pollution to 63 % under high pollution conditions, and eBC increases from 10 % to 16 %. In contrast, inorganic species, particularly SO4 and NH4, show a decreasing trend in their mass fractions with increasing pollution levels. For instance, under low pollution conditions, SIA species contributes 47 % of total PM1 mass, comparable to carbonaceous components (52 %), with SO4 alone accounting for 20 %, likely due to increased contribution of photochemical formation and marine aerosols carried by westerly winds under low pollution levels (Ovadnevaite et al., 2014; Lin et al., 2019a). However, under high pollution conditions, the SO4 fraction drops to 9 %. Interestingly, under moderate pollution, SIA still contributes 42 % of PM1 on average, mainly due to a significant increase in NO3 (from 14 % to 21 %), indicating a strong influence from transboundary transport in addition to local emissions.
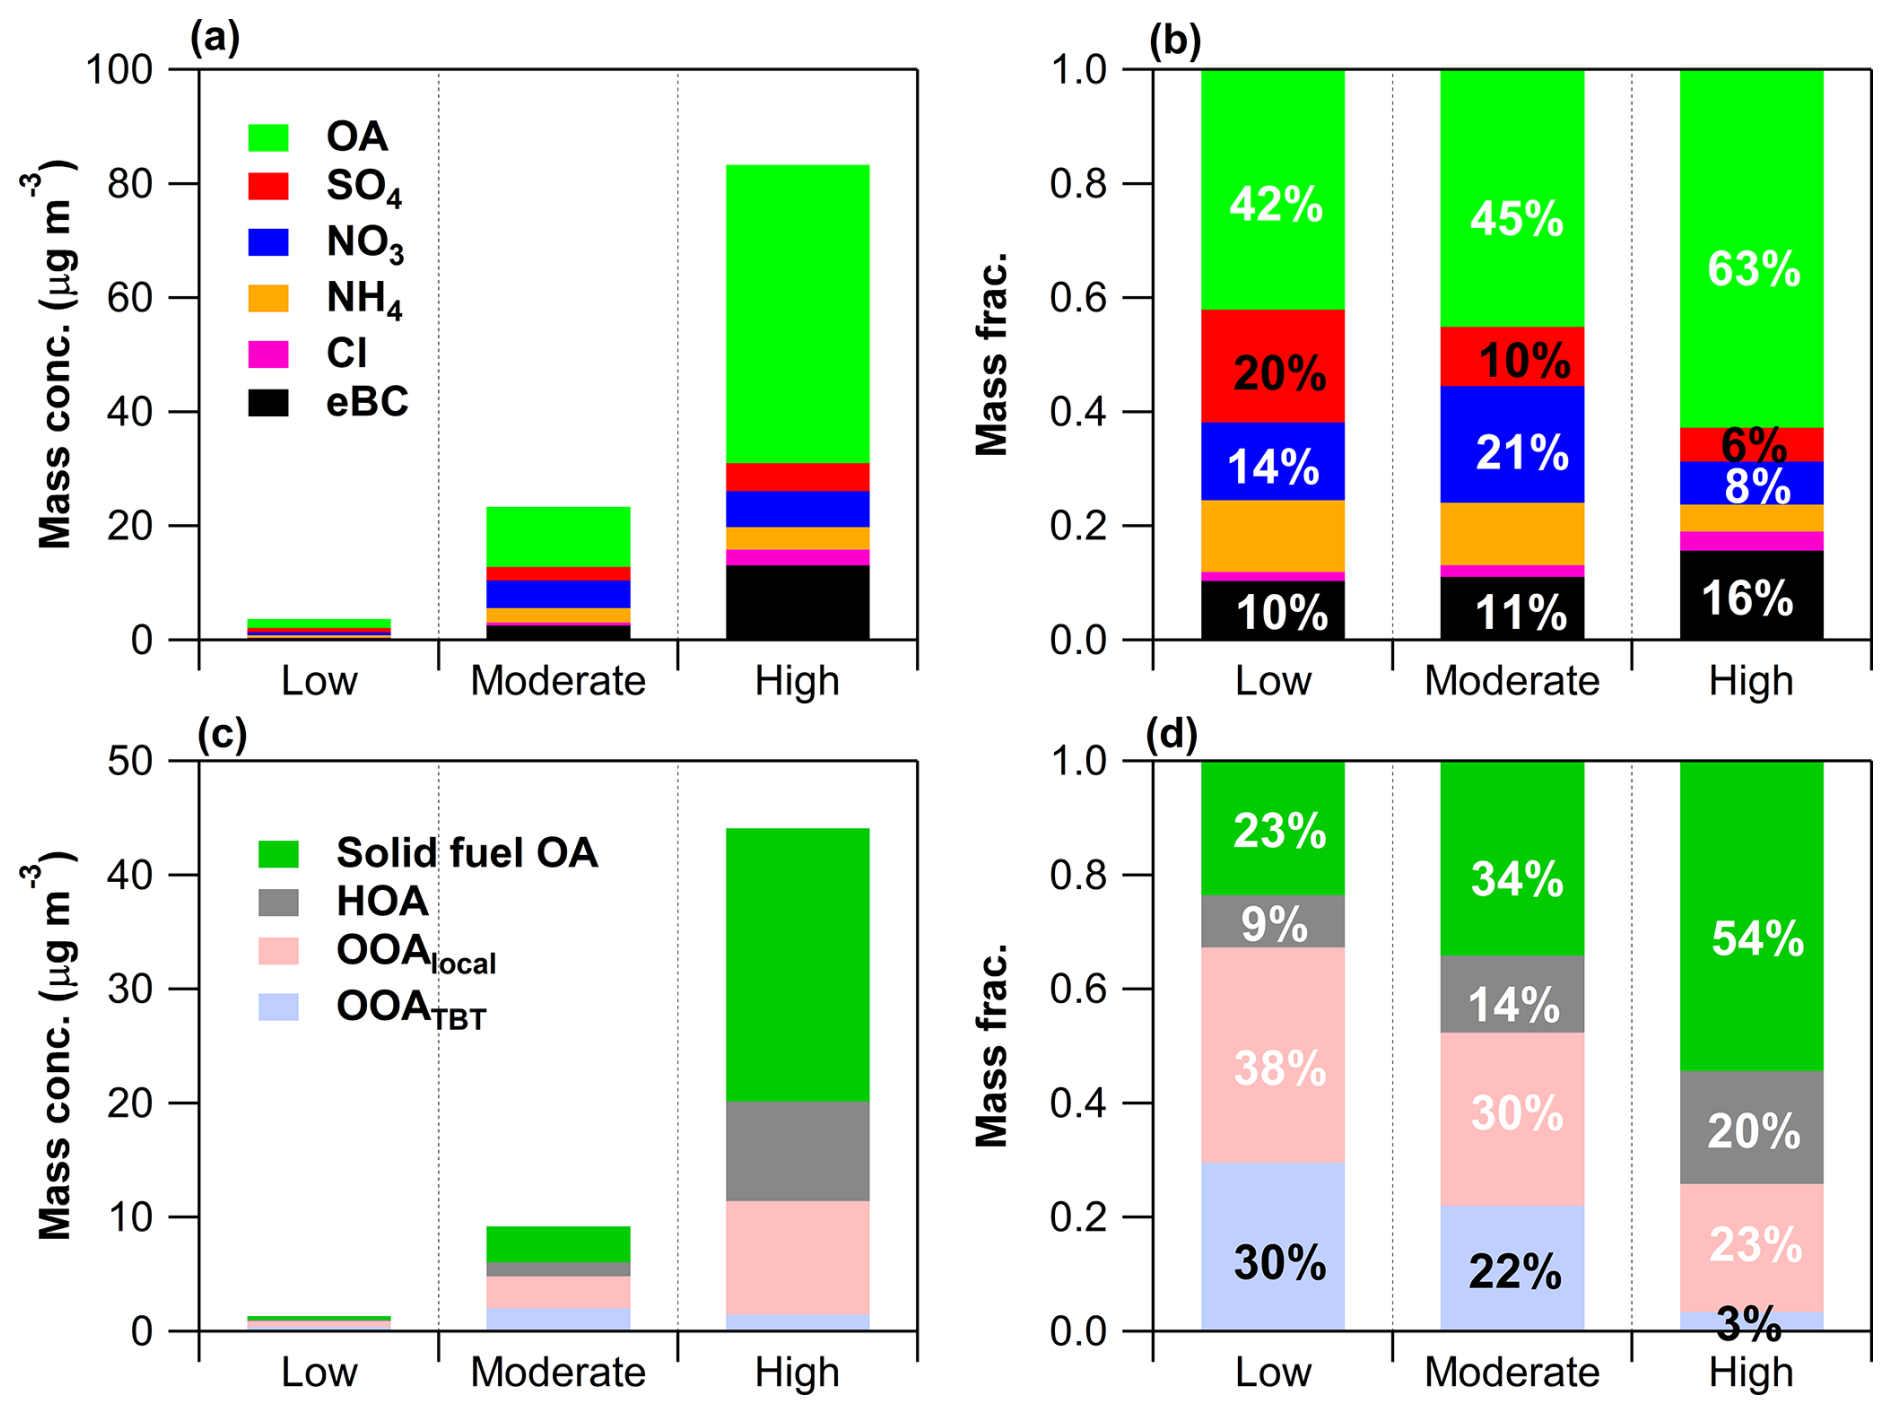
Figure 5Average mass concentrations and chemical composition of (a, b) PM1 and (c, d) OA under different pollution levels based on long-term measurements from 2016 to 2023. Pollution levels are categorized as low (PM1<15 µg m−3), moderate ( µg m−3) and high (PM1≥50 µg m−3). Percentages in (b) and (d) indicate the average relative contributions of individual PM1 and OA components.
Among OA components, POA becomes increasingly dominant with rising pollution levels (Fig. 5d). The fraction of solid fuel OA increases largely from 23 % under low pollution to 54 % under high pollution, HOA also rises from 9 % to 20 %. Conversely, the fraction of OOA, including both OOAlocal and OOATBT, decreases significantly. The mass fraction of OOAlocal drops from 38 % to 23 %, and OOATBT reduces from 30 % to only 3 %, reflecting the overwhelming influence of local home heating emissions during heavy pollution episodes. The decline in OOAlocal contribution with increasing pollution severity is likely linked to reduced oxidant availability. Indeed, as shown in Fig. S16a, the average concentrations of O3, which is one of the main nighttime oxidants, are significantly lower during more polluted periods (49.6 vs. 5.5 µg m−3). This suggests that oxidants may become insufficient under polluted conditions due to reduced photochemical production and enhanced depletion by elevated precursor levels, thus limiting the formation of OOAlocal.
Figure 6 presents the long-term trends of PM1 components, including both mass concentrations and relative mass fraction, under different pollution levels. PM1 concentrations showed statistically significant decreasing trends across all pollution levels, with the most pronounced reduction occurring under high pollution conditions. Under low pollution conditions, most major PM1 components exhibited statistically significant trends (Table 2), however, the average rates of change were minimal (≤0.05 ), resulting in only a minor decrease in total PM1 concentration (from 3.8 to 3.3 µg m−3). Notably, solid fuel OA and OOATBT showed a slight increasing trend, though the rate was negligible (≤0.02 ). Consequently, total OA showed a weak upward trend on average (0.02 , 95 % CI: −0.13 to 0.17, Table 2). Overall, while statistically significant, the observed changes under low pollution conditions were minor in magnitude. In contrast, under high pollution conditions, the decrease in PM1 concentration was substantial, with the average PM1 concentration dropping from 100.9 µg m−3 in 2016–2017 to 61.9 µg m−3 in 2022 and 72.4 µg m−3 in 2023, corresponding to an average annual decline of −7.8 (95 % CI: −13.1 to −2.2, Table 2). Moreover, the frequency of highly polluted points also showed a clear drop from over 100 in 2016–2017 to only around 30 in 2022–2023. All major PM1 components exhibited significant decreasing trends under high pollution conditions, except for total OA, whose overall reducing trend was not significant mainly due to the increasing concentrations of OOATBT. Locally emitted species showed the most substantial reductions. For example, solid fuel OA decreased from 26.3–33.1 µg m−3 in 2016–2018 to around 15 µg m−3 in 2022–2023, with an average annual reduction of −2.92 (−5.9 to 0.1). eBC and HOA concentrations also declined significantly, at rates of −1.68 (−3.3 to −0.1) and −1.48 (−3.1 to 0.1), respectively.
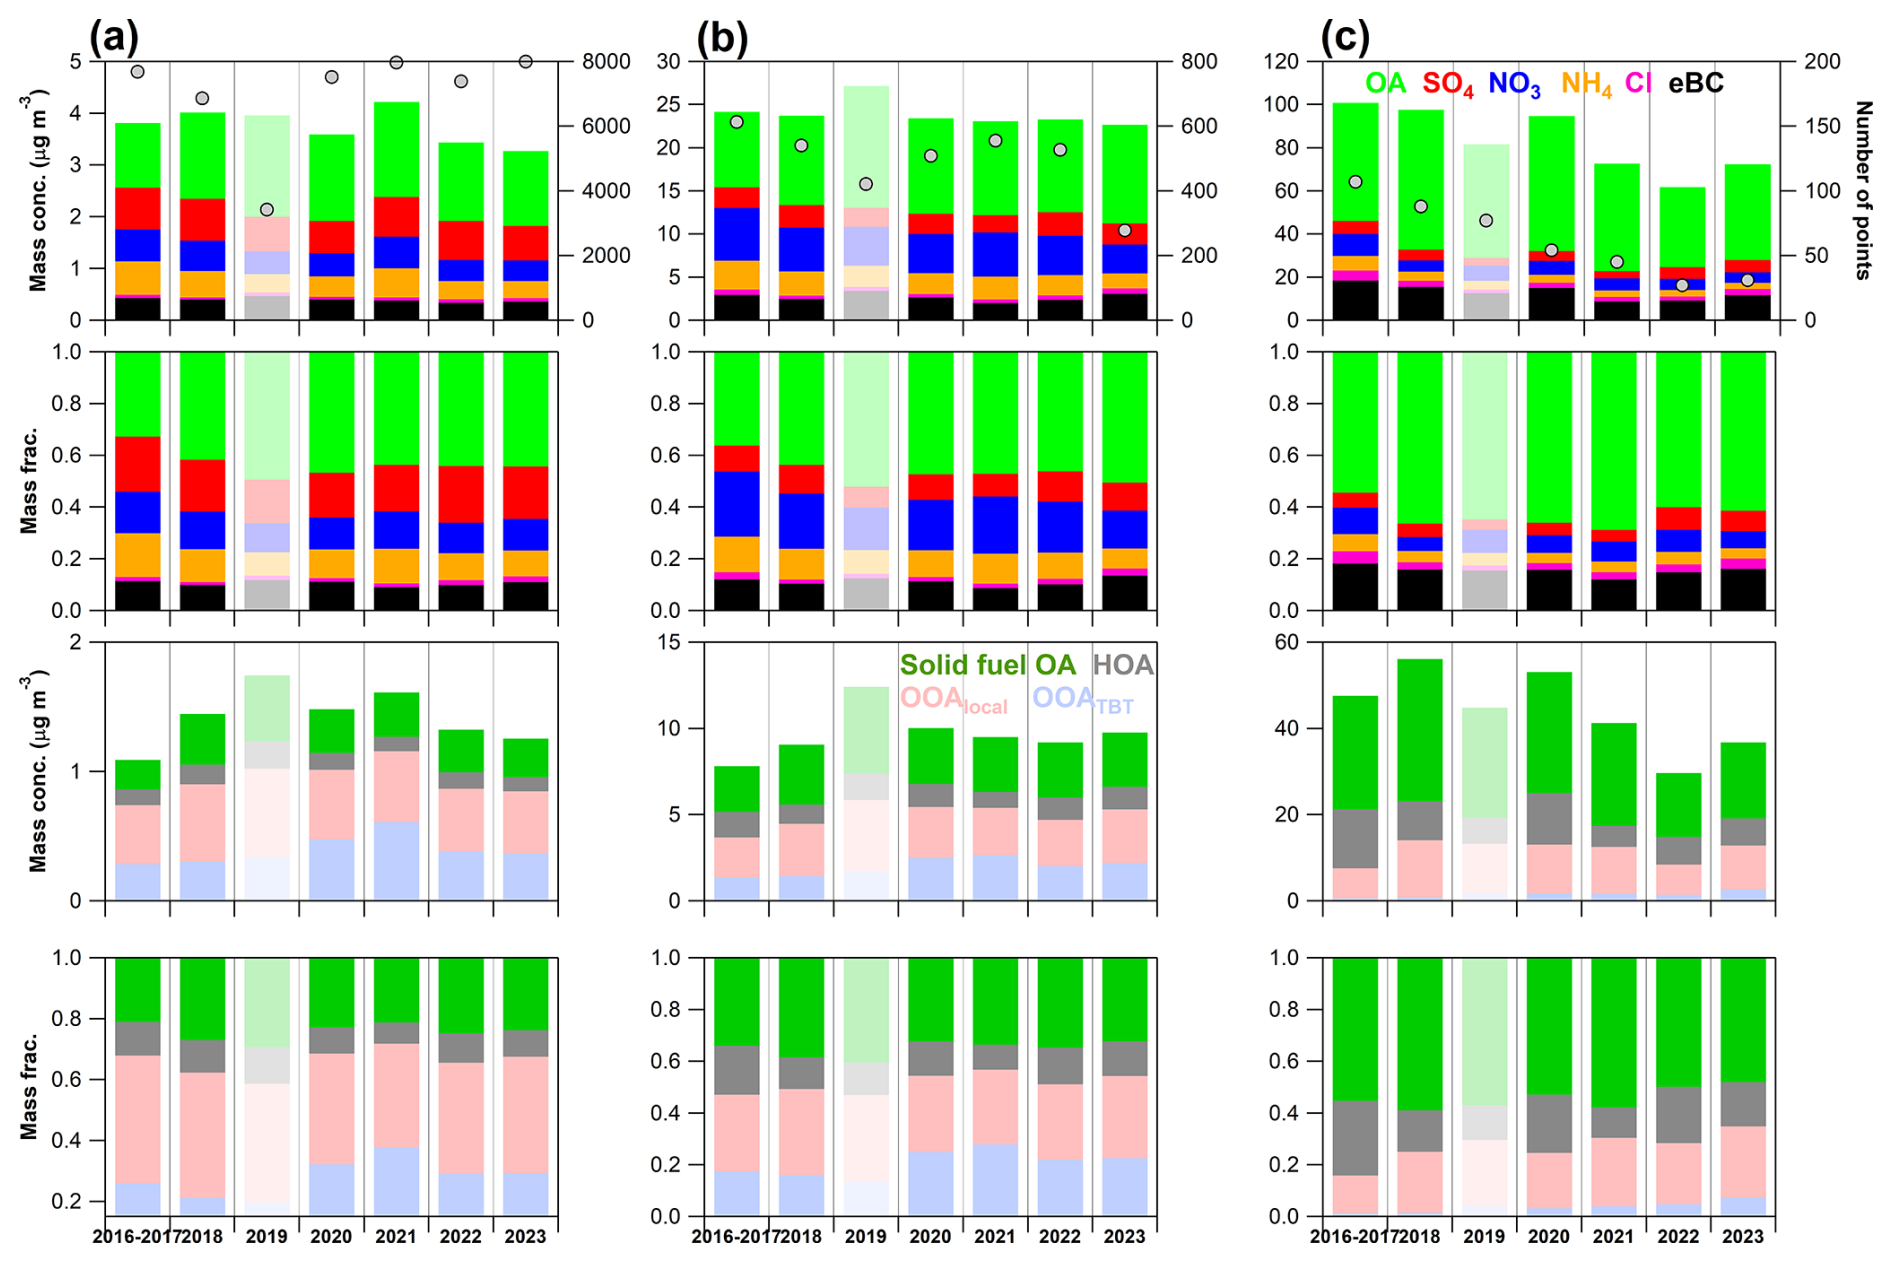
Figure 6Long-term trends in average mass concentrations and relative contributions of PM1 and OA components under (a) low, (b) moderate and (c) high pollution conditions from 2016 to 2023 in Dublin. Data from 2019 are excluded from the trend analysis due to biased coverage and are shown in grey. The grey open-circle markers in the top panels indicate the number of hourly data points in each year under each pollution level, read from the right-hand axis.
Table 2Mann–Kendall test results for total PM1 and its major components from 2016 to 2023, along with linear regression slopes and the 95 % confidence intervals based on annual average mass concentrations under low (PM1<15 µg m−3, shaded light green), moderate ( µg m−3, shaded light orange) and high pollution (PM1≥50 µg m−3, shaded light purple) conditions. The upward arrows denote increasing trends, downward arrows denote decreasing trends, and the absence of arrows indicates non-significant trends (p>0.05).
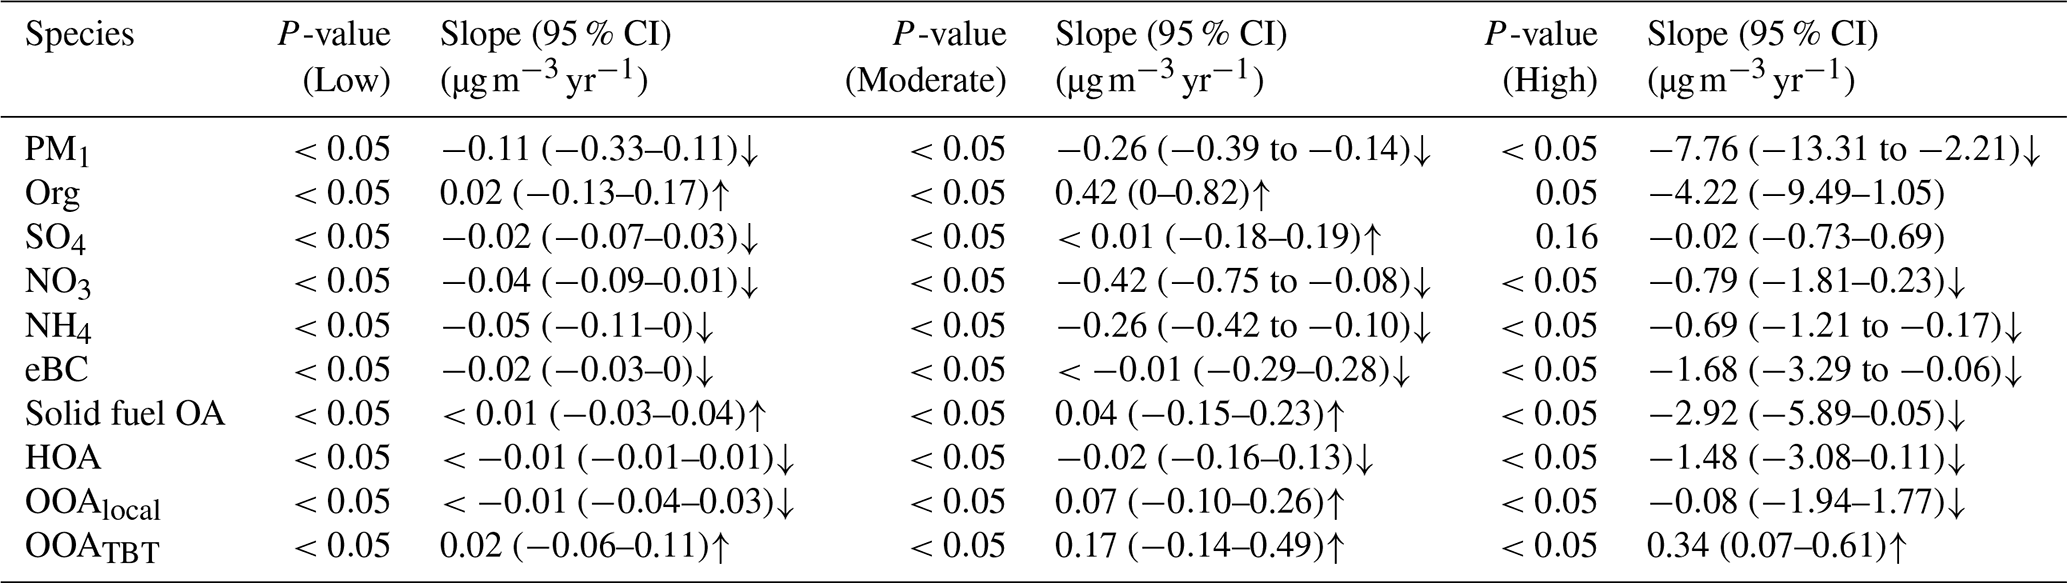
While OOAlocal also showed consistent decline, its decreasing rate was much smaller (−0.08 ) compared to that of primary species. Interestingly, although the concentration of O3 is typically much lower under high pollution conditions, it showed a clear increasing trend from 2016 to 2023, with an average rate at 0.80 (95 % CI: −0.80 to 2.49). This indicates that the slower decline in OOAlocal may be linked to enhanced secondary formation under increasing atmospheric oxidative capacity in urban Dublin, which could partially offset reductions driven by decreased heating emissions. In contrast, OOATBT was the only species to show a statistically significant upward trend, increasing from 0.64 µg m−3 in 2016–2017 to 2.7 µg m−3 in 2023 (increasing rate at +0.34 , 0.07 to 0.61). This increase may also be linked to enhanced oxidative processing in the upwind source regions and/or during transport from the UK and continental Europe, associated with rising regional O3 levels (Derwent et al., 2018; Adame et al., 2022). As a result, the declining trend of total OA under high pollution conditions was only marginally significant (p=0.05), despite its average concentration dropping from 54.8–64.7 µg m−3 in 2016–2018 to around 40 µg m−3 in 2022–2023. SO4 did not show any significant trend over the study period. Although its concentration once continuously decreased from 5.9 µg m−3 in 2016–2017 to only 3.3 µg m−3 in 2021, with a modest decreasing trend in SO2 (−0.44 , 95 % CI: −1.74 to 0.88), a marked rebound to higher than 5.0 µg m−3 was observed since 2022, possibly linked to shifts in fuel usage under the influences of the European energy crisis, such as potential increased use of lower-price fuels with higher sulfur contents (Fazelianov, 2023; Urbano et al., 2023). Such a shift may have occurred in some households despite the new solid fuel regulations and public awareness efforts, as economic pressures could still have influenced fuel choices. However, this interpretation needs to be further validated with direct fuel-use data in future studies. In contrast, NO3 and NH4 both exhibited clear and significant decreasing trends under high pollution conditions. Specifically, the concentration of NO3 and NH4 declined by 52 % (from 10.3 µg m−3 in 2016–2017 to only 4.9 µg m−3 in 2023) and 58 % (from 6.7 µg m−3 in 2016–2017 to 2.8 µg m−3 in 2023), with the average rate at −0.79 (−1.81 to 0.23) and −0.69 (−1.21 to −0.17), respectively. Consistently, NO2 also decreased from 66.3 to 48.7 µg m−3 in 2023 (−2.30 , −5.23 to 0.70). Taken together, these findings suggest that although mitigation measures have led to substantial reductions in primary emissions and major secondary inorganic components, OOA shows a more limited decline, and, in some cases, an increasing influence. This indicates its growing relative importance, potentially associated with increasing O3 levels thus enhanced atmospheric oxidative capacity. These results therefore underscore the urgent need for coordinated control strategies that consider both PM1 and O3 precursors to mitigate future air quality and health risks.
Interestingly, despite the overall encouraging decline in local emissions, several primary components showed a notable rebound in 2023 under high pollution conditions. For example, solid fuel OA increased from 14.8 µg m−3 in 2022 to 17.7 µg m−3 in 2023, OOAlocal and eBC rose by 44 % and 29 %, respectively. Among all POA factors, the most substantial rebound was observed for wood burning OA (Fig. S18 in the Supplement), which nearly tripled from 1.6 µg m−3 in 2022 to 4.6 µg m−3, followed by a moderate increase in coal (by 49 % compared with 2022), while peat and HOA remained almost unchanged. While year-to-year variability is expected, the fact that these increases were limited to local heating-related components suggests a possible resurgence in local emissions due to the persistent energy crisis. Notably, these increases occurred despite the introduction of the nationwide solid fuel regulations in late 2022, suggesting that the policy effects may not have yet materialized, given such a short time after the implementation, or that changes in fuel usage may have occurred. This underscores the continued need to strengthen efforts in reducing residential solid fuel use and highlights the importance of continuous long-term observations to better track the changes of air pollution and the major sources.
Under moderate pollution conditions, although total PM1 concentrations also showed an overall decreasing trend with a moderate reducing rate at −0.26 (95 % CI: −0.39 to −0.14, Table 2), comparatively larger variability was observed in trend direction of PM1 components. More specifically, unlike the more consistent declines observed under low and high pollution conditions, the trends of individual components under moderately polluted periods were mixed. While eBC and HOA showed weak decreasing trends ( for eBC and −0.02 for HOA respectively), solid fuel OA showed a slight increasing trend (+0.04 , −0.15 to 0.23). This contrast suggests potential minor reductions in traffic-related emissions, whereas domestic heating emissions likely remained relatively stable under moderate pollution conditions. OOAlocal also presented an increasing trend (+0.07 , −0.10 to 0.26), concurrent with rising O3 concentrations (1.13 , −4.34 to 6.60). OOATBT also rose steadily from 1.4 µg m−3 in 2016–2017 to 2.2 µg m−3 in 2023 (+0.17 , −0.14 to 0.49), leading to a significant increase in total OA from 8.7 to 11.4 µg m−3 (+0.42 , 0 to 0.82). Meanwhile, the most notable reductions were observed for NO3 (−0.42 , −0.75 to −0.08) and NH4 (−0.26 , −0.42 to −0.10), which primarily contributed to the overall decline in PM1 mass. The significant reductions in NO3 and NH4, despite the absence of clear downward trends in locally emitted particle components, further suggests that their decline is primarily driven by reduced nitrogen-containing precursor emissions at the regional scale. Consistently, as shown in Fig. S16c, NO2 showed a local decreasing tendency at a rate of −1.14 (−3.68 to 1.41, Table S6 in the Supplement). It is interesting to note that NO3 and NH4 decreased consistently across all pollution levels, accompanied by a concurrent decline in NO2, likely reflecting a combination of reduced local emissions and broader regional-scale reductions. In contrast, OOATBT exhibited overall increasing trends across all pollution levels, which may be linked to rising ozone levels on a regional scale (Adame et al., 2022; Nelson and Drysdale, 2025; Korhale et al., 2026).
Corresponding to the observed changes in concentration, the chemical composition of PM1 and OA also evolved over time across different pollution levels. Under low pollution conditions, due to the minimal changes in PM1 and OA components, the overall composition remained largely stable due to minimal changes in absolute concentrations. OA and SO4 consistently dominate PM1, with OOAlocal being the major contributor to total OA. Notable changes include a moderate increase in the OA fraction after 2016–2017 (from 33 % to 42 %–47 %) and a clear rise in the contribution of OOATBT, which grew from 21 %–26 % before 2018 to 29 %–38 % in later years. Under moderate pollution level, the relative contribution of NO3 and NH4 declined significantly over time, in line with their strong decreasing trends in mass concentrations. Specifically, the average NO3 and NH4 fractions dropped from 25 % and 14 % in 2016–2017 to 15 % and 8 % in 2023, respectively. In contrast, the fraction of OA increased from 36 % to 50 %, while other components (SO4, Cl and eBC) remained relatively constant. Among OA factors, the fraction of solid fuel OA slightly declined (from 34 %–38 % in 2016–2018 to 32 %–35 %), while OOATBT showed a clear increase (from 16 %–17 % in 2016–2018 to 22 %–28 % in later years), suggesting an increasingly important contribution of transboundary transport in OA. Meanwhile, contributions from HOA and OOAlocal remained overall unchanged over the study period.
Under high pollution conditions, local residential heating emissions remained the dominant contributors, with OA consistently contributing over 60 % of total PM1 and solid fuel OA alone accounting for 55 %–58 %. eBC also contributed substantially (12 %–18 %). The contribution of NO3and SO4 remained minor and relatively stable over the years, while SO4 showed a notable increase in 2022–2023 (from 4 %–5 % to 8 %–9 %), likely due to more frequent pollution events with elevated sulfate levels, potentially linked to changes in fuel use during the energy crisis (European Commission, 2024). Notably, both OOA factors showed consistent increase in their contributions over the years: OOAlocal rose from 15 % in 2016–2017 to 28 % in 2023, and OOATBT increased from 1 % to 7 %, highlighting the growing importance of OOA in PM composition. These trends further reflected a gradual enhancement of atmospheric oxidation capacity even under high pollution conditions, supported by the increasing average O3 levels (Fig. S16d and Table S6).
This study provides a comprehensive long-term, source-resolved characterization of PM1 pollution in Dublin, a temperate European urban environment and a sensitive receptor of regional pollution influences across Europe. In the context of the nationwide regulations and public awareness efforts targeting residential solid fuels in Ireland, these long-term observations offer new insights into how urban air pollution responds to changes in heating emissions and regional sources. The results illustrate that urban air pollution in Dublin is jointly shaped by local heating emissions and transboundary transport from continental Europe and the UK under easterly winds. These two dominant drivers lead to pronounced seasonal variations in both PM1 concentration and composition: PM1 peaks during cold months and is dominated by carbonaceous species and local OA, while springtime PM1 is strongly influenced by transboundary transport, leading to elevated SIA, particularly NO3, and OOATBT.
The findings demonstrate clear progress in reducing the severity and frequency of air pollution events in Dublin, potentially associated with recent mitigation efforts regarding residential heating emissions. Specifically, the annual PM1 decreased from 6.5 µg m−3 to below 5.0 µg m−3 over the study period, accompanied by a sharp reduction in peak pollution levels and a decrease in the number of polluted days from around 30 before 2018 to approximately 10 d in 2023. These improvements were driven by substantial reductions in both local primary emissions and major secondary inorganic components. In particular, heating-related primary pollutants such as solid fuel OA and eBC showed consistent reductions (−0.07 to −0.08 ), while strongest reductions were observed in NO3 and NH4 (−0.11 and −0.09 , respectively).
The chemical composition and trends of PM1 varied substantially across different pollution levels, reflecting shifts in dominant pollution sources. The largest PM1 decreases occurred during high pollution episodes (−7.8 ) that are typically associated with domestic heating emissions, accompanied by substantial reductions in primary pollutants (−1.48 to −2.92 ) linked to residential combustion. However, the results also show that this progress remains fragile. The rebound of local pollutants in 2023, including the marked increase in wood-burning OA, indicates that Dublin remains vulnerable to residential heating emissions, especially under changing fuel-use behaviour, energy-price pressure, and cold stagnant weather conditions. Therefore, continued enforcement of solid fuel regulations, public communication, and continuous air quality monitoring remain necessary, even after clear reductions in PM1 mass and extreme concentrations have been achieved.
The trends in secondary components reveal a further shift in the chemical drivers of PM1. NO3 and NH4 exhibited consistent declines across all pollution levels. In particular, under moderate pollution conditions, they were the main drivers of PM1 declines (−0.42 and −0.26 , respectively), despite limited reductions in local emissions. Taken together, the results point to a regional-scale drop in nitrogen-containing precursors and demonstrate the importance of regional precursor controls. In contrast, secondary organic aerosol showed a different response. OOAlocal only showed limited reductions (−0.08 ), while OOATBT even increased significantly (+0.34 ). These trends coincided with rising O3 levels in Dublin and across the broader region, suggesting potential enhancement in atmospheric oxidative capacity favouring OOA formation. These findings suggest that as primary emissions decline, secondary organic aerosols may play an increasingly important role in shaping future PM pollution. Thus, reductions in primary PM1 emissions alone may not be sufficient to suppress secondary aerosol pollution or achieve continued air quality improvements.
The results highlight both the progress and the remaining challenges in urban air quality management. Despite improvements over the study period, the persistence of wintertime home heating emissions and the increasing importance of secondary organic aerosols underscore the need for sustained emission controls. In particular, this study highlights the need for an integrated air quality strategy that addresses local residential heating emissions, regional precursors, and the coupling between PM1 and O3 pollution. More broadly, this study demonstrates the critical value of long-term, source-resolved measurements not only for evaluating past mitigation measures, but also for identifying emerging pollution regimes and supporting evidence-based air quality policy in Ireland and across Europe.
The NR-PM1 dataset measured by ACSM, the PMF-derived OA factors, and the eBC data retrieved from the Aethalometer used in this study are publicly available on Zenodo (https://doi.org/10.5281/zenodo.19610048, Lei et al., 2026). Meteorological data from Dublin Airport can be downloaded from https://www.met.ie/climate/available-data/historical-data (last access: 20 July 2026), and gaseous pollutant data are available through the EPA Ireland data portal at https://eparesearch.epa.ie/safer (last access: 20 July 2026).
The supplement related to this article is available online at https://doi.org/10.5194/acp-26-10927-2026-supplement.
LL and JO designed the experiments. LL, KNF and CL carried out the measurements. LL, WX, and CL performed the data analysis. KNF, JG and DC provided technical support. LL prepared the manuscript with contributions from all co-authors. CO and JO supervised this study.
At least one of the (co-)authors is a member of the editorial board of Atmospheric Chemistry and Physics. The peer-review process was guided by an independent editor, and the authors also have no other competing interests to declare.
Publisher's note: Copernicus Publications remains neutral with regard to jurisdictional claims made in the text, published maps, institutional affiliations, or any other geographical representation in this paper. The authors bear the ultimate responsibility for providing appropriate place names. Views expressed in the text are those of the authors and do not necessarily reflect the views of the publisher.
We are deeply grateful to Elaine Murphy and colleagues at the Science Centre Hub, University College Dublin, as well as to Matthew Saunders, Michelle Murray, and their colleagues at Trinity College Botanical Gardens for their support and assistance in hosting and maintaining the monitoring sites. The authors acknowledge the support of EPA Ireland and the Department of Climate, Energy and the Environment for the measurements reported in this study.
This research has been supported by the Research Ireland (grant no. 22/FFP-A/10611), the National Natural Science Foundation of China (grant no. 42577115), the European Commission, Directorate-General for Climate Action (grant no. 101081430 – PARIS), and the Natural Science Foundation of Fujian Province (grant no. 2025J01261).
This paper was edited by James Allan and reviewed by two anonymous referees.
Adame, J. A., Gutiérrez-Álvarez, I., Cristofanelli, P., Notario, A., Bogeat, J. A., López, A., Gómez, A., Bolívar, J. P., and Yela, M.: Surface ozone trends over a 21 year period at El Arenosillo observatory (Southwestern Europe), Atmos. Res., 269, 106048, https://doi.org/10.1016/j.atmosres.2022.106048, 2022.
Arfin, T., Pillai, A. M., Mathew, N., Tirpude, A., Bang, R., and Mondal, P.: An overview of atmospheric aerosol and their effects on human health, Environ. Sci. Pollut. R., 30, 125347–125369, https://doi.org/10.1007/s11356-023-29652-w, 2023.
Bates, J. T., Fang, T., Verma, V., Zeng, L., Weber, R. J., Tolbert, P. E., Abrams, J. Y., Sarnat, S. E., Klein, M., Mulholland, J. A., and Russell, A. G.: Review of Acellular Assays of Ambient Particulate Matter Oxidative Potential: Methods and Relationships with Composition, Sources, and Health Effects, Environ. Sci. Technol., 53, 4003–4019, https://doi.org/10.1021/acs.est.8b03430, 2019.
Bauer, M., Slowik, J. G., Via, M., Khare, P., Chazeau, B., Glojek, K., Manousakas, M., Decker, Z. C. J., Gregoric, A., Bijedic, A., Krecinic, E., Mocnik, G., Dzepina, K., and Prevot, A. S. H.: Assessing the severe urban pollution crisis in Sarajevo, Bosnia and Herzegovina: mobile measurements and source characterization, Environ. Int., 207, 110009, https://doi.org/10.1016/j.envint.2025.110009, 2026.
Byrne, R., Ryan, K., Venables, D. S., Wenger, J. C., and Hellebust, S.: Highly local sources and large spatial variations in PM2.5 across a city: evidence from a city-wide sensor network in Cork, Ireland, Environmental Science: Atmospheres, 3, 919–930, https://doi.org/10.1039/d2ea00177b, 2023.
Canagaratna, M. R., Jayne, J. T., Jimenez, J. L., Allan, J. D., Alfarra, M. R., Zhang, Q., Onasch, T. B., Drewnick, F., Coe, H., Middlebrook, A., Delia, A., Williams, L. R., Trimborn, A. M., Northway, M. J., DeCarlo, P. F., Kolb, C. E., Davidovits, P., and Worsnop, D. R.: Chemical and microphysical characterization of ambient aerosols with the aerodyne aerosol mass spectrometer, Mass Spectrom. Rev., 26, 185–222, https://doi.org/10.1002/mas.20115, 2007.
Canonaco, F., Tobler, A., Chen, G., Sosedova, Y., Slowik, J. G., Bozzetti, C., Daellenbach, K. R., El Haddad, I., Crippa, M., Huang, R.-J., Furger, M., Baltensperger, U., and Prévôt, A. S. H.: A new method for long-term source apportionment with time-dependent factor profiles and uncertainty assessment using SoFi Pro: application to 1 year of organic aerosol data, Atmos. Meas. Tech., 14, 923–943, https://doi.org/10.5194/amt-14-923-2021, 2021.
Casotto, R., Skiba, A., Rauber, M., Strahl, J., Tobler, A., Bhattu, D., Lamkaddam, H., Manousakas, M. I., Salazar, G., Cui, T., Canonaco, F., Samek, L., Rys, A., El Haddad, I., Kasper-Giebl, A., Baltensperger, U., Necki, J., Szidat, S., Styszko, K., Slowik, J. G., Prevot, A. S. H., and Daellenbach, K. R.: Organic aerosol sources in Krakow, Poland, before implementation of a solid fuel residential heating ban, Sci. Total Environ., 855, 158655, https://doi.org/10.1016/j.scitotenv.2022.158655, 2023.
Chebaicheb, H., de Brito, J. F., Amodeo, T., Couvidat, F., Petit, J.-E., Tison, E., Abbou, G., Baudic, A., Chatain, M., Chazeau, B., Marchand, N., Falhun, R., Francony, F., Ratier, C., Grenier, D., Vidaud, R., Zhang, S., Gille, G., Meunier, L., Marchand, C., Riffault, V., and Favez, O.: Multiyear high-temporal-resolution measurements of submicron aerosols at 13 French urban sites: data processing and chemical composition, Earth Syst. Sci. Data, 16, 5089–5109, https://doi.org/10.5194/essd-16-5089-2024, 2024.
Chen, G., Canonaco, F., Slowik, J. G., Daellenbach, K. R., Tobler, A., Petit, J. E., Favez, O., Stavroulas, I., Mihalopoulos, N., Gerasopoulos, E., El Haddad, I., Baltensperger, U., and Prevot, A. S. H.: Real-Time Source Apportionment of Organic Aerosols in Three European Cities, Environ. Sci. Technol., 56, 15290–15297, https://doi.org/10.1021/acs.est.2c02509, 2022a.
Chen, G., Canonaco, F., Tobler, A., Aas, W., Alastuey, A., Allan, J., Atabakhsh, S., Aurela, M., Baltensperger, U., Bougiatioti, A., De Brito, J. F., Ceburnis, D., Chazeau, B., Chebaicheb, H., Daellenbach, K. R., Ehn, M., El Haddad, I., Eleftheriadis, K., Favez, O., Flentje, H., Font, A., Fossum, K., Freney, E., Gini, M., Green, D. C., Heikkinen, L., Herrmann, H., Kalogridis, A.-C., Keernik, H., Lhotka, R., Lin, C., Lunder, C., Maasikmets, M., Manousakas, M. I., Marchand, N., Marin, C., Marmureanu, L., Mihalopoulos, N., Močnik, G., Nęcki, J., O'Dowd, C., Ovadnevaite, J., Peter, T., Petit, J.-E., Pikridas, M., Matthew Platt, S., Pokorná, P., Poulain, L., Priestman, M., Riffault, V., Rinaldi, M., Różański, K., Schwarz, J., Sciare, J., Simon, L., Skiba, A., Slowik, J. G., Sosedova, Y., Stavroulas, I., Styszko, K., Teinemaa, E., Timonen, H., Tremper, A., Vasilescu, J., Via, M., Vodička, P., Wiedensohler, A., Zografou, O., Cruz Minguillón, M., and Prévôt, A. S. H.: European aerosol phenomenology – 8: Harmonised source apportionment of organic aerosol using 22 Year-long ACSM/AMS datasets, Environ. Int., 166, 107325, https://doi.org/10.1016/j.envint.2022.107325, 2022b.
Coleman, L., Korhale, N., Martin, D., Chevassus, E., Zhen, L., Xu, W., and O'Dowd, C. D.: Understanding Ozone Levels in Ireland, Environmental Protection Agency (EPA), Ireland, EPA Research Report 497, ISBN 978-1-80009-317-1, 2025.
Crenn, V., Sciare, J., Croteau, P. L., Verlhac, S., Fröhlich, R., Belis, C. A., Aas, W., Äijälä, M., Alastuey, A., Artiñano, B., Baisnée, D., Bonnaire, N., Bressi, M., Canagaratna, M., Canonaco, F., Carbone, C., Cavalli, F., Coz, E., Cubison, M. J., Esser-Gietl, J. K., Green, D. C., Gros, V., Heikkinen, L., Herrmann, H., Lunder, C., Minguillón, M. C., Močnik, G., O'Dowd, C. D., Ovadnevaite, J., Petit, J.-E., Petralia, E., Poulain, L., Priestman, M., Riffault, V., Ripoll, A., Sarda-Estève, R., Slowik, J. G., Setyan, A., Wiedensohler, A., Baltensperger, U., Prévôt, A. S. H., Jayne, J. T., and Favez, O.: ACTRIS ACSM intercomparison – Part 1: Reproducibility of concentration and fragment results from 13 individual Quadrupole Aerosol Chemical Speciation Monitors (Q-ACSM) and consistency with co-located instruments, Atmos. Meas. Tech., 8, 5063–5087, https://doi.org/10.5194/amt-8-5063-2015, 2015.
Crilley, L. R., Bloss, W. J., Yin, J., Beddows, D. C. S., Harrison, R. M., Allan, J. D., Young, D. E., Flynn, M., Williams, P., Zotter, P., Prevot, A. S. H., Heal, M. R., Barlow, J. F., Halios, C. H., Lee, J. D., Szidat, S., and Mohr, C.: Sources and contributions of wood smoke during winter in London: assessing local and regional influences, Atmos. Chem. Phys., 15, 3149–3171, https://doi.org/10.5194/acp-15-3149-2015, 2015.
Crippa, M., DeCarlo, P. F., Slowik, J. G., Mohr, C., Heringa, M. F., Chirico, R., Poulain, L., Freutel, F., Sciare, J., Cozic, J., Di Marco, C. F., Elsasser, M., Nicolas, J. B., Marchand, N., Abidi, E., Wiedensohler, A., Drewnick, F., Schneider, J., Borrmann, S., Nemitz, E., Zimmermann, R., Jaffrezo, J.-L., Prévôt, A. S. H., and Baltensperger, U.: Wintertime aerosol chemical composition and source apportionment of the organic fraction in the metropolitan area of Paris, Atmos. Chem. Phys., 13, 961–981, https://doi.org/10.5194/acp-13-961-2013, 2013.
Cuesta-Mosquera, A., Močnik, G., Drinovec, L., Müller, T., Pfeifer, S., Minguillón, M. C., Briel, B., Buckley, P., Dudoitis, V., Fernández-García, J., Fernández-Amado, M., Ferreira De Brito, J., Riffault, V., Flentje, H., Heffernan, E., Kalivitis, N., Kalogridis, A.-C., Keernik, H., Marmureanu, L., Luoma, K., Marinoni, A., Pikridas, M., Schauer, G., Serfozo, N., Servomaa, H., Titos, G., Yus-Díez, J., Zioła, N., and Wiedensohler, A.: Intercomparison and characterization of 23 Aethalometers under laboratory and ambient air conditions: procedures and unit-to-unit variabilities, Atmos. Meas. Tech., 14, 3195–3216, https://doi.org/10.5194/amt-14-3195-2021, 2021.
Daellenbach, K. R., Uzu, G., Jiang, J., Cassagnes, L.-E., Leni, Z., Vlachou, A., Stefenelli, G., Canonaco, F., Weber, S., Segers, A., Kuenen, J. J. P., Schaap, M., Favez, O., Albinet, A., Aksoyoglu, S., Dommen, J., Baltensperger, U., Geiser, M., El Haddad, I., Jaffrezo, J.-L., and Prévôt, A. S. H.: Sources of particulate-matter air pollution and its oxidative potential in Europe, Nature, 587, 414–419, https://doi.org/10.1038/s41586-020-2902-8, 2020.
DeCarlo, P. F., Kimmel, J. R., Trimborn, A., Northway, M. J., Jayne, J. T., Aiken, A. C., Gonin, M., Fuhrer, K., Horvath, T., Docherty, K. S., Worsnop, D. R., and Jimenez, J. L.: Field-deployable, high-resolution, Time-of-Flight Aerosol Mass Spectrometer, Anal. Chem., 78, 8281–8289, https://doi.org/10.1021/ac061249n, 2006.
DeCarlo, P. F., Ulbrich, I. M., Crounse, J., de Foy, B., Dunlea, E. J., Aiken, A. C., Knapp, D., Weinheimer, A. J., Campos, T., Wennberg, P. O., and Jimenez, J. L.: Investigation of the sources and processing of organic aerosol over the Central Mexican Plateau from aircraft measurements during MILAGRO, Atmos. Chem. Phys., 10, 5257–5280, https://doi.org/10.5194/acp-10-5257-2010, 2010.
Denier van der Gon, H. A. C., Bergström, R., Fountoukis, C., Johansson, C., Pandis, S. N., Simpson, D., and Visschedijk, A. J. H.: Particulate emissions from residential wood combustion in Europe – revised estimates and an evaluation, Atmos. Chem. Phys., 15, 6503–6519, https://doi.org/10.5194/acp-15-6503-2015, 2015.
Department of Climate Energy and the Environment: Minister Ryan announces public awareness campaign to reduce air pollution from domestic solid fuel fires this winter, https://www.gov.ie/en/department-of-climate-energy-and-the-environment/press-releases/minister-ryan-announces-public-awareness-campaign-to-reduce-air-pollution-from-domestic-solid-fuel-fires-this-winter/ (last access: 11 July 2026), 2021.
Derwent, R. G., Manning, A. J., Simmonds, P. G., Spain, T. G., and O'Doherty, S.: Long-term trends in ozone in baseline and European regionally-polluted air at Mace Head, Ireland over a 30 year period, Atmos. Environ., 179, 279–287, https://doi.org/10.1016/j.atmosenv.2018.02.024, 2018.
Environmental Protection Agency Ireland: Solid Fuel Regulations, https://www.epa.ie/our-services/licensing/air/solid-fuel-regulations/ (last access: 12 July 2026), 2025a.
Environmental Protection Agency Ireland: Air Reports, https://www.epa.ie/publications/research/air/ (last access: 30 June 2026), 2025b.
European Commission: EU action to address the energy crisis, https://commission.europa.eu/topics/energy/eu-action-address-energy-crisis_en (last access: 30 June 2026), 2024.
European Environment Agency: Air quality improving, but just over 180 000 deaths still attributable to air pollution in EU, https://www.eea.europa.eu/en/newsroom/news/air-quality-improving-but-just-over-180-000-deaths-still-attributable-to-air-pollution-in-eu (last access: 30 March 2026), 2025.
Fazelianov, E. M.: The Energy Crisis in Europe and Russian Gas Supplies, Her. Russ. Acad. Sci.+, 92, S902–S907, https://doi.org/10.1134/s1019331622150035, 2023.
Finch, D. P. and Palmer, P. I.: Increasing ambient surface ozone levels over the UK accompanied by fewer extreme events, Atmos. Environ., 237, 117627, https://doi.org/10.1016/j.atmosenv.2020.117627, 2020.
Fossum, K. N., Lin, C., O'Sullivan, N., Lei, L., Hellebust, S., Ceburnis, D., Afzal, A., Tremper, A., Green, D., Jain, S., Byčenkienė, S., O'Dowd, C., Wenger, J., and Ovadnevaite, J.: Two distinct ship emission profiles for organic-sulfate source apportionment of PM in sulfur emission control areas, Atmos. Chem. Phys., 24, 10815–10831, https://doi.org/10.5194/acp-24-10815-2024, 2024.
Freney, E., Zhang, Y., Croteau, P., Amodeo, T., Williams, L., Truong, F., Petit, J.-E., Sciare, J., Sarda-Esteve, R., Bonnaire, N., Arumae, T., Aurela, M., Bougiatioti, A., Mihalopoulos, N., Coz, E., Artinano, B., Crenn, V., Elste, T., Heikkinen, L., Poulain, L., Wiedensohler, A., Herrmann, H., Priestman, M., Alastuey, A., Stavroulas, I., Tobler, A., Vasilescu, J., Zanca, N., Canagaratna, M., Carbone, C., Flentje, H., Green, D., Maasikmets, M., Marmureanu, L., Minguillon, M. C., Prevot, A. S. H., Gros, V., Jayne, J., and Favez, O.: The second ACTRIS inter-comparison (2016) for Aerosol Chemical Speciation Monitors (ACSM): Calibration protocols and instrument performance evaluations, Aerosol Sci. Tech., 53, 830–842, https://doi.org/10.1080/02786826.2019.1608901, 2019.
Fröhlich, R., Cubison, M. J., Slowik, J. G., Bukowiecki, N., Prévôt, A. S. H., Baltensperger, U., Schneider, J., Kimmel, J. R., Gonin, M., Rohner, U., Worsnop, D. R., and Jayne, J. T.: The ToF-ACSM: a portable aerosol chemical speciation monitor with TOFMS detection, Atmos. Meas. Tech., 6, 3225–3241, https://doi.org/10.5194/amt-6-3225-2013, 2013.
Goodman, P. G., Rich, D. Q., Zeka, A., Clancy, L., and Dockery, D. W.: Effect of Air Pollution Controls on Black Smoke and Sulfur Dioxide Concentrations across Ireland, J. Air Waste Manage., 59, 207–213, https://doi.org/10.3155/1047-3289.59.2.207, 2009.
Huang, X., Ding, A., Gao, J., Zheng, B., Zhou, D., Qi, X., Tang, R., Wang, J., Ren, C., Nie, W., Chi, X., Xu, Z., Chen, L., Li, Y., Che, F., Pang, N., Wang, H., Tong, D., Qin, W., Cheng, W., Liu, W., Fu, Q., Liu, B., Chai, F., Davis, S. J., Zhang, Q., and He, K.: Enhanced secondary pollution offset reduction of primary emissions during COVID-19 lockdown in China, Natl. Sci. Rev., 8, nwaa137, https://doi.org/10.1093/nsr/nwaa137, 2021.
Jaiswal, R. K., Lohani, A. K., and Tiwari, H. L.: Statistical Analysis for Change Detection and Trend Assessment in Climatological Parameters, Environ. Process., 2, 729–749, https://doi.org/10.1007/s40710-015-0105-3, 2015.
Jimenez, J. L., Jayne, J. T., Shi, Q., Kolb, C. E., Worsnop, D. R., Yourshaw, I., Seinfeld, J. H., Flagan, R. C., Zhang, X., Smith, K. A., Morris, J. W., and Davidovits, P.: Ambient aerosol sampling using the Aerodyne Aerosol Mass Spectrometer, J. Geophys. Res., 108, 8425, https://doi.org/10.1029/2001jd001213, 2003.
Jimenez, J. L., Canagaratna, M. R., Donahue, N. M., Prevot, A. S. H., Zhang, Q., Kroll, J. H., DeCarlo, P. F., Allan, J. D., Coe, H., Ng, N. L., Aiken, A. C., Docherty, K. S., Ulbrich, I. M., Grieshop, A. P., Robinson, A. L., Duplissy, J., Smith, J. D., Wilson, K. R., Lanz, V. A., Hueglin, C., Sun, Y. L., Tian, J., Laaksonen, A., Raatikainen, T., Rautiainen, J., Vaattovaara, P., Ehn, M., Kulmala, M., Tomlinson, J. M., Collins, D. R., Cubison, M. J., Dunlea, J., Huffman, J. A., Onasch, T. B., Alfarra, M. R., Williams, P. I., Bower, K., Kondo, Y., Schneider, J., Drewnick, F., Borrmann, S., Weimer, S., Demerjian, K., Salcedo, D., Cottrell, L., Griffin, R., Takami, A., Miyoshi, T., Hatakeyama, S., Shimono, A., Sun, J. Y., Zhang, Y. M., Dzepina, K., Kimmel, J. R., Sueper, D., Jayne, J. T., Herndon, S. C., Trimborn, A. M., Williams, L. R., Wood, E. C., Middlebrook, A. M., Kolb, C. E., Baltensperger, U., and Worsnop, D. R.: Evolution of organic aerosols in the atmosphere, Science, 326, 1525–1529, https://doi.org/10.1126/science.1180353, 2009.
Kampa, M. and Castanas, E.: Human health effects of air pollution, Environ. Pollut., 151, 362–367, https://doi.org/10.1016/j.envpol.2007.06.012, 2008.
Kim, N.-K., Kim, Y.-P., Shin, H.-J., and Lee, J.-Y.: Long-Term Trend of the Levels of Ambient Air Pollutants of a Megacity and a Background Area in Korea, Appl. Sci.-Basel, 12, 4039, https://doi.org/10.3390/app12084039, 2022.
Korhale, N., Ansari, T., Butler, T., Ovadnevaite, J., Chevassus, E., Ceburnis, D., Martin, D., O'Dowd, C. D., and Coleman, L.: Surface ozone distribution and trends over Ireland: insights from long-term measurement record and source attribution modelling, Atmos. Chem. Phys., 26, 6557–6577, https://doi.org/10.5194/acp-26-6557-2026, 2026.
Lanz, V. A., Prévôt, A. S. H., Alfarra, M. R., Weimer, S., Mohr, C., DeCarlo, P. F., Gianini, M. F. D., Hueglin, C., Schneider, J., Favez, O., D'Anna, B., George, C., and Baltensperger, U.: Characterization of aerosol chemical composition with aerosol mass spectrometry in Central Europe: an overview, Atmos. Chem. Phys., 10, 10453–10471, https://doi.org/10.5194/acp-10-10453-2010, 2010.
Lee, J. D., Drysdale, W. S., Finch, D. P., Wilde, S. E., and Palmer, P. I.: UK surface NO2 levels dropped by 42 % during the COVID-19 lockdown: impact on surface O3, Atmos. Chem. Phys., 20, 15743–15759, https://doi.org/10.5194/acp-20-15743-2020, 2020.
Lei, L., Zhou, W., Chen, C., He, Y., Li, Z., Sun, J., Tang, X., Fu, P., Wang, Z., and Sun, Y.: Long-term characterization of aerosol chemistry in cold season from 2013 to 2020 in Beijing, China, Environ. Pollut., 268, 115952, https://doi.org/10.1016/j.envpol.2020.115952, 2020.
Lei, L., Xu, W., Lin, C., Chen, B., Fossum, K. N., Ceburnis, D., O'Dowd, C., and Ovadnevaite, J.: Enhancing Differentiation of Oxygenated Organic Aerosol: A Machine Learning Approach to Distinguish Local and Transboundary Pollution, ACS ES&T Air, 2, 891–902, https://doi.org/10.1021/acsestair.4c00331, 2025.
Lei, L., Xu, W., Lin, C., Fossum, K. N., Ceburnis, D., Gallagher, J., O'Dowd, C., and Ovadnevaite, J.: Evolving Sources and Composition of Urban Submicron Aerosols in Dublin: Impacts of Emission Reductions and Transboundary Transport, Zenodo [data set], https://doi.org/10.5281/zenodo.19610048, 2026.
Lelieveld, J., Evans, J. S., Fnais, M., Giannadaki, D., and Pozzer, A.: The contribution of outdoor air pollution sources to premature mortality on a global scale, Nature, 525, 367–371, https://doi.org/10.1038/nature15371, 2015.
Li, K., Jacob, D. J., Liao, H., Zhu, J., Shah, V., Shen, L., Bates, K. H., Zhang, Q., and Zhai, S.: A two-pollutant strategy for improving ozone and particulate air quality in China, Nat. Geosci., 12, 906–910, https://doi.org/10.1038/s41561-019-0464-x, 2019.
Li, R., Jiang, N., Liu, Q., Huang, J., Guo, X., Liu, F., and Gao, Z.: Impact of Air Pollutants on Outpatient Visits for Acute Respiratory Outcomes, Int. J. Env. Res. Pub. He., 14, 47, https://doi.org/10.3390/ijerph14010047, 2017.
Lin, C., Ceburnis, D., Hellebust, S., Buckley, P., Wenger, J., Canonaco, F., Prevot, A. S. H., Huang, R. J., O'Dowd, C., and Ovadnevaite, J.: Characterization of Primary Organic Aerosol from Domestic Wood, Peat, and Coal Burning in Ireland, Environ. Sci. Technol., 51, 10624–10632, https://doi.org/10.1021/acs.est.7b01926, 2017.
Lin, C., Huang, R.-J., Ceburnis, D., Buckley, P., Preissler, J., Wenger, J., Rinaldi, M., Facchini, M. C., O'Dowd, C., and Ovadnevaite, J.: Extreme air pollution from residential solid fuel burning, Nature Sustainability, 1, 512–517, https://doi.org/10.1038/s41893-018-0125-x, 2018.
Lin, C., Ceburnis, D., Huang, R.-J., Canonaco, F., Prévôt, A. S. H., O'Dowd, C., and Ovadnevaite, J.: Summertime Aerosol over the West of Ireland Dominated by Secondary Aerosol during Long-Range Transport, Atmosphere-Basel, 10, 59, https://doi.org/10.3390/atmos10020059, 2019a.
Lin, C., Ceburnis, D., Huang, R.-J., Xu, W., Spohn, T., Martin, D., Buckley, P., Wenger, J., Hellebust, S., Rinaldi, M., Facchini, M. C., O'Dowd, C., and Ovadnevaite, J.: Wintertime aerosol dominated by solid-fuel-burning emissions across Ireland: insight into the spatial and chemical variation in submicron aerosol, Atmos. Chem. Phys., 19, 14091–14106, https://doi.org/10.5194/acp-19-14091-2019, 2019b.
Lin, C., Ceburnis, D., Xu, W., Heffernan, E., Hellebust, S., Gallagher, J., Huang, R.-J., O'Dowd, C., and Ovadnevaite, J.: The impact of traffic on air quality in Ireland: insights from the simultaneous kerbside and suburban monitoring of submicron aerosols, Atmos. Chem. Phys., 20, 10513–10529, https://doi.org/10.5194/acp-20-10513-2020, 2020.
Lin, C., Ceburnis, D., Trubetskaya, A., Xu, W., Smith, W., Hellebust, S., Wenger, J., O'Dowd, C., and Ovadnevaite, J.: On the use of reference mass spectra for reducing uncertainty in source apportionment of solid-fuel burning in ambient organic aerosol, Atmos. Meas. Tech., 14, 6905–6916, https://doi.org/10.5194/amt-14-6905-2021, 2021.
Lin, C., Ceburnis, D., O'Dowd, C., and Ovadnevaite, J.: Seasonality of Aerosol Sources Calls for Distinct Air Quality Mitigation Strategies, Toxics, 10, 121, https://doi.org/10.3390/toxics10030121, 2022.
Lin, C., Ceburnis, D., Vaishya, A., Trubetskaya, A., Tan, Y., Wang, T., Smith, W., Johnson, R., Xu, W., Monaghan, R. F. D., O'Dowd, C., and Ovadnevaite, J.: Air quality – climate forcing double whammy from domestic firelighters, npj Climate and Atmospheric Science, 6, 101, https://doi.org/10.1038/s41612-023-00427-x, 2023.
Lin, C., Ceburnis, D., Trubetskaya, A., Lei, L., Wang, S., Liu, Y., Yuan, W., Cui, H., Smith, W., Johnson, R., Fossum, K. N., Lebedev, V., Carré, V., Monaghan, R. F. D., Worsnop, D., Morawska, L., Wang, T., Huang, R.-J., O'Dowd, C., and Ovadnevaite, J.: Low-smoke fuels for residential heating linked to an increase in ultrafine particle emissions, Nat. Geosci., 19, 447–454, https://doi.org/10.1038/s41561-026-01942-1, 2026.
Macdonald, E., Otero, N., and Butler, T.: A comparison of long-term trends in observations and emission inventories of NOx, Atmos. Chem. Phys., 21, 4007–4023, https://doi.org/10.5194/acp-21-4007-2021, 2021.
Manisalidis, I., Stavropoulou, E., Stavropoulos, A., and Bezirtzoglou, E.: Environmental and Health Impacts of Air Pollution: A Review, Front. Public Health, 8, 14, https://doi.org/10.3389/fpubh.2020.00014, 2020.
Middlebrook, A. M., Bahreini, R., Jimenez, J. L., and Canagaratna, M. R.: Evaluation of composition-dependent collection efficiencies for the Aerodyne aerosol mass spectrometer using field data, Aerosol Sci. Tech., 46, 258–271, https://doi.org/10.1080/02786826.2011.620041, 2012.
Nassau, R. and Jaeglé, L.: Understanding the Recent Stagnation in PM2.5 Concentrations Across the United States: A Seasonal Composition Perspective, J. Geophys. Res.-Atmos., 130, e2024JD042401, https://doi.org/10.1029/2024jd042401, 2025.
Nelson, B. S. and Drysdale, W. S.: Urban ozone trends in Europe and the USA (2000–2021), Atmos. Chem. Phys., 25, 16009–16026, https://doi.org/10.5194/acp-25-16009-2025, 2025.
Ng, N. L., Canagaratna, M. R., Zhang, Q., Jimenez, J. L., Tian, J., Ulbrich, I. M., Kroll, J. H., Docherty, K. S., Chhabra, P. S., Bahreini, R., Murphy, S. M., Seinfeld, J. H., Hildebrandt, L., Donahue, N. M., DeCarlo, P. F., Lanz, V. A., Prévôt, A. S. H., Dinar, E., Rudich, Y., and Worsnop, D. R.: Organic aerosol components observed in Northern Hemispheric datasets from Aerosol Mass Spectrometry, Atmos. Chem. Phys., 10, 4625–4641, https://doi.org/10.5194/acp-10-4625-2010, 2010.
Ng, N. L., Herndon, S. C., Trimborn, A., Canagaratna, M. R., Croteau, P. L., Onasch, T. B., Sueper, D., Worsnop, D. R., Zhang, Q., Sun, Y. L., and Jayne, J. T.: An aerosol chemical speciation monitor (ACSM) for routine monitoring of the composition and mass concentrations of ambient aerosol, Aerosol Sci. Tech., 45, 780–794, https://doi.org/10.1080/02786826.2011.560211, 2011.
Ovadnevaite, J., Ceburnis, D., Leinert, S., Dall'Osto, M., Canagaratna, M., O'Doherty, S., Berresheim, H., and O'Dowd, C.: Submicron NE Atlantic marine aerosol chemical composition and abundance: Seasonal trends and air mass categorization, J. Geophys. Res.-Atmos., 119, 11850–11863, https://doi.org/10.1002/2013JD021330, 2014.
Ovadnevaite, J., Lin, C., Rinaldi, M., Ceburnis, D., Buckley, P., Coleman, L., Facchini, M. C., Wenger, J., and O'Dowd, C.: Air pollution sources in Ireland, Environmental Protection Agency (EPA), Ireland, EPA Research Report 385, ISBN 978-1-80009-007-1, 2021.
Parworth, C., Fast, J., Mei, F., Shippert, T., Sivaraman, C., Tilp, A., Watson, T., and Zhang, Q.: Long-term measurements of submicrometer aerosol chemistry at the Southern Great Plains (SGP) using an Aerosol Chemical Speciation Monitor (ACSM), Atmos. Environ., 106, 43–55, https://doi.org/10.1016/j.atmosenv.2015.01.060, 2015.
Perillo, H. A., Broderick, B. M., Gill, L. W., McNabola, A., Kumar, P., and Gallagher, J.: Spatiotemporal representativeness of air pollution monitoring in Dublin, Ireland, Sci. Total Environ., 827, 154299, https://doi.org/10.1016/j.scitotenv.2022.154299, 2022.
Pope, C. A. and Dockery, D. W.: Health effects of fine particulate air pollution: lines that connect, J. Air Waste Manage., 56, 709–742, https://doi.org/10.1080/10473289.2006.10464485, 2012.
Rinaldi, M., Manarini, F., Lucertini, M., Rapuano, M., Decesari, S., Paglione, M., Facchini, M. C., Lin, C., Ceburnis, D., O'Dowd, C. D., Buckley, P., Hellebust, S., Wenger, J., and Ovadnevaite, J.: Important Contribution to Aerosol Oxidative Potential from Residential Solid Fuel Burning in Central Ireland, Atmosphere-Basel, 15, 436, https://doi.org/10.3390/atmos15040436, 2024.
Salvador, C. M. G., Alindajao, A. D., Burdeos, K. B., Lavapiez, M. A. M., Yee, J. R., Bautista VII, A. T., Pabroa, P. C. B., and Capangpangan, R. Y.: Assessment of Impact of Meteorology and Precursor in Long-term Trends of PM and Ozone in a Tropical City, Aerosol Air Qual. Res., 22, 210269, https://doi.org/10.4209/aaqr.210269, 2022.
Seo, J., Park, D.-S. R., Kim, J. Y., Youn, D., Lim, Y. B., and Kim, Y.: Effects of meteorology and emissions on urban air quality: a quantitative statistical approach to long-term records (1999–2016) in Seoul, South Korea, Atmos. Chem. Phys., 18, 16121–16137, https://doi.org/10.5194/acp-18-16121-2018, 2018.
Shi, Z., Song, C., Liu, B., Lu, G., Xu, J., Van Vu, T., Elliott, R. J. R., Li, W., Bloss, W. J., and Harrison, R. M.: Abrupt but smaller than expected changes in surface air quality attributable to COVID-19 lockdowns, Sci. Adv., 7, eabd6696, https://doi.org/10.1126/sciadv.abd6696, 2021.
Shiraiwa, M., Ueda, K., Pozzer, A., Lammel, G., Kampf, C. J., Fushimi, A., Enami, S., Arangio, A. M., Frohlich-Nowoisky, J., Fujitani, Y., Furuyama, A., Lakey, P. S. J., Lelieveld, J., Lucas, K., Morino, Y., Poschl, U., Takahama, S., Takami, A., Tong, H., Weber, B., Yoshino, A., and Sato, K.: Aerosol health effects from molecular to global scales, Environ. Sci. Technol., 51, 13545–13567, https://doi.org/10.1021/acs.est.7b04417, 2017.
Sicard, P., De Marco, A., Agathokleous, E., Feng, Z., Xu, X., Paoletti, E., Rodriguez, J. J. D., and Calatayud, V.: Amplified ozone pollution in cities during the COVID-19 lockdown, Sci. Total Environ., 735, 139542, https://doi.org/10.1016/j.scitotenv.2020.139542, 2020.
Sicard, P., Agathokleous, E., Anenberg, S. C., De Marco, A., Paoletti, E., and Calatayud, V.: Trends in urban air pollution over the last two decades: A global perspective, Sci. Total Environ., 858, 160064, https://doi.org/10.1016/j.scitotenv.2022.160064, 2023.
Sun, Y., Wang, Z., Dong, H., Yang, T., Li, J., Pan, X., Chen, P., and Jayne, J. T.: Characterization of summer organic and inorganic aerosols in Beijing, China with an Aerosol Chemical Speciation Monitor, Atmos. Environ., 51, 250–259, https://doi.org/10.1016/j.atmosenv.2012.01.013, 2012.
Sun, Y., Lei, L., Zhou, W., Chen, C., He, Y., Sun, J., Li, Z., Xu, W., Wang, Q., Ji, D., Fu, P., Wang, Z., and Worsnop, D. R.: A chemical cocktail during the COVID-19 outbreak in Beijing, China: Insights from six-year aerosol particle composition measurements during the Chinese New Year holiday, Sci. Total Environ., 742, 140739, https://doi.org/10.1016/j.scitotenv.2020.140739, 2020.
Szidat, S., Prévôt, A. S. H., Sandradewi, J., Alfarra, M. R., Synal, H. A., Wacker, L., and Baltensperger, U.: Dominant impact of residential wood burning on particulate matter in Alpine valleys during winter, Geophys. Res. Lett., 34, L05820, https://doi.org/10.1029/2006gl028325, 2007.
Tichý, O., Eckhardt, S., Balkanski, Y., Hauglustaine, D., and Evangeliou, N.: Decreasing trends of ammonia emissions over Europe seen from remote sensing and inverse modelling, Atmos. Chem. Phys., 23, 15235–15252, https://doi.org/10.5194/acp-23-15235-2023, 2023.
Tobler, A. K., Skiba, A., Canonaco, F., Močnik, G., Rai, P., Chen, G., Bartyzel, J., Zimnoch, M., Styszko, K., Nęcki, J., Furger, M., Różański, K., Baltensperger, U., Slowik, J. G., and Prevot, A. S. H.: Characterization of non-refractory (NR) PM1 and source apportionment of organic aerosol in Kraków, Poland, Atmos. Chem. Phys., 21, 14893–14906, https://doi.org/10.5194/acp-21-14893-2021, 2021.
Tsimpidi, A. P., Scholz, S. M. C., Milousis, A., Mihalopoulos, N., and Karydis, V. A.: Aerosol composition trends during 2000–2020: in-depth insights from model predictions and multiple worldwide near-surface observation datasets, Atmos. Chem. Phys., 25, 10183–10213, https://doi.org/10.5194/acp-25-10183-2025, 2025.
Ulbrich, I. M., Canagaratna, M. R., Zhang, Q., Worsnop, D. R., and Jimenez, J. L.: Interpretation of organic components from Positive Matrix Factorization of aerosol mass spectrometric data, Atmos. Chem. Phys., 9, 2891–2918, https://doi.org/10.5194/acp-9-2891-2009, 2009.
Urbano, E. M., Kampouropoulos, K., and Romeral, L.: Energy Crisis in Europe: The European Union's Objectives and Countries' Policy Trends – New Transition Paths?, Energies, 16, 5957, https://doi.org/10.3390/en16165957, 2023.
Wenger, J., Arndt, J., Buckley, P., Hellebust, S., McGillicuddy, E., O'Connor, I., Sodeau, J., and Wilson, E.: Source Apportionment of Particulate Matter in Urban and Rural Residential Areas of Ireland, EPA Ireland, EPA Research Report 318, ISBN 978-1-84095-905-5, 2020.
Wilson, W. E. and Suh, H. H.: Fine particles and coarse particles: concentration relationships relevant to epidemiologic studies, J. Air Waste Manage., 47, 1238–1249, https://doi.org/10.1080/10473289.1997.10464074, 1997.
Yan, Y., Lin, J., and He, C.: Ozone trends over the United States at different times of day, Atmos. Chem. Phys., 18, 1185–1202, https://doi.org/10.5194/acp-18-1185-2018, 2018.
Zhang, L., Yang, Y., Li, Y., Qian, Z. M., Xiao, W., Wang, X., Rolling, C. A., Liu, E., Xiao, J., Zeng, W., Liu, T., Li, X., Yao, Z., Wang, H., Ma, W., and Lin, H.: Short-term and long-term effects of PM(2.5) on acute nasopharyngitis in 10 communities of Guangdong, China, Sci. Total Environ., 688, 136–142, https://doi.org/10.1016/j.scitotenv.2019.05.470, 2019.
Zhang, Q., Alfarra, M. R., Worsnop, D. R., Allan, J. D., Coe, H., Canagaratna, M. R., and Jimenez, J. L.: Deconvolution and Quantification of Hydrocarbon-like and Oxygenated Organic Aerosols Based on Aerosol Mass Spectrometry, Environ. Sci. Technol., 39, 4938–4952, https://doi.org/10.1021/es048568l, 2005.