
the Creative Commons Attribution 4.0 License.
the Creative Commons Attribution 4.0 License.
 | 05 Aug 2026
Diurnal sea breeze worsens coastal air quality and complicates monitoring of remote North Atlantic air
Thomas G. Bell
Ian Brooks
Frances Hopkins
Jani Pewter
Katie Read
Timothy J. Smyth
In coastal environments, land and sea absorb and release heat at different rates due to their differing thermal properties. The resultant regular fluctuation in winds from onshore during the day to offshore at night, termed the diurnal sea breeze effect, can have a strong but uncertain impact on coastal air quality. In this study, from 10 years of observations from the Penlee Point Atmospheric Observatory on the northeast Atlantic coast, we identified 428 diurnal sea breeze events. Such events were most prevalent in spring and summer, when sea temperature is cooler than air temperature over land, wind speeds are relatively low, and the solar irradiance is strong. Observed surface concentrations of trace gases (O3, NOx, CH4, CO2, SO2) as well as aerosols (total aerosol number, PM2.5, PM10) were all elevated in the daytime during sea breeze events, increasing air quality regulation exceedance especially for O3. Sea breeze generally coincided with the highest Ox (O3 + NO2) levels in this environment (mean daytime mixing ratio of ∼ 45 ppb), likely due to poor pollutant dispersion at night, rapid photochemistry, and inflow of O3-rich air during the day from the sea. Sea breeze also appears to cause an accumulation of ship-emitted SO2, which likely contributes to new particle formation and a pronounced diurnal cycle in aerosol number concentration in this environment. Finally, the occurrence of diurnal sea breeze confounds the representativeness of coastal observations for remote North Atlantic atmosphere – excluding sea breeze events reduces the diurnal amplitudes in O3 and CH4 and also modifies their seasonal variations during southwesterly wind conditions.
- Article
(12465 KB) - Full-text XML
- BibTeX
- EndNote


Diurnal sea breeze (DSB) is a well-known circulation pattern that occurs near the coast due to land heating up faster than the sea during the day and cooling off faster at night. Solar heating causes updraft of air over land, which causes a pressure gradient that under certain conditions can pull in cooler air from the sea at the surface. At night, longwave cooling can cause subsidence of air over land which then flows out to the sea, reversing the circulation.
DSB events can significantly affect air quality and atmospheric chemistry in a multitude of ways, depending on the environment. For example, emissions of primary pollutants (e.g. nitrogen oxides NOx = NO + NO2) tend to be higher in coastal cities than over the sea. Thus, daytime inflow of marine air could dilute pollutants near the coast but worsen air quality over rural areas further inland (e.g. Meng et al., 2024). At night, the formation of a shallow internal boundary layer during DSB events limits vertical dispersion, often resulting in accumulation of surface emitted pollutants (Miller et al., 2003). For regions with nearby heavy shipping emissions, recirculation and poor dispersion may further lead to increased pollution in marine air (e.g. Ma et al., 2022).
The impact of DSB is different for ozone (O3), a secondary pollutant, greenhouse gas, and strong oxidant that can cause respiratory illnesses (e.g. Geddes et al., 2021; Loughner et al., 2014). Surface O3 is produced photochemically from NOx and VOCs, and is usually deposited much faster over land than over the sea (Monks et al., 2015). Lower primary emissions over the sea also mean less O3 titration due to nitrogen oxide. Thus, marine air can often be more enriched in O3 compared to terrestrial air. In some coastal environments, the highest O3 concentrations are observed on days with DSB events (e.g. Martins et al., 2012).
At the sea breeze front, pollutant concentrations can change rapidly with time and space, such that an operational forecast model generally struggles to simulate DSB events well (e.g. Martins et al., 2012; Wang et al., 2023; Brown et al., 2026). The timing of DSB events has an especially pronounced effect on O3, as a later onset of sea breeze can allow for greater photochemical build-up of O3 over the sea during the day (Oh et al., 2006; Martins et al., 2012). The spatial extent of DSB also varies, but penetration of tens of km inland is possible (e.g. Miller et al., 2003), meaning that its impact is not just limited to the near shore.
Since approximately 10 % of the global population resides within 5 km of the coast (Cosby et al., 2024), it is important to fully understand the impact of DSB on air quality. Previous studies using high resolution chemical transport modelling tended to be based on fairly short periods, thus not capturing variability caused by seasonal variation. Studies on long-term variability in sea breeze events have focused on the meteorological aspect (e.g. Reddy et al., 2021; KiranKumar et al., 2019; Junnaedhi et al., 2023), rather than on how these events influence air pollution. In this study, we systematically analyze 10 years of observations from the Penlee Point Atmospheric Observatory on the Northeast Atlantic coast for DSB events. We evaluate atmosphere-ocean conditions that favour their occurrence (Sect. 3), and then examine how sea breeze affects coastal air quality (Sect. 4.1, 4.2) as well as monitoring of remote marine air (Sect. 4.3).
The Penlee Point Atmospheric Observatory (PPAO, 50°19.08′ N, 4°11.35′ W; https://www.westernchannelobservatory.org.uk/penlee, last access: 27 July 2026) was established in May 2014 by the Plymouth Marine Laboratory (PML) for long term observations of the marine atmosphere (Yang et al., 2016a, b, 2019a, b). PPAO is in close proximity to marine sampling stations that form the Western Channel Observatory (WCO), which supports detailed understanding of air-sea interaction. Routine observations collected throughout the operation of PPAO include trace gases (CH4, CO2, O3, SO2) and basic meteorological parameters (winds, temperature, humidity, pressure, rain rate). For instrumental details see Archibald et al. (2025). Other measurements of shorter duration include NOx by a Teledyne T200 monitor (Oct 2021 to Mar 2024) and total aerosol number concentration by a TSI 3025A condensation particle counter (February to June 2015; May to July 2016; November 2016 to September 2017; Yang et al., 2019b).
The other datasets used in this paper include:
-
Approximately weekly near surface (∼ 2 m) water temperature from CTD (conductivity, temperature, depth) casts made at station L4 (50°15.0′ N, 4°13.0′ W). The long-term marine station L4, part of the Western Channel Observatory, is situated about 6 km south of PPAO.
-
Air quality measurements (NOx, O3, PM2.5, PM10) from the DEFRA monitoring station in the Plymouth City Centre, about 7 km north/northeast of PPAO.
-
Solar irradiance measurements (2014–2015) from the rooftop of PML (50°21.57′ N, 4°08.52′ W), about 6 km north/northeast of PPAO
The predominant (nearly half of the time) wind direction at PPAO is from the southwest (SW), which faces the North Atlantic Ocean as well as the English Channel with heavy shipping influence (Yang et al., 2016b). Winds from the northeast (NE) are also common (about a quarter of the time), which tend to carry more pollution from urban sources. During prevailing SW wind conditions, solar heating of land can enhance SW winds during the day; at night, winds are often weaker but still from the SW direction. In contrast, during calm or weak prevailing NE wind conditions, solar heating of land has the potential to reverse the wind direction during the day. We focus on this latter type of DSB event in this paper, as they can have a significant impact on atmospheric chemistry and air pollution.
To identify diurnal sea breeze events, hourly wind speed and direction are first converted into zonal and meridional components. We then operationally classify DSB days from daily segments of data (midnight to midnight) using the following criteria:
-
Minimum meridional wind velocity is negative (from south to north), occurring during the daytime between 10:00 and 18:00 UTC, and
-
Maximum meridional wind velocity is positive (from north to south), occurring at night between 00:00 and 08:00 UTC, and
-
Standard deviation in wind direction within 24 h period exceeds 30° (so that days when wind direction is fluctuating around due east or due west are not included).
The identification of sea breeze events is not very sensitive to the last threshold. Increasing the threshold to 40° or reducing it to 20° leads to roughly a 10 % reduction/increase in the number of DSB days identified, which does not noticeably change the diurnal averages.
3.1 Occurrence of sea breeze
In total, out of 10 years of data, 428 d (∼ 12 %) were classified as DSB events. Figure 1a shows the number of sea breeze days per month over the 10-year time series, along with air and sea temperatures, while Fig. 1b shows the sea-air temperature difference and wind speed. Sea breeze events tend to peak in the early summer and nearly vanish in the winter, with substantial year to year variability. For some spring/summer months, up to 40 % of the days were classified as sea breeze events. This interannual variability is likely due to a combination of factors, including the sea-air temperature difference and prevailing winds during the spring/summer months. Interestingly, spring/summer 2023 was well known for an exceptionally strong marine heat wave in the Northeast Atlantic (e.g. Berthou et al., 2024). Our observations show that the air temperature was much warmer than the sea during that period, but the occurrence of DSB was not exceptional, probably because the prevailing wind was mostly from the southwest in the spring/summer period. In contrast, many DSB events were observed in spring/summer 2021 and 2022, which coincided with prevailing weak winds from the northeast (and correspondingly low relative humidity). Given this interannual variability, even 10 years of observations seem too short to ascertain whether there is a significant trend in the frequency of DSB events.
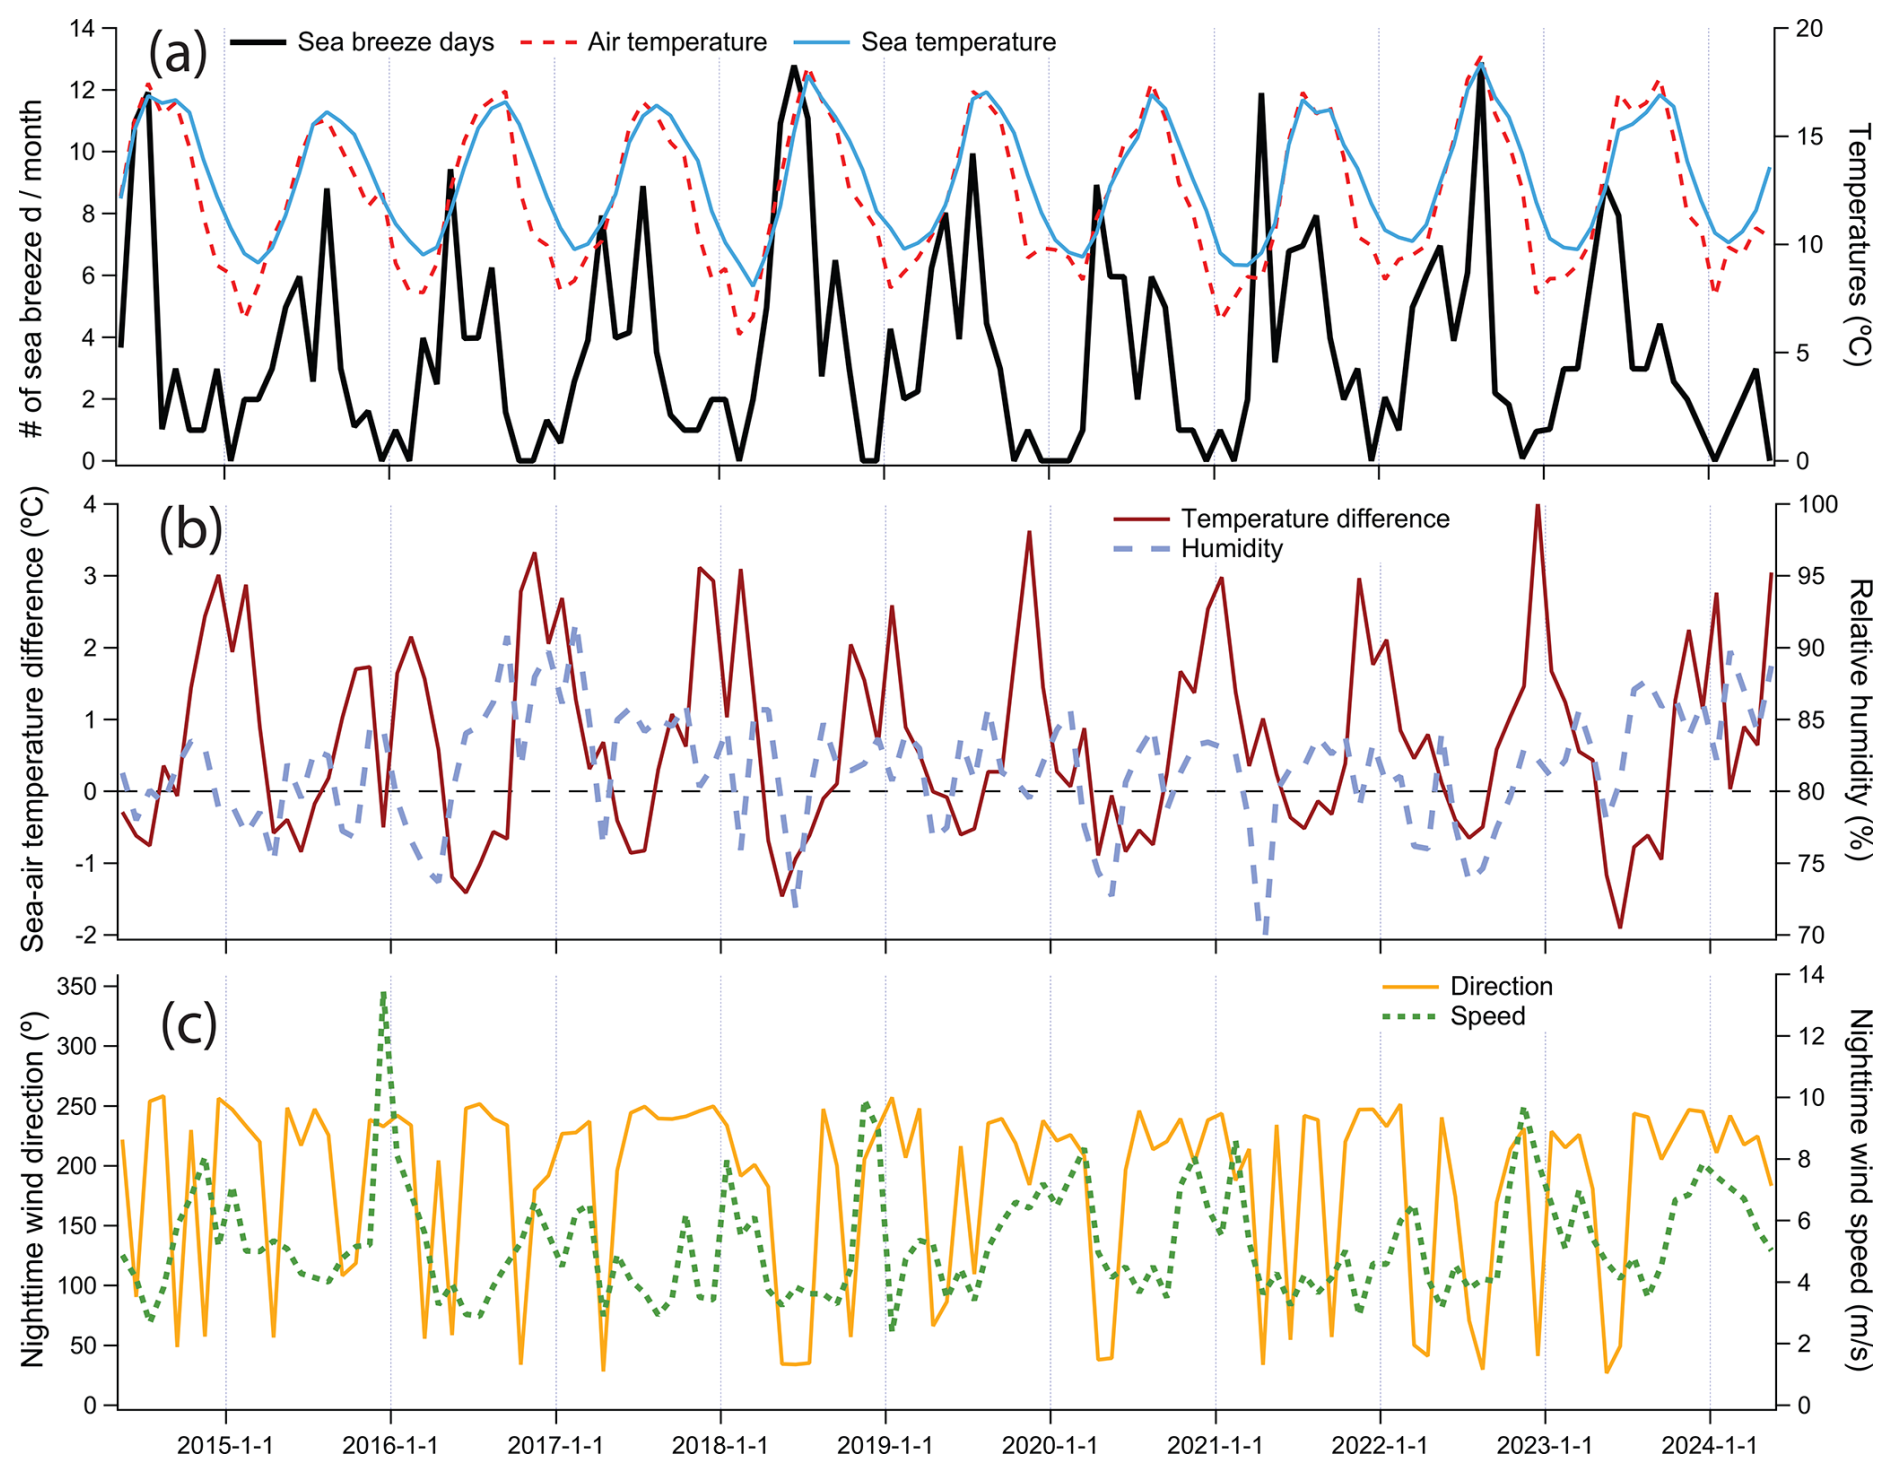
Figure 1Monthly time series of (a) Sea breeze days identified using PPAO data; (b) sea-air temperature difference and relative humidity; (c) median night time wind direction and wind speed as a proxy for the prevailing wind condition. Air temperature, humidity, and wind measurements were from PPAO, while near surface sea temperature was from L4.
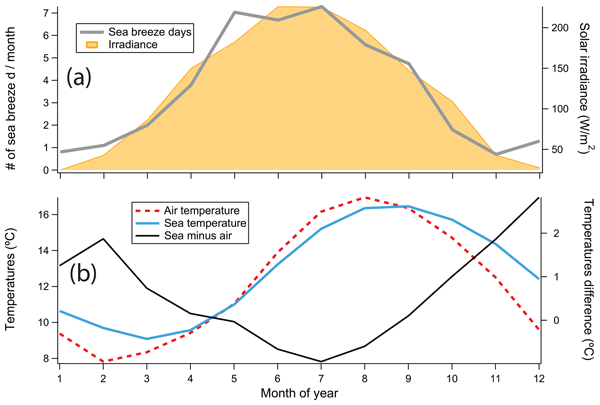
Averaged seasonally, the frequency of DSB occurrence tracks the solar irradiance well and precedes the cycles in air or sea temperatures. DSB occurrence is more closely and negatively correlated with the sea-air temperature difference rather than air or sea temperature alone (Fig. 2). Here we make the implicit assumption that the solar irradiance data from the two years of measurements are reasonably representative of the mean seasonal cycle (Fig. 2) and diurnal cycle (Fig. 4) of light for the entire 10 years, which seems reasonable since over seasonal and diurnal timescales, the cycles in solar irradiance should be very consistent. We have also checked the CAMS solar radiation data product (https://ads.atmosphere.copernicus.eu/datasets/cams-solar-radiation-timeseries?tab=overview, last access: 27 July 2026) over the 10 years, which shows a mean seasonal cycle that is comparable to the observations from 2014–2015.
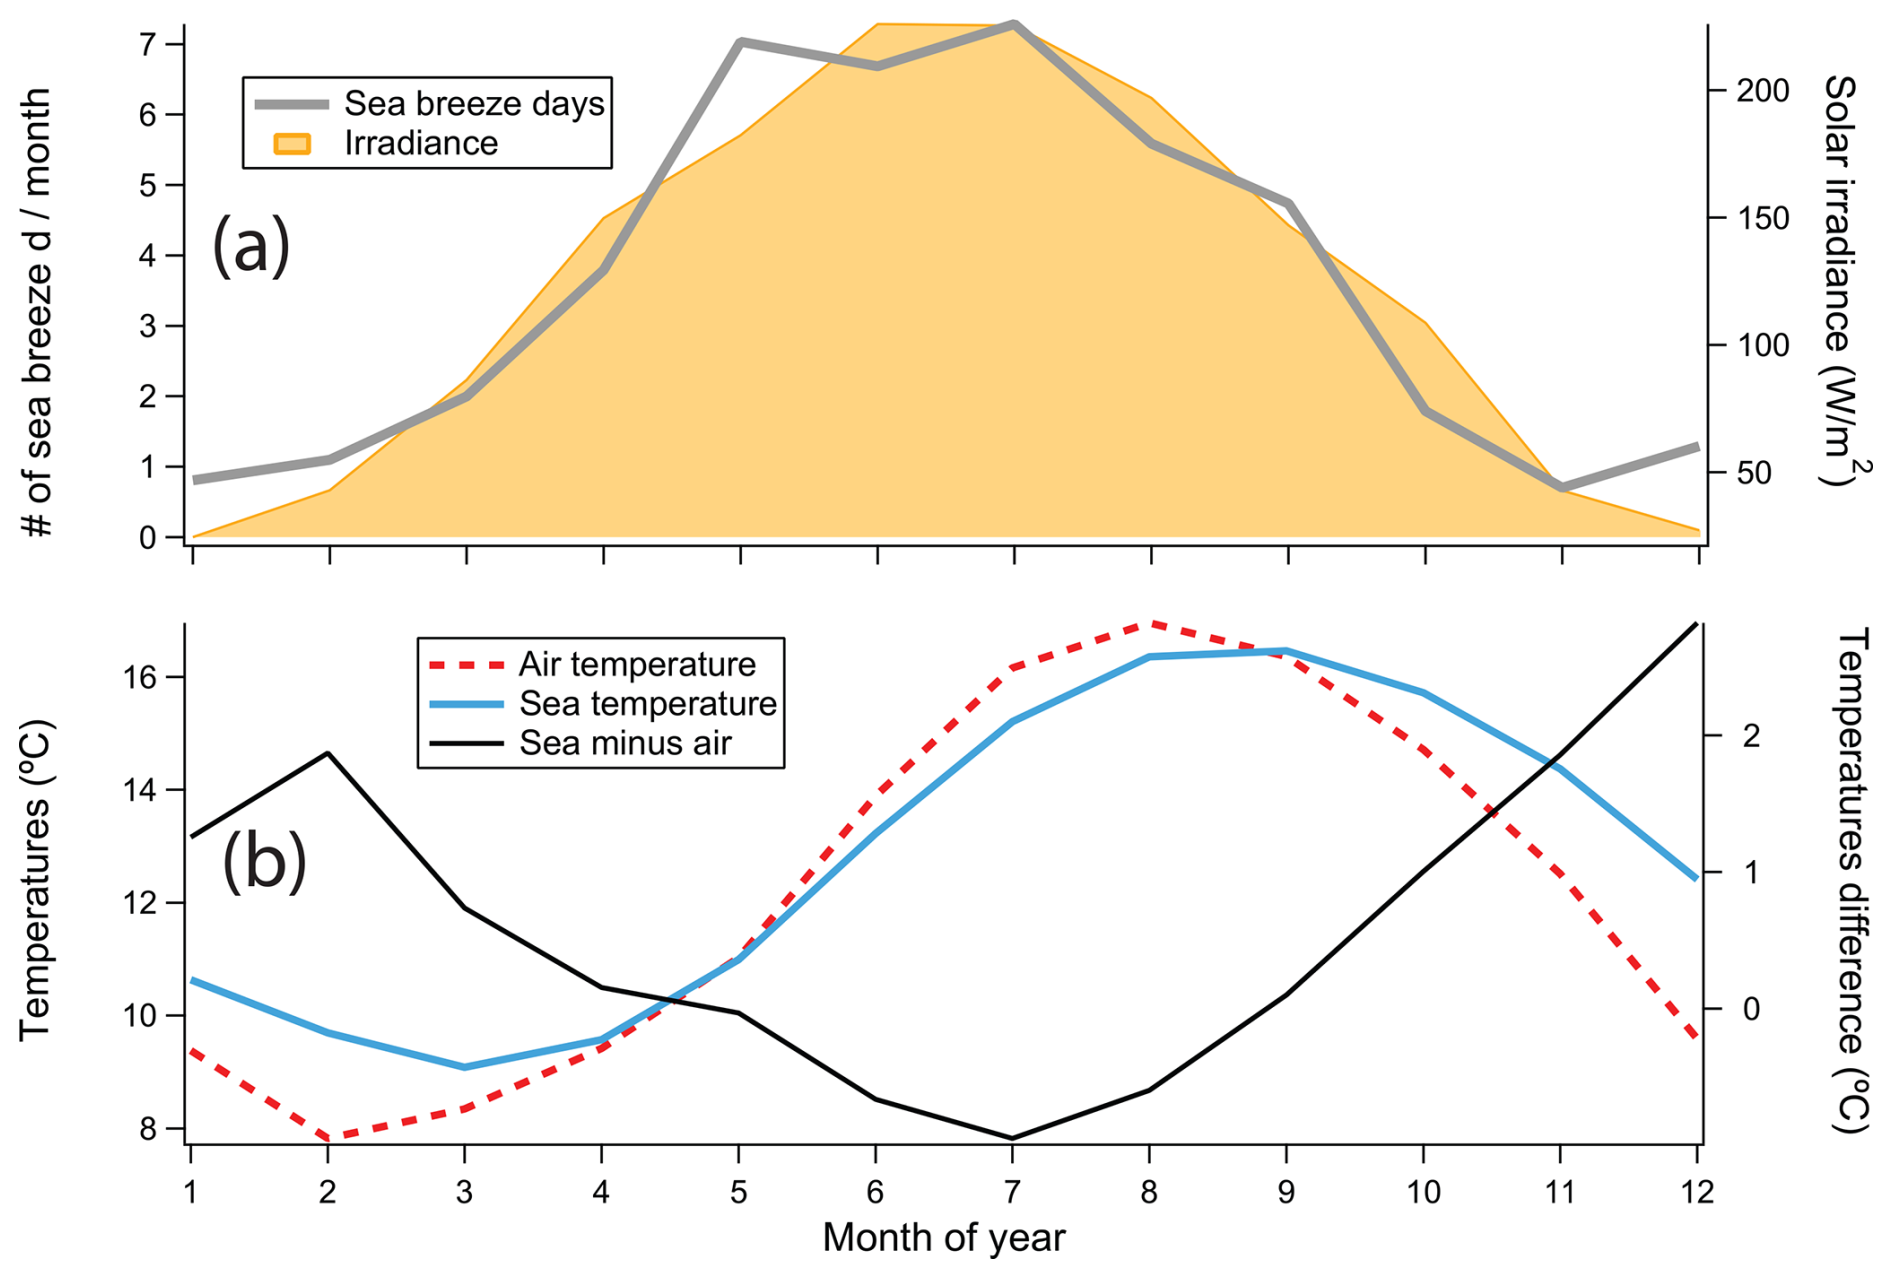
Figure 2Mean annual cycles (2014–2024) in (a) DSB events and solar irradiance; (b) air (PPAO), water (L4) temperatures and their difference. DSB events closely track the annual cycle in solar irradiance and correlate negatively with the temperature difference.
Focusing on periods when DSB events occur most frequently (May to July), we see that these events tend to be associated with fair weather, namely higher air temperature, pressure, and solar irradiance, as well as lower wind speed, relative humidity, and rainfall (Fig. A2). Such fair-weather conditions are conducive to pollutant build-up due to both strong photochemistry as well as limited dispersion and removal.
3.2 Drivers of sea breeze
We mainly focus on the impact of sea-air temperature difference, heat fluxes, and atmospheric stability on DSB events in this section, as solar irradiance data were only available for the first two years of this dataset. Figure 3 shows the relationships between the number of sea breeze days/month and the monthly averaged sea-air temperature difference, sensible heat flux, and atmospheric stability parameter (, where Z is measurement height and L the Obukhov length). The latter two parameters were computed with the COARE3.5 bulk flux algorithm (Edson et al., 2013) from meteorological measurements from PPAO and seawater temperature from L4. We note that while the use of the COARE3.5 algorithm that has been tuned to the open ocean for a coastal environment may lead to some uncertainty, any bias will most likely be in the magnitude of the transfer coefficients, but not in the sign of heat flux (or in turn L in the term).
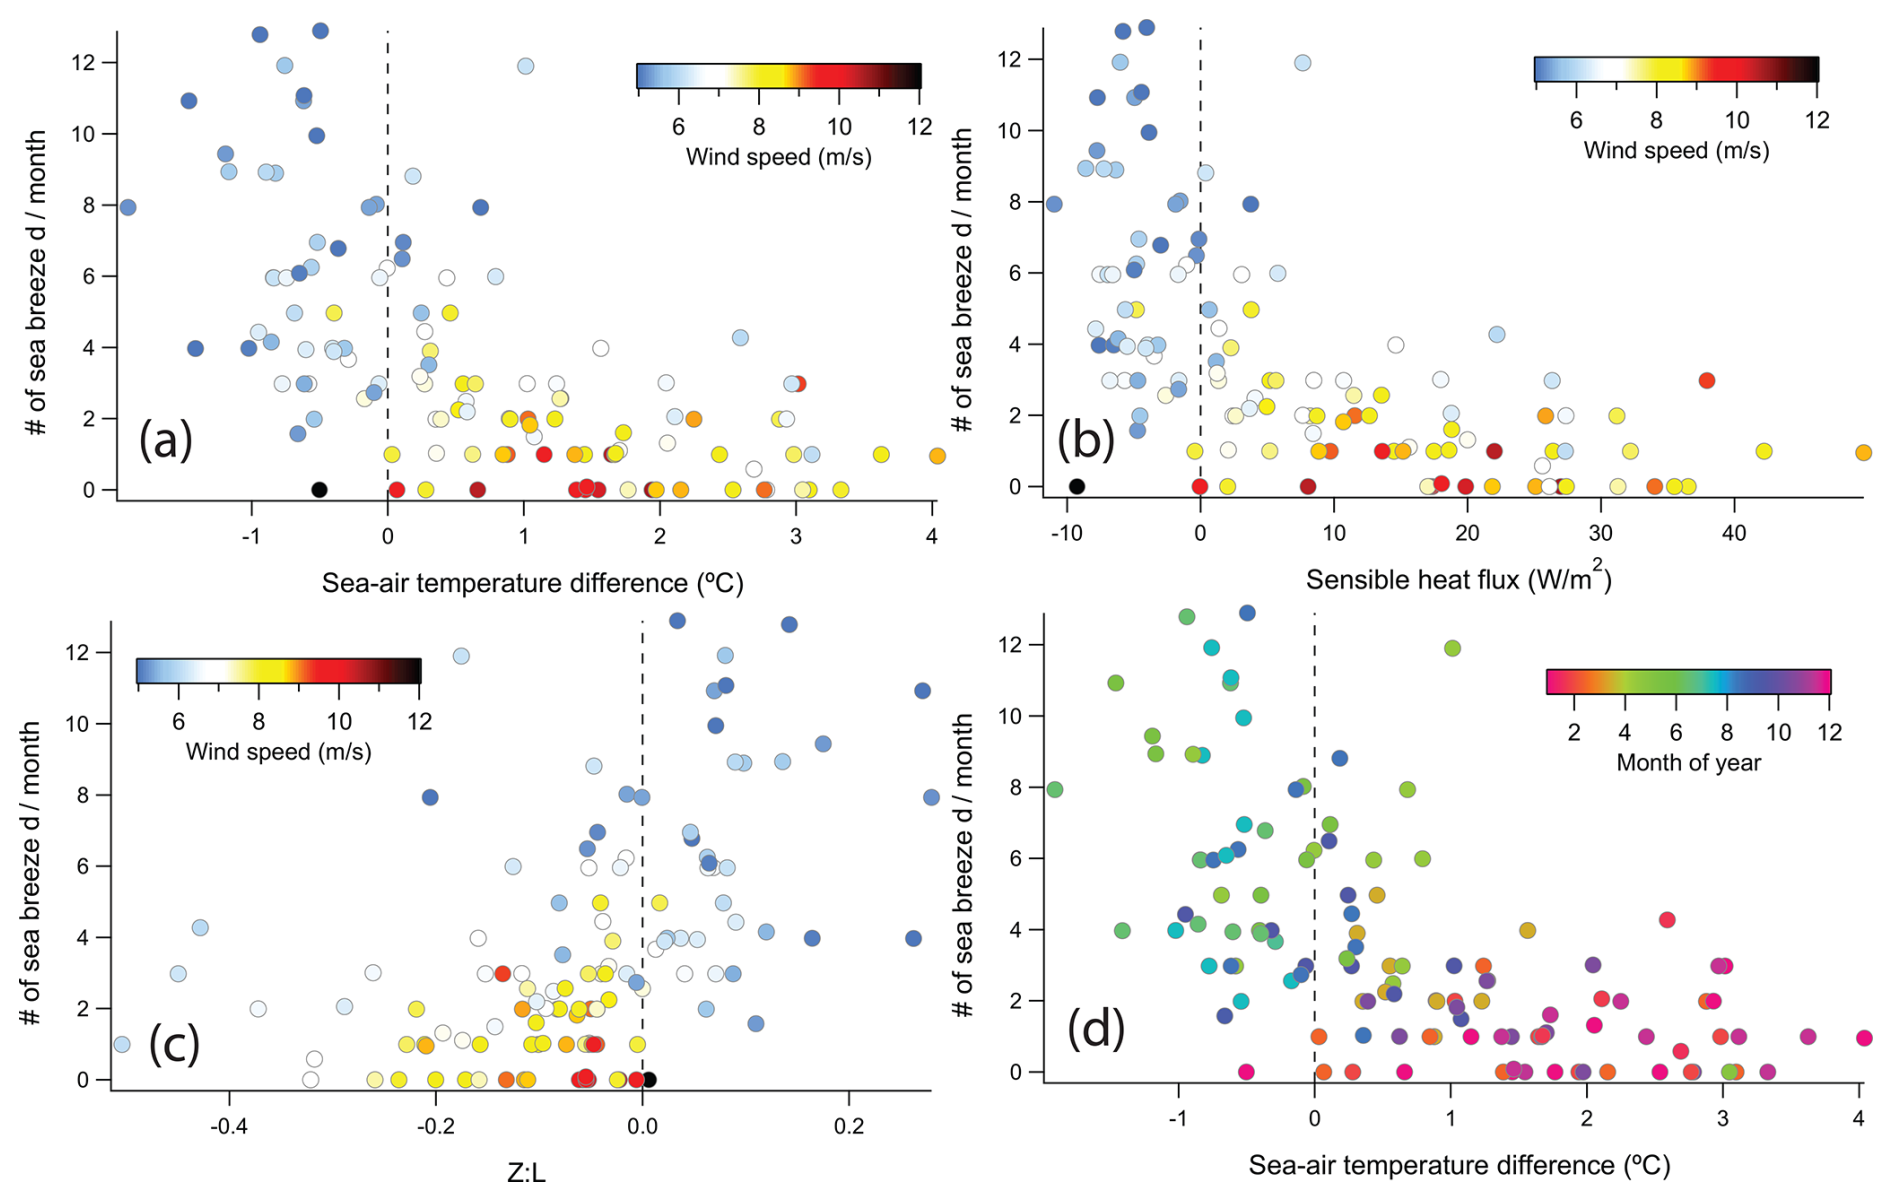
Figure 3The number of sea breeze days identified per month vs. monthly means of (a) sea-air temperature difference; (b) sensible heat flux; (c) stability parameter , all color-coded by wind speed. Panel (d) is same as a, except that it is color-coded by the month of year. Sea breeze days most prevalent when sea is slightly cooler than air, resulting in negative sensible heat flux and positive (most prevalent during spring and summer).
DSB events were most common when the sea was slightly cooler than air at PPAO and the wind speeds were fairly low, resulting in negative sensible heat fluxes and a statically stable atmosphere (positive ). On ∼ 70 % of the identified sea breeze days, the sea was cooler than air by more than 0.5 °C and wind speed was less than 7 m s−1. This pattern seems reasonable because when the sea is much warmer than air or at high wind speeds, the land-sea temperature difference becomes insufficient to reverse the wind direction between day and night.
3.3 Timing of sea breeze front
Previous studies suggest that the timing of sea breeze can be highly variable (e.g. Banta et al., 2005; Martins et al., 2012), with strong implications for air pollution (e.g. time available for photochemical smog formation). Here we divide the 10 years of data into four seasons and investigate the timing of identified sea breeze events. Figure 4 shows the diurnal cycles in the meridional (north-south) wind velocity, solar irradiance, and O3 mixing ratio.
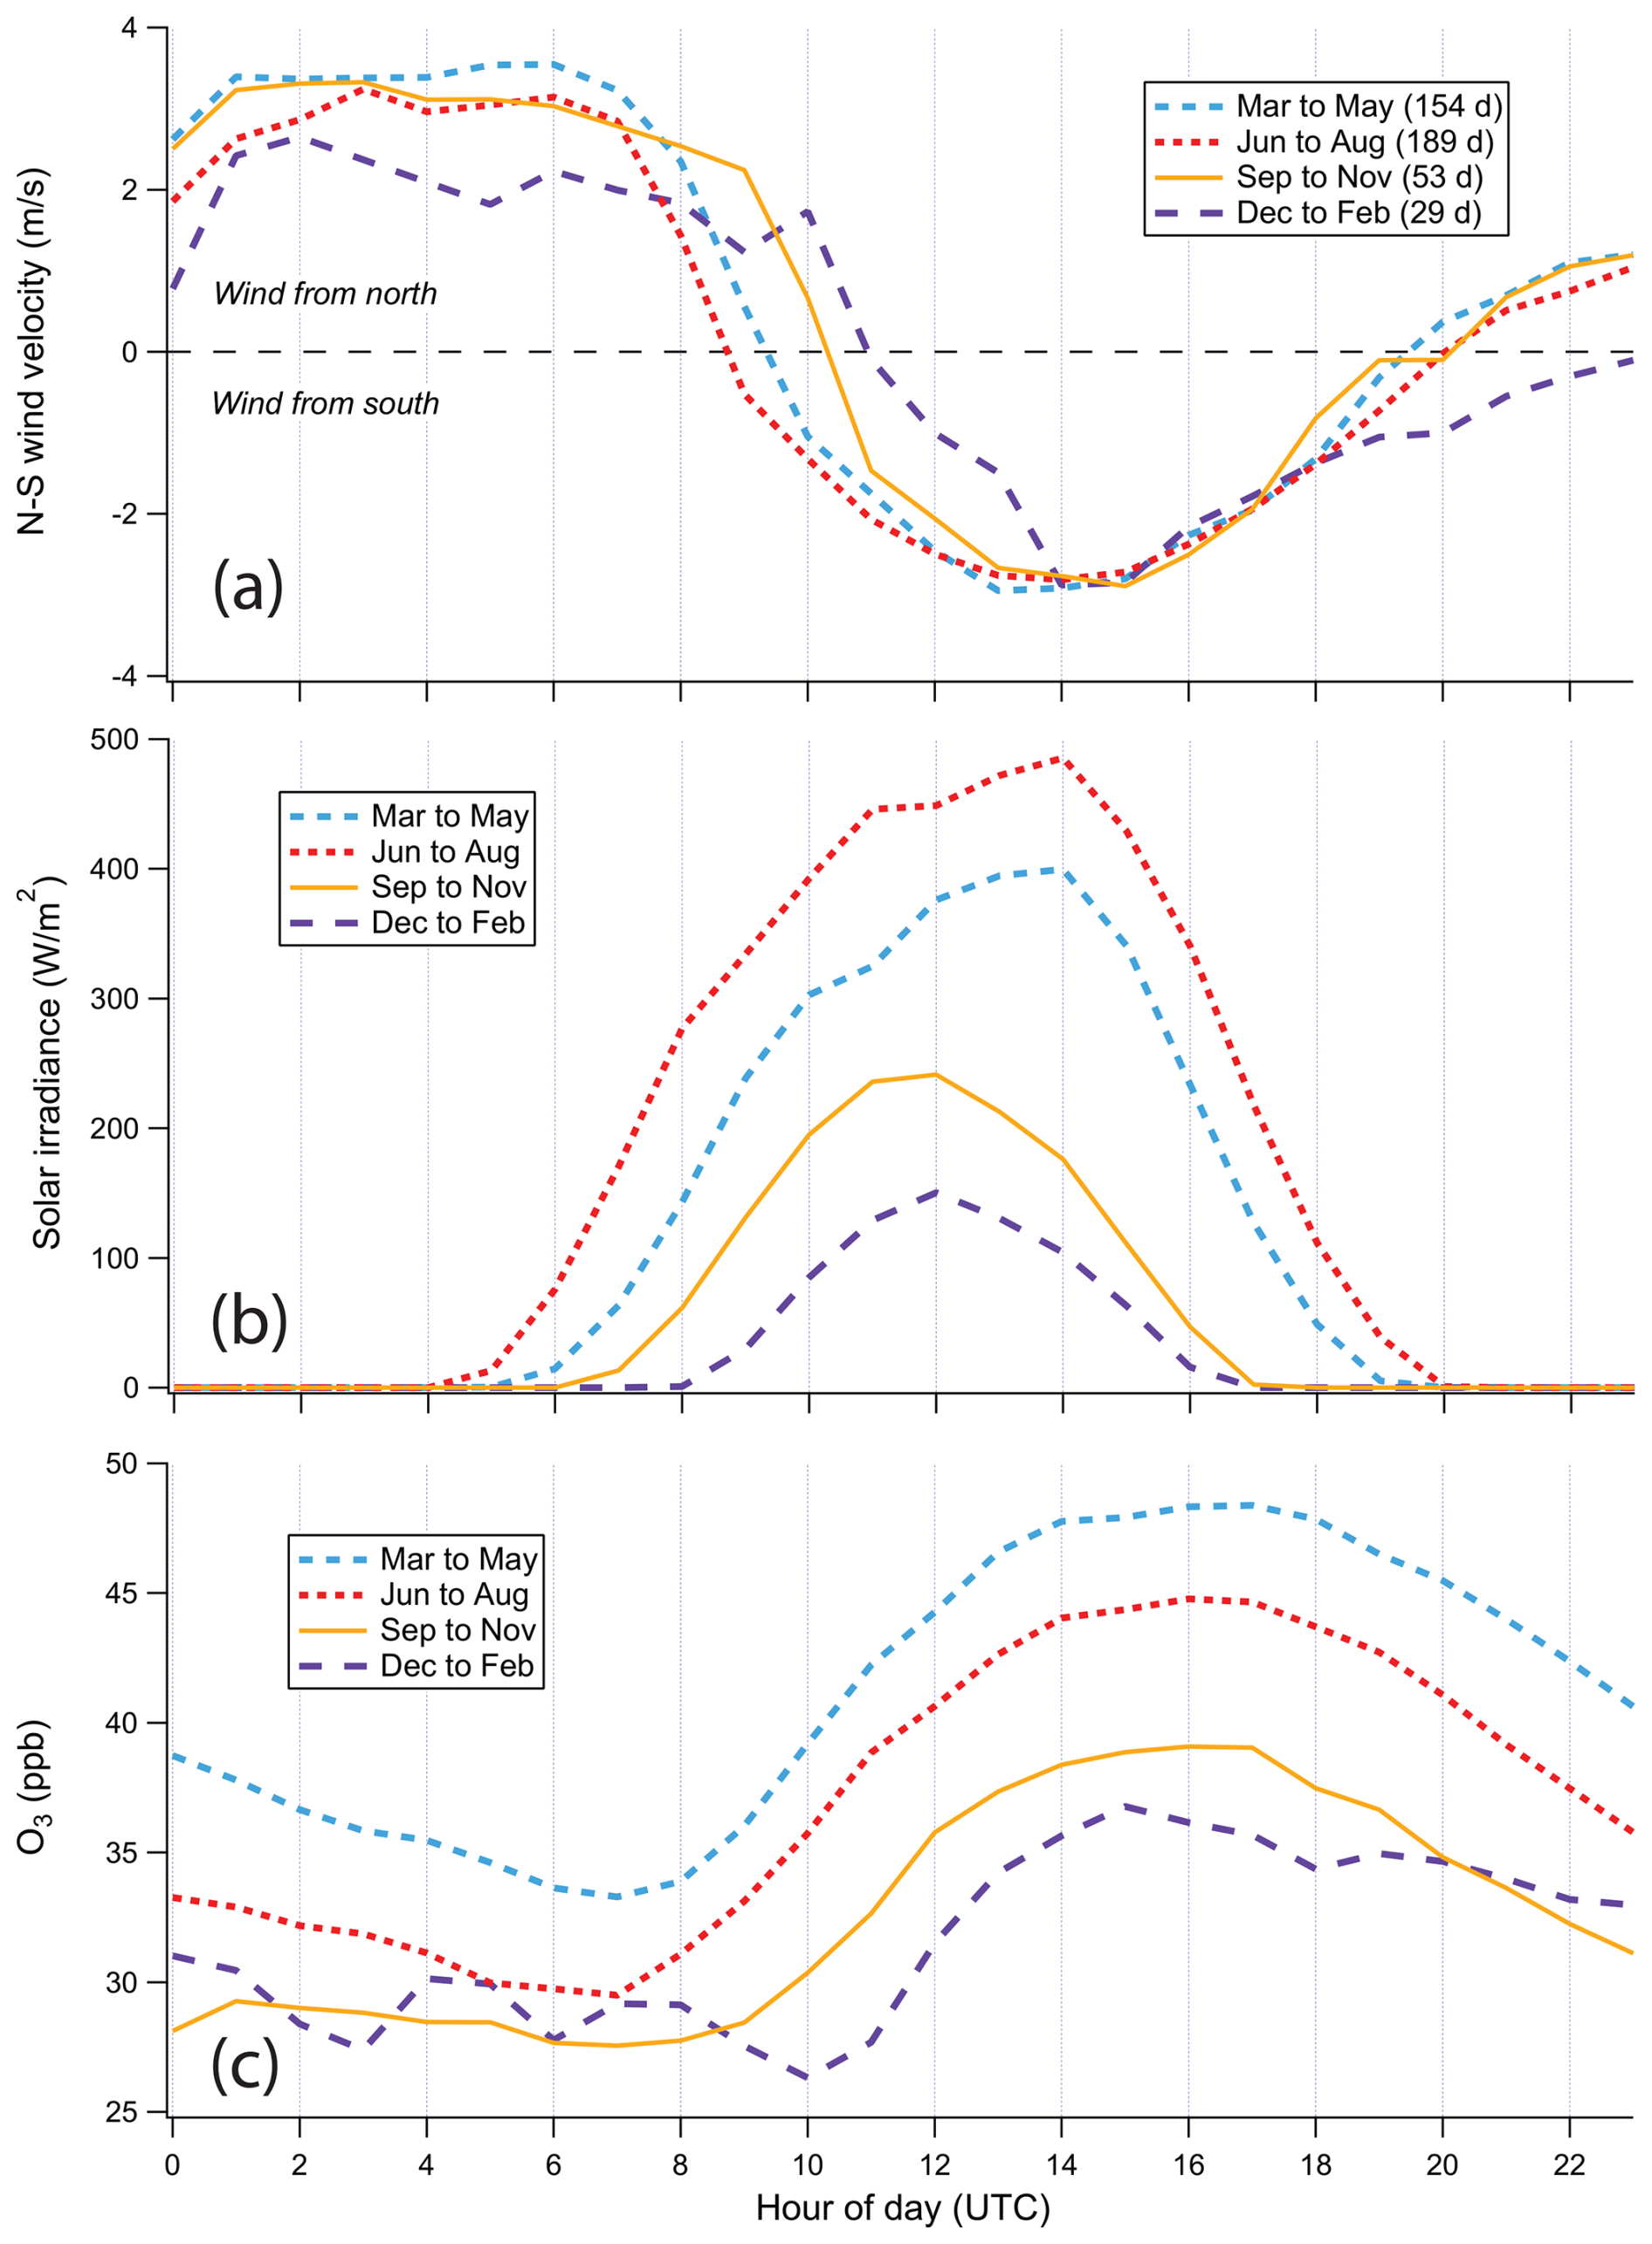
Figure 4Diurnal cycles during DSB days divided by different seasons in (a) N–S wind velocity at PPAO; (b) Solar irradiance at PML; (c) O3 mixing ratio at PPAO.
The timing when wind velocity switched from offshore (positive) to onshore (negative) in the morning is slightly earlier in the summer (before ∼ 09:00 UTC) than in the autumn and winter (after ∼ 10:00 UTC). These switches took place a few hours after sunrise and the switches were abrupt (within ∼ 2 h). The delay relative to sunrise reflects the time needed for land to heat up. The earlier onset of sea breeze in the warmer months than in the cooler months is clearly evidenced in the timing of the increase in O3 mixing ratio, as onshore winds during the daytime brings in O3-rich air from the sea. This morning time increase in O3 had an average rate of 2 to 3 ppb h−1 from spring to autumn, which is more rapid than on non-DSB days (Appendix A, Fig. 3A). During the warmer months, the net rate of change in O3 is positive throughout the day, and the peak in in the morning coincides with when the winds change from offshore to onshore during DSB events. The peak net rate of change in O3 during DSB days is about twice as high as during non-DSB days for a given season, largely due to the higher NOx concentrations accumulated during DSB events. The diurnal amplitude in O3 was also largest in the warmer months, in part due to the longer duration of sea breeze during the day.
In contrast, the timing when wind velocity switches from onshore (negative) to offshore (positive) in the evening was less variable across the seasons (around 20:00 UTC). These switches appear to take place shortly after sunset and the switches over several hours are less abrupt than those in the morning. The change in wind direction was most gradual in winter due to weak solar irradiance (note though the winter data are the least certain due to the low number of sea breeze events). The apparent asymmetry between the abrupt onset of sea breeze in the morning and the more gradual demise of sea breeze in the evening is likely because the solar heating of land after sunrise is more rapid than the longwave cooling of land after sunset. This is evidenced in the diurnal cycles in air temperature (Fig. A3), with more rapid warming in the morning and more gradual cooling in the early evening.
4.1 Air quality at Penlee Point Atmospheric Observatory
We start this section by showing an example of DSB from August 2022 (Fig. 5). Consistent sea breeze was observed during the first week of this example time series, with very light winds from the NE at night, moderate winds from the SW during the daytime, and generally high air temperature and strong solar irradiance. More consistent SW winds were observed during the latter part of the time series when the air temperature was lower and winds stronger. As shown in Fig. A4 in Appendix A, airmass back trajectories (Stein et al., 2015; Rolph et al., 2017) do not capture these DSB events at all.
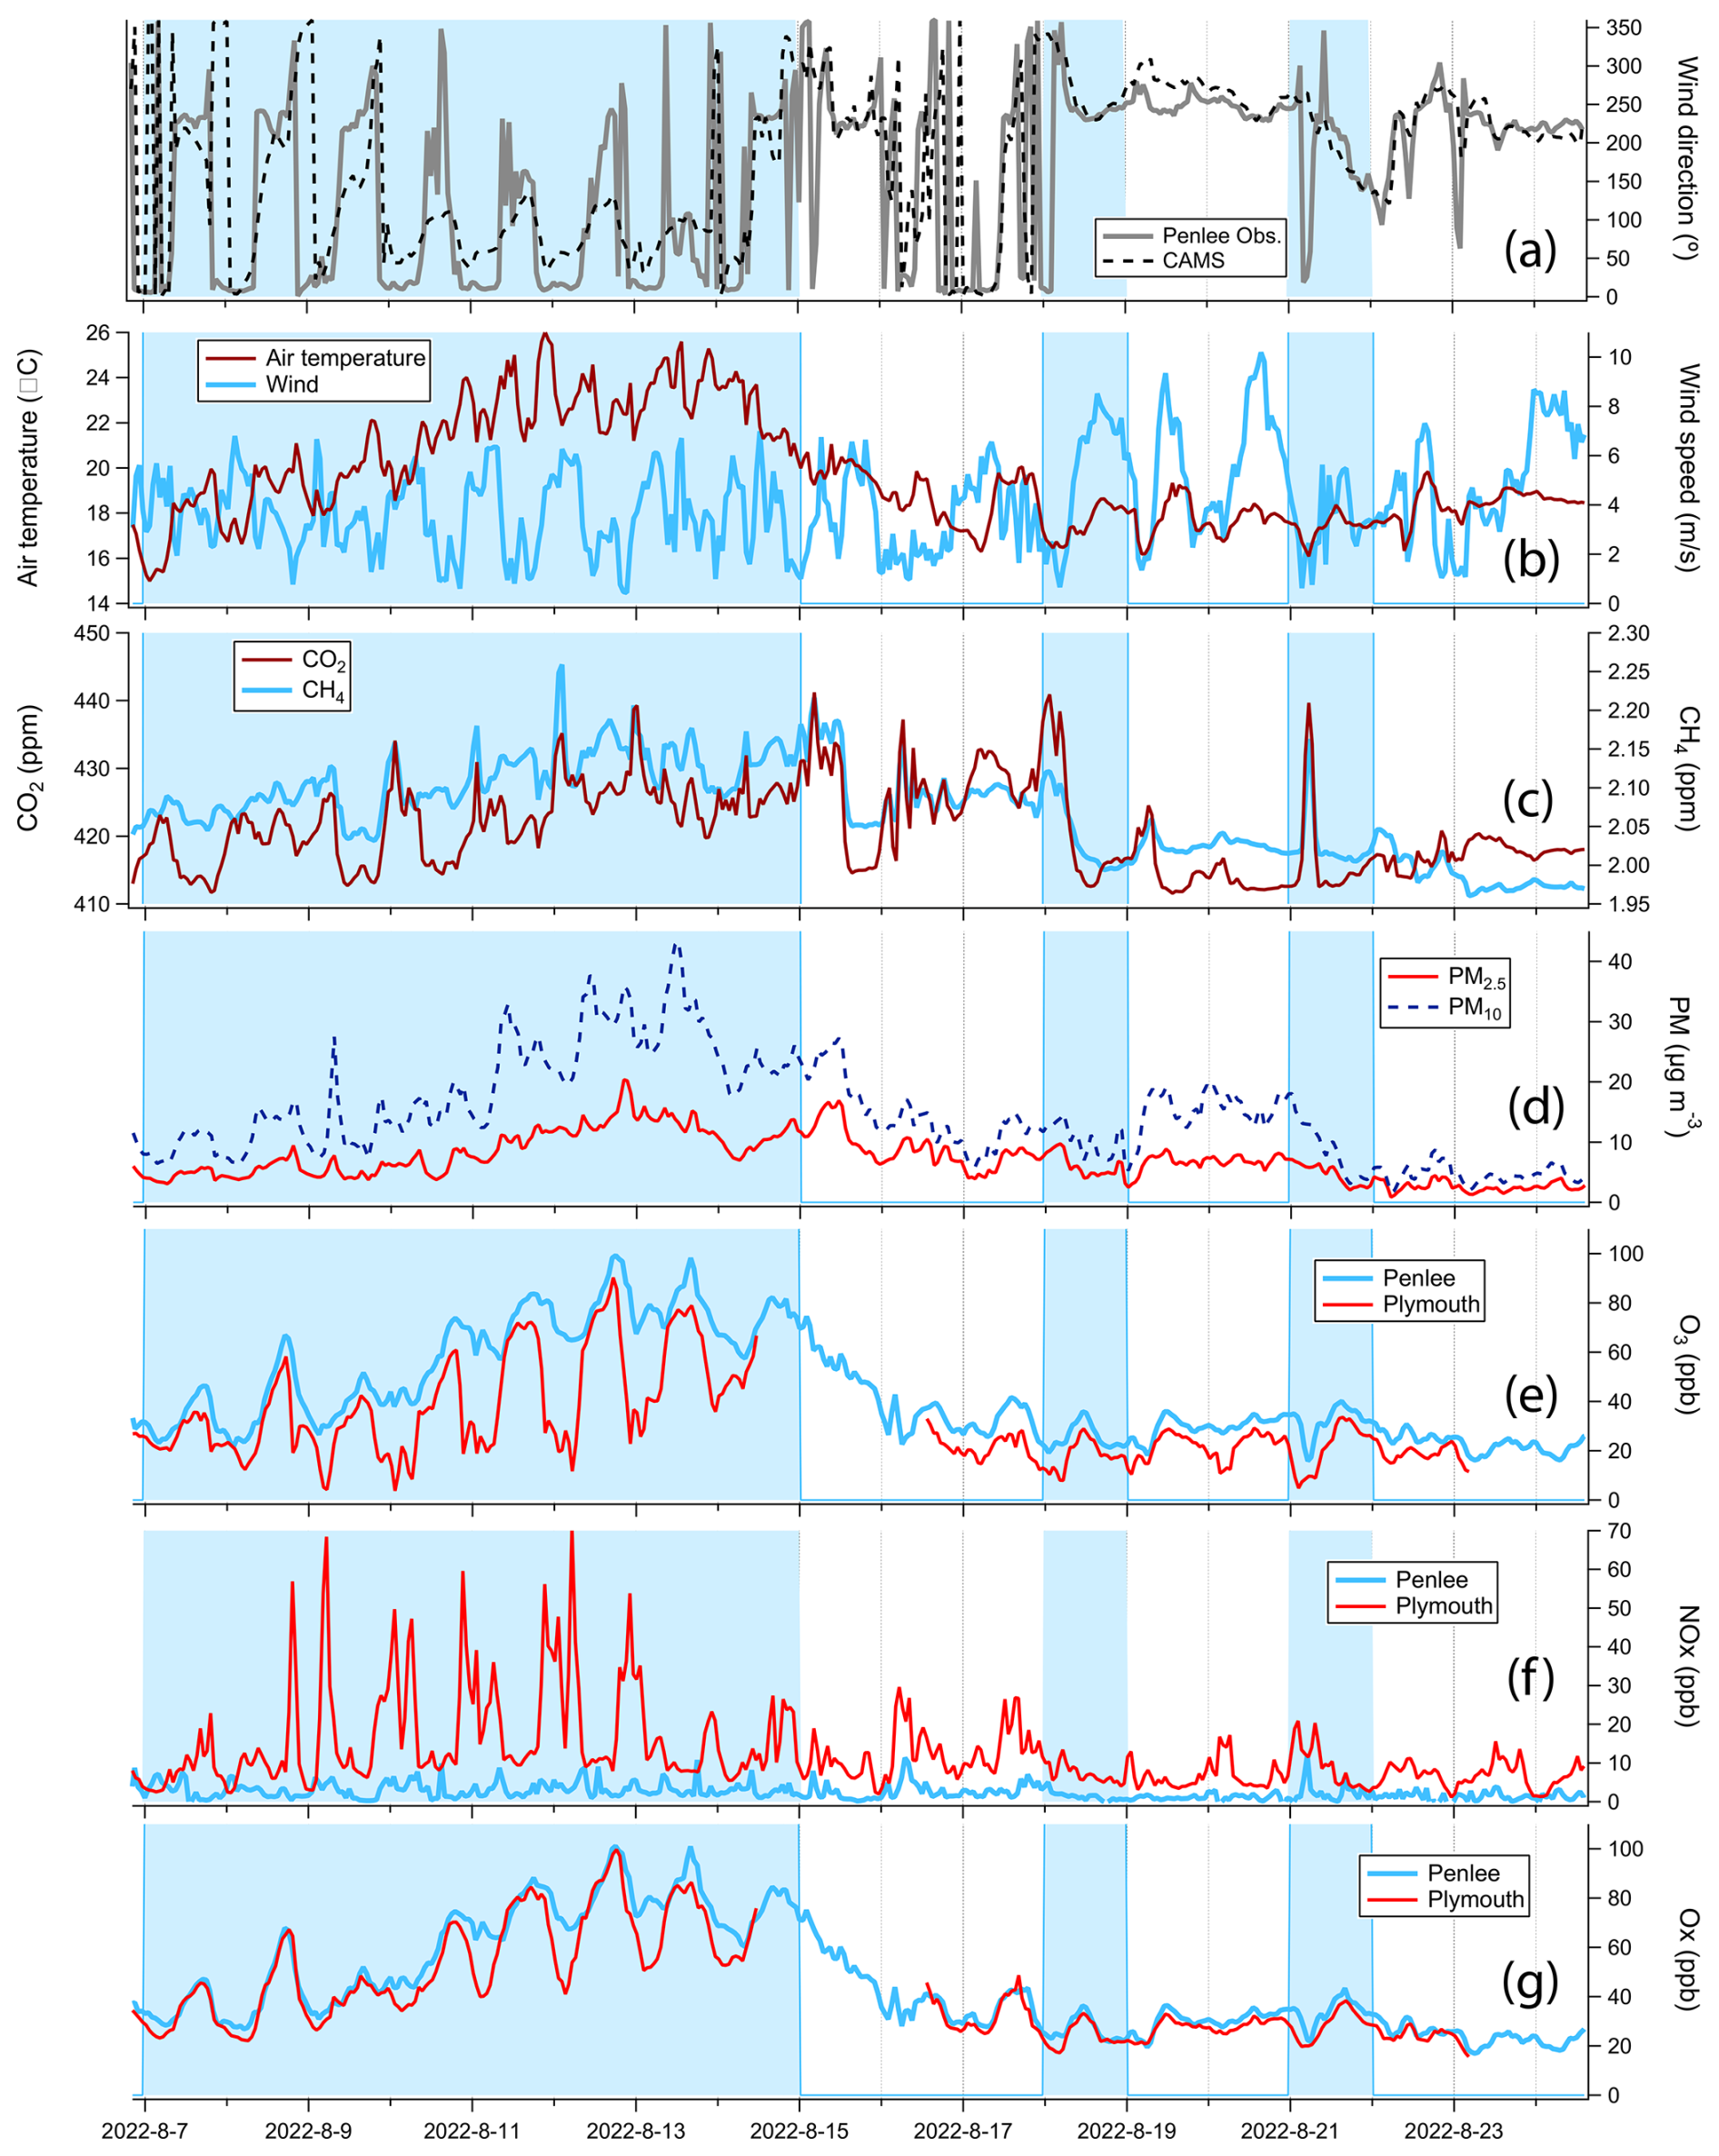
Figure 5Example of DSB events at PPAO and Plymouth City Centre, with blue shading indicating DSB events. (a) wind direction; (b) air temperature and wind speed from PPAO; (c) CO2 and CH4 from PPAO; (d) PM2.5and PM10 from Plymouth; (e) O3 at PPAO and Plymouth; (f) NOx at PPAO and Plymouth; (g) Ox at PPAO and Plymouth. The ECMWF model forecast wind direction is also shown in panel (a).
Concentrations of greenhouse gases (GHG) CO2 and CH4 were elevated by ca. 20 and 0.2 ppm, respectively, during this first week, with large diurnal amplitudes. The second week was characterized by lower and less diurnally variable GHG concentrations of around 415 and 2 ppm. Aerosols (both PM10 and PM2.5) were also several times higher during the first week than the second week, with the larger aerosols showing more consistent diurnal variability.
O3 and NOx were measured at both PPAO and in Plymouth City Centre. During the first week, O3 at PPAO reached 100 ppb – the highest level recorded at this site since its establishment in 2014, likely due to both highly active photochemistry and the DSB circulation. O3 was much lower and NOx was much higher in Plymouth in the night time than at PPAO. This was primarily due to the higher NOx emission in the city, which was poorly ventilated during sea breeze events at night due to the low winds, resulting in greater O3 titration (i.e. O3 + NO forming NO2). During the second week, NOx and O3 concentrations were lower, and the difference in O3 between the two sites was also smaller. Outside of DSB events the Ox (O3 + NO2) levels are very similar between PPAO and the city centre, suggesting that O3 measurements at PPAO can generally be considered reasonable background conditions for the city centre. However, during DSB events, Ox was lower in Plymouth than at PPAO at night, perhaps due to rapid depositional loss as a result of the shallow boundary layer or differences in atmospheric boundary layer structure between the coast and several km inland.
It is apparent in Fig. 5a that the ECMWF short-range forecast winds (steps 2 to 13 h from forecast initiated at 00:00 and 12:00 UTC) do not capture well the diurnal change in wind direction due to sea breeze during this period. In particular on the 7th–9th, wind direction switched earlier and more abruptly than the model forecast (Fig. 5B). That operational numerical weather prediction models struggle to fully capture DSB events have been reported elsewhere (e.g. the very recent work of Brown et al., 2026). Since this modelled wind is used to drive the CAMS air quality forecast, it is likely that the predicted air pollutants will also be uncertain.
The mean impact of sea breeze on PPAO observations is shown as diurnal cycles in Fig. 6. The frequency of DSB occurrence varies seasonally (Fig. 2). To avoid conflating DSB impact with seasonal variability, in this section we limit our analysis to the months of May to July only, when DSB events occur frequently. To separate the impact of larger scale transport from the smaller scale circulation from DSB, we further select for periods with either offshore or onshore flow and compare their means to DSB/non-DSB events.
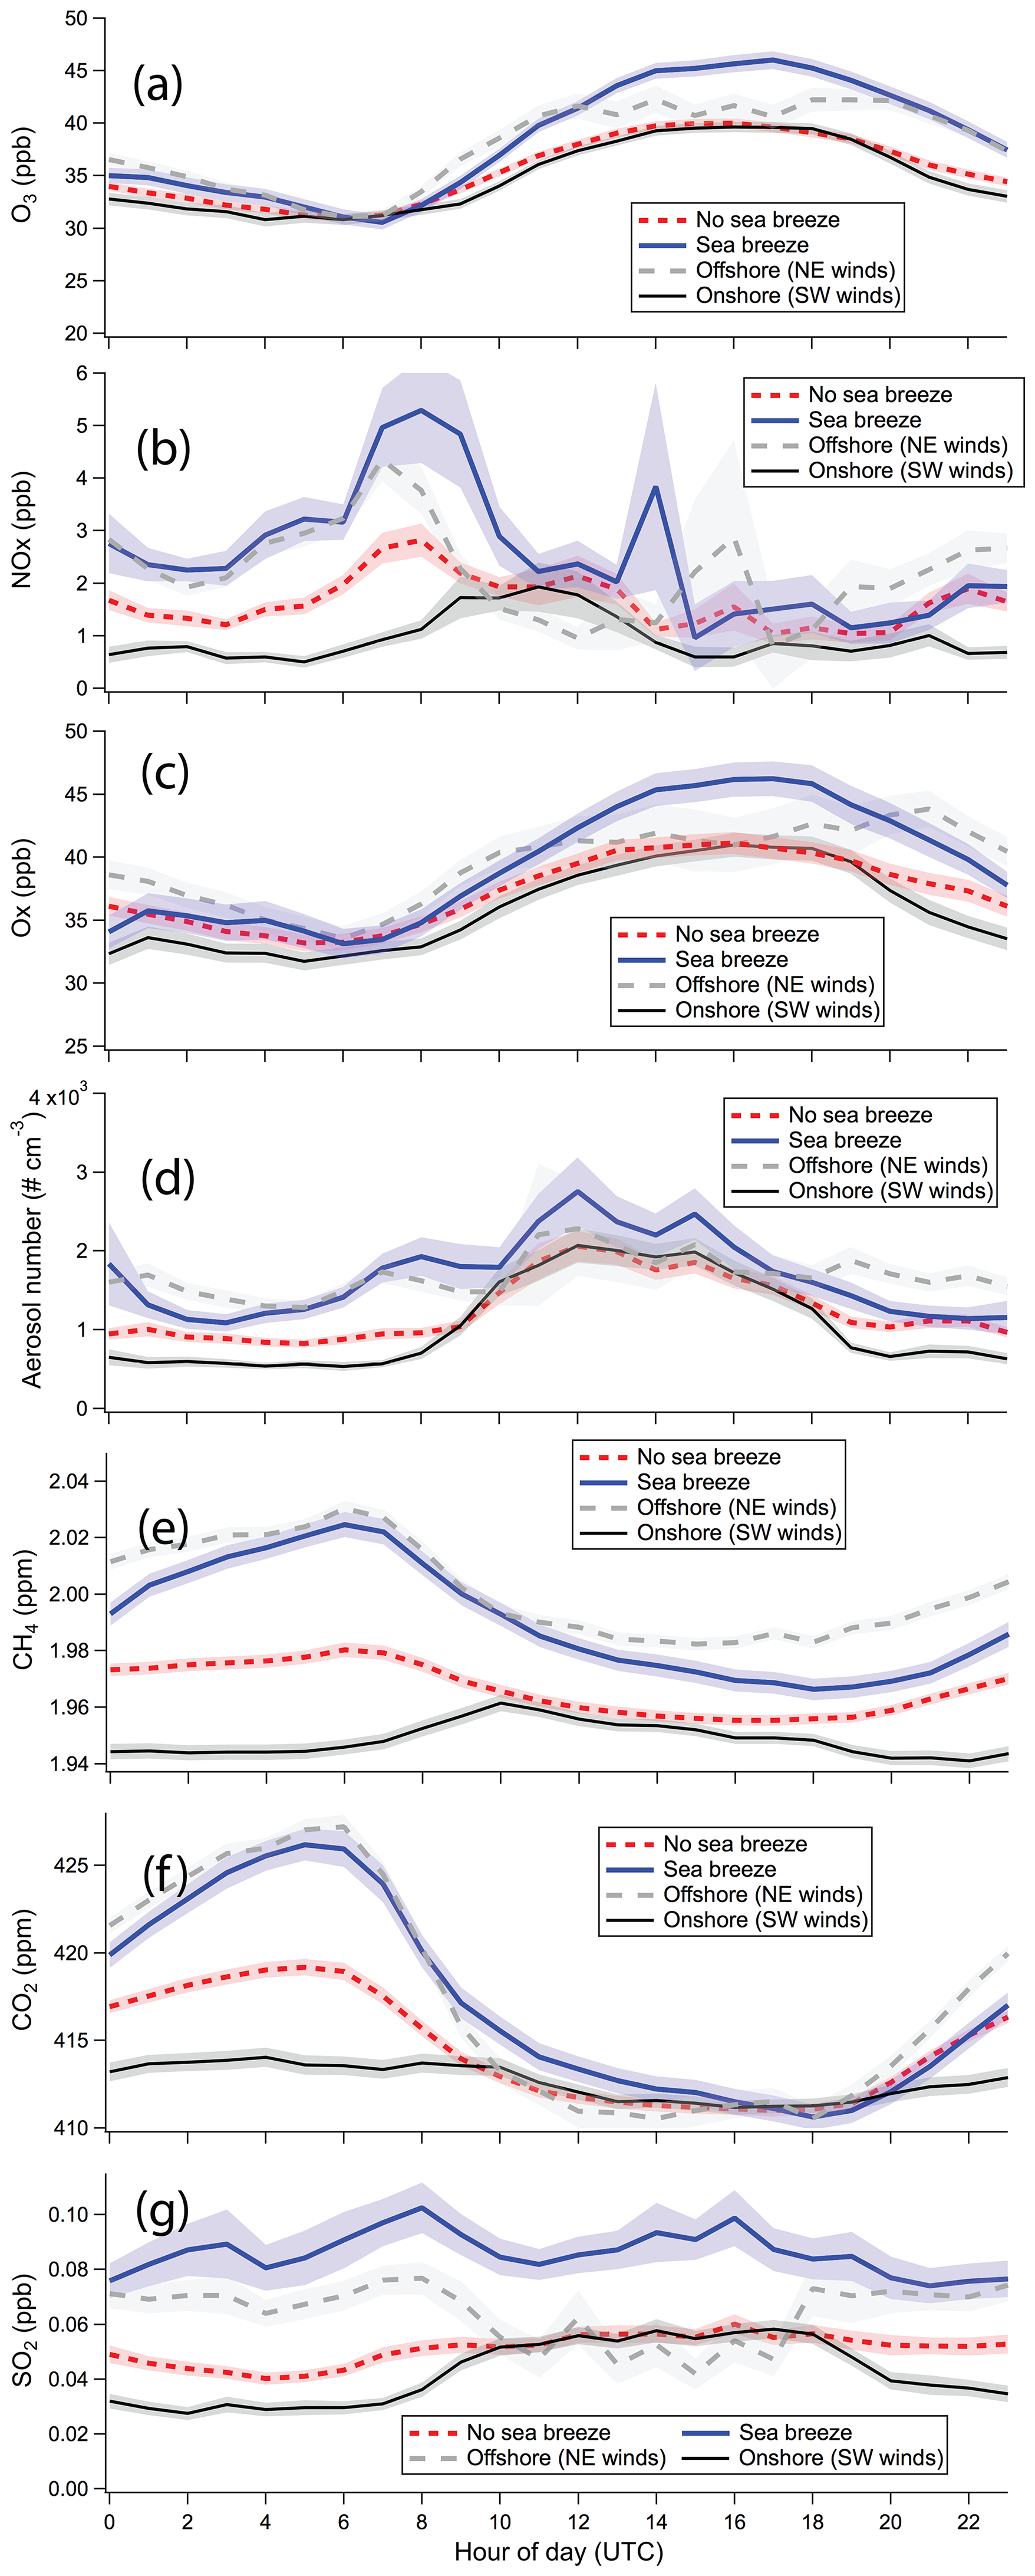
Figure 6Mean diurnal cycles at PPAO during and outside of sea breeze events for May, June, and July over the entire measurement period for (a) O3 [2014–2024]; (b) NOx [2021–2024]; (c) Ox [2021–2024]; (d) aerosol number concentration [2015–2017]; (e) CH4 [2014–2024]; (f) CO2 [2014–2024]; (g) SO2 [2014–2024]. Mean diurnal cycles during offshore wind flow (hourly wind direction from NE, specifically 330 to 60°) and onshore wind flow (hourly wind direction from SW, specifically 210 to 260°) are also shown. Shading corresponds to standard error.
In general, the night time concentrations of trace gases and aerosols were fairly similar between DSB events and periods of offshore wind flow. During the day, pollutant concentrations (especially NOx, O3,and Ox) were on average ca. 20 % higher on DSB events than during periods of onshore wind flow, which is partly due to insufficient dispersion of pollutants from the previous night as well as the highly active photochemistry. For SO2, a gas with substantial contribution from shipping in this environment (Yang et al., 2016b), concentrations during DSB events were more than twice as high as during periods of onshore flow during the daytime. This is likely because (1) the dry, sunny conditions characteristic of DSB events are associated with slow destruction of SO2, which is otherwise rapidly oxidized in clouds; (2) the ship emitted SO2 is recirculated due to poor dispersion. To assess how much of the elevated pollution on DSB days is driven by stagnant conditions and fair weather alone rather than due to DSB circulation, we have also looked at non-DSB days between May to July with comparable wind speed and air temperature as DSB days. These stagnant periods with no DSB are similar on average to the mean of all non-DSB days, illustrating the importance of DSB circulation in building up pollution.
Out of these four cases, periods of onshore flow (i.e. SW winds) generally have the smallest diurnal cycles for the trace gases, as might be expected for the marine atmosphere where sources and sinks are weak or diffuse. The one exception is aerosol number, which shows a fairly large increase during the daytime even during SW winds. The cause of this diurnal cycle in aerosol number is uncertain but may be related to new particle formation driven by ship emissions (e.g. Mao et al., 2021) as well as coastal halogens (e.g. McFiggans et al., 2010) ship emissions (e.g. Mao et al., 2021). Halogen emissions from the coast likely contribute to this new particle formation, as PPAO data show enhanced aerosol number concentration when the tidal height is less than ∼ 2 m. However, removing these low tide data (20 % of the time) lowers the mean aerosol number concentration at around midday by only ca. 200 cm−3, and does not eliminate the bulk of the diurnal cycle. Thus the large diurnal cycles in aerosol number concentration may be mostly driven by ship-emitted SO2, which is substantially enhanced on DSB days than non-DSB days. We note that the aerosol number concentration data here were collected prior to the 2020 International Maritime Organisation regulation on ship sulfur emission reduction. Further aerosol number concentration observations post regulation as well as composition measurements of nucleation mode aerosols would shed light on the sources of new particles at PPAO.
4.2 Air quality in Plymouth City Centre
The mean impact of sea breeze on air quality in Plymouth City Centre is shown as diurnal cycles in Fig. 7. Again, we focus on the months of May to July.
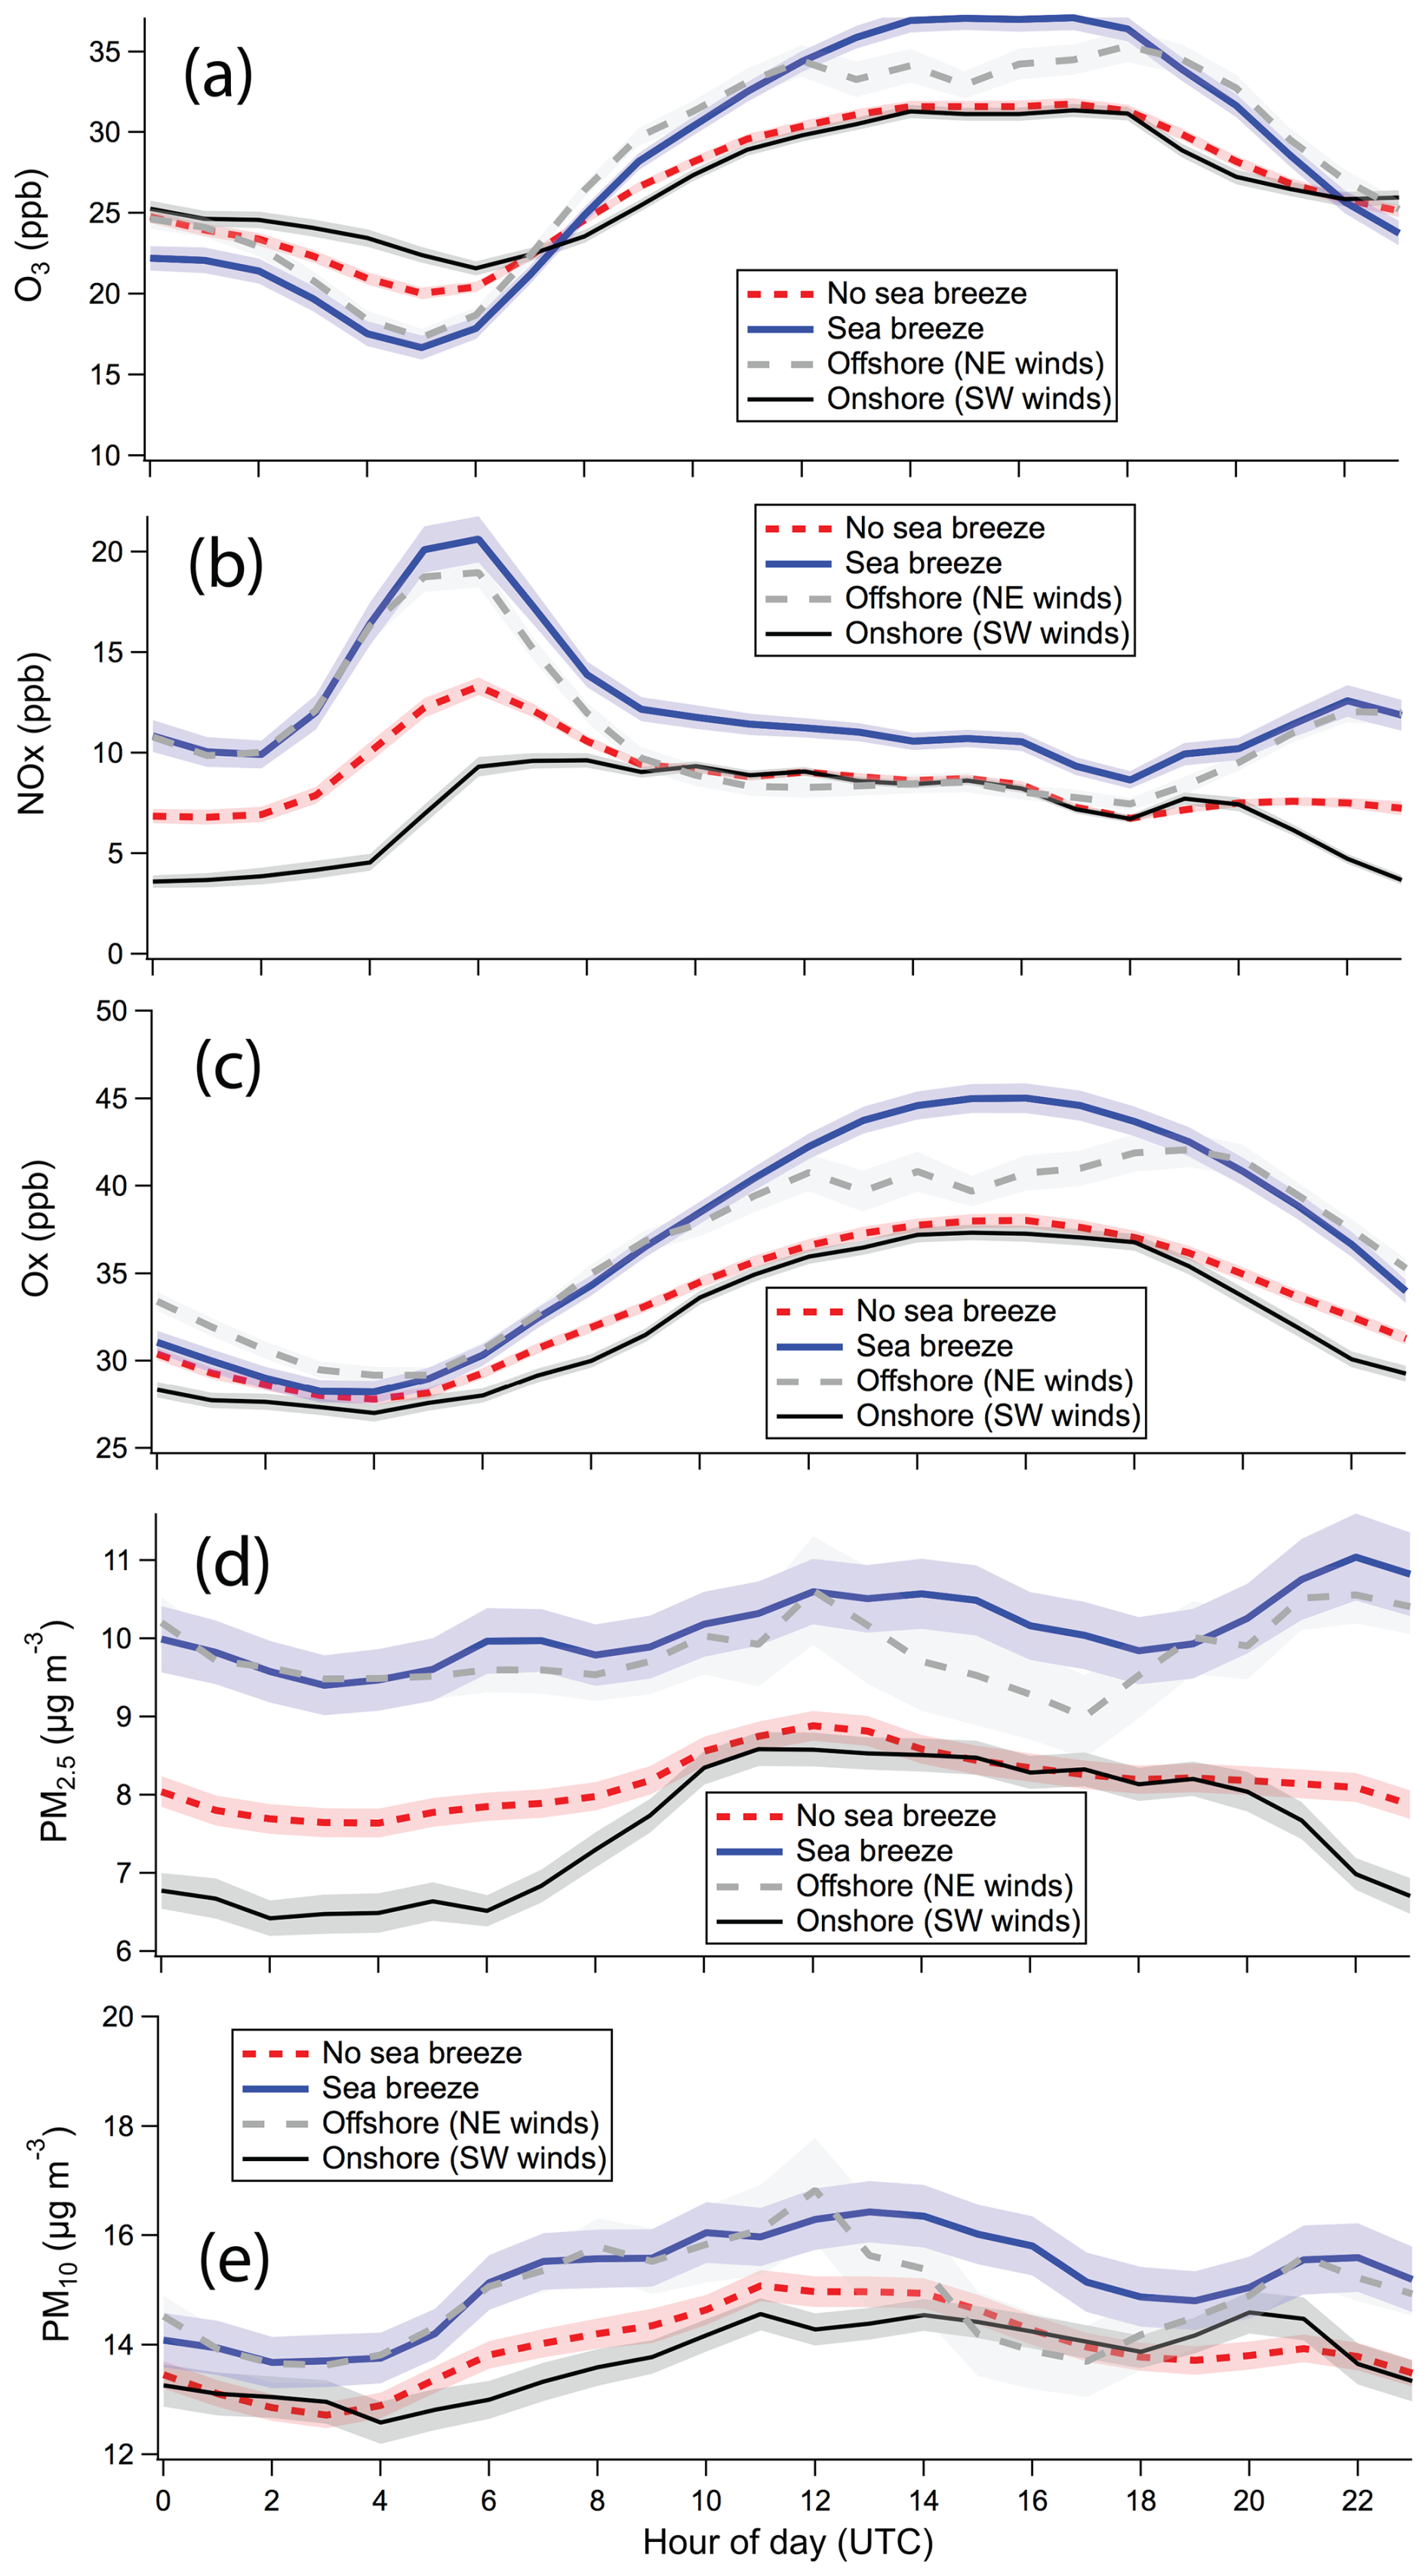
Figure 7Mean diurnals cycles of (a) O3; (b) NOx; (c) Ox; (d) PM2.5; (e) PM10 with and without sea breeze events in Plymouth City Centre during May, June, and July from 2014 to 2024. Diurnals during offshore wind flow (hourly wind direction from NE) and onshore wind flow (hourly wind direction from SW) are also shown. Shading corresponds to standard error.
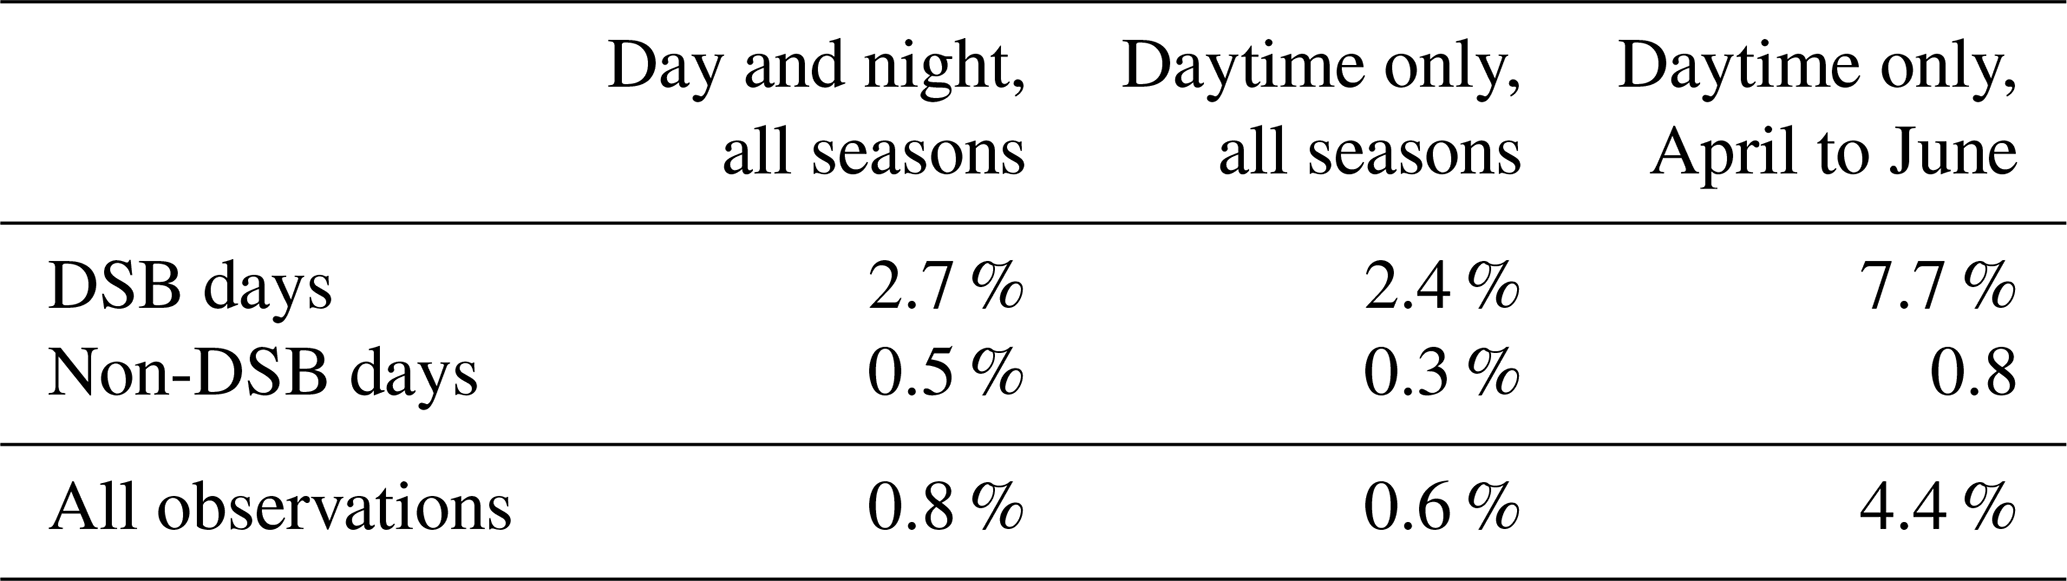
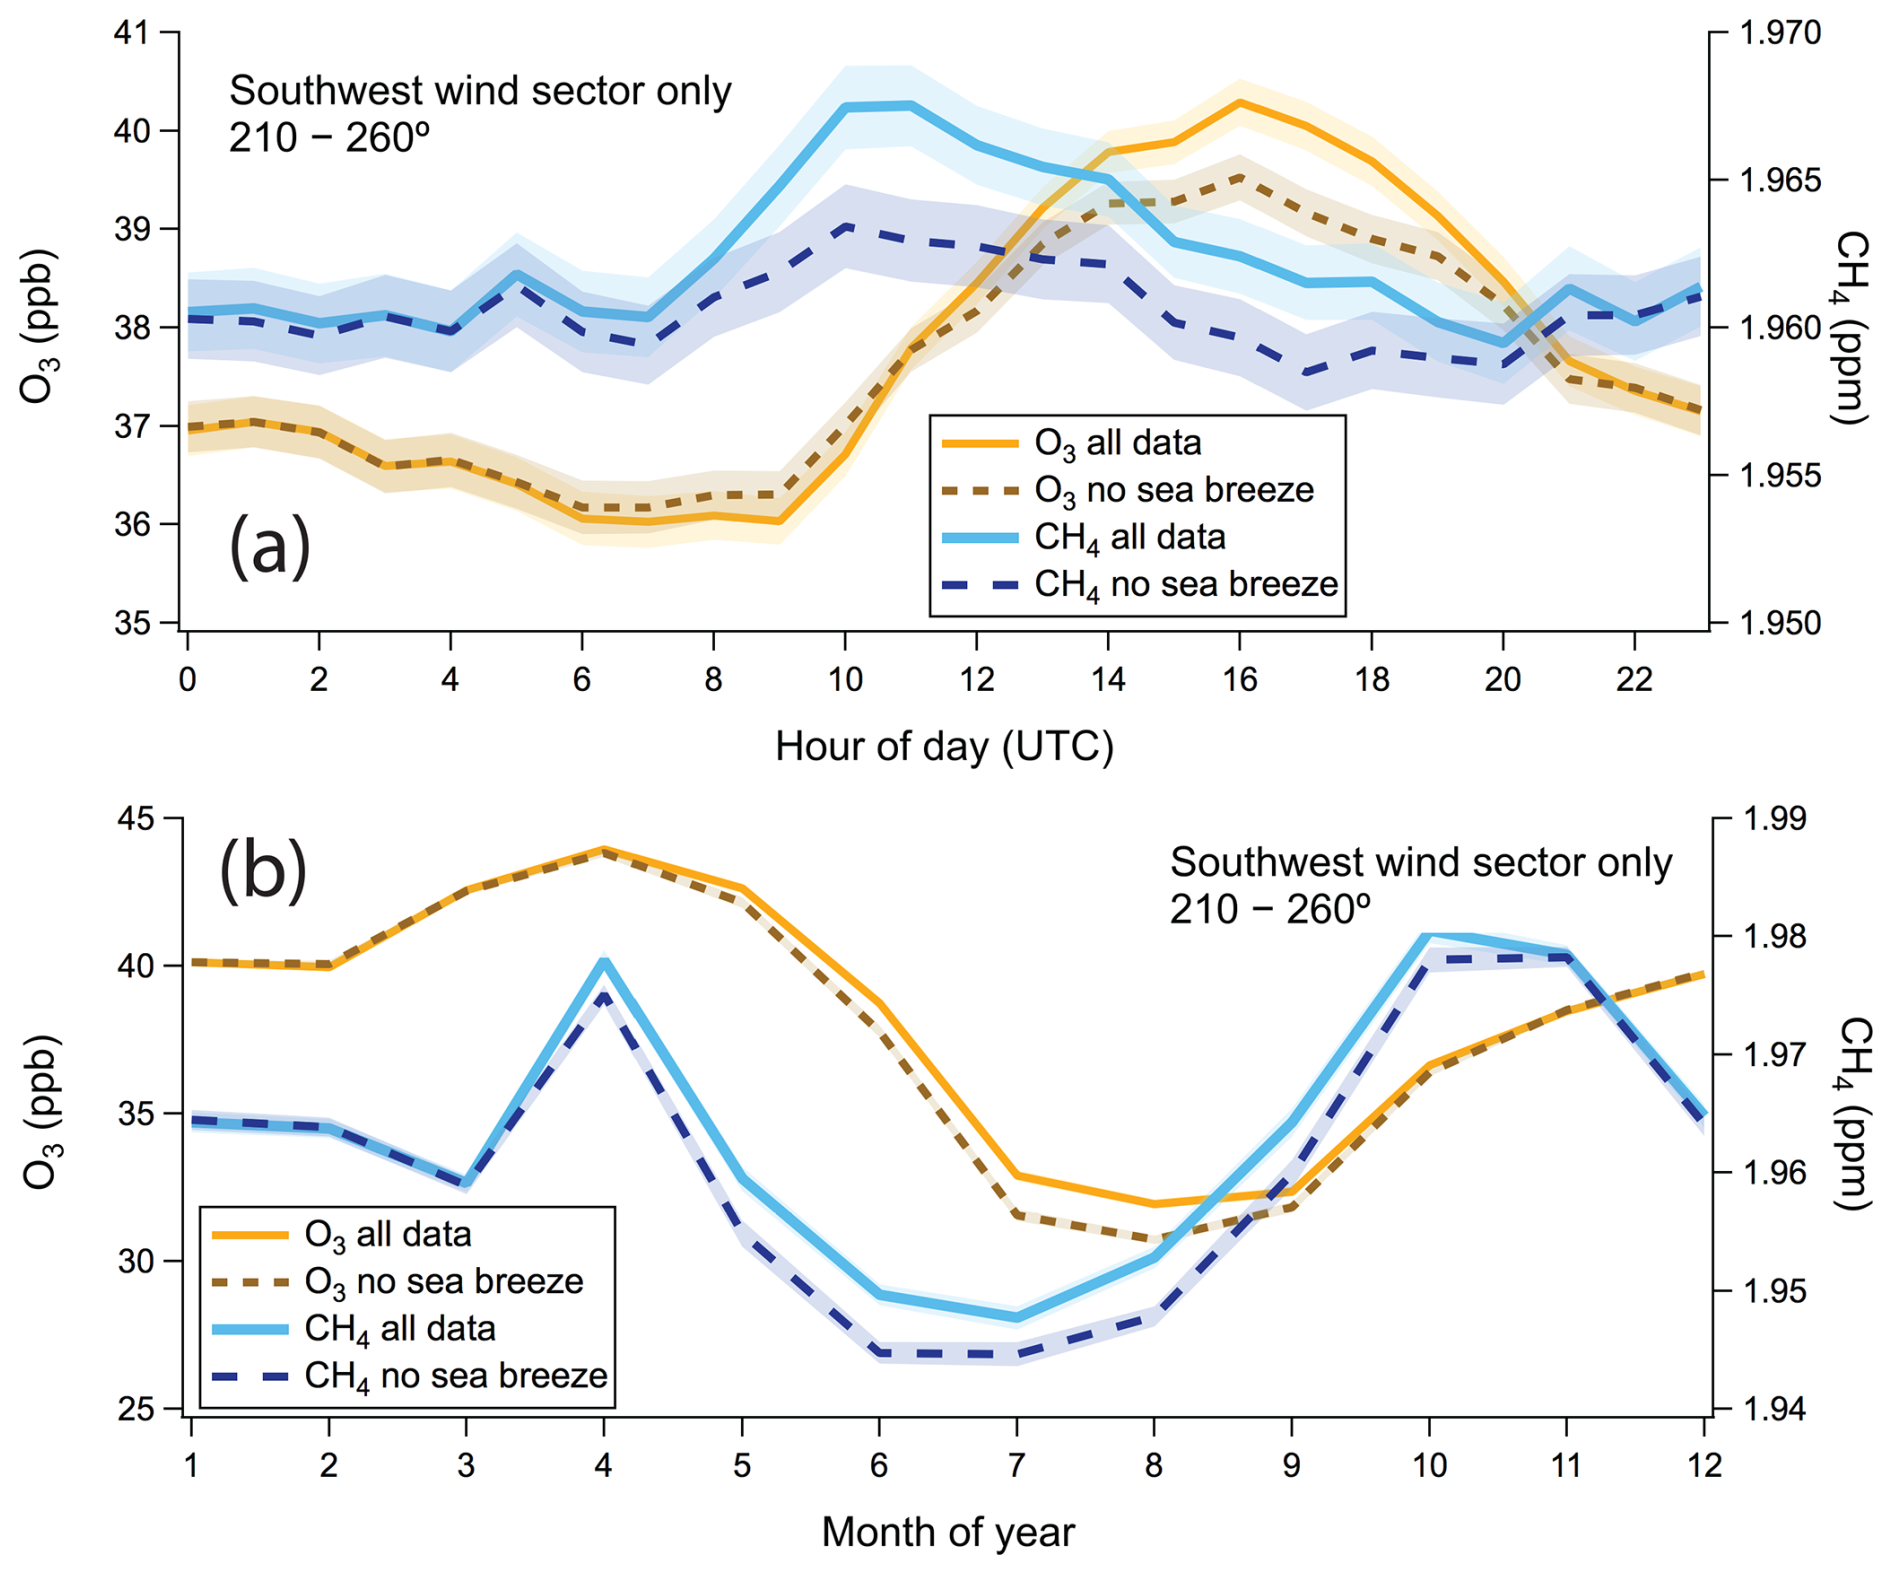
Figure 8(a) Mean diurnal cycles in O3 and CH4 when winds were from the southwest sector, including and excluding DSB events; (b) Seasonal cycles of O3 and CH4 mixing ratios when winds were from the southwest sector, including and excluding DSB events. Shading corresponds to standard error.
Similar to PPAO observations, the night-time concentrations of pollutants are fairly similar on average between DSB events and periods of offshore wind flow. During the day, all pollutant concentrations during DSB are higher than during periods of onshore and even offshore wind flow. This suggests a lack of dispersion of pollutants from the previous night over the sea, which then comes back over land during the daytime. In the city centre, the increases in NOx and aerosols at around 06:00 UTC and their decreases after 20:00 UTC were partly related to the local traffic.
We can evaluate the impact of DSB in terms of air quality regulation exceedance. At PPAO, out of the measured pollutants O3 is the parameter that exceeds regulation limits the most frequently. The European Union (EU, https://environment.ec.europa.eu/topics/air/air-quality/eu-air-quality-standards_en, last access: 27 July 2026) limit for O3 (eight hour mean) is 60 ppb. Considering all observations, the PPAO measurements exceed that limit 0.8 % of the time. When limiting the observations to daytime only during DSB events, the rates of exceedance across all seasons increases to 2.4 % due to episodes of very high O3. The highest exceedance was found in the daytime between April and June during DSB events (7.7 %), when the background O3 concentration is already elevated in this region and the DSB events occurring most frequently.
4.3 Monitoring of remote North Atlantic air
On the southwest coast of the UK, PPAO is exposed to prevailing SW winds from the North Atlantic and thus can intuitively be considered a remote monitoring site under the right conditions. However, the DSB events, which are often not well captured by airmass back trajectory modelling (Appendix A, Fig. A4), may result in local to regional scale recirculation that complicates this interpretation. In this section, we examine to what extent measurements within the southwest wind sector (210 to 260°) are impacted by DSB events.
The diurnal cycle of O3 and CH4 over land are widely reported. For O3, the daytime maximum is greater during DSB events than otherwise (Figs. 6 and 7). This is partly due to more photochemical production during the sunnier, warmer days that is characteristic of DSB (Figs. 2 and A2), and partly due to higher precursor concentrations accumulated as a result of DSB (Fig. 6). At night, O3 is continuously removed due to deposition to the sea surface. Focusing on observations when the wind is from the SW sector only, excluding DSB events results in a smaller diurnal range in O3 (Fig. 8a), which is likely more representative of O3 cycling in the marine atmosphere. As shown in Fig. A5, this reduction in the diurnal amplitude in O3 is largest in the warmer months.
In the case of CH4, fluxes over the ocean tend to be small and the chemical lifetime in the atmosphere is long, and thus we expect to see little diurnal variability for SW winds. The greater daytime CH4 increase in the presence of DSB is likely due to recirculation of previously land-influenced air mass. Excluding such events reduces the diurnal variability in CH4, with the largest effect again seen in the warmer months (Fig. A5).
The seasonal cycle of O3 in the Northeast Atlantic is primarily driven by a combination of precursor emissions, atmospheric transport, and photochemistry (Robson et al., 2020). Similarly, the seasonal cycle of CH4 is driven by a combination of CH4 emission, atmospheric transport, and loss to OH radical. Excluding DSB events modifies the seasonal cycles of O3 and CH4 when winds were from the southwest sector, namely by reducing their mean mixing ratios during the warmer months (Fig. 8b). We expect the long-term trends in these trace gases to be more representative of the remote North Atlantic once DSB events are removed.
In this work, we systematically identified 428 diurnal sea breeze (DSB) events from 10 years of observations from the Penlee Point Atmospheric Observatory on the northeast Atlantic. DSB occurred most frequently in spring and summer, when the sea was cool, wind speeds low and prevailingly from the northeast, and the solar irradiance strong. These events are not always well captured by operational numerical weather forecasts or airmass back trajectory modelling. The timing of the DSB events varied seasonally, with the switch from offshore to onshore winds in the morning relatively abrupt (mostly between 08:00 to 10:00 UTC) and the reverse from onshore to offshore winds in the evening more gradual over several hours. Surface concentrations of gas and particle phase pollutants were all higher during sea breeze events than on days with winds from the North Atlantic, increasing the rate of air quality regulation exceedance especially for O3. Some of the highest O3 levels were observed on days with sea breeze in this environment, likely because of inefficient pollutants dispersion at night over the sea and strong photochemistry. SO2 was also substantially elevated during DSB events, likely related to nearby shipping activities, and probably contributes to new particle formation and a pronounced diurnal cycle in aerosol number concentration. As DSB occur mostly during “fair weather” conditions, the greater level of pollution may be of concern for beach goers and for people who spend more time outdoors. If so, this phenomenon may negate some of the proposed health benefits of coastal proximity (Wheeler et al., 2012; White et al., 2013). Finally, the sea breeze effect needs to be accounted for when considering coastal observations to be representative of remote marine atmosphere. Excluding sea breeze events reduces the diurnal amplitudes in O3 and CH4 at PPAO and also modifies their seasonal variability when winds were from the southwest sector. Looking forward, numerical modelling will be best suited for more fully separating the effects of transport and accumulation vs. chemistry on the cycling of reactive gases such as O3. Combining high resolution ground-based measurements with vertical profile observations of meteorological and chemical parameters and satellite snapshots will provide further insight into this coastal, three-dimensional phenomenon.
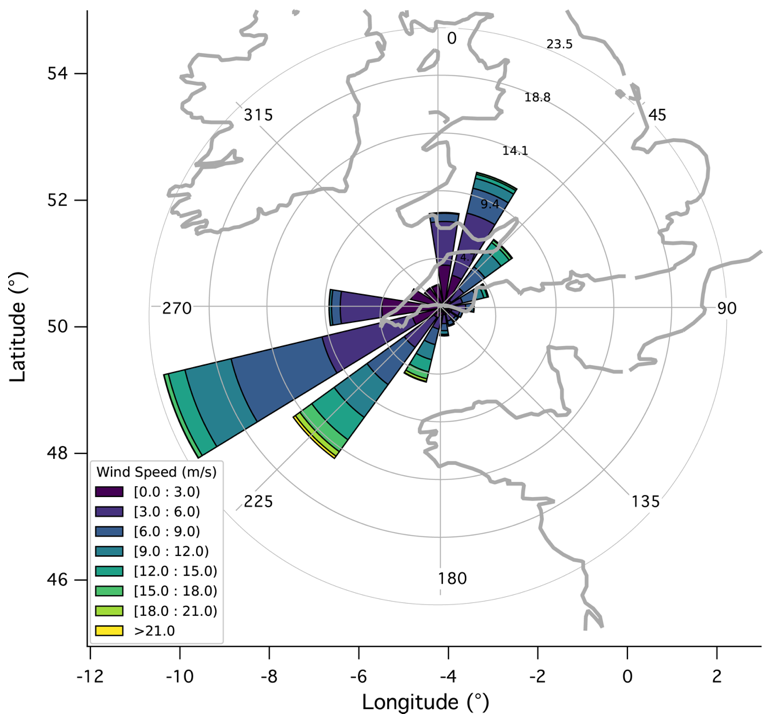
Figure A1Map of the study region, with PPAO located at the centre of the wind rose. The wind rose, based on 10 years of observations, shows that the predominant wind direction here is from the southwest (210–260° referred to “onshore”), followed by northeast (330–60° referred to as “offshore”).
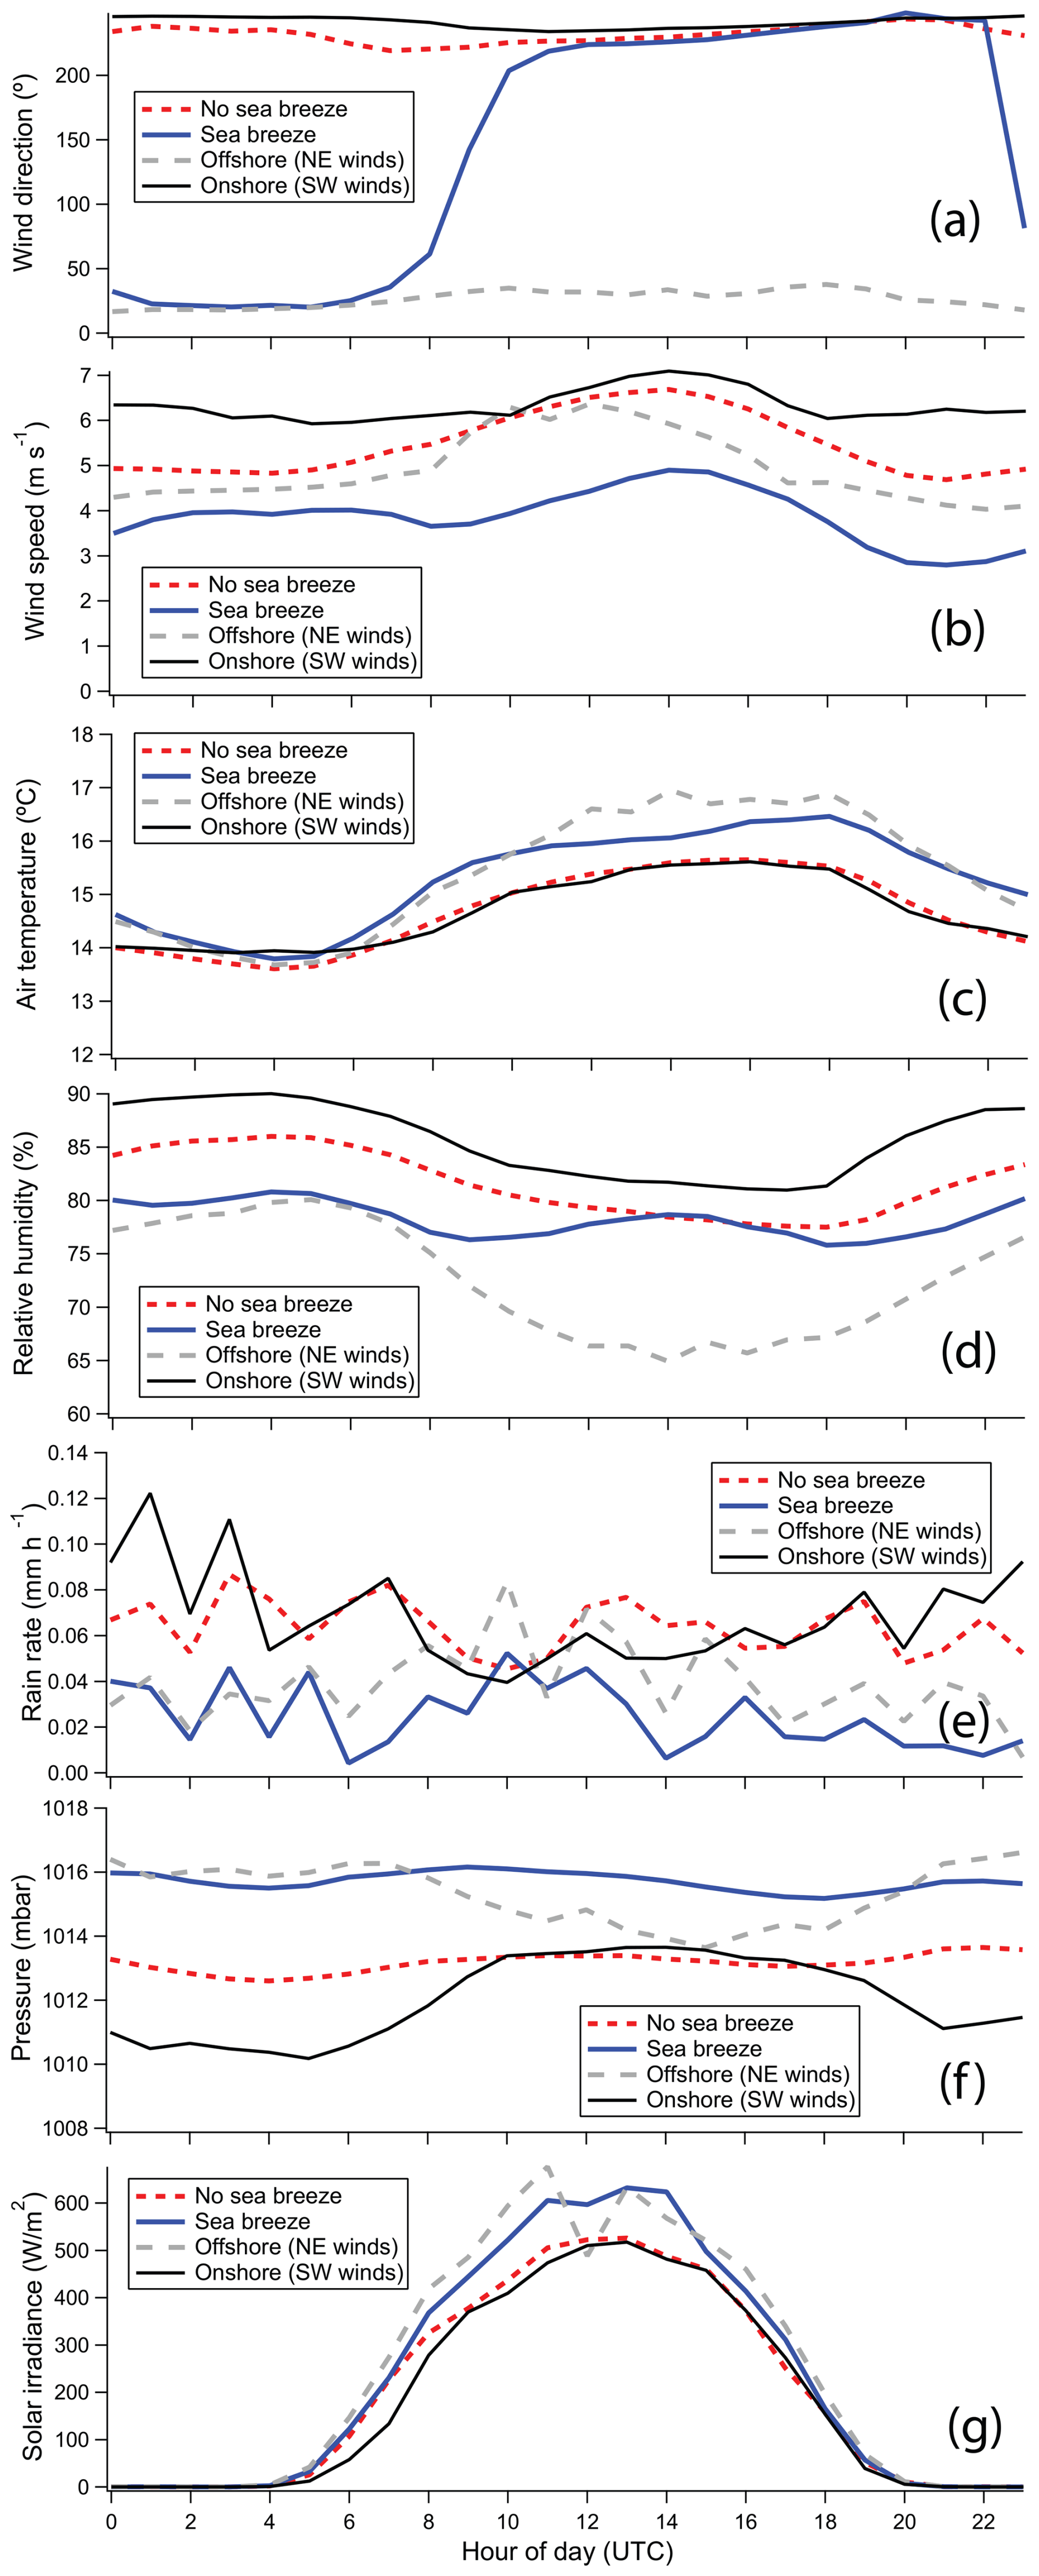
Figure A2Mean meteorological conditions during sea breeze events vs. non-sea breeze events during the months of May to July. All data were from PPAO except solar irradiance, which was measured from the PML rooftop. Mean diurnal cycles during offshore (northeasterly) wind flow and onshore (southwesterly) wind flow are also shown.
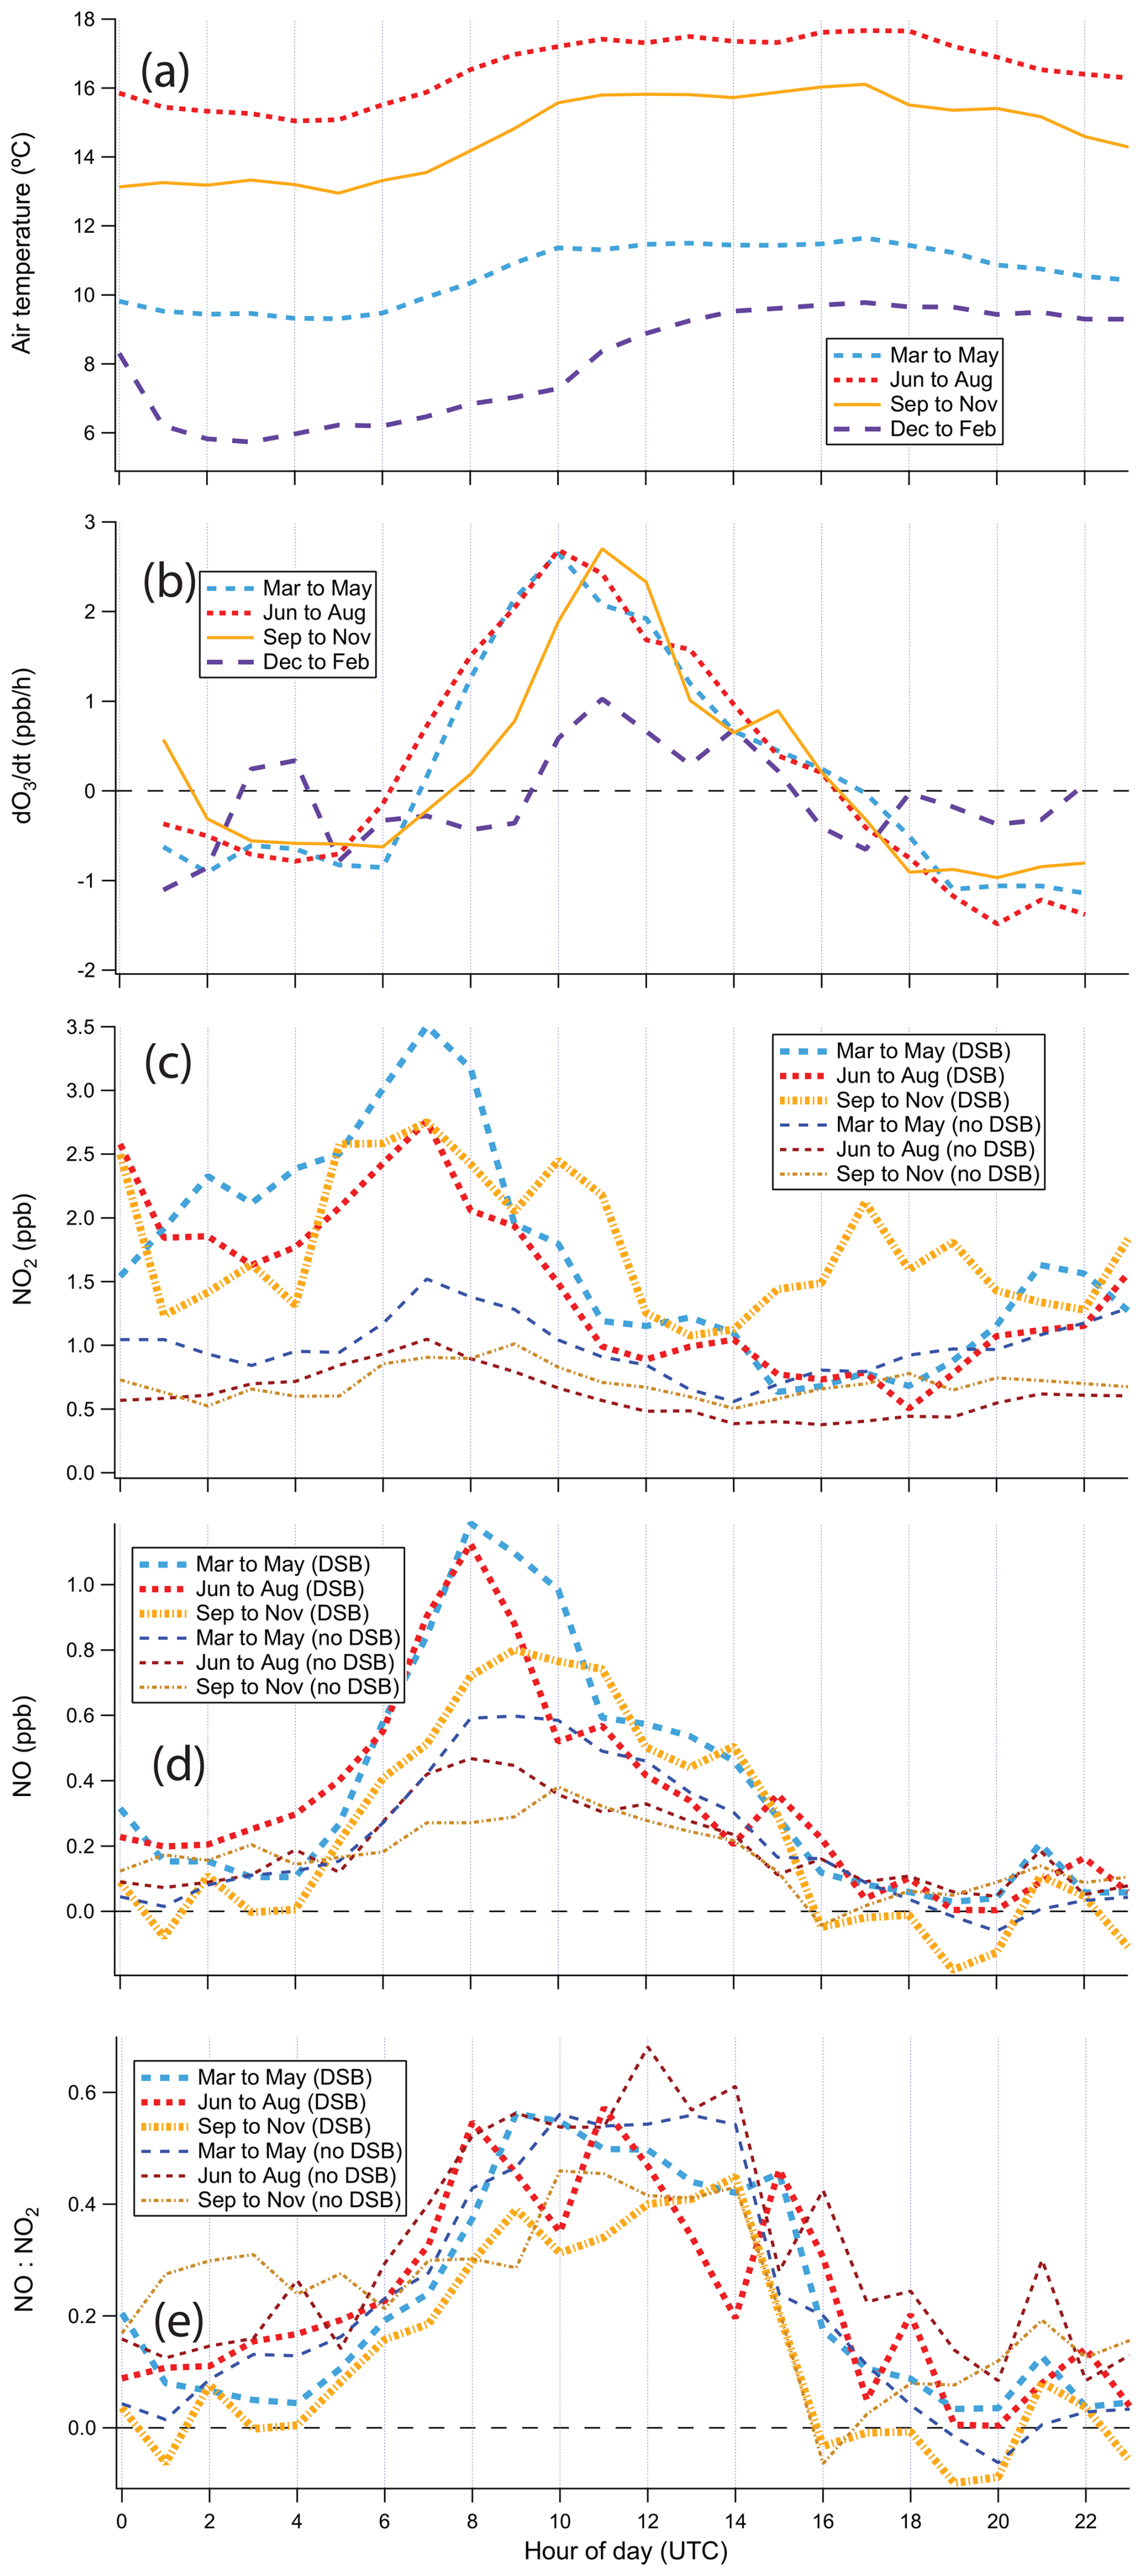
Figure A3Diurnal cycles of (a) air temperature during DSB days divided by different seasons; (b) net rate of change in O3 during DSB and non-DSB days; (c) NO2 during DSB and non-DSB days; (d) NO during DSB and non-DSB days; (e) NO:NO2 ratio during DSB and non-DSB days. Note that the O3 data spans the entire 10 years, while the NO2 and NO data are from 2021 to 2024.
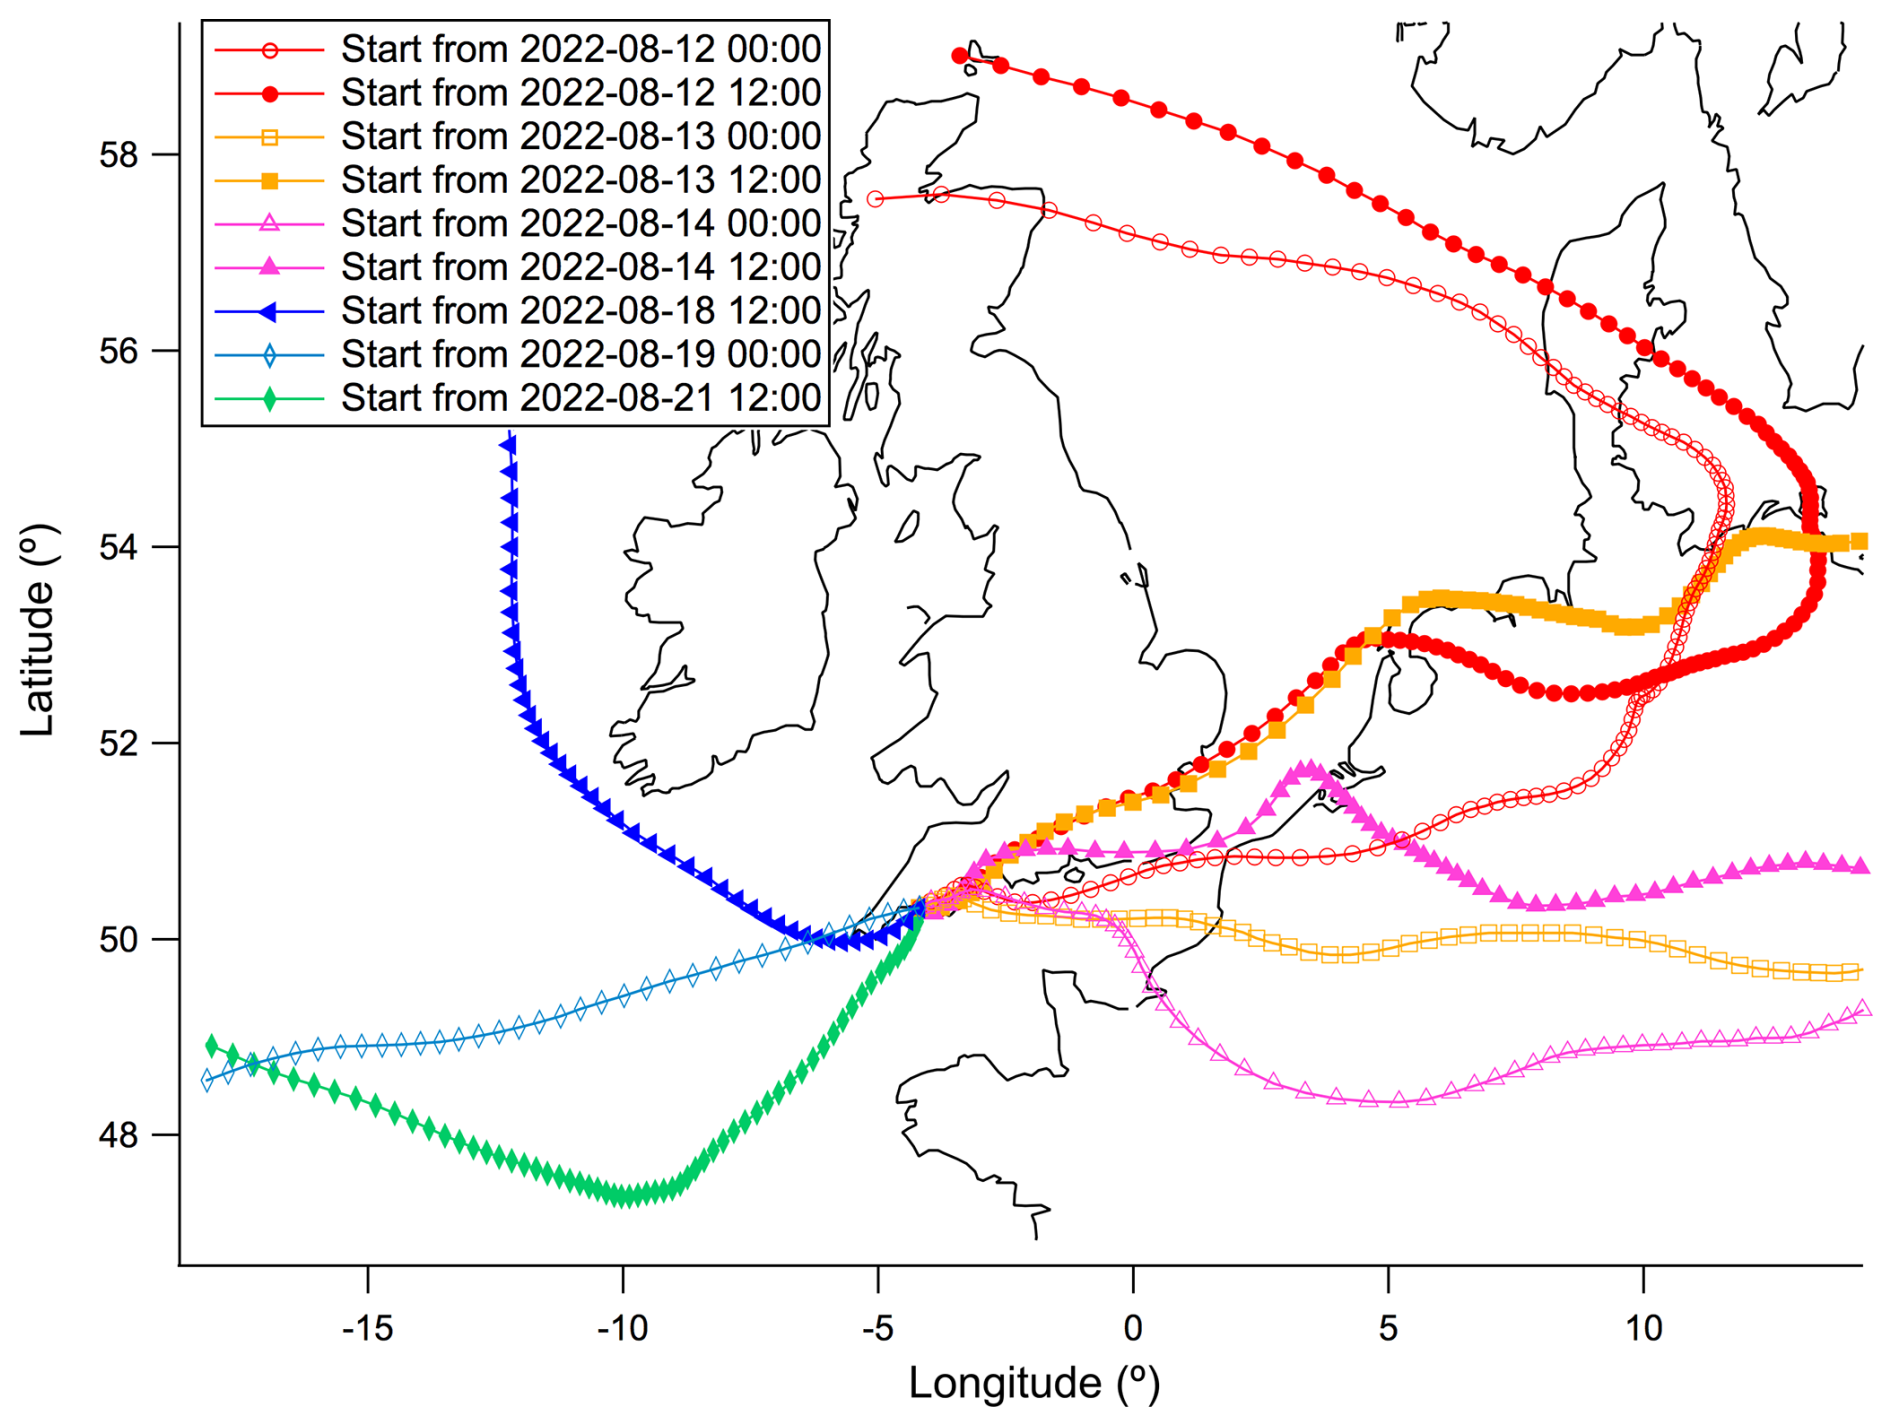
Figure A4Examples of HYSPLIT back trajectories for selected days in August 2022. Even using the high resolution GFS meteorological data (0.25° resolution), the trajectories do not well capture the sea breeze events. Trajectories started between 12 and 14 August 2022 only showed the prevailing (night time) northeasterly winds, and did not show the daytime switch to onshore flow. Trajectories started between 18 and 19 August 2022 showed winds mostly from the North Atlantic and did not capture the briefly periods when the winds switched to offshore at night/predawn.
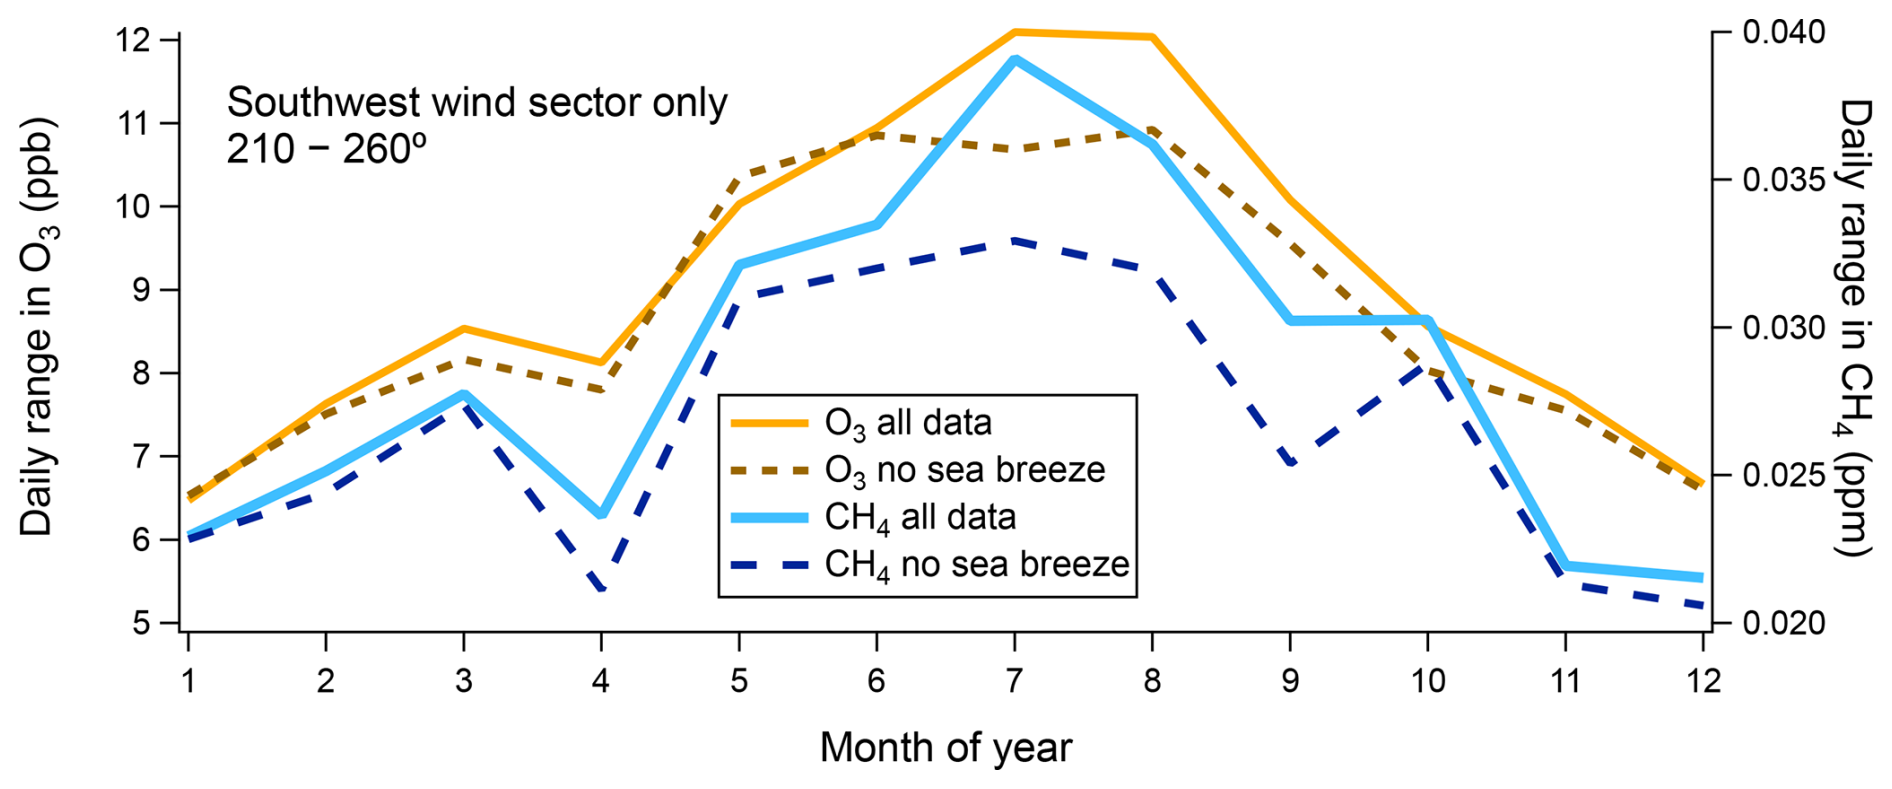
Figure A5Daily range in O3 and CH4 averaged over different months of the year, including and excluding DSB events. Removal of sea breeze events reduces the diurnal range in O3 and CH4, with the effect most pronounced in the warmer months.
PPAO data are archived and publicly available at CEDA (https://catalogue.ceda.ac.uk/uuid/8f1ff8ea77534e08b03983685990a9b0, Plymouth Marine Laboratory and Yang, 2017). Defra air quality data can be found at https://uk-air.defra.gov.uk/data/ (last access: 27 July 2026).
MY, TB, FH, JP, and TS led the observations at PPAO. IB and KR supported the aerosol and NOx measurements at PPAO, respectively. All co-authors contributed to the writing of the manuscript.
The contact author has declared that none of the authors has any competing interests.
Publisher's note: Copernicus Publications remains neutral with regard to jurisdictional claims made in the text, published maps, institutional affiliations, or any other geographical representation in this paper. The authors bear the ultimate responsibility for providing appropriate place names. Views expressed in the text are those of the authors and do not necessarily reflect the views of the publisher.
Trinity House owns the Penlee Point site and has kindly agreed to rent the building to PML so that instrumentation can be protected from the elements. We are able to access the site thanks to the cooperation of Mount Edgcumbe Estate. Thanks to J. Bidlot (ECMWF) for helpful discussions about the ECMWF wind data. We acknowledge Defra and https://uk-air.defra.gov.uk/ (last access: 27 July 2026) for the AURN surface aerosol measurements. The NOx measurements at Penlee Point were made possible thanks to the Atmospheric Measurement and Observation Facility (AMOF_20240322101807). This is contribution from the Penlee Point Atmospheric Observatory. The authors gratefully acknowledge the NOAA Air Resources Laboratory (ARL) for the provision of 435 the HYSPLIT transport and dispersion model and/or READY website (https://www.ready.noaa.gov, last access: 27 July 2026) used in this publication.
This research has been supported by the Natural Environment Research Council (grant nos. NE/W005050/1 and NE/Y005589/1).
This paper was edited by Geraint Vaughan and reviewed by two anonymous referees.
Archibald, A. T., Sinha, B., Russo, M. R., Matthews, E., Squires, F. A., Abraham, N. L., Bauguitte, S. J.-B., Bannan, T. J., Bell, T. G., Berry, D., Carpenter, L. J., Coe, H., Coward, A., Edwards, P., Feltham, D., Heard, D., Hopkins, J., Keeble, J., Kent, E. C., King, B. A., Lawrence, I. R., Lee, J., Macintosh, C. R., Megann, A., Moat, B. I., Read, K., Reed, C., Roberts, M. J., Schiemann, R., Schroeder, D., Smyth, T. J., Temple, L., Thamban, N., Whalley, L., Williams, S., Wu, H., and Yang, M.: Data supporting the North Atlantic Climate System Integrated Study (ACSIS) programme, including atmospheric composition; oceanographic and sea-ice observations (2016–2022); and output from ocean, atmosphere, land, and sea-ice models (1950–2050), Earth Syst. Sci. Data, 17, 135–164, https://doi.org/10.5194/essd-17-135-2025, 2025.
Banta, R. M., Senff, C. J., Nielsen-Gammon, J., Darby, L. S., Ryerson, T. B., Alvarez, R. J., Sandberg, S. P., Williams, E. J., and Trainer, M.: A bad air day in Houston, B. Am. Meteorol. Soc., 86, 657–670, 2005.
Berthou, S., Renshaw, R., Smyth, T., Tinker, J., Grist, J. P., Wihsgott, J. U., Jones, S., Inall, M., Nolan, G., Berx, B., and Arnold, A.: Exceptional atmospheric conditions in June 2023 generated a northwest European marine heatwave which contributed to breaking land temperature records, Commun. Earth Environ., 5, 287, https://doi.org/10.1038/s43247-024-01413-8, 2024.
Brown, A., Vincent, C., and Short, E.: Identifying sea breezes from atmospheric model output (sea_breeze v1.1), Geosci. Model Dev., 19, 933–953, https://doi.org/10.5194/gmd-19-933-2026, 2026.
Cosby, A. G., Lebakula, V., Smith, C. N., Wanik, D. W., Bergene, K., Rose, A. N., Swanson, D., and Bloom, D. E.: Accelerating growth of human coastal populations at the global and continent levels: 2000–2018, Sci. Rep., 14, 22489, https://doi.org/10.1038/s41598-024-73287-x, 2024.
Edson, J. B., Jampana, V., Weller, R. A., Bigorre, S. P., Plueddemann, A. J., Fairall, C. W., Miller, S. D., Mahrt, L., Vickers, D., and Hersbach, H.: On the exchange of momentum over the open ocean, J. Phys. Oceanogr., 43, 1589–1610, 2013.
Geddes, J. A., Wang, B., and Li, D.: Ozone and nitrogen dioxide pollution in a coastal urban environment: The role of sea breezes, and implications of their representation for remote sensing of local air quality, J. Geophys. Res.-Atmos., 126, e2021JD035314, https://doi.org/10.1029/2021JD035314, 2021.
Junnaedhi, I. D. G. A., Inagaki, A., Ferdiansyah, M. R., and Kanda, M.: Seasonal sea breeze variation analysis based on multi-year near-surface observations in Jakarta, Indonesia, Int. J. Climatol., 43, 5177–5195, 2023.
KiranKumar, N. V. P., Jagadeesh, K., Niranjan, K., and Rajeev, K.: Seasonal variations of sea breeze and its effect on the spectral behaviour of surface layer winds in the coastal zone near Visakhapatnam, India, J. Atmos. Sol.-Terr. Phys., 186, 1–7, https://doi.org/10.1016/j.jastp.2019.01.013, 2019.
Loughner, C. P., Tzortziou, M., Follette-Cook, M., Pickering, K. E., Goldberg, D., and Satam, C.: Impact of bay-breeze circulations on surface air quality and boundary layer export, J. Appl. Meteorol. Climatol., 53, 1697–1713, https://doi.org/10.1175/JAMC-D-13-0323.1, 2014.
Ma, Y., Chen, D., Fu, X., Shang, F., Guo, X., Lang, J., and Zhou, Y.: Impact of sea breeze on the transport of ship emissions: A comprehensive study in the Bohai Rim Region, China, Atmosphere, 13, 1094, https://doi.org/10.3390/atmos13071094, 2022.
Mao, J., Zhang, Y., Yu, F., Nair, A. A., Yu, Q., Wang, L., Ma, W., and Chen, L.: On the ship particle number emission index: Size-resolved microphysics and key controlling parameters, J. Geophys. Res.-Atmos., 126, e2020JD034427, https://doi.org/10.1029/2020JD034427, 2021.
Martins, D. K., Stauffer, R. M., Thompson, A. M., Knepp, T. N., and Pippin, M.: Surface ozone at a coastal suburban site in 2009 and 2010: Relationships to chemical and meteorological processes, J. Geophys. Res., 117, D05306, https://doi.org/10.1029/2011JD016828, 2012.
McFiggans, G., Bale, C. S. E., Ball, S. M., Beames, J. M., Bloss, W. J., Carpenter, L. J., Dorsey, J., Dunk, R., Flynn, M. J., Furneaux, K. L., Gallagher, M. W., Heard, D. E., Hollingsworth, A. M., Hornsby, K., Ingham, T., Jones, C. E., Jones, R. L., Kramer, L. J., Langridge, J. M., Leblanc, C., LeCrane, J.-P., Lee, J. D., Leigh, R. J., Longley, I., Mahajan, A. S., Monks, P. S., Oetjen, H., Orr-Ewing, A. J., Plane, J. M. C., Potin, P., Shillings, A. J. L., Thomas, F., von Glasow, R., Wada, R., Whalley, L. K., and Whitehead, J. D.: Iodine-mediated coastal particle formation: an overview of the Reactive Halogens in the Marine Boundary Layer (RHaMBLe) Roscoff coastal study, Atmos. Chem. Phys., 10, 2975–2999, https://doi.org/10.5194/acp-10-2975-2010, 2010.
Meng, L., Yang, E., Liu, L., Wang, W., Yang, J., and Qu, P.: Impacts of sea land breeze on the fog and PM2.5 concentration in Tianjin, China, Aerosol Air Qual. Res., 24, 230279, https://doi.org/10.4209/aaqr.230279, 2024.
Miller, S. T. K., Keim, B. D., Talbot, R. W., and Mao, H.: Sea breeze: Structure, forecasting, and impacts, Rev. Geophys., 41, 1011, https://doi.org/10.1029/2003RG000124, 2003.
Monks, P. S., Archibald, A. T., Colette, A., Cooper, O., Coyle, M., Derwent, R., Fowler, D., Granier, C., Law, K. S., Mills, G. E., Stevenson, D. S., Tarasova, O., Thouret, V., von Schneidemesser, E., Sommariva, R., Wild, O., and Williams, M. L.: Tropospheric ozone and its precursors from the urban to the global scale from air quality to short-lived climate forcer, Atmos. Chem. Phys., 15, 8889–8973, https://doi.org/10.5194/acp-15-8889-2015, 2015.
Oh, I.-B., Kim, Y.-K., Lee, H.-W., and Kim, C.-H.: An observational and numerical study of the effects of the late sea breeze on ozone distributions in the Busan metropolitan area, Korea, Atmos. Environ., 40, 1284–1298, 2006.
Plymouth Marine Laboratory and Yang, M.: Penlee Point Atmospheric Observatory: Meteorological and chemical observations 2014–present, Centre for Environmental Data Analysis [data set], https://catalogue.ceda.ac.uk/uuid/8f1ff8ea77534e08b03983685990a9b0 (last access: 27 July 2026), 2017.
Reddy, T. R., Mehta, S. K., Ananthavel, A., Ali, S., Annamalai, V., and Rao, D. N.: Seasonal characteristics of sea breeze and thermal internal boundary layer over Indian east coast region, Meteorol. Atmos. Phys., 133, 217–232, 2021.
Robson, J., Aksenov, Y., Bracegirdle, T. J., Dimdore-Miles, O., Griffiths, P. T., Grosvenor, D. P., Hodson, D. L. R., Keeble, J., MacIntosh, C., Megann, A., Osprey, S., Povey, A. C., Schröder, D., Yang, M., Archibald, A. T., Carslaw, K. S., Gray, L., Jones, C., Kerridge, B., Knappett, D., Kuhlbrodt, T., Russo, M., Sellar, A., Siddans, R., Sinha, B., Sutton, R., Walton, J., and Wilcox, L. J.: The evaluation of the North Atlantic climate system in UKESM1 historical simulations for CMIP6, J. Adv. Model. Earth Syst., 12, e2020MS002126, https://doi.org/10.1029/2020MS002126, 2020.
Rolph, G., Stein, A., and Stunder, B.: Real-time Environmental Applications and Display sYstem: READY, Environ. Modell. Softw., 95, 210–228, https://doi.org/10.1016/j.envsoft.2017.06.025, 2017.
Stein, A. F., Draxler, R. R, Rolph, G. D., Stunder, B. J. B., Cohen, M. D., and Ngan, F.: NOAA's HYSPLIT atmospheric transport and dispersion modeling system, B. Am. Meteorol. Soc., 96, 2059–2077, https://doi.org/10.1175/BAMS-D-14-00110.1, 2015.
Wang, B., Geddes, J. A., Adams, T. J., Lind, E. S., McDonald, B. C., He, J., Harkins, C., Li, D., and Pfister, G. G.: Implications of sea breezes on air quality monitoring in a coastal urban environment: Evidence from high-resolution modeling of NO2 and O3, J. Geophys. Res.-Atmos., 128, e2022JD037860, https://doi.org/10.1029/2022JD037860, 2023.
Wheeler, B. W., White, M., Stahl-Timmins, W., and Depledge, M. H.: Does living by the coast improve health and wellbeing?, Health Place, 18, 1198–1201, 2012.
White, M. P., Alcock, I., Wheeler, B. W., and Depledge, M. H.: Coastal proximity, health and well-being: Results from a longitudinal panel survey, Health Place, 23, 97–103, 2013.
Yang, M., Bell, T. G., Hopkins, F. E., Kitidis, V., Cazenave, P. W., Nightingale, P. D., Yelland, M. J., Pascal, R. W., Prytherch, J., Brooks, I. M., and Smyth, T. J.: Air–sea fluxes of CO2 and CH4 from the Penlee Point Atmospheric Observatory on the south-west coast of the UK, Atmos. Chem. Phys., 16, 5745–5761, https://doi.org/10.5194/acp-16-5745-2016, 2016a.
Yang, M., Bell, T. G., Hopkins, F. E., and Smyth, T. J.: Attribution of atmospheric sulfur dioxide over the English Channel to dimethyl sulfide and changing ship emissions, Atmos. Chem. Phys., 16, 4771–4783, https://doi.org/10.5194/acp-16-4771-2016, 2016b.
Yang, M., Bell, T. G., Brown, I. J., Fishwick, J. R., Kitidis, V., Nightingale, P. D., Rees, A. P., and Smyth, T. J.: Insights from year-long measurements of air–water CH4 and CO2 exchange in a coastal environment, Biogeosciences, 16, 961–978, https://doi.org/10.5194/bg-16-961-2019, 2019a.
Yang, M., Norris, S. J., Bell, T. G., and Brooks, I. M.: Sea spray fluxes from the southwest coast of the United Kingdom – dependence on wind speed and wave height, Atmos. Chem. Phys., 19, 15271–15284, https://doi.org/10.5194/acp-19-15271-2019, 2019b.
- Abstract
- Introduction
- Experimental
- Physical characteristics and drivers of diurnal sea breeze events
- Impact of sea breeze on coastal air quality and monitoring of remote marine air
- Conclusions
- Appendix A
- Data availability
- Author contributions
- Competing interests
- Disclaimer
- Acknowledgements
- Financial support
- Review statement
- References
- Abstract
- Introduction
- Experimental
- Physical characteristics and drivers of diurnal sea breeze events
- Impact of sea breeze on coastal air quality and monitoring of remote marine air
- Conclusions
- Appendix A
- Data availability
- Author contributions
- Competing interests
- Disclaimer
- Acknowledgements
- Financial support
- Review statement
- References