
the Creative Commons Attribution 4.0 License.
the Creative Commons Attribution 4.0 License.
 | 31 Jul 2026
Investigating the development of persistent contrails in ice supersaturated regions with cloudy backgrounds using ICON-LEM
Sina Mehrdad
Johannes Quaas
Persistent contrails are a major contributor to aviation-induced non-CO2 climate forcing, yet the extent to which their development depends on background cloud properties remains unclear. In this study, we aim to investigate persistent contrail development in various cloudy backgrounds. We use the high-resolution ICON-LEM model with a horizontal resolution of 154 m. Eight distinct ice-cloud scenarios are simulated as control runs, each initialized with realistic meteorological forcing. For each control case, a corresponding perturbation run is conducted by introducing an identical contrail, allowing us to assess its evolution within the same cloudy, ice-supersaturated environment. We find that persistent contrails embedded within natural cirrus clouds not only survive but can also alter the humidity field, cloud microphysics, and potentially the radiative properties of the host cloud. The evolution of persistent contrails is highly sensitive to the microphysical and thermodynamic properties of the background ice-supersaturated regions, particularly the combination of supersaturated layer thickness below flight level and the temporal availability of excess water vapor, as the former alone is not sufficient to sustain contrail development. Although vertical growth through fall streaks is commonly expected, we suggest that in regions of high ice supersaturation and low atmospheric stability, contrails may also expand above the flight height due to latent heat release from deposition. Our findings indicate that threshold criteria alone are insufficient to predict the growth and climate relevance of persistent contrails, because time-varying background cloud and humidity conditions strongly influence how far contrails develop.
- Article
(21308 KB) - Full-text XML
- BibTeX
- EndNote


Although near-global air traffic experienced an unprecedented reduction during the COVID-19 pandemic (Quaas et al., 2021), it has since resumed its rise. In 2023, air transportation nearly returned to its pre-pandemic levels, and by the first quarter of 2024, the aviation industry surpassed pre-pandemic traffic for the first time (International Air Transport Association, 2023, 2024). The aviation industry has grown significantly over the past decades, contributing not only to CO2 emissions but also to various non-CO2 effects that impact the Earth's climate. These non-CO2 impacts, including emissions of nitrogen oxides (NOx), water vapor, soot, sulfate aerosols, and the formation of contrails, account for approximately two-thirds of the net radiative forcing (RF) attributed to aviation (Lee et al., 2021). Among these, contrail cirrus, which includes both linear contrails and the cloudiness that develops from them, represents the largest positive net effective radiative forcing (ERF) term, exceeding the contributions from CO2 and NOx emissions. Despite the substantial role of contrail cirrus in aviation-induced climate change, considerable uncertainty persists in accurately quantifying its overall impact.
Contrails, or condensation trails, are ice-laden clouds formed by aircraft exhaust that have been observed to form in the upper troposphere, leading to measurable changes in atmospheric conditions. Exhaust contrails form during the jet phase, the first few seconds after emission, due to engine emissions of water vapor and soot particles, which result from the incomplete combustion of hydrocarbon fuels and act as cloud condensation nuclei (CCN) (Petzold et al., 1997; Heymsfield et al., 2010; Bond et al., 2013). For visible contrails to form – characterized by their distinct white cloud-like appearance – the aircraft exhaust plume must reach supersaturation with respect to water as it mixes with the surrounding ambient air (Schumann, 1996). Once this condition is met, extremely small supercooled water droplets rapidly condense onto soot particles and freeze almost instantly due to the low temperatures at cruising altitudes (Kärcher and Yu, 2009; Wong and Miake-Lye, 2010).
Contrail life can be divided into three main phases. First is the jet phase, lasting just a few seconds, where initial ice crystals form, heavily influenced by engine emissions and ambient temperature (Kärcher et al., 2015). This is followed by the vortex phase, lasting a few minutes and characterized by significant ice crystal loss, influenced mainly by the number of crystals formed during the jet phase and the surrounding relative humidity (Unterstrasser, 2016). Finally, after a few minutes, once the vortices dissipate, the surviving ice crystals enter the dispersion phase, during which the contrail becomes more influenced by and fully integrated into the surrounding ambient air.
The dispersion phase of contrails is challenging to predict, as it is influenced by a broader range of atmospheric factors than the jet and vortex phases (Burkhardt and Kärcher, 2011; Schumann and Heymsfield, 2017). In this stage, contrail spreading, mixing, survival, and total extinction are governed by ambient atmospheric processes, from small-scale diffusion to mesoscale wind shear and larger-scale dynamics like synoptic updrafts. These interactions create complex and often unpredictable patterns over time. Initially, contrail spreading is influenced by diffusion and turbulence intensity, but over time, the combined effects of wind shear and sedimentation become more dominant (Unterstrasser et al., 2017). The process becomes increasingly complex when ice sedimentation becomes significant, as contrail particles descend into air layers with varying humidity levels. Even within saturated layers, differences in the thickness of the supersaturated layer can directly affect the vertical development of contrails (Bock and Burkhardt, 2016a).
The terminal fall speed of particles is influenced by their size and shape (Heymsfield and Wright, 2014). Larger particles tend to fall faster and separate from smaller ones, causing the upper part of the contrail to thin while still containing many small particles. Smaller ice particles may sublimate more quickly than larger ones, under the influence of the Kelvin effect, leading to in situ particle losses (Lewellen, 2014). When larger particles fall into more humid air, they grow and fall even more quickly, forming fall streaks that can eventually lead to precipitation (Atlas et al., 2006; Unterstrasser et al., 2012). As individual contrails evolve, they expand and mix with natural cirrus clouds and other contrails (Schumann and Wendling, 1990). In merged contrails, competition among ice crystals for the available humidity limits their growth, yielding less total extinction than in individual contrails (Singh et al., 2024). This competition means that the climate impact of contrails does not increase linearly with traffic density (Unterstrasser and Sölch, 2012). “Contrail outbreaks”, which consist of both aged and young contrails that have spread over large areas, further illustrate the complexity of contrail evolution (Duda et al., 2001).
The prevalence and significance of cirrus clouds in the upper troposphere have been highlighted by various studies (Krämer et al., 2016, 2020), which provide comprehensive overviews of cirrus microphysical characteristics, climatologies, and radiative effects. Notably, research by Immler et al. (2008) found that cirrus clouds were present 55 % of the time in their measurements, while Sun et al. (2024) reported an occurrence frequency of approximately 48 % in the tropical Western Pacific, underscoring their frequent occurrence and importance in the atmosphere. These clouds play a crucial role in weather and climate systems due to their impact on radiative transfer (Chen et al., 2000). Cirrus clouds influence Earth's energy balance by reflecting incoming solar radiation, which cools the surface, and by absorbing and re-emitting outgoing terrestrial infrared radiation, which warms the atmosphere. Their net effect on surface temperature depends primarily on their optical properties (e.g., optical depth, ice-crystal size), cloud temperature, and the cloudiness of the underlying atmosphere (Stephens and Webster, 1981; Chen et al., 2000; Fauchez et al., 2015). Optically thick cirrus clouds tend to exert a cooling effect due to their high solar reflectance, whereas optically thin cirrus clouds typically contribute to atmospheric warming by trapping outgoing terrestrial radiation, similar to greenhouse gases (Hong et al., 2016; Campbell et al., 2016; Masson-Delmotte et al., 2021).
Contrails, which typically form at altitudes where natural cirrus clouds are prevalent, can modify surrounding atmospheric conditions, subsequently influencing the development and properties of natural cloudiness. Using the global climate model ECHAM4, Burkhardt and Kärcher (2011) showed that contrail cirrus reduces natural cloudiness by absorbing water vapor, delaying the formation of natural cirrus clouds. Similarly, Schumann et al. (2015) demonstrated that contrail ice particles grow substantially by taking up moisture, which dehydrates the atmosphere at flight levels and redistributes humidity to lower altitudes.
The overlapping altitude ranges of contrails and cirrus clouds complicate their combined impact on the Earth's energy balance. Contrails can form in clear skies, within existing cirrus clouds, or merge with natural cirrus clouds through processes such as wind shear, sedimentation, and advection. Previous studies in the early 2010s (e.g., Kübbeler et al., 2011; Voigt et al., 2011) often characterized aircraft contrails as relatively thin or even subvisible under typical atmospheric conditions. Climate models up to around 2017 consequently tended to assume low contrail optical depths in their simulations. However, recent peer-reviewed studies from 2018 onward, utilizing satellite observations, in-situ measurements, and enhanced climate models, indicate that contrail-generated cirrus clouds can achieve significantly greater optical thicknesses and consequently larger radiative impacts than previously estimated (e.g., Bock and Burkhardt, 2019; Schumann et al., 2021; Wang et al., 2023; Zhang et al., 2025). Given that contrail and natural cirrus clouds frequently coexist and interact in the upper troposphere, accurately assessing their combined climate effects is crucial. These interactions can have dual climate impacts – either promoting the formation of new optically thin ice clouds, contributing to surface warming (Burkhardt and Kärcher, 2011; Boucher et al., 2013; Kärcher, 2018), or increasing the optical thickness of existing cirrus clouds, potentially enhancing their reflectivity and exerting a cooling effect (Tesche et al., 2016).
Verma and Burkhardt (2022) incorporated the influence of background cirrus ice crystals into the jet (Kärcher et al., 2015) and vortex phase (Unterstrasser, 2016) parameterizations. Using large eddy simulations over Germany, they estimated the number of contrail ice crystals remaining after the vortex phase, taking into account the surrounding cloudy region.
Gierens (2012) and Verma and Burkhardt (2022) estimated a slight increase in the threshold temperature for contrail formation in cloudy conditions as opposed to clear skies, attributed to the added humidity from the cirrus clouds' ice water content. However, their findings also indicate that these effects on the threshold temperature and ice crystal numbers are relatively subtle, occurring significantly only under conditions of high ice water content and low supersaturation in cirrus clouds. This suggests that while the presence of cirrus can influence contrail formation, the overall impact might be limited under typical atmospheric conditions. Although the formation of contrails within cirrus clouds has a minimal immediate impact, they tend to mix over several hours through various processes. Gierens (2012) showed that contrails embedded in cirrus clouds decrease the average size of ice crystals while increasing their concentration.
Contrails not only affect the atmospheric potential for natural cloud formation, but also their growth, aging, survival, and dispersion are significantly affected by the characteristics of the existing background cloudy region. While contrails are typically transient, they can persist and grow for many hours in Ice-Supersaturated Regions (ISSRs) (Minnis et al., 1998; Schumann et al., 2017). This favorable atmospheric condition is often accompanied by natural cirrus clouds, as it is a prerequisite for their formation. Unterstrasser et al. (2017) used a Large-Eddy Simulation (LES) model with a Lagrangian ice microphysics module in an idealized setup. This study was the first to simulate the temporal evolution of both contrail-cirrus and naturally occurring cirrus clouds under different synoptic scenarios, enabling a direct comparison between them.
Current estimates of contrail cirrus radiative forcing do not fully account for the effects of contrails forming within natural clouds (Lee et al., 2021), partly due to the challenges in quantifying their interactions. As a result, the impacts of contrail formation within pre-existing cloud systems have remained underexplored. Recent studies using satellite observations have shed light on our understanding of the impacts of contrail-induced perturbations within cirrus clouds. For instance, Tesche et al. (2016) employed satellite-based lidar measurements, while Marjani et al. (2022) utilized combined radar–lidar retrievals from satellite observations. These studies have highlighted that contrails forming within natural cirrus clouds lead to measurable changes in cloud optical depth and increase ice crystal number concentration below flight altitude. This suggests that contrails embedded within cirrus clouds can modify the optical properties of these natural clouds. Observational studies, such as that of Gryspeerdt et al. (2024), have successfully integrated satellite imagery with air traffic data to identify contrails, employing convolutional neural networks to detect their characteristic linear cloud features. Despite these advances, tracking contrails beyond their initial stages remains a major challenge. As contrails evolve and age, they gradually lose their distinct linear structure, becoming increasingly difficult to differentiate from natural cirrus clouds and hindering a comprehensive evaluation of anthropogenic influences on cloud properties.
To complement these observational efforts and address the challenges in tracking aged contrails, modeling studies have offered valuable insights into their dynamics, yet significant gaps remain in understanding the spreading and aging stages under varying weather conditions (Kärcher, 2018). While prior research has explored the initial dynamics of contrail formation in diverse weather scenarios (Bier and Burkhardt, 2022) and within cloudy regions (Verma and Burkhardt, 2022), uncertainties persist regarding their evolution beyond the vortex phase, particularly as they interact with and become indistinguishable from natural cloud systems. Building on these foundations, this study addresses these gaps by employing high-resolution Large-Eddy Simulations (LES) to investigate the evolution of young contrails from the post-vortex phase up to approximately 3 h after formation, with a special emphasis on persistent contrails embedded within natural ice clouds. Operating in weather forecasting mode with a horizontal resolution of 154 m, our simulations incorporate realistic synoptic forcing to model contrail development under selected real-world atmospheric conditions. By initializing identical ice crystal concentrations corresponding to a narrow, line-shaped post-vortex contrail, we isolate how background cloud conditions influence its subsequent growth, persistence, and radiative effects.
This section describes the modeling framework used to simulate persistent contrails embedded in cloudy, ice-supersaturated regions, including the ICON setup, case selection, contrail initialization, and flight-path design.
2.1 ICON Model Configuration
We utilize the ICOsahedral Non-hydrostatic (ICON) model, developed collaboratively by the German Meteorological Service and the Max Planck Institute for Meteorology (Zängl et al., 2015; Klocke et al., 2017; Costa-Surós et al., 2020). ICON operates on an unstructured triangular grid, refined successively from a spherical icosahedron, and supports applications from global climate simulations (Giorgetta et al., 2018) to high-resolution large-eddy simulations (Heinze et al., 2017). For this research, we employ the ICON Large Eddy Model (ICON-LEM), an extension of the numerical weather prediction version (ICON-NWP). ICON-LEM integrates a physics package designed for Large Eddy Simulation (LES) on the unstructured grid, allowing the simulation of both mean-flow characteristics and turbulence-related quantities (Zängl et al., 2015; Dipankar et al., 2015).
The model's horizontal resolution is set at approximately 154 m, utilizing the R2B14 triangular grid. Vertically, the model uses a stretched, height-based, terrain-following coordinate system, with finer resolution near the surface that gradually coarsens with altitude, with the model top located at 22 km. To better resolve upper-tropospheric ice cloud dynamics, we configure 160 vertical levels, yielding an average spacing of 137 m across the full column and roughly 150 m within the 8–12 km altitude range, corresponding to typical commercial flight levels. This configuration provides sufficient detail to capture upper-tropospheric processes while remaining computationally efficient.
Microphysics follow the double-moment scheme of Seifert and Beheng (2006) for cloud liquid and ice, predicting both mass mixing ratios and number concentrations for six hydrometeor categories (cloud droplets, rain, ice, hail, snow, and graupel). At fine grid scales, the model resolves deep and shallow convection, so no separate convective parameterization is used. Instead of the default diagnostic, PDF-based cloud-cover scheme intended for coarser configurations, we use a binary scheme in which the cloud fraction is set to 1 when resolved hydrometeors are present and 0 otherwise – standard practice when clouds are explicitly resolved at grid scale. Homogeneous and heterogeneous ice nucleation are parameterized following Kärcher et al. (2006) and Phillips et al. (2008). The model represents competition between heterogeneous and homogeneous nucleation: homogeneous nucleation depends primarily on updraft velocity, and the reduction of supersaturation by heterogeneously formed ice crystals is implemented as an effective reduction of the updraft, which in turn lowers homogeneous nucleation rates (Kärcher et al., 2006).
This ice nucleation configuration is the default for ICON-LEM and has been successfully applied and evaluated in previous high-resolution LES studies using comparable setups, including simulations at 625, 312, and 156 m resolutions over Germany that captured small to mesoscale variability in clouds and precipitation (Heinze et al., 2017). Additional studies have shown that the scheme adapts well to short time steps, with nucleation effectively captured through supersaturation adjustments applied at each model time step, without the need for substepping (Schemann and Ebell, 2020; Verma and Burkhardt, 2022).
2.2 ICON Model Setup
The simulation workflow comprises two phases. First, we ran ICON-NWP at kilometer-scale resolution, using initial and boundary conditions from the ECMWF IFS operational analysis, updated every 6 h. This phase uses three nested domains with resolutions of 5, 2.5, and 1.25 km. Second, we perform a high-resolution ICON-LEM run initialized from the output of the finest nest (1.25 km). The ICON-LEM run uses a horizontal grid spacing of 154 m (R2B14), a two-second time step, and hourly boundary-condition updates. This second run constitutes our main, high-resolution simulation of contrail evolution.
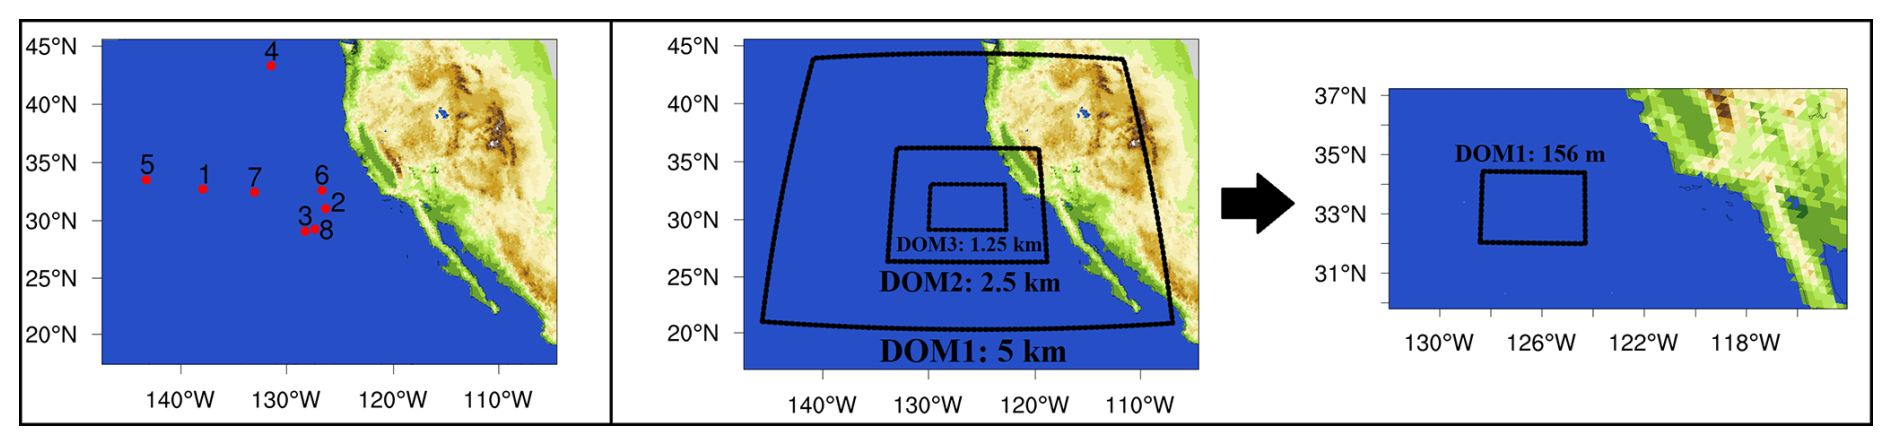
Figure 1Left: Geographic center locations of the LES simulation domains for the eight contrail cases, spanning the midlatitude Pacific Ocean off the west coast of the United States. Numbers indicate the case identifiers (1–8), corresponding to the simulations analyzed in this study. Middle: Three nested domains used in the initial ICON-NWP simulations, progressively refined from 5 km (40° longitude × 24° latitude) to 2.5 km (16° longitude × 10° latitude), and finally to 1.25 km (8° longitude × 4° latitude). Right: The subsequent high-resolution ICON-LEM domain at 154 m (4.2° longitude × 2.4° latitude), initialized directly from the finest nest of the first simulation. Note that the middle and right panels show the domain configuration for Case 2, representative of the configurations used in all simulations.
This two-stage approach ensures a smooth transition to higher resolution, minimize large-scale discrepancies between the boundary and the main domain, and reduces spin-up shocks. To allow adequate spin-up, the high-resolution simulation is started at least 4 h prior to contrail implementation. Figure 1 illustrates the two-stage domains for a representative case, including the spatial coverage and the nested-resolution strategy. The initial extensive domain coverage – up to 40° longitude by 24° latitude in the coarsest nest – helps ensure that atmospheric and synoptic-scale conditions are well represented, which is essential for a more realistic cloud dynamics simulation.
2.3 Simulation Case Selection and Background Conditions
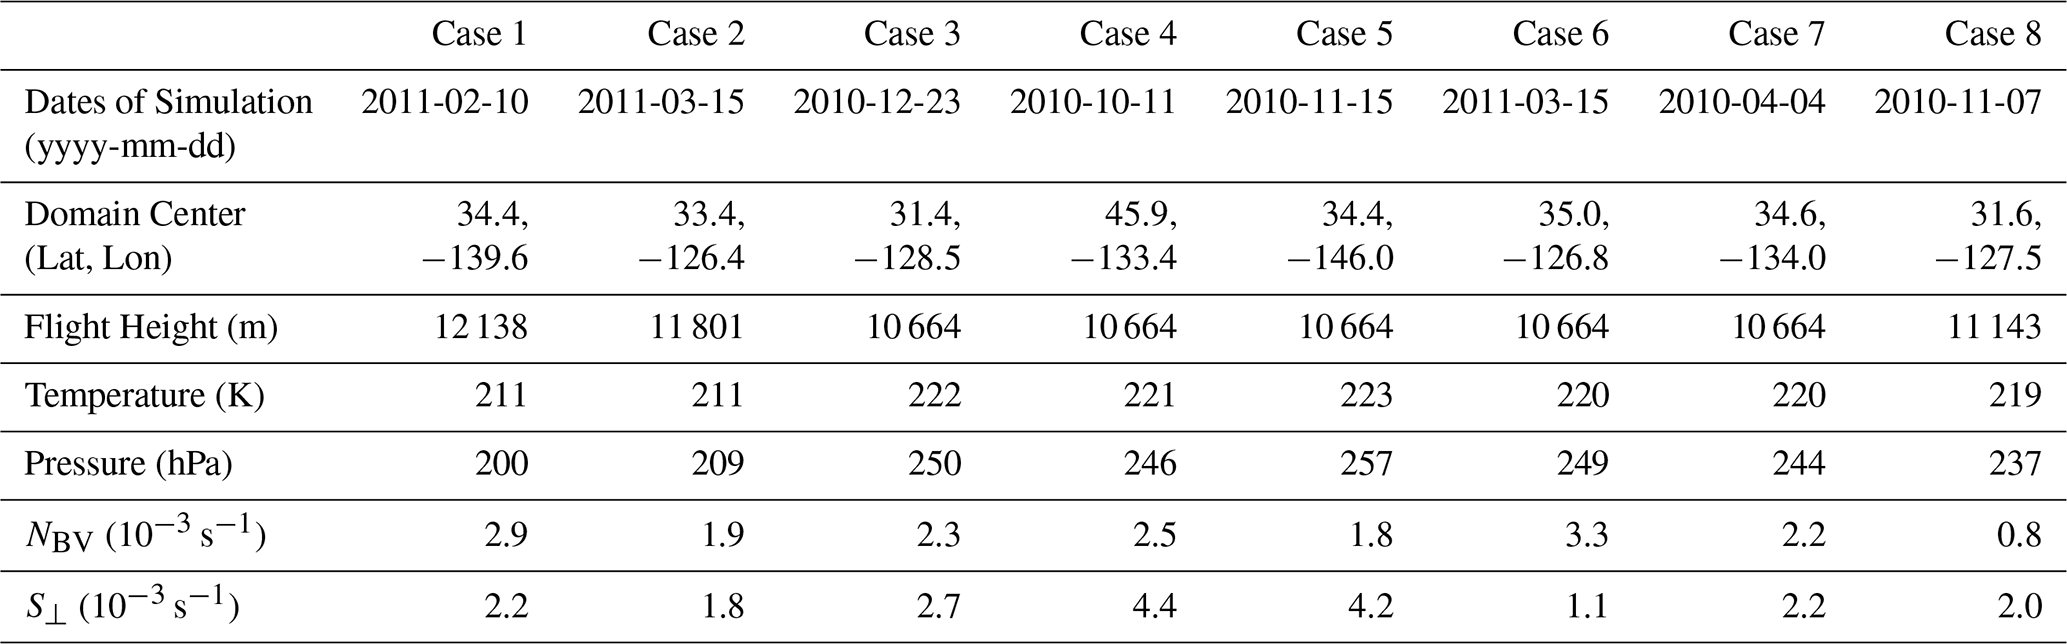
We conduct eight high-resolution LES simulations with ICON-LEM, each representing a distinct real-world scenario within the midlatitude Pacific Ocean between the U.S. west coast and Hawaii, with domain centers shown in Fig. 1. The cases are selected from the satellite-based catalog of Marjani et al. (2022), which identified contrail-induced modifications to cirrus clouds using combined radar–lidar retrievals of ice crystal number concentrations along aircraft tracks intersecting thin cirrus. From this catalog, we selected events with extensive upper-tropospheric cloud cover and ice-supersaturated conditions favorable for persistent contrail formation. Together, the eight cases span a physically diverse range of cloudy, ice-supersaturated background conditions, enabling the study of contrail–cirrus interactions in non-idealized environments subject to realistic synoptic forcing. Key setup parameters for each simulation are listed in Table 1.
Table 1Summary of the simulation cases: simulation dates; domain centers; flight altitude; and background conditions at flight level – temperature, pressure, static stability (Brunt–Väisälä frequency, NBV), and the perpendicular component of the local wind shear relative to the initial contrail axis, S⟂, evaluated at the contrail initialization location.
For each case, a control run of the natural cloudy background is paired with a perturbation run that is identical except for contrail initialization along a prescribed flight path (Sect. 2.5). The control simulations provide a baseline for quantifying contrail-induced changes and for characterizing the inherent variability of the background atmosphere.
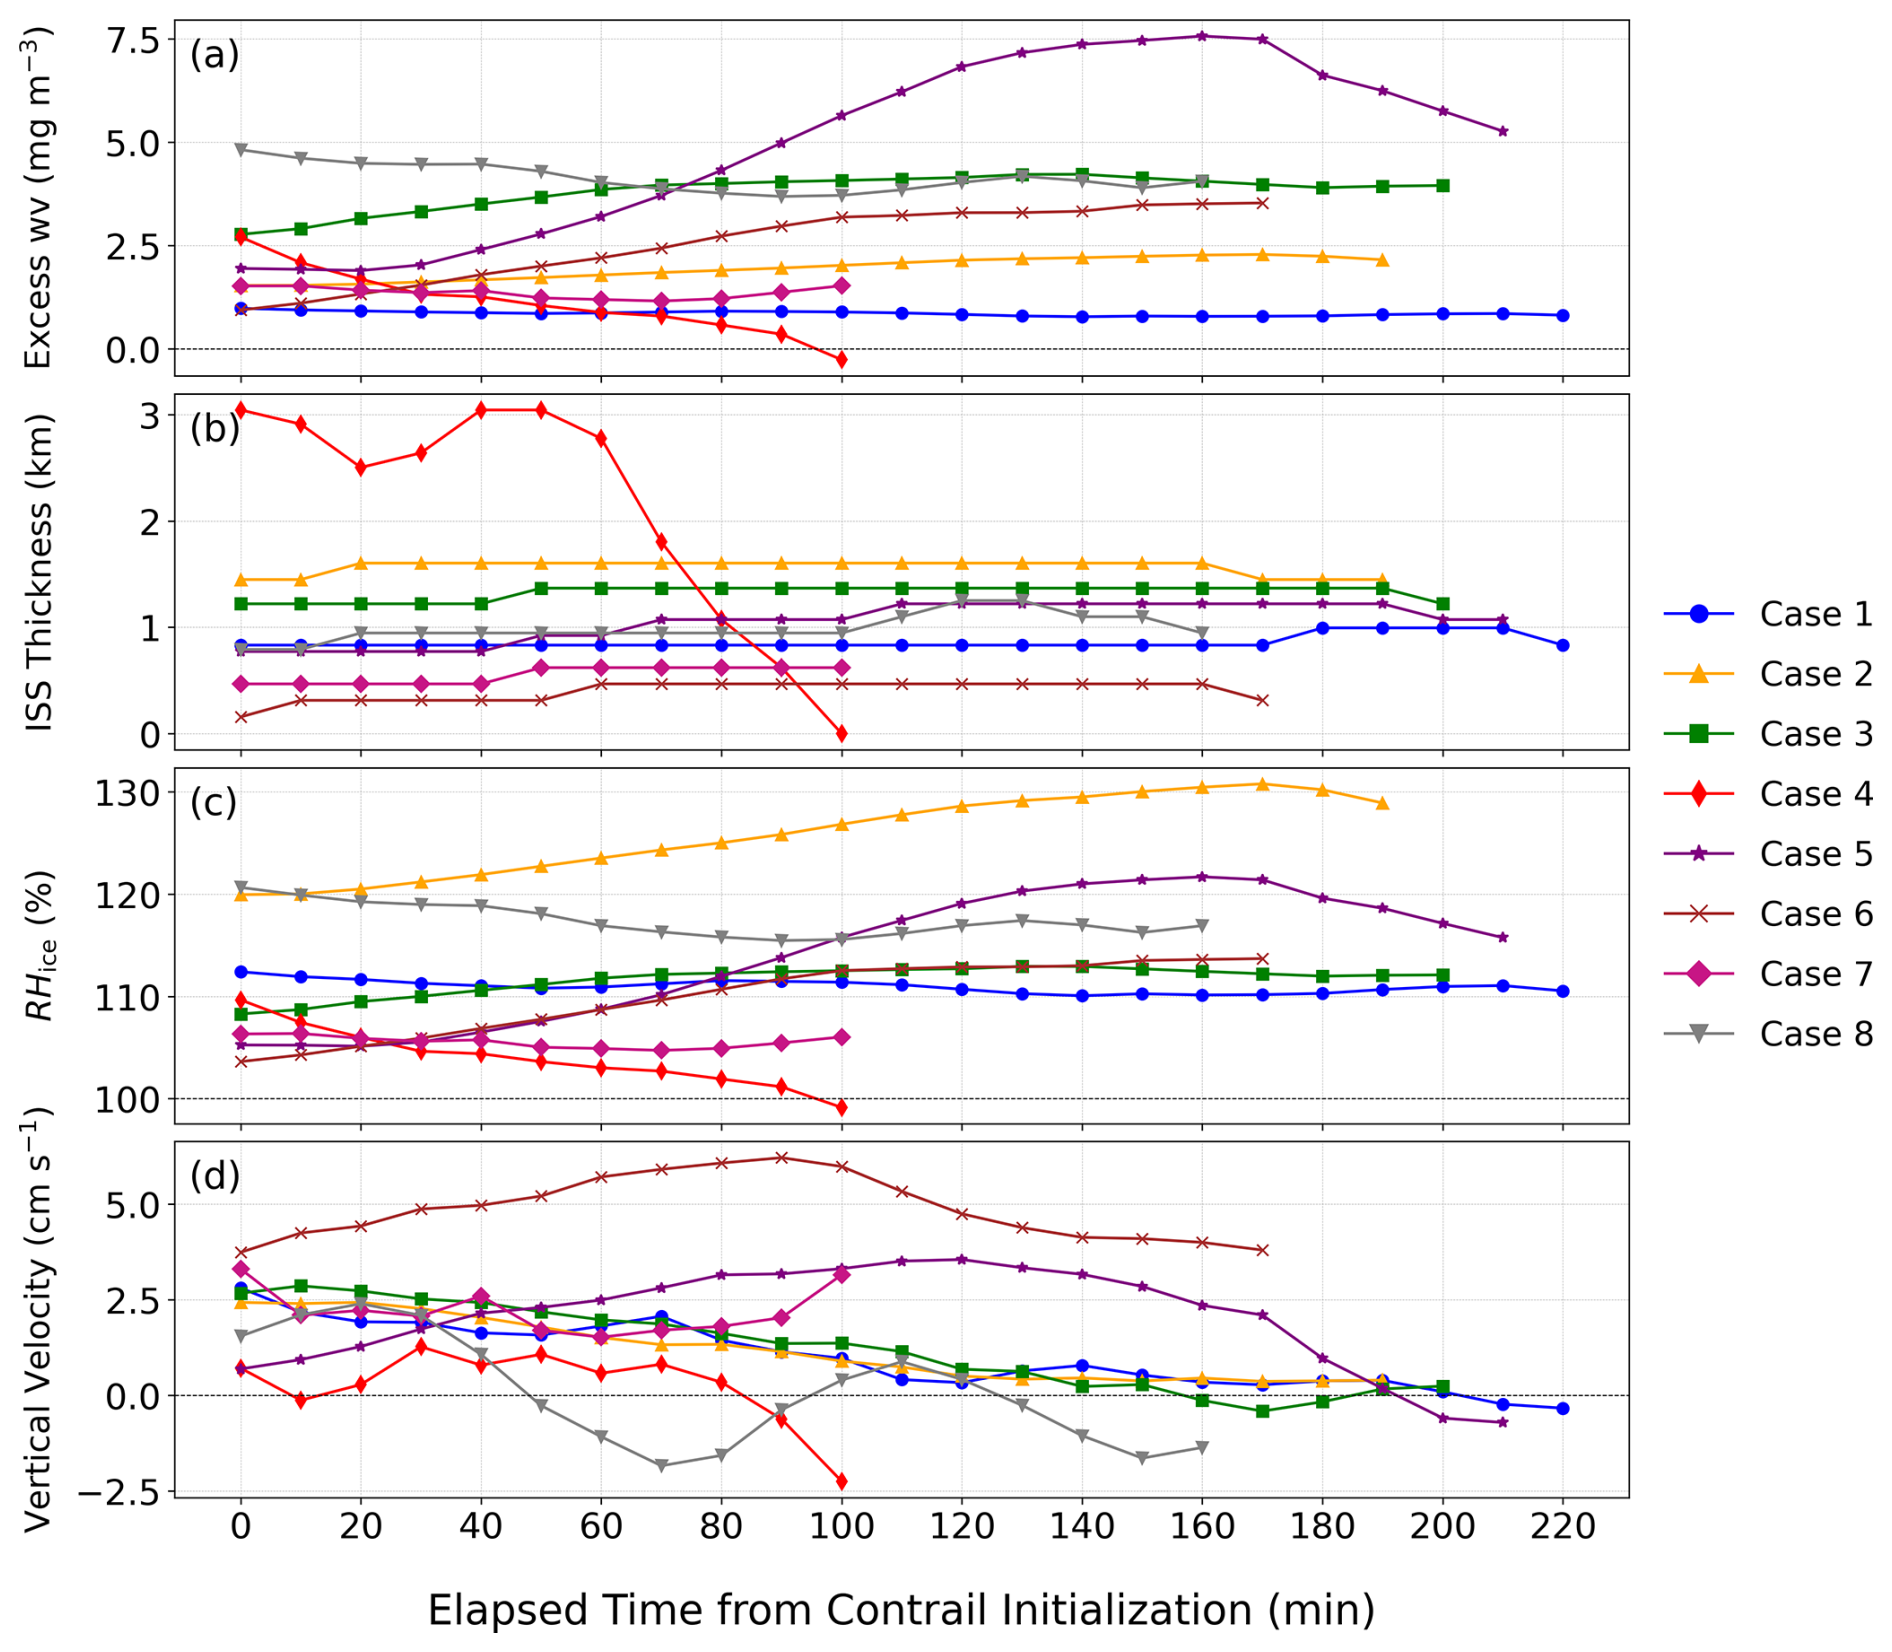
Figure 2Time series of background atmospheric parameters from control simulations for the eight selected cases: (a) excess water vapor above ice saturation, (b) depth of ice-supersaturated layers (ISS) below flight altitude, (c) relative humidity over ice (RHice), and (d) vertical velocity. Cases were chosen following Marjani et al. (2022) to sample diverse cirrus environments favorable for persistent contrail formation. Values shown are median statistics over the analysis region at each time step. Conditions vary spatially and temporally in these non-idealized environments, influencing contrail development.
Table 2Overview of the eight cloudy background simulation cases, including key atmospheric conditions relevant for contrail persistence. Cases were selected from Marjani et al. (2022) based on the presence of sufficient upper-tropospheric cloud coverage in ice-supersaturated regions.
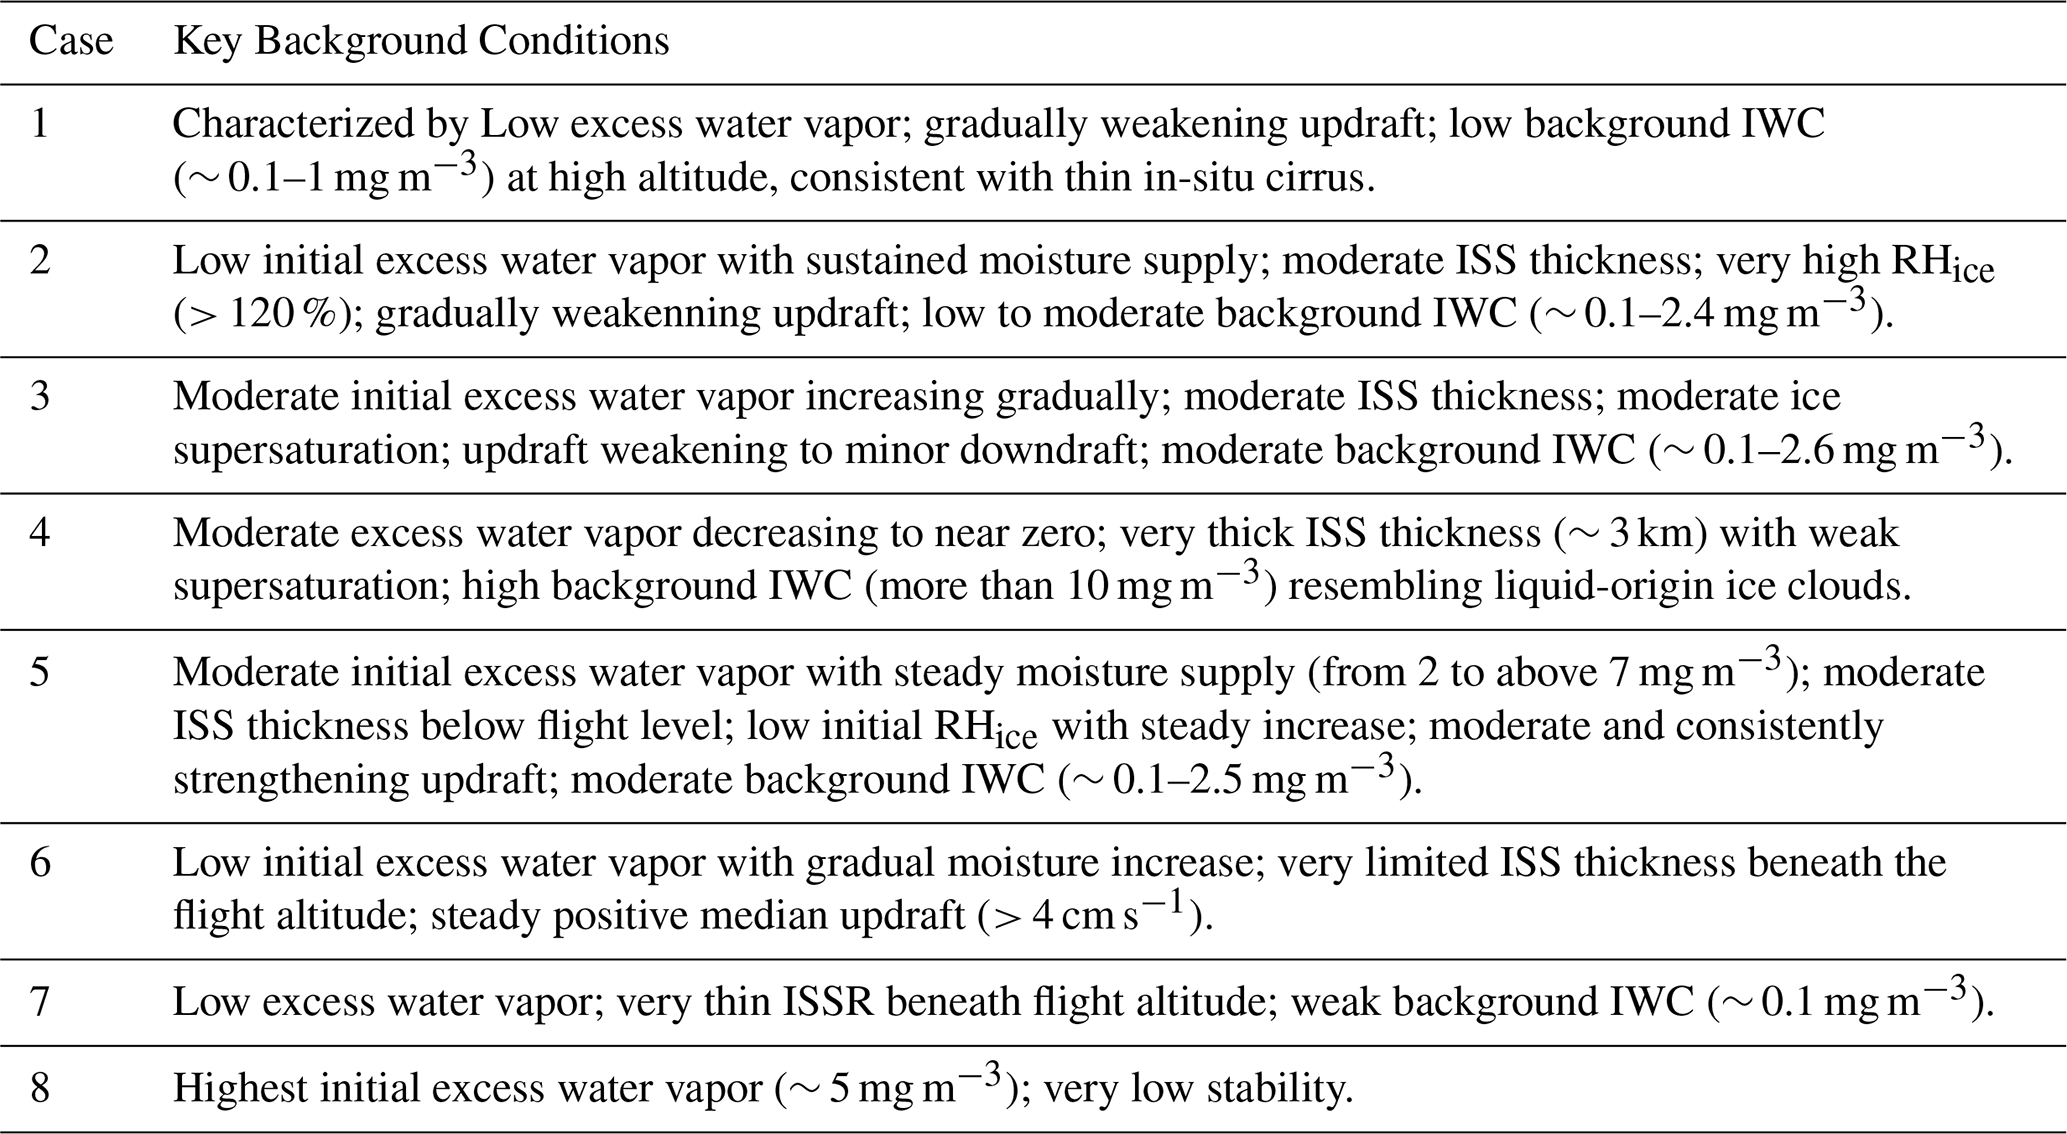
Background weather characteristics are shown in Fig. 2 as time series of median values for four parameters: (a) excess water vapor above ice saturation; (b) depth of ice-supersaturated layers (ISS) below flight altitude; (c) relative humidity over ice (RHice); and (d) vertical velocity. Notable trends and case-specific features derived from these time series, together with vertical cross-sections of ice water content (IWC) in Appendix A1, are summarized in Table 2 to facilitate comparison among cases.
2.4 Contrail Formation and Initialization in ICON
We use the Schmidt–Appleman Criterion (SAC; Schumann, 1996) to assess whether the mixing of aircraft exhaust with ambient air exceeds the threshold for visible contrail formation. For persistent contrails, ambient conditions must also be at or above ice saturation, ensuring that the ice crystals do not sublimate after formation. Further details on the SAC, including a schematic of mixing lines, are provided in Appendix B.
The critical temperature, i.e., the maximum ambient temperature at which contrail formation becomes thermodynamically possible, is computed using the following parameters: water vapor emission index Mw=1.25 kgwv kg, specific heat capacity of air cp=1005 J kg−1 K−1, combustion heat Q=43.2 MJ kg, and propulsion efficiency η=0.3. These values are used in the standard SAC formulation, in which the slope of the mixing line (G) is given by
with Pa denoting the ambient pressure. These parameter choices follow previous contrail modeling studies (Kärcher et al., 2015; Bock and Burkhardt, 2019; Verma and Burkhardt, 2022).
Figure 3 shows the critical temperature for contrail formation as a function of pressure and relative humidity over ice using the above parameters. For a given pressure, higher relative humidity increases the threshold, while for a fixed relative humidity, lower pressure (higher altitude) reduces the critical temperature.
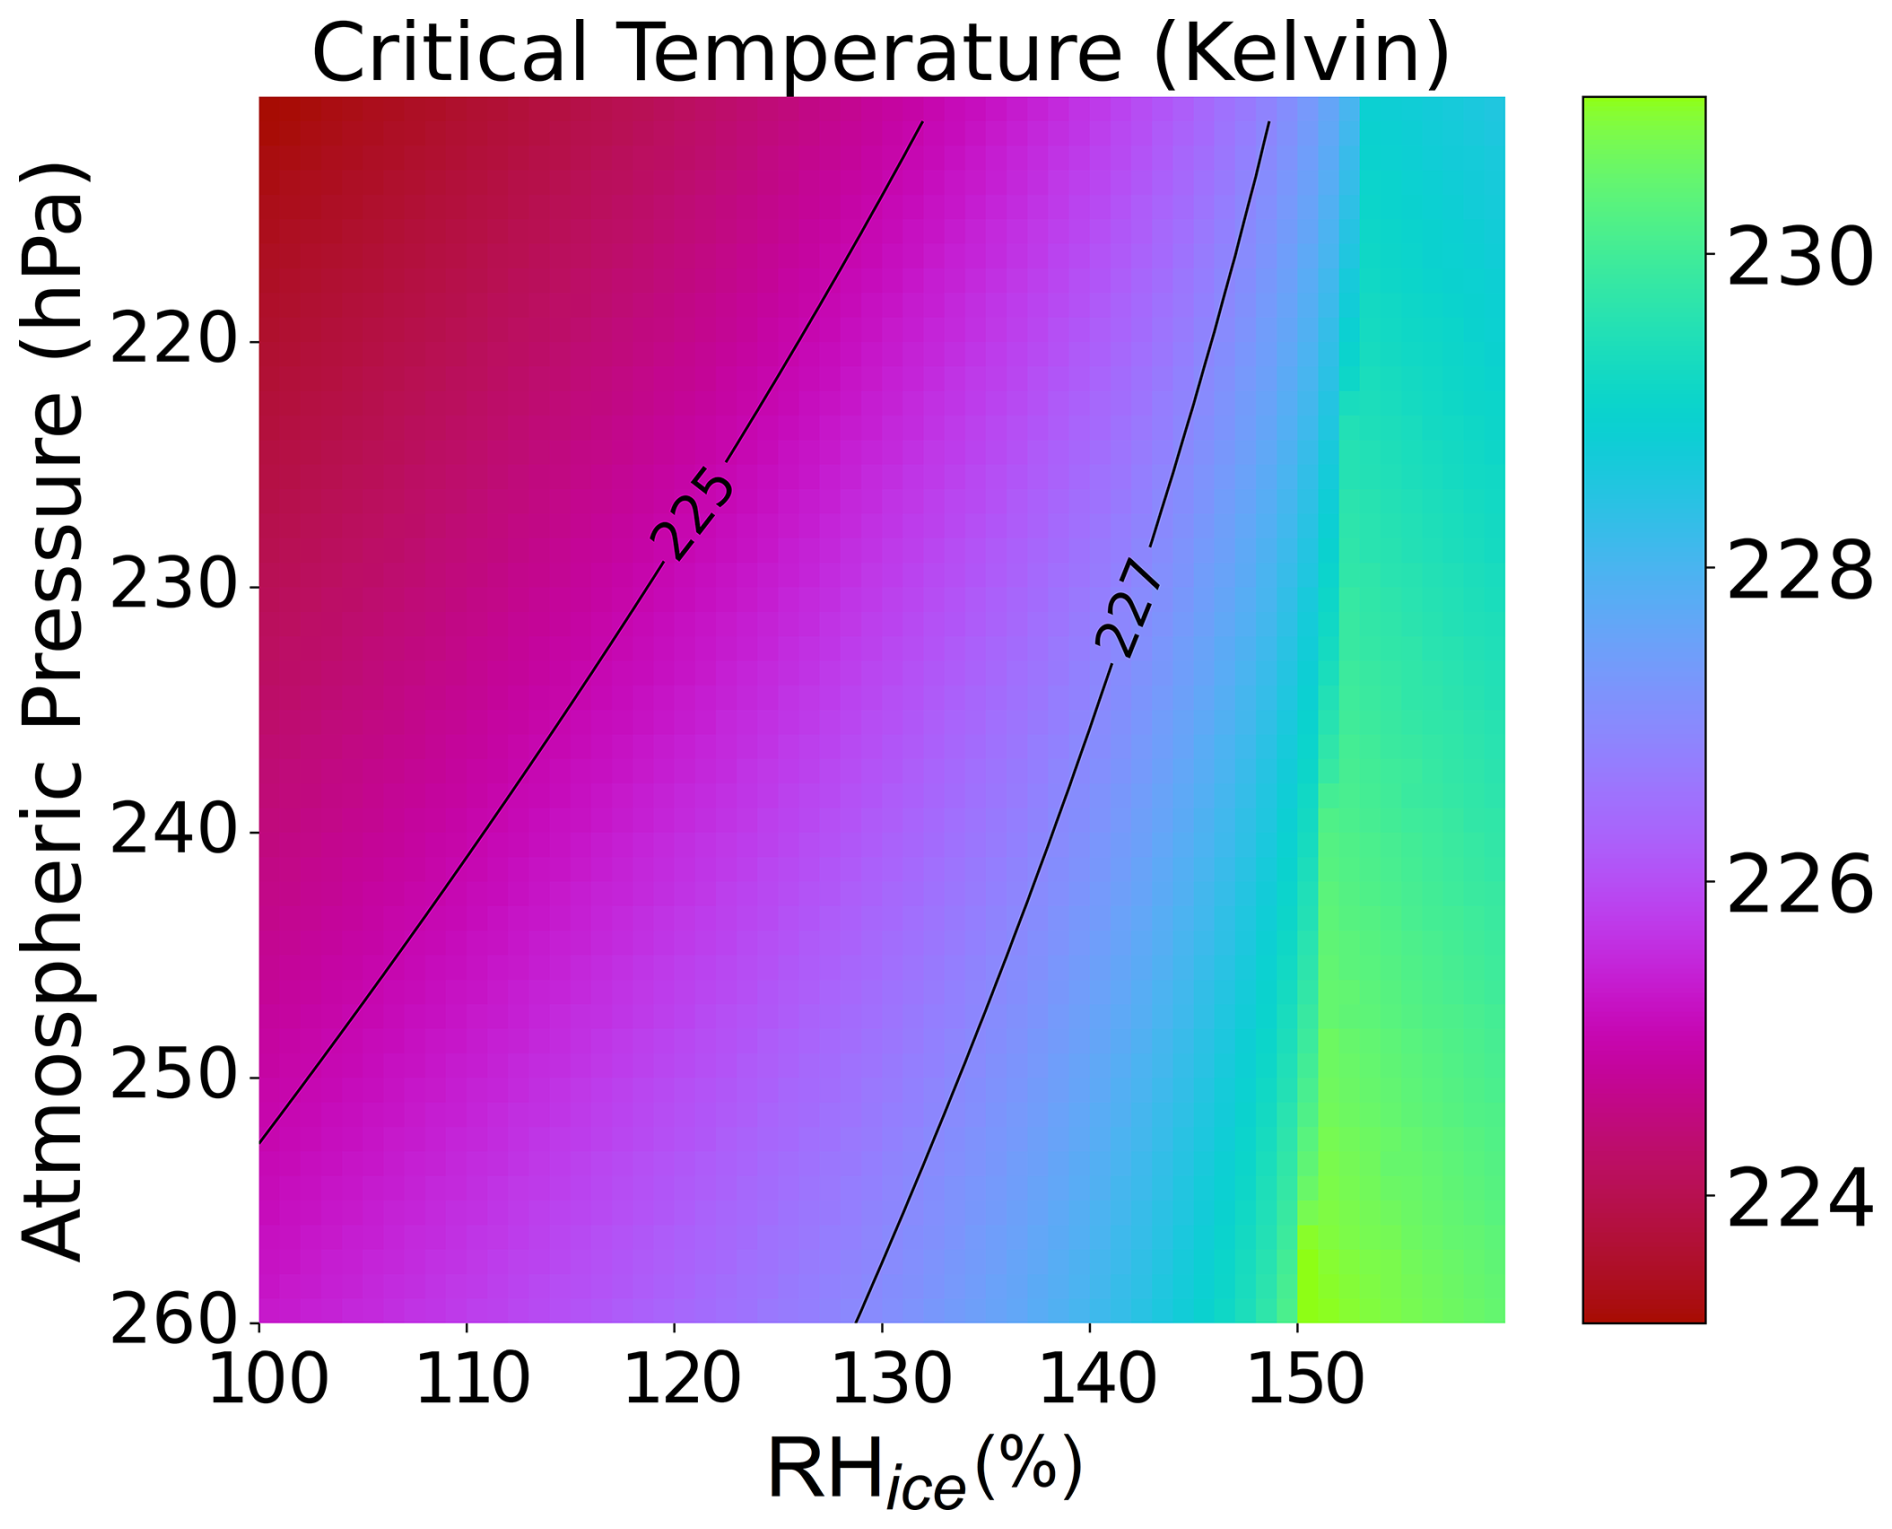
Figure 3Heatmap showing the critical temperature (K) for contrail formation as a function of relative humidity with respect to ice (%) and atmospheric pressure (hPa). The calculation assumes a water vapor emission index of Mw=1.25 kgwv kg, specific heat capacity of air cp=1005 J kg−1 K−1, combustion heat Q=43.2 MJ kg, and propulsion efficiency η=0.3.
In ICON, these formation criteria are evaluated along the simulated flight paths to initialize contrails. We consider the B767 and A300 as representative aircraft, with a wingspan of roughly 50 m and a water vapor emission of about 7.26 g m−1 of flight (Unterstrasser, 2016). Each grid box along the flight path is evaluated against the SAC temperature threshold and ice saturation condition: if both are met, water vapor emissions are introduced as ice mass with a corresponding ice crystal number concentration; otherwise, they are introduced as water vapor. Initialization is applied within a single model time step, after which contrails interact with the environment and evolve further, both responding to and modifying the surrounding atmosphere.
Contrails are initialized under the assumption that they have already entered the post-vortex phase, approximately 450 s after formation, when atmospheric conditions dominate their development (Bier and Burkhardt, 2022). Each contrail is prescribed a fixed ice crystal number concentration of 150 cm−3 and a cross-sectional area consistent with the model's horizontal and vertical resolution (about 154 × 150 m2). This choice follows Bier and Burkhardt (2022), who incorporated parameterizations for contrail nucleation (Kärcher et al., 2015) and vortex-phase crystal loss (Unterstrasser, 2016) in the contrail–cirrus scheme CCMod of the climate model ECHAM5. For the U.S. west coast – our focal region – they report annual-mean contrail number concentrations consistent with our adopted value, equivalent to a soot number emission of 1.5×10¹⁵ kg−1, representative of present-day conditions.
This initialization is further supported by earlier work. Bock and Burkhardt (2016b) applied the same fixed number concentration for contrail–cirrus simulations based on European observations, while in situ aircraft measurements (Schröder et al., 2000; Febvre et al., 2009; Voigt et al., 2011) report similar magnitudes for young post-vortex contrails. Unterstrasser et al. (2017) simulated contrail–cirrus in an idealized large-eddy model, initializing contrails at 5 min of age with average concentrations of 20 cm−3 and local maxima up to 200 cm−3, with contrails approximately 500 m deep and 200 m wide.
In the present study, the two-moment bulk microphysics scheme uses a single prognostic ice category (Seifert and Beheng, 2006). Contrail ice and natural cloud ice are therefore not represented as separate source-tagged populations. Instead, the model predicts the evolution of the total bulk ice field in each grid cell and its exchange with neighbouring grid cells. The contrail is initialized as a narrow, line-shaped post-vortex perturbation with high ice crystal number concentration, and its subsequent evolution is governed by the ambient thermodynamic and dynamical conditions. Because our analysis focuses on the dispersion phase, when depositional growth, sublimation, sedimentation, and mixing dominate the evolution, this setup is sufficient for the objectives of the present study.
A consequence, however, is that once contrail ice and natural cloud ice occupy the same grid cell, their individual source contributions cannot be diagnosed explicitly; only the combined bulk response is represented. Our paired perturbation–control framework still allows us to diagnose contrail-induced anomalies, but it does not permit an explicit partitioning of bulk ice into contrail-origin and natural-origin fractions within the same grid cell. The consistency of this bulk representation for the initialized post-vortex contrail perturbation is assessed in Appendix C, which shows that the combined bulk state remains controlled by the contrail-like high-Ni, small-particle perturbation under representative cloudy-background conditions.
2.5 Designing Aircraft Flight Paths Considering Persistent Contrail Formation Zones
In this study, we focus on the evolution of persistent contrails due to their substantial climate impacts. Teoh et al. (2024) found that while fewer than a quarter of global flights produce persistent contrails, these contrails contribute the majority of contrail-induced radiative forcing. Consequently, identifying regions favorable for persistent contrail formation is essential, enabling us to initialize and position contrail tracks at optimal altitudes and locations. This requires target regions to have temperatures below the contrail formation threshold and ice supersaturation to sustain persistent contrail growth in the simulation. To achieve this, within our simulation domain, we analyzed the height levels around the desired flight altitude, using control run results to verify suitability for contrail persistence. We then deliberately selected the contrail height and location to guarantee an environment conducive to persistent contrail formation (as opposed to mitigation strategies).
Having designed all eight perturbation cases to initialize contrails within cloudy, ice-supersaturated regions colder than the critical temperature for contrail formation, we now compare their subsequent evolution under differing background conditions to identify the key factors governing persistent-contrail growth.
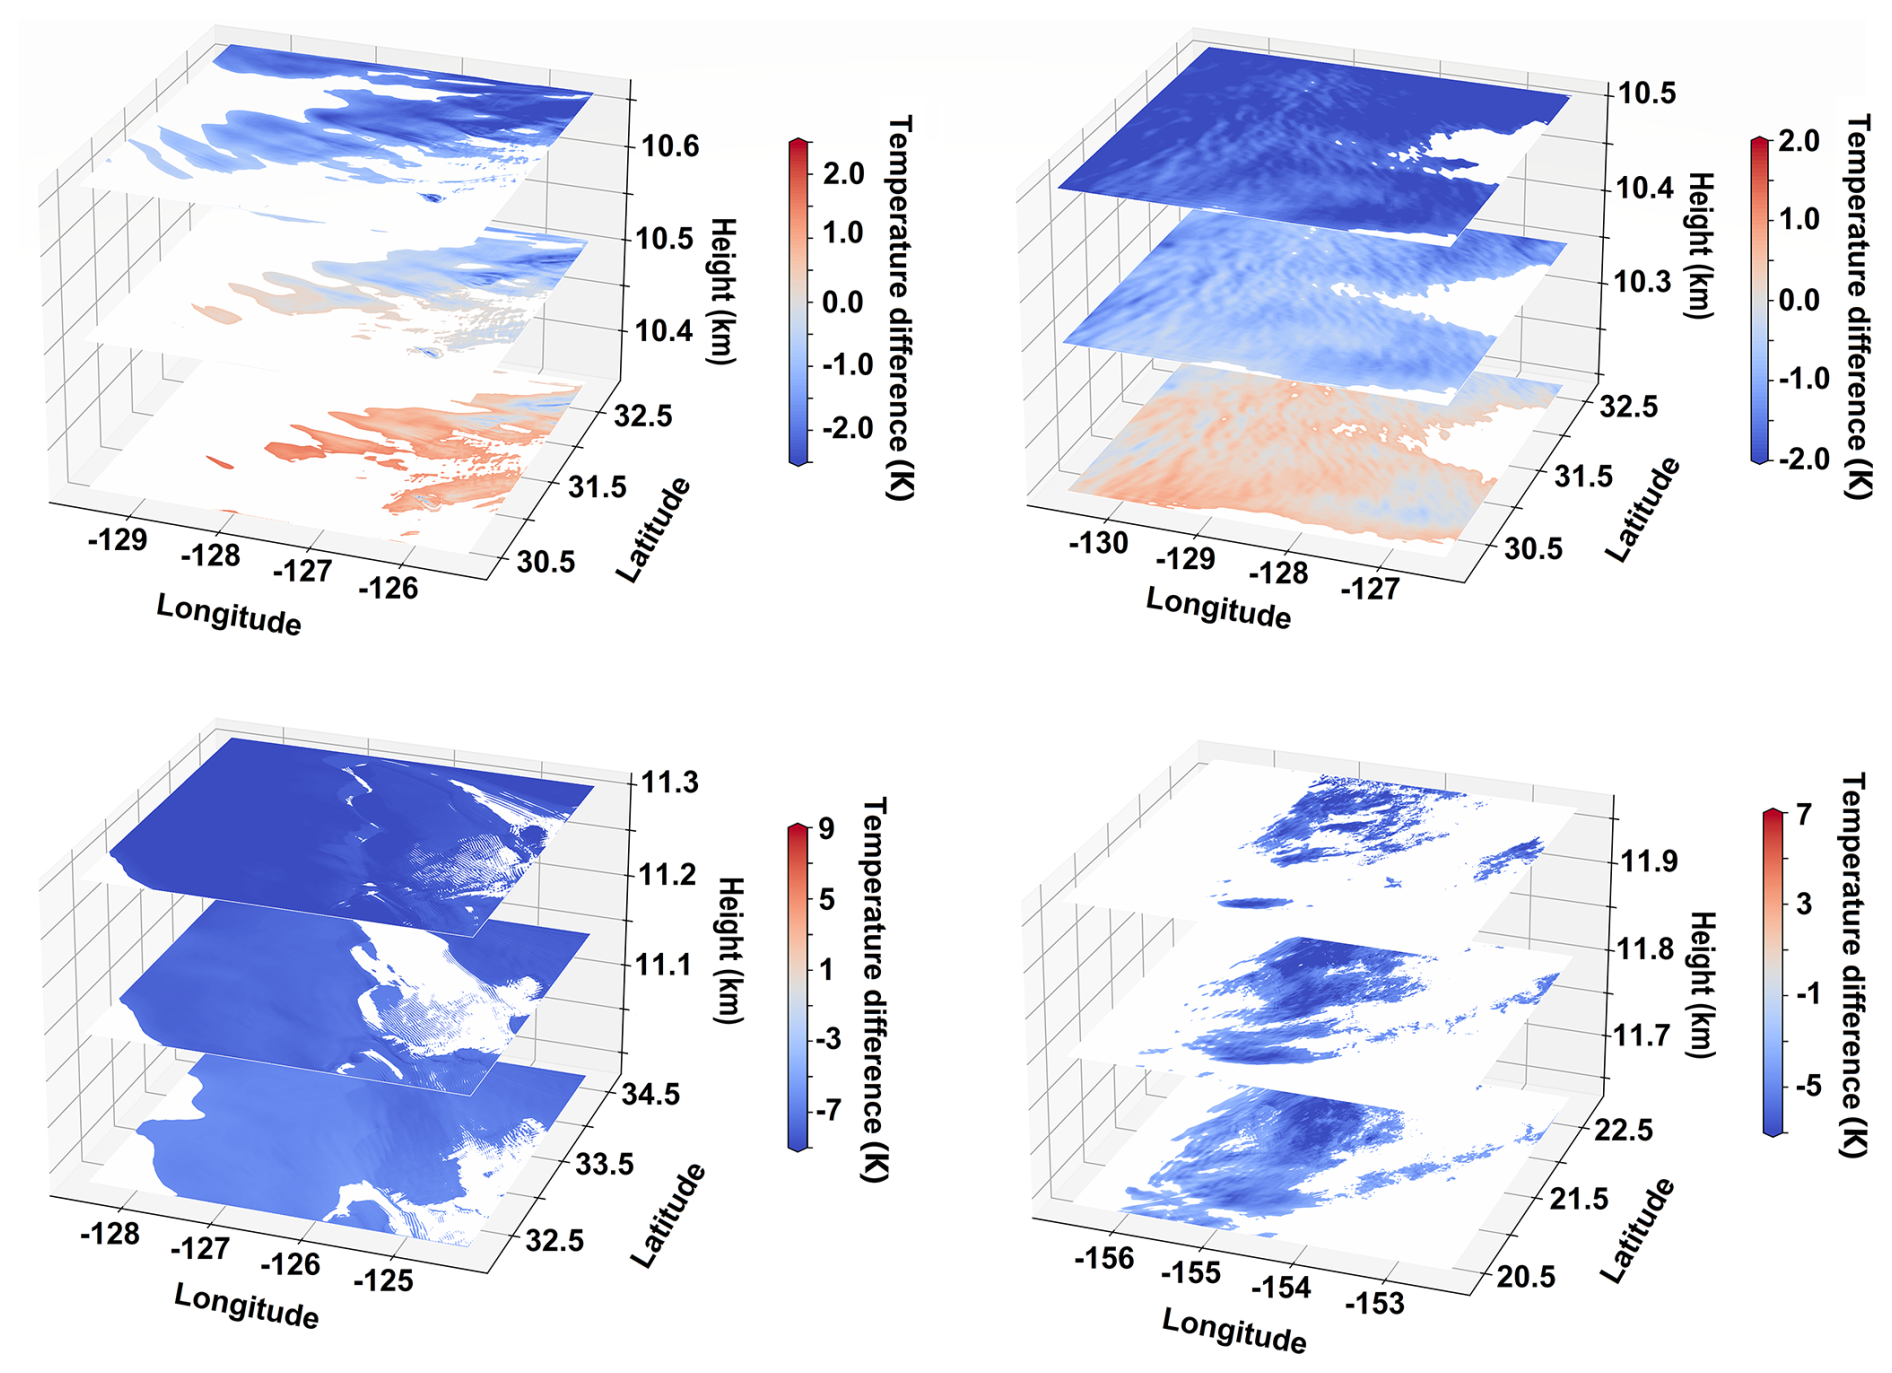
Figure 4Temperature difference from the contrail formation threshold within ice-supersaturated regions for four representative simulations. These examples illustrate the variability of conditions favorable for persistent contrail formation at three consecutive height levels and were used to guide contrail initialization in the perturbation runs. Please note the differing values in the color bar.
Figure 4 presents representative sample maps of temperature differences from the Schmidt–Appleman criterion within ice-saturated regions at three consecutive height levels, based on our model results. The top row panels show that while the lower altitude levels contain ice supersaturation regions, they are not cold enough for contrail formation, as they are warmer than the threshold temperature. This highlights that flying aircraft within ice supersaturated regions alone does not necessarily lead to formation of contrail (at least based on our current definition of contrail formation). In the bottom row panels, all three consecutive layers meet the temperature criterion for contrail formation. The temperature difference from the threshold increases with altitude, while the extent of the saturated region also varies. This suggests that for aircraft operating at higher altitudes, as is typical for modern aviation, the temperature criterion is rarely a limiting factor for contrail formation.
According to the Schmidt–Appleman Criterion, contrail formation requires plume saturation with respect to liquid water, which can occur even when the ambient atmosphere is subsaturated with respect to ice. However, for contrails to become persistent – our primary focus due to their climate relevance – ambient ice supersaturation is additionally required to sustain contrail's growth. This requirement aligns persistent contrails with environments favorable for natural cirrus development, where they can either contribute to additional cloudiness (Tesche et al., 2016; Marjani et al., 2022) or modify existing clouds (Burkhardt and Kärcher, 2011).
3.1 Contrail Ice Crystals Spreading in Ice Supersaturation Regions with Cloudy Background
Contrail evolution is influenced by atmospheric conditions such as temperature, humidity, and background properties. Their persistence and spreading depend on environmental interactions and their temporal evolution, which together shape both microphysics and radiative effects. To explore this, we first examine key characteristics of the simulated contrails in ice supersaturation regions (ISSRs). Figure 5 shows ice crystal number concentration (Ni) snapshots for four different cases at various stages of contrail development at flight altitude. Because Fig. 5 is restricted to the flight level, it does not capture the additional horizontal extent arising from vertical contrail development; quantitative width estimates at 30 and 60 min are provided separately in Table A1. At early ages, all cases exhibit a narrow, well-defined contrail core with high ice crystal concentrations. As contrails evolve, lateral spreading becomes more evident, though the extent and pattern vary. In all cases, the highest Ni remains concentrated in the core, while values gradually decrease toward the outer edges as the contrail expands. Although Ni in the core declines over time, this high-concentration pattern persists even after 2 h.
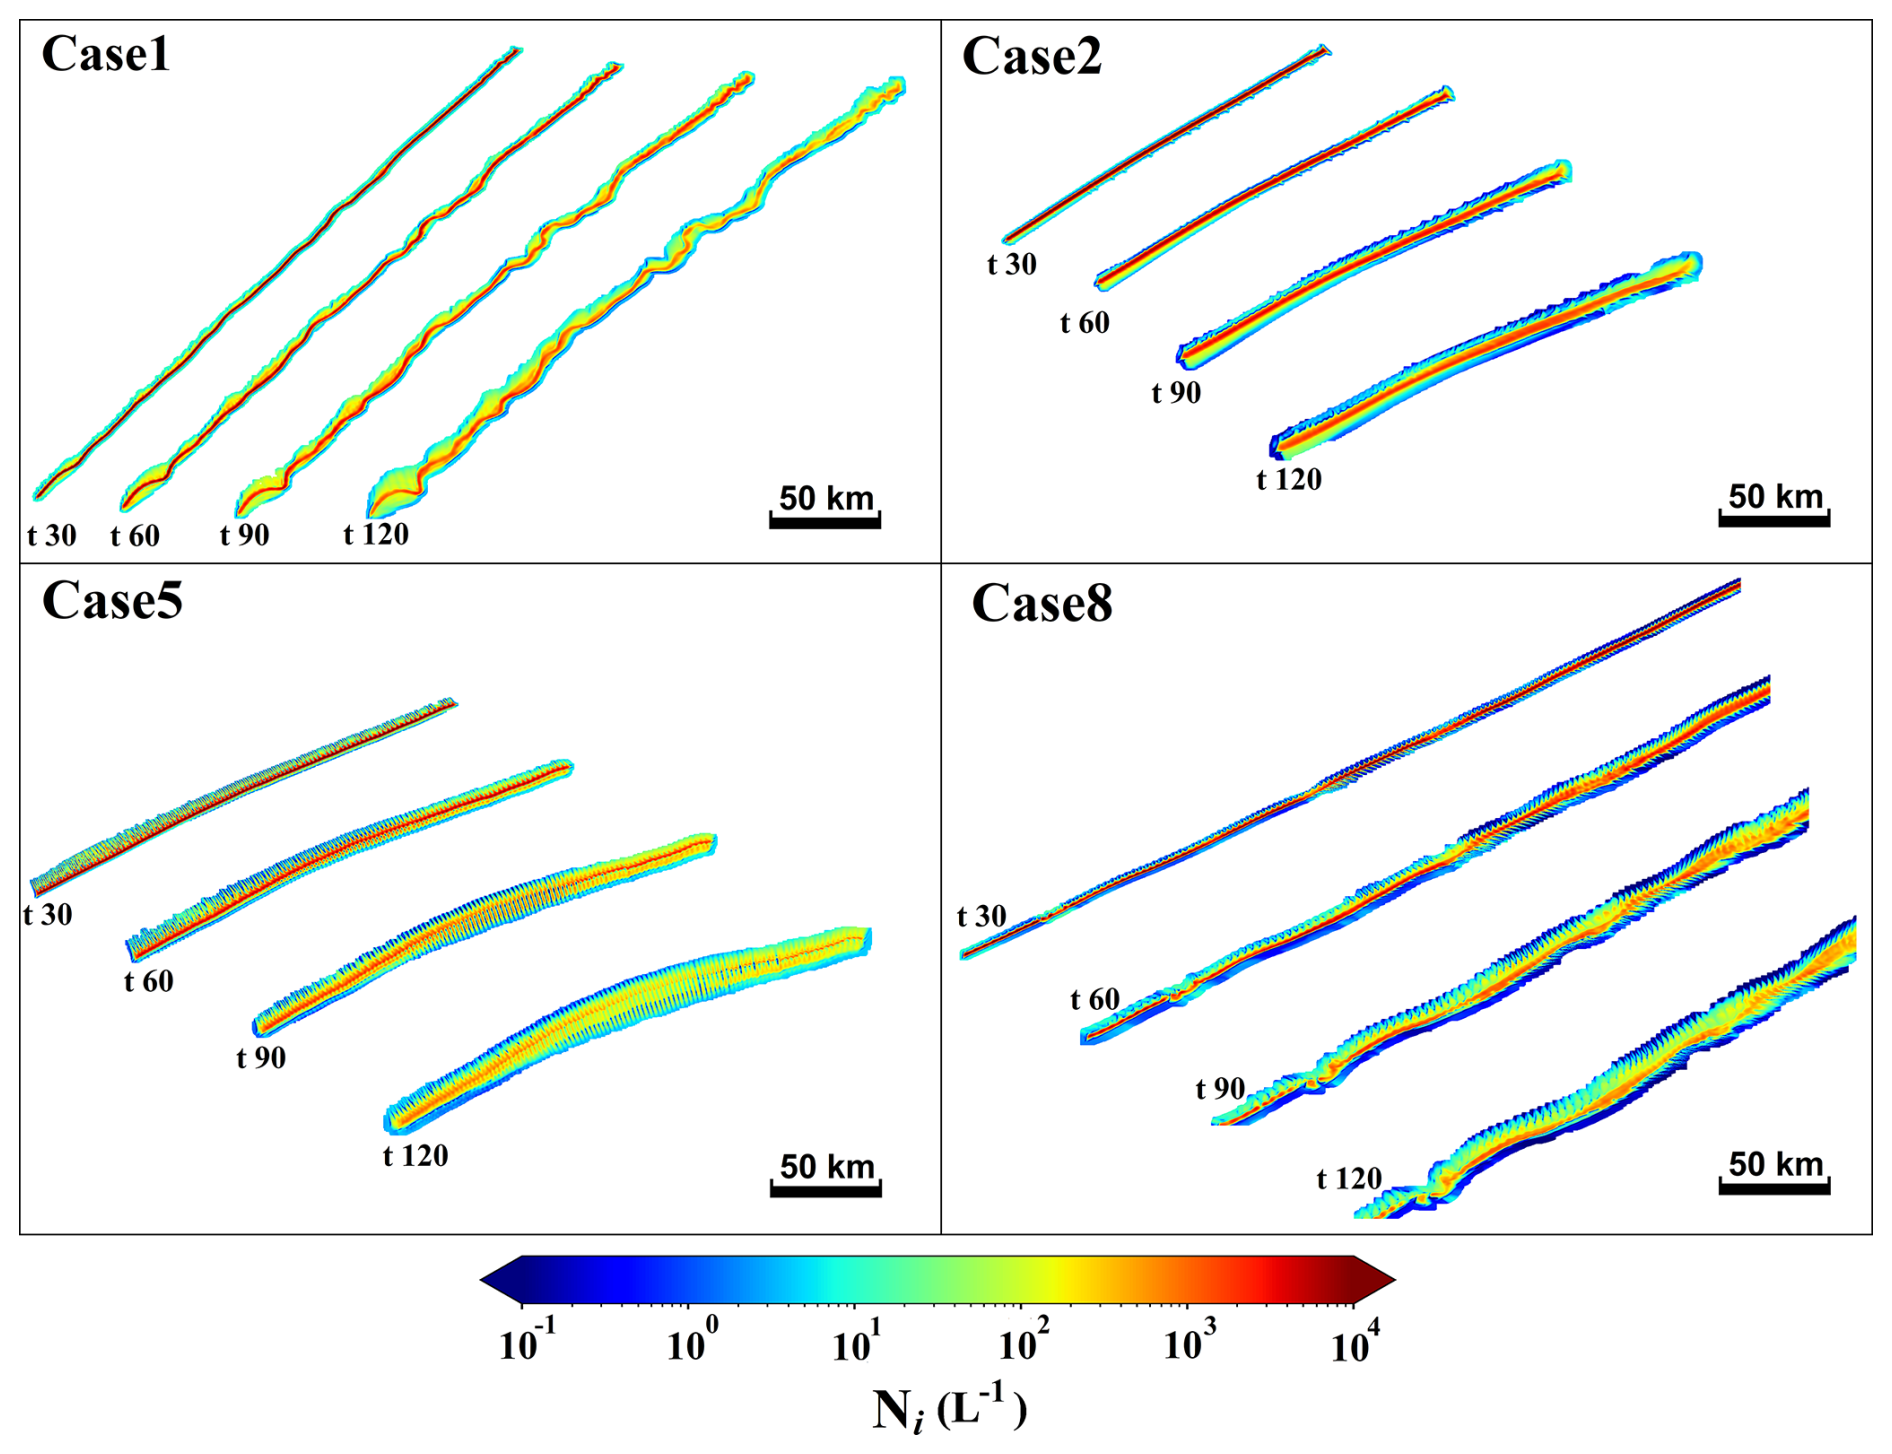
Figure 5Horizontal spatial distribution of contrail ice crystal number concentration (Ni) at flight altitude for four selected cases, shown at 30, 60, 90, and 120 min after contrail initialization. Quantitative contrail widths at flight altitude and across all vertical levels are summarized in Table A1.
The spreading of initially linear contrails is primarily driven by variations in horizontal wind shear – changes in wind speed and direction across the contrail – as well as atmospheric turbulence. Strong shear stretches contrails into wavy, or filament-like structures, while weak shear preserves a more uniform shape. Additionally, turbulence disrupts contrail symmetry, specially at the edges where contrail ice crystals interact with surrounding clouds, producing irregular dispersion. Under strong turbulence contrails appear fragmented, whereas in calm conditions they remain more coherent. The evolution of simulated contrail ice crystal concentration for all eight cases is available as animations at the original model grid resolution (https://doi.org/10.5281/zenodo.15106425, Marjani, 2025).
3.2 Contrail-Induced Changes in Relative Humidity within Ice Supersaturation Regions
Relative humidity over ice (RHice) is a thermodynamic state variable rather than a direct contrail property such as Ni, yet it can be substantially perturbed within contrail-affected regions. Figure 6 shows the RHice across multiple simulations, where the linear structure of contrails is clearly distinguishable, leaving a visible fingerprint within the atmospheric background. A common feature across all cases is that contrail regions stand out distinctly, exhibiting RHice values near 100 % (Naiman et al., 2011; Unterstrasser et al., 2017). This near-saturation condition is particularly evident in younger contrails, where the exceptionally high number concentration of small ice crystals – with their large surface-area-to-volume ratio – rapidly depletes atmospheric supersaturation in the core. This behavior is a key characteristic of persistent contrails in ISSRs and should be considered when analyzing their evolution. Unterstrasser et al. (2017) explained that if excess water vapor is not continuously supplied to the contrail core via updraft as the contrail ages, local relative humidity tends to fall below saturation. This drop in humidity leads to the in situ loss of smaller ice crystals due to sublimation.
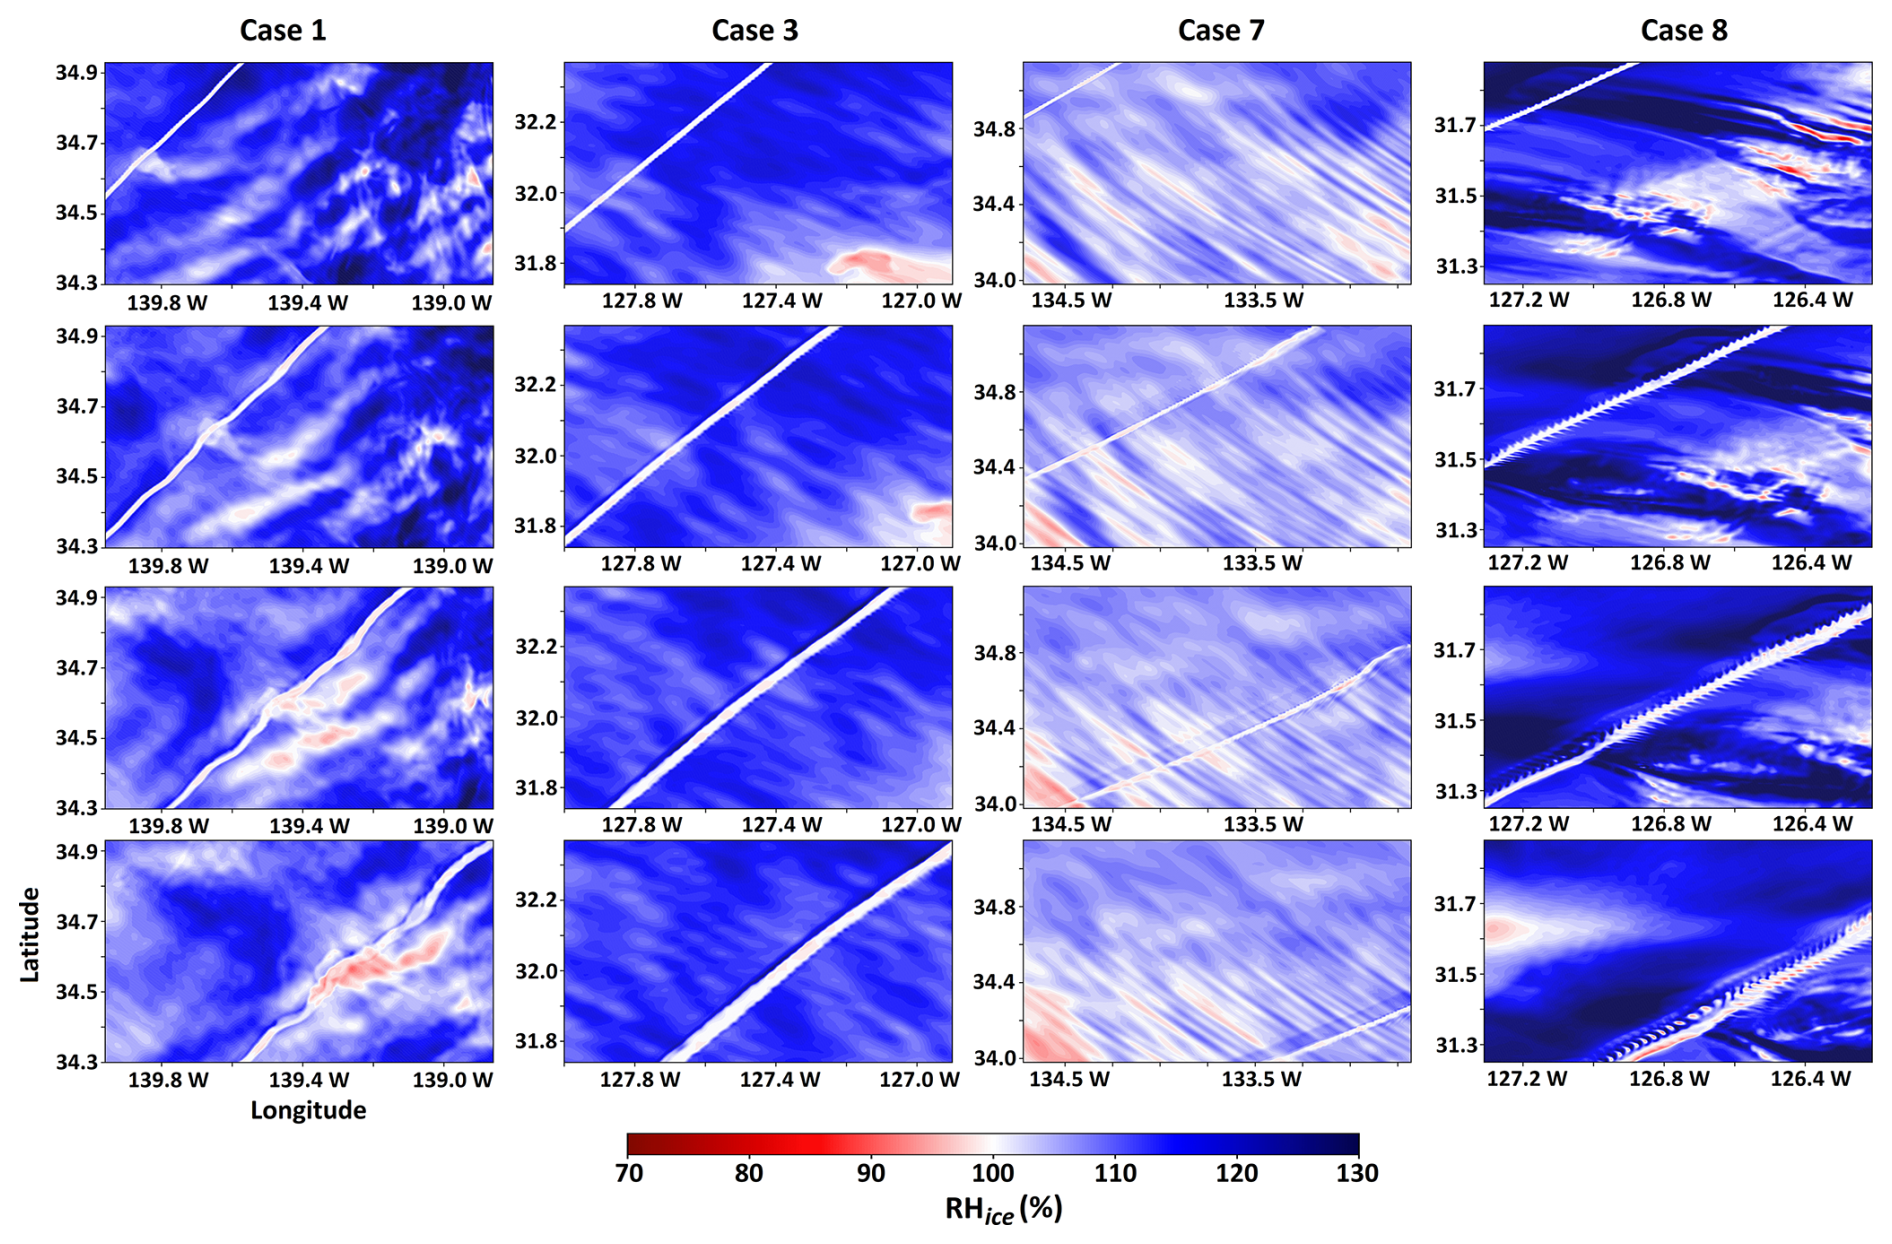
Figure 6Horizontal spatial distribution of relative humidity with respect to ice (RHice) at flight altitude in cloudy ice-supersaturated background regions across multiple simulations (Cases 1, 3, 7, and 8 from left to right). The snapshots represent different contrail ages (10, 30, 50, and 70 min after contrail initialization). A distinct reduction in RHice to approximately 100 % is simulated within the contrail region, often accompanied by a narrow and localized zone of elevated ice supersaturation at the interface between the contrail and the surrounding ice-supersaturated environment.
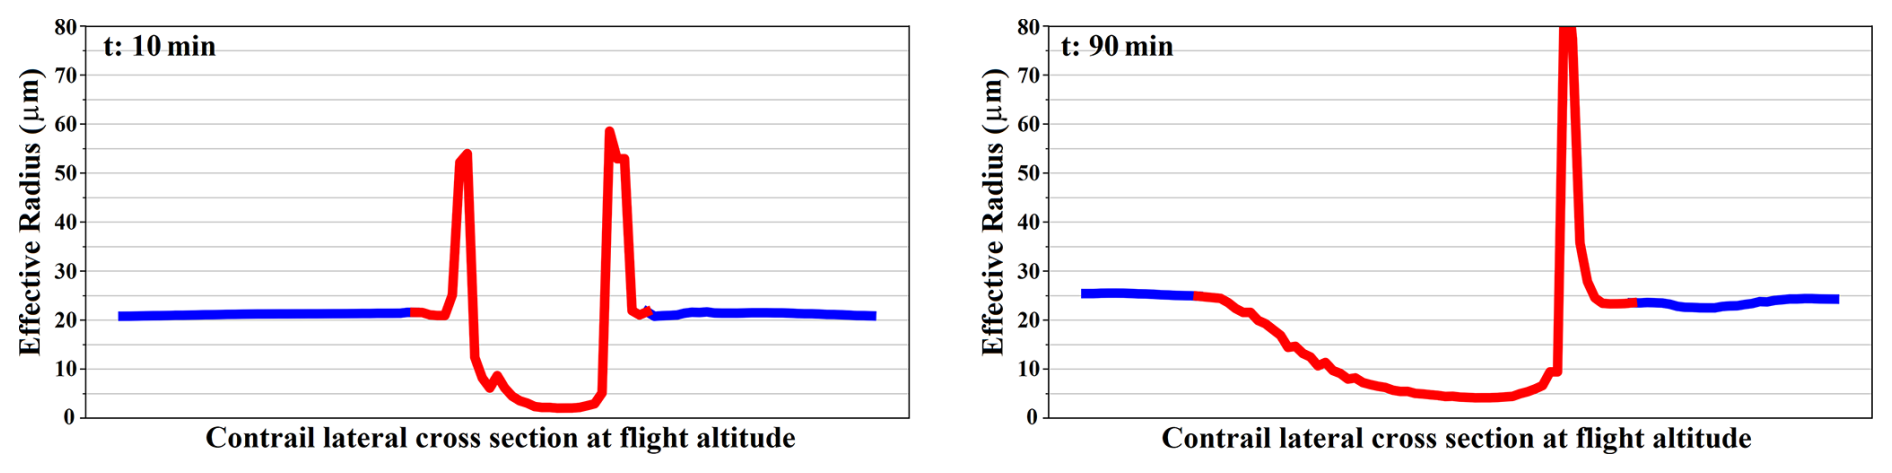
Figure 7Lateral cross-section of the ice crystal effective radius at flight altitude. These samples illustrate a general pattern observed in our simulations; however, this structure is not uniformly present along the entire contrail flight track. The red curve represents the contrail region, while the blue curve corresponds to the surrounding cloudy background.
Another feature apparent in our simulations, though spatially confined, is the presence of elevated RHice values along the lateral edges of the contrail, particularly at the boundary between the contrail and the background ice-supersaturated cloudy region. This localized increase in RHice is likely driven by turbulence and mixing across the sharp gradient in ice crystal concentration between the contrail and the surrounding natural cloud. Figure 7 presents a representative example of the ice crystal effective radius of a contrail within a natural cloudy region at flight altitude. The exact contrail width is case-specific, but the consistently much smaller crystal sizes in the contrail core compared to the surrounding cloud reflect a typicall pattern in our simulations. Inside core, crystals remain mainly very small (< 5 µm) even after 90 min of evolution, confirming that the contrail signal is retained in the core during the analysed dispersion phase. This persistence reflects the initially high number concentration that rapidly consumes available water vapor and limits subsequent growth. This persistence of small crystals is another defining feature of contrails, shown in different observational studies (Voigt et al., 2010; Wang et al., 2023). At the contrail edges, transient peaks of much larger crystals occasionally appear in our simulations, likely related to the elevated RHice in these regions (see Fig. 6). Although sedimentation rates were not explicitly analyzed in this study, the occurrence of such large edge crystals suggests enhanced local sedimentation with possible implications for contrail evolution.
While these simulations reproduce the key characteristics of linear contrails in ISSRs – namely smaller ice crystals relative to the surrounding natural cloud and a reduction in relative humidity toward saturation within the contrail core – detailed aspects such as contrail morphology, turbulence-induced effects, and small-scale mixing during expansion are not the focus of this study. Instead, the following sections take a broader perspective, investigating how identical ice-crystal perturbations evolve under different atmospheric conditions, and how the evolution of Ni and IWC proceeds within the contrail. The objective is to identify the key environmental factors governing persistent-contrail development in cloudy, ice-supersaturated regions.
3.3 Contrail Evolution within Ice Supersaturation Cloudy Regions: Differences Between Perturbation and Control Runs
Cold and humid conditions that satisfy the Schmidt–Appleman criterion and support persistent contrails are well recognized as key factors in identifying flight avoidance regions for planning mitigation strategies. Here, in this section, we go beyond these criteria by comparing persistent contrail development under varying background conditions, to better understand the factors influencing their evolution and atmospheric impact. This section examines the temporal evolution of contrails across eight simulations by comparing perturbation runs (with contrails) to control runs (cloudy background without contrails). The duration of each simulation depends on when the contrail exits the domain.
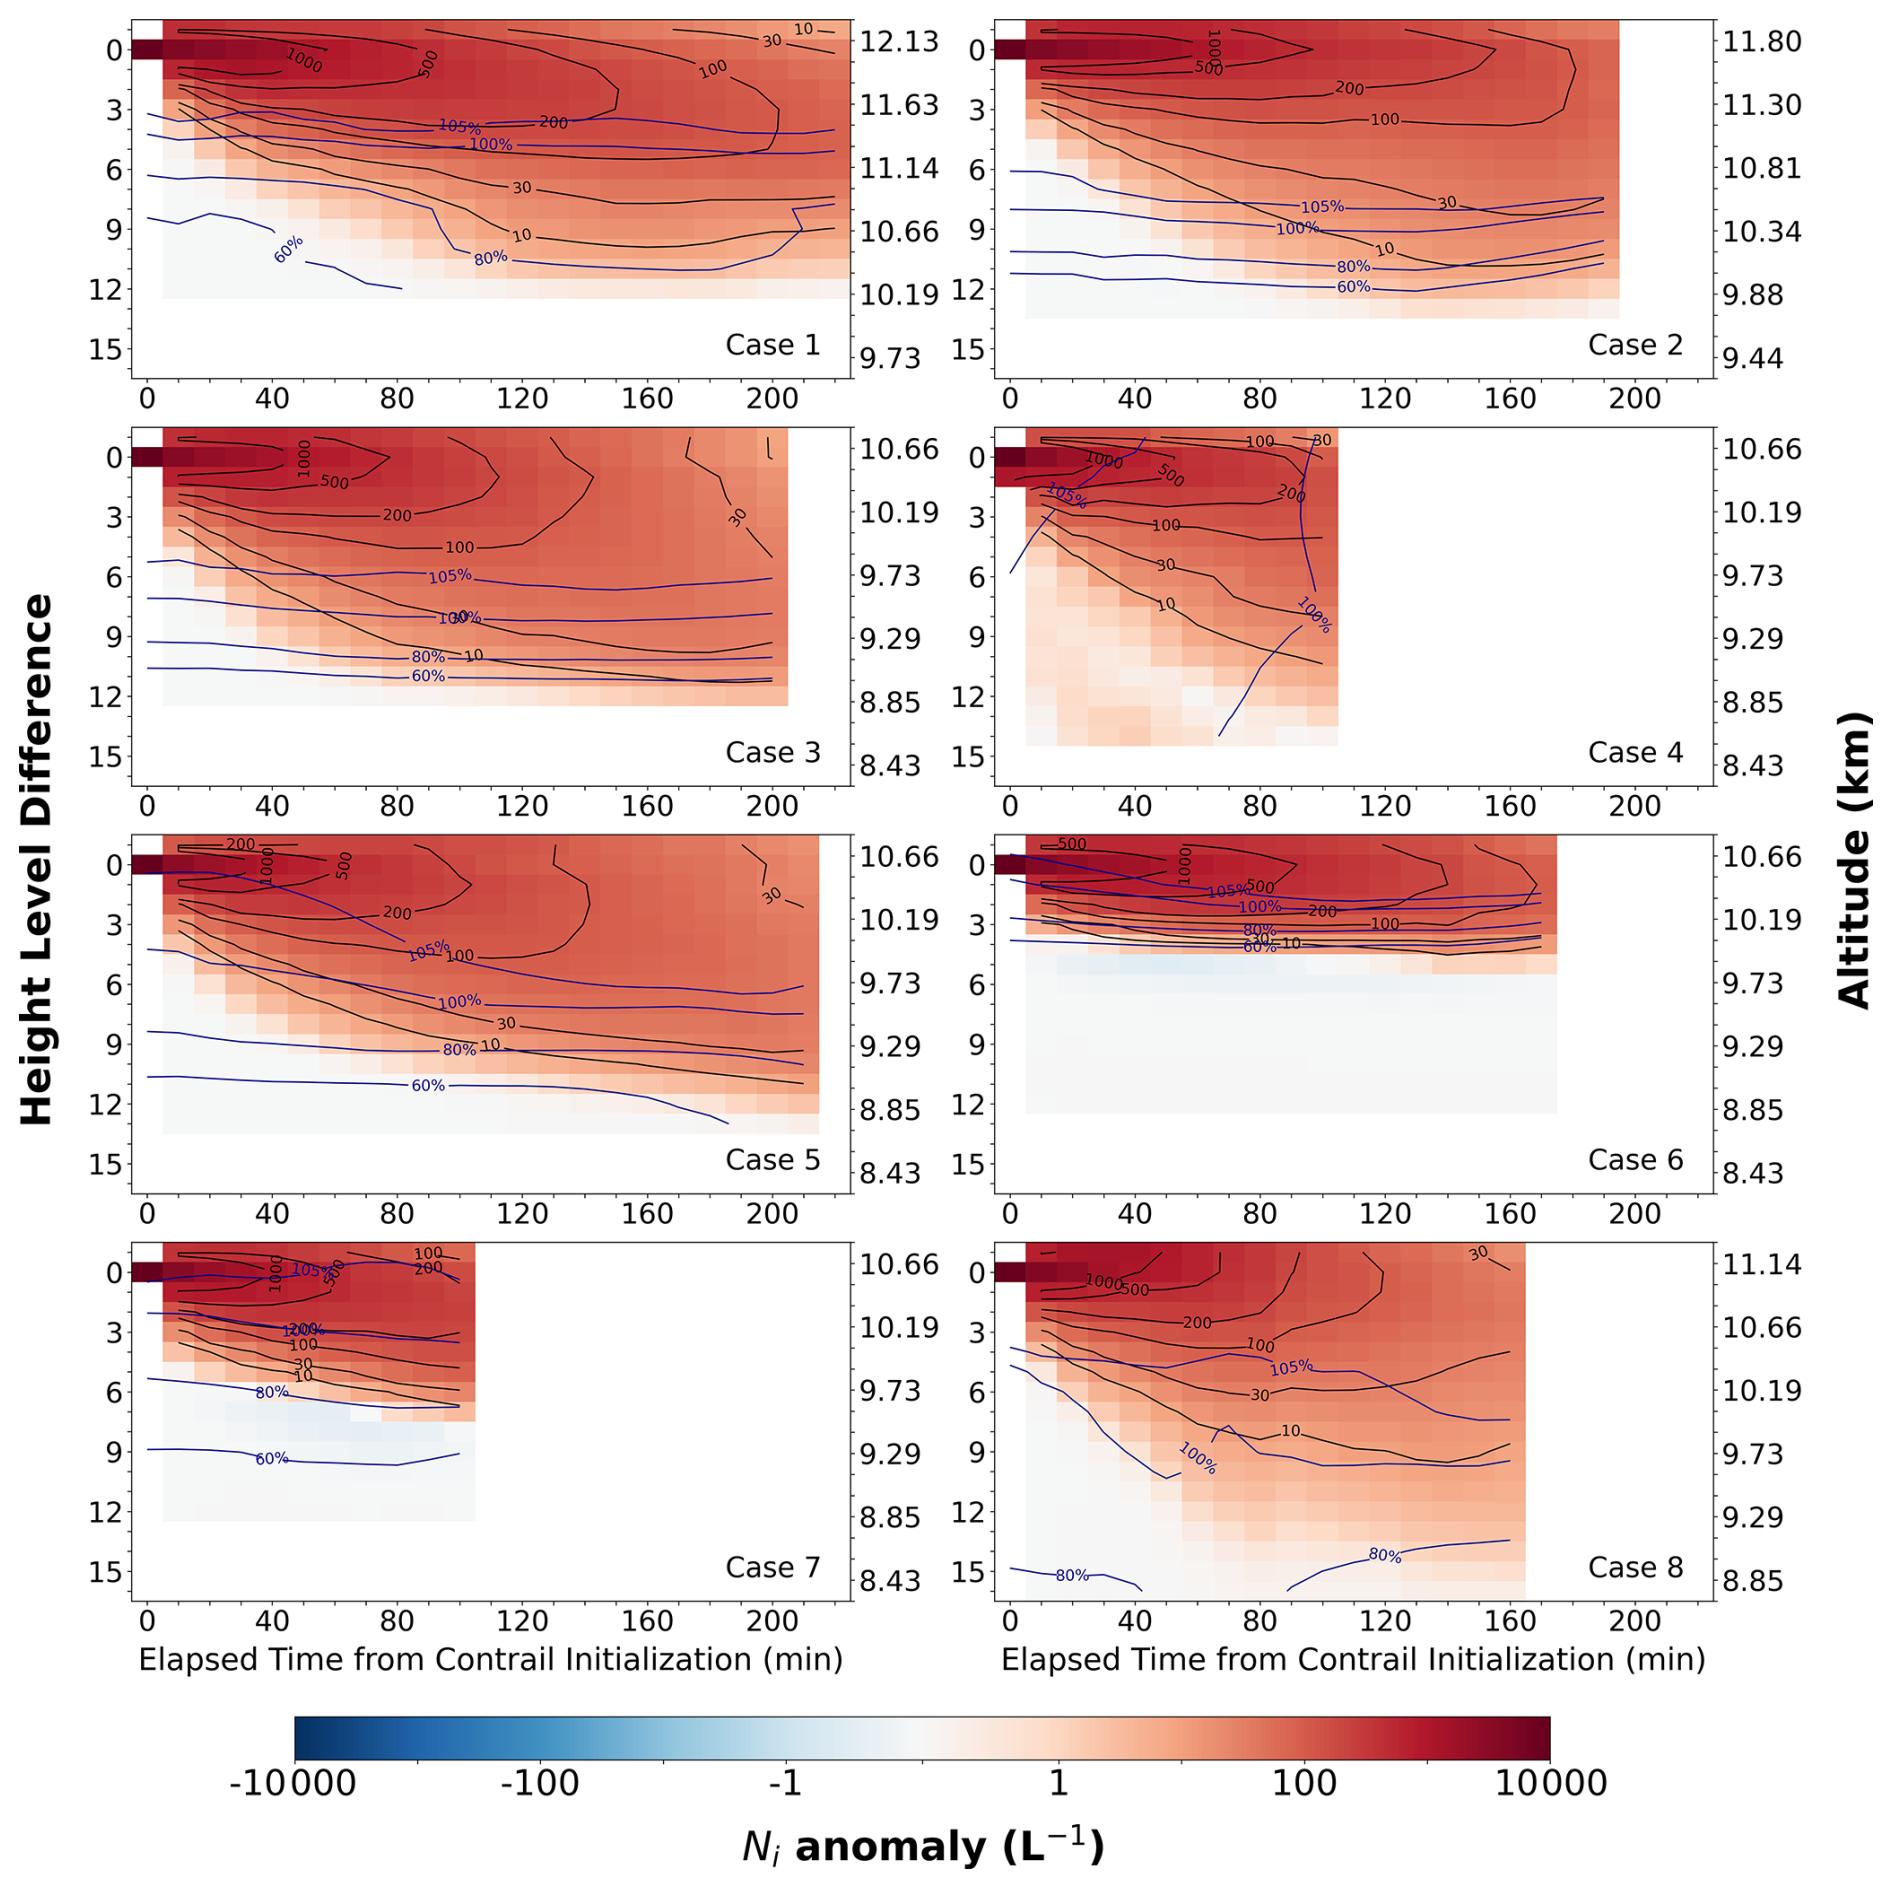
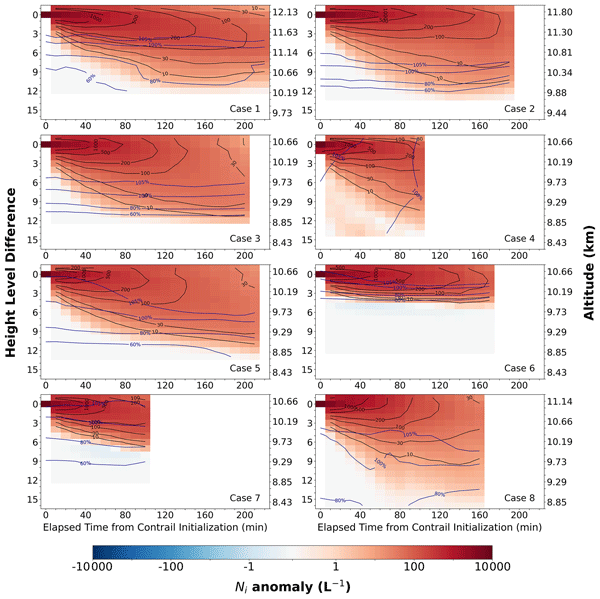
Figure 8Time–height evolution of contrail ice crystal number concentration anomalies (ΔNi; perturbation minus control) for different cases, defined as the difference between the perturbation (contrail) and control (natural cloud) runs over the same region. The x-axis shows time since initialization; the y-axis shows height level differences from flight height. Black contours denote Ni anomalies; blue contours show RHice (%) from the control run. Warm colors indicate positive Ni anomalies; cool colors indicate negative ones.
Figures 8 and 10 show Time–Height plots of perturbation–control differences in the contrail region. The x-axis indicates elapsed time since initialization, and the y-axis shows model levels relative to flight altitude (labeled as zero), with positive values below it. Each grid cell represents the horizontally averaged anomaly (perturbation minus control) at a given time and height. For clarity, perturbation–control differences in ice crystal number concentration and ice water content are denoted hereafter by ΔNi and ΔIWC, respectively. Here, the “contrail region” is defined diagnostically from the perturbation relative to the corresponding control simulation and should not be interpreted as a separately prognosed contrail-ice class in the microphysics scheme. Because values are averaged over the entire contrail extent, horizontal variability is not equal between the cases. This framework highlights contrail-induced atmospheric modifications and allows us to assess their vertical development and temporal evolution, thereby identifying the key factors controlling contrail growth in ISSRs.
3.3.1 Contrail induced anomalies in Ice Crystal Number Concentration Under Various Weather Conditions
Ice crystal number concentration aomaly (ΔNi; perturbation minus control) is shown in Fig. 8. At flight altitude in Case 1, the ΔNi remains above 1000 L−1 for up to 60 min after initialization, with more than 20 % of the contrail area still exceeding this threshold at that time. By 90 min, ΔNi remains above 500 L−1 across most of the contrail, while 15 % of the area still exhibits ΔNi values exceeding 1000 L−1. At 120 min, ΔNi decreases further, with values remaining above 200 L−1, though a small fraction (0.5 %) of the area continues to exceed 1000 L−1. By 150 min, ΔNi exceeds 100 L−1 in approximately 30 % of the area, with 0.5 % maintaining values above 500 L−1.
At flight altitude in Case 2, ΔNi remains above 1000 L−1 for up to 60 min after initialization, with over 30 % of the contrail area exceeding this threshold at that time. By 100 min, ΔNi decreases to values above 500 L−1, while 20 % of the area still retains ΔNi values exceeding 1000 L−1. At 150 min, ΔNi remains above 200 L−1, with 0.5 % of the area still maintaining values above 1000 L−1. By 180 min, ΔNi remains above 100 L−1, with 25 % of the area exceeding this value, and 0.5 % of the area still exhibiting ΔNi values greater than 500 L−1. These results demonstrate a gradual decline in ΔNi over time, while the contrail persists with a still substantial ΔNi for over 2 to 3 h, albeit at progressively lower concentrations.
In Case 6, Ni remains elevated at flight altitude for an extended period, with values exceeding 500 L−1 up to 90 min and remaining above 200 L−1 until 140 min. Among all eight simulations, these three cases (1, 2, 6) exhibit the most prolonged presence of high Ni at flight altitude. This suggests a delicate balance where ice crystals are neither too small nor the air too dry to induce rapid sublimation, while also preventing excessive humidity and rapid crystal growth that would accelerate sedimentation. Comparing the contours of Case 1 and Case 2 reveals distinct differences in their vertical evolution. In Case 1, the 200 L−1 contour extends up to four layers below flight altitude, whereas in Case 2, it reaches only two. However, Case 1 does not ultimately exhibit greater vertical expansion. Over time, Case 2 develops a larger vertical extent, as indicated by the 30 and 10 L−1 contours. This difference is primarily attributed to the greater average ice-supersaturated (ISS) thickness below flight altitude in Case 2, which supports sustained contrail growth and facilitates continued vertical development. Evaluating the vertical development of Case 6 and Case 7 reveals that their growth is more restricted and shallower than in other cases. This limitation stems from the thin ISS layer below flight altitude, which constrained crystal growth as the contrails spread downward. In contrast, in all other cases the ΔNi extends well below the saturated layer, indicating that contrail ice crystals had more opportunity to grow while sedimenting in saturated air. By the time they reached the subsaturated layer, these larger crystals were able to persist, enabling the contrail to develop beyond the saturated region, as evident in Cases 1, 3, and 5. The vertical development of Case 7 is somewhat larger than in Case 6, with ΔNi contours decreasing more gradually and without the sharp reduction observed when Case 6 enters the subsaturated region. This contrast reflects differences in how relative humidity falls below the saturation threshold – gradual in Case 7 but abrupt in Case 6. Observational studies, such as Li et al. (2023), have shown that contrail cirrus can persist in slightly ice-subsaturated air, rather than being restricted to strictly saturated or supersaturated conditions. Consistent with this, the 80 % relative humidity contours in Case 1 decline only slowly after 100 min, indicating a much more gradual transition from saturation compared to earlier in the simulation. This slow decrease is mirrored in the ΔNi patterns, particularly in the 30 and 10 L−1 contours, reinforcing that the rate of humidity decline in subsaturated air strongly influences contrail growth and ice crystal survival.
Beyond these ΔNi variations, a broader implication is that the thickness of the supersaturated layer below flight altitude influences contrail vertical development in two related ways:
-
A thicker supersaturated layer provides sedimenting ice crystals with additional supersaturated air for continued growth, and
-
A deeper supersaturated layer allows ice crystals to become large enough to survive in slightly subsaturated air, enabling contrail extension beyond the saturation layer.
Contrail Evolution and Ice Crystal Survival in a Deep Supersaturated Layer
The control run for Case 4 reveals a deep layer of near-saturated conditions, as indicated by the relative humidity contours (Fig. 8). The vertical cross-section of IWC in the background weather condition shows high values extending from lower altitudes upward (Appendix Fig. A1), consistent with cloud formation driven by strong vertical transport. As shown later in this study the natural cloud in Case 4 has a strong greenhouse effect related to its high optical thickness. These characteristics point to a liquid-origin ice cloud (Krämer et al., 2016), making Case 4 a clear example of this cloud type.
In this case, the contrail is initialized in a deep but only slightly supersaturated layer. Such conditions should, in principle, permit unrestricted vertical extension through fall streak development, since the ISS layer imposes no thickness constraint. Yet the 30 and 10 L−1 ΔNi contours in Fig. 8 show a vertical extent comparable to cases with a thinner supersaturated layer (e.g., Cases 3, 5, and 8), indicating that additional factors may be limiting the contrail's vertical growth. While ISSRs are essential for persistent contrail formation, but the mere presence of an ISSR does not determine how far contrails may ultimately grow. The following sections examine additional atmospheric variables that shape contrail growth and their radiative effects.
In Case 4, ΔNi at flight altitude decreases more rapidly than in other cases, as seen in the 1000, 500, and 200 L−1 contours. While part of this reduction results from horizontal spreading, dilution, and vertical extension through fall streak development, the comparatively higher rate of decrease suggests that a larger fraction of ice crystals undergo in-situ sublimation at flight altitude. The distinguishing feature in this case is a continuous decrease in relative humidity from the beginning of the simulation (blue contours in Fig. 8 and panel c in Fig. 2). Unlike in cases with higher or sustained humidity, where crystals undergo rapid initial growth (Unterstrasser, 2016), ice crystals here remain growth-limited from the outset and, without a continuous water vapor supply, a larger fraction sublimate before they can develop further.
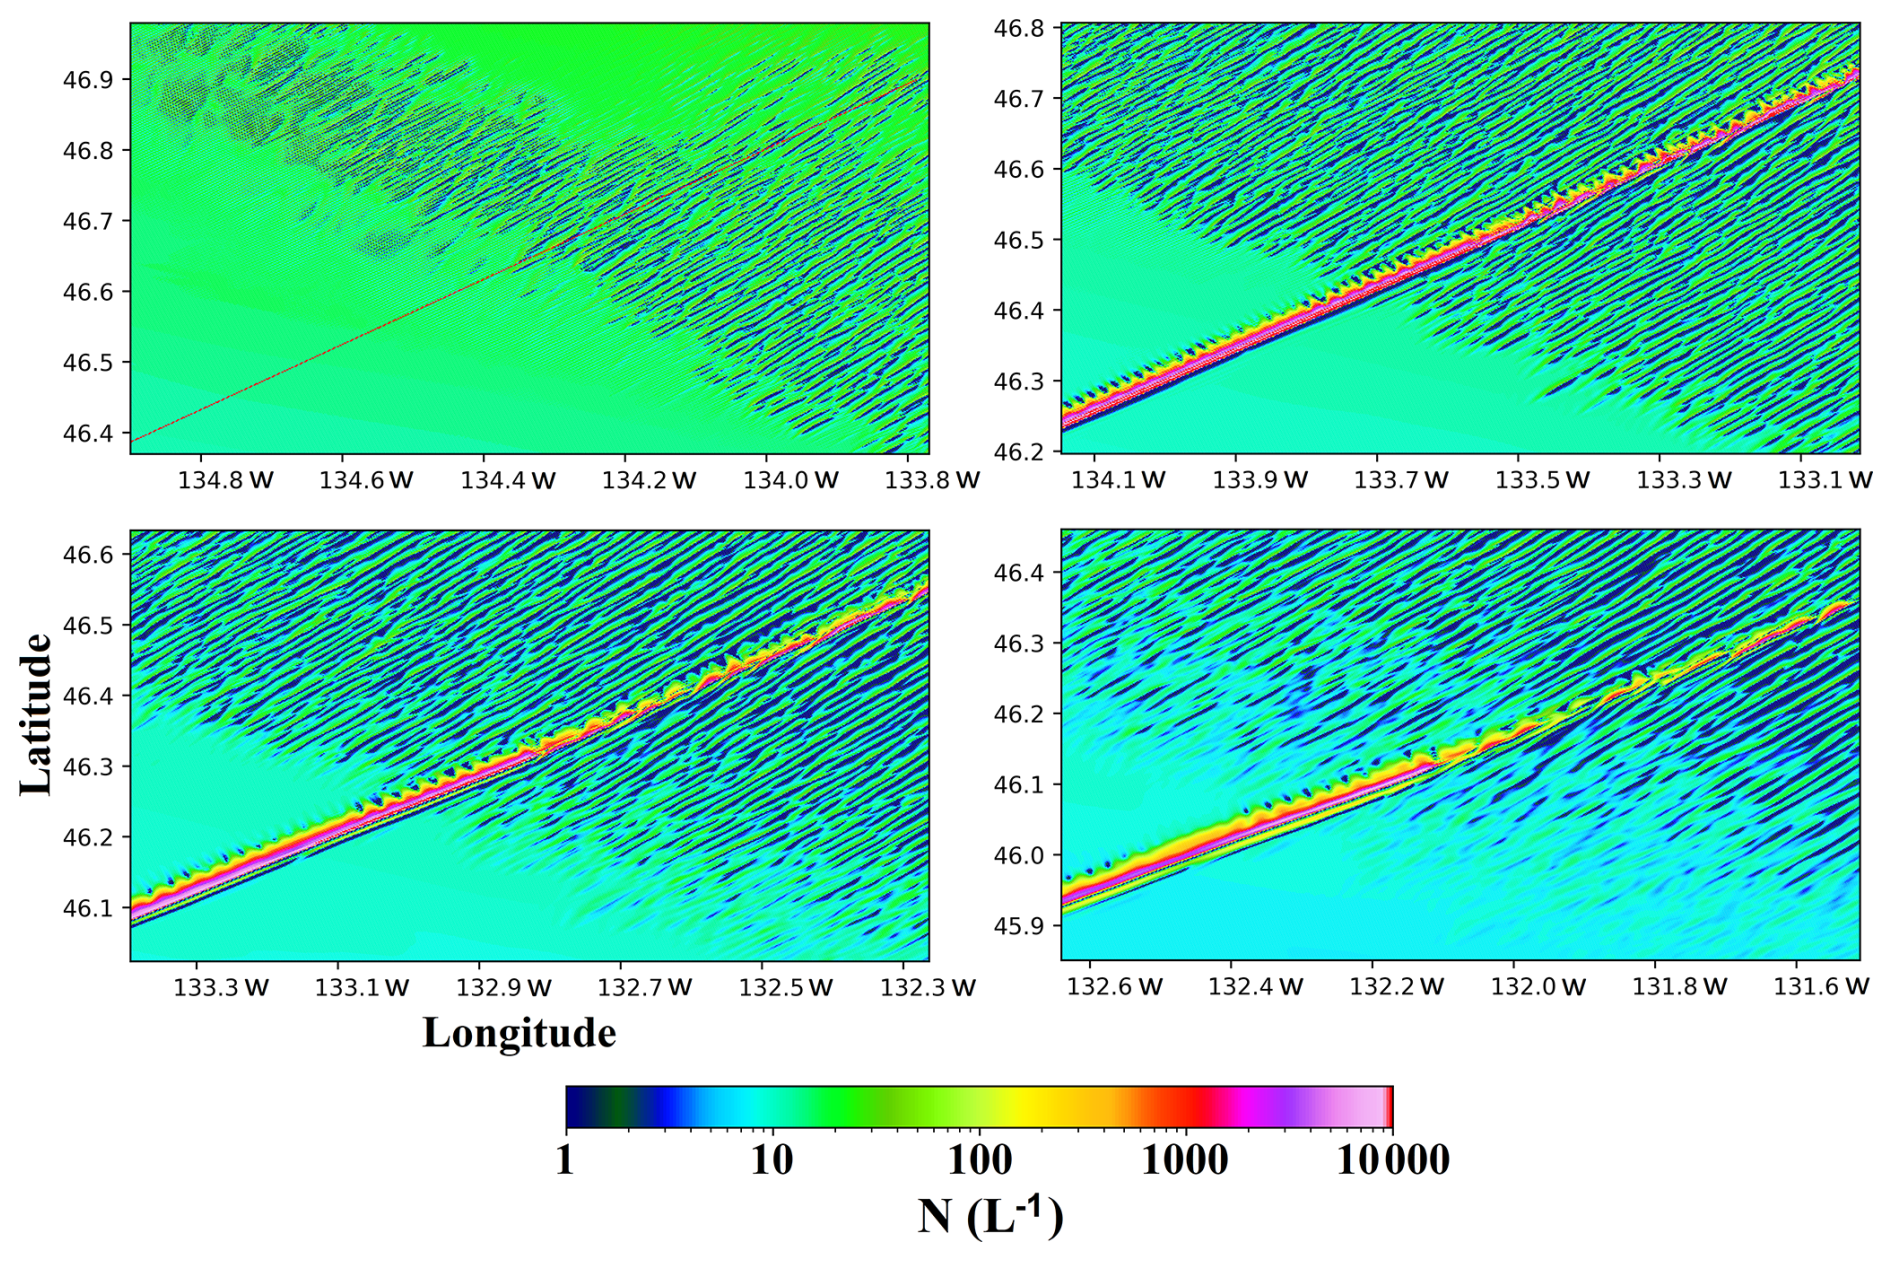
Figure 9Horizontal spatial distribution of contrail ice crystal number concentration at flight altitude within a thick supersaturated layer in Case 4, alongside the evolution of fine-scale gravity wave-induced ice clouds. The panels correspond to contrail ages of 0, 20, 40, and 60 min (from top left to bottom right), respectively, representing the moment of contrail initialization and subsequent times. The figure is shown on the original triangular ICON model grid.
Moreover, part of the contrail was initialized within a fine-scale gravity-wave–induced ice cloud and remained in the simulation domain for about 60 min before advecting out (Fig. 9). Gravity wave dynamics generate small-scale fluctuations that create localized subsaturated regions and restrict mixing with the surrounding supersaturated environment. While contrails in other cases can sustain growth by drawing in water vapor from the edges through mixing with ISSRs, this inhibited spreading likely enhanced ice crystal sublimation here.
Atmospheric Stability and Contrail Ice Crystal vertical Growth
Contrail ice crystals in Case 8 exhibit a pronounced upward development above flight altitude (Fig. 8). While some vertical extension occurs in all cases due to turbulence, mixing, and wind shear, the ΔNi countours 1000, 500, and 200 L−1 rise more prominently here. As previously noted, young contrails act as strong moisture sinks, leading to high deposition rates that are evident in the RHice fields (Fig. 6). This deposition reduces humidity toward saturation and releases latent heat, producing a small positive temperature anomaly (Appendix A2). The resulting temperature increase is minor – typically only a few tenths of a degree – and its buoyancy effect is likely negligible compared to background wind shear, turbulence, and the overall stability of the upper troposphere.
Case 8 shows a distinctly lower Brunt–Väisälä frequency at flight altitude in the control run (Table 1), indicating weaker atmospheric stability. In such conditions, even small temperature perturbations from latent heat release can produce relatively large vertical displacements. The evolution of this case therefore suggests that atmospheric stability may influence not only the cross-sectional area of young contrails during the vortex phase (Unterstrasser et al., 2017), but also may influence their subsequent vertical expansion as they develop into contrail cirrus.
3.3.2 Contrail induced Ice Water Content anomalies Under Various Weather Conditions
Figure 10 is similar to Fig. 8, but shows the ice water content anomaly (ΔIWC) – that is, the change in IWC within the contrail region in the perturbation run relative to the corresponding region in the control run. In contrast to ΔNi, the ΔIWC increases as the contrail ages. The maxima of IWC and Ni anomalies generally do not coincide in space or time, with Case 4 as the only exception. In the other simulations, the maximum IWC anomaly occurs well below flight altitude. The ΔIWC contours suggest that the thickness of the ice-supersaturated layer beneath the contrail strongly controls both the location and magnitude of this peak, with the maximum positioned just above the subsaturated layer. In Cases 2, 3, 5, and 8, which have thicker ISS layers below flight altitude, contrails reach peak ΔIWC about 2.5 h after formation. Even in Cases 6 and 7, where the ISS layer is much thinner, the maximum occurs after roughly 90 min. Overall, in contrail cirrus (long-lived contrails), the ΔIWC maximum tends to occur near the base of the supersaturated layer, while the ΔNi maximum at that time remains close to flight altitude.
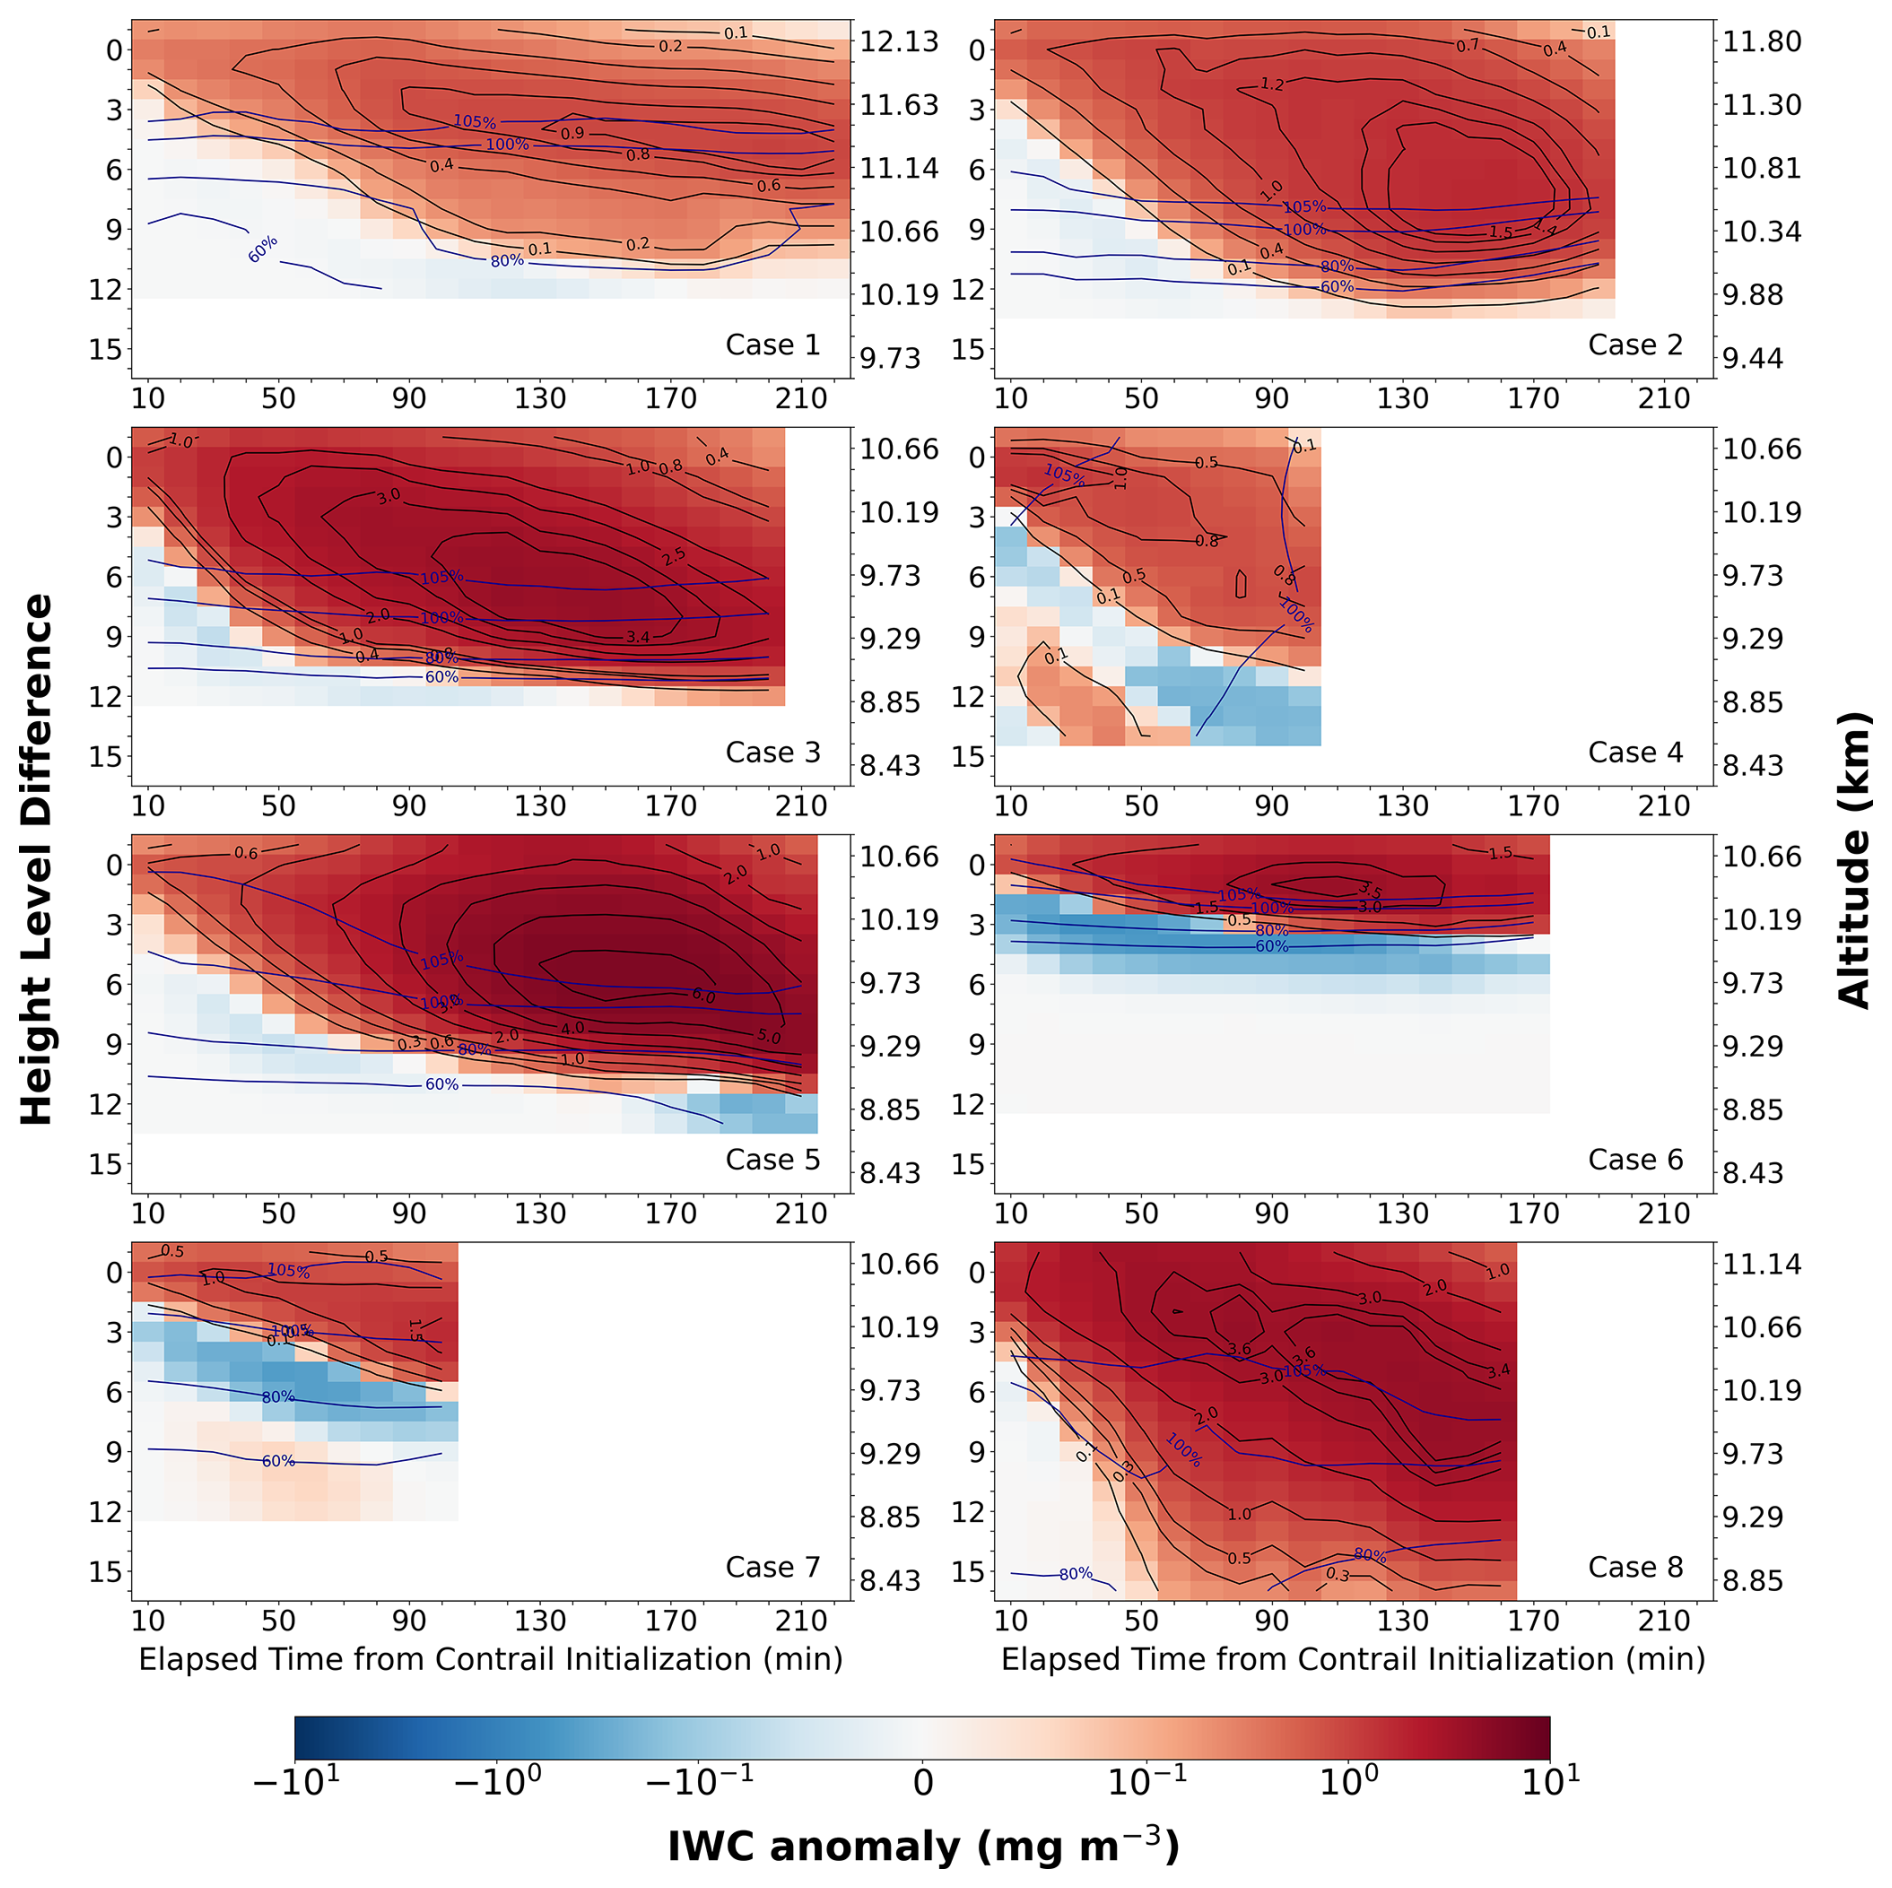
Figure 10Time–height evolution of contrail ice water content anomalies (ΔIWC) for different cases, defined as the difference between the perturbation (contrail) and control (natural cloud) runs over the same region. The x-axis shows time since contrail initialization; the y-axis shows height level differences from flight height. Black contours denote IWC anomalies (mg m−3), and blue contours indicate RHice (%) from the control run. Warm colors indicate positive anomalies; cool colors indicate negative ones.
When comparing the cases, the largest ΔIWC is simulated for Case 5, where growth starts gradually at low values and peaks around 160 min after contrail initialization. The maximum anomaly, averaging 6 mg m−3, occurs just above the saturation contour. Case 3 follows a similar growth pattern, albeit with lower peak values.
Case 8 reaches a maximum similar to Case 3, but with a different development over time. The ΔIWC increases rapidly at first, reaching 2 and 3 mg m−3 much earlier, after which ΔIWC growth decelerates. Another distinct feature of this case is its much stronger vertical growth (fall streak) compared to all other cases, despite the ISS layer beneath not being the deepest. Here, the gradual transition between the 100 % and 80 % RHice contours plays a key role in sustaining the downward growth of the contrail. This indicates that, beyond ISS thickness beneath flight altitude, the structure of the slightly subsaturated region – especially its depth and the rate of humidity decrease – strongly influences contrail ice growth and the resulting IWC anomaly and facilitates continued descent of the fall streak. Hence, when planning flight management strategies, it is essential to account not only for the vertical structure and thickness of ISSRs beneath flight level, but also for the characteristics of the slightly subsaturated layer below, which influence contrail growth potential. This aligns with the study of Marjani et al. (2022), which detected contrail signals a few hundred meters below flight altitude in cloudy regions using satellite-based observations; similar evidence was reported by Seelig et al. (2025), who observed enhanced extinction and ice water content below flight altitude in cirrus perturbed by embedded contrails.
By contrast, several cases exhibited only weak ΔIWC. Aviation-induced IWC is weakest in Cases 1, 2, and 4 (Case 7 is omitted from this discussion because the contrail advected out of the domain before its development could be analyzed). The control simulations for Cases 1 and 2 (Appendix A1) show very low background IWC, particularly near flight altitude. These two cases involved contrail initialization at higher altitudes (Case 1 at 12 138 m and Case 2 at 11 800 m) under extremely low ambient temperatures (T<215 K). Such cold conditions likely explain the weaker contrail-induced IWC anomalies in these cases. Case 4 also recorded a low ΔIWC, but under markedly different background conditions. Here, the contrail formed at 10 664 m with an average temperature of about 221 K – roughly 10 K warmer than Cases 1 and 2 – and within a deep ISSR. Unlike those cases, the control run shows relatively high background IWC, indicating a background environment capable of sustaining higher ice water content due to the warmer temperatures. Despite this contrast, the contrail-induced IWC anomaly remained among the lowest.
3.3.3 Excess Water Vapor, Contrail Lifetime and Growth Potential
Although both contrails and natural ice clouds consist of ice crystals, their microphysical properties differ markedly. Young persistent contrails are characterized by exceptionally high ice crystal number concentrations composed of extremely small ice crystals – a feature rarely observed in natural clouds. Owing to their large surface-area-to-volume ratio, these numerous small crystals have very short deposition and sublimation timescales. As a result, young persistent contrails efficiently consume available moisture in ISSRs, rapidly depleting excess water vapor and creating a near-saturated environment at flight altitude (as was shown in Fig. 6). However, natural ice clouds do not necessarily deplete excess water vapor rapidly upon formation. Observations show that highly supersaturated conditions often persist within natural cirrus clouds (Krämer et al., 2009; Diao et al., 2014), highlighting a fundamental distinction from contrails. Therefore, the excess water vapor mass – defined here as the mass of water vapor exceeding the saturation threshold over ice at a given temperature and pressure – plays a critical role in contrail evolution within ISSRs. This parameter strongly influences contrail-induced IWC anomalies, as discussed in detail by Unterstrasser (2016).
In this study, the saturation vapor pressure over ice, esi, was computed using the formulation implemented in the ICON-2.6.6 version used for our simulations, in order to maintain internal consistency between the post-processed excess-water-vapor diagnostic and the model thermodynamic fields. The corresponding saturation vapor density, ρsi, was then obtained from the ideal gas law (Eq. 2), where Rv=461.5 J kg−1 K−1 is the specific gas constant for water vapor and T is the temperature in Kelvin. The actual water vapor density was calculated from the specific humidity, qv, and air density, ρ, as in Eq. (3). Excess water vapor mass was then determined as Eq. (4)
Role of Excess Water Vapor in Contrail Evolution and Microphysical Properties
Figure 11 illustrates the time-height evolution of excess water vapor density (mg m−3), averaged over the contrail region in the control simulations (only natural cloud). This representation reflects the moisture availability in the contrail region without contrail influence.
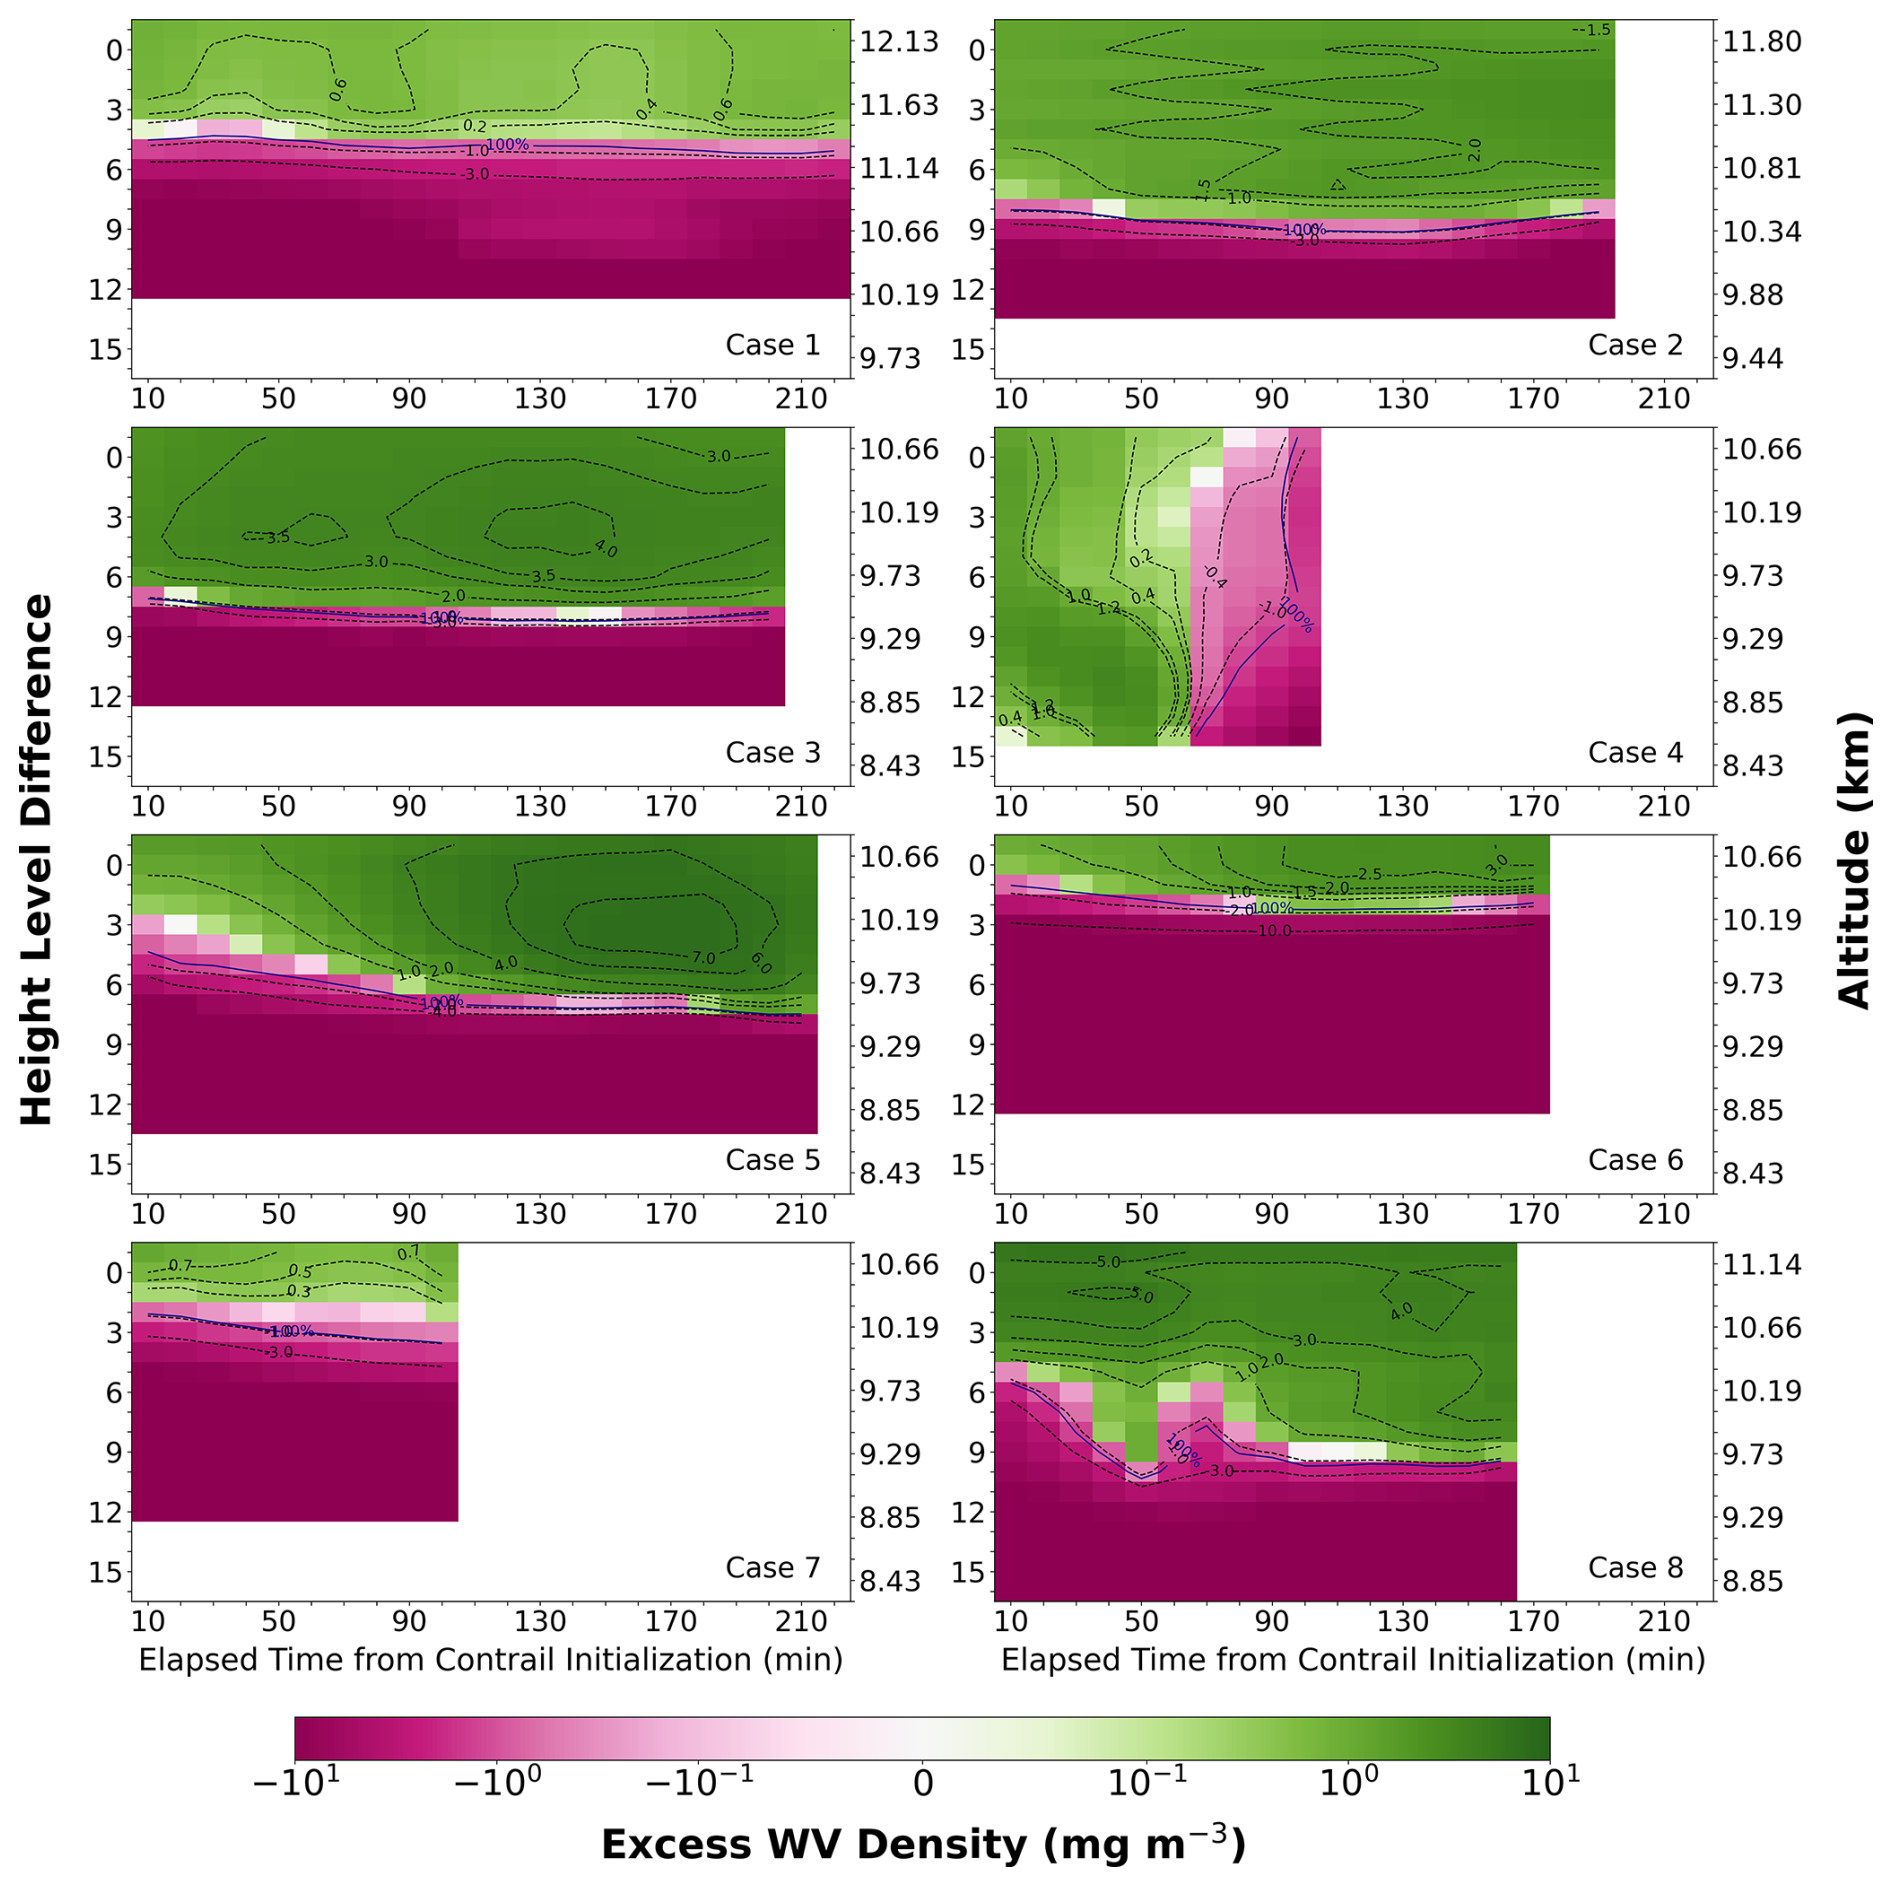
Figure 11Time–height evolution of excess water vapor density (mg m−3) in the contrail area for different cases in the control runs, representing background conditions without contrail influence. The x-axis shows elapsed time after contrail initialization, while the y-axis shows height relative to flight altitude (with 0 at flight level).
The largest IWC anomalies were simulated for Cases 5, 3, and 8, respectively, while Cases 1 and 2 were among the weakest. Case 4 showed a distinct pattern, with an initial increase in IWC followed by a gradual reduction over time (Case 7 is omitted from this discussion because the contrail advected out of the domain before its development could be fully analyzed). Notably, Cases 1, 2, and 6 were among those with the highest Ni, which remained elevated at flight altitude for an extended period. Cases 1 and 2 formed at higher altitudes (≈ 12 km) under very low temperatures (T<210 K). Although relative humidity was high (above 110 %), the absolute amount of excess water vapor is small (less than 2.5 mg m−3 throughout), owing to the cold conditions. This limited moisture supply restricted ice crystal growth, resulting in their persistence near flight altitude. Consistently, these two cases showed prolonged Ni anomalies at flight altitude but only minimal increases in IWC anomalies. In agreement, Gryspeerdt et al. (2024) reported that contrails forming at higher altitudes tend to persist longer and exhibit increased lifetimes. We note that our simulations assume a constant initial ice crystal number concentration, while in reality colder conditions at higher altitudes would likely activate more during the contrail formation.
Although both Cases 1 and 2 had limited excess water vapor, Case 2 showed slightly higher values and a distinct temporal pattern: a gradual, steady increase that sustained moisture supply to the contrail region. This behavior is consistent with Unterstrasser et al. (2017), who highlighted the role of sustained moisture availability – often linked to prolonged but weak updrafts – in supporting contrail persistence. Consequently, Case 2 maintained a high ice crystal number concentration throughout the 3 h simulation and exhibited greater IWC growth than Case 1.
A similar trend was observed at flight level in Case 6, where excess water vapor initially remained low (below 1 mg m−3) but gradually increased over time, supporting relatively longer ice crystal persistence at flight altitude compared with other cases of similar altitude and temperature.
In both Cases 5 and 3, the contours show a gradual increase over time, but Case 5 begins at lower values and eventually exceeds those of Case 3. This excess water vapor availability is clearly reflected in the contrail-induced IWC anomalies over the contrail lifetime, though it may not be readily apparent when examining relative humidity alone.
In Case 8, the excess water vapor reached 4–5 mg m−3, yet the IWC anomalies did not attain comparable values. The high moisture supply was present mainly at the beginning of the simulation and then gradually diminished. This initial abundance accelerated ice crystal growth and sedimentation, causing the IWC anomaly to rise more rapidly than in other cases to intermediate values (∼ 3 mg m−3). However, it did not continue to develop further, illustrating that not only the total amount of available water vapor but also its temporal distribution strongly influences contrail growth potential.
As discussed previously, Case 4 exhibits unique behavior in both Ni and IWC anomalies. Here, the maxima occur only at a very early stage, after which the contrail gradually decays. This case, marked by a deep supersaturated layers with only moderate ice supersaturation, resembles the conditions usually linked to liquid-origin ice clouds. Both Figs. 11 and 2 show that the contrail initially formed and evolved in a region with positive excess water vapor, which gradually decreased over time and even reached negative values. Time series of excess water vapor density for the natural cloud (control run) and the contrail-affected region (perturbation run) is provided in Fig. A4. These results reveal that while excess water vapor declines gradually in the control run – likely due to weakening mesoscale updrafts – its depletion is markedly accelerated in the presence of a contrail. In the perturbation run, excess water vapor decreases sharply at first and then stabilizes near zero, consistent with the rapid initial increase in the IWC anomaly followed by stalled growth and, eventually, a decline as sublimation is required to maintain near-saturated conditions.
To summarize, these findings emphasize that the development potential of persistent contrails is determined not only by the presence of supersaturation conditions but also, critically, by the quantity and temporal availability of excess water vapor within ISSRs.
3.4 Radiative Effects of Individual Contrail Evolution in Ice-Supersaturated Regions
This section analyzes the radiative impacts – both longwave and shortwave – by comparing perturbation runs (with contrails) to control runs, focusing on the subregion directly influenced by the contrail. This approach ensures that the analysis isolates contrail-induced effects from the broader atmospheric variability within the full simulation domain.
3.4.1 Contrail-induced Thermal Radiative Effects
Figure 12 presents the time series of terrestrial infrared, or longwave (LW), radiative flux at the top of the atmosphere (TOA). Negative values indicate outgoing radiation and energy loss to space. Less negative values correspond to reduced outgoing radiation, signifying increased greenhouse effects and greater energy retention.
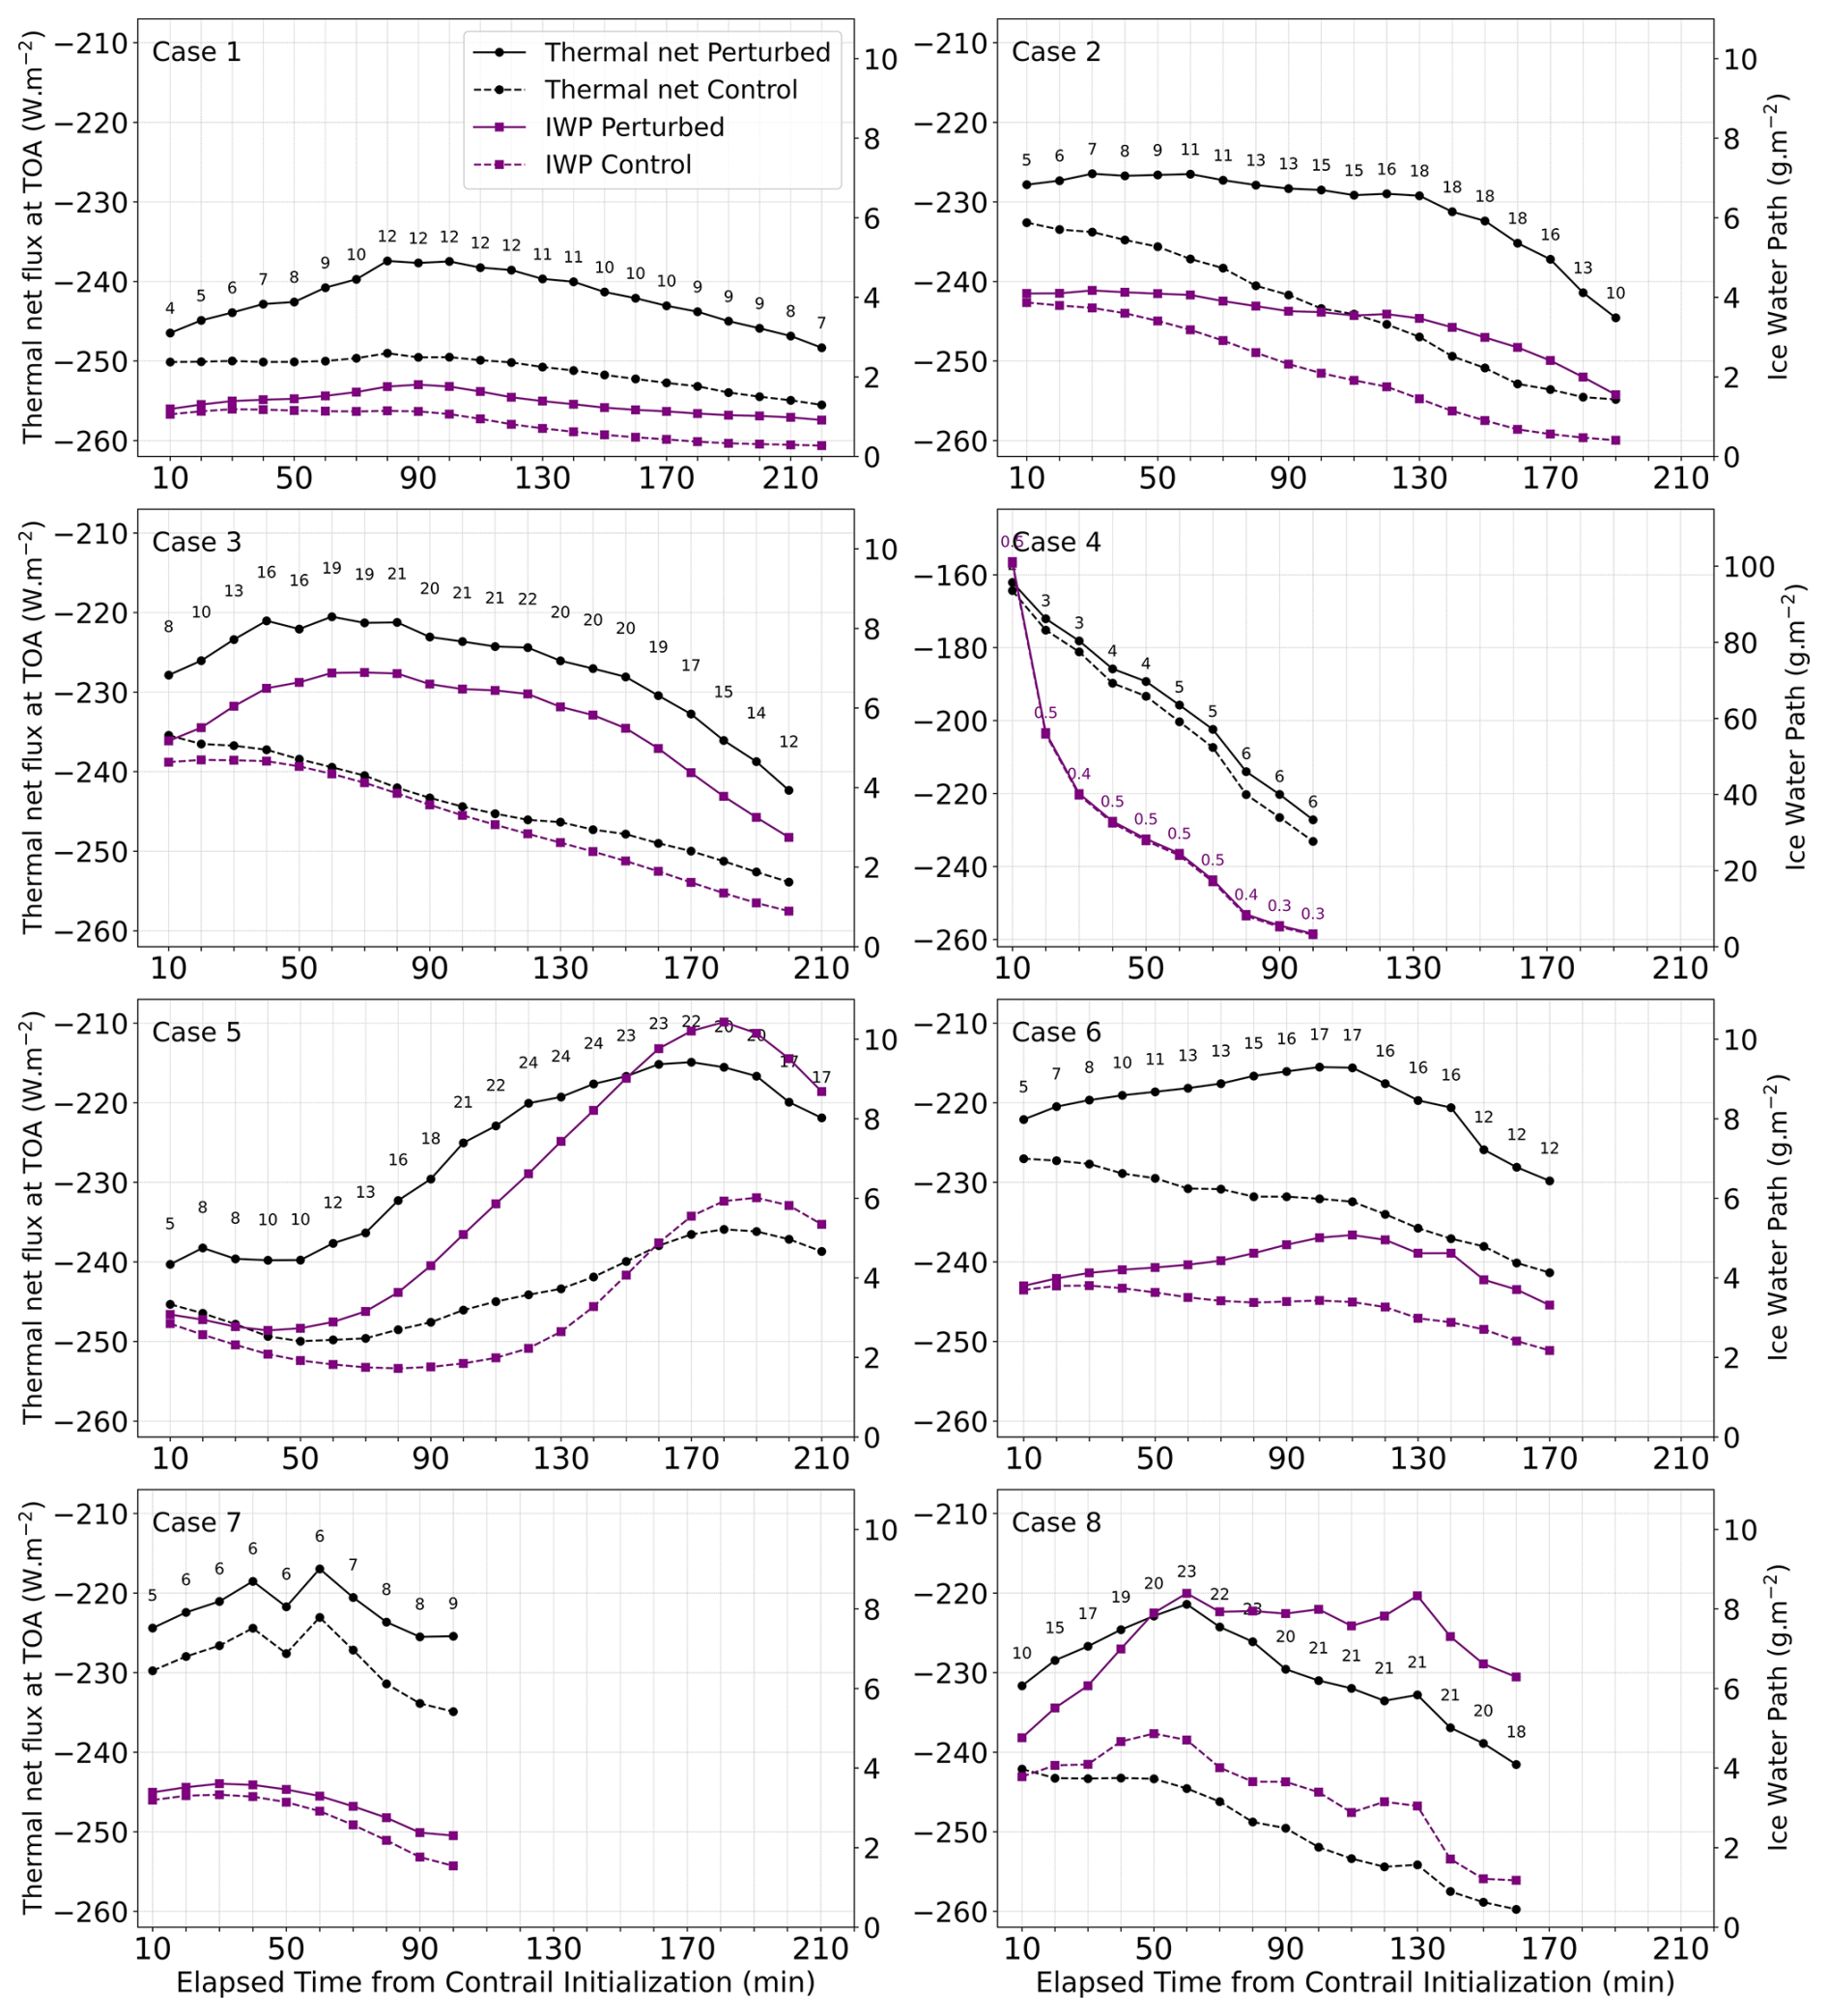
Figure 12Time series of thermal net flux at the top of the atmosphere (left y-axis) and ice water path (IWP, right y-axis) for control and perturbation simulations across eight cases. Circles denote thermal net flux and squares denote IWP, with solid lines for perturbation and dashed lines for control. Numbers above the thermal net-flux markers report the differences between perturbation and control simulations to facilitate comparison.
The smallest contrail-induced radiative impact is simulated for Case 4. This case features relatively high thermal flux in the control run, consistent with the presence of optically thick, liquid-origin ice clouds, which typically exert stronger radiative effect than in situ-origin cirrus clouds due to their higher optical thickness (Krämer et al., 2016). In contrast, the strongest impacts occur in Cases 3, 5 and 8. Case 5 shows the largest anomaly, 24 W m−2 after 120 min, exemplifying contrail growth under near-optimal conditions: not too high to limit excess water vapor (unlike Case 2), benefiting from a steady, gradual moisture supply, and supported by deep ISSRs below flight altitude (unlike Case 6, where growth was constrained by a thin subsaturated layer).
Case 8 also exhibits a substantial radiative impact, peaking at 23 W m−2 after only 60 min. This rapid onset mirrors its early IWC anomaly growth. Interestingly, Case 2 – despite forming at higher altitude with limited water vapor – still reaches 18 W m−2 after 150 min, a value comparable to cases with greater moisture availability.
Relationship between Thermal Radiative Effects and Ice Water Path
Figure 12 also includes the time evolution of IWP. As expected, Case 4 has the largest values in the natural cloudy region (control). However, the contrail-induced change in IWP remains minimal in this case, though a slight increase is still noticeable. A potential relationship between changes in thermal net flux at the top of the atmosphere and IWP anomalies is evident from the analysis. We computed the pointwise distance correlation between contrail-induced changes in IWP and thermal net flux. The coefficient, shown in Appendix A5, indicates a positive association between these variables – suggesting that larger increases in IWP correspond to greater reductions in outgoing longwave flux. This is in line with Seelig et al. (2025), who found that the strongest net radiative forcing of embedded contrails was associated primarily with increases in ice water content. This relationship holds across the simulations, except in Case 4.
3.4.2 Contrail-induced Solar Radiative Effects
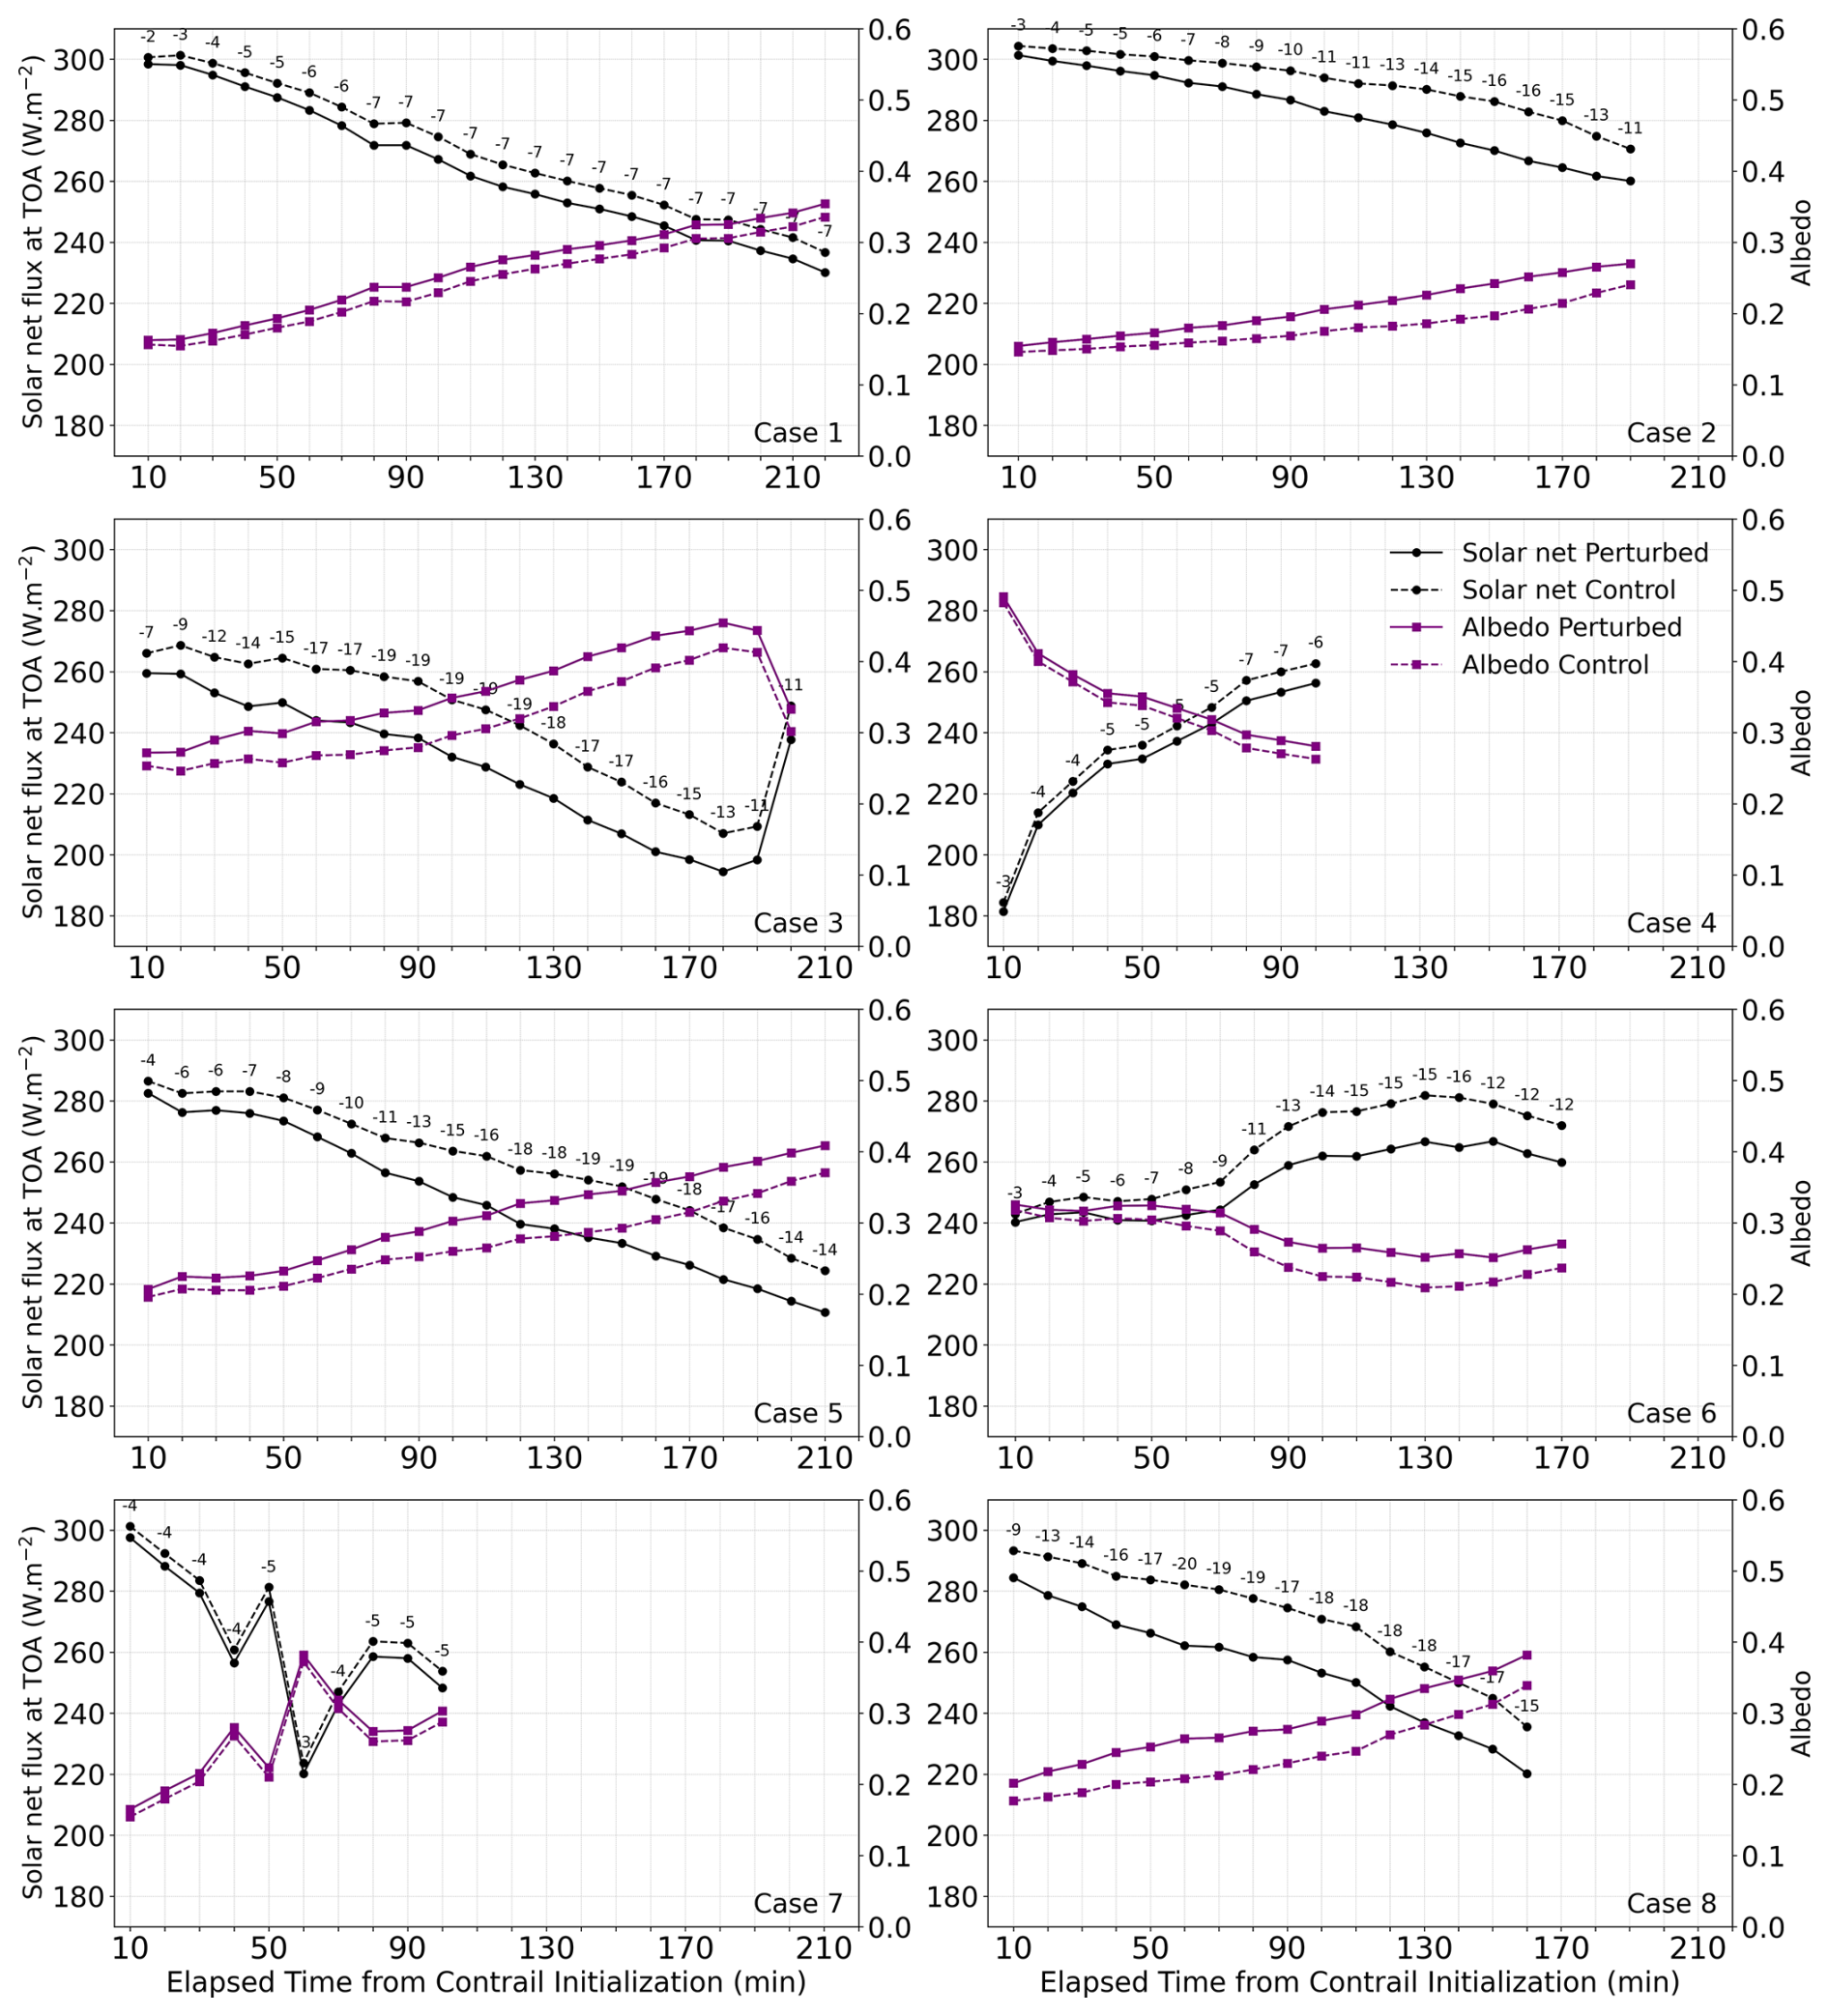
To assess solar, or shortwave (SW), radiative effects, all cases were normalized to a standardized reference irradiance corresponding to 1 March at a latitude of 34°. This normalization enables direct comparison of net solar flux across cases, based on a reference value of Sref=231 W m−2. Figure 13 presents the time series of solar net flux at the top of the atmosphere for all cases, together with the corresponding albedo time series.
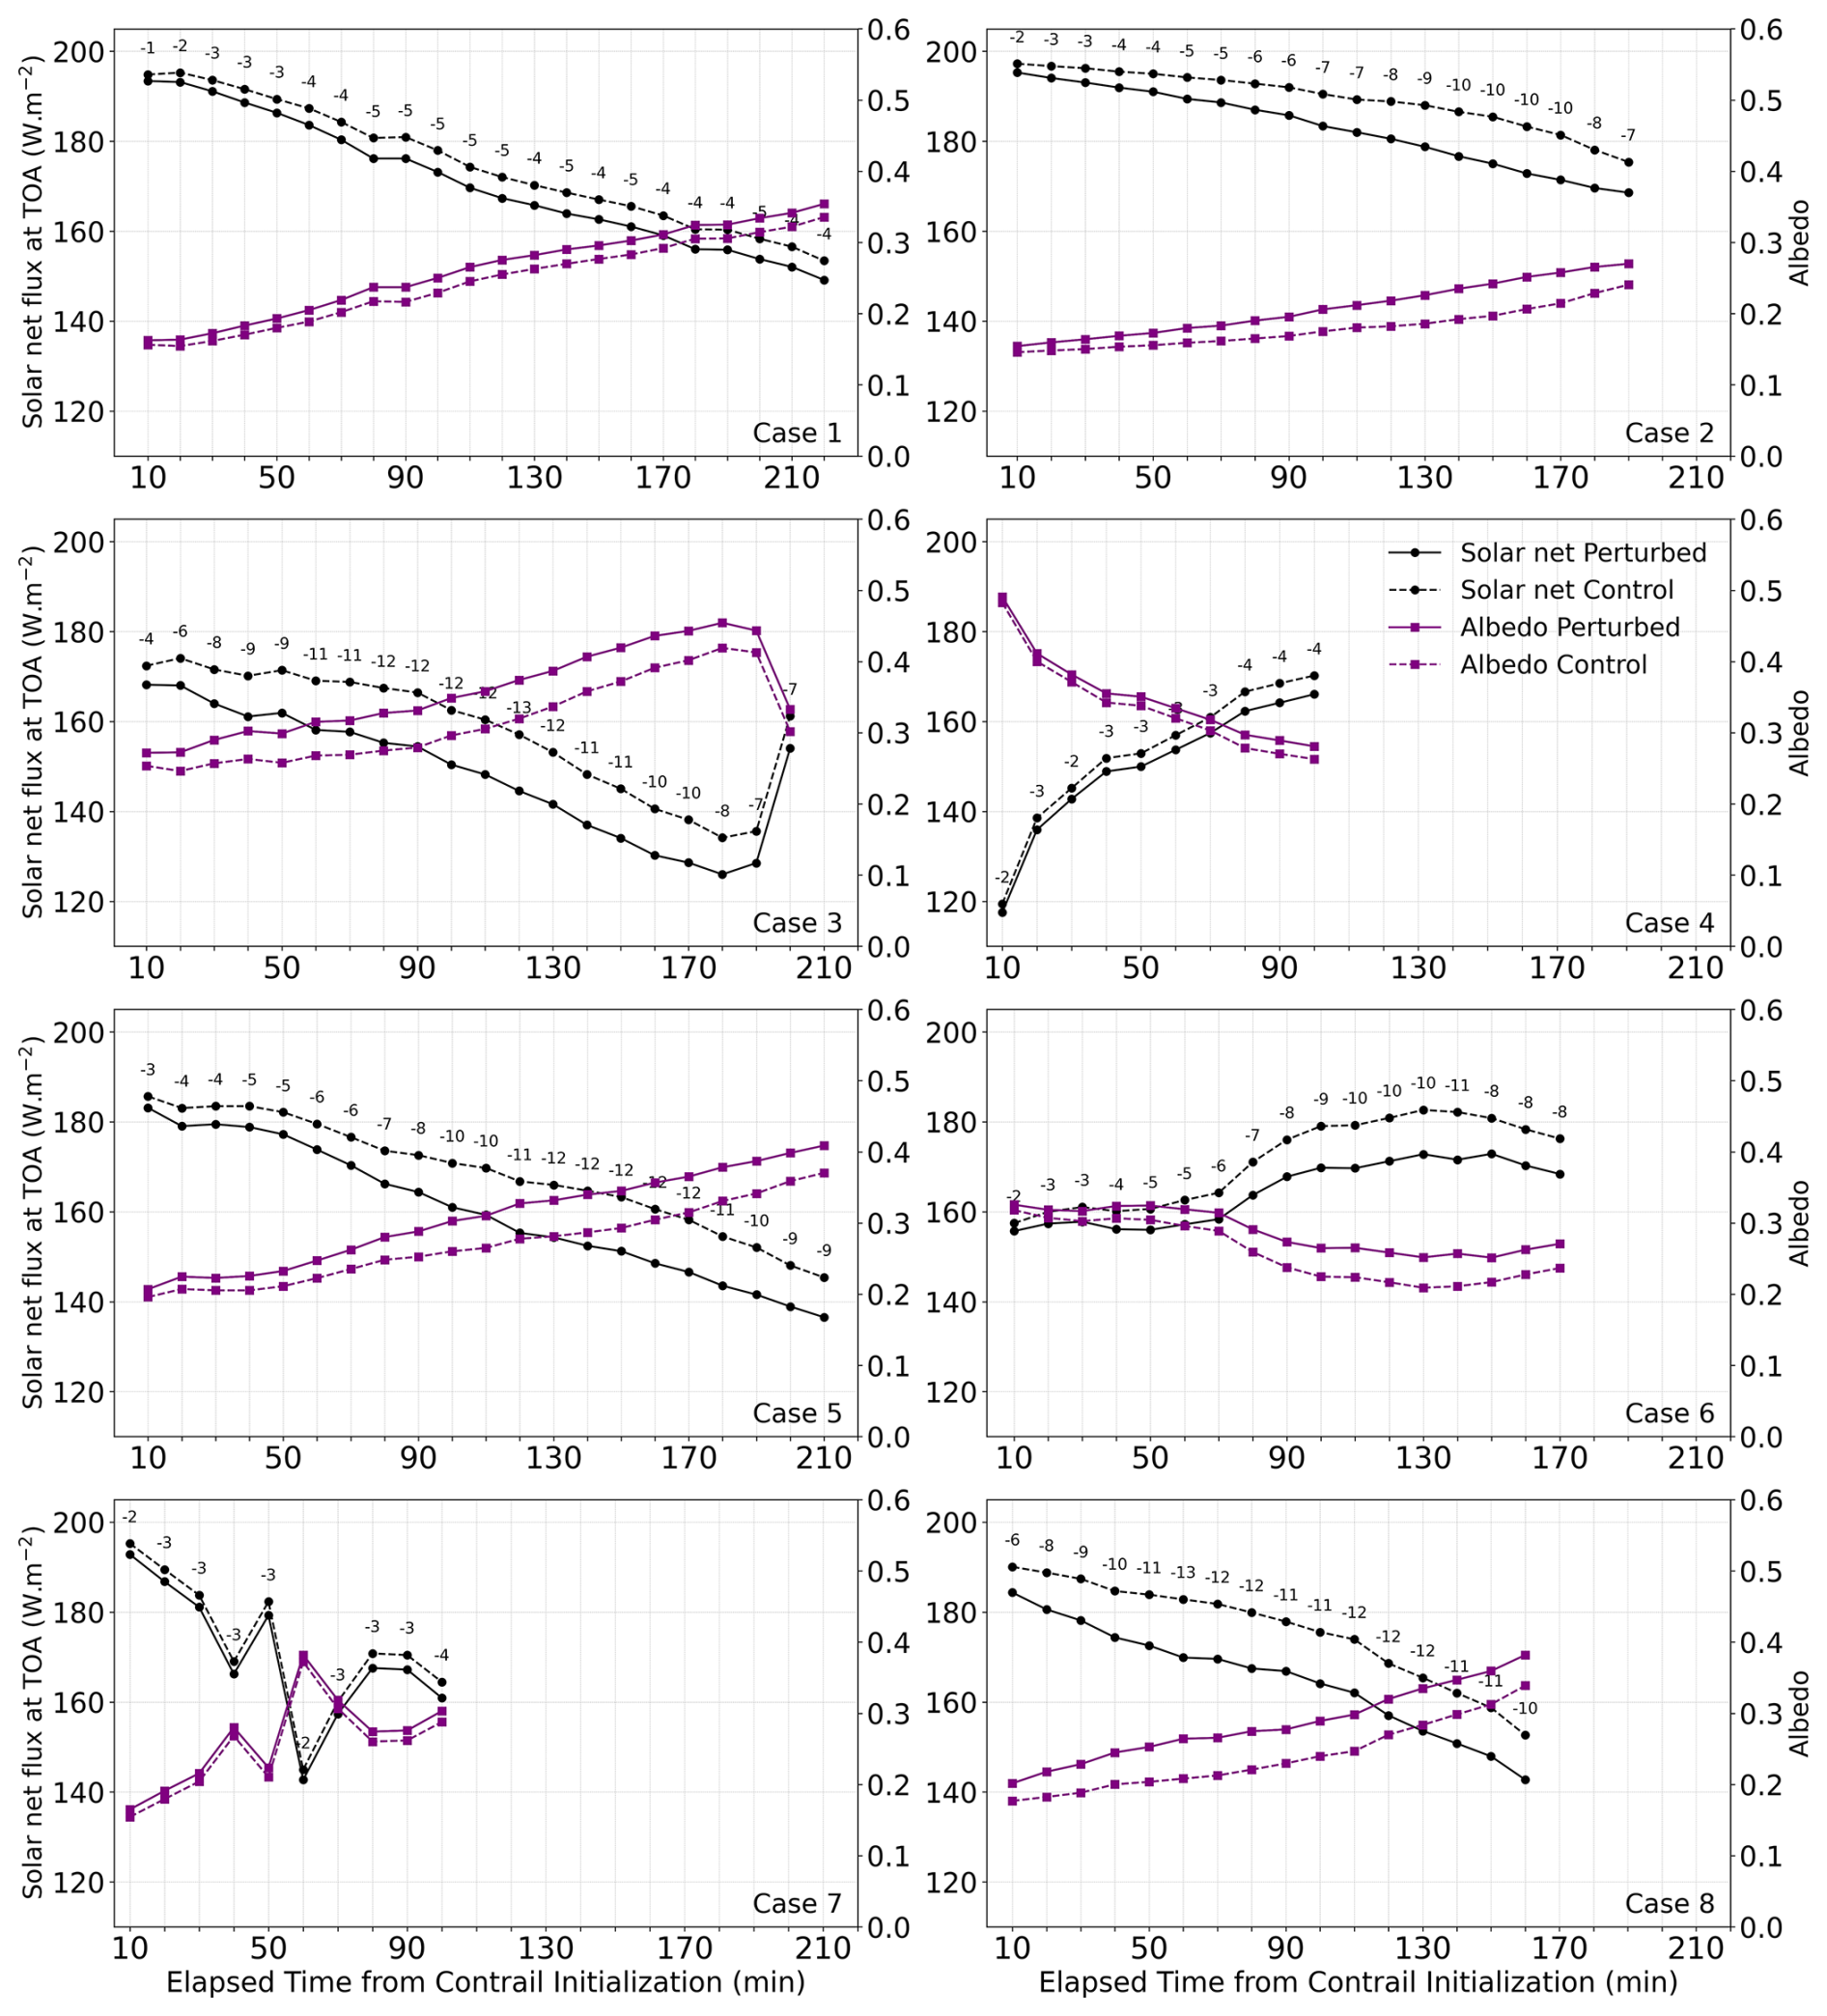
Figure 13Time series of solar net flux at the top of the atmosphere (left y-axis) for control and perturbation simulations across eight cases. Fluxes are standardized using a reference irradiance (Sref=231 W m−2), corresponding to 1 March at latitude 34°, enabling direct comparison across cases. The right y-axis shows albedo for perturbation and control runs. Circles denote standardized solar net flux and squares denote albedo, with solid lines representing perturbation runs and dashed lines representing control runs. Numbers above the solar net-flux markers indicate perturbation–control differences to facilitate comparison.
Although the perturbation and control runs show similar overall temporal evolution, the presence of contrails consistently enhances local atmospheric reflectivity, thereby reducing the incoming solar radiation. The largest reductions in solar net flux are observed in Cases 3, 5, and 8, while Cases 1, 4, and 7 exhibit comparatively smaller effects.
In our study, although contrails exhibit a cooling effect from the shortwave (solar) perspective, their warming impact due to the trapping of outgoing longwave radiation (greenhouse effect) remains dominant. A version of Fig. 13, normalized using a standardized reference irradiance corresponding to 21 June – when solar irradiance typically reaches its annual maximum – is provided in Appendix A6. Even under these peak solar conditions, the cooling effect from reduced solar flux cannot fully compensate the warming caused by longwave radiation trapping.
This study aimed to investigate how persistent contrails evolve within varying ice-supersaturated environments – typically associated with cloudy backgrounds – and to address the question: what atmospheric constraints govern contrail development and persistence?
To capture contrail evolution under realistic weather conditions, we employed a two-stage modeling framework. First, kilometer-scale simulations using ICON-NWP were performed with nested domains to provide synoptically consistent initial and boundary conditions for our main simulations. The output from the finest nest then initialized high-resolution ICON-LEM simulations at 154 m horizontal resolution. In these simulations, we introduced an identical perturbation – a fixed ice crystal number concentration of 150 cm−3 – along targeted flight tracks that satisfied the Schmidt–Appleman criterion throughout the perturbed region. This two-stage modeling framework ensured a smooth scale transition and provided physically consistent background cloud environments for large-eddy simulation (LES) of contrail evolution. By comparing the evolution of identical initial contrail perturbations across diverse cloudy, ice-supersaturated backgrounds – and against corresponding control runs featuring only natural cirrus clouds – we assessed how environmental variability governs persistent contrail development.
Our high-resolution simulations emphasize that contrail persistence and microphysical development are strongly shaped by the surrounding atmospheric environment – particularly the interplay between the vertical extent of ice supersaturation and the availability of excess water vapor. A thick supersaturated layer alone does not guarantee contrail growth unless sufficient water vapor is available to sustain deposition. Notably, contrails developing within liquid-origin ice clouds – despite deep vertical extent – exhibit limited growth when ice supersaturation is marginal. Our findings also reveal that in the cold upper troposphere, contrail ice water content may be constrained by the limited absolute amount of excess water vapor available for depositional growth, even under strong supersaturation.
While vertical spreading through fall streaks is well established, our results suggest that in environments with high ice supersaturation and low atmospheric stability, contrails may also expand above the flight altitude due to latent heat release from rapid deposition. Consistent across cases, we find that the net radiative effect of contrails remains dominated by longwave warming, with shortwave cooling from increased albedo insufficient to offset it – even under summer solstice conditions. These results suggest that mitigation approaches which identify contrail-avoidance regions solely from the Schmidt–Appleman criterion and ambient RHice or ISSR occurrence, such as simple altitude-adjustment or rerouting strategies based only on persistent-contrail formation thresholds (Teoh et al., 2020; Sausen et al., 2023), may be insufficient to predict or mitigate contrail climate effects, because the properties and coverage of pre-existing cirrus and the temporal availability of excess water vapor also influence contrail growth and radiative impact (Petzold et al., 2025).
The interpretation of these results follows from the single-category bulk microphysics used in the present ICON-LEM configuration. As detailed in Appendix C, the initialized perturbation retains the defining contrail-like signatures of high ice crystal number concentration and small effective particle size under representative cloudy-background conditions. The paired perturbation–control design therefore provides a consistent framework for analysing bulk contrail-induced responses in different cloudy, ice-supersaturated environments. The results should not be interpreted as source-resolved budgets of contrail-origin and natural-cirrus ice; such a budget would require source-tagged ice tracers or separate ice categories and is left for future model development.
Future studies may explore the sensitivity of our findings to perturbations in ice crystal number concentration (Ni), by systematically increasing or decreasing the initial values. This would help assess how changes in Ni influence the evolution of the ice water path and better quantify the microphysical feedbacks. In our LES simulations, the model resolution of 154 m was chosen to fully resolve the initial vertical cross-sectional area of the contrail within a single grid box. As a result, we were not able to investigate the effects of smaller aircraft or narrower initial cross-sections without moving to a finer resolution, such as 78 m. This study focuses exclusively on the evolution of individual contrails in ice supersaturated cloudy backgrounds. While this allows for detailed process-level understanding, we acknowledge that the results may not be directly generalizable to conditions involving contrail outbreaks or interactions between multiple contrails. Lastly, the microphysical schemes used in this study are based on the parameterizations of Seifert and Beheng (2006). These parameterizations may require further tuning, especially regarding the growth rates and sedimentation behavior of contrail ice particles, which can differ from those of natural cirrus clouds – particularly if one aims to accurately interpret the extent of vertical development.
This appendix provides additional tables and figures that support the analysis presented in the main text.
Table A1Contrail widths at 30 and 60 min after initialization for the eight simulation cases. “Width at flight altitude only” refers to the single model level at flight height, while “Overall contrail width” shows the maximum horizontal extent across all vertical levels. Contrail edges are determined using the ice crystal concentration excess relative to the control simulation, allowing detection of even small perturbations. See Fig. 5 for the spatial evolution of the contrails at flight altitude.

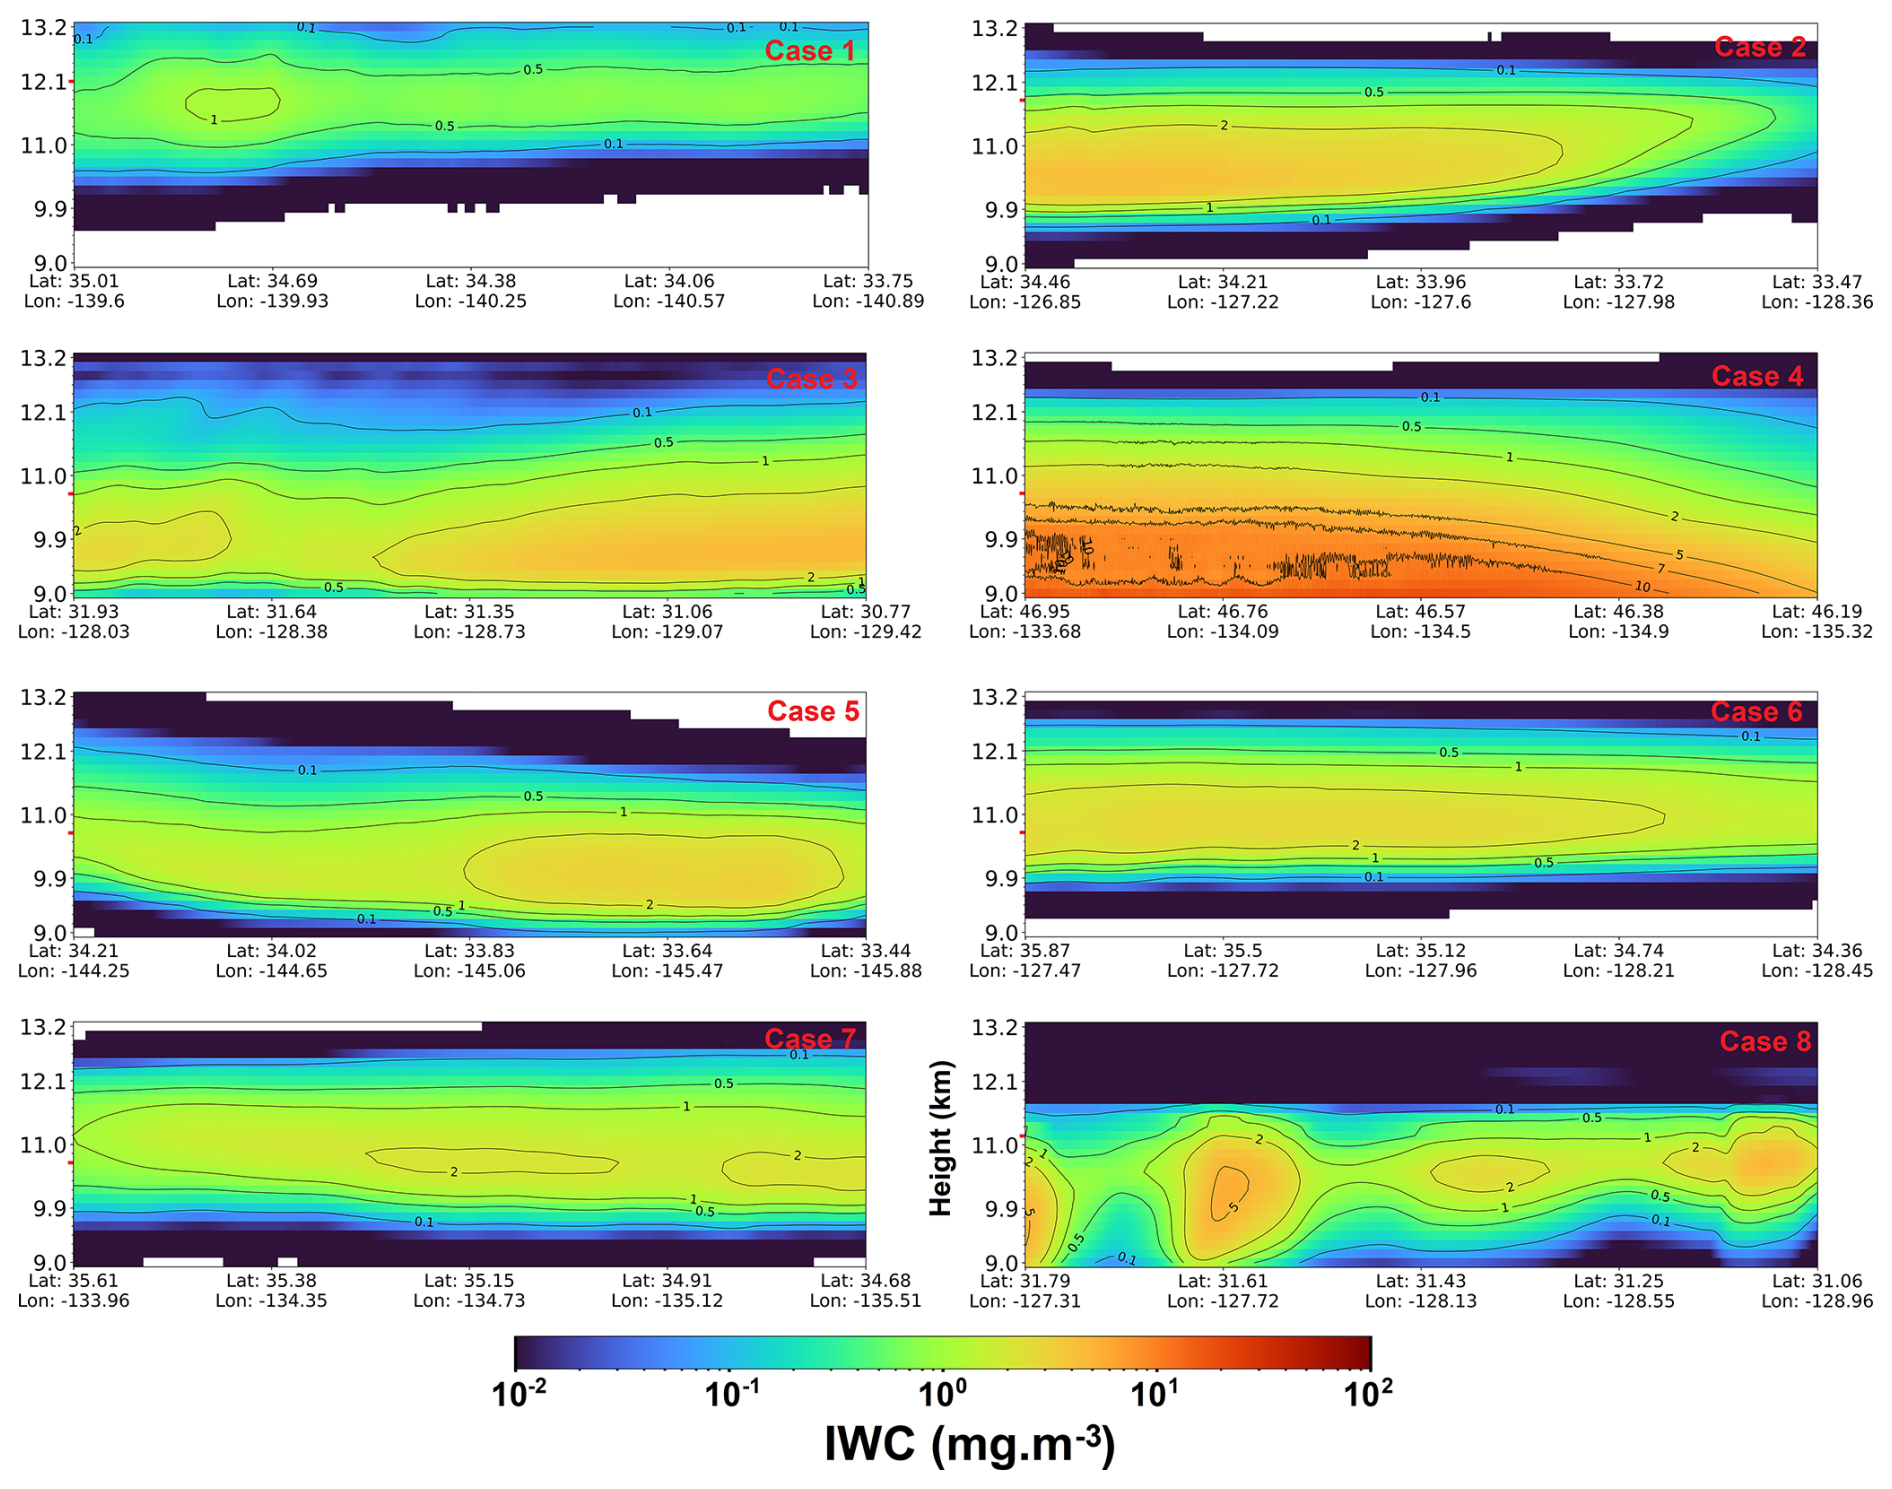
Figure A1Vertical cross-sections of background ice water content (IWC) along the flight track for all eight cases at the moment of contrail initialization, based on the control simulations. The data are averaged over a broad region perpendicular to the flight path, representing the overall mean atmospheric conditions rather than just the immediate contrail environment. The altitudes at which contrails are initialized are indicated by red tick marks.
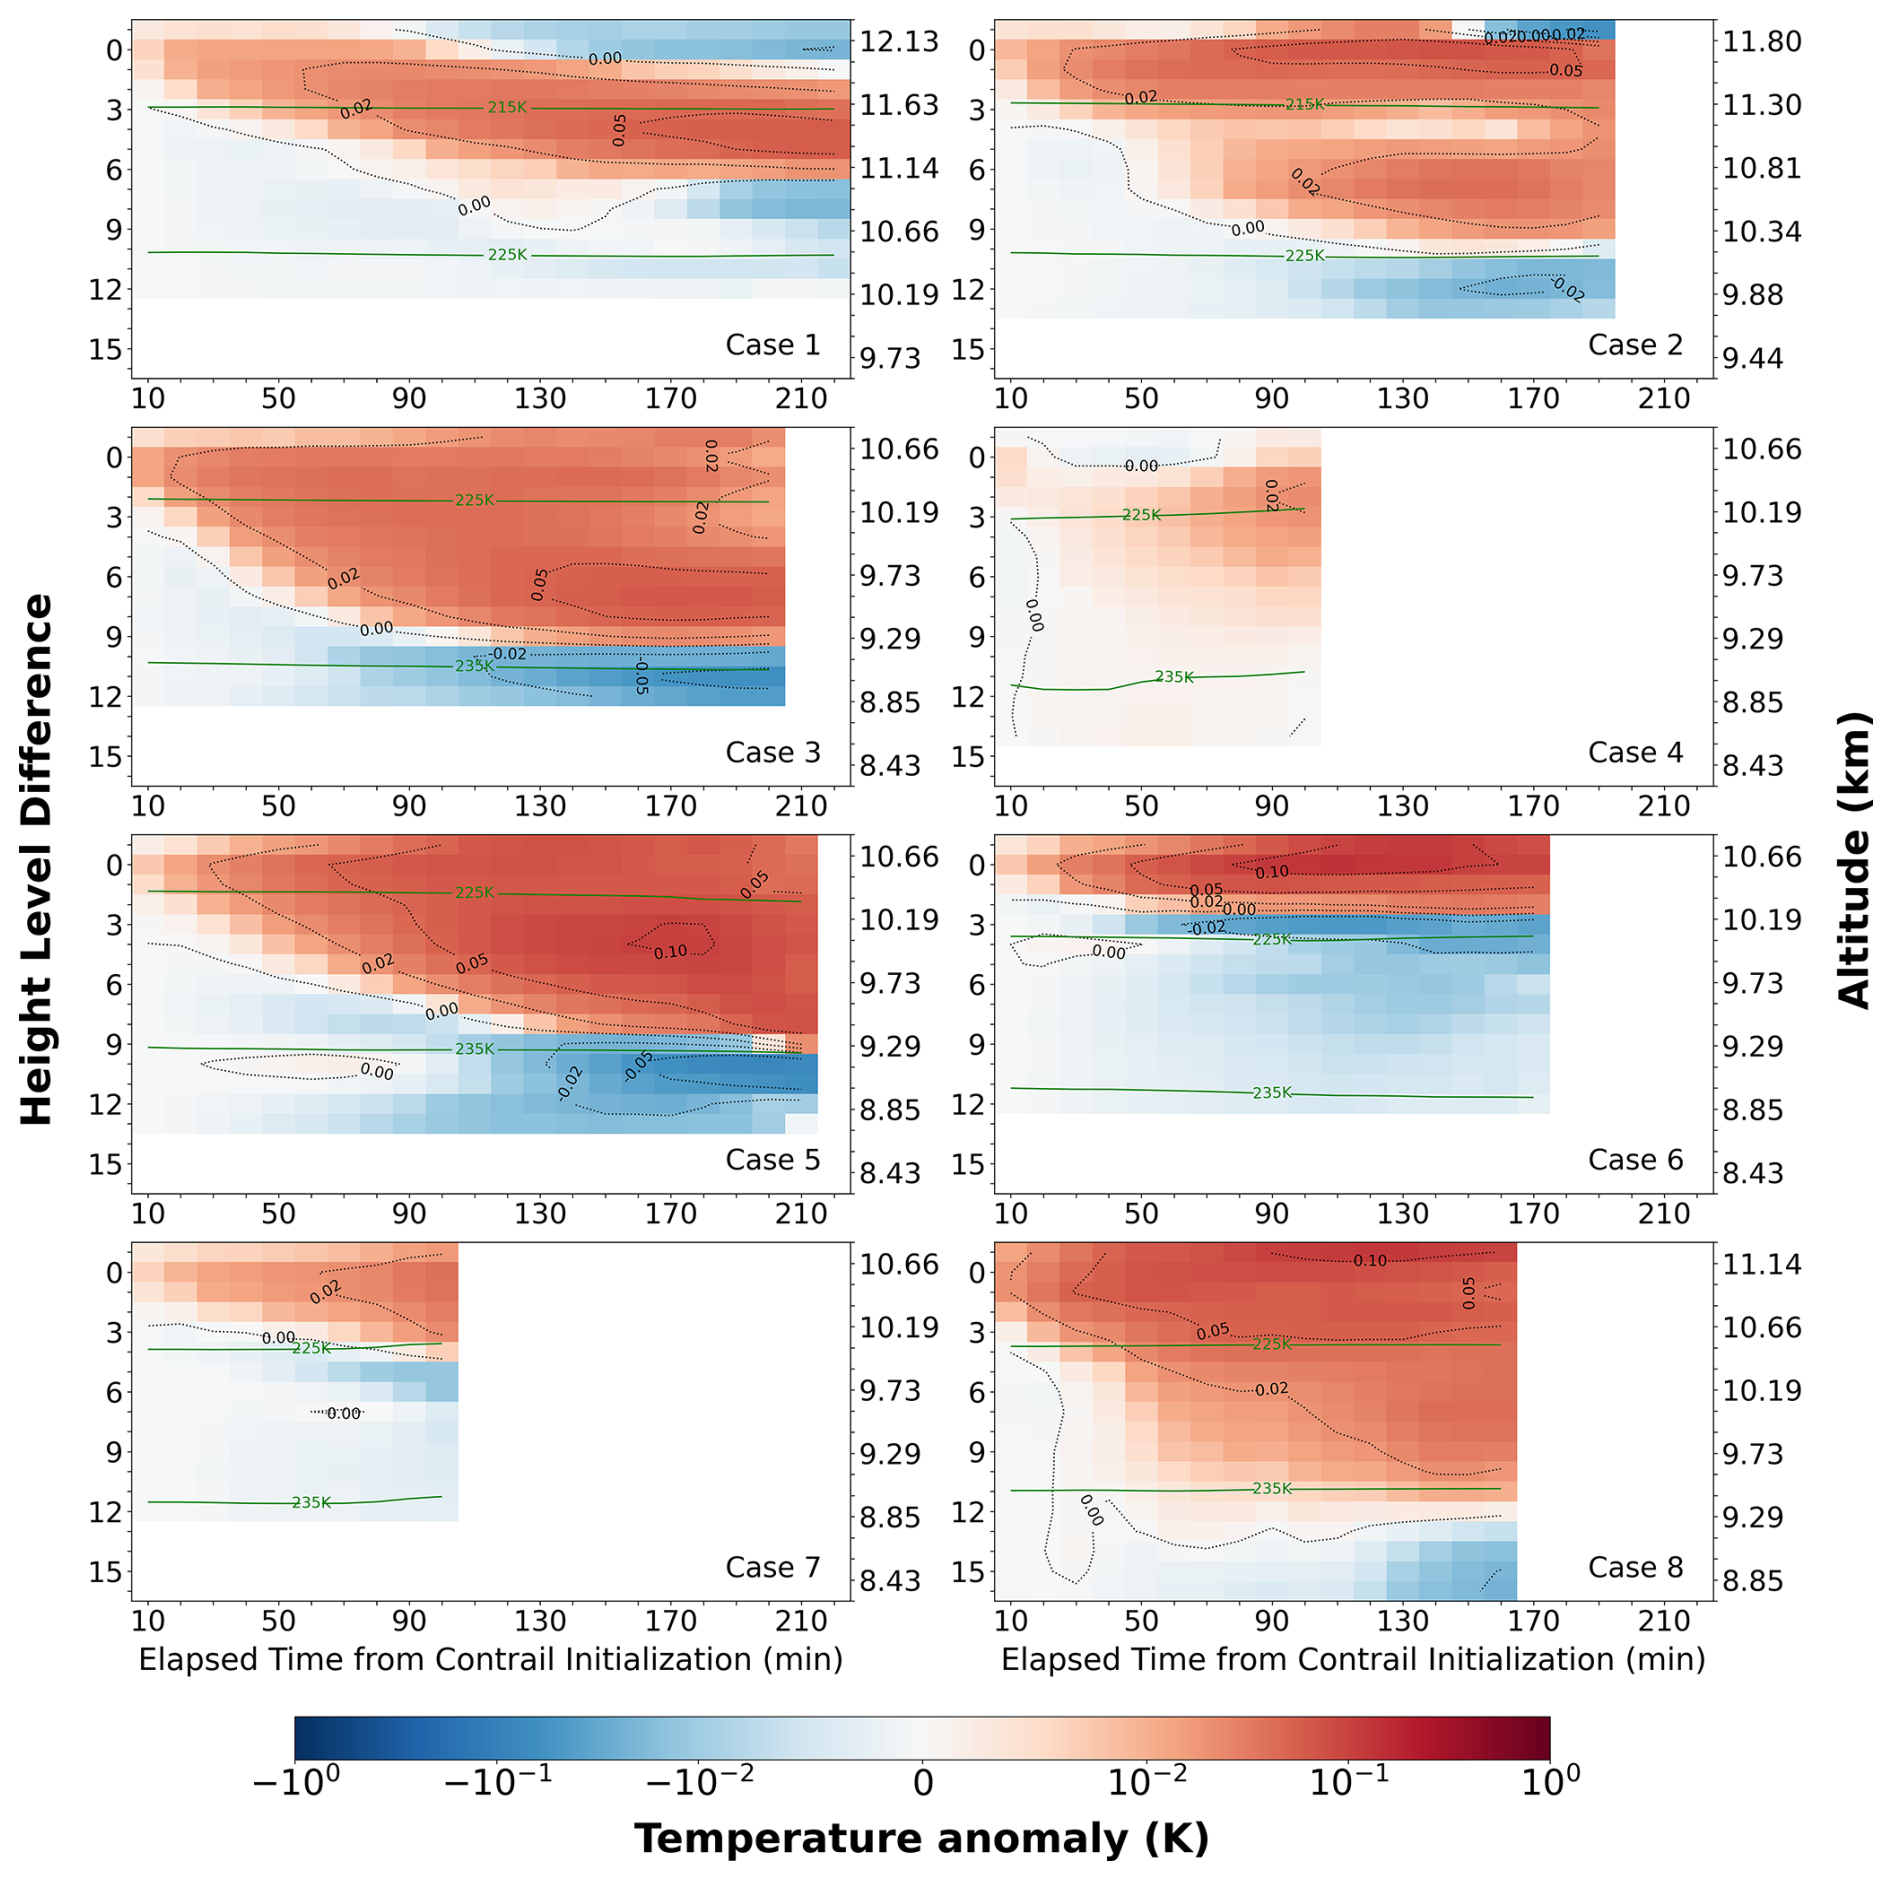
Figure A2Time–height evolution of temperature anomalies for different cases, defined as the difference between the perturbation (contrail) and control (natural cloud) runs. The x-axis shows time since contrail initialization; the y-axis shows altitude. Green contours mark 215, 225, and 235 K from the control run. Warm colors indicate positive anomalies; cool colors indicate negative ones.
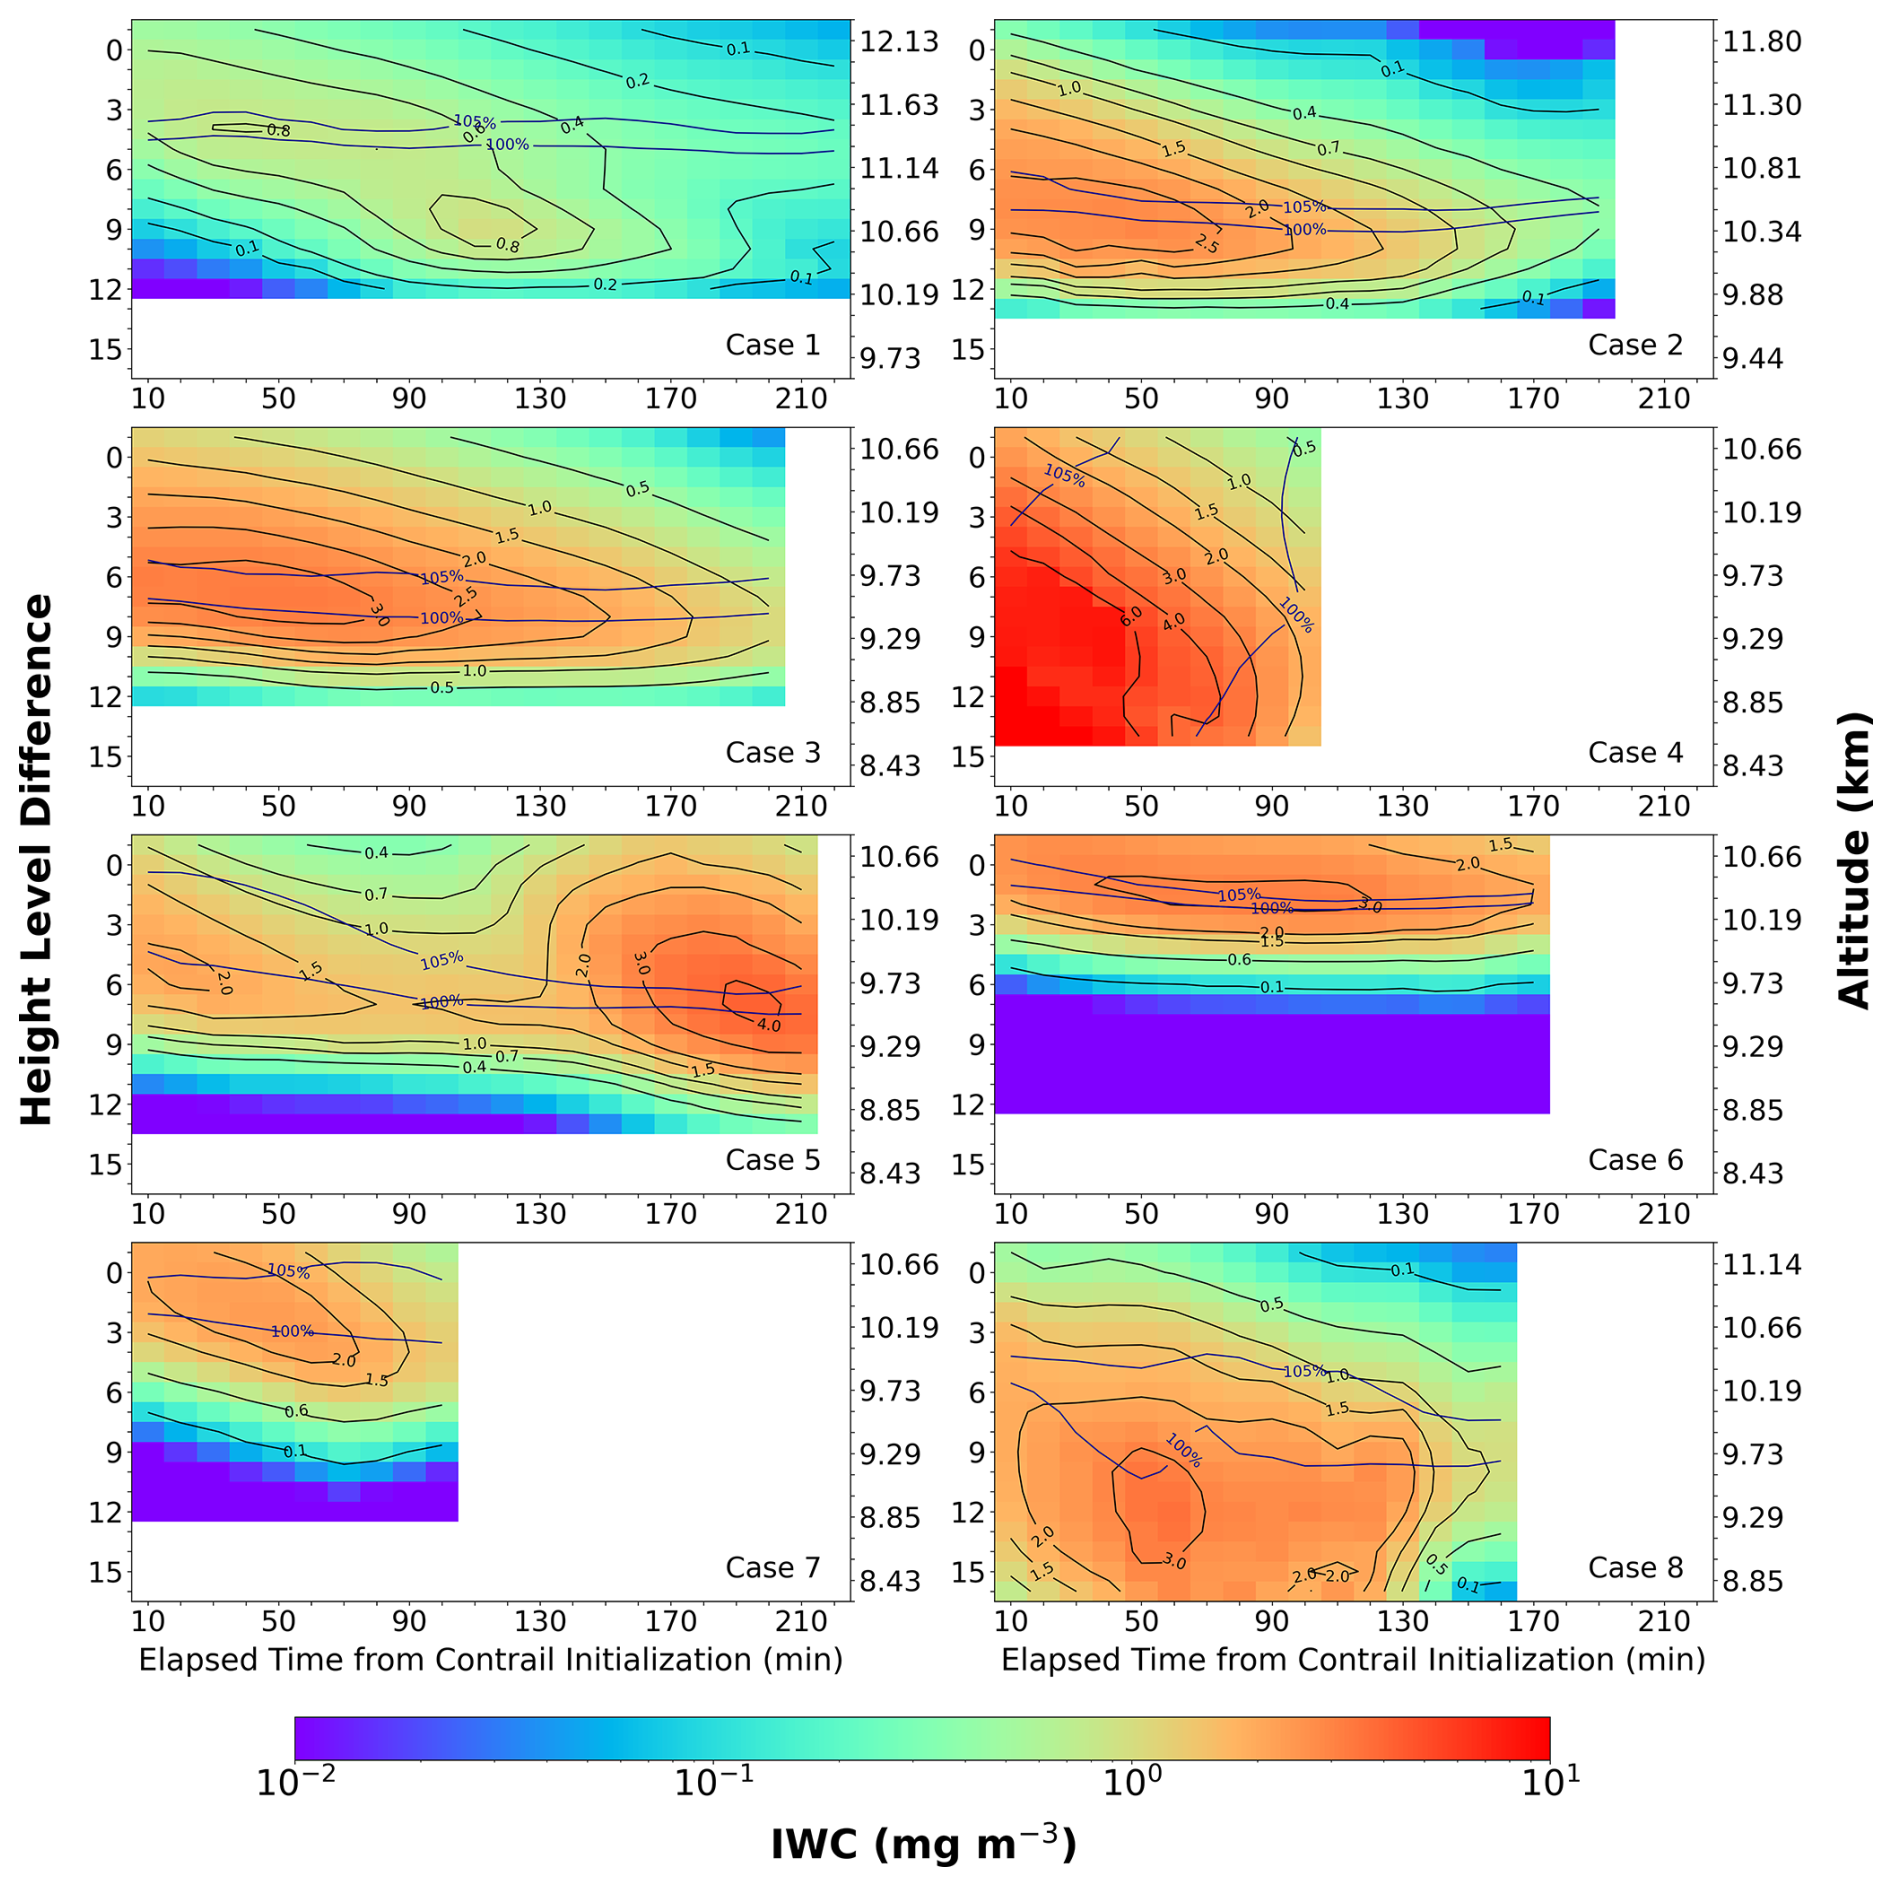
Figure A3Time–height evolution of IWC for control (natural cloud) runs. The x-axis shows time since contrail initialization; the y-axis shows altitude. Black contours denote IWC (mg m−3), while blue contours indicate relative humidity over ice (RHice, %) from the control run.
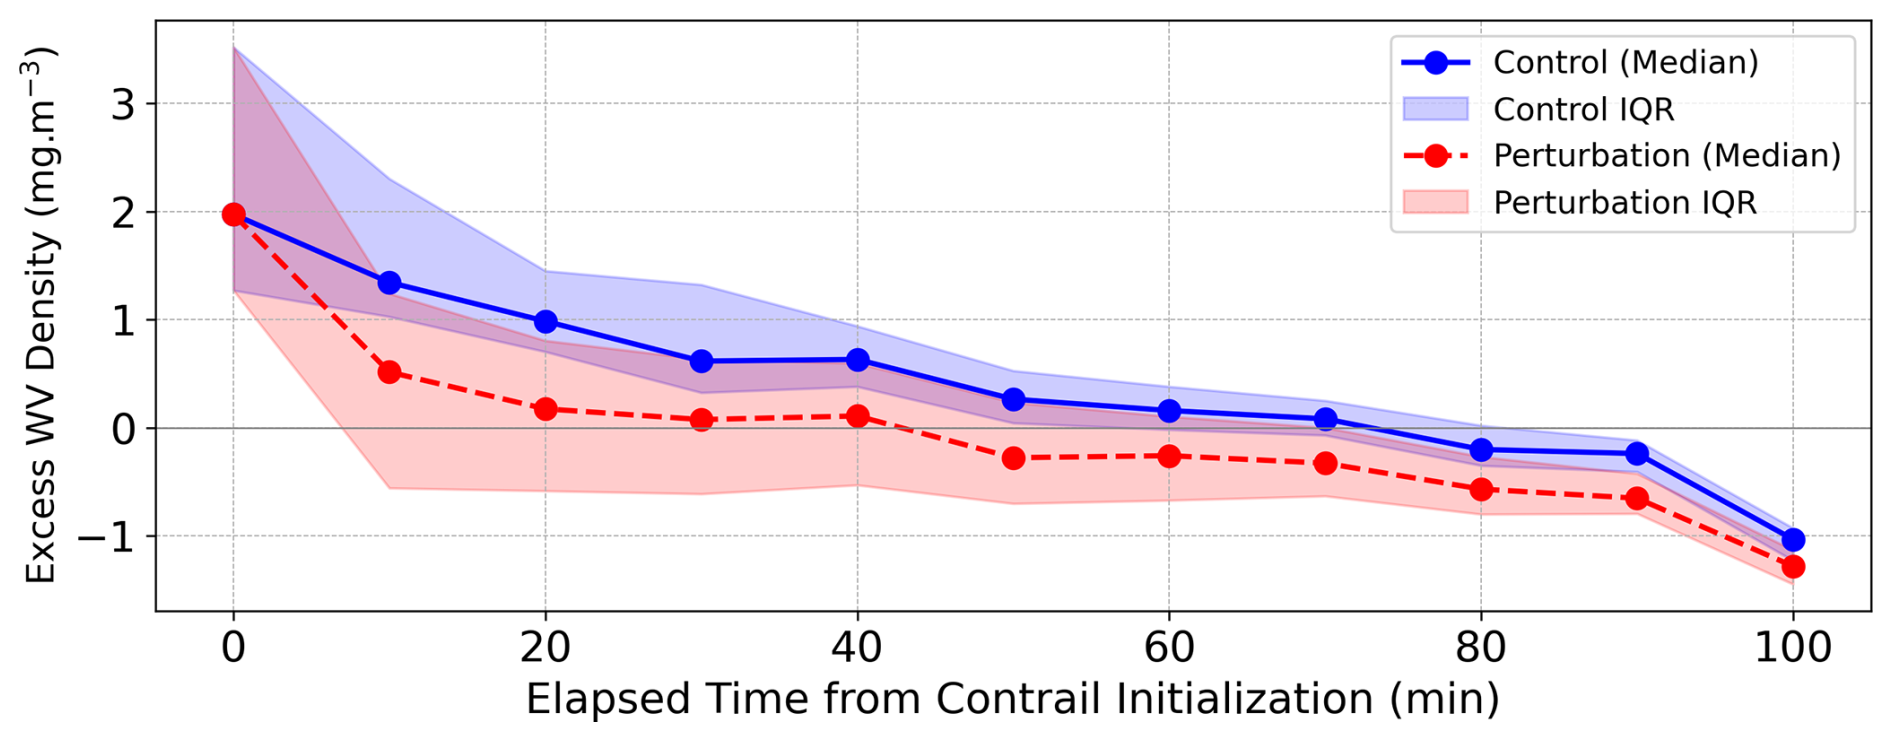
Figure A4Time series of excess water vapor for the control (blue) and perturbation (red) runs in Case 4, at flight altitude. The blue line represents the evolution in the natural cloudy region, where excess water vapor remains positive until approximately 70 min, followed by a gradual decline, indicating the absence of strong upward motion. In the perturbation run, the contrail accelerates moisture depletion, leading to a more rapid decline in excess water vapor. Shaded regions indicate the interquartile range (IQR).
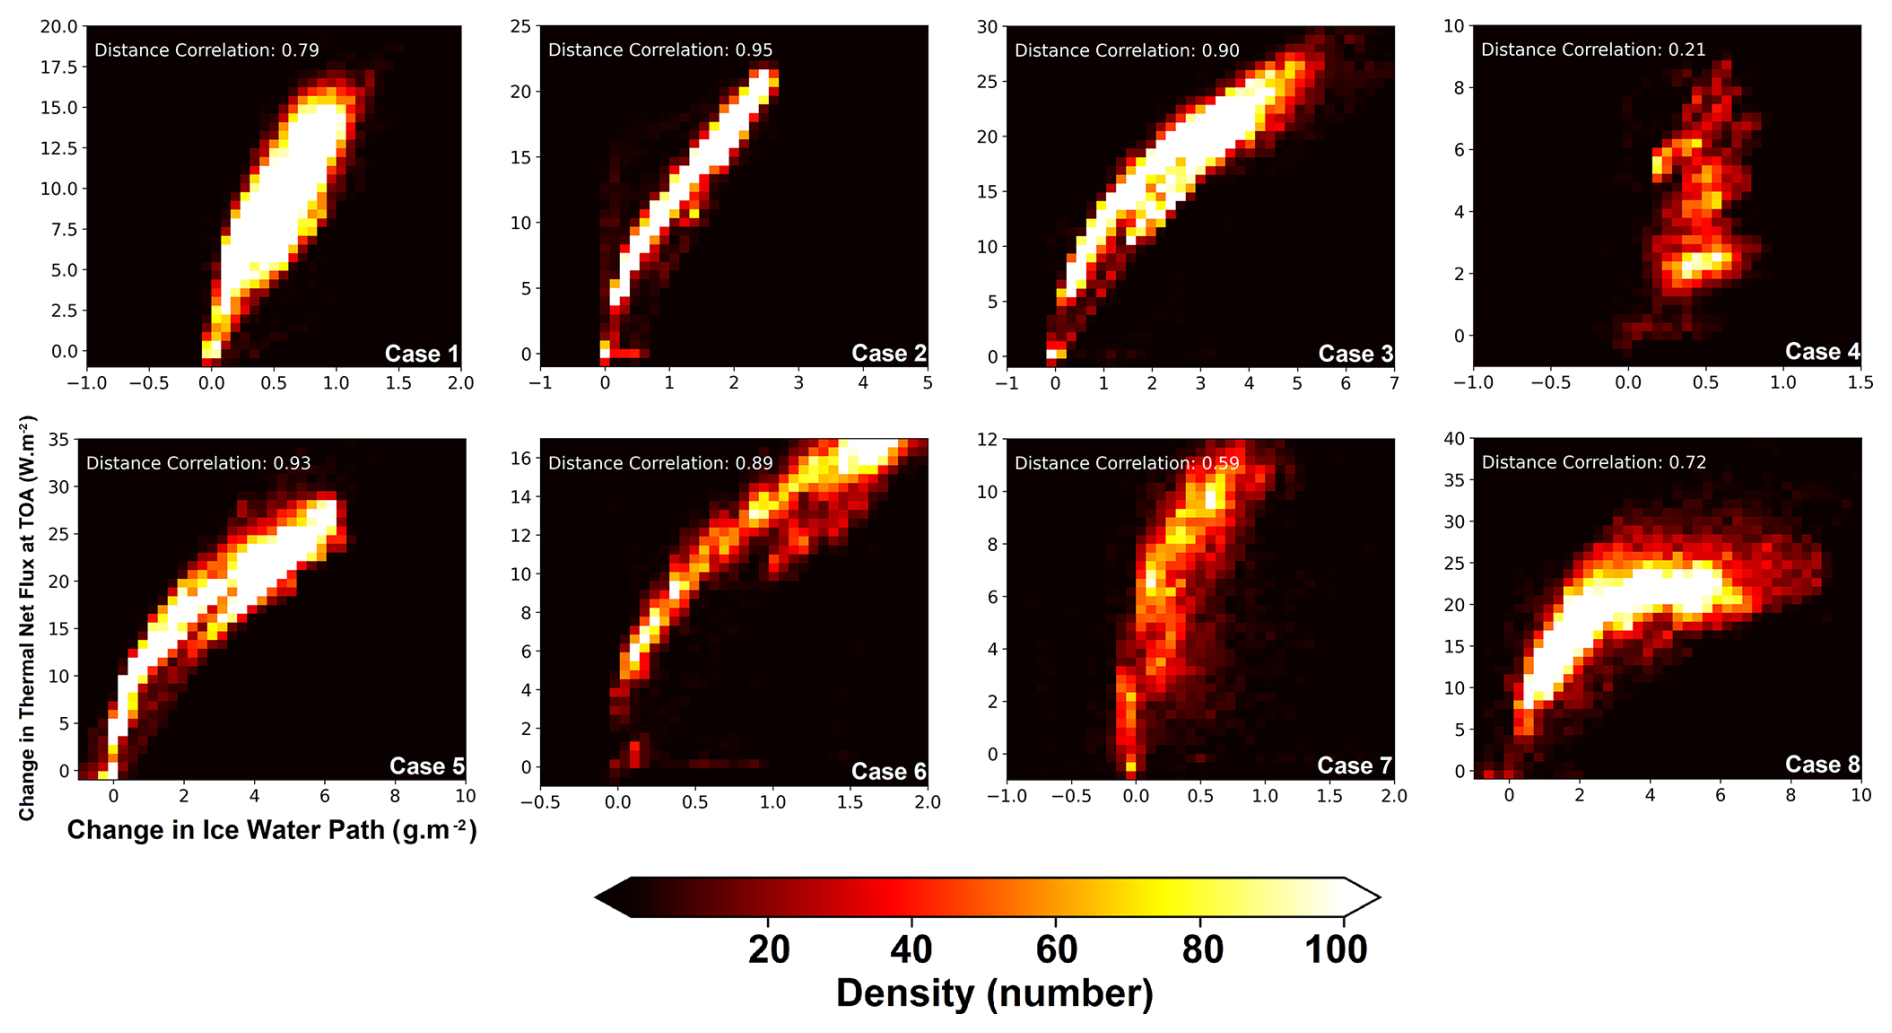
Figure A5Overall 2D histogram of pointwise contrail-induced changes in ice water path (IWP) and changes in thermal net flux at the top of the atmosphere for all eight cases. The computed distance correlation coefficient indicates a positive association between these variables, suggesting that larger pointwise increases in IWP are related to greater reductions in outgoing longwave flux.
B1 The Physics of Contrail Formation: The Schmidt–Appleman Criterion
Aircraft contrails form when hot, moist engine exhaust mixes with the colder ambient air at cruising altitudes. This mixing process follows a linear trajectory in temperature–vapor pressure space, known as a mixing line. The Schmidt–Appleman Criterion (SAC; Schumann, 1996) provides an analytical framework for contrail formation by defining the conditions under which this mixing line intersects the saturation vapor pressure curve over liquid water. Such an intersection indicates that the exhaust plume has reached water saturation, allowing exhaust particles – predominantly composed of soot, as observed in typical commercial flight operations – act as cloud condensation nuclei (CCN).
As a result, supercooled water droplets quickly form and freeze, generating a visible contrail. Numerous flight experiments have confirmed that contrails only form when this water saturation is exceeded (Busen and Schumann, 1995; Schumann, 1996; Jensen et al., 1998; Schumann, 2000). For contrails to persist, however, the surrounding atmosphere must also be at least saturated with respect to ice; otherwise, the ice particles sublimate and the contrail dissipates shortly after formation.
B2 Slope of the Mixing Line and the Threshold Temperature θ100
The slope of the mixing line, denoted by G, depends on atmospheric pressure and several aircraft-specific parameters and is calculated using Eq. (1). To determine the Schmidt–Appleman threshold temperature – the maximum ambient temperature at which contrails can form – a threshold mixing line must be derived using the specified aircraft parameters and atmospheric pressure. The point of tangency between this mixing line and the saturation vapor pressure curve over liquid water defines θ100 – the threshold temperature at water saturation within the mixing plume. This value, which varies with pressure, provides the basis for calculating the complete threshold mixing line.
Figure B1 (left) displays θ100 across different atmospheric pressures, illustrating that lower atmospheric pressures correlate with lower θ100, thereby indicating the cooler conditions the plume must reach for contrail formation to occur.
B3 Atmospheric Temperature and Humidity in Contrail Formation
Along the threshold mixing line, each atmospheric vapor pressure corresponds to a specific temperature – the Schmidt–Appleman threshold temperature (θG) – which represents the highest ambient temperature at which contrail formation can occur under given conditions. Conversely, for a given ambient temperature along the mixing line, one can compute the threshold vapor pressure (eG), which is the minimum required for contrail formation at that atmospheric temperature and pressure.
Figure B1 (right) illustrates the intersection between the critical mixing line at an atmospheric pressure of 240 hPa and the saturation vapor pressure curve corresponding to RHice of 120 % (point 1).
We used the Goff–Gratch empirical formula to calculate saturation vapor pressure, owing to its high accuracy across a broad range of cold temperatures. If the ambient temperature, given a specific atmospheric pressure (Pa) and relative humidity, is below θG, contrail formation is likely; conversely, if it exceeds θG, contrails will not form. The critical temperature for this particular atmospheric pressure and relative humidity is indicated by point 1. For these conditions, the critical temperature is θG=225.5 K.
When the ambient temperature exceeds the critical temperature (moving from point 1 to point 2), the mixing line no longer intersects the water saturation vapor pressure curve (the gray line aligned parallel to the black line on its right side), indicating that contrail formation will not occur. Conversely, when the ambient temperature falls below this critical threshold (moving from point 1 toward point 3), the mixing line intersects the saturation curve, ensuring contrail formation (represented by the gray line aligned parallel to the black line on its left side).
From another perspective, ambient humidity also plays a critical role: at a given atmospheric pressure and temperature, contrails form only when ambient humidity exceeds a critical value. When the atmospheric pressure is 240 hPa and the temperature is 225.5 K, contrail formation requires an ambient vapor pressure corresponding to RHice of 120 % (point 1). If the ambient humidity is any higher (moving from point 1 to point 4), the mixing plume surpasses saturation with respect to water, guaranteeing contrail formation. Conversely, lower humidity (moving from point 1 to point 5) falls short of liquid saturation, and no contrail will form.
B4 Summary of Appendix B and Context for Fig. 3
In brief, both fuel/engine properties and ambient atmospheric conditions (temperature, pressure, and humidity) determine contrail formation. A look-up table of these threshold temperatures, as a function of RHice and Pa, is included in the main text (Fig. 2). This heatmap more compactly visualizes how higher relative humidity and higher pressure both raise the contrail formation temperature threshold.
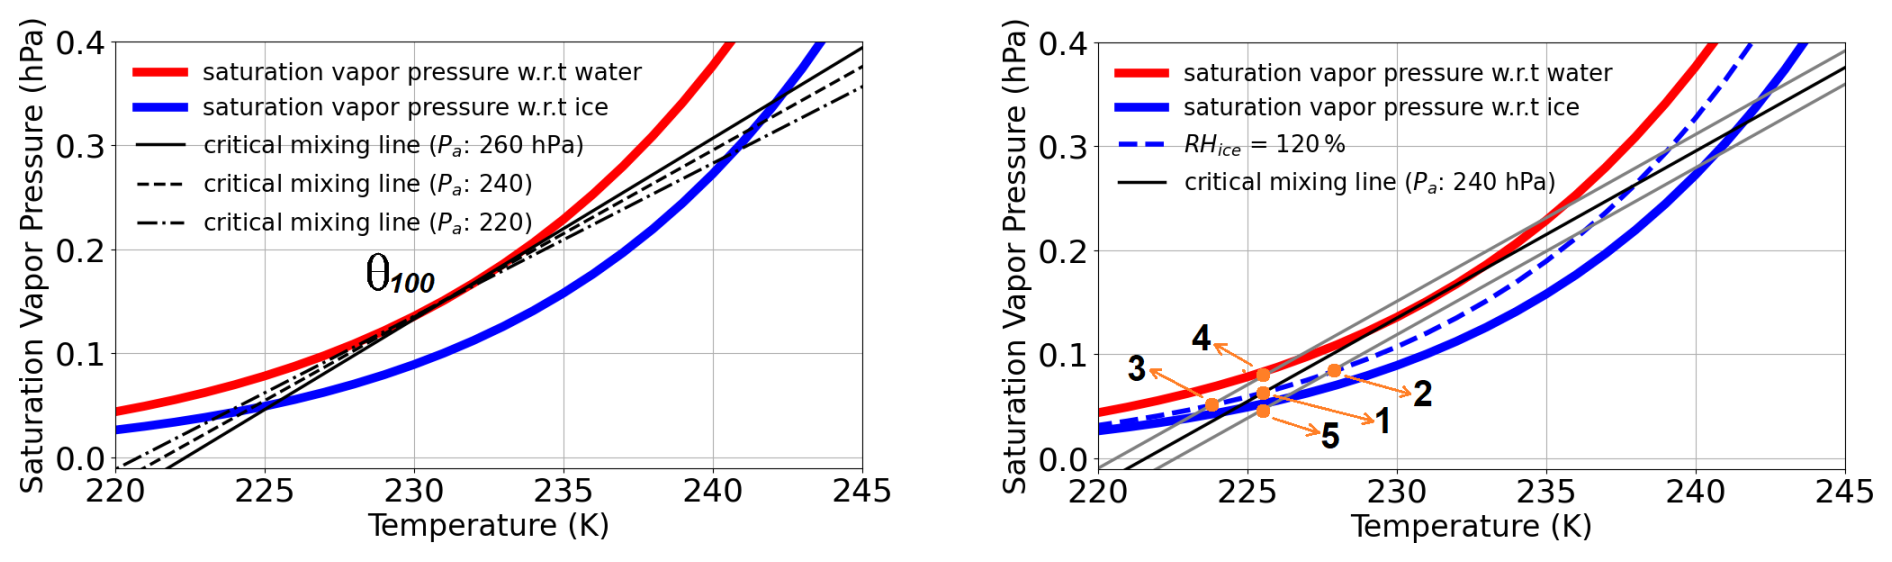
Figure B1Threshold mixing lines are shown for three different atmospheric pressures (left). The tangent point between each mixing line and the water saturation curve indicates the threshold temperature at water saturation. It is evident that at higher ambient pressures, the tangent occurs at warmer temperatures, indicating a higher threshold temperature for contrail formation. The dashed blue line represents the saturation vapor pressure curve at a relative humidity with respect to ice (RHice) of 120 % (right). The three diagonal lines, which have identical slopes, represent mixing lines for a fixed atmospheric pressure and aircraft characteristics, but varying ambient temperatures and humidities. This illustrates how the critical mixing line delineates atmospheric conditions that are favorable for contrail formation from those that are not.
The ICON-LEM configuration used in this study applies the two-moment bulk microphysics scheme of Seifert and Beheng (2006). Therefore, when natural cirrus ice and the imposed contrail perturbation occupy the same grid cell, ice mass and number are represented as conserved bulk quantities rather than as source-tagged populations. In such a grid cell, the combined state is
and the representative particle mass and spherical-equivalent radius are
where ρi=917 kg m−3. This diagnostic is used only to assess the representativeness of the initialized bulk state; the subsequent evolution follows the full two-moment microphysics and resolved transport.
In our simulations, the contrail is initialized as a narrow post-vortex perturbation with Nc=150 cm−3 (= 150 000 L−1) and kg m−3, corresponding to the emitted water distributed over the initialized cross-section. This initialization is consistent with post-vortex contrail values used or reported in previous modelling and observational studies (Bier and Burkhardt, 2022; Bock and Burkhardt, 2016b; Schröder et al., 2000; Febvre et al., 2009; Voigt et al., 2011; Schumann et al., 2017). For a representative cloudy background in the analysed cases, with Nbg≈20 L−1 and IWCbg≈2 mg m−3, the number concentration contrast at initialization is approximately 7500 : 1. The combined number concentration is therefore controlled by the contrail perturbation.
The corresponding spherical-equivalent radii are rc ≈ 0.8 µm for the initialized contrail perturbation, rbg ≈ 30 µm for the representative background cirrus, and rmix ≈ 1.6 µm for the combined bulk state. Even after local bulk mixing with this representative cloudy background, the resulting particle size remains within the observed range of young and post-vortex contrail particles and far below the background-cirrus particle size (Schröder et al., 2000; Febvre et al., 2009; Schumann et al., 2017). The initialized perturbed grid cells therefore retain the two defining microphysical signatures of a post-vortex contrail: high ice crystal number concentration and small effective particle size relative to the surrounding cirrus.
This consistency is also supported by the simulated effective-radius cross-section in Fig. 7, where the contrail core remains characterized by particles smaller than about 5 µm even after 90 min of evolution. The single-category treatment is therefore appropriate for the objective of this study: quantifying the bulk perturbation induced by an identical post-vortex contrail in different cloudy, ice-supersaturated backgrounds. The setup does not provide a source-resolved budget of contrail-origin and natural-origin ice; such partitioning would require source-tagged ice tracers or separate ice categories and is left for future model development.
The ICON model outputs used in this study are stored at the German Climate Computing Center (DKRZ) and are available upon request to the corresponding author.
The evolution of contrail ice crystal concentration within a cloudy background is presented for all eight simulation cases as individual animations. Each animation corresponds to a specific case and shows contrail development at flight altitude. The simulations were performed using ICON-LEM with a horizontal resolution of approximately 154 m, based on the R2B14 triangular grid. Snapshots are taken every 10 min to capture the temporal progression of contrail behavior.
The animations are available on Zenodo at https://doi.org/10.5281/zenodo.15106425 (Marjani, 2025).
SM conceived the study, developed the methodology, performed the model simulations, carried out the data analysis, and wrote the manuscript. SM also conducted the ICON model setup and technical implementations. JQ supervised the project and provided scientific guidance throughout, contributing to the interpretation of the results and manuscript development. SME contributed through discussions and feedback during the study. All authors reviewed and edited the final manuscript. This work forms part of SM's doctoral dissertation.
At least one of the (co-)authors is a member of the editorial board of Atmospheric Chemistry and Physics. The peer-review process was guided by an independent editor, and the authors also have no other competing interests to declare.
Publisher's note: Copernicus Publications remains neutral with regard to jurisdictional claims made in the text, published maps, institutional affiliations, or any other geographical representation in this paper. The authors bear the ultimate responsibility for providing appropriate place names. Views expressed in the text are those of the authors and do not necessarily reflect the views of the publisher.
The authors gratefully acknowledge the Deutsches Klimarechenzentrum (DKRZ) for providing computational resources, granted by its Scientific Steering Committee (WLA), under project ID bb1143.
This research has been supported by Horizon 2020 (grant no. 875036, project ACACIA), the Sächsisches Staatsministerium für Wissenschaft und Kunst (grant no. ScaDS.AI, Center of Excellence for AI Research: Center for Scalable Data Analytics and Artificial Intelligence Dresden/Leipzig), the Bundesministerium für Forschung, Technologie und Raumfahrt (grant no. 03F0891A), and the Natural Environment Research Council through the COBALT project (grant no. NE/Z503794/1).
Supported by the Open Access Publishing Fund
of Leipzig University.
This paper was edited by Martina Krämer and reviewed by three anonymous referees.
Atlas, D., Wang, Z., and Duda, D. P.: Contrails to cirrus – Morphology, microphysics, and radiative properties, J. Appl. Meteorol. Clim., 45, 5–19, https://doi.org/10.1175/JAM2325.1, 2006. a
Bier, A. and Burkhardt, U.: Impact of parametrizing microphysical processes in the jet and vortex phase on contrail cirrus properties and radiative forcing, J. Geophys. Res.-Atmos., 127, e2022JD036677, https://doi.org/10.1029/2022JD036677, 2022. a, b, c, d
Bock, L. and Burkhardt, U.: Reassessing properties and radiative forcing of contrail cirrus using a climate model, J. Geophys. Res.-Atmos., 121, 9717–9736, https://doi.org/10.1002/2016JD025112, 2016a. a
Bock, L. and Burkhardt, U.: The temporal evolution of a long-lived contrail cirrus cluster: Simulations with a global climate model, J. Geophys. Res.-Atmos., 121, 3548–3565, https://doi.org/10.1002/2015JD024475, 2016b. a, b
Bock, L. and Burkhardt, U.: Contrail cirrus radiative forcing for future air traffic, Atmos. Chem. Phys., 19, 8163–8174, https://doi.org/10.5194/acp-19-8163-2019, 2019. a, b
Bond, T. C., Doherty, S. J., Fahey, D. W., Forster, P. M., Berntsen, T., DeAngelo, B. J., Flanner, M. G., Ghan, S., Kärcher, B., Koch, D., Kinne, S., Kondo, Y., Quinn, P. K., Sarofim, M. C., Schultz, M. G., Schulz, M., Venkataraman, C., Zhang, H., Zhang, S., Bellouin, N., Guttikunda, S. K., Hopke, P. K., Jacobson, M. Z., Kaiser, J. W., Klimont, Z., Lohmann, U., Schwarz, J. P., Shindell, D., Storelvmo, T., Warren, S. G., and Zender, C. S.: Bounding the role of black carbon in the climate system: A scientific assessment, J. Geophys. Res.-Atmos., 118, 5380–5552, https://doi.org/10.1002/jgrd.50171, 2013. a
Boucher, O., Randall, D., Artaxo, P., Bretherton, C., Feingold, G., Forster, P., Kerminen, V.-M., Kondo, Y., Liao, H., Lohmann, U., Rasch, P., Satheesh, S. K., Sherwood, S., Stevens, B., and Zhang, X. Y.: Clouds and aerosols, in: Climate change 2013: The physical science basis, Contribution of working group I to the fifth assessment report of the intergovernmental panel on climate change, Cambridge University Press, 571–657, http://www.climatechange2013.org/images/report/WG1AR5_Chapter07_FINAL.pdf (last access: 27 July 2026), 2013. a
Burkhardt, U. and Kärcher, B.: Global radiative forcing from contrail cirrus, Nat. Clim. Change, 1, 54–58, https://doi.org/10.1038/nclimate1068, 2011. a, b, c, d
Busen, R. and Schumann, U.: Visible contrail formation from fuels with different sulfur contents, Geophys. Res. Lett., 22, 1357–1360, https://doi.org/10.1029/95GL01312, 1995. a
Campbell, J. R., Lolli, S., Lewis, J. R., Gu, Y., and Welton, E. J.: Daytime cirrus cloud top-of-atmosphere radiative forcing properties at a midlatitude site, J. Appl. Meteorol. Clim., 55, 1667–1679, 2016. a
Chen, T., Rossow, W. B., and Zhang, Y.: Radiative effects of cloud-type variations, J. Climate, 13, 264–286, https://doi.org/10.1175/1520-0442(2000)013<0264:REOCTV>2.0.CO;2, 2000. a, b
Costa-Surós, M., Sourdeval, O., Acquistapace, C., Baars, H., Carbajal Henken, C., Genz, C., Hesemann, J., Jimenez, C., König, M., Kretzschmar, J., Madenach, N., Meyer, C. I., Schrödner, R., Seifert, P., Senf, F., Brueck, M., Cioni, G., Engels, J. F., Fieg, K., Gorges, K., Heinze, R., Siligam, P. K., Burkhardt, U., Crewell, S., Hoose, C., Seifert, A., Tegen, I., and Quaas, J.: Detection and attribution of aerosol–cloud interactions in large-domain large-eddy simulations with the ICOsahedral Non-hydrostatic model, Atmos. Chem. Phys., 20, 5657–5678, https://doi.org/10.5194/acp-20-5657-2020, 2020. a
Diao, M., Zondlo, M. A., Heymsfield, A. J., Avallone, L. M., Paige, M. E., Beaton, S. P., Campos, T., and Rogers, D. C.: Cloud-scale ice-supersaturated regions spatially correlate with high water vapor heterogeneities, Atmos. Chem. Phys., 14, 2639–2656, https://doi.org/10.5194/acp-14-2639-2014, 2014. a
Dipankar, A., Stevens, B., Heinze, R., Moseley, C., Zängl, G., Giorgetta, M., and Brdar, S.: Large eddy simulation using the general circulation model ICON, J. Adv. Model. Earth Syst., 7, 963–986, https://doi.org/10.1002/2015MS000431, 2015. a
Duda, D. P., Minnis, P., and Nguyen, L.: Estimates of cloud radiative forcing in contrail clusters using GOES imagery, J. Geophys. Res.-Atmos., 106, 4927–4937, https://doi.org/10.1029/2000JD900393, 2001. a
Fauchez, T., Dubuisson, P., Cornet, C., Szczap, F., Garnier, A., Pelon, J., and Meyer, K.: Impacts of cloud heterogeneities on cirrus optical properties retrieved from space-based thermal infrared radiometry, Atmos. Meas. Tech., 8, 633–647, https://doi.org/10.5194/amt-8-633-2015, 2015. a
Febvre, G., Gayet, J.-F., Minikin, A., Schlager, H., Shcherbakov, V., Jourdan, O., Busen, R., Fiebig, M., Kärcher, B., and Schumann, U.: On optical and microphysical characteristics of contrails and cirrus, J. Geophys. Res.-Atmos., 114, https://doi.org/10.1029/2008JD010184, 2009. a, b, c
Gierens, K.: Selected topics on the interaction between cirrus clouds and embedded contrails, Atmos. Chem. Phys., 12, 11943–11949, https://doi.org/10.5194/acp-12-11943-2012, 2012. a, b
Giorgetta, M. A., Brokopf, R., Crueger, T., Esch, M., Fiedler, S., Helmert, J., Hohenegger, C., Kornblueh, L., Köhler, M., Manzini, E., Mauritsen, T., Nam, C., Raddatz, T., Rast, S., Reinert, D., Sakradzija, M., Schmidt, H., Schneck, R., Schnur, R., Silvers, L., Wan, H., Zängl, G., and Stevens, B.: ICON-A, the atmosphere component of the ICON earth system model: I. Model description, J. Adv. Model. Earth Syst., 10, 1613–1637, https://doi.org/10.1029/2017MS001242, 2018. a
Gryspeerdt, E., Stettler, M. E. J., Teoh, R., Burkhardt, U., Delovski, T., Driver, O. G. A., and Painemal, D.: Operational differences lead to longer lifetimes of satellite detectable contrails from more fuel efficient aircraft, Environ. Res. Lett., 19, 084059, https://doi.org/10.1088/1748-9326/ad5b78, 2024. a, b
Heinze, R., Dipankar, A., Carbajal Henken, C., Moseley, C., Sourdeval, O., Trömel, S., Xie, X., Adamidis, P., Ament, F., Baars, H., Barthlott, C., Behrendt, A., Blahak, U., Bley, S., Brdar, S., Brueck, M., Crewell, S., Deneke, H., Di Girolamo, P., Evaristo, R., Fischer, J., Frank, C., Friederichs, P., Göcke, T., Gorges, K., Hande, L., Hanke, M., Hansen, A., Hege, H.-C., Hoose, C., Jahns, T., Kalthoff, N., Klocke, D., Kneifel, S., Knippertz, P., Kuhn, A., van Laar, T., Macke, A., Maurer, V., Mayer, B., Meyer, C. I., Muppa, S. K., Neggers, R. A. J., Orlandi, E., Pantillon, F., Pospichal, B., Röber, N., Scheck, L., Seifert, A., Seifert, P., Senf, F., Siligam, P., Simmer, C., Steinke, S., Stevens, B., Wapler, K., Weniger, M., Wulfmeyer, V., Zängl, G., Zhang, D., and Quaas, J.: Large-eddy simulations over Germany using ICON: A comprehensive evaluation, Q. J. Roy. Meteor. Soc., 143, 69–100, https://doi.org/10.1002/qj.2947, 2017. a, b
Heymsfield, A. and Wright, R.: Graupel and hail terminal velocities: Does a “supercritical” Reynolds number apply?, J. Atmos. Sci., 71, 3392–3403, https://doi.org/10.1175/JAS-D-14-0034.1, 2014. a
Heymsfield, A., Baumgardner, D., DeMott, P., Forster, P., Gierens, K., and Kärcher, B.: Contrail microphysics, B. Am. Meteorol. Soc., 91, 465–472, https://doi.org/10.1175/2009BAMS2839.1, 2010. a
Hong, Y., Liu, G., and Li, J.-L. F.: Assessing the Radiative Effects of Global Ice Clouds Based on CloudSat and CALIPSO Measurements, J. Climate, 29, 7651–7674, 2016. a
Immler, F., Treffeisen, R., Engelbart, D., Krüger, K., and Schrems, O.: Cirrus, contrails, and ice supersaturated regions in high pressure systems at northern mid latitudes, Atmos. Chem. Phys., 8, 1689–1699, https://doi.org/10.5194/acp-8-1689-2008, 2008. a
International Air Transport Association: Global Outlook for Air Transport – A Local Sweet Spot, Tech. rep., International Air Transport Association, https://www.iata.org/en/iata-repository/publications/economic-reports/global-outlook-for-air-transport---december-2023---report/ (last access: 27 July 2026), 2023. a
International Air Transport Association: Quarterly Air Transport Chartbook Q1 2024, Tech. rep., International Air Transport Association, https://www.iata.org/en/iata-repository/publications/economic-reports/quarterly-air-transport-chartbook-q1-2024/ (last access: 27 July 2026), 2024. a
Jensen, E. J., Toon, O. B., Kinne, S., Sachse, G. W., Anderson, B. E., Chan, K. R., Twohy, C. H., Gandrud, B., Heymsfield, A., and Miake-Lye, R. C.: Environmental conditions required for contrail formation and persistence, J. Geophys. Res.-Atmos., 103, 3929–3936, https://doi.org/10.1029/97JD02808, 1998. a
Kärcher, B.: Formation and radiative forcing of contrail cirrus, Nat. Commun., 9, 1824, https://doi.org/10.1038/s41467-018-04068-0, 2018. a, b
Kärcher, B. and Yu, F.: Role of aircraft soot emissions in contrail formation, Geophys. Res. Lett., 36, https://doi.org/10.1029/2008GL036649, 2009. a
Kärcher, B., Hendricks, J., and Lohmann, U.: Physically based parameterization of cirrus cloud formation for use in global atmospheric models, J. Geophys. Res.-Atmos., 111, https://doi.org/10.1029/2005JD006219, 2006. a, b
Kärcher, B., Burkhardt, U., Bier, A., Bock, L., and Ford, I.: The microphysical pathway to contrail formation, J. Geophys. Res.-Atmos., 120, 893–7927, https://doi.org/10.1002/2015JD023491, 2015. a, b, c, d
Klocke, D., Brueck, M., Hohenegger, C., and Stevens, B.: Rediscovery of the doldrums in storm-resolving simulations over the tropical Atlantic, Nat. Geosci., 10, 891–896, https://doi.org/10.1038/s41561-017-0005-4, 2017. a
Krämer, M., Schiller, C., Afchine, A., Bauer, R., Gensch, I., Mangold, A., Schlicht, S., Spelten, N., Sitnikov, N., Borrmann, S., de Reus, M., and Spichtinger, P.: Ice supersaturations and cirrus cloud crystal numbers, Atmos. Chem. Phys., 9, 3505–3522, https://doi.org/10.5194/acp-9-3505-2009, 2009. a
Krämer, M., Rolf, C., Luebke, A., Afchine, A., Spelten, N., Costa, A., Meyer, J., Zöger, M., Smith, J., Herman, R. L., Buchholz, B., Ebert, V., Baumgardner, D., Borrmann, S., Klingebiel, M., and Avallone, L.: A microphysics guide to cirrus clouds – Part 1: Cirrus types, Atmos. Chem. Phys., 16, 3463–3483, https://doi.org/10.5194/acp-16-3463-2016, 2016. a, b, c
Krämer, M., Rolf, C., Spelten, N., Afchine, A., Fahey, D., Jensen, E., Khaykin, S., Kuhn, T., Lawson, P., Lykov, A., Pan, L. L., Riese, M., Rollins, A., Stroh, F., Thornberry, T., Wolf, V., Woods, S., Spichtinger, P., Quaas, J., and Sourdeval, O.: A microphysics guide to cirrus – Part 2: Climatologies of clouds and humidity from observations, Atmos. Chem. Phys., 20, 12569–12608, https://doi.org/10.5194/acp-20-12569-2020, 2020. a
Kübbeler, M., Hildebrandt, M., Meyer, J., Schiller, C., Hamburger, Th., Jurkat, T., Minikin, A., Petzold, A., Rautenhaus, M., Schlager, H., Schumann, U., Voigt, C., Spichtinger, P., Gayet, J.-F., Gourbeyre, C., and Krämer, M.: Thin and subvisible cirrus and contrails in a subsaturated environment, Atmos. Chem. Phys., 11, 5853–5865, https://doi.org/10.5194/acp-11-5853-2011, 2011. a
Lee, D. S., Fahey, D. W., Skowron, A., Allen, M. R., Burkhardt, U., Chen, Q., Doherty, S. J., Freeman, S., Forster, P. M., Fuglestvedt, J., Gettelman, A., De León, R. R., Lim, L. L., Lund, M. T., Millar, R. J., Owen, B., Penner, J. E., Pitari, G., Prather, M. J., Sausen, R., and Wilcox, L. J.: The contribution of global aviation to anthropogenic climate forcing for 2000 to 2018, Atmos. Environ., 244, 117834, https://doi.org/10.1016/j.atmosenv.2020.117834, 2021. a, b
Lewellen, D.: Persistent contrails and contrail cirrus. Part II: Full lifetime behavior, J. Atmos. Sci., 71, 4420–4438, https://doi.org/10.1175/JAS-D-13-0317.1, 2014. a
Li, Y., Mahnke, C., Rohs, S., Bundke, U., Spelten, N., Dekoutsidis, G., Groß, S., Voigt, C., Schumann, U., Petzold, A., and Krämer, M.: Upper-tropospheric slightly ice-subsaturated regions: frequency of occurrence and statistical evidence for the appearance of contrail cirrus, Atmos. Chem. Phys., 23, 2251–2271, https://doi.org/10.5194/acp-23-2251-2023, 2023. a
Marjani, S.: ICON-LEM Animations of Contrail Development Within Cloudy Backgrounds, Zenodo [video], https://doi.org/10.5281/zenodo.15106425, 2025. a, b
Marjani, S., Tesche, M., Bräuer, P., Sourdeval, O., and Quaas, J.: Satellite observations of the impact of individual aircraft on ice crystal number in thin cirrus clouds, Geophys. Res. Lett., 49, e2021GL096173, https://doi.org/10.1029/2021GL096173, 2022. a, b, c, d, e, f
Masson-Delmotte, V., Zhai, P., Pirani, A., Connors, S. L., Péan, C., Berger, S., Caud, N., Chen, Y., Goldfarb, L., Gomis, M. I., Huang, M., Leitzell, K., Lonnoy, E., Matthews, J. B. R., Maycock, T. K., Waterfield, T., Yelekçi, O., Yu, R., and Zhou, B. (Eds.): Climate Change 2021: The Physical Science Basis. Contribution of Working Group I to the Sixth Assessment Report of the Intergovernmental Panel on Climate Change, Cambridge University Press, Cambridge, UK, https://doi.org/10.1017/9781009157896, 2021. a
Minnis, P., Young, D. F., Garber, D. P., Nguyen, L., Smith, W. L. J., and Palikonda, R.: Transformation of contrails into cirrus during SUCCESS, Geophys. Res. Lett., 25, 1157–1160, https://doi.org/10.1029/97GL03314, 1998. a
Naiman, A. D., Lele, S. K., and Jacobson, M. Z.: Large eddy simulations of contrail development: Sensitivity to initial and ambient conditions over first twenty minutes, J. Geophys. Res.-Atmos., 116, D21208, https://doi.org/10.1029/2011JD015806, 2011. a
Petzold, A., Busen, R., Schröder, F. P., Baumann, R., Kuhn, M., Ström, J., Hagen, D. E., Whitefield, P. D., Baumgardner, D., Arnold, F., Borrmann, S., and Schumann, U.: Near-field measurements on contrail properties from fuels with different sulfur content, J. Geophys. Res.-Atmos., 102, 29867–29880, https://doi.org/10.1029/97JD02209, 1997. a
Petzold, A., Khan, N. F., Li, Y., Spichtinger, P., Rohs, S., Crewell, S., Wahner, A., and Krämer, M.: Most long-lived contrails form within cirrus clouds with uncertain climate impact, Nat. Commun., 16, 9695, https://doi.org/10.1038/s41467-025-65532-2, 2025. a
Phillips, V. T., DeMott, P. J., and Andronache, C.: An empirical parameterization of heterogeneous ice nucleation for multiple chemical species of aerosol, J. Atmos. Sci., 65, 2757–2783, https://doi.org/10.1175/2007JAS2546.1, 2008. a
Quaas, J., Gryspeerdt, E., Vautard, R., and Boucher, O.: Climate impact of aircraft-induced cirrus assessed from satellite observations before and during COVID-19, Environ. Res. Lett., 16, 064051, https://doi.org/10.1088/1748-9326/abf686, 2021. a
Sausen, R., Hofer, S. M., Gierens, K. M., Bugliaro Goggia, L., Ehrmanntraut, R., Sitova, I., Walczak, K., Burridge-Diesing, A., Bowman, M., and Miller, N.: Can we successfully avoid persistent contrails by small altitude adjustments of flights in the real world?, Meteorol. Z., https://doi.org/10.1127/metz/2023/1157, 2023. a
Schemann, V. and Ebell, K.: Simulation of mixed-phase clouds with the ICON large-eddy model in the complex Arctic environment around Ny-Ålesund, Atmos. Chem. Phys., 20, 475–485, https://doi.org/10.5194/acp-20-475-2020, 2020. a
Schröder, F., Kärcher, B., Duroure, C., Ström, J., Petzold, A., Gayet, J.-F., Strauss, B., Wendling, P., and Borrmann, S.: On the transition of contrails into cirrus clouds, J. Atmos. Sci., 57, 464–480, https://doi.org/10.1175/1520-0469(2000)057<0464:OTTOCI>2.0.CO;2, 2000. a, b, c
Schumann, U.: On conditions for contrail formation from aircraft exhausts, Meteorol. Z., 5, 4–23, https://doi.org/10.1127/metz/5/1996/4, 1996. a, b, c, d
Schumann, U.: Influence of propulsion efficiency on contrail formation, Aerosp. Sci. Technol., 4, 391–401, https://doi.org/10.1016/S1270-9638(00)01062-2, 2000. a
Schumann, U. and Heymsfield, A. J.: On the life cycle of individual contrails and contrail cirrus, Meteor. Mon., 58, 3–1, 2017. a
Schumann, U. and Wendling, P.: Determination of contrails from satellite data and observational results, in: Air Traffic and the Environment – Background, Tendencies and Potential Global Atmospheric Effects, edited by: Schumann, U., Lecture Notes in Engineering, Springer, Berlin, 138–153, https://doi.org/10.1007/978-3-642-51686-3_9, 1990. a
Schumann, U., Penner, J. E., Chen, Y., Zhou, C., and Graf, K.: Dehydration effects from contrails in a coupled contrail–climate model, Atmos. Chem. Phys., 15, 11179–11199, https://doi.org/10.5194/acp-15-11179-2015, 2015. a
Schumann, U., Baumann, R., Baumgardner, D., Bedka, S. T., Duda, D. P., Freudenthaler, V., Gayet, J.-F., Heymsfield, A. J., Minnis, P., Quante, M., Raschke, E., Schlager, H., Vázquez-Navarro, M., Voigt, C., and Wang, Z.: Properties of individual contrails: a compilation of observations and some comparisons, Atmos. Chem. Phys., 17, 403–438, https://doi.org/10.5194/acp-17-403-2017, 2017. a, b, c
Schumann, U., Bugliaro, L., Dörnbrack, A., Baumann, R., and Voigt, C.: Aviation contrail cirrus and radiative forcing over Europe during 6 months of COVID-19, Geophys. Res. Lett., 48, e2021GL092771, https://doi.org/10.1029/2021GL092771, 2021. a
Seelig, T., Wolf, K., Bellouin, N., and Tesche, M.: Quantification of the radiative forcing of contrails embedded in cirrus clouds, Nat. Commun., 16, 10703, https://doi.org/10.1038/s41467-025-66231-8, 2025. a, b
Seifert, A. and Beheng, K. D.: A two-moment cloud microphysics parameterization for mixed-phase clouds. Part 1: Model description, Meteorol. Atmos. Phys., 92, 45–66, https://doi.org/10.1007/s00703-005-0112-4, 2006. a, b, c, d
Singh, D. K., Sanyal, S., and Wuebbles, D. J.: Understanding the role of contrails and contrail cirrus in climate change: a global perspective, Atmos. Chem. Phys., 24, 9219–9262, https://doi.org/10.5194/acp-24-9219-2024, 2024. a
Stephens, G. L. and Webster, P. J.: Clouds and climate: Sensitivity of simple systems, J. Atmos. Sci., 38, 235–247, https://doi.org/10.1175/1520-0469(1981)038<0235:CACSOS>2.0.CO;2, 1981. a
Sun, X., Ritter, C., Müller, K., Palm, M., Ji, D., Ruhe, W., Beninga, I., Patris, S., and Notholt, J.: Properties of Cirrus Cloud Observed over Koror, Palau (7.3° N, 134.5° E), in Tropical Western Pacific Region, Remote Sens., 16, 1448, https://doi.org/10.3390/rs16081448, 2024. a
Teoh, R., Schumann, U., Majumdar, A., and Stettler, M. E.: Mitigating the climate forcing of aircraft contrails by small-scale diversions and technology adoption, Environ. Sci. Technol., 54, 2941–2950, https://doi.org/10.1021/acs.est.9b05608, 2020. a
Teoh, R., Engberg, Z., Schumann, U., Voigt, C., Shapiro, M., Rohs, S., and Stettler, M. E. J.: Global aviation contrail climate effects from 2019 to 2021, Atmos. Chem. Phys., 24, 6071–6093, https://doi.org/10.5194/acp-24-6071-2024, 2024. a
Tesche, M., Achtert, P., Glantz, P., and Noone, K. J.: Aviation effects on already-existing cirrus clouds, Nat. Commun., 7, 12016, https://doi.org/10.1038/ncomms12016, 2016. a, b, c
Unterstrasser, S.: Properties of young contrails – a parametrisation based on large-eddy simulations, Atmos. Chem. Phys., 16, 2059–2082, https://doi.org/10.5194/acp-16-2059-2016, 2016. a, b, c, d, e, f
Unterstrasser, S. and Sölch, I.: Numerical Modeling of contrail cluster formation, in: Proceedings of the 3rd International Conference on Transport, Atmosphere and Climate (TAC-3), edited by: Sausen, R., Unterstrasser, S., and Blum, A., Prien am Chiemsee, Germany, 114–119, 2012. a
Unterstrasser, S., Sölch, I., and Gierens, K.: Cloud resolving modeling of contrail evolution, in: Atmospheric Physics: Background–Methods–Trends, Springer, 543–559, https://doi.org/10.1007/978-3-642-30183-4_33, 2012. a
Unterstrasser, S., Gierens, K., SöLCH, I., and Lainer, M.: Numerical simulations of homogeneously nucleated natural cirrus and contrail-cirrus. Part 1: How different are they?, Meteorol. Z., 26, 621–642, https://doi.org/10.1127/metz/2016/0777, 2017. a, b, c, d, e, f, g
Verma, P. and Burkhardt, U.: Contrail formation within cirrus: ICON-LEM simulations of the impact of cirrus cloud properties on contrail formation, Atmos. Chem. Phys., 22, 8819–8842, https://doi.org/10.5194/acp-22-8819-2022, 2022. a, b, c, d, e
Voigt, C., Schumann, U., Jurkat, T., Schäuble, D., Schlager, H., Petzold, A., Gayet, J.-F., Krämer, M., Schneider, J., Borrmann, S., Schmale, J., Jessberger, P., Hamburger, T., Lichtenstern, M., Scheibe, M., Gourbeyre, C., Meyer, J., Kübbeler, M., Frey, W., Kalesse, H., Butler, T., Lawrence, M. G., Holzäpfel, F., Arnold, F., Wendisch, M., Döpelheuer, A., Gottschaldt, K., Baumann, R., Zöger, M., Sölch, I., Rautenhaus, M., and Dörnbrack, A.: In-situ observations of young contrails – overview and selected results from the CONCERT campaign, Atmos. Chem. Phys., 10, 9039–9056, https://doi.org/10.5194/acp-10-9039-2010, 2010. a
Voigt, C., Schumann, U., Jessberger, P., Jurkat, T., Petzold, A., Gayet, J.-F., Krämer, M., Thornberry, T., and Fahey, D.: Extinction and optical depth of contrails, Geophys. Res. Lett., 38, https://doi.org/10.1029/2011GL047189, 2011. a, b, c
Wang, Z., Bugliaro, L., Jurkat-Witschas, T., Heller, R., Burkhardt, U., Ziereis, H., Dekoutsidis, G., Wirth, M., Groß, S., Kirschler, S., Kaufmann, S., and Voigt, C.: Observations of microphysical properties and radiative effects of a contrail cirrus outbreak over the North Atlantic, Atmos. Chem. Phys., 23, 1941–1961, https://doi.org/10.5194/acp-23-1941-2023, 2023. a, b
Wong, H.-W. and Miake-Lye, R. C.: Parametric studies of contrail ice particle formation in jet regime using microphysical parcel modeling, Atmos. Chem. Phys., 10, 3261–3272, https://doi.org/10.5194/acp-10-3261-2010, 2010. a
Zängl, G., Reinert, D., Rípodas, P., and Baldauf, M.: The ICON (ICOsahedral Non-hydrostatic) modelling framework of DWD and MPI-M: Description of the non-hydrostatic dynamical core, Q. J. Roy. Meteor. Soc., 141, 563–579, https://doi.org/10.1002/qj.2378, 2015. a, b
Zhang, W., Van Weverberg, K., Morcrette, C. J., Feng, W., Furtado, K., Field, P. R., Chen, C.-C., Gettelman, A., Forster, P. M., Marsh, D. R., and Rap, A.: Impact of host climate model on contrail cirrus effective radiative forcing estimates, Atmos. Chem. Phys., 25, 473–489, https://doi.org/10.5194/acp-25-473-2025, 2025. a
- Abstract
- Introduction
- Methodology
- Results and Discussion
- Conclusion
- Appendix A: Supplementary Tables and Figures
- Appendix B: Contrail Formation Conditions – A Closer Look
- Appendix C: Consistency of the bulk-ice representation for the initialized contrail perturbation
- Data availability
- Video supplement
- Author contributions
- Competing interests
- Disclaimer
- Acknowledgements
- Financial support
- Review statement
- References
- Abstract
- Introduction
- Methodology
- Results and Discussion
- Conclusion
- Appendix A: Supplementary Tables and Figures
- Appendix B: Contrail Formation Conditions – A Closer Look
- Appendix C: Consistency of the bulk-ice representation for the initialized contrail perturbation
- Data availability
- Video supplement
- Author contributions
- Competing interests
- Disclaimer
- Acknowledgements
- Financial support
- Review statement
- References